UNITED STATES
SECURITIES AND EXCHANGE COMMISSION
WASHINGTON, DC 20549
FORM 10-K
(Mark One)
|
| |
x | ANNUAL REPORT PURSUANT TO SECTION 13 OR 15(d) OF THE SECURITIES EXCHANGE ACT OF 1934 |
xANNUAL REPORT PURSUANT TO SECTION 13 OR 15(d) OF THE SECURITIES EXCHANGE ACT OF 1934For the fiscal year ended December 31, 20152016
OR
|
| |
o | TRANSITION REPORT PURSUANT TO SECTION 13 OR 15(d) OF THE SECURITIES EXCHANGE ACT OF 1934 |
orFORoTRANSITION REPORT PURSUANT TO SECTION 13 OR 15(d) OF THE TRANSITION PERIOD FROMSECURITIES EXCHANGE ACT OF 1934
For the transition period from TOto
Commission File Number: 001-36373
TRINET GROUP, INC.
(Exact Name of Registrant as Specified in its Charter)
|
| | |
| Delaware | | 95-3359658 |
(State or other jurisdiction of incorporation or organization) | | (I.R.S. Employer Identification No.) |
| 1100 San Leandro Blvd., Suite 400, San Leandro, CA | | 94577 |
| (Address of principal executive offices) | | (Zip Code) |
Registrant’s telephone number, including area code: (510) 352-5000
Securities registered pursuant to Section 12(b) of the Act: Common Stock, Par Value $0.000025 Per Share; Common stock traded on the New York Stock Exchange.
Securities registered pursuant to Section 12(g) of the Act: None
Indicate by check mark if the Registrant is a well-known seasoned issuer, as defined in Rule 405 of the Securities Act. Yes o No x
Indicate by check mark if the Registrant is not required to file reports pursuant to Section 13 or 15(d) of the Act. Yes o No x
Indicate by check mark whether the registrant (1) has filed all reports required to be filed by Section 13 or 15(d) of the Securities Exchange Act of 1934 during the preceding 12 months (or for such shorter period that the registrant was required to file such reports), and (2) has been subject to such filing requirements for the past 90 days. Yes x No o
Indicate by check mark whether the registrant has submitted electronically and posted on its corporate Web site, if any, every Interactive Data File required to be submitted and posted pursuant to Rule 405 of Regulation S-T (§ 232.405 of this chapter) during the preceding 12 months (or for such shorter period that the registrant was required to submit and post such files). Yes x No o
Indicate by check mark if disclosure of delinquent filers pursuant to Item 405 of Regulation S-K (§229.405) is not contained herein, and will not be contained, to the best of Registrant’s knowledge, in definitive proxy or information statements incorporated by reference in Part III of this Form 10-K or any amendment to this Form 10-K. x
Indicate by check mark whether the registrant is a large accelerated filer, an accelerated filer, a non-accelerated filer, or a smaller reporting company. See the definitions of “large accelerated filer,” “accelerated filer” and “smaller reporting company” in Rule 12b-2 of the Exchange Act. (Check one):
|
| | | |
| Large accelerated filer | x | Accelerated filer | o |
| | | | |
| Non-accelerated filer | o (do not check if a smaller reporting company) | Smaller reporting company | o |
Indicate by check mark whether the registrant is a shell company (as defined in Rule 12b-2 of the Exchange Act). Yes o No x
The aggregate market value of the voting and non-voting common equity held by non-affiliates of the Registrant, based on the closing price of the shares of common stock on The New York Stock Exchange on June 30, 2015,2016, was $1,055,737,584.$865,320,029.
The number of shares of Registrant’s Common Stock outstanding as of March 28, 2016February 23, 2017 was 70,711,536.68,268,207.
Portions of the Registrant’s Definitive Proxy Statement to be issued in connection with its Annual Meeting of Stockholders, scheduled to be held on May 26, 2016,18, 2017, are incorporated by reference into Part III of this Form 10-K.
TriNet, Inc.TRINET GROUP, INC.
Form 10-K - Annual Report
For the Fiscal Year End December 31, 20152016
TABLE OF CONTENTS
SpecialCautionary Note Regarding Forward-Looking Statements
For purposes of this Annual Report, the terms “TriNet," "the Company," “we,” “us” and “our" refer to TriNet Group, Inc., and its consolidated subsidiaries. This reportAnnual Report on Form 10-K contains statements that are not historical in nature, are predictive in nature, or that depend upon or refer to future events or conditions or otherwise contain forward-looking statements within the meaning of Section 27A of the Securities Act and Section 21E21 of the Securities Exchange Act of 1934, as amended, orand the Exchange Act.Private Securities Litigation Reform Act of 1995. Forward-looking statements are often identified by the use of words such as, but not limited to, “anticipate,” “believe,” “can,” “continue,” “could,” “estimate,” “expect,” “intend,” “may,” “plan,” “project,” “seek,” “should,” “strategy,” “target,” “will,” “would” and similar expressions or variations intended to identify forward-looking statements. TheseExamples of forward-looking statements include, among others, TriNet’s expectations regarding: the growth of our customer base, our ability to roll out additional product offerings as and when planned, our ability to make enhancements to our technology platform, our ability to remediate the material weaknesses in our internal controls over financial reporting, our ability to execute on our vertical market strategy and penetrate the market for human resources (HR) solutions for small to midsize businesses, and other expectations, outlooks and forecasts on our future business, operational and financial performance.
Forward-looking statements are not guarantees of future performance, but are based on management’s expectations as of the date of this report and assumptions that are inherently subject to uncertainties, risks and changes in circumstances that are difficult to predict. Forward-looking statements are subject toinvolve known and unknown risks, uncertainties and other factors that may cause actual results, performance or achievements to be materially different from those in forward-looking statements.our current expectations and any past results, performance or achievements. Important factors that could cause actual results to differ materially from those expressed or implied by these forward-looking statements include, but are not limitedinclude:
risks associated with the market acceptance of outsourcing the HR function, and the anticipated benefits associated with the use of a bundled HR solution;
changes to and our ability to comply with laws and regulations, including both those identified belowapplicable to the co-employment relationship as well as those applicable to our clients’ businesses and thosetheir employees;
the amendment, repeal, replacement or continuing implementation of the Affordable Care Act and other health care reform, which may be more challenging in a changing political environment;
our ability to maintain the security of our information technology (IT) infrastructure against cyber-attacks and security breaches;
our ability to manage unexpected changes in workers’ compensation and health insurance claims by worksite employees;
the unpredictable nature of our costs and operating expenses, in particular our workers’ compensation and health insurance costs;
our ability to remediate the material weaknesses in our internal controls over financial reporting;
our ability to effectively acquire and integrate new businesses;
our ability to gain new clients, and our clients’ ability to grow and gain more employees;
volatility in the financial and economic environment to small and mid-sized businesses;
the effects of increased competition and our ability to compete effectively; and
our ability to comply with the restrictions of our credit facility and meet our debt obligations.
Any of these factors, as well as such other factors as discussed in the section titled “Risk Factors” included under Part I, Item 1A, below.and throughout Part II, Item 7 of this Annual Report on Form 10-K (Form 10-K), as well as in our periodic filings with the Securities and Exchange Commission (SEC), could cause our actual results to differ materially from our anticipated results. The information provided in this Form 10-K is based upon the facts and circumstances known at this time, and any forward-looking statements made by us in this Form 10-K speak only as of the date on which they are made. All information provided in this report is as of the date of this report and we undertake no duty to update this information except as required by law.
PART I
Item 1. Business
Business OverviewGeneral
TriNet Group Inc., or TriNet or the Company, is a leading provider of comprehensive human resources or HR,(HR) solutions for small to midsize businesses or SMBs, under a(SMBs). Under our co-employment model. Our HR solutions are designed to managemodel, we assume many of the complex and burdensome responsibilities of being an increasingly complex set of HR regulations, costs,employer, helping our clients minimize employer-related risks and manage administrative and compliance responsibilities for our clients, allowing them to focus on operatingassociated with employment. We provide an HR technology platform with online and growing their core businesses. Our bundled HR solutions include offerings such as:
multi-state payroll processing and tax administration;
employee benefits programs, including health insurance and retirement plans;
workers compensation insurance and claims management;
federal, state and local labor, employment and benefit law compliance;
risk mitigation, including employment practices claims management;
expense and time management; and
human capital consulting.
Our proprietary, cloud-based HR software systems are used bymobile tools that allow our clients and their employees, whom we refer to as worksite employees or WSEs,(WSEs) to efficiently store, view and manage their core HR-related information and conduct a variety of HR-related transactions anytime and anywhere.
We utilize our size and scale to provide our clients with a broad range of employee benefit and insurance programs generally not available to individual SMBs. In addition, our expertservice teams of in-house HR professionals also provide additional services upon request to support various stages of our clients' growth, includinghelp with talent management, recruiting and training, performance management, consulting or other consultingemployee onboarding and terminations, benefits enrollment and support, claims administration and employment practices risk management. We also monitor employer-related developments and assist clients in complying with applicable local, state and federal regulations.
Our strategy is to provide industry-specific products and services (with an incremental chargeto help clients address their HR needs and allow them to focus on operating and growing their businesses. We believe our industry-oriented (vertical) approach is a key differentiator for such services).
us and delivers significant benefits to our clients. This allows our sales force, product development and service teams to tailor product and service offerings to the specific industry needs of our clients. As of December 31, 2015,2016, we served over 12,700have introduced four verticals - TriNet Financial Services, TriNet Life Sciences, TriNet Nonprofit and TriNet Technology - and we intend to continue to develop and offer new industry vertical products in the future.
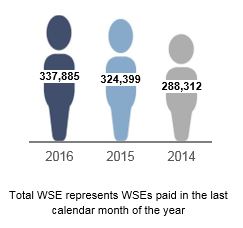
TriNet was founded in 1988 and has significantly grown the number of clients we serve, both organically and through strategic acquisitions, including our acquisitions of SOI Holding, Inc. (SOI) and Park Avenue Holding, Inc. (Accord) in 2012 and Ambrose Employer Group, LLC (Ambrose) in 2013. For the year ended December 31, 2016, we processed $34 billion in payroll payments for approximately 13,900 clients with about 338,000 WSEs in all 50 states, the District of Columbia and Canada, co-employed more than 324,000 WSEsCanada.
Products and had processed over $31 billion in payroll and payroll tax payments for clients on our systems in 2015. Our clients are distributed across a variety of industries, including technology, life sciences, not-for-profit, professional services, financial services, property management, retail, manufacturing, and hospitality. Our sales and marketing, client services and product development teams are increasingly focused on specific industry verticals. This verticalized approach gives us a deeper understanding of the HR needs facing SMBs in particular industries, which better enables us to provide HR solutions and services tailored to the specific needs of clients in these verticals. We conduct our business primarily in the United States, with more than 99% of our total revenues for each of 2015, 2014 and 2013 being attributable to WSEs in the U.S. and the remainder being attributable to WSEs in Canada.
For 2015, 2014 and 2013, our total revenues were $2.7 billion, $2.2 billion and $1.6 billion respectively. Our total revenues consist of professional service revenues and insurance service revenues. For 2015 and 2014, 15% and 16% of our total revenues, respectively, consisted of professional service revenues, and 85% and 84% of our total revenues, respectively, consisted of insurance service revenues.Services
We recognize as professional service revenues the fees we earn for providing our clients withdeliver a comprehensive suite of HR professionalproducts and services but do not include amounts paid to us by clients as payroll that are paid out to WSEs or amounts withheld and remitted to authorities as taxes.
We recognize as insurance service revenues all insurance-related billings and administrative fees collected fromwhich allow our clients and withheld from WSEs. We pay premiumstheir WSEs to third-partyadminister and manage HR-related compensation and benefits, including payroll, health insurance carriers for client and WSE insurance benefits and reimburse the insurance carriers and third-party administrators for claims payments made onworker's compensation programs, through our behalf within our insurance deductible layer, where applicable. These premiums and reimbursements are classified as insurance costs on our statements of operations.
To augment our financial information prepared in accordance with U.S. generally accepted accounting principles, or GAAP, we use internally a non-GAAP financial measure, Net Insurance Service Revenues, which consists of insurance service revenues less insurance costs. We also use a measure of total non-GAAP revenue, or Net Service Revenues, which is the sum of professional service revenues and Net Insurance Service Revenues. For 2015, 2014 and 2013, Net Service Revenues were $546.9 million, $507.2 million and $417.7 million, respectively. For 2015, 73% of our Net Service Revenues consisted of professional service revenues and 27% of our Net Service Revenues consisted of Net Insurance Service Revenues.
For 2015, 2014 and 2013, our net income was $31.7 million, $15.5 million and $13.1 million, respectively, and our Adjusted Earnings Before Interest, Taxes, Depreciation and Amortization, or Adjusted EBITDA, was $151.3 million, $165.3 million and $136.0 million, respectively.technology platform.
Our Servicescomprehensive HR products and solutions include the following common capabilities:
We provide our clients |
| | | | | | |
| |
| |
| |
|
TECHNOLOGY PLATFORM | | HR EXPERTISE | | BENEFITS | | COMPLIANCE |
| | | | | | |
Technology Platform
Our HR technology platform, with a comprehensive suite of HR professional services that we believe enable SMBs to effectively execute fundamental HR transactions and manage an increasingly complex set of HR regulations, costs, risks and responsibilities.
As part of our professional service offerings, we provide our clients with fundamental HR transactional capabilities, including multi-state payroll processing and tax administration, as well as a cloud-based system of record for all their HR transactions. Our online and mobile self-service tools enableallows our clients for example,and WSEs to store, view and manage effectivelycore HR information and administer a variety of HR transactions, such as payroll processing, tax administration, employee hiringonboarding and termination, administer changescompensation reporting, expense management, and benefits enrollment and administration.
Our strategy is to employee payroll, view real-time benefits datacontinue to invest in product development and create compensation reports. In addition, WSEs are able to access our system to manage their own payroll information, request paid time off (PTO)improve the functionality, experience and view approval status real-time, view paystubs, PTO balances, W-2s and more. This HR functionality is a core componentease of use of our professionalproducts and services for clients and their WSEs. We have transformed the way we deliver our products and services though a full-service online and mobile platform, with standard Application Programming Interfaces (API) for integrating selected third-party software offerings and with an improved client experience for key processes. We will continue to integrate functionality and retire legacy software systems inherited from acquisitions and migrate clients to our primary TriNet software system. We believe the continued improvement of our technology platform and the
consolidation of legacy systems allows us to drive operating efficiencies and improve the user experience by providing a unified view of all pertinent HR service offering.information.
During 2016, 2015 and 2014 we invested approximately $52.7 million, $38.7 million and $32.4 million, respectively, developing our technology solutions.
HR Expertise
We also leverageuse the collective insights and experience that we have gained overof our 27-year operating historyteams of HR, benefits, risk management and compliance professionals to help clients mitigate many of the many administrative, regulatory and practical risks associated with their responsibilities as employers. We continuously monitor changes in the labor, employment and benefit regulatory environment and offer guidanceemployers, including talent management, recruiting and training, to clients to assist them in avoiding or reducing liabilityperformance management, employee onboarding and exposure.terminations, benefits enrollment and support, claims administration and employment practices risk management. Our professional HR services includeteams provide access to HR templates, best practices, employee handbooks, disciplined process management guidelines, employee relations consultation, issue investigation workplace employment posters,support, and compensation practice benchmarking data. In addition,employee communications. Each of our clients are ableand WSEs have access to consult directly withvarying levels of service and support from our HR professionals through a variety of interaction models,experts ranging from call center support for basic questions to pooled specialized resources and dedicated HR professionals,to onsite consulting and services, depending uponon the needs of the client and their WSEs. OurIn addition, our teams of in-house HR teamsprofessionals can also provide additional, incremental consulting and other services upon requestrequest.
Under our vertical strategy, we continue to tailor our product and service offerings to specific industries by identifying common needs and leveraging scale and shared experience to provide more efficient, relevant offerings. For example, our fourth vertical product, TriNet Technology, is specifically targeted to help support stages of our clients’ growth, includingthe talent recruiting, orequity compensation and foreign employee immigration needs with applicant tracking systems, immigration services for employees requiring work visas and online tools to help clients manage equity compensation plans that SMBs in other services (with an incremental charge for such services).industries do not face. We now offer four industry specific product offerings: TriNet Technology, TriNet Financial Services, TriNet Life Sciences and TriNet Nonprofit.
Insurance ServicesBenefits
We offer our clients and WSEs access to a broad range of TriNet-sponsored benefitsbenefit and insurance programs that many of our clients may be unable to obtain for their WSEs on their own and that are compliant with state, local, and federal regulations. We believe access to our fully-insured, Affordable Care Act compliant group health insurance plans is one of the
most important benefits we provide to our clients and WSEs. In addition, ourOur insurance services offerings include plan design and administration, enrollment management, and WSE and client communications relating to our sponsored benefits and insurance programs. As described below,
We pay premiums to third-party insurance carriers for WSE insurance benefits and reimburse the principal components ofinsurance carriers and third-party administrators for claims payments made on our behalf within our insurance services offerings are employee benefit plans, workers compensation insurance and employment practices liability insurance.deductible layer, where applicable.
Employee Benefit Plans
Plans: We sponsor and administer a number ofseveral fully-insured, risk based employee benefit plans, including group health, dental, vision and life insurance as an employer plan sponsor under Section 3(5) of the Employee Retirement Income Security Act or ERISA.(ERISA). We also offer other benefit programs to our clients and WSEs, including flexible spending accounts, retirement plans, Consolidated Omnibus Budget Reconciliation Act (COBRA) benefits, individual life insurance, a legal services plan, commuter benefits, home insurance, critical illness insurance, pet insurance and auto insurance. We provide group insurance coverage to our WSEs through a national network of carriers including Aetna, Blue Shield of California, Florida Blue, BlueCross BlueShield of North Carolina, Tufts, Kaiser Permanente, MetLife United Healthcare, EyeMed, Delta Dental and Vision Service Plan.
Approximately 38%For further discussion of our 2015 group health insurance premiums were for fully insuredfully-insured programs including policies with respect to which our carriers set the premiums and for whichwhere we were not responsible for any deductible, which are referred to as ‘guaranteed cost’ policies. The remaining 62% of our 2015 group health insurance premiums were for fully insured policies with respect to which we agree to pay additional amounts toreimburse our carriers for anycertain amounts relating to claims, paid within an agreed-upon deductible layer. Our agreements with our health insurance carriers with respect to these non-'guaranteed cost' policies typically include limits to our exposure for individual claims, which we refer to as ‘pooling’ limits, and limits to our maximum aggregate exposure for claimsNote 1 in a given policy year, which we refer to as ‘stop loss’ limits. We have experienced variability, and may experience variability in the future, in the amounts that we are required to pay our health insurance carriers for group health insurance expenses incurred by WSEs within our deductible layer under non-'guaranteed cost' policies, based on continually changing trends in the frequency and severityPart II, Item 8 of claims. These historical trends may change, and other seasonal trends and variability may develop, which may make it more difficult for us to manage this aspect of our business.Form 10-K.
Workers Compensation Insurance
Workers' Compensation: We provide fully-insured workersworkers' compensation insurance coverage for our clients and WSEs through agreementsinsurance policies that we negotiate with our third-party insurance providers. These agreements typically include a deductible layercarriers. Additionally, we help clients manage their risk by providing risk management services, including performing workplace assessment, safety consultation, accident investigation and other risk management services at our client locations to help prevent workplace accidents that obligates uscould lead to reimburse our carriers upclaims. We also provide services to $1 million per claim occurrence. help remediate such claims when they occur.
We manage the deductible risk that we assume in connection with these policies by being selective in the types of businesses that we take on as new clients, by monitoring claims data and the performance of our carriers and third-party claims management services and vendors and by providing risk management services for existing clients. These services include performing workplace assessment, safety consultation, accident investigation and other risk management services at our client locations to help prevent situations that could lead to claims and services to help remediate claims when they occur.
Employment Practices Liability Insurance
(EPLI): We provide employment practices liability insurance (EPLI)EPLI coverage for our clients through agreementsinsurance policies that we negotiate withobtain from our third-party EPLI insurance provider.carrier. These EPLI policies provide coverage for certain claims that arise in the course of the employment relationship such as discrimination, harassment, and certain other employee claims,
with a per-claim retention amount. For most of our clients, the retention amount is split between the client and TriNet, with the client paying its portion of the retention amount first.
While we do not provide legal representation to our clients, our clients can benefit from the extensive experience of our employment law specialists in our legal department who support ourand HR professionals in their efforts towho assist clients in avoidingimplementing HR best practices to avoid employment practices liability claims and in managing, processing and responding to such claims. For claims covered by theour EPLI insurance, actual litigation defense is conducted by one of several outside employment law firms chosen by the EPLI carrier with whom we and our EPLI carriers have previously negotiated rates, established billing guidelines and invoice review processes andprocesses. We have also developed a case management protocol to efficiently and effectively defend such claims.
Seasonality and Insurance VariabilityCompliance
Our business is affected by cyclicalityproducts and services are designed to help our clients comply with local, state and federal employment and benefit laws. Often these changes are staggered and require additional guidance from a variety of local, state or federal agencies, making compliance a continuous challenge. We monitor employer-related developments and assist clients in business activitycomplying with changing regulations and WSE behavior. Historically, we have experienced our highest monthly addition of WSEs,requirements at all levels, from changes in local minimum wage and family leave ordinances to sweeping reforms such as well as our highest monthly levels of client attrition, in the month of January, primarily because clients that change their payroll service providers tend to do so at the beginning of a calendar year. We also experience higher levels of client attrition in connection with renewals of the health insurance we sponsor for our WSEs, in the event that such renewals result in higher costs to our clients. We have also historically experienced higher insurance claim volumes in the secondPatient Protection and third quarters of a fiscal year than in the first and fourth quarters of a fiscal year, as WSEs typically access their health care providers more often in the second and third quarters of a fiscal year, which has negatively impacted our insurance
costs in these quarters. We have also experienced variability on a quarterly basis in the amountAffordable Care Act (ACA). Each component of our healthHR solutions is designed with compliance in mind, whether it is payroll processing and workers compensation insurance costs due to the number and severity of insurance claims being unpredictable. These historical trends may change, and other seasonal trends and variability may develop which would make it more difficult for us to manage our business.tax administration, HR services focused on creating a compliant workplace, or offering ACA-compliant benefit plans.
Our Co-Employment Model
We operate under a co-employment model business model, under which employment-related responsibilities are contractually allocated between us and our clients, which affords us a close relationship with ourclients. This model allows clients and their WSEs.WSEs to receive the full benefit of our employee benefit plan offerings. Each of our clients enters into a client service agreement with us that defines the suite of professional and insurance services and benefits to be provided by us, the fees payable to us, and the division of responsibilities between us and our clientclients as co-employers. The division of responsibilities under our client service agreements is typically as follows:
TriNet Responsibilities
We assume responsibility for, and manage certain risks associated with:
remittance to WSEs of salaries, wages and certain other compensation, as reported and paid to us by the client, related tax reporting and remittance to tax authorities and processing of garnishment and wage deduction orders. Unlike a payroll service provider, we issue each WSE a payroll check drawn on our bank accounts;accounts,
report the wages, withhold and deposit the associated payroll taxes as the employer on information reporting and payroll tax returns,
maintenance of workersworkers' compensation insurance and workersworkers' compensation claims processing;processing,
provision and administration of group health, welfare, and retirement benefits to WSEs based on our clients’ elections, under TriNet-sponsored insurance plans;plans,
compliance with applicable law for employee benefits offered to WSEs;WSEs,
processing of unemployment claims;claims, and
provision of certain HR policies, including an employee handbook describing the co-employment relationship.
Client Responsibilities
Our clients are responsible for employment-related responsibilities that we do not assume, including:
day-to-day management of their worksites and WSEs;WSEs,
compliance with laws associated with the classification of employees as exempt or non-exempt, such as overtime pay and minimum wage law compliance;compliance,
accurate and timely reporting to TriNet of compensation and deduction information, including information relating to hours worked, rates of pay, salaries, wages and certain other compensation;compensation,
accurate and timely reporting to TriNet of information relating to workplace injuries, employee hires and termination, and certain other information relevant to TriNet’s services;services,
provision and administration of any employee benefits not provided by TriNet (e.g., equity incentive plans);,
compliance with all laws and regulations applicable to the client’sclients' workplace and business, including work eligibility laws, laws relating to workplace safety or the environment, laws relating to family and medical leave, laws pertaining to employee organizing efforts and collective bargaining and employee termination notice requirements;requirements,
payment of TriNet invoices which include wages to WSEs and applicable employment taxes and service fees;fees, and
all other matters for which TriNet does not assume responsibility under the client service agreement, such as intellectual property ownership and protection and liability for products produced and/or services provided.
As a result of our co-employment relationship with each of our WSEs, we are liable for payment of salary, wages and certain other compensation to the WSEs as reported and paid to us by the client and are responsible for providing specified employee benefits to such persons to the extent provided in each client service agreement and under federal and state law. In most instances, clients are required to remit payment prior to the applicable payroll date by wire transfer or automated clearinghouse transaction. Although we may become liable, as the employer for payroll purposes, to pay certain amounts for work previously performed, we are not obligated to continue to provide services to the client if payment has not been made. For the year ended December 31, 2015, our bad debt expense relating to such obligations was approximately $2.0 million.transaction (ACH).
We also assume responsibility for payment and liability for the withholding and remittance of federal and state income and employment taxes with respect to salaries, wages and certain other compensation paid to WSEs, although we reserve the right to seek recourse against our clients for any liabilities arising out of their conduct. We perform these functions as the employer for federal employment tax purposes, since our clients transfer legal control over these payroll functions to us. Except to the extent applicable federal legislation and applicable state lawlaws otherwise provide, the client may be held ultimately liable for those obligations if we fail to remit taxes and the bonding security provided by the Employer Services Assurance Corporation (ESAC) is not sufficient to satisfy the obligation. We also secure insurance in the event that we fail to meet these obligations.
Our Technology Platform
We provide our clients and WSEs with fundamental HR transactional capabilities, as well as a cloud-based system of record for all their HR transactions. Our online and mobile self-service tools allow our clients and WSEs 24/7 access to their core HR information. On our systems, clients can effectively manage employee hiring and termination, administer employee payroll, view real-time benefits data and create compensation reports. WSEs can also manage their own payroll information, request paid time off (PTO) and view approval status real-time, enroll in benefits, and view paystubs, PTO balances, and W-2s, among other things. We also offer human capital management software offerings, including talent management and development, applicant tracking, expense management, and performance management. These modules can be either bundled into the product offering or purchased as add-ons for certain of our verticals. We have also made significant investments to integrate our software offerings with those of certain third-party technology and benefits services providers to allow clients and WSEs to access a unified view of all of their pertinent HR information.
By offering a proprietary, cloud-based HR system, our clients gain the efficiencies of an enterprise-level software solution without the significant cost of in-house installation or ongoing maintenance. Features include:
multi-tenant system enabling multiple clients and WSEs to share one version of our system while isolating each client’s and WSE’s data;
rule-based provisioning ensuring that all users are authenticated, authorized and validated before they can access our systems;
redundant processing centers to protect client data from loss;
integrated benefits and payroll processing for faster, more accurate data; and
flexible and extensible platform architecture.
From 2013 through 2015, we invested approximately $111.3 million in our technology systems. We plan to continue to invest to upgrade and improve our technology offerings, including enhancements of our solutions to address specific needs of clients in our key vertical markets, as we believe the continued improvement of our technology provides TriNet with the ability to drive operating efficiencies while improving our clients’ experience. We will leverage our existing online technology offerings to build additional products and features, including a full-service mobile platform, standard APIs for selected third party offerings, improved client experience for key processes, and retirement of legacy software systems from acquisitions and migration of clients to the primary TriNet software system.
Competition
We face significant competition on a national and regional level from a number of companies purporting to deliver a range of bundled services that are generally similar to the services we provide. The National Association of Professional Employer Organizations, or NAPEO, estimates that there are between 780 and 980 such entities currently operating in the United States. We are one of only five PEOs accredited by the Employer Services Assurance Corporation that offers services in all 50 states and believe that we are one of the largest PEOs in the industry. Our competitors include large PEOs such as the TotalSource unit of Automatic Data Processing, Inc. and Insperity, Inc., as well as specialized and smaller PEOs and similar service providers. If and to the extent that we and other companies providing these services are successful in growing our businesses, we anticipate that future competitors will enter this industry.
In addition to competition from other professional employer organizations, we also face significant competition in the form of companies serving their HR needs in both traditional and non-traditional manners. These forms of competition include:
HR and information systems departments and personnel of companies that perform their own administration of employee benefits, payroll and HR;
providers of certain endpoint HR services, including payroll, employee benefits and business process outsourcers with high-volume transaction and administrative capabilities, such as Automatic Data Processing, Inc., Paychex, Inc. and other third-party administrators;
employee benefit exchanges that provide benefits administration services over the Internet to companies that otherwise maintain their own employee benefit plans; and
insurance brokers who allow third party HR systems to integrate with their platform.
We believe that our services are attractive to many SMBs in part because of the quality and breadth of our workers compensation, group health insurance and other employee benefits programs. We compete with insurance brokers and other providers of this coverage in this regard.
We believe the principal competitive factors in our market include the following:
level of client satisfaction;
ease of client setup and on-boarding;
breadth and depth of benefit plans;
vertical market expertise;
total cost of service;
brand awareness and reputation;
ability to innovate and respond to client needs rapidly;
online and mobile functionality; and
subject matter expertise.
We believe that we compete favorably on the basis of each of these factors.
Sales and Marketing
We sell our solutions primarily through our direct sales organization. We have aligned our sales organization by industry vertical with the goal of drivinggrowing profitable market share in our targeted industries. This vertical approach deepens our network of relationships and gives us an understanding of the unique HR needs facing SMBs in those industries. As part of our vertical approach, we conduct industry-specific client marketing programs, including industry and geographic focus groups, to foster a sense of community through the sharing of best practices, while also collecting valuable information about the unique requirements of companies in particular industries. This knowledge then allows our sales team to work with our product development and client service teams to build bundled solutions of services that are tailored to the specific needs of clients in these industries.
The number of sales representatives in the field has grown substantially in recent years, through both internal hiring and through onboarding sales representatives from acquired businesses, from 80224 sales representatives as of December 31, 20112012 to 481452 sales representatives as of December 31, 2015. In our direct sales organization, we2016. We recruit and seek to hire sales professionals who have experience in a specific industry vertical market,markets, and with a background in selling business services such as accounting, HR or sales solutions. As of December 31, 2015,2016, we had approximately 5049 regional field sales offices.
Our sales team’s primary focus and goal is to win new accounts as opposed to mining our installed base of business for incremental revenue. In order to drive the most effective cost of acquisition for this new business, we continually fine-tune our lead generation and marketing efforts and our initiatives to attempt to drive higher productivity per sales representative.
Our marketing, inside sales, lead generation, and lead incubation efforts support the success of our direct sales representatives. We employ a broad range of vertically focused awareness and demand-generation marketing programs, including digital and print advertising, e-mail, direct mail and social media. We have an internal public relations team that works with an external agency to promote relevant content to target media outlets. We sponsor and participate in associations and events around the country and utilize these forums to target specific vertical and geographic markets. We also generate
sales opportunities and deepen our relationships within key industry verticals, through marketing alliances and other indirect channels, such as existing clients, certified public accountants,accounting firms, venture capital firms, incubators, insurance brokers, and other vertical market industry associations. Additionally, we utilize digital marketing programs, including digital advertising, search and email marketing, to create awareness and interest in our products.
We drive sales representative productivity in a number of ways, including by improving the quality of leads generated by our marketing and inside sales teams, and through the development of a sales operations team that offloads sales process work. We believe our focus on specific verticals, and the expertise gained through this focus, makes our sales representatives increasingly relevant to their target audience. Recently, we have expanded our focus on various channel relationships and alliances that drive warm leadsreferrals to our direct sales force. Finally, our sales representatives benefit from building strong relationships with prospects during the sales process,and client service processes, resulting in referrals to new prospects as well as direct support through providing reference calls in regardsregard to our products and services.
Legal and Regulatory
Our business operates in a complex environment created by the numerous federal, state and local laws and regulations relating to labor and employment matters, benefit plans and income and employment taxes. The following summarizes what we believe are the most important legal and regulatory aspects of our business:
Federal Regulations
Employer Status
We sponsor our employee benefit plan offerings as the “employer” of our WSEs under the Internal Revenue Code of 1986 (the Code), and ERISA. The multiple definitions of “employer” under both the Code and ERISA are not clear and most are defined in part by complex multi-factor tests under common law. We believe that we qualify as an “employer” of our WSEs in the U.S. under both the Code and ERISA, as well as various state regulations, but this status could
be subject to challenge by various regulators. For additional information on employer status and its impact on our business and results of operations, refer to Item 1A of this Form 10-K, under the heading - If we are not recognized as an employer of worksite employees under federal and state regulations, or are deemed to be an insurance agent or third-party administrator, we and our clients could be adversely impacted.
Affordable Care Act and Health Care Reform
The Patient Protection and Affordable Care Act (ACA) was signed into law in March 2010. The ACA implemented sweeping health care reforms with staggered effective dates from 2010 through 2020, and many provisions in the Act require the issuance of additional guidance from the U.S. Department of Labor (DOL), the Internal Revenue Service (IRS), the U.S. Department of Health and Human Services and the states. There could be significant changes to the ACA and health care in general in 2017 and beyond, including the potential modification, amendment or repeal of the ACA. For additional information on the ACA and its impact on our business and results of operations, refer to Item 1A of this Form 10-K, under the heading - Our business is subject to numerous complex state and federal laws, and changes in, uncertainty regarding, or adverse application of these laws could adversely affect our business.
Health Insurance Portability and Accountability Act
Maintaining the security of our WSEs information is important to TriNet as we sponsor employee benefit plans and may have access to personal health information of our WSEs. The manner in which we manage protected health information (PHI) is subject to the Health Insurance Portability and Accountability Act of 1996 (HIPAA), and the Health Information Technology for Economic and Clinical Health Act of 2009 (HITECH Act). HIPAA contains substantial restrictions and health data privacy, security and breach notification requirements with respect to the use and disclosure of PHI. Further, under the HITECH Act there are steep penalties and fines for HIPAA violations. Our health plans are covered entities under HIPAA, and we are therefore required to comply with HIPAA's portability, privacy, and security requirements.
However, only our Flexible Spending Accounts and SOI dental plans come into direct contact with PHI. The other health information we possess is anonymized and accessed through a secured third-party database. For additional information on how we maintain the confidentiality of our clients' and WSEs' personal data and PHI and the potential impact to our business if we fail to protect our WSEs' PHI, refer to Item 1A of this Form 10-K, under the heading - Cyber-attacks or security breaches could result in reduced revenue, increased costs, liability claims or damage to our reputation.
Certified Professional Employer Organization (PEO)
With passage of the Small Business Efficiency Act in 2014, the U.S. Congress clarified the employer status of PEOs who voluntarily become certified under this law for federal tax purposes under the Code. The IRS has started accepting applications for certification under the Code, and we intend to apply for certification, even though final regulations for the certification program have not yet been issued.
State Regulations
Forty-two states have adopted provisions for licensing, registration, certification or recognition of co-employers, and others are considering such regulation. Such laws vary from state to state but generally provide for monitoring or ensuring the fiscal responsibility of PEOs, and in some cases codify and clarify the co-employment relationship for unemployment, workers' compensation and other purposes under state laws. We believe we are in compliance in all material respects with the requirements in all 42 states.
We must also comply with state unemployment tax requirements where our clients are located. State unemployment taxes are based on taxable wages and tax rates assigned by each state. The tax rates vary by state and are determined, in part, based on our prior years’ compensation and unemployment claims experience in each state. Certain rates are also determined, in part, by each client’s own compensation and unemployment claims experience. In addition, states have the ability under law to increase unemployment tax rates, including retroactively, to cover deficiencies in the unemployment tax funds.
Strategic Acquisitions
Historically, we have pursued strategic acquisitions to both expand our product capabilities and supplement our growth across geographies and certain industry verticals. Our acquisition targets have included other bundled HR providers as well as technology companies or technology product offerings to supplement or enhance our existing HR solutions. We intend to continue to pursue strategic acquisitions that will enable us to add new clients and WSEs, expand our presence in certain geographies or industry verticals and offer our clients and WSEs more comprehensive and attractive products and services.
ClientsClient Industries and Geographies
We approach the market with a vertical, or industry-based, focus. Our clients spanare distributed across a variety of industries including technology, life sciences, not-for-profit, professional services, financial services, property management, retail, manufacturing, and hospitality. We have grownOur clients execute annual service contracts with us that automatically renew. Generally, our number of clients from approximately 4,500 as of December 31, 2011may cancel these contracts with thirty to over 12,700 clients as of December 31, 2015. We have also grown our number of WSEs from approximately 83,000 as of December 31, 2011 to approximately 324,000 in all 50 states, the District of Columbianinety days' notice and Canada as of December 31, 2015.
U.S. Legal and Regulatory Environment
The complex environment created by the numerous federal, state and local laws and regulations relating to labor and employment matters, benefit plans and income and employment taxes creates a significant demand for our HR solutions. Many of those laws and regulations also significantly affect how we are able to provide our HR solutions to our clients. Many ofmay cancel these laws, such as ERISA, were enacted before the development of the co-employment relationship and other non-traditional employment relationships, such as temporary employment and other employment-related outsourcing arrangements. Therefore, many of these laws do not specifically address the obligations and responsibilities of professional employer organizations utilizing a co-employment model like ours, creating uncertainty about their interpretation and application to our industry. In addition, other federal and state laws and regulations, such as the Affordable Care Act, are relatively new and administrative agencies and federal and state courts have only begun to interpret and apply these regulations to our industry. The development of additional regulations and interpretation of these laws and regulations can be expected over time.contracts with thirty days' notice.
We believe thatconduct our operations are currently in compliance in all material respects with applicable federal and state statutes and regulations. The sections discussed below summarize what we believe are the most important regulatory aspects of our business:
Employer Status
In order for clients and WSEs to receive the full benefit of our employee benefit plan offerings, it is important that we constitute the “employer” of the WSEs under the Internal Revenue Code of 1986, or the Code, and ERISA. The definitions of “employer” under both the Code and ERISA are not clear and are defined in part by complex multi-factor tests under common law. We believe that we qualify as an “employer” of our WSEsbusiness primarily in the United States under bothof America (U.S.), with more than 99% of our total revenues being attributable to WSEs in the CodeU.S. and ERISA,the remainder being attributable to WSEs in Canada. Substantially all our long-lived assets are located in the U.S.
Seasonality
Our business is affected by seasonality in business activity and we implement processes to protect and preserve this status. With Congressional passageWSE behavior. Clients generally change their payroll service providers at the beginning of the Small Business Efficiency Act in December 2014, the Code clarified the employer status of professional employer organizations, or PEOs, for federalpayroll tax purposes, for those PEOs who voluntarily become certified under this law. The IRS is expected to begin accepting applications for certification in July 2016year and we currently intend to apply for certification.
Tax Qualified Plans. In order to qualify for favorable tax treatment under the Code, certain employee benefit plans such as 401(k) retirement plans and cafeteria plans must be established and maintained by an employer for the exclusive benefit of its employees. Generally, an entity is an “employer” of certain workers for federal employment tax purposes if an employment
relationship exists between the entity and the workers under the common law test of employment. The common law test of employment, as applied by the IRS, involves an examination of many factors to ascertain whether an employment relationship exists between a worker and a purported employer. Our 401(k) retirement plans are operated pursuant to guidance provided by the IRS for the operation of defined contribution plans maintained by co-employers that benefit WSEs. This guidance provides qualification standards for such plans. All of our 401(k) retirement plans have received favorable determination letters from the IRS confirming the qualified status of the plans. The IRS 401(k) guidance and qualification requirements are not applicable to the operation of our cafeteria plans.
ERISA Regulation. Employee pension and welfare benefit plans are also governed by ERISA. ERISA defines an “employer” as “any person acting directly as an employer, or indirectly in the interest of an employer, in relation to an employee benefit plan.” ERISA defines the term “employee” as “any individual employed by an employer.” The courts have held that the common law test of employment must be applied to determine whether an individual is an employee or an independent contractor under ERISA. However, in applying that test, control and supervision are less important for ERISA purposes when determining whether an employer has assumed responsibility for providing employee benefits. A definitive judicial interpretation of “employer” in the context of a professional employer organization has not been established, and the U.S. Department of Labor has issued guidance that certain entities in the HR outsourcing industry do not qualify as common law employers for ERISA purposes. If we were found not to be an employer for ERISA purposes, it could affect the manner in which we are able to provide employee benefits to our WSEs.
Affordable Care Act
The Affordable Care Act, or the Act, implemented sweeping health care reforms with staggered effective dates from 2010 through 2020, and many provisions in the Act require the issuance of additional guidance from the U.S. Department of Labor, the IRS, the U.S. Department of Health and Human Services and the states. The Act imposed a number of new mandates on the coverage required to be provided under health insurance plans beginning in 2010, with additional requirements staged in subsequent years. We believe that our group health insurance plans comply with existing mandates. However, the guidance issued to date by the IRS and the U.S. Department of Health and Human Services has not addressed, or in some instances is unclear, as to its application in the co-employer context. As a result, we are not yet able to predict allhave historically experienced our highest volumes of new and exiting clients in the impacts to our business,month of January. Other periods of client changes coincide with a client's benefit program renewal.
Competition
Our competitors include large PEOs such as the TotalSource unit of Automatic Data Processing, Inc. and Insperity, Inc., as well as specialized and smaller PEOs and similar HR service providers with PEO operations. If and to the extent that we and other companies providing these services are successful in growing our clients, resulting from the Act.businesses, we anticipate that future competitors will enter this industry.
State Unemployment Taxes
State unemployment taxes are based on taxable wages and tax rates assigned by each state. The tax rates vary by state and are determined, in part, based on our prior years’ compensation and unemployment claims experience in each state. Certain rates are also determined, in part, by each client’s own compensation and unemployment claims experience. In addition statesto competition from other PEOs, we also face significant competition from companies that serve part of a clients’ HR needs. These forms of competition include providers of endpoint HR services, employee benefit exchanges that provide benefits administration services and insurance brokers who allow third-party HR systems to integrate with their insurance services platform. Such competitors may have the ability under law to increase unemployment tax rates, including retroactively, to cover deficiencies in the unemployment tax funds. Due to the adverse U.S. economic conditions during recent yearsgreater marketing and the associated reductions in employment levels, the state unemployment tax fundsfinancial resources than we have, experienced a significant increase in the number of unemployment claims. Accordingly, state unemployment tax rates increased substantially over the past few years. Employers in certain states are also experiencing higher federal unemployment tax rates as a result of certain states not repaying their unemployment loans from the federal government in a timely manner. We have taken steps to mitigate the risk of fluctuations in state and federal unemployment tax rates, including reporting and remitting unemployment insurance taxes or contributions at the client level and/or under the client’s own account number in approximately 40 states, and we will continue to evaluate such reporting relationships in the future.
State Regulation of Co-Employers
Forty-two states have adopted provisions for licensing, registration, certification or recognition of co-employers, and others are considering such regulation. Such laws vary from state to state but generally provide for monitoring or ensuring the fiscal responsibility of professional employer organizations, and in some cases codify and clarify the co-employment relationship for unemployment, workers compensation and other purposes under state law. We believemay be better positioned than we are in compliance in all material respects with the requirements in all 42 states. Regardless of whether a state has licensing, registration or certification requirements for co-employers, we must comply with a number of other state and local regulations that could impact our operations, such as state and local taxes, licensing and business regulations.
Intellectual Property
Our success depends in part on intellectual property rights to the services that we develop. We rely on a combination of contractual rights, including non-disclosure agreements, trade secrets, copyrights and trademarks, to establish and protect our
intellectual property rightscertain markets. Increased competition in our names, services, methodologies and related technologies. If we lose intellectual property protectionindustry could result in price reductions or the ability to secure intellectual property protection on anyloss of our names, confidential information or technology, this could harm our business. Our intellectual property rights may not prevent competitors from independently developing services and methodologies similar to ours, and the steps we take might be inadequate to deter infringement or misappropriation of our intellectual property by competitors, former employees or other third parties,market share, any of which could harm our business. We expect that we will continue to experience competitive pricing pressure.
We believe the principal competitive factors in our market include client satisfaction, ease of client setup and on-boarding, breadth and depth of benefit plans, vertical market expertise, total cost of service, brand awareness and reputation, ability to innovate and respond to client needs rapidly, online and mobile solutions, and subject matter expertise. We believe that we compete favorably on the basis of each of these factors.
Intellectual Property
We own or license from third parties' various computer software, as well as other intellectual property rights, used in our business. Generally, we protect our intellectual property rights through the use of confidentiality and non-disclosure agreements and policies with our employees and third-party partners and vendors, although we currently have one pending U.S. patent application covering our technology. We also own registered trademarks in the United States,U.S., Canada and the European Union that have various expiration dates unless renewed through customary processes. Our trademark registrations may be unenforceable or ineffective in protectingcovering our trademarks. Ourname and other trademarks may be unenforceable in countries outside of the United States, which may adversely affect our ability to build our brand outside of the United States.
Althoughand logos that we believe thatare materially important to our conduct of our business does not infringe on the intellectual property rights of others, third parties may nevertheless assert infringement claims against us in the future. We may be required to modify our products, services, internal systems or technologies, or obtain a license to permit our continued use of those rights. We may be unable to do so in a timely manner, or upon reasonable terms and conditions, which could harm our business. In addition, future litigation over these matters could result in substantial costs and resource diversion. Adverse determinations in any litigation or proceedings of this type could subject us to significant liabilities to third parties and could prevent us from using some of our services, internal systems or technologies.operations.
Corporate Employees
We refer to our employees excluding employees that we do not co-employ on behalf ofwith our clients as our corporate employees. We had approximately 2,5002,600 corporate employees as of December 31, 2015.2016. None of our corporate employees isare covered by a collective bargaining agreement.
Corporate and Other Available Information
We were incorporated in 1988 as TriNet Employer Group, Inc., a California corporation. We reincorporated as TriNet Merger Corporation, a Delaware corporation, in 2000 and during that year changed our name to TriNet Group, Inc. Our principal executive offices are located at 1100 San Leandro Blvd., Suite 400, San Leandro, CA 94577 and our telephone number is (510) 352-5000. Our website address is www.trinet.com. Information contained in or accessible through our website is not a part of this report.
On the Investor Relations page of our Internet website at http://www.trinet.com, we make available, free of charge, our Annual Reports on Form 10-K, Quarterly Reports on Form 10-Q, Current Reports on Form 8-K, and amendments to those reports, as soon as reasonably practicable after such material is electronically filed with or furnished to the SEC. Information contained in or accessible through our website isThe public may read and copy any materials that we file with the SEC at the SEC’s Public Reference Room at 100 F Street, NE, Room 1580, Washington, DC 20549. The public may obtain information on the operation of the Public Reference Room by calling the SEC at 1-800-SEC-0330. The SEC also maintains an internet site that contains reports, proxy and information statements and other information regarding issuers that file electronically with the SEC at www.sec.gov. The contents of these websites are not incorporated into this report and isare not a part of this report.
Item 1A. Risk Factors
Investing in our common stock involves a high degree of risk. You should carefully consider the following risks and all of the other information contained in this report, including the section of this report titled “Management’s Discussion and Analysis of Financial Condition and Results of Operations” and our consolidated financial statements and related notes. Any of the following risks could materially and adversely affect our business, financial condition and results of operations and cause a decline in the trading price of our common stock, and you may lose some or all of your investment.
Risks Related to Our Business and Industry
Our co-employment relationship with our worksite employees exposes us to business risks.
Under our agreements with our clients, we are a co-employer of our WSEs and assume certain obligations, including the responsibility to pay salaries, wages and related payroll taxes of our WSEs, and to do so, to the extent required by law, regardless of whether our client timely remits payments to us. In addition, we provide benefits to our WSEs, even if the cost of providing such benefits is greater than fees received from our clients. Although our client agreements require clients to pay these amounts or indemnify us for failure to make such payments, we may not be able to effectively enforce or collect on these contractual obligations. Accordingly, our ultimate liability for payroll and benefits expenses for our WSEs could exceed the amounts we receive from our clients, which could have a material adverse effect on our financial condition or results of operations.
Moreover, as a co-employer of our WSEs, there is a possibility that we may be subject to liability for violations of employment laws and other acts and omissions by our clients or WSEs, who may be deemed to be our agents, even if we do not participate in any such acts or violations. Such laws include, but are not limited to, laws relating to payment of wages, employment discrimination, labor relations and whistleblower protection. Although our client agreements establish the contractual division of responsibilities between us and our clients for various personnel management matters, including compliance with and liability under various governmental regulations, as well as providing for clients to indemnify us for any liability attributable to clients’ or their employees’ conduct, we may not be able to effectively enforce or collect on these contractual obligations, which could have a material adverse effect on our financial condition or results of operations.
We maintain employment practices liability insurance coverage (often including coverage for our clients) to manage our and our clients’ exposure for various WSE-related claims and are responsible (often together with our clients) for any deductible layer under such coverage. Furthermore, employment practices liability insurance generally excludes coverage for claims relating to compliance with laws associated with the classification of employees as exempt or non-exempt, such as overtime pay and minimum wage law compliance. We cannot assure you that our insurance will be sufficient in amount or scope to cover all claims that may be asserted against us and for which we are unable to obtain indemnification from our clients. If judgments or settlements or defense costs exceed our insurance coverage, it could harm our results of operations and financial condition. We cannot assure you that we will be able to obtain appropriate types and levels of insurance in the future, that we will be able to replace existing policies on acceptable terms, or at all, or that our insurers will be able to pay all claims that we may make under our policies, any of which could have a material adverse effect on our financial condition or results of operations.
Our business is subject to numerous state and federalcomplex laws, and changes in, uncertainty as to theregarding, or adverse application of these laws or adverse applications of these laws, as well as changes in applicable laws, could adverselynegatively affect our business.
Our operationsThe products and services we provide to our clients are governed by numerous complex federal, state and local laws relating to labor, tax, employee benefits, insurance and employment matters. However, manyregulations, including those described under the heading "Legal and Regulatory" in Item 1 of this Form10-K. Many of these laws (such as ERISA and federal and state employment tax laws)laws, wage and hour laws, anti-discrimination laws, etc.) may not result in a consistent approach at the federal, state and local level, do not specifically address the obligationsPEOs and responsibilitiesco-employment relationships or may allow significant regulatory interpretation and discretion in enforcement. As a result, there is uncertainty in how they might be applied to our operations and those of a professional employer organization providing outsourced HR services in a co-employment relationship, and the definition of employer under these laws is not uniform. In addition, many states have not addressed the co-employment relationship for purposes of compliance with applicable state laws governing the relationship between employers and employees and state insurance laws. We are not able to predict whether broader federal or state regulation governing our business and the co-employment relationship with our WSEs will be implemented, or if it is, how it will affect us, our clients and WSEs.
New laws, changes in existing laws, or our WSEs. Any adverse application or interpretation (in courts, agencies or otherwise) of new or existing federal or state laws to theregarding our co-employment relationship with our clients and WSEs could reduce or eliminate the need for, or benefit provided by, some or all of the services we provide or require us to make significant changes in our methods of doing business and providing services, which could have a material adverse effect on our financial condition and results of operations. If federal, state or local jurisdictions were to change their regulatory framework related to outsourced HR services, or introduce new laws governing our industry that were materially different from existing laws, thoseRegulatory changes could reduce or eliminate the need for some of our services, or could require that we make significant changes in our methods of doing business, which could increase our cost of doing business. Changes in regulations could also affect the extent and type of employee benefits employers can or must provide employees, the amount and type of taxes employers and employees are required to pay or the time within which employers must remit taxes to the applicable tax authority. These changesFor example, continued uncertainty regarding the implementation and future of health care reform in the U.S. under the ACA, any successor to the ACA, related or similar state laws, and the regulations adopted or to be adopted thereunder, has the potential to substantially change the health insurance market for SMBs and how such employers provide health insurance to their employees, which could substantially decrease our revenues and substantially increase our cost of doing business and have a materialmaterially adverse effect on our financial conditionability to attract and resultsretain our clients. In addition, there could be significant changes to the ACA in 2017 and beyond, including the potential modification, amendment or repeal of the ACA. Changes to the ACA could also result in new or amended regulations being introduced at the state or local level. Changes in, or uncertainty regarding, the ACA and other health care reforms could impact our business and we are not able to predict the direction or ultimate impact of health care reform on our business operations.
Although some statesSimilarly, state regulatory authorities generally impose licensing requirements on companies acting as insurance agents or third-party administrators, such as those that handle health or retirement plan funding and claim processing. We do not explicitly regulate professional employer organizations, 42 states have passed lawsbelieve that haveour current activities require such licensing, certificationbut if regulatory authorities in any state determine that we are acting as an insurance agent or registration requirements applicable to professional employer organizations or recognize the professional employer organization model, and other states may implement such requirements in the future. Laws regulating professional employer organizations vary from state to state, but generally provide for oversight of the fiscal responsibility of professional employer organizations, and in some cases codify and clarify the co-employment relationship for processing unemployment claims, workers compensation and other purposes under state law. We may be required to spend significant time and resources to satisfy licensing requirements or other applicable regulations in some states, andas a third-party administrator, we may not be ableneed to satisfy these requirements or regulations in all states, which could prohibit us from doing business in such states,hire additional personnel to manage regulatory compliance and become obligated to pay annual regulatory fees, which could have a material adverse effect on our financial condition and results of operations.
Our co-employment relationship with our worksite employees exposes us to business risks.
We are the co-employer of our WSEs. As the co-employer of our WSEs, we assume certain obligations and responsibilities of an employer. For instance, we are responsible for providing benefits to our WSEs regardless of whether the cost of providing benefits exceeds the fees received from our clients. Under certain circumstances, it could be argued that we are, or we may be found to be, responsible for paying salaries, wages and related payroll taxes of our WSEs, regardless of whether our client timely remits payments to us.
We co-employ people in our clients' workplaces. Our ability to control the workplace environment of our clients is limited. As a co-employer of our WSEs, there is a possibility that we may be subject to liability for violations of employment or other laws and other acts and omissions by our clients or WSEs, who may be deemed to be our agents, even if we do not participate in any such acts or violations.
We seek to mitigate these risks through our client agreements and with employment practices liability insurance coverage. Our agreements with our clients establish the contractual division of responsibilities between us and our clients and that they will indemnify us for any liability attributable to their own or our WSEs' conduct, however, we may not be able to effectively enforce or collect on these contractual obligations. In addition, we maintain employment practices insurance to limit our and our clients' exposure to various WSE related claims, but we are still responsible for any deductible layer under such insurance and such insurance generally excludes coverage for claims relating to the classification of employees as exempt or non-exempt, other wage and hour issues, and employment contract disputes, among other things. We cannot assure you that our insurance will be sufficient in amount or scope to cover all claims that may be asserted against us and for which we are unable to obtain indemnification from our clients. Negative publicity relating to events or activities attributed to us, our corporate employees, our WSEs, or others associated with any of these parties, whether or not justified, may tarnish our reputation and reduce the value of our
brand. In addition, if our brand is negatively impacted, it may have a material adverse effect on our business, including creating challenges in retaining clients or attracting new clients and hiring and retaining employees.
If we are not recognized as an employer of worksite employees under federal and state regulations, or are deemed to be an insurance agent or third-party administrator, we and our clients could be adversely impacted.
In order for WSEs to receive the full benefit ofsponsor our employee benefitsbenefit plan offerings it is important thatfor our WSEs, we act andmust qualify as an employer of theour WSEs for certain purposes under the Code and ERISA. In addition, our status as an employer is important for purposes of ERISA’s preemption of certain state laws. The definition of employer under various laws is not uniform, and under both the Code and ERISA, the term is defined in part by complex multi-factor tests. We believe
Generally, these tests are designed to evaluate whether an individual is an independent contractor or employee and they provide substantial weight to whether a purported employer has the right to direct and control the details of an individual's work. Some factors that we
qualify as an employer of our WSEsthe IRS has considered important in the United States forpast have included the relevant purposeemployer’s degree of bothbehavioral control (the extent of instructions, training and the Code and ERISA, and we implement processes to protect and preserve this status. With passagenature of the Small Business Efficiency Actwork), the financial control and the economic aspects of the relationship, and the intent of the parties, as evidenced by the specific benefit, contract, termination and other similar arrangements between the parties and the on-going versus project-oriented nature of the work to be performed. However, a definitive judicial interpretation of “employer” in December 2014, the U.S. Congress clarified the employer statuscontext of professional employer organizations or PEOs has not been established. For ERISA purposes, for federal tax purposes under the Code for those PEOs who voluntarily become certified under this law. The IRS is expectedexample, courts have held that test factors relating to begin accepting applications for certification under the Code in July 2016ability to control and we currently intend to apply for certification. However,supervise an individual are less important, while the U.S. Department of Labor has issued guidance that certain entities in the HR outsourcing industry maydo not qualify as common law employers for ERISA purposes. Although we believe that we qualify as an employer of our WSEs under ERISA and the U.S. Department of Labor has not provided guidance otherwise, we are not able to predict the outcome of any future regulatory challenge.
If we were found not to be an employer under the Code orfor ERISA purposes, it could adversely affect the manner in which we are able to provide employee benefits to our WSEs and could have a material adverse effect on our financial condition and results of operations.
In addition, state regulatory authorities generally require licensesWSEs. Similarly, to qualify for companies that do business in their states as insurance agents or third-party administrators,favorable tax treatment under the Code, certain employee benefit plans such as those that handle health or401(k) retirement plan fundingplans and claim processing. Insurancecafeteria plans must be established and third-party administrator regulation coversmaintained by an employer for the exclusive benefit of its employees. All of our 401(k) retirement plans are operated pursuant to guidance provided by the IRS and we have received favorable determination letters from the IRS confirming the qualified status of the plans. However, the IRS uses its own complex, multi-factor test to ascertain whether an employment relationship exists between a host of activities, including sales, underwriting, rating, claims paymentsworker and record keeping by companies and agents. We do nota purported employer. Although we believe that our services constitute actingwe qualify as an insurance agent or third-party administrator. If regulatory authorities in any state determineemployer of our WSEs under the Code, we cannot assure you that the natureIRS will not challenge this position or continue to provide favorable determination letters. Moreover, the IRS' 401(k) guidance and qualification requirements are not applicable to the operation of our business requires thatcafeteria plans.
If we be licensedare not recognized as an insurance agentemployer under the Code or as a third-party administrator,ERISA, we may needbe required to hire additional personnelchange the method by which we report and remit payroll taxes to manage regulatory compliancethe tax authorities and become obligatedthe method by which we provide, or discontinue providing, certain employee benefits to pay annual regulatory fees,our WSEs, which could have a material adverse effect on our financial conditionbusiness and results of operations.
We must also qualify as an employer of our WSEs under state regulations, which govern licensing, certification and registration requirements for PEOs. Forty-two states have passed such laws and other states may implement such requirements in the future. While we believe that we qualify as an employer of our WSEs under these state regulations, these requirements vary from state to state and change frequently and if we are not able to satisfy existing or future licensing requirements or other applicable regulations of any states, we may be prohibited from doing business in that state.
Cyber-attacks or security breaches could result in reduced revenue, increased costs, liability claims or damage to our reputation.
Maintaining the security of our IT infrastructure and the confidentiality of our, our clients' and WSEs' personal data and information is paramount for us and our clients could be adversely impacted by health care reform.
The Affordable Care Act, orclients. Clients using our technology platform rely on the ACA, proposes sweeping health care reforms with staggered effective dates from 2010 through 2020,security of our IT infrastructure to ensure the reliability of our products and many provisions of the ACA require the issuance of additional guidance from the U.S. Departments of Labor and Health and Human Services, the IRSservices and the states. A numberprotection of key provisionstheir and their WSEs data. We use and store significant personal data and confidential information about our clients, WSEs and employees, including bank account and social security numbers, tax return data, certain medical information, retirement account information and payroll data. Threats to security can take a variety of the ACA have begunforms. Hackers may develop and deploy viruses, worms and other malicious software programs that attack our networks and data centers. Sophisticated organizations or individuals may launch targeted attacks using novel methods to take effect over the past several years, including the establishment of stategain access to our networks, applications and federal insurance exchanges, insurance market reforms, “play or pay” penaltiesconfidential data. Although we rely on applicable large employers and the imposition and assessment of excise taxes and reinsurance taxes on insurersstandard security systems, development practices and third-party administrators. Collectively,assessment service to provide the security and authentication necessary to effect secure transmission of data, these items have the potential to significantly change the insurance marketplace for employers and how employers offer or provide insurance to employees.
As a co-employer of our clients’ WSEs, we assume or share certain employer-related responsibilities and legal risks and assist our clients in complying with many employment-related governmental regulations. Generally, the ACA and subsequently issued guidance by the IRS and the U.S. Department of Health and Human Services have not addressed, or in some instances are unclear, as to their application in the co-employment relationship. In future periods, the changesthreats may result in increased costsbreaches of ou
r network or data security, disruptions of our internal systems and business applications, impairment of our ability to provide services to our customers, product development delays, harm to our competitive position from the compromise of confidential business information, or other negative impacts on our business.
Maintaining the security of our WSEs' information is particularly important to us as a sponsor of employee benefit plans with access to certain personal health information. The manner in which we manage protected health information (PHI) is subject to HIPAA and the HITECH Act. Although we maintain, and actively seek to improve, security measures and infrastructure designed to protect against unauthorized access to this sensitive data, cyber-attacks and security breaches remain a significant threat to our business. Any security breach could result in the access, public disclosure, loss or theft of the confidential and personal data of our clients and WSEs, which could negatively affect our ability to attract and retain clients. Additionally, we may be limited or delayed in our ability to increase service fees to offset any associated potential increased costs resulting from compliance with the ACA. Furthermore, the uncertainty surrounding the terms and application of the ACA may delay or inhibit the decisions of potentialnew clients, cause existing clients to outsourceterminate their HR needs.agreements with us, result in reputational damage and subject us to lawsuits, regulatory fines, or other actions or liabilities which could materially and adversely affect our business and operating results.
In providing our services, we also rely on third-party service providers and products, such as insurance carriers, to process sensitive information about our clients, WSEs and employees. Through contractual provisions, we take steps to require that our service providers protect sensitive information. However, we cannot provide assurances as to the security steps taken by such providers. Any security breach or other disruption of our third-party service providers that results in an inadvertent disclosure or loss of confidential information could adversely affect our reputation and our business.
We devote resources to defend against security threats, both to our internal IT systems and those of our customers. We focus our defense efforts on the following cyber-security discipline areas:
security threat detection and prevention,
data loss prevention,
identity and access management,
audit, policies and controls, and
product security.
The cost of these developmentsprecautionary measures could reduce our operating margins.
Any cyber-attack or security breach that accesses or discloses sensitive data may have a material adverse effect onaffect negatively our financial conditionreputation and resultsour client relationships, and the cost of operations.
Our inability to offer competitive health and/remediating any attack, breach or workers compensation insurance rates could harm our business.
If we are unable to offer competitive health and/or workers compensation insurance rates to our clients, it could affect our ability to attract and retain clients, which would have a material adverse effect on our business. For example, where we offer our clients and their WSEs group health insurance policies with respect to which our carriers set the premiums and for which we are not responsible for any deductible, the rates set by our carriers on such policies may not be competitive. Further, for policies with respect to which we agree to pay additional amounts to our carriers for any claims that they pay within an agreed-upon deductible layer, we may not be able to control costs through the deductible layer in a way that would make our rates competitive. In addition, broad adoption of our services in certain geographies or industries may make it more difficult for us to obtain competitive health and/or workers compensation insurance rates due to concentration of clients within a particular geography or industry. The inability to offer competitive insurance rates, for the above reasons or any other,disclosure could have a material adverse effect on our financial condition and results of operations.business.
Unexpected changes in workersworkers' compensation and health insurance claims by worksite employees could harm our business.
We maintain health and workers compensationOur insurance coveringcosts, which make up a significant portion of our WSEs. Our insuranceoverall costs, are impacted significantly by our WSEs’ health and workersworkers' compensation insurance claims experience. We establish reserves to provide for the estimated costs of reimbursing our workersworkers' compensation and health insurance carriers for payingunder our insurance policies, but the volume and severity of claims within the deductible layeractivity is inherently unpredictable. If we experience a sudden or unexpected increase in accordance with theirclaim activity, our costs could increase, and it could be more difficult to secure replacement insurance policies.policies on competitive terms once our current policies expire. Estimating these reserves involves our consideration of a number
of factors and requires significant judgment. If there is an unexpected increase in the severity or frequency of claims activity of our WSEs (including activity arising from any of a number of factors that affect claim activity levels, such as changes in general economic conditions, claims differing significantly from expectations for new and existing clients, proposed and enacted regulatory changes, and terrorism, disease outbreaks or other catastrophic events ), or if we subsequently receive updated information indicating insurance claims were higher than previously estimated and reported, our insurance costs could be higher in that period or subsequent periods as we adjust our reserves accordingly. We have also experienced variability in the amount of our insurance costs due to the number and severity of insurance claims being unpredictable. For example, in the three months ended June 30, 2015, we experienced a significant increase in the number of large medical claims,accordingly, which resulted in a significant increase in insurance costs. In addition, we may be unable to increase our pricing to offset increases in insurance costs either in full or on a timely basis. Incorporating cost increases into what we charge our clients could also adversely impact our ability to attract and retain clients. The occurrence of any of the above could have a material adverse effect on our financial conditionbusiness. We have experienced insurance cost variability due to claims activity in the past and results of operations.
Adverse changescould have similar or worse experience in our relationships with key vendors, particularly our employee benefit carriers, could harm our business.the future.
Our success dependsfully-insured agreements with our health insurance carriers include non-guaranteed cost policies that typically include limits to our exposure for individual claims, which are referred to as pooling limits, and limits to our maximum aggregate exposure for claims in parteach policy year. Refer to Note 1 in Part II, Item 8 of this Form 10-K for further
discussion of these policies. We have experienced variability, and may experience variability in the future, in the amounts that we are required to pay our health insurance carriers for group health insurance expenses incurred by WSEs within our deductible layer under non-guaranteed cost policies, based on our abilitycontinually changing trends in the frequency and severity of claims. These historical trends may change, and other seasonal trends and variability may develop, which may make it more difficult for us to establish and maintain arrangements and relationships with vendors that supply us with essential componentsmanage this aspect of our services. These service providers include insurance carriers to provide healthbusiness and workers compensation insurance coverage for WSEs, as well as other vendors such as couriers used to deliver client payroll checks and banks used to electronically transfer funds from clients to their WSEs. Failure by these service providers, for any reason, to deliver their services in a timely manner could result in material interruptions to our operations, impact client relations, and result in significant penalties or other liabilities to us. If any of these vendors decide to terminate its relationship with us, particularly our employee benefit carriers, wewhich may have difficulty obtaining replacement services at reasonable rates or on a timely basis, if at all. The loss of any one or more of our key vendors, or our inability to partner with certain vendors that are better-known or more desirable to our clients or potential clients, could have a material adverse effect on our financial conditionbusiness.
Client unemployment tax rates can change based on factors outside of our control, which could adversely affect client retention and results of operations.growth.
Security breaches could resultWe must comply with federal unemployment tax regulations and state unemployment tax regulations where our clients are located. Unemployment taxes are generally based on taxable wages. The tax rates vary by state and are determined, in part, based on our prior years’ compensation and unemployment claims experience in each state. Certain rates are also determined, in part, by each client’s own compensation and unemployment claims experience. In addition, some states can retroactively increase unemployment tax rates to cover deficiencies in the improper disclosure of sensitive company, employee, clientunemployment tax funds, and WSE data, including personal information, exposingfederal unemployment taxes can be retroactively increased in states that have failed to timely repay federal unemployment loans. It may be difficult for us to liability, which would causerecover increased taxes from our business and reputation to suffer.
Our ability to ensure secure electronic processing, maintenance and transmission of payroll, insurance and other sensitive employee, client and WSE information is critical to our operations. This information could include sensitive or confidential data, such as employees’ Social Security numbers, bank account numbers, retirement account information and medical information.
We rely on standard internet and other security systems to provide the security and authentication necessary to effect secure transmission of data. Despite our security measures, it is possible that our information technology and infrastructure may be vulnerable to cybersecurity threats, including attacks by hackers and other malfeasance. Third parties, including vendors that provide services for our operations, could also be a source of security risk to usclients in the event of a failure of their own securitysuch retroactive tax increases.
In addition, adverse U.S. economic conditions and associated reductions in employment levels can place strain on unemployment systems, which has resulted in substantial increases in state and infrastructure. Any such security breach could compromise our networksfederal unemployment tax rates over the past few years and result in the information stored or transmitted there to be accessed, publicly disclosed, lost or stolen. Any such access, disclosure or other loss of information could result in legal claims or proceedings leading to liability, including under laws that protect the privacy of personal information, disrupt our operations and the services we provide tothis trend may continue. In some states, our clients may face higher rates as a result of these increases under a co-employment relationship with us than they would alone. While we have taken steps to mitigate the risk of fluctuations in state and WSEs, damage our reputationfederal unemployment tax rates, including reporting and cause a loss of confidenceremitting unemployment insurance taxes or contributions at the client level and/or under the client’s own account number in our productsapproximately 40 states, unexpected state and services, whichfederal unemployment tax increases or regulatory changes could adversely affect our business, operations and competitive position. In the course of providing our servicesability to ourretain existing clients we also rely on certain third-party service providers and products, such as insurance carriers, to process information related to our employees, clients and WSEs. Through contractual provisions, we take steps to require that our service providers protect sensitive information. However, we cannot provide assurances as to the security steps taken by such providers. Any security breach or other disruption of our third-party service providers that results in an inadvertent disclosure or loss of confidential information could adversely affect our reputation and our business.attract new clients.
Our quarterly results of operations may fluctuate as a result of numerous factors, many of which are outside of our control.
Our future operating results are subject to quarterly resultsvariations based upon a variety of operationsfactors, many of which are likely to fluctuate, andnot within our results in some quarters may be below the expectations of research analysts and our investors, which could cause the price of our common stock to decline. Some of our significant expenses, such as insurance costs for our WSEs, may require significant lead time to offset or reduce. If we do not achieve our expected revenues targets, we may be unable to adjust our costs quickly enough to offset any revenues shortfall, which could
harm our results of operations. Some of the important factors that have and may cause our revenues, results of operations and cash flows to fluctuate from quarter to quarter include:control, including, without limitation:
the numbervolume and severity of health and workersworkers' compensation insurance claims by our WSEs, recorded as part of our insurance costs, and the timing of related claims information provided by our insurance carriers;carriers,
the amount and timing of our other insurance costs, operating expenses and capital expenditures;expenditures
the number of our new clients initiating service and the number of WSEs employed by each new client;client,
the loss or merger of existing clients;clients,
reduction in the number of WSEs employed by existing clients;clients,
the timing of client payments and payment defaults by clients;clients,
costs associated with our acquisitions of companies, assets and technologies;technologies,
payments or drawdowns on our credit facility, or any amendments to our obligations under our credit facility;
unanticipated expenses such as litigation or other dispute-related settlement payments;payments,
expenses we incur for geographic and service expansion;expansion,
changes in laws or adverse interpretation of laws increasing our regulatory compliance costs;costs,
changes in our effective tax rate;rate, and
the impact of new accounting pronouncements.
Many of the above factors are discussed in more detail elsewhere in this “Risk Factors” section and in the sectionPart II, Item 7 of this report titled “Management’s Discussion and Analysis of Financial Condition and Results of Operations.”Form 10-K. Many of these factors are outside our control, and the variability and unpredictability of these factors
have in the past and could in the future cause us to fail to meet our expectations and the expectations of investors and any industry analysts who cover our shares for revenues or other results of operations for a given period.period, which could result in a decline in our share price and reduced liquidity in our shares. In addition, the occurrence of one or more of these factors might cause our results of operations to vary widely, which could lead to negative impacts on our margins, short-term liquidity or ability to retain or attract key personnel, and could cause other unanticipated issues.issues, including a downgrade of our shares by or change in opinion of industry analysts and a related decline in our share price. Accordingly, we believe that quarter-to-quarter and annual comparisons of our revenues, results of operations and cash flows may not be meaningful and should not be relied upon as an indication of our future performance.
VolatilityAny failure in our business systems could reduce the quality of our business services, which could harm our reputation and expose us to liability.
Our business systems rely on the complex integration of numerous hardware and software subsystems to manage client transactions including the processing of employee, payroll and benefits data. These systems can be disrupted by, among other things, equipment failures, computer server or systems failures, network outages, malicious acts, software errors or defects, vendor performance problems, power failures, natural disasters, terrorist actions or similar events. Any delay or failure in our systems that impairs our ability to communicate electronically with our clients, employees or vendors or our ability to store or process data could harm our reputation and our business. For example, errors in our products and services, such as the erroneous denial of healthcare benefits or delays in making payroll, could expose our clients to liability claims from improperly serviced WSEs, for which we may be contractually obligated to provide indemnification.
In addition, the software, hardware and networking technologies we use must be frequently and rapidly upgraded in response to technological advances, competitive pressures and consumer expectations. To succeed, we need to effectively develop, or license from third parties, and integrate these new technologies as they become available to improve our services. We rely on enterprise software applications licensed from third parties that are upgraded from time to time. Any difficulties we encounter in adapting application upgrades to our systems could harm our performance, delay or prevent the successful development, introduction or marketing of new services.
New products or upgrades may not be released according to schedule, or may contain defects when released. Difficulties in integrating new technologies could result in adverse publicity, loss of sales, delay in market acceptance of our services, or client claims against us, any of which could harm our business. We could also incur substantial costs in modifying our services or infrastructure to adapt to these changes. In addition, we could lose market share if our competitors develop technologically superior products and services.
We have identified material weaknesses in our internal control over financial reporting that could, if not remediated, result in material misstatements in our financial statements.
In connection with the audit of our consolidated financial statements as of and for the year ended December 31, 2016, we have identified and concluded that we continue to have material weaknesses relating to our internal control over financial reporting. A material weakness is a deficiency, or a combination of deficiencies, in internal control over financial reporting such that there is a reasonable possibility that a material misstatement of our annual or interim consolidated financial statements will not be prevented or detected on a timely basis. Refer to Part II, Item 9A in this Form 10-K for more details. While the material weaknesses described in that section create a reasonable possibility that an error in financial reporting may go undetected, after extensive review and the performance of additional analysis and other procedures, no material adjustments, restatement or other revisions to our previously issued financial statements were required.
As further described in Part II, Item 9A of this form 10-K below, we are taking specific steps to remediate the material weaknesses that we identified by implementing and enhancing our control procedures. These material weaknesses will not be remediated until all necessary internal controls have been implemented, repeatably tested and determined to be operating effectively. In addition, we may need to take additional measures, including system migration and automation, to address the material weaknesses or modify the remediation steps, and we cannot be certain that the measures we have taken, and expect to take, to improve our internal controls will be sufficient to address the issues identified, to ensure that our internal controls are effective or to ensure that the identified material weaknesses will not result in a material misstatement of our annual or interim consolidated financial statements. Implementing any appropriate changes to our internal controls may distract our officers and employees and require material cost to implement new process or modify our existing processes. Moreover, other material weaknesses or deficiencies may develop or be identified in the future. If we are unable to correct material weaknesses or deficiencies in internal controls
in a timely manner, our ability to record, process, summarize and report financial information accurately and within the time periods specified in the rules and forms of the U.S. Securities and Exchange Commission, will be adversely affected. This failure could negatively affect the market price and trading liquidity of our common stock, lead to delisting, cause investors to lose confidence in our reported financial information, subject us to civil and criminal investigations and penalties, and generally materially and adversely impact our business and financial condition.
We have acquired, and may in the future acquire, other businesses and technologies, which can divert management's attention and create integration risks and other risks for our business.
We have completed numerous acquisitions of other businesses and technologies, and we expect that we will continue to grow through similar future acquisitions. Such acquisitions involve numerous other risks, including:
identifying attractive acquisition candidates,
over-valuing and over-paying for acquisition candidates,
integrating the operations, systems, technologies, services and personnel of the acquired companies, including the migration of WSEs from an acquired company’s technology platform to ours,
establishing or maintaining internal controls, procedures and policies relating to the acquired systems and processes, including the potential for actual or perceived control weaknesses associated with or arising from the acquisitions and integration of acquired systems,
diversion of management’s attention from other business concerns,
litigation resulting from activities of the acquired company, including claims from terminated employees, clients, former stockholders and other third parties,
insufficient revenues to offset increased expenses associated with the acquisitions and unanticipated liabilities of the acquired companies,
insufficient indemnification or security from the selling parties for legal liabilities that we may assume in connection with our acquisitions,
entering markets in which we have no prior experience and may not succeed,
risks associated with foreign acquisitions, such as communication and integration problems resulting from geographic dispersion and language and cultural differences, compliance with foreign laws and regulations and general economic or political conditions in other countries or regions,
potential loss of key employees of the acquired companies, and
impairment of relationships with clients and employees of the acquired companies or our clients and employees as a result of the integration of acquired operations and new management personnel.
If we fail to integrate newly acquired businesses effectively, we might not achieve the growth, service enhancement or operational efficiency objectives of the acquisitions, and our business, results of operations and financial condition could be harmed.
We may pay for acquisitions by issuing additional shares of our common stock, which would dilute our stockholders, or by issuing debt, which could include terms that restrict our ability to operate our business or pursue other opportunities and subject us to meaningful debt service obligations. We may also use significant amounts of cash to complete acquisitions. To the extent that we complete acquisitions in the future, we likely will incur future depreciation and amortization expenses associated with the acquired assets. We may also record significant amounts of intangible assets, including goodwill, which could become impaired in the future. Any such impairment charges would adversely affect our results of operations.
Our SMB clients are particularly affected by volatility in the financial and economic environment, which could harm our business.
Demand for our services is sensitiveOur clients are small and mid-sized businesses that we believe can be particularly susceptible to changes in the level of overall economic activity in the markets in which we operate. During periods of weak economic conditions, employment levels tend to decrease, small business failures tend to increase and interest rates may become more volatile.employment levels tend to decrease. Current or potential clients may also react to weak economic conditions or forecasted weak economic conditions by reducing their employee headcount or by lowering their wage, bonuswages, bonuses or benefits levels, any of which would affect our revenues, and may affect our margins, because we may be unable to reduce our operating expenses sufficientsufficiently enough or quickly enough to offset the drop in revenues. It is difficult for us to forecast future demand for our services due to the inherent difficulty in forecasting the direction, strength and length of economic cycles. These conditions may affect the willingness of our clients and potential clients to pay outside vendors for services like ours, and may impact their ability to pay their obligations to us on time, or at all. In addition, ifas a result of macroeconomic factors, interest rates may become more volatile. Rising interest rates may negatively affect our net income due to increased interest expense. Increased interest rate volatility could also negatively impact our clients' and prospects' access to credit. If businesses have difficulty obtaining credit, business growth and new business formation may be impaired, which could also harm our business.
Even modest downturns in economic activity or the availability of credit on a regional or national level could have a material adverse effect on our financial condition or results of operations.
Most of our clients are concentrated in certain geographies and a relatively small number of industries, making us vulnerable to downturns in those geographies and industries.
Most of our clients are concentrated in certain geographies and operate in a relatively small number of industries, including the technology, life sciences, not-for-profit, professional services, financial services, real estate, retail, manufacturing, and hospitality industries. As a result, if any of those geographic regions or specific industries suffers a downturn, the portion of our business attributable to clients in that region or industry could be adversely affected, which could have a material adverse effect on our financial condition or results of operations.
Our business and operations have experienced rapid growth in recent periods, and if we are unable to effectively manage this growth, our business and results of operations may suffer.
We have experienced rapid growth and have significantly expanded our operations in recent periods, which has placed a strain on our management and our administrative, operational and financial infrastructure. Managing this growth requires us to further refine our operational, financial and management controls and reporting systems and procedures.
Our ability to effectively manage any significant growth of our business will depend on a number of factors, including our ability to do the following:
effectively recruit, integrate, train and motivate new employees, while retaining our existing employees, maintaining the beneficial aspects of our corporate culture and effectively executing our business plan;plan,
satisfy our existing clients and identify and acquire new clients;clients,
enhance the breadth and quality of our services;services,
continue to improve our operational, financial and management controls;controls, and
make sound business decisions in light of the scrutiny associated with operating as a public company.
These activities will require significant operating and capital expenditures and allocation of valuable management and employee resources, and we expect that our growth will continue to place significant demands on our management and on our operational and financial infrastructure.
Our future financial performance and our ability to execute on our business plan will depend, in part, on our ability to effectively manage any future growth. We cannot assure you that we will be able to do so in an efficient or timely manner, or at all. In particular, any failure to successfully implement systems enhancements and improvements will likely negatively impact our ability to manage our expected growth, ensure uninterrupted operation of key business systems and comply with the rules and regulations that are applicable to public companies. If we fail to manage our growth effectively, our costs and expenses may increase more than we expect them to, which in turn could harm our business, financial condition and results of operations.
We may not be able to sustain our profitability or revenue growth rate in the future.
While we have achieved profitability on an annual basis in each of the last four fiscal years, we have not consistently achieved profitability on a quarterly basis during that same period. Our operating expenses could increase substantially in the near term, particularly as we continue to invest in our sales and marketing organization, expand our operations and improve our infrastructure and enhance the breadth and quality of our services. If our revenues do not increase to offset these increases in our operating expenses, we may not be profitable in future periods.
Moreover, you should not consider our historical revenue growth rate to be indicative of our future performance. As we grow our business, our revenue growth rates may slow in future periods due to a number of reasons, which may include slowing demand for our services, increasing competition, a decrease in the growth of our overall market, our failure, for any reason, to continue to capitalize on growth opportunities, the maturation of our business or the decline in the number of SMBs in our target markets and verticals.
If our vertical sales strategy is unsuccessful, or if our sales force is otherwise unable to sell our solutions at the rate that we anticipate, we may not be able to maintain our client base or grow our business which could have a material adverse effect on our financial condition and results of operations.at historical rates we experienced.
We have aligned our business based ondeveloped an industry vertical approach wherebusiness strategy and we plan to continue to devote significant resources and time in pursuit of this strategy. Under our industry vertical strategy, our sales force, product development, and service teams are increasingly focused on specific business sectors. OurWe cannot assure you that our industry vertical approach gives us an understanding ofwill resonate with our existing and prospective clients or that we will target the HR needs facing SMBsright industries or implement our strategy in those industries. This knowledge enables us to provide a bundled solution of services that is tailored to its specific needs of clients in these industries.timely and effective manner. If our vertical strategy is unsuccessful, our business may not grow at the rate that we anticipate, which could have a material adverse effect on our financial condition and results of operations.
In order to raise awareness of the benefits of our services and identify and acquire new clients, weWe have rapidly grown our direct sales force.force historically and we currently expect to rely on this sales force to promote our industry vertical strategy and sell our solutions. Competition for skilled sales personnel is intense, and we cannot assure you that we will be successful in attracting, training and retaining qualified sales personnel, or that our newly hired sales personnel will function effectively, either individually or as a group. In addition, our newly hired sales personnel are typically not productive for up to a yearsome period of time following their hiring. This results in increased near-term costs to us relative to the sales contributions of these newly hired sales personnel. If we are unable to effectively train our sales force and benefit from greater productivity of our sales
representatives, or if our sales force is otherwise unable to sell our solutions as we anticipate, our revenues likely will not increase at the rate that we anticipate, which could have a material adverse effect on our business, financial condition and results of operations.
We are subject to legal proceedings that may result in adverse outcomes.
We are subject to claims, suits, government investigations, and proceedings arising from the ordinary course of our business. Refer to Note 13 in Part II, Item 8 of this Form 10-K for additional information about the legal proceedings we are currently involved in and future proceedings that we may face. Current and future legal proceedings may result in substantial costs and may divert management’s attention and resources, which may seriously harm our business, results of operations, financial condition and liquidity.
Changes in our income tax positions or adverse outcomes resulting from on-going or future tax audits, which could harm our business, operating results, financial condition and prospects.
Significant judgments and estimates are required in determining our provision for income taxes and other tax liabilities. Our provision for income taxes, results of operations and cash flows may be impacted if any of our tax positions are challenged and successfully disputed by the tax authorities. In determining the adequacy of our tax provision, we assess the likelihood of adverse outcomes that could result if our tax positions were challenged by the IRS and other tax authorities. The tax authorities in the U.S. regularly examine our income and other tax returns. Refer to Note 12 in Part II, Item 8 of this Form 10-K for additional details regarding our on-going tax examinations and disputes. The ultimate outcome of tax examinations and disputes cannot be predicted with certainty. Should the IRS or other tax authorities assess additional taxes as a result of these or other examinations, we may be required to record charges to operations that could have a material impact on our results of operations, financial position or cash flows.
Adverse changes in our relationships with key vendors, particularly our employee benefit and workers' compensation insurance carriers, could harm our business.
Our success depends in part on our ability to establish and maintain arrangements and relationships with the key vendors that supply us with essential components of our services, particularly including the insurance carriers that provide health and workers' compensation insurance coverage for our WSEs. Failure by these service providers, for any reason, to deliver their services in a timely or cost effective manner could result in material interruptions to our operations, impact client relations, and result in significant penalties or other liabilities to us. If any of these vendors decide to terminate their relationship with us, particularly our employee benefit carriers, we may have difficulty obtaining replacement services at reasonable rates or on a timely basis, if at all. The loss of any one or more of our key vendors, or our inability to partner with certain vendors that are better-known or more desirable to our clients or potential clients, could have a material adverse effect on our financial condition and results of operations.
For example, if we are unable to maintain and offer competitive health and/or workers' compensation insurance rates to our clients through well-known insurance carriers, it could affect our ability to attract and retain clients, which would have a material adverse effect on our business. Where we offer our clients and their WSEs group health insurance policies with respect to which our carriers set the premiums and for which we are not responsible for any deductible, the rates set by our carriers on such policies may not be competitive. Further, for policies with respect to which we agree to reimburse our carriers for any claims that they pay within an agreed-upon deductible layer, we may not be able to control costs through the deductible layer in a way that would make our rates competitive. In addition, broad
adoption of our services in certain geographies or industries may make it more difficult for us to obtain competitive health and/or workers' compensation insurance rates due to concentration of clients within a particular geography or industry.
We are subject to client attrition.
We regularly experience client attrition due to a variety of factors, including cost, client merger and acquisition activity, increases in administrative fees and insurance costs, client business failure, effects of competition and clients deciding to bring their HR administration in-house. Our standard client service agreement can be cancelled by us or by the client without penalty with 30 days’ prior written notice. Clients who intend to cease doing business with us often elect to do so effective as of the beginning of a calendar year. As a result, we have historically experienced our largest concentration of client attrition in the first quarter of each year. In addition, we experience higher levels of client attrition in connection with renewals of the health insurance we provide for WSEs in the event that such renewals result in increased premiums that we pass on to our clients. If we were to experience client attrition in excess of our historic annual attrition rate, it could have a material adverse effect on our business, financial condition and results of operations.
The terms of our credit facility may restrict our current and future operations, which would impair our ability to respond to changes in our business and to manage our business.
Our credit facility contains, and any future indebtedness of ours would likely contain, a number of restrictive covenants that impose significant operating and financial restrictions on us subject to customary exceptions, including restricting our ability to:
incur, assume or guarantee additional debt,
pay dividends or distributions or redeem or repurchase capital stock,
incur or assume liens,
make loans, investments and acquisitions,
engage in sales of assets and subsidiary stock,
enter into sale-leaseback transactions,
enter into certain transactions with affiliates,
enter into certain hedging agreements,
enter into new lines of business,
prepay certain indebtedness,
transfer all or substantially all of our assets or enter into merger or consolidation transactions with another person, and
enter into agreements that prohibit the incurrence of liens or the payment by our subsidiaries of dividends and distributions.
Our failure to comply with these restrictions and the other terms and conditions under our credit facility could result in a default, which in turn could result in the termination of the lenders’ commitments to extend further credit to us under our credit facility and acceleration of a substantial portion of our indebtedness then outstanding under our credit facility. If that were to happen, we may not be able to repay all of the amounts that would become due under our indebtedness or refinance our debt, which could materially harm our business and force us to seek bankruptcy protection.
Atairos, our largest stockholder, may have significant influence over our Company, and the existing ownership of capital stock, and thus the voting control, remains concentrated in our executive officers, directors and their affiliates, which limits your ability to influence corporate matters.
On February 1, 2017, an entity affiliated with Atairos Group, Inc. (together with its affiliates, “Atairos”) became our largest stockholder when it acquired the shares of TriNet common stock previously held by General Atlantic. In connection with this transaction, we appointed Michael J. Angelakis, the Chairman and CEO of Atairos, to our board
of directors and agreed to nominate Mr. Angelakis or another designee of Atairos reasonably acceptable to our Nominating and Corporate Governance Committee for election at future annual meetings until Atairos’ beneficial ownership falls below 15% of our common stock. As of February 1, 2017, Atairos beneficially owned approximately 28.5% of our outstanding common stock, and all of our directors, officers and their affiliates, including Atairos, beneficially own, in the aggregate, approximately 41.1% of our outstanding common stock. As a result, of the foregoing, Atairos, particularly when acting with our executive officers, directors and their affiliates who beneficially owned in the aggregate, approximately 41.1% of our outstanding common stock, will be able to exert substantial influence on all matters requiring stockholder approval, including the election of directors and approval of significant corporate transactions, such as a merger or other sale of our company or its assets. This concentration of ownership could limit the ability of other stockholders to influence corporate matters and may have the effect of delaying or preventing a third party from acquiring control over us.
Anti-takeover provisions in our charter documents and under Delaware law could make an acquisition of our company more difficult, limit attempts by our stockholders to replace or remove our current management and limit the market price of our common stock.
Provisions in our certificate of incorporation and bylaws may have the effect of delaying or preventing a change of control or changes in our management. Our amended and restated certificate of incorporation and bylaws include provisions that:
establish a classified board of directors so that not all members of our board of directors are elected at one time;
permit our board of directors to establish the number of directors,
provide that directors may only be removed “for cause”,
require super-majority voting to amend some provisions in our certificate of incorporation and bylaws,
authorize the issuance of “blank check” preferred stock that our board of directors could use to implement a stockholder rights plan,
eliminate the ability of our stockholders to call special meetings of stockholders,
prohibit stockholder action by written consent, which requires all stockholder actions to be taken at a meeting of our stockholders,
provide that our board of directors is expressly authorized to make, alter or repeal our bylaws, and
establish advance notice requirements for nominations for election to our board of directors or for proposing matters that can be acted upon by stockholders at annual stockholder meetings.
These provisions may frustrate or prevent any attempts by our stockholders to replace or remove our current management by making it more difficult for our stockholders to replace members of our board of directors, which is responsible for appointing the members of our management. In addition, because we are incorporated in Delaware, we are governed by the provisions of Section 203 of the Delaware General Corporation Law, which generally prohibits a Delaware corporation from engaging in any of a broad range of business combinations with any holder of at least 15% of our capital stock for a period of three years following the date on which the stockholder became a 15% stockholder.
Most of our clients are concentrated in certain geographies and a relatively small number of industries, making us vulnerable to downturns in those geographies and industries.
Most of our clients are concentrated in certain geographies and operate in a relatively small number of industries, including the technology, life sciences, not-for-profit, professional services, financial services, real estate, retail, manufacturing, and hospitality industries. As a result, if any of those geographic regions or specific industries suffers a downturn, the portion of our business attributable to clients in that region or industry could be adversely affected, which could have a material adverse effect on our financial condition or results of operations.
Our industry is highly competitive, which may limit our ability to maintain or increase our market share or improve our results of operations.
We face significant competition on a national and regional level from a number of companies purporting to deliver a range of bundled services that are generally similar to the services we provide, including large professional employer organizations such as the TotalSource business unit of Automatic Data Processing, Inc. and Insperity, Inc., as well as specialized and small professional employer organization service providers. If and to the extent that we and other companies providing these services are successful, we anticipate that future competitors will enter this industry. Some of our current, and any future, competitors have or may have greater marketing and financial resources than we have, and may be better positioned than we are in certain markets. Increased competition in our industry could result in price reductions or loss of market share, any of which could harm our business. We expect that we will continue to experience competitive pricing pressure. If we cannot compete effectively, our market share, business, results of operations and financial condition may suffer.
In addition to competition from other professional employer organizations, we also face significant competition in the form of companies serving their HR needs in both traditional and non-traditional manners. These forms of competition include:
HR and information systems departments and personnel of companies that perform their own administration of employee benefits, payroll and HR;HR,
providers of certain endpoint HR services, including payroll, employee benefits and business process outsourcers with high-volume transaction and administrative capabilities, such as Automatic Data Processing, Inc., Paychex, Inc. and other third-party administrators;administrators,
employee benefit exchanges that provide benefits administration services over the Internet to companies that otherwise maintain their own employee benefit plans; and
insurance brokers who allow third party HR systems to integrate with their platform.
We believe that our services are attractive to many SMBs in part because of our ability to provide workersaccess to TriNet-sponsored workers' compensation, health care and other benefits programs to them on a cost-effective basis. We compete with insurance brokers and other providers of this coverage in this regard, and our offerings must be priced competitively with those provided by these competitors in order for us to attract and retain our clients.
We may not be successful in convincing potential clients that the use of our services is a superior, cost-effective means of satisfying their HR obligations relative to the way in which they currently satisfy these obligations.
If we cannot compete effectively against other professional employer organizations or against the alternative means by which companies meet their HR obligations, or if we are unable to convince clients or potential clients of the advantages of our offerings, our market share and business may suffer, resulting in a material, , adverse effect on our financial condition and results of operations.
Our failure to maintain or enhance our reputation or brand identity could harm our business.
We believe that maintaining and enhancing our reputation and the TriNet brand identity is critical to maintaining our relationships with our clients and vendors and our ability to attract new clients and vendors. We also believe that our reputation and brand identity will become more important as competition in our industry continues to develop. Our ability to maintain and enhance our reputation and brand identity will be affected by a number of factors, some of which are beyond our control, including:
the effectiveness of our marketing efforts;
our ability to attract and retain new sales personnel to expand our direct sales force;
our ability to retain our existing clients and attract new clients;
the quality and perceived value of our services;
our ability to successfully differentiate our services from those of our competitors;
actions of our competitors and other third parties;
positive or negative publicity about us or our industry in general;
timeliness of our filings with the SEC,
interruptions, delays or attacks on our platform or mobile applications; and
litigation or regulatory developments.
Any brand promotion activities in which we engage may not be successful or yield increased revenues. Furthermore, negative publicity, whether or not justified, relating to events or activities attributed to us, our corporate employees, our WSEs, our vendors, other companies in our industry or others associated with any of these parties, may tarnish our reputation and reduce the value of our brand. Damage to our reputation and loss of brand identity may reduce demand for our services and harm our business, results of operations and financial condition. Moreover, any attempts to rebuild our reputation and restore the value of our brand may be costly and time-consuming, and any such efforts may not ultimately be successful.
We are subject to client attrition.
We regularly experience significant client attrition due to a variety of factors, including cost, client merger and acquisition activity, increases in administrative fees and insurance costs, client business failure, effects of competition and clients deciding to bring their HR administration in-house. Our standard client service agreement can be cancelled by us or by the client without penalty with 30 days’ prior written notice. Clients who intend to cease doing business with us often elect to do so effective as of the beginning of a calendar year. As a result, we have historically experienced our largest concentration of client attrition in the first quarter of each year. In addition, we experience higher levels of client attrition in connection with renewals of the health insurance we provide for WSEs in the event that such renewals result in increased premiums that we pass on to our clients. If we were to experience client attrition in excess of our projected annual attrition rate of approximately 20% of our installed WSE base, which occurred most recently in 2011, it could have a material adverse effect on our business, financial condition and results of operations.
Our acquisition strategy creates risks for our business.
We have completed numerous acquisitions of other businesses and technologies, and we expect that we will continue to grow through acquisitions of other businesses, assets or technologies. We may fail to identify attractive acquisition candidates or we may be unable to reach acceptable terms for future acquisitions. If we are unable to complete acquisitions in the future, our ability to grow our business will be impaired.
Acquisitions involve numerous other risks, including:
difficulties integrating the operations, systems, technologies, services and personnel of the acquired companies, including the migration of WSEs from an acquired company’s technology platform to ours;
challenges associated with establishing or maintaining internal controls, procedures and policies relating to the acquired systems and processes, including the potential for actual or perceived control weaknesses associated with or arising from the acquisitions and integration of acquired systems;
diversion of management’s attention from other business concerns;
over-valuation by us of acquired companies;
litigation resulting from activities of the acquired company, including claims from terminated employees, clients, former stockholders and other third parties;
insufficient revenues to offset increased expenses associated with the acquisitions and unanticipated liabilities of the acquired companies;
insufficient indemnification or security from the selling parties for legal liabilities that we may assume in connection with our acquisitions;
entering markets in which we have no prior experience and may not succeed;
risks associated with foreign acquisitions, such as communication and integration problems resulting from geographic dispersion and language and cultural differences, compliance with foreign laws and regulations and general economic or political conditions in other countries or regions;
potential loss of key employees of the acquired companies; and
impairment of relationships with clients and employees of the acquired companies or our clients and employees as a result of the integration of acquired operations and new management personnel.
If we fail to integrate newly acquired businesses effectively, we might not achieve the growth, service enhancement or operational efficiency objectives of the acquisitions, and our business, results of operations and financial condition could be harmed.
We may pay for acquisitions by issuing additional shares of our common stock, which would dilute our stockholders, or by issuing debt, which could include terms that restrict our ability to operate our business or pursue other opportunities and subject us to meaningful debt service obligations. We may also use significant amounts of cash to complete acquisitions. To the extent that we complete acquisitions in the future, we likely will incur future depreciation and amortization expenses associated with the acquired assets. We may also record significant amounts of intangible assets, including goodwill, which could become impaired in the future. Any such impairment charges would adversely affect our results of operations.
We may have additional tax liabilities, which could harm our business, operating results, financial condition and prospects.
Significant judgments and estimates are required in determining our provision for income taxes and other tax liabilities. Our provision for income taxes, results of operations and cash flows may be impacted if any of our tax positions are challenged and successfully disputed by the tax authorities. In determining the adequacy of our tax provision, we assess the likelihood of adverse outcomes that could result if our tax positions were challenged by the IRS and other tax authorities. The tax authorities in the United States regularly examine our income and other tax returns. For example, in connection with an IRS examination of prior federal income tax returns filed by Gevity, a company we acquired in 2009, we received a technical advice memorandum from the IRS taking the position that a total of $10.1 million employment tax credits taken by Gevity, and an additional approximately $2.3 million taken by us after acquiring Gevity, should be reversed, which position we dispute. The ultimate outcome of these examinations and tax disputes cannot be predicted with certainty. Should the IRS or other tax authorities assess additional taxes as a result of these or other examinations, we may be required to record charges to operations that could have a material impact on our results of operations, financial position or cash flows.
We have a substantial amount of indebtedness, which could adversely affect our financial condition and our operating flexibility.
As of December 31, 2015, we had $499.6 million in outstanding indebtedness under our credit facility, all of which was secured indebtedness of our subsidiary, TriNet HR Corporation, guaranteed on a senior secured basis by us and certain of our subsidiaries. Our level of indebtedness and the limitations imposed on us by our credit facility could affect our business in various ways, including the following:
we will have to use a portion of our cash flows from operating activities for debt service rather than for other operational activities;
we may not be able to borrow additional funds or obtain additional financing for future working capital, acquisitions, capital expenditures or other corporate purposes, or may have to pay more for such financing;
some or all of the indebtedness under our current or future credit facilities bears interest at variable interest rates, making us more vulnerable to interest rate increases;
we could be less able to take advantage of significant business opportunities, such as acquisition opportunities, and to react to changes in market or industry conditions; and
we may be more vulnerable to general adverse economic and industry conditions as a result of our inability to reduce our debt service costs in response to reduced revenues.
Because borrowings under our credit facility bear interest at a variable rate, our interest expense could increase even though the amount borrowed remains the same, exacerbating these risks. Our ability to meet these expenses depends on our future business performance, which will be affected by various factors, including the risks described in this “Risk Factors” section. We are not able to control many of these factors, such as economic conditions in the markets where we operate and pressure from competitors. Our operations may provide insufficient cash to pay the principal and interest on our credit facility and to meet our other debt obligations. If so, we may be required to refinance all or part of our existing indebtedness or borrow additional funds, which we may not be able to do on terms that are acceptable to us, if at all. In addition, the terms of our existing or future debt agreements may restrict our ability to take some or all of these responsive actions. If we were unable to pay the principal and interest on our credit facility or meet our other debt obligations, the lenders under our credit facility could
terminate their commitments to extend further credit to us and accelerate a substantial part of our indebtedness. If that were to happen, we may not be able to repay all of the amounts that would become due under our indebtedness or refinance our debt. If we were unable to repay those amounts or refinance our debt, the lenders under our credit facility could proceed against the collateral granted to them to secure that indebtedness. If that were to happen, our results of operations and financial condition could be harmed and we might be forced to seek bankruptcy protection.
The terms of our credit facility may restrict our current and future operations, which would impair our ability to respond to changes in our business and to manage our business.
Our credit facility contains, and any future indebtedness of ours would likely contain, a number of restrictive covenants that impose significant operating and financial restrictions on us, including restricting our ability to:
incur, assume or guarantee additional debt;
pay dividends or distributions or redeem or repurchase capital stock;
incur or assume liens;
make loans, investments and acquisitions;
engage in sales of assets and subsidiary stock;
enter into sale-leaseback transactions;
enter into certain transactions with affiliates;
complete dividends, loans or asset transfers from our subsidiaries;
enter into new lines of business;
prepay other indebtedness;
transfer all or substantially all of our assets or enter into merger or consolidation transactions with another person; and
make capital expenditures.
Under the credit facility, we are required to comply with a financial covenant that requires us and our subsidiaries to maintain a maximum leverage ratio so long as there is any indebtedness outstanding under the revolving credit facility (excluding letters of credit issued and outstanding of up to $15.0 million other than letters of credit that have been cash collateralized). Our ability to meet the leverage ratio can be affected by events beyond our control, and we may be unable to comply with it. Our failure to comply with this financial covenant or other restrictive covenants under our credit facility and other debt instruments could result in a default under our credit facility and/or other debt instruments, which in turn could result in the termination of the lenders’ commitments to extend further credit to us under our credit facility and acceleration of a substantial portion of our indebtedness then outstanding under our credit facility. If that were to happen, we may not be able to repay all of the amounts that would become due under our indebtedness or refinance our debt. If we were unable to repay those amounts or refinance our debt, the lenders under our credit facility could proceed against the collateral granted to them to secure that indebtedness. If that were to happen, our results of operations and financial condition could be harmed and we might be forced to seek bankruptcy protection.
If we fail to retain our key personnel or fail to attract additional skilled personnel, our business may suffer.
Our operations are dependent on the continued efforts of our officers and executive management and the performance and productivity of our regional managers and field personnel. Our ability to attract and retain business depends on the quality of our services and the relationships that we maintain with our clients. If we lose key personnel with significant experience in managing our business, this could impair our ability to deliver services effectively or profitably, could divert other senior management time in seeking replacements, and could adversely affect our reputation with our clients and potential clients. Some of our most important client relationships depend on the continued involvement of individual managers or sales personnel, and any loss of those individuals could jeopardize those relationships and in turn adversely affect our operating results.
Our future success will depend on our ability to attract, hire, train and retain highly skilled technical, sales and marketing and support personnel, particularly with expertise in outsourced solutions and the technology platforms that we deploy today and will deploy in the future. Our failure to attract and retain the appropriate personnel may limit the rate at which we can expand our business, including developing new services and attracting new clients, or otherwise have a material adverse effect on our financial condition or results of operations.
We have identified material weaknesses in our internal control over financial reporting that could, if not remediated, result in material misstatements in our financial statements.
In connection with the audit of our consolidated financial statements as of and for the year ended December 31, 2015, we have identified material weaknesses relating to our internal control over financial reporting. A material weakness is a deficiency, or a combination of deficiencies, in internal control over financial reporting such that there is a reasonable possibility that a material misstatement of the company’s annual or interim consolidated financial statements will not be prevented or detected on a timely basis. As described in Item 9A. Controls and Procedures, we have concluded that our internal control over financial reporting was not effective as of December 31, 2015 due to material weaknesses. Specifically, we identified material weaknesses relating to (i) ineffective information technology general controls, primarily with respect to computer operations, access controls and change management, (ii) ineffective control environment and risk assessment, (iii) ineffective management review controls and controls over system-generated reports, (iv) ineffective controls over payroll operations, (v) ineffective controls over health and workers compensation liabilities and related expenses, (vi) ineffective controls over validating accuracy of payroll tax liabilities, and (vii) ineffective authorization controls over procurement processes. However, giving full consideration to these weaknesses, and the additional analyses and other procedures we performed to ensure that our consolidated financial statements included in this Annual Report on Form 10-K were prepared in accordance with U.S. generally accepted accounting principles (GAAP), our management has concluded that our consolidated financial statements present fairly, in all material respects, our financial position, results of operations and cash flows for the periods disclosed in conformity with GAAP. While the material weaknesses described above create a reasonable possibility that an error in financial reporting may go undetected, after extensive review and the performance of additional analysis and other procedures, no material adjustments, restatement or other revisions to our previously issued financial statements were required.
As further described in Part II, Item 9A “Controls and Procedures” below, we are taking specific steps to remediate the material weaknesses that we identified; however, the material weaknesses will not be remediated until the necessary controls have been implemented and we have determined the controls to be operating effectively. Because the reliability of the internal control process requires repeatable execution, the successful remediation of these material weaknesses will require review and evidence of effectiveness prior to concluding that the controls are effective. In addition, we may need to take additional measures to address the material weaknesses or modify the remediation steps, and we cannot be certain that the measures we have taken, and expect to take, to improve our internal controls will be sufficient to address the issues identified, to ensure that our internal controls are effective or to ensure that the identified material weaknesses will not result in a material misstatement of our annual or interim consolidated financial statements. Implementing any appropriate changes to our internal controls may distract our officers and employees and require material cost to implement new process or modify our existing processes. Moreover, other material weaknesses or deficiencies may develop or be identified in the future. If we are unable to correct material weaknesses or deficiencies in internal controls in a timely manner, our ability to record, process, summarize and report financial information accurately and within the time periods specified in the rules and forms of the U.S. Securities and Exchange Commission, will be adversely affected. This failure could negatively affect the market price and trading liquidity of our common stock, lead to delisting, cause investors to lose confidence in our reported financial information, subject us to civil and criminal investigations and penalties, and generally materially and adversely impact our business and financial condition.
We are subject to legal proceedings that may result in adverse outcomes.
We are subject to claims, suits, government investigations, and proceedings arising from the ordinary course of our business, including actions with respect to intellectual property claims, privacy, data protection or law enforcement matters, tax matters, labor and employment claims, commercial claims, purported class action lawsuits, and other matters. For example, we are a party to a putative securities class action lawsuit filed by a purported stockholder of our company in the United States District Court for the Northern District of California. Such claims, suits, government investigations, and proceedings are inherently uncertain and their results cannot be predicted with certainty. Regardless of the outcome, such legal proceedings can have an adverse impact on us because of legal costs, diversion of management and other personnel, and other factors. In addition, it is possible that a resolution of one or more such proceedings could result in liability, penalties, or sanctions, as well as judgments, consent decrees, or orders preventing us from offering certain features, functionalities, products, or services, or requiring a change in our business practices, products or technologies, which could in the future materially and adversely affect our business, operating results, and financial condition. See Part I, Item 3, “Legal Proceedings” below for additional information about the legal proceedings we are currently involved in and future proceedings that we may face.
Our failure to timely file any periodic reports with the SEC may prevent us from complying with the NYSE rules and may make it more difficult for us to access the public markets to raise debt or equity capital.
Despite extensive efforts, we were unable to file our Annual Report on Form 10-K for the year ended December 31, 2015 within the time frame required by the SEC (including the extension permitted by Rule 12b-25 under the Exchange Act).
As a result, we were not in full compliance with the NYSE Listed Company Manual, Section 802.01E, but have cured this deficiency upon filing our Annual Report. We are required to comply with the NYSE Listed Company Manual as a condition for our common stock to continue to be listed on the NYSE. If we are unable to comply with such conditions, then our shares of common stock are subject to delisting from the NYSE. Any delisting of our common stock from the NYSE could have a significant negative effect on the value and liquidity of our securities, may preclude us from using exemptions from certain state and federal securities regulations, and could adversely affect our ability to raise capital on terms acceptable to us or at all.
In addition, because we were unable to timely file our Annual Report, we will not be eligible to use a registration statement on Form S-3 to conduct public offerings of our securities until we have timely made our periodic filings with the SEC for a full year. Our inability to use Form S-3 during this time period may have a negative impact on our ability to access the public capital markets in a timely fashion because we would be required to file a long-form registration statement on Form S-1 and have it reviewed and declared effective by the SEC. This may limit our ability to access the public markets to raise debt or equity capital. Our limited ability to access the public markets could prevent us from pursuing transactions or implementing business strategies that we believe would be beneficial to our business.
Any failure in our business systems could reduce the quality of our business services, which could harm our reputation and expose us to liability.
Our business systems rely on the complex integration of numerous hardware and software subsystems to manage client transactions including the processing of employee, payroll and benefits data. These systems can be disrupted by, among other things, equipment failures, computer server or systems failures, network outages, malicious acts, software errors or defects, vendor performance problems and power failures. Any delay or failure in our systems that impairs our ability to communicate electronically with our clients, employees or vendors or our ability to store or process data could harm our reputation and our business. If we are unable to meet client demands or service expectations, we may lose existing clients and we may have difficulty attracting new clients. In addition, errors in our products and services, such as the erroneous denial of healthcare benefits or delays in making payroll, could expose our clients to liability claims from improperly serviced WSEs, for which we may be contractually obligated to provide indemnification.
We have disaster recovery, business continuity, and crisis management plans and procedures designed to protect our business against a multitude of events, including natural disasters, military or terrorist actions, power or communication failures, or similar events. Despite our preparations, our plans may not be successful in preventing the loss of client data, service interruptions, and disruptions to our operations, or damage to our important facilities. The precautions that we have taken to protect ourselves against these types of events may prove to be inadequate. If we suffer damage to our data or operations centers, experience a telecommunications failure or experience a security breach, our operations could be interrupted. Any interruption or other loss may not be covered by our insurance and could harm our reputation.
If our systems were to fail for any of these reasons during payroll processing, preventing the proper payment of employees, or the proper remission of payroll taxes, we could be liable for wage payment delay penalties and payroll tax penalties, as well as other contractual penalties. Any inaccuracies in the processing of health insurance benefits could result in our being liable for lapses in insurance. If any of our systems fails to operate properly or becomes disabled even for a brief period of time, we could suffer financial loss, a disruption of our businesses, liability to clients, regulatory intervention, or damage to our reputation.
We depend on licenses with third-party software in order to provide our services.
We license a substantial portion of the software on which we depend to provide services to our clients from third-party vendors. If we are unable to maintain these licenses, or if we are required to make significant changes in the terms and conditions of these licenses, we may need to seek replacement vendors or change our software architecture to address licensing revisions with our current vendors, either of which could increase our expenses and impair the quality of our services. In addition, we cannot assure you that our key vendors will continue to support their technology. Financial or other difficulties experienced by these vendors may adversely affect the technologies we incorporate into our products and services. If this software ceases to be available, we may be unable to find suitable alternatives on reasonable terms, or at all.
We must keep pace with rapid technological change in order to succeed.
Our business depends upon the use of software, hardware and networking technologies that must be frequently and rapidly upgraded in response to technological advances, competitive pressures and consumer expectations. To succeed, we will need to effectively develop or license and integrate these new technologies as they become available to improve our services commensurate with client requirements. In particular, we rely on enterprise software applications licensed from third parties that are upgraded from time to time such as PeopleSoft HR information systems and Oracle databases, which provide the basis
for our HR information system platform supporting payroll, benefits and other HR functions. Any difficulties we encounter in adapting applications upgrades to our systems could harm our performance or delay or prevent the successful development, introduction or marketing of new services. New products or upgrades may not be released according to schedule, or may contain defects when released. Difficulties in integrating new technologies could result in adverse publicity, loss of sales, delay in market acceptance of our services, or client claims against us, any of which could harm our business. We could also incur substantial costs in modifying our services or infrastructure to adapt to these changes. In addition, we could lose market share if our competitors develop technologically superior products and services.
If we are unable to protect our intellectual property, or if we infringe on the intellectual property rights of others, our business may be harmed.
Our success depends in part on intellectual property rights to the services that we develop. We rely on a combination of contractual rights, including non-disclosure agreements, trade secrets, copyrights and trademarks, to establish and protect our intellectual property rights in our names, services, methodologies and related technologies. If we lose intellectual property protection or the ability to secure intellectual property protection on any of our names, confidential information or technology, this could harm our business. Our intellectual property rights may not prevent competitors from independently developing services and methodologies similar to ours, and the steps we take might be inadequate to deter infringement or misappropriation of our intellectual property by competitors, former employees or other third parties, any of which could harm our business. We currently have one pending U.S. patent application covering our technology. We own registered trademarks in the United States, Canada and the European Union that have various expiration dates unless renewed through customary processes. Our trademark registrations may be unenforceable or ineffective in protecting our trademarks. Our trademarks may be unenforceable in countries outside of the United States, which may adversely affect our ability to build our brand outside of the United States.
Although we believe that our conduct of our business does not infringe on the intellectual property rights of others, third parties may nevertheless assert infringement claims against us in the future. We may be required to modify our products, services, internal systems or technologies, or obtain a license to permit our continued use of those rights. We may be unable to do so in a timely manner, or upon reasonable terms and conditions, which could harm our business. In addition, future litigation over these matters could result in substantial costs and resource diversion. Adverse determinations in any litigation or proceedings of this type could subject us to significant liabilities to third parties and could prevent us from using some of our services, internal systems or technologies.
Our use of open source software could subject us to possible litigation.
A portion of our technologies incorporates open source software, and we expect to continue to incorporate open source software into our platform in the future. Few of the licenses applicable to open source software have been interpreted by courts, and their application to the open source software integrated into our proprietary technology platform may be uncertain. If we fail to comply with these licenses, then pursuant to the terms of these licenses, we may be subject to certain requirements, including requirements that we make available the source code for our software that incorporates the open source software. We cannot assure you that we have not incorporated open source software in our software in a manner that is inconsistent with the terms of the applicable licenses or our current policies and procedures. If an author or other third party that distributes such open source software were to allege that we had not complied with the conditions of one or more of these licenses, we could incur significant legal expenses defending against such allegations. Litigation could be costly for us to defend, have a negative effect on our operating results and financial condition or require us to devote additional research and development resources to change our technology platform.
Risks Related to Ownership of Our Common Stock
Our stock price may be volatile or may decline regardless of our operating performance, resulting in substantial losses for our stockholders.
The market price of our common stock has been, and is likely to continue to be, volatile for the foreseeable future. Since shares of our common stock were sold in our initial public offering in March 2014 at a price of $16.00 per share, the daily closing price of our common stock hasin 2016 ranged from $16.33$11.10 to $37.88$26.64 per share through December 31, 2015.2016. The market price of our common stock may fluctuate significantly in response to numerous factors, many of which are beyond our control, including the factors listed below and other factors described in this “Risk Factors” section:
actual or anticipated fluctuations in our results of operations;operations,
any financial projections we provide to the public, any changes in these projections or our failure to meet these projections;projections,
failure of securities analysts to initiate or maintain coverage of our company, changes in financial estimates by any securities analysts who follow our company, or our failure to meet these estimates or the expectations of investors;investors,
ratings changes by any securities analysts who follow our company;company,
announcements by us or our competitors of significant innovations, acquisitions, strategic partnerships, joint ventures or capital commitments;commitments,
changes in operating performance and stock market valuations of other business services companies generally, or those in our industry in particular;particular,
price and volume fluctuations in the overall stock market, including as a result of trends in the economy as a whole;whole,
changes in our board of directors or management;management,
sales of large blocks of our common stock, including sales by our executive officers, directors and significant stockholders;stockholders,
lawsuits threatened or filed against us;us,
short sales, hedging and other derivative transactions involving our capital stock;stock,
general economic conditions in the United States and abroad;abroad, and
other events or factors, including those resulting from war, incidents of terrorism or responses to these events.
In addition, stock markets have experienced extreme price and volume fluctuations that have affected and continue to affect the market prices of equity securities of many business services companies. Stock prices of many business services companies have fluctuated in a manner unrelated or disproportionate to the operating performance of those companies. In the past, stockholders have instituted securities class action litigation following periods of market volatility. Securities litigation could subject us to substantial costs, divert resources and the attention of management from our business and adversely affect our business, results of operations and financial condition.
Substantial future sales of shares of our common stock could cause the market price of our common stock to decline.
We may issue additional shares of common stock or securities convertible into shares of our common stock in one or more transactions and at prices and in a manner as we may determine from time to time. Sales of a substantial number of shares of our common stock in the public market, or the perception that these sales might occur, could depress the market price of our common stock and impair our ability to raise capital through the sale of additional equity securities. We cannot predict the effect that such sales may have on the prevailing market price of our common stock.
As of December 31, 2015, there were 4,446,149 shares of common stock subject to outstanding options, 956,687 shares of common stock issuable upon settlement of restricted stock units and 173,286 shares of common stock issuable upon settlement of performance-based restricted stock units. We have registered all of the shares of common stock issuable upon exercise of these outstanding options and settlement of these outstanding restricted stock units, and upon exercise or settlement of any options or other equity incentives we may grant in the future, as well as the shares we have reserved for future issuance under our Employee Stock Purchase Plan, or ESPP, for public resale under the Securities Act of 1933, as amended. Accordingly, these shares are eligible for sale in the public market to the extent such options are exercised or such restricted stock units settle, or such shares are purchased pursuant to our ESPP, subject to compliance with applicable securities laws.
As of December 31, 2015, the holders of 20,091,312 shares of common stock have rights, subject to some conditions, to require us to file registration statements for the public resale of such shares or to include such shares in registration statements that we may file for TriNet or our stockholders.
The existing ownership of capital stock by our executive officers, directors and their affiliates has the effect of concentrating voting control with our executive officers, directors and their affiliates for the foreseeable future, which limits your ability to influence corporate matters.
As of December 31, 2015, funds affiliated with General Atlantic, our largest stockholder, beneficially own approximately 28.6% of our outstanding common stock, and all of our directors, officers and their affiliates, including the funds affiliated with General Atlantic, beneficially own, in the aggregate, approximately 40.8% of our outstanding common stock. As
a result, these stockholders will be able to determine substantially all matters requiring stockholder approval, including the election of directors and approval of significant corporate transactions, such as a merger or other sale of our company or its assets. This concentration of ownership could limit the ability of other stockholders to influence corporate matters and may have the effect of delaying or preventing a third party from acquiring control over us.
If securities or industry analysts do not publish research or reports about our business, or publish negative reports about our business, our share price and trading volume could decline.
The trading market for our common stock will depend in part on the research and reports that securities or industry analysts publish about us or our business, our market and our competitors. We do not have any control over these analysts. If one or more of the analysts who cover us downgrade our shares or change their opinion of our shares, our share price would likely decline. If one or more of these analysts cease coverage of our company or fail to regularly publish reports on us, we could lose visibility in the financial markets, which could cause our share price or trading volume to decline.
Anti-takeover provisions in our charter documents and under Delaware law could make an acquisition of our company more difficult, limit attempts by our stockholders to replace or remove our current management and limit the market price of our common stock.
Provisions in our certificate of incorporation and bylaws may have the effect of delaying or preventing a change of control or changes in our management. Our amended and restated certificate of incorporation and bylaws include provisions that:
establish a classified board of directors so that not all members of our board of directors are elected at one time;
permit our board of directors to establish the number of directors;
provide that directors may only be removed “for cause”;
require super-majority voting to amend some provisions in our certificate of incorporation and bylaws;
authorize the issuance of “blank check” preferred stock that our board of directors could use to implement a stockholder rights plan;
eliminate the ability of our stockholders to call special meetings of stockholders;
prohibit stockholder action by written consent, which requires all stockholder actions to be taken at a meeting of our stockholders;
provide that our board of directors is expressly authorized to make, alter or repeal our bylaws; and
establish advance notice requirements for nominations for election to our board of directors or for proposing matters that can be acted upon by stockholders at annual stockholder meetings.
These provisions may frustrate or prevent any attempts by our stockholders to replace or remove our current management by making it more difficult for our stockholders to replace members of our board of directors, which is responsible for appointing the members of our management. In addition, because we are incorporated in Delaware, we are governed by the provisions of Section 203 of the Delaware General Corporation Law, which generally prohibits a Delaware corporation from engaging in any of a broad range of business combinations with any holder of at least 15% of our capital stock for a period of three years following the date on which the stockholder became a 15% stockholder.
Item 1B. Unresolved Staff Comments
None.
Item 2. Properties
We lease space for our corporate headquarters in San Leandro, California, approximately 50 regional sales53 offices in various states in the United States and our client service centers in Bradenton, Florida; Reno, Nevada; Fort Mill, South Carolina; Oklahoma City, Oklahoma and New York, New York. U.S., including the following:
|
| |
| Corporate: | Client Service Centers: |
| • San Leandro, California | • Pleasanton, California |
| • Bradenton, Florida |
| Technology Center: | • Reno, Nevada |
| • Austin, Texas | • Fort Mill, South Carolina |
All of these leases expire at various times up through 2023.
2024. We believe that our leases are sufficient for our current facilities are adequate for the purposes for which they are intended and provide for further expansion to accommodate our long-termlong term growth and expansion goals. We believe that short-term leased facilities are readily available if needed to accommodate near-term needs if they arise. We will continue to evaluate the need for additional facilities
based on the extent of our product and service offerings, the rate of client growth, the geographic distribution of our client base and our long-term service delivery requirements.
Item 3. Legal Proceedings
Securities Class Action. On or about August 7, 2015, Howard Welgus, a purported stockholderFor the information required in this section, refer to Note 13 in Part II, Item 8 of the Company, filed a putative securities class action lawsuit arising under the Securities and Exchange Act of 1934 in the United States District Court for the Northern District of California. The case has not been certified as a class action, although it purports to be filed on behalf of purchasers of the Company’s common stock between May 5, 2014 and August 3, 2015, inclusive. The name of the case is Welgus v. TriNet Group, Inc. et al., Case No. 3:15-cv-03625. No stockholder other than Mr. Welgus submitted a motion for appointment as lead plaintiff to represent the putative class, and, on December 3, 2015, the Court appointed Mr. Welgus as lead plaintiff. On February 1, 2016, Mr. Welgus filed an amended complaint. The defendants named in the case are the Company and certain of its officers and directors, as well as General Atlantic, LLC, a significant shareholder, and formerly majority shareholder, of the Company. The amended complaint generally alleges that the Company caused damage to stockholders of the Company by misrepresenting and/or failing to disclose facts generally pertaining to alleged trends affecting health insurance and workers compensation claims. Under a stipulated briefing schedule approved by the Court, the Company intends to move to dismiss the amended complaint no later than April 11, 2016. The Company believes that it has meritorious defenses against this action and intends to continue to defend itself vigorously against the allegations of Mr. Welgus.Form 10-K.
Other Litigation. The Company is and, from time to time, has been and may in the future become involved in various litigation matters, legal proceedings and claims arising in the ordinary course of its business, including disputes with its clients or various class action, collective action, representative action and other proceedings arising from the nature of its co-employment relationship with its clients and WSEs in which the Company is named as a defendant. In addition, due to the nature of the Company’s co-employment relationship with its clients and WSEs, the Company could be subject to liability for federal and state law violations, even if the Company does not participate in such violations. While the Company’s agreements with its clients contain indemnification provisions related to the conduct of its clients, the Company may not be able to avail itself of such provisions in every instance.
While the outcome of the matters described above cannot be predicted with certainty, management currently does not believe that any such claims or proceedings or the above mentioned securities class action will have a materially adverse effect on the Company’s consolidated financial position, results of operations or cash flows. However, the unfavorable resolution of any particular matter or the Company’s reassessment of its exposure for any of the above matters based on additional information obtained in the future could have a material impact on the Company’s consolidated financial position, results of operations or cash flows. In addition, regardless of the outcome, the above matters, individually and in the aggregate, could have an adverse impact on the Company because of diversion of management resources and other factors.
Item 4. Mine Safety Disclosures
Not applicable.
PART II
Item 5. Market for Registrant’s Common Equity, Related Stockholder Matters and Issuer Purchases of Equity Securities
Market Information and Holders of Record
Our common stock has been listed on the New York Stock Exchange under the symbol “TNET” since March 27, 2014. Prior to that date, there was no public trading market for our common stock. The following table sets forth for the periods indicated the high and low sale prices per share of our common stock as reported on the New York Stock Exchange:
| | | Year Ended December 31, 2015: | | High | | Low | |
| | | Year 2016 | Year 2015 |
| | | High | Low | High | Low |
| First Quarter | | $ | 37.88 |
| | $ | 30.04 |
| $ | 18.78 |
| $ | 12.28 |
| $ | 37.88 |
| $ | 30.04 |
|
| Second Quarter | | $ | 37.27 |
| | $ | 25.23 |
| $ | 20.86 |
| $ | 14.57 |
| $ | 37.27 |
| $ | 25.23 |
|
| Third Quarter | | $ | 26.88 |
| | $ | 16.33 |
| $ | 22.65 |
| $ | 20.53 |
| $ | 26.88 |
| $ | 16.33 |
|
| Fourth Quarter | | $ | 20.05 |
| | $ | 16.79 |
| $ | 26.32 |
| $ | 17.80 |
| $ | 20.05 |
| $ | 16.79 |
|
| | | | | | |
| Year Ended December 31, 2014: | | High | | Low | |
| First Quarter | | $ | 23.44 |
| | $ | 17.28 |
| |
| Second Quarter | | $ | 27.78 |
| | $ | 18.81 |
| |
| Third Quarter | | $ | 29.96 |
| | $ | 21.79 |
| |
| Fourth Quarter | | $ | 32.79 |
| | $ | 24.38 |
| |
On March 29, 2016,February 23, 2017, the last reported salesales price of our common stock on the New York Stock Exchange was $13.97$26.35 per share. As of March 29, 2016,February 23, 2017, we had 4842 holders of record of our common stock per Computershare Trust Company N.A., our transfer agent. The actual number of stockholders is greater than this number of record holders, and includes stockholders who are beneficial owners, but whose shares are held in street name by brokers and other nominees. This number of holders of record also does not include stockholders whose shares may be held in trust by other entities.
Dividend Policy
Our boardWe have not declared or paid cash dividends in 2016 or 2015. Payment of directors has declared two special dividends since January 1, 2013. In August 2013, our board of directors declared a special dividend of $5.88 per common-equivalent share for holders of record of our preferred stock and $5.88 per share for holders of record of our common stock and restricted stock units, for a total of approximately $310.8 million. In December 2013, our board of directors declared a special dividend of $0.88 per common-equivalent share for holders of record of our preferred stock and $0.88 per share for holders of record of our common stock and restricted stock units, for a total amount of approximately $46.7 million. In each case, we determined to pay such dividends to our stockholders because our board of directors determined that such dividends were in our best interests and those of our stockholders, that we had sufficient surplus capital to pay such dividends and that we would be able to continue to fund our operations and service our indebtedness utilizing cash flows from operations after payment of such dividends.
Any future determination as to the declaration and payment of dividends, if any, in the future will be at the discretion of our board of directors and will depend on then existingthen-existing conditions, including our financial condition, operating results, contractual restrictions under our credit facility (refer to Note 8 in Item 8 of this Form 10-K), capital requirements, business prospects and other factors our board of directors may deem relevant.
In addition, our credit facility, as amended and restated in 2014, contains restrictions on our ability to declare and pay cash dividends on our capital stock. So long as no event of default has occurred and is continuing and no ECF Shortfall Amount (as defined in the credit agreement) exists, our credit facility permits cash dividends in amounts up to the sum of (a) specified dollar amounts under the facility, plus (b) so long as a specified leverage ratio under the credit facility is satisfied, the available Excess Cash Flow (as defined in the credit agreement and subject to certain adjustments). See Note 8 to our consolidated financial statements included elsewhere in this report.
Performance Graph
The following graph compares the cumulative return on the Company’sour common stock since the initial public offering onin March 27, 2014 with the cumulative return on the S&P 500 Index and a Peer Group Index.
COMPARISON OF 2133 MONTH CUMULATIVE TOTAL RETURN
Among TriNet Group, Inc., the S&P 500 Index, and a Peer Group*
* The Peer Group Index consists of the following companies:
Automatic Data Processing, Inc.Insperity, Inc.
|
| | |
| Automatic Data Processing, Inc. | Insperity, Inc. | Paychex, Inc.
|
| Barrett Business Services, Inc. | Intuit, Inc. | |
Heartland Payment Systems Inc. historically was included in the Peer Group Index. It is excluded from the graph above because it was acquired in April 2016 and ceased to be an SEC registrant.
Intuit, Inc.
This graph shall not be deemed “filed” for purposes of Section 18 of the Securities and Exchange Act of 1934, as amended (the “Exchange Act”), or otherwise subject to the liabilities of that section, nor shall it be deemed incorporated by reference in any filing under the Securities Act of 1933 or the Exchange Act, regardless of any general incorporation language in such filing.
Issuer Purchases of Equity Securities
The following table provides information about our purchases of TriNet common stock during the fourth quarter ended December 31, 2015:of 2016:
|
| | | | | | | | | | | | |
| Period | Total Number of Shares Purchased | | Average Price Paid Per Share | | Total Number of Shares Purchased as Part of Publicly Announced Plans (1) | | Approximate Dollar Value of Shares that May Yet be Purchased Under the Plans (1) |
| October 1 - October 31, 2015 | — |
| | — |
| | — |
| | $ | 31,628,073 |
|
| November 1 - November 30, 2015 | — |
| | — |
| | — |
| | $ | 31,628,073 |
|
| December 1 - December 31, 2015 | — |
| | — |
| | — |
| | $ | 31,628,073 |
|
| Total | — |
| | | | | | |
|
| | | | | | | | | | |
| Period | Total Number of Shares Purchased | Average Price Paid Per Share | Total Number of Shares Purchased as Part of Publicly Announced Plans | Approximate Dollar Value of Shares that May Yet Be Purchased Under the Plans |
| October 1 - October 31, 2016 | 850,935 |
| $ | 20.47 |
| 849,790 |
| $ | 20,483,156 |
|
| November 1 - November 30, 2016 | 59,621 |
| $ | 22.20 |
| — |
| $ | 70,483,156 |
|
| December 1 - December 31, 2016 | 419,852 |
| $ | 25.14 |
| 414,675 |
| $ | 60,024,244 |
|
| Total | 1,330,408 |
| | 1,264,465 |
|
|
In 2016, our board of directors approved a $100 million incremental increase to our ongoing stock repurchase program with no expiration date. We repurchased a total of approximately $71.6 million of our outstanding common stock in 2016. As of December 31, 2016, approximately $60.0 million remained available from previous authorizations approved by the board of directors. Stock repurchases under the program are primarily intended to offset the dilutive effect of share-based employee incentive compensation. In 2016, we repurchased shares using a Rule 10b5-1 plan. The purchases were funded from existing cash and cash equivalents balances.
Our stock repurchases and dividends are subject to certain restrictions under the terms of our credit facility. For more information about our stock repurchases and dividends, refer to Note 8 and Note 9 in Item 8 of this Form 10-K.
|
| |
(1)SELECTED FINANCIAL DATA | In May 2014, our board of directors authorized a program to repurchase in the aggregate up to $15 million of our outstanding common stock. Our board of directors subsequently approved incremental increases to our ongoing stock repurchase program of $30 million in November 2014 and $50 million on June 29, 2015. In 2014 and 2015, we repurchased approximately $15 million and approximately $49.2 million, respectively, of our outstanding common stock. As of December 31, 2015 we had approximately $31.6 million remaining for repurchases under our stock repurchase program. Stock repurchases under the program are primarily intended to offset the dilutive effect of share-based employee incentive compensation. |
Item 6. Selected Financial Data.Data
The following selected consolidated financial and other data should be read in conjunction with the section titled “Management’sItem 7. Management’s Discussion and Analysis of Financial Condition and Results of Operations”Operations as well as our audited consolidated financial statements and related notes included in Item 8 of this Annual Report on Form 10-K. We have derived the consolidated statement of operations data for the years ended December 31, 2015, 2014 and 2013 and the consolidated balance sheet data as of December 31, 2015 and 2014 from our audited consolidated financial statements that are included elsewhere in this report. We have derived the consolidated statement of operations data for the years ended December 31, 2012 and 2011 and consolidated balance sheet data as of December 31, 2013, 2012 and 2011 from our audited consolidated financial statements that are not included in this report. Our historical results are not necessarily indicative of the results to be expected in the future.
|
| | | | | | | | | | | | | | | | | | | |
| | Year Ended December 31, |
| | 2015 | | 2014 | | 2013 | | 2012 | | 2011 |
| | (in thousands, except share and per share data) |
| Consolidated Statement of Operations: | | | | | | | | | |
| Professional service revenues | $ | 401,287 |
| | $ | 342,074 |
| | $ | 272,372 |
| | $ | 148,233 |
| | $ | 113,279 |
|
| Insurance service revenues | 2,258,001 |
| | 1,851,457 |
| | 1,371,903 |
| | 870,828 |
| | 727,111 |
|
| Total revenues | 2,659,288 |
| | 2,193,531 |
| | 1,644,275 |
| | 1,019,061 |
| | 840,390 |
|
| Costs and operating expenses: | | | | | | | | | |
| Insurance costs | 2,112,376 |
| | 1,686,315 |
| | 1,226,585 |
| | 750,025 |
| | 651,094 |
|
Cost of providing services (exclusive of depreciation and amortization of intangible assets) (1) | 150,694 |
| | 134,256 |
| | 106,661 |
| | 63,563 |
| | 59,388 |
|
Sales and marketing (1) | 166,759 |
| | 139,997 |
| | 109,183 |
| | 59,931 |
| | 38,087 |
|
General and administrative (1) | 69,626 |
| | 53,926 |
| | 52,455 |
| | 37,879 |
| | 31,421 |
|
Systems development and programming costs (1) | 27,558 |
| | 26,101 |
| | 19,948 |
| | 16,718 |
| | 15,646 |
|
| Amortization of intangible assets | 39,346 |
| | 52,302 |
| | 51,369 |
| | 17,441 |
| | 12,388 |
|
| Depreciation | 14,612 |
| | 13,843 |
| | 11,737 |
| | 11,676 |
| | 9,201 |
|
| Restructuring | — |
| | — |
| | — |
| | — |
| | 2,358 |
|
| Total costs and operating expenses | 2,580,971 |
| | 2,106,740 |
| | 1,577,938 |
| | 957,233 |
| | 819,583 |
|
| Operating income | 78,317 |
| | 86,791 |
| | 66,337 |
| | 61,828 |
| | 20,807 |
|
| Other income (expense): | | | | | | | | | |
| Interest expense and bank fees | (19,449 | ) | | (54,193 | ) | | (45,724 | ) | | (9,709 | ) | | (751 | ) |
| Other, net | 1,142 |
| | 478 |
| | 471 |
| | 57 |
| | 127 |
|
| Income before provision for income taxes | 60,010 |
| | 33,076 |
| | 21,084 |
| | 52,176 |
| | 20,183 |
|
| Provision for income taxes | 28,315 |
| | 17,579 |
| | 7,937 |
| | 20,344 |
| | 5,421 |
|
| Net income | $ | 31,695 |
| | $ | 15,497 |
| | $ | 13,147 |
| | $ | 31,832 |
| | $ | 14,762 |
|
| Net income per share attributable to common stock: | | | | | | | | | |
| Basic | $ | 0.45 |
| | $ | 0.24 |
| | $ | 0.26 |
| | $ | 0.66 |
| | $ | 0.32 |
|
| Diluted | $ | 0.44 |
| | $ | 0.22 |
| | $ | 0.24 |
| | $ | 0.63 |
| | $ | 0.31 |
|
| Weighted average common stock outstanding: | | | | | | | | | |
| Basic | 70,228,159 |
| | 56,160,539 |
| | 12,353,047 |
| | 9,805,384 |
| | 7,842,682 |
|
| Diluted | 72,618,069 |
| | 59,566,773 |
| | 15,731,807 |
| | 12,476,091 |
| | 10,103,979 |
|
|
| | | | | | | | | | | | | | | |
| | Year Ended December 31, |
| (in thousands, except per share data) | 2016 | 2015 | 2014 | 2013 | 2012 |
| Income Statement Data: | | | | | |
| Total revenues | $ | 3,060,313 |
| $ | 2,659,288 |
| $ | 2,193,531 |
| $ | 1,644,275 |
| $ | 1,019,061 |
|
| Operating income | 123,958 |
| 78,317 |
| 86,791 |
| 66,337 |
| 61,828 |
|
| Net income | 61,406 |
| 31,695 |
| 15,497 |
| 13,147 |
| 31,832 |
|
| Diluted net income per share of common stock | 0.85 |
| 0.44 |
| 0.22 |
| 0.24 |
| 0.63 |
|
Non-GAAP measures (1): | | | | | |
Net Service Revenues (1) | 646,561 |
| 546,912 |
| 507,216 |
| 417,690 |
| 269,036 |
|
Net Insurance Service Revenues (1) | 199,806 |
| 145,625 |
| 165,142 |
| 145,318 |
| 120,803 |
|
Adjusted EBITDA (1) | 186,554 |
| 151,340 |
| 165,319 |
| 136,027 |
| 95,362 |
|
Adjusted Net income (1) | 86,694 |
| 70,720 |
| 74,392 |
| 57,456 |
| 47,431 |
|
| | | | | | |
| Balance Sheet Data: | | | | | |
| Cash and cash equivalents | $ | 184,004 |
| $ | 166,178 |
| $ | 134,341 |
| $ | 94,356 |
| $ | 63,749 |
|
| Working capital | 156,771 |
| 112,428 |
| 121,290 |
| 81,528 |
| 61,340 |
|
| Total assets | 2,095,143 |
| 2,092,449 |
| 2,340,580 |
| 1,434,738 |
| 887,727 |
|
| Notes and capital leases payable | 459,054 |
| 493,935 |
| 545,150 |
| 818,877 |
| 301,334 |
|
| Total liabilities | 2,060,553 |
| 2,084,368 |
| 2,366,339 |
| 1,705,100 |
| 830,407 |
|
| Convertible preferred stock | — |
| — |
| — |
| 122,878 |
| 122,878 |
|
| Total stockholders’ equity (deficit) | 34,590 |
| 8,081 |
| (25,759 | ) | (393,240 | ) | (65,558 | ) |
| | | | | | |
| Cash Flow Data: | | | | | |
| Net cash provided by operating activities | $ | 144,532 |
| $ | 130,599 |
| $ | 151,899 |
| $ | 100,721 |
| $ | 80,542 |
|
| Net cash used in investing activities | (27,122 | ) | (37,689 | ) | (45,427 | ) | (212,438 | ) | (262,608 | ) |
| Net cash provided by (used in) financing activities | (99,371 | ) | (60,752 | ) | (66,372 | ) | 142,377 |
| 214,190 |
|
| |
| (1) | Includes stock-based compensation expense as follows:Refer to Non-GAAP Financial Measures section below for definition and reconciliation from GAAP measures. |
|
| | | | | | | | | | | | | | | | | | | |
| | Year Ended December 31, |
| | 2015 | | 2014 | | 2013 | | 2012 | | 2011 |
| | (in thousands) |
| Cost of providing services | $ | 4,244 |
| | $ | 2,658 |
| | $ | 1,193 |
| | $ | 516 |
| | $ | 438 |
|
| Sales and marketing | 4,490 |
| | 2,755 |
| | 1,284 |
| | 500 |
| | 637 |
|
| General and administrative | 7,501 |
| | 4,517 |
| | 3,220 |
| | 3,144 |
| | 3,590 |
|
| Systems development and programming costs | 1,688 |
| | 1,030 |
| | 416 |
| | 200 |
| | 160 |
|
| Total stock-based compensation expense | $ | 17,923 |
| | $ | 10,960 |
| | $ | 6,113 |
| | $ | 4,360 |
| | $ | 4,825 |
|
|
| | | | | | | | | | | | | | | | | | | |
| | Year Ended December 31, |
| | 2015 | | 2014 | | 2013 | | 2012 | | 2011 |
| | (in thousands) |
| Other Financial Data: | | | | | | | | | |
Net Insurance Service Revenues (1) | $ | 145,625 |
| | $ | 165,142 |
| | $ | 145,318 |
| | $ | 120,803 |
| | $ | 76,017 |
|
Net Service Revenues (2) | $ | 546,912 |
| | $ | 507,216 |
| | $ | 417,690 |
| | $ | 269,036 |
| | $ | 189,296 |
|
Adjusted EBITDA (3) | $ | 151,340 |
| | $ | 165,319 |
| | $ | 136,027 |
| | $ | 95,362 |
| | $ | 47,348 |
|
Adjusted Net Income (4) | $ | 70,720 |
| | $ | 74,392 |
| | $ | 57,456 |
| | $ | 47,431 |
| | $ | 27,626 |
|
|
| |
(1)SELECTED FINANCIAL DATA | Net Insurance Service Revenues is |
Significant Transactions Affecting Comparability Between Periods
|
| | | |
| | Business Acquisitions | Equity and Debt Activities |
| 2014 | | None | • In March, we completed our initial public offering (IPO) by issuing 15,000,000 shares of common stock and received $216.8 million net proceeds. • As a non-GAAP financial measure that we calculate as insurance service revenues less insurance costs. For more information about Net Insurance Service Revenuesresult of the IPO, all our preferred shares were converted into common stock. • With the IPO proceeds, the outstanding second lien term loan of $190.0 million was fully paid off. |
| | | |
| | | |
| 2013 | | • We acquired Ambrose for a total of $195.0 million. | • The board of directors declared and paid total special dividends of $357.7 million. • In August, the outstanding credit facility was amended and restated with: - A $750.0 million first lien credit facility including a $175.0 million three-year term loan (B-1 term loan), a $455.0 million seven-year term loan (B-2 term loan) and a reconciliation$75.0 million revolving facility, and - A $190.0 million second lien seven-year-six-month term loan. |
| | | |
| | | |
| 2012 | | • We acquired SOI, Accord, and App7, Inc. (ExpenseCloud), for a total of Net Insurance Service Revenues to insurance service revenues, the most directly comparable financial measure calculated$220.0 million. | • The board of directors declared and presented in accordancepaid total special dividends of $75.0 million. • In March, we entered into a credit facility with GAAP, see “Non-GAAP Financial Measures.”a $140.0 million five-year term loan and a $35.0 million five-year revolving facility. • In October, our then outstanding credit facility was amended and restated with a $150.0 million five-year term loan, a $150.0 million six-year term loan and a $50.0 million revolving facility. |
| | | |
Non-GAAP Financial Measures
In addition to the selected financial measures presented in accordance with U.S. Generally Accepted Accounting Principles (GAAP), we monitor other non-GAAP financial measures to manage our business, make planning decisions, allocate resources and as performance measures in our executive compensation plan. These key financial measures provide an additional view of our operational performance over the long term and provide useful information in order to maintain and grow our business.
The presentation of the non-GAAP financial measures is to enhance the understanding of certain aspects of our financial performance. It is not meant to be considered in isolation, superior to, or as a substitute for the directly comparable financial measures prepared in accordance with GAAP.
|
| |
(2)SELECTED FINANCIAL DATA | |
|
| | |
| Non-GAAP Measure | Definition | How We Use The Measure |
Net Service Revenues is a non-GAAP financial measure that we calculate as the sum | • Sum of professional service revenues and Net Insurance Service Revenues. For more information aboutRevenues, or total revenues less insurance costs. | • Provides a comparable basis of revenues on a net basis. Professional service revenues are represented net of client payroll costs whereas insurance service revenues are presented gross of insurance costs for financial reporting purposes. • Acts as the basis to allocate resources to different functions and evaluates the effectiveness of our business strategies by each business function, and • Provides a measure, among others, used in the determination of incentive compensation for management. |
| Net Insurance Service Revenues | • Insurance revenues less insurance costs. | • Is a component of Net Service Revenues, and
• Provides a reconciliationcomparable basis of Net Service Revenues to total revenues on a net basis. Professional service revenues are represented net of client payroll costs whereas insurance service revenues are presented gross of insurance costs for financial reporting purposes. Promotes an understanding of our insurance services business by evaluating insurance service revenues net of our WSE related costs which are substantially pass-through for the most directly comparable financial measure calculatedbenefit of our WSEs. Under GAAP, insurance service revenues and presentedcosts are recorded gross as we have latitude in accordance with GAAP, see “Non-GAAP Financial Measures.” |
| establishing the price, service and supplier specifications. |
(3) | Adjusted EBITDA is a non-GAAP financial measure that we calculate as net | • Net income, excluding the effects of ourof: - income tax provision, - interest expense, - depreciation, - amortization of intangible assets, - stock-based compensation expense and, - in 2014, certainsecondary offering costs related to a public offering of shares from existing stockholders. | • Provides period-to-period comparisons on a consistent basis and an understanding as to how our management evaluates the effectiveness of our common stock. For more information about Adjusted EBITDAbusiness strategies by excluding certain non-cash charges such as depreciation and amortization that have fluctuated significantly over the past five years, and stock-based compensation recognized based on the estimated fair values. We believe these charges are not directly resulting from our core operations or indicative of our ongoing operations. • Enhances comparisons to prior periods and, accordingly, facilitates the development of future projections and earnings growth prospects, and • Provides a reconciliationmeasure, among others, used in the determination of Adjusted EBITDA to net income, the most directly comparable financial measure calculated and presented in accordance with GAAP, see “Non-GAAP Financial Measures.” |
| incentive compensation for management. |
(4) | Adjusted Net Income is a non-GAAP financial measure that we calculate as net | • Net income, excluding the effects of ourof: - effective income tax rate (1), - stock-based compensation, - amortization of intangible assets, - non-cash interest expense (2), - debt prepayment premium, - in 2014, secondary offering costs related to offering of shares from existing stockholders, and - the income tax effect (at our effective tax rate)rate (1)) of these pre-tax adjustmentsadjustments. | • Provides information to our stockholders and in 2014, certain costs relatedboard of directors to a public offeringunderstand how our management evaluates our business, to monitor and evaluate our operating results, and analyze profitability of our sharesongoing operations and trends on a consistent basis by excluding certain non-cash charges as described above, debt payment premiums and our secondary offering costs as these are not directly resulting from our core operations or indicative of common stock. our ongoing operations.
|
| |
| (1) | For purposes of our non-GAAP financial presentation, as a result of a 2015 increase in New York City tax rates and an increase in blended state rates, we have adjusted the non-GAAP effective tax rate to 42.5% for 2016, from 41.5% for the year ended December 31, 2015 fromand 39.5% for year ended December 31, 2014. For more information about Adjusted Net IncomeThese non-GAAP effective tax rates exclude income tax on non-deductible stock-based compensation and a reconciliationdiscrete items including the cumulative effect of Adjusted Net Income to net income, the most directly comparable financial measure calculatedstate legislative changes. |
| |
| (2) | Non-cash interest expense represents amortization and presented in accordance with GAAP, see “Non-GAAP Financial Measures.”write-off of our debt issuance costs. |
|
| | | | | | | | | | | | | | | | | | | |
| | Year Ended December 31, |
| | 2015 | | 2014 | | 2013 | | 2012 | | 2011 |
| | (in thousands) |
| Consolidated Balance Sheet Data: | | | | | | | | | |
| Cash and cash equivalents | $ | 166,178 |
| | $ | 134,341 |
| | $ | 94,356 |
| | $ | 63,749 |
| | $ | 31,620 |
|
Working capital(1) | $ | 112,428 |
| | $ | 121,290 |
| | $ | 81,528 |
| | $ | 61,340 |
| | $ | 26,944 |
|
Total assets(1) | $ | 2,098,230 |
| | $ | 2,340,580 |
| | $ | 1,434,738 |
| | $ | 887,727 |
| | $ | 334,849 |
|
| Notes payable and borrowings under capital leases | $ | 499,716 |
| | $ | 545,150 |
| | $ | 818,877 |
| | $ | 301,334 |
| | $ | 1,683 |
|
Total liabilities(1) | $ | 2,090,149 |
| | $ | 2,366,339 |
| | $ | 1,705,100 |
| | $ | 830,407 |
| | $ | 241,251 |
|
| Convertible preferred stock | $ | — |
| | $ | — |
| | $ | 122,878 |
| | $ | 122,878 |
| | $ | 122,878 |
|
| Total stockholders’ equity (deficit) | $ | 8,081 |
| | $ | (25,759 | ) | | $ | (393,240 | ) | | $ | (65,558 | ) | | $ | (29,280 | ) |
(1) In November 2015, the FASB issued ASU 2015-17, 29Balance Sheet Classification of Deferred Taxes. We elected to early adopt and retrospectively apply the provisions of the amendment. Historical amounts above are conformed to the current presentation. See note 11 for further details.
Non-GAAP Financial Measures
We use Net Insurance Service Revenues, Net Service Revenues, Adjusted EBITDA and Adjusted Net Income to provide an additional view of our operational performance. Net Insurance Service Revenues, Net Service Revenues, Adjusted EBITDA and Adjusted Net Income are financial measures that are not prepared in accordance with GAAP. We define Net Insurance Service Revenues as insurance service revenues less insurance costs, which include the premiums we pay to insurance carriers for the health and workers compensation insurance coverage provided to our clients and WSEs and the reimbursements we pay to the insurance carriers and third-party administrators for claim payments made on our behalf within our insurance deductible layer, where applicable. We define Net Service Revenues as the sum of professional service revenues and Net Insurance Service Revenues. We define Adjusted EBITDA as net income, excluding the effects of our income tax provision, interest expense, depreciation, amortization of intangible assets, stock-based compensation expense and, in 2014, certain costs related to a public offering of our shares of common stock. We define Adjusted Net Income as net income, excluding the effects of our effective income tax rate, stock-based compensation, amortization of intangible assets, non-cash interest expense, debt prepayment premium, the income tax effect (at our effective tax rate) of these pre-tax adjustments and, in 2014, certain costs related to a public offering of our shares of common stock. For purposes of our non-GAAP financial presentation, as a result of a 2015 increase in New York City tax rates and an increase in blended state rates, we have adjusted the effective tax rate to 41.5% for
the year ended December 31, 2015, from 39.5% for year ended December 31, 2014. EachReconciliation of these effective tax rates exclude income tax on non-deductible stock-based compensation and discrete items including the cumulative effect of state legislative changes. Non-cash interest expense represents amortization and write-off of our debt issuance costs.GAAP to Non-GAAP Measures
We believe that the use of Net Insurance Service Revenues provides useful information as it
The table below presents a measure of revenues from our provision of insurance services to our clients less the costs associated with such insurance. We believe that Net Service Revenues provides a useful measurereconciliation of total revenues for the two main components of our revenues calculated on a consistent basis. We believe that the use of Adjusted EBITDA and Adjusted Net Income provides additional period-to-period comparisons and analysis of trends in our business, as they exclude certain one-time and non-cash expenses. We believe that Net Insurance Service Revenues,to Net Service Revenues, Adjusted EBITDA and Adjusted Net Income are useful for our stockholders and board of directors by helping them to identify trends in our business and understand how our management evaluates our business. We use Net Insurance Service Revenues, Net Service Revenues, Adjusted EBITDA and Adjusted Net Income to monitor and evaluate our operating results and trends on an ongoing basis and internally for operating, budgeting and financial planning purposes, in addition to allocating our resources to enhance the financial performance of our business and evaluating the effectiveness of our business strategies. We also use Net Service Revenues and Adjusted EBITDA in determining the incentive compensation for management.Revenues: Net Insurance Service Revenues, Net Service Revenues, Adjusted EBITDA and Adjusted Net Income are not prepared in accordance with, and should not be considered in isolation of, or as an alternative to, measurements required by GAAP. In addition, these non-GAAP measures are not based on any comprehensive set of accounting rules or principles. As non-GAAP measures, Net Insurance Service Revenues, Net Service Revenues, Adjusted EBITDA and Adjusted Net Income have limitations in that they do not reflect all of the amounts associated with our results of operations as determined in accordance with GAAP. In particular:
Net Insurance Service Revenues and Net Service Revenues are reduced by the premiums that we pay to the insurance carriers and any reimbursements we pay to the insurance carriers and third-party administrators for claims payments made on our behalf within our insurance deductible layer, where applicable;
Adjusted EBITDA does not reflect interest expense, or the cash requirements necessary to service interest or principal payments on our debt;
Adjusted EBITDA does not reflect the amounts we paid in taxes or other components of our tax provision;
Adjusted EBITDA does not reflect our cash expenditures or future requirements for capital expenditures or contractual commitments;
Adjusted EBITDA and Adjusted Net Income do not reflect changes in, or cash requirements for, our working capital needs;
Adjusted EBITDA and Adjusted Net Income do not reflect the non-cash component of employee compensation;
Although depreciation and amortization of intangible assets are non-cash charges, the assets being depreciated and amortized often will have to be replaced in the future, and Adjusted EBITDA does not reflect any cash requirements for such replacements; and
Other companies in our industry may calculate these measures or similar measures differently than we do, limiting their usefulness as a comparative measure.
Because of these limitations, you should consider Net Insurance Service Revenues, Net Service Revenues, Adjusted EBITDA and Adjusted Net Income alongside other financial performance measures, including total revenues, net income and our financial results presented in accordance with GAAP. |
| | | | | | | | | | | | | | | |
| | Year Ended December 31, |
| (in thousands) | 2016 | 2015 | 2014 | 2013 | 2012 |
| Total revenues | $ | 3,060,313 |
| $ | 2,659,288 |
| $ | 2,193,531 |
| $ | 1,644,275 |
| $ | 1,019,061 |
|
| Less: Insurance costs | 2,413,752 |
| 2,112,376 |
| 1,686,315 |
| 1,226,585 |
| 750,025 |
|
| Net Service Revenues | $ | 646,561 |
| $ | 546,912 |
| $ | 507,216 |
| $ | 417,690 |
| $ | 269,036 |
|
The table below sets forthpresents a reconciliation of GAAP insurance service revenues to Net Insurance Service Revenues:
|
| | | | | | | | | | | | | | | | | | | |
| | Year Ended December 31, |
| | 2015 | | 2014 | | 2013 | | 2012 | | 2011 |
| | (in thousands) |
| Insurance service revenues | $ | 2,258,001 |
| | $ | 1,851,457 |
| | $ | 1,371,903 |
| | $ | 870,828 |
| | $ | 727,111 |
|
| Less: Insurance costs | 2,112,376 |
| | 1,686,315 |
| | 1,226,585 |
| | 750,025 |
| | 651,094 |
|
| Net Insurance Service Revenues | $ | 145,625 |
| | $ | 165,142 |
| | $ | 145,318 |
| | $ | 120,803 |
| | $ | 76,017 |
|
The table below sets forth a reconciliation of GAAP total revenues to Net Service Revenues:
|
| | | | | | | | | | | | | | | | | | | |
| | Year Ended December 31, |
| | 2015 | | 2014 | | 2013 | | 2012 | | 2011 |
| | (in thousands) |
| Total revenues | $ | 2,659,288 |
| | $ | 2,193,531 |
| | $ | 1,644,275 |
| | $ | 1,019,061 |
| | $ | 840,390 |
|
| Less: Insurance costs | 2,112,376 |
| | 1,686,315 |
| | 1,226,585 |
| | 750,025 |
| | 651,094 |
|
| Net Service Revenues | $ | 546,912 |
| | $ | 507,216 |
| | $ | 417,690 |
| | $ | 269,036 |
| | $ | 189,296 |
|
|
| | | | | | | | | | | | | | | |
| | Year Ended December 31, |
| (in thousands) | 2016 | 2015 | 2014 | 2013 | 2012 |
| Insurance service revenues | $ | 2,613,558 |
| $ | 2,258,001 |
| $ | 1,851,457 |
| $ | 1,371,903 |
| $ | 870,828 |
|
| Less: Insurance costs | 2,413,752 |
| 2,112,376 |
| 1,686,315 |
| 1,226,585 |
| 750,025 |
|
| Net Insurance Service Revenues | $ | 199,806 |
| $ | 145,625 |
| $ | 165,142 |
| $ | 145,318 |
| $ | 120,803 |
|
The table below sets forthpresents a reconciliation of GAAP net income to Adjusted EBITDA:
| | | | Year Ended December 31, | Year Ended December 31, |
| | 2015 | | 2014 | | 2013 | | 2012 | | 2011 | |
| | (in thousands) | |
| (in thousands) | | 2016 | 2015 | 2014 | 2013 | 2012 |
| Net income | $ | 31,695 |
| | $ | 15,497 |
| | $ | 13,147 |
| | $ | 31,832 |
| | $ | 14,762 |
| $ | 61,406 |
| $ | 31,695 |
| $ | 15,497 |
| $ | 13,147 |
| $ | 31,832 |
|
| Provision for income taxes | 28,315 |
| | 17,579 |
| | 7,937 |
| | 20,344 |
| | 5,421 |
| 43,046 |
| 28,315 |
| 17,579 |
| 7,937 |
| 20,344 |
|
| Stock-based compensation | 17,923 |
| | 10,960 |
| | 6,113 |
| | 4,360 |
| | 4,825 |
| 26,497 |
| 17,923 |
| 10,960 |
| 6,113 |
| 4,360 |
|
| Interest expense and bank fees | 19,449 |
| | 54,193 |
| | 45,724 |
| | 9,709 |
| | 751 |
| 20,257 |
| 19,449 |
| 54,193 |
| 45,724 |
| 9,709 |
|
| Depreciation | 14,612 |
| | 13,843 |
| | 11,737 |
| | 11,676 |
| | 9,201 |
| 19,351 |
| 14,612 |
| 13,843 |
| 11,737 |
| 11,676 |
|
| Amortization of intangible assets | 39,346 |
| | 52,302 |
| | 51,369 |
| | 17,441 |
| | 12,388 |
| 15,997 |
| 39,346 |
| 52,302 |
| 51,369 |
| 17,441 |
|
| Secondary offering costs | — |
| | 945 |
| | — |
| | — |
| | — |
| — |
| — |
| 945 |
| — |
| — |
|
| Adjusted EBITDA | $ | 151,340 |
| | $ | 165,319 |
| | $ | 136,027 |
| | $ | 95,362 |
| | $ | 47,348 |
| $ | 186,554 |
| $ | 151,340 |
| $ | 165,319 |
| $ | 136,027 |
| $ | 95,362 |
|
The table below sets forthpresents a reconciliation of GAAP net income to Adjusted Net Income:
| | | | Year Ended December 31, | Year Ended December 31, |
| | 2015 | | 2014 | | 2013 | | 2012 | | 2011 | |
| | (in thousands) | |
| (in thousands) | | 2016 | 2015 | 2014 | 2013 | 2012 |
| Net income | $ | 31,695 |
| | $ | 15,497 |
| | $ | 13,147 |
| | $ | 31,832 |
| | $ | 14,762 |
| $ | 61,406 |
| $ | 31,695 |
| $ | 15,497 |
| $ | 13,147 |
| $ | 31,832 |
|
| Effective income tax rate adjustment | 3,411 |
| | 4,514 |
| | — |
| | — |
| | — |
| (1,346 | ) | 3,411 |
| 4,514 |
| — |
| — |
|
| Stock-based compensation | 17,923 |
| | 10,960 |
| | 6,113 |
| | 4,360 |
| | 4,825 |
| 26,497 |
| 17,923 |
| 10,960 |
| 6,113 |
| 4,360 |
|
| Amortization of intangible assets | 39,346 |
| | 52,302 |
| | 51,369 |
| | 17,441 |
| | 12,388 |
| 15,997 |
| 39,346 |
| 52,302 |
| 51,369 |
| 17,441 |
|
| Non-cash interest expense | 3,610 |
| | 21,880 |
| | 13,577 |
| | 3,768 |
| | 375 |
| 3,827 |
| 3,610 |
| 21,880 |
| 13,577 |
| 3,768 |
|
| Debt prepayment premium | — |
| | 3,800 |
| | — |
| | — |
| | — |
| — |
| — |
| 3,800 |
| — |
| — |
|
| Secondary Offering Costs | — |
| | 945 |
| | — |
| | — |
| | — |
| |
| Secondary offering costs | | — |
| — |
| 945 |
| — |
| — |
|
| Income tax impact of pre-tax adjustments | (25,265 | ) | | (35,506 | ) | | (26,750 | ) | | (9,970 | ) | | (4,724 | ) | (19,687 | ) | (25,265 | ) | (35,506 | ) | (26,750 | ) | (9,970 | ) |
| Adjusted Net Income | $ | 70,720 |
| | $ | 74,392 |
| | $ | 57,456 |
| | $ | 47,431 |
| | $ | 27,626 |
| $ | 86,694 |
| $ | 70,720 |
| $ | 74,392 |
| $ | 57,456 |
| $ | 47,431 |
|
|
| |
| MANAGEMENT'S DISCUSSION AND ANALYSIS | |
Item 7. Management’s Discussion and Analysis of Financial Condition and Results of Operations
You should read the following discussion of our financial condition and results of operations in conjunction with our consolidated financial statements and the related notes included elsewhere in this report. This discussion contains forward-looking statements that involve risks and uncertainties. When reviewing the discussion below, you should keep in mind the substantial risks and uncertainties that characterize our business. In particular, we encourage you to review the risks and uncertainties described in the section titled “Risk Factors” included under Part I, Item 1A above. These risks and uncertainties could cause actual results to differ materially from those projected in forward-looking statements contained in this report or implied by past results or trends.
Executive Overview
TriNet isWe are a leading provider of comprehensive HR solutions for small to midsize businessesSMBs under a co-employment, or PEO model. OurWe offer a comprehensive HR solutions are designedsolution to manage an increasingly complex set of HR regulations, costs, risks, and responsibilities for our clients allowing them to focus on operatingusing cloud based software systems, enabled with our HR professionals and growing their core businesses. Our bundled HR solutions include multi-state payroll processingexpertise in combination with competitive benefit offerings, insurance coverage and tax administration, employee benefits programs (including health insurance and retirement plans), workers compensation insurance and claims management, federal, state and local labor, employment and benefit law compliance, risk mitigation expense and time management, and other human capital consulting services. Our proprietary, cloud-based HR software systems are used by our clients and their WSEs to efficiently store and manage their core HR-related information and conduct a variety of HR-related transactions anytime and anywhere. In addition, our expert teams of in-house HR professionals also provide additional services upon request to support various stages of our clients’ growth, including talent management, recruiting and training, performance management consulting or other consulting services (with an incremental charge for such services).2016 we:
As of December 31, 2015, we served over 12,70013,900 clients, in all 50 states, the District of Columbia and Canada, co-employed more than 324,000approximately 338,000 WSEs and had we increased our Total WSEs4% over 2015,
processed over $31$34 billion in payroll and payroll tax payments for our clients in 2015. Our clients are distributed across a variety2016 with an increase of industries, including technology, life sciences, not-for-profit, professional services, financial services, property management, retail, manufacturing,12% over 2015,
reorganized our sales force by adding national vertical sales leaders and hospitality. Our sales andfocused our marketing client services and product development teams are increasingly focusedefforts on specifican industry verticals. This verticalized approach gives us a deeper understandingvertical basis,
launched three vertical products - TriNet Technology, TriNet Nonprofit and TriNet Financial Services, and
completed the consolidation of the HR needs facing SMBs in particular industries, which betterAccord and Ambrose legacy platforms through the migration of our clients to the TriNet platform and retirement of these legacy software platforms.
Our financial highlights for the 2016 year include:
Total revenues increased 15% to $3.1 billion, while Net Service Revenues increased 18% to $646.6 million,
Operating Income increased 58% to $124.0 million,
Net income increased 94% to $61.4 million, or $0.85 per diluted share, while Adjusted Net Income increased 23% to $86.7 million,
Adjusted EBITDA increased 23% to $186.6 million, and
Cash provided by operating activities increased 11% to $144.5 million.
Our Vertical Approach
Our vertical approach enables us to provide better HR solutions and services tailored to the specific needs of clients in these verticals. In addition to sales and marketing, our client services and product development teams are increasingly focused on specific industry verticals. We conduct our business primarily in the United States, with more than 99% of our total revenuesbelieve this vertical approach is an important competitive differentiator for each of 2015, 2014 and 2013 being attributable to WSEs in the U.S. and the remainder being attributable to WSEs in Canada.
For 2015, 2014 and 2013, our total revenues were $2.7 billion, $2.2 billion, and $1.6 billion respectively. Our total revenues consist of professional service revenues and insurance service revenues. For 2015 and 2014, 15% and 16% of our total revenues, respectively, consisted of professional service revenues, and 85% and 84% of our total revenues, respectively, consisted of insurance service revenues. We recognize as professional service revenues the fees we earn for providing our clients with a comprehensive suite of HR professional services, but do not include amounts paid to us by clients as payroll that are paid out to WSEs or amounts withheld and remitted to authorities as taxes. We recognize as insurance service revenues all insurance-related billings and administrative fees collected from clients and withheld from WSEs. We pay premiums to third-party insurance carriers for client and WSE insurance benefits and reimburse the insurance carriers and third-party administrators for claims payments made on our behalf within our insurance deductible layer, where applicable. These premiums and reimbursements are classified as insurance costs on our statements of operations.TriNet.
We sell our services primarily through our direct sales organization, which consists of sales representatives who focus on serving clients in specific industry vertical markets. For 2015, 2014Our sales representatives are supported by marketing, inside sales, lead generation and 2013, our sales and marketing expenses were $166.8 million, $140.0 million and $109.2 million, respectively, or 6%, 6% and 7%lead incubation efforts as well as referral networks.
Historically, year over year comparison of our total revenues and 30%, 28% and 26%Total Sales Representatives has served as an indicator of our Net Service Revenues, respectively.success in growing our business. During 2016, the vertical sales leaders consciously slowed down hiring while they assessed, recalibrated, and realigned their sales teams. Going forward, we expect to grow the salesforce strategically within the assigned vertical markets. While having a productive direct sales force is important to the success of our business, we no longer rely on the absolute number of sales representatives by itself as an indicator of the growth of our revenues or our business overall.
|
| |
| MANAGEMENT'S DISCUSSION AND ANALYSIS | |
Our Technology
We have made significant investments in our proprietary, cloud-based HR systems, including implementing client information and management software to provide our clients with enhanced features and functionality. In addition, we invested in a common technology platform as it is an important enabler of our products. It allows us to offer industry–specific solutions in a scalable manner while delivering frequent enhancements that benefit all clients. In 2016, we completed the consolidation and retirement of two of our three legacy platforms that we acquired (Accord and Ambrose). We plan to consolidate our remaining legacy acquired platform (SOI) onto our TriNet platform in 2017.
For 2015, 2014 and 2013,2016, our systems development and programming costs were $27.6$31.4 million, $26.1 million and $19.9 million, or 1%, 1% andrepresenting 1% of our total revenues and 5%, 5% and 5% of our Net Service Revenues, respectively. Revenues. Combined with our technology related capital expenditures, our total technology investment was $62.1 million, representing 2% of our total revenues and 10% of our Net Service Revenues.
We plan to continue to invest to upgrade and improve our technology offerings, including enhancements of our solutionsonline interface and mobile applications to address specific needsprovide better client and individual WSE experience.
Insurance
We have added senior insurance management and in-house actuarial capabilities to allow us to improve our risk monitoring and management of our insurance pricing with the expectation that we can continue to provide a cost effective and competitive solution to clients that is priced to the risk incurred. In 2015, we started an effort to reprice our insurance service offerings to our clients. With this substantially complete, total revenues increased 15% to $3.1 billion and Net Insurance Service Revenue increased 37% to $199.8 million in 2016.
Our People
As we grow, we continue to invest in our key vertical markets, asemployees and their capabilities. In 2016, for example, we believe the continued improvement ofincreased our technology provides TriNet with the ability to drive operating efficiencies while improvingin-house Risk Management expertise, most notably through investing in our clients’ experience. We will leverage our existing online technology offerings to build additional productsactuarial pricing and features, including a full-service mobile platform, standard APIs for selected third party offerings,
improved client experience for key processes, and retirement of legacy software systems from acquisitions and migration of clients to the primary TriNet software system.
Strategic Acquisitions
Historically, we have pursued strategic acquisitions to both expand our product capabilities and supplement our growth across geographies and certain industry verticals. Our acquisition targets have included other bundled HR providersclaims management employees as well as technology companies or technology product offeringsin our internal financial control functions. We also continued to supplement or enhanceinvest in growing our existing HR solutions. sales functions, hiring and retaining sales reps with industry experience, which resulted in a direct sales organization of over 450 direct sales representatives. From 2015 to 2016, we incurred additional salary and salary related costs of $51 million.
We intend towill continue to pursue strategic acquisitions that will enable ussearch, select and hire people to addserve our current clients and find new clients as our business grows and WSEs, expandadd to our presenceskills and capabilities in certain geographies or industry verticals and offerorder to provide innovative HR solutions for our clients and WSEs more comprehensive and attractive products and services.
Key Financial and Operating Metricsclients.
We regularly review certain key financialexpect our employee-related expenses will continue to grow in absolute dollar amounts in the foreseeable future as we continue to drive our growth through vertical product delivery and operating metricsplatform integrations, while also working to evaluate growth trends, measureimprove our performancesystems and make strategic decisions. These key financialprocesses and operating metrics may change over time. Our key financial and operating metrics atgain efficiencies.
|
| |
| MANAGEMENT'S DISCUSSION AND ANALYSIS | |
Results of Operations
The following table summarizes our results of operations for the three years ended December 31, 2015, 20142016. For details of the critical accounting judgments and 2013, were as follows:estimates that could affect the Results of Operations, see the Critical Accounting Judgments and Estimates section within Management's Discussion and Analysis (MD&A).
|
| | | | | | | | | | | |
| | Year Ended December 31, |
| Key Financial and Operating Metrics: | 2015 | | 2014 | | 2013 |
| Net Insurance Service Revenues (in thousands) | $ | 145,625 |
| | $ | 165,142 |
| | $ | 145,318 |
|
| Net Service Revenues (in thousands) | $ | 546,912 |
| | $ | 507,216 |
| | $ | 417,690 |
|
| Total WSEs | 324,399 |
| | 288,312 |
| | 231,203 |
|
| Total Sales Representatives | 481 |
| | 385 |
| | 300 |
|
|
| | | | | | | | | | | | | |
| | Year Ended December 31, | % Change |
| (in thousands, except operating metrics data) | 2016 | 2015 | 2014 | 2016 vs. 2015 | 2015 vs. 2014 |
| Consolidated Statements of Income: | | | | | |
| Professional service revenues | $ | 446,755 |
| $ | 401,287 |
| $ | 342,074 |
| 11 | % | 17 | % |
| Insurance service revenues | 2,613,558 |
| 2,258,001 |
| 1,851,457 |
| 16 |
| 22 |
|
| Total revenues | 3,060,313 |
| 2,659,288 |
| 2,193,531 |
| 15 |
| 21 |
|
| Insurance costs | 2,413,752 |
| 2,112,376 |
| 1,686,315 |
| 14 |
| 25 |
|
| Cost of providing services (exclusive of depreciation and amortization of intangible assets) | 190,444 |
| 150,694 |
| 134,256 |
| 26 |
| 12 |
|
| Sales and marketing | 173,714 |
| 166,759 |
| 139,997 |
| 4 |
| 19 |
|
| General and administrative | 91,659 |
| 69,626 |
| 53,926 |
| 32 |
| 29 |
|
| Systems development and programming | 31,438 |
| 27,558 |
| 26,101 |
| 14 |
| 6 |
|
| Amortization of intangible assets | 15,997 |
| 39,346 |
| 52,302 |
| (59 | ) | (25 | ) |
| Depreciation | 19,351 |
| 14,612 |
| 13,843 |
| 32 |
| 6 |
|
| Total costs and operating expenses | 2,936,355 |
| 2,580,971 |
| 2,106,740 |
| 14 |
| 23 |
|
| Operating income | 123,958 |
| 78,317 |
| 86,791 |
| 58 |
| (10 | ) |
| Other income (expense): | | | |
|
|
| Interest expense and bank fees | (20,257 | ) | (19,449 | ) | (54,193 | ) | 4 |
| (64 | ) |
| Other, net | 751 |
| 1,142 |
| 478 |
| (34 | ) | 139 |
|
| Income before provision for income taxes | 104,452 |
| 60,010 |
| 33,076 |
| 74 |
| 81 |
|
| Income tax expenses | 43,046 |
| 28,315 |
| 17,579 |
| 52 |
| 61 |
|
| Net income | $ | 61,406 |
| $ | 31,695 |
| $ | 15,497 |
| 94 | % | 105 | % |
| | | | |
|
|
Non-GAAP measures (1): | | | |
|
|
Net Service Revenues (1) | $ | 646,561 |
| $ | 546,912 |
| $ | 507,216 |
| 18 | % | 8 | % |
Net Insurance Service Revenues (1) | 199,806 |
| 145,625 |
| 165,142 |
| 37 |
| (12 | ) |
Adjusted EBITDA (1) | 186,554 |
| 151,340 |
| 165,319 |
| 23 |
| (8 | ) |
Adjusted Net income (1) | 86,694 |
| 70,720 |
| 74,392 |
| 23 |
| (5 | ) |
| | | | | | |
| Operating Metrics: | | | | | |
| Total WSEs payroll and payroll taxes processed (in billions) | $ | 34.3 |
| $ | 30.6 |
| $ | 25.6 |
| 12 | % | 20 | % |
| Total WSEs | 337,885 |
| 324,399 |
| 288,312 |
| 4 |
| 13 |
|
| Average WSEs | 326,850 |
| 303,917 |
| 261,431 |
| 8 |
| 16 |
|
| |
| (1) | Refer to Non-GAAP measures definitions and reconciliations from GAAP measures in Item 6. Selected Financial Data. |
|
| |
| MANAGEMENT'S DISCUSSION AND ANALYSIS | |
Revenues and Income
2016 - 2015 Commentary
Total revenues were $3.1 billion, a 15% increase from 2015:
Professional service revenues were $446.8 million an increase of 11% over 2015 as a result of an Average WSEs growth of 8% with the remainder due to price increases.
Insurance service revenues grew 16% over 2015 to $2.6 billion. Service price increases in combination with the 8% growth in Average WSEs accounted for the year over year growth.
Net Service Revenues was $646.6 million representing an 18% increase from 2015. Net Insurance Service revenues represented 31% of Net Service Revenues and grew 37% over 2015 with Insurance Service revenues per Average WSE increasing by 8% but Insurance Costs per Average WSE increasing by only 6%.
Operating Income was $124.0 million and 58% better than 2015, primarily due to improvement in our service revenues, especially our insurance services business as noted above, partially offset by a 12% increase in operating expenses used to support our growth as detailed below.
Net Income increased 94% to $61.4 million, or $0.85 per diluted share.
Adjusted Net Income increased $16.0 million, a 23% increase from 2015, primarily due to increased operating income as described above, offset by higher income tax expenses.
2015 - 2014 Commentary
Total revenues in 2015 were $2.7 billion, a 21% increase from 2014:
Professional service revenues was $401.3 million an increase of 17% over 2014. The increase was mainly attributable to our 16% growth in Average WSEs and an increase in WSEs from verticals with higher average revenue per WSE.
Insurance revenues grew 22% over 2014 to $2.3 billion. The increase was primarily due to our WSEs growth and an increase of 5% in average insurance service revenues per WSE.
Net Service Revenues was $546.9 million, an 8% increase from 2014. This was the result of a 17% growth in professional service revenues, partially offset by a 12% decrease in Net Insurance Service Revenues which represented 27% of the total. In 2015, we recorded an increase of 25% in insurance costs primarily related to medical claims which exceeded our 16% growth in Average WSEs and Net Service Revenues
We define Net22% increase in Insurance Service Revenues as insurance service revenues less insurance costs. We define Net Service Revenues as the sumoverall.
Operating Income was $78.3 million, 10% decrease from 2014, primarily due to 23% increase in total cost and operating expenses compared to growth of professional service revenues and Net Insurance Service Revenues. Ouronly 21% in total revenues on a GAAP basis represent the total amount invoicedas described above.
Net Income increased 105% to $31.7 million, or $0.44 per diluted share, primarily due to reduction of $34.7 million in interest expense and bank fees, partially offset by usdecrease in operating income as described above.
|
| |
| MANAGEMENT'S DISCUSSION AND ANALYSIS | |
Adjusted Net Income decreased 5% from 2014, primarily due to our clients, net of direct pass-through costs such as payroll and payroll tax payments, for the services we provide to our clients. Our insurance costs include the premiums we pay to third-party insurance carriers for the insurance coverage provided to our clients and WSEs and the reimbursements we pay to the insurance carriers and third-party administrators for claims payments made on our behalf within our insurance deductible layer, where applicable. We act principally as the service provider to add valuedecrease in the executionincome before provision for income taxes after adjusting the non-GAAP reconciling items, and procurementincrease of these servicesnon-GAAP tax rate from 39.5% for 2014 to our clients. Historically, Net Insurance Service Revenues has served as the primary indicator of our ability to source, add value and offer benefit services to our clients and WSEs through third-party insurance carriers, and has been considered by management to be a key performance measure. Historically, Net Service Revenues has also served41.5% for 2015 as a key performance measure as it provides a useful measureresult of total revenues for the two main components of our revenues calculated on a consistent basis. In addition, management believes measuring operating costs as a function of Net Service Revenues has historically provided a useful metric, as we believe it has enabled evaluation of the performance of our business.an increase in New York City tax rates and blended state rates in 2015.
|
| | | | | | |
| | | Average WSE growth | |
| | 2016 |
| | 2015 |
| | 8 | % | | 16% |
| | | | |
| | Average monthly total revenue per WSE |
| | 2016 | 2015 | 2014 |
| | $780 | $729 | $699 |
| | | | |
| | |
| |
| |
| |
Historically, year over year Total WSEs at the end of a given fiscal period as the total number of WSEs paid in the last calendar month of the fiscal period. Historically, comparing our Total WSEs at the end of a fiscal period to that of prior periodscomparison has served as an indicator of our success in growing our business, both organically and through the integration of acquired businesses, and retaining clients. Our Total WSEs paid inAverage WSE growth is another volume measure we use to monitor the last calendar monthperformance of the fiscal period has also historically been a leading indicator of our business. However, anticipated revenues for future fiscal periods.
Total Sales Representatives
Our direct sales force consists of sales representatives whoperiods can diverge from total WSEs paid due to pricing differences across our HR solutions and services. In addition to driving the growth in WSE count, we also focus on serving clients in specific industry vertical markets. We define Total Sales Representatives at the end of a given fiscal period as the total number ofpricing strategies and product differentiation to maximize our direct sales force employees at that date. Historically, comparing our Total Sales Representatives at the end of a fiscal period to our Total Sales Representatives at the end of a prior fiscal period has served as an indicator of our success in growing our business. Our Total Sales Representatives at the end of recent fiscal periods has also historically been a key indicator of our ability to increase our revenues in the following fiscal periods.
Impact of Health Care Reform
The Affordable Care Act, or the Act, entails sweeping health care reforms with staggered effective dates from 2010 through 2020, and many provisions of the Act require the issuance of additional guidance from the U.S. Departments of Labor and Health and Human Services, the IRS and the states. A number of key provisions of the Act have begun to take effect over the past three years, including the establishment of state and federal insurance exchanges, insurance market reforms, “play or pay” penalties on applicable large employers and the imposition and assessment of excise taxes on the health insurance industry and reinsurance taxes on insurers and third-party administrators. Collectively, these items have the potential to significantly change the insurance marketplace for employers and how employers offer or provide insurance to employees. We are not yet able to determine the full impact to our business, and to our clients, resulting from the Act. In future periods, the Act may result in increased costs to us and our clients and could affect our ability to attract and retain clients. Additionally, we may be limited or delayed in our ability to increase service fees to offset any associated potential increased costs resulting from compliance with the Act. Furthermore, the uncertainty surrounding the terms and application of the Act may delay or inhibit the decisions of potential clients to outsource their HR needs. As a result, these changes could have a negative impact on our operating results.
Seasonality and Insurance Variability
Our business is affected by cyclicality in business activity and WSE behavior. Historically, we have experienced our highestrevenue opportunities. Average monthly addition of WSEs, as well as our highest monthly levels of client attrition, in the month of January, primarily because clients that change their payroll service providers tend to do so at the beginning of a calendar year. We also experience higher levels of client attrition in connection with renewals of the health insurance we sponsor for our WSEs, in the event that such renewals result in higher costs to our clients. We have also historically experienced higher insurance claim volumes in the second and third quarters of a fiscal year than in the first and fourth quarters of a fiscal year, as WSEs typically access their health care providers more often in the second and third quarters of a fiscal year, which has negatively impacted our insurance costs in these quarters. We have also experienced variability on a quarterly basis in the amount of our health and workers compensation insurance costs due to the number and severity of insurance claims being unpredictable. These historical trends may change, and other seasonal trends and variability may develop, which would make it more difficult for us to manage our business.
Basis of Presentation and Key Components of Our Results of Operations
Total Revenues
Our total revenues consistper WSE, as a measure to monitor the success of such pricing strategies, has increased 7% in 2016 versus 4% in 2015.
Professional Service Revenues (PSR)
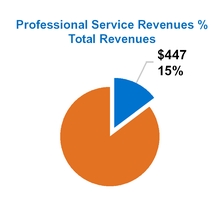
|
| | | | |
| | Revenue Growth |
| | 2016 |
| | 2015 |
| | 11 | % | | 17% |
| | | | |
| | Monthly PSR per Average WSE |
| | 2016 | 2015 | 2014 |
| | $114 | $110 | $109 |
| | | | |
| | Payroll and payroll taxes processed |
| | 2016 | 2015 | 2014 |
| | $34 billion | $31 billion | $26 billion |
| | | | |
| | |
| |

In 2016, our professional service revenues and insurance service revenues. Forrepresented 15% of total revenues unchanged from 2015 and 2014, 15% and 16%69% of Net Service Revenues which is a reduction of 4% over 2015 reflecting our total revenues, respectively, consistedimproved performance of professional service revenues, and 85% and 84% ofNet Insurance Service Revenues from our total revenues, respectively, consisted of insurance service revenues.repricing efforts.
We recognize as professional service revenues the fees we earn for providing our clients with a comprehensive suite of HR professional services, but do not include amounts paid to us by clients as payroll that are paid out to WSEs or amounts withheld and remitted to authorities as taxes. Our clients generally pay us these feesare billed either based on either a fixed fee per WSE per month, or per transaction or a percentage of the WSE’s payroll cost, pursuantWSEs’ payroll. Our investment in a vertical approach provides us the flexibility to writtenoffer clients in different industries with different services agreements that are generally cancelable byat different prices. This vertical approach will allow us orto address specific needs for different vertical clients, improve our clients upon 30 days’ prior written notice.revenue retention rate but potentially reduce the value of WSEs as a leading indicator of future revenue performance.
We recognize as
|
| |
| MANAGEMENT'S DISCUSSION AND ANALYSIS | |
Insurance Service Revenues (ISR)
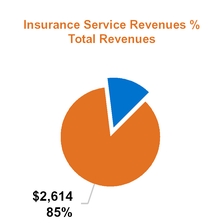
|
| | | | |
| | Insurance Service Revenues Growth |
| | 2016 |
| | 2015 |
| | 16 | % | | 22% |
| | | | |
| | Monthly ISR per Average WSE |
| | 2016 | 2015 | 2014 |
| | $666 | $619 | $590 |
| | | | |
| | |
| |
| |
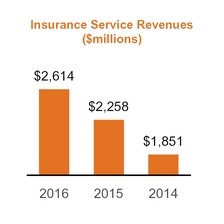
Insurance service revenues represented 85% of total revenues with growth of 16% in 2016 versus 22% in 2015. The slower growth in insurance service revenues all insurance-related billings and administrative fees collected from clients and withheld from WSEs. We pay premiumswas mainly attributable to third-party insurance carriersan 8% growth in Average WSEs for client and WSE insurance benefits and reimburse the insurance carriers and third-party administrators2016 compared with 16% growth in Average WSEs for claims payments made on our behalf within2015.
In 2016, we strengthened our insurance deductible layer, where applicable, as further described belowoffering with new leadership and a new actuarial team to improve our pricing and operating effectiveness. We completed the repricing of medical insurance for our existing clients in “Insurance Costs”. These premiums2016 which now fully reflects our insurance experience in 2015. Average insurance service revenues per WSE increased by 8% in 2016 and reimbursements are classified as insurance costs on our statements of operations.5% in 2015.
Insurance Costs
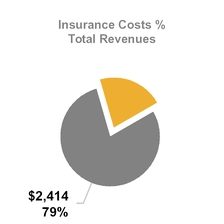
|
| | | | |
| Insurance Costs Growth |
| 2016 |
| | 2015 |
| 14 | % | | 25 | % |
| | | |
| Insurance Costs per Average WSE |
| 2016 | 2015 | 2014 |
| $615 | $579 | $538 |
| | | |
| |
| | | |
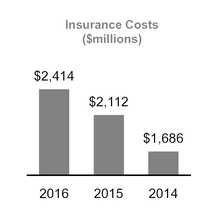
2016 - 2015 Commentary
Insurance costs include the premiums we pay to third-party insurance carriers for insurance coverage provided to clients and WSEs and the reimbursements we pay to the insurance carriers and third-party administrators for claims payments made on our behalf within the insurance deductible layer for those plans that have such a deductible.
Our insurance costs are,increased 14% in part, a function of the type and terms of agreements that we enter into with the third-party insurance carriers that provide TriNet-sponsored insurance plans for our clients and WSEs. Approximately 38% of our 2015
health insurance premiums were for fully-insured policies with respect to which our carriers set the premiums and for which we were not responsible for any deductible, which are referred to2016 as ‘guaranteed cost’ policies. Our future premiums under these guaranteed cost policies will be influenced by the WSE claims activity in prior periods and rate increases by our insurance carriers. The remaining 62% of our 2015 group health insurance premiums, and all of our workers compensation insurance premiums, were for fully-insured policies with respect to which we agree to reimburse our carriers for any claims paid within our agreed-upon deductible layer. Under these policies, WSEs file claims with the carriers, which are responsible for paying the claims up to the maximum coverage under the policies. The carriers and third-party administrators then seek reimbursement from us for payments of claims made on our behalf up to our deductible per incident for workers compensation claims, or up to limits to our exposure for individual claims and limits to our maximum aggregate exposure for claims in a given policy year in accordance with the terms of the underlying health insurance policies. In no event are we liable to pay claims directly to WSEs. As we evaluate the claims experience for each fiscal period, we adjust, as we deem necessary, our workers compensation and health benefits reserves, and this in turn has a corresponding impact on our insurance costs. As a result our insuranceof an 8% increase in Average WSEs, increased workers' compensation costs fluctuateper WSE, including $28.2 million of workers' compensation costs from periodloss development relating to period depending onprior accident years.
2015 - 2014 Commentary
Insurance costs increased 25% in 2015 as a result of a 16% increase in Average WSEs, increases in the numbervolume and severity of medical claims and $26.4 million in workers' compensation costs from loss development relating to prior accident years.
|
| |
| MANAGEMENT'S DISCUSSION AND ANALYSIS | |
Other Operating Expenses (OOE)
Other operating expenses includes cost of providing services (COPS), sales and marketing (S&M), general and administrative (G&A), systems development and programming (SD&P) expenses.
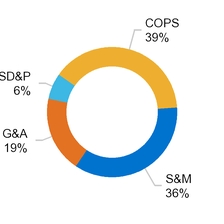
|
| | | |
| Operating Expense Growth |
| 2016 |
| | 2015 |
| 18 | % | | 17% |
| | | |
| % of Total Revenues |
| 2016 | 2015 | 2014 |
| 16% | 16% | 16% |
| | | |
| % of Net Service Revenue |
| 2016 | 2015 | 2014 |
| 75% | 76% | 70% |
| | | |
| |
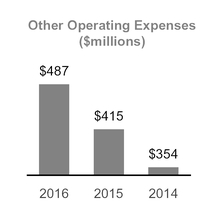
We have approximately 2,600 corporate employees as of December 31, 2016 in 53 offices across the claims incurredU.S. Our corporate employees' compensation related expenses represent 70% of our operating expenses in 2016 and 2015 and 72% in 2014.
We manage our expenses and allocate resources across different business functions based on percentage of Net Service Revenues which has increased from 70% in 2014 to 76% in 2015 and 75% in 2016. The increase was primarily due to lower revenue in 2015, and increased expenses in the following:
|
| |
| MANAGEMENT'S DISCUSSION AND ANALYSIS | |
2016 - 2015 Commentary
Operating costs increased $72.6 million or 18% as part of our continued investment in supporting our infrastructure and our capabilities to our clients. Specific costs increased as follows:
Compensation costs for our corporate employees includes payroll, payroll taxes, stock-based compensation, bonuses, commissions and other payroll and benefits related costs. Total compensation costs increased $51.0 million or 15% primarily due to increases in our
| |
| ◦ | client services functions to support the growth and migration of clients from legacy platforms to TriNet platform, |
| |
| ◦ | risk services functions to strengthen our insurance business management by hiring new leaders and actuarial teams, |
| |
| ◦ | technology function to support product delivery and platform integration, and |
| |
| ◦ | other supporting functions as a result of increased operational and compliance requirement for a growing public company. |
Accounting and other professional fees increased $8.1 million in 2016 in connection with significant time and resources required for our internal control remediation efforts and audit of our internal controls as required by Section 404 of the Sarbanes-Oxley Act.
Consulting expenses included costs associated with reviewing and administering our WSEsinsurance programs, as well as consulting firms engaged in that periodenhancing our product offerings.
Costs capitalized as internally developed software increased $10.1 million in 2016 primarily associated with product delivery and prior periods. platform integration.
Other expenses increased $13.8 million in 2016 and included office leases and IT infrastructure costs to support the increased operational requirements.
We expect our insurance costsoperating expenses to continue to increase in absolute dollars on an annual basis for the foreseeable future due to expected growth, in WSEs, whichour strategy to develop new vertical products and platform integrations. We will likely mean an increase in the absolute number of claims, and an increase in the cost of claims due to inflation or other factors.
Cost of Providing Services
Cost of providing services consists primarily of costs incurred by us associated with direct client support, such as payroll and benefits processing, professional HR consultants, employee liability insurance and costs associated with assisting clients in managing, processing and responding to employment-related legal claims, benefits and risk management, postage and shipping expenses and consulting expenses. We expect our cost of providing services to continue to increase in absolute dollars on an annual basis for the foreseeable future due to expected growth in WSEs, although as we improve our systems, processes and processes, we expectinternal controls to gain efficiencies and we expect our cost of providing services as a percentage of total revenues to decline. In addition, our costs of providing services may fluctuate as a percentage of our total revenues from period to period depending on the timing of those expenses.
Sales and Marketing Expenses
Sales and marketing expenses consist primarily of salaries, commissions and related variable compensation expenses, commission payments to partners and the cost of marketing programs. Marketing programs consist of advertising, lead generation, marketing events, corporate communications, brand building and product marketing activities, as well as various incentivized partnership and referral programs. We expect our sales and marketing expenses to increase in absolute dollars at a slower rate than in the past three years as we reduce our rate of growth in our direct sales force offset by increased investments to improve our sales productivity. In addition, our sales and marketingefficiencies. These expenses may fluctuate as a percentage of our total revenues from period to period depending on the timing of those expenses.
General and Administrative Expenses
General and administrative expenses consist
|
| |
| MANAGEMENT'S DISCUSSION AND ANALYSIS | |
2015 - 2014 Commentary
Operating costs increased $60.4 million or 17% in 2015. Significant increases include:
Total compensation costs for our corporate employees increased $37.0 million primarily of compensation-related expenses, legal, accountingin
| |
| ◦ | sales and marketing function as a result of our growth in direct sales channels, primarily the addition of new sales representatives, |
| |
| ◦ | client services professionals to support the growth of our clients and WSEs, and |
| |
| ◦ | stock-based compensation costs to attract and retain our people. |
Accounting and other professional services fees and other general corporate expenses. We expect our general and administrative expenses to continue to increaseincreased $7.2 million in absolute dollars for the foreseeable future due to increases in our legal and financial compliance costs2015 including in connection with being a newly public company. As we improveimplementation of Section 404 of the Sarbanes-Oxley Act.
Consulting expenses included costs associated with consulting firms engaged in enhancing our systems, processesproduct offerings.
Costs capitalized as internally developed software increased $4.8 million in 2015 primarily associated with product delivery and internal controls we expect to gain efficienciesplatform integration initiatives.
Other expenses increased $14.9 million in 2015 and expect our generalincluded
| |
| ◦ | IT infrastructure costs to support the increased operational requirements, |
| |
| ◦ | marketing events to focus on market verticals and penetration, |
| |
| ◦ | travel expenses, meetings, recruiting expenses to support growth in sales force, and |
| |
| ◦ | broker commission costs resulted from increased revenues. |
Amortization of Intangible Assets
Amortization of intangible assets represents costs associated with acquired companies' developed technologies, client lists, trade names and administrative costscontractual agreements. Amortization expenses decreased 59% in 2016 and 25% in 2015, as a percentageresult of total revenuesthe 2016 revision to decline. In addition, these expensesthe expected useful life of certain client lists and trademarks related to our previous acquisitions and expiration of other acquisition related intangible assets.
Depreciation
Depreciation expense increased 32% in 2016 and 6% in 2015 which was a result of our continuous investment in technology products and platforms.
Other Income (Expense)
Other income (expense) consists primarily of interest expense under our credit facility and capital leases, and non-cash debt issuance cost amortization. It increased 4% in 2016 due primarily to the write-off of debt issuance costs resulting from the refinance of our term loan in July 2016; and decreased 64% in 2015 which was primarily due to lower outstanding debts. Interest expense for 2014 was significantly higher due to the acceleration of loan fee amortization resulting from our refinancing activities, and a prepayment premium related to our partial repayment of the credit facilities.
We may seek to amend our credit facility, including if available terms become more favorable. We may also seek additional borrowings to fund acquisitions or accelerate the payment of principal on outstanding debt. As such, our interest expense may fluctuate as a percentage of our total revenues from period to period depending on the timing of those expenses.
Systems Developmentborrowing and Programming Costs
Systems development and programming costs consist primarily of compensation-related expenses for our employees and contractors dedicated to systems development and programming, as well as fees that we pay to third-party consulting firms. We expect our systems development and programming costs to continue to increase in absolute dollars for the foreseeable future as we continue to invest in and improve our technology platform. Over time, we expect our systems development and programming costs to remain relatively consistent as a percentage of our total revenues on an annual basis. In addition, our systems development and programming costs may fluctuate as a percentage of our total revenues from period to period depending on when we incur those costs.
Amortization of Intangible Assets
Amortization of intangible assets represents costs associated with an acquired company’s developed technologies, client lists, trade names and contractual agreements. We amortize these intangibles over their respective estimated useful lives using either the straight-line method or the accelerated method.
Depreciation
Depreciation consists primarily of amortization of the cost of software and furniture, fixtures and equipment.
Other Income (Expense)
Other income (expense) consists primarily of interest expense under our credit facility and capital leases, debt issuance cost amortization, and a prepayment premium.repayment activities.
Provision for Income Taxes
We are subject to taxation in the United States and Canada. We conduct our business primarily in the United States, and almost all of our clients are U.S. employers with a small percentage of Canadian employers. We also provide services with respect to certain of our U.S. clients’ employees in Canada. The percentage of our total revenues attributable to WSEs in Canada was less than 1% for each of 2015 and 2014. Our effective tax rate differs from the statutory rate primarily due to state taxes, tax credits, non-deductible charges, changes in uncertain tax positions,rates (ETR) were 41.2% for 2016, 47.2% for 2015 and other discrete items. We make estimates and judgments about our future taxable income based on assumptions that are consistent with our plans and estimates. Should the actual amounts differ from our estimates, the amount of our valuation allowance could be materially affected.
Income taxes are computed using the asset and liability method, under which deferred tax assets and liabilities are determined based on the difference between the financial statement and tax bases of assets and liabilities using enacted tax rates in effect53.2% for the year in which the differences are expected to affect taxable income. Valuation allowances are established when necessary to reduce deferred tax assets to the amount expected to be realized. Changes in valuation allowances are reflected as a component of provision for income taxes.2014.
Results of Operations
The following tables set forth our results of operations for the periods presented and as a percentage of our total revenues and Net Service Revenues for those periods. Period-to-period comparisons of our financial results are not necessarily indicative of financial results to be achieved in future periods.
|
| | | | | | | | | | | |
| | Year Ended December 31, |
| | 2015 | | 2014 | | 2013 |
| | (in thousands) |
| Consolidated Statement of Operations: | | | | | |
| Professional service revenues | $ | 401,287 |
| | $ | 342,074 |
| | $ | 272,372 |
|
| Insurance service revenues | 2,258,001 |
| | 1,851,457 |
| | 1,371,903 |
|
| Total revenues | 2,659,288 |
| | 2,193,531 |
| | 1,644,275 |
|
| Costs and operating expenses: | | | | | |
| Insurance costs | 2,112,376 |
| | 1,686,315 |
| | 1,226,585 |
|
Cost of providing services (exclusive of depreciation and
amortization of intangible assets) (1) | 150,694 |
| | 134,256 |
| | 106,661 |
|
Sales and marketing (1) | 166,759 |
| | 139,997 |
| | 109,183 |
|
General and administrative (1) | 69,626 |
| | 53,926 |
| | 52,455 |
|
Systems development and programming costs (1) | 27,558 |
| | 26,101 |
| | 19,948 |
|
| Amortization of intangible assets | 39,346 |
| | 52,302 |
| | 51,369 |
|
| Depreciation | 14,612 |
| | 13,843 |
| | 11,737 |
|
| Total costs and operating expenses | 2,580,971 |
| | 2,106,740 |
| | 1,577,938 |
|
| Operating income | 78,317 |
| | 86,791 |
| | 66,337 |
|
| Other income (expense): | | | | | |
| Interest expense and bank fees | (19,449 | ) | | (54,193 | ) | | (45,724 | ) |
| Other, net | 1,142 |
| | 478 |
| | 471 |
|
| Income before provision for income taxes | 60,010 |
| | 33,076 |
| | 21,084 |
|
| Provision for income taxes | 28,315 |
| | 17,579 |
| | 7,937 |
|
| Net income | $ | 31,695 |
| | $ | 15,497 |
| | $ | 13,147 |
|
|
| |
(1)MANAGEMENT'S DISCUSSION AND ANALYSIS | Includes stock-based compensation expense as follows: |
|
| | | | | | | | | | | |
| | Year Ended December 31, |
| | 2015 | | 2014 | | 2013 |
| | (in thousands) |
| Cost of providing services | $ | 4,244 |
| | $ | 2,658 |
| | $ | 1,193 |
|
| Sales and marketing | 4,490 |
| | 2,755 |
| | 1,284 |
|
| General and administrative | 7,501 |
| | 4,517 |
| | 3,220 |
|
| Systems development and programming costs | 1,688 |
| | 1,030 |
| | 416 |
|
| Total stock-based compensation expense | $ | 17,923 |
| | $ | 10,960 |
| | $ | 6,113 |
|
|
| | | | | | | | |
| | Year Ended December 31, |
| | 2015 | | 2014 | | 2013 |
| Percentage of total revenues: | | | | | |
| Professional service revenues | 15 | % | | 16 | % | | 17 | % |
| Insurance service revenues | 85 | % | | 84 | % | | 83 | % |
| Total revenues | 100 | % | | 100 | % | | 100 | % |
| Costs and operating expenses: | | | | | |
| Insurance costs | 79 | % | | 77 | % | | 75 | % |
| Cost of providing services (exclusive of depreciation and amortization of intangible assets) | 6 | % | | 6 | % | | 6 | % |
| Sales and marketing | 6 | % | | 6 | % | | 7 | % |
| General and administrative | 3 | % | | 2 | % | | 3 | % |
| Systems development and programming costs | 1 | % | | 1 | % | | 1 | % |
| Amortization of intangible assets | 1 | % | | 2 | % | | 3 | % |
| Depreciation | 1 | % | | 1 | % | | 1 | % |
| Total costs and operating expenses | 97 | % | | 96 | % | | 96 | % |
| Operating income | 3 | % | | 4 | % | | 4 | % |
| Other income (expense): | | | | | |
| Interest expense and bank fees | (1 | )% | | (2 | )% | | (3 | )% |
| Other, net | 0 | % | | 0 | % | | 0 | % |
| Income before provision for income taxes | 2 | % | | 2 | % | | 1 | % |
| Provision for income taxes | 1 | % | | 1 | % | | 0 | % |
| Net income | 1 | % | | 1 | % | | 1 | % |
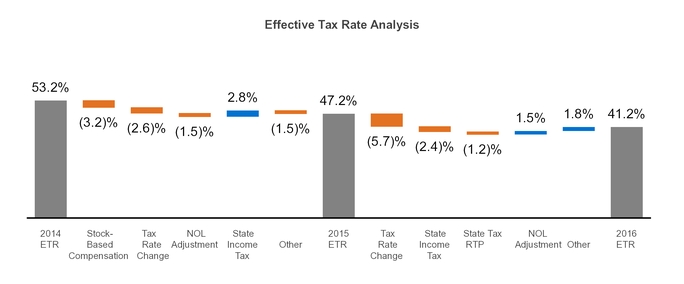
|
| | | | | | | | |
| | Year Ended December 31, |
| | 2015 | | 2014 | | 2013 |
| Percentage of Net Service Revenues: | | | | | |
| Professional service revenues | 73 | % | | 67 | % | | 65 | % |
| Net Insurance Service Revenues | 27 | % | | 33 | % | | 35 | % |
| Net Service Revenues | 100 | % | | 100 | % | | 100 | % |
| Other operating expenses: | | | | | |
| Cost of providing services (exclusive of depreciation and amortization of intangible assets) | 28 | % | | 26 | % | | 26 | % |
| Sales and marketing | 30 | % | | 28 | % | | 26 | % |
| General and administrative | 13 | % | | 11 | % | | 13 | % |
| Systems development and programming costs | 5 | % | | 5 | % | | 5 | % |
| Amortization of intangible assets | 7 | % | | 10 | % | | 12 | % |
| Depreciation | 3 | % | | 3 | % | | 3 | % |
| Total other operating expenses | 86 | % | | 83 | % | | 84 | % |
| Operating income | 14 | % | | 17 | % | | 16 | % |
| Other income (expense): | | | | | |
| Interest expense and bank fees | (4 | )% | | (11 | )% | | (11 | )% |
| Other, net | 0 | % | | 0 | % | | 0 | % |
| Income before provision for income taxes | 11 | % | | 7 | % | | 5 | % |
| Provision for income taxes | 5 | % | | 3 | % | | 2 | % |
| Net income | 6 | % | | 3 | % | | 3 | % |
Years EndedDecember 31, 2015, 2014 and 2013
Total Revenues and Key Operating Metrics
|
| | | | | | | | | | | | | | | | | | | | | | | | | |
| | Year Ended
December 31, | | Change
2015 vs. 2014 | | Change
2014 vs. 2013 |
| | 2015 | | 2014 | | 2013 | | $ | | % | | $ | | % |
| | (in thousands, except percentages) |
| Professional service revenues | $ | 401,287 |
| | $ | 342,074 |
| | $ | 272,372 |
| | $ | 59,213 |
| | 17 | % | | $ | 69,702 |
| | 26 | % |
| Insurance service revenues | 2,258,001 |
| | 1,851,457 |
| | 1,371,903 |
| | 406,544 |
| | 22 | % | | 479,554 |
| | 35 | % |
| Total revenues | $ | 2,659,288 |
| | $ | 2,193,531 |
| | $ | 1,644,275 |
| | $ | 465,757 |
| | 21 | % | | $ | 549,256 |
| | 33 | % |
| | | | | | | | | | | | | | |
| | Year Ended
December 31, | | Change
2015 vs. 2014 | | Change
2014 vs. 2013 |
| | 2015 | | 2014 | | 2013 | | $ | | % | | $ | | % |
| | (in thousands, except percentages) |
| Key operating metrics: | | | | | | | | | | | | | |
| Total WSEs | 324,399 |
| | 288,312 |
| | 231,203 |
| | 36,087 |
| | 13 | % | | 57,109 |
| | 25 | % |
| Total Sales Representatives | 481 |
| | 385 |
| | 300 |
| | 96 |
| | 25 | % | | 85 |
| | 28 | % |
Total revenues for 2015 increased by $465.8 million, or 21%, compared to 2014. Professional service revenues and insurance service revenues represented 15% and 85%, respectively, of total revenues for 2015, compared to 16% and 84%, respectively, of total revenues for 2014.
Professional service revenues increased by $59.2 million, or 17%, compared to 2014. The increase was mainly attributable to our increaseOur ETR decreased 6.0% in Total WSEs and an increase2016 from 47.2% in WSEs from verticals with higher average revenue per WSE.
Insurance service revenues for 2015 increased by $406.5 million, or 22%, compared to 2014. The increase was primarily due to our increase in Total WSEs and an increase of 5% in average insurance service revenues per WSE.
Total WSEs at December 31, 2015 increased by approximately 36,000, or 13%, compared to Total WSEs at December 31, 2014, which was primarily driven by a net increase in total clients. Our Total Sales Representatives increased from 385 at December 31, 2014 to 481 at December 31, 2015 primarily due to our efforts to grow our sales force.the following:
Total revenues for 2014 increased by $549.3 million, or 33%, compared to 2013. Professional service revenues and insurance service revenues represented 16% and 84%, respectively, of total revenues for 2014, compared to 17% and 83%, respectively, of total revenues for 2013. The increase in total revenues was5.7% decrease attributable to the significant growthrevaluation of our Total WSEs and revenuesdeferred taxes resulting from our acquisition of Ambrose Employer Group, LLC, or Ambrose,state legislative changes enacted in the third quarter of 2013, as further described below.2015,
Professional service revenues for 2014 increased $69.7 million, or 26%, compared to 2013. The increase was mainly attributable to our increase2.4% decrease in Total WSEs and our acquisition of Ambrose in third quarter of 2013, which contributed $15.4 million of professional service revenues during the first half of 2014.
Insurance service revenues for 2014 increased by $479.6 million, or 35%, compared to 2013. The increase was primarily due to our increase in Total WSEs. Additionally, our acquisition of Ambrose contributed $130.4 million of insurance service revenues during the first half of 2014.
Total WSEs at December 31, 2014 increased by approximately 57,000, or 25%, compared to Total WSEs at December 31, 2013. Our Total Sales Representatives increased from 300 at December 31, 2013 to 385 at December 31, 2014.
Insurance Costs
|
| | | | | | | | | | | | | | | | | | | | | | | | | |
| | Year Ended
December 31, | | Change
2015 vs. 2014 | | Change
2014 vs. 2013 |
| | 2015 | | 2014 | | 2013 | | $ | | % | | $ | | % |
| | (in thousands, except percentages) |
| Insurance costs | $ | 2,112,376 |
| | $ | 1,686,315 |
| | $ | 1,226,585 |
| | $ | 426,061 |
| | 25 | % | | $ | 459,730 |
| | 37 | % |
Insurance costs for 2015 increased $426.1 million, or 25%, compared to 2014. The increase resultedstate income taxes from an increase in Total WSEs, the volume and severity of medical claims being unexpectedly higher thanexcludable income for state income tax purposes,
1.2% decrease from discrete benefits recorded in 2016 associated with prior year state income tax expense resulting from a state tax return to provision (RTP) adjustment relating to audit premiums paid for worker’s compensation insurance, partially offset by a
1.5% increase from net operating loss adjustment recorded in 2015.
We anticipate our WSE growth, experience and available information would have suggested and,ETR to a lesser extent, increased workers compensation costs per WSE.
Insurance costs for 2014 increased $459.7 million,be consistent going forward provided there are no significant tax reforms enacted or 37% compared to 2013, $118.6 million of which was due toexcess tax benefits from our acquisition of Ambrose. The remaining increase resulted from an increase in Total WSEs other than those acquired from Ambrose and a 3% increase in average insurance costs per WSE other than those acquired from Ambrose.
Net Insurance Service Revenues and Net Service Revenues
|
| | | | | | | | | | | | | | | | | | | | | | | | | |
| | Year Ended
December 31, | | Change
2015 vs. 2014 | | Change
2014 vs. 2013 |
| | 2015 | | 2014 | | 2013 | | $ | | % | | $ | | % |
| | (in thousands, except percentages) |
| Insurance service revenues | $ | 2,258,001 |
| | $ | 1,851,457 |
| | $ | 1,371,903 |
| | $ | 406,544 |
| | 22 | % | | $ | 479,554 |
| | 35 | % |
| Less: Insurance costs | 2,112,376 |
| | 1,686,315 |
| | 1,226,585 |
| | 426,061 |
| | 25 | % | | 459,730 |
| | 37 | % |
| Net Insurance Service Revenues | $ | 145,625 |
| | $ | 165,142 |
| | $ | 145,318 |
| | $ | (19,517 | ) | | (12 | )% | | $ | 19,824 |
| | 14 | % |
|
| | | | | | | | | | | | | | | | | | | | | | | | | |
| | Year Ended
December 31, | | Change
2015 vs. 2014 | | Change
2014 vs. 2013 |
| | 2015 | | 2014 | | 2013 | | $ | | % | | $ | | % |
| | (in thousands, except percentages) |
| Total revenues | $ | 2,659,288 |
| | $ | 2,193,531 |
| | $ | 1,644,275 |
| | $ | 465,757 |
| | 21 | % | | $ | 549,256 |
| | 33 | % |
| Less: Insurance costs | 2,112,376 |
| | 1,686,315 |
| | 1,226,585 |
| | 426,061 |
| | 25 | % | | 459,730 |
| | 37 | % |
| Net Service Revenues | $ | 546,912 |
| | $ | 507,216 |
| | $ | 417,690 |
| | $ | 39,696 |
| | 8 | % | | $ | 89,526 |
| | 21 | % |
Our Net Insurance Service Revenues for 2015 decreased by $19.5 million, or 12%, as compared to 2014. This decrease resulted from an increase in insurance costs due to the number and size of medical claims being unexpectedly higher than our growth in insurance revenues and unexpectedly higher than our WSE growth, experience and available information would have suggested, and, to a lesser extent, increased workers compensation costs per WSE, offset in part by the increases in our insurance service revenues.
For the reasons set forth above with respect to the increase in our total revenues, offset in part by the increase in our insurance costs, our Net Service Revenues for 2015 increased by $39.7 million, or 8%, as compared to 2014.
Also for the reasons set forth above with respect to total revenues, our Net Insurance Service Revenues for 2014 increased by $19.8 million, or 14%, as compared to 2013, and our Net Service Revenues for 2014 increased by $89.5 million, or 21%, as compared to 2013.
Other Operating Expenses
|
| | | | | | | | | | | | | | | | | | | | | | | | | |
| | Year Ended
December 31, | | Change
2015 vs. 2014 | | Change
2014 vs. 2013 |
| | 2015 | | 2014 | | 2013 | | $ | | % | | $ | | % |
| | (in thousands, except percentages) |
| Cost of providing services | $ | 150,694 |
| | $ | 134,256 |
| | $ | 106,661 |
| | $ | 16,438 |
| | 12 | % | | $ | 27,595 |
| | 26 | % |
| Sales and marketing | 166,759 |
| | 139,997 |
| | 109,183 |
| | 26,762 |
| | 19 | % | | 30,814 |
| | 28 | % |
| General and administrative | 69,626 |
| | 53,926 |
| | 52,455 |
| | 15,700 |
| | 29 | % | | 1,471 |
| | 3 | % |
| Systems development and programming costs | 27,558 |
| | 26,101 |
| | 19,948 |
| | 1,457 |
| | 6 | % | | 6,153 |
| | 31 | % |
| Amortization of intangible assets | 39,346 |
| | 52,302 |
| | 51,369 |
| | (12,956 | ) | | (25 | )% | | 933 |
| | 2 | % |
| Depreciation | 14,612 |
| | 13,843 |
| | 11,737 |
| | 769 |
| | 6 | % | | 2,106 |
| | 18 | % |
| Total operating expenses | $ | 468,595 |
| | $ | 420,425 |
| | $ | 351,353 |
| | $ | 48,170 |
| | 11 | % | | $ | 69,072 |
| | 20 | % |
Cost of Providing Services2015 - 2014 Commentary
|
| | | | | | | | | | | | | | | | | | | | | | | | | |
| | Year Ended
December 31, | | Change
2015 vs. 2014 | | Change
2014 vs. 2013 |
| | 2015 | | 2014 | | 2013 | | $ | | % | | $ | | % |
| | (in thousands, except percentages) |
| Compensation-related costs | $ | 110,658 |
| | $ | 97,423 |
| | $ | 75,941 |
| | $ | 13,235 |
| | 14 | % | | $ | 21,482 |
| | 28 | % |
| Facilities | 7,585 |
| | 7,149 |
| | 5,615 |
| | 436 |
| | 6 | % | | 1,534 |
| | 27 | % |
Information technology and
communication | 9,693 |
| | 8,948 |
| | 8,482 |
| | 745 |
| | 8 | % | | 466 |
| | 5 | % |
| Other expenses | 22,758 |
| | 20,736 |
| | 16,623 |
| | 2,022 |
| | 10 | % | | 4,113 |
| | 25 | % |
| Total cost of providing services | $ | 150,694 |
| | $ | 134,256 |
| | $ | 106,661 |
| | $ | 16,438 |
| | 12 | % | | $ | 27,595 |
| | 26 | % |
Cost of providing services for 2015 increased by $16.4 million, or 12%, compared to 2014. The increase was primarily attributable to a $13.2 million increase in compensation-related costs due to increased headcount to support our growth, which includes a $1.6 million increase in stock-based compensation expense. Other expenses increased $2.0 million, or 10%, mainly in consulting costs incurred to enhance our product offering. Cost of providing services represented 6% of total revenues in each of the years ended December 31, 2015 and 2014. Cost of providing services increased to 28% of Net Service Revenues in 2015 from 26% in 2014.
Cost of providing services for 2014 increased by $27.6 million, or 26%, compared to 2013, primarily due to an increase in compensation-related costs. Compensation-related costs increased by $21.5 million, or 28%, due to increased headcount, including $4.0 million from our acquisition of Ambrose and a $1.5 million increase in stock-based compensation not related to Ambrose. Facilities-related costs increased by $1.5 million, or 27%, due to the growth of our business. Other expenses increased $4.1 million, or 25%, mainly due to increased consulting costs incurred to enhance our product offering. Cost of providing services as a percentage of total revenues and Net Service Revenues remained unchanged at 6% of total revenues and 26% of Net Service Revenues for the years ended December 31, 2014 and 2013.
Sales and Marketing
|
| | | | | | | | | | | | | | | | | | | | | | | | | |
| | Year Ended
December 31, | | Change
2015 vs. 2014 | | Change
2014 vs. 2013 |
| | 2015 | | 2014 | | 2013 | | $ | | % | | $ | | % |
| | (in thousands, except percentages) |
| Compensation-related costs | $ | 113,718 |
| | $ | 96,903 |
| | $ | 73,901 |
| | $ | 16,815 |
| | 17 | % | | $ | 23,002 |
| | 31 | % |
| Marketing and advertising | 22,097 |
| | 19,667 |
| | 15,863 |
| | 2,430 |
| | 12 | % | | 3,804 |
| | 24 | % |
| Facilities | 4,511 |
| | 3,832 |
| | 3,155 |
| | 679 |
| | 18 | % | | 677 |
| | 21 | % |
| Other expenses | 26,433 |
| | 19,595 |
| | 16,264 |
| | 6,838 |
| | 35 | % | | 3,331 |
| | 20 | % |
| Total sales and marketing | $ | 166,759 |
| | $ | 139,997 |
| | $ | 109,183 |
| | $ | 26,762 |
| | 19 | % | | $ | 30,814 |
| | 28 | % |
Sales and marketing expenses for 2015 increased by $26.8 million, or 19%, compared to 2014. Of this increase, $16.8 million was due to compensation-related costs from our growth in direct sales channels, primarily the addition of new sales representatives, which includes a $1.7 million increase in stock-based compensation expense. Marketing and advertising expenses increased $2.4 million, or 12%, primarily as a result of our effort to focus on market verticals and penetration. In order to support the growth in sales force, other expenses including travel expenses, meetings, recruiting, training and consulting increased $6.8 million for 2015, or 35% compared to 2014. Sales and marketing represented 6% of total revenues in each of the years ended December 31, 2015 and 2014. As a percentage of Net Service Revenues, sales and marketing expenses increased to 30% in 2015 from 28% in 2014 as a result of lower Net Service Revenues.
Sales and marketing expenses for 2014 increased by $30.8 million, or 28%, compared to 2013. Of this increase, $23.0 million was due to compensation-related costs, including $2.9 million from our acquisition of Ambrose and $18.3 million from our growth in direct sales channels, primarily the addition of new sales representatives, as well as a $1.5 million increase in stock based compensation. Marketing and advertising expenses increased $3.8 million, or 24%, primarily due to our acquisition of Ambrose and as a result of our effort to focus on market verticals and penetration. Other expenses increased $3.3 million, or 20%, primarily due to increased sales travel, meeting and conference activities, as well as other expenses associated with recruiting efforts and information technology. Sales and marketing expenses as a percentage of total revenues decreased to 6% for the year ended December 31, 2014 compared to 7% for the year ended December 31, 2013. As a percentage of Net Service Revenues, sales and marketing expenses increased to 28% for the year ended December 31, 2014 compared to 26% for the year ended December 31, 2013.
General and Administrative
|
| | | | | | | | | | | | | | | | | | | | | | | | | |
| | Year Ended
December 31, | | Change
2015 vs. 2014 | | Change
2014 vs. 2013 |
| | 2015 | | 2014 | | 2013 | | $ | | % | | $ | | % |
| | (in thousands, except percentages) |
| Compensation-related costs | $ | 36,694 |
| | $ | 32,697 |
| | $ | 31,934 |
| | $ | 3,997 |
| | 12 | % | | $ | 763 |
| | 2 | % |
| Legal, accounting and other professional fees | 16,798 |
| | 6,969 |
| | 6,910 |
| | 9,829 |
| | 141 | % | | 59 |
| | 1 | % |
| Other expenses | 16,134 |
| | 14,260 |
| | 13,611 |
| | 1,874 |
| | 13 | % | | 649 |
| | 5 | % |
| Total general and administrative | $ | 69,626 |
| | $ | 53,926 |
| | $ | 52,455 |
| | $ | 15,700 |
| | 29 | % | | $ | 1,471 |
| | 3 | % |
General and administrative expenses for 2015 increased by $15.7 million, or 29%, compared to 2014. Compensation-related costs increased $4.0 million compared to 2014 primarily due to a $3.0 million increase in stock-based compensation expenses. Legal, accounting and other professional fees increased $9.8 million primarily due to costs associated with the implementation of Section 404 of the Sarbanes-Oxley Act, which amounted to $5.7 million for 2015. General and administrative expenses increased to 3% as a percentage of total revenues in 2015 from 2% in 2014. As a percentage of Net Service Revenues, general and administrative expenses increased to 13% for 2015 from 11% in 2014 as a result of lower Net Service Revenues.
General and administrative expenses for 2014, increased by $1.5 million, or 3%, compared to 2013. Of these expenses, compensation-related costs increased $0.8 million compared to 2013. General and administrative expenses decreased to 2% of total revenues, or 11% of Net Service Revenues, for the year ended December 31, 2014, from 3% of total revenues, or 13% of Net Service Revenues, in the same period of the prior year as a result of efficiencies realized subsequent to our acquisitions.
Systems Development and Programming
|
| | | | | | | | | | | | | | | | | | | | | | | | | |
| | Year Ended
December 31, | | Change
2015 vs. 2014 | | Change
2014 vs. 2013 |
| | 2015 | | 2014 | | 2013 | | $ | | % | | $ | | % |
| | (in thousands, except percentages) |
| Compensation-related costs | $ | 18,826 |
| | $ | 20,766 |
| | $ | 15,493 |
| | $ | (1,940 | ) | | (9 | )% | | $ | 5,273 |
| | 34 | % |
| Other expenses | 8,732 |
| | 5,335 |
| | 4,455 |
| | 3,397 |
| | 64 | % | | 880 |
| | 20 | % |
Total systems development and
programming costs | $ | 27,558 |
| | $ | 26,101 |
| | $ | 19,948 |
| | $ | 1,457 |
| | 6 | % | | $ | 6,153 |
| | 31 | % |
Our systems development and programming costs for 2015 increased by $1.5 million, or 6%, compared to 2014. The increase was primarily due to an increase in consulting expenses to support and enhance our technology product delivery, offset by decreased compensation-related costs. Despite the increase, systems development and programming costs represented 1% of total revenues in each of the years ended December 31, 2015 and 2014. As a percentage of Net Service Revenues, systems development and programming costs represented 5% in each of the years ended December 31, 2015 and 2014.
Systems development and programming costs for 2014 increased by $6.2 million, or 31%, compared to 2013. The increase was mainly due to an increase in compensation-related costs resulting from the increase in headcount to support and enhance our technology product delivery. Despite these increases, systems development and programming costs remained unchanged at 1% of total revenues, or 5% of Net Service Revenues, for the years ended December 31, 2014 and 2013.
Amortization of Intangible Assets and Depreciation
|
| | | | | | | | | | | | | | | | | | | | | | | | | |
| | Year Ended
December 31, | | Change
2015 vs. 2014 | | Change
2014 vs. 2013 |
| | 2015 | | 2014 | | 2013 | | $ | | % | | $ | | % |
| | (in thousands, except percentages) |
| Amortization of intangible assets | $ | 39,346 |
| | $ | 52,302 |
| | $ | 51,369 |
| | $ | (12,956 | ) | | (25 | )% | | $ | 933 |
| | 2 | % |
| Depreciation | $ | 14,612 |
| | $ | 13,843 |
| | $ | 11,737 |
| | $ | 769 |
| | 6 | % | | $ | 2,106 |
| | 18 | % |
In 2015, amortization of intangible assets decreased by $13.0 million, or 25%, as a result of the expiration of useful lives of certain client lists and trademarks related to our previous acquisitions. Depreciation expense was relatively flat compared to 2014.
In 2014, amortization of intangible assets expense increased by $0.9 million, or 2%, primarily attributable to our acquisition of Ambrose in the third quarter of 2013, offset by expiration of useful lives of certain client lists and non-compete agreements related to our previous acquisitions. Depreciation expense increased by $2.1 million, or 18%, compared to 2013, primarily attributable to depreciation from our acquisition of Ambrose.
We accelerated depreciation expenses of $0.4 million, $0.9 million, and $0.8 million in the years ended December 31, 2015, 2014, and 2013, respectively, due to significant changes in the extent and manner in which certain assets were expected to be used.
Other Income (Expense)
|
| | | | | | | | | | | | | | | | | | | | | | | | | |
| | Year Ended
December 31, | | Change
2015 vs. 2014 | | Change
2014 vs. 2013 |
| | 2015 | | 2014 | | 2013 | | $ | | % | | $ | | % |
| | (in thousands, except percentages) |
| Interest expense and bank fees | $ | (19,449 | ) | | $ | (54,193 | ) | | $ | (45,724 | ) | | $ | 34,744 |
| | (64 | )% | | $ | (8,469 | ) | | 19 | % |
| Other, net | $ | 1,142 |
| | $ | 478 |
| | $ | 471 |
| | $ | 664 |
| | 139 | % | | $ | 7 |
| | 1 | % |
Other income (expense) was primarily the result of interest expense under our credit facilities. In March 2014, we repaid $216.6 million of these facilities from the proceeds of our initial public offering, or IPO, which led to lower interest expense in the year ended December 31, 2015 as a result of the lower debt level compared to the same period of the prior year. For the year ended December 31, 2015 interest expense decreased by $12.6 million and amortization of deferred issuance costs decreased by $6.2 million. Additionally, the year ended December 31, 2014 included $12.1 million in deferred issuance cost write-offs and a $3.8 million debt prepayment premium.
Provision for Income Taxes
|
| | | | | | | | | | | | | | | | | | | | | | | | | |
| | Year Ended
December 31, | | Change
2015 vs. 2014 | | Change
2014 vs. 2013 |
| | 2015 | | 2014 | | 2013 | | $ | | % | | $ | | % |
| | (in thousands, except percentages) |
| Provision for income taxes | $ | 28,315 |
| | $ | 17,579 |
| | $ | 7,937 |
| | $ | 10,736 |
| | 61 | % | | $ | 9,642 |
| | 121 | % |
| Effective Income Tax Rate | 47.2 | % | | 53.2 | % | | 37.6 | % | | | | | | | | |
Our provision for income taxes for 2015 increased by $10.7 million compared to 2014 primarily due to the increase in our pre-tax income. Our effective tax rate decreased ETR decrease from 53.2% for 2014 to 47.2% infor 2015 dueincludes:
3.2% decrease attributable to disqualifying dispositions on previously non-deductible stock-based compensation, and tax credits offset in part by increased state taxes of 2.8%
2.6% decrease due to state legislative changes. Of the $10.7 million increase, approximately $3.1 million in discrete tax expense representing 5.2% of pre-tax income is attributed to thea revaluation of deferred taxes due to a state legislative change enacted in the second quarter ended June 30, 2015.
Our provision for income taxes for 2014 increased by $9.6 million compared to 2013 primarily due to the increase in our pre-tax income and our effective tax rate increasedresulting from 37.6% for 2013 to 53.2% in 2014, primarily due to non-deductible stock-based compensation, and the revaluation of deferred taxes, based on regulatory state legislative changes enacted during the first quarter ended March 31, 2014. Of the $9.6 million increase, $2.6 million in discrete tax expense representing 7.8% of pretax income is attributed to the revaluation of deferred taxes2014,
1.5% decrease from net operating loss adjustments due to apportionment changes, partially offset by a
2.8% increase in state income taxes resulting from state legislative change. The remainder of the increase is primarily due to a release of uncertain tax positions recognized for the first quarter ended March 31, 2013.changes.
|
| |
| MANAGEMENT'S DISCUSSION AND ANALYSIS | |
Liquidity and Capital Resources
Our principal sourceLiquidity
We manage our liquidity separately between assets and liabilities that are WSE related from our corporate assets and liabilities.
WSE related assets and liabilities primarily consist of liquidity for operations is derivedcurrent assets and liabilities resulting from cash provided by operating activities. We rely on cash provided by operating activities to meet our short-term liquidity requirements, which primarily relate to the payment of corporatetransactions directly or indirectly associated with WSEs, including payroll and related taxes and withholdings, our sponsored workers' compensation and health insurance programs, and other operating costs, and capital expenditures. Our credit facilities have been used to fund acquisitions and special dividends, and we have not relied on these facilities to provide liquidity for our operations.benefit programs. Our cash flowflows related to WSE payroll and benefits is generally matched by advance collection from our clients. To minimize the credit risk associated with remitting the payroll and associated taxes and benefits costs, we require clients to prefund the payroll and related payroll taxes and benefits costs. To the extent this does not occur, our results of operations and cash flow may be negatively impacted.
WSE-related liabilities can fluctuate significantly due to various factors, including the day of the week on which a client payroll period ends, the existence of holidays at or immediately following a client payroll period-end and various federal and state compliance calendars. We report the advance collection from our clientsis reported as payroll funds collected within WSE-related assets onWSE related assets.
We reported our balance sheet. Ourcorporate cash and cash equivalents reported on ourthe consolidated balance sheet representsheets separately from WSE related assets. We rely on our corporate cash available
and cash equivalents and cash from operations to meet corporate liquidity requirements, capital spendingsatisfy our operational and expansion plans, potential acquisitions, debt serviceregulatory requirements and other corporate operating cash needs.
The following table shows ourfund capital expenditures. Our credit facilities have been primarily used to fund acquisitions. We believe that we have sufficient liquidity and capital resources for the stated periods:to satisfy future requirements and meet our obligations to clients, creditors and debt holders.
Our liquid assets are as follows:
|
| | | | | | | |
| | Year Ended December 31, |
| | 2015 | | 2014 |
| | (in thousands) |
| Cash and cash equivalents | $ | 166,178 |
| | $ | 134,341 |
|
| Working capital: |
|
| |
|
|
Corporate working capital(1) | 108,539 |
| | 116,709 |
|
| WSE-related assets, net of WSE-related liabilities | 3,889 |
| | 4,581 |
|
(1) In November 2015, the FASB issued ASU 2015-17, Balance Sheet Classification of Deferred Taxes. We elected to early adopt and retrospectively apply the provisions of the amendment. Historical amounts above are conformed to the current presentation. See Note 11 for further details. |
| | | | | | |
| | Year Ended December 31, |
| (in thousands) | 2016 | 2015 |
| Cash and cash equivalents | $ | 184,004 |
| $ | 166,178 |
|
| Working capital: |
|
|
|
|
| Corporate working capital | 151,295 |
| 108,539 |
|
| WSE related assets, net of WSE related liabilities | 5,476 |
| 3,889 |
|
We had corporate cash and cash equivalents of $166.2$184.0 million and $134.3$166.2 million as of December 31, 20152016 and 2014,2015, respectively. The increase was primarily due to the cash generated from operations during the year ended December 31, 2015.2016. We believe that our existing corporate cash and cash equivalents, working capital and cash provided by operating activities will be sufficient to meet our working capital and capital expenditure needs for at least the next 12 months.
WSE-related assets consist ofWe manage our sponsored benefit and workers' compensation insurance obligations by maintaining funds in restricted cash, cash equivalents and investments restricted for current workers compensation deductible payments, payroll funds collected, accounts receivable, unbilled revenues and refundable or prepaid amounts related to our sponsored workers compensation and health plan programs. WSE-related liabilities consist of client prepayments, wages and payroll taxes accrued and payable and liabilities related to our sponsored workers compensation and health plan programs resulting from deductible reserves and premium amounts due to providers for enrolled employees expected to be disbursed within the next 12 months.
Our working capital asset accounts consist of cash and cash equivalents, accounts receivables, prepaid assets, WSE-related assets and other current assets. Liabilities included within working capital include accounts payable, accrued expenses, WSE-related liabilities and other current liabilities and the current portion of our notes payable.as collateral. As of December 31, 2015,2016, we had $108.5 million in corporate working capital and $3.9 million in WSE-related assets net of WSE-related liabilities. Corporate working capital decreased by $8.2 million as compared to December 31, 2014 primarily due to recording a $12.7 million anticipated debt prepayment as a result of excess cash flows requirements in accordance with our credit facility. Included in WSE-related assets as of December 31, 2015 is $0.9 billion of payroll funds collected from clients, which represents cash available to settle short-term WSE-related operating liabilities. Changes in WSE-related assets and liabilities are included in operating cash flow in our consolidated statement of cash flows.
Under the terms of the agreements with our workers compensation insurance carriers, we are required to maintain collateral accounts to fund the carriers’ claim payments within our deductible layer. The collateral amount is determined at the beginning of each plan year based on estimated workers compensation wages and claim histories and the insurance carrier may adjust the balance when facts and circumstances change. As of December 31, 2015, we had $92.9$129.8 million of restricted cash, cash equivalents and investments included in WSE-relatedWSE related assets and $101.8$130.5 million of marketable securities designated as long-term restricted cash, cash equivalents and investments on the consolidated balance sheet. Our restricted marketable securities investment portfolio represents U.S. long-term treasuriessheets. These collateral amounts are generally determined at the beginning of each plan year and mutual funds.we may be required by our insurance carriers to adjust the balance when facts and circumstances change. We regularly review the collateral balances with our insurance carriers, and anticipate funding further collateral as needed based on program development.
At December 31, 2015,Capital Resources
Sources of Funds
We believe that we had approximately $499.6 million of outstanding debt undercan meet our credit facility. On July 9, 2014, we amendedpresent and restatedreasonably foreseeable operating cash needs and future commitments through existing liquid assets, continuing cash flows from operations, our first lien credit facility pursuant to an amended and restated first lien credit agreement, or the Amended and Restated Credit Agreement. The Amended and Restated Credit Agreement provides for: (i) $375 million principal amount of “tranche A term loans,” (ii) $200 million principal amount of “tranche B term loans,” and (iii) a revolving credit facility of $75 million. The tranche A term loans and the revolving credit facility will mature on July 9, 2019. The tranche B term loans will mature on July 9, 2017. Loansborrowing capacity under the revolving credit facility areand the potential issuance of debt or equity securities.
In July 2016, we refinanced our existing tranche B term loan, originally scheduled to mature in July 2017, with tranche A-2 term loans, pursuant to an amendment to the Amended and Restated First Lien Credit Agreement (Credit Agreement). As of December 31, 2016, $462.9 million of the term loans were outstanding including a $330.5 million term loan A at 3.250% per annum and $132.5 million term loan A-2 at 3.125% per annum maturing in July 2019.
We also have available a $75.0 million revolving credit facility. The total unused portion of the revolving credit facility was $59.5 million as of December 31, 2016. This revolving credit facility is expected to be used for working capital and other general corporate purposes. The repayment
|
| |
| MANAGEMENT'S DISCUSSION AND ANALYSIS | |
Uses of obligationsFunds
In 2016, we repurchased approximately 3.4 million shares of our common stock for $71.6 million. As of December 31, 2016, $60.0 million remained available for repurchase under the Amended and Restated Credit Agreement could adversely affect our liquidity if we haveprogram, which is not generated sufficient cash from our operationssubject to meet these obligations when they are due.an expiration date.
Cash Flows
We generated positive cash flows from operating activities during 2016, 2015 2014 and 2013.2014. We also have the ability to generate cash through our financing arrangements under our credit facility to meet short-term funding requirements related to WSE-related obligations.requirements. The following table showspresents our cash flows from operating activities, investing activities and financing activities for the stated periods:
| | | | Year Ended December 31, | Year Ended December 31, |
| | 2015 | | 2014 | | 2013 | |
| | (in thousands) | |
| (in thousands) | | 2016 | 2015 | 2014 |
| Net cash provided by (used in): | | | | | | | |
| Operating activities | $ | 130,599 |
| | $ | 151,899 |
| | $ | 100,721 |
| $ | 144,532 |
| $ | 130,599 |
| $ | 151,899 |
|
| Investing activities | (37,689 | ) | | (45,427 | ) | | (212,438 | ) | (27,122 | ) | (37,689 | ) | (45,427 | ) |
| Financing activities | (60,752 | ) | | (66,372 | ) | | 142,377 |
| (99,371 | ) | (60,752 | ) | (66,372 | ) |
| Effect of exchange rates on cash and cash equivalents | (321 | ) | | (115 | ) | | (53 | ) | (213 | ) | (321 | ) | (115 | ) |
| Net increase in cash and cash equivalents | $ | 31,837 |
| | $ | 39,985 |
| | $ | 30,607 |
| $ | 17,826 |
| $ | 31,837 |
| $ | 39,985 |
|
Cash Flows from Operating Activities
NetComponents of net cash provided by operating activities was $130.6 million, $151.9 million and $100.7 million for the years ended December 31, 2015, 2014 and 2013, respectively. Historically, cash provided by operating activities has been affected by our net income, adjusted for non-cash expense items (suchare as depreciation, amortization of intangible assets, deferred income taxes, and expense associated with stock-based compensation) andfollows:
|
| | | | | | | | | |
| | Year Ended December 31, |
| (in thousands) | 2016 | 2015 | 2014 |
| Operating income | $ | 123,958 |
| $ | 78,317 |
| $ | 86,791 |
|
| Depreciation and amortization | 39,175 |
| 52,817 |
| 84,403 |
|
| Stock-based compensation expense | 26,497 |
| 17,923 |
| 10,960 |
|
| Payment of interest | (15,420 | ) | (15,224 | ) | (32,051 | ) |
| Income taxes (payments) refunds, net | (39,285 | ) | (2,005 | ) | 3,809 |
|
| Collateral (paid to) refunded from insurance carriers, net | (25,057 | ) | 9,918 |
| (8,408 | ) |
| Changes in deferred taxes | 41,772 |
| 14,954 |
| 43,842 |
|
| Changes in other operating assets and liabilities | (2,469 | ) | (5,431 | ) | (27,784 | ) |
| Excess tax benefits from equity incentive plan activity | (4,639 | ) | (20,670 | ) | (9,663 | ) |
| Net cash provided by operating activities | $ | 144,532 |
| $ | 130,599 |
| $ | 151,899 |
|
The period to period fluctuation in changes in working capital accounts. The fluctuation in our working capital accounts wasother operating assets and liabilities is primarily driven by WSE-relatedtiming of payments related to WSE related assets and liabilities, deferred taxesour accounts payable and increased workersaccrued expenses related to our trade creditors, and corporate employee compensation liabilities.related payables.
Cash Flows from
|
| |
| MANAGEMENT'S DISCUSSION AND ANALYSIS | |
Investing Activities
Net cash used in investing activities was $37.7 million in 2015, as compared to $45.4 million in 2014 and $212.4 million in 2013. In 2015, we invested $41.9 million in debt securities and collected $27.6 million on maturing of debt securities, compared to investing $24.9 million in debt securities in 2014. Investments to purchase property and equipment were $18.6 million for 2015 compared to $20.6 million for the same period of 2014. In 2015, we used $4.8 million for an acquisition of a business, while there were no such acquisitions in 2014. In 2013, we used $195.0 million (netprimarily consists of cash acquired)paid for capital expenditures, and purchases of investments, offset partially by proceeds from the acquisitionsales of Ambrose.investments.
|
| | | | | | | | | |
| | Year Ended December 31, |
| (in thousands) | 2016 | 2015 | 2014 |
| Capital expenditures: | | | |
| Software and hardware | $ | 30,677 |
| $ | 12,830 |
| $ | 13,798 |
|
| Office furniture, equipment and leasehold improvements | 8,973 |
| 5,727 |
| 5,363 |
|
| Cash used in capital expenditures | $ | 39,650 |
| $ | 18,557 |
| $ | 19,161 |
|
| | | | |
| Investments: | | | |
| Purchases of restricted investments | $ | (14,959 | ) | $ | (41,939 | ) | $ | (24,875 | ) |
| Proceeds from maturity of restricted investments | 27,787 |
| 27,557 |
| — |
|
| Cash provided by (used in) investments | $ | 12,828 |
| $ | (14,382 | ) | $ | (24,875 | ) |
Our most significant capital expenditures have been investments in our software and hardware to introduce new products, enhance existing products and platforms, as well as platform integrations. In 2016, we introduced TriNet Technology, TriNet Nonprofit, and TriNet Financial Services vertical products. In addition, we completed integrating our legacy Accord and Ambrose platforms into the TriNet platform. We expect such capital investment will continue in the future.
We invest cash held as collateral to satisfy our long-term obligation towards the workers' compensation liabilities in U.S. long-term treasuries and mutual funds. Such investments are classified as available for sale investments and included as restricted cash, cash equivalents and investments in the balance sheet. The amount of investment and the anticipated holding period is reviewed regularly in conjunction with our estimated long-term workers' compensation liabilities and anticipated claims payment trend.
Financing Activities
Net cash used in financing activities was $60.8 million in 2015, compared to $66.4 million in 2014consisted primarily of repayment of debt and $142.4 million provided by financing activities in 2013. Net cash used in financing activities during 2015 consisted of $45.3 million in loan repayments and $48.4 million in stock repurchases offset by excess tax benefit of $20.7 million from equity incentive plan activity, $7.2 million received in connection with the exercise of stock options and $5.3 million in proceeds from issuance of our common stock, forpartially offset by proceeds from new borrowings and exercises of stock options.
Historically we funded business acquisitions and special dividends through borrowings under credit facilities which may fluctuate from period to period. We may seek to amend the current credit facilities as they expire, as needed by the business or if market conditions become more favorable, with interest rates or terms that may not necessarily be more favorable than the current interest rates or terms.
The board of directors from time to time authorizes stock repurchases of our outstanding common stock in order to offset dilution from the issuance of stock under our equity-based incentive plan and employee stock purchase plan. Net cash usedRefer to Note 9 in financing activities during 2014 was largely attributable to $273.6 million in loan repayments, $15.0 million in common stock repurchases and $11.1 million in paymentsItem 8 of this Form 10-K for debt issuance costs, offset by $217.8 million of net proceeds received from the issuance of common stock in our IPO, $2.2 million received in connection with the exercise of stock options and $3.4 million in proceeds from issuancedetails of our common stock for the employee stock purchase plan. Net cash provided by financing activities during 2013 was largely attributable to our borrowing of $970.0 million under our credit facility and receipt of $7.1 million in proceeds from stock option exercises, offset by $451.7 million in repayments of notes payable, the payment of a $357.6 million special dividend, $6.0 million in common stock repurchases and the payment of $25.7 million in debt issuance costs.
2014 Credit Facility
In August 2013, we, as guarantor, our subsidiary TriNet HR Corporation, as borrower, and certain of our other subsidiaries as subsidiary guarantors entered into two senior secured credit facilities: (i) a $705.0 million first lien credit facility with JPMorgan Chase Bank, N.A., as administrative agent, and (ii) a $190.0 million second lien credit facility with Wilmington Trust, National Association, as administrative agent. Proceeds from our IPO were used to fully repay the $190.0 million second lien credit facility, which resulted in a prepayment premium of $3.8 million, and to repay $25.0 million of the first lien credit
tranche B-1 term loan. Additionally, the remaining balance of the loan fees associated with the second lien credit facility and a portion of the loan fees associated with the first lien credit facility were fully amortized in March 2014 for a charge of $5.0 million. In July 2014, we amended and restated our first lien credit facility pursuant to an amended and restated first lien credit agreement, or the Amended and Restated Credit Agreement.
The Amended and Restated Credit Agreement provides for: (i) $375 million principal amount of “tranche A term loans,” (ii) $200 million principal amount of “tranche B term loans,” and (iii) a revolving credit facility of $75 million, which we refer to as the revolving credit facility. The proceeds of the tranche A term loans were used to refinance in part the tranche B-2 term loans outstanding under the original first lien credit facility. The proceeds of the tranche B term loans were used to (i) refinance the remaining tranche B-2 term loans outstanding under the original first lien credit facility, (ii) refinance other amounts outstanding under the original first lien credit facility and (iii) pay fees and expenses related thereto. The revolving credit facility replaced the revolving credit facility under the original first lien credit facility. The $75.0 million revolving credit facility includes capacity for a $40.0 million letter of credit facility and a $10.0 million swingline facility. The total unused portion of the revolving credit facility was $59.5 million as of December 31, 2015.equity plans. As of December 31, 2015, we had $499.62016, approximately $60.0 million in outstanding indebtedness under the Amended and Restated Credit Agreement, all of which was secured indebtedness of our subsidiary, TriNet HR Corporation, guaranteed on a senior secured basis by us and certain of our subsidiaries.remained available for repurchase.
|
| | | | | | | | | |
| | Year Ended December 31, |
| | 2016 | 2015 | 2014 |
| Shares repurchased under the plan | 3,414,675 |
| 1,895,625 |
| 490,419 |
|
| Amounts (in thousands) | $ | 71,604 |
| $ | 48,364 |
| $ | 15,009 |
|
In connection with the Amended2014, we received $216.8 million net proceeds from our IPO and Restated Credit Agreement, we incurred $11.1 millionit was used to pay off a portion of debt issuance costs. We deferred $8.0 million of the costs, which are being amortized over the term of thethen outstanding credit facility. The remaining $3.1 million of costs were recorded to interest expense and bank fees. Additionally, we recorded a $9.0 million loss on extinguishment of debt to write-off deferred issuance costs associated with the original first lien credit facility, which was also recorded to interest expense and bank fees. The remaining $6.1 million of loan fees associated with the previous facility were deemed to be modified and continue to be amortized over the revised remaining term of the Amended and Restated Credit Agreement.facilities.
|
| |
| MANAGEMENT'S DISCUSSION AND ANALYSIS | |
Covenants
The tranche A term loans and the revolving credit facility will mature on July 9, 2019. The tranche B term loans will mature on July 9, 2017. Loans under the revolving credit facility are expected to be used for working capital and other general corporate purposes.
The tranche A term loans and loans under the revolving credit facility bear interest, at our option, at a rate equal to either the LIBOR rate, plus an applicable margin equal to 2.75% per annum, or the prime lending rate, plus an applicable margin equal to 1.75% per annum. The applicable margins for the tranche A term loans and loans under the revolving credit facility are subject to specified rate adjustments of 0.25% based upon our total leverage ratio. The tranche B term loans bear interest, at our option, at a rate equal to either the LIBOR rate, plus an applicable margin equal to 2.75% per annum or the prime lending rate, plus an applicable margin equal to 1.75% per annum. We are required to pay a commitment fee of 0.50%, subject to decrease to 0.375% based on our total leverage ratio, on the daily unused amount of the commitments under the revolving credit facility, as well as fronting fees and other customary fees for letters of credit issued under the revolving credit facility.
We are permitted to make voluntary prepayments at any time without payment of a premium, except that a 1% premium would apply to a repricing of the tranche B term loans effected on or prior to the six-month anniversary of the effective date for the amendment and restatement of our credit facility. We are required to make mandatory prepayments of term loans (without payment of a premium) with (i) net cash proceeds from issuances of debt (other than certain permitted debt), (ii) net cash proceeds from certain non-ordinary course asset sales and casualty and condemnation proceeds (subject to reinvestment rights and other exceptions), and (iii) beginning with the fiscal year ending December 31, 2015, 50% of our excess cash flow (subject to decrease to (x) 25% if our total leverage ratio as of the last day of such fiscal year is less than 3.75 to 1.0 and equal to or greater than 3.00 to 1.0, and (y) 0% if our total leverage ratio as of the last day of such fiscal year is less than 3.00 to 1.0), provided that we may defer prepayments based on excess cash flow to the extent such payments would result our GAAP working capital being less than $10 million (after giving effect to such prepayments). We recorded a current liability of $12.7 million at December 31, 2015 in anticipation of this prepayment.
The tranche A term loans will be repaid in equal quarterly installments in an aggregate annual amount equal to: (i) beginning on December 31, 2014 to December 31, 2016, 5% of the original principal amount thereof, (ii) beginning on December 31, 2016 to December 31, 2018, 7.5% of the original principal amount thereof, and (iii) beginning on December 31, 2018 to June 30, 2019, 10% of the original principal amount thereof with any remaining balance payable on the final maturity date of the tranche A term loans. The tranche B term loans will be repaid in equal quarterly installments in an aggregate annual amount equal to 1% of the principal amount thereof, with any remaining balance payable on the final maturity date of the tranche B term loans.
Our credit facilityCredit Agreement contains customary representations and warranties and customary affirmative and negative covenants applicable to us and our subsidiaries, including, among other things, restrictions on indebtedness, liens, investments, mergers,
dispositions, prepayment of other indebtedness, and dividends and other distributions. Our credit facilitysubsidiaries. It also contains financial covenants that require us to maintainmaintain: (1) a minimum consolidated interest coverage ratio of at least 3.50 to 1.00 and (2) a maximum total leverage ratio.ratio of 4.25 to 1.00 through December 31, 2016, 3.75 to 1.00 through December 31, 2017 and 3.50 to 1.00 thereafter. As of December 31, 2016, we were in compliance with these financial covenants.
In order to meet various states’ licensing requirements and maintain accreditation by the ESAC, we are subject to various minimum working capital and net worth requirements. As of December 31, 2016 and 2015, we believe we have fully complied in all material respects with all applicable state regulations regarding minimum net worth, working capital and all other financial and legal requirements. Further, we have maintained positive working capital throughout each of the periods covered by the financial statements.
Contractual Obligations and Commitments
The following table summarizes our significant contractual obligations and commercial commitments as of December 31, 2015, and the effect they are expected to have on our liquidity and capital resources (in thousands):2016:
|
| | | | | | | | | | | | | | | | | | | |
| | Payments Due by Period |
| | Total | | Less than 1 year | | 1-3 years | | 3-5 years | | More than 5 years |
| Long-term debt obligations | $ | 499,563 |
| | $ | 35,289 |
| | $ | 192,399 |
| | $ | 271,875 |
| | $ | — |
|
| Interest on debt obligations | 53,078 |
| | 17,597 |
| | 29,144 |
| | 6,337 |
| | — |
|
| Workers compensation liabilities | 198,274 |
| | 70,888 |
| | 46,218 |
| | 23,077 |
| | 58,091 |
|
| Capital lease obligations | 268 |
| | 82 |
| | 145 |
| | 41 |
| | — |
|
| Operating lease obligations | 50,323 |
| | 11,882 |
| | 20,072 |
| | 15,762 |
| | 2,607 |
|
| Purchase obligations | 14,116 |
| | 8,587 |
| | 5,529 |
| | — |
| | — |
|
| Uncertain tax positions | 616 |
| | 18 |
| | 598 |
| | — |
| | — |
|
| Total | $ | 816,238 |
| | $ | 144,343 |
| | $ | 294,105 |
| | $ | 317,092 |
| | $ | 60,698 |
|
|
| | | | | | | | | | | | | | | |
| | Payments Due by Period |
| (in thousands) | Total | Less than 1 year | 1-3 years | 3-5 years | More than 5 years |
Debt obligations (1) | $ | 503,323 |
| $ | 53,715 |
| $ | 449,608 |
| $ | — |
| $ | — |
|
Workers' compensation obligations (2) | 277,853 |
| 96,110 |
| 84,678 |
| 35,726 |
| 61,339 |
|
Operating lease obligations (3) | 64,644 |
| 15,274 |
| 25,649 |
| 16,839 |
| 6,882 |
|
Purchase obligations (4) | 11,505 |
| 5,078 |
| 6,427 |
| — |
| — |
|
| Total | $ | 857,325 |
| $ | 170,177 |
| $ | 566,362 |
| $ | 52,565 |
| $ | 68,221 |
|
Long-term debt obligations(1) Includes principal and interest on debt obligations reflect the terms of the Amended and Restated Credit Agreement discussed above. The projected interest payments incorporate the forward LIBOR curve as of December 31, 2015.our term loans, see Note 8 in Item 8 of this Form 10-K for details.
Workers compensation liabilities represented in the table above are considered contractual obligations because they represent the(2) Represents estimated payments that willare expected to be made to carriers for various workers' compensation program under the various workers compensation programs.contractual obligations. These obligations include the costs of reimbursing the carriers for paying claims within the deductible layer in accordance with workersthe workers' compensation insurance policiespolicy as well as premiums and other liabilities. Workers compensation claim liabilities include estimates for reported claims, plus estimates for claims incurred but not reported,
(3) Includes various facilities and estimates of certain expenses associated with processing and settling the claims. These estimates are subject to significant uncertainty. The actual amount to be paid is not finally determined until we reach a settlement with the insurance carrier. Final claim settlements may vary significantly from the present estimates, particularly because many claims will not be settled until well into the future. In estimating the timing of future payments by year, we have assumed that our historical payment patterns will continue. However, the actual timing of future payments could vary materially from these estimates due to, among other things, changes in claim reporting and payment patterns and large unanticipated settlements.equipment leases under various operating lease agreements.
(4) Our purchase obligations primarily consist of software licenses, maintenance agreements and maintenance, sales and marketing events and professional and consulting fees. These are associated with agreements that we believe are enforceable and legally binding and that specify all significant terms, including fixed or minimum servicespertaining to be used, fixed, minimum or variable price provisions, and the approximate timing of the transaction.
To support our growth and expansion, we may lease additional office space. Many of our operating lease agreements provide us with the option to renew. Our future operating lease obligations would change if we exercised these options and if we entered into additional operating lease agreements as we expand our operations.various contractual agreements.
In the normal course of business, we make representations and warranties that guarantee the performance of services under service arrangements with clients. Historically, there hashave been no material losses related to such guarantees. In addition, in connection with our initial public offering,IPO, we have entered into indemnification agreements with our officers and directors, which require us to defend and, if necessary, indemnify these individuals for certain pending or future legal claims as they relate to their services provided to us. Such indemnification obligations are not included in the table above.
The uncertain tax positions disclosed in the table above exclude certain tax credit related reservesOff-Balance Sheet Arrangements
As of December 31, 2016, we did not have any material off-balance sheet arrangements that we net with tax credit carryforwards. The reserveare reasonably likely to have a current or future effect on these tax credits does not represent a contractual obligationour financial condition, results of operations, liquidity, capital expenditures or commitment because the associated tax credits have not been utilized to offset our tax liability.capital resources.
|
| |
| MANAGEMENT'S DISCUSSION AND ANALYSIS | |
Critical Accounting Policies,Judgments and Estimates and Judgments
Our consolidated financial statements are prepared in accordance with GAAP. The preparation of financial statements in conformity withU.S. GAAP, requires managementwhich require us to make estimates, judgments, and assumptions that affect certain reported amounts of assets, liabilities, revenues and disclosures. These estimates include, but are not limited to, allowances for accounts receivable, workers compensationexpenses, and the related disclosures of contingent assets and liabilities, health plan assets and liabilities, recoverability of goodwill and other intangible assets, income taxes, stock-based compensation and other contingent liabilities. SuchThese estimates are based on historical experience and on various other assumptions that Company management believeswe believe to be reasonable under the circumstances. Actual results could differ significantly from our estimates.Some of the assumptions are highly uncertain at the time of estimation. To the extent that there are material differences between these estimates and actual results, our future financial statement presentation, financial condition, results of operations and cash flows will be affected.
The following accounting policies are critical and/or require significant judgments and estimates inexperience differs from the preparation ofassumptions used, our consolidated financial statements.statements could be materially affected. For additional information about our accounting policies, refer to Note 1 in Item 8 of this Form 10-K.
Revenue RecognitionRecent Accounting Pronouncements
Professional service revenues represent fees chargedRefer to clientsNote 1 in Item 8 of this Form 10-K for co-employment services including processing HR transactions such as payroll payments and remitting employment tax withholding amounts, providing accessadditional information related to our HR expertise, including HR templates, best practices, and interactions with our HR professionals, providing labor, employment and benefit law compliance services to assist clients in avoiding or reducing liability and exposure and providing additional services, including recruiting or other services, to support various stages of our clients’ growth based on either a fixed fee per WSE per month or per transaction, or a percentage of WSEs’ payroll. We recognize professional service revenues in the period the services are rendered and earned under service arrangements with clients where service fees are fixed or determinable and collectability is reasonably assured.recent accounting pronouncements.
Insurance service revenues consistLoss Reserves
We have purchased fully-insured workers' compensation and health benefits coverage for our employees and WSEs. As part of insurance-related billingsthese insurance policies, we bear claims costs up to a defined deductible amount and administrative fees collected from clientsas a result, we establish insurance reserves including both known and withheld from WSEsincurred but not reported (IBNR) costs. As workers' compensation costs for TriNet-sponsored, risk-based, fully-insured insurance plans provided through third-party insurance carriers, primarily employee health benefit plans and workers compensation insurance. We recognize insurance service revenues ina particular period are not known for many years after the period amounts are due and collectability is reasonably assured.
The professional service revenues and insurance service revenues are each considered separate units of accounting and the associated fees and insurance premiums are billed as such for the majority oflosses have occurred these loss reserves represent our clients. For clients billed through a bundled invoice, the selling price of significant deliverables is determined based on the best estimate of selling price.
We are not the primary obligor for payrollunpaid claim losses and payroll tax payments and therefore these payments are not reflected as either revenue or expense. The gross payroll and payroll tax payments made on behalf of our clients, combined, were $30.6 billion, $25.6 billion and $17.6 billion for the years ended December 31, 2015, 2014, and 2013, respectively.
We record a liability relating to work performed by WSEs but unpaid at the end of each period in the period in which the WSE performs work along with the related receivable for the same period. We generally charge an upfront non-refundable set-up fee for which the performance of such services is not a discrete earnings event and therefore the revenue is recognized on a straight-line basis over the estimated average client tenure.
Insurance Costs
Insurance costs include insurance premiums paid to the third-party insurance carriers for insurance coverage for our clients and WSEs and the reimbursements paid to the insurance carriers and/or third-party administrators for claims payments made by them on our behalf within our insurance deductible layer, where applicable.
Workers Compensation Insurance Reserves
We establish workers compensation insurance reserves to provide for our estimated ultimate costs of reimbursing our workers compensation insurance carriers and third-party administrators for paying claims on our behalfloss adjustment expenses within the deductible layer in accordance with workers compensationour insurance policies. These reserves include estimates for reported losses, plus amounts for those claims not yet reported,
We have appointed external actuaries to evaluate, review and recommend estimates of certain expenses incurredour workers' compensation and health benefits loss reserves. The loss reserve studies performed by our carriersthese qualified actuaries analyze historical claims data to develop a range of potential ultimate losses using loss development, expected loss ratio and third-party administratorsfrequency/severity methods in accordance with Actuarial Standards of Practice. Loss methods are applied to classes or segments of the loss data organized by policy year and risk class.
Key judgments and evaluations in arriving at loss estimates by segment and the reserve selection overall include:
the selection of models used and the relative weights given to selection model used for each policy year,
the underlying assumptions of loss development factor (LDF) used in these models,
the effect of any changes claims handling processes,
evaluation of loss (medical and indemnity) cost trends, costs from changes in the courserisk exposure being evaluated and any applicable changes in legal, regulatory or judicial environment.
We review and evaluate these judgments and the associated recommendations in concluding the adequacy of processingloss reserves. Where adjustments are necessary these are recorded in the period in which the adjustments are identified.
Workers' Compensation Loss Reserves
Under our policies, we are responsible for reimbursing the insurance carriers for workers' compensation losses up to $1 million per claim occurrence (Deductible Layer). We use external actuaries to evaluate, review and settlingrecommend workers' compensation loss reserves on a quarterly basis. The data is segmented by class and state and analyzed by policy year; states where we have small exposure are aggregated into a single segment.
We use a combination of loss development, expected loss ratio and frequency/severity methods which include the claims. In establishing our workers compensation insurance reserves, we use an independent actuarial estimate of undiscounted future cash payments that would be made to settle the claims.following inputs, assumptions and analytical techniques:
In estimating these reserves, we utilize ourTriNet historical loss experience, exposure data and actuarial judgment, together with a rangeindustry loss experience,
inputs of inputs that are primarily based upon the WSEs’ job responsibilities theirand location, the
historical frequency and severity of workersworkers' compensation claims, and
an estimate of future cost trends. Alltrends to establish expected loss ratios for subsequent accident years,
expected loss ratios for the latest accident year or prior accident years, adjusted for the loss trend, the effect of these components can materially impact the reserves as reported in our consolidated financial statements. For each reporting period, we incorporaterate changes in the actuarial assumptions resulting from changes in our actual claims experience and other trends into our workers compensation claims cost estimates. Accordingly, finalquantifiable factors, and
loss development factors to project the reported losses for each accident year to an ultimate basis.
|
| |
| MANAGEMENT'S DISCUSSION AND ANALYSIS | |
Final claim settlements may vary materially from the present estimates, particularly when those payments may not occur until well into the future.
We review the adequacy of In our workersexperience, plan years related to workers' compensation insuranceprograms may take 10 years or more to be fully settled. Certain assumptions used in estimating these reserves on a quarterly basis. We reflect adjustments to previously establishedare highly judgmental. Our loss reserves, in our results of operations for the period in which the adjustments are identified. These adjustmentsand financial condition can be significant, reflecting any variety of new and adverse or favorable trends. Any unexpected increases in the severity or frequency of claims could harm our operating results.
We do not discount loss reserves accrued under these programs. We record claim costs that we expect to be paid within one year as accrued workers compensation costs and include them in worksite employee related liabilities or short term worksite related assetsmaterially impacted if funds are held by third parties to cover the claims, and we include costs that we expect to be paid beyond one year in long-term liabilities or long term workers compensation receivables if funds are held by third parties to cover the claims on our consolidated balance sheets. Assets held by third parties to cover claim liabilities remain restricted until the plan year to which they relate are settled.
At policy inception, we estimate annual workers compensation costs based on projected wages over the duration of the policy period. As actual wages are realized, the amounts paid for premiums may differexperience differs from the estimates we record, creating an asset or liability throughout the policy year. These differences can have a material effect on our consolidated financial position and results of operations.assumptions used in establishing these reserves.
Health Benefits InsuranceLoss Reserves
We establishsponsor and administer a number of fully-insured, risk based employee benefit plans, including group health, benefitsdental, vision and life insurance reservesas an employer plan sponsor under section 3(5) of the ERISA. Approximately 62% by premium of our 2016 policies relate to provide for our estimated costs of reimbursingfully-insured policies where we reimburse our health benefits insurance carriers and third-party administratorsinsurers for paying claims incurred within oura per person deductible layer in accordance with healthup to a maximum aggregate exposure limit per policy. These deductible dollar limits and maximum limits vary by carrier and year.
Costs covered by these insurance policies. Theseplans generally develop on average within three to six months so loss reserves include estimates forof reported losses plus amounts for thoseand claims incurred but not yet paid. We determine ourpaid (IBNP). Data is segmented and analyzed by insurance carrier.
To estimate health benefits insuranceloss reserves based uponwe use a number of factors, including actuarial calculations, our currentinputs, assumptions and analytical techniques:
TriNet historical loss claims payment patterns,
per employee per month claims costs, and
plan enrollment and medical trend rates. We record these
These reserves within health benefits payable and include themmay vary in WSE-related liabilities on our consolidated balance sheets.
Under certain contracts, based on plan performance, we may be entitled to receive refunds of premiums that we pay to our health benefits insurance carriers. We estimate these refunds based on our premium and claims data and recordsubsequent quarters from the prepaid health plan assets within WSE-related assets on our consolidated balance sheets. These prepaid health plan assets require our management to make assumptions and to apply judgment based on actuarial assumptions, claim history, medical trends and other industry-specific factors. If actual results are not consistent with our estimates or assumptions, it could harm our financial condition and results of operations.
We review the adequacy of our health benefits insuranceamount estimated. Our loss reserves, on a quarterly basis. We reflect adjustments to previously established reserves in our results of operations for the period in which the adjustments are identified. These adjustmentsand financial condition can be significant, reflecting any variety of new and adverse or favorable trends. Any unexpected increases in the severity or frequency of claims could harm our operating results.
Goodwill and Other Intangible Assets
Our goodwill and identifiable intangible assets with indefinite useful lives are not amortized, but instead are tested for impairment annually in the fourth quarter or when an event occurs or circumstances change in a way to indicate that there has been a potential decline in the fair value of the reporting unit. Impairment is determined by comparing the estimated fair value of the reporting unit to its carrying amount, including goodwill. Our business is largely homogeneous and, as a result, all the goodwill is associated with one reporting unit. Annually, we perform a qualitative assessment to determine whether it is more likely than not that the fair value of the reporting unit has declined below carrying value. This assessment requires significant management judgment to evaluate the impact of various financial, macroeconomic, industry, and reporting unit specific qualitative factors.
Intangible assets with finite useful lives include purchased client lists, trade names, developed technologies and contractual agreements. Fair value of our intangible assets acquired in business combinations are corroborated using appraisals that are performed by independent third-party valuation firms. The assumptions utilized to determine the fair value of our intangible assets requires management’s assessment of various factors including business strategies and future expectations. Intangible assets are amortized over their respective estimated useful lives using either the straight-line method or an accelerated method, ranging from two to five years. Intangible assets are reviewed for indicators of impairment at least annually and evaluated for impairment whenever events or changes in circumstances indicate that the carrying amount of an asset may not be recoverable.
These types of analyses contain uncertainties requiring management to make assumptions and to apply judgment to estimate industry economic factors and the profitability of future business strategies. It is our policy to conduct impairment testing based on our current business strategy in light of present industry and economic conditions, as well as our future expectations. We do not believe that there is a reasonable likelihood that there will be a material change in the future estimates or assumptions we use to test for impairment losses for goodwill and other intangible assets. However,materially impacted if actual results are not consistent with our estimates or assumptions, we may be exposed to an impairment charge that could be material.
Impairment of Long-Lived Assets
Long-lived assets, such as property, equipment and capitalized internal use software subject to amortization, are reviewed for impairment whenever events or changes in circumstances indicate that the carrying amount of an asset may not be recoverable such as: (i) a significant adverse change in the extent or manner in which it is being used or in its physical condition, (ii) a significant adverse change in legal factors or in business climate that could affect its value, or (iii) a current-period operation or cash flow loss combined with a history of operating or cash flow losses or a projection or forecast that demonstrates continuing losses associated with its use.
An asset is considered impaired if the carrying amount exceeds the undiscounted future net cash flows the asset is expected to generate. An impairment charge is recognized for the amount by which the carrying amount of the assets exceeds its fair value. The adjusted carrying amount of the asset becomes its new cost basis. For a depreciable long-lived asset, the new cost basis will be depreciated or amortized over the remaining useful life of that asset. Assets to be disposed of are reported at the lower of the carrying amount or fair value, less selling costs.
Our impairment loss calculations contain uncertainties which require management to make assumptions and to apply judgment to estimate future cash flows and asset fair values, including forecasting useful lives of the assets and selecting the discount rate that reflects the risk inherent in future cash flows.
Stock-Based Compensation
We have historically issued two types of stock-based awards to employees: restricted stock units and stock options. Compensation expense associated with restricted stock units is based on the fair value of our common stock on the grant date. Compensation expense associated with stock options is based on the estimated grant date fair value method using the Black-Scholes valuation model. Expense is recognized, net of estimated forfeitures, using a straight-line amortization method over the respective vesting period for awards during which the employee is required to perform service in exchange for such award.
Our option-pricing model requires the input of highly subjective assumptions, including the fair value of our common stock (prior to our IPO), the expected term of the option, the expected volatility of the price of our common stock, risk-free interest rates and the expected dividend yield of our common stock as follows:
Prior to our IPO in March 2014, because our common stock was not publicly traded, we estimated the fair value of our common stock. Our board of directors considered numerous objective and subjective factors to determine the fair market value of our common stock at each meeting at which awards were granted and approved. These factors included, but were not limited to: (i) contemporaneous third-party valuations of our common stock; (ii) our performance, growth rate, financial condition and future financial projections; (iii) the value of our peer companies; (iv) changes to our business and our prospects; (v) lack of marketability of our common stock; (vi) the likelihood of achieving a liquidity event; and (vii) the rights, preferences and privileges of our preferred stock relative to those of our common stock. After the completion of our IPO, the fair value of our common stock has been based on the closing price of our common stock on the New York Stock Exchange.
Risk-free interest rate is based on the implied yield available on U.S. Treasury zero-coupon issues with an equivalent remaining term of the options.
Expected term represents the period that our share-based awards are expected to be outstanding. We estimated the expected term for a “plain vanilla” option using the simplified method allowed under current guidance, which uses the midpoint between the graded vesting period and the contractual termination date.
Expected volatility is determined by taking the average historical volatilities of our peer group based on daily price observations over a period equivalent to the expected term of the option. Our peer group consists of public companies primarily in HR service industry and are similar to us in size, stage of life cycle, and financial leverage. We intend to continue to consistently apply this process using the same or similar public companies until a sufficient amount of historical information regarding the volatility of our own common stock share price becomes available, or unless circumstances change such that the identified companies are no longer similar to us, in which case, more suitable companies whose share prices are publicly available would be utilized in the calculation.
We declared special dividends in May 2011, March 2012, August 2013 and December 2013. These dividends are considered extraordinary and non-recurring. Consequently, we used an expected dividend yield of zero.
We estimate forfeitures based on historical forfeitures of equity awards and adjust the rate to reflect voluntary termination behaviors as well as trends of actual forfeitures. We will continue to evaluate our estimated forfeiture rate if actual forfeitures differexperience differs from our initial estimates. Quarterly changeskey assumptions used in the estimated forfeiture rate can have a significant impact on our share-based compensation expense as the cumulative effect of adjusting the rate is recognized in the period the forfeiture estimate is changed.
The following table sets forth the assumptions made with respect toestablishing these assumptions for the periods presented:
|
| | | | | | | | | | | |
| | Year Ended December 31, |
| | 2015 | | 2014 | | 2013 |
| Expected volatility | 39 | % | | 58 | % | | 48 | % |
| Expected term (in years) | 6.08 |
| | 6.05 |
| | 6.04 |
|
| Risk-free interest rate | 1.73 | % | | 1.80 | % | | 1.26 | % |
| Expected dividend yield | — | % | | — | % | | — | % |
| Weighted-average grant-date fair value of stock options | $ | 12.73 |
| | $ | 7.18 |
| | $ | 4.11 |
|
These assumptions represent management’s best estimates which involve inherent uncertainties and the application of management’s judgment. If facts and circumstances change and different assumptions are used, our share-based compensation expense could be materially different in the future. As we continue to accumulate additional data related to our common stock, we may have refinements to our estimates, which could materially impact our future share-based compensation expense.
Income Taxes
We are subject to income taxes in the United States and Canada and we conduct our business primarily in the United States. Significant judgments are required in determining our provision for income taxes and income tax assets and liabilities, including evaluating uncertainties in the application of accounting principles and complex tax laws.
We use the asset and liability method to account for income taxes. Deferred tax assets and liabilities are recognized for the future tax consequences attributable to differences between the financial statement carrying amounts of existing assets and liabilities and their respective tax bases and net operating loss carryforwards. Deferred tax assets and liabilities are measured using enacted tax rates expected to apply to taxable income in the years in which those temporary differences are expected to be recovered or settled. The effect on deferred tax assets and liabilities of a change in tax rates is recognized in income in the period that includes the enactment date.
For transactions and calculations for which the ultimate tax determination is uncertain, we recognize tax liabilities based on estimates of whether additional taxes and interest will be due. These tax liabilities are recognized when, despite the belief that our tax return positions are supportable, we believe that certain positions may not be more likely than not of being sustained upon review by tax authorities. As of December 31, 2015 and 2014, we had recognized tax liabilities of approximately $3.3 million and $3.2 million, respectively, related to uncertain income tax positions.
We periodically evaluate if it is more likely than not that some or all of the deferred tax assets will be realized. In making such determination, we consider all available positive and negative evidence, including scheduled reversals of deferred tax
|
| |
| QUANTITATIVE AND QUALITATIVE DISCLOSURES | |
liabilities, projected future taxable income, tax planning strategies and recent financial performance. In order to support a conclusion that a valuation allowance is not needed, positive evidence of sufficient quantity and quality (objective compared to subjective) is necessary to overcome negative evidence. Because certain federal and state net operating loss carryforwards may not be utilized prior to expiration, a valuation allowance on our deferred tax asset balance was recognized as of December 31, 2015.
We believe that our accruals for tax liabilities are adequate for all open audit years based on our assessment of many factors, including past experience and interpretations of tax law. This assessment relies on estimates and assumptions and may involve a series of complex judgments about future events. We do not anticipate any adjustments would result in a material change to our financial position. To the extent that the final tax outcome of these matters is different than the amounts recorded, such differences will impact income tax expense in the period in which such determination is made. We paid Notices of Proposed Assessments outstanding as of December 31, 2014 related to the disallowance of employment tax credits totaling $10.5 million in connection with the IRS examination of Gevity HR, Inc. and its subsidiaries, which was acquired by TriNet in June 2009. The Company plans to exhaust all administrative efforts to resolve this matter, however, it is likely that the matter will ultimately be resolved through litigation. With regard to these employment tax credits, the Company believes it is more likely than not that the Company will prevail. Therefore, no reserve has been recognized related to this matter.
Recent Accounting Pronouncements
In February 2016, the Financial Accounting Standards Board, or (FASB), issued Accounting Standards Update (ASU) 2016-02—Leases. The amendment requires that lease arrangements longer than 12 months result in an entity recognizing an asset and liability. The amendment is effective for annual reporting periods, and interim periods within those years beginning after December 15, 2018. Early adoption is permitted. We are currently in the process of evaluating the impact of the adoption of this standard on our consolidated financial statements.
In January 2016, the FASB issued ASU 2016-01—Recognition and Measurement of Financial Assets and Financial Liabilities. The amendment addresses various aspects of the recognition, measurement, presentation, and disclosure for financial instruments. The amendment is effective for annual reporting periods, and interim periods within those years beginning after December 15, 2017. Early adoption by public entities is permitted only for certain provisions. We are currently in the process of evaluating the impact of the adoption of this standard on our consolidated financial statements.
In November 2015, the FASB issued ASU 2015-17—Balance Sheet Classification of Deferred Taxes, as part of its initiative to reduce complexity in accounting standards (the Simplification Initiative). The amendment requires that deferred tax liabilities and assets be classified as noncurrent in a classified statement of financial position. The amendment is effective for fiscal years, and interim periods within those fiscal years, beginning after December 15, 2016. Early adoption is permitted. We adopted this guidance in 2015 with retrospective application. See Note 11 for further details.
In April 2015, the FASB issued ASU 2015-05—Intangibles—Goodwill and Other—Internal-Use Software, as part of the Simplification Initiative. The amendment provides guidance to clarify the customer’s accounting for fees paid in a cloud computing arrangement. The amendment is effective for fiscal years, and interim periods within those fiscal years, beginning after December 15, 2015. Early adoption is permitted. We expect to adopt this guidance in 2016. We do not expect this guidance to have a material effect on our consolidated financial statements.
In April 2015, the FASB issued ASU 2015-03— Interest—Imputation of Interest, as part of its Simplification Initiative. The amendment requires that debt issuance costs related to a recognized debt liability be presented in the balance sheet as a direct deduction from the carrying amount of that debt liability, consistent with debt discounts. The amendment is effective for fiscal years, and interim periods within those fiscal years, beginning after December 15, 2015. Early adoption is permitted for financial statements that have not been previously issued. We expect to adopt this guidance in 2016. We do not expect this guidance to have a material effect on our consolidated financial statements.
In August 2014, the FASB issued ASU 2014-15—Presentation of Financial Statements — Going Concern (Subtopic 205-40), which addresses management’s responsibility to evaluate whether there is substantial doubt about an entity’s ability to continue as a going concern and to provide related footnote disclosures. Management’s evaluation should be based on relevant conditions and events that are known and reasonably knowable at the date that the financial statements are issued. The standard will be effective for the first interim period within annual reporting periods beginning after December 15, 2016. Early adoption is permitted. We do not expect to adopt this guidance early and do not believe that the adoption of this guidance will have a material effect on our consolidated financial statements.
In June 2014, the FASB issued ASU 2014-12—Compensation - Stock Compensation, which requires that a performance target that affects vesting and that could be achieved after the requisite service period be treated as a performance condition. ASU 2014-12 is effective for annual reporting periods, and interim periods within those years, beginning after December 15,
2015. Early adoption is permitted. The amendments may be applied prospectively to all awards granted or modified after the effective date or retrospectively to all awards with performance targets that are outstanding as of the beginning of the earliest annual period presented. We do not expect this guidance to have a material effect on our consolidated financial statements. We expect to adopt this guidance in 2016.
In May 2014, the FASB issued ASU 2014-09—Revenue from Contracts with Customers, which will replace most existing revenue recognition guidance under GAAP. The core principle of the guidance is that an entity should recognize revenue to depict the transfer of promised goods or services to customers in an amount that reflects the consideration to which the entity expects to be entitled in exchange for those goods or services. The standard provides a five-step analysis of transactions to determine when and how revenue is recognized. In July 2015, the FASB deferred the effective date to annual reporting periods, and interim periods within those years, beginning after December 15, 2017. Early adoption at the original effective date of December 15, 2016 is permitted. The amendments may be applied retrospectively or as a cumulative-effect adjustment as of the date of adoption. We have not yet selected a method of adoption and are currently evaluating the effect that the amendments will have on our consolidated financial statements.
Item 7A. Quantitative and Qualitative Disclosures About Market Risk
We are exposed to certain market risks in the ordinary course of our business. These risks primarily include interest rate sensitivities as follows.
We had cash and cash equivalents, restricted cash, restricted investments payroll funds collected, and interest bearing receivables in connection with workersworkers' compensation premiums totaling $1.3 billion at$56.3 million as of December 31, 2015.2016. Included in this amount were $66.4$53.6 million in time deposits and U.S. Treasuries. SuchOur investments are made for capital preservation purposes and these interest-earning instruments carry a degree of interest rate risk. To date, fluctuationsOur future investment income may fall short of expectations due to changes in interest income have not been significant.rates or we may suffer losses in principal if we are forced to sell securities prior to maturity or declines in fair value are determined to be other-than-temporary. Fluctuations in the value of our investment securities caused by a change in interest rates (gains or losses on the carrying value) are recorded in other comprehensive income, and are realized only if we sell the underlying securities. Our investments are made for capital preservation purposes. The cash and cash equivalents, restricted cash, payroll funds collected and workers compensation premium receivable are held for working capital purposes.
Our cash equivalents, payroll funds collected, workers compensation receivable and our investments are subject to market risk due to changesTo date, fluctuations in interest rates. Fixed rate securities mayincome have their market value adversely impacted due to a rise in interest rates, while floating rate securities may produce less income than expected if interest rates fall. Due in part to these factors, our future investment income may fall short of expectations due to changes in interest rates or we may suffer losses in principal if we are forced to sell securities that decline in market value due to changes in interest rates. However, because we classify our debt securities as “available for sale,” no gains or losses are recognized due to changes in interest rates unless such securities are sold prior to maturity or declines in fair value are determined to be other-than-temporary. Our fixed-income portfolio is subject to interest rate risk.not been significant.
We also had total outstanding indebtedness of $499.6$462.9 million as of December 31, 2015,2016, of which $35.3$38.3 million is due within 12 months. Amounts outstanding under our credit facility carry variable interest rates of LIBOR + 2.75% over the term of the facility, subject to specified rate adjustments under certain circumstances. As a result of our credit facility, weWe are exposed to market risk from changes in interest rates. Withrates on our debt. Depending upon the borrowing option chosen, the interest charged is generally based upon the prime lending rate or LIBOR plus an increase inapplicable margin. If interest rates in effect at December 31, 2015 of2016 increased or decreased 100 basis points, our interest expense for 20162017 through 20202019 would be $66.5correspondingly increase or decrease by $10.7 million. On the other hand, with a decrease in interest rates in effect at December 31, 2015 of 100 basis points, our interest expense for 2016 through 2020 would be $39.7 million.
Item 8. Financial Statements and Supplementary Data.Data
TRINET GROUP, INC.
Consolidated Financial Statements of TriNet Group, Inc. and Subsidiaries
REPORT OF INDEPENDENT REGISTERED PUBLIC ACCOUNTING FIRM
The Board of Directors and Stockholders of
TriNet Group, Inc. and Subsidiaries
We have audited the accompanying consolidated balance sheetssheet of TriNet Group, Inc. and Subsidiariessubsidiaries (the "Company") as of December 31, 2016, and the related consolidated statements of income, comprehensive income, stockholders’ equity (deficit), and cash flows for the year then ended. Our audit also included the financial statement schedule listed in the Index at Item 15, pertaining to the year ended December 31, 2016. These financial statements and financial statement schedule are the responsibility of the Company's management. Our responsibility is to express an opinion on the financial statements and financial statement schedule based on our audit.
We conducted our audit in accordance with the standards of the Public Company Accounting Oversight Board (United States). Those standards require that we plan and perform the audit to obtain reasonable assurance about whether the financial statements are free of material misstatement. An audit includes examining, on a test basis, evidence supporting the amounts and disclosures in the financial statements. An audit also includes assessing the accounting principles used and significant estimates made by management, as well as evaluating the overall financial statement presentation. We believe that our audit provides a reasonable basis for our opinion.
In our opinion, such consolidated financial statements present fairly, in all material respects, the financial position of TriNet Group, Inc. and subsidiaries as of December 31, 2016, and the results of their operations and their cash flows for the year then ended, in conformity with accounting principles generally accepted in the United States of America. Also, in our opinion, such financial statement schedule pertaining to the year ended December 31, 2016, when considered in relation to the basic consolidated financial statements taken as a whole, presents fairly, in all material respects, the information set forth therein.
We have also audited, in accordance with the standards of the Public Company Accounting Oversight Board (United States), the Company's internal control over financial reporting as of December 31, 2016, based on the criteria established in Internal Control - Integrated Framework (2013) issued by the Committee of Sponsoring Organizations of the Treadway Commission and our report dated February 28, 2017 expressed an adverse opinion on the Company's internal control over financial reporting.
/s/ DELOITTE & TOUCHE LLP
San Francisco, California
February 28, 2017
REPORT OF INDEPENDENT REGISTERED PUBLIC ACCOUNTING FIRM
The Board of Directors and Stockholders of TriNet Group, Inc.
We have audited the accompanying consolidated balance sheet of TriNet Group, Inc. as of December 31, 2015, and 2014, and the related consolidated statements of operations,income, comprehensive income, stockholders’ equity (deficit) and cash flows for each of the threetwo years in the period ended December 31, 2015. Our audits also included the financial statement schedule listed at Item 15(a). These financial statements and schedule are the responsibility of the Company’s management. Our responsibility is to express an opinion on these financial statements and schedule based on our audits.
We conducted our audits in accordance with the standards of the Public Company Accounting Oversight Board (United States). Those standards require that we plan and perform the audit to obtain reasonable assurance about whether the financial statements are free of material misstatement. An audit includes examining, on a test basis, evidence supporting the amounts and disclosures in the financial statements. An audit also includes assessing the accounting principles used and significant estimates made by management, as well as evaluating the overall financial statement presentation. We believe that our audits provide a reasonable basis for our opinion.
In our opinion, the financial statements referred to above present fairly, in all material respects, the consolidated financial position of TriNet Group, Inc. and Subsidiaries at December 31, 2015, and 2014, and the consolidated results of their operations and their cash flows for each of the threetwo years in the period ended December 31, 2015, in conformity with U.S. generally accepted accounting principles. Also, in our opinion, the related financial statement schedule, when considered in relation to the basic financial statements taken as a whole, presents fairly in all material respects the information set forth therein.
We also have audited, in accordance with the standards of the Public Company Accounting Oversight Board (United States), TriNet Group, Inc. and Subsidiaries’ internal control over financial reporting as of December 31, 2015, based on criteria established in Internal Control-Integrated Framework issued by the Committee of Sponsoring Organizations of the Treadway Commission (2013 framework) and our report dated March 31, 2016 expressed an adverse opinion thereon.
/s/ Ernst & Young LLP
San Francisco, California
March 31, 2016
TriNet Group, Inc. and SubsidiariesTRINET GROUP, INC.
CONSOLIDATED BALANCE SHEETS
(In thousands, except share and per share data)
| | | | December 31, 2015 | | December 31, 2014 | |
| (In thousands, except share and per share data) | | December 31, 2016 | December 31, 2015 |
| Assets | | | | |
| Current assets: | | | | | |
| Cash and cash equivalents | $ | 166,178 |
| | $ | 134,341 |
| $ | 184,004 |
| $ | 166,178 |
|
| Restricted cash | 14,557 |
| | 14,543 |
| |
| Restricted cash and cash equivalents | | 14,569 |
| 14,557 |
|
| Prepaid income taxes | 4,105 |
| | 26,711 |
| 42,381 |
| 4,105 |
|
| Prepaid expenses | 8,579 |
| | 9,336 |
| 10,784 |
| 8,579 |
|
| Deferred loan costs and other current assets | 3,715 |
| | 4,271 |
| |
| Other current assets | | 2,145 |
| 1,359 |
|
| Worksite employee related assets | 1,373,386 |
| | 1,635,136 |
| 1,281,471 |
| 1,373,386 |
|
| Total current assets | 1,570,520 |
| | 1,824,338 |
| 1,535,354 |
| 1,568,164 |
|
| Workers compensation receivable | 29,204 |
| | 31,905 |
| |
| Restricted cash and investments | 101,806 |
| | 69,447 |
| |
| Workers' compensation collateral receivable | | 31,883 |
| 29,204 |
|
| Restricted cash, cash equivalents and investments | | 130,501 |
| 101,806 |
|
| Property and equipment, net | 37,844 |
| | 32,298 |
| 58,622 |
| 37,844 |
|
| Goodwill | 289,207 |
| | 288,857 |
| 289,207 |
| 289,207 |
|
| Other intangible assets, net | 46,772 |
| | 81,718 |
| 31,074 |
| 46,772 |
|
| Deferred loan costs and other assets | 22,877 |
| | 12,017 |
| |
| Other assets | | 18,502 |
| 19,452 |
|
| Total assets | $ | 2,098,230 |
| | $ | 2,340,580 |
| $ | 2,095,143 |
| $ | 2,092,449 |
|
| Liabilities and stockholders’ equity (deficit) | |
| | | |
| Liabilities and stockholders’ equity | | |
| |
| Current liabilities: | |
| | | |
| |
| Accounts payable | $ | 12,904 |
| | $ | 12,273 |
| $ | 22,541 |
| $ | 12,904 |
|
| Accrued corporate wages | 28,963 |
| | 29,179 |
| 30,937 |
| 28,963 |
|
| Current portion of notes payable and borrowings under capital leases | 35,326 |
| | 20,738 |
| |
| Notes and capital leases payable, net | | 36,559 |
| 32,970 |
|
| Other current liabilities | 11,402 |
| | 10,303 |
| 12,551 |
| 11,402 |
|
| Worksite employee related liabilities | 1,369,497 |
| | 1,630,555 |
| 1,275,995 |
| 1,369,497 |
|
| Total current liabilities | 1,458,092 |
| | 1,703,048 |
| 1,378,583 |
| 1,455,736 |
|
| Notes payable and borrowings under capital leases, less current portion | 464,390 |
| | 524,412 |
| |
| Workers compensation liabilities | 105,481 |
| | 75,448 |
| |
| Notes and capital leases payables, net, noncurrent | | 422,495 |
| 460,965 |
|
Workers' compensation loss reserves (net of collateral paid $22,377 and $15,129 at December 31, 2016 and 2015, respectively) | | 159,301 |
| 105,481 |
|
| Deferred income taxes | 54,641 |
| | 58,529 |
| 92,373 |
| 54,641 |
|
| Other liabilities | 7,545 |
| | 4,902 |
| 7,801 |
| 7,545 |
|
| Total liabilities | 2,090,149 |
| | 2,366,339 |
| 2,060,553 |
| 2,084,368 |
|
| Commitments and contingencies (Note 12) |
|
| |
|
| |
| Stockholders’ equity (deficit): | | | | |
Preferred stock, $.000025 per share stated value; 20,000,000 shares authorized; no shares issued and outstanding at December 31, 2015 and December 31, 2014 | — |
| | — |
| |
Common stock, $.000025 per share stated value; 750,000,000 shares authorized; 70,371,425 and 69,811,326 shares issued and outstanding at December 31, 2015 and December 31, 2014, respectively | 494,397 |
| | 442,682 |
| |
| Commitments and contingencies (see Note 13) | |
|
|
|
|
| Stockholders’ equity: | | |
Preferred stock ($0.000025 par value per share; 20,000,000 shares authorized; no shares issued and outstanding at December 31, 2016 and 2015) | | — |
| — |
|
Common stock and additional paid-in capital ($0.000025 par value per share; 750,000,000 shares authorized; 69,015,690 and 70,371,425 shares issued and outstanding at December 31, 2016 and 2015, respectively) | | 535,132 |
| 494,397 |
|
| Accumulated deficit | (485,595 | ) | | (468,127 | ) | (499,938 | ) | (485,595 | ) |
| Accumulated other comprehensive loss | (721 | ) | | (314 | ) | (604 | ) | (721 | ) |
| Total stockholders’ equity (deficit) | 8,081 |
| | (25,759 | ) | |
| Total liabilities and stockholders’ equity (deficit) | $ | 2,098,230 |
| | $ | 2,340,580 |
| |
| Total stockholders’ equity | | 34,590 |
| 8,081 |
|
| Total liabilities and stockholders’ equity | | $ | 2,095,143 |
| $ | 2,092,449 |
|
See accompanying notes.
TriNet Group, Inc. and SubsidiariesTRINET GROUP, INC.
CONSOLIDATED STATEMENTS OF OPERATIONS
(In thousands, except share and per share data)
INCOME
| | | | Year Ended December 31, | Year Ended December 31, |
| | 2015 | | 2014 | | 2013 | |
| (In thousands, except share and per share data) | | 2016 | 2015 | 2014 |
| Professional service revenues | $ | 401,287 |
| | $ | 342,074 |
| | $ | 272,372 |
| $ | 446,755 |
| $ | 401,287 |
| $ | 342,074 |
|
| Insurance service revenues | 2,258,001 |
| | 1,851,457 |
| | 1,371,903 |
| 2,613,558 |
| 2,258,001 |
| 1,851,457 |
|
| Total revenues | 2,659,288 |
| | 2,193,531 |
| | 1,644,275 |
| 3,060,313 |
| 2,659,288 |
| 2,193,531 |
|
| Costs and operating expenses: | | | | | | |
| Insurance costs | 2,112,376 |
| | 1,686,315 |
| | 1,226,585 |
| 2,413,752 |
| 2,112,376 |
| 1,686,315 |
|
Cost of providing services (exclusive of depreciation and amortization of intangible assets) | 150,694 |
| | 134,256 |
| | 106,661 |
| 190,444 |
| 150,694 |
| 134,256 |
|
| Sales and marketing | 166,759 |
| | 139,997 |
| | 109,183 |
| 173,714 |
| 166,759 |
| 139,997 |
|
| General and administrative | 69,626 |
| | 53,926 |
| | 52,455 |
| 91,659 |
| 69,626 |
| 53,926 |
|
| Systems development and programming costs | 27,558 |
| | 26,101 |
| | 19,948 |
| |
| Systems development and programming | | 31,438 |
| 27,558 |
| 26,101 |
|
| Amortization of intangible assets | 39,346 |
| | 52,302 |
| | 51,369 |
| 15,997 |
| 39,346 |
| 52,302 |
|
| Depreciation | 14,612 |
| | 13,843 |
| | 11,737 |
| 19,351 |
| 14,612 |
| 13,843 |
|
| Total costs and operating expenses | 2,580,971 |
| | 2,106,740 |
| | 1,577,938 |
| 2,936,355 |
| 2,580,971 |
| 2,106,740 |
|
| Operating income | 78,317 |
| | 86,791 |
| | 66,337 |
| 123,958 |
| 78,317 |
| 86,791 |
|
| Other income (expense): | | | | | | |
| Interest expense and bank fees | (19,449 | ) | | (54,193 | ) | | (45,724 | ) | (20,257 | ) | (19,449 | ) | (54,193 | ) |
| Other, net | 1,142 |
| | 478 |
| | 471 |
| 751 |
| 1,142 |
| 478 |
|
| Income before provision for income taxes | 60,010 |
| | 33,076 |
| | 21,084 |
| 104,452 |
| 60,010 |
| 33,076 |
|
| Provision for income taxes | 28,315 |
| | 17,579 |
| | 7,937 |
| |
| Income tax expenses | | 43,046 |
| 28,315 |
| 17,579 |
|
| Net income | $ | 31,695 |
| | $ | 15,497 |
| | $ | 13,147 |
| $ | 61,406 |
| $ | 31,695 |
| $ | 15,497 |
|
| Net income per share: | | | | | | |
| Basic | $ | 0.45 |
| | $ | 0.24 |
| | $ | 0.26 |
| $ | 0.88 |
| $ | 0.45 |
| $ | 0.24 |
|
| Diluted | $ | 0.44 |
| | $ | 0.22 |
| | $ | 0.24 |
| $ | 0.85 |
| $ | 0.44 |
| $ | 0.22 |
|
| Weighted average shares: | | | | | | |
| Basic | 70,228,159 |
| | 56,160,539 |
| | 12,353,047 |
| 70,159,696 |
| 70,228,159 |
| 56,160,539 |
|
| Diluted | 72,618,069 |
| | 59,566,773 |
| | 15,731,807 |
| 71,972,486 |
| 72,618,069 |
| 59,566,773 |
|
See accompanying notes.
TriNet Group, Inc. and SubsidiariesTRINET GROUP, INC.
CONSOLIDATED STATEMENTS OF COMPREHENSIVE INCOME
(In thousands)
| | | | Year Ended December 31, | Year Ended December 31, |
| | 2015 | | 2014 | | 2013 | |
| (In thousands) | | 2016 | 2015 | 2014 |
| Net income | $ | 31,695 |
| | $ | 15,497 |
| | $ | 13,147 |
| $ | 61,406 |
| $ | 31,695 |
| $ | 15,497 |
|
| Other comprehensive income (loss), net of tax | | | | | | |
| Unrealized losses on investments | (86 | ) | | (8 | ) | | (9 | ) | |
| Unrealized gains on interest rate cap | — |
| | — |
| | 66 |
| |
| Unrealized gains (losses) on investments | | 47 |
| (86 | ) | (8 | ) |
| Foreign currency translation adjustments | (321 | ) | | (115 | ) | | (53 | ) | 70 |
| (321 | ) | (115 | ) |
| Total other comprehensive income (loss), net of tax | (407 | ) | | (123 | ) | | 4 |
| 117 |
| (407 | ) | (123 | ) |
| Comprehensive income | $ | 31,288 |
| | $ | 15,374 |
| | $ | 13,151 |
| $ | 61,523 |
| $ | 31,288 |
| $ | 15,374 |
|
See accompanying notes.
TriNet Group, Inc. and SubsidiariesTRINET GROUP, INC.
CONSOLIDATED STATEMENTS OF STOCKHOLDERS’ EQUITY (DEFICIT)
(In thousands, except share data)
| | | | | | | | | | | | | | | | | Accumulated | | | Preferred Stock |
Common Stock and Additional Paid-In Capital | Accumulated Deficit | Accumulated Other Comprehensive Loss | Total Stockholders’ Equity (Deficit) |
| | Preferred Stock– | | Preferred Stock– | | | | | | | | Other | | Total | |
| | Series G | | Series H | | Common Stock | | Accumulated | | Comprehensive | | Stockholders’ | |
| | Shares | | Amount | | Shares | | Amount | | Shares | | Amount | | Deficit | | Loss | | Equity (Deficit) | |
| Balance at December 31, 2012 | 5,391,441 |
| | $ | 59,059 |
| | 4,124,986 |
| | $ | 63,819 |
| | 10,709,224 |
| | $ | 45,488 |
| | $ | (110,851 | ) | | $ | (195 | ) | | $ | (65,558 | ) | |
| (In thousands, except per share data) | | Shares | Amount | Shares | Amount | Accumulated Deficit | Accumulated Other Comprehensive Loss | Total Stockholders’ Equity (Deficit) |
| Balance at December 31, 2013 | | 9,516,427 |
| $ | 122,878 |
| 15,259,540 |
| $ | 74,160 |
|
| Net income | — |
| | — |
| | — |
| | — |
| | — |
| | — |
| | 13,147 |
| | — |
| | 13,147 |
| — |
| — |
| — |
| — |
| 15,497 |
| — |
| 15,497 |
|
| Other comprehensive income | — |
| | — |
| | — |
| | — |
| | — |
| | — |
| | — |
| | 4 |
| | 4 |
| |
| Issuance of common stock from vested restricted stock units | — |
| | — |
| | — |
| | — |
| | 36,512 |
| | — |
| | — |
| | — |
| | — |
| |
| Other comprehensive loss | | — |
| — |
| — |
| — |
| — |
| (123 | ) | (123 | ) |
| Issuance of common stock for vested restricted stock units | | — |
| — |
| 4,250 |
| — |
| — |
| — |
| — |
|
| Issuance of common stock under employee stock purchase plan | | — |
| — |
| 249,494 |
| 3,393 |
| — |
| — |
| 3,393 |
|
| Conversion of preferred stock | | (9,516,427 | ) | (122,878 | ) | 38,065,708 |
| 122,878 |
| — |
| — |
| 122,878 |
|
| Issuance of common stock from exercise of stock options | — |
| | — |
| | — |
| | — |
| | 5,730,544 |
| | 7,109 |
| | — |
| | — |
| | 7,109 |
| — |
| — |
| 1,712,278 |
| 2,193 |
| — |
| — |
| 2,193 |
|
| Issuance of common stock, net of IPO cost | | — |
| — |
| 15,091,074 |
| 217,796 |
| | 217,796 |
|
| Stock-based compensation expense | — |
| | — |
| | — |
| | — |
| | — |
| | 5,953 |
| | — |
| | — |
| | 5,953 |
| — |
| — |
| — |
| 10,660 |
| — |
| — |
| 10,660 |
|
| Repurchase of common stock | — |
| | — |
| | — |
| | — |
| | (407,728 | ) | | — |
| | (3,342 | ) | | — |
| | (3,342 | ) | — |
| — |
| (490,419 | ) | — |
| (15,009 | ) | — |
| (15,009 | ) |
| Awards effectively repurchased for required employee withholding taxes | — |
| — |
| — |
| | — |
| | — |
| | (809,012 | ) | | — |
| | (8,643 | ) | | — |
| | (8,643 | ) | — |
| — |
| (80,599 | ) | — |
| (1,431 | ) | — |
| (1,431 | ) |
| Excess tax benefit from equity incentive plan activity | — |
| | — |
| | — |
| | — |
| | — |
| | 15,610 |
| | — |
| | — |
| | 15,610 |
| |
| Special dividend | — |
| | — |
| | — |
| | — |
| | — |
| | — |
| | (357,520 | ) | | — |
| | (357,520 | ) | |
| Balance at December 31, 2013 | 5,391,441 |
| | 59,059 |
| | 4,124,986 |
| | 63,819 |
| | 15,259,540 |
| | 74,160 |
| | (467,209 | ) | | (191 | ) | | (393,240 | ) | |
| Net income | — |
| | — |
| | — |
| | — |
| | — |
| | — |
| | 15,497 |
| | — |
| | 15,497 |
| |
| Other comprehensive loss | — |
| | — |
| | — |
| | — |
| | — |
| | — |
| | — |
| | (123 | ) | | (123 | ) | |
| Issuance of common stock from vested restricted stock units | — |
| | — |
| | — |
| | — |
| | 4,250 |
| | — |
| | — |
| | — |
| | — |
| |
| Issuance of common stock for employee stock purchase plan | — |
| | — |
| | — |
| | — |
| | 249,494 |
| | 3,393 |
| | — |
| | — |
| | 3,393 |
| |
| Conversion of preferred stock | (5,391,441 | ) | | (59,059 | ) | | (4,124,986 | ) | | (63,819 | ) | | 38,065,708 |
| | 122,878 |
| | — |
| | — |
| | 122,878 |
| |
| Issuance of common stock from exercise of stock options | — |
| | — |
| | — |
| | — |
| | 1,712,278 |
| | 2,193 |
| | — |
| | — |
| | 2,193 |
| |
| Issuance of common stock, net of initial public offering cost | — |
| | — |
| | — |
| | — |
| | 15,091,074 |
| | 217,796 |
| | | | | | 217,796 |
| |
| Stock-based compensation expense | — |
| | — |
| | — |
| | — |
| | — |
| | 10,660 |
| | — |
| | — |
| | 10,660 |
| |
| Repurchase of common stock | — |
| | — |
| | — |
| | — |
| | (490,419 | ) | | — |
| | (15,009 | ) | | — |
| | (15,009 | ) | |
| Awards effectively repurchased for required employee withholding taxes | — |
| | — |
| | — |
| | — |
| | (80,599 | ) | | — |
| | (1,431 | ) | | — |
| | (1,431 | ) | |
| Excess tax benefit from equity incentive plan activity | — |
| | — |
| | — |
| | — |
| | — |
| | 9,663 |
| | — |
| | — |
| | 9,663 |
| |
| Excess tax benefits from equity incentive plan activity | | — |
| — |
| — |
| 9,663 |
| — |
| — |
| 9,663 |
|
| Realized tax benefit of deductible IPO transaction costs | — |
| | — |
| | — |
| | — |
| | — |
| | 1,939 |
| | — |
| | — |
| | 1,939 |
| — |
| — |
| — |
| 1,939 |
| — |
| — |
| 1,939 |
|
| Special dividend | — |
| | — |
| | — |
| | — |
| | — |
| | — |
| | 25 |
| | — |
| | 25 |
| — |
| — |
| — |
| — |
| 25 |
| — |
| 25 |
|
| Balance at December 31, 2014 | — |
| | — |
| | — |
| | — |
| | 69,811,326 |
| | 442,682 |
| | (468,127 | ) | | (314 | ) | | (25,759 | ) | — |
| — |
| 69,811,326 |
| 442,682 |
| (468,127 | ) | (314 | ) | (25,759 | ) |
| Net income | — |
| | — |
| | — |
| | — |
| | — |
| | — |
| | 31,695 |
| | — |
| | 31,695 |
| — |
| — |
| — |
| — |
| 31,695 |
| — |
| 31,695 |
|
| Other comprehensive loss | — |
| | — |
| | — |
| | — |
| | — |
| | — |
| | — |
| | (407 | ) | | (407 | ) | — |
| — |
| — |
| — |
| — |
| (407 | ) | (407 | ) |
| Issuance of common stock from vested restricted stock units | — |
| | — |
| | — |
| | — |
| | 106,136 |
| | — |
| | — |
| | — |
| | — |
| |
| Issuance of common stock for employee stock purchase plan | — |
| | — |
| | — |
| | — |
| | 272,836 |
| | 5,315 |
| | — |
| | — |
| | 5,315 |
| |
| Issuance of common stock for vested restricted stock units | | — |
| — |
| 106,136 |
| — |
| — |
| — |
| — |
|
| Issuance of common stock under employee stock purchase plan | | — |
| — |
| 272,836 |
| 5,315 |
| — |
| — |
| 5,315 |
|
| Issuance of common stock from exercise of stock options | — |
| | — |
| | — |
| | — |
| | 2,112,131 |
| | 7,166 |
| | — |
| | — |
| | 7,166 |
| — |
| — |
| 2,112,131 |
| 7,166 |
| — |
| — |
| 7,166 |
|
| Stock-based compensation expense | — |
| | — |
| | — |
| | — |
| | — |
| | 17,742 |
| | — |
| | — |
| | 17,742 |
| — |
| — |
| — |
| 17,742 |
| — |
| — |
| 17,742 |
|
| Repurchase of common stock | — |
| | — |
| | — |
| | — |
| | (1,895,625 | ) | | — |
| | (48,364 | ) | | — |
| | (48,364 | ) | — |
| — |
| (1,895,625 | ) | — |
| (48,364 | ) | — |
| (48,364 | ) |
| Awards effectively repurchased for required employee withholding taxes | — |
| | — |
| | — |
| | — |
| | (35,379 | ) | | — |
| | (799 | ) | | — |
| | (799 | ) | — |
| — |
| (35,379 | ) | — |
| (799 | ) | — |
| (799 | ) |
| Excess tax benefit from equity incentive plan activity | — |
| | — |
| | — |
| | — |
| | — |
| | 20,670 |
| | — |
| | — |
| | 20,670 |
| |
| Excess tax benefits from equity incentive plan activity | | — |
| — |
| — |
| 20,670 |
| — |
| — |
| 20,670 |
|
| Realized tax benefit of deductible IPO transaction costs | — |
| | — |
| | — |
| | — |
| | — |
| | 822 |
| | — |
| | — |
| | 822 |
| — |
| — |
| — |
| 822 |
| — |
| — |
| 822 |
|
| Balance at December 31, 2015 | — |
| | $ | — |
| | — |
| | $ | — |
| | 70,371,425 |
| | $ | 494,397 |
| | $ | (485,595 | ) | | $ | (721 | ) | | $ | 8,081 |
| — |
| — |
| 70,371,425 |
| 494,397 |
| (485,595 | ) | (721 | ) | 8,081 |
|
| Net income | | — |
| — |
| — |
| — |
| 61,406 |
| — |
| 61,406 |
|
| Other comprehensive income | | — |
| — |
| — |
| — |
| — |
| 117 |
| 117 |
|
| Issuance of common stock for vested restricted stock units | | — |
| — |
| 695,253 |
| — |
| — |
| — |
| — |
|
| Issuance of common stock under employee stock purchase plan | | — |
| — |
| 283,644 |
| 4,506 |
| — |
| — |
| 4,506 |
|
| Issuance of common stock from exercise of stock options | | — |
| — |
| 1,297,812 |
| 5,272 |
| — |
| — |
| 5,272 |
|
| Stock-based compensation expense | | — |
| — |
| — |
| 26,318 |
| — |
| — |
| 26,318 |
|
| Repurchase of common stock | | — |
| — |
| (3,414,675 | ) | — |
| (71,604 | ) | — |
| (71,604 | ) |
| Awards effectively repurchased for required employee withholding taxes | | — |
| — |
| (217,769 | ) | — |
| (4,145 | ) | — |
| (4,145 | ) |
| Excess tax benefits from equity incentive plan activity | | — |
| — |
| — |
| 4,639 |
| — |
| — |
| 4,639 |
|
| Balance at December 31, 2016 | | — |
| — |
| 69,015,690 |
| $ | 535,132 |
| $ | (499,938 | ) | $ | (604 | ) | $ | 34,590 |
|
See accompanying notes.
TriNet Group, Inc. and SubsidiariesTRINET GROUP, INC.
CONSOLIDATED STATEMENTS OF CASH FLOWS
(In thousands)
| | | | Year Ended December 31, | Year Ended December 31, |
| | 2015 | | 2014 | | 2013 | |
| (In thousands) | | 2016 | 2015 | 2014 |
| Operating activities | | | | | | |
| Net income | $ | 31,695 |
| | $ | 15,497 |
| | $ | 13,147 |
| $ | 61,406 |
| $ | 31,695 |
| $ | 15,497 |
|
| Adjustments to reconcile net income to net cash provided by operating activities: | | | | | | |
| Depreciation and amortization | 52,817 |
| | 84,403 |
| | 73,838 |
| 39,175 |
| 52,817 |
| 84,403 |
|
| Stock-based compensation | | 26,497 |
| 17,923 |
| 10,960 |
|
| Excess tax benefits received from equity incentive plan activity | | (4,639 | ) | (20,670 | ) | (9,663 | ) |
| Deferred income taxes | 14,954 |
| | 43,842 |
| | (6,680 | ) | 41,772 |
| 14,954 |
| 43,842 |
|
| Stock-based compensation | 17,923 |
| | 10,960 |
| | 6,113 |
| |
| Excess tax benefit from equity incentive plan activity | (20,670 | ) | | (9,663 | ) | | (15,610 | ) | |
| Accretion of workers compensation and leases fair value adjustment | (639 | ) | | (1,090 | ) | | (1,427 | ) | |
| Accretion of workers' compensation and leases fair value adjustment | | — |
| (639 | ) | (1,090 | ) |
| Changes in operating assets and liabilities: | | | | | | |
| Restricted cash and investments | (17,991 | ) | | (6,880 | ) | | (6,118 | ) | |
| Restricted cash and cash equivalents | | (41,535 | ) | (17,991 | ) | (6,880 | ) |
| Prepaid income taxes | | (37,715 | ) | 24,494 |
| (23,387 | ) |
| Prepaid expenses and other current assets | 1,313 |
| | (7,389 | ) | | (7,723 | ) | (2,991 | ) | 1,313 |
| (7,389 | ) |
| Workers compensation receivables | 3,152 |
| | (5,413 | ) | | 9,876 |
| |
| Workers' compensation collateral receivable | | (2,679 | ) | 3,152 |
| (5,413 | ) |
| Other assets | (14,527 | ) | | 8,004 |
| | 4,052 |
| 262 |
| (14,527 | ) | 8,004 |
|
| Accounts payable | 287 |
| | 5,212 |
| | 976 |
| 9,158 |
| 287 |
| 5,212 |
|
| Prepaid income taxes | 24,494 |
| | (23,387 | ) | | 6,394 |
| |
| Other current liabilities | 5,616 |
| | 7,749 |
| | 13,186 |
| |
| Other liabilities | 31,483 |
| | 29,822 |
| | 4,149 |
| |
| Accrued corporate wages and other current liabilities | | 3,247 |
| 5,616 |
| 7,749 |
|
| Workers' compensation loss reserves | | 54,161 |
| 31,483 |
| 29,822 |
|
| Worksite employee related assets | 261,750 |
| | (862,699 | ) | | (304,265 | ) | 91,915 |
| 261,750 |
| (862,699 | ) |
| Worksite employee related liabilities | (261,058 | ) | | 862,931 |
| | 310,813 |
| (93,502 | ) | (261,058 | ) | 862,931 |
|
| Net cash provided by operating activities | 130,599 |
| | 151,899 |
| | 100,721 |
| 144,532 |
| 130,599 |
| 151,899 |
|
| Investing activities | | | | | | |
| Acquisitions of businesses | (4,750 | ) | | — |
| | (194,998 | ) | (300 | ) | (4,750 | ) | — |
|
| Purchase of debt securities | (41,939 | ) | | (24,875 | ) | | (7,750 | ) | |
| Proceeds from maturity of debt securities | 27,557 |
| | — |
| | 1,000 |
| |
| Purchases of marketable securities | | (14,959 | ) | (41,939 | ) | (24,875 | ) |
| Proceeds from maturity of marketable securities | | 27,787 |
| 27,557 |
| — |
|
| Purchase of property and equipment | (18,557 | ) | | (20,552 | ) | | (10,690 | ) | (39,650 | ) | (18,557 | ) | (20,552 | ) |
| Net cash used in investing activities | (37,689 | ) | | (45,427 | ) | | (212,438 | ) | (27,122 | ) | (37,689 | ) | (45,427 | ) |
| Financing activities | | | | | | |
| Proceeds from issuance of common stock, net of issuance costs | — |
| | 217,796 |
| | — |
| — |
| — |
| 217,796 |
|
| Realized tax benefit of deductible IPO transaction costs | 822 |
| | 1,939 |
| | — |
| |
| Repurchase of common stock | | (71,604 | ) | (48,364 | ) | (15,009 | ) |
| Proceeds from issuance of common stock on exercised options | 7,166 |
| | 2,193 |
| | 7,109 |
| 5,272 |
| 7,166 |
| 2,193 |
|
| Proceeds from issuance of common stock on employee stock purchase plan | 5,315 |
| | 3,393 |
| | — |
| 4,506 |
| 5,315 |
| 3,393 |
|
| Excess tax benefit from equity incentive plan activity | 20,670 |
| | 9,663 |
| | 15,610 |
| |
| Borrowings under notes payable | — |
| | — |
| | 970,000 |
| |
| Repayment of notes payable | (45,312 | ) | | (273,550 | ) | | (451,679 | ) | |
| Awards effectively repurchased for required employee withholding taxes | | (4,145 | ) | (799 | ) | (1,431 | ) |
| Proceeds from issuance of notes payable | | 57,978 |
| — |
| — |
|
| Payments for extinguishment of debt | | (57,563 | ) | — |
| — |
|
| Repayment of notes and capital leases payable | | (37,078 | ) | (45,562 | ) | (273,856 | ) |
| Payment of debt issuance costs | — |
| | (11,060 | ) | | (25,697 | ) | (1,376 | ) | — |
| (11,060 | ) |
| Payments of special dividend | — |
| | — |
| | (357,582 | ) | |
| Repayments under capital leases | (250 | ) | | (306 | ) | | (778 | ) | |
| Repurchase of common stock | (48,364 | ) | | (15,009 | ) | | (5,963 | ) | |
| Awards effectively repurchased for required employee withholding taxes | (799 | ) | | (1,431 | ) | | (8,643 | ) | |
| Net cash provided by (used in) financing activities | (60,752 | ) | | (66,372 | ) | | 142,377 |
| |
| Excess tax benefits received from equity incentive plan activity | | 4,639 |
| 20,670 |
| 9,663 |
|
| Tax credit received for deductible IPO transaction costs | | — |
| 822 |
| 1,939 |
|
| Net cash used in financing activities | | (99,371 | ) | (60,752 | ) | (66,372 | ) |
| Effect of exchange rate changes on cash and cash equivalents | (321 | ) | | (115 | ) | | (53 | ) | (213 | ) | (321 | ) | (115 | ) |
| Net increase in cash and cash equivalents | 31,837 |
| | 39,985 |
| | 30,607 |
| 17,826 |
| 31,837 |
| 39,985 |
|
| Cash and cash equivalents at beginning of period | 134,341 |
| | 94,356 |
| | 63,749 |
| 166,178 |
| 134,341 |
| 94,356 |
|
| Cash and cash equivalents at end of period | $ | 166,178 |
| | $ | 134,341 |
| | $ | 94,356 |
| $ | 184,004 |
| $ | 166,178 |
| $ | 134,341 |
|
| | | | | | | |
| Supplemental disclosures of cash flow information | | | | | | |
| Cash paid for interest | $ | 15,224 |
| | $ | 32,051 |
| | $ | 30,534 |
| |
| Cash paid for income taxes, net | $ | 2,005 |
| | $ | (3,809 | ) | | $ | 8,070 |
| |
| Interest paid | | $ | 15,420 |
| $ | 15,224 |
| $ | 32,051 |
|
| Income taxes paid (refund), net | | 39,285 |
| 2,005 |
| (3,809 | ) |
| Supplemental schedule of noncash investing and financing activities | | | | | | |
| Payable for purchase of property and equipment | $ | 344 |
| | $ | 1,290 |
| | $ | 1,302 |
| $ | 823 |
| $ | 344 |
| $ | 1,290 |
|
| Allowance for tenant improvements | $ | 1,257 |
| | $ | — |
| | $ | — |
| — |
| 1,257 |
| — |
|
See accompanying notes.
TriNet Group, Inc. and SubsidiariesTRINET GROUP, INC.
NOTES TO CONSOLIDATED FINANCIAL STATEMENTS
NOTE 1. DESCRIPTION OF BUSINESS AND SIGNIFICANT ACCOUNTING POLICIES
Description of Business
TriNet Group Inc. (the Company(TriNet or TriNet)we, our and us), a Delaware corporation incorporatedprofessional employer organization (PEO) founded in January 2000,1988, provides comprehensive human resources or HR,(HR) solutions for small to midsize businesses or SMBs, across a number of industries(SMBs) under a co-employment model. The Company’s HR solutions are designed to manage an increasingly complex set of HR regulations, costs, risks and responsibilities for its clients, allowing them to focus on operating and growing their core businesses. These HR solutions include bundled services, such as multi-state payroll processing and tax administration, employee benefits programs, including health insurance and retirement plans, workersworkers' compensation insurance and claims management, federal, state and local labor, employment and benefit law compliance, risk mitigation, expense and time management, human capital consulting and other services.
The Company provides its services through Through the co-employment relationships with its clients, under which the Company and its clients each take responsibility for certain portions of the employer-employee relationship, for worksite employees (WSEs). The Company iswe are the employer of record for most administrative and regulatory purposes, including the following: (i) including:
compensation through wages and salaries; (ii) salaries,
employer payroll-related taxes payment; (iii) payment,
employee payroll-related taxes withholding and payment; (iv) payment,
employee benefit programs including health and life insurance, and others;others, and (v) workers
workers' compensation coverage. The client is
Our clients are responsible for responsibilities not assumed by the Company, including the day-to-day job responsibilities of the WSEs.worksite employees (WSEs).
Segment Information
The Company operatesWe operate in one reportable segment in accordance with Accounting Standard Codification (ASC) 280 – Segment Reporting, issued by the Financial Accounting Standards Board (FASB).segment. All of the Company’sour service revenues are generated from external clients. Less than 1% of revenue is generated outside of the United States of America (U.S.). Substantially all of the Company’s long-lived assets are located in the U.S.
Basis of Presentation
The accompanyingOur consolidated financial statements and footnotes thereto of the Company and its wholly owned subsidiaries have beenare prepared in accordanceconformity with U.S. generally accepted accounting principles (GAAP). in the United States of America. All intercompany accounts and transactions have been eliminated in consolidation. Certain prior period amounts in the consolidated balance sheets, the consolidated statement of stockholders’equity (deficit), the consolidated statement of cash flows and Note 3 have been reclassified to conform to the current presentation.
The accompanying consolidated balance sheets present the current assets and current liabilities directly related to the processing of human resources transactions as WSE-related assets and WSE-related liabilities, respectively. WSE-related assets consist of cash and investments restricted for current workers compensation claim payments, payroll funds collected, accounts receivable, unbilled service revenues, and refundable or prepaid amounts related to the Company-sponsored workers compensation and health plan programs. WSE-related liabilities consist of client prepayments, wages and payroll taxes accrued and payable, and liabilities related to the Company-sponsored workers compensation and health plan programs resulting from workers compensation case reserves, premium amounts due to providers for enrolled employees, and workers compensation and health reserves that are expected to be disbursed within the next 12 months.
Use of Estimates
The preparation of financial statements in conformity with GAAP requires managementus to make estimates and assumptions that affect certain reported amounts and related disclosures. TheseSignificant estimates include, but are not limitedinclude:
liability for unpaid losses and loss adjustment expenses (loss reserves) related to allowancesworkers' compensation and workers' compensation collateral receivable,
health insurance loss reserves,
liability for accounts receivable, workers compensation-related assets and liabilities, health plan assets and liabilities, recoverabilityinsurance premiums payable,
impairments of goodwill and other intangible assets,
income taxes, stock-based compensationtax assets and other contingent liabilities. Suchliabilities, and
liability for legal contingencies.
These estimates are based on historical experience and on various other assumptions that Company management believeswe believe to be reasonable underfrom the circumstances. Actual resultsfacts available to us. Some of the assumptions are highly uncertain at the time of estimation. To the extent actual experience differs from the assumptions used, our consolidated financial statements could differ from those estimates.be materially affected.
Revenue Recognition
Professional service revenues represent fees charged to clients for processing HRpayroll-related transactions on behalf of the Company’sour clients, such as payroll payments and remitting employment tax withholding amounts, providing access to the Company’sour HR expertise, including HR templates, best practices, and interactions with our HR professionals, providing labor, employment and benefit law compliance services to assist clients in avoiding or reducing liability and exposure and providing additional services, including recruiting or other services, to support various stages of clients’ growth.HR related services. Professional service revenues are recognized in the period the services are rendered and earned under service arrangements with clients, where service fees are fixed or determinable, and collectability is reasonably assured.
Under the accounting rules, we are not considered the primary obligor with respect to WSEs payroll and payroll tax payments and therefore, these payments are not reflected as either revenue or expense in our consolidated statements of income. The gross payroll and payroll tax payments made on behalf of our clients, combined, were $34.3 billion, $30.6 billion and $25.6 billion for the years ended December 31, 2016, 2015, and 2014, respectively.
We generally charge an upfront non-refundable set-up fee which is recognized on a straight-line basis over the estimated average client tenure.
Insurance service revenues consist of insurance-related billings and administrative fees collected from clients and withheld from WSEs for Company-sponsored, risk-based, fully-insuredworkers' compensation insurance and health benefit insurance plans provided throughby third-party insurance carriers, primarily employee health benefit insurance and workers compensation insurance.carriers. Insurance service revenues are recognized in the period amounts are due and where collectability is reasonably assured.
The professional service revenues and insurance service revenues are each considered separate units of accounting and the associated feesfor administrative services and insurance premiums arerelated benefits billed as such forto the majority of the Company’sour clients. For clients billed through a bundled invoice, the selling price of significant deliverables is determined based on the best estimate of the selling price.
The Company is notInsurance Costs
Our fully-insured insurance plans are provided by third-party insurance carriers under guaranteed-cost or risk-based insurance policies. Under guaranteed-cost policies, our carriers establish the primary obligor for payrollpremiums and payroll tax payments and, therefore, these paymentswe are not reflected as either revenue or expense. The gross payroll and payroll taxresponsible for any deductibles. Under risk-based policies, we agree to reimburse our carriers for any claims paid within an agreed-upon deductible layer.
Insurance costs include insurance premiums for coverage provided by insurance carriers, reimbursement of claims payments made on behalf of the clients, combined, were $30.6 billion, $25.6 billion and $17.6 billion for the years ended December 31, 2015, 2014, and 2013, respectively.
The Company records a liability relating to work performed by WSEs but unpaid at the end of each period in the period in which the WSEs perform work, along with the related receivable for the same period. The Company generally charges an upfront non-refundable set-up fee for which the performance of onboarding services is not a discrete earnings event, and therefore the revenue is recognized on a straight-line basis over the estimated average client tenure.
Insurance Costs
Insurance premiums paid to the insurance carriers for the insurance coverage for clients and WSEs and the reimbursements paid to the insurance carriers or third-party administrators, and changes in loss reserves related to our workers' compensation and health benefit insurance.
At policy inception, annual workers' compensation premiums are estimated based on projected wages over the duration of the policy period and the risk categories of the WSEs. As actual wages are realized, the amounts paid for claims payments madepremiums may differ from the estimates that we recorded, creating an asset or liability throughout the policy year. Such asset or liability is reported on the Company’s behalf within itsour consolidated balance sheets as prepaid insurance deductible layer, where applicable, are included in cost and operating expenses aspremiums or insurance costs.premiums payable, respectively.
WorkersWorkers' Compensation InsuranceLoss Reserves
WorkersWe have secured fully-insured insurance policies with insurance carriers for our clients and WSEs that obligate us to reimburse the insurance carriers for losses up to $1 million per claim occurrence (deductible layer). Workers' compensation insurance reserves represent our liability for unpaid losses and loss adjustment expenses. These reserves are established to provide for the estimated ultimate costs of paying claims within the deductible layer in accordance with workersworker's compensation insurance policies. These reserves include estimates for reported losses, plus amounts for those claimsand incurred but not paid,reported (IBNR) losses, and estimates of certain expenses associated with processing and settling the claims. In establishing the workers compensation insurancethese reserves, the Company useswe use an independent actuarialactuary to provide an estimate of undiscounted future cash payments that would be made to settle the claims. In the Company's experience, plan years related to workers compensation programs may take up to 10 years or more to be settled.claims based upon:
In estimating these reserves, the Company utilizesTriNet's historical loss experience, exposure data, and actuarial judgment, together with a range of industry loss experience,
inputs which are primarily based upon theincluding WSE job responsibilities theirand location, the
historical frequency and severity of workersworkers' compensation claims, and
an estimate of future cost trends. Alltrends to establish expected loss ratios for subsequent accident years,
expected loss ratios for the latest accident year or prior accident years, adjusted for the loss trend, the effect of these components could materially impactrate changes and other quantifiable factors, and
loss development factors to project the reported losses for each accident year to an ultimate basis.
We assess the workers' compensation loss reserves as reported in the consolidated financial statements.on a quarterly basis. For each reporting period, changes in the actuarial methods and assumptions resulting from changes in actual claims experience and other trends are incorporated into the workersworkers' compensation claims cost estimates. Accordingly, final claim settlements may vary materially from the present estimates, particularly when those payments may not occur until well into the future.
The Company regularly reviews the adequacy of workers compensation insuranceloss reserves. Adjustments to previously established reserves are reflected in the results of operations for the period in which the adjustment is identified. Such adjustments could be significant, reflecting any variety of new and adverse or favorable trends. Any unexpected increases inAccordingly, final claim settlements may vary materially from the severitypresent estimates, particularly when those payments may not occur until well into the future. In our experience, plan years related to workers' compensation programs may take ten years or frequency of claims could result in material adverse effectsmore to the operating results.be settled.
The Company doesWe do not discount workers' compensation loss reserves accrued under these programs.reserves. Claim costs expected to be paid within one year are recorded as accrued workersworkers' compensation costs andreserves included in short-term worksite employeeWSE related liabilities or
short term worksite related assets if funds are held by third parties to cover the claims, whileliabilities. Claim costs expected to be paid beyond one year are included in long-term liabilitiesliabilities.
Insurance carriers are responsible for administering and paying claims. We are responsible for reimbursing each carrier up to a deductible limit per occurrence.
We have collateral agreements with various insurance carriers where either we retain custody of funds in trust accounts which we record as restricted cash and cash equivalents, or long term workers compensation receivables ifremit funds areto carriers. Collateral whether held by third partiesus, or the carriers, is used to cover the claims on the consolidated balance sheets. Assets heldsettle our insurance and claim deductible obligations to them. Collateral is calculated by third parties to cover claim liabilities remainpolicy year and remains restricted until the planpolicy year is fully settled. Collateral paid to carriers, by agreement permits net settlement of obligations against collateral held, which they relate are settled.
Atwe record net of our loss reserves (Carrier Collateral Offset). Any excess funds held by carriers over our recorded loss reserves by policy inception, annual premiums are estimatedyear can be returned to us based on projected wages over the durationagreements with them. Based on the estimated timing of return, such excess funds are recorded as workers' compensation collateral receivable, in WSE related assets or in long-term assets.
Health Benefits Loss Reserves
We sponsor and administer a number of fully-insured, risk based employee benefit plans, including group health, dental, and vision as an employer plan sponsor under section 3(5) of the policy period. As actual wagesEmployee Retirement Income Security Act (ERISA). Approximately 38% of our 2016 group health insurance premiums were for guaranteed-cost policies which are realized, the amounts paidfully-insured policies where we are not responsible for premiums may differ from the estimates recordedany deductible. The remaining 62% by the Company, creating an asset or liability throughout the policypremium of our 2016 policies relate to fully-insured policies where we reimburse our health insurers for claims incurred within a per person deductible layer up to a maximum aggregate exposure limit per policy. These deductible dollar limits and maximum limits vary by carrier and year. Such differences could have a material effect on the Company’s consolidated financial position and results of operations.
Health Benefits
Health benefits insuranceloss reserves are established to provide for the estimated unpaid costs of reimbursing the carriers for paying claims within the deductible layer in accordance with health insurance policies. These reserves include estimates for reported losses, plus estimates for claims incurred but not reported. Reserves are determinedpaid. We assess reserves regularly by the Company based upon a number ofindependent actuarial studies that include other relevant factors including but not limited to actuarial calculations,such as current and historical claims payment patterns, plan enrollment and medical trend rates. Ultimate health insurance reserves may vary in subsequent years from the amounts estimated. As of December 31, 2015 and 2014, liability reserves of $113.2 million and $82.1 million, respectively, were recorded within health benefits payable and are included in WSE-related liabilities in the accompanying consolidated balance sheets.
Under certain contracts,policies, based on plan performance, the Companywe may be entitled to receive refunds of premiums.premiums which we recognize in accordance with the policy terms. We estimate these refunds based on premium and claims data and record these withinas a reduction in the insurance costs on the consolidated statements of income and prepaid health plan expenses and are included in WSE-relatedWSE related assets on the consolidated balance sheet.sheets. As of December 31, 2016 and 2015, we had $8.6 million and 2014, the Company had $6.8 million, and $4.9 million, respectively, included within WSE related assets as prepaid health plan expenses included within WSE-related assets.insurance premiums.
Cash and Cash Equivalents
Cash and cash equivalents include bank deposits and short-term, highly liquid investments. Investments with original maturity dates of three months or less are considered cash equivalents.
Restricted Cash, Cash Equivalents and Investments
The Company classifies itsRestricted cash and cash equivalents presented on our consolidated balance sheets represents our corporate cash and cash equivalents in trust accounts functioning as security deposits for our insurance carriers. These deposits are not used for settling insurance premiums or claims payments.
WSE related assets also includes restricted cash, cash equivalents and investments held in trust for current and future premium and claim obligations with our insurance carriers. Amounts are held in trust according to the terms of the relevant insurance policies and by the local insurance regulations of the jurisdictions in which the policies are in force.
Investments
We have investments primarily in marketable securities including U.S. treasuries, which are classified as available-for-saleavailable for sale and are carried at estimated fair value. Unrealized gains and losses are reported as a component of accumulated other comprehensive income.income (loss), net of deferred income taxes. The amortized cost of debtmarketable securities is adjusted for amortization of premiums and accretion of discounts from the date of purchase to maturity or sale. Such amortization is included in interest income as an addition to or deduction from the coupon interest earned on the investments. The Company usesWe use the specific identification method of determiningto determine the cost basis in computing realized gains and losses on the sale of its available-for-saleavailable for sale securities. Realized gains and losses are included in other income in the accompanying consolidated statementstatements of operations.income.
The Company assesses whetherWe assess our investments for an other-than-temporary impairment loss has occurred due to declinesa decline in fair value or other market conditions. With respectWe review several factors to debt securities, this assessment takes into account our currentdetermine whether a loss is other than temporary, such as the length and extent of the fair value decline, the financial condition and near-term prospects of the issuer and whether we have the intent to sell or not sell, the security, and whether it iswill more likely than not that we will not be required to sell before the securities' anticipated recovery, which may be at maturity. If management determines that a security before recoveryis impaired under these circumstances, the impairment recognized in earnings is measured as the entire difference between the amortized cost and the then-current fair value.
Fair Value of Financial Instruments
Fair value is an exit price, representing the amount that would be received to sell an asset or paid to transfer a liability in an orderly transaction between market participants at the measurement date. As such, fair value is a market-based measurement that should be determined based on assumptions that market participants would use in pricing an asset or a liability.
Our financial assets recorded at fair value on a recurring basis are comprised of available for sale marketable securities and certificates of deposits. We measure certain financial assets at fair value for disclosure purposes, as well as on a nonrecurring basis when they are deemed to be other-than-temporarily impaired. Our other current financial assets and our other current financial liabilities, including cash and cash equivalents, restricted cash and cash equivalents, WSE related assets and liabilities excluding insurance loss reserves, line of credit and accrued corporate wages, have fair values that approximate their carrying value due to their short-term nature.
Assets and liabilities recorded at fair value are measured and classified in accordance with a three-tier fair value hierarchy based on the observability of the inputs available in the market to measure fair value, summarized as follows:
Level I—observable inputs for identical assets or liabilities, such as quoted prices in active markets,
Level II—inputs other than the quoted prices in active markets that are observable either directly or indirectly,
Level III—unobservable inputs in which there is little or no market data, which requires that we develop our own assumptions.
The fair value hierarchy requires us to maximize the use of observable inputs and minimize the use of unobservable inputs when measuring fair value. We classify our cash equivalents, debt securities and notes payable in the fair value hierarchy based on the lowest level input that is significant to the fair value measurement in its amortized cost.entirety.
WSE related Assets and Liabilities
Current assets and liabilities resulted from transactions directly or indirectly associated with WSEs, including payroll and related taxes and withholdings, our sponsored workers' compensation and health insurance programs, and other benefit programs, are reported in WSE related assets and liabilities on the consolidated balance sheets. These assets
and liabilities are reported separately from our corporate assets and liabilities to better distinguish our corporate position from those assets and liabilities held by us to fund client payrolls.
Unbilled Revenue
We recognize WSE payroll and payroll tax liabilities in the period in which the WSEs perform work. When clients' pay periods cross reporting periods, we accrue the portion of the unpaid WSE payroll and the corresponding payroll tax liabilities associated with the work performed prior to period-end. These estimated payroll and payroll taxes liabilities as accrued wages in WSE related liabilities. The associated receivables, including estimated revenues, offset by advance collections from clients, are recorded as unbilled revenues in WSE related assets.
Accounts Receivable
The Company’sOur accounts receivable whichrecorded in WSE related assets, represent outstanding gross billings to clients, are reported net of an allowance for doubtful accounts. The Company establishesWe establish an allowance for doubtful accounts based on historical experience, the age of the accounts receivable balances, credit quality of clients, current economic conditions and other factors that may affect clients’ ability to pay, and charges offcharge-off amounts when they are deemed uncollectible.
Property and Equipment
The Company recordsWe record property and equipment at historical cost and computescompute depreciation using the straight-line method over the estimated useful lives of the assets or the lease terms, generally three to five years for software and office
equipment, five to seven years for furniture and fixtures, and the shorter of the asset life or the remaining lease term for leasehold improvements. The Company expensesWe expense the cost of maintenance and repairs as incurred and capitalizes betterments.capitalize leasehold improvements.
Internal Use Software
The Company capitalizesWe capitalize internal and external costs incurred to develop internal-use computer software during the application development stage. Application development stage costs include license fees paid to third-parties for software use, software configuration, coding, and installation. Capitalized costs are amortized on a straight-line basis over the estimated useful life, typically ranging from three to five years, commencing when the software is placed into service. The Company expensesWe expense costs incurred during the preliminary project stage, as well as general and administrative, overhead, maintenance and training costs, and costs that do not add functionality to existing systems. For the years ended December 31, 2016, 2015 2014 and 2013,2014, internally developed software costs capitalized were $21.3 million, $11.2 million and $6.3 million respectively.
We periodically assess the likelihood of unsuccessful completion of projects in progress, as well as monitor events or changes in circumstances, which might suggest that impairment has occurred and $3.3 million respectively.recoverability should be evaluated. An impairment loss is recognized if the carrying amount of the asset is not recoverable and exceeds the future net cash flows expected to be generated by the asset.
Goodwill and Other Intangible Assets
The Company’sOur goodwill and identifiable intangible assets with indefinite useful lives are not amortized, but instead are tested for impairment on an annual basis or when an event occurs or circumstances change in a way to indicate that there has been a potential decline in the fair value of the reporting unit. ImpairmentGoodwill impairment is determined by comparing the estimated fair value of the reporting unit to its carrying amount, including goodwill. The Company’sOur business is largely homogeneous and, as a result, all goodwill is associated with the Company’s one reporting unit within our reportable segment.
Annually, we perform a qualitative assessment to determine whether it is more likely than not that the fair value of the reporting unit has declined below carrying value. This assessment considers various financial, macroeconomic, industry, and reporting unit specific qualitative factors. We perform our annual impairment testing in the fourth quarter. Based on the results of our reviews, no impairment loss was recognized in the results of operations for the years ended December 31, 2016, 2015 and 2014.
Intangible assets with finite useful lives include purchased client lists, trade names, developed technologies, and contractual agreements. Intangible assets are amortized over their respective estimated useful lives ranging from two to sixten years using either the straight-line method or an accelerated method. Intangible assets are reviewed for indicators of impairment at least annually and evaluated for impairment whenever events or changes in circumstances indicate that the carrying amount of an asset may not be recoverable. Based on the results of the Company’sour reviews, no impairment loss was recognized in the results of operations for the years ended December 31, 2016, 2015 2014 and 2013.2014.
Annually, the Company performs a qualitative assessment to determine whether it is more likely than not that the fair value of the reporting unit has declined below carrying value. This assessment considers various financial, macroeconomic, industry, and reporting unit specific qualitative factors. The Company performs its annual impairment testing in its fiscal fourth quarter. Based on the results of the Company’s reviews, no impairment loss was recognized in the results of operations for the years ended December 31, 2015, 2014 and 2013.
Impairment of Long-Lived Assets
The Company evaluates itsWe evaluate our long-lived assets for impairment whenever events or changes in circumstances indicate that the carrying amount of an asset may not be recoverable. An asset is considered impaired if the carrying amount exceeds the undiscounted future net cash flows the asset is expected to generate. An impairment charge is recognized for the amount by which the carrying amount of the assets exceeds its fair value. Assets to be disposed of are reported at the lower of the carrying amount or fair value, less selling costs.
Advertising Costs
The Company expensesWe expense the costs of producing advertisements at the time production occurs, and expensesexpense the cost of running advertisements in the period in which the advertising space or airtime is used as sales and marketing expense. Advertising costs were $6.4 million, $8.2 million, $7.3 million, and $7.5$7.3 million for the years ended December 31, 2016, 2015 2014 and 2013,2014, respectively.
Stock-Based Compensation
The Company has issuedWe have three types of stock-based awards to employees: restricted stock units (time based and performance based), stock options and an employee stock purchase plan. Compensation expense associated with restricted stock units is based on the fair value of common stock on the date of grant. Compensation expense associated with stock options and employee stock purchase plan are based on the estimated grant date fair value method using the Black-Scholes valuationoption pricing model. Expense is recognized using a straight-line amortization method over the respective vesting period for awards that are ultimately expected to vest. Accordingly, stock-based compensation has been reduced for estimated forfeitures. When estimating forfeitures, the Company
considerswe consider voluntary termination behaviorsbehavior as well as trends of actual option forfeitures. A tax benefit from stock-based compensation is recognized in equityadditional paid in capital to the extent that an incremental tax benefit is realized.
Income Taxes
The Company recognizesWe account for our provision for income taxes using the asset and liability method, under which we recognize income taxes payable or refundable for current year and deferred tax assets and liabilities for estimated future tax effectseffect of events that have been recognized in our financial statements or tax returns. We measure our current and deferred tax assets and liabilities based on provision of enacted tax laws of those jurisdictions in which we operate. The effect of changes in tax laws and regulations, or interpretations, is recognized in our consolidated financial statements in the period that includes the enactment date.
We recognize deferred tax assets and liabilities based on temporary differences between the carrying amounts of assets and liabilities for financial reporting purposes and amounts used for income tax purposes, under currentas well as the expected benefits of using net operating loss and other carryforwards. We are required to establish a valuation allowance when it is determined more likely than not that the deferred tax laws. Deferred tax expense results fromassets will not be realized. Provision for income taxes may change when estimates used in determining valuation allowances change or when receipt of new information indicates the need for adjustment in valuation allowances. Changes in valuation allowances are reflected as a component of provision for income taxes in the period the change in the net liability for deferred income taxes between periods.is enacted.
The Company maintainsWe recognize a reserve for uncertain tax positions. The Company evaluates tax positions taken or expected to be taken in a tax return for recognition in its consolidated financial statements. Prior to recording the related tax benefit in the consolidated financial statements, the Company must concludewhen it is concluded that tax positions are not more likely than not to be sustained assuming those positions will be examinedupon examination by taxing authorities, with full knowledgeincluding resolution of all relevant information. The benefit recognized inany related appeals or litigation processes, based on the consolidated financial statements istechnical merits of the amount the Company expects to realize after examination by taxing authorities. If a tax position drops below the more likely than not standard, the benefit can no longer be recognized.positions. Assumptions, judgment and the use of estimates are required in determining if the more likely than not standard has been met when developing the provision for income taxes and in determining the expected benefit. A changeThe tax benefits of the position recognized in the assessmentfinancial statements are then measured based on the largest amount of benefit that is greater than 50% likely to be realized upon settlement with a taxing authority. Unrecognized tax benefits due to tax uncertainties that do not meet the more likely than not standard could materially impactminimum probability threshold are included as other liabilities and are charged to earnings in the Company’s results of operations or financial position. The Company recognizesperiod that such determination is made. We recognize interest and penalties related to uncertain tax positions as a component of income tax expense. Accrued interest and penalties are included in other liabilities on the consolidated balance sheet.
Concentrations of Credit Risk
Financial instruments that subject the Company to concentrations of credit risk include cash, and cash equivalents investments, restricted cash and restricted investments (including payroll funds collected), accounts receivable, and amounts due from insurance carriers. The Company maintains its cash and cash equivalents, investments, restricted cash and restricted investments (including payroll funds collected)We maintain these financial
assets principally in domestic financial institutions and performsinstitutions. We perform periodic evaluations of the relative credit standing of these institutions. The Company’sOur exposure to credit risk in the event of default by the financial institutions holding these funds is limited to amounts currently held by the institution in excess of insured amounts.
Under the terms of professional services agreements, clients agree to maintain sufficient funds or other satisfactory credit at all times to cover the cost of itstheir current payroll, all accrued paid time off, vacation or sick leave balances, and other vested wage and benefit obligations for all their work site employees. The CompanyWe generally requiresrequire payment from itsour clients on or before the applicable payroll date.
For certain clients, the Company requireswe require an indemnity guarantee payment (IGP) supported by a letter of credit, bond, or a certificate of deposit from certain financial institutions. The IGP typically equals the total payroll and service fee for one average payroll period.
As of December 31, 2015 and2016, no client accounted for more than 10% of total accounts receivable. As of December 31, 2014,2015, one client accounted for 12% of total accounts receivable. No client accounted for more than 10% of total revenues in the years ended December 31, 2016, 2015 2014 and 2013.2014. Bad debt expense, net of recoveries was $1.3 million, $2.0 million $1.4 million and $0.6$1.4 million for the years ended December 31, 2016, 2015 2014 and 2013,2014, respectively.
Recent Accounting Pronouncements
Recently adopted accounting guidance
Debt issuance costs - In February 2016,April 2015, the Financial Accounting Standards Board or (FASB), issued Accounting Standards Update (ASU) 2016-02—2015-03-Simplifying the Presentation of Debt Issuance Costs, and, in August 2015, the FASB issued ASU 2015-15, Presentation and Subsequent Measurement of Debt Issuance Costs Associated with Line-of-Credit Arrangements. These ASUs require debt issuance costs related to a recognized debt liability to be presented in the balance sheet as a direct deduction from the carrying amount of that debt, which is consistent with the presentation of debt discounts and premiums. The presentation and subsequent measurement of debt issuance costs associated with lines of credit, may be presented as an asset and amortized ratably over the term of the line of credit arrangement, regardless of whether there are outstanding borrowings on the arrangement. The recognition and measurement guidance for debt issuance costs are not affected by these ASUs.
We adopted these ASUs as of March 31, 2016. The adoption of these ASUs resulted in a reclassification of unamortized debt issuance costs of $2.4 million from other current assets to current portion of notes and capital leases payable and $3.4 million from other assets to notes and capital leases payable, less current portion, as of December 31, 2015. Unamortized debt issuance costs related to our revolving credit facility will remain classified within other assets in the accompanying consolidated balance sheets. The adoption of this guidance did not have any impact on our consolidated statements of income, comprehensive income or cash flows.
Recent issued accounting pronouncements
Lease arrangements - In February 2016, the FASB, issued ASU 2016-02-Leases. The amendment requires that lease arrangements longer than 12 months result in an entity recognizing an assetlease assets and liability. lease liabilities. Most significant impact is on those leases classified as operating leases under previous U.S. GAAP. Under the new standard, disclosures are required to meet the objective of enabling users of financial statements to assess the amount, timing, and uncertainty of cash flows arising from leases.
The amendment is effective for annual reporting periods, and interim periods within those years beginning after December 15, 2018. Early adoption is permitted. The Company is currently inpermitted, the process of evaluatingnew standard will be effective for us beginning January 1, 2018. We will be required to recognize and measure leases at the impactbeginning of the earliest period presented using a modified retrospective approach. We currently anticipate early adoption of the new standard effective January 1, 2018 in conjunction with our adoption of the new revenue standard. Our ability to early adopt is dependent on system readiness and the completion of our analysis of information necessary to restate prior period financial statements.
As of December 31, 2016, we had a total of $64.6 million non-cancelable operating lease commitments. We anticipate this standard will have a material impact on itsour consolidated financial statements. While we are continuing to assess all potential impacts of the standard, we currently believe the most significant impact relates to our accounting for equipment, office and data-center operating leases.
Financial Instruments - In January 2016, the FASB issued ASU 2016-01—2016-01-Recognition and Measurement of Financial Assets and Financial Liabilities. The amendment addresses various aspects of the recognition, measurement, presentation, and disclosure for financial instruments. The amendment is effective for annual reporting periods, and interim periods within those years beginning after December 15, 2017. Early adoption by public entities is permitted only for certain provisions. The Company isWe are currently in the process of evaluating the impact of the adoption of this standard on itsour consolidated financial statements.
In November 2015, the FASB issued ASU 2015-17—Revenue Recognition - Balance Sheet Classification of Deferred Taxes, as part of its initiative to reduce complexity in accounting standards (the Simplification Initiative). The amendment requires that deferred tax liabilities and assets be classified as noncurrent in a classified statement of financial position. The amendment is effective for
fiscal years, and interim periods within those fiscal years, beginning after December 15, 2016. Early adoption is permitted. The Company adopted this guidance in 2015 with retrospective application. See Note 11 for further details.
In April 2015, the FASB issued ASU 2015-05—Intangibles—Goodwill and Other—Internal-Use Software, as part of the Simplification Initiative. The amendment provides guidance to clarify the customer’s accounting for fees paid in a cloud computing arrangement. The amendment is effective for fiscal years, and interim periods within those fiscal years, beginning after December 15, 2015. Early adoption is permitted. The Company expects to adopt this guidance in 2016. The Company does not expect this guidance to have a material effect on its consolidated financial statements.
In April 2015, the FASB issued ASU 2015-03—Interest—Imputation of Interest, as part of its Simplification Initiative. The amendment requires that debt issuance costs related to a recognized debt liability be presented in the balance sheet as a direct deduction from the carrying amount of that debt liability, consistent with debt discounts. The amendment is effective for fiscal years, and interim periods within those fiscal years, beginning after December 15, 2015. Early adoption is permitted for financial statements that have not been previously issued. The Company expects to adopt this guidance in 2016. The Company does not expect this guidance to have a material effect on its consolidated financial statements.
In August 2014, the FASB issued ASU 2014-15—Presentation of Financial Statements—Going Concern (Subtopic 205-40), which addresses management’s responsibility to evaluate whether there is substantial doubt about an entity’s ability to continue as a going concern and to provide related footnote disclosures. Management’s evaluation should be based on relevant conditions and events that are known and reasonably knowable at the date that the financial statements are issued. The standard will be effective for the first interim period within annual reporting periods beginning after December 15, 2016. Early adoption is permitted. The Company does not expect to adopt this guidance early and does not believe that the adoption of this guidance will have a material effect on its consolidated financial statements.
In June 2014, the FASB issued ASU 2014-12—Compensation—Stock Compensation, which requires that a performance target that affects vesting and that could be achieved after the requisite service period be treated as a performance condition. ASU 2014-12 is effective for annual reporting periods, and interim periods within those years, beginning after December 15, 2015. Early adoption is permitted. The amendments may be applied prospectively to all awards granted or modified after the effective date or retrospectively to all awards with performance targets that are outstanding as of the beginning of the earliest annual period presented. The Company does not expect this guidance to have a material effect on its consolidated financial statements. The Company expects to adopt this guidance in 2016.
In May 2014, the FASB issued ASU 2014-09—2014-09-Revenue from Contracts with Customers, which will replace most existing revenue recognition guidance under GAAP. The core principle of the guidance is that an entity should recognize revenue to depict the transfer of promised goods or services to customers in an amount that reflects the consideration to which the entity expects to be entitled in exchange for those goods or services. The standard provides a five-step analysis of transactions to determine when and how revenue is recognized. In July 2015, the FASB deferred the effective date to annual reporting periods, and interim periods within those years, beginning after December 15, 2017. Early adoption at the original effective date of December 15, 2016 is permitted. The amendments may be applied retrospectively or as a cumulative-effect adjustment as of the date of adoption. In March, April and May 2016, the FASB issued ASU 2016-08 Principal versus Agent Considerations (Reporting Revenue Gross versus Net), ASU 2016-10 Identifying Performance Obligations and Licensing, ASU 2016-12 Narrow-Scope Improvements and Practical Expedients and ASU 2016-20 Technical Corrections and Improvements, respectively, providing further clarification to be considered when implementing ASU 2014-09. The Company has not yet selected aguidance permits two methods of adoption: retrospectively to each prior reporting period presented (full retrospective method), or retrospectively with the cumulative effect of initially applying the guidance recognized at the date of initial application (the cumulative catch-up transition method). We currently anticipate adopting the standard using the full retrospective method to restate each prior reporting period presented.
The new standard will be effective for us beginning January 1, 2018. Our ability to adopt using the full retrospective method is dependent on system readiness and the completion of adoption and is currently evaluating the effect that the amendmentsour analysis of information necessary to restate prior period financial statements.
We anticipate this standard will have a material impact on our consolidated financial statements. While we are continuing to assess all potential impacts of the standard, we currently believe the adoption will have material impact on our accounting for sales commission expense, income tax provision and deferred taxes. We anticipate that certain client acquisition costs will be deferred over the expected client tenure. Additionally, we are assessing whether it remains appropriate to accrue assets and liabilities for unprocessed client payrolls where WSEs have performed work during the period. We expect our professional service revenues and insurance service revenues remain substantially unchanged. The actual revenue recognition treatment required under the standard will be dependent on contract-specific terms, and may vary in some instances from recognition at the time of billing.
Share-based payments - In March 2016, the FASB issued ASU 2016-09-Stock Compensation (Topic 718): Improvements to Employee Share-Based Payment Accounting, as part of the Simplification Initiative. Under this standard, among other changes, income tax benefits and deficiencies with respect to stock-based compensation will be recognized as income tax expense or benefit in the income statement, excess tax benefits will be classified as an operating activity on the statement of cash flows and stock-based compensation awards can qualify as equity awards even if the entity permits tax withholdings greater than the statutory minimum. ASU 2016-09 is effective for fiscal years beginning after December 15, 2016, including interim periods within that reporting period. We will adopt the guidance effective January 1, 2017.
The adoption of ASU 2016-09 is expected to impact income taxes expenses on our 2017 consolidated statements of income and the operating and financing cash flows on the consolidated statements of cash flows. The magnitude of such impacts are dependent upon our future grants of stock-based compensation, the stock price in relation to the fair value of awards on grant date, and the exercise behavior of the equity compensation holders. The Company will retrospectively adopt the presentation in the consolidated statements of cash flows, resulting in $4.6 million and $20.7 million increase in operating cash flows and decrease in financing cash flows for the years ended December 31, 2016 and 2015, respectively. We expect the remaining adjustments will not have a material effect on our consolidated financial statements.
Statement of Cash Flows - In November and August 2016, the FASB issued (ASU) 2016-18 - Statement of Cash Flows (Topic 230): Restricted Cash and 2016-15-Statement of Cash Flows (Topic 230): Classification of Certain Cash Receipts and Cash Payments. The new guidance is intended to reduce diversity in practice in how restricted cash and other certain transactions are classified in the statement of cash flows. The amendments are effective for annual reporting periods, and interim periods within those years beginning after December 15, 2017. Early adoption is permitted, provided that all of the amendments are adopted in the same period. The guidance requires application using a retrospective transition method.
As of December 31, 2016 and 2015, we had total restricted cash, restricted cash equivalents and payroll funds collected of $1.0 billion. Currently, changes in these balances are presented as operating cash activities in the consolidated statements of cash flows. Under the new guidance, changes in these amounts will be included with cash and cash equivalents when reconciling the beginning-of-period and end-of-period total amounts shown on the consolidated statements of cash flows.
NOTE 2. CASH, CASH EQUIVALENTS AND INVESTMENTS
Under the terms of the agreements with certain of our workers' compensation and health benefit insurance carriers, we are required to maintain collateral in trust accounts for the benefit of specified insurance carriers and to reimburse the carriers’ claim payments within our deductible layer. We invest a portion of the collateral amounts in marketable securities. We report the current portion of these trust accounts as restricted cash and cash equivalents in WSE related assets, and long term portion as restricted cash, cash equivalents and investments on the consolidated balance sheets.
We require our clients to prefund their payroll and related taxes and other withholding liabilities before payroll is processed or due for payment. This prefund is included in WSE related assets as payroll funds collected which is designated to pay pending payrolls and other WSE related liabilities.
Our total corporate and WSE related cash, cash equivalents and investments are summarized below:
|
| | | | | | | | | | | | | | | | | | | | | | | | |
| | December 31, 2016 | December 31, 2015 |
| (In thousands) | Cash and cash equivalents | Available for sale marketable securities | Certificate of deposits | Total | Cash and cash equivalents | Available for sale marketable securities | Certificate of deposits | Total |
| Cash and cash equivalents | $ | 184,004 |
| $ | — |
| $ | — |
| $ | 184,004 |
| $ | 166,178 |
| $ | — |
| $ | — |
| $ | 166,178 |
|
| Restricted cash and cash equivalents | 14,569 |
|
|
|
|
| 14,569 |
| 14,557 |
|
|
|
|
| 14,557 |
|
| Restricted cash, cash equivalents and investments, noncurrent | | | |
|
| | | |
|
|
| Collateral for workers' compensation claims | 78,672 |
| 51,829 |
| — |
| 130,501 |
| 38,711 |
| 63,095 |
| — |
| 101,806 |
|
| Worksite employee related assets | | | |
|
| | | |
|
|
| Restricted cash, cash equivalents and investments, current | | | |
|
| | | |
|
|
| Collateral for health benefits claims | 65,022 |
| — |
| — |
| 65,022 |
| 46,980 |
| — |
| — |
| 46,980 |
|
| Collateral for workers' compensation claims | 64,773 |
|
|
|
|
| 64,773 |
| 45,937 |
| 1,500 |
|
|
| 47,437 |
|
| Investments | — |
| — |
| 2,320 |
| 2,320 |
| — |
| — |
| 2,319 |
| 2,319 |
|
| Total WSE related restricted cash, cash equivalents and investments, current | 129,795 |
| — |
| 2,320 |
| 132,115 |
| 92,917 |
| 1,500 |
| 2,319 |
| 96,736 |
|
| Payroll funds collected | 825,958 |
| — |
| — |
| 825,958 |
| 859,322 |
| — |
| — |
| 859,322 |
|
| Total | $ | 1,232,998 |
| $ | 51,829 |
| $ | 2,320 |
| $ | 1,287,147 |
| $ | 1,171,685 |
| $ | 64,595 |
| $ | 2,319 |
| $ | 1,238,599 |
|
NOTE 2.3. WORKSITE EMPLOYEE-RELATEDEMPLOYEE RELATED ASSETS AND LIABILITIES
The following schedule presentsWSE related assets and WSE related liabilities are intended to be reviewed together when considering the componentsposition of the Company’s WSE-relatedcompany. The client directs the price and service specifications for payroll and payroll taxes and as a result, we are not the primary obligor for payroll and payroll tax payments and therefore, record these amounts net in our statements of income. However, we record without offset, accrued wages and payroll tax liabilities for WSEs in WSE related liabilities with the related payroll funds collected and unbilled revenues in WSE related assets. We have classified these assets and WSE-related liabilities (in thousands):and other service related amounts, collectively as WSE related, to present a clearer picture of the inter-relationship of the balances and distinguish these from our other corporate assets and liabilities.
In addition to unbilled revenues, accrued wages and payroll tax liabilities, other significant balances included in the WSE related assets and liabilities include: |
| | | | | | | |
| | December 31, 2015 | | December 31,
2014 |
| Worksite employee-related assets: | | | |
| Restricted cash | $ | 92,917 |
| | $ | 64,890 |
|
| Restricted investments | 3,819 |
| | 4,555 |
|
| Payroll funds collected | 859,322 |
| | 1,336,994 |
|
Unbilled revenue, net of advance collections of $11,875 and $113,190 at December 31, 2015 and December 31, 2014, respectively | 213,837 |
| | 203,599 |
|
Accounts receivable, net of allowance for doubtful accounts of $1,158 and $388 at December 31, 2015 and December 31, 2014, respectively | 5,060 |
| | 5,193 |
|
| Prepaid health plan expenses | 8,088 |
| | 4,932 |
|
| Refundable workers compensation premiums | 2,428 |
| | 7,975 |
|
| Prepaid workers compensation expenses | 744 |
| | 1,256 |
|
| Other payroll assets | 187,171 |
| | 5,742 |
|
| Total worksite employee-related assets | $ | 1,373,386 |
| | $ | 1,635,136 |
|
| Worksite employee-related liabilities: | | | |
|
| Unbilled wages accrual | $ | 202,396 |
| | $ | 292,906 |
|
| Payroll taxes payable | 883,608 |
| | 1,119,427 |
|
| Health benefits payable | 128,028 |
| | 104,220 |
|
| Customer prepayments | 57,758 |
| | 53,770 |
|
| Workers compensation payable | 66,174 |
| | 36,778 |
|
| Other payroll deductions | 31,533 |
| | 23,454 |
|
| Total worksite employee-related liabilities | $ | 1,369,497 |
| | $ | 1,630,555 |
|
Other payroll assets andprimarily include payroll taxes payable above include a receivable due from one client attax receivables. As of December 31, 2015, forthere was a receivable of $181 million from one client related to an end of year payroll tax liability for which funding was received in January 2016.
Client deposits represent IGP payments received from clients and collections from clients in excess of payroll and other payroll related liabilities;
Other payroll withholdings primarily include withholdings under 401(k) plans and flexible benefit plans.
|
| | | | | | |
| (In thousands) | December 31, 2016 | December 31, 2015 |
| Worksite employee related assets: | | |
| Restricted cash, cash equivalents and investments | $ | 132,115 |
| $ | 96,736 |
|
| Payroll funds collected | 825,958 |
| 859,322 |
|
Unbilled revenues (net of advance collections of $8,602 and $11,875 at December 31, 2016 and 2015, respectively) | 293,192 |
| 213,837 |
|
Accounts receivable (net of allowance for doubtful accounts of $292 and $1,158 at December 31, 2016 and 2015, respectively) | 4,854 |
| 5,060 |
|
| Prepaid insurance premiums | 12,805 |
| 8,832 |
|
| Workers' compensation collateral receivable | 2,136 |
| 2,428 |
|
| Other payroll assets | 10,411 |
| 187,171 |
|
| Total worksite employee related assets | $ | 1,281,471 |
| $ | 1,373,386 |
|
| | | |
| Worksite employee related liabilities: | | |
|
| Accrued wages | $ | 272,966 |
| $ | 202,396 |
|
| Client deposits | 56,182 |
| 57,758 |
|
| Payroll tax liabilities | 692,460 |
| 883,608 |
|
| Unpaid losses and loss adjustment expenses (less than 1 year): | | |
| Health benefits loss reserves | 129,430 |
| 112,658 |
|
Workers' compensation loss reserves (net of collateral paid of $9,234 and $11,761 at December 31, 2016 and 2015, respectively) | 63,702 |
| 57,731 |
|
| Insurance premiums and other payables | 14,223 |
| 23,813 |
|
| Other payroll withholdings | 47,032 |
| 31,533 |
|
| Total worksite employee related liabilities | $ | 1,275,995 |
| $ | 1,369,497 |
|
Included in the payroll tax liabilities and insurance premiums and other payables were amounts relating to approximately 2,600 and 2,500 of our corporate employees at December 31, 2016 and 2015, respectively.
Payroll taxes payable, workers compensation payable and health benefits payable also include the related amounts of approximately 2,500 Company employees.
NOTE 3. WORKERS4. WORKERS' COMPENSATION
The Company has agreements with various insurance carriers to provide workers compensation insurance coverage for worksite employees, including programs where either the Company or the carrier retains custody of claim deposits paid by the Company. Insurance carriers are responsible for administrating and paying claims. The Company is responsible for reimbursing each carrier up to a deductible limit per occurrence. In cases where the carriers retain custody, any excess deposits held by the carrier can be returned to the Company over time, based on terms defined within the respective agreements. LOSS RESERVES
The following summarizes the activities in the consolidated balance sheetsheets for unpaid claims and claims adjustment expenses within workersworkers' compensation assets and liabilities (in thousands):liabilities:
|
| | | | | | | |
| | Year Ended December 31, |
| | 2015 | | 2014 |
Programs where assets are held by the Company to cover claims liabilities
| | | |
| Liability for unpaid claims and claims adjustment at beginning of period | $ | 92,406 |
| | $ | 58,610 |
|
| | | | |
| Incurred related to: | | | |
| Current year | 88,438 |
| | 61,669 |
|
| Prior years | 4,880 |
| | (4,725 | ) |
| Total incurred | 93,318 |
| | 56,944 |
|
| Paid related to: | | | |
| Current year | (16,076 | ) | | (11,003 | ) |
| Prior years | (30,453 | ) | | (12,145 | ) |
| Total paid | (46,529 | ) | | (23,148 | ) |
| | | | |
Reclassification from workers compensation receivable
| 5,045 |
| | — |
|
| Liability for unpaid claims and claims adjustment at end of period | $ | 144,240 |
| | $ | 92,406 |
|
| | | | |
Programs where assets are held by third parties to cover claims liabilities
| | | |
| Liability for unpaid claims and claims adjustment at the beginning of period | $ | 55,628 |
| | $ | 62,129 |
|
| Incurred related to: | | | |
| Current year | 699 |
| | 1,708 |
|
| Prior years | 21,511 |
| | 20,126 |
|
| Total incurred | 22,210 |
| | 21,834 |
|
| Paid related to: | | | |
| Current year | (300 | ) | | (2,083 | ) |
| Prior years | (26,631 | ) | | (26,252 | ) |
| Total paid | (26,931 | ) | | (28,335 | ) |
| | | | |
Reclassification to workers compensation liability
| (5,045 | ) | | — |
|
| Liability for unpaid claims and claims adjustment at end of period | $ | 45,862 |
| | $ | 55,628 |
|
| | | | |
| Total liability for unpaid claims and claims adjustment at end of period | 190,102 |
| | 148,034 |
|
| | | | |
| Assets held by third parties to cover claim liabilities | (58,522 | ) | | (95,372 | ) |
| Workers compensation premiums and other liabilities | 9,455 |
| | 19,820 |
|
| Other workers compensation assets | (1,012 | ) | | (136 | ) |
| Total net workers compensation liabilities | $ | 140,023 |
| | $ | 72,346 |
|
| | | | |
| Location on Consolidated Balance Sheet: | | | |
| Workers compensation liabilities | | | |
| Current portion included in worksite employee-related liability | $ | 66,174 |
| | $ | 36,778 |
|
| Long term portion | 105,481 |
| | 75,448 |
|
| Total | $ | 171,655 |
| | $ | 112,226 |
|
| | | | |
| Workers compensation receivables | | | |
| Current portion included in worksite employee-related asset | $ | 2,428 |
| | $ | 7,975 |
|
| Long term portion | 29,204 |
| | 31,905 |
|
|
| | | | | | | | | |
| | Year Ended December 31, |
| (in thousands) | 2016 | 2015 | 2014 |
| Total loss reserves, beginning of year | $ | 190,102 |
| $ | 148,034 |
| $ | 120,739 |
|
| Incurred | | | |
| Current year | 112,967 |
| 89,137 |
| 63,377 |
|
| Prior years | 28,243 |
| 26,391 |
| 15,401 |
|
| Total incurred | 141,210 |
| 115,528 |
| 78,778 |
|
| Paid | | | |
| Current year | (14,411 | ) | (16,376 | ) | (13,086 | ) |
| Prior years | (62,287 | ) | (57,084 | ) | (38,397 | ) |
| Total paid | (76,698 | ) | (73,460 | ) | (51,483 | ) |
| Total loss reserves, end of year | $ | 254,614 |
| $ | 190,102 |
| $ | 148,034 |
|
| Collateral paid to carriers and offset against loss reserves | (31,611 | ) | (26,890 | ) | (55,492 | ) |
| Total loss reserves, net of carrier collateral offset | $ | 223,003 |
| $ | 163,212 |
| $ | 92,542 |
|
| | | | |
Payable in less than 1 year (1) (net of collateral paid to carriers of $9,234, $11,761 and $10,275 as of December 31, 2016, 2015 and 2014, respectively) | 63,702 |
| 57,731 |
| 17,094 |
|
Payable in more than 1 year (net of collateral paid to carriers of $22,377, $15,129 and $45,217 as of December 31, 2016, 2015 and 2014, respectively) | 159,301 |
| 105,481 |
| 75,448 |
|
| Workers' Compensation Loss Reserves | $ | 223,003 |
| $ | 163,212 |
| $ | 92,542 |
|
Incurred claims related to prior years represent changes in estimates for ultimate losses on workersworkers' compensation claims.
Under the terms of certain agreements with workers compensation insurance carriers, the Company collects and holds premiums in restricted accounts pending claims payments by the claims administrator. As of December 31, 2015 and December 31, 2014, such restricted amounts of $49.8 million and $36.5 million, respectively, are presented as restricted cash and restricted investments within WSE-related assets in the accompanying consolidated balance sheets. In addition, at December 31, 2015 and December 31, 2014, $101.8 million and $69.4 million, respectively, are presented as restricted long-term cash and investments. Assets held by third parties to cover claim liabilities represents prefunded claim obligations paid to carriers in excess of estimated total claim liabilities, which will be applied to incurred claims. The funds remain restricted until the plan year to which they relate are settled.
The reclassification from workers compensation receivable to workers compensation liability resulted from the return of collateral to the Company following a negotiated amendment of the underlying contract with a carrier.
NOTE 4. BUSINESS COMBINATIONS
Periodically, as part of the Company’s strategic objectives, the Company may acquire other companies or may acquire strategic technologies which may be considered an acquisition of a business. During For the year ended December 31, 2016, the adverse development was primarily due to higher than expected severity of reported claims associated with our non-office WSEs in recent accident years. For the years ended December 31, 2015 and 2014, the Company’s strategic acquisition activityadverse development resulted from changes in estimates for ultimate losses associated with non-office WSEs.
As of December 31, 2016, 2015 and 2014, we had $65.6 million, $58.5 million and $95.4 million, respectively, collateral held by insurance carriers of which $31.6 million, $26.9 million and $55.5 million was offset against workers' compensation loss reserves as the paymentagreements permit and are net settled of aggregate purchase consideration of approximately $4.8 million, consisting solely of cash. The purchase priceinsurance obligations against collateral held. Collateral paid to each carrier for each business combination is allocated to tangible and identifiable intangible assets acquired and liabilities assumed based on the fair value at the date of purchase. Purchase pricea policy year in excess of the identifiable assets and liabilities isour loss reserves are recorded as goodwill. The allocation of the aggregate purchase consideration resulted in intangible assets of $4.4 million and goodwill of $0.4 million. The intangible assets have a useful life of 5 years. The consolidated financial statements include the operating results of strategic acquisitions considered to be a business since the respective date of the acquisition. Pro forma results of operations have not been presented as the acquisition activity is not material to the Company. All acquisition-related costs are expensed as incurred and recorded in operating expenses. The Company includes operations associated with acquisitions from the date of acquisition.workers' compensation collateral receivable.
The Company made no acquisitions during 2014. In 2013, the Company acquired 100% of the outstanding equity of Ambrose Employer Group, LLC (Ambrose) for $195.0 million. Ambrose contributed revenues of $134.5 million and net income of $1.6 million to the Company from July 1, 2013 to December 31, 2013.
NOTE 5. PROPERTY AND EQUIPMENT, NET
Property and equipment, net, consistconsists of the following (in thousands):following:
|
| | | | | | | |
| | December 31,
2015 | | December 31,
2014 |
| Software | $ | 64,727 |
| | $ | 53,349 |
|
| Office equipment, including data processing equipment | 20,044 |
| | 18,550 |
|
| Leasehold improvements | 9,874 |
| | 7,092 |
|
| Furniture, fixtures, and equipment | 7,911 |
| | 6,450 |
|
| Projects in progress | 7,407 |
| | 6,786 |
|
| | 109,963 |
| | 92,227 |
|
| Accumulated depreciation | (72,119 | ) | | (59,929 | ) |
| Property and equipment, net | $ | 37,844 |
| | $ | 32,298 |
|
Software and furniture, fixtures, and equipment include amounts for assets under capital leases of $0.2 million and $1.4 million at December 31, 2015 and December 31, 2014, respectively. Accumulated depreciation of these assets was de minimis and $0.9 million at December 31, 2015 and December 31, 2014, respectively. Amortization of assets held under capital leases is included with depreciation expense in the accompanying consolidated statements of operations. |
| | | | | | |
| (In thousands) | December 31, 2016 | December 31, 2015 |
| Software | $ | 88,161 |
| $ | 64,727 |
|
| Office equipment, including data processing equipment | 20,974 |
| 20,044 |
|
| Leasehold improvements | 11,785 |
| 9,874 |
|
| Furniture, fixtures, and equipment | 11,421 |
| 7,911 |
|
| Projects in progress | 10,714 |
| 7,407 |
|
| Total | 143,055 |
| 109,963 |
|
| Less: Accumulated depreciation | (84,433 | ) | (72,119 | ) |
| Property and equipment, net | $ | 58,622 |
| $ | 37,844 |
|
Projects in progress consist primarily of software development costs. The Company capitalizes software development costs intended for internal use. The Companyinternally developed software, which we capitalize and amortize on a straight-line basis over the estimated useful life. We recognized depreciation expense for capitalized internally developed software of $10.2 million, $5.4 million, $5.2 million, and $4.5$5.2 million for the years ended December 31, 2015, 2014 and 2013, respectively. Accumulated depreciation for these assets was $34.5 million and $29.4 million at December 31,2016, 2015 and 2014, respectively. The Company periodically assesses the likelihood of unsuccessful completion of projects in progress, as well as monitoring events or changes in circumstances, which might suggest that impairment has occurred and recoverability should be evaluated. An impairment
loss is recognized if the carrying amount of the asset is not recoverable and exceeds the future net cash flows expected to be generated by the asset. Due to significant changes in the extent and manner in which assets were expected to be used, the Company recognized losses of $0.4 million, $0.9 million and $0.8 million for the years ended December 31, 2015, 2014 and 2013, respectively, and included these charges in depreciation expense in the accompanying consolidated statements of operations.
NOTE 6. GOODWILL AND OTHER INTANGIBLE ASSETS
The following schedule summarizes goodwill and other intangible assets (in thousands):assets:
| | | | December 31, 2015 | | December 31, 2016 | December 31, 2015 |
| | Weighted Average Amortization Period | | Gross Carrying Amount | | Accumulated Amortization | | Net Carrying Amount | |
| (In thousands) | | Weighted Average Amortization Period | Gross Carrying Amount | Accumulated Amortization | Net Carrying Amount | Gross Carrying Amount | Accumulated Amortization | Net Carrying Amount |
| Goodwill |
| | $ | 289,207 |
| | $ | — |
| | $ | 289,207 |
| | $ | 289,207 |
| $ | — |
| $ | 289,207 |
| $ | 289,207 |
| $ | — |
| $ | 289,207 |
|
| Amortizable intangibles: | | | | | | | | |
| Customer contracts | 5 years | | 209,850 |
| | (167,968 | ) | | 41,882 |
| 10 years | 209,850 |
| (182,168 | ) | 27,682 |
| 209,850 |
| (167,968 | ) | 41,882 |
|
| Trademark | 3 years | | 16,900 |
| | (16,467 | ) | | 433 |
| 3 years | 16,900 |
| (16,900 | ) | — |
| 16,900 |
| (16,467 | ) | 433 |
|
| Developed technology | 5 years | | 5,400 |
| | (1,173 | ) | | 4,227 |
| 5 years | 5,700 |
| (2,308 | ) | 3,392 |
| 5,400 |
| (1,173 | ) | 4,227 |
|
| Noncompete agreements | 3 years | | 1,940 |
| | (1,710 | ) | | 230 |
| 3 years | 1,940 |
| (1,940 | ) | — |
| 1,940 |
| (1,710 | ) | 230 |
|
| | 5 years | | 234,090 |
| | (187,318 | ) | | 46,772 |
| |
| Total | | $ | 523,297 |
| | $ | (187,318 | ) | | $ | 335,979 |
| | $ | 234,390 |
| $ | (203,316 | ) | $ | 31,074 |
| $ | 234,090 |
| $ | (187,318 | ) | $ | 46,772 |
|
We evaluate the remaining useful life of intangible assets annually to determine whether events and circumstances warrant a revision to the estimated remaining useful life. On October 1, 2016, we adjusted the estimated useful lives of customer contracts acquired from Ambrose, from a previously estimated useful life of 5 years to 10 years.
|
| | | | | | | | | | | | | |
| | December 31, 2014 |
| | Weighted Average Amortization Period | | Gross Carrying Amount | | Accumulated Amortization | | Net Carrying Amount |
| Goodwill | — | | $ | 288,857 |
| | $ | — |
| | $ | 288,857 |
|
| Amortizable intangibles: | | | | | | | |
| Customer contracts | 5 years | | 209,850 |
| | (134,454 | ) | | 75,396 |
|
| Trademark | 3 years | | 16,900 |
| | (11,761 | ) | | 5,139 |
|
| Developed technology | 5 years | | 1,000 |
| | (533 | ) | | 467 |
|
| Noncompete agreements | 3 years | | 1,940 |
| | (1,224 | ) | | 716 |
|
| | 5 years | | 229,690 |
| | (147,972 | ) | | 81,718 |
|
| Total | | | $ | 518,547 |
| | $ | (147,972 | ) | | $ | 370,575 |
|
Amortization expenseExpense related to amortizable intangibles amortization in future periods as of December 31, 20152016 is expected to be as follows (in thousands):follows:
| | | Year ending December 31: | | Amount (in thousands) |
| 2016 | $ | 19,255 |
| |
| 2017 | 17,497 |
| $ | 5,265 |
|
| 2018 | 8,700 |
| 5,199 |
|
| 2019 | 880 |
| 5,199 |
|
| 2020 and thereafter | 440 |
| |
| 2020 | | 4,759 |
|
| 2021 and thereafter | | 10,652 |
|
| Total | $ | 46,772 |
| $ | 31,074 |
|
NOTE 7. MARKETABLE SECURITIESFINANCIAL INSTRUMENTS AND FAIR VALUE MEASUREMENTS
The Company’s noncurrentCash, Cash equivalents and Restricted Investments
We classify our cash, cash equivalents and restricted cash and investments include $63.1 million of available-for-salein marketable securities and $38.7 million of cash collateral at December 31, 2015. The Company’s restricted investments within WSE-related assets include $2.3 million ofLevel I in the fair value hierarchy because we use quoted market prices to determine the fair value. We classify our certificates of deposit and $1.5 million of available-for-sale marketablewithin Level II in the fair value hierarchy as we use a market approach that compares fair values on certificates with similar maturities. We have no available for sale securities included in Level III as of December 31, 2016 and 2015. There was no transfer of any assets and liabilities between Levels during years ended December 31, 2016 and 2015.
The available-for-sale marketable securitiesfollowing table summarizes our investments by significant categories and fair value measurement on a recurring basis as of December 31, 20152016 and December 31, 2014 consist of the following (in thousands):2015:
| | | | Amortized Cost | | Gross Unrealized Gains | | Gross Unrealized Losses | | Estimated Fair Value | |
| December 31, 2015: | | | | | | | | |
| (In thousands) | | Maturity (in years) | Amortized Cost | Gross Unrealized Gains | Gross Unrealized Losses | Fair Value |
| December 31, 2016 | | | |
| Level 1: | | | |
| Investments: | | | |
|
|
| U.S. treasuries | $ | 64,226 |
| | $ | 9 |
| | $ | (144 | ) | | $ | 64,091 |
| < 3 | $ | 51,376 |
| $ | 25 |
| $ | (77 | ) | $ | 51,324 |
|
| Mutual funds | 500 |
| | 4 |
| | — |
| | 504 |
| N/A | 500 |
| 5 |
| — |
| 505 |
|
| Total investments | $ | 64,726 |
| | $ | 13 |
| | $ | (144 | ) | | $ | 64,595 |
| | $ | 51,876 |
| $ | 30 |
| $ | (77 | ) | $ | 51,829 |
|
| December 31, 2014: | | | | | | | | |
| Level 2: | | | |
| Certificates of deposit | | < 1 | $ | 2,320 |
| $ | — |
| $ | — |
| 2,320 |
|
| Total | | | | $ | 54,149 |
|
| | | | |
| December 31, 2015 | | | |
| Level 1: | | | |
| Investments | | | |
| U.S. treasuries | $ | 50,075 |
| | $ | 22 |
| | $ | (15 | ) | | $ | 50,082 |
| < 4 | $ | 64,226 |
| $ | 9 |
| $ | (144 | ) | $ | 64,091 |
|
| Mutual funds | 500 |
| | 6 |
| | — |
| | 506 |
| N/A | 500 |
| 4 |
| — |
| 504 |
|
| Total investments | $ | 50,575 |
| | $ | 28 |
| | $ | (15 | ) | | $ | 50,588 |
| | $ | 64,726 |
| $ | 13 |
| $ | (144 | ) | $ | 64,595 |
|
| Level 2: | | | |
| Certificates of deposit | | < 1 | $ | 2,319 |
| $ | — |
| $ | — |
| $ | 2,319 |
|
| Total | | | | $ | 66,914 |
|
There were node minimis realized gains or losses for the yearyears ended December 31, 20152016 and 2014. As2015. We had $0.1 million gross unrealized losses in our U.S. Treasury securities as of December 31, 20152016 and December 31, 2014, the contractual maturities2015. The fair value of the U.S. treasuries were one to four years.
As of December 31, 2015, certain of the Company’s U.S. treasuries werethese securities in an unrealized loss position. position represented 58% and 81% of the total fair value of all U.S. Treasury securities as of December 31, 2016 and 2015, respectively.
Unrealized losses are principally due tocaused by changes in interest rates. In analyzing an issuer’sissuer's financial condition, the Company considerswe consider whether the securities are issued by the federal government or its agencies, whether downgrades by bond rating agencies have occurred, and industry analysts’analysts' reports. The fair value ofAs we have the ability to hold these securities in an unrealized loss position represented 81% and 59% of the total fair value of all securities available for sale as of December 31, 2015 and December 31, 2014, respectively, and their unrealized losses were $0.1 million and de minimis as of December 31, 2015 and December 31, 2014. As the Company has the ability and intent to hold debtmarketable securities until maturity, or for the foreseeable future, as classified as available for sale, no decline was deemed to be other-than-temporary.
Fair value is an exit price, representing the amount that would be received to sell an asset or paid to transfer a liability in an orderly transaction between market participants. As such, fair value is a market-based measurement that should be determined based on assumptions that market participants would use in pricing an asset or a liability.Notes Payable
As a basis for considering such assumptions, the Company uses a three-tier value hierarchy, which prioritizes the inputs used in measuring fair value as follows:
Level I—observable inputs such as quoted prices in active markets
Level II—inputs other than the quoted prices in active markets that are observable either directly or indirectly
Level III—unobservable inputs in which there is little or no market data, which requires the Company to develop its own assumptions
This hierarchy requires the Company to use observable market data when available and to minimize the use of unobservable inputs when determining fair value.
The following table summarizes the Company’s financial assets measured at fair value on a recurring basis (in thousands):
|
| | | | | | | | | | | | | | | |
| | Total Fair Value | | Level I | | Level II | | Level III |
| December 31, 2015: | | | | | | | |
| Certificates of deposit | $ | 2,319 |
| | $ | 2,319 |
| | $ | — |
| | $ | — |
|
| U.S. treasuries | 64,091 |
| | 64,091 |
| | — |
| | — |
|
| Mutual funds | 504 |
| | 504 |
| | — |
| | — |
|
| Total | $ | 66,914 |
| | $ | 66,914 |
| | $ | — |
| | $ | — |
|
| December 31, 2014: | | | | | | | |
| Certificates of deposit | $ | 2,318 |
| | $ | 2,318 |
| | $ | — |
| | $ | — |
|
| U.S. treasuries | 50,082 |
| | 50,082 |
| | — |
| | — |
|
| Mutual funds | 506 |
| | 506 |
| | — |
| | — |
|
| Interest rate cap | 1 |
| | — |
| | 1 |
| | — |
|
| Total | $ | 52,907 |
| | $ | 52,906 |
| | $ | 1 |
| | $ | — |
|
There were no transfers between Level I and Level II assets during the years December 31, 2015 or December 31, 2014.
As of December 31, 2015 and December 31, 2014, certificates of deposit consisted of certificates of deposit held by domestic financial institutions, which are presented as restricted investments within WSE-related assets in the accompanying consolidated balance sheets.
The carrying value of the Company’s financial instruments not measuredour notes payable at fair value, including cash, restricted cash, WSE-related assets and liabilities, line of credit and accrued corporate wages, approximates fair value due to the relatively short maturity, cash repayments or market interest rates of such instruments. The fair value of such financial instruments, other than cash and restricted cash, is determined using the income approach based on the present value of estimated future cash flows. The fair value of all of these instruments would be categorized as Level II of the fair value hierarchy, with the exception of cash and cash equivalents, which would be categorized as Level I.
At December 31, 2016 and 2015 was $462.9 million and December 31, 2014, the carrying value of the Company’s notes payable of $499.6 million, and $544.9 million, respectively, which approximated fair value. The estimated fair values of the Company’s notes payableThese valuations are considered a Level II valuation in the hierarchy for fair value measurement and aremeasurement. At December 31, 2016, the valuation was based on areadily available quoted market prices. The discounted cash flow model discounted at market interest rates that considers the underlying risksmethod of unsecured debt.valuation was used as of December 31, 2015.
NOTE 8. NOTES PAYABLE AND BORROWINGS UNDER CAPITAL LEASES PAYABLE
The following schedule summarizes the componentsAs of December 31, 2016, notes and capital leases payable consisted of the Company’s notes payable and borrowings under capital leases balances (in thousands):following:
|
| | | | | | | |
| | December 31,
2015 | | December 31,
2014 |
| Notes payable under credit facility | $ | 499,563 |
| | $ | 544,875 |
|
| Capital leases | 153 |
| | 275 |
|
| Less current portion | (35,326 | ) | | (20,738 | ) |
| | $ | 464,390 |
| | $ | 524,412 |
|
|
| | | | | | | | | | | | |
| (In thousands) | December 31,
2016 | December 31,
2015 | Annual
Contractual
Interest Rate | Effective Interest Rate | Maturity
Date |
| Term loan A | $ | 330,469 |
| $ | 351,563 |
| 3.250 | % | (1) | 3.46 | % | July 2019 |
| Term loan B | — |
| 148,000 |
| 3.220 | % | (2) | N/A |
| July 2017 |
| Term loan A-2 | 132,469 |
| — |
| 3.125 | % | (3) | 3.29 | % | July 2019 |
| Total term loans | 462,938 |
| 499,563 |
| | | | |
| Deferred loan costs | (4,018 | ) | (5,781 | ) | | | | |
| Capital leases | 134 |
| 153 |
| | | | |
| Less: current portion | (36,559 | ) | (32,970 | ) | | | | |
| Non-current term portion | $ | 422,495 |
| $ | 460,965 |
| | | | |
In March 2014, the proceeds from the Company’s initial public offering (IPO) were used to fully repay its existing $190.0 million second lien credit facility, which resulted in a prepayment premium of $3.8 million, and to repay $25.0 million of its existing first lien tranche B-1 term loan. Additionally, the remaining balance of the loan fees associated with the second lien credit facility and a portion of the loan fees associated with the first lien credit facility were fully amortized in March 2014 for a charge of $5.0 million. In May 2014, the Company repaid $25.0 million of the first lien tranche B-1 term loan. As a result, a portion of the loan fees associated with the first lien credit facility was fully amortized in May 2014 for a charge of $0.5 million.
| |
| (1) | Bears interest at LIBOR plus 2.25% or the prime rate plus 1.25% at our option, subject to certain rate adjustments based upon our total leverage ratio. |
| |
| (2) | Contractual interest rate in place at June 30, 2016, prior to the refinancing in July 2016. |
| |
| (3) | Bears interest at LIBOR plus 2.125% or the prime rate plus 1.125% at our option, subject to certain rate adjustments based upon our total leverage ratio. |
In July 2014, the Company amended and restated its first lien credit facility pursuant to an amended and restated first lien credit agreement (the2016, we refinanced our Amended and Restated First Lien Credit Agreement (Credit Agreement). The Amended and Restated Credit Agreement provides
for: (i) $375We replaced $135.0 million principal amount of tranche A term loans, (ii) $200 million principal amount ofoutstanding tranche B term loans and (iii) a revolving credit facilitymaturing July 2017 with substantially the same amount of $75 million. The proceeds of thenew tranche AA-2 term loans were used to refinance in part the tranche B-2 term loans outstanding under the original first lien credit facility.maturing July 2019. The proceeds$342.0 million of the tranche B term loans were used to (i) refinance the remaining tranche B-2 term loans outstanding under the original first lien credit facility, (ii) refinance other amounts outstanding under the original first lien credit facility and (iii) pay fees and expenses related thereto. The revolving credit facility replaced the revolving credit facility under the original first lien credit facility.
Theexisting tranche A term loans and the $75.0 million revolving credit facility will mature on July 9, 2019. were not refinanced. As part of the $135.0 million refinancing transaction, $57.6 million was recorded as an extinguishment, and $77.0 million was rolled over into the new tranche A-2 term loans and was treated as a debt modification.
The proceeds of the tranche A-2 term loans were used to: (i) refinance the remaining tranche B term loans will mature on July 9, 2017. Loansoutstanding under the revolving credit facility are expected to be used for working capitalCredit Agreement and other general corporate purposes.(ii) pay related fees and expenses. As a result of this refinancing, approximately $1.4 million in fees and costs were incurred, of which $0.8 million were recorded as deferred loan cost with the remainder expensed.
The tranche AInterest on term loans and loans under the revolving credit facility bear interest, at the Company’s option, at a rate equal to either the LIBOR rate, plus an applicable margin equal to 2.75% per annum, or the prime lending rate, plus an applicable margin equal to 1.75% per annum. The applicable margins for the tranche A term loans and loans under the revolving credit facilityis payable quarterly. We are subject to specified rate adjustments of 0.25%, based upon the Company’s total leverage ratio. The tranche B term loans bear interest, at the Company’s option, at a rate equal to either the LIBOR rate, plus an applicable margin equal to 2.75% per annum or the prime lending rate, plus an applicable margin equal to 1.75% per annum. The Company is required to pay a quarterly commitment fee of 0.50%, subject to which may decrease to 0.375% based on itsour total leverage ratio, on the daily unused amount of the commitments under the revolving credit facility, as well as fronting fees and other customary fees for letters of credit issued under the revolving credit facility.
The Company is$75.0 million revolving credit facility includes capacity for a $40.0 million letter of credit facility and a $10.0 million swingline facility. Letters of credit issued pursuant to the revolving credit facility reduce the amount available for borrowing under the revolving credit facility. The total unused portion of the revolving credit facility was $59.5 million as of December 31, 2016.
We are permitted to make voluntary prepayments at any time without payment of a premium. The Company isWe are required to make mandatory prepayments of term loans (without payment of a premium) with (i) net cash proceeds from issuances of debt (other than certain permitted debt), and (ii) net cash proceeds from certain non-ordinary course asset sales and casualty and condemnation proceeds (subject to reinvestment rights and other exceptions), and (iii) beginning with the fiscal year ending December 31, 2015, 50% of its excess cash flow (subject to decrease to (x) 25% if its total leverage ratio as of the last day of such fiscal year is less than 3.75 to 1.0 and equal to or greater than 3.00 to 1.0, and (y) 0% if the total leverage ratio as of the last day of such fiscal year is less than 3.00 to 1.0), provided that the Company may defer prepayments based on excess cash flow to the extent such payments would result in the working capital being less than $10 million (after giving effect to such prepayments).
The tranche A and A-2 term loans will be repaid in equal quarterly installments in an aggregate annual amount equal to: (i) beginning on December 31, 2014 to December 31, 2016, 5% of the original principal amount thereof, (ii) beginning on December 31, 2016 to December 31, 2018, 7.5% of the original principal amount thereof, and (iii) beginning on December 31, 2018 to June 30, 2019, 10% of the original principal amount thereof with any remaining balance payable on the final maturity date of the tranche A term loans. The tranche B term loans will be repaid in equal quarterly installments in an aggregate annual amount equal to 1% of the principal amount thereof, with any remaining balance payable on the final maturity date of the tranche B term loans.amounts as follows (in thousands):
|
| | | | | | | | | | | | |
| | Year ending December 31, | |
| | 2017 | 2018 | 2019 | Total |
| Term loan repayments | $ | 38,250 |
| $ | 41,438 |
| $ | 383,250 |
| $ | 462,938 |
|
The $75.0 million revolving credit facility includes capacity for a $40.0 million letter of credit facility and a $10.0 million swingline facility. The total unused portion of the revolving credit facility was $59.5 million as of December 31, 2015. In connection with the Amended and Restated Credit Agreement, the Company incurred $11.1 million of debt issuance costs. The Company deferred $8.0 million of the costs, which are being amortized over the term of the credit facility. The remaining $3.1 million of costs were recorded to interest expense and bank fees. Additionally, the Company recorded a $9.0 million loss on extinguishment of debt to write-off deferred issuance costs associated with the original first lien credit facility, which was also recorded to interest expense and bank fees. The remaining $6.1 million of loan fees associated with the previous facility that was deemed to be modified continues to be amortized over the revised remaining term of the Amended and Restated Credit Agreement.
In March 2015, the Company repaid $25.0 million of the tranche B term loan. As a result, a portion of the loan fees associated with the first lien credit facility was fully amortized in March 2015 for a charge of $0.4 million.
The Amended and Restated Credit Agreement contains customary representations and warranties, and customary affirmative and negative covenants applicable to the Company and its subsidiaries,us, including, among other things, restrictions on indebtedness, liens, investments, mergers, dispositions,and other dispositions. The Credit Agreement also defines certain restricted payments including prepayment of other indebtedness, and dividends and other distributions. stock repurchases within a dollar limit. This limit is subject to adjustments based on our total leverage ratio and continued compliance with the financial covenants set forth in the Credit Agreement.
The Amended and Restatedfinancial covenants under the Credit Agreement also contains financial covenants that require the Companyus to maintain a minimum consolidated interest coverage ratio of at least 3.50 to 1.00 and a maximum total leverage ratio of 4.25 to 1.00 at December 31, 2016 and 2015. The Company wasWe were in compliance with the restrictivethese financial covenants under the credit facilities at
December 31, 2015. Despite extensive efforts, we were unable to file our Annual Report on Form 10-K for the year ended December 31, 2015 within the time frame required by the SEC (including the extension permitted by Rule 12b-25 under the Exchange Act). As a result, we were not in compliance with our restrictive covenant to have timely filed financial statements, but have cured this deficiency within the thirty day cure period upon filing our Annual Report. In addition to these covenants, the Amended2016 and Restated Credit Agreement requires, beginning with the fiscal year ending December 31, 2015, the Company to prepay the tranche B term loan in an amount which is based on the specified excess cash flow percentage determined by the current leverage ratio. The Company recorded a current liability of $12.7 million at December 31, 2015 in anticipation of this prepayment. 2015.
The credit facility is secured by substantially all of the Company’sour assets, and the assets of the borrower and of the subsidiary guarantors, other than specifically excluded assets as defined in the Credit Agreement, which includes certain customary assets, assets held in trusts as collateral and WSE related assets.
NOTE 9:9. STOCKHOLDERS’ EQUITY
Convertible Preferred Stock
On June 7, 2005, the Company issued 5,391,441 shares of Series G convertible preferred stock (Series G) at $11.00 per share for an aggregate cash purchase price of $59.3 million. The Company recorded the issuance of Series G at $59.1 million, net of issuance costs of $0.2 million. On June 1, 2009, the Company issued 4,124,986 shares of Series H convertible preferred stock (Series H) at $16.69 per share for an aggregate cash purchase price of $68.8 million. The Company recorded the issuance of Series H at $63.8 million, net of issuance costs of $5.0 million. Upon the issuance of Series H, certain terms related to Series G were amended. In March 2014, upon completion of the Company’s IPO, all of the outstanding shares of Series H and Series G were converted into 38,065,708 shares of common stock.
Common Stock
Upon closing of theour IPO onin March 31, 2014, the Companywe issued 15,000,000 shares of common stock at a public offering price $16 per share, for an aggregate offering price of $240.0 million, resulting in net proceeds to us of $216.8 million, after deducting underwriting discounts and commissions of approximately $16.8 million and offering expenses of approximately $5.6 million.
In February 2014, the Company issued 91,074 shares to a member of the Board of Directors at $10.98 per share, which was the then estimated fair market value, for an aggregate of $1.0 million in cash.
Equity-Based Incentive Plans
In 2000, the Company established the 2000 Equity Incentive Plan (the 2000 Plan), which provided for granting incentive stock options, nonstatutory stock options, bonus awards and restricted stock awards to eligible employees, directors, and consultants of the Company. In December 2009, the Boardboard of Directorsdirectors approved the 2009 Equity Incentive Plan (the 2009 Plan) as the successor to and continuation of the 2000 Plan. As of the 2009 Plan effective date, remaining shares available for issuance under the 2000 Plan were cancelled and became available for issuance under the 2009 Plan. No additional stock awards will be granted under the 2000 Plan. The 2009 Planwhich provides for the grant of the followingvarious equity awards to eligible employees, directors, and consultants: incentiveconsultants including stock options, nonstatutory stock options, stock appreciation rights, restricted stock awards, restricted stock unit awards, performance stock awards, performance cash awards,(time-based and performance-based) and other stock awards. Incentive stockShares available for grant as of December 31, 2016 were 6.7 million.
Stock Options
Stock options may only beare granted to employees. Non-employee directors are eligible to receive nonstatutory stock options automatically at designated intervals over their period of continuous service on the Board. The 2009 Plan, as amended, provides that the number of shares reserved for issuanceemployees under the 2009 Plan will increase on January 1 of each year for a period of up to five years by 4.5% of the total number of shares of capital stock outstanding on December 31 of the preceding calendar year, which will begin on January 1, 2015 and continue through January 1, 2019. On January 1, 2015, an additional 3,141,509 shares were automatically reserved for issuance under the amended 2009 Plan.
Theat exercise price per share of all incentive stock options granted under the 2000 Plan and the 2009 Plan must be at leastprices equal to the fair market value of our common stock on the shares at the datedates of grant as determined by the Board of Directors.grant. Options generally have a maximum contractual term of 10 years. Incentive stock options granted at 110% of the fair market value to stockholders who have greater than 10% ownership have a maximum term of five years. Options granted to non-employee directors in connection with an initial election or appointmentare generally vest at the rate of 33% of the total options one year after the grant date and 1/36 of the total options granted monthly thereafter. All other options granted to non-employee directors generally vest 100% one year from grant date. Before 2015, options granted to employees generally vestvested over four years, with a one year cliff and monthly thereafter. Starting in 2015, the options granted to newly hired employees generally vest at a rate of 25% of the total options a year after the grant date and then 1/16 of the total options granted on the 15th day of the second month of each
calendar quarter thereafter. All other options granted to employees generally vest at a rate of 1/16 of the total options granted on the 15th day of the second month of each calendar quarter following the grant date.
The Company has granted restricted stock units (RSUs) to members of the Board of Directors, certain executives and employees. These RSUs represent rights to receive shares of the Company’s common stock on satisfaction of applicable vesting conditions. The fair value of RSUs is equal to the fair value of the Company’s common stock on the date of grant. RSUs granted to newly elected or appointed non-employee directors generally vest on the first anniversary of the Company’s most recent annual grants. RSUs granted to non-employee directors in connection with an annual grant generally vest 100% one year from the grant date. RSUs granted to newly hired employees generally vest at a rate of 25% of the total RSUs one year after the grant date and then 1/16 of the total RSUs granted on the 15th day of the second month of each calendar quarter thereafter. All other RSUs granted to employees generally vest at a rate of 1/16 of the total RSUs granted on the 15th day of the second month of each calendar quarter following the grant date.
In March 2015, the Company granted performance-based restricted stock units (PSUs) to its executives intended to represent 33.3% of each executive’s annual long-term incentive compensation award value in fiscal 2015. These PSUs vest over three years based on continued service. Stock options are forfeited if the Company’s attainment of annual financial performance goals as well as the executive’s continued employment through each vesting date. The number of shares that ultimately vest each year will range from 0employee ceases to 200% of the annual target amount, based on the Company’s performance. Cumulative financial performance metrics and goals are established for these awards at the grant date and the tranche of each award relatedbe employed by us prior to that period’s performance goal is treated as a separate grant for accounting purposes. The financial performance metric established for the performance awards is cumulative annual growth rate in the Company’s net service revenues. These values are being recognized over the tranches’ 12-month, 24-month and 36-month service periods. The Company began recording stock-based compensation expense for these tranches in March 2015, when the financial performance goals were established.vesting.
Equity incentive plan activity under the 2000 Plan and the 2009 Plan is summarized as follows:
|
| | |
Equity Incentive Plan Activity | Shares Available for Grant | |
|
Balance at December 31, 2014 | 2,708,524 |
|
AuthorizedFINANCIAL STATEMENTS | 3,141,509 |
|
Granted | (1,569,865 | ) |
Forfeited | 674,786 |
|
Expired | 1,250 |
|
Shares withheld for taxes and not issued | 35,379 |
|
Balance at December 31, 2015 | 4,991,583 |
|
The following table summarizes stock option activity under the Company’sour equity-based plans for the year ended December 31, 2015:2016:
| | | Stock Options Activity | Number
of Shares | | Weighted
Average
Exercise
Price | | Weighted
Average
Remaining
Contractual
Term | | Aggregate
Intrinsic
Value
(in thousands) | |
| Balance at December 31, 2014 | 6,892,810 |
| | $ | 6.13 |
| | 8.22 | | $ | 173,338 |
| |
| | | Number
of Shares | Weighted
Average
Exercise
Price | Weighted
Average
Remaining
Contractual
Term | Aggregate
Intrinsic
Value
(in thousands) |
| Balance at December 31, 2015 | | 4,446,149 |
| $ | 8.96 |
| 7.56 | $ | 52,108 |
|
| Granted | 312,200 |
| | 31.66 |
| | | — |
| — |
| | |
| Exercised | (2,112,131 | ) | | 3.44 |
| | | (1,297,812 | ) | 4.06 |
| | |
| Forfeited | (645,480 | ) | | 7.84 |
| | | (261,029 | ) | 17.53 |
| | |
| Expired | (1,250 | ) | | 10.98 |
| | | (72,084 | ) | 27.01 |
| | |
| Balance at December 31, 2015 | 4,446,149 |
| | $ | 8.96 |
| | 7.56 | | $ | 52,108 |
| |
| | | | | | | |
| Exercisable at December 31, 2015 | 2,100,591 |
| | $ | 6.20 |
| | 7.16 | | $ | 28,922 |
| |
| Vested and expected to vest at December 31, 2015 | 4,257,065 |
| | $ | 8.70 |
| | 7.53 | | $ | 50,675 |
| |
| Balance at December 31, 2016 | | 2,815,224 |
| $ | 9.96 |
| 6.66 | $ | 46,231 |
|
| Exercisable at December 31, 2016 | | 2,014,443 |
| $ | 8.00 |
| 6.42 | $ | 36,459 |
|
| Vested and expected to vest at December 31, 2016 | | 2,775,326 |
| $ | 9.83 |
| 6.65 | $ | 45,865 |
|
|
| | | | | | | | | |
| | Year Ended December 31, |
| Additional Disclosures for Stock Options | 2016 | 2015 | 2014 |
| Weighted-average grant date fair value of stock options | N/A |
| $ | 12.73 |
| $ | 7.18 |
|
| Total fair value of options vested (in millions) | $ | 6.8 |
| $ | 12.2 |
| $ | 7.5 |
|
| Total intrinsic value of options exercised (in millions) | $ | 20.5 |
| $ | 53.3 |
| $ | 35.1 |
|
| Cash received from options exercised (in millions) | $ | 5.3 |
| $ | 7.3 |
| $ | 2.2 |
|
Restricted Stock Units
Restricted stock units are subject to time-based or performance-based vesting conditions:
The weighted-averagetime-based restricted stock units (RSUs) granted to non-employee directors generally fully vest on the first anniversary of the grant date fair valuedate;
The RSU granted to employees are generally subject to vesting ratably on a quarterly basis over four years;
The performance-based restricted stock units (PSUs) are subject to vesting based on our achievement of stock options grantedthe financial performance metrics and other goals that are established at the grant date. The financial performance metric established represents cumulative annual growth rate in our Net Service Revenues as defined in the years ended December 31, 2015, 2014 and 2013 was $12.73, $7.18 and $4.11 per share, respectively. The total fair valueincentive plan over three-year performance periods. Depending on the results achieved, the actual number of options vested forshares to be granted may range from 0% to 200% of the years ended December 31, 2015, 2014 and 2013 was $12.2 million, $7.5 million and $4.0 million, respectively.target shares. Compensation expense is recognized ratably over the vesting period based on the probability of the number of awards expected to vest at each reporting date.
Unvested restricted stock units are forfeited if the employee ceases to be employed by us prior to vesting.
The total intrinsic value of options exercised for the years ended December 31, 2015, 2014 and 2013 was $53.3 million, $35.1 million and $52.6 million, respectively. Cash received from options exercised during the years ended December 31, 2015, 2014 and 2013 was $7.3 million, $2.2 million and $7.1 million, respectively. The exercise price of all options granted was equal to the fair value of the common stock on the date of grant.
As of December 31, 2015, unrecognized compensation expense, net of forfeitures, associated with nonvested options outstanding was $13.9 million and is expected to be recognized over a weighted-average period of 2.19 years.
The following table summarizes RSU and PSU activity under the Company’sour equity-based plans for the year ended December 31, 2015:2016:
| | | Restricted Stock Unit Activity | Number of Units | | Weighted-Average Grant Date Fair Value | |
| Nonvested at December 31, 2014 | 7,750 |
| | $ | 13.21 |
| |
| | | RSUs | PSUs |
| | | Number of Units | Weighted-Average Grant Date Fair Value | Number of Units | Weighted-Average Grant Date Fair Value |
| Nonvested at December 31, 2015 | | 956,687 |
| $ | 28.03 |
| 173,286 |
| $ | 33.51 |
|
| Granted | 1,084,379 |
| | 28.73 |
| 2,281,998 |
| 18.25 |
| — |
| — |
|
| Vested | (106,136 | ) | | 32.83 |
| (695,253 | ) | 23.52 |
| — |
| — |
|
| Forfeited | (29,306 | ) | | 32.70 |
| (220,381 | ) | 22.29 |
| (23,874 | ) | 33.51 |
|
| Nonvested at December 31, 2015 | 956,687 |
| | $ | 28.03 |
| |
| Nonvested at December 31, 2016 | | 2,323,051 |
| $ | 20.32 |
| 149,412 |
| $ | 33.51 |
|
The total grant date fair value of RSUs granted in the year ended December 31, 2015 was $31.2 million. The total grant date fair value of RSUs vested in the years ended December 31, 2015, 2014 and 2013 was $3.5 million, $0.1 million and $0.1 million, respectively. As of December 31, 2015, unrecognized compensation expense, net of forfeitures, associated with the nonvested RSUs outstanding was $23.3 million, and is expected to be recognized over a weighted-average period of 3.05 years.
During the years 2015, 2014 and 2013, the Company withheld 35,379, 80,599 and 809,012 shares, respectively, to settle payroll tax liabilities resulting from the exercises of stock options and vesting of RSUs held by the employees.
The following table summarizes PSU activity under the Company’s equity-based plans for the year ended December 31, 2015:
|
| | | | | | |
| Performance Based Restricted Stock Unit Activity | Number of Units | | Weighted-Average
Grant Date
Fair Value |
| Outstanding units at December 31, 2014 | — |
| | $ | — |
|
| Granted | 173,286 |
| | 33.51 |
|
| Units converted | — |
| | — |
|
| Forfeited | — |
| | — |
|
| Outstanding units at December 31, 2015 | 173,286 |
| | $ | 33.51 |
|
|
| | | | | | | | | |
| | Year Ended December 31, |
| Additional Disclosures for RSUs | 2016 | 2015 | 2014 |
| Total grant date fair value of RSUs granted (in millions) | $ | 41.7 |
| $ | 31.2 |
| N/A |
|
| Total grant date fair value of RSUs vested (in millions) | $ | 16.4 |
| $ | 3.5 |
| $ | 0.1 |
|
| Shares withheld to settle payroll tax liabilities related to vesting of RSUs held by employees | 217,769 |
| 35,379 |
| 80,599 |
|
The maximum total grant date fair value of PSUs granted in the year ended December 31, 2015 was $5.8 million, assuming maximum 200% performance target is met. As of December 31, 2015, unrecognized compensation expense, net of forfeitures, was $0.8 million, and is expected to be recognized over a weighted-average period of 2 years.
Employee Stock Purchase Plan
The Company adopted theOur 2014 Employee Stock Purchase Planplan (ESPP) in February 2014, which became effective on March 26, 2014. The ESPP was approved with a reserve of 1.1 millionoffers eligible employees an option to purchase shares of our common stock for future issuance under various terms provided for in the ESPP, which will automatically increase on January 1 of each year from 2015 through 2024 by the lesser of 1% of the total number of shares outstanding on December 31 of the preceding calendar year or 1,800,000 shares. On January 1, 2015, an additional 698,113 shares were automatically reserved for issuance under the ESPP.a payroll deduction. The Company commenced its first purchase period under the ESPP on March 26, 2014 with a purchase price is equal to the lesser of 85% of the fair market value of theour common stock on the offering date andor 85% of the fair market value of theour common stock on the applicable purchase date. Offering periods are approximately six months in duration and will end on or about May 15 and November 15 of each year, with the exception of the initial offering period, which commenced on March 26, 2014 and ended on November 14, 2014.year. Employees may contribute a minimum of 1% and a maximum of 15% of their earnings. During the year ended December 31, 2015, employees purchasedThe plan is considered to be a compensatory plan. We issued 283,644, 272,836, and 249,494 shares under the ESPP at a price of $25.25 per share for the first
offering period ending induring 2016, 2015 and $15.71 per share2014, respectively. As of December 31, 2016, 1.7 million shares were reserved for future issuances under the second offering period ending in 2015 for total cash proceeds of $5.3 million.ESPP.
Stock-Based Compensation
Stock-based compensation expense of $17.9 million, $11.0 million and $6.1 million was recognized for the years ended December 31, 2015, 2014 and 2013, respectively. Income tax benefit of $5.7 million, $2.0 million and $4.4 million was recognized relating to stock-based compensation expense for the years ended December 31, 2015, 2014 and 2013, respectively. The actual tax benefit realized from stock options exercised was $19.6 million, $13.5 million and $19.9 million for 2015, 2014 and 2013, respectively.
The fair value of stock-based awardsour RSUs and PSUs is equal to the fair value of our common stock on the grant date. The fair value of stock options and the ESPP is estimated on the date of grant using the Black-Scholes option-pricing model with the following weighted-average assumptions:
|
| | | | | | | | |
| Stock Option Assumptions | Year Ended December 31, |
| | 2015 | | 2014 | | 2013 |
| Expected term (in years) | 6.08 |
| | 6.05 |
| | 6.04 |
|
| Expected volatility | 39 | % | | 58 | % | | 48 | % |
| Risk-free interest rate | 1.73 | % | | 1.80 | % | | 1.26 | % |
| Expected dividend yield | 0 | % | | 0 | % | | 0 | % |
|
| | | | | | | | | | | | |
| | Stock Option Assumptions | ESPP Assumptions |
| Year Ended December 31, | Expected Term (in Years) | Expected Volatility | Risk-Free Interest Rate | Expected Dividend Yield | Expected Term (in Years) | Expected Volatility | Risk-Free Interest Rate | Expected Dividend Yield |
| 2016 | N/A | N/A |
| N/A |
| N/A |
| 0.50 | 32-76% | 0.33-0.62% | 0 | % |
| 2015 | 6.08 | 39 | % | 1.73 | % | 0 | % | 0.50 | 34-76% | 0.07-0.33% | 0 | % |
| 2014 | 6.05 | 58 | % | 1.80 | % | 0 | % | 0.50 | 33-58% | 0.06-0.07% | 0 | % |
|
| | | | | | | |
| ESPP Assumptions | Year Ended December 31, |
| | 2015 | | 2014 | | 2013 |
| Expected term (in years) | 0.50 |
| | 0.50 |
| | n/a |
| Expected volatility | 34-76% |
| | 33-58% |
| | n/a |
| Risk-free interest rate | 0.07-0.33% |
| | 0.06-0.07% |
| | n/a |
| Expected dividend yield | 0 | % | | 0 | % | | n/a |
Compensation expense is measured based on the fair value of the stock option on the grant date and recognized over the requisite service period for each separately vesting portion of the stock option award. Stock-based compensation expense and other disclosures for stock-based awards made to the Company’sour employees pursuant to the equity plans was as follows (in thousands): follows:
| | | | Year Ended December 31, | Year Ended December 31, |
| | 2015 | | 2014 | | 2013 | |
| (In thousands) | | 2016 | 2015 | 2014 |
| Cost of providing services | $ | 4,244 |
| | $ | 2,658 |
| | $ | 1,193 |
| $ | 6,607 |
| $ | 4,244 |
| $ | 2,658 |
|
| Sales and marketing | 4,490 |
| | 2,755 |
| | 1,284 |
| 6,573 |
| 4,490 |
| 2,755 |
|
| General and administrative | 7,501 |
| | 4,517 |
| | 3,220 |
| 10,831 |
| 7,501 |
| 4,517 |
|
| Systems development and programming costs | 1,688 |
| | 1,030 |
| | 416 |
| 2,486 |
| 1,688 |
| 1,030 |
|
| | $ | 17,923 |
| | $ | 10,960 |
| | $ | 6,113 |
| |
| Total stock-based compensation expense | | $ | 26,497 |
| $ | 17,923 |
| $ | 10,960 |
|
| Income tax benefit related to stock-based compensation expense | | $ | 9,142 |
| $ | 5,678 |
| $ | 2,040 |
|
| Actual tax benefit realized from stock options exercise | | $ | 7,076 |
| $ | 19,609 |
| $ | 13,514 |
|
Earnings per ShareThe table below summarizes unrecognized compensation expense, net of forfeitures for the year ended December 31, 2016 associated with the following:
|
| | | | |
| | Amount (in thousands) | Weighted-Average Period (in Years) |
| Nonvested stock options | $ | 5,739 |
| 1.41 |
| Nonvested RSUs | $ | 42,198 |
| 2.70 |
| Nonvested PSUs | $ | 374 |
| 1.00 |
Stock Repurchases
During 2016, 2015, and 2014, the board of directors authorized $100 million, $50 million and $45 million, respectively of outstanding common stock to its IPO,be repurchased with no expiration from the Company’sdate of authorization. As of December 31, 2016, approximately $60.0 million remained available for repurchase pursuant to our stock repurchase program. During 2016, 2015 and 2014, we repurchased 3,414,675 shares, 1,895,625 shares and 490,419 shares, respectively.
NOTE 10. EARNINGS PER SHARE (EPS)
Basic EPS is computed based on the weighted average number of common stocks outstanding during the period. Diluted EPS is computed based on those shares used in the basic and diluted earnings per share (EPS)EPS computation, plus potentially dilutive shares issuable under our equity-based compensation plans using the treasury stock method. Shares that are potentially anti-dilutive are excluded.
In 2014, we had convertible preferred stock which were participating securities. Basic EPS was computed using the two-class method anthat earnings allocation method that determines earnings per share for common stock and participating securities. Shares of convertible preferred stock are considered participating securities and are entitled to dividend, on a pro rata basis, upon redemption, as if these had been converted to common stock. The undistributed earnings arewere allocated between common stock and participating securities as if all earnings had been distributed during the period.
Basic EPS is calculated by taking net income, less earnings available to participating securities, divided by the basic weighted average common stock outstanding.
preferred stock. Diluted EPS is calculatedcomputed using the more dilutive of the if-converted method and the two-class method. Because theThe convertible preferred stock participates in dividends onwas converted into common stock as a pro rata basis as if the shares had been converted, the diluted earnings per share are the same under both methods. The two-class method has been presented below.result of our IPO.
The following table sets forthpresents the computation of the Company’sour basic and diluted net income per shareEPS attributable to our common stock (in thousands, except per share data):stock:
| | | | Year Ended December 31, | Year Ended December 31, |
| | 2015 | | 2014 | | 2013 | |
| (In thousands, except per share data) | | 2016 | 2015 | 2014 |
| Numerator (basic) | | | | | | | |
| Net income | $ | 31,695 |
| | $ | 15,497 |
| | $ | 13,147 |
| $ | 61,406 |
| $ | 31,695 |
| $ | 15,497 |
|
| Less net income allocated to participating securities | — |
| | (2,224 | ) | | (9,926 | ) | — |
| — |
| (2,224 | ) |
| Net income attributable to common stock | $ | 31,695 |
| | $ | 13,273 |
| | $ | 3,221 |
| $ | 61,406 |
| $ | 31,695 |
| $ | 13,273 |
|
| Denominator (basic) | | | | | | |
| Weighted average shares of common stock outstanding | 70,228 |
| | 56,161 |
| | 12,353 |
| 70,160 |
| 70,228 |
| 56,161 |
|
| Basic EPS | $ | 0.45 |
| | $ | 0.24 |
| | $ | 0.26 |
| $ | 0.88 |
| $ | 0.45 |
| $ | 0.24 |
|
| | | |
| Numerator (diluted) | | | | | | |
| Net income | $ | 31,695 |
| | $ | 15,497 |
| | $ | 13,147 |
| $ | 61,406 |
| $ | 31,695 |
| $ | 15,497 |
|
| Less net income allocated to participating securities | — |
| | (2,114 | ) | | (9,303 | ) | — |
| — |
| (2,114 | ) |
| Net income attributable to common stock | $ | 31,695 |
| | $ | 13,383 |
| | $ | 3,844 |
| $ | 61,406 |
| $ | 31,695 |
| $ | 13,383 |
|
| Denominator (diluted) | | | | | | |
| Weighted average shares of common stock | 70,228 |
| | 56,161 |
| | 12,353 |
| 70,160 |
| 70,228 |
| 56,161 |
|
| Dilutive effect of stock options and restricted stock units | 2,390 |
| | 3,406 |
| | 3,379 |
| 1,812 |
| 2,390 |
| 3,406 |
|
| Weighted average shares of common stock outstanding | 72,618 |
| | 59,567 |
| | 15,732 |
| 71,972 |
| 72,618 |
| 59,567 |
|
| Diluted EPS | $ | 0.44 |
| | $ | 0.22 |
| | $ | 0.24 |
| $ | 0.85 |
| $ | 0.44 |
| $ | 0.22 |
|
| | | | | | | |
Common stock equivalents excluded from income per diluted
share because of their anti-dilutive effect | 1,004 |
| | 526 |
| | 1,389 |
| 871 |
| 1,004 |
| 526 |
|
Special Dividend
In August 2013, the Board of Directors declared a special dividend of $5.88 per common-equivalent share for holders of record of the Company’s preferred stock as of August 21, 2013, or a total of $223.6 million, and $5.88 per share for holders of record of the Company’s common stock as of August 30, 2013, or a total of $87.1 million. These dividends were fully paid in August 2013 and September 2013. Dividends have also been declared to holders of restricted stock units at $5.88 per share, or a total of $0.1 million, and are payable as the restricted stock units vest.
In December 2013, the Board of Directors declared a special dividend of $0.88 per common-equivalent share for holders of record of the Company’s preferred stock as of December 25, 2013, or a total of $33.3 million, and $0.88 per share for holders of record of the Company’s common stock as of December 25, 2013, or a total of $13.4 million. These dividends were fully paid in December 2013. Dividends have also been declared to holders of restricted stock units at $0.88 per share and are payable as the restricted stock units vest.
As a result of the August 2013 special dividend and in accordance with the provisions of the 2009 Plan, the Company adjusted the exercise prices on all outstanding options downward by $5.88, exactly equal to the amount of the dividend, except in three instances in which: i) the exercise price was lower than $6.38, ii) the holder of the incentive stock option under the 2009 Plan did not consent to the adjustment when consent was required, or iii) the incentive stock option was under the 2000 Plan. For options that were priced lower than $6.38, the Company adjusted the exercise price to $0.50.
As a result of the December 2013 special dividend and in accordance with the provisions of the 2009 Plan, the Company adjusted the exercise prices on all outstanding options downward by $0.88, exactly equal to the amount of the dividend, except in three instances in which: i) the exercise price was lower than $1.38, ii) the holder of the incentive stock option under the 2009 Plan did not consent to the adjustment when consent was required, or iii) the incentive stock option was under the 2000 Plan. For options that were priced lower than $2.75, the Company adjusted the exercise price to $0.50.
No changes were made to the original option grant-date fair value for the purpose of recognizing ongoing stock-based compensation cost. No changes were made to nonvested restricted stock units.
Stock Repurchases
In May 2014, the Board of Directors authorized a stock repurchase program that provided for the repurchase of up to $15 million of our outstanding common stock, with no expiration from the date of authorization. In November 2014, the Board of Directors authorized an additional $30 million stock repurchase program, with no expiration from the date of authorization. These stock repurchase programs are intended to offset dilution resulting from the issuance of shares under the Company’s ESPP and upon exercise of stock options. During 2014, the Company repurchased 490,419 shares of outstanding common stock for $15 million.
On June 29, 2015, the Board of Directors approved a $50.0 million incremental increase to the Company’s stock repurchase program. During the year ended December 31, 2015, the Company repurchased 1,895,625 shares of outstanding common stock for $48.4 million. Accordingly, as of December 31, 2015, a total of approximately $31.6 million remained available for further repurchases of the Company’s common stock under the Company’s stock repurchase program.
Stock Split
On March 7, 2014, the Company’s board of directors and stockholders approved and effected an amendment to the amended and restated certificate of incorporation providing for a 2-for-1 stock split of the outstanding common stock, which has been retroactively adjusted for all periods presented.
NOTE 10.11. 401(k) PLAN
Under the Company’sour 401(k) plan, corporate participants may direct the investment of contributions to their accounts among certain investments. The Company matchesWe match individual employee 401(k) plan contributions at the rate of $0.50 for every dollar contributed by employees subject to a cap. The CompanyWe recorded matching contributions to the 401(k) plan of $5.1 million, $4.6 million, $3.5 million, and $2.7$3.5 million during the years ended December 31, 2016, 2015, 2014, and 2013,2014, respectively, which are reflected in various operating expense lines within the accompanying consolidated statements of operations.income.
The CompanyWe also maintains amaintain multiple employer defined contribution plan,plans, which coverscover WSEs for client companies electing to participate in the plan and for itstheir internal staff employees. The Company contributes,We contribute, on behalf of each participating client, varying amounts based on the clients’ policies and serviced employee elections.
NOTE 11.12. INCOME TAXES
The Company is subject to income taxation in the United States and Canada. However, business is conducted primarily in the United States. The effective income tax rate differs from the statutory rate primarily due to state taxes, non-deductible stock-based compensation, and tax credits. The Company makes estimates and judgments about its future taxable income that are based on assumptions that are consistent with the Company’s plans and estimates. Should the actual amounts differ from these estimates, the amount of the valuation allowance could be materially affected.
Provision for Income taxes are computed using the asset and liability method, under which deferred tax assets and liabilities are determined based on the difference between the financial statement and tax bases of assets and liabilities using enacted tax rates in effect for the year in which the differences are expected to affect taxable income. Valuation allowances are established when necessary to reduce deferred tax assets to the amount expected to be realized. Changes in valuation allowances are reflected as a component of provision for income taxes.Taxes
Significant components of the Company’s deferred tax assets and liabilities are as follows (in thousands):
|
| | | | | | | |
| | Year Ended December 31, |
| | 2015 | | 2014 |
| Deferred tax assets: | | | |
| Net operating losses (federal and state) | $ | 2,508 |
| | $ | 2,996 |
|
| Accrued expenses | 9,908 |
| | 9,381 |
|
| Accrued workers compensation costs | 18,823 |
| | 13,964 |
|
| Stock-based compensation | 4,643 |
| | 2,508 |
|
| Tax benefits relating to uncertain positions | 29 |
| | 20 |
|
| Tax credits (federal and state) | 6,272 |
| | 9,865 |
|
| Other | 113 |
| | 354 |
|
| Total | 42,296 |
| | 39,088 |
|
| Valuation allowance | (5,276 | ) | | (6,945 | ) |
| Total deferred tax assets | 37,020 |
| | 32,143 |
|
| Deferred tax liabilities: | | | |
| Depreciation and amortization | (3,277 | ) | | (10,643 | ) |
| Deferred service revenues | (85,263 | ) | | (77,827 | ) |
| Prepaid health plan expenses | (3,121 | ) | | (2,202 | ) |
| Total deferred tax liabilities | (91,661 | ) | | (90,672 | ) |
| Net non-current deferred tax liabilities | $ | (54,641 | ) | | $ | (58,529 | ) |
In November 2015, the FASB issued ASU 2015-17, Balance Sheet Classification of Deferred Taxes. The Company elected to early adopt and retrospectively apply the provisions of the amendment which resulted in reclassification of the previously reported current deferred tax liability of $65.7 million and noncurrent deferred tax asset of $7.2 million to net against the noncurrent deferred tax liability for a total noncurrent deferred tax liability of $58.5 million for 2014.
The deferred tax assets and liabilities presented above are classified in the accompanying consolidated balance sheets as follows (in thousands):
|
| | | | | | | |
| | Year Ended December 31, |
| | 2015 | | 2014 |
| Net current deferred tax liabilities | $ | — |
| | $ | — |
|
| Net non-current deferred tax liabilities | (54,641 | ) | | (58,529 | ) |
| Net current deferred tax assets | — |
| | — |
|
| Net non-current deferred tax assets | — |
| | — |
|
| Net deferred tax liabilities | $ | (54,641 | ) | | $ | (58,529 | ) |
The provision for income taxes consists of the following (in thousands):following:
| | | | Year Ended December 31, | Year Ended December 31, |
| | 2015 | | 2014 | | 2013 | |
| (In thousands) | | 2016 | 2015 | 2014 |
| Current: | | | | | | |
| Federal | $ | 9,189 |
| | $ | (31,111 | ) | | $ | 11,319 |
| $ | 1,488 |
| $ | 9,189 |
| $ | (31,111 | ) |
| State | | (364 | ) | 3,794 |
| 4,618 |
|
| Foreign | 378 |
| | 230 |
| | 217 |
| 150 |
| 378 |
| 230 |
|
| State | 3,794 |
| | 4,618 |
| | 3,081 |
| |
| | 13,361 |
| | (26,263 | ) | | 14,617 |
| 1,274 |
| 13,361 |
| (26,263 | ) |
| Deferred: | | | | | | |
| Federal | 11,528 |
| | 38,297 |
| | (5,659 | ) | 38,028 |
| 11,528 |
| 38,297 |
|
| State | | 4,278 |
| 320 |
| 2,951 |
|
| Foreign | (24 | ) | | — |
| | — |
| (6 | ) | (24 | ) | — |
|
| State | 320 |
| | 2,951 |
| | (1,344 | ) | |
| Revaluation due to state legislative changes | 3,130 |
| | 2,594 |
| | 323 |
| (528 | ) | 3,130 |
| 2,594 |
|
| | 14,954 |
| | 43,842 |
| | (6,680 | ) | 41,772 |
| 14,954 |
| 43,842 |
|
| | $ | 28,315 |
| | $ | 17,579 |
| | $ | 7,937 |
| |
| Total | | $ | 43,046 |
| $ | 28,315 |
| $ | 17,579 |
|
The U.S. federal statutory income tax rate reconciled to the Company’sour effective tax rate is as follows:
| | | | Year Ended December 31, | Year Ended December 31, |
| | | 2016 | 2015 | 2014 |
| (In thousands, except percent) | | Pre-Tax Income | Tax Expense/(Benefit) | Percent of Pre-Tax Income (Loss) | Pre-Tax Income | Tax Expense/(Benefit) | Percent of Pre-Tax Income (Loss) | Pre-Tax Income | Tax Expense/(Benefit) | Percent of Pre-Tax Income (Loss) |
| | 2015 | | 2014 | | 2013 | $ | 104,452 |
| | | $ | 60,010 |
| | | $ | 33,076 |
| | |
| U.S. federal statutory tax rate | 35.00 | % | | 35.00 | % | | 35.00 | % | | $ | 36,558 |
| 35.0 | % | | $ | 21,004 |
| 35.0 | % | | $ | 11,577 |
| 35.0 | % |
| State income taxes, net of federal benefit | 6.6 |
| | 3.8 |
| | 3.8 |
| | 4,484 |
| 4.2 |
| | 3,961 |
| 6.6 |
| | 1,257 |
| 3.8 |
|
| Tax rate change | 5.2 |
| | 7.8 |
| | 1.5 |
| | (528 | ) | (0.5 | ) | | 3,130 |
| 5.2 |
| | 2,594 |
| 7.8 |
|
| Nondeductible transaction costs | — |
| | 0.9 |
| | — |
| | — |
| — |
| | — |
| — |
| | 305 |
| 0.9 |
|
| Nondeductible meals, entertainment and penalties | 3.3 |
| | 4.3 |
| | 4.1 |
| | 4,129 |
| 4.0 |
| | 1,970 |
| 3.3 |
| | 1,412 |
| 4.3 |
|
| Stock-based compensation | 1.3 |
| | 4.5 |
| | (0.1 | ) | | 634 |
| 0.6 |
| | 816 |
| 1.3 |
| | 1,478 |
| 4.5 |
|
| Uncertain tax positions | 0.2 |
| | 0.8 |
| | (2.3 | ) | | 23 |
| — |
| | 98 |
| 0.2 |
| | 268 |
| 0.8 |
|
| Tax credits | (2.2 | ) | | (3.6 | ) | | (4.3 | ) | | (1,228 | ) | (1.2 | ) | | (1,340 | ) | (2.2 | ) | | (1,202 | ) | (3.6 | ) |
| Net Operating Loss adjustment | | | — |
| — |
| | (932 | ) | (1.5 | ) | | — |
| — |
|
| State tax return to provision adjustment | | | (1,267 | ) | (1.2 | ) | | — |
| — |
| | — |
| — |
|
| Other | (2.2 | ) | | (0.3 | ) | | (0.1 | ) | | 241 |
| 0.3 |
| | (392 | ) | (0.7 | ) | | (110 | ) | (0.3 | ) |
| | 47.20 | % | | 53.20 | % | | 37.60 | % | |
| Total | | | $ | 43,046 |
| 41.2 | % | | $ | 28,315 |
| 47.2 | % | | $ | 17,579 |
| 53.2 | % |
Our effective income tax rate decreased by 6.0% from 53.2%47.2% in 2015 to 41.2% in 2016. The change was primarily attributed to a decrease in state income taxes from income that is excluded for 2014 to 47.2% for 2015. The decrease is primarilystate income tax purposes and dilution of the negative rate impact from permanent items due to disqualifying dispositions on previously non-deductible stock-based compensation and tax credits offsetan increase in part by increased state taxes of 2.8% due to state legislative changes. Revaluationpre-tax earnings.
In 2015, the revaluation of deferred taxes due tofrom state legislative changes resulted in a charge to income tax of $3.1 million compared to the state tax benefit from such revaluation of $0.5 million in 2016. Further, a discrete benefit of $1.3 million resulting in a tax rate benefit of 1.2% was recorded in 2016 associated with reduced state income tax expense in prior years arising from state return to provision paid for workers' compensation insurance. The revaluation
of deferred taxes resulted in discrete tax (benefit)/expense representing 5.2%(0.5)%, 7.8%5.2% and 1.5%7.8% of the effective tax rate for the years ended December 31, 2016, 2015 and 2014, and 2013, respectively. The benefit in other tax expense
Deferred Income Taxes
Significant components of 2.2% is primarily attributable to adjustments to state net operating losses resulting from state legislative changes.
The Company records a valuation allowance to reduce reportedour deferred tax assets if, based on the weightand liabilities are as follows:
|
| | | | | | |
| | Year Ended December 31, |
| (In thousands) | 2016 | 2015 |
| Deferred tax assets: | | |
| Net operating losses (federal and state) | $ | 4,397 |
| $ | 2,508 |
|
| Accrued expenses | 10,239 |
| 9,908 |
|
| Accrued workers' compensation costs | 13,266 |
| 18,823 |
|
| Stock-based compensation | 5,350 |
| 4,643 |
|
| Tax benefits relating to uncertain positions | 37 |
| 29 |
|
| Tax credits (federal and state) | 6,344 |
| 6,272 |
|
| Other | (47 | ) | 113 |
|
| Total | 39,586 |
| 42,296 |
|
| Valuation allowance | (5,689 | ) | (5,276 | ) |
| Total deferred tax assets | 33,897 |
| 37,020 |
|
| Deferred tax liabilities: | | |
| Depreciation and amortization | (8,055 | ) | (3,277 | ) |
| Deferred service revenues | (114,646 | ) | (85,263 | ) |
| Prepaid health plan expenses | (3,569 | ) | (3,121 | ) |
| Total deferred tax liabilities | (126,270 | ) | (91,661 | ) |
| Net non-current deferred tax liabilities | $ | (92,373 | ) | $ | (54,641 | ) |
We recorded an additional $0.4 million of available evidence, both positive and negative, for each respective tax jurisdiction, it is more likely than not that some or all of the deferred tax assets will not be realized. The Company recorded a valuation allowance of $0.6from $5.3 million and $1.9in 2015 to $5.7 million as of December 31, 2015 and 2014, respectively,in 2016, related to certain federal and state net operating loss carryforwards generated in current year that may not be utilized prior to expiration. The Company hasWe have de minimis federal net operating loss carryforwards and$95.5 million multiple state net operating loss carryforwards of approximately $0.1 million and $60.8 million, respectively, as of December 31, 2015.2016. The federal net operating loss carryforward will begin expiring in 2031 and the state net operating loss carryforward will begin expiring in 2016. The Internal Revenue Code of 1986, as amended, imposes substantial restrictions on the utilization of net operating losses in the event of an “ownership change” of a corporation. Accordingly, a company’s ability to use net operating losses may be limited as prescribed under Internal Revenue Code Section 382 (“IRC Section 382”)2017. Events which may cause limitations in the amount of the net operating losses that the Company may use in any one year include, but are not limited to, a cumulative ownership change of more than 50% over a
three-year period. Due to the effects of historical equity issuances, the Company has determined that the future utilization of a portion of its net operating losses is limited annually pursuant to IRC Section 382. As of December 31, 2015, the Company has determined that a portion of its state net operating losses in the amount of $2.7 million, will expire because of the annual limitation.
The Company hasWe have excluded excess windfall tax benefits resulting from stock option exercises as components of the Company’sour gross state deferred tax assets, as tax attributes related to such windfall tax benefits should not be recognized until they result in a reduction of state taxes payable. The gross amount of unrealized state net operating loss carryforwards for state resulting from stock option exercises was $14.1$13.1 million at December 31, 2015.2016. When realized, excess windfall tax benefits are credited to additional paid-in capital. The provision for income taxes for the year ended December 31, 20152016 included $20.7$4.7 million of excess tax benefitbenefits resulting from stock option exercises and net operating loss carryforward utilization. The Company followsWe follow the tax law ordering method to determine when such net operating loss carryforwards have been realized.
The Company hasWe have $6.5 million (net of federal benefit) state tax credit carryforwards available that will begin expiring in 2021, which are partially offset by a valuation allowance of $4.7 million and $5.0 million as of December 31, 20152016 and 2014, respectively. Provision for income taxes for the years ended December 31, 2015 and 2014 included a tax benefit from operating loss carryforwards of $3.9 million and $24.3 million, respectively. The valuation allowance decreased by $1.7 million as of December 31, 2015. The valuation allowance increased by $1.8 million and $3.7 million as of December 31, 2014 and 2013, respectively.
The Company isWe are subject to tax in U.S. federal and various state and local jurisdictions, as well as Canada. The Company isWe are not subject to any material income tax examinations in federal or state jurisdictions for tax years beginning prior to January 1, 2011. The CompanyWe paid Notices of Proposed Assessments disallowing employment tax credits totaling $10.5 million, plus interest and penalties of $4.0 million in connection with the IRS examination of Gevity HR, Inc. and its subsidiaries, which was acquired by TriNet in June 2009. The Company plans to exhaust all administrative efforts to resolve this matter, however, itThis issue is likely that the matter will ultimately bebeing resolved through litigation. With regard to these employment tax credits, the Company believeswe believe it is more likely than not that the Companywe will prevail.prevail and realize our receivable included in other noncurrent assets without a charge to our statement of income. Therefore, no reserve has been recognized related to this matter.
As of December 31, 2015 and 2014, the total unrecognized tax benefits related to uncertain income tax positions, which would affect the effective tax rate if recognized, were $3.3 million and $3.2 million, respectively. As of December 31, 2015, the amount of the total unrecognized tax benefits for which it was reasonably possible such benefits could settle within the next year was de minimis.
A reconciliation of the beginning and ending amount of unrecognized tax benefits (excluding interest and penalties) is as follows (in thousands):
|
| | | | | | | | | | | |
| | Year Ended December 31, |
| | 2015 | | 2014 | | 2013 |
| Unrecognized tax benefits at January 1 | $ | 2,471 |
| | $ | 2,300 |
| | $ | 2,710 |
|
| Additions for tax positions of prior periods | — |
| | 25 |
| | — |
|
| Additions for tax positions of current period | 167 |
| | 182 |
| | 286 |
|
| Reductions for tax positions of prior period: | | | | | |
| Settlements with taxing authorities | — |
| | — |
| | (406 | ) |
| Lapse of applicable statute of limitations | — |
| | — |
| | (290 | ) |
| Adjustments to tax positions | (20 | ) | | (36 | ) | | — |
|
| Unrecognized tax benefits at December 31 | $ | 2,618 |
| | $ | 2,471 |
| | $ | 2,300 |
|
The Company includes interest and penalties related to unrecognized tax benefits within the provision for income taxes. As of December 31, 2015 and December 31, 2014, the total amount of gross interest and penalties accrued was $0.8 million and $0.8 million, respectively. In connection with tax matters, the Company recognized de minimis interest and penalty expense related to its uncertain tax positions as a component of income tax expense in the accompanying consolidated statements of operations for the years ended December 31, 2015, 2014 and 2013, respectively.
The Company hasWe have not provided for U.S. federal income and foreign withholding taxes on itsour Canadian subsidiary’s undistributed earnings of $2.6$2.7 million as of December 31, 2015,2016, because the Company intendswe intend to reinvest such earnings indefinitely. Upon
indefinitely. Upon distribution of those earnings in the form of dividends or otherwise, the Companywe would be subject to U.S. income taxes (subject to an adjustment for foreign tax credits). Determining the unrecognized deferred tax liability related to the Company'sour investment in itsour Canadian subsidiary that are indefinitely reinvested is not practicable. We currently intend
Uncertain Tax Positions
As of December 31, 2016 and 2015, the total unrecognized tax benefits related to indefinitely reinvest those earningsuncertain income tax positions, which would affect the effective tax rate if recognized, were $0.6 million and $3.3 million, respectively.
A reconciliation of the beginning and ending amount of unrecognized tax benefits (excluding interest and penalties) is as follows:
|
| | | | | | | | | |
| | Year Ended December 31, |
| (In thousands) | 2016 | 2015 | 2014 |
| Unrecognized tax benefits at January 1 | $ | 2,618 |
| $ | 2,471 |
| $ | 2,300 |
|
| Additions for tax positions of prior periods | — |
| — |
| 25 |
|
| Additions for tax positions of current period | 132 |
| 167 |
| 182 |
|
| Reductions for tax positions of prior period: | | | |
| Settlements with taxing authorities | (1,855 | ) | — |
| — |
|
| Lapse of applicable statute of limitations | (130 | ) | — |
| — |
|
| Adjustments to tax positions | (15 | ) | (20 | ) | (36 | ) |
| Unrecognized tax benefits at December 31 | $ | 750 |
| $ | 2,618 |
| $ | 2,471 |
|
As of December 31, 2016 and 2015, the total amount of gross interest and penalties accrued was $0.8 million. Accrued interest and penalties are included in other basis differences in operations outsideliabilities on the U.S.consolidated balance sheet.
NOTE 12.13. COMMITMENTS AND CONTINGENCIES
Lease Commitments
The Company leasesWe lease office facilities, including itsour headquarters and other facilities and equipment under non-cancelable operating leases. The Company also leases certain software and furniture, fixtures, and equipment under capital leases. The schedule of minimum future rental payments under non-cancelable operating and capital leases having initial terms in excess of one year at December 31, 2015,2016, is as follows (in thousands):follows:
| | | | Capital
Leases | | Operating Leases | |
| (In thousands) | | Operating Leases |
| Year ending December 31: | | | | |
| 2016 | $ | 82 |
| | $ | 11,882 |
| |
| 2017 | 80 |
| | 10,466 |
| $ | 15,274 |
|
| 2018 | 65 |
| | 9,606 |
| 13,809 |
|
| 2019 | 41 |
| | 8,119 |
| 11,840 |
|
| 2020 | — |
| | 7,643 |
| 11,334 |
|
| 2021 | | 5,505 |
|
| Thereafter | — |
| | 2,607 |
| 6,882 |
|
| Minimum lease payments | 268 |
| | $ | 50,323 |
| $ | 64,644 |
|
| Less current portion of minimum lease payments | (37 | ) | | | |
| Less interest | (115 | ) | | | |
| Long term portion of capital leases | $ | 116 |
| | | |
The lease agreements generally provide for rental payments on a graduated basis and for options to renew, which could increase future minimum lease payments if exercised. The Company recognizesWe recognize rent expense on a straight-line basis over the lease period and accruesaccrue for rent expense incurred but not paid. Rent expense for the years ended December 31, 2016, 2015 and 2014 and 2013 was $16.7 million, $12.9 million and $11.9 million, and $9.9respectively.
Standby Letters of Credit
We have two standby letters of credit up to an aggregate of $17.8 million respectively. Sublease income to be received under non-cancelable subleasesprovided as collateral for the years endingour workers’ compensation obligations. At December 31, 2016, and 2017, is $0.3 million and de minimis, respectively.
Operating Covenants
To meet various states’ licensing requirements and maintain accreditation by the Employer Services Assurance Corporation, the Company is subject to various minimum working capital and net worth requirements. As of December 31, 2015 and 2014, the Company believes it has fully complied in all material respects with all applicable state regulations regarding minimum net worth, working capital and all other financial and legal requirements. Further, the Company has maintained positive working capital throughout the period covered by the financial statements.facilities were not drawn down.
Contingencies
On or about
In August 7, 2015, Howard Welgus, a purported stockholder of the Company, filed a putative securities class action lawsuit, arisingWelgus v. TriNet Group, Inc. et. al., under the Securities and Exchange Act of 1934 in the United States District Court (the Court) for the Northern District of California. The case has not been certified as a class action, although it purports to be filed on behalf of purchasers of the Company’s common stock between May 5, 2014 and August 3, 2015, inclusive. The name of the case is Welgus v. TriNet Group, Inc. et al., Case No. 3:15-cv-03625. No stockholder other than Mr. Welgus submitted a motion for appointment as lead plaintiff to represent the putative class, and, on December 3, 2015, the Court appointed Mr. Welgus as lead plaintiff. On February 1, 2016, Mr. Welgus filed ancomplaint was later amended complaint. The defendants named in the case are the Company and certain of its officers and directors, as well as General Atlantic, LLC, a significant shareholder, and formerly majority shareholder, of the Company.April 2016. The amended complaint generally alleges that TriNet and the Companyother defendants caused damage to stockholderspurchasers of the Companyour stock by misrepresenting and/or failing to disclose facts generally pertaining to alleged trends affecting health insurance and workersworkers' compensation claims. UnderThe other defendants include certain of our officers and directors, General Atlantic, LLC, a stipulated briefing schedule approved byformer significant shareholder, and the underwriters of our IPO. In November 2016, the parties appeared at a hearing before the Court the Company intends to moveon our motion to dismiss the amended complaint no later than April 11, 2016.in its entirety. In January 2017, the Court issued an order granting TriNet’s and the other defendants’ motions to dismiss. The Company believes that itCourt dismissed the plaintiff’s claims in part with prejudice and in part without. As a result, the Court has meritorious defenses againstgiven the plaintiff until March 3, 2017 to file a second amended complaint with respect to claims not dismissed with prejudice. If the plaintiff chooses not to file a second amended complaint, the case will be dismissed with prejudice and a final judgment will be entered. We are unable to reasonably estimate the possible loss or range of losses, if any, arising from this action and intends to continue to defend itself vigorously against the allegations of Mr. Welgus.
litigation.
The Company isWe are and, from time to time, hashave been and may in the future become involved in various litigation matters, legal proceedings and claims arising in the ordinary course of its business, including disputes with itsour clients or various class action, collective action, representative action and other proceedings arising from the nature of itsour co-employment relationship with itsour clients and WSEs in which the Company iswe are named as a defendant. In addition, due to the nature of the Company’sour co-employment relationship with itsour clients and WSEs, the Companywe could be subject to liability for federal and state law violations, even if the Company doeswe do not participate in such violations. While the Company’sour agreements with itsour clients contain indemnification provisions related to the conduct of itsour clients, the Companywe may not be able to avail itselfourselves of such provisions in every instance. We have accrued our current best estimates of probable losses with respect to these matters which are individually and in aggregate immaterial to our consolidated financial statements.
While the outcome of the matters described above cannot be predicted with certainty, management currently does not believe that any such claims or proceedings or the above mentioned securities class action will have a materially
adverse effect on the Company’sour consolidated financial position, results of operations or cash flows. However, the unfavorable resolution of any particular matter or the Company’sour reassessment of itsour exposure for any of the above matters based on additional information obtained in the future could have a material impact on the Company’sour consolidated financial position, results of operations or cash flows. In addition, regardless of the outcome, the above matters, individually and in the aggregate, could have an adverse impact on the Company because of diversion of management resources and other factors.
NOTE 13.14. RELATED PARTY TRANSACTIONS
The Company entersWe have service agreements with certain stockholders that we process their employees' payrolls and payroll taxes. From time to time, we also enter into sales and purchases agreements with various companies that have a relationship with the Company’sour executive officers or members of the Company’sour board of directors. The relationships are typically an equity investment by the executive officer or board member in the customer / vendor company or the Company’sour executive officer or board member is a member of the customer / vendor company’scompany's board of directors. The Company hasWe have received $10.2 million, $6.1 million, and $3.9 million and $3.2 million in gross revenuetotal revenues from such related parties during the years ended December 31, 2016, 2015 and 2014, and 2013, respectively.
The Company hasWe have also entered into various software license agreements with Oracle Corporation. H. Raymond Bingham,software service providers who ishave board members in common with us. We paid the Chairman of the Board of the Company, is also a director of Oracle Corporation. The Company paid Oracle Corporationsoftware service providers $7.1 million, $4.1 million, $5.9 million, and $4.7$5.9 million during the years ended December 31, 2016, 2015 2014 and 2013,2014, for services itwe received, respectively.
Additionally, the company has entered into indemnity agreements with the directors and officers that provide, among other things, that TriNet will indemnify such officer or director, under the circumstances and to the extent provided for therein, for expenses, damages, judgments, fines and settlements he or she may be required to pay in actions or proceedings to which he or she is or may be made a party by reason of his or her position as a director, officer or other agent of TriNet, and otherwise to the fullest extent permitted under Delaware law and the Company’s Bylaws.
NOTE 14. RESTRUCTURING COSTS
In 2011, the Company conducted reductions in force affecting approximately 11% of its workforce. The restructuring costs consist of severance and placement costs, lease termination costs and other exit costs. The activity and balance of the restructuring liability account excluding impairment charges is as follows (in thousands):
|
| | | | | | | | | | | |
| | Year Ended December 31, |
| | 2015 | | 2014 | | 2013 |
| Beginning balance | $ | 644 |
| | $ | 1,374 |
| | $ | 2,200 |
|
| Provision | — |
| | — |
| | — |
|
| Change in estimate | — |
| | — |
| | — |
|
| Payments | (644 | ) | | (730 | ) | | (826 | ) |
| Ending Balance | $ | — |
| | $ | 644 |
| | $ | 1,374 |
|
The restructuring liability account was included in other current liabilities in the accompanying consolidated balance sheets as of December 31, 2014.
NOTE 15. QUARTERLY FINANCIAL DATA (UNAUDITED)
| | | | Quarter ended | Quarter ended |
| | March 31 | | June 30 | | September 30 | | December 31 | |
| (In thousands, except per share data) | | March 31 | June 30 | September 30 | December 31 |
| 2016 | | |
| Total revenues | | $ | 732,939 |
| $ | 745,846 |
| $ | 770,457 |
| $ | 811,071 |
|
| Insurance costs | | 569,689 |
| 596,673 |
| 609,422 |
| 637,968 |
|
| Operating income | | 25,902 |
| 26,367 |
| 28,972 |
| 42,717 |
|
| Net income | | 11,577 |
| 12,282 |
| 14,581 |
| 22,966 |
|
| Basic net income per share | | $ | 0.16 |
| $ | 0.17 |
| $ | 0.21 |
| $ | 0.34 |
|
| Diluted net income per share | | $ | 0.16 |
| $ | 0.17 |
| $ | 0.20 |
| $ | 0.32 |
|
| 2015 | | | | | | | | |
| Total revenues | $ | 625,578 |
| | $ | 640,007 |
| | $ | 668,008 |
| | $ | 725,695 |
| $ | 625,578 |
| $ | 640,007 |
| $ | 668,008 |
| $ | 725,695 |
|
| Insurance costs | $ | 483,203 |
| | $ | 517,994 |
| | $ | 534,481 |
| | $ | 576,698 |
| 483,203 |
| 517,994 |
| 534,481 |
| 576,698 |
|
| Operating income | $ | 31,041 |
| | $ | 5,985 |
| | $ | 11,682 |
| | $ | 29,609 |
| 31,041 |
| 5,985 |
| 11,682 |
| 29,609 |
|
| Net income (loss) | $ | 15,811 |
| | $ | (1,308 | ) | | $ | 3,097 |
| | $ | 14,095 |
| 15,811 |
| (1,308 | ) | 3,097 |
| 14,095 |
|
| Basic net income (loss) per share | $ | 0.23 |
| | $ | (0.02 | ) | | $ | 0.04 |
| | $ | 0.20 |
| $ | 0.23 |
| $ | (0.02 | ) | $ | 0.04 |
| $ | 0.20 |
|
| Diluted net income (loss) per share | $ | 0.22 |
| | $ | (0.02 | ) | | $ | 0.04 |
| | $ | 0.20 |
| $ | 0.22 |
| $ | (0.02 | ) | $ | 0.04 |
| $ | 0.20 |
|
| 2014 | | | | | | | | |
| Total revenues | $ | 508,912 |
| | $ | 525,006 |
| | $ | 555,951 |
| | $ | 603,662 |
| |
| Insurance costs | $ | 381,157 |
| | $ | 400,195 |
| | $ | 428,184 |
| | $ | 476,779 |
| |
| Operating income | $ | 25,277 |
| | $ | 20,029 |
| | $ | 21,246 |
| | $ | 20,239 |
| |
| Net income | $ | 1,540 |
| | $ | 6,221 |
| | $ | 725 |
| (1) | $ | 7,011 |
| |
| Basic net income per share | $ | 0.03 |
| | $ | 0.09 |
| | $ | 0.01 |
| | $ | 0.10 |
| |
| Diluted net income per share | $ | 0.03 |
| | $ | 0.09 |
| | $ | 0.01 |
| | $ | 0.10 |
| |
(1) Included in the results of the third quarter of 2014 is the write-off of debt issuance costs and pre-payment premium as a result of the Company’s amended and restated first lien credit facility. Please read Note 8, “Notes Payable and Borrowings Under Capital Leases,” for additional information.
|
| |
| DISCLOSURE CONTROLS AND PROCEDURES | |
Item 9. Changes in and Disagreements Withwith Accountants on Accounting and Financial Disclosure.
None.None
Item 9A. Controls and Procedures
Evaluation of Disclosure Controls and Procedures
Our management,We have, with the participation of our Chief Executive Officer (CEO) and our Chief Financial Officer (CFO), evaluated the effectiveness of our disclosure controls and procedures as of December 31, 2015.2016. The term “disclosure controls and procedures,” as defined in Rules 13a-15(e) and 15d-15(e) under the Securities Exchange Act of 1934, as amended, or the Exchange Act, means controls and other procedures of a company that are designed to ensure that information required to be disclosed by a company in the reports that it files or submits under the Exchange Act is recorded, processed, summarized and reported, within the time periods specified in the SEC’s rules and forms.
Disclosure controls and procedures include, without limitation, controls and procedures designed to ensure that information required to be disclosed by a company in the reports that it files or submits under the Exchange Act is accumulated and communicated to the company’s management, including its principal executive officer and principal financial officer, as appropriate to allow timely decisions regarding required disclosure. Based on the evaluation of our disclosure controls and procedures as of December 31, 2015,2016, our Chief Executive Officer and Chief Financial Officer concluded that, as of such date, our disclosure controls and procedures were not effective as a result of the material weaknesses in our internal control over financial reporting, described below.
However, giving full consideration to these weaknesses, and the additional analyses and other procedures we performed to ensure that our consolidated financial statements included in this Annual Report on Form 10-K were prepared in accordance with U.S. generally accepted accounting principles (GAAP), our management has concluded that our consolidated financial statements present fairly, in all material respects, our financial position, results of operations and cash flows for the periods disclosed in conformity with GAAP.
Management’s Report on Internal Control Over Financial Reporting
Our management is responsible for establishing and maintaining adequate internal control over financial reporting (as defined in Rules 13a-15(f) and 15d-15(f) under the Exchange Act). Internal control over financial reporting is designed to provide reasonable assurance regarding the reliability of financial reporting and the preparation of financial statements for external reporting purposes in accordance with GAAP. Internal control over financial reporting includes those policies and procedures that:
pertain to the maintenance of records that in reasonable detail accurately and fairly reflect the transactions and dispositions of assets;
provide reasonable assurance that transactions are recorded as necessary to permit preparation of financial statements in accordance with GAAP, and that receipts and expenditures are being made only in accordance with appropriate authorizations; and
provide reasonable assurance regarding prevention or timely detection of unauthorized acquisition, use or disposition of assets that could have a material effect on the financial statements.
Because of its inherent limitations, a system of internal control over financial reporting may not prevent or detect misstatements. Also, projections of any evaluation of effectiveness to future periods are subject to the risk that controls may become inadequate because of changes in conditions and that the degree of compliance with the policies or procedures may deteriorate.
Our management conducted an assessment of the effectiveness of our internal control over financial reporting based on the criteria established in “Internal Control - Integrated Framework” (2013) issued by the Committee of Sponsoring Organizations of the Treadway Commission (COSO). Based on that assessment, our management has concluded that our internal control over financial reporting as of December 31, 2015 was not effective due to the material weaknessesfurther described below. A material weakness is a deficiency, or a combination of deficiencies, in internal control over financial reporting such that there is a reasonable possibility that a material misstatement of our annual or interim financial statements will not be prevented or detected on a timely basis. Ernst & Young LLP,
Notwithstanding the material weaknesses in our internal control over financial reporting, we have concluded that the consolidated financial statements included in this Annual Report on Form 10-K fairly present, in all material respects, our financial position, results of operations and cash flows for the periods presented in conformity with accounting principles generally accepted in the United States of America. Additionally, the material weaknesses did not result in any restatements of our consolidated financial statements or disclosures for any prior period.
Management’s Report on Internal Control Over Financial Reporting
We are responsible for establishing and maintaining adequate internal control over financial reporting as defined in Rules 13a-15(f) and 15d-15(f) promulgated under the Exchange Act as a process, designed by, or under the supervision of the our principal executive and principal financial officers and effected by our board of directors, management and other personnel, to provide reasonable assurance regarding the reliability of financial reporting and the preparation of financial statements for external purposes in accordance with GAAP.
Due to inherent limitations, internal control over financial reporting is not intended to provide absolute assurance that a misstatement of our financial statements would be prevented or detected. Also, projections of any evaluation of effectiveness to future periods are subject to the risk that controls may become inadequate because of changes in conditions or that the degree of compliance with policies or procedures may deteriorate.
We, with the participation of the CEO and CFO, conducted an independent registered public accounting firm, has auditedevaluation of the effectiveness of our internal control over financial reporting as statedof December 31, 2016 based on the framework and criteria established in theirInternal Control - Integrated Framework (2013) issued by the Committee of Sponsoring Organizations of the Treadway Commission. This evaluation included review of the documentation of controls, testing of the operating effectiveness of controls and a conclusion on this evaluation.
Based on the foregoing, we concluded that our internal controls over financial reporting as of December 31, 2016 were not effective as a result of the material weaknesses described below.
Deloitte & Touche LLP, our independent registered public accounting firm, has issued an audit report dated March [15], 2016, which is included in this Annual Report on Form 10-K.the effectiveness of our internal control over financial reporting as of December 31, 2016. This audit report appears below.
|
| |
| DISCLOSURE CONTROLS AND PROCEDURES | |
IneffectiveInformation Technology General Controls (ITGC)
In the course of completing our assessment of internal control over financial reporting as of December 31, 2015, we identified a number of deficiencies related to the design and operating effectiveness of information technology (IT) general controls for information systems that comprised part of our system of internal control over financial reporting and are relevant to the preparation of our consolidated financial statements (such information technology systems are referred to as the “affected IT systems”).
OurThese deficiencies in the design and operating effectiveness of the controls involved logical access, program change management and computer operations controls that are intended to ensure that access to financial applications and data is adequately restricted to appropriate personnel, and that changes affecting the financial applications and underlying account records are identified, authorized, tested and implemented appropriately.
We have concluded that deficiencies in ITGC logical access, including controls intended to ensure that access rights are compatible with job duties (segregation of duties) existed at December 31, 2016 and therefore represent a material weakness as of December 31, 2016.
As a result of the deficiencies identified, the following business process controls that are dependent on the affected IT systems or resulting electronic data and financial reports were adversely affected: controls over revenues and insurance costs; insurance liabilities, payroll related costs, payroll tax and WSE related assets and liabilities. Accordingly, the business process controls that are dependent on affected IT systems or resulting electronic data were also deemed to be deficient and have material weaknesses.
Revenue and Payroll Operations
We have determined that we have several control deficiencies aggregating to a material weakness related to the design and operating effectiveness of controls over our revenue platforms as of December 31, 2016. This was primarily caused by controls over the review and approval of adjustments to revenue, including revenue pricing and SOI benefit elections could not be attested as operating effectively due to control deficiencies. The deficiencies noted above could impact revenues, insurance costs, insurance liabilities, payroll related costs, payroll tax and WSE related assets and liabilities.
Payroll Tax Liabilities
We have determined that we have several control deficiencies aggregating to a material weakness in the design and operating effectiveness of our controls to validate the accuracy and completeness of withholding tax rates updated into our payroll systems as of December 31, 2016. We receive payroll tax rate updates from an outside vendor which we rely upon. We do not, however, receive a report of service organization controls to ensure that we timely receive all tax rate updates. Additionally, our controls over the identification and resolution of reconciling items for our payroll tax liabilities to our general ledger were not operating with a sufficient level of precision to be effective. Our internal review processes to verify the tax rate updates received from the vendor are not at a sufficient level of precision to conclude all that tax rate updates have been accurately and timely identified. These deficiencies impact our WSE related liabilities.
Insurance Costs and Insurance Liabilities
We have determined that we have several control deficiencies aggregating to a material weakness exist related to the design and operating effectiveness of our IT general controls (ITGCs) for certainover health and worker’s compensation expenses and liabilities as of our key information systems, including our enterprise resource planning (ERP) systemsDecember 31,2016. Controls over the review and payroll systems, that are relevant to the preparationreconciliation of our consolidated financial statementsinput data, spreadsheets and system of internal control over financial reporting. In addition, these deficiencies also impact the ability to rely on related interfaces, application controls andgenerated reports generated by the systems with ineffective ITGCs. The ineffective design and operation of our ITGCs impacts all of our significant financial statement accounts and disclosures. The deficiencies related to the design and operating effectiveness of our ITGCs fell into the three main categories listed below:
Computer Operations
Design and operating effectiveness of our system of controls related to the monitoring of batch processing and system interfaces to ensure the completeness and accuracy of data movement involving our ERP system and certain payroll systems that process revenue transactions were identified as having deficiencies.
Access Controls
Design and operating effectiveness of our controls to ensure that access to applications and data were adequately restricted to appropriate personnel were identified as having deficiencies. These deficiencies impact a number of our systems that process internal and revenue-generating payroll transactions, fixed assets, stock option and restricted stock unit information, procurement authorizations, insurance expenses, insurance reserves and payroll taxes.
Change Management
Design and operating effectiveness of controls to monitor program change management procedures, including monitoring the activities of individuals who have authority and have been granted access to make changes to programs, were identified as having deficiencies. These deficiencies impacted systems that process procurement authorizations and accumulate claims data that is utilized to estimate worker’s compensation liabilities.
Ineffective control environment and risk assessment
Our management determined that a material weakness exists due to a lack of a sufficient complement of personnelnot designed with an appropriate level of knowledge, experienceprecision to provide reasonable assurance that they will prevent or detect a material error in the financial statements. These deficiencies impact insurance costs, workers’ compensation collateral receivable, workers’ compensation liabilities, and training commensurateworksite employee related assets and liabilities.
Entity Level Controls - Control Activities and Monitoring
We determined that we have several control deficiencies aggregating to a material weakness related to our entity level controls over our identification of certain control activities and the monitoring of our control performance as of December 31, 2016.
|
| |
| DISCLOSURE CONTROLS AND PROCEDURES | |
The control deficiencies included ineffective controls over the evaluation and timely review of controls operating at service organizations and the integration of these controls with our structure,'user' controls. Additionally, we had inadequate processes to monitor control performance and remediation activities and failed to implement compensating controls for deficiencies in ITGC's.
Changes in Internal Control over Financial Reporting
Significant changes in internal control over financial reporting included, but were not limited to
Improved the design, operating effectiveness, and documentation of certain review controls used to verify the accuracy of data used in financial reporting. These activities included the development of new review controls, training and education for process owners on audit requirements, and the creation of review templates to properly document evidence of management review.
Implementation of a new procure-to-pay system that interfaces with internal systems and designed to ensure only authorized individuals can access the system and execute purchases. Detailed processes and automated controls are maintained in the system in an effort to ensure all approvers and defined dollar limits conform with our expense and authorization policy. Other control enhancements include vendor contract review and approval prior to purchase requisition set-up and payment.
We have been actively engaged in the implementation of a remediation plan designed to ensure that controls contributing to remediation of our ITGC material weakness are designed appropriately and will operate effectively. We also engaged external IT specialist consultants to advise us on these remediation activities. The remediation actions we have taken to date to address the material weakness and to improve and strengthen our internal controls include the following:
Enhancing IT governance policies and procedures,
Designing and implementing control activities and procedures around user and administrator access, program change management and monitoring of batch processing, and
Hiring qualified IT resources, and providing sufficient training to the relevant control owners.
We retired the Ambrose and Accord payroll platforms and implemented a number of controls to improve the effectiveness of revenue processing and to control the manual inputs and data changes to address the material weaknesses identified in 2015.
We improved the design, operation, and monitoring of control activities and procedures to address internal controls and financial reporting requirements. Additionally, we did not have an adequate process in placeThese activities included the hiring of senior financial management, improvements to complete our testingfinancial reporting processes and assessmentcontrol activities, and the significant expansion of the internal audit department as well as hiring outside consultants to facilitate the timely completion of the evaluation of the design and operating effectiveness of internal control over financial reporting in a timely manner.reporting.
Ineffective management reviewWe improved reconciliation controls andof the payroll taxes payable account, but have not sufficiently addressed controls over system-generated reportsthe completeness and accuracy of the payroll tax rates input into our Passport platform.
Our management determined that several control deficiencies aggregating to a material weakness exist related toAs of December 31, 2016, testing of both the design and operating effectiveness of ourthe new and improved controls was completed, and management concluded that the material weaknesses in internal controls over financial reporting related to ensure that key spreadsheetsITGC computer operations and system-generated reports were properly reviewed for completenesschange management control, control environment and accuracy. For certainrisk assessment, management review controls, and procurement processes have been fully remediated.
Except for the changes described above there were no changes in our internal control over financial reporting identified in management’s evaluation pursuant to Rules 13a-15(d) or 15d-15(d) of the Exchange Act during the fourth quarter ended December 31, 2016 that materially affected, or are reasonably likely to materially affect, our internal control over financial reporting.
Planned Remediation Activities
We will continue the consolidation of IT platforms, plan to complete the implementation of appropriate access rights and monitor the operation of new controls verifyingso management can conclude that they are designed and operating effectively, and the accuracymaterial weakness is remediated. We plan to implement additional compensating controls over areas of underlying data used to perform these reviews were not performed or adequately documented. known ITGC access issues while the relevant controls are in remediation, require self-certification as part of an improved
|
| |
| DISCLOSURE CONTROLS AND PROCEDURES | |
system of control monitoring and improve the process of integrating and testing service organization controls that we rely upon.
In addition, certain management review controls were not performed at a sufficiently precise levelas we continue to identify errors that could aggregateevaluate and work to a material misstatement of theimprove our internal control over financial statements. These deficiencies impact substantially all of our significant financial statement accounts.
Ineffective controls over payroll operations
Our management determined that severalreporting, we may take additional measures to address control deficiencies aggregatingor determine to a material weakness exist relatedmodify the remediation plan described above. We will continue to test and evaluate the designimplementation of these new processes and internal controls during 2017 to ascertain whether they are designed and operating effectiveness of our controls over the accuracy of certain informationeffectively to provide reasonable assurance that we manually input into the payroll systems and that is used in the processing of payroll for customers. Manually input information includes contractual terms, bill rates, benefit elections and other wage data. Controls identified tothey will prevent or detect inappropriate changes to payroll informationa material error in our financial statements.
To further strengthen controls around the accuracy and resolvecompleteness of revenue and payroll processing, errors were not effectively designedwe will continue to detect material errors. Additionally, management identified deficiencies relatedconsolidate platforms in 2017 and retire the SOI platform which will reduce a significant number of manual business process controls. We intend to improve transaction logging capabilities in an effort to ensure manual adjustments are properly evidenced as authorized and reviewed. We will develop an additional compensating controls in an effort to ensure the output of payroll processing and recorded revenue is complete and accurate.
We will be implementing a number of control improvements in order to further improve the design and operating effectiveness of controls over the reconciliation of benefit enrollment data between the Company’s payroll systems and the insurance carriers’ records. The deficiencies impact amounts recorded as professional and insurance service revenues, operating expenses, accrued corporate wages, and worksite employee related assets and liabilities.
Ineffective controls over health and workersworker’s compensation liabilities and related expenses
Our management determined that several control deficiencies aggregating in 2017. The design of key controls will be addressed to a material weakness exist related to the design and operating effectiveness of our controls to validatebetter ensure the completeness and accuracy of data utilizedinformation used in calculating healtha control (key reports) and workers compensation liabilitiesreview controls will be refined to better address both the accuracy and related expenses, including premium expenses and administrative fees. Data utilized includes enrollment counts, cost rates, wage data, claim counts and incurred and paid claim amounts. Certain reconciliationsprecision of claim payments per the Company’s actuarial analyses to actual amounts paid were not operating effectively. Additionally,management’s review.
We will implement compensating controls over the reviewtax rates provided by the outside vendor in an effort to ensure all tax rate updates are complete, accurate, and timely.
While we intend to resolve all of health premium expenses did not operate at a level of precision that would detectthe material errors. These deficiencies impact insurance costs, workers compensation receivables, workers compensation liabilities, and worksite employee related assets and liabilities.
Ineffective controls over validating accuracy of payroll tax liabilities
Our management determined that several control deficiencies, aggregating towe cannot provide any assurance that these remediation efforts will be successful or that our internal control over financial reporting will be effective as a material weakness exist related to the design and operating effectivenessresult of our controls to validate the accuracy and completeness of tax rates input into our payroll systems, including reconciliation to the general ledger of the payroll taxes payable account at a sufficient level of detail. In addition, due to the ineffective ITGCs over the system that calculates payroll tax withholdings, compensating controls identified are not sufficiently precise to prevent or detect errors in the amounts recorded as payroll tax liabilities for internal employees and WSEs.these efforts by any particular date.
Ineffective authorization controls over procurement processes
Our management determined that a material weakness exists related to the design and operating effectiveness of our controls over the initial set up and changes to designated approvers over corporate purchases, including purchasing card limits, expense reimbursements or approving new vendors added to the procurement system.
|
| |
| DISCLOSURE CONTROLS AND PROCEDURES | |
REPORT OF INDEPENDENT REGISTERED PUBLIC ACCOUNTING FIRM
The Board of Directors and Stockholders of
TriNet Group, Inc. and Subsidiaries
We have audited TriNet Group, Inc. and Subsidiaries’the internal control over financial reporting of TriNet Group, Inc. and subsidiaries (the "Company”) as of December 31, 2015,2016, based on criteria established in Internal Control-IntegratedControl - Integrated Framework (2013) issued by the Committee of Sponsoring Organizations of the Treadway Commission (2013 framework), (the COSO criteria). TriNet Group, Inc. and SubsidiariesCommission. The Company's management is responsible for maintaining effective internal control over financial reporting and for its assessment of the effectiveness of internal control over financial reporting, included in the accompanying Management’s Report on Internal Control Over Financial Reporting. Our responsibility is to express an opinion on the company’sCompany's internal control over financial reporting based on our audit.
We conducted our audit in accordance with the standards of the Public Company Accounting Oversight Board (United States). Those standards require that we plan and perform the audit to obtain reasonable assurance about whether effective internal control over financial reporting was maintained in all material respects. Our audit included obtaining an understanding of internal control over financial reporting, assessing the risk that a material weakness exists, testing and evaluating the design and operating effectiveness of internal control based on the assessedthat risk, and performing such other procedures as we considered necessary in the circumstances. We believe that our audit provides a reasonable basis for our opinion.
A company’scompany's internal control over financial reporting is a process designed by, or under the supervision of, the company's principal executive and principal financial officers, or persons performing similar functions, and effected by the company's board of directors, management, and other personnel to provide reasonable assurance regarding the reliability of financial reporting and the preparation of financial statements for external purposes in accordance with generally accepted accounting principles. A company’scompany's internal control over financial reporting includes those policies and procedures that (1) pertain to the maintenance of records that, in reasonable detail, accurately and fairly reflect the transactions and dispositions of the assets of the company; (2) provide reasonable assurance that transactions are recorded as necessary to permit preparation of financial statements in accordance with generally accepted accounting principles, and that receipts and expenditures of the company are being made only in accordance with authorizations of management and directors of the company; and (3) provide reasonable assurance regarding prevention or timely detection of unauthorized acquisition, use, or disposition of the company’scompany's assets that could have a material effect on the financial statements.
Because of itsthe inherent limitations of internal control over financial reporting, including the possibility of collusion or improper management override of controls, material misstatements due to error or fraud may not preventbe prevented or detect misstatements.detected on a timely basis. Also, projections of any evaluation of the effectiveness of the internal control over financial reporting to future periods are subject to the risk that the controls may become inadequate because of changes in conditions, or that the degree of compliance with the policies or procedures may deteriorate.
A material weakness is a deficiency, or a combination of deficiencies, in internal control over financial reporting, such that there is a reasonable possibility that a material misstatement of the company’s annual or interim financial statements will not be prevented or detected on a timely basis. MaterialThe following material weaknesses have been identified in the following categories and included in management’smanagement's assessment:
Ineffective controls to ensure identification of control activities and monitoring
Ineffective information technology (IT) general controls
Ineffective control environment and risk assessment
Ineffective management review controls and controls over system-generated reportsuser access
Ineffective controls over revenue and payroll operations
Ineffective controls over health and workers compensation liabilities and related expenses
Ineffective controls over validating accuracy of payroll tax liabilities
Ineffective authorization controls over procurement processesinsurance costs and insurance liabilities
We also have audited, in accordance with the standards of the Public Company Accounting Oversight Board (United States), the 2015 consolidated financial statements. These material weaknesses were considered in determining the nature, timing, and extent of audit tests applied in our audit of the 2015consolidated financial statements and financial statement schedule as of and for the year ended December 31, 2016, of the Company and this report does not affect our report dated March 31, 2016 which expressed an unqualified opinion on thosesuch financial statements.
|
| |
| DISCLOSURE CONTROLS AND PROCEDURES | |
In our opinion, because of the effect of the material weaknesses describedidentified above on the achievement of the objectives of the control criteria, TriNet Group, Inc. and Subsidiariesthe Company has not maintained effective internal control over financial reporting as of December 31, 2015,2016, based on the COSO criteria.criteria established in Internal Control - Integrated Framework (2013) issued by the Committee of Sponsoring Organizations of the Treadway Commission.
We have also audited, in accordance with the standards of the Public Company Accounting Oversight Board (United States), the consolidated financial statements and financial statement schedule as of and for the year ended December 31, 2016, of the Company and our report dated February 28, 2017 expressed an unqualified opinion on those financial statements and financial statement schedule.
/s/ ErnstDELOITTE & YoungTOUCHE LLP
San Francisco, California
March 31, 2016
Additional Analyses and Procedures and Remediation Plan
As a result of the material weaknesses described above, we performed additional analyses and other procedures in order to prepare the financial statements included in this Annual Report on Form 10-K. While the material weaknesses described above create a reasonable possibility that an error in financial reporting may go undetected, after extensive review and the performance of additional analysis and other procedures, no material adjustments, restatement or other revisions to our previously issued financial statements were required.
In addition, we are taking specific steps, as further described below, to remediate the material weaknesses identified by management and described in greater detail in the preceding section. Although we intend to complete the remediation process with respect to these material weaknesses as quickly as possible, we cannot at this time estimate how long it will take, and our remediation plan may not prove to be successful.February 28, 2017
With respect to the remediation of our ineffective IT general controls, we are taking a number of steps, which include, but are not limited to:
designing, adopting or implementing IT governance policies, procedures and general controls across all technology platforms;
improving the design and operation of control activities and procedures associated with monitoring of batch processing and system interfaces to ensure the completeness and accuracy of data movement;
establishing a more comprehensive review and approval process for authorizing user access to IT systems , including both preventive and detective control activities;
improving the design and operation of program change management control activities such as change management control setting configurations across the affected IT systems, including tracking of access and history of change; and
augmenting and hiring additional IT resources and professionals.
We are also working to integrate our technology platforms and ERP systems to reduce the number of redundant business processes. For example, we completed the integration of our Ambrose technology platform as of February 29, 2016 and we currently expect to complete the integration of our Accord technology platform by the end of 2016.
With respect to the remediation in other areas, we are taking a number of steps, which include, but are not limited to:
defining and assessing the control deficiency for each of the material weaknesses to ensure a thorough understanding of the “as-is” state, identify relevant process owners, and define and address gaps in the control deficiency;
designing and evaluating a remediation plan for each of the material weaknesses to validate or improve the related policy and procedures, assess and improve skills of the process owners with regards to the policy and make necessary adjustments as required;
implementing the remediation plan for each of the material weaknesses and training process owners, evaluating process adoption and monitoring results;
testing and measuring the design and effectiveness of the remediation plan, and the updated controls;
management review and acceptance of the remediation effort; and
augmenting and hiring additional accounting, actuarial, finance and internal audit resources and professionals.
We believe that the foregoing efforts will effectively remediate the material weaknesses identified above. Because the reliability of the internal control process requires repeatable execution, the successful remediation of these material weaknesses will require review and evidence of effectiveness prior to concluding that the controls are effective and there is no assurance that additional remediation steps will not be necessary. As such, as we continue to evaluate and work to improve our internal control over financial reporting, our management may decide to take additional measures to address the material weaknesses or modify the remediation steps described above. As noted above, although we plan to complete the remediation process as quickly as possible, we cannot at this time estimate how long it will take, and our initiatives may not prove to be successful. Accordingly, until these weaknesses are remediated, we plan to perform additional analyses and other procedures to ensure that our consolidated financial statements are prepared in accordance with GAAP.
Changes in Internal Control Over Financial Reporting
Other than the identification of the material weaknesses described above, there were no changes in our internal control over financial reporting identified in connection with the evaluation required by Rule 13a-15(d) and 15d-15(d) of the Exchange Act that occurred during the quarter ended December 31, 2015, that have materially affected, or are reasonably likely to materially affect, our internal control over financial reporting.
Item 9B. Other Information.
Not applicable.
|
| |
| MANAGEMENT AND CERTAIN SECURITY HOLDERS | |
PART III
Item 10. Directors, Executive Officers and Corporate Governance.
Information required by this item is incorporated by reference to TriNet Group Inc.’s Proxy Statement for its 20162017 Annual Meeting of Shareholders to be filed with the SEC within 120 days after the end of the fiscal year ended December 31, 2015.2016.
Item 11. Executive Compensation.
Information required by this item is incorporated by reference to TriNet Group Inc.’s Proxy Statement for its 20162017 Annual Meeting of Shareholders to be filed with the SEC within 120 days after the end of the fiscal year ended December 31, 2015.2016.
Item 12. Security Ownership of Certain Beneficial Owners and Management and Related Stockholder Matters.
Information required by this item is incorporated by reference to TriNet Group Inc.’s Proxy Statement for its 20162017 Annual Meeting of Shareholders to be filed with the SEC within 120 days after the end of the fiscal year ended December 31, 2015.2016.
Item 13. Certain Relationships and Related Transactions, and Director Independence.
Information required by this item is incorporated by reference to TriNet Group Inc.’s Proxy Statement for its 20162017 Annual Meeting of Shareholders to be filed with the SEC within 120 days after the end of the fiscal year ended December 31, 2015.2016.
Item 14. Principal Accounting Fees and Services.
Information required by this item is incorporated by reference to TriNet Group Inc.’s Proxy Statement for its 20162017 Annual Meeting of Shareholders to be filed with the SEC within 120 days after the end of the fiscal year ended December 31, 2015.2016.
|
| |
| FINANCIAL STATEMENT SCHEDULES | |
PART IV
Item 15. Exhibits, Financial Statement Schedules.
(a) The following documents are filed as a part of the report:
(1) The financial statements filed as part of this report are listed in the “Index to Financial Statements” under Part II, Item 8 of this report.
(2) Financial statement schedules.
SCHEDULE II-VALUATION AND QUALIFYING ACCOUNTS
| | | | | Balance at | | Credited/ | | | | Charges | | Balance at | Balance at | Credited/ | Charges | Balance at |
| | | Beginning of | | Charged to | | Balance | | Utilized/ | | End of | Beginning of | Charged to | Utilized/ | End of |
| (in thousands) | | Period | | Net Income | | Acquired | | Write-Offs | | Period | Period | Net Income | Write-Offs | Period |
| Allowances for Doubtful Accounts and Authorized Credits | | | | | | | | | | | | | |
| Year ended December 31, 2016 | | $ | 1,158 |
| 1,418 |
| (2,284 | ) | $ | 292 |
|
| Year ended December 31, 2015 | | $ | 388 |
| | $ | 2,085 |
| | $ | — |
| | $ | (1,315 | ) | | $ | 1,158 |
| $ | 388 |
| 2,085 |
| (1,315 | ) | $ | 1,158 |
|
| Year ended December 31, 2014 | | $ | 865 |
| | $ | 947 |
| | $ | — |
| | $ | (1,424 | ) | | $ | 388 |
| $ | 865 |
| 947 |
| (1,424 | ) | $ | 388 |
|
| Year ended December 31, 2013 | | $ | 819 |
| | $ | 839 |
| | $ | — |
| | $ | (793 | ) | | $ | 865 |
| |
| Tax Valuation Allowance | | | | | | | | | | | | | |
| Year ended December 31, 2016 | | $ | 5,276 |
| 413 |
| — |
| $ | 5,689 |
|
| Year ended December 31, 2015 | | $ | 6,945 |
| | $ | — |
| | $ | — |
| | $ | (1,669 | ) | | $ | 5,276 |
| $ | 6,945 |
| — |
| (1,669 | ) | $ | 5,276 |
|
| Year ended December 31, 2014 | | $ | 5,194 |
| | $ | 1,751 |
| | $ | — |
| | $ | — |
| | $ | 6,945 |
| $ | 5,194 |
| 1,751 |
| — |
| $ | 6,945 |
|
| Year ended December 31, 2013 | | $ | 1,547 |
| | $ | 2,451 |
| | $ | 1,196 |
| | $ | — |
| | $ | 5,194 |
| |
|
| |
| FINANCIAL STATEMENT SCHEDULES | |
SIGNATURES
Pursuant to the requirements of Section 13 or 15(d) of the Securities Exchange Act of 1934, the Registrant has duly caused this report to be signed on its behalf by the undersigned, thereunto duly authorized, in the City of San Leandro, State of California, on the 31st28th day of March, 2016.February, 2017.
|
| | | |
| | TRINET GROUP, INC. |
| | |
Date: March 31, 2016February 28, 2017 | | By: | /s/ Burton M. Goldfield |
| | | | Burton M. Goldfield |
| | | | Chief Executive Officer |
KNOW ALL PERSONS BY THESE PRESENTS, that each person whose signature appears below constitutes and appoints Burton M. Goldfield, William Porter and Brady Mickelsen, and each of them, as his true and lawful attorneys-in-fact and agents, each with the full power of substitution, for him and in his name, place or stead, in any and all capacities, to sign any amendments to this report and to file the same, with exhibits thereto, and other documents in connection therewith, with the Securities and Exchange Commission, hereby ratifying and confirming all that any of said attorneys-in-fact and agents, or their or his substitute or substitutes, may lawfully do or cause to be done by virtue hereof.
|
| |
| FINANCIAL STATEMENT SCHEDULES | |
Pursuant to the requirements of the Securities Exchange Act of 1934, this report has been signed by the following persons on behalf of the Registrant and in the capacities and on the dates indicated.
|
| | | | |
| Signature | | Title | | Date |
| | | | | |
/s/ BURTONBurton M. GOLDFIELD Goldfield | | Chief Executive Officer (principal executive officer) | | March 31, 2016February 28, 2017 |
| Burton M. Goldfield | | |
| | | | | |
/s/ WILLIAM PORTER William Porter | | Chief Financial Officer (principal financial and accounting officer) | | March 31, 2016February 28, 2017 |
| William Porter | | |
| | | | |
| /s/ Michael J. Angelakis | | Director | | February 28, 2017 |
| Michael J. Angelakis | | |
| | | | | |
| /s/ Katherine August-deWilde | | Director | | March 31, 2016February 28, 2017 |
| Katherine August-deWilde | | |
| | | | | |
| /s/ Martin Babinec | | Director | | March 31, 2016February 28, 2017 |
| Martin Babinec | | |
| | | | | |
| /s/ H. Raymond Bingham | | Director | | March 31, 2016February 28, 2017 |
| H. Raymond Bingham | | |
| | | | | |
| /s/ Paul Chamberlain | | Director | | March 31, 2016February 28, 2017 |
| Paul Chamberlain | | |
| | | | | |
| /s/ Kenneth Goldman | | Director | | March 31, 2016February 28, 2017 |
| Kenneth Goldman | | |
| | | | | |
| /s/ David C. Hodgson | | Director | | March 31, 2016February 28, 2017 |
| David C. Hodgson | | |
| | | | | |
| /s/ John H. Kispert | | Director | | March 31, 2016February 28, 2017 |
| John H. Kispert | | |
| | | | | |
| /s/ Wayne B. Lowell | | Director | | March 31, 2016February 28, 2017 |
| Wayne B. Lowell | | |
EXHIBIT INDEX
| | | | | | | Incorporated by Reference | | | | Incorporated by Reference | | |
Exhibit No. | | Description of Exhibit | | Form | | File No. | | Exhibit | | Filing | | Filed Herewith | | Description of Exhibit | | Form | | File No. | | Exhibit | | Filing | | Filed Herewith |
| | | | | | | | | | | | | |
| 2.1 | | Equity Purchase Agreement by and among TriNet Group, Inc., Ambrose Employer Group, LLC and Gregory Slamowitz, John Iorillo and Marc Dwek, dated July 1, 2013. | | S-1 | | 333-192465 | | 2.1 |
| | 11/21/2013 | | | | Equity Purchase Agreement by and among TriNet Group, Inc., Ambrose Employer Group, LLC and Gregory Slamowitz, John Iorillo and Marc Dwek, dated July 1, 2013. | | S-1 | | 333-192465 | | 2.1 |
| | 11/21/2013 | | |
| | | | | | | | | | | | | |
| 2.2 | | Agreement and Plan of Merger by and among TriNet Group, Inc., Champ Acquisition Corporation, SOI Holdings, Inc. and SOI Stockholder Representative, LLC, dated August 24, 2012. | | S-1 | | 333-192465 | | 2.2 |
| | 11/21/2013 | | | | Agreement and Plan of Merger by and among TriNet Group, Inc., Champ Acquisition Corporation, SOI Holdings, Inc. and SOI Stockholder Representative, LLC, dated August 24, 2012. | | S-1 | | 333-192465 | | 2.2 |
| | 11/21/2013 | | |
| | | | | | | | | | | | | |
| 3.1 | | Amended and Restated Certificate of Incorporation of TriNet Group, Inc. | | 8-K | | 001-36373 | | 3.1 |
| | 4/1/2014 | | | | Amended and Restated Certificate of Incorporation of TriNet Group, Inc. | | 8-K | | 001-36373 | | 3.1 |
| | 4/1/2014 | | |
| | | | | | | | | | | | | |
| 3.2 | | Amended and Restated Bylaws of TriNet Group, Inc. | | S-1/A | | 333-192465 | | 3.4 |
| | 3/4/2014 | | | | Amended and Restated Bylaws of TriNet Group, Inc. | | S-1/A | | 333-192465 | | 3.4 |
| | 3/4/2014 | | |
| | | | | | | | | | | | | |
| 4.1 | | Amended and Restated Registration Rights Agreement, by and among TriNet Group, Inc., GA TriNet LLC and HR Acquisitions, LLC, dated June 1, 2009. | | S-1 | | 333-192465 | | 4.2 |
| | 11/21/2013 | | | | Amended and Restated Registration Rights Agreement, by and among TriNet Group, Inc., GA TriNet LLC and HR Acquisitions, LLC, dated June 1, 2009. | | S-1 | | 333-192465 | | 4.2 |
| | 11/21/2013 | | |
| | | | | | | | |
| 4.2 | | | Registration Rights Agreement, by and between TriNet Group, Inc. and AGI-T, L.P., dated as of February 1, 2017. | | 8-K | | 001-36373 | | 4.1 |
| | 2/2/2017 | |
| | | | | | | | | | |
| 10.1* | | Amended and Restated 2000 Equity Incentive Plan. | | S-1 | | 333-192465 | | 10.1 |
| | 11/21/2013 | | | | Amended and Restated 2000 Equity Incentive Plan. | | S-1 | | 333-192465 | | 10.1 |
| | 11/21/2013 | | |
| | | | | | | | | | | | | |
| 10.2* | | Forms of Option Agreement and Option Grant Notice under the Amended and Restated 2000 Equity Incentive Plan. | | S-1 | | 333-192465 | | 10.2 |
| | 11/21/2013 | | | | Forms of Option Agreement and Option Grant Notice under the Amended and Restated 2000 Equity Incentive Plan. | | S-1 | | 333-192465 | | 10.2 |
| | 11/21/2013 | | |
| | | | | | | | | | | | | |
| 10.3* | | Amended and Restated 2009 Equity Incentive Plan. | | S-1/A | | 333-192465 | | 10.3 |
| | 3/14/2014 | | | | Amended and Restated 2009 Equity Incentive Plan. | | S-1/A | | 333-192465 | | 10.3 |
| | 3/14/2014 | | |
| | | | | | | | | | | | | |
| 10.4* | | Form of Performance-Based Restricted Stock Unit Award Agreement and Performance-Based Restricted Stock Unit Grant Notice under the Amended and Restated 2009 Equity Incentive Plan. | | 10-Q | | 001-36373 | | 10.X |
| | 5/8/2015 | | | Form of Performance-Based Restricted Stock Unit Award Agreement and Performance-Based Restricted Stock Unit Grant Notice under the Amended and Restated 2009 Equity Incentive Plan. | | 10-Q | | 001-36373 | | 10.1 |
| | 5/8/2015 | |
| | | | | | | |
| 10.5* | | Form of Option Agreement and Option Grant Notice under the Amended and Restated 2009 Equity Incentive Plan. | | S-1/A | | 333-192465 | | 10.4 |
| | 3/4/2014 | | | | Form of Option Agreement and Option Grant Notice under the Amended and Restated 2009 Equity Incentive Plan. | | S-1/A | | 333-192465 | | 10.4 |
| | 3/4/2014 | | |
| | | | | | | | | | | | | |
| 10.6* | | Form of Restricted Stock Unit Agreement and Restricted Stock Unit Award Notice under the Amended and Restated 2009 Equity Incentive Plan. | | S-1/A | | 333-192465 | | 10.6 |
| | 3/4/2014 | | | | Form of Restricted Stock Unit Agreement and Restricted Stock Unit Award Notice under the Amended and Restated 2009 Equity Incentive Plan. | | S-1/A | | 333-192465 | | 10.6 |
| | 3/4/2014 | | |
| | | | | | | | | | | | | |
| 10.7* | | 2014 Employee Stock Purchase Plan. | | S-1/A | | 333-192465 | | 10.7 |
| | 3/14/2014 | | | | 2014 Employee Stock Purchase Plan. | | S-1/A | | 333-192465 | | 10.7 |
| | 3/14/2014 | | |
| | | | | | | | | | | | | |
| 10.8* | | 2015 Executive Bonus Plan. | | 8-K | | 001-36373 | | N/A |
| | 3/11/2015 | | | 2015 Executive Bonus Plan. | | 8-K | | 001-36373 | | N/A |
| | 3/11/2015 | |
| | | | | | | |
| 10.9* | | Amended and Restated Non-Employee Director Compensation Policy. | | DEF 14A | | 001-36373 | | N/A |
| | 4/2/2015 | | | Amended and Restated Non-Employee Director Compensation Policy. | | DEF 14A | | 001-36373 | | N/A |
| | 4/2/2015 | |
| | | | | | | |
| 10.10* | | Severance Benefit Plan. | | | | X | | Severance Benefit Plan. | | 10-K | | 001-36373 | | 10.10 |
| | 4/1/2016 | |
| | | | | | | |
| 10.11* | | Form of Indemnification Agreement made by and between TriNet Group, Inc. and each of its directors and executive officers. | | S-1/A | | 333-192465 | | 10.8 |
| | 3/4/2014 | | | | Form of Indemnification Agreement made by and between TriNet Group, Inc. and each of its directors and executive officers. | | S-1/A | | 333-192465 | | 10.8 |
| | 3/4/2014 | |
| | | | | | | |
| 10.12* | | Employment Agreement, dated November 9, 2009, between Burton M. Goldfield and TriNet Group, Inc. | | S-1/A | | 333-192465 | | 10.9 |
| | 2/13/2014 | | | |
| | | | | |
| 10.13* | | Letter Agreement, dated June 22, 2015, between Gregory Hammond and TriNet Group, Inc. | | 10-Q | | 001-36373 | | 10.1 |
| | 8/6/2015 | | |
| | | | | |
|
| | | | | | | | | | | | | |
| | | | | Incorporated by Reference | | |
Exhibit No. | | Description of Exhibit | | Form | | File No. | | Exhibit | | Filing | | Filed Herewith |
| 10.14* | | Employment Agreement, dated November 9, 2009, between Gregory Hammond and TriNet Group, Inc. | | S-1/A | | 333-192465 | | 10.10 |
| | 2/13/2014 | | |
| | | | | | | | | | | | | |
| 10.15* | | Employment Agreement, dated August 23, 2010, between William Porter and TriNet Group, Inc. | | S-1/A | | 333-192465 | | 10.11 |
| | 2/13/2014 | | |
| | | | | | | | | | | | | |
| 10.16* | | Employment Agreement, dated March 5, 2012, between John Turner and TriNet Group, Inc. | | S-1/A | | 333-192465 | | 10.12 |
| | 2/13/2014 | | |
| | | | | | | | | | | | | |
| 10.17* | | Employment Agreement, dated May 8, 2015, between Brady Mickelsen and TriNet Group, Inc. | | 10-Q | | 001-36373 | | 10.2 |
| | 08/06/2015 | | |
| | | | | | | | | | | | | |
| 10.18* | | Amended and Restated First Lien Credit Agreement, dated as of August 20, 2013, as amended and restated as of July 9, 2014, among TriNet HR Corporation, as borrower, TriNet Group, Inc., the lenders from time to time party thereto and JPMorgan Chase Bank, N.A., as administrative agent. | | 8-K | | 001-36373 | | 10.1 |
| | 7/10/2014 | | |
| | | | | | | | | | | | | |
| 10.19 | | Creekside Plaza Office Lease between Creekside Associates, LLC and TriNet Group, Inc., dated April 24, 2001. | | S-1 | | 333-192465 | | 10.15 |
| | 11/21/2013 | | |
| | | | | | | | | | | | | |
| 10.20 | | First Amendment to Creekside Plaza Office Lease between Creekside Associates, LLC and TriNet Group, Inc., dated June 21, 2012. | | S-1 | | 333-192465 | | 10.16 |
| | 11/21/2013 | | |
| | | | | | | | | | | | | |
| 21.1 | | List of Subsidiaries. | | | | | | | | | | X |
| | | | | | | | | | | | | |
| 23.1 | | Consent of Ernst & Young LLP, independent registered public accounting firm. | | | | | | | | | | X |
| | | | | | | | | | | | | |
| 24.1 | | Power of Attorney (included on the signature page of this report). | | | | | | | | | | |
| | | | | | | | | | | | | |
| 31.1 | | Certification of Principal Executive Officer pursuant to Section 302 of the Sarbanes-Oxley Act of 2002. | | | | | | | | | | X |
| | | | | | | | | | | | | |
| 31.2 | | Certification of Principal Financial Officer pursuant to Section 302 of the Sarbanes-Oxley Act of 2002. | | | | | | | | | | X |
| | | | | | | | | | | | | |
| 32.1** | | Certification of Principal Executive Officer and Principal Financial Officer pursuant to Section 906 of the Sarbanes-Oxley Act of 2002. | | | | | | | | | | X |
| | | | | | | | | | | | | |
| 101.INS | | XBRL Instance Document. | | | | | | | | | | X |
| | | | | | | | | | | | | |
| 101.SCH | | XBRL Taxonomy Extension Schema Document. | | | | | | | | | | X |
| | | | | | | | | | | | | |
| 101.CAL | | XBRL Taxonomy Extension Calculation Linkbase Document. | | | | | | | | | | X |
| | | | | | | | | | | | | |
| 101.DEF | | XBRL Taxonomy Extension Definition Linkbase Document. | | | | | | | | | | X |
| | | | | | | | | | | | | |
| 101.LAB | | XBRL Taxonomy Extension Label Linkbase Document. | | | | | | | | | | X |
| | | | | | | | | | | | | |
| 101.PRE | | XBRL Taxonomy Extension Presentation Linkbase Document. | | | | | | | | | | X |
| | | | | | | | | | | | | |
| * | Constitutes a management contract or compensatory plan or arrangement. |
| ** | Document has been furnished, is deemed not filed and is not to be incorporated by reference into any of the Company’s filings under the Securities Act of 1933, as amended, or the Securities Exchange Act of 1934, as amended, irrespective of any general incorporation language contained in any such filing. |
|
| | | | | | | | | | | | | |
| | | | | Incorporated by Reference | | |
Exhibit No. | | Description of Exhibit | | Form | | File No. | | Exhibit | | Filing | | Filed Herewith |
| 10.12* | | Employment Agreement, dated November 9, 2009, between Burton M. Goldfield and TriNet Group, Inc. | | S-1/A | | 333-192465 | | 10.9 |
| | 2/13/2014 | | |
| | | | | | | | | | | | | |
| 10.13* | | Employment Agreement, dated August 23, 2010, between William Porter and TriNet Group, Inc. | | S-1/A | | 333-192465 | | 10.11 |
| | 2/13/2014 | | |
| | | | | | | | | | | | | |
| 10.14* | | Employment Agreement, dated March 5, 2012, between John Turner and TriNet Group, Inc. | | S-1/A | | 333-192465 | | 10.12 |
| | 2/13/2014 | | |
| | | | | | | | | | | | | |
| 10.15* | | Employment Agreement, dated May 8, 2015, between Brady Mickelsen and TriNet Group, Inc. | | 10-Q | | 001-36373 | | 10.2 |
| | 8/6/2015 | | |
| | | | | | | | | | | | | |
| | | Letter Agreement, dated June 22, 2015, between Gregory Hammond and TriNet Group, Inc. | | 10-Q | | 001-36373 | | 10.1 |
| | 8/6/2015 | | |
| | | | | | | | | | | | | |
| 10.16* | | Transition Agreement by and among TriNet Group, Inc. and William Porter, dated as of September 30, 2016
| | 8-K | | 001-36373 | | 10.1 |
| | 10/3/2016 | | |
| | | | | | | | | | | | | |
| 10.17 | | Stockholder Agreement, by and between TriNet Group, Inc. and AGI-T, L.P., dated as of December 21, 2016
| | 8-K | | 001-36373 | | 10.1 |
| | 12/22/2016 | | |
| | | | | | | | | | | | | |
| 10.18 | | Amended and Restated First Lien Credit Agreement, dated as of August 20, 2013, as amended and restated as of July 29, 2016, among TriNetHR Corporation, as borrower, TriNet Group, Inc., the lenders from time to time party thereto and JPMorgan Chase Bank, N.A., as administrative agent.
| | 8-K | | 001-36373 | | 10.1 |
| | 7/10/2014 | | |
| | | | | | | | | | | | | |
| | | Incremental Facility Amendment, dated as of July 29, 2016, to the Amended and Restated First Lien Credit Agreement dated as of August 20, 2013, as amended and restated as of July 9, 2014, among TriNet HR Corporation, as borrower, TriNet Group, Inc., the lenders party thereto and JPMorgan Chase Bank, N.A., as administrative agent.
| | 8-K | | 001-36373 | | 10.1 |
| | 8/1/2016 | | |
| | | | | | | | | | | | | |
| 10.19 | | Creekside Plaza Office Lease between Creekside Associates, LLC and TriNet Group, Inc., dated April 24, 2001. | | S-1 | | 333-192465 | | 10.15 |
| | 11/21/2013 | | |
| | | | | | | | | | | | | |
| 10.20 | | First Amendment to Creekside Plaza Office Lease between Creekside Associates, LLC and TriNet Group, Inc., dated June 21, 2012. | | S-1 | | 333-192465 | | 10.16 |
| | 11/21/2013 | | |
| 16.1 | | Letter from Ernst & Young LLP, dated May 10, 2016 | | 8-K | | 001-36373 | | 16.1 |
| | 5/10/2016 | | |
| | | | | | | | | | | | | |
| 21.1 | | List of Subsidiaries. | | | | | | | | | | X |
| | | | | | | | | | | | | |
| 23.1 | | Consent of Ernst & Young LLP, independent registered public accounting firm. | | | | | | | | | | X |
| | | | | | | | | | | | | |
| 23.2 | | Consent of Deloitte & Touche LLP, independent registered public accounting firm. | | | | | | | | | | X |
| | | | | | | | | | | | | |
| 24.1 | | Power of Attorney (included on the signature page of this report). | | | | | | | | | | |
| | | | | | | | | | | | | |
|
| | | | | | | | | | | | | |
| | | | Incorporated by Reference | | |
Exhibit No. | | Description of Exhibit | | Form | | File No. | | Exhibit | | Filing | | Filed Herewith |
| 31.1 | | Certification of Principal Executive Officer pursuant to Section 302 of the Sarbanes-Oxley Act of 2002. | | | | | | | | | | X |
| | | | | | | | | | | | |
| 31.2 | | Certification of Principal Financial Officer pursuant to Section 302 of the Sarbanes-Oxley Act of 2002. | | | | | | | | | | X |
| | | | | | | | | | | | |
| 32.1** | | Certification of Principal Executive Officer and Principal Financial Officer pursuant to Section 906 of the Sarbanes-Oxley Act of 2002. | | | | | | | | | | X |
| | | | | | | | | | | | |
| 101.INS | | XBRL Instance Document. | | | | | | | | | | X |
| | | | | | | | | | | | |
| 101.SCH | | XBRL Taxonomy Extension Schema Document. | | | | | | | | | | X |
| | | | | | | | | | | | |
| 101.CAL | | XBRL Taxonomy Extension Calculation Linkbase Document. | | | | | | | | | | X |
| | | | | | | | | | | | |
| 101.DEF | | XBRL Taxonomy Extension Definition Linkbase Document. | | | | | | | | | | X |
| | | | | | | | | | | | |
| 101.LAB | | XBRL Taxonomy Extension Label Linkbase Document. | | | | | | | | | | X |
| | | | | | | | | | | | |
| 101.PRE | | XBRL Taxonomy Extension Presentation Linkbase Document. | | | | | | | | | | X |
| | | | | | | | | | | | |
| * | Constitutes a management contract or compensatory plan or arrangement. |
| ** | Document has been furnished, is deemed not filed and is not to be incorporated by reference into any of the Company’s filings under the Securities Act of 1933, as amended, or the Securities Exchange Act of 1934, as amended, irrespective of any general incorporation language contained in any such filing. |