UNITED STATES
SECURITIES AND EXCHANGE COMMISSION
WASHINGTON, DC 20549
FORM 10-K
(Mark One)
☒ ANNUAL REPORT PURSUANT TO SECTION 13 OR 15(d) OF THE SECURITIES EXCHANGE ACT OF 1934
For the year ended December 31, 20202023
or
☐ TRANSITION REPORT PURSUANT TO SECTION 13 OR 15(d) OF THE SECURITIES EXCHANGE ACT OF 1934
For the transition period from to
Commission File Number: 001-36373
TRINET GROUP, INC.
(Exact Name of Registrant as Specified in its Charter)
| | | | | | | | | | | |
| Delaware | | 95-3359658 |
(State or other jurisdiction of
incorporation or organization) | | (I.R.S. Employer
Identification No.) |
| One Park Place, | Suite 600 | | |
| Dublin, | CA | | 94568 |
| (Address of principal executive offices) | | (Zip Code) |
Registrant’s telephone number, including area code: (510) 352-5000
Securities registered pursuant to Section 12(b) of the Act:
| | | | | | | | |
| Title of each class | Trading Symbol(s) | Name of each exchange on which registered |
| Common stock par value $0.000025 per share | TNET | New York Stock Exchange |
Securities registered pursuant to Section 12(g) of the Act: None
Indicate by check mark if the registrant is a well-known seasoned issuer, as defined in Rule 405 of the Securities Act. Yes ☒ No ☐
Indicate by check mark if the registrant is not required to file reports pursuant to Section 13 or Section 15(d) of the Act. Yes ☐ No ☒
Indicate by check mark whether the registrant (1) has filed all reports required to be filed by Section 13 or 15(d) of the Securities Exchange Act of 1934 during the preceding 12 months (or for such shorter period that the registrant was required to file such reports), and (2) has been subject to such filing requirements for the past 90 days. Yes ☒ No ☐
Indicate by check mark whether the registrant has submitted electronically every Interactive Data File required to be submitted pursuant to Rule 405 of Regulation S-T (§ 232.405 of this chapter) during the preceding 12 months (or for such shorter period that the registrant was required to submit such files). Yes ☒ No ☐
Indicate by check mark whether the registrant is a large accelerated filer, an accelerated filer, a non-accelerated filer, a smaller reporting company, or an emerging growth company. See the definitions of “large accelerated filer,” “accelerated filer,” “smaller reporting company,” and “emerging growth company” in Rule 12b-2 of the Exchange Act.
| | | | | | | | | | | | | | | | | |
| Large accelerated filer | ☒ | Accelerated filer | ☐ | Non-accelerated filer | ☐ |
| | | | | | |
| Smaller reporting company | ☐ | Emerging growth company | ☐ | | |
If an emerging growth company, indicate by check mark if the registrant has elected not to use the extended transition period for complying with any new or revised financial accounting standards provided pursuant to Section 13(a) of the Exchange Act. Yes ☐ No ☐
Indicate by check mark whether the registrant has filed a report on and attestation to its management’s assessment of the effectiveness of its internal control over financial reporting under Section 404(b) of the Sarbanes-Oxley Act (15 U.S.C. 7262(b)) by the registered public accounting firm that prepared or issued its audit report.☒
If securities are registered pursuant to Section 12(b) of the Act, indicate by check mark whether the financial statements of the registrant included in the filing reflect the correction of an error to previously issued financial statements. ☐
Indicate by check mark whether any of those error corrections are restatements that required a recovery analysis of incentive-based compensation received by any of the registrant’s executive officers during the relevant recovery period pursuant to §240.10D-1(b). ☐
Indicate by check mark whether the registrant is a shell company (as defined in Rule 12b-2 of the Exchange Act). Yes ☐ No ☒
The aggregate market value of the voting and non-voting common equity held by non-affiliates of the Registrant, based on the closing price of the shares of common stock on The New York Stock Exchange on June 30, 2020,2023, was $2.5$3.6 billion.
The number of shares of Registrant’s Common Stock outstanding as of February 9, 20218, 2024 was 65,990,673.50,567,866.
Portions of the Registrant’s Definitive Proxy Statement to be issued in connection with its Annual Meeting of Stockholders, scheduled to be held on May 27, 2021,23, 2024, are incorporated by reference into Part III of this Form 10-K.
TRINET GROUP, INC.
Form 10-K - Annual Report
For the Year Ended December 31, 20202023
TABLE OF CONTENTS
| | | | | | | | |
| Form 10-K Cross Reference | Page |
| | |
| Part I, Item 1. | |
| Part I, Item 1A. | |
| Part I, Item 1B. | |
| Part I, Item 1C | |
| Part I, Item 2. | |
| Part I, Item 3. | |
| Part I, Item 4. | |
| Part II, Item 5. | |
| | |
| Part II, Item 7. | |
| Part II, Item 7A. | |
| Part II, Item 8. | |
| | |
| | |
| | |
| | |
| | |
| Part II, Item 9. | |
| Part II, Item 9A. | |
| Part II, Item 9B. | |
| Part II, Item 9C. | |
| Part III, Item 10. | |
| Part III, Item 11. | |
| Part III, Item 12. | |
| Part III, Item 13. | |
| Part III, Item 14. | |
| Part IV, Item 15. | |
| Part IV, Item 16. | |
| | |
Glossary of Acronyms and Abbreviations
Acronyms and abbreviations are used throughout this report, particularly in Part I, Item 1. Business; Part I, Item 1A. Risk Factors; Part II, Item 7. MD&A; Part II, Item 7A. Quantitative and Qualitative Disclosures About Market Risk and Part II, Item 8. Financial Statements and Supplementary Data.
| | | | | | |
AB52018 Term Loan | Assembly Bill 5Our $425 million term loan A executed in June 2018 and repaid in 2021 | |
| 2021 Credits | Our announced 2021 credits, which provided eligible clients with discretionary credits, subject to certain predefined conditions. | |
| 2022 Credits | Includes both of our announced 2022 credits, each of which provides eligible clients with discretionary credits, subject to certain predefined conditions. | |
| 2021 Credit Agreement | Our credit agreement dated February 26, 2021, as amended, supplemented or modified from time to time, most recently August 16, 2023. | |
| 2021 Revolver | Our $700 million revolving line of credit included in our 2021 Credit Agreement | |
| 2029 Notes | Our $500 million senior unsecured notes maturing in March 2029 | |
| 2031 Notes | Our $400 million senior unsecured notes maturing in August 2031 | |
| | |
| ACA | The Patient Protection and Affordable Care Act | |
| ACH | Automated Clearinghouse Transaction | |
| AFS | Available-for-sale | |
| ARPA | American Rescue Plan Act | |
| ASC | Accounting standards codificationStandards Codification | |
| ASO | Administrative Services Organization | |
| ASU | Accounting standards updateStandards Update | |
| CARES Act | Coronavirus Aid Relief and Economic Security Act | |
| CCPA | California Consumer Privacy Act | |
| CEO | Chief Executive Officer | |
| CIRT | Cybersecurity Incident Response Team | |
| CFO | Chief Financial Officer | |
| | |
| COBRA | Consolidated Omnibus Budget Reconciliation Act | |
| Colleague | TriNet's internal employee (as distinguished from WSEs and HRIS Users) | |
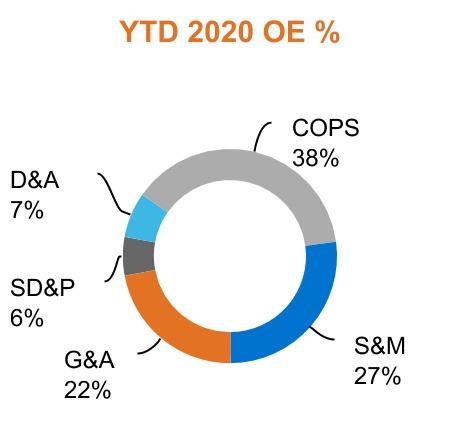
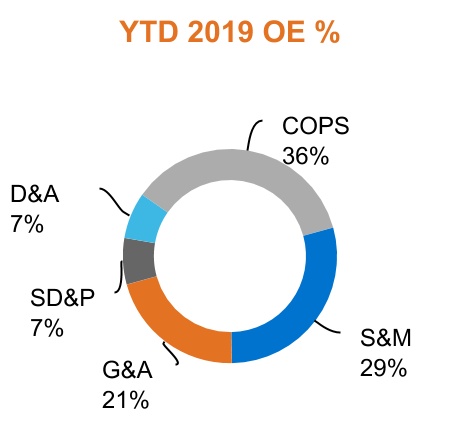
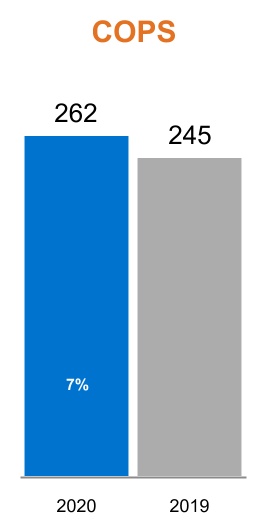
| COPS | Cost of providing services | |
| | |
| COVID-19 | Novel coronavirus | |
| CPRA | California Privacy Rights Act | |
| CSO | Chief Security Officer | |
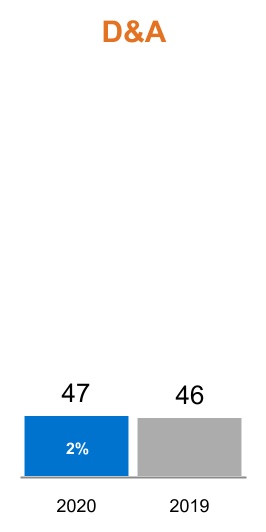
| D&A | Depreciation and amortization expenses | |
| DOL | U.S. Department of Labor | |
| EBITDA | Earnings before interest expense, taxes, depreciation and amortization of intangible assets | |
| EPLI | Employment Practices Liability Insurance | |
| EPS | Earnings Per Share | |
| ERISA | Employee Retirement Income Security Act | |
ESACERM | Employer Services Assurance CorporationEnterprise Risk Management | |
| ERP | Enterprise Resource Planning | |
| | |
| ESPP | Employee stock purchase plan | |
| ETR | Effective tax rate | |
| FASB | Financial Accounting Standards Board | |
| FFCRA | Families First Coronavirus Response Act | |
| FLSA | Fair Labor Standards Act | |
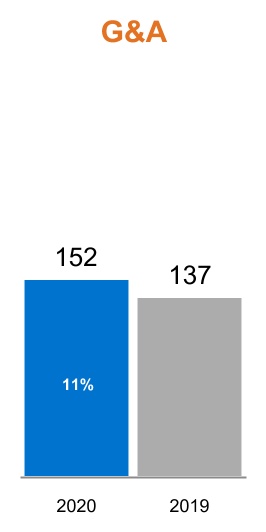
| G&A | General and administrative | |
| GAAP | Generally Accepted Accounting Principles in the United States | |
| HCM | Human capital management | |
| HIPAA | Health Insurance Portability and Accountability Act | |
| | | | | | |
| HITECH Act | Health Information Technology for Economic and Clinical Health Act | |
| HR | Human Resources | |
| HRIS | Human resources information system | |
| HRIS User | A client employee who is a user of our HR Platform (for example, employees of a TriNet Zenefits client) | |
| IBNP | Incurred but not yet paid | |
| IBNR | Incurred but not yet reported | |
| ICR | Insurance cost ratio | |
| IGP | Indemnity Guarantee Payment | |
| IRC | Incident Review Committee | |
| IRCF | Integrated Risk and Control Framework | |
| IRM | Information Risk Management | |
| IRS | Internal Revenue Service | |
| ICR | Insurance cost ratio | |
| ISR | Insurance service revenues | |
| | |
| LDF | Loss development factor | |
| LIBOR | London Inter-bank Offered Rate | |
| MCT | Medical cost trend | |
| MD&A | Management's Discussion and Analysis of Financial Condition and Results of Operations |
| | | | | |
NIMMEWA | Net Insurance Margin |
NISRMultiple Employer Welfare Arrangement | | Net Insurance Service Revenues
NSR | Net service revenues |
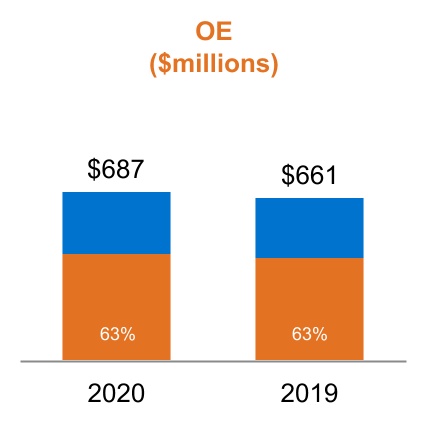
| OE | Operating expenses | |
| OMS | Open Market Solutions offering that includes Broker Select and Broker Flex offerings | |
| PCAOB | Public Company Accounting Oversight Board | |
| PEO | Professional Employer Organization | |
| PFC | Payroll funds collected | |
| PHI | Protected Health Information | |
| PPP | Paycheck Protection Program, a loan program administered by the SBA |
| PPPFA | Paycheck Protection Program Flexibility Act |
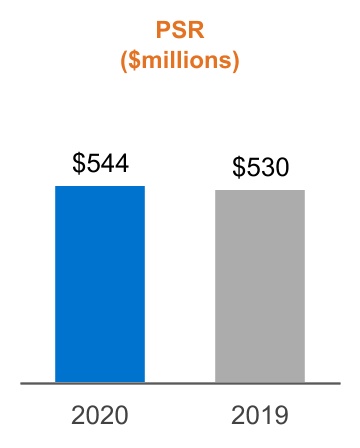
| PSR | Professional service revenues | |
| R&D | Research and Development | |
| Recovery Credit | ProgramOur 2020 Recovery Credit to provide eligible clients with one-time reductions against fees for future services | |
| Recovery Credits | Collectively, our Recovery Credit, 2021 Credits, and 2022 Credits | |
| Reg FD | Regulation Fair Disclosure | |
| ROU | Right-of-use | |
| RSA | Restricted Stock Award | |
| RSU | Restricted Stock Unit | |
| SBA | U.S. Small Business Administration | |
| SBC | Stock Based Compensation | |
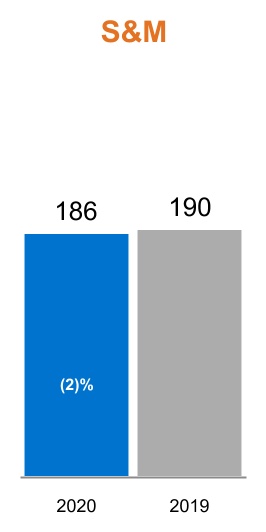
| S&M | Sales and marketing | |
S&P 500 | Standard and& Poor's 500 Stock Index | |
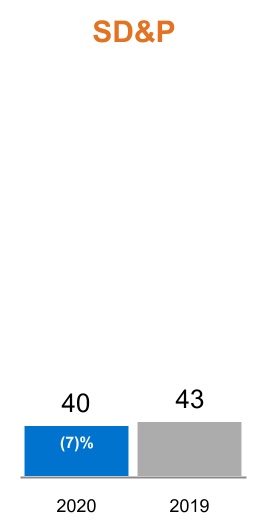
| SD&P | Systems development and programming | |
| SEC | U.S. Securities and Exchange Commission | |
| SMB | Small and medium-size business | |
| | |
| TCJA | Tax Cuts and Jobs Act | |
| TriNet Clarus R+D | Clarus R+D Solutions, LLC | |
| U.S. | United States | |
| | |
| | |
| WSE | WorksiteA worksite employee who is co-employed by, or otherwise receiving services from a TriNet PEO | |
| YTD | Year to date | |
| Zenefits | YourPeople, Inc. and its subsidiaries | |
Cautionary Note Regarding Forward-Looking Statements
For purposes of this Annual Report on Form 10-K (Form 10-K), the terms “TriNet,” “the Company,” “we,” “us” and “our” refer to TriNet Group, Inc., and its subsidiaries. This Form 10-K contains statements that are not historical in nature, are predictive in nature, or that depend upon or refer to future events or conditions or otherwise contain forward-looking statements within the meaning of Section 21 of the Securities Exchange Act of 1934, as amended, and the Private Securities Litigation Reform Act of 1995. Forward-looking statements are often identified by the use of words such as, but not limited to, “ability,” “anticipate,” “believe,” “can,” “continue,” “could,” “design,” “estimate,” “expect,” “forecast,” “hope,” “impact,” “intend,” “may,” “outlook,” “plan,” “potential,” “predict,” “project,” “seek,” “should,” “strategy,” “target,” “value,” “will,” “would” and similar expressions or variations intended to identify forward-looking statements. Examples of forward-looking statements include, among others, TriNet’s expectations regarding: market response to new support, service and product offerings, including our Enrich, Broker Select and tax credit products; our ability to successfully diversify our overall service and technology offerings to support SMBs throughout their lifecycle; our plans and ability to grow our client base; the impact of the COVID-19 pandemic; the impact of COVID-19 regulationsthat stopping our discretionary credit program may have on client loyalty and government programs;attrition; the impact of our Recovery Creditongoing efforts to ensure that our billing practices best match the expectations of our customers and the impact on our WSE count; the impact of our TriNet PeopleForce conference; our expectations regarding medical utilization rates by our WSEs and the impact of inflation on our insurance costs; the effect that our stock repurchase program and its suitability for generating client loyalty and retention;will have on our ability to modify or develop service offerings to assist clients affected by COVID-19;business; the impact of our vertical approach; our ability to leverage our scale and industry HR experience to deliver vertical servicefocused offerings; the growthimpact of our client base; planned improvements to our technology platform;platform and HRIS software and whether they will meet the needs of our current clients and attract new ones; the implementation of our ERP system and its impact on our internal financial controls and operations; our ability to driveimprove operating efficiencies and improve the client experience;efficiencies; the impact of our client service initiatives;initiatives and whether they enhance client experience and satisfaction; our continued ability to provide access to a broad range of benefit programs on a cost-effective basis; our expectations regarding the volume and severity of insurance claims and insurance claim trends; the impacteffectiveness of COVID-19 on claims;our risk strategies for, and management of, workers' compensation, health benefit insurance costs and deductibles, and EPLI risk; the metrics that may be indicators of future financial performance; the relative value of our benefit offerings versus those SMBs can independently obtain; the impact that our benefit offerings have for SMBs seeking to attract and retain employees; the principal competitive drivers in our market; our plans to retaingrow net new clients and manage client attrition; our investment strategy and its impact on our ability to generate future interest income, net income, and Adjusted EBITDA; seasonal trends and their impact on our business and the impact of COVID-19 on those trends;business; fluctuations in the period-to-period timing of when we incur certain operating expenses; the estimates and assumptions we use to prepare our financial statements; our belief we can meet our present and reasonably foreseeable cash needs and future commitments through existing liquid assets and continuing cash flows from corporate operating activities; and other expectations, outlooks and forecasts on our future business, operational and financial performance.
Important factors that could cause actual results, level of activity, performance or achievements to differ materially from those expressed or implied by these forward-looking statements are discussed above and throughout this Form 10-K, including under Part I, Item 1A. Risk Factors, and Part II, Item 7. MD&A, and in the other periodic filings we make with the SEC, and including risk factors associated with: the economic, health and business disruption caused by the COVID-19 pandemic; the impact of the COVID-19 pandemic on our clients and prospects, insurance costs and operations; the impact of the COVID-19 pandemic on the laws and regulations that impact our industry and clients; our ability to mitigate the business risks we face as a co-employer; our ability to manage unexpected changes in workers’ compensation and health insurance claims and costs by worksite employees;WSEs; our ability to mitigate the unique business risks we face as a co-employer; the effects of volatility in the financial and economic environment on the businesses that make up our client base,base; loss of clients for reasons beyond our control and the concentrationshort-term contracts we typically use with our clients; the impact of regional or industry-specific economic and health factors on our clients in certain geographies and industries;operations; the impact of failures or limitations in the business systems and centers we rely upon; the impact of discontinuing our Recovery Credit program; adversediscretionary credits on our business and client loyalty and retention; changes in our insurance coverage or our relationships with key insurance carriers; our ability to improve our services and technology to satisfy client and regulatory requirements and meet the expectations of our clients and manage client attrition;expectations; our ability to effectively integrate businesses we have acquired or may acquire in the future; our ability to effectively manage and improve our operational processes;effectiveness and resiliency; our ability to attract and retain qualified personnel; the effects of increased competition and our ability to compete effectively; the impact on our business of cyber-attacks, breaches, disclosures and security breaches;other data-related incidents; our ability to secureprotect against and remediate cyber-attacks, breaches, disclosures and other data-related incidents, whether intentional or inadvertent and whether attributable to us or our information technology infrastructure and our confidential, sensitive and personal information;service providers; our ability to comply with constantly evolving data privacy and security laws; our ability to manage changes in, uncertainty regarding, or adverse application of the complex laws and regulations that govern our business; changing laws and regulations governing health insurance and employee benefits; our ability to be recognized as an employer of worksite employees and for our benefits plans to satisfy all requirements under federal and state regulations; changes in the laws and regulations that govern what it means to be an employer, employee or independent contractor; the impact of new and changing laws regarding
remote work; our ability to comply with the laws and regulationslicensing requirements that govern PEOs and other similar industries;our solutions; the outcome of existing and future legal and tax proceedings; fluctuation in our results of operationoperations and stock price due to factors outside of our control, such as the volume and severity of our workers’ compensation and health insurance claims and the amount and timing of our insurance costs, operating expenses and capital expenditure requirements;control; our ability to comply with the restrictions of our credit facility and meet our debt obligations; and the impact of concentrated ownership in our stock.stock by Atairos and other large stockholders. Any of these factors could cause our actual results to differ materially from our anticipated results.
Forward-looking statements are not guarantees of future performance, but are based on management’s expectations as of the date of this Form 10-K and assumptions that are inherently subject to uncertainties, risks and changes in circumstances that are difficult to predict. Forward-looking statements involve known and unknown risks, uncertainties and other factors that may cause actual results, performance or achievements to be materially different from our current expectations and any past results, performance or achievements. Given these risks and uncertainties, readers are cautioned not to place undue reliance on such forward-looking statements.
The information provided in this Form 10-K is based upon the facts and circumstances known atas of the date of this time,Form 10-K, and any forward-looking statements made by us in this Form 10-K speak only as of the date of this Form 10-K. We undertake no obligation to revise or update any of the information provided in this Form 10-K, except as required by law.
Part II, Item 7.The MD&A of this Form 10-K includes references to our performance measures presented in conformity with GAAP and other non-GAAP financial measures that we use to manage our business, to make planning decisions, to allocate resources and to use as performance measures in our executive compensation plans. Refer to the Non-GAAP Financial Measures in Part II, Item 7. within our MD&A for definitions and reconciliations from GAAP measures.Website Disclosures
We use our website (www.trinet.com) to announce material non-public information to the public and to comply with our disclosure obligations under Regulation Fair Disclosure (Reg FD). We also use our website to communicate with the public about our Company, our services, and other matters. Our SEC filings, press releases and recent public conference calls and webcasts can also be found on our website. The information we post on our website could be deemed to be material information under Reg FD. We encourage investors and others interested in our Company to review the information we post on our website. Information contained in or accessible through our website is not a part of this report.
PART I
Item 1. Business
TriNet is a leading provider of comprehensive and flexible HCM solutions designed to address a wide range of SMB needs as they change over time. Our flexible HCM solutions free SMBs from HR complexities and empower SMBs to focus on what matters most - growing their business and enabling their people.
TriNet offers access to human capital expertise, payroll services, employee benefits, and employmentpayroll, risk mitigation and compliance, all enabled by industry leading technology capabilities. TriNet's suite of products also includes services for SMBs. and software-based solutions to help streamline workflows by connecting HR, benefits, payroll, time and attendance, and employee engagement. Clients can use our industry tailored PEO services and technology platform to receive the full benefit of our HCM services enabling their WSEs to participate in our TriNet-sponsored employee benefit plans. Clients can alternatively choose to use our self-directed, cloud-based HRIS software solution and add HR services such as payroll and access to benefits management as needed. By providing PEO and HRIS services, we believe that we can support a wider range of SMBs and create a pipeline of HRIS clients that may be able to benefit from and transition to TriNet’s higher-touch PEO services at future points in their business lifecycle. In order to better serve TriNet’s customers throughout their business lifecycle, we are investing in our technology platform so that it can accommodate both PEO and HRIS customers.
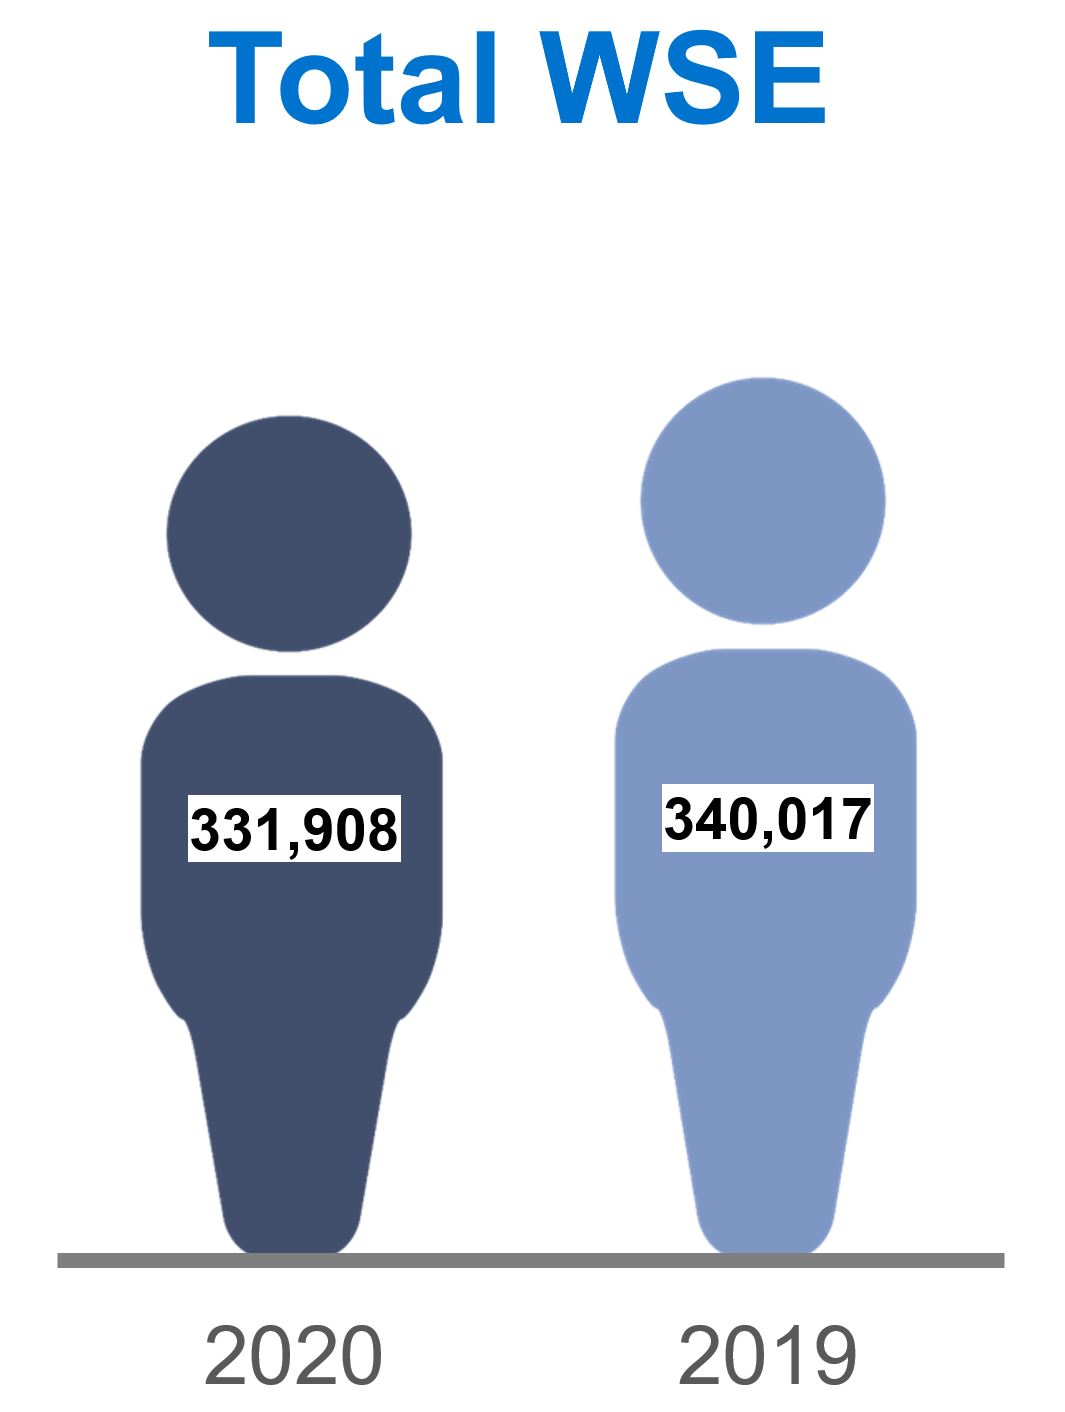
Since our founding in 1988, TriNet has served, and continues to serve, thousands of SMBs. In 2020,2023, we processed $44.9$72 billion in payroll and payroll taxes for our clients and ended the year with approximately 17,70022,600 clients, 347,500 WSEs and 331,900 WSEs,200,800 HRIS Users primarily in the U.S.
Our ServicesService Models
To free SMBs from HR complexities, weWe deliver a comprehensive suite of HCM services that help our clients administer and manage various HR-related needs and functions, such as compensation, and benefits, payroll processing, tax credit support, employee data, health insurance, and workers' compensation, EPLI and other employment risk mitigation programs, employee performance management and training, on-boarding and off-boarding, and other transactional HR needs using our PEO and HRIS technology platformplatforms and HR,our HCM, benefits and compliance expertise.
We empower SMBs to focusdeliver our services through two primary models, higher-touch PEO services and our more self-directed HRIS services.
PEO Services
TriNet has historically focused almost exclusively on what mattersthe PEO business and PEO services remain our core business. Our PEO services offer clients our most - growing their business.
complete HCM solution generally including all of the services described below. We leverage our scale and industry HR experience to deliver our PEO service offerings tailored for SMBs in specific industry verticals. We believe our vertical approach is a key differentiator for us and creates additional value for our clients thanks to service offerings that are tailored to addressby addressing their industry-specific HR needs. We offer six industry-tailored vertical PEO services: TriNet Financial Services, TriNet Life Sciences, TriNet Main Street, TriNet Nonprofit, TriNet Professional Services, and TriNet Technology.
HRIS Services
Our HRIS services primarily consists of our self-directed, cloud-based HRIS software solution which allows clients to manage their HR needs and the option to add tools such as payroll processing and benefits management to provide HCM solutions that flex dynamically over time based on the needs of our clients. Our HRIS services do not include access to our co-employment services, or access to our TriNet sponsored health benefit plans. However, these services can also include tax credit support via our TriNet Clarus R+D team, additional cloud-based software integrations and incremental administrative services.
Our Services
Our comprehensive HR solutions include the following capabilities:
| | | | | | | | | | | | | | | | | | | | | | | | | | |
| | | | | | | | |
| HR CONSULTING EXPERTISE | | BENEFIT
OPTIONS | | PAYROLL SERVICES | | RISK MITIGATION | | TECHNOLOGY
PLATFORM |
| | | | | | | | |
 HR
HR Consulting ExpertiseWe use the collective knowledge and experience of our teams of HR, benefits, payroll, risk management and compliance professionals to help our PEO and HRIS clients manage many of the administrative, regulatory and practical requirements associated with being employers. These professionalsWe do this by incorporating our knowledge and experience into our services and our services helptechnology platforms and by making our professionals available to consult with clients addresson a variety of client HR needs, including consulting on talent management, retention and terminations, benefits enrollment, immigration and visas, payroll tax credits, labor lawemployment compliance and regulatory developments and many other industry-specific and general HR topics. Depending on their needs, our clients, WSEs and WSEsHRIS Users have access to varying levels of service and support from our professionals, ranging from call center support for basic questions, to pooled HR resources, to onsite consulting and services.resources. Our professionals also provide additional specialized HR consulting and services upon request.
 Benefit Options
WeIn our PEO business, we utilize our scale to provide our clients and WSEs access to a broad range of TriNet-sponsored employee benefit and insurance programs with choice and at costs that we believe most of our clients would be unable to obtain on their own. We believe that our TriNet-sponsored programs help our PEO clients compete for talent against larger businesses. Our benefit and insurance programs are designed to comply with federal, state and local regulations, and our benefit and insurance service offerings include plan selection and administration, enrollment management, leave management, plan document distribution and WSE and client communications.
Under ourthese benefit and insurance programs, we pay third-party insurance carriers for WSE insurance benefits and reimburse insurance carriers or third-party administrators for claims payments within our insurance deductible layer, where applicable.
We sponsor and administer several employee benefit plans for our WSEs through a broad range of carriers, including group health, dental, vision, short- and long-term disability, and life insurance as an employer plan sponsor under Section 3(5) of ERISA. We also provide for other benefit programs to be made available to WSEs, including flexible spending accounts, health savings accounts, retirement benefits, COBRA benefits, supplemental insurance, commuter benefits, home insurance, critical illness insurance, accident insurance, hospital indemnity, pet insurance, and auto insurance. For further discussion of our insurance programs, including policies where we reimburse our carriers for certain amounts relating to claims, refer to Note 1 in Part II, Item 8. Financial Statements and Supplementary Data, of this Form 10-K. We also offer PEO clients the option to obtain their own client-sponsored benefits through our OMS product family. Our OMS clients receive PEO services like HR, payroll, payroll tax, and risk management from TriNet while sponsoring their own health benefits obtained through a broker.
Our HRIS clients use our HRIS software solution to manage their own selected group health plans. For our HRIS clients, we provide access to benefit programs for HRIS Users where we are not an employer plan sponsor under ERISA, such as flexible spending accounts, health savings accounts, retirement benefits, COBRA benefits, supplemental insurance, commuter benefits, critical illness insurance, accident insurance, and hospital indemnity.
 Payroll Services
We help our PEO and HRIS clients manage all aspects of their employee compensation by providing multi-state payroll processing, tax administration and tax credit services and other payroll-related services, such as time and attendance management, time off and overtime tracking, and expense management solutions. Our clients, WSEs, and WSEsHRIS Users can access payroll and tax information using our various online and mobile tools. Our payroll tax administration and tax credit services include calculating, withholding, remitting and reporting certain federal, state and local payroll and unemployment taxes on behalf of clients, WSEs, and WSEs.HRIS Users. While all of our PEO clients receive payroll and payroll tax administration tax services, our HRIS clients can choose whether to manage these services themselves.
Through TriNet Clarus R+D, we also help SMBs take advantage of federal and state payroll tax credits, particularly PATH Act R&D tax credits, one of the largest payroll tax incentives available to US businesses. TriNet Clarus R+D uses a proprietary software solution and payroll tax experts to support clients and help them determine their tax credits. SMBs do not need to use TriNet’s PEO or HRIS services to use TriNet Clarus R+D's tax credit services.
 Risk Mitigation
We monitor employment-related legal and regulatory developments at the federal, state, and local levels to help our PEO and HRIS clients comply with employment laws and mitigate many of the risks associated with being an employer. We provide HR guidance on employment laws and regulations, includingsuch as those relating to minimum wage, unemployment insurance, family and medical leave and anti-discrimination. WeFor our PEO clients, we also ensure that our TriNet-sponsored benefit plans comply with applicable laws and regulations, like the ACA, reducing this compliance burden to our clients.
WeOur PEO services provide fully-insured workers' compensation insurance coverage for our clients and WSEs through insurance policies that we negotiate with our third-party insurance carriers. We manage the deductible risk that we assume in connection with these policies by being selective in the types of businesses that we take on as new clients, and by monitoring claims data and the performance of our carriers and third-party claims management service providers. In addition, we advise clients on workers’ compensation best practices, including by performing workplace assessment consultations and assisting with client efforts to identify conditions or practices that might lead to employee injuries.
We also provide EPLI coverage for our PEO clients through an insurance policiespolicy that we obtain from a third-party EPLI carrier. These policies provideThis policy provides coverage for certain claims that arise in the course of the employment relationship, such as discrimination, harassment, and certain other employee claims, with a per-claim retention amount. The retention amount under this policy, which functions like a deductible, is allocated on a pre-determined basis between the client and TriNet. Our professionals assist our clients in implementing HR best practices to help avoid and reduce the cost of employment-related liabilities. Litigation defense is conducted by ourOur preferred outside employment law firms.firms defend covered EPLI claims.
 Technology Platform
We currently use separate technology platforms for our PEO and HRIS clients. Our PEO technology platform includes online and mobile tools that allow our clients and WSEs to store, view, and manage HR information and administer a variety of HR transactions, such as payroll processing, tax administration, tax credits, employee onboarding and termination, employee performance, time and attendance, compensation reporting, expense management, and benefits enrollment and administration. Our online tools also incorporate workforce analytics, allowing PEO clients to generate HR, data, payroll, total compensation and other custom reports.
Our HRIS software allows our HRIS clients to manage most of the same functions as our PEO technology platform and it is optimized to provide HRIS clients with customizable and flexible reporting tools and analytics to fit specific client needs. Our TriNet Clarus R+D tax credit services use a proprietary cloud-based software platform to simplify and support various state and federal tax credits for SMBs.
Our PEO Co-Employment Model
WeOur PEO services operate using a co-employment model, under which employment-related responsibilities are allocated by contract between us and our PEO clients. ThisThe co-employment model allows WSEs to receive the full benefit of our services, including providing WSEs with access to TriNet-sponsored employee benefit plan offerings. Each of our PEO clients enters into a client service agreement with us that defines the suite of services and benefits to be provided by us, the fees payable to us, and the division of responsibilities between us and our clients as co-employers. WSEs also separately acknowledge the co-employment relationship and the allocation of employment-related responsibilities between TriNet and our clients.the client co-employer. The division of responsibilities under our client service agreements is typically as follows:
TriNet Responsibilities
We generally assume responsibility for, and manage certain risks associated with:
•payments of salaries, wages and certain other compensation to WSEs from our own bank accounts (based on client reports and payments), including the processing of garnishment and wage deduction orders,
•reporting of wages, withholding and deposit of associated payroll taxes as the employer of record,
•provision and maintenance of workers' compensation insurance and workers' compensation claims processing,
•access to, and administration of, group health, welfare, and retirement benefits to WSEs under TriNet-sponsored benefit plans,
•compliance with applicable law for certain TriNet-sponsored employee benefits offered to WSEs,
•administration of unemployment claims and post-employment COBRA benefits, and
•provision of various HR policies and agreements, including employee handbooks and worksite employee agreements describing the co-employment relationship.
Client Responsibilities
Our clients are responsible for employment-related responsibilities that we do not specifically assume, generally including:
•day-to-day management of their worksites and WSEs,
•compliance with laws associated with the classification of employees as exempt or non-exempt, such as overtime pay and minimum wage law compliance,
•accurate and timely reporting to TriNet of compensation and deduction information, including information relating to hours worked, rates of pay, salaries, wages and other compensation, and work locations,
•accurate and timely reporting to TriNet of information relating to workplace injuries, employee hires and termination, and certain other information relevant to TriNet’s services,
•provision and administration of any employee benefits not provided by TriNet, such as equity incentive plans,
•compliance with all laws and regulations applicable to the clients' workplace and business, including work eligibility laws, laws relating to workplace safety or the environment, laws relating to family and medical leave, laws pertaining to employee organizing efforts and collective bargaining and employee termination notice requirements,
•payment of TriNet invoices, which include salary, wages and other relevant compensation to WSEs and applicable employment taxes and service fees, and
•all other matters for which TriNet does not assume responsibility under the client service agreement, such as intellectual property ownership and protection and liability for products produced and services provided by the client company to its own clients.
As a result of our co-employment relationships for PEO services, we are liable for payment of salary, wages and certain other compensation to the WSEs as reported and paid to us by theour client, and we are responsible for providing specified employee benefits to such persons to the extent provided in each client service agreement and under federal and state law. In most instances, clients are required to remit payment prior to the applicable payroll date by wire transfer or ACH.
WeFor our PEO services, we also assume responsibility for payment and liability for the withholding and remittance of federal and state income and employment taxes with respect to salaries, wages and certain other compensation paid to WSEs, although we reserve the right to seek recourse against our clients for any liabilities arising out of their conduct. We perform these functions as the statutory employer for federal employment tax purposes, since our clients transfer legal control over these payroll functions to us. The laws that govern the payment of salaries, wages and related payroll taxes for our WSEs are complex and the various federal, state and local laws that govern such payments can vary significantly. Based on applicable law in any jurisdiction, we or our client may be held ultimately liable for those obligations if we fail to remit taxes.
Our HRIS services do not involve co-employment, and this reduces the responsibility and liability that we assume when providing these services. For example, while our software may facilitate payroll processing for HRIS clients, TriNet is not the employer of record and acts only in a software provider role. HRIS clients generally remain responsible for, among other things, payroll funding, workers’ compensation insurance, obtaining and administering group health, welfare and retirement benefits, administering unemployment claims, and in some cases payroll tax reporting. The higher level of responsibility that our PEOs assume, and risks that our PEOs manage, for our PEO clients is a key differentiator between our PEO and HRIS services.
Market Trends and Developments Affecting Our Business in 20202023
The COVID-19 pandemic wasU.S. economy grew modestly during 2023 with unemployment remaining low while inflation began to abate over the most significant development we faced in 2020. COVID-19 related stay-at-home mandates and social distancing practices resulted in a nationwide economic slowdown and an unprecedented disruption to the businesses of our clients, the PEO industry and our business.year. We observed the following PEO industry trends in 2020 as a result of the COVID-19 pandemic:2023:
•SMB Economic DistressPerformance. Over any year, SMBs generally suffered,experience staffing changes, either resulting in a net increase or decrease in staffing. In 2023 the extent of net staffing increases differed significantly based on industry and we expect they will continue to suffer, from headcount freezes, furloughsgeographic region. Our clients experienced significant staffing reductions in the technology sector, and terminations, partial or complete business shutdowns, as well as reduced budgets and liquidity issues.reductions in the professional services sector, while staffing levels in other industries remained stable. Overall in 2023, our SMB clients still increased their staffing, however the increase was significantly lower overall than historic trends.
•IncreasedContinued Insurance Cost Variability and Volatility. The volumeIn 2023, we experienced increased health benefits utilization and inflation in health costs. We believe this occurred in part due to market-wide pharmaceutical price increases, as well as the impact of medical claims, including COVID-19 testingrising wages and treatmentother costs changed. We observed significant fluctuationswhich led to increased costs associated with contract renewals between health insurers and health care providers. These higher costs over the year were and continue to be reflected in the use of medical services, particularly in the second quarter of 2020, as enrollees deferred or cancelled elective procedures and outpatient medical, dental and vision services.2023 health claims.
•NewTax Credit Backlogs. Many of the key economic assistance programs that SMBs relied on during the COVID-19 pandemic have now expired, including the Employee Retention Tax Credit (ERTC). Although these programs have expired, processing backlogs and a temporary halt in September 2023 in processing new ERTC claims at the IRS have resulted in many SMBs, including some of our clients, continuing to wait to receive their tax credits. In many cases, SMBs still participated in these programs retroactively via payroll tax filing amendments. The regulatory uncertainty surrounding the end date for the filing of ERTC claims and its impact on our PEO clients in particular exacerbates this trend and its impact.
•Interest Rates. The same rise in interest rates that is contributing to lower overall hiring among our SMB clients also contributed to higher interest income we receive on our cash deposits and higher interest expense on our debt. While the Federal Reserve's last increase to the Federal Funds Rate was in the middle of 2023, the impacts of the higher rates continue to contribute to our earnings, as well as contributed to higher interest costs as we issued debt and borrowed on our credit line in August and September of 2023.
•Privacy Laws and Regulations. We have seen increased focus at every level of government inside and outside of the United States on regulating the collection, storage, use, retention, security, disclosure, transfer and other processing of confidential, sensitive and personal information, as well as the growing use of artificial intelligence. As the patchwork of laws becomes increasingly complex, we expect the effort and cost of complying with all of the requirements to also increase and the likelihood of compliance failures to rise.
•PEO Benefit Plan Legislation. We saw an increase in state efforts to regulate PEO health plans. For example, new legislation and proposed rules in New lawsMexico seek to prevent WSEs of small group employers from participating in PEO-sponsored large group market health plans, with the exception for plans the PEOs register as MEWAs under state law. State regulations on PEO health plans can limit our options for providing TriNet sponsored benefits to our PEO clients or eliminate those benefits entirely, so we devote substantial time and programs were passedresources to assist SMBsmonitor and their employees during the COVID-19 pandemic, including the federal FFCRA and CARES Act and PPPFA business loan, employment, and tax assistance programs, and various state and local labor, employment and tax assistance programs.respond to these developments. We expect legislative efforts to help SMBs and employees to continue and we will need to continue to create or redesign our services to provide support for as many of these programs as possible.see similar legislative and regulatory efforts across the country.
Our Technology and Service Development Efforts
We continued to make significant investments in our PEO and HRIS technology platform with projectsplatforms. These investments are intended to provide our usersclients, WSEs, and HRIS Users with improvedenhanced functionality, ease of use, HR management options, security and security.an optimized user experience. We intend to continue to investmaking these and other similar investments in our technology platform to improve its functionality, ease of use, security2024 and the overall user experience for our clients and WSEs.beyond. We believe the continued investment in and improvement ofimproving our technology platform will drive operating efficiencies and improve client retention and satisfaction over the long termterm.
In 2023, we began combining our PEO and HRIS technology platform into a single modern cloud-based platform that can support all of our customers with a technology that enables more self-service capabilities. By creating these new cloud-based services we are able to invest in common services that can benefit both our PEO and HRIS customers. These cloud services are easier to deploy, modify and maintain which will allow us, over time, to achieve faster time to market. The first services on this next generation cloud-based platform went live in 2023 and as we continue to bring more innovation to our entire customer base we expect that our investment and prioritization in this area will increase. We believe this will enable us to service SMBs throughout a larger portion of their lifecycle. Additionally, our TriNet Clarus R+D cloud-based software platform allows us to serve our existing SMB clients and to serve SMBs that are not currently a client of our PEO or HRIS services with tax credit support services. The services we provide through our HRIS and TriNet Clarus R+D software platforms create a potential pipeline of SMB clients that may benefit from, and transition to, TriNet’s higher-touch PEO services at future points in their lifecycle.
In 2023 TriNet moved all of our applications, computing and storage to the cloud in a multi-cloud strategy which enabled the shutdown of all on-premise data centers. We believe this cloud migration will enable TriNet to deploy solutions quickly and manage costs effectively by taking advantage of the ability to expand or change with our growing needs while allowing our colleagues to focus on high value activities in support of our customers. This strategy is aligned with our sustainability goals to reduce waste and improve our client experience.
In April 2020, we created our Recovery Credit program to assist in the economic recovery of our existing clients and enhance our ability to retain these clients. Eligible clients receive one-time reductions against fees for future services, accounted for as a discount, to be received over the following 12 months. The ultimate amount of the Recovery Credit eligible clients will receive is dependent on our future performance and is subject to a limit on the total amount. Our Recovery Credit program is designed to promote client loyalty, incentivize client retention, and to differentiate TriNet from its peers in the PEO industry and in other competing HR services industries.
In March 2020, the FFCRA and the CARES Act were signed into law, creating several important funding and payroll tax incentive programs for SMBs, including PPP, mandatory employee leave requirements, payroll tax deferral and tax credit programs and other employment- and employment tax-related incentives. The PPPFA was signed into law in June 2020, modifying and expanding the original PPP. The appropriations package passed in December 2020 further expanded the availability of some of the employee leave and tax credit programs available to SMBs and their employees during 2021 as well as the PPP. These developments required us to create new services, or redesign our existing services, to support these programs.
To engage with our clients and SMBs virtually we launched our COVID-19 Preparedness Center, which provides ongoing and timely webinars, information, resources and offerings to clients and other SMBs to help them navigate the rapidly changing and complex COVID-19 business landscape. In the fourth quarter of 2020 we hosted the first annual TriNet PeopleForce, our virtual client and prospect conference, where we provided insights, thought leadership and recommendations for the challenges they face.energy consumption.
Our Clients and Geographies
Our clients are distributed across a variety of industries, including technology, professional services, financial services, life sciences, not-for-profit, property management, retail, manufacturing, and hospitality.industries. We generally support these different clients using our industry-tailored vertical approach.suite of HCM offerings. Our PEO clients generally execute annual service contracts with us that automatically renew. In most cases, our PEO clients may cancel these contracts with 30 days' notice to us and we may cancel these contracts with 30 days' notice.notice to our clients. Our HRIS clients execute contracts with monthly or annual terms and clients can typically cancel these contracts with 30 days’ notice to us. In some cases, our clients may incur fees associated with early termination.
Our top five PEO markets are California, New York, Florida, Texas and Massachusetts, which account for approximately 64% of our total WSEs for the year ended December 31, 2023. Nearly all of our revenues are generated within the United States and its territories and substantially all our long-lived assets are located in the United States.
Our Competitors
We face competition from:
•PEOs that compete directly with us,
•HRHRIS software providers that compete directly with us,
•payroll processing agents and information systems departmentsother HCM services providers that do not use a PEO model,
•HR and personnel of companies that administer employee benefits, payroll and HR for their companies in-house,
•providers of certain endpoint HR services, including payroll, employee benefits, business process outsourcers with high-volume transaction and administrative capabilities, and other third-party administrators, and
•insurance brokers who allow third-party HR systems to integrate with their technology platform.
PEO services remain our core business and other PEOs continue to represent our most significant competition. Our PEO service competitors include large PEOs such as the TotalSource unit of Automatic Data Processing, Inc., the
PEO operations of Paychex, Inc. and Insperity, Inc., as well as numerous specialized and smaller PEOs and similar HR service providers with PEO operations.
Our HRIS service competitors include software and HCM service providers such as Rippling, Gusto, Automatic Data Processing, Inc. and Bamboo in addition to smaller national and local providers.
Our tax credit services face competition from large CPA firms, such as PwC, Ernst &Young, Moss Adams, and KPMG and smaller software companies and CPA firms, such as alliantgroup, Ardius, Cherry Bekaert and Eide Bailly.
We believe that a key reason why our PEO services are attractive to many SMBs in partis because of our ability to provide access to a broad range of TriNet-sponsored workers'workers compensation, health insurance and other benefits programs on a cost-effective basis. We compete with insurance brokers and other providers of insurance and benefits coverage, and our PEO offerings must be priced competitively with those provided by these competitors in order for us to attract and retain our clients.
We believe that we also compete based upon the breadthOur PEO clients are typically looking for high-touch HR compliance and depthservices support, TriNet sponsored employee benefits, TriNet responsibility for processing payroll and payroll taxes, and access to EPLI claims support and other substantial HR services. By contrast, many of our benefit plans, vertical market expertise, total costHRIS clients are looking for more self-directed, focused and less expensive HRIS services. We do not co-employ our HRIS Users and do not provide TriNet sponsored health benefits, workers’ compensation, or EPLI coverage. As a result, our HRIS services competes with services provided by a wider array of service, brand awarenessHCM companies and reputation, ability to innovate and respond to client needs rapidly, access to online and mobile solutions, and subject matter expertise. We believe that we are competitive across these factors. HRIS providers outside of the PEO industry.
For additional information about our competition, please refer to Part I, Item 1A. Risk Factors, of this Form 10-K, under the heading – "We must continue to work to improve our services to meet the expectations of our clients and regulators, or we may lose our clients and materially harm our business".
Our Sales and Marketing Organizations
We sell our solutions primarily online and through our direct sales organization. We have aligned our PEO sales organization by industry vertical with the goal of growing profitable market share in our targeted industries. ThisOur PEO vertical approach deepens our network of relationships and gives us an understanding of the unique HR needs facing SMBs in those industries. Our sales representatives are supported by marketing, lead generation efforts, and referral sources and networks. While the COVID-19 pandemic made it difficult to engage with prospects face-to-face, theWe increasingly use of technology and remote communication tools created new opportunities for us to engage with customers and prospects virtually.
We typically sponsor and participate in associations and events around the country to promote our PEO and HRIS services and we also utilize these forums to target specific vertical and geographic markets. We responded to the unique challenges posed by the COVID-19 pandemic by shifting to virtual events, such asEvents include our 20204th TriNet PeopleForce conference, and by providing informational webinars periodically throughout the year on a wide variety of COVID-19 and business topics relevant to our SMB prospects and clients. We also generate sales opportunities, and promote brand awareness, client retention, and build our reputation as HCM thought leaders, within key industry verticals, through marketing alliances and other indirect channels, such as accounting firms, venture capital firms, incubators, insurance brokers, and vertical market industry associations. Additionally, we utilize digital marketing programs, including digital advertising, search and email marketing, to create awareness and interest in all of our services.
Our marketing and corporate communications organization is charged with driving overall brand awareness, managing lead generation, creating and managing our website and other online properties, creating content for all marketing and communication channels. Includingchannels including our outbound and inbound marketing efforts, media relations, and managing our sponsorships, major marketing events, and internal and external communications. SMBs are increasingly using digital tools like tele-presence and web engagements and we work to engage with SMBs in these ways. In 20202023, we continued to use numerous digital channels for engagement, including conversational marketing enhancements on our website. Our marketing team also focused on strategic marketing, communications via social media, branding initiatives, and crisis communication plans, in part by augmenting our comprehensive company re-brandingbrand campaign, Incredible Starts Here, with our marketing campaign, People Matter, that included an omni channelomni-channel initiatives using social media, digital, television, radio and out-of-home media.
The Laws and Regulations that Affect Our Business
Our business operates in a complex legal and regulatory environment due to a myriad of federal, state and local laws and regulations that impact our business. Below is a summary of what we believe are the most important legal and regulatory issues forspecific to our business. For additional information on the impact of these and other laws and regulations on our business and results of operations, refer to Part I, Item 1A. Risk Factors, of this Form 10-K, under the heading - "Legal and Compliance Risks". Employer Status under ERISA and State Laws
WeAs part of our PEO services, we sponsor our employee benefit plan offerings as the employer of our WSEs under the Internal Revenue Code of 1986, as amended (the Code)"Code"), ERISA and applicable state law. The multipleterm “employer” has different definitions of “employer”for different purposes under both the Code and ERISA, and for most purposes are not clear and most are defined in part byinterpreted under complex multi-factor tests under common law. As an employer of WSEs, we must manage our benefit plans in accordance with ERISA requirements, which can impact how we fulfill plan obligations, how we price services, the features of our benefit plans, and how we administer and operate our plans. We believe we manage our benefit plans in accordance with ERISA requirements and that we are an “employer”employer of our WSEs in the U.S. under the Code, and the employer of our WSEs in the U.S. for the purposes of ERISA, as well as qualifying as an employer under various state laws, but this status could be subject to challenge by various regulators. We believe that our benefit plans are exempt from many state regulations under ERISA, but our position could be challenged by state regulators or as a result of new laws, regulations, agency guidance, audits or caselaw at the federal and state levels. For additional information on our state and federal employer status and itsthe ERISA and other state requirements that apply to us and their collective impact on our business and results of operations, refer to Part I, Item 1A. Risk Factors, of this Form 10-K, under the heading - "If we are not recognized as an employer of worksite employees, and if our benefit plans are deemed to not satisfy plan requirements, under federal and state regulations, we and our clients could be adversely impacted".Health Insurance and Health Care Reform
Our sponsored employee health and welfare offerings are an important component of the services that we provide. The future of health care reform continues to evolve in the U.S. For example, the passage of the ACA in 2010 implemented sweeping health care reforms with staggered effective dates from 2010 through 2022, and many provisions in the ACA are still requiresubject to the issuance of additional guidance from the DOL, the IRS, the U.S. Department of Health and Human Services and various U.S. states. Passage of the TCJA in 2017 eliminated the individual mandate tax penalty under the ACA beginning in 2019, while retaining employer ACA mandate obligations. States have developed, and will continue to develop, varying approaches to state-based health exchanges and mandates. Further significant changes to health care statutes, regulations and policy at the federal, state and local levels could occur in 20212024 and beyond, including the potential further modification or amendment of the ACA, and we may need to adapt the manner in which we conduct our business as a result of any such changes. For additional information on the ACAhealth care reform and its impact on our business and results of operations, refer to Part I, Item 1A. Risk Factors, of this Form 10-K, under the heading - "Changing laws and regulations governing health insurance and other traditional employee benefits at the federal, state and local level could negatively affect our business".
Data Privacy and Security Regulations
We collect, store, use, retain, disclose, transfer and otherwise process a significant amount of confidential, sensitive and personal information from and about our actual and potential clients, WSEs, HRIS Users and corporate employees,colleagues, and we are subject to a variety of federal, state and foreigninternational laws, rules, and regulations in connection with such activities. As a sponsor of employee benefit plans, we also have access to certain protected health information (PHI) of our WSEs and corporate employees.colleagues. Management of PHI is subject to several regulations at the federal level, including HIPAA and the HITECH Act. HIPAA contains restrictions and health data privacy, security and breach notification requirements with respect to the use and disclosure of PHI. Further, there are penalties and fines for HIPAA violations. Because TriNet sponsored health plans are covered entities under HIPAA, we are required to comply with HIPAA's portability, privacy, and security requirements. We are also subject, among other applicable federal laws, rules and regulations, to the rules and regulations promulgated under the authority of the Federal Trade Commission. The U.S. Congress has considered, but not yet passed, several comprehensiveWe expect that the federal government’s approach to data privacy bills over the past few years, such as the CONSENT Act, which was intended to be similar to the landmark 2018 European Union General Data Protection Regulation. We expect federal data privacy laws toand security rules and regulations will continue to evolve.evolve in the coming years.
At the state and local level, there is increased focus on regulating the collection, storage, use, retention, security, disclosure, transfer and other processing of confidential, sensitive and personal information. In recent years, many states have proposed or enacted new laws or amended existing laws and we have seen significant changesexpect them to datacontinue to do so in the future. As the state privacy regulations acrosslaws becomes increasingly complex, we expect the U.S., including the enactmentcost and effort of complying with all of the California Consumer Privacy Act of 2018 (CCPA), which went into effect in January 2020. The CCPA increases privacy rights for California residentsrequirements to increase and imposes obligations on companies that process their personal information, including an obligation to provide certain new disclosures to such residents. The CCPA provides for civil penalties for violations, as well as a private right of action for certain data breaches that result in the loss of personal information. This private right of action may increase the likelihood of compliance failures to rise. Lack of uniformity of laws and risks associated with, data breach litigation. The CCPA was amended in September 2018regulations, which we expect will increase as various states and October 2019, and further amendments may be enacted. In November 2020, California approved the California Privacy Rights Act (CPRA), which creates a new privacy oversight agency and further amends the CCPA to provide additional rights to consumers to access, edit and control the sale and sharing of personal information. The provisions of the CPRA go into effect in January 2023.
New legislation proposed or enacted in Illinois, Massachusetts, New Jersey, New York, Rhode Island, Washington and other states, including a proposed right to privacy amendment to the Vermont Constitution, impose, or has the potential to impose, additional obligations on companies that collect , store, use, retain, disclose, transfer and otherwise process confidential, sensitive and personal information, and will continue to shape thecountries enact data privacy environment nationally. In addition,laws, creates significant legal complexities for companies like TriNet that operate nationwide and in India and Canada. Also, all 50 U.S. states, the District of Columbia, Guam, Puerto Rico, the Virgin Islands and Canada have enacted data breach notification laws that may require us to notify WSEs, HRIS Users, clients, employees,colleagues, third parties or regulators in the event of unauthorized access to or disclosure of personal or confidential information. Complying with existing and new data privacy and security regulations could cause us to incur substantial costs or require us to change our business practices in a manner adverse to our business. Any failure to comply with existing and new data privacy and security regulations could result in significant penalties, damage our reputation and otherwise have a material adverse effect on our business. For additional information on the privacy and security of the confidential, sensitive and personal information and PHI we possess and the potential impact to our business if we fail to protect such information, refer to Part I, Item 1C. Cybersecurity and each of the risk factors included in Part I, Item 1A. Risk Factors, of this Form 10-K, under the heading - "Data"Data Privacy and Security Risks".PEO Licensing Laws
Nearly all states have adopted laws and regulations for licensing, registration, certification or recognition of PEOs and the IRS has implemented a voluntary federal certification program for PEOs. We expect states without such laws and regulations to adopt them in the future. While these laws and regulations can vary widely, most regulators monitor the financial health and other relevant business information of PEOs on an annual or quarterly basis. In some cases, these laws and regulations codify and clarify the co-employment relationship for certain payroll, unemployment, workers' compensation and other employment-related purposes or require specific client contractual terms and/or WSE disclosures. We believe we comply in all material respects with the applicable PEO laws and regulations in each state and jurisdiction in which we operate.provide PEO services.
Every state regulates insurance practices conducted within their jurisdiction. While we do not broker insurance, certain of our PEO and HRIS services involve assisting our clients in obtaining and managing employee benefits. We partner with brokers to provide these services and have elected to obtain state insurance licenses as a result. As each state’s licensing requirements differ, maintaining current licenses is complex and we are subject to insurance audits, investigations and fines if we fail to comply with insurance license requirements.
Other state regulatory authorities impose licensing requirements on companies involved in the transmission of cash, such as banks, and other money transmitters. We do not believe that our current activities require any such licenses, but we and others in our industry have received inquiries from regulatory authorities in the past and could receive them in the future.
For additional information on the impact of licensing laws, refer to Part I, Item 1A. Risk Factors, of this Form 10-K, under the heading "If we do not comply with our regulatory license requirements, or if we are deemed to be operating in various non-PEO licensed industries without the required licenses, we and our clients could be adversely impacted".
Payroll andTaxes, Unemployment Taxes and Payroll Tax Credits
We must also comply with the federal and state payroll tax and unemployment tax requirements that apply where our clients are located. Tax reform efforts, and other payroll tax changes, at the federal, state and local level can impact our payroll tax reporting obligations for our clients and the services we can provide. State unemployment tax rates vary by state based in part on prior years’ compensationtotal wages, unemployment taxes paid and unemployment claims experience and may also vary based on the overall claims experience of a PEO.PEO in states in which we are required to report and pay unemployment taxes using one of our accounts and rates. As a result, depending on where client WSEs perform services for our clients, are located, the fees we charge PEO clients for unemployment taxes can be higher or lower than a client could obtain alone.without use of a PEO. In some cases, taxing authorities can retroactively increase the unemployment taxes we pay can also be retroactively increased to cover deficiencies in the unemployment tax funds. We also rely on our clients to accurately reportinform us of the work and residence locations for their work locationsWSEs and HRIS Users, and inaccurate reporting,information, whether due to remote work from home policies during the COVID-19 pandemic or otherwise, can impact our payroll tax obligations and the obligations of our clients, WSEs and WSEs.HRIS Users.
We have seen a growing trend, particularly at the federal level, of using payroll tax credits, deferrals and other related payroll tax programs as a mechanism for incentivizing SMB development and economic recovery. These programs are popular because they allow SMBs, which often have business income tax losses, to realize benefits via payroll tax reductions, rather than business income tax reductions. As a result, many of our SMB clients require that we support these programs. Examples of these programs include the federal 2015 PATH Act, CARES Act and FFCRA Act. The PATH Act allows SMBs to use R&D tax credits submitted on the SMB’s business income tax return to reduce certain payroll taxes. The CARES Act and FFCRA Act introduced payroll tax credits and employer Social Security deferral programs that allowed SMBs to receive payroll tax reductions and refunds or to defer the employer portion of Social Security based on qualifications and employment practices.
We act as the employer of record for federal payroll tax reporting for our PEO clients. This means that we file client tax credit claims, and pass the associated tax credit refunds to our clients based on information supplied by our clients, which we do not control. These programs have generally not been designed with the PEO industry in mind and these programs are subject to broad agency interpretations given their complexity. While our clients are contractually responsible to us for their errors in tax credit submissions and for repaying us for all rejected tax credits under our service contracts, taxing authorities may still look to TriNet for repayment and we may not be able to effectively enforce or collect on these obligations. For additional information tax credit programs, and the risks they post to our operations, refer to Part I, Item 1A. Risk Factors, of this Form 10-K, under the heading - "Our business is subject to numerous complex laws, and changes in, uncertainty regarding, or adverse application of these laws could negatively affect our business." Other Employment Regulations
We must also comply with labor and employment laws, which can change frequently at the federal, state and local level. In particular for our PEO services, regulatory focus on the classification of employers, employees and independent contractors has the potential to significantly change how we and other PEOs operate and the services that we and other PEOs can provide to our clients and WSEs. States continue to consider, or have adopted, changing regulations or guidance around the definition of employers, employees and independent contractors and any change in these definitions may impact our ability to provide certain PEO and HRIS services to certain employers or employees.
We must also comply with state and federal rules and guidelines around both independent contractor and joint employer status. Standards for determining independent contractor and joint employer status vary from law to law and state to state, and changes to and new interpretations of these standards can limit the client workers to which we can provide services and increase the likelihood of claims that we are a joint employer of client WSEs or an employer of HRIS Users. For example, In January 2024, the DOL proposed a new rule for determining independent contractor status and in September 2019, California passed AB5, a lawAugust 2023, the DOL proposed new regulations that could potentially reclassify clientaddress the salary requirements for white collar minimum wage and overtime exemptions under the FLSA. Meanwhile, the NLRB also modified its own independent contractors as employees. In November 2020, California voters passed Proposition 22, which supersedes AB5 for certain types of contractors. Recently, the DOLtest in June 2023 and issued a new rule to make it easier to classify workers as independent contractors under federal law referenced below. Although the rule is scheduled to go into effect on March 8, 2021, the Biden administration and/or Congress may delay its effective date, change the rule, or quash it in its entirety. In January 2020, the DOL issued a new rule changing the definition ofstandard for determining whether two businesses are joint employer usedemployers under the Fair Labor Standards Act (FLSA) and potentially limiting businesses that are deemed to be joint employers. Since its issuanceNLRA in 2020, the rule has been struck down by a federal court, and that decision is currently on appeal.October 2023. We do not believe that we are a joint employer under any law or rule, or that these rule changes impact our status as a co-employer. However, laws regarding independent contractor and joint employer status can impact the new DOL rule, but the impacttypes of new regulations like these could lead to increased legal claims against us or our clients, increase our compliance costs, or require changes to howSMB workers we operate our businesscan service and the servicespotential liability that we provide tohave for the actions of our SMB clients and WSEs.their employees. For additional information, refer to Part I, Item 1A. Risk Factors, of this Form 10-K, under the heading - ""The definition of employers, employees and independent
contractors is evolving. Changes to the laws and regulations that govern what it means to be an employer or an employee may require us to make significant changes in our operations and may negatively affect our business".
Our Human Capital Resources
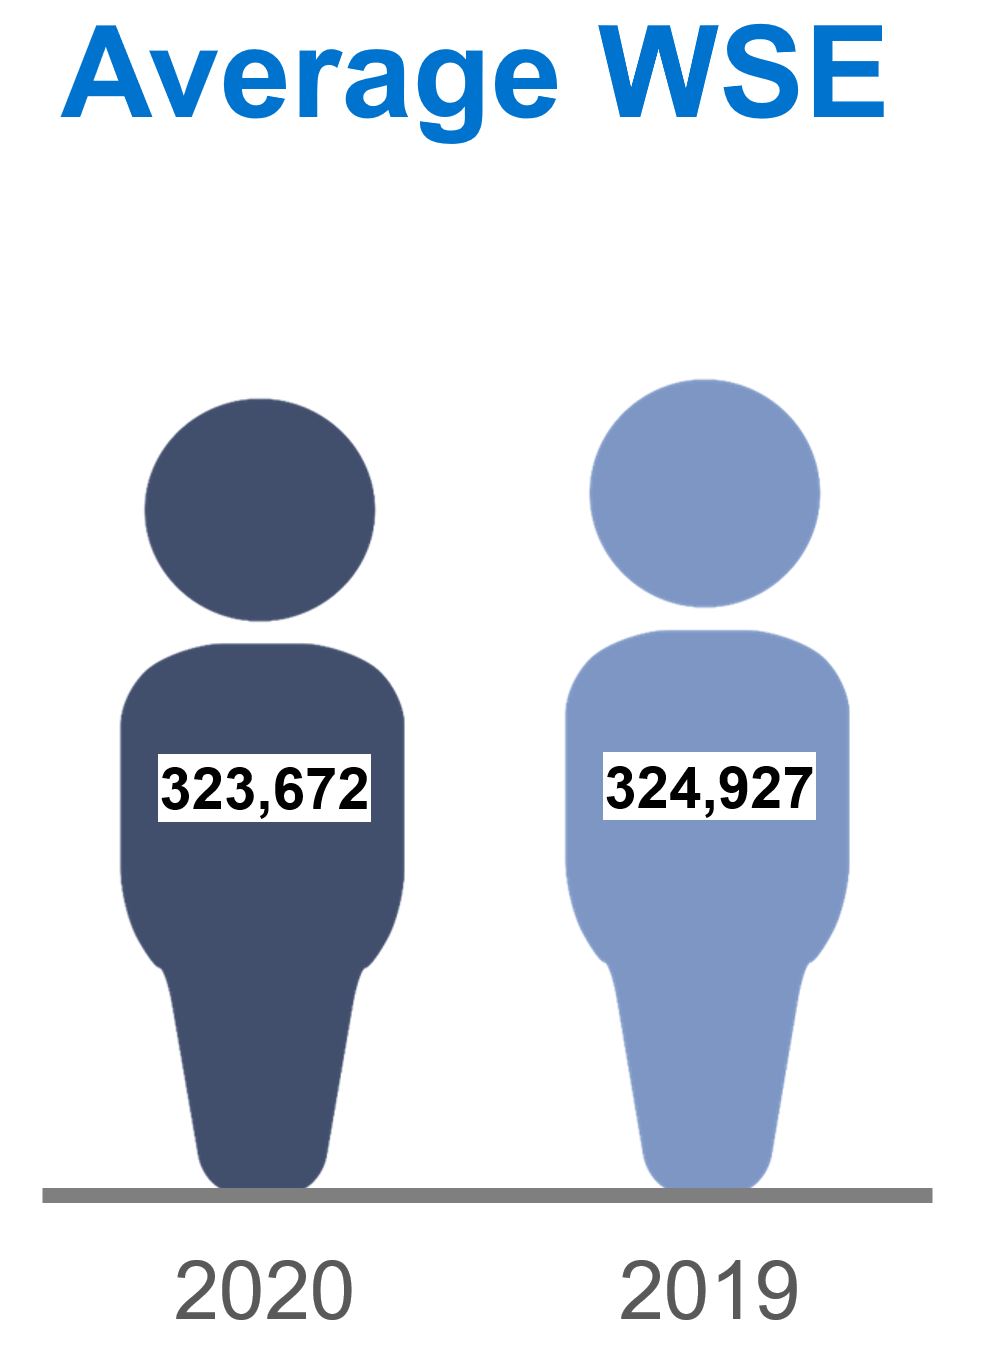
As of December 31, 2020,2023, we had approximately 331,900347,500 WSEs, 200,800 HRIS Users and 2,700 corporate employees, or3,600 colleagues.
Oversight and Management
At TriNet, we rally around a shared visionpower the success of improving humanity through businessSMBs by supporting their growth and innovation.enabling their people. Together, we strive to become the most trusted advisor to SMBs by harnessing the power of scale. We recognize the incredible opportunity that can only be realized by working together, with a shared view of how we support our clients, WSEs and WSEs.HRIS Users. This is illustrated in our core values:
•Lead with the customer - We are accessible, responsive and empowered to serve our customers. We are successful when our customers are successful.
•Stand together - We bring together diverse backgrounds, experiences and ideas to create better outcomes. We collaborate across boundaries, communicate openly and respect each other.
•Act with integrity - We are honest, transparent, ethical and fair. We take pride in always doing what’s right for our customers and colleagues.
•Make an impact - We act with purpose, are deliberate in our planning and quick in execution. We are accountable to each other and empowered to make decisions.
•Be incredible - We invest in the development of our colleagues. We push the boundaries of what's possible, lead the way and innovate to accomplish the extraordinary.
We regularly conduct surveys to seek feedback from our colleagues on a variety of topics, including confidence in company leadership, competitiveness of our compensation and benefits package, career growth opportunities and opportunities to improve the attractiveness of our company with existing and potential colleagues. The results are shared with our colleagues and reviewed by senior leadership, who analyze areas of progress or deterioration and prioritize actions and activities in response to this feedback to drive meaningful improvements in colleague engagement. Our corporate employeesNone of our colleagues are not covered by a collective bargaining agreement.
Attracting and Retaining Ourour Colleagues
We must attract, develop and retain highly motivated and qualified colleagues to continue to provide the services that our clients need, to achieve our strategic objectives, and to grow our business. We do this by:
•offering competitive compensation and benefits packages, including comprehensive health benefits and our 401(k) retirement savings plan, with an immediately vested employer match of up to 4% of cash compensation,
•supporting a pay for performance culture through the use of cash and equity incentives tied to the performance of our company and individual performance,
•offering an employee stock purchase planESPP that allows our colleagues to purchase our shares at a discount to market value, which fosters a stronger sense of ownership and aligns the interests of our colleagues with our stockholders,
•investing in the professional growth of our colleagues with tuition and continuing education reimbursement, wellbeing programs, and comprehensive training and development activities and opportunities both inside and outside of our company,
•creating and maintaining a diverse and inclusive colleague base by, for example, the use of colleague-led resource groups and by launching a new diversity and inclusion training curriculum for our colleagues, in 2020, and
•supporting workplace flexibility for our colleagues during the COVID-19 pandemic by adopting work-from-homeremote work policies, halting non-critical travel, and providing additional paid time off, employee assistance plans, and access to telemedicine services.
We refer to our employees that are co-employed with our clients as our worksite employees (WSE). For more information about how we help our PEO and HRIS clients manage their own human capital resources and satisfy their own HR-related needs, see the section above titled “Our Services”.
Our Approach to Acquisitions
Historically, we have pursued acquisitions to both expand our service capabilities, technology offerings, and supplement our growth across geographies and certain industry verticals.growth. Our acquisition targets have included PEOs and other HR solution providers as well as HCM technology and services companies or technology product offerings to supplement or enhance our existing HR solutions.HCM services. We intend to continue to pursue acquisitions, where appropriate, that will enable us to add new clients, and WSEs or HRIS Users, expand our presence in certain geographies or industry verticals, and offeror expand our clients and WSEs more attractivetechnology capabilities or services.
The Impact of Seasonality on Our Business
Our business is affected by seasonality in client business activity, hiring and WSE benefit selection,selections, health claims costs and payroll taxes:
•ClientsPEO clients generally change their payroll service providers at the beginning of the payroll tax and benefits enrollment year; as a result, we have historically experienced our highest volumes of new clients joining and terminating clients in the month of January. Our HRIS clients are generally less affected by these considerations.
•WSEs select our TriNet-sponsored benefit plans during their respective open enrollment periods, which occur throughout the year. We have historically experiencedgenerally experience the largest proportion of WSE benefit changes in the first and fourthsecond quarters.
•Health claims costs tend to increase throughout the year as the utilization of medical services above each WSE's deductible causes our insurance costs to increase. In addition, the overall use of medical services by WSEs, including elective procedures, tends to increase later in the calendar year. During the COVID-19 pandemic, we observed significant fluctuations in the typical seasonal use of medical services by our WSEs, particularly in the second quarter of 2020. Utilization approached more typical levels through the second half of 2020. The COVID-19 pandemic may continue to cause variability in our WSE's medical services utilization that may result in changes in this seasonal fluctuation in our business.
•Certain payroll tax related billings are based on the WSE's annual taxable wage basebases up to a set cap. WSEs and HRIS Users frequently meet these wage base caps in the first two quarters of the year, depending on the WSE's compensation level, resulting in lower related billing contributions to PSR in the latter half of the year.
Our Owned and Licensed Intellectual Property
We own or license from third parties various computer software as well asand other intellectual property rights, used in our business. Generally, weWe protect our intellectual property rights through the use of confidentiality and non-disclosure agreements and policies with our employeescolleagues and third-party partners and vendors.vendors as well as policies incorporated and enforceable by contract. We also own registered trademarks in the United States, Australia, Canada, the United Kingdom, and the European Union covering our name and other trademarks and logos that we believe are materially important to our operations. We generally protect our trademarks through federal registration or through the commercial use of our trademarks. Trademark registrations must generally be renewed every five to ten years and we renew the registration of trademarks that we deem to have continuing value to our business.
Corporate and Other Available Information
We were incorporated in 1988 as TriNet Employer Group, Inc., a California corporation. We reincorporated as TriNet Merger Corporation, a Delaware corporation, in 2000 and during that year changed our name to TriNet Group, Inc. Our principal executive office is located at One Park Place, Suite 600, Dublin, CA 94568 and our telephone number is (510) 352-5000. Our website address is www.trinet.com. Information contained in or accessible through our website is not a part of this report.
Our Annual Reports on Form 10-K, Quarterly Reports on Form 10-Q, Current Reports on Form 8-K, and amendments to those reports are available free of charge at investor.trinet.com as soon as reasonably practicable after we file such material with, or furnish it to, the SEC. Alternatively, the public may access these reports at the SEC's website at www.sec.gov. The contents of these websites are not incorporated into this report and are not part of this report.
Item 1A. Risk Factors
Below is a discussion of the risks that we believe are significant to our business. These risks are not the only ones we face. We may face additional risks that we do not currently consider to be significant or of which we are not currently aware, and any of these risks could cause our actual results to differ materially from historical or anticipated results. You should carefully consider these risks along with the other information provided in this Form 10-K, including the information in "Management's Discussion and Analysis of Financial Condition and Results of Operations" and our accompanying consolidated financial statements, as well as the information under the heading "Cautionary Note Regarding Forward-Looking Statements" before investing in any of our securities. We may amend, supplement or add to the risk factors described below from time to time in future reports filed with the SEC.
Operational Risks Related to the COVID-19 Pandemic
The economic,Unexpected changes in workers' compensation and health insurance costs and business disruption causedclaims by the COVID-19 pandemic is impacting our business and could result in a material adverse effect on our business, results of operation and financial condition.
The COVID-19 pandemic and the measures being taken at every level of government in reaction to its impact have resulted in an economic slowdown and an unprecedented disruption to our business and the businesses of our small and medium-size business clients. We cannot predict or control all of these disruptions, and any such disruptions may have a material adverse effect on our financial condition and results of operations.
Any of the COVID-19 related risks below could have a material adverse effect on our business, results of operations or financial condition. The extent to which COVID-19 will impact our business remains uncertain and will depend on a variety of factors that are changing on a day-to-day basis and that we may not be able to accurately predict, such as the duration and scope of the pandemic, the disruption of the national and global economy, the duration of the economic downturn, the laws, programs and actions that governments will enact or take, the extent to which our clients' businesses contract or fail, the extent to which new laws intended to help small and medium-size businesses can be supported by the PEO industry, the extent to which our own operations are impacted by office closures, remote work and/or infections, and how quickly and to what extent normal economic and operating conditions can resume. Any of these factors could exacerbate the risks and uncertainties identified below.
Actual and potential impact on clients and prospects
The change in the economic environment has had, and will continue to have, an adverse economic impact on our clients and potential clients. We have seen, and continue to see, affected businesses freeze headcount, furlough and terminateworksite employees and partially or completely shut down business operations. Impacted businesses have faced and will likely continue to face liquidity issues, reduced budgets, or an inability to pay for our services or the same level of our services. For example, in the second quarter of 2020, our new sales growth declined and we experienced higher WSE attrition than prior periods. The current economic environment has made it difficult for us to achieve service fee increases, and may continue to make it difficult in future periods. Any of these issues have the potential to result in a material adverse effect on our revenues and margins, our financial condition and results of operations, and/or on our ability to attract and retain clients. See the risk factor titled “Our clients are particularly affected by volatility in the financial and economic environment, which could harm our business” below for more details.business.
Stay-at-home, quarantine and other similar orders have been widely issued across the United States during 2020, including in nearly all of the locations where our clients and potential clients are located. We cannot predict the extent or duration of such measures in any given location, or whether new orders will be issued in locations where such orders were previously lifted, and the existence of such orders in locations where our clients and potential clients are located could haveOur insurance costs, which comprise a further negative impact on the businessessignificant portion of our clientsoverall costs, are significantly affected by WSEs health and potential clientsworkers' compensation insurance claims experience. We use fully insured risk-based, and resultfully insured guaranteed-cost, insurance plans provided by third-party insurance carriers. Under risk-based policies, we agree to reimburse our carriers for any claims paid within an agreed-upon per-person deductible layer up to a maximum aggregate exposure limit per policy. These deductible dollar limits and maximum limits vary by carrier and year. Under guaranteed-cost policies, our carriers establish the premiums, and we are not responsible for any deductible. Refer to Note 1 in a material adverse effect onPart II, Item 8. Financial Statements and Supplementary Data, of this Form 10-K for further discussion of these policies.Under our business, resultsrisk-based health insurance policies, which make up the majority of operationsour health plans and financial condition.
Actual and potential impact on insuranceclaims paid in 2023, we assume the risk of variability in future health claims costs
The COVID-19 pandemic has changed how and when for our WSEs incur health expenses.enrollees. We have experienced variability, and expect to continue tomay experience higher than normal volatility and variability in the future, in the amounts that we are required to pay for group health insurance expenses incurred by WSEs within our deductible layer under our risk-based health insurancethese policies.
COVID-19 stay-at-home orders and social distancing practices have caused, and we expect will continue This variability arises from changes to cause, fluctuations in the usecomponents of medical services as some enrollees defer or cancel elective procedures and outpatient medical, dental and vision services. Reduced use of medical services primarily in the second quarter led to decreases in our MCT, defined as changes in participant use of services, including the introduction of new treatment options, changes in treatment guidelines and mandates, and changes in the mix, unit cost of providing treatment, and timing of services
provided to plan participants. This decrease resultedMCT trends change over time, and other seasonal trends and variability may develop, which makes it difficult for us to predict this aspect of our business and our failure to accurately predict these trends could have a material adverse effect on our business, financial condition and results of operations. For example, while the amount of medical claims we experienced in higher than normal2023 increased as compared to 2022, our insurance costs remained slightly below expectations, which still had a significant impact on our results due to volume.
Under our fully insured workers' compensation insurance policies, we assume the risk for losses up to $1 million per claim occurrence (deductible layer). The ultimate cost of the workers’ compensation services provided will not be known until all the claims are settled. If we do not accurately predict the risks that we assume, we may not charge adequate fees to cover our costs, which could reduce our net insurance revenue during that period.income and result in a material adverse effect on our business. Our ability to predict these costs is impacted by unexpected increases in frequency or severity of claims, which can vary due to changes in the cost of treatments or claim settlements.
We cannot predictaccrue for the rate at which theestimated future costs of reimbursing our workers' compensation and health insurance carriers under our insurance policies. We use of medical services will change in subsequent quarters as announced vaccine rollouts are implemented, social distancing practices change,internal actuaries to develop health claims estimates and as provider networks adaptwe use external actuaries and our own experience to providing services during the COVID-19 pandemic. For example, the use of medical services may decrease if enrollees do not feel safe or as regional hotspots change, regardless of government intervention, vaccine availability, or other positive developments in the COVID-19 pandemic.
These changing trends indevelop workers’ compensation estimates, but the volume and severity of medicalclaims activity is difficult to accurately predict. Estimating these accrued costs requires us to consider a number of factors, such as the components of MCT, seasonal trends and pharmaceutical claims, including COVID-19 testing, treatment and vaccination costs make future health claims costs less predictable than previously experienced, and actual claims patterns and cost trends may differ significantly from our historical experience.
As a result, we cannot predict howthe impact of events like the COVID-19 pandemic, will affectwhich requires significant judgment. In addition, the usefulness of historic claims data is impacted by our rates of WSE and client turnover and we renew our carrier contracts and set fees in advance of benefit periods.
In past periods, we have experienced insurance costs that were either higher or lower than our expectations and estimates. If we were to experience either outcome in the future, it could have a material adverse effect on our business, financial condition and results of operation. Higher-than-expected insurance costs result in lower net income. Because we set fees in advance of plan periods, lower-than-expected insurance costs can be an indicator that insurance costs are developing more slowly than our projections, which are reflected in our fees, and this can have a negative impact on client retention and new sales.
In addition, claims are not static and if we subsequently receive updated information indicating that the volume and severity of insurance claims were higher or lower than previously estimated and reported, our MCT. Because we assume the risk of variability in future health claims costs for our enrollees under our risk-based health insurance policies, this unpredictability could result in higher than expected insurance costs could be higher or lower, respectively, in that period or subsequent periods as we adjust our accrued costs accordingly, which could have a material adverse effect on our business, financial condition and results of operationsoperations. We have experienced both favorable and financial condition.
As we set ourunfavorable insurance service fees for health benefitscost variability due to claims activity in advance for a fixed benefit period, if actual MCT exceeds our projections, this would result in lower net insurance revenues, whichthe past and could have a material adverse effect on our business, results of operations and financial condition. For details on howsimilar or worse experiences in the volume and severity of insurance claims and MCT impact our insurance costs, see future. Refer to Critical Accounting Judgments and Estimates in Part II, Item 7. MD&A, and see the risk factor titled “Unexpected changes in workers’ compensation and health insurance costs and claims by worksite employees could harm our business” below.In response to COVID-19, many states have adopted standards intended to extend workers’ compensation coverage to claims based on a diagnosis of COVID-19. Most states have focused on providing coveragethis Form 10-K for first responders and frontline healthcare workers. Some have gone further to include other essential workers. In California, employees are presumed to be covered by workers’ compensation if certain diagnosed employee thresholds are met and their COVID-19 diagnosis is made within a specified time. As we are responsible for the deductible layer under our workers’ compensation policies, our insurance costs are affected by our WSEs' workers’ compensation insurance claims experience. Any law or legal standard that increases the number of covered workers’ compensation claims under our insurance policies could have a material adverse effect on our insurance costs and financial condition. See the risk factor titled “Unexpected changes in workers’ compensation and health insurance costs and claims by worksite employees could harm our business” below for more details.
Actual and potential impact of the laws affecting our industry and clients
New laws and programs have been enacted, and may continue to be enacted, at every level of government to help the economy, employers and employees. For example, the FFCRA and the CARES Act were signed into law in March 2020, creating numerous new programs, including a paycheck protection program (PPP), mandatory employee leave requirements, payroll tax deferral and tax credit programs and other employment- and employment tax-related incentives. The Paycheck Protection Program Flexibility Act (PPPFA) was signed into law in June 2020, modifying and expanding the original PPP program. The appropriations package passed into law in December 2020 further expanded the availability of some of the employee leave and tax credit programs available to SMBs and their employees, as well as the PPP. Many states have also passed laws to address the impact of COVID-19, and many local governments have enacted ordinances for the same reason. New and amended laws may be passed at the federal, state and local level at any time. We are spending, and will continue to spend, significant time and resources to comply with new and amended laws and to provide the benefits created by these laws for our clients and WSEs, where applicable. Mostdiscussion of these laws and programs have not been, and we do not anticipate will be, enacted with the PEO industry in mind. As a result, we cannot guarantee we will be able to support any of these laws and programs in a timely and cost effective manner or at all, which could reduce or eliminate the attractiveness of our services and/or affect the ability of our clients and WSEs to fully realize the benefits of these laws and programs.estimates.
Many of these laws are complex and require interpretation from various federal and state agencies to implement. Government agency interpretations, at any level of government, can increase the unpredictability and inconsistent application, interpretation and enforcement of these laws. In addition, since many of these laws do not specifically address the PEO industry and many regulators are unfamiliar with the PEO industry, we have been, and expect in the future to be, particularly impacted by unpredictable and inconsistent application, interpretation and enforcement of these laws. For example, implementation of the PPP and the tax credit programs offered under the FFCRA and CARES Act involves substantial input and interpretation from the SBA, the DOL and the IRS, respectively. We have experienced delays in our support for, and have been required to change our approach to implementing, various COVID-19 programs created by these laws in the past due to guidance from the SBA, DOL, IRS and other government agencies, and we expect to experience future delays and changes. Any government agency interpretation may delay, reduce or eliminate our ability to support any of these COVID-19 assistance programs, which could have a material adverse effect on our business.
See the risk factor titled “Our business is subject to numerous complex laws, and changes in, uncertainty regarding, or adverse application of these laws could negatively affect our business” below for more details.
Actual and potential impact on human resources and cyber security
In response to local laws and guidance intended to reduce the spread of COVID-19, in mid-March 2020 we closed our offices across the country and implemented remote working. Remote work increases our risk of experiencing material security-related incidents, such as phishing attacks. There is also an increased risk that our colleagues and WSEs will experience COVID-19 related scams, such as malware and phishing scams. See the risk factor titled “Cyber-attacks or other security-related incidents could result in reduced revenue, increased costs, liability claims, regulatory penalties, and damage to our reputation” below for more details. In addition, responding to the COVID-19 pandemic has diverted, and will continue to divert, the time and attention of our management and service teams. Certain of our employees and their immediate families have been, and others will likely become, ill as a result of COVID-19, or will be impacted by COVID-19 protection measures such as school closures, which may affect our service levels. As a result, our ability to provide services in the same way and in the same timeframe that our clients have come to expect may be negatively impacted.
Operational Risks
Our co-employment relationship with our worksite employees exposes us to unique business risks.
We are theAs a co-employer of our WSEs. As the co-employer of ourclient WSEs, we assume some of the risks and obligations of an employer. For instance, in the past we may needhave been required to provide access to health benefits to our WSEs even ifwhen the cost of providing those benefits exceedsexceeded the service fees received from our clients. The extent of our responsibility for other aspects of our co-employer relationship with our WSEs remains subject to regulatory uncertainty at the federal, state and local levels. For example, underin certain circumstances, we may bestates, PEOs are responsible for paying salaries, wages and related payroll taxes of our WSEs, even if our clients have not timely remitted payments to us.us whether due to insolvency, their bank going into receivership, or other events that may be out of our control.
Our WSEs work in our clients' workplaces. Our ability to control the workplace environment of our clients is limited. Yet, we may be subject to liability for violations of labor and employment laws, workers' compensation laws, industry-specific laws that apply to the businesses our clients operate, and other laws that apply to our clients or to employers generally. We may also be liable for acts, omissions or violations by our clients or WSEs, even if we do not participate in such acts, omissions or violations.
We seek to mitigate these risks through our client agreements and insurance coverage and by requiring certain clients to pre-fund certain obligations.coverage. Our client agreements with our clients divideallocate responsibilities between us and our clients and provide that our clients will fund certain obligations in advance and indemnify us for any liability attributable to their own or our WSEs' conduct. However, we may not be able to effectively enforce or collect on these obligations. In addition, we maintain insurance coverage, including workers’ compensation and EPLI coverage, to limit our and our clients' exposure to various WSE-related claims, but subject to split by contract, weclaims. We are still responsible for any deductible layerlayers under such insuranceour EPLI policies, and such insurancethese policies generally excludesexclude coverage for claims relating to the classification of employees as exempt or non-exempt, other wage and hour issues, and employment contract disputes. We cannot assure you that our insurance will be sufficient in amount or scope to cover all claims that may be asserted against us and for which we are unable to obtain indemnification from our clients.
Negative publicity relating to events or activities attributed to us or our corporate employeescolleagues as a result of the actions of our clients and WSEs, or others associated with them, whether or not justified, may tarnish our reputation and reduce the value of our brand. In addition, if our brand, is negatively impacted, it may have a material adverse effect on our business, including creating challenges in retaining clients or attracting new clients and hiring and retaining employees.
In addition, federal and state positions regarding co-employment relationships can change, and have frequently changed in the past, with varying degrees of impact on our operations. We cannot predict when changes will occur or forecast whether any particular future changes will be favorable or unfavorable to our operations. Any such changes could increase our potential liability for the risks outlined above, or otherwise reduce or eliminate the attractiveness of using a PEO, or significantly increase our compliance costs and the cost to provide our services, which could result in a material adverse effect on our financial condition and results of operations.
Unexpected changes in workers' compensation and health insurance costs and claims by worksite employees could harm our business.
Our insurance costs, which comprise a significant portion of our overall costs, are significantly affected by our WSEs’ health and workers' compensation insurance claims experience. Our insurance plans are provided by third-party insurance carriers under risk-based or under guaranteed-cost insurance policies. Refer to Note 1 in Part II, Item 8. Financial Statements and Supplementary Data, of this Form 10-K for further discussion of these policies.
Under our risk-based health insurance policies, we assume the risk of variability in future health claims costs for our enrollees. We have experienced variability, and may experience variability in the future, in the amounts that we are required to pay for group health insurance expenses incurred by WSEs within our deductible layer under these risk-based policies, based on changing trends in the volume and severity of medical and pharmaceutical claims. This variability arises from changes to the components of MCT. These trends change, and other seasonal trends and variability may develop, which makes it difficult for us to predict this aspect of our business and which may have a material adverse effect on our business.
Under our fully-insured workers' compensation insurance policies, we assume the risk for losses up to $1 million per claim occurrence (deductible layer). Refer to Note 1 in Part II, Item 8. Financial Statements and Supplementary Data, of this Form 10-K for further discussion of these policies. The ultimate cost of the workers’ compensation services provided will not be known until all the claims are settled. If we do not accurately predict the risks that we assume, we may not charge adequate fees to cover our costs, which could reduce our net income and result in a material adverse effect on our business. Our ability to predict these costs is limited by unexpected increases in frequency or severity of claims, which can vary due to changes in the cost of treatments or claim settlements.
We accrue for the estimated future costs of reimbursing our workers' compensation and health insurance carriers under our insurance policies, using external actuaries and our own experience to develop the estimates, but the volume and severity of claims activity is inherently unpredictable. Estimating these accrued costs requires us to consider a number of factors and requires significant judgment.
If we subsequently receive updated information indicating that the volume and severity of insurance claims were higher or lower than previously estimated and reported, our insurance costs could be higher or lower, respectively, in that period or subsequent periods as we adjust our accrued costs accordingly, which could have a material adverse effectimpact on our business. We have experienced both favorableability to attract and unfavorable insurance cost variability due to claims activity in the past and could have similar or worse experiences in the future. Refer to Critical Accounting Judgments and Estimates in Part II, Item 7. MD&A, of this Form 10-K for further discussion of these estimates.retain clients.
Our SMB clients are particularly affected by volatility in the financial and economic environment, which could harm our business.environment.
Our clients are small and medium-size businesses that we believe areSMBs can be particularly susceptible to changes in the level of overall economic activity in the markets in which they operate. These businesses are often exposed to credit and cash liquidity risks, including exposure as a result of the failure of their financial institutions, that larger businesses may be able to avoid, and during periods of weak economic conditions, small businessincluding periods of increased inflation and increased borrowing costs, SMB failures tend to increase, and employment levels tend to decrease. During these periods, our clients have in the pastcan and may in the futuredo freeze hiring, terminate their employees, and reduce employee headcount, compensation and/orand benefits levels, any of which couldwould negatively affect our revenues and margins if we are unable to reduce our operating expenses sufficiently or quickly enough.
During these periods, of weak economic conditions, we have also seen in the past and expect to see, during such periods in the future, including during the COVID-19 pandemic,reduced demand for our services, increased client attrition and/orterminations, fewer new clients, asand clients are unwillingseeking to renegotiate our contracts and prices. When our clients leave us or reduce their headcount, we typically see increases in the volume and severity of unemployment claims, COBRA claims, disability claims, and workers’ compensation claims. We may be unable to pay for our services, as well as an increase in clients that are unablerecover costs related to pay their obligations on time, and an increase in unemployment and related COBRAthese claims and employment-related costs from our clients and WSEs, which we may be legally or practically unable to recover based on the fees we chargeestablished in our clients.
In addition, most of our clients are concentrated in certain geographic regionsclient service agreements, and operate in a relatively small number of industries, including the technology, life sciences, not-for-profit, professional services and financial services industries. As a result, if any of those geographic regions or specific industries suffers a downturn, even if the economy at the national level remains strong, the portion of our business attributablefailure to clients in that region or industry could be adversely affected, which couldrecover such costs may have a material adverse effect on our business, financial condition orand results of operations.
We lose clients for many reasons that we cannot control or easily predict and, generally, our clients sign service agreements that they can cancel on short notice.
Our standard client service agreementagreements can generally be canceled by us or by the clientour clients with 30 days’ prior written notice. We regularly experience client attrition and decreases in new client sales due to a variety of factors that are difficult for us to control or predict, including the overall national economic factors above, as well as cost pressures,conditions, client mergermergers and acquisition activity, reactions to any proposed increasesacquisitions, changes in administrativemedical utilization and insurance service fees by us,related costs, client business failure and liquidity issues, the effects of competition, and client decisiondecisions to bringadminister all or a portion of their HR administration in-house.needs in-house without using our services. If we were to experience client attrition due tofor any of the above reasons or otherwise in excess of our historic and estimated rates it could have a material adverse effect on our business, financial condition and results of operations.
Geographic and industry market concentration makes our results of operations vulnerable to regional and industry-specific economic and health factors.
PEO services remain our core business. Our top five PEO markets, California, New York, Florida, Texas and Massachusetts, accounted for approximately 64% in aggregate of our paid WSEs for the year ended December 31, 2023. If any of those geographic regions suffers a downturn, even if the economy at the national level remains strong, or experiences higher than expected medical services utilization, due to regional health issues, the portion of our business attributable to clients in that region could be adversely affected, which could have a material adverse effect on our financial condition or results of operations.
In addition, most of our PEO clients operate in a relatively small number of verticals, including the technology, professional services, financial services, life sciences and not-for-profit verticals. As a result, if any of those verticals, or any industry within one of those verticals, suffers a downturn, even if the economy at the national level remains strong, the portion of our business attributable to clients in that industry could be adversely affected, which could have a material adverse effect on our business, financial condition or results of operations.
Any failure in our business systems, or in any third-partythe business systems or service providercenters that we or our service providers rely upon, could reduce the quality ofnegatively impact our business services,clients, harm our reputation and expose us to significant, unanticipated liability.
Our business is highly dependent on in-house and third-party data processing centersbusiness systems and systems that relyservice centers. The operation of our business relies on the complex integration of numerous hardware and software subsystems across several service centers to manage a large volume of daily client, WSE and WSE transactions,HRIS User transactions. For example, we rely on software systems, including the processing of employee,software systems used by our banking institutions, to process payroll, payroll tax and benefits data. We also rely on third-party systemsdata and make related payments, and to provide services for our clients and WSEs, includingaccess insurance carrier networks and databases that manage theWSE and HRIS User benefits provided to, and claims made by,claims. These software systems run on computer hardware that we or our clients and WSEs and electronic banking systems and payroll tax systems that transmit payments and data to clients, WSEs and taxing agencies. service providers house in various service centers.
These centers and systems have been, and could be disrupted by equipment failures, computer server or systems failures, network outages, ransomware attacks and other malicious acts, software errors or defects, vendor performance problems, banking failures, power failures, natural disasters, terrorist actions or similar events. We have, alsofor example, experienced office closures on the East Coasteast coast on multiple occasions over the past few years due to hurricane and storm threats, in Texas due to climate-related power grid issues, and in California due to increased wildfire threats in the state. Our offices and data processingservice centers in these and other locations will continue to face the risk of closure or damage in the future due to climate change.related events.
Any delay or failure in our business continuity response to these events, or in the response of our third-party service providers,such disruption, even if only for a short period of time and even if we are not at fault, can have a significant impact on our clients, WSEs and WSEs. ThisHRIS Users by preventing us from timely processing payroll, paying payroll taxes and other liabilities and otherwise disrupting our business operations. As a result, any such disruption could cause us to lose clients, negatively impact our ability to leave us, result in reducedattract new clients, and reduce our revenues and increase our liability to our clients and WSEs,costs, any of which could result in a materiallymaterial adverse effect on our reputation, and business. We also rely on enterprise software applications licensed from third parties that are updated from time to time. Any failure of these systems for any reason could delay or prevent us from providing services to our clients, which would have a material adverse effect on our business and results of operations.
Our Recovery CreditDiscontinuing our discretionary credit program could fail to achieve the business goals for which it was designed, which could result in a material adverse effect on our business, results of operation and/orand financial condition.
In AprilWe offered various discretionary credits to eligible clients in 2020, we created our Recovery Credit program2021 and 2022. These credits were based on TriNet health insurance costs over specified periods and were intended to assist in the economic recovery of our existing SMB clients and enhance our ability to retain these clients. Eligible clients receive one-time reductions against fees for future services, accounted for as a discount, to be received overduring the following 12 months. The ultimate amount of the Recovery Credit eligible clients will receive is dependent on our future performance and is subject to a limit on the total amount of $145 million. Our Recovery Credit program is designedCOVID-19 pandemic, to promote client loyalty and incentivize client retention, and to differentiate TriNet from its peers in the PEO industry and in other competing HR services industries.
Although We did not offer discretionary credits in 2023 and do not have plans to in the future. While we have designed our Recovery Credit to address these objectives,believe the discretionary credits created some client loyalty and retention, not offering discretionary credits may cause those clients we cannot predict how the program will ultimately be received by our clients and we may not achieve the loyalty, retention and product differentiation impact that we expect. For example, our competitors may create similar programs or offer other competing incentives that resonate more with our clients and prospects, reducing some or allretained because of the expected benefits of our Recovery Credit program.
As a resultdiscretionary credits to leave. Client attrition due to the stoppage of the Recovery Credit, we recognized a reduction in totaldiscretionary credits could reduce our revenues of $128 million in 2020. If our Recovery Credit program fails to generate the business impact for which it was designed, for any reason, our financial performance will be negatively affected, which could result inand have a material adverse effect on our business, financial condition and results of operations. For more details on our Recovery Credit program, refer to Note 1 in Part II, Item 8. Financial Statements and Supplemental Data, in this Form 10-K.
Adverse changesChanges in our insurance coverage, or in our relationships with key insurance carriers, could harm our business.
Our success depends in part on our ability to maintain competitive health and workers' compensation coverage options and insurance rates through well-known insurance carriers. If we are unable to maintain competitive insurance rates or obtain popular and desirable coverage plans through well-known insurance carriers, it could affect our ability to attract and retain clients, which could have a material adverse effect on our business. Where we sponsor insurance coverage and we are not responsible for any deductibles, our carriers set the fixed cost of the plan, which may lead to uncompetitive fees. Even where we sponsor insurance under which we are responsible for deductibles, we may not be able to control our costs in a way that would make our fees competitive.
In addition, broad adoption of our services in certain geographic regions or industries may make it more difficult for us to obtain competitive health and/or workers' compensation insurance rates due to concentration of clients within a particular region or industry. For example, we have significant concentrations of PEO clients in California, New York, Florida, Texas and Massachusetts, which account for approximately 64% in aggregate of our paid WSEs for the year ended December 31, 2023. The loss of any one or more of our key insurance vendors in these areas, or our inability to partner with certain vendors that are better-known or morethe most desirable to our clients or potential clients,carriers in these areas, could have a material adverse effect on our financial condition and results of operations.
We must continue to work to improve our services to meet the expectations of our clients and regulators, or we may lose our clients and materially harm our business.
In order to attract and retain clients, we believe that we must compete in our industry effectively on the basis of the value proposition that we deliver to our clients, including which includes
•client experience and satisfaction,
•the relevance and cost-effectiveness of our PEO benefit plans,
•our PEO vertical market expertise, total price of
•our service and product pricing,
•our brand awareness and reputation,
•our ability to innovate and respond to client needs and regulatory mandates rapidly, access to
•the performance of our online and mobile solutions, software and technology platforms, and
•our human resources subject matter expertise.
The expectations of our clients and prospective clients in these areas change over time as a result of many factors outside of our control, such as competition, regulatory and technical changes, and changing trends in the demands employees place on SMB employers. Regulatory changes may also mandate that we make changes to our services or benefit offerings.
To satisfy client expectations and regulatory requirements, we must timely and effectively identify and develop, or license and contract appropriate technologies and services, and incorporate themsuch technologies and services into the solutions that we provide. New services or upgrades may not be released according to schedule or may contain defects when released. Difficulties with the performance ofIf our new technologies and services perform poorly, or fail to satisfy regulatory requirements, we could result inexperience client dissatisfaction, adverse publicity, loss of sales, delay in market acceptance of our services, orand client claims against us, any of which could materially harm our business. For example, like other PEOs, our federal R&D tax credit programs require the IRS to provide tax credit refunds for our clients. In situations where IRS refunds were delayed, even where we were not at fault, we have experienced client terminations and dissatisfaction, and we may experience similar outcomes in the future. Even ifwhere we are capable of satisfyingcan satisfy client expectations in these areas,and regulatory requirements, we may not be able to do so on a cost-effective basis, which could have a material adverse effect on our financial condition and our results of operations. We could lose market share if our competitors develop superior productstechnologies and services or satisfy client or regulatory demands before we are able to do so. If we are unable to satisfy the evolving producttechnology and service expectations and regulatory requirements, then we wouldmay experience lower client satisfaction, fewer new clients and higher client attrition, which could have a material adverse effect on our business.
We have acquired, and may in the future acquire, other businesses and technologies, which can divert management's attention and create integration risks and other risks for our business.
We have completed numerous acquisitions of other businesses and technologies over the years, and we expect that we will continue to pursue future acquisitions. Acquisitions involve numerous other risks, some of which we have experienced in the past and which we may experience in the future, including:
•over-valuing and over-paying for businesses and technologies,
•increased operating costs and unanticipated costs to successfully integrate the clients, WSEs and HRIS Users, operations, systems, technologies, services and personnel of the acquired business,
•establishing or maintaining required internal controls, procedures and policies for the acquired business,
•unanticipated costs and risks arising from the unique corporate culture and risk appetite of acquired businesses,
•diversion of management’s attention from other business concerns,
•litigation resulting from the activities of the acquired business,
•insufficient revenues, insurance or seller indemnification to offset increased expenses associated with the acquisitions and unanticipated liabilities of the acquired businesses,
•entering markets in which we have no prior experience and may not succeed, and
•potential loss of key employees or key clients of the acquired business as a result of the acquisition or integration of the acquired business.
We have experienced increased operating costs to resolve the challenges of prior acquisitions. If we fail to appropriately integrate any acquired business, we may fail to achieve our growth, service enhancement or operational efficiency objectives, and our business, results of operations and financial condition could be harmed.
For example, TriNet has focused almost exclusively on the PEO business since its formation and PEO services remain our core business. Our HRIS and tax credit offerings are not PEO businesses. They utilize separate software and technology platforms, and they service SMB clients that can have very different needs from our traditional PEO clients. These businesses may divert management attention from our core PEO business to its detriment. Conversely, we may lack the experience needed in these non-PEO businesses to manage them effectively. Any such outcome could result in a material adverse effect on our business, financial condition and operations have undergone and will continue to undergo significant change as we seekresults of operations.
Our efforts to improve our operational effectiveness. If we are unable to effectively manage this change,effectiveness and resiliency require significant time, resources and costs and if these efforts fail or significantly divert management attention, our business and results of operations may suffer.
We have changed our operations and internal client service processes in recent periods in order to improve our operational effectiveness and to provide improved client supportresiliency, and services. For example, we recently adopted a new client service engagement model that we believe will benefit our clients and WSEs. Managing these changes will continue to require further refinementdo so in the future. For example, over the course of 2022 and 2023 we upgraded and released a new company-wide enterprise resource planning (ERP) system. If our new ERP system does not function as intended and designed, management attention may be diverted, and we may see increased operational costs while we remediate any issues. We are also working on other projects intended to upgrade our technology platform and the client support tools we use, increase workflow automation, and improve the retention of, and access to, institutional knowledge. For example, over 2023 we expended considerable time and resources on decoupling and modernizing our PEO and HRIS platforms. We will continue to expend considerable resources on these efforts through 2024. If we are unable to achieve our goals, management attention may be diverted and we may experience competitive challenges, client dissatisfaction, program delays and increased operational costs to remediate any resulting issues.
We have and will continue to devote substantial time, money and management resources to these projects. Managing these projects also typically requires changes to our internal operational, financial and management controls andas well as our reporting systems and procedures. We cannot guarantee that our efforts will achieve our goals in a timely or cost-effective manner or at all, and we cannot guarantee that we can carry out these projects without a negative impact on our day-to-day operations and client satisfaction. If our current and future projects are delayed or unsuccessful, of if any changes to our controls, reporting systems, or procedures whileare deficient, client satisfaction may suffer, we simultaneously seekmay lose clients or fail to effectively recruit, integrate, train and motivate new corporate employees, retain our existing corporate employees, maintain our corporate culture, effectively execute our business plan, satisfy our existing clients, acquireonboard new clients at expected rates, and enhance the quality and scopewe may incur substantial unanticipated costs to complete these projects. Any of our services. These activities will also require significant operating and capital expenditures and allocation of valuable management and employee resources, which we expect will continue to place significant demandsthese outcomes could have a material adverse effect on our management and on our operational and financial infrastructure. If we fail to manage these changes effectively, our costs and expenses may increase more than we expect and our business, financial condition and results of operations may be harmed.operations.
If we are unable to attract, maintain and manage qualified personnel, including our sales force, our business may be harmed.
To succeed, we must be able to attract and retain highly motivated and qualified personnel. Competition for skilled employees is intense and iflike many businesses, we are susceptible to fluctuations in the labor market. For example, as we continue to expand our operations in India, we are also entering a new labor market. If we are unable to attract and retain qualified personnel, in either or both of the personnelUS and India (or any other jurisdiction into which we need,expand), our business may suffer.
For example, we have experienced elevated sales force attrition in the past and may experience it in the future, for a variety of reasons, including due to changes in industry or client focus, compensation structure, third-party competition for sales talent and other factors.we have experienced elevated sales force attrition in the past and may experience it in the future. Newly hired sales personnel are typically not productive for some period of time following their hiring, which results in increased near-term costs to us relative to their actual sales contributions during this period. If we are unable to effectively train and maintain an adequately seasoned and sized sales force, our revenues likelynew client onboarding will not increase at the rate that we anticipate, which could have a material adverse effect on our business, financial condition and results of operations.
Our industry is competitive, which may limit our ability to maintain or increase our market share or improve our results of operations.
We face significant competition on a national and regional level from other PEOs, ASOs that do not use co-employment relationships, and HRIS software providers, as well as from other existing, and potential, companies and industries that service, or may in the future service, client HRHCM needs. Refer to the heading "“Competition"Competition” under Part I, Item 1. Business, above for more details. Our competitors, regardless of industry, may have greater marketing and financial resources than we have, and may be better positioned than we are in certain markets. Increased competition in our industry could result in price reductions or loss of market share, any of which could harm our business. We expect that we will continue to experience competitive pricing pressure. Moreover, we may not be successful in convincing potential clients that the usepressure and competition from new technologies and HCM service models, any one of our services is a superior, cost-effective means of satisfying their HR obligations relative to the way in which they currently satisfy these obligations either by themselves or by using the services of our competitors. If we cannot compete effectively against other PEOs or against the alternative means by which companies meet their HR obligations, or if we are unable to convince clients or potential clients of the advantages of our offerings, our market share and business may suffer, resulting incould have a material adverse effect on our financial condition and results of operations.business.
Data Privacy and Security Risks
Cyber-attacks, breaches, disclosures or other security-relateddata-related incidents could result in reduced revenue, increased costs, liability claims, regulatory penalties, regulatory disclosure requirements and damage to our reputation.
We and our third-party service providers and subcontractors collect, store, use, retain, disclose, transfer and otherwise process a significant amount of confidential, sensitive and personal information from and about our actual and potential clients, WSEs, HRIS Users and corporate employees,colleagues, including bank account andnumbers, social security numbers, tax information, certain PHI, certain health claim information, retirement account information, and payroll data. Maintaining the security and confidentiality of this information is critically important to our clients, WSEs, HRIS Users and corporate employees.
| | | | | |
RISK FACTORScolleagues. For more information regarding our cybersecurity risk management framework and governance, refer to Part I, Item 1C. Cybersecurity. | |
Due to the size and complexity of our technology platform and services, the amount of confidential, sensitive and personal information that we store, and the number of clients, WSEs, corporate employees and service providers with access to this information, we and our service providers are potentially vulnerablesusceptible to a variety of intentional andor inadvertent cyber-attacks, breaches, disclosures and other security-relateddata-related incidents and threats.
Cybersecurity threats can take a variety of forms. HackersMalicious actors may develop and deploy viruses, worms and other malicious software programs that attack our networks and data centers or those of our service providers. Other maliciousMalicious actors may also direct social engineering, phishing, credential stuffing, ransomware, denial or degradation of service attacks and similar types of attacks against any or all of us, our clients and our service providers. Other threats include inadvertent security breaches or theft,disclosure, misuse or unauthorized access or other improper actions by our employees,colleagues, clients, WSEs, HRIS Users, service providers and other business partners. Cyber-attacks, breaches, disclosures and other security-relateddata-related incidents are increasing in frequency and evolving in nature. While we devote substantial time and resources to training our colleagues to identify and avoid such incidents, no training or cybersecurity program can offer absolute protection against such attacks and incidents.
Any actual or attempted cyber-attack, breach, disclosure or other security-relateddata-related incident, and any disclosure of the confidential, sensitive and personal information that we possess, the reporting of such an incident or the public perception or even rumors of such an incident, whether accurate or not, or any failure by us or our service providers to make adequate and timely public and regulatory disclosures for any reason, could have a material adverse effect on our business, reputation, financial condition or results of operation, and alsooperation. Public perception of, or even inaccurate or unfounded rumors of, any such cyber-attacks, breaches, disclosures, or other data-related incidents, could have a material adverse effect on our business, reputation, financial condition or results of operation.
Any such cyber-attacks, breaches, disclosures or other data-related incidents, could result in material financial liability by:
•causing us to incur material fines, penalties, orders, sanctions and proceedings or actions against us or our service providers by regulatory authorities, clients and other third parties. Any such fines, penalties, order, sanctions, proceedings or actions,parties,
•requiring us to indemnify clients and any related indemnification obligation, could also damageother third parties,
•damaging our reputation, force
•causing us to incur significant expenses in defense of these proceedingsto defend our actions and practices,
•delaying product and service development plans,
•causing unrelated compliance breaches through system failures or to pay finesmanagement distraction, and penalties, distract our management, increase
•increasing our costs of doing business,business.
TriNet does not need to be the direct target of such cyber-attacks, breaches, disclosures or other data-related incidents, for them to have a material adverse effect on our operations. A cyber-attack on a key third-party software service provider, or a new vulnerability identified in software that we use, could disrupt our services or compromise client data entrusted to that service provider. In March 2022, a hacking group announced that they had compromised several systems, including those of Microsoft and Okta, both TriNet vendors. After review, our security team determined that no security compromises had occurred within TriNet's systems related to any of these incidents, but this is no guarantee that a future vulnerability or incident would not result in material financial liability. Any such incidenta security compromise. New software vulnerabilities are identified regularly, by organizations like the U.S. Cybersecurity and Infrastructure Security Agency. Similar cyber-attacks, breaches, disclosures and other data-related incidents, including those resulting from a vulnerability, involving a client could also result in disruptionaccess to our clients' or service providers' systems and services, product development delays or other compliance breaches, whichTriNet’s systems. Any such incidents, even if not initially directed at TriNet, could also have a material adverse effect on our business operations, result in liability, fines and penalties or other regulatory sanctions, a loss of confidence in our ability to provide our services, and/or harm our reputation and relationships with current or potential clients.
We, our clients and our service providers have been the victims of these types of threats, attacks and securitycyber-attacks, breaches, in the past, and we, our clients and our service providers expect to be victims again in the future. Cyber-attacks have disrupted,disclosure or resulted in unauthorized access to, our networks, applications, bank accounts, and confidential, sensitive and personal information, or those of our clients or WSEs or service providers, in the past and successful attacks may occur again in the future. We, our service providers and our clients have experienced other securitydata-related incidents, in the past that led to disclosure of the confidential, sensitive or personal information we possess, and we, our clients and they could experience such incidentsour service providers expect to be victims again in the future. As a result of these incidents,Similarly, we and our service providers have experienced disruption to, or unauthorized access to, our networks, applications, bank accounts and other key systems in the past reported, and expect to reportsimilar events may occur again in the future,future. We have reported data breaches to regulators, affected individuals, clients and other third parties.parties in the past and we expect to do so in the future as appropriate. While we do not believe that any such past events constitute a material cybersecurity incident or resulted in material expenditures, orfuture events could result in a material loss of confidential, sensitive or personal information, we cannot guarantee that any future events will not have a materialadverse impact on our operations.
We expend significant capital and other resources
operations. For more information regarding our analysis of material cybersecurity incidents, refer to protect against, respond to, and recover from any potential, attempted, or existing cyber-attacks or other security-related incidents and their consequences. Part I, Item 1C. Cybersecurity. The costs of identifying and remediating any threat, attack, breach, or disclosure, and the costs associated with responding to litigationany cyber-attacks, breaches, disclosure or regulatory investigations,other data-related incidents could also haveresult in a material adverse effect on our businessfinancial condition and reduce our operating margins.results of operations. Although we maintain insurance coverage for such events, the amount of our insurance may not cover thethese costs, associated with any security incident, and we cannot be certain that cyber insurance will continue to be available to us on economically reasonable terms, or at all, or that any insurer will not deny coverage as to any future claim. Moreover, there could be public announcements regarding any security-related incidents and any steps we take to respond to or remediate such incidents, if securities analysts or investors perceive these announcements to be negative, could have a material adverse effect on the price of our common stock.
Our efforts to protect against and to remediate cyber-attacks, breaches, disclosures and other security-relateddata-related incidents, and data breaches may not succeed and any such event, whether intentional or inadvertent and whether attributable to us or our service providers, could have a material adverse effect on our business, reputation and the price of our common stock.reputation.
We have implemented policy, procedural, technical, physical, and administrative controls with the aim of protecting our networks, applications, bank accounts, and the confidential, sensitive and personal information entrusted to us, including bank account and social security numbers, tax information, certain medical information, certain health claim information, retirement account information, payroll datafrom cyber-attacks, breaches, disclosures and other PHI, from cyber-attacks and other security-relateddata-related incidents. While we, and our service providers, have security measures and programs in place to prevent detect, and respond to cyber-attacks, security-related incidents, data breaches, disclosures and other similar threats, these security measures and programs and our collective efforts may not always succeed. Despite our efforts and those of our service providers,data-related incidents, we cannot fully eliminate the possibility of such cyber-attacks, security-related incidentsbreaches, disclosures and other threats,data-related incidents, whether intentional or inadvertent and whether internal or external andexternal. Moreover, we, our clients or our service providers also may not discover a securitycyber-attack, breach, disclosure or other data-related incident for a significant period of time after the incident occurs. For more information regarding our cybersecurity risk management framework and governance, refer to Part I, Item 1C. Cybersecurity. In some cases, weWe perform riskrisk-based assessments of our vendors and service providers, but our assessments may be incomplete or not detect vulnerabilities that can impact our business. Vendors and service providers with access to our data and systems typically undergo additional security review procedures. In addition, we require themthose vendors and service providers to undertake additional security measures through contract provisions.according to the inherent risk of the system access or processing activity contemplated in the contract. However, we do not control our service providers and our ability to monitor their data security is limited, so we cannot ensure the security measures they take will be sufficient to protect our confidential, sensitive and personal information. Due to applicable laws and regulations or contractual obligations, we may be held responsible for any cyber-attack, breach, disclosure or other security-relateddata-related incident attributed to our service providers regarding the information we share with them and any contractual protections we may have from our service providers may not be sufficient to adequately protect us from any such liabilities and losses.losses.
We have invested, and plan to continue investing, in resources to protect our information security ecosystem against cyber-attacks, breaches, disclosures and other security-relateddata-related incidents, and data breaches and to investigate and remediate any information security vulnerabilities. However, the security protections and strategies that we implement, and the investigation and remediation efforts we undertake, may not be successful. The use of artificial intelligence and machine learning ("AI-ML") tools by cyber threat actors may create new types of attacks that are difficult or impossible for our existing security controls to detect and prevent. While we continue to invest in new security tools and technologies that aim to counteract this weaponization of AI-ML, those measures may fall behind the capabilities of the threat actors. Any securitycyber-attack, breach, disclosure or other data-related incident, whether intentional or inadvertent, could result in the access, public disclosure, loss or theft of our clients', WSEs', HRIS Users’ and corporate employees’colleagues’ confidential, sensitive and personal information, which could negatively affect our ability to attract new clients, cause existing clients to terminate their agreements with us, result in significant reputational damage and subject us to significant lawsuits, regulatory fines, or other actions or liabilities, any of which could materially and adversely affect our business and operating results.
We must comply with constantly evolving, data privacy and security laws and regulations, which may require substantial costs or changes to our business, and any actual or perceived compliance failure could result in reduced revenue, increased costs, liability claims, regulatory penalties, and damage to our reputation.
We are subject to various federal, state and local laws, rules, and regulations, as well as contractual obligations, relating to the collection, storage, use, retention, security, disclosure, transfer and other processing of confidential, sensitive and personal information. Existing laws and regulations are constantly evolving, and new laws and regulations that apply to our business are being introduced at every level of government inside and outside of the United States. For example, all 50 U.S. states,
Depending on the District of Columbia, Guam, Puerto Rico, the Virgin Islands and Canada have enacted data breach notificationapplicable jurisdiction, these laws that may require us to notify WSEs, clients, corporate employees, or other third parties and regulators in the event of unauthorized access to or disclosure of confidential, sensitive or personal information experienced by us or our service providers.
In addition to breach notification laws, we have seen increased focus at every level of government inside and outside of the United States on regulating the collection, storage, use, retention, security, disclosure, transfer and other processing of confidential, sensitive and personal information. For example, in recent years, many states have proposed or enacted new laws or amended existing laws. Certain state laws, including the CCPA and CPRA, may be more stringent or broader in scope, or offer greater individual rights, with respect to confidential, sensitive and personal information than federal, international or other state laws, and such laws may differ from each other, which may complicate compliance efforts, requiring attention to changing regulatory requirements. We believe thatAs the patchwork of privacy laws to which we currently complyare subject becomes increasingly complex, the cost of complying with all of the requirements of the CCPA, but additional provisions of the CCPA will become effective in 2021rise and 2023. While we are working to comply with these provisions, we cannot guarantee that we will not incur significant costs or that our compliance efforts will be successful. As a sponsor of employee benefit plans with access to certain PHI, we are subject to regulation at the federal level, including under the HIPAA and the HITECH Act. HIPAA contains restrictions and health data privacy, security and breach notification requirements with respect to the use and disclosure of PHI and there are penalties and fines for HIPAA violations.
For details regarding these data privacy and security laws and regulations discussed above and that apply to our operations, refer to Part I, Item 1. Business, of this Form 10-K, under the heading "“The Impact of LawLaws and Regulation onRegulations that affect Our Business: Data Privacy and Security Regulations"Regulations”. Complying with these and any other data privacy and security laws, rules and regulations, and with any new laws or regulations or changes to existing laws, could cause us to incur substantial costs or require us to change our business practices in a manner adverse to our business, divert resources from other initiatives and projects, and restrict the way products and services involving data are offered, all of which may have a material adverse effect on our business. For example, we have incurred and expect to continue to incur additional costs to comply with the CCPA and other similar regulations. Despite our efforts, in the future we may be unable to make required changes and modifications to our business practices in a commercially reasonable manner, or at all. Given the rapid development of cybersecurity and data privacy laws, we expect to encounter inconsistent interpretation and enforcement of these laws and regulations, as well as frequent changes to these laws and regulation. As a result, we may be required to incur significant, unexpected compliance costs and we may be exposed to significant penalties or liability for non-compliance, the possibility of fines, lawsuits (including class action privacy litigation), regulatory investigations, criminal or civil sanctions, audits, adverse media coverage, public censure, other claims, significant costs for remediation and damage to our reputation, all of which could have a material adverse effect on our business and operations. Any inability, or the perception of any inability, to adequately address data privacy or security-relateddata-related concerns, even if unfounded, or to comply with applicable laws, regulations, standards and other obligations relating to data privacy and security, could result in additional cost and liability to us, damage our relationships with clients and have a material adverse effect on our businessbusiness.. As a sponsor of employee benefit plans with access to certain PHI, we are subject to regulation at the federal level, including under the HIPAA and the HITECH Act. HIPAA contains restrictions and health data privacy, security and breach notification requirements with respect to the use and disclosure of PHI. There are penalties and fines for HIPAA violations.
Due to our international footprint, we have customers and colleagues outside of the United States. If we fail to comply with applicable data privacy regulations in the countries in which we send and receive personal data, we may be exposed to regulatory action and fines, which could have a material adverse effect on our business.
Legal and Compliance Risks
Our business is subject to numerous complex laws, and changes in, uncertainty regarding, or adverse application of these laws could negatively affect our business.
The services we provide to our clients are subject to numerous complex federal, state and local laws and regulations, including those described in Part I, Item 1. Business, of this Form 10-K. These laws and regulations cover a diverse range of topics, including employer status, employee and independent contractor classifications, employee benefit,benefits, health and retirement plan laws,plans, workers' compensation, laws,banking and money transmission, employment and payroll tax, laws, worksite safety, laws, insurance, and banking laws, wage and hour, laws, anti-discrimination, laws, and many lawstopics specific to the industries of our clients. Many of these laws do not specifically address PEOs or co-employment relationships, and regulators are often unfamiliar with the PEO industry and co-employment relationships, which can lead to unpredictable application, interpretation and enforcement of these laws and regulations at the federal, state and local levels in relation to our business. Our HRIS services can also be subject to complex federal, state and local laws and regulations regarding payroll agents, employment and payroll taxes, insurance producers, banking and money transmission, and other licensing requirements. The tax credit support services we provide are also subject to federal, state and local regulations regarding tax preparation and practice that limit the services we can provide to SMBs. While regulations governing HRIS services and tax credit support services do not involve the complexity of a co-employment relationship, these services are in some ways also highly regulated and such regulations can, and do, change regularly at the federal, state and local levels. For example, in mid-January the House of Representatives passed the Tax Relief for American Families and Workers Act of 2024 (TRAFWA) which, if it were to become law, would require that the IRS not accept further claims for the CARES Act Employee Retention Tax Credit (ERTC) after January 31, 2024, which results in a shorter time to file than would normally be permitted under federal filing rules. This change would negatively impact SMBs by terminating the availability of the ERTC early.
Any new laws, changes in existing laws, or any adverse application, interpretation or enforcement of new or existing laws, including those described in Part I, Item 1. Business, of this Form 10-K, whether they apply to employers generally or specifically to PEOs or to our co-employment relationships could:
•reduce or eliminate the value and benefits that clients realize by using our services,
•change or eliminate the types of services we provide,
•require us to make significant changes to how we do business and provide services,
•require us to modify our current business practices or operations,
•affect the extent and type of employee benefits that employers and co-employers can or must provide employees,
•alter the amount, timing and type of taxes employers, co-employers, clients, WSEs, and WSEsHRIS Users are required to pay and that we must manage for and collect from our clients,
•increase the cost and complexity of the licensing requirements for our business operations,
•create or increase our liability and responsibilities to our clients and WSEs, HRIS Users, and/or
•mandate new compliance requirements, disclosures or services.
Any of these changesthe above could have a material adverse effect on our business, financial condition and results of operations.
For example, we have seen a growing trend, particularly at the federal level, of using payroll tax credits, deferrals and other related payroll tax programs as a mechanism for incentivizing SMB development and economic recovery. These programs are popular because they allow SMBs, which often have income tax losses, to realize benefits via payroll tax reductions, rather than income tax reductions. However, these programs have generally not been designed with the PEO industry in mind and rely on calculations contained in client income tax returns which PEOs do not process in their role as the co-employer or other client data that cannot be verified by a PEO, even though the resulting tax benefits are processed through the PEO’s payroll tax returns. Because minimal guidance exists in the statutes that create these programs, they are subject to broad and varied agency interpretation and application. In addition, the processes used to evaluate payroll tax filings are designed with individual taxpayers in mind, not PEOs that aggregate the filings of many clients, which can further increase varied interpretation by agencies and make it difficult to predict their interpretation and application. For example, we must claim PEO client ERTCs in aggregate on our federal tax filings and such filings are inherently more complex. The laws that applyconstrained timeline in the TRAFWA coupled with the complexity of our federal filings may result in our industry and to employers and co-employers have in the past, and could in the future, be changed, replaced or interpretedPEO clients being negatively impacted in a manner adversethat is more significant than the impact that the TRAFWA, if it were to become law, would have on SMBs not using our operations and we are not able to predict the occurrence, direction or ultimate impactPEO services.
Some of these events. Any such new laws, changeprograms include the 2015 PATH Act, which allows SMBs to use R&D tax credits submitted on the SMB’s income tax return to reduce the SMB’s payroll taxes, and the CARES Act and FFCRA Act payroll tax credit and payroll tax deferral program enacted in laws2020 and 2021, which allow SMBs to defer certain payroll tax obligations to a later date or adverse application or interpretation of laws could reduce or eliminate the attractiveness ofto receive payroll tax credits based on SMB employment practices that are beyond our services, providecontrol. The IRS has taken positions that we and other PEOs, rather than clients, with neware responsible for client errors and attractive alternativesrepaying rejected tax credit claims under these and similar programs. While our clients are contractually responsible for repaying us for any rejected tax credits under these programs, a contract does not guarantee our ability to recover rejected tax credits and any failure to recover rejected tax credits from our services, significantlyclients would increase our compliance costs and the cost to provide our services, or require us to make substantial changes to the way in which we operate, any one ofoperating expenses, which could result in a material adverse effect on our financial condition and results of operations. Similarly, the IRS has taken positions that the tax benefits under some of these programs should be calculated on an aggregate PEO, rather than individual client, basis, which can limit whether and how we obtain credits for our clients. We cannot predict how these positions will ultimately be resolved and if they are resolved unfavorably, we may be forced to discontinue supporting some or all of these programs, incur tax expenses that we cannot recover from our clients, and divert management’s attention to defending our positions, any one of which could have a material adverse effect on our ability to attract and retain SMB clients or on our business, financial condition and results of operations.
In addition, many states have also implemented assistance programs, such as mandatory employee leave requirements and other employment- and employment tax-related incentives. Our SMB clients rely on us to help them take advantage of these programs, and new laws, regulations and agency or judicial interpretations of these laws could change or eliminate existing programs at any time, which could force us to discontinue supporting these programs or incur liability that we cannot recover from our clients, which could cause us to lose clients and have a material adverse effect on our business, financial condition and results of operations.
Changing laws and regulations governing health insurance and other traditional employee benefits at the federal, state and local level could negatively affect our business.
Changes to and continued uncertainty regarding the implementation and future of health care reform in the United States, at the federal, state and local level, has the potential to substantially change the health insurance market for SMBs and how such employers provide health insurance to their employees, which could have a materially adverse effect on how we provide our sponsored health benefits to our WSEs,, and our ability to attract and retain our clients. In addition, changes at the federal, state and local level to the laws and regulations regarding other traditional employee benefits, such as retirement and workers’ compensation benefits, also have the potential to substantially change the types of benefit programs that are available to SMBs and that we and other PEOs may be required to offer.offer. Our ability to comply with, and adapt our service offerings to take advantage of, any such changes could require significant additional costs, divert management attention, or be prohibitive based on cost, technology or other factors, which could result in a material adverse effect on our business, financial condition and results of operations.
If we are not recognized as an employer of our worksite employees, and if our benefit plans are deemed to not satisfy plan requirements, under federal and state regulations, we and our clients could be adversely impacted.
In order to sponsor some of our most important employee benefit plan offerings for WSEs, including health plans, we must qualify as an employer of WSEs, for certain purposesand our plans must qualify as employer-sponsored plans, under applicable provisions of the Code and ERISA. In addition,particular, our status as the employer for the purposes of ERISA is important for purposes of ERISA’s preemption of certainbecause ERISA preempts state laws. laws that otherwise might apply to, and limit, our benefit plan offerings.
The definition of employer under various lawsthe Code and ERISA is not uniform and under both the Code and ERISA the term is defined in part by different facts and circumstances tests.
tests, and there is no definitive judicial interpretation of employer in the context of PEOs. Generally, thesethe tests used under the Code or ERISA are designed to evaluate whether an individual is an independent contractor or employee, and they provideconfer substantial weight to whether a purported employer has the right to direct and control the details of an individual's work. Some factors that may be considered important under these tests in evaluating these issues have included the employer’s degree of behavioral control (for example the extent of instructions, training and evaluation of the work), financial control and the economic aspects of the work relationship, the type of relationship, as evidenced by the specific contract, if any, whether employee benefits are provided, whether the work is indefinite in duration or project-based, and whether it is a regular part of the employer’s business. However, a definitive judicial interpretation of “employer” in the context of PEOs has not been established.
We believe that we qualify as the sole employer of WSEs for the purposes of Sections 3(5) and 3(40) of ERISA and as such that our health and welfare plans are single-employer plans that, as such, are entitled to ERISA’s preemption of state law. The DOL, however, has issued guidance that certain entities in the HR outsourcing industry do not qualify as common law employers. In addition,However, the DOL routinely audits employee benefit plan offerings of employers, and these audits can take years to complete. Onein one routine audit of ourone of TriNet’s health and welfare plans is currently under audit. As part of that audit,concluded in 2021, the DOL has indicated that while it agrees that we are an employer for ERISA purposes, the DOL has notedit believes that wherever there is more than one employer of a WSE, then neitherno employer may qualify as a single employer for ERISA purposes. Similarly, in 2022, the DOL revised an existing publication regarding regulation of MEWAs and added a new section stating its view that a PEO arrangement offering health coverage to more than one client is a MEWA under Section 3(40) of ERISA. This DOL interpretation is contrary to our interpretation of the applicable ERISA facts and circumstances test, and we understand it also is contrary to the position oftaken by other national PEOs.
We believewill continue to vigorously defend our position that we are the sole employer of our WSEs for the purposes of Sections 3(5) and 3(40) of ERISA, and we continue to engage with the DOL on the matter. While we will vigorously challenge any conclusion that we are not the single employer for the purposes of ERISA, and therefore that our health plans are not single-employersingle employer plans entitled to ERISA’s preemption of applicable state laws,laws. While we have no current DOL audit on-going, this issue and the final outcomeMEWA publication referenced above may arise in future audits of this matter is uncertain.TriNet plans or the plans of other PEOs in our industry. If it were ultimately determined that any health and welfare planplans sponsored by a PEO were a multiple-employer planTriNet are multiple employer plans and subject to potential regulation at athe state level, we would likely adjust our business model and the manner in which we provide employee health benefits to WSEs. Any such outcome or adjustment would require significant investment in time, cost and management attention and would have a material impact on our clients and WSEs and the type of products and services we provide to them, which could have a material adverse effect on our business and results of operations.
As an employer of WSEs under ERISA, we must manage our plans in accordance with ERISA requirements, which could impact how we fulfill plan obligations, how we price services, the features of our benefit plans, and how we administer and operate our plans. We believe that our benefit plans satisfy all applicable ERISA requirements, but if it were ultimately determined that we fail to satisfy any such requirements, we would likely be required to adjust our business model, including with respect to each of the areas outlined above, and could be subject to material fines or penalties. Any such consequence may result in a material adverse effect on our business and results of operations.
We have seen increased state efforts to regulate PEO health plans. For example, new legislation and proposed rules in New Mexico seek to prevent WSEs of small group employers from participation in PEO sponsored large group market health plans, with exception for plans the PEOs register as MEWAs under state law. These rules, and legislation, and any other new or changed rules that treat PEO health plans as multiple employer plans, restrict PEO fees with carriers or that limit the availability of PEO benefit plans, if upheld to be legally valid and applicable to our PEO health plans, would likely require us to adjust our business model in the states with such rules, including the manner in which we provide employee health benefits to WSEs and price our services, and could result in material fines or penalties. Any such outcome or adjustment would require significant investment in time, cost and management attention and would have a material impact on our clients and WSEs and the type of products and services we provide to them, which could have a material adverse effect on our business and results of operations.
Similarly, to qualify for favorable tax treatment under the Code, certain employee benefit plans, such as 401(k) retirement plans and cafeteria plans, must be established and maintained by an employer for the exclusive benefit of its employees. All of our 401(k) retirement plans are operated pursuant to guidance provided by the IRS and have
received favorable determination letters from the IRS confirming the qualified status of these plans.their tax-qualified status. However, the IRS uses its own complex, multi-factor test to ascertain whether an employment relationship exists between a worker and a purported employer. Although we believe that we qualify as an employer of WSEs under the Code, we cannot assure you that the IRS will not challenge our position or continue to provide favorable determination letters.
Moreover, the IRS' 401(k) guidance and qualification requirements are not applicable to the operation of our cafeteria plans.
IfFurther, if we are not recognized as an employer of our WSEs under the Code or by any state tax authority, we may be required to change the method by which we report and remit payroll taxes to the IRS or such tax authorities. Such changes could have a material adverse effect on our business and results of operations.
The definition of employers, employees and independent contractors is evolving. Changes to the laws and regulations that govern what it means to be an employer or an employee may require us to make significant changes in our operations and may negatively affect our business.
National viewsViews on employers, employees and independent contractors are changing at a rapid rate as evidenced by recentat federal, state and local levels. Any state rule changes. In September 2019, California passed AB5, a lawregulations that could potentially reclassify client independent contractors as employees. In November 2020, California voter passed Proposition 22, which supersedes AB5 for certain types of contractors. Changes like these to the rules in any jurisdiction that define when a worker is an employee or independent contractor can increase or decrease the pool of WSEs that we can co-employchange existing definitions and include in our TriNet sponsored benefit plans, which may negatively impact client demand for the services we provide, require us to modify or change how we operate our business and have a material adverse effect on our business and results of operations.
In January 2020, the DOL issued a new rule broadening the definition of joint employer that has been used under the Fair Labor Standards Act (FLSA) for more than sixty years. Joint employment is not the same as co-employment, and we do not believe that we are a joint employer under the new DOL rule or that this rule change impacts our status as a co-employer. While this rule has been partially vacated by a district court decision, these changes could still potentially result in increased FLSA jointemployment claims, which could divert management attention and cause us to incur additional and potentially material costs to defend.
The examples above highlight the impact to our business when regulations regarding the definitions or classificationclassifications of employers, employees and independent contractors and other groups of workers change. Any such regulatory changes could affect the types of client employees we can support through our PEO and HRIS services, the way in which we provide TriNet-sponsored benefits to our WSEs, the way in which we report and remit payroll taxes to tax authorities, and our legal liability for the actions and inactions of our clients. Any of such regulatory changes could alsoclients, which may negatively impact client demand for the services we provide, require us to modify or change the manner in whichhow we operate our business or provide our services, and could have ana material adverse effect on our business and results of operations.
At the federal level, the DOL published a final rule in January 2024 on independent contractor status. Meanwhile, the National Labor Relation Board (NLRB) modified its own independent contractor standard under the National Labor Relations Act (NLRA) in a decision published in June 2023. In August 2023, the DOL issue a Notice of Proposed Rulemaking addressing the salary requirements for white collar minimum wage and overtime exemptions under the FLSA. In October 2023, the NLRB issued a new standard setting forth its standards under the NLRA for determining joint employer status. Standards for determining joint employer status vary from law to law and state to state. Joint employment is not the same as co-employment, and we do not believe that we are a joint employer under any law or rule, or that these rule changes impact our status as a co-employer. However, continuing uncertainty regarding independent contractor and joint employer status could still result in increased regulatory and worker claims, which could divert management attention and cause us to incur additional and potentially material costs to defend.
Remote work continues to be widely used by employers across the country. The laws and regulations that govern employees were not drafted with remote workers in mind and changes in, uncertainty regarding, or adverse application of these laws could negatively affect our business.
More and more employees, including WSEs and HRIS Users, are working from home and SMBs, including our clients, are increasingly hiring employees in locations where they have not previously had employees and/or permitting existing employees to relocate to other locations and work entirely remotely. Other employees may work at home in one state or city some of the time and in an office in another state or city at other times. The work location and residence of an employee can create confusion regarding the federal, state and local laws that apply, including labor and employment, payroll and payroll tax, and unemployment laws. For example, it can be difficult to determine the amount of payroll and unemployment taxes that must be paid when employees spend part of their time working from home in one state and part of their time working in an office in another state. Regulations regarding payroll and unemployment taxes are still catching up to this new reality, which creates a risk that states will disagree about the taxes that must be paid, or the employment laws that must apply, in these situations. New laws, changes in laws or adverse application or interpretation of laws that depend on the residence and work location of WSEs and HRIS Users could reduce or eliminate the attractiveness of our services, significantly increase our compliance costs and the cost to provide our services, or require us to make substantial changes to the way in which we operate, and any one of these outcomes could result in a material adverse effect on our financial condition and results of operations.
Even where remote workers live and work in the same state and city, as a co-employer of WSEs, our PEO services are open to the risk that new laws, changes in laws or adverse application or interpretation of laws will expand PEO responsibility for remote WSEs.For example, during the COVID-19 pandemic we saw many states extend workers’ compensation coverage to remote employees and to COVID-19 claims. We expect to see additional, similar expansions of PEO responsibility and we cannot guarantee that we will be able to recover the costs to comply with such changes from our clients, which could have a material adverse effect on our business.
If we do not comply with our regulatory license requirements, or if we are deemed to be operating in various non-PEO licensed industries without the required licenses, we and our clients could be adversely impacted.
Most states require PEOs to hold a license and we are licensed as a PEO in all states that require such licenses. If we are not able to satisfy existing or future PEO licensing requirements or other applicable regulations in any state, we may be prohibited from doing business in that state, including having any clients within that state.
In addition, stateState regulatory authorities generally impose licensing requirements on companies acting as insurance agents or third-party administrators, such as those that handle health or retirement plan funding and claim processing. TriNet
does not provide broker insurance, but we do maintain producer licenses in all 50 states and select U.S. territories for our HRIS services and for our OMS product family, which offers clients the option to receive PEO services from TriNet while sponsoring their own health benefits obtained through brokers. Other state regulatory authorities impose licensing requirements on companies involved in the transmission of cash, such as banks, and other money transmitters. We do not believe that our current activities require any such licenses, but we and others in our industry have received inquiries from regulatory authorities in the past and could receive them in the future. Businesses similar to our HRIS services have been subject to such licensing requirements in the past and although we believe that our operations have been designed to be compliant and avoid such requirements, we cannot guarantee that all regulators will agree. If regulatory authorities in any state determine that we are acting as an insurance agent, third-party administrator, money transmitter, or as any other regulated industry other than a PEO, we may need to hire additional personnel to manage regulatory compliance and pay annual regulatory fees, which could have a material adverse effect on our financial condition and results of operations.
We are subject to legal and tax proceedings that may result in adverse outcomes.
We are subject to claims, lawsuits, government investigations, and other legal and regulatory proceedings arising from the ordinary course of our business. Refer to Note 109 in Part II, Item 8. Financial Statements and Supplementary Data, of this Form 10-K for additional information about the legal proceedings we are currently involved in and future proceedings that we may face. Current and future legal proceedings may result in substantial costs and may divert management’s attention and resources, which may seriously harm our business, results of operations, financial condition and liquidity.
In addition, the tax authorities in the U.S. regularly examine our tax returns. Refer to
Note 1312 in Part II, Item 8. Financial Statements and Supplementary Data, of this Form 10-K for additional details regarding our on-going tax examinations and disputes. The ultimate outcome of tax examinations and disputes cannot be predicted with certainty. Should the IRS or other tax authorities assess additional taxes as a result of theseany audit or other examinations,examination, we may be required to record charges to operations that could have a material impact on our results of operations, financial position or cash flows.Financial and Stock Ownership Risks
Our results of operations and stock price may fluctuate as a result of numerous factors, many of which are outside of our control.
Our future operating results and stock price are subject to fluctuations and quarterly variations based upon a variety of factors, many of which are not within our control, including, without limitation:
•the volume and severity of health and workers' compensation insurance claims made by our WSEs, recorded as part of our insurance costs, and the timing of related claims information provided by our insurance carriers,
���•the amount and timing of our insurance premiums and other insurance costs, operating expenses and capital expenditures,
•the number of our new clients and the number of WSEs or HRIS Users employed by each new client,
•the retention or loss of existing clients, for any reason, including third-party acquisition,
•a reduction in the number of WSEs or HRIS Users employed by existing clients,
•a reduction in the rate of WSE or HRIS User hiring by existing clients,
•the timing of client payments and payment defaults by clients,
•the costs associated with our acquisitions of companies, assets and technologies,
•any payments or draw downs on our credit facility,
•any unanticipated expenses, such as litigation or other dispute-related settlement payments and compliance expenses arising from changes in regulations or regulatory enforcement,
•any expenses we incur for geographic and service expansion and service enhancements,
•any changes in laws or adverse interpretation or enforcement of laws, which may require us to change the manner in which we operate and/or increase our regulatory compliance costs,
•any changes in our effective tax rate,
•the issuance of common stock or debt to pay for future acquisitions, which could dilute our stockholders or subject us to significant debt service obligations,
•the repurchase of our common stock under our stock repurchase program or otherwise, which could impact earnings per share and increase the ownership percentage of non-participating stockholders,
•amortization expense, or the impairment of intangible assets and goodwill, associated with past or future acquisitions, and
•the impact of new accounting pronouncements.
In addition, the trading price of our common stock is subject to fluctuation in response to a variety of factors, including the factors above and below, many of which are not within our control, including, without limitation:
•the overall performance of the equity markets,
•any trading activity, or a market expectation regarding such activity, by our directors, executive officers and significant stockholders,
•the economy as a whole, and its impact on SMBs and our clients,
•the performance and market perception of companies that investors believe are similar to us,
•changes in the interest rates and financial performance of our cash investments, which may increase during periods of high inflation and market volatility and impact our interest income,
•any significant changes in the liquidity of our common stock.stock, and
| | | | | |
RISK FACTORS•market acceptance of our performance across non-financial factors, including evolving environmental, social, and governance factors favored by investors and required by regulators. | |
Many of the above factors are discussed in more detail elsewhere in this Risk Factors section and in Part II, Item 7. MD&A, of this Form 10-K. Many of these factors are outside our control, and the variability and unpredictability of these factors have in the past and could in the future cause us to fail to meet our expectations and the expectations of investors and any industry analysts who cover our shares, which could result in a decline in our share price and reduced liquidity in our shares. In addition, the occurrence of one or more of these factors might cause our results of operations to vary widely, which could lead to negative impacts on our margins, short-term liquidity, and our ability to retain or attract key personnel, and could cause other unanticipated issues, including a downgrade of our securities by or change in opinion of industry analysts and a related decline in our share price.
The terms of our credit facility may restrict our current and future operations, which would impair our ability to respond to changes in our business and to manage our business.
Our credit facility contains, and any future indebtedness of ours would likely contain, a number of restrictive covenants that impose significant operating and financial restrictions on us subject to customary exceptions, including restricting our ability to:
•incur, assume or prepay debt or incur or assume liens,
•pay dividends or distributions or redeem or repurchase capital stock,
•make loans, investments or acquisitions,
•enter into sale-leaseback transactions,
•enter into new lines of business,
•complete a significant corporate transaction, such as a merger or sale of our company or its assets, and
•enter into agreements that prohibit the incurrence of liens or the payment by our subsidiaries of dividends and distributions.
Our failure to comply with these restrictions and the other terms and conditions under our credit facility could result in a default, which in turn could result in the termination of the lenders’ commitments to extend further credit to us under our credit facility and acceleration of a substantial portion of our indebtedness then outstanding under our credit facility. If that were to happen, we may not be able to repay all of the amounts that would become due under our indebtedness or refinance our debt, which could materially harm our business and force us to seek bankruptcy protection.
In July 2017, the head of the United Kingdom Financial Conduct Authority announced plans to phase out the use of LIBOR by the end of 2021. In November 2020, the ICE Benchmark Administration Limited extended the use of certain LIBOR values through June 2023. Our credit facility includes a LIBOR-indexed component and our lenders are not obligated to accept any LIBOR alternative that we may propose. However, we do not believe that the phase out of LIBOR will have a material effect on our operational or borrowing costs under our credit facility or any of our other business arrangements.
Atairos, our largest stockholder, may have significant influence over our Company, and the ownership of capital stock, and thus the voting control, of our Company remains concentrated in our executive officers, directors and their affiliates, which limits your ability to influence corporate matters.
On February 1, 2017, an entity affiliated with Atairos Group, Inc. (together with its affiliates, “Atairos”) became our largest stockholder when it acquired the shares of TriNet common stock previously held by General Atlantic. In connection with this transaction, we appointed Michael J. Angelakis, the Chairman and CEO of Atairos, to our board of directors and agreed to nominate Mr. Angelakis or another designee of Atairos reasonably acceptable to our Nominating and Corporate Governance Committee for election at future annual meetings until Atairos’ beneficial ownership falls below 15% of our common stock. As of January 31, 2021,2024, Atairos beneficially owned approximately 32%36% of our outstanding common stock, and all of our directors, executive officers and their affiliates, including Atairos, beneficially own, in the aggregate, approximately 39%37% of our outstanding common stock. As a result, Atairos, particularly when acting with our executive officers, directors and their affiliates, is able to exert substantial influence on all matters requiring stockholder approval, including the election of directors and approval of significant corporate transactions, such as a merger or other sale of our company or its assets. In addition, our stockholders have no assurances that Atairos’ holdings, or the holdings of our other large stockholders, in our common stock will not increase. This concentration of ownership could limit the ability of other stockholders to influence corporate matters and may have the effect of delaying or preventing a third party from acquiring control over us.
| | | | | | | | |
| PROPERTIES, LEGAL PROCEEDINGS AND MINE SAFETY DISCLOSURES | |
Item 1B. Unresolved Staff Comments
None.
Item 1C. Cybersecurity
Below is a discussion of our risk management and approach to governance as it relates to cyber risks. For additional information on the impact of cyber risks, refer to Part I, Item 1A. Risk Factors, of this Form 10-K, under the heading “Data Privacy and Security Risks”.
Cyber Risk Management and Strategy
Our Global Security program aims to safeguard critical assets through a risk-based approach to cybersecurity. The CSO provides leadership for the program. We employ a defense-in-depth strategy and has established a Security Risk Management Program. In that regard, we built a customized IRCF that was developed with the specific intent of keeping information assets secure and preventing technology resources from unauthorized disclosure, modification, deletion, and destruction. We have modeled our IRCF on several leading industry standards including portions of the NIST Cybersecurity Framework. The IRCF serves as an organizational model for governance and reporting and is reviewed annually.
Our Global Security Organization is responsible for the day-to-day execution of our cyber risk management strategy. This strategy has been incorporated into our overall ERM program and is thus informed by, and overseen through, our ERM program. Our ERM program facilitates identifying, prioritizing, analyzing and remediating enterprise risks, in which cyber risks are included. Within the broader ERM framework, we established a specific program - the IRM program - organizing the governance of risks associated with information held by us. The IRM Steering Committee, of which our CSO is a member, manages the IRM program, discusses the management of cyber risks on a regular cadence and substantive updates from the IRM Steering Committee are provided to the ERM Steering Committee. Finally, through our ERM program, updates and discussion regarding our cybersecurity risk management are provided to and occur at the Risk Committee of our Board of Directors.
To supplement our cyber risk management capabilities, we utilize certain third-party vendors. These vendors support our ability to proactively secure our network and systems, in addition to ongoing monitoring of our cyber environment. With respect to our management of cyber risks arising from third-party vendors, we utilize an internal risk assessment and monitoring program that includes the identification and ongoing review of third-party controls.
As part of our cyber risk management strategy, we established a process for identifying and assessing the material risk of cybersecurity incidents. In the event a cybersecurity incident is identified, the CIRT, which is made up of a cross-functional team, including technology, security, finance and legal professionals, acts in accordance with established processes. The CIRT convenes regular meetings to review and analyze relevant cybersecurity indicators and information. Utilizing an IRC, if it is determined that an incident needs to be reviewed for potential materiality, it is referred to our Chief Legal Officer who will engage the necessary or desirable cross functional professionals as needed in order to make a determination of materiality. We also seek to regularly update and upgrade our technology investments in an effort to further support our ability to identify and assess risks from cybersecurity incidents. We have not identified any cyber threats or incidents that have materially affected or are reasonably likely to materially affect us. For additional information on the potential impact of cybersecurity incidents on our business strategy, operations, or financial condition, refer to Part I, Item 1A. Risk Factors, of this Form 10-K, under the heading “Data Privacy and Security Risks”.
Cyber Risk Governance
Our Cyber Risk Management Strategy described in this Item 1C. is overseen by senior executives with experience in cybersecurity and our business operations and is ultimately overseen by the Risk Committee of the Board. Our Global Security Organization is tasked with executing this strategy through the implementation of cybersecurity policies, procedures, and strategies. In the event that a cybersecurity risk is identified, as and to the extent appropriate, the Global Security Organization manages the day-to-day response to such material risk and provides regular reports to the ERM Steering Committee, or the Risk Committee of the Board, or the Board, as appropriate. The CSO is also an advisor to the Company's Disclosure Committee, which meets quarterly.
On a quarterly basis, a meeting of the Risk Committee is convened to discuss and evaluate our management of enterprise-wide risks. Each meeting of the Risk Committee is facilitated by our Executive Director for ERM and includes programmatic updates from the CSO. The Risk Committee provides updates to the full Board of Directors regarding the state of the Company’s ERM program.
Cyber risks are an enterprise risk that the ERM Program monitors and thus such risks are an ongoing area of focus of the ERM Steering Committee and, as a result, the Risk Committee. On a monthly basis, the ERM Steering Committee is convened and receives pertinent updates regarding our management of cyber risks.
| | | | | | | | |
| PROPERTIES, LEGAL PROCEEDINGS AND MINE SAFETY DISCLOSURES | |
In addition to the regularly scheduled programmatic updates that are provided to the ERM Steering Committee and the Risk Committee, we also established a process to inform such committees of cybersecurity events and allow them to monitor corresponding remediation efforts. Specifically, the IRM Steering Committee, consisting of senior leaders from the security, privacy, data governance, technology, records management, and third-party risk management programs, reports to the ERM Steering Committee and has the responsibility to provide updates regarding the identification, management, and remediation of significant cybersecurity threats.
The ERM Steering Committee is similarly tasked with providing relevant updates to the Risk Committee regarding cybersecurity threats. Additionally, we have developed a process that is specific to the management and analysis of cybersecurity incidents. This process includes weekly and monthly updates from the CIRT along with escalation criteria that allows for incidents to be reviewed for materiality on an ad hoc basis. These updates are also provided to the ERM Steering Committee and the Risk Committee as necessary.
Our CSO leads our Global Security Organization which is responsible for overseeing the Company's cyber risk management strategy. Our CSO has over 20 years of industry experience, including serving in similar roles leading and overseeing cybersecurity programs at other companies. Team members who support our Global Security team have relevant educational and industry experience, including holding similar positions at other large companies.
Item 2. Properties
We lease space for our offices in various U.S. states, including the following:
| | | | | |
| Corporate Headquarters: | Significant Client Service Centers: |
| • Dublin, California | • Bradenton, Florida |
| • Reno, Nevada |
| • Indian Land, South Carolina |
| • Austin, Texas |
For more information regarding our leases, refer to Note 87 in Part II, Item 8. Financial Statements and Supplementary Data, of this Form 10-K. Item 3. Legal Proceedings
For the information required in this section, refer to Note 109 in Part II, Item 8. Financial Statements and Supplementary Data, of this Form 10-K. Item 4. Mine Safety Disclosures
Not applicable.
PART II
Item 5. Market for Registrant’s Common Equity, Related Stockholder Matters and Issuer Purchases of Equity Securities
Market Information and Holders of Record
Our common stock is traded on the New York Stock Exchange under the symbol “TNET”.
As of February 9, 2021,8, 2024, we had 3570 holders of record of our common stock per Computershare Trust Company N.A., our transfer agent. TheOur actual number of stockholders is greater than thisthe number of our record holders, andbecause it includes stockholders who are beneficial owners of our common stock, but whose shares are held in street name by brokers and other nominees. This number of holders of record also does not include stockholders whose shares may be held in a trust by other entities.
Dividend Policy
We did not declare or pay cash dividends in 20202023 or 2019. Payment of2022. The decision to pay cash dividends if any, in the future will beis made at the discretion of our board of directors and will depend on then-existing conditions, including our financial condition, operating results, contractual restrictions under our credit facility (refer to Note 98 in Part II, Item 8. Financial Statements and Supplementary Data, of this Form 10-K), capital requirements, business prospects and other factors our board of directors may deem relevant. Performance Graph
The graph on the following pagebelow compares the cumulative total return on our common stock since December 31, 20152018 with the cumulative total return on the S&P 500 Index and a Peer Group Index. The cumulative total return is based on the assumption that $100 had been invested in TriNet Group, Inc. common stock, the Standard & Poor'sPoor’s 500 Stock Index (S&P 500) and common stock of members of a Peer Group Index, all on December 31, 20152018 and that all quarterly dividends were reinvested. The cumulative dollar total returns shown on the graph represent the value that such investments would have had at each year end.
COMPARISON OF 5-YEAR CUMULATIVE TOTAL RETURN
Among TriNet Group, Inc., the S&P 500 Index, and a Peer Group(1)
(1) The Peer Group Index used in the chart above consists of the following companies:
| | | | | | | | |
| Automatic Data Processing, Inc. | Insperity, Inc. | Paychex, Inc. |
| Barrett Business Services, Inc. | Intuit, Inc. | |
Issuer Purchases of Equity Securities
The following table provides information about our purchases of TriNet common stock during the fourth quarter of 2020:2023:
| | | | | | | | | | | | | | |
| Period | Total Number of Shares Purchased (1) | Weighted Average Price Paid Per Share | Total Number of Shares Purchased as Part of Publicly Announced Plans (2) | Approximate Dollar Value of Shares that May Yet Be Purchased Under the Plans (in millions) (3) |
| October 1 - October 31, 2020 | 402,355 | | $ | 66.69 | | 402,355 | | $ | 374 | |
| November 1 - November 30, 2020 | 270,786 | | $ | 74.09 | | 216,181 | | $ | 358 | |
| December 1 - December 31, 2020 | 49,275 | | $ | 80.87 | | — | | $ | 358 | |
| Total | 722,416 | | | 618,536 | | |
| | | | | | | | | | | | | | |
| Period | Total Number of Shares Purchased (2) | Weighted Average Price Paid Per Share | Total Number of Shares Purchased as Part of Publicly Announced Plans (1) | Approximate Dollar Value of Shares that May Yet Be Purchased Under the Plans (in millions) (3) |
| October 1 - October 31, 2023 | 98,722 | | $ | 109.78 | | 98,390 | | $ | 435 | |
| November 1 - November 30, 2023 | 77,037 | | $ | 109.28 | | 24,717 | | $ | 433 | |
| December 1 - December 31, 2023 | 75,899 | | $ | 118.96 | | — | | $ | 433 | |
| Total | 251,658 | | | 123,107 | | |
(1) In May 2014, our board of directors approved a stock repurchase program pursuant to which we are authorized to repurchase our common stock in privately negotiated and/or open market transactions, including under plans complying with Rule 10b5-1 under the Securities Exchange Act of 1934. From time to time, our board of directors authorizes increases to our stock repurchase program and has approved an aggregate total of $951$2,715 million as of December 31, 2020.2023. The total remaining authorization for future stock repurchases under our stock repurchase program was $358$433 million as of December 31, 2020.2023. The program does not have an expiration date.
(2) Includes shares surrendered by employees to us to satisfy tax withholding obligations that arose upon vesting of restricted stock units granted pursuant to approved plans.
(3) We repurchased a total of approximately $43$13 million of our outstanding stock during the three months ended December 31, 2020.2023.
We use our stock repurchase program to return value to our stockholders and to offset dilution from the issuance of stock under our equity-based incentive plans and employee purchase plan. As part of our stock repurchase program, we repurchased approximately $178 million$1.1 billion of our common stock in 2020 using existing cash and cash equivalents through our Rule 10b5-1 plan.2023. We plan to use current cash and cash generated from ongoing operating activities to fund our stock repurchase program.
Under our previously announced tender offer which concluded in the third quarter of 2023, we purchased 5,981,308 of our shares for an aggregate cost of approximately $640 million, including fees and expenses. Concurrently, through a purchase agreement with our largest stockholder, Atairos Group, Inc we purchased 3,364,486 of our shares for approximately $360 million, including fees and expenses.
Our stock repurchases are subject to certain restrictions under the terms of our credit facility. For more information about our stock repurchases and the restrictions imposed by our credit facility, refer to Note 128 and Note 11 in Part II, Item 8. Financial Statements and Supplementary Data, of this Form 10-K.
| | | | | |
| MANAGEMENT'S DISCUSSION AND ANALYSIS | |
Item 7. Management’s Discussion and Analysis of Financial Condition and Results of Operations
Operational Highlights
Our consolidated results for 20202023 reflect our continuing efforts to serve our existing clients, throughout the COVID-19 pandemic. In response, we took the following actions:attract new clients and invest in our platform.
During 2023 we:
•launched our COVID-19 Preparedness Center, which provides ongoingimproved sales performance and timely webinars, information, resources and offerings to clients and other SMBs to help them navigate the rapidly changing and complicated COVID-19 business landscape,customer retention,
•helped our clients navigate the various small business relief loan programs through informational webinars and PPP loan application support initiatives,
•hosted the first annual TriNet PeopleForce, our virtual client and prospect conference, where we provided insights, thought leadership and recommendations for the challenges they face,
•enacted new programs in response to the FFCRA and CARES Act to enable new employee paid sick leave and expanded family and medical leave, payroll tax deferral and tax credit programs and other employment and non-employment tax-related incentives for our clients,
•facilitated access to alternative health plan options in addition to COBRA, and
•implemented and extended our remote working and office closures around the country for non-essential activities.
During 2020 we:
•continued to grow ourtotal revenues, although at a slower rate than we initially expected due to the impact from COVID-19 on both new salesmanage expense prudently, and our clients,grow earnings per share,
•createdutilized our Recovery Credit programscale and knowledge to assist our eligiblePEO and HRIS clients resultingduring and following the liquidity challenges in a reduction in revenue recognized,regional banks ensuring that our clients were able to successfully run payroll during that time,
•sawexecuted a series of transactions to rebalance our WSEs increasing their participation, or enrollment,capital structure in order to enhance our insurance offerings,leverage ratios, including:
◦issued $400 million of our senior unsecured notes maturing in August 2031,
◦executed our 2021 Credit Amendment, to among other things (1) increase the aggregate capacity under our 2021 Revolver from $500 million to $700 million, and (2) extend the maturity date of our 2021 Revolver to August 16, 2028,
◦completed approximately $1 billion in share repurchases of TriNet common stock through a public tender offer in August and a private repurchase from our largest stockholder, Atairos Group, Inc. in September,
•experienced lower utilization of health services primarily inhosted the second quarter, although utilization approached more typical levels through the second half of the year,
•completed the acquisition of Little Bird HR, Inc., expanding4th TriNet PeopleForce, our footprint in our non-profit vertical,
•launched the extension of our People Matter branding campaign - Humanity Campaign,showcase client and prospect conference focused on business transformation, agility and innovation for SMBs, and
•delivered profitable growth as a resultsuccessfully completed the migration of revenue growth and lower insurance costs.our general business applications to the cloud.
Performance Highlights
These operational achievements drove the financial performance improvements noted below in 2020 when compared to 2019:
| | | | | | | | | | | | | | | | | | | | | | | | | | |
| $4.0B | | $368M | | $1.1B |
| Total revenues | | Operating income | | Net Service Revenue * |
| 5 | % | increase | | 37 | % | increase | | 14 | % | increase |
| | | | | | | | |
| $272M | | $3.99 | | $303M |
| Net income | | Diluted EPS | | Adjusted Net income * |
| 28 | % | increase | | 34 | % | increase | | 28 | % | increase |
| | | | | | | | |
| * | Non-GAAP measure | | | | | | |
| | | | | |
| MANAGEMENT'S DISCUSSION AND ANALYSIS | |
Performance Highlights
Our results for WSEs in 20202023 when compared to the prior year were:2022 are noted below:
| | | | | | | | | | | | | | | | | | | | | | | | | | |
| 323,672 | | 331,908 | | |
| Average WSE | | Total WSE | | |
| — | % | no change | | (2) | % | decrease | | | |
| | | | | | | | |
| | | | | | | | | | | | | | | | | | | | | | | | | | |
| $4.9B | | $469M | | 84% |
| Total revenues | | Operating income | | Insurance cost ratio |
| 1 | % | increase | | (6) | % | decrease | | 0 | % | flat |
| | | | | | | |
| $375M | | $6.56 | | $446M |
| Net income | | Diluted EPS | | Adjusted Net income * |
| 6 | % | increase | | 17 | % | increase | | 0 | % | flat |
During 2020, our average WSEs remained flat and total WSEs declined primarily as a result of the impact of COVID-19 on our clients and new sales. We experienced significant client and WSE attrition during the second quarter, driving our total WSEs down to 313,104 at June 30, 2020, before increasing due to a return to hiring by our existing clients in the third and fourth quarters. New sales also contributed to the return to growth, albeit at lower volumes than in previous years. | | | | | | | | | | | | | | | | | | | | | | | | | | | | | | |
| 331,423 | | 347,542 | | 215,295 | | | |
| Average WSE ** | | Total WSE ** | | Average HRIS Users | | | |
| (5) | % | decrease | | 0 | % | flat | | (13) | % | decrease | | | | |
| * | | |
| ** | Total WSEs includes approximately 12,000 incremental WSEs for December 31, 2023 and Average WSEs includes approximately 4,000 incremental WSEs for the fourth quarter of 2023 (1,000 for the full year 2023) that were charged a platform user access fee. Additionally, Total WSEs includes approximately 4,500 incremental WSEs for December 31, 2023 and Average WSEs includes approximately 4,800 for the fourth quarter of 2023 (1,500 for the full year 2023) additional service recipients. These were identified as a result of our ongoing effort to ensure that our billing practices best match the expectations of our customers. For details, refer to the heading "Operating Metrics – Worksite Employees (WSEs).” | |
Our total revenues grewincreased 1%, primarily driven by 5% primarily due to the change in our mix of WSEs andinflationary rate increases, partially offset by the Recovery Credit recognized. During 2020, we recognized a $128 million reductionlower volume due to decreases in total revenues for the Recovery Credit, allocated proportionally to PSR and ISR. The Recovery Credit is a program designed to assist the economic recovery of our existing SMB clients, by providing one-time reductions against fees for future services.Average WSEs.
Our total revenue increasedAverage WSEs decreased 5% and Total WSEs was approximately flat year over year. The decrease in Average WSEs was primarily due to the cumulative impact of lower hiring in our installed base during the past twelve months, particularly within our Technology vertical, which did not offset our attrition. This trend was partially offset by stronger new client additions and retention during the year.
Our ICR was approximately flat year over year as health insurance costs grew at a higherfaster rate than ourhealth ISR, partially offset by favorable workers' compensation prior period claims development.
Higher revenues and interest income, partially offset by higher health insurance costs and OE, resultingoperating expenses from our investments in year-over-year increasessales and marketing, resulted in ourthe 6% increase in net income. Adjusted Net Service Revenue,income was flat as the increase in net income was offset by lower transaction and adjusted net income of 14%, 28% and 28%, respectively.integration costs as compared to 2022.
| | | | | |
| MANAGEMENT'S DISCUSSION AND ANALYSIS | |
Results of Operations
The following table summarizes our results of operations for the three years ended December 31, 2020, 20192023, 2022 and 2018.2021. For details of the critical accounting judgments and estimates that could affect the Results of Operations, see the Critical Accounting Judgments and Estimates section within MD&A. | | | | Year Ended December 31, | % Change | | Year Ended December 31, | % Change |
| (in millions, except operating metrics data) | (in millions, except operating metrics data) | 2020 | 2019 | 2018 | 2020 vs. 2019 | 2019 vs. 2018 | (in millions, except operating metrics data) | 2023 | 2022 | 2021 | 2023 vs. 2022 | 2022 vs. 2021 |
| Income Statement Data: | Income Statement Data: | |
| Professional service revenues | |
| Professional service revenues | |
| Professional service revenues | Professional service revenues | $ | 544 | | $ | 530 | | $ | 487 | | 3 | % | 9 | % | $ | 756 | | $ | 754 | | $ | 639 | | — | — | % | 18 | % |
| Insurance service revenues | Insurance service revenues | 3,490 | | 3,326 | | 3,016 | | 5 | | 10 | |
| Total revenues | Total revenues | 4,034 | | 3,856 | | 3,503 | | 5 | | 10 | |
| Insurance costs | Insurance costs | 2,979 | | 2,927 | | 2,610 | | 2 | | 12 | |
| Operating expenses | Operating expenses | 687 | | 661 | | 642 | | 4 | | 3 | |
| Total costs and operating expenses | Total costs and operating expenses | 3,666 | | 3,588 | | 3,252 | | 2 | | 10 | |
| Operating income | Operating income | 368 | | 268 | | 251 | | 37 | | 7 | |
| Other income (expense): | Other income (expense): | |
| Interest expense, bank fees and other | Interest expense, bank fees and other | (21) | | (21) | | (22) | | — | | (5) | |
| Interest expense, bank fees and other | |
| Interest expense, bank fees and other | |
| Interest income | Interest income | 10 | | 23 | | 12 | | (57) | | 92 | |
| | | Income before provision for income taxes | |
| | Income before provision for income taxes | |
| | Income before provision for income taxes | Income before provision for income taxes | 357 | | 270 | | 241 | | 32 | | 12 | |
| Income taxes | Income taxes | 85 | | 58 | | 49 | | 47 | | 18 | |
| Net income | Net income | $ | 272 | | $ | 212 | | $ | 192 | | 28 | % | 10 | % | Net income | $ | 375 | | $ | 355 | | $ | 338 | | 6 | 6 | % | 5 | % |
| | | Cash Flow Data: | |
| | Cash Flow Data: | |
| | Cash Flow Data: | |
| Net cash provided by operating activities | |
| Net cash provided by operating activities | |
| Net cash provided by operating activities | | 545 | | 562 | | 218 | | (3) | % | 158 | % |
| Net cash used in investing activities | |
| Net cash provided by (used in) financing activities | |
| Non-GAAP measures (1): | Non-GAAP measures (1): | |
| Net Service Revenues | $ | 1,055 | | $ | 929 | | $ | 893 | | 14 | % | 4 | % |
| Net Insurance Service Revenues | 511 | | 399 | | 406 | | 28 | | (2) | |
| Net Insurance Margin | 15 | % | 12 | % | 13 | % | 3 | | (1) | |
Non-GAAP measures (1): | |
Non-GAAP measures (1): | |
| | Adjusted EBITDA | |
| | Adjusted EBITDA | |
| | Adjusted EBITDA | Adjusted EBITDA | 468 | | 378 | | 347 | | 24 | | 9 | | 697 | | 688 | 688 | | 565 | 565 | | 1 | 1 | % | 22 | % |
| Adjusted Net income | Adjusted Net income | 303 | | 236 | | 218 | | 28 | | 8 | |
| Corporate Operating Cash Flow | |
| | Operating Metrics: | Operating Metrics: | |
| Average WSEs | 323,672 | | 324,927 | | 317,104 | | — | % | 2 | % |
| Total WSEs | 331,908 | | 340,017 | | 325,616 | | (2) | | 4 | |
| Operating Metrics: | |
| Operating Metrics: | |
| Insurance Cost Ratio | |
| Insurance Cost Ratio | |
| Insurance Cost Ratio | | 84 | % | 84 | % | 86 | % | — | % | (2) | % |
Average WSEs (2) | |
Total WSEs (2) | |
Average HRIS Users (3) | | Average HRIS Users (3) | 215,295 | | 248,496 | | N/A | (13) | | N/A |
|
(1) Refer to Non-GAAP measures definitions and reconciliations from GAAP measures below.under the heading "Non-GAAP Financial Measures".
(2) Total WSEs includes approximately 12,000 incremental WSEs for December 31, 2023 and Average WSEs includes approximately 4,000 incremental WSEs for the fourth quarter of 2023 (1,000 for the full year 2023) that were charged a platform user access fee. Additionally, Total WSEs includes approximately 4,500 incremental WSEs for December 31, 2023 and Average WSEs includes approximately 4,800 for the fourth quarter of 2023 (1,500 for the full year 2023) additional service recipients. These were identified as a result of our ongoing effort to ensure that our billing practices best match the expectations of our customers. For details, refer to the heading "Operating Metrics – Worksite Employees (WSEs).”
(3) For the year ended December 31, 2022, reflects HRIS Users from February 15, 2022, the date on which we acquired Zenefits, to the end of the period.
The following table summarizes our balance sheet data as of December 31, 2023, 2022 and 2021.
| | | | | | | | | | | | | | | | | |
| | Year Ended December 31, | % Change |
| (in millions) | 2023 | 2022 | 2021 | 2023 vs. 2022 | 2022 vs. 2021 |
| Balance Sheet Data: | | | | | |
| Cash and cash equivalents | $ | 287 | | $ | 354 | | $ | 612 | | (19) | % | (42) | % |
| Working capital | 115 | | 338 | | 700 | | (66) | % | (52) | % |
| Total assets | 3,693 | | 3,443 | | 3,309 | | 7 | % | 4 | % |
| Debt | 1,093 | | 496 | | 495 | | 120 | % | — | % |
| Total stockholders’ equity | 78 | | 775 | | 881 | | (90) | % | (12) | % |
| | | | | |
| MANAGEMENT'S DISCUSSION AND ANALYSIS | |
A discussion regarding our financial condition and results of operations for 20192022 compared to 20182021 can be found under Part II, Item 7. Management's Discussion and Analysis in our Annual Report on Form 10-K for the year ended December 31, 2019,2022, filed with the SEC on February 13, 2020.15, 2023. Non-GAAP Financial Measures
In addition to financial measures presented in accordance with GAAP, we monitor other non-GAAP financial measures that we use to manage our business, to make planning decisions, to allocate resources and to use as performance measures in our executive compensation plan. These key financial measures provide an additional view of our operational performance over the long-term and provide information that we use to maintain and grow our business.
The presentation of these non-GAAP financial measures is used to enhance the understanding of certain aspects of our financial performance. It is not meant to be considered in isolation from, superior to, or as a substitute for the directly comparable financial measures prepared in accordance with GAAP.
| | | | | | | | |
| Non-GAAP Measure | Definition | How We Use The Measure |
| Net Service Revenues | • Sum of professional service revenues and Net Insurance Service Revenues,
or total revenues less insurance costs.
| • Provides a comparable basis of revenues on a net basis. Professional service revenues are represented net of client payroll costs whereas insurance service revenues are presented gross of insurance costs for financial reporting purposes.
• Acts as the basis to allocate resources to different functions and evaluates the effectiveness of our business strategies by each business function.
• Provides a measure, among others, used in the determination of incentive compensation for management.
| Net Insurance Service Revenues | • Insurance service revenues less insurance costs. | • Is a component of Net Service Revenues.
• Provides a comparable basis of revenues on a net basis. Professional service revenues are represented net of client payroll costs whereas insurance service revenues are presented gross of insurance costs for financial reporting purposes. Promotes an understanding of our insurance services business by evaluating insurance service revenues net of our WSE related costs which are substantially pass-through for the benefit of our WSEs. Under GAAP, insurance service revenues and costs are recorded gross as we have latitude in establishing the price, service and supplier specifications.
| | |
Net Insurance Margin | • Net Insurance Margin (NIM) is the ratio of Net Insurance Services Revenues to insurance service revenues. | • Provides a comparable basis of Net Insurance Service Revenues relative to insurance service revenues. Promotes an understanding of our pricing to risk performance. |
| | | | | |
MANAGEMENT'S DISCUSSION AND ANALYSIS | |
| | | | | | | | |
| Adjusted EBITDA | • Net income, excluding the effects of: - income tax provision, - interest expense, bank fees and other, - depreciation, - amortization of intangible assets, and - stock based compensation expense.expense, - amortization of cloud computing arrangements, and - transaction and integration costs.
| • Provides period-to-period comparisons on a consistent basis and an understanding as to how our management evaluates the effectiveness of our business strategies by excluding certain non-recurring costs, which include transaction and integration costs, as well as certain non-cash charges such as depreciation and amortization, and stock basedstock-based compensation and certain impairment charges recognized based on the estimated fair values. We believe these charges are either not directly resulting from our core operations or not indicative of our ongoing operations.
• Enhances comparisons to prior periods and, accordingly, facilitates the development of future projections and earnings growth prospects.
• Provides a measure, among others, used in the determination of incentive compensation for management.
• We also sometimes refer to Adjusted EBITDA margin, which is the ratio of Adjusted EBITDA to Net Service Revenue.total revenues. |
| Adjusted Net Income | • Net income, excluding the effects of: - effective income tax rate (1), - stock based compensation, - amortization of intangible assets, net, - non-cash interest expense (2), - transaction and integration costs, and - the income tax effect (at our effective tax rate (1)) of these pre-tax adjustments. | • Provides information to our stockholders and board of directors to understand how our management evaluates our business, to monitor and evaluate our operating results, and analyze profitability of our ongoing operations and trends on a consistent basis by excluding certain non-cash charges. |
| Corporate Operating Cash Flows | • Net cash provided by (used in) provided by operating activities, excluding the effects of:
- Assets associated with WSEs (accounts receivable, unbilled revenue, prepaid expenses, other payroll assets and other current assets) and
- Liabilities associated with WSEs (client deposits and other client liabilities, accrued wages, payroll tax liabilities and other payroll withholdings, accrued health benefitinsurance costs, accrued workers' compensation costs, insurance premiums and other payables, and other current liabilities).
| • Provides information that our stockholders and management can use to evaluate our cash flows from operations independent of the current assets and liabilities associated with our WSEs.
• Enhances comparisons to prior periods and, accordingly, used as a liquidity measure to manage liquidity between corporate and WSE related activities, and to help determine and plan our cash flow and capital strategies.
|
| | |
(1) We have adjusted our non-GAAPNon-GAAP effective tax rate tois 25.6% for 2023, and 25.5%, 25.5%, for 2022 and 26.0% for 2020, 2019 and 2018, respectively. These non-GAAP effective tax rates exclude2021, which excludes the income tax impact from stock basedstock-based compensation, changes in uncertain tax positions, and nonrecurring benefits or expenses from federal legislative changes.
(2) Non-cash interest expense represents amortization and write-off of our debt issuance costs.costs and loss on a terminated derivative.
| | | | | |
| MANAGEMENT'S DISCUSSION AND ANALYSIS | |
Reconciliation of GAAP to Non-GAAP Measures
The table below presents a reconciliation of Total revenues to Net Service Revenues:
| | | | | | | | | | | | | |
| Year Ended December 31, |
| (in millions) | 2020 | 2019 | 2018 | | |
| Total revenues | $ | 4,034 | | $ | 3,856 | | $ | 3,503 | | | |
| Less: Insurance costs | 2,979 | | 2,927 | | 2,610 | | | |
| Net Service Revenues | $ | 1,055 | | $ | 929 | | $ | 893 | | | |
The table below presents a reconciliation of Insurance service revenues to Net Insurance Service Revenues:
| | | | | | | | | | | | | |
| Year Ended December 31, |
| (in millions) | 2020 | 2019 | 2018 | | |
| Insurance service revenues | $ | 3,490 | | $ | 3,326 | | $ | 3,016 | | | |
| Less: Insurance costs | 2,979 | | 2,927 | | 2,610 | | | |
| Net Insurance Service Revenues | $ | 511 | | $ | 399 | | $ | 406 | | | |
| Net Insurance Margin | 15 | % | 12 | % | 13 | % | | |
| | | | | |
MANAGEMENT'S DISCUSSION AND ANALYSIS | |
The table below presents a reconciliation of Net income to Adjusted EBITDA:
| | Year Ended December 31, |
| Year Ended December 31, | |
| Year Ended December 31, | |
| Year Ended December 31, | |
| (in millions) | (in millions) | 2020 | 2019 | 2018 | |
| Net income | Net income | $ | 272 | | $ | 212 | | $ | 192 | | |
| Net income | |
| Net income | |
| Provision for income taxes | |
| Provision for income taxes | |
| Provision for income taxes | Provision for income taxes | 85 | | 58 | | 49 | | |
| Stock based compensation | Stock based compensation | 43 | | 41 | | 44 | | |
| Interest expense and bank fees | 21 | | 21 | | 22 | | |
| Depreciation and amortization of intangible assets | 47 | | 46 | | 40 | | |
| Stock based compensation | |
| Stock based compensation | |
Interest expense, bank fees and other (1) | |
Interest expense, bank fees and other (1) | |
Interest expense, bank fees and other (1) | |
Depreciation and amortization of intangible assets (2) | |
Depreciation and amortization of intangible assets (2) | |
Depreciation and amortization of intangible assets (2) | |
| Amortization of cloud computing arrangements | |
| Amortization of cloud computing arrangements | |
| Amortization of cloud computing arrangements | |
| Transaction and integration costs | |
| Transaction and integration costs | |
| Transaction and integration costs | |
| | Adjusted EBITDA | |
| | Adjusted EBITDA | |
| | Adjusted EBITDA | Adjusted EBITDA | $ | 468 | | $ | 378 | | $ | 347 | | |
| Adjusted EBITDA Margin | Adjusted EBITDA Margin | 44 | % | 41 | % | 39 | % | |
| Adjusted EBITDA Margin | |
| Adjusted EBITDA Margin | |
(1) 2022 Interest expense, bank fees and other includes $17M of realized investments losses on sales and impairments related to AFS securities.
(2) Amount includes impairment of customer relationship intangibles in 2021.
The table below presents a reconciliation of Net income to Adjusted Net Income:
| | Year Ended December 31, |
| Year Ended December 31, | |
| Year Ended December 31, | |
| Year Ended December 31, | |
| (in millions) | (in millions) | 2020 | 2019 | 2018 | |
| Net income | Net income | $ | 272 | | $ | 212 | | $ | 192 | | |
| Net income | |
| Net income | |
| Effective income tax rate adjustment | |
| Effective income tax rate adjustment | |
| Effective income tax rate adjustment | Effective income tax rate adjustment | (6) | | (11) | | (13) | | |
| Stock based compensation | Stock based compensation | 43 | | 41 | | 44 | | |
| Amortization of intangible assets | 5 | | 5 | | 5 | | |
| | Stock based compensation | |
| Stock based compensation | |
Amortization of other intangible assets, net (¹) | |
Amortization of other intangible assets, net (¹) | |
Amortization of other intangible assets, net (¹) | |
| Non-cash interest expense | Non-cash interest expense | 1 | | 1 | | 4 | | |
| Non-cash interest expense | |
| Non-cash interest expense | |
| Transaction and integration costs | |
| Transaction and integration costs | |
| Transaction and integration costs | |
| Income tax impact of pre-tax adjustments | |
| Income tax impact of pre-tax adjustments | |
| Income tax impact of pre-tax adjustments | Income tax impact of pre-tax adjustments | (12) | | (12) | | (14) | | |
| Adjusted Net Income | Adjusted Net Income | $ | 303 | | $ | 236 | | $ | 218 | | |
| Adjusted Net Income | |
| Adjusted Net Income | |
(1) Amount includes impairment of customer relationship intangibles in 2021.
The table below presents a reconciliation of net cash (used in) provided by operating activities to Corporate Operating Cash Flows:
| | Year Ended December 31, |
| Year Ended December 31, | |
| Year Ended December 31, | |
| Year Ended December 31, | |
| (in millions) | (in millions) | 2020 | 2019 | 2018 | |
| Net cash (used in) provided by operating activities | $ | 546 | | $ | 471 | | $ | (104) | | |
| Net cash provided by operating activities | |
| Net cash provided by operating activities | |
| Net cash provided by operating activities | |
| Less: Change in WSE related other current assets | |
| Less: Change in WSE related other current assets | |
| Less: Change in WSE related other current assets | Less: Change in WSE related other current assets | 10 | | 15 | | (33) | | |
| Less: Change in WSE related liabilities | Less: Change in WSE related liabilities | 198 | | 223 | | (305) | | |
| Less: Change in WSE related liabilities | |
| Less: Change in WSE related liabilities | |
| Net cash (used in) provided by operating activities - WSE | |
| Net cash (used in) provided by operating activities - WSE | |
| Net cash (used in) provided by operating activities - WSE | Net cash (used in) provided by operating activities - WSE | $ | 208 | | $ | 238 | | $ | (338) | | |
| Net cash provided by operating activities - Corporate | Net cash provided by operating activities - Corporate | $ | 338 | | $ | 233 | | $ | 234 | | |
| Net cash provided by operating activities - Corporate | |
| Net cash provided by operating activities - Corporate | |
| | | | | |
| MANAGEMENT'S DISCUSSION AND ANALYSIS | |
Operating Metrics
Worksite Employees (WSE)
Average WSE growthchange is a volume measure we use to monitor the performance of our PEO business. DuringOur PEO clients generally change their payroll service providers at the secondbeginning of the payroll tax and benefits enrollment year; as a result, we have historically experienced our highest volumes of new PEO clients joining and existing clients terminating in the month of January. PEO client attrition, new PEO client additions and changes in employment levels within our installed PEO client base all impact our Average WSEs and Total WSEs as we move through a calendar year.
We support WSEs from the date on which their co-employment with TriNet commences through the end of their co-employment with TriNet and also after their co-employment period. We define WSEs to include co-employees and other individuals receiving PEO services, such as individuals who receive COBRA benefits post co-employment or are subject to K-1 tax reporting as well as individuals who utilize our PEO platform on behalf of TriNet PEO clients. As part of an ongoing effort to ensure that our billing practices best match the expectations of our customers, in the third quarter of 2023 we experienced significant attrition attributabledetermined that certain individuals such as those described above and certain co-employees were not previously or consistently counted in Total WSEs and Average WSEs.] This resulting adjustment increased our reported Total WSEs by approximately 4,500 for December 31, 2023 and Average WSEs by approximately 4,800 and 1,500 for the fourth quarter of 2023 and the full year 2023, respectively. We intend to continue our ongoing effort to ensure that our billing practices best match the expectations of our customers and in the future we may identify additional individuals that should be included in Total WSEs and Average WSEs.
In December 2023, we implemented a platform user access fee to charge clients for those users of our PEO platform that may not be co-employed by us and to charge clients for co-employees for whom payroll may not be regularly run. In addition to co-employees for whom payroll may not be regularly run, this includes individuals authorized by our clients to access and use the PEO platform for functions such as bookkeeping and benefits management. The amount of the fee is comparable to the impactfee we charge for users of COVID-19. Throughoutour HRIS platform. While the second halfamount of 2020,revenue we recognized in 2023 for this service was not significant, these users of the PEO platform for whose access we charged this fee increased our clientreported Total WSEs by approximately 12,000 as of December 31, 2023 and Average WSEs by approximately 4,000 and 1,000 for the fourth quarter of 2023 and the full year ended December 31, 2023, respectively.
The effect of this new fee is that we are now receiving revenue from two types of users on our PEO platform, those that are co-employed in our PEO business and those that are utilizing our PEO platform, albeit in a more limited fashion. The table below illustrates how those two components comprise our Total WSE and Average WSE metrics.
| | | | | | | | | | | | | | | | | |
| | Year Ended December 31, | % Change |
| 2023 | 2022 | 2021 | 2023 vs. 2022 | 2022 vs. 2021 |
| | | | | |
| Average WSEs | 331,423 | | 348,543 | | 340,067 | | (5) | | 2 | |
| Co-Employed | 330,423 | | 348,543 | | 340,067 | | (5) | | 2 | |
| PEO Platform Users | 1,000 | | N/A | N/A | N/A | N/A |
| Total WSEs | 347,542 | | 348,652 | | 364,940 | | — | | (4) | |
| Co-Employed | 335,543 | | 348,652 | | 364,940 | | (4) | | (4) | |
| PEO Platform Users | 11,999 | | N/A | N/A | N/A | N/A |
| | | | | |
Average WSEs decreased 5% when comparing 2023 to 2022, primarily due to lower hiring in our installed base recovered and returned to hiring, primarily inacross most verticals during the past twelve months, especially within our Technology vertical. Our attrition abated as our clients accessed available business relief measures. This return to hiring paired withmarket trend was partially offset by strong new sales, albeit at lower rates thanclient additions and improved client retention in previous years, resulted in growth in our WSEs from the low of 313,104 total WSEs at June 30, 2020. As a result, average WSEs was flat in 2020.2023.
Total WSEs can be used to estimate our beginning WSEs for the next period and, as a result, can be used as an indicator of our potential future success in generating revenue, growing our business and retaining clients. DespiteTotal WSEs was flat when comparing 2023 to 2022 due to the challenging economic environmentcombined effects of lower hiring by our clients and net client attrition over the past year being, offset by the combined effect of improvements in new client additions and improved client retention during 2023 and the impact of COVID-19, Totaladditional WSEs declined by only 2% after accounting for favorable retention of clients that value our full service offerings, our clients' return to hiring, and our acquisition of Little Bird.described above.
Anticipated revenues for future periods can diverge from the revenue expectation derived from Average WSEs or Total WSEs due to pricing differences across our HRHCM solutions and services and the degree to which clients and
| | | | | |
| MANAGEMENT'S DISCUSSION AND ANALYSIS | |
WSEs elect to participate in our solutions during future periods. In addition to focusing on growing our Average WSE and Total WSE counts, we also focus on pricing strategies, benefit participation and service differentiation to expand the value we provide to our clients and our resulting revenue opportunities. We report the impact of client and WSE participation differences as a change in mix.
We continue to invest in efforts intended to enhance client experience, improve our new sales performance, and manage client attrition, through product development as well as operational and process improvements. As we continue our work in combining our PEO platform and our HRIS SaaS capabilities into a single platform, these various types of TriNet users will all be served from the same platform. In addition to focusing on retaining and growing our WSE base, we continue to review acquisition opportunities that would add appropriately toexpand our scale. We continue to invest in efforts intended to enhance client experiences, through operationalproduct offering and process improvements and to manage attrition that we believe we will experience as a result of the COVID-19 pandemic.provide further scale.
HRIS Users
| | | | | |
| |
|
|
|
|
|
|
|
|
|
|
|
|
|
| Average WSE represents average monthly | Total WSE represents WSEs paid |
| WSEs paid during the year | at period end |
| Average WSE change | Total WSE change |
| 2020 | 2020 |
| —% | (2)% |
Insurance Cost Ratio (ICR)
ICR is a performance measure calculated as the ratio of insurance costs to insurance service revenues. We believe that ICR promotes an understanding of our insurance cost trends and our ability to align our relative pricing to risk performance.
We purchase workers' compensation and health benefits coverage for our WSEs. Under the insurance policies for this coverage, we bear claims costs up to a defined deductible amount. Our insurance costs, which comprise a significant portion of our overall costs, are significantly affected by our WSEs’ health and workers' compensation insurance claims experience. We set our insurance service fees for workers’ compensation and health benefits in advance for fixed benefit periods. As a result, increases in insurance costs above our projections, reflected as a higher ICR, result in lower net income. Decreases in insurance costs below our projections, reflected as a lower ICR, result in higher net income, but can be an indicator that insurance costs are developing more slowly than our projections, which are reflected in our fees, and this can have a negative impact over time on client retention and new sales.
| | | | | |
| MANAGEMENT'S DISCUSSION AND ANALYSIS | |
Under our fully-insured workers' compensation insurance policies, we assume the risk for losses up to $1 million per claim occurrence (deductible layer). The ultimate cost of the workers’ compensation services provided cannot be known until all the claims are settled. Our ability to predict these costs is limited by unexpected increases in frequency or severity of claims, which can vary due to changes in the cost of treatments or claim settlements.
Under our risk-based health insurance policies, we assume the risk of variability in future health claims costs for our enrollees. This variability typically results from changing trends in the volume, severity and ultimate cost of medical and pharmaceutical claims, due to changes to the components of MCT, which we define as changes in participant use of services, including the introduction of new treatment options, changes in treatment guidelines and mandates, and changes in the mix, cost of providing treatment and timing of services provided to plan participants. These trends change, and other seasonal trends and variability may develop. As a result, it is difficult for us to predict our insurance costs with accuracy and a significant increase in these costs could have a material adverse effect on our business.
| | | | | | | | | | | | | | |
| | | | |
| (in millions) | | | | 2023 | 2022 | 2021 |
| Insurance costs | | | | $ | 3,513 | | $ | 3,463 | | $ | 3,339 | |
| Insurance service revenues | | | | 4,166 | | 4,131 | | 3,901 | |
| Insurance Cost Ratio | | | | 84 | % | 84 | % | 86 | % |
ICR was approximately flat when comparing 2023 to 2022 as health insurance costs grew at a faster rate than health ISR, partially offset by favorable workers' compensation prior period claims development. Insurance costs increased due to higher costs associated with medical services utilization, in particular outpatient services and pharmacy costs. This was partially offset by favorable prior period development in workers' compensation and lower volume due to lower Average WSEs. ISR increased due to rate increases partially offset by lower volume due to lower Average WSEs. In addition, ISR in 2023 did not include any reductions for credit programs whereas ISR in 2022 included a $75 million reduction related to our 2022 Credits.
Total Revenues
Our revenues consist of professional service revenues (PSR)PSR and insurance service revenues (ISR).ISR. PSR represents fees charged to clients for processing payroll-related transactions on behalf of our PEO and HRIS clients, access to our HR expertise, employment and benefit law compliance services, and other HR-related services.and tax credit filing services and fees charged to access our cloud-based HRIS services . ISR consists of insurance-related billings and administrative fees collected from PEO clients and withheld from WSEs for workers' compensation insurance and health benefit insurance plans provided by third-party insurance carriers.
In April 2020, we created our Recovery Credit program to assist in the economic recovery of our existing SMB clients and enhance our ability to retain these clients. Eligible clients will receive one-time reductions against fees for future services, accounted for as a discount, to be received over the following 12 months. We recognized a reduction in total revenues of $128 million in 2020 for the Recovery Credit, allocated proportionally to PSR ($16 million) and ISR ($112 million).
The reduction in revenue is estimated each period based on the timing of when eligible clients will receive the Recovery Credit and the ultimate amount of the total Recovery Credit. The ultimate amount of the Recovery Credit eligible clients will receive is dependent on our future performance and is subject to a limit on the total amount of $145 million. To the extent our future performance is worse than expected, the ultimate amount of the Recovery Credit may decrease. We will continue to recognize a reduction to revenues in 2021 for the remaining Recovery Credit over the period that our clients will earn the right to receive credits.
Monthly total revenues per Average WSE is a measure we use to monitor the success of our PEO pricing strategies. This measure increased 5% during 20206% in 2023 compared to 2019.2022.
We also use the following measures to further analyze changes in total revenue:
•Volume - the percentage change in period over period co-employed Average WSEs,
•Rate - the combined weighted average percentage changes in service fees for each vertical service and changes in service fees associated with each insurance service offering,
•Mix - the change in composition of Average WSEs within our verticals combined with the composition of our enrolled WSEs within our insurance service offerings and the composition of products and services our clients receive, including Clarus R+D,
•Recovery Credit - the weighted average change in amounts recognized for the Recovery Credit program.our 2022 Credits, and
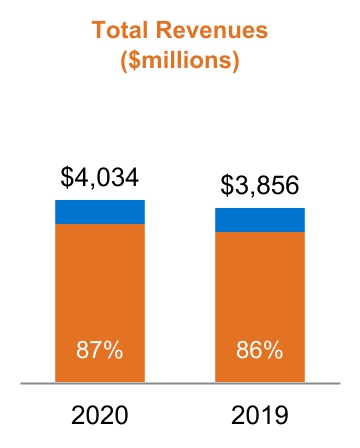
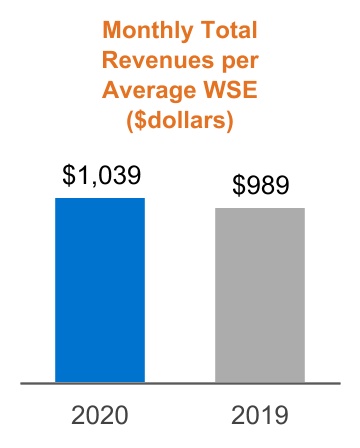
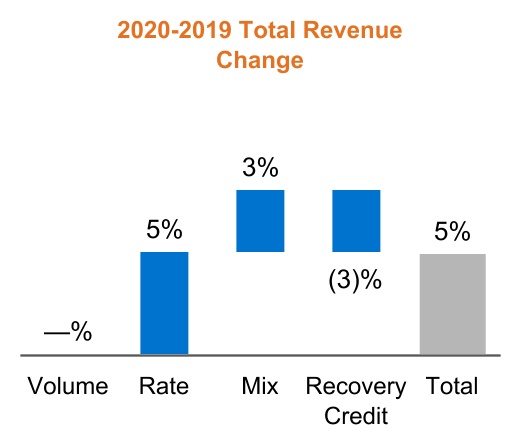
| | | | | |
| MANAGEMENT'S DISCUSSION AND ANALYSIS | |
| | | | | | | | | | | | | | | | | |
| | PSR | | | |
| | | |
| | | |
| | ISR - % represents proportion of insurance service revenues to total revenues | | | |
| | | |
| | | |
| | *Total revenues generated from PEO services only | | | |
| | | | |
| | | | |
The growthincrease in total revenues,revenue for the year was primarily driven by inflationary rate increases and higher health plan enrollmentincreases. In addition, as part of our 2022 Credit program, we recognized a $75 million reduction in our insurance service offerings.revenue in 2022, which did not recur in 2023. This was partially offset by the $128 million reduction recognized for our Recovery Credit.lower health plan enrollment and lower volume due to lower Average WSEs.
| | | | | |
MANAGEMENT'S DISCUSSION AND ANALYSIS | |
Operating Income
Our operating income consists of total revenues less insurance costs and OE. Our insurance costs include insurance premiums for coverage provided by insurance carriers, reimbursement ofexpenses for claims payments made by insurance carriers or third-party administrators,costs and risk management and administrative services, and changes in accrued costs related to contractual obligations with our workers' compensation and health benefit carriers. Our OE consists primarily of our corporate employees'colleagues' compensation related expenses, which includes payroll, payroll taxes, SBC, bonuses, commissions and other payroll-and benefits-related costs.
The table below provides a view of the changes in components of operating income on a year-over-year basis.
| | | | | | | | |
| (in millions) | |
$268499 | 20192022 Operating Income |
| +17837 | Higher total revenues primarily as a result of increaseddriven by rate increases and due to no reduction in revenue being recognized in 2023 related to our 2022 Credits, partially offset by lower health plan enrollment in our insurance service offerings, together with rate increases, partially offset by the $128 million reduction recognized for our Recovery Credit.and lower Average WSEs. |
| -52-50 | Higher insurance costs primarily as a result of increasedhigher rates, partially offset by lower health plan enrollment offset byand lower utilization of medical services.volume due to lower Average WSEs. |
| -26-17 | Higher OE primarily as a result of increasedhigher compensation, including incentive compensationS&M and costs to support initiativestechnology spend to improve client experience, enhance service offerings, and improve processes.processes, including a full year of supporting the HRIS product, together with higher sales and marketing expenses to support sales efforts. This was partially offset by lower spend in facilities and transaction and integration costs. |
$368469 | 20202023 Operating Income |
Professional Service Revenues
Our PEO and HRIS clients are primarily billed on a fee per WSE or HRIS User per month per transaction. Our vertical approach provides us the flexibility to offer our PEO clients in different industries with varied services at different prices, which we believe potentially reduces the value of solely using Average WSE and Total WSE counts as indicators of future potential revenue performance.
| | | | | |
| MANAGEMENT'S DISCUSSION AND ANALYSIS | |
PSR from PEO Services customers and HRIS cloud services clients was as follows:
| | | | | | | | | | | | |
| | | | |
| (in millions) | | | | 2023 | 2022 | |
| PEO Services | | | | $ | 704 | | $ | 711 | | |
| HRIS Cloud Services | | | | 52 | | 43 | | |
| Total | | | | $ | 756 | | $ | 754 | | |
We also analyze changes in PSR with the following measures:
•Volume - the percentage change in period over period co-employed Average WSEs,
•Rate - the weighted average percentage change in fees for each vertical,
•Mix - the change in composition of Average WSEs across our verticals and the composition of products and services our clients receive, including TriNet Clarus R+D, and
•Recovery CreditHRIS - the weighted average amounts recognizedincremental HRIS cloud services revenue.
PSR was flat for the Recovery Credit program.
The increase in PSR reflectsyear as rate increases andfrom our PEO services, as well as the changehigher HRIS revenue from a full year of revenue in mix of our WSEs, partially2023 compared to a ten month period in 2022, were offset by the Recovery Credit recognizedlower WSEs, primarily in 2020.our Technology vertical due to client attrition and lower client hiring within our installed base.
| | | | | |
MANAGEMENT'S DISCUSSION AND ANALYSIS | |
Insurance Service Revenues
ISR consists of insurance services-related billings and administrative fees collected from PEO clients and withheld from WSE payroll for health benefits and workers' compensation insurance provided by third-party insurance carriers.
We use the following measures to analyze changes in ISR:
•Volume - the percentage change in period over period co-employed Average WSEs,
•Rate - the weighted average percentage change in fees associated with each of our insurance service offerings,
•Mix - all other changes including the composition of our enrolled WSEs within our insurance service offerings (health plan enrollment), and
•Recovery Credit - the weighted average amounts recognized for the Recovery Credit program.our 2022 Credits.
| | | | | |
| MANAGEMENT'S DISCUSSION AND ANALYSIS | |
The growthincrease in ISR reflectsfor the year was primarily driven by rate increases and higher health plan enrollmentincreases. In addition, as part of our 2022 Credit program, we retained and added new clients that value our full service offerings.recognized a $75 million reduction in revenue in 2022, which did not recur in 2023. This was partially offset by the Recovery Credit recognized in 2020.lower health plan enrollment and lower volume due to lower Average WSEs.
Insurance Costs
Insurance costs include insurance premiums for coverage provided by insurance carriers, payments for claims costs and expenses for other risk management and administrative services, reimbursement of claims payments made by insurance carriers or third-party administrators below a predefined deductible limit, and changes in accrued costs related to contractual obligations with our workers' compensation and health benefit carriers.
We use the following measures to analyze changes in insurance costs:
•Volume - the percentage change in period over period co-employed Average WSEs,
•Rate - the weighted average percentage change in cost trend associated with each of our insurance service offerings, and
•Mix - all other changes including the composition of our enrolled WSEs within our insurance service offerings (health plan enrollment).
The increase in insurance costs for the year was primarily driven by higher rates paid for services, partially offset by lower health plan enrollment and lower volume due to lower Average WSEs. The rate increases were primarily driven by higher costs associated with medical services utilization, in particular outpatient services and pharmacy costs.
| | | | | |
| MANAGEMENT'S DISCUSSION AND ANALYSIS | |
During 2020, as a result of the COVID-19 pandemic, we experienced higher than normal volatility and variability in the amounts that we pay for group health insurance expenses incurred by WSEs within our deductible layer under our risk-based health insurance policies.
Stay-at-home orders and social distancing practices decreased the utilization of medical services from mid-March through April as enrollees deferred or cancelled elective procedures and reduced outpatient medical, dental and vision services. Utilization began to approach more typical levels by the end of the second quarter and this trend continued through the second half of the year as enrollees resumed previously deferred or canceled non-essential elective procedures, outpatient medical, dental and vision services and provider networks adapted to providing services during the COVID-19 pandemic. This decrease in utilization of medical services drove the reduction in rate that we experienced on an annual basis. This reduction in utilization was offset by normal cost inflation for medical services and prescription drugs, resulting in a MCT of 7.5% - 9.5% in 2020.
The lower rate was offset by increased mix, primarily from higher health plan enrollments. We continued to experience favorable prior years development on our accrued workers' compensation costs of $20 million during 2020, primarily due to lower than expected claim severity.
| | | | | |
MANAGEMENT'S DISCUSSION AND ANALYSIS | |
Net Service Revenues
NSR provides us with a comparable basis of revenues on a net basis, acts as the basis to allocate resources to different functions and helps us evaluate the effectiveness of our business strategies by each business function.
| | | | | | | | | | | | | | | | | |
| | PSR | | | |
| | | | |
| | | | |
| | Net insurance service revenues - % represents proportion of Net Insurance Service Revenues to total Net Service Revenues | | | |
| | | | |
| | | | |
The primary drivers to the changes in our NSR are presented below.
(1) Change in NISR during 2020 comprised of an increase in ISR of $164 million, offset by an increase in insurance costs of $52 million.
NIM was 15% for 2020 representing an increase of 3% from 2019, due to higher ISR and lower utilization of medical services, as discussed previously.
| | | | | |
MANAGEMENT'S DISCUSSION AND ANALYSIS | |
Operating Expenses
OE includes cost of providing services (COPS), salesCOPS, S&M, G&A, SD&P, and marketing (S&M), general and administrative (G&A), systems development and programming (SD&P), and depreciation and amortization expenses (D&A).
We manage our operating expenses and allocate resources across different business functions based on a percentage of NSR, which has decreased to 65% in 2020 from 71% in 2019. The lower percentage of OE to NSR in 2020 when compared to 2019 was primarily driven by the increase in NSR.D&A.
We had approximately 2,700 corporate employees3,600 colleagues as of December 31, 2020 in 22 offices2023 primarily across the U.S. During 2020, we exited our monthly shared office workspaces. Our corporate employees' compensation-related expenses represent a majority of our operating expenses.but also in India and Canada. Compensation costs for our corporate employeescolleagues include payroll, payroll taxes, SBC, bonuses, commissions and other payroll- and benefits-related costs. Compensation-related expense represented 65% and 63% of our OE in 20202023 and 2019. We did not incur significant operating expenses2022, respectively.
Transaction and integration costs associated with our 2022 acquisitions of Zenefits and Clarus R+D are included in 2020 relatedG&A. These costs include advisory, legal, employee retention costs tied to COVID-19 and our transition to remote work arrangements.ongoing employment.
In 2020,2023, we experienced OE growth of 4%2% compared to 2019.2022. The ratio of OE to total revenues was 17%19% in both 20202023 and 2019.2022.
| | | | | | | | | | | | | | | | | | | | | | | | | | | | | |
| | | | | | % represents portion of compensation related expense included in operating expenses |
We analyze and present our OE based upon the business functions COPS, S&M, G&A and SD&P and D&A. The charts below provide a view of the expenses of the business functions. Dollars are presented in millions and percentages represent year-over-year change.
| | | | | |
| MANAGEMENT'S DISCUSSION AND ANALYSIS | |
| | | | | | | | |
| (in millions) | |
$661923 | 20192022 Operating Expense |
| +174 | COPS increased, driven primarily by increasedhigher compensation including incentive compensation and costsexpense to support initiativesWSEs and incremental costs related to improve our client experience, our systems and processes, and to enhance our service offerings and an increase in technology services expenses, partially offset by decreases in consulting and travel and entertainment expenses.HRIS cloud services. |
| -4+43 | S&M increased, driven primarily by higher compensation from the growth in our sales force, together with higher advertising, conference and events expenses, technology spend and broker commissions. |
| -30 | G&A decreased, driven primarily by decreaseslower transaction and integration expenses as well as lower costs in expenses related to travel, entertainment, meetingsconsulting and corporate events due to COVID-19, partially offset by an increase in variable incentive compensation.facilities expenses. |
| +15 | G&A increased, driven primarily by increases in payroll tax compliance costs and increases in variable incentive compensation related expenses, partially offset by a decrease in travel and entertainment. |
| -3-8 | SD&P decreased, driven primarily by a reduction inlower net compensation relatedand consulting expenses partially offset by an increase in technology services expenses.due to higher capitalization of internally developed software. |
| +18 | D&A remained consistent in 2020.increased, due to the amortization of intangible assets recognized for the Zenefits and Clarus R+D acquisitions as well as higher amortization related to recently deployed software. |
$687940 | 20202023 Operating Expenses |
The primary spend type drivers to the changes in our OE are presented below:
| | | | | |
| MANAGEMENT'S DISCUSSION AND ANALYSIS | |
Other Income (Expense)
Other income (expense) consists primarily of interest and dividend income from cash and investments and interest expense underon our credit facility.outstanding debt.
InterestThe growth in interest income decreased to $10 million in 2020for the year was primarily driven by higher interest earned on cash deposits due to lower averagehigher market interest rates. Interestrates in 2023.
In 2022, interest expense, bank fees and other remained flatfor the year included $17M of realized investments losses on sales and impairments related to AFS securities in 2020, as lowerthe third quarter of 2022, which did not reoccur in the current year. In 2023, interest ratesexpense, bank fees and other included additional interest on our floating rate debt was offset bynewly issued 2031 Notes and our $200 million drawdown of our 2021 Revolver in order to partially fund share repurchases in the third quarter of 2023. In addition, we incurred additional borrowingsinterest expense earlier in 2023 related to our temporary draw-down under our revolving credit facility.2021 Revolver following the Silicon Valley Bank failure.
Provision for Income Taxes
Our effective tax rate (ETR) was 24%25% and 21%26% for 20202023 and 2019,2022, respectively. The changedecrease in ETR rates was primarily attributabledue to a decreasean increase in excludable income for state tax purposes a decreaseand an increase in tax credits and a benefit recorded in the prior year from changes in valuation allowance.benefits related to stock-based compensation.
Liquidity and Capital Resources
Liquidity
Liquidity is a measure of our ability to access sufficient cash flows to meet the short-term and long-term cash requirements of our business operations. Our principal source of liquidity for operations is derived from cash provided by operating activities. We believe that we have sufficientrely on cash provided by operating activities to meet our short-term liquidity requirements, which primarily relate to the payment of corporate payroll and other operating costs, and capital resourcesexpenditures. Our cash flow related to satisfy future requirementsWSE payroll and meetbenefits is generally matched by advance collection from our obligationsPEO clients. To minimize the credit risk associated with remitting the payroll and associated taxes and benefits costs, we require PEO clients to our clients, creditorsprefund the payroll and debt holders.
From time to time, we may seek to raise capital, including by issuing debt securities or borrowing under our term loan, revolver or any future credit facility. We may also seek to refinance, retire or repurchase any such debt obligations. These activities, if any, will be dependent on market conditions, our liquidityrelated payroll taxes and other factors.benefits costs.
Included in our balance sheets are assets and liabilities resulting from transactions directly or indirectly associated with WSEs, including payroll and related taxes and withholdings, our sponsored workers' compensation and health insurance programs, and other benefit programs. Although we are not subject to regulatory restrictions that require us to do so, we distinguish and manage our corporate assets and liabilities separately from those current assets and liabilities held by us to satisfy our employer obligations associated with our WSEs as follows:
| | | | | |
| MANAGEMENT'S DISCUSSION AND ANALYSIS | |
| | | | | | | | | | | | | | | | | | | | |
| December 31, |
| 2020 | 2019 |
| (in millions) | Corporate | WSE | Total | Corporate | WSE | Total |
| Current assets: | | | | | | |
| Cash and cash equivalents | $ | 301 | | $ | — | | $ | 301 | | $ | 213 | | $ | — | | $ | 213 | |
| Investments | 57 | | — | | 57 | | 68 | | — | | 68 | |
| Restricted cash, cash equivalents and investments | 15 | | 1,373 | | 1,388 | | 15 | | 1,165 | | 1,180 | |
| Other current assets | 59 | | 355 | | 414 | | 45 | | 365 | | 410 | |
| Total current assets | $ | 432 | | $ | 1,728 | | $ | 2,160 | | $ | 341 | | $ | 1,530 | | $ | 1,871 | |
| | | | | | |
| | | | | | |
| | | | | | |
| | | | | | |
| Total current liabilities | 142 | | 1,728 | | $ | 1,870 | | $ | 113 | | $ | 1,530 | | $ | 1,643 | |
| | | | | | |
| | | | | | |
| Working capital | $ | 290 | | $ | — | | $ | 290 | | $ | 228 | | $ | — | | $ | 228 | |
To meet various U.S. state licensing requirements and maintain accreditation by the ESAC, we are subject to various minimum working capital and net worth requirements. As of December 31, 2020, we believe we have fully complied in all material respects with all applicable state regulations regarding minimum net worth, working capital and all other financial and legal requirements. Further, we have maintained positive working capital throughout each of the periods covered by the financial statements. | | | | | | | | | | | | | | | | | | | | |
| December 31, |
| 2023 | 2022 |
| (in millions) | Corporate | WSE | Total | Corporate | WSE | Total |
| Current assets: | | | | | | |
| Cash and cash equivalents | $ | 287 | | $ | — | | $ | 287 | | $ | 354 | | $ | — | | $ | 354 | |
| Investments | 65 | | — | | 65 | | 76 | | — | | 76 | |
| Restricted cash, cash equivalents and investments | 22 | | 1,247 | | 1,269 | | 22 | | 1,241 | | 1,263 | |
| Other current assets | 73 | | 884 | | 957 | | 78 | | 555 | | 633 | |
| Total current assets | $ | 447 | | $ | 2,131 | | $ | 2,578 | | $ | 530 | | $ | 1,796 | | $ | 2,326 | |
| | | | | | |
| | | | | | |
| | | | | | |
| | | | | | |
| Total current liabilities | 332 | | 2,131 | | $ | 2,463 | | $ | 192 | | $ | 1,796 | | $ | 1,988 | |
| | | | | | |
| | | | | | |
| Working capital | $ | 115 | | $ | — | | $ | 115 | | $ | 338 | | $ | — | | $ | 338 | |
As of December 31, 2020,2023, we did not have any material off-balance sheet arrangements that are reasonably likely to have a current or future effect on our financial condition, results of operations, liquidity, capital expenditures or capital resources,resources.
Working capital for WSEs related activities
We designate funds to ensure that we have adequate current assets to satisfy our current obligations associated with WSEs and the Recovery Credit liability. We expect the Recovery Credit liability of $92 million as of December 31, 2020 to be settled over the following 12 months.WSEs. We manage our WSE payroll and benefits obligations through collections of payments from our clients which generally occursoccur two to three days in advance of client payroll dates. We regularly review our short-term obligations associated with our WSEs (such as payroll and related taxes, insurance premium and claim payments) and designate funds required to fulfill these short-term obligations, which we refer to as PFC. PFC is included in current assets as restricted cash, cash equivalents and investments.
We manage our sponsored benefit and workers' compensation insurance obligations by maintaining collateral funds in restricted cash, cash equivalents and investments. These collateral amounts are generally determined at the beginning of each plan year and we may be required by our insurance carriers to adjust our collateral balances when facts and circumstances change. We regularly review our collateral balances with our insurance carriers and anticipate funding further collateral in the future based upon our capital requirements. We classify our restricted cash, cash equivalents and investments as current and noncurrent assets to match against the anticipated timing of payments to carriers.
The following table summarizes our workers' compensation obligations, gross of collateral, as of December 31, 2020,2023,
| | | | Payments Due by Period | | Payments Due by Period |
| (in millions) | (in millions) | Total | Less than 1 year | 1-3 years | 3-5 years | More than 5 years | (in millions) | Total | Less than 1 year | 1-3 years | 3-5 years | More than 5 years |
Workers' compensation obligations (1) | Workers' compensation obligations (1) | $ | 205 | | $ | 62 | | $ | 62 | | $ | 27 | | $ | 54 | |
(1) Represents estimated payments that are expected to be made to carriers for various workers' compensation programs under the contractual obligations. These obligations include the costs of reimbursing the carriers for paying claims within the deductible layer in accordance with the workers' compensation insurance policy.
Working capital for corporate purposes
Corporate working capital as of December 31, 2020 increased $622023 decreased $223 million from December 31, 2019,2022, primarily driven by a $88due to the $109 million increase in current liabilities from our borrowings under our 2021 Revolver and the $67 million decrease in corporate unrestricted cash and cash equivalents. This decrease in corporate unrestricted cash and cash equivalents was largely driven by the net impacts of our capital transactions the third quarter of 2023, when we purchased approximately $1 billion of our stock partially financed by $600 million of debt issuances. This was partially offset by increase in our corporate accounts payable and other current liabilities.
| | | | | |
MANAGEMENT'S DISCUSSION AND ANALYSIS | |
positive cash flows from operations over the year.We use our available cash and cash equivalents to satisfy our operational and regulatory requirements and to fund capital expenditures. We believe that we can meet our present and reasonably foreseeable operating cash needs and future commitments through existing liquid assets, continuing cash flows from corporate operating activities and the potential issuance of debt or equity securities. We hold both corporate cash and cash associated with WSEs across multiple financial institutions to reduce concentrations of counterparty risk. We believe our existing corporate
| | | | | |
| MANAGEMENT'S DISCUSSION AND ANALYSIS | |
cash and cash equivalents and positive working capital will be sufficient to meet our working capital expenditure needs for at least the next twelve months.
The following table summarizes our purchase obligations as of December 31, 2020,2023,
| | | | Payments Due by Period | | Payments Due by Period |
| (in millions) | (in millions) | Total | Less than 1 year | 1-3 years | 3-5 years | More than 5 years | (in millions) | Total | Less than 1 year | 1-3 years | 3-5 years | More than 5 years |
Purchase obligations (1) | Purchase obligations (1) | $ | 97 | | $ | 51 | | $ | 44 | | $ | 2 | | $ | — | |
(1) Our purchase obligations primarily consist of software licenses, consulting and maintenance agreements, and future sales and marketing events pertaining to various agreements.events.
Cash Flows
The following table presents our cash flow activities for the stated periods:
| | | | Year Ended December 31, | | Year Ended December 31, |
| (in millions) | (in millions) | 2020 | 2019 | (in millions) | 2023 | 2022 |
| Corporate | WSE | Total | Corporate | WSE | Total |
| Corporate | | | Corporate | WSE | Total | Corporate | WSE | Total |
| Net cash provided by (used in): | Net cash provided by (used in): | | | | Net cash provided by (used in): | | | | | | |
| Operating activities | Operating activities | $ | 338 | | $ | 208 | | $ | 546 | | $ | 233 | | $ | 238 | | $ | 471 | |
| Investing activities | Investing activities | (69) | | (82) | | (151) | | (191) | | 3 | | (188) | |
| Financing activities | Financing activities | (208) | | — | | (208) | | (176) | | — | | (176) | |
| Effect of exchange rate changes on cash and cash equivalents | |
| Net increase (decrease) in cash and cash equivalents, unrestricted and restricted | Net increase (decrease) in cash and cash equivalents, unrestricted and restricted | $ | 61 | | $ | 126 | | $ | 187 | | $ | (134) | | $ | 241 | | $ | 107 | |
| Cash and cash equivalents, unrestricted and restricted: | Cash and cash equivalents, unrestricted and restricted: | | |
| Beginning of period | |
| Beginning of period | |
| Beginning of period | Beginning of period | $ | 291 | | $ | 1,165 | | $ | 1,456 | | $ | 425 | | $ | 924 | | $ | 1,349 | |
| End of period | End of period | $ | 352 | | $ | 1,291 | | $ | 1,643 | | $ | 291 | | $ | 1,165 | | $ | 1,456 | |
| | Net increase (decrease) in cash and cash equivalents: | Net increase (decrease) in cash and cash equivalents: | | |
| Net increase (decrease) in cash and cash equivalents: | |
| Net increase (decrease) in cash and cash equivalents: | |
| Unrestricted | |
| Unrestricted | |
| Unrestricted | Unrestricted | $ | 88 | | $ | — | | $ | 88 | | $ | (15) | | $ | — | | $ | (15) | |
| Restricted | Restricted | (27) | | 126 | | 99 | | (119) | | 241 | | 122 | |
Operating Activities
Components of net cash provided by operating activities are as follows:
| | | |
| | | | Year Ended December 31, |
| (in millions) | (in millions) | 2020 | 2019 |
| (in millions) | |
| (in millions) | |
| | Net cash provided by operating activities | |
| | Net cash provided by operating activities | |
| | | Net cash provided by operating activities | Net cash provided by operating activities | $ | 546 | | $ | 471 | |
| Net cash provided by operating activities - Corporate | Net cash provided by operating activities - Corporate | $ | 338 | | $ | 233 | |
| Net cash provided by operating activities - Corporate | |
| Net cash provided by operating activities - Corporate | |
| | Net cash provided by operating activities - WSE | Net cash provided by operating activities - WSE | $ | 208 | | $ | 238 | |
| | Net cash provided by operating activities - WSE | |
| | Net cash provided by operating activities - WSE | |
Year-over-yearThe year-over-year change in net cash used inprovided by operating activities for WSE purposes was primarily driven by timing of client payments, payments of payroll and payroll taxes, settlement of the Recovery Credit liability,our previously announced 2022 Credits, and insurance claim activities. We expect the changes in restricted cash and cash equivalents to correspond to WSE cash provided by (or used in) operations as we manage our obligations associated with WSEs through restricted cash.
Our corporate operating cash flows in 20202023 increased when compared to 20192022 due to the increase in our net income and the timing of our paymentpayments of corporate obligations.
| | | | | |
| MANAGEMENT'S DISCUSSION AND ANALYSIS | |
Investing Activities
Cash used in investing activities for the periods presented below primarily consisted of purchases of investments, and capital expenditures and acquisition of business, partially offset by proceeds from the sale and maturity of investments.
| | | | Year Ended December 31, | | Year Ended December 31, |
| (in millions) | (in millions) | 2020 | 2019 | (in millions) | 2023 | 2022 |
| Investments: | Investments: | | |
| Purchases of investments | Purchases of investments | $ | (327) | | $ | (302) | |
| Purchases of investments | |
| Purchases of investments | |
| Proceeds from sale and maturity of investments | Proceeds from sale and maturity of investments | 224 | | 159 | |
| Other | (12) | | — | |
| Cash used in investments | $ | (115) | | $ | (143) | |
| Acquisition of subsidiaries | |
| Cash provided by (used in) investments | |
| | Capital expenditures: | Capital expenditures: | | |
| Capital expenditures: | |
| Capital expenditures: | |
| Software and hardware | |
| Software and hardware | |
| Software and hardware | Software and hardware | $ | (33) | | $ | (34) | |
| Office furniture, equipment and leasehold improvements | Office furniture, equipment and leasehold improvements | (3) | | (11) | |
| Cash used in capital expenditures | Cash used in capital expenditures | $ | (36) | | $ | (45) | |
| Cash used in investing activities | Cash used in investing activities | $ | (151) | | $ | (188) | |
Investments
We invest a portion of available cash in investment-grade securities with effective maturities less than five years that are classified on our balance sheets as investments. We consider industry and issuer concentrations in our investment policy.
We also invest funds held as collateral to satisfy our long-term obligation towards workers' compensation liabilities. These investments are classified on our balance sheets as restricted cash, cash equivalents and investments. We review the amount and the anticipated holding period of these investments regularly in conjunction with our estimated long-term workers' compensation liabilities and anticipated claims payment trend. At December 31, 2020,2023, our investments had a weighted average duration of less than two years and an average S&P credit rating of AA.
As of December 31, 2020,2023, we held approximately $2.1$1.9 billion in restricted and unrestricted cash, cash equivalents and investments, of which $301$287 million was unrestricted cash and cash equivalents and $195$208 million was unrestricted investments. Refer to Note 2 in Part II, Item 8. Financial Statements and Supplemental Data, in this Form 10-K for a summary of these funds. Capital Expenditures
During 2020,the twelve months ended December 31, 2023 and 2022, we continued to make investments in software and hardware andas we enhanced our existing service offerings and technology platform. We expect capital investments in our software and hardware to continue in the future.
| | | | | |
| MANAGEMENT'S DISCUSSION AND ANALYSIS | |
Financing Activities
Net cash used in financing activities in the years ended December 31, 20202023 and 20192022 consisted of our debt and equity-related activities.
| | | | | | | | |
| | Year Ended December 31, |
| (in millions) | 2020 | 2019 |
| Financing activities | | |
| Repurchase of common stock, net of issuance | $ | (186) | | $ | (154) | |
| Draw down from revolving credit facility | 234 | | — | |
| Repayment of borrowings under revolving credit facility | (234) | | — | |
| Repayment of borrowings | (22) | | (22) | |
| | |
| Cash used in financing activities | $ | (208) | | $ | (176) | |
| | | | | |
MANAGEMENT'S DISCUSSION AND ANALYSIS | |
| | | | | | | | |
| | Year Ended December 31, |
| (in millions) | 2023 | 2022 |
| Financing activities | | |
| Repurchase of common stock, net of issuance costs | $ | (1,137) | | $ | (536) | |
| Proceeds from issuance of 2031 Notes | 400 | | — | |
| Payment of long-term financing fees and debt issuance costs | (9) | | — | |
| Draw down from revolving credit agreement borrowings | 695 | | — | |
| Repayment of borrowings under revolving credit agreement | (495) | | — | |
| Cash used in financing activities | $ | (546) | | $ | (536) | |
In June 2018 we entered intoFebruary 2023, our board of directors authorized a $425$300 million term loan A (our 2018 Term Loan) underincremental increase to our credit agreement (2018 Credit Agreement). The proceedsongoing stock repurchase program initiated in May 2014. In July 2023, our board of the 2018 Term Loan were useddirectors authorized a further $1 billion incremental increase to repay our previously outstanding term loans. Refer to Note 9 in Part II, Item 8. Financial Statements and Supplemental Data, in this Form 10-K for more details.
In response to economic uncertainties resulting from COVID-19, in March 2020 we drew down $234 million from our revolving credit facility to enhance our short-term cash reserves. The revolving credit facility was repaid in full in December 2020. Refer to Note 9 in Part II, Item 8. Financial Statements and Supplemental Data, instock repurchase program. We use this Form 10-K for more details.
We repurchase sharesprogram to return value to our stockholders and to offset dilution from the issuance of stock under our equity-based incentive plansplan and employee purchase plan.
On August 28, 2023, we completed a public tender offer through which we repurchased 5,981,308 shares of common stock at a price of $107.00 per share, for total consideration of approximately $640 million. On September 13, 2023, we repurchased 3,364,486 shares of common stock at a price of $107.00 per share, for total consideration of approximately $360 million, through a private repurchase from our largest stockholder, Atairos Group, Inc.
During the year ended December 31, 2023, we repurchased 10,734,790 shares of our common stock for approximately $1,112 million through our existing stock repurchase program in addition to 128,551 shares acquired to satisfy tax withholding obligations related to SBC vesting. As of December 31, 2023, approximately $433 million remained available for repurchase under all authorizations by our board of directors. We plan to use current cash and cash generated from ongoing operating activities to fund ourthis stock repurchase program.
Our stockIn March 2023, to ensure that we maintained liquidity during the regional banking liquidity challenges, we drew down the available $495 million of capacity under our 2021 Revolver. As concerns about market liquidity subsided, we repaid $200 million in March and $295 million in April. In September of 2023, we drew down $200 million under our 2021 Revolver to partially fund our share repurchases are subject to certain restrictions underin the termsthird quarter of 2023 noted above.
In August 2023, we issued $400 million aggregate principal amount of our credit facility. For more information about2031 Notes to partially fund share repurchases in the third quarter of 2023. In August 2023, concurrently with the issuance of the 2031 Notes, we amended certain provisions of our stock repurchases2021 Credit Agreement, dated February 26, 2021, as amended, to, among other things (1) increase the aggregate capacity under our 2021 Revolver from $500 million to $700 million and (2) extend the restrictions imposed bymaturity date of our credit facility, refer2021 Revolver to Note 9 and Note 12 in Part II, Item 8. Financial Statements and Supplemental Data, in this Form 10-KAugust 16, 2028.
In February of 2024, our board of directors declared a cash dividend of $0.25 per share, for more details.a total payment of approximately $13 million.
Capital Resources
As of December 31, 2020, $3702023, $500 million and $400 million aggregate principal of our 2029 Notes and 2031 Notes was outstanding, underrespectively. The indenture governing our 2018 Term Loan. 2029 Notes and 2031 Notes each includes restrictive covenants limiting our ability to: (i) create liens on certain assets to secure debt; (ii) grant a subsidiary guarantee of certain debt without also providing a guarantee of the 2029 Notes or 2031 Notes, as applicable; and (iii) consolidate or merge with or into, or sell or otherwise dispose of all or substantially all of our assets to, another person, subject, in each case, to certain customary exceptions.
Our 20182021 Credit Agreement includes a $250$700 million revolving credit facility (our 2018 Revolver), which will be used solely for working capital and other general corporate purposes. The 2018 Revolver includes capacity for a $20 million swingline facility. Lettersrevolver. In September of credit issued pursuant to the revolving credit facility reduce the amount available for borrowing under the 2018 Revolver. At December 31, 2020,2023, we had $16drew down $200 million of lettersthis revolver to partially fund our third quarter of credit outstanding2023 share repurchases. The 2021 Credit Agreement includes negative covenants that limit our ability to incur indebtedness and remaining capacity of $234 million under the 2018 Revolver.
Each of our 2018 Term Loanliens, sell assets and our 2018 Revolver mature in June 2023make restricted payments, including dividends and bear interest, at our option, either at a LIBOR rate, or the prime lending rate, plus an applicable margininvestments, subject to change incertain exceptions. In addition, the future based on our leverage ratio, as set forth in our 2018 Credit Agreement.
Our 20182021 Credit Agreement also
| | | | | |
| MANAGEMENT'S DISCUSSION AND ANALYSIS | |
contains other customary affirmative and restrictive financialnegative covenants and representations and warrantiescustomary events of default. The 2021 Credit Agreement also contains a financial covenant that are customary for facilities of this type, including restrictions on indebtedness, liens, investments, mergers, dispositions, prepayment of indebtedness (other than our 2018 Term Loan and our 2018 Revolver), dividends, distributions and transactions with affiliates, as well as minimum interest coverage andrequires the Company to maintain certain maximum total net leverage ratio requirements. ratios.
We were in compliance with theall financial covenants and restrictions under our 20182021 Credit Agreement, 2029 Notes and 2031 Notes at December 31, 2020.2023.
Critical Accounting Judgments and Estimates
Our consolidated financial statements are prepared in accordance with GAAP, which require us to make estimates, judgments, and assumptions that affect reported amounts of assets, liabilities, revenues and expenses, and the related disclosures of contingent assets and liabilities. These estimates are based on historical experience and on various other assumptions that we believe to be reasonable under the circumstances. Some of the assumptions are highly uncertain at the time of estimation. To the extent actual experience differs from the assumptions used, our consolidated financial statements could be materially affected. For additional information about our accounting policies, refer to Note 1 in Part II, Item 8. Financial Statements and Supplementary Data, of this Form 10-K. The following items require significant estimation or judgment:
Insurance Costs
We purchase workers' compensation and health benefits coverage for our employeescolleagues and WSEs. As part of these insurance policies, we bear claims costs up to a defined deductible amount and as a result, we establish accrued insurance costs including both known claims filed and estimates for incurred but not reported claims.
| | | | | |
MANAGEMENT'S DISCUSSION AND ANALYSIS | |
We use externalqualified actuaries to evaluate, review and recommend estimates of our accrued workers' compensation and health insurance costs. The accrued costs studies performed by these qualified external actuaries analyze historical claims data to develop a range of our potential ultimate costs using loss development, expected loss ratio and frequency/severity methods in accordance with Actuarial Standards of Practice. These methods are applied to classes of the claims data organized by policy year and risk class.
Key judgments and evaluations in arriving at loss estimates by class and the accrued costs selection overall include:
•the selection of method used and the relative weights given to selecting the method used for each policy year,
•the underlying assumptions of LDF used in these models,
•the effect of any changes to the insurers' claims handling and payment processes,
•evaluation of medical and indemnity cost trends, costs from changes in the risk exposure being evaluated and any applicable changes in legal, regulatory or judicial environment.
We review and evaluate these judgments and the associated recommendations in concluding the adequacy of accrued costs. Our quarterly reserving process involves the collaboration of our internal qualified external actuaries and our actuarial and finance departments to approve a single point best estimate. In selecting this best estimate, management considers the actuarial estimates and applies informed judgment regarding qualitative factors that may not be fully captured in these actuarial estimates. Such factors include but are not limited to: the timing, of the emergence of claims, volume, severity and complexity of claims, social and judicial trends, andmedical treatment trends, the extent of our historical loss data versus industry information.information, rates of participant turnover, the impact of MCT and seasonal trends, the impact of setting prices in advance of benefit periods, and the impact of unanticipated events. Where adjustments are necessary these are recorded in the period in which the adjustments are identified.
These accrued costs may vary in subsequent quarters from the amount estimated. Certain assumptions used in estimating these accrued costs are highly judgmental. Our accrued costs, results of operations and financial condition can be materially impacted if actual experience differs from the assumptions used in establishing these accrued costs.
Accrued Workers' Compensation Costs
Under our policies, we are responsible for reimbursing the insurance carriers for workers' compensation losses up to $1 million per claim occurrence (Deductible Layer). As workers' compensation costs for a particular period are not known for many years after the losses have occurred, these costs represent our best estimate of unpaid claim
| | | | | |
| MANAGEMENT'S DISCUSSION AND ANALYSIS | |
losses and loss adjustment expenses within the deductible layerDeductible Layer in accordance with our insurance policies. We use external actuaries to evaluate, review and recommend accrued workers' compensation costs on a quarterly basis. The data is segmented by class and state and analyzed by policy year, and states where we have small exposure are aggregated into a single grouping.
We use a combination of loss development, expected loss ratio and frequency/severity methods which include the following inputs, assumptions and analytical techniques:
•Historical volume and severity of workers' compensation cost experience, exposure data and industry loss experience related to TriNet’s insurance policies,
•inputs of WSEs’ job responsibilities and location,
•estimates of future cost trends,
•expected loss ratios for the latest accident year or prior accident years, adjusted for the loss trend, the effect of rate changes and other quantifiable factors, and
•LDFs to project the reported losses for each accident year to an ultimate basis.
Final cost settlements may vary materially from the present estimates, particularly when payments do not occur until well into the future. In our experience, plan years related to workers' compensation programs may take 10 years or more to be fully settled.
| | | | | |
MANAGEMENT'S DISCUSSION AND ANALYSIS | |
We believe that our estimate of accrued workers' compensation costs is most sensitive to LDFs given the long reporting and paid development patterns for our workers' compensation loss costs. Our methods of estimating accrued workers' compensation costs rely on these LDFs and an estimate of future cost trend.
The following table illustrates the sensitivity of changes in the LDFs on our year end estimate of insurance costs (in millions of dollars):
| | Change in loss development factor | Change in loss development factor | Change in insurance costs | Change in loss development factor | Change in insurance costs |
| -5.0% | -5.0% | ($37) | -5.0% | ($31) |
| -2.5% | -2.5% | ($18) | -2.5% | ($18) |
| +2.5% | +2.5% | $18 | +2.5% | $19 |
| +5.0% | +5.0% | $36 | +5.0% | $38 |
Accrued Health Insurance Costs
We sponsor and administer a number of employee benefit plans for our WSEs, including group health, dental, vision and life insurance as an employer plan sponsor under section 3(5) of the ERISA. Approximately 83%86% of our group health insurance costs relate to risk-based plans in which we agree to reimburse our carriers for any claims paid within an agreed-upon per-person deductible layer up to a maximum aggregate exposure limit per policy. These deductible dollar limits and maximum limits vary by carrier and year.
Costs covered by these insurance plans generally develop on average within three to six months so insurance costs and accrued health insurance costs include estimates of reported losses and claims incurred but not yet paid (IBNP).IBNP. Data is grouped and analyzed by insurance carrier.
To estimate accrued health benefits costs we use a number of inputs, assumptions and analytical techniques:
•historical loss claims payment patterns and medical cost trendMCT rates related to TriNet’s insurance policies,
•current period claims costs and claims reporting patterns (completion factors), and
•plan enrollment.
Medical cost trendMCT rates are a significant factor we use in developing our accrued health insurance costs. Medical cost trendsMCT are developed through an analysis of claims incurred in prior months, provider pricing and indicators of health care utilization, including pharmacy utilization trends, and outpatient and inpatient utilization. Many factors may cause medical cost trendMCT to vary from our estimates. Such factors include, but are not limited to: the timing of the emergence of claims, volume,
| | | | | |
| MANAGEMENT'S DISCUSSION AND ANALYSIS | |
severity and complexity of claims, social and judicial trends, medical treatment trends, the extent of our historical loss data versus industry information, rates of participant turnover, the impact of MCT and seasonal trends, the impact of setting prices in advance of benefit periods, new treatment options, and the impact of unanticipated events.
The following table illustrates the sensitivity of changes in the medical cost trendMCT on our year end estimate of insurance costs (in millions of dollars):
| | Change in medical cost trend | Change in medical cost trend | Change in insurance costs | Change in medical cost trend | Change in insurance costs |
| +3.0% | +3.0% | $19 | +3.0% | $21 |
| +2.0% | +2.0% | $13 | +2.0% | $14 |
| +1.0% | +1.0% | $6 | +1.0% | $7 |
| -1.0% | -1.0% | $(6) | -1.0% | $(7) |
| -2.0% | -2.0% | $(13) | -2.0% | $(14) |
| -3.0% | -3.0% | $(19) | -3.0% | $(21) |
Completion factors are an actuarial estimate based on historical experience and analysis of current trends, of paid costs to carriers as a percentage of the expected ultimate costs to carriers. Many factors may cause actual claims submissions rates from our carriers to vary from our estimated completion factors, including carrier claims processing patterns, the mix of providers and the mix of electronic versus manual claims submitted to our carriers.
| | | | | |
MANAGEMENT'S DISCUSSION AND ANALYSIS | |
The following table illustrates the sensitivity of changes in completion factors on our year end estimate of insurance costs (in millions of dollars):
| | Change in completion factors | Change in completion factors | Change in insurance costs | Change in completion factors | Change in insurance costs |
| -0.75% | -0.75% | $14 | -0.75% | $19 |
| -0.50% | -0.50% | $9 | -0.50% | $13 |
| -0.25% | -0.25% | $5 | -0.25% | $6 |
| +0.25% | +0.25% | $(5) | +0.25% | $(6) |
| +0.50% | +0.50% | $(9) | +0.50% | $(13) |
| +0.75% | +0.75% | $(14) | +0.75% | $(19) |
Business Combinations
Under the acquisition method of accounting we generally recognize the identifiable assets acquired and the liabilities assumed in an acquiree at their estimated fair values as of the date of acquisition. We measure goodwill as the excess of the fair value of consideration transferred over the net of the estimated fair values of the identifiable assets acquired and liabilities assumed. Refer to Note 16 in Part II, Item 8, Financial Statements and Supplementary Data, of this Form 10-K . The acquisition method of accounting requires us to exercise judgment and make significant estimates and assumptions regarding the fair values of the elements of a business combination as of the date of acquisition, including the estimated fair values of identifiable intangible assets, deferred tax asset valuation allowances, liabilities related to uncertain tax positions, and contingencies. This method also allows us to refine these estimates over a one year measurement period to reflect new information obtained about facts and circumstances that existed as of the acquisition date that, if known, would have affected the measurement of the amounts recognized as of that date. If we are required to retroactively adjust provisional amounts that we have recorded for the fair values of assets and liabilities in connection with acquisitions, these adjustments could materially decrease net income and result in lower asset values on our consolidated balance sheets.
These significant estimates are inherently uncertain as they relate to future economic conditions, future cash flows that we expect to generate from the acquired assets and customer behavior. If the subsequent actual results and updated projections of the underlying business activity change compared with the assumptions and projections used to develop these values, we could record impairment charges. In addition, we have estimated the economic lives of certain acquired assets and these lives are used to calculate depreciation and amortization expense. If our estimates of the economic lives change, depreciation or amortization expenses could be accelerated or slowed.
| | | | | |
| MANAGEMENT'S DISCUSSION AND ANALYSIS | |
Recent Accounting Pronouncements
Refer to Note 1 in Part II, Item 8, Financial Statements and Supplementary Data, of this Form 10-K for additional information related to recent accounting pronouncements.
| | | | | |
| QUANTITATIVE AND QUALITATIVE DISCLOSURES | |
Item 7A. Quantitative and Qualitative Disclosures About Market Risk
Our exposure to changes in interest rates relates primarily to our investment portfolio and outstanding floating rate debt.portfolio. Changes in U.S. interest rates affect the interest earned on the Company’sCompany's cash, cash equivalents and investments and the fair value of the investments, as well as interest costs associated with our debt.
In June 2019, we entered into an interest rate collar derivative transaction with no upfront premium. We use this derivative to hedge against interest rate risk on a portion of our outstanding floating rate debt. We have designated this derivative as a cash flow hedge. Our primary objective in purchasing and holding this derivative is to reduce our volatility of net earnings and cash flows associated with changes in the benchmark interest rate in our interest rate payments. We do not enter into any derivatives for trading or other speculative purposes.
We performed a sensitivity analysis to determine the impact a change in interest rates would have on the cash flows of the collar assuming a 100 basis point parallel shift in the current LIBOR rate. Based on the terms and remaining settlements as of December 31, 2020, a hypothetical 100 basis point increase in one-month LIBOR across all maturities would not result in any cash receipts by the Company while a hypothetical 100 basis point decrease in one-month LIBOR across all maturities would result in cash payments of $4 million.investments.
Our cash equivalents consist primarily of money market mutual funds, which are not significantly exposed to interest rate risk. Our AFS marketable securitiesinvestments are subject to interest rate risk because these securities generally include a fixed interest rate. As a result, the market values of these securities are affected by changes in prevailing interest rates. We attempt to limit our exposure to interest rate risk and credit risk by investing our investment portfolio in instruments that meet the minimum credit quality, liquidity, diversification and other requirements of our investment policy. Our AFS marketable securitiesinvestments consist of liquid, investment-grade securities. The risk of rate changes on investment balances was not significantmaterial at December 31, 2020.2023 and 2022.
AtAs of December 31, 2020,2023, we had total outstanding long-term debtdrawn down $200 million under our floating rate 2021 Revolver. The impact of $370 million. Aa 100 basis point increase or decrease in market interest rates would causeto interest expense on our debt2021 Revolver as of December 31, 2020 to increase by $3 million2023 over the next twelve months of the loan.
Item 8. Financial Statements and Supplementary Data
TRINET GROUP, INC.
Consolidated Financial Statements
| | | | | | | | |
| | |
| | |
| | |
| | |
| | |
| | |
| | |
| | |
| | |
| | |
| | |
| | |
| | |
| | |
| | |
| | |
Note 11. Stock Based Compensation | | |
| | |
| | |
| | |
| | |
| | |
| | |
| | |
| | |
| | |
| | |
| | |
| | |
REPORT OF INDEPENDENT REGISTERED PUBLIC ACCOUNTING FIRM
To the Stockholders and the Board of Directors of TriNet Group, Inc.
Opinion on the Financial Statements
We have audited the accompanying consolidated balance sheets of TriNet Group, Inc. and subsidiaries (the "Company") as of December 31, 20202023 and 2019,2022, the related consolidated statements of income and comprehensive income, stockholders’ equity, and cash flows, for each of the three years in the period ended December 31, 2020,2023, and the related notes (collectively referred to as the "financial statements"). In our opinion, the financial statements present fairly, in all material respects, the financial position of the Company as of December 31, 20202023 and 2019,2022, and the results of its operations and its cash flows for each of the three years in the period ended December 31, 2020,2023, in conformity with accounting principles generally accepted in the United States of America.
We have also audited, in accordance with the standards of the Public Company Accounting Oversight Board (United States) (PCAOB), the Company's internal control over financial reporting as of December 31, 2020,2023, based on criteria established in Internal Control - Integrated Framework (2013) issued by the Committee of Sponsoring Organizations of the Treadway Commission and our report dated February 16, 2021,15, 2024, expressed an unqualified opinion on the Company's internal control over financial reporting.
Basis for Opinion
These financial statements are the responsibility of the Company's management. Our responsibility is to express an opinion on the Company's financial statements based on our audits. We are a public accounting firm registered with the PCAOB and are required to be independent with respect to the Company in accordance with the U.S. federal securities laws and the applicable rules and regulations of the Securities and Exchange Commission and the PCAOB.
We conducted our audits in accordance with the standards of the PCAOB. Those standards require that we plan and perform the audit to obtain reasonable assurance about whether the financial statements are free of material misstatement, whether due to error or fraud. Our audits included performing procedures to assess the risks of material misstatement of the financial statements, whether due to error or fraud, and performing procedures that respond to those risks. Such procedures included examining, on a test basis, evidence regarding the amounts and disclosures in the financial statements. Our audits also included evaluating the accounting principles used and significant estimates made by management, as well as evaluating the overall presentation of the financial statements. We believe that our audits provide a reasonable basis for our opinion.
Critical Audit Matter
The critical audit matter communicated below is a matter arising from the current-period audit of the financial statements that was communicated or required to be communicated to the audit committee and that (1) relates to accounts or disclosures that are material to the financial statements and (2) involved our especially challenging, subjective, or complex judgments. The communication of critical audit matters does not alter in any way our opinion on the financial statements, taken as a whole, and we are not, by communicating the critical audit matter below, providing a separate opinion on the critical audit matter or on the accounts or disclosures to which it relates.
Accrued Workers’ Compensation and Health Insurance Costs - Refer to Note 1 and Note 76 to the financial statements
Critical Audit Matter Description
The Company offers its clients and worksite employees (WSEs) workers' compensation insurance and health insurance coverage through insurance policies provided by third-party insurance carriers. The Company is obligated to reimburse the insurance carriers for losses up to defined deductible limits, in accordance with the insurance policies. Accrued workers’ compensation and health insurance costs are established to provide for the estimated unpaid costs of reimbursing the carriers.
The accrued workers’ compensation costs include estimates of unpaid claimfor reported and incurred but not reported losses, accrued costs on reported claims, and loss adjustment expenses.expenses associated with settling the claims. The estimates are based on the Company’s historical and industry loss experience, exposure data, an estimate of future cost trends, expected loss ratios, and loss development factors. Accrued workers' compensation costs, as of December 31, 2020, were $197 million.
The accrued health insurance costs include estimates for reported losses and estimates for claims incurred but not paid. The estimates are based on the Company’s historical claim payment patterns and medical cost trends, current period claim costs and claim reporting patterns, and plan enrollment. Accrued health insurance costs as of December 31, 2020, were $172 million.
Both the accrued workers’ compensation and health insurance costs are established using actuarial methods followed in the insurance industry and the Company uses third-partyqualified actuaries to develop these estimates.
Given the subjectivity of estimating the value of the accrued workers’ compensation and health insurance costs, performing audit procedures to evaluate whether accrued workers’ compensation and health insurance costs recorded for the year ended December 31, 20202023 required a high degree of auditor judgment and an increased extent of effort, including the need to involve our actuarial specialists.
How the Critical Audit Matter Was Addressed in the Audit
Our audit procedures related to the accrued workers’ compensation and health insurance costs included the following, among others:
•We tested the effectiveness of controls related to accrued workers’ compensation and health insurance costs.
•We tested the underlying data that served as inputs into the actuarial analyses, including testing historical claims and enrollment data and recreating the claim loss triangles.
•With the assistance of our actuarial specialists, we evaluated the methods and key assumptions used by management to estimate the accrued workers’ compensation and health insurance costs:
◦Compared management’s prior-year assumptions of expected development and ultimate loss to actuals incurred during the current year to identify and evaluate potential bias in the determination of the accrued workers’ compensation and health insurance costs.
◦Developed an independent range of estimates of the accrued costs, utilizing loss development factors and future cost trends for accrued workers’ compensation costs and claim payment patterns and medical trend rates for accrued health insurance costs. We compared our estimated ranges to management’s estimates.
/s/ DELOITTE & TOUCHE LLP
San Francisco, California
February��16, 2021February 15, 2024
We have served as the Company's auditor since 2016.
REPORT OF INDEPENDENT REGISTERED PUBLIC ACCOUNTING FIRM
To the Stockholders and the Board of Directors of TriNet Group, Inc.
Opinion on Internal Control over Financial Reporting
We have audited the internal control over financial reporting of TriNet Group, Inc. and subsidiaries (the "Company”) as of December 31, 2020,2023, based on criteria established in Internal Control - Integrated Framework (2013) issued by the Committee of Sponsoring Organizations of the Treadway Commission (COSO). In our opinion, the Company maintained, in all material respects, effective internal control over financial reporting as of December 31, 2020,2023, based on criteria established in Internal Control - Integrated Framework (2013) issued by COSO.
We have also audited, in accordance with the standards of the Public Company Accounting Oversight Board (United States) (PCAOB), the consolidated financial statements as of and for the year ended December 31, 2020,2023, of the Company and our report dated February 16, 2021,15, 2024, expressed an unqualified opinion on those financial statements.
Basis for Opinion
The Company’s management is responsible for maintaining effective internal control over financial reporting and for its assessment of the effectiveness of internal control over financial reporting, included in the accompanying Management’s Report on Internal Control Over Financial Reporting. Our responsibility is to express an opinion on the Company’s internal control over financial reporting based on our audit. We are a public accounting firm registered with the PCAOB and are required to be independent with respect to the Company in accordance with the U.S. federal securities laws and the applicable rules and regulations of the Securities and Exchange Commission and the PCAOB.
We conducted our audit in accordance with the standards of the PCAOB. Those standards require that we plan and perform the audit to obtain reasonable assurance about whether effective internal control over financial reporting was maintained in all material respects. Our audit included obtaining an understanding of internal control over financial reporting, assessing the risk that a material weakness exists, testing and evaluating the design and operating effectiveness of internal control based on the assessed risk, and performing such other procedures as we considered necessary in the circumstances. We believe that our audit provides a reasonable basis for our opinion.
Definition and Limitations of Internal Control over Financial Reporting
A company’s internal control over financial reporting is a process designed to provide reasonable assurance regarding the reliability of financial reporting and the preparation of financial statements for external purposes in accordance with generally accepted accounting principles. A company’s internal control over financial reporting includes those policies and procedures that (1) pertain to the maintenance of records that, in reasonable detail, accurately and fairly reflect the transactions and dispositions of the assets of the company; (2) provide reasonable assurance that transactions are recorded as necessary to permit preparation of financial statements in accordance with generally accepted accounting principles, and that receipts and expenditures of the company are being made only in accordance with authorizations of management and directors of the company; and (3) provide reasonable assurance regarding prevention or timely detection of unauthorized acquisition, use, or disposition of the company’s assets that could have a material effect on the financial statements.
Because of its inherent limitations, internal control over financial reporting may not prevent or detect misstatements. Also, projections of any evaluation of effectiveness to future periods are subject to the risk that controls may become inadequate because of changes in conditions, or that the degree of compliance with the policies or procedures may deteriorate.
/s/ DELOITTE & TOUCHE LLP
San Francisco, California
February 16, 202115, 2024
TRINET GROUP, INC.
CONSOLIDATED STATEMENTS OF INCOME AND COMPREHENSIVE INCOME
| | | | Year Ended December 31, | | Year Ended December 31, |
| (in millions except per share data) | (in millions except per share data) | 2020 | 2019 | 2018 | (in millions except per share data) | 2023 | 2022 | 2021 |
| Professional service revenues | Professional service revenues | $ | 544 | | $ | 530 | | $ | 487 | |
| Insurance service revenues | Insurance service revenues | 3,490 | | 3,326 | | 3,016 | |
| Total revenues | Total revenues | 4,034 | | 3,856 | | 3,503 | |
| Insurance costs | Insurance costs | 2,979 | | 2,927 | | 2,610 | |
| Cost of providing services | Cost of providing services | 262 | | 245 | | 229 | |
| Sales and marketing | Sales and marketing | 186 | | 190 | | 182 | |
| General and administrative | General and administrative | 152 | | 137 | | 142 | |
| Systems development and programming | Systems development and programming | 40 | | 43 | | 49 | |
| Depreciation and amortization of intangible assets | Depreciation and amortization of intangible assets | 47 | | 46 | | 40 | |
| Total costs and operating expenses | Total costs and operating expenses | 3,666 | | 3,588 | | 3,252 | |
| Operating income | Operating income | 368 | | 268 | | 251 | |
| Other income (expense): | Other income (expense): | |
| Interest expense, bank fees and other | Interest expense, bank fees and other | (21) | | (21) | | (22) | |
| Interest expense, bank fees and other | |
| Interest expense, bank fees and other | |
| Interest income | Interest income | 10 | | 23 | | 12 | |
| | Income before provision for income taxes | |
| Income before provision for income taxes | |
| Income before provision for income taxes | Income before provision for income taxes | 357 | | 270 | | 241 | |
| Income taxes | Income taxes | 85 | | 58 | | 49 | |
| Net income | Net income | $ | 272 | | $ | 212 | | $ | 192 | |
| Other comprehensive income, net of income taxes | 4 | | 0 | | 0 | |
| Other comprehensive (loss) income, net of income taxes | |
| Comprehensive income | Comprehensive income | $ | 276 | | $ | 212 | | $ | 192 | |
| | Net income per share: | Net income per share: | |
| Net income per share: | |
| Net income per share: | |
| Basic | |
| Basic | |
| Basic | Basic | $ | 4.03 | | $ | 3.04 | | $ | 2.72 | |
| Diluted | Diluted | $ | 3.99 | | $ | 2.99 | | $ | 2.65 | |
| Weighted average shares: | Weighted average shares: | |
| Basic | Basic | 67 | | 70 | | 70 | |
| Basic | |
| Basic | |
| Diluted | Diluted | 68 | | 71 | | 72 | |
See accompanying notes.
TRINET GROUP, INC.
CONSOLIDATED BALANCE SHEETS
| | December 31, | | December 31, |
| | December 31, | | | | December 31, | | December 31, |
| (in millions, except share and per share data) | (in millions, except share and per share data) | | 2020 | | 2019 | (in millions, except share and per share data) | | 2023 | | 2022 |
| ASSETS | ASSETS | |
| Current assets: | Current assets: | |
| Current assets: | |
| Current assets: | |
| Cash and cash equivalents | |
| Cash and cash equivalents | |
| Cash and cash equivalents | Cash and cash equivalents | | $ | 301 | | | $ | 213 | |
| Investments | Investments | | 57 | | | 68 | |
| Restricted cash, cash equivalents and investments | Restricted cash, cash equivalents and investments | | 1,388 | | | 1,180 | |
| Accounts receivable, net | Accounts receivable, net | | 18 | | | 9 | |
| Unbilled revenue, net | Unbilled revenue, net | | 246 | | | 285 | |
| Prepaid expenses, net | Prepaid expenses, net | | 63 | | | 52 | |
| Other payroll assets | |
| Other current assets | Other current assets | | 87 | | | 64 | |
| Total current assets | Total current assets | | 2,160 | | | 1,871 | |
| Restricted cash, cash equivalents and investments, noncurrent | Restricted cash, cash equivalents and investments, noncurrent | | 210 | | | 212 | |
| Investments, noncurrent | Investments, noncurrent | | 138 | | | 125 | |
| Property, equipment and software, net | | 79 | | | 85 | |
| Property and equipment, net | |
| Operating lease right-of-use asset | Operating lease right-of-use asset | | 51 | | | 55 | |
| Goodwill | Goodwill | | 294 | | | 289 | |
| Other intangible assets, net | | 18 | | | 15 | |
| Software and other intangible assets, net | |
| Other assets | Other assets | | 93 | | | 96 | |
| Total assets | Total assets | | $ | 3,043 | | | $ | 2,748 | |
| Liabilities and stockholders' equity | Liabilities and stockholders' equity | |
| Current liabilities: | Current liabilities: | |
| Current liabilities: | |
| Current liabilities: | |
| Accounts payable and other current liabilities | Accounts payable and other current liabilities | | $ | 50 | | | $ | 31 | |
| Accounts payable and other current liabilities | |
| Accounts payable and other current liabilities | |
| Revolving credit agreement borrowings | |
| | Long-term debt | | 22 | | | 22 | |
| Client deposits and other client liabilities | |
| Client deposits and other client liabilities | |
| Client deposits and other client liabilities | Client deposits and other client liabilities | | 134 | | | 44 | |
| Accrued wages | Accrued wages | | 309 | | | 391 | |
| Accrued health insurance costs, net | Accrued health insurance costs, net | | 172 | | | 167 | |
| Accrued workers' compensation costs, net | Accrued workers' compensation costs, net | | 59 | | | 61 | |
| Payroll tax liabilities and other payroll withholdings | Payroll tax liabilities and other payroll withholdings | | 1,095 | | | 901 | |
| Operating lease liabilities | Operating lease liabilities | | 11 | | | 17 | |
| Insurance premiums and other payables | Insurance premiums and other payables | | 18 | | | 9 | |
| Total current liabilities | Total current liabilities | | 1,870 | | | 1,643 | |
| Long-term debt, noncurrent | Long-term debt, noncurrent | | 348 | | | 369 | |
| Accrued workers' compensation costs, noncurrent, net | Accrued workers' compensation costs, noncurrent, net | | 138 | | | 144 | |
| Deferred taxes | Deferred taxes | | 22 | | | 61 | |
| Operating lease liabilities, noncurrent | Operating lease liabilities, noncurrent | | 49 | | | 48 | |
| Other non-current liabilities | | 9 | | | 8 | |
| Other non current liabilities | |
| Total liabilities | Total liabilities | | 2,436 | | | 2,273 | |
| Commitments and contingencies (see Note 10) | |
Commitments and contingencies (see Note 9) | | Commitments and contingencies (see Note 9) | | |
| Stockholders' equity: | Stockholders' equity: | |
| Preferred stock | Preferred stock | | 0 | | | 0 | |
| ($0.000025 par value per share; 20,000,000 shares authorized; 0 shares issued or outstanding at December 31, 2020 and 2019) | |
| Preferred stock | |
| Preferred stock | |
| ($0.000025 par value per share; 20,000,000 shares authorized; no shares issued or outstanding at December 31, 2023 and 2022) | |
| Common stock and additional paid-in capital | Common stock and additional paid-in capital | | 747 | | | 694 | |
| ($0.000025 par value per share; 750,000,000 shares authorized; 66,456,663 and 69,065,491 shares issued and outstanding at December 31, 2020 and 2019, respectively) | |
| Accumulated deficit | | (144) | | | (219) | |
| Accumulated other comprehensive income | | 4 | | | 0 | |
| Common stock and additional paid-in capital | |
| Common stock and additional paid-in capital | |
| ($0.000025 par value per share; 750,000,000 shares authorized; 50,664,471 and 60,555,661 shares issued and outstanding at December 31, 2023 and 2022, respectively) | |
| Retained earnings (Accumulated deficit) | |
| Retained earnings (Accumulated deficit) | |
| Retained earnings (Accumulated deficit) | |
| Accumulated other comprehensive loss | |
| Total stockholders' equity | Total stockholders' equity | | 607 | | | 475 | |
| Total liabilities & stockholders' equity | Total liabilities & stockholders' equity | | $ | 3,043 | | | $ | 2,748 | |
See accompanying notes.
TRINET GROUP, INC.
CONSOLIDATED STATEMENTS OF STOCKHOLDERS’ EQUITY
| | | | | | | | | | | |
| Year Ended December 31, |
| (in millions) | 2020 | 2019 | 2018 |
| Total Stockholders' Equity, beginning balance | $ | 475 | | $ | 375 | | $ | 206 | |
| Common Stock and Additional Paid-In Capital: | | | |
| Beginning balance | 694 | | 641 | | 583 | |
| Issuance of common stock from exercise of stock options | 0 | | 2 | | 7 | |
| Issuance of common stock for employee stock purchase plan | 9 | | 9 | | 7 | |
| Stock based compensation expense | 44 | | 42 | | 44 | |
| | | |
| Ending balance | 747 | | 694 | | 641 | |
| | | |
| Accumulated Deficit: | | | |
| Beginning balance | (219) | | (266) | | (377) | |
| Net income | 272 | | 212 | | 192 | |
| Cumulative effect of accounting change | (1) | | 0 | | 2 | |
| Repurchase of common stock | (178) | | (140) | | (61) | |
| Awards effectively repurchased for required employee withholding taxes | (18) | | (25) | | (22) | |
| Ending balance | (144) | | (219) | | (266) | |
| | | |
| Accumulated Other Comprehensive Income: | | | |
| Beginning balance | 0 | | 0 | | 0 | |
| Other comprehensive income | 4 | | 0 | | 0 | |
| Ending balance | 4 | | 0 | | 0 | |
| | | |
| Total Stockholders' Equity, ending balance | $ | 607 | | $ | 475 | | $ | 375 | |
| | | |
| | | | | | | | | | | |
| Year Ended December 31, |
| (in millions) | 2023 | 2022 | 2021 |
| Total Stockholders' Equity, beginning balance | $ | 775 | | $ | 881 | | $ | 607 | |
| Common Stock and Additional Paid-In Capital: | | | |
| Beginning balance | 899 | | 808 | | 747 | |
| Issuance of common stock from exercise of stock options | 4 | | 1 | | 1 | |
| Issuance of common stock for employee stock purchase plan | 11 | | 10 | | 10 | |
| Issuance of common stock for the acquisition of Zenefits | — | | 17 | | — | |
| Repurchase of common stock | — | | 1 | | — | |
| Stock based compensation expense | 62 | | 62 | | 50 | |
| | | |
| Ending balance | 976 | | 899 | | 808 | |
| | | |
| Retained Earnings (Accumulated Deficit): | | | |
| Beginning balance | (119) | | 74 | | (144) | |
| Net income | 375 | | 355 | | 338 | |
| | | |
| Repurchase of common stock | (1,122) | | (524) | | (94) | |
| Awards effectively repurchased for required employee withholding taxes | (30) | | (24) | | (26) | |
| Ending balance | (896) | | (119) | | 74 | |
| | | |
| Accumulated Other Comprehensive (Loss) Income: | | | |
| Beginning balance | (5) | | (1) | | 4 | |
| Other comprehensive (loss) income | 3 | | (4) | | (5) | |
| Ending balance | (2) | | (5) | | (1) | |
| | | |
| Total Stockholders' Equity, ending balance | $ | 78 | | $ | 775 | | $ | 881 | |
| | | |
See accompanying notes.
TRINET GROUP, INC.
CONSOLIDATED STATEMENTS OF CASH FLOWS
| | | | | | | | | | | |
| | Year Ended December 31, |
| (in millions) | 2020 | 2019 | 2018 |
| Operating activities | | | |
| Net income | $ | 272 | | $ | 212 | | 192 | |
| Adjustments to reconcile net income to net cash provided by operating activities: | | | |
| Depreciation and amortization | 67 | | 57 | | 46 | |
| Stock based compensation | 43 | | 41 | | 44 | |
| Amortization of ROU asset | 14 | | 16 | | 0 | |
| Lease modification and impairment | 1 | | 0 | | 0 | |
| Accretion of discount rate on lease liabilities | 2 | | 0 | | 0 | |
| Amortization of (premium) discount of investments | 1 | | (1) | | 0 | |
| Deferred income taxes | (42) | | (7) | | 1 | |
| | | |
| Changes in operating assets and liabilities: | | | |
| Accounts receivable, net | (7) | | 5 | | 10 | |
| Unbilled revenue, net | 39 | | 19 | | (14) | |
| Prepaid expenses, net | (12) | | (5) | | (9) | |
| Accounts payable and other current liabilities | 19 | | (15) | | (8) | |
| Client deposits and other client liabilities | 87 | | (12) | | 4 | |
| Accrued wages | (82) | | 40 | | 23 | |
| Accrued health insurance costs, net | 5 | | 32 | | (16) | |
| Accrued workers' compensation costs, net | (9) | | (20) | | (7) | |
| Payroll taxes payable and other payroll withholdings | 194 | | 172 | | (305) | |
| Operating lease liabilities | (19) | | (17) | | 0 | |
| Other assets | (38) | | (34) | | (64) | |
| Other liabilities | 11 | | (12) | | (1) | |
| Net cash (used in) provided by operating activities | 546 | | 471 | | (104) | |
| Investing activities | | | |
| | | |
| Purchases of marketable securities | (327) | | (302) | | (258) | |
| Proceeds from sale and maturity of marketable securities | 224 | | 159 | | 101 | |
| Acquisitions of property and equipment | (36) | | (45) | | (43) | |
| Other | (12) | | 0 | | 0 | |
| Net cash used in investing activities | (151) | | (188) | | (200) | |
| Financing activities | | | |
| Repurchase of common stock | (178) | | (140) | | (61) | |
| Proceeds from issuance of common stock | 10 | | 11 | | 14 | |
| Awards effectively repurchased for required employee withholding taxes | (18) | | (25) | | (22) | |
| Proceeds from revolving credit agreement borrowings | 234 | | 0 | | 0 | |
| Proceeds from issuance of notes payable, net | 0 | | 0 | | 210 | |
| Payments for extinguishment of debt | 0 | | 0 | | (204) | |
| Repayment of borrowings under revolving credit facility | (234) | | 0 | | 0 | |
| Repayment of debt | (22) | | (22) | | (22) | |
| Net cash used in financing activities | (208) | | (176) | | (85) | |
| Net (decrease) increase in cash and cash equivalents, unrestricted and restricted | 187 | | 107 | | (389) | |
| Cash and cash equivalents, unrestricted and restricted: | | | |
| Beginning of period | 1,456 | | 1,349 | | 1,738 | |
| End of period | $ | 1,643 | | $ | 1,456 | | $ | 1,349 | |
| | | |
| Supplemental disclosures of cash flow information | | | |
| Interest paid | $ | 16 | | $ | 19 | | 17 | |
| Income taxes paid, net | 123 | | 62 | | 49 | |
| Supplemental schedule of noncash investing and financing activities | | | |
| Payable for purchase of property and equipment | $ | 2 | | $ | 2 | | 3 | |
| | | |
| | | | | | | | | | | |
| | Year Ended December 31, |
| (in millions) | 2023 | 2022 | 2021 |
| Operating activities | | | |
| Net income | $ | 375 | | $ | 355 | | $ | 338 | |
| Adjustments to reconcile net income to net cash provided by operating activities: | | | |
| Depreciation and amortization of intangible assets | 72 | | 64 | | 54 | |
| Amortization of deferred costs | 40 | | 38 | | 31 | |
| Amortization of ROU asset, lease modification, impairment, and abandonment | 9 | | 25 | | 12 | |
| Stock based compensation | 59 | | 62 | | 50 | |
| | | |
| Accretion of discount rate on lease liabilities | 2 | | 2 | | 2 | |
| Provision for doubtful accounts | 3 | | 2 | | — | |
| | | |
| Deferred income taxes | 5 | | (22) | | (9) | |
| Losses from disposition of assets | 1 | | 6 | | — | |
| Losses and impairment on investments | 1 | | 18 | | — | |
| Changes in operating assets and liabilities: | | | |
| Accounts receivable, net | (2) | | — | | 3 | |
| Unbilled revenue, net | (72) | | (51) | | (78) | |
| Prepaid expenses, net | 4 | | (2) | | (5) | |
| Other payroll assets | (259) | | (72) | | 10 | |
| Accounts payable and other current liabilities | (8) | | (13) | | 33 | |
| Client deposits and other client liabilities | (40) | | 9 | | (37) | |
| Accrued wages | 77 | | 65 | | 60 | |
| Accrued health insurance costs, net | 1 | | — | | 2 | |
| Accrued workers' compensation costs, net | (12) | | (8) | | (7) | |
| Payroll taxes payable and other payroll withholdings | 351 | | 158 | | (166) | |
| Operating lease liabilities | (17) | | (17) | | (13) | |
| Other assets | (38) | | (55) | | (60) | |
| Other liabilities | (7) | | (2) | | (2) | |
| Net cash provided by operating activities | 545 | | 562 | | 218 | |
| Investing activities | | | |
| | | |
| Purchases of marketable securities | (276) | | (410) | | (444) | |
| Proceeds from sale and maturity of marketable securities | 286 | | 469 | | 349 | |
| Acquisitions of property and equipment and projects in process | (75) | | (56) | | (40) | |
| Acquisitions of subsidiaries, net of cash acquired | — | | (229) | | — | |
| Other Investments | (5) | | — | | — | |
| Net cash used in investing activities | (70) | | (226) | | (135) | |
| Financing activities | | | |
| Repurchase of common stock | (1,122) | | (523) | | (94) | |
| Proceeds from issuance of common stock | 15 | | 11 | | 11 | |
| Payment of long-term financing costs and debt issuance costs | (9) | | — | | (9) | |
| Proceeds from issuance of 2031 Notes | 400 | | — | | — | |
| Proceeds from issuance of 2029 Notes | — | | — | | 500 | |
| Repayment of borrowings | — | | — | | (370) | |
| Proceeds from revolving credit agreement borrowings | 695 | | — | | — | |
| Repayment of borrowings under revolving credit agreement | (495) | | — | | — | |
| Awards effectively repurchased for required employee withholding taxes | (30) | | (24) | | (26) | |
| | | |
| | | |
| | | |
| Net cash provided by (used in) financing activities | (546) | | (536) | | 12 | |
| Effect of exchange rate changes on cash and cash equivalents | — | | (1) | | — | |
| Net increase (decrease) in cash and cash equivalents, unrestricted and restricted | (71) | | (201) | | 95 | |
| Cash and cash equivalents, unrestricted and restricted: | | | |
| Beginning of period | 1,537 | | 1,738 | | 1,643 | |
| End of period | $ | 1,466 | | $ | 1,537 | | $ | 1,738 | |
| | | |
| Supplemental disclosures of cash flow information | | | |
| Interest paid | $ | 25 | | $ | 18 | | $ | 12 | |
| Income taxes paid, net | 114 | | 128 | | 129 | |
| Supplemental schedule of noncash investing and financing activities | | | |
| Payable for purchase of property and equipment | $ | 4 | | $ | 6 | | $ | 3 | |
| Acquisitions of subsidiaries paid in stock | $ | — | | $ | 17 | | $ | — | |
| | | |
See accompanying notes.
TRINET GROUP, INC.
NOTES TO CONSOLIDATED FINANCIAL STATEMENTS
NOTE 1. DESCRIPTION OF BUSINESS AND SIGNIFICANT ACCOUNTING POLICIES
Description of Business
TriNet Group, Inc. (TriNet, or the Company, we, our and us), a professional employer organization, provides comprehensive human resourcesHCM solutions for small and medium-size businesses under both a co-employmentPEO model and an HRIS services model. These HRHCM solutions include multi-state payroll processing and tax administration, employee benefits programs, including health insurance and retirement plans, workers' compensation insurance and claims management, employment and benefit law compliance, and other HR-related services. Through the co-employment relationship,our PEO service model, we are the employer of record for certain employment-related administrative and regulatory purposes for the worksite employees (WSEs),WSEs, including:
•compensation through wages and salaries,
•certain employer payroll-related tax payments,
•employee payroll-related tax withholdings and payments,
•employee benefit programs, including health and life insurance, and others, and
•workers' compensation coverage.
Our PEO clients are responsible for the day-to-day job responsibilities of the WSEs.
Through our HRIS services model, we provide cloud-based HCM services to SMBs that allows them to manage hiring, onboarding, employee information, payroll processing, payroll tax administration, health insurance, and other benefits, from a single cloud-based software platform. We are not the co-employer or employer of record for such employees.
We operate in 1one reportable segment. All of our service revenues are generated from external clients. Less than 1% of our revenue is generated outside of the U.S.
Basis of Presentation
Our consolidated financial statements are prepared in conformity with generally accepted accounting principles in the United States of America (GAAP). All intercompany accounts and transactions have been eliminated in consolidation. Certain prior year amounts within operating activities of the Consolidated Statement of Cash Flows have been reclassified to conform to current period presentation. In particular, the amortization of deferred costs, consisting of costs to obtain contracts with customers, cloud computing implementation and debt issuance costs, were previously included in depreciation and amortization and are now separately classified as Amortization of Deferred Costs.
Use of Estimates
The preparation of financial statements in conformity with GAAP requires us to make estimates and assumptions that affect certain reported amounts and related disclosures.
These estimates are based on historical experience and on various other assumptions that we believe to be reasonable from the facts available to us. Some of the assumptions are highly uncertain at the time of estimation. To the extent actual experience differs from the assumptions used, our consolidated financial statements could be materially affected.
Revenue Recognition
Revenues are recognized when the promised services are transferred to our clients, in an amount that reflects the consideration that we expect to receive in exchange for services. We generate all of our revenue from contracts with clients. We disaggregate revenues into professional services revenues and insurance services revenues as reported on the consolidated statements of income and comprehensive income. In the majority of our contracts, both the client and the Company may terminate the contract without penalty by providing a 30-day notice.
On January 1, 2018, we adopted Accounting Standards Codification Topic 606 (ASC Topic 606) using the modified retrospective method applied to those contracts which were not completed as of January 1, 2018 and recorded a $2 million cumulative effect adjustment to opening retained earnings.
Performance Obligations
At contract inception, we assess the services promised in our contracts with clients and identify a performance obligation for each distinct promise to transfer to the client a service or bundle of services. We determined that the following distinct services represent separate performance obligations:
•Payroll and payroll tax processing,
•Health benefits services,
•Workers’ compensation services, and
•A right to receive future services at a discount through oura Recovery Credit program.Credit.
Payroll and payroll tax processing performance obligations include services to process payroll and payroll tax-related transactions on behalf of our PEO and HRIS clients. Revenues associated with this performance obligation are reported as professional service revenues and recognized using an output method in which the promised services are transferred when a client's payroll is processed by us and WSEs and users are paid. Professional service revenues are stated net of the gross payroll and payroll tax amounts funded by our clients. Although we assume the responsibilities to process and remit the payroll and payroll related obligations, we do not assume employment-related responsibilities such as determining the amount of the payroll and related payroll obligations. As a result, we are the agent in this arrangement for revenue recognition purposes.
Health benefits and workers' compensation services include performance obligations to provide TriNet-sponsored health benefits and workers' compensation insurance coverage through insurance policies provided by third-party insurance carriers and settle high deductible amounts on those policies. Revenues associated with these performance obligations are reported as insurance services revenues and are recognized using the output method over the period of time that the client and WSEs are covered under TriNet-sponsored insurance policies.
We control the selection of health benefits and workers' compensation coverage made available. As a result, we are the principal in this arrangement for revenue recognition purposes and insurance services revenues are reported gross.
In April 2020,previous years, we created our Recovery Credit programCredits to assist in the economic recovery of our existing SMBPEO clients and enhance our ability to retain these clients. Under this one-time program eligible clients will receive reductions against fees for future services, accounted forThese credits were based on the performance of our insurance costs and were recorded as a discount, over the following 12 months. This optionreduction to renew futureinsurance services at a discount represents a material rightrevenues and is accounted for as a new performance obligation (Recovery Credit). This performance obligation will be satisfied when the clients have successfully renewed the services contracts and the future services are transferred.
The consideration we receive that is allocated to this performance obligation is deferred as an unsatisfied performance obligation and is included in client deposits and other client liabilities on the balance sheet. The amount of consideration we defer each periodchange in balance for the liability for credits previously accrued is dependent on the timing of when eligible clients will receive the Recovery Credit and the ultimate amount of the total Recovery Credit. The ultimate amount that clients will receive varies depending on our future performance and is subject to a limit on the total amount of $145 million. In 2020, we distributed $36 million to clients related to this program.following:
| | | | | | | | |
| (in millions) | 2023 | 2022 |
| | |
| Balance at beginning of period | $ | 75 | | $ | 48 | |
| (+) Accruals | — | | 75 | |
| (-) Distributions to clients | (68) | | (48) | |
| Balance at end of period | $ | 7 | | $ | 75 | |
We generally charge new clients a nominal upfront non-refundable fee to recover our costs to set them up on our TriNet platform for payroll processing and other administrative services, such as benefit enrollments. These fees are accounted for as part of our transaction price and are allocated among the performance obligations based on their relative standalone selling prices.
Client Deposits and Other Client Liabilities
Client deposits and other client liabilities represents our contractual commitments and payables to clients, including indemnity guarantee payments received from clients, amounts prefunded by clients for their payroll and related taxes and other withholding liabilities before payroll is processed or due for payment, as well as service fee consideration received for unsatisfied performance obligations of $92 million.
Variable Consideration and Pricing Allocation
Our contracts with clients generally do not include any variable consideration. However, fromFrom time to time, we may offer incentive credits to our clients considered to be variable consideration including incentiveconsideration. Incentive credits issued related to contract renewals. Incentive creditsrenewals are recorded as a reduction to revenue as part of the transaction price at contract inception when there is a basis to reasonably estimate the amount of the incentive credit and we reduce the full amount of the credit only to the extent that it is probable that a significant reversal of any incremental revenue will not occur. These incentive credits are allocated among the performance obligations based on their relative standalone selling prices.
We allocate the total transaction price to each performance obligation based on the estimated relative standalone selling prices of the promised services underlying each performance obligation. The transaction price for the payroll and payroll tax processing performance obligations is determined upon establishment of the contract that contains the final terms of the arrangement, including the description and price of each service purchased. The estimated service fee is calculateddetermined based on observable inputs and includeincludes the following key assumptions: target profit margin, pricing strategies including the mix of services purchased and competitive factors, and client and industry specifics.
The transaction pricefees for access to health benefits insurance and workers' compensation insurance performance obligations is determined during the new client on-boarding and enrollment processes based on the types of benefits coverage the clients and WSEs have elected and the applicable risk profile of the client. We estimate our service fees based on actuarial forecasts of our expected insurance premiums and loss sensitive premium costs and amounts to cover our costs to administer these programs.
We require our clients to prefund payroll and related taxes and other withholding liabilities before payroll is processed or due for payment. Under the provision of our contracts with clients, we generally will process the payment of a client’s payroll only when the client successfully funds the amount required. As a result, there is no financing arrangement for the contracts, however,contracts. However, certain contracts to provide payroll and payroll tax processing services permit the client to pay certain payroll tax components ratably over a 12-month periodperiods of up to 12 months rather than as payroll tax is otherwise determined on wages paid,and due, which may be considered a significant financing arrangement under FASB ASC Topic 606.606 Revenue from Contracts with Customers. However, as the period between our performing the service under the contract and when the client pays for the service is less than one year, we have elected, as a practical expedient, not to adjust the transaction price.
Unbilled Revenue
WeFor our PEO clients, we recognize WSE payroll and payroll tax liabilities in the period in which the WSEs perform work. When clients' pay periods cross reporting periods, we accrue the portion of the unpaid WSE payroll where we assume, under state regulations, the obligation for the payment of wages and the corresponding payroll tax liabilities associated with the work performed prior to period-end. These estimated payroll and payroll tax liabilities are recorded in accrued wages. The associated receivables, including estimated revenues, offset by advance collections from clients and an allowance for credit losses, are recorded as unbilled revenue. As of December 31, 20202023 and 2019,2022, advance collections included in unbilled revenue were $24$8 million and $95$9 million, respectively.
Contract Costs
We recognize as deferred commission expense the incremental cost to obtain a contract with a client for certain components under our commission plans for sales representatives and channel partners that are directly related to new clients onboarded as we expect to recover these costs through future service fees. Such assets are amortized over the estimated average client tenure. These commissions are earned on the basis of the revenue generated from payroll and payroll tax processing performance obligations. When the commission on a renewal contract is not commensurate with the commission on the initial contract, any incremental commission will be capitalized and amortized over the estimated average client tenure. If the commission for both the initial contract and renewal contracts are commensurate, such commissions are expensed in the contract period. The below table summarizes the amounts capitalized and amortized during the years ended December 31, 2020, 20192023, 2022 and 2018:2021:
| | | | | | | | | | | | | | | | | | | | |
| Year Ended December 31, |
| 2020 | 2019 | 2018 |
| (in millions) | Capitalized | Amortized | Capitalized | Amortized | Capitalized | Amortized |
| Deferred commission expense | $ | 29 | | $ | 19 | | $ | 45 | | $ | 10 | | $ | 33 | | $ | 2 | |
| | | | | | | | | | | |
| Year Ended December 31, |
| (in millions) | 2023 | 2022 | 2021 |
| Deferred commission expense: | | | |
| Capitalized | $ | 33 | | $ | 32 | | $ | 28 | |
| Amortized | 35 | | 31 | | 25 | |
Certain commission plans pay a commission on estimated professional service revenues over the first 12 months of the contract with clients. The portion of commission paid in excess of the actual commission earned in that period is recorded as prepaid commission. When the prepaid commission is considered earned, it is classified as a deferred commission expense and subject to amortization. We dodid not have material contract liabilities as of December 31, 20202023 and 2019.2022.
Insurance Costs
Our insurance plans are provided by third-party insurance carriers under risk-based or guaranteed-cost insurance policies. Under risk-based policies, we agree to reimburse our carriers for any claims paid within an agreed-upon per-person deductible layer up to a maximum aggregate exposure limit per policy. These deductible dollar limits and maximum limits vary by carrier and year. Under guaranteed-cost policies, our carriers establish the premiums and we are not responsible for any deductible.
Insurance costs include insurance premiums for coverage provided by insurance carriers, paymentsexpenses for claimclaims costs and other risk management and administrative services, reimbursement of claims payments made by insurance carriers or third-party administrators below a predefined deductible limit, and changes in accrued costs related to contractual obligations with our workers' compensation and health benefit carriers.
At policy inception, annual workers' compensation premiums are estimated by the insurance carriers based on projected wages over the duration of the policy period and the risk categories of the WSEs. We initially pay premiums based on these estimates. As actual wages are realized, premium expense recorded may differ from estimated premium expense, creating an asset or liability throughout the policy year. Such asset or liability is reported on our consolidated balance sheets as prepaid expenses or insurance premiums and other payables, respectively.
Accrued Workers' Compensation Costs
We have secured workers' compensation insurance policies with insurance carriers to administer and pay claims for our clients and WSEs. We are responsible for reimbursing the insurance carriers for losses up to $1 million per claim occurrence (deductible layer). Insurance carriers are responsible for administering and paying claims. We are responsible for reimbursing each carrier up to a deductible limit per occurrence. Accrued workers' compensation costs represent our liability to reimburse insurance carriers for our share of their losses and loss adjustment expenses. These accrued costs are established to provide for the estimated ultimate costs of paying claims within the deductible layer in accordance with workers' compensation insurance policies. These accrued costs include estimates for reported and incurred but not reported (IBNR) losses, accrued costs on reported claims, and expenses associated with processing and settling the claims. In establishing these accrued costs, we use an external actuary to provide an estimate of undiscounted future cash payments that would be made to settle the claims based upon:
•historical loss experience, exposure data, and industry loss experience related to TriNet’s insurance policies,
•inputs including WSE job responsibilities and location,
•historical volume and severity of workers' compensation claims,
•an estimate of future cost trends,
•expected loss ratios for the latest accident year or prior accident years, adjusted for the loss trend, the effect of rate changes and other quantifiable factors, and
•loss development factors to project the reported losses for each accident year to an ultimate basis.
We assess the accrued workers' compensation costs on a quarterly basis. For each reporting period, changes in the actuarial methods and assumptions resulting from changes in actual claims experience and other trends are incorporated into the accrued workers' compensation costs. Adjustments to previously established accrued costs estimates are reflected in the results of operations for the period in which the adjustment is identified. Such adjustments could be significant, reflecting any variety of new adverse or favorable trends. Accordingly, final claim settlements may vary materially from the present estimates, particularly when those payments may not occur until well into the future. In our experience, plan years related to workers' compensation programs may take ten years or more to be settled.
We do not discount accrued workers' compensation costs. Costs expected to be paid within one year are recorded as accrued workers' compensation costs. Costs expected to be paid beyond one year are included in accrued workers' compensation costs, less current portion.
We have collateral agreements with various insurance carriers where either we retain custody of funds in trust accounts which we record as restricted cash and cash equivalents, or remit funds to carriers. Collateral whether held by us, or the carriers, is used to settle our insurance and claim deductible obligations to them. Collateral requirements are established at the policy year and are re-assessed by each carrier annually. Based on the results of each assessment, additional collateral may be required for or paid to the carrier or collateral funds may be released or returned to the Company. In instances where we pay collateral to carriers and the agreement permits net settlement of obligations against collateral held, we record our accrued costs net of that collateral (Carrier Collateral Offset). We offset Carrier Collateral Offset against our obligation due within the next 12 months before applying against long-term obligations. Collateral balances in excess of accrued costs are recorded in other assets.
Accrued Health Insurance Costs
We sponsor and administer a number of employee benefit plans for our PEO WSEs, including group health, dental, and vision as an employer plan sponsor under section 3(5) of the ERISA. In 2020, a2023, the majority of our group health insurance costs related to risk-based plans. Our remaining group health insurance costs were for guaranteed-cost policies.
Accrued health insurance costs are established to provide for the estimated unpaid costs of reimbursing the carriers for paying claims within the deductible layer in accordance with risk-based health insurance policies. These accrued costs include estimates for reported losses, plus estimates for claims incurred but not paid. We assess accrued health insurance costs regularly based upon external actuarial studies that include other relevant factors such as current and historical claims payment patterns, plan enrollment and medical trend rates.
In certain carrier contracts we are required to prepay our obligations for the expected claims activity for subsequent periods. These prepaid balances by agreement permit net settlement of obligations and offset the accrued health insurance costs. As of December 31, 20202023 and 2019,2022, prepayments and miscellaneous receivables offsetting accrued health insurance costs were $49$58 million and $39$57 million, respectively. When the prepaid amount is in excess of our recorded liability the net asset position is included in prepaid expenses. As of December 31, 20202023 and 2019,2022, accrued health insurance costs offsetting prepaid expenses were $58$68 million and $52$73 million, respectively.
Leases
We adopted ASU 2016-02 - Leases (ASC 842) effective January 1, 2019 using the optional transition method, under which we recognized the cumulative effects of initially applying the standard as an adjustment to the opening balance of retained earnings on January 1, 2019 with unchanged comparative periods. As part of this adoption, we elected the following practical expedients:
•not to reassess 1) whether any contracts that existed prior to adoption have or contain leases, 2) the classification of our existing leases or 3) initial direct costs for existing leases,
•to use the practical expedient of using hindsight to determine the lease terms and evaluate any impairments in right-of-use assets upon transition, and
•not separately record non-lease and lease components for all leases in which we act as a lessee.
We determine if a new contractual arrangement is a lease at contract inception. If a contract contains a lease, we evaluate whether it should be classified as an operating or a finance lease. If applicable as a lease, we record our lease liabilities and right-of-use (ROU) assets based on the future minimum lease payments over the lease term and only include options to renew a lease in the future minimum lease payments if it is reasonably certain that we will exercise that option. For certain leases with original terms of twelve months or less we recognize the lease expense as incurred and we do not recognize lease liabilities and ROU assets.
We measure our lease liabilities based on the future minimum lease payments discounted over the lease term. We determine our discount rate at lease inception using our incremental borrowing rate, which is based on our outstanding term debts that are collateralized by certain corporate assets. As of December 31, 2020,2023 and 2022, the weighted-average rate used in discounting the lease liability was 4.0%.
4.2% and 3.9%, respectively. We measure our ROU assets based on the associated lease liabilities adjusted for any lease incentives such as tenant improvement allowances and classify operating ROU assets in other assets in our consolidated balance sheet.sheets. For operating leases, we recognize expense for lease payments on a straight-line basis over the lease term.
Cash and Cash Equivalents
Cash and cash equivalents include bank deposits and short-term, highly liquid investments. Investments with original maturity dates of three months or less are considered cash equivalents.
Restricted Cash, Cash Equivalents and Investments
Restricted cash, cash equivalents and investments presented on our consolidated balance sheets include:
•cash and cash equivalents in trust accounts functioning as security deposits for our insurance carriers,
•payroll funds collected representing cash collected in advance from clients which we designate as restricted for the purpose of funding WSE payroll and payroll taxes and other payroll related liabilities, and
•amounts held in trust for current and future premium and claim obligations with our insurance carriers, which amounts are held in trust according to the terms of the relevant insurance policies and by the local insurance regulations of the jurisdictions in which the policies are in force.
Investments
Our marketable investments are primarily classified as available-for-sale and are carried at estimated fair value.
Unrealized gains and losses are reported as a component of accumulated other comprehensive income, net of deferred income taxes. The amortized cost of debt investments is adjusted for amortization of premiums and accretion of discounts from the date of purchase to the earliest call date for premiums or the maturity date for discounts. Such amortization is included in interest income as an addition to or deduction from the coupon interest earned on the investments. We use the specific identification method to determine realized gains and losses on the sale of available-for-sale securities. Realized gains and losses are included in interest incomeexpense, bank fees, and other in the accompanying consolidated statements of income and comprehensive income.
We assess our investments for credit impairment. We review several factors to determine whether an unrealized loss is credit related, such as financial condition and future prospects of the issuer. To the extent that a security's amortized cost basis exceeds the present value of the cash flows expected to be collected from the security, an allowance for credit losses will be recognized. If management intends to sell or will more likely than not be required to sell the security before any anticipated recovery, a write down will be recognized in earnings measured as the entire difference between the amortized cost and the then-current fair value.
We have investments within our unrestricted and our restricted accounts. Unrestricted investments are recorded on the balance sheet as current or noncurrent based upon the remaining time to maturity, and investments subject to restrictions are classified as current or noncurrent based on the expected payout of the related liability.
Derivative Instruments
In June 2019, we entered into an interest rate collar derivative transaction with no upfront premium to mitigate the risk of changes in interest rates on our floating rate debt. This derivative, for which we have elected and qualify for cash flow hedge accounting, is recorded on the balance sheet at its fair value. Changes in the derivative’s fair value are recorded each period in other comprehensive income until the underlying monthly interest payment and the corresponding portion of the derivative are settled, at which point changes in fair value are recorded in net income. We evaluate this derivative each quarter to determine that it remains effective by comparing the remaining expected cash flows of the derivative against the related expected interest payments of our floating rate debt. We do not enter into any derivatives for trading or other speculative purposes.
Comprehensive Income
Comprehensive income consists of net income and other comprehensive income. Other comprehensive (loss) income includes those gains and losses included in comprehensive income, but excluded from net income, in accordance with GAAP. Other comprehensive (loss) income is primarily comprised of immaterial net unrealized gains or losses arising on available-for-sale investments, net of unrealized losses on derivatives designated as cash flow hedges and net of deferred taxes.
Fair Value of Financial Instruments
Fair value is an exit price, representing the amount that would be received to sell an asset or paid to transfer a liability in an orderly transaction between market participants at the measurement date. As such, fair value is a market-based measurement that should be determined based on assumptions that market participants would use in pricing an asset or a liability.
Our financial assets recorded at fair value on a recurring basis are comprised of cash equivalents, available-for-sale marketable securities and certificates of deposits. We measure certain financial assets at fair value for disclosure purposes, as well as on a nonrecurring basis when they are deemed to be other-than-temporarily impaired. Our other current financial assets and liabilities have fair values that approximate their carrying value due to their short-term nature.
Assets and liabilities recorded at fair value are measured and classified in accordance with a three-tier fair value hierarchy based on the observability of the inputs available in the market to measure fair value, summarized as follows:
•Level 1—observable inputs for identical assets or liabilities, such as quoted prices in active markets,
•Level 2—inputs other than the quoted prices in active markets that are observable either directly or indirectly,
•Level 3—unobservable inputs in which there is little or no market data, which requires that we develop our own assumptions.
The fair value hierarchy requires us to maximize the use of observable inputs and minimize the use of unobservable inputs when measuring fair value. We classify our cash equivalents, investments and long-term debt in the fair value hierarchy based on the lowest level input that is significant to the fair value measurement in its entirety.
Accounts Receivable
Our accounts receivable represents outstanding gross billings to clients, net of an allowance for estimated credit losses. We require our clients to prefund payroll and related liabilities before payroll is processed or due for payment. If a client fails to fund payroll or misses the funding cut-off, at our sole discretion, we may pay the payroll and the resulting amounts due to us are recognized as accounts receivable. When client payment is received in advance of our performance under the contract, such amount is recorded as client deposits. We establish an allowance for credit losses based on the credit quality of clients, current economic conditions, the age of the accounts receivable balances, historical experience, and other factors that may affect clients’ ability to pay, and charge-off amounts against the allowance when they are deemed uncollectible. The allowance was immaterial at December 31, 20202023 and 2019.2022.
Property Equipment and SoftwareEquipment
We record property and equipment at historical cost and compute depreciation using the straight-line method over the estimated useful lives of the assets or the lease terms, generally three years to five years for software and office equipment, five years to seven years for office equipment, furniture and fixtures, and the shorter of the asset life or the remaining lease term for leasehold improvements. We expense the cost of maintenance and repairs as incurred and capitalize leasehold improvements.
We capitalize internal and external costs incurred to develop internal-use computer software during the application development stage. Application development stage costs include software configuration, coding, and installation. Capitalized costs are amortized on a straight-line basis over the estimated useful life, typically ranging from three years to five years, commencing when the software is placed into service. We expense costs incurred during the preliminary project stage, as well as general and administrative, overhead, maintenance and training costs, and costs that do not add functionality to existing systems.
We periodically assess the likelihood of unsuccessful completion of projects in progress, as well as monitor events or changes in circumstances, which might suggest that impairment has occurred, and recoverability should be evaluated. An impairment loss is recognized if the carrying amount of the asset is not recoverable and exceeds the future net cash flows expected to be generated by the asset.
We evaluate our long-lived assets for impairment whenever events or changes in circumstances indicate that the carrying amount of an asset or asset group may not be recoverable. An asset is considered impaired if the carrying amount exceeds the undiscounted future net cash flows the asset is expected to generate. An impairment charge is recognized for the amount by which the carrying amount of the assets exceeds its fair value. Assets to be disposed of are reported at the lower of the carrying amount or fair value, less selling costs.
Goodwill, Software and Other Intangible Assets
Our goodwill and identifiable intangible assets with indefinite useful lives are not amortized but are tested for impairment on an annual basis or when an event occurs or circumstances change in a way to indicate that there has been a potential decline in the fair value of the reporting unit. Goodwill impairment is determined by comparing the estimated fair value of the reporting unit to its carrying amount, including goodwill. All goodwill is associated with 1one reporting unit within our 1one reportable segment.
Annually, we perform a qualitative assessment to determine whether it is more likely than not that the fair value of the reporting unit has declined below its carrying value. This assessment considers various financial, macroeconomic, industry, and reporting unit specific qualitative factors. We perform our annual impairment testing in the fourth quarter. Based on the results of our reviews, 0no impairment loss was recognized in the results of operations for the years ended December 31, 2020, 20192023, 2022 and 2018.2021.
Intangible assets and software with finite useful lives are amortized over their respective estimated useful lives ranging from one year to ten years using either the straight-line method or an accelerated method. Intangible assets are reviewed for indicators of impairment at least annually and evaluated for impairment whenever events or changes in circumstances indicate that the carrying amount of an asset may not be recoverable. Based
We capitalize internal and external costs incurred to develop internal-use computer software during the application development stage. Application development stage costs include software configuration, coding, and installation. Capitalized costs are amortized on a straight-line basis over the results of our reviews, 0 impairment loss was recognized inestimated useful life, typically ranging from three years to six years, commencing when the results of operations forsoftware is placed into service. We expense costs incurred during the years ended December 31, 2020, 2019preliminary project stage, as well as general and 2018.administrative, overhead, maintenance and training costs, and costs that do not add functionality to existing systems.
Advertising Costs
We expense the costs of producing advertisements at the time production occurs, and expense the cost of running advertisements in the period in which the advertising space or airtime is used as sales and marketing expense. Advertising costs were $19$37 million, $18$29 million, and $17$21 million for the years ended December 31, 2020, 20192023, 2022 and 2018,2021, respectively.
Stock Based Compensation
Our stock basedstock-based awards to employees include time based and performance based restricted stock units and restricted stock awards, stock options and an employee stock purchase plan. Compensation expense associated with restricted stock units and restricted stock awards is based on the fair value of common stock on the date of grant. Compensation expense associated with stock options and employee stock purchase plan are based on the estimated grant date fair value method using the Black-Scholes option pricing model. Expense is recognized using a straight-line amortization method over the respective vesting period for awards that are ultimately expected to vest, with adjustments to expense recognized in the period in which forfeitures occur.
Income Taxes
We account for our provision for income taxes using the asset and liability method, under which we recognize income taxes payable or refundable for current year and deferred tax assets and liabilities for the future tax effect of events that have been recognized in either our financial statements or tax returns. We measure our current and deferred tax assets and liabilities based on provision of enacted tax laws of those jurisdictions in which we operate. The effect of changes in tax laws and regulations, or interpretations, is recognized in our consolidated financial statements in the period that includes the enactment date.
We recognize deferred tax assets and liabilities based on temporary differences between the carrying amounts of assets and liabilities for financial reporting purposes and amounts used for income tax purposes, as well as the expected benefits of using net operating loss and other carryforwards. We are required to establish a valuation allowance when it is determined more likely than not that the deferred tax assets will not be realized. Provision for income taxes may change when estimates used in determining valuation allowances change or when receipt of new information indicates the need for adjustment in valuation allowances. Changes in valuation allowances are reflected as a component of the provision for income taxes in the period the change is enacted.of adjustment.
We recognize a reserve for uncertain tax positions taken or expected to be taken in a tax return when it is concluded that tax positions are not more likely than not to be sustained upon examination by taxing authorities, including resolution of any related appeals or litigation processes, based on the technical merits of the positions. Assumptions, judgment and the use of estimates are required in determining if the more likely than not standard has been met when developing the provision for income taxes and in determining the expected benefit. The tax benefits of the position recognized in the financial statements are then measured based on the largest amount of benefit that is greater than 50% likely to be realized upon settlement with a taxing authority. Unrecognized tax benefits due to tax uncertainties that do not meet the minimum probability threshold are included as other liabilities and are charged to earnings in the period that such determination is made. We recognize interest and penalties related to uncertain tax positions as a component of income tax expense. Accrued interest and penalties are included in other non-current liabilities on the consolidated balance sheet.sheets.
Concentrations of Credit Risk
Financial instruments subject to concentrations of credit risk include cash, cash equivalents and investments (unrestricted and restricted), accounts receivable, and amounts due from insurance carriers. We maintain these financial assets principally in domestic financial institutions. We perform periodic evaluations of the relative credit standing of these institutions. Our exposure to credit risk in the event of default by the financial institutions holding these funds is limited to amounts currently held by the institution in excess of insured amounts.
Under the terms of professional services agreements, clients agree to maintain sufficient funds or other satisfactory credit at all times to cover the cost of their current payroll, all accrued paid time off, vacation or sick leave balances, and other vested wage and benefit obligations for all their work site employees. We generally require payment from our clients on or before the applicable payroll date.
For certain clients, we require an indemnity guarantee payment (IGP) supported by a letter of credit, bond, or a certificate of deposit from certain financial institutions. The IGP typically equals the total payroll and service fee for one average payroll period.
No client accounted for more than 10% of total revenues in the years ended December 31, 2020, 20192023, 2022 and 2018.2021. Bad debt expense, net of recoveries was $1$3 million for the year ended December 31, 2020 and insignificant$2 million for the years ended December 31, 20192023 and 2018.2022, respectively, and was immaterial for the year ended 2021.
Recent Accounting Pronouncements
Recently adopted accounting guidance
Leases -Recognizing and Measuring Contract Assets and Contract Liabilities From Contracts With Customers Acquired in a Business Combination – In February 2016, the FASB issued ASC 842, which replaced existing lease guidance under GAAP. Under this guidance, we recognize on our balance sheet lease liabilities representing the present value of future lease payments and an associated right-of-use asset representing our right to use or control the use of specified assets for the lease term for any operating lease with a term greater than one year.
The impact of our adoption of ASC 842 did not have a material impact on our income statement or cash flow statement. The impact on our balance sheets is as follows:
| | | | | | | | | | | | | | | | | | | | |
| | December 31, 2019 |
| (in millions) | | As reported | | Balance Using Previous Standard | | Increase (Decrease) |
| Balance sheet | | | | | | |
| Assets | | | | | | |
| | | | | | |
| Operating lease right-of-use assets | | $ | 55 | | | $ | 0 | | | $ | 55 | |
| Liabilities | | | | | | |
| Operating lease liabilities | | 17 | | | 0 | | | 17 | |
| Operating lease liabilities, noncurrent | | 48 | | | 10 | | | 38 | |
| Equity | | | | | | |
| Accumulated deficit | | (219) | | | (219) | | | 0 | |
Credit Losses -We early adopted ASU 2016-13 - Financial Instruments - Credit Losses (ASC Topic 326)2021-08 – Business Combinations (Topic 805) effective January 1, 2020 using a modified retrospective approach, under which we recognized the cumulative effects of initially applying this guidance as an adjustment2022. ASU 2021-08 amends ASC 805 to add contract assets and contract liabilities to the opening balancelist of retained earnings on January 1, 2020exceptions to the recognition and measurement principles that apply to business combinations and requires that we recognize and measure contract assets and contract liabilities acquired in a business combination in accordance with unchanged comparative periods. We are required to use forward-looking information when evaluating an allowance for our accounts receivable, unbilled revenue and other financial assets measured at amortized cost.FASB ASC Topic 326 also modified the impairment guidance for available-for-sale debt securities to require an allowance for credit losses.606 Revenue from Contracts with Customers. The adoption of ASC Topic 326ASU 2021-08 did not have a material effect on our financial statements.
NOTE 2. CASH, CASH EQUIVALENTS AND INVESTMENTS - UNRESTRICTED AND RESTRICTED
Under the terms of the agreements with certain of our workers' compensation and health benefit insurance carriers, we are required to maintain collateral in trust accounts for the benefit of specified insurance carriers and to reimburse the carriers’ claim payments within our deductible layer. We invest a portion of the collateral amounts in marketable securities. We report the current and noncurrent portions of these trust accounts as restricted cash, cash equivalents and investments on the consolidated balance sheets.
We require our clients to prefund their payroll and related taxes and other withholding liabilities before payroll is processed or due for payment. This prefund is included in restricted cash, cash equivalents and investments as payroll funds collected, which is designated to pay pending payrolls, payroll tax liabilities and other payroll withholdings.
We also invest available corporate funds, primarily in fixed income securities which meet the requirements of our corporate investment policy and are classified as available for sale (AFS).AFS.
Our total cash, cash equivalents and investments are summarized below:
| | December 31, 2020 | December 31, 2019 |
| December 31, 2023 | |
| December 31, 2023 | |
| December 31, 2023 | | December 31, 2022 |
| (in millions) | (in millions) | Cash and cash equivalents | Available-for-sale marketable securities | | Total | Cash and cash equivalents | Available-for-sale marketable securities | Certificate of deposits | Total | (in millions) | Cash and cash equivalents | Available-for-sale marketable securities | | Total | Cash and cash equivalents | Available-for-sale marketable securities | | Total |
| Cash and cash equivalents | Cash and cash equivalents | $ | 301 | | $ | 0 | | | $ | 301 | | $ | 213 | | $ | 0 | | $ | 0 | | $ | 213 | |
| Investments | Investments | 0 | | 57 | | | 57 | | 0 | | 68 | | 0 | | 68 | |
| Restricted cash, cash equivalents and investments | Restricted cash, cash equivalents and investments | | | |
| Payroll funds collected | Payroll funds collected | 1,228 | | 0 | | | 1,228 | | 1,018 | | 0 | | 0 | | 1,018 | |
| Payroll funds collected | |
| Payroll funds collected | |
| Collateral for health benefits claims | Collateral for health benefits claims | 16 | | 82 | | | 98 | | 98 | | 0 | | 0 | | 98 | |
| Collateral for workers' compensation claims | Collateral for workers' compensation claims | 60 | | 0 | | | 60 | | 62 | | 0 | | 0 | | 62 | |
| | Other security deposits | |
| Other security deposits | |
| Other security deposits | Other security deposits | 2 | | 0 | | | 2 | | 2 | | 0 | | 0 | | 2 | |
| Total restricted cash, cash equivalents and investments | Total restricted cash, cash equivalents and investments | 1,306 | | 82 | | | 1,388 | | 1,180 | | 0 | | 0 | | 1,180 | |
| Investments, noncurrent | Investments, noncurrent | 0 | | 138 | | | 138 | | 0 | | 125 | | 0 | | 125 | |
| Restricted cash, cash equivalents and investments, noncurrent | Restricted cash, cash equivalents and investments, noncurrent | | | |
| Collateral for workers' compensation claims | Collateral for workers' compensation claims | 36 | | 174 | | | 210 | | 63 | | 148 | | 1 | | 212 | |
| Collateral for workers' compensation claims | |
| Collateral for workers' compensation claims | |
| Other security deposits | |
| Total | Total | $ | 1,643 | | $ | 451 | | | $ | 2,094 | | $ | 1,456 | | $ | 341 | | $ | 1 | | $ | 1,798 | |
NOTE 3. INVESTMENTS
The following tables summarize our financial instruments by significant categories and fair value measurement on a recurring basis as of December 31, 2023 and December 31, 2022 and the amortized cost, gross unrealized gains, gross unrealized losses, and fair valuesvalue of our AFS investments as of December 31, 2020 and 2019 are presented below:investments:
| | | | | | | | | | | | | | | | | | | | | | | | | | | | | |
| December 31, 2020 | | December 31, 2019 |
| (in millions) | Amortized Cost | Gross Unrealized Gains | Gross Unrealized Losses | Fair Value | | Amortized Cost | Gross Unrealized Gains | Gross Unrealized Losses | Fair Value |
| Asset-backed securities | $ | 24 | | $ | 0 | | $ | 0 | | $ | 24 | | | $ | 30 | | $ | 0 | | $ | 0 | | $ | 30 | |
| Corporate bonds | 126 | | 2 | | 0 | | 128 | | | 123 | | 1 | | 0 | | 124 | |
| U.S. government agencies and government-sponsored agencies | 27 | | 1 | | 0 | | 28 | | | 14 | | 0 | | 0 | | 14 | |
| U.S. treasuries | 261 | | 4 | | 0 | | 265 | | | 163 | | 0 | | 0 | | 163 | |
| | | | | | | | | |
| Certificates of deposit | 0 | | 0 | | 0 | | 0 | | | 1 | | 0 | | 0 | | 1 | |
| Other debt securities | 6 | | 0 | | 0 | | 6 | | | 10 | | 0 | | 0 | | 10 | |
| Total | $ | 444 | | $ | 7 | | $ | 0 | | $ | 451 | | | $ | 341 | | $ | 1 | | $ | 0 | | $ | 342 | |
Gross unrealized losses were immaterial at December 31, 2020 and 2019. | | | | | | | | | | | | | | | | | | | | | | | | | | |
| (in millions) | Fair Value Level | Amortized Cost | Gross Unrealized Gains | Gross Unrealized Losses | Fair Value | Cash and Cash Equivalents | Investments | Restricted Cash, Cash Equivalents and Investments |
| December 31, 2023 | | | | | | | | |
| Cash equivalents: | | | | | | | | |
| Money market mutual funds | Level 1 | $ | 183 | | $ | — | | $ | — | | $ | 183 | | $ | 96 | | $ | — | | $ | 87 | |
| U.S. treasuries | Level 2 | 7 | | — | | — | | 7 | | 5 | | — | | 2 | |
| Total cash equivalents | | 190 | | — | | — | | 190 | 101 | | — | | 89 | |
| AFS Investments: | | | | | | | | |
| Asset-backed securities | Level 2 | 41 | | — | | (1) | | 40 | | — | | 40 | | — | |
| Corporate bonds | Level 2 | 135 | | 1 | | — | | 136 | | — | | 103 | | 33 | |
| Agency securities | Level 2 | 40 | | — | | (1) | | 39 | | — | | 10 | | 29 | |
| U.S. treasuries | Level 2 | 231 | | 1 | | (1) | | 231 | | — | | 47 | | 184 | |
| Certificate of deposit | Level 2 | 2 | | — | | — | | 2 | | — | | — | | 2 | |
| Other debt securities | Level 2 | 8 | | — | | — | | 8 | | — | | 8 | | — | |
| Total AFS Investments | | $ | 457 | | $ | 2 | | $ | (3) | | $ | 456 | | $ | — | | $ | 208 | | $ | 248 | |
Unrealized losses on fixed income securities are principally caused by changes in interest rates and the financial condition of the issuer. In analyzing an issuer's financial condition, we consider whether the securities are issued by the federal government or its agencies, whether downgrades by credit rating agencies have occurred, and industry analysts' reports. As we have the ability to hold these investments until maturity, or for the foreseeable future, no decline was deemed to be other-than-temporary. Actual maturities may differ from contractual maturities because borrowers may have the right to prepay obligations with or without prepayment penalties.
The fair value of debt investments by contractual maturity are shown below:
| | | | | | | | | | | |
(in millions) | | December 31, 2020 | | | |
One year or less | | $ | 120 | | | | |
Over one year through five years | | 301 | | | | |
Over five years through ten years | | 6 | | | | |
Over ten years | | 24 | | | | |
Total fair value | | $ | 451 | | | | |
The gross proceeds from sales and maturities of AFS securities for the years ended December 31, 2020, 2019, and 2018 are shown below. We had immaterial realized gains and losses from sales of investments for the years ended December 31, 2020, 2019, and 2018.
| | | | | | | | | | | |
| Year Ended December 31, |
| (in millions) | 2020 | 2019 | 2018 |
| | | |
| | | |
| Gross proceeds from sales | $ | 93 | | $ | 76 | | $ | 54 | |
| Gross proceeds from maturities | 131 | | 83 | | 47 | |
| Total | $ | 224 | | $ | 159 | | $ | 101 | |
NOTE 4. FINANCIAL INSTRUMENTS AND FAIR VALUE MEASUREMENTS | | | | | | | | | | | | | | | | | | | | | | | | | | |
| (in millions) | Fair Value Level | Amortized Cost | Gross Unrealized Gains | Gross Unrealized Losses | Fair Value | Cash and Cash Equivalents | Investments | Restricted Cash, Cash Equivalents and Investments |
| December 31, 2022 | | | | | | | | |
| Cash equivalents: | | | | | | | | |
| Money market mutual funds | Level 1 | $ | 314 | | $ | — | | $ | — | | $ | 314 | | $ | 225 | | $ | — | | $ | 89 | |
| U.S. treasuries | Level 2 | 18 | | — | | — | | 18 | 18 | | — | | — | |
| Total cash equivalents | | 332 | | — | | — | | 332 | 243 | | — | | 89 | |
| AFS Investments: | | | | | | | | |
| Asset-backed securities | Level 2 | 42 | | — | | (2) | | 40 | | — | | 40 | | — | |
| Corporate bonds | Level 2 | 140 | | — | | (1) | | 139 | | — | | 112 | | 27 | |
| Agency securities | Level 2 | 33 | | — | | (1) | | 32 | | — | | 5 | | 27 | |
| U.S. treasuries | Level 2 | 229 | | — | | — | | 229 | | — | | 62 | | 167 | |
| Certificate of deposit | Level 2 | 12 | | — | | — | | 12 | | — | | — | | 12 | |
| Other debt securities | Level 2 | 8 | | — | | — | | 8 | | — | | 7 | | 1 | |
| Total AFS Investments | | $ | 464 | | $ | — | | $ | (4) | | $ | 460 | | $ | — | | $ | 226 | | $ | 234 | |
Fair Value of Financial Instruments
We use an independent pricing source to determine the fair value of our securities. The independent pricing source utilizes various pricing models for each asset class;class, including the market approach. The inputs and assumptions for the pricing models are market observable inputs including trades of comparable securities, dealer quotes, credit spreads, yield curves and other market-related data.
We have not adjusted the prices obtained from the independent pricing service and we believe the prices received from the independent pricing service are representative of the prices that would be received to sell the assets at the measurement date (exit price).
The carrying value of the Company's cash equivalents and restricted cash equivalents approximate their fair values due to their short-term maturities.
We did not have any Level 3 financial instruments recognized in our balance sheetsheets as of December 31, 20202023 and 2019.December 31, 2022. There were no transfers between levels as of December 31, 20202023 and 2019.December 31, 2022.
Fair Value Measurements on a Recurring Basis
Sales and Maturities
The following tables summarize our financial instruments by significant categories and fair value measurementof debt investments by contractual maturity are shown below:
| | | | | | | | | | | |
| (in millions) | | December 31, 2023 | | | |
| One year or less | | $ | 93 | | | | |
| Over one year through five years | | 332 | | | | |
| Over five years through ten years | | 11 | | | | |
| Over ten years | | 20 | | | | |
| Total fair value | | $ | 456 | | | | |
The gross proceeds from sales and maturities of AFS securities for the years ended December 31, 2023, 2022, and 2021 are presented below. We had immaterial gross realized gains and losses from sales of investments for the year ended December 31, 2021.
| | | | | | | | | | | |
| Year Ended December 31, |
| (in millions) | 2023 | 2022 | 2021 |
| | | |
| Gross realized losses | $ | (1) | | $ | (18) | | $ | — | |
| Gross proceeds from sales | 150 | | 227 | | 162 | |
| Gross proceeds from maturities | 137 | | 253 | | 187 | |
| Total | $ | 286 | | $ | 462 | | $ | 349 | |
Unrealized Losses on a recurring basis asAFS Investments
Unrealized losses on fixed income securities are principally caused by changes in market interest rates and the financial condition of the issuer. In analyzing an issuer's financial condition, we consider whether the securities are issued by the federal government or its agencies, whether downgrades by credit rating agencies have occurred, and industry analysts' reports. Actual maturities may differ from contractual maturities because borrowers may have the right to prepay obligations with or without prepayment penalties.
As of December 31, 20202022, management recorded an impairment loss of $7 million on fixed income securities due to the probability that management could sell these securities before they recover in value. None of this impairment was credit-related. After this recognized impairment, gross unrealized losses related to AFS investments in an unrealized loss position were $4 million. Gross unrealized losses were immaterial at December 31, 2023 and 2019:December 31, 2021.
| | | | | | | | | | | |
| (in millions) | Level 1 | Level 2 | Total |
| December 31, 2020 | | | |
| Cash equivalents: | | | |
| Money market mutual funds | $ | 2 | | $ | 0 | | $ | 2 | |
| U.S. treasuries | 0 | | 11 | | 11 | |
| Total cash equivalents | 2 | | 11 | | 13 | |
| Investments: | | | |
| Asset-backed securities | 0 | | 24 | | 24 | |
| Corporate bonds | 0 | | 93 | | 93 | |
| U.S. government agencies and government-sponsored agencies | 0 | | 5 | | 5 | |
| U.S. treasuries | 0 | | 67 | | 67 | |
| Other debt securities | 0 | | 6 | | 6 | |
| Total investments | 0 | | 195 | | 195 | |
| Restricted cash equivalents: | | | |
| Money market mutual funds | 99 | | 0 | | 99 | |
| | | |
| | | |
| | | |
| Total restricted cash equivalents | 99 | | 0 | | 99 | |
| Restricted investments: | | | |
| Corporate bonds | 0 | | 35 | | 35 | |
| U.S. government agencies and government-sponsored agencies | 0 | | 23 | | 23 | |
| U.S. treasuries | 0 | | 198 | | 198 | |
| | | |
| | | |
| Total restricted investments | 0 | | 256 | | 256 | |
| Total investments and restricted cash equivalents and investments | $ | 101 | | $ | 462 | | $ | 563 | |
| | | | | | | | | | | |
| (in millions) | Level 1 | Level 2 | Total |
| December 31, 2019 | | | |
| Cash equivalents: | | | |
| Money market mutual funds | $ | 89 | | $ | 0 | | $ | 89 | |
| U.S. treasuries | 0 | | 3 | | 3 | |
| Total cash equivalents | 89 | | 3 | | 92 | |
| Investments: | | | |
| Asset-backed securities | 0 | | 30 | | 30 | |
| Corporate bonds | 0 | | 96 | | 96 | |
| U.S. government agencies and government-sponsored agencies | 0 | | 5 | | 5 | |
| U.S. treasuries | 0 | | 53 | | 53 | |
| Other debt securities | 0 | | 10 | | 10 | |
| Total investments | 0 | | 194 | | 194 | |
| Restricted cash equivalents: | | | |
| Money market mutual funds | 42 | | 0 | | 42 | |
| U.S. treasuries | 0 | | 12 | | 12 | |
| Certificate of deposit | 0 | | 2 | | 2 | |
| Commercial paper | 14 | | 0 | | 14 | |
| Total restricted cash equivalents | 56 | | 14 | | 70 | |
| Restricted investments: | | | |
| Corporate bonds | 0 | | 28 | | 28 | |
| U.S. government agencies and government-sponsored agencies | 0 | | 9 | | 9 | |
| U.S. treasuries | 0 | | 110 | | 110 | |
| | | |
| Certificate of deposit | 0 | | 1 | | 1 | |
| Total restricted investments | 0 | | 148 | | 148 | |
| Total investments and restricted cash equivalents and investments | $ | 145 | | $ | 359 | | $ | 504 | |
Fair Value of Financial Instruments Disclosure
Long-Term Debt
The fair value of our 2029 Notes and 2031 Notes was obtained from a third-party pricing service and is based on observable market inputs. As such, the fair value of the senior notes is considered Level 2 in the hierarchy for fair value measurement. As of December 31, 2023, our 2029 Notes and 2031 Notes were carried at their cost, net of issuance costs, and had a fair value of $443 million and $414 million, respectively. As of December 31, 2022, our 2029 Notes were carried at their cost, net of issuance costs, and had a fair value of $413 million.
Our long-term debt2021 Revolver is a floating rate debt anddebt. At December 31, 2023, the fair value of our floating rate debt2021 Revolver approximated its carrying value (exclusive of issuance costs) at December 31, 2020 and 2019.. The fair value of our floating rate debt is estimated based on a discounted cash flow, which incorporates credit spreads, and market interest rates and contractual maturities to estimate the fair value and is considered Level 3 in the hierarchy for fair value measurement.
Derivative Instruments
In June 2019, we entered into an interest rate collar derivative transaction with no upfront premium to mitigate the risk of changes in interest rates on the interest payments on a portion of our floating rate debt. If short-term interest rates increase, we will incur higher interest expense on any future outstanding balances of floating rate debt. We use this derivative as part of our interest rate risk management strategy and designated it as a cash flow hedge. If interest rates rise above the cap strike rate on the contract, we will receive variable-rate amounts and if interest rates fall below the floor strike rate on the contract, we will pay variable-rate amounts.
The following table summarizes the fair value of our derivative instrument at December 31, 2020 and 2019:
| | | | | | | | | | | | | | | | | | | | | | | |
| | | | Fair Market Value |
| | | | December 31, 2020 | December 31, 2019 |
| (in millions) | Hedge type | Final settlement date | Notional amount | Other current assets | Accounts payable and other current liabilities | Other current assets | Accounts payable and other current liabilities |
| Derivatives designated as hedging instruments | | | | | | | |
| Collar - LIBOR | Cash flow | May 2022 | $ | 213 | | $ | 0 | | $ | 1 | | $ | 0 | | $ | 0 | |
| | | | | | | |
| | | | | |
FINANCIAL STATEMENTSTRINET | 76 | 2023 FORM 10-K |
The pre-tax effect of our derivative instrument for the year ended December 31, 2020 is insignificant and we estimate approximately $1 million of net derivative losses included in other comprehensive income will be reclassified into earnings within the following 12 months. There were insignificant cash flows associated with the derivative for the year ended December 31, 2020 and none for 2019.
As of December 31, 2020 and 2019, we do not hold, nor have we posted, any collateral related to the above derivative instrument.
The interest rate collar derivative is classified as Level 2 in the fair value hierarchy as its value is determined using observable inputs such as forward LIBOR curves.
NOTE 5. PROPERTY, EQUIPMENT AND SOFTWARE, NET
Property, equipment and software, net, consists of the following:
| | | | | | | | |
| (in millions) | December 31, 2020 | December 31, 2019 |
| Software | $ | 204 | | $ | 174 | |
| Office equipment, including data processing equipment | 28 | | 27 | |
| Leasehold improvements | 24 | | 24 | |
| Furniture, fixtures, and equipment | 16 | | 17 | |
| Projects in progress | 1 | | 3 | |
| Total | 273 | | 245 | |
| Less: Accumulated depreciation | (194) | | (160) | |
| Property and equipment, net | $ | 79 | | $ | 85 | |
Projects in progress consist primarily of development costs for internally developed software, which we capitalize and amortize on a straight-line basis over the estimated useful life.
The following table summarizes our depreciation expense and capitalized internally developed software costs and related depreciation expense.
| | | | | | | | | | | |
| | Year Ended December 31, |
| (in millions) | 2020 | 2019 | 2018 |
| Depreciation expense | $ | 42 | | $ | 41 | | $ | 35 | |
| Capitalized internally developed software costs | 36 | | 31 | | 33 | |
| Depreciation expense for capitalized internally developed software costs | 31 | | 29 | | 24 | |
NOTE 6.4. PROPERTY AND EQUIPMENT, NET
Property and equipment, net, consists of the following:
| | | | | | | | |
| (in millions) | December 31, 2023 | December 31, 2022 |
| Office equipment, including data processing equipment | $ | 37 | | $ | 36 | |
| Leasehold improvements | 19 | | 21 | |
| Furniture, fixtures, and equipment | 14 | | 16 | |
| Projects in progress | 2 | | 4 | |
| Total | 72 | | 77 | |
| Less: Accumulated depreciation | (55) | | (50) | |
| | |
Less: Impairments (1) | $ | — | | (3) | |
| Property and equipment, net | $ | 17 | | $ | 24 | |
(1) Amount includes impairment of leasehold improvements in leased office space that we have exited. Refer to Note 7 in Part II, Item 8. Financial Statements and Supplementary Data, of this Form 10-K. Depreciation of property and equipment was $9 million, $10 million, and $9 million for years ended December 31, 2023, 2022, and 2021, respectively.
NOTE 5. GOODWILL, SOFTWARE AND OTHER INTANGIBLE ASSETS, NET
Changes in goodwill for the years ended December 31, 2020, 20192023 and 20182022 are as follows:
| | | | | |
| (in millions) | Amount |
Balance at December 31, 20182021 | $ | 289294 | |
| Additions | 0168 | |
Balance at December 31, 20192022 | $ | 289462 | |
Additions(1) | 5— | |
Balance at December 31, 20202023 | $ | 294462 | |
(1) Refer to Note 17 for more details.
The following summarizes goodwillsoftware and other intangible assets:
| | | December 31, 2023 | | | | December 31, 2023 | December 31, 2022 |
| (in millions) | | (in millions) | Weighted Average Amortization Period | Gross Carrying Amount | Accumulated Amortization | Net Carrying Amount | Gross Carrying Amount | Accumulated Amortization | Net Carrying Amount |
| Amortizable intangibles: | |
| Software | |
| Software | |
| Software | |
| Customer relationships | |
| | December 31, 2020 | December 31, 2019 |
| (in millions) | Weighted Average Amortization Period | Gross Carrying Amount | Accumulated Amortization | Net Carrying Amount | Gross Carrying Amount | Accumulated Amortization | Net Carrying Amount |
| Goodwill | | $ | 294 | | $ | — | | $ | 294 | | $ | 289 | | $ | — | | $ | 289 | |
| Amortizable intangibles: | |
| Customer contact lists | 10 years | 98 | | (80) | | 18 | | 90 | | (76) | | 14 | |
| | Developed technology | |
| Developed technology | |
| Developed technology | Developed technology | 5 years | 0 | | 0 | | 0 | | 5 | | (4) | | 1 | |
| | Total | Total | | $ | 98 | | $ | (80) | | $ | 18 | | $ | 95 | | $ | (80) | | $ | 15 | |
| Total | |
| Total | |
Amortization of intangible assets during the years ended December 31, 2020, 20192023, 2022 and 20182021 was $5$63 million, for each period.$54 million and $50 million respectively. We evaluate the remaining useful life of intangible assets quarterlyannually to determine whether events and circumstances warrant a revision to the estimated remaining useful life. During the year ended December 31, 2021, we recognized a $7 million impairment of a customer relationship intangible due to higher than expected attrition. There were no impairment charges recognized for the years ended December 31, 2023 and 2022.
The following table summarizes our capitalized internally developed software costs and related depreciation expense.
| | | | | | | | | | | |
| | Year Ended December 31, |
| (in millions) | 2023 | 2022 | 2021 |
| Capitalized internally developed software costs | 69 | | 48 | | 33 | |
| Depreciation expense for capitalized internally developed software costs | 42 | | 35 | | 33 | |
Expense related to intangibles amortization in future periods as of December 31, 20202023 is expected to be as follows:
| | | | | |
| Year ending December 31: | Amount
(in millions) |
| 2021 | $ | 5 | |
| 2022 | 5 | |
| 2023 | 3 | |
| 2024 | 1 | |
| 2025 | 1 | |
| 2026 and thereafter | 3 | |
| Total | $ | 18 | |
| | | | | |
| Year ending December 31: | Amount
(in millions) |
| 2024 | $ | 59 | |
| 2025 | 46 | |
| 2026 | 31 | |
| 2027 | 23 | |
| 2028 | 7 | |
| 2029 and thereafter | 3 | |
| Total | $ | 169 | |
NOTE 7.6. ACCRUED WORKERS' COMPENSATION COSTS
The following table summarizes the accrued workers’ compensation cost activity for the years ended December 31, 2020, 20192023, 2022 and 2018:2021:
| | Year Ended December 31, |
| Year Ended December 31, | | | Year Ended December 31, |
| (in millions) | (in millions) | 2020 | 2019 | 2018 | (in millions) | 2023 | 2022 | 2021 |
| Total accrued costs, beginning of year | Total accrued costs, beginning of year | $ | 214 | | $ | 238 | | $ | 255 | |
| Incurred | Incurred | |
| Current year | |
| Current year | |
| Current year | Current year | 64 | | 72 | | 80 | |
| Prior years | Prior years | (20) | | (31) | | (28) | |
| Total incurred | Total incurred | 44 | | 41 | | 52 | |
| Paid | Paid | |
| Current year | Current year | (8) | | (14) | | (12) | |
| Current year | |
| Current year | |
| Prior years | Prior years | (45) | | (51) | | (57) | |
| Total paid | Total paid | (53) | | (65) | | (69) | |
| Total accrued costs, end of year | Total accrued costs, end of year | $ | 205 | | $ | 214 | | $ | 238 | |
The following tables summarize workers' compensation liabilities on the consolidated balance sheets:
| | (in millions) | (in millions) | | December 31, 2020 | December 31, 2019 | (in millions) | | December 31, 2023 | December 31, 2022 |
| Total accrued costs, end of year | Total accrued costs, end of year | | $ | 205 | | $ | 214 | |
| Collateral paid to carriers and offset against accrued costs | Collateral paid to carriers and offset against accrued costs | | (8) | | (9) | |
| Total accrued costs, net of carrier collateral offset | Total accrued costs, net of carrier collateral offset | | $ | 197 | | $ | 205 | |
| Payable in less than 1 year (net of collateral paid to carriers of $3 as of December 31, 2020 and 2019) | | $ | 59 | | 61 |
Payable in more than 1 year (net of collateral paid to carriers of $5 and $6 as of December 31, 2020 and 2019, respectively) | | 138 | | 144 | |
Payable in less than 1 year (net of collateral paid to carriers of $1 and $2 as of December 31, 2023 and 2022, respectively) | |
Payable in less than 1 year (net of collateral paid to carriers of $1 and $2 as of December 31, 2023 and 2022, respectively) | |
Payable in less than 1 year (net of collateral paid to carriers of $1 and $2 as of December 31, 2023 and 2022, respectively) | | | $ | 50 | | 54 |
Payable in more than 1 year (net of collateral paid to carriers of $4 and $5 as of December 31, 2023 and 2022, respectively) | |
| Total accrued costs, net of carrier collateral offset | Total accrued costs, net of carrier collateral offset | | $ | 197 | | $ | 205 | |
Incurred claims related to prior years represent changes in estimates for ultimate losses on workers' compensation claims. For the years ended December 31, 2020, 20192023, 2022 and 2018,2021, the favorable development was primarilyis due to lower than expected reported claim frequency and severity development on claims that had previously been reported.for the more recent years.
As of December 31, 20202023 and 2019,2022, we had $45$32 million and $46$43 million respectively, of collateral held by insurance carriers of which $8$5 million and $9$7 million, respectively, was offset against accrued workers' compensation costs as the agreements permit and are net settled of insurance obligations against collateral held.
NOTE 8.7. LEASES
Our leasing activities predominantly consist of leasing office space that we occupy, which we have classified as operating leases. Our leases are comprised of fixed payments with remaining lease terms of 1 to 8 years, 1 of which includes an option to extend for up to 56 years. As of December 31, 2020,2023, we have not included any options to extend or cancel in the calculation of our lease liability or ROU asset. We do not have any significant residual value guarantees or restrictive covenants in our leases.
We recognized operating lease expense of $17$11 million, $19$15 million and $20$13 million for the years ended December 31, 2020, 20192023, 2022 and 2018,2021, respectively.
During For the yearyears ended December 31, 2020,2023 and 2022, we paid $2recognized $6 million and $20 million, respectively, of lease impairment due to reduce operating lease liabilities and recognized $2 million in new operating lease liabilities in exchange for ROU assets.
the closing of several offices. As of December 31, 2020,2023 and 2022, the weighted average remaining lease term on our operating leases was 5.8 years.3.8 years and 4.4 years, respectively. Future minimum lease payments as of December 31, 20202023 were as follows:
| | (in millions) | (in millions) | December 31, 2020 | |
| (in millions) | |
| (in millions) | |
| | 2021 | $ | 13 | | |
| 2022 | 13 | | |
| 2023 | 11 | | |
| 2024 | |
| | 2024 | |
| | 2024 | 2024 | 9 | | |
| 2025 | 2025 | 7 | | |
| 2026 and thereafter | 15 | | |
| 2025 | |
| 2025 | |
| 2026 | |
| 2026 | |
| 2026 | |
| 2027 | |
| 2027 | |
| 2027 | |
| 2028 | |
| 2028 | |
| 2028 | |
| 2029 and thereafter | |
| 2029 and thereafter | |
| 2029 and thereafter | |
| Total future minimum lease payments | |
| Total future minimum lease payments | |
| Total future minimum lease payments | Total future minimum lease payments | $ | 68 | | |
| Less: imputed interest | Less: imputed interest | (8) | | |
| Less: imputed interest | |
| Less: imputed interest | |
| Total operating lease liabilities | |
| Total operating lease liabilities | |
| Total operating lease liabilities | Total operating lease liabilities | $ | 60 | | |
| Current portion | Current portion | 11 | | |
| Current portion | |
| Current portion | |
| Non-current portion | Non-current portion | 49 | | |
| Non-current portion | |
| Non-current portion | |
NOTE 9.8. LONG-TERM DEBT AND REVOLVING CREDIT AGREEMENT BORROWINGS
AsThe following table summarizes our long-term debt and revolving credit agreement borrowings as of December 31, 20202023 and 2019, long-term debt consisted2022.
| | | | | | | | | | | | | | | | | | | | | | | |
| (Dollars in millions) | Annual contractual interest rate | Effective interest rate | Principal amount | Deferred issuance costs | Less: current portion | Long-term debt, noncurrent |
| December 31, 2023 | December 31, 2022 |
| | | | | | | |
| 2021 Revolver | 6.58 | % | 7.07 | % | $ | 200 | | $ | — | | $ | (109) | | $ | 91 | | $ | — | |
| 2029 Notes | 3.50 | % | 3.67 | % | $ | 500 | | $ | (3) | | $ | — | | $ | 497 | | $ | 496 | |
| 2031 Notes | 7.13 | % | 7.30 | % | $ | 400 | | $ | (4) | | $ | — | | $ | 396 | | $ | — | |
In March 2023, as a precaution to ensure we maintained liquidity during the uncertainty of the following:
| | | | | | | | |
| (in millions) | December 31,
2020 | December 31,
2019 |
| 2018 Term Loan A | 370 | | 392 | |
| Total term loans | 370 | | 392 | |
| Deferred loan costs | 0 | | (1) | |
| Less: current portion | (22) | | (22) | |
| Long-term debt, noncurrent | $ | 348 | | $ | 369 | |
| | |
| Annual contractual interest rate | 1.77 | % | 3.42 | % |
| Effective interest rate | 1.87 | % | 3.52 | % |
In June 2018February 2021, we issued $500 million aggregate principal of 3.50% senior unsecured notes maturing in March 2029 (our 2029 Notes). In August 2023, we issued $400 million aggregate principal of 7.125% senior unsecured notes maturing in August 2031 (our 2031 Notes). Interest payments on the 2031 Notes are due semi-annually in arrears on February 15 and August 15, beginning on February 15, 2024. We used the net proceeds to fund an equity tender offer and a private share repurchase, each of which were executed in the third quarter of 2023 (including the related fees and expenses).
We may voluntarily redeem all or a part of the 2031 Notes on or after August 15, 2026, on any one or more occasions, at the redemption prices set forth in the indenture governing the 2031 Notes, plus, in each case, accrued and unpaid interest thereon, if any, to, but excluding, the applicable redemption date. In addition, at any time prior to August 15, 2026, we may on any one or more occasions redeem up to 40% of the aggregate principal amount of the 2031 Notes outstanding under the indenture governing the 2031 Notes with the net cash proceeds of one or more equity offerings at a redemption price equal to 107.125% of the principal amount of the 2031 Notes then outstanding, plus accrued and unpaid interest thereon, if any, to, but excluding the applicable redemption date. At any time prior to August 15, 2026, we may also redeem all or a part of the 2031 Notes at a redemption price equal to 100% of the principal amount of the 2031 Notes redeemed plus a “make-whole” premium as of, and accrued and unpaid interest, if any, to, but excluding, the applicable redemption date.
In February 2021, concurrently with the closing of the 2029 Notes offering, we entered into a $425new $500 million term loan Arevolving facility (our 2018 Term Loan)2021 Revolver) under oura new credit agreement (2018(our 2021 Credit Agreement). The proceeds of the 2018 Term Loan were used to repay and our previously outstanding term loans.
The 2018 Credit Agreement includes a $250 million revolving credit facility (our 2018 Revolver), which could be used solely for working capital and other general corporate purposes. The 2018 Revolver includes capacity for a $20 million swingline facility.was terminated. Letters of credit issued pursuant to the revolving credit facility reduce the amount available for borrowing under the 2018 Revolver. At December 31, 2020, we had $16 million of letters of credit outstanding and remaining capacity of 234 million under the 20182021 Revolver.
InterestIn August 2023, concurrently with the issuance of the 2031 Notes, we amended certain provisions of our credit agreement, dated February 26, 2021, as amended, to, among other things (1) increasing the aggregate capacity under our 2021 Revolver from $500 million to $700 million and (2) extending the maturity date of our 2021 Revolver to August 16, 2028.
The annual interest rate for borrowings under our 2021 Revolver was previously calculated based on an applicable LIBOR tenor of our 2018 Term Loan is payable quarterly and is variablechoosing, plus a margin of 1.25% to 2.00%, or, at our option, the alternative base rate (ABR), plus a margin of 0.25% to 1.00%. In the second quarter of 2023, we replaced the interest rate based on LIBOR and related LIBOR-based mechanics with an interest rate based on the forward-looking Secured Overnight Financing Rate (Term SOFR). Term SOFR loans will be charged interest at the Term SOFR rate (subject to a 0.00% floor), plus 1.625% ora margin between 1.25% and 2.00%, depending on the primeCompany’s total net leverage ratio, plus a credit adjustment spread of 10 basis points for all tenors (such Term SOFR rate plus 0.625%, at our option, subject to certain rate adjustments based upon our total leverage ratio. At December 31, 2020, the interest rates were based on LIBOR plus 1.625%credit adjustment spread, the "Adjusted Term SOFR Rate"). We are required to pay a quarterly commitment fee on the daily unused amount of the commitments under our 2018 Revolver, as well as fronting fees and other customary fees for letters of credit issued under our 2018 Revolver, whichThe applicable Term SOFR or ABR margin is subject to adjustments based on our total leverage ratio.
Borrowings under our 2018 Term LoanTotal Leverage Ratio, as defined in the 2021 Credit Agreement. The ABR is the highest of (a) the applicable Federal Reserve Bank of New York rate in effect on such day (which rate is the greater of the Federal funds Effective Rate in effect on such day and 2018 Revolver are secured by substantially all of our assets, other than excluded assetsthe Overnight Bank Funding Rate in effect on such day), as defined in our 20182021 Credit Agreement which includes certain customary assets, assets heldplus 0.50% (b) the prime rate in trustseffect on such day, and (c) the Adjusted Term SOFR Rate for a one month interest period, as collateral and WSE related assets.
We are permittedpublished by two U.S. Government Securities Business Days prior to make voluntary prepayments at any time without payment of a premium. We are required to make mandatory prepayments of term loans (without payment of a premium) with (i) net cash proceeds from issuances of debt (other than certain permitted debt), and (ii) net cash proceeds from certain non-ordinary course asset sales and casualty and condemnation proceeds (subject to reinvestment rights and other exceptions)such day daily plus 1.00%. The interest rate
for 2023 borrowings under our 2021 Revolver was 6.582% - 8.125%. As of December 31, 2023, we had remaining capacity of $494 million under our 2021 Revolver.
In the event TriNet Group, Inc. receives a Corporate Issuer Credit Rating that is one level below investment grade rating or higher from at least two Nationally Recognized Statistical Rating Organizations, then rating based pricing applies and, for so long as rating-based pricing applies, irrespective of the Total Leverage Ratio, the Term SOFR margin will be 1.125% and the ABR margin will be 0.125%.
The 2018indenture governing our 2029 Notes and 2031 Notes each includes restrictive covenants limiting our ability to: (i) create liens on certain assets to secure debt; (ii) grant a subsidiary guarantee of certain debt without also providing a guarantee of the 2029 Notes or 2031 Notes, as applicable; and (iii) consolidate or merge with or into, or sell or otherwise dispose of all or substantially all of our assets to, another person, subject, in each case, to certain customary exceptions.
The 2021 Credit Agreement includes negative covenants that limit our ability to incur indebtedness and liens, sell assets and make restricted payments, including dividends and investments, subject to certain exceptions. In addition, the 2021 Credit Agreement also contains certain financialother customary affirmative and negative covenants and restrictive covenants customary for facilitiesevents of this type, including restrictions on indebtedness, liens, investments, mergers, dispositions, prepayment of indebtedness (other than our 2018 Term Loan and our 2018 Revolver), dividends, distributions and transactions with affiliates, as well as minimum interest coverage anddefault. The 2021 Credit Agreement also contains a financial covenant that requires the Company to maintain certain maximum total net leverage ratio requirements.ratios. We were in compliance with all financial covenants under the credit facilities2021 Credit Agreement, 2029 Notes and 2031 Notes at December 31, 2020.
The remaining balance of our 2018 Term Loan will be repaid in quarterly installments in aggregate annual amounts as follows:
| | | | | | | | | | | | | | | | | | | | |
| Year ending December 31, | |
| (in millions) | 2021 | 2022 | 2023 | 2024 | 2025 | Thereafter |
| Term loan repayments | $ | 22 | | $ | 22 | | $ | 326 | | $ | 0 | | $ | 0 | | $ | 0 | |
NOTE 10.9. COMMITMENTS AND CONTINGENCIES
Contingencies
On September 29, 2020, a class action was filed in the United States District Court for the Middle District of Florida against the directors of certain TriNet subsidiaries and other TriNet employees on behalf of a putative class of participants in two retirement plans available to TriNet’s eligible worksite employees, the TriNet 401(k) Plan and the TriNet Select 401(k) Plan (the “Plans”).Plan. The complaint is similar to claims recently brought against a number of employers including PEOs and generally alleges that the defendants violated certain fiduciary obligations to Plan participants under the Employee Retirement Income Security Act of 1974 with respect to overseeing plan investment and recordkeeping fees. These claims are inOn October 21, 2022, the early stages, and we are unablecourt issued an order declining to reasonably estimate any possible loss, or range of loss,certify a class with respect to this matter. We believeclaims against the TriNet 401(k) Plan, but certified a class with respect to claims are without merit.against the TriNet Select 401(k) Plan. On April 26, 2023, the court entered an order granting TriNet's motion for summary judgment on all remaining claims. No appeal was timely filed and the matter is closed.
We are and, from time to time, have been and may in the future become involved in various litigation matters, legal proceedings, and claims arising in the ordinary course of our business, including disputes with our clients or various class action, collective action, representative action, and other proceedings arising from the nature of our co-employment relationship with our clients and WSEs in which we are named as a defendant. In addition, due to the nature of our co-employment relationship with our clients and WSEs, we could be subject to liability for federal and state law violations, even if we do not participate in such violations. While our agreements with our clients contain indemnification provisions related to the conduct of our clients, we may not be able to avail ourselves of such provisions in every instance. We have accrued our current best estimates of probable losses with respect to these matters, which are individually and in aggregate immaterial to our consolidated financial statements.
While the outcome of the matters described above cannot be predicted with certainty, management currently does not believe that any such claims or proceedings will have a materially adverse effect on our consolidated financial position, results of operations, or cash flows. However, the unfavorable resolution of any particular matter or our reassessment of our exposure for any of the above matters based on additional information obtained in the future could have a material impact on our consolidated financial position, results of operations, or cash flows.
NOTE 11.10. STOCK BASED COMPENSATION
Equity Based Incentive Plans
Our 2019 Equity Incentive Plan and as amended and restated (the 2019 Plan), approved in May 2019, provides for the grant of stock awards, including stock options, RSUs, RSAs, and other stock awards. There were approximately 25 million shares available for grant under the 2019 Plan as of December 31, 2020.2023.
The 2009 Equity Incentive Plan (the 2009 Plan), was replaced by the 2019 Plan, except that any outstanding awards granted under the 2009 Plan remain in effect pursuant to their terms.
Stock Options
Stock options are granted to employees at exercise prices equal to the fair market value of our common stock on the dates of grant. Stock options generally have a maximum contractual term of 10 years. Stock options generally vest over 4 years, and are generally forfeited if the employee terminates service prior to vesting.
The following table summarizes stock option activity for the year ended December 31, 2020:2023:
| | | | | | | | | | | | | | |
| Number
of Shares | Weighted
Average
Exercise
Price | Weighted
Average
Remaining
Contractual
Term (in years) | Aggregate
Intrinsic
Value
(in millions) |
| Balance at December 31, 2019 | 462,011 | | $ | 13.90 | | 4.0 | $ | 20 | |
| | | | |
| Exercised | (81,026) | | 8.70 | | | |
| | | | |
| | | | |
| Canceled | (1,000) | | 0.50 | | | |
| Balance at December 31, 2020 | 379,985 | | $ | 15.10 | | 3.2 | $ | 25 | |
| Vested and exercisable at December 31, 2020 | 379,985 | | $ | 15.10 | | 3.2 | $ | 25 | |
| | | | |
| | | | | | | | | | | | | | |
| Number
of Shares | Weighted
Average
Exercise
Price | Weighted
Average
Remaining
Contractual
Term (in years) | Aggregate
Intrinsic
Value
(in millions) |
| Balance at December 31, 2022 | 190,275 | | $ | 20.50 | | 1.5 | $ | 9 | |
| | | | |
| Exercised | (182,067) | | 20.50 | | | 14 | |
| | | | |
| | | | |
| | | | |
Balance at December 31, 2023 (1) | 8,208 | | $ | 19.50 | | 0.45 | $ | 1 | |
| | | | |
| | | | |
| | | | |
| | | | | | | | | | | |
| Year Ended December 31, |
| Additional Disclosures for Stock Options (in millions) | 2020 | 2019 | 2018 |
| | | |
| Total fair value of options vested | $ | 0 | | $ | 1 | | $ | 4 | |
| Total intrinsic value of options exercised | 4 | | 9 | | 24 | |
| Cash received from options exercised | 1 | | 2 | | 7 | |
| | | | | | | | | | | |
| Year Ended December 31, |
| Additional Disclosures for Stock Options (in millions) | 2023 | 2022 | 2021 |
| | | |
| | | |
| Total intrinsic value of options exercised | 14 | | 8 | | 6 | |
| Cash received from options exercised | 4 | | 1 | | 1 | |
Restricted Stock Units (RSUs) and Restricted Stock Awards (RSAs)
Time-based RSUs and RSAs generally vest over a four-year term. Performance-based RSUs and RSAs are subject to vesting requirements and are earned, in part, based on certain financial performance metrics as defined in the grant notice. Actual number of shares earned may range from 0% to 200% of the target award. Performance-based awards granted in 20202023, 2022 and 20182021 are earned based on a single-year performance period subject to subsequent multi-year time-based vesting with 50% of the shares earned vesting in one year after the performance period and the remaining shares in the year after. The performance-based awards granted in 2019 were previously cancelled. RSUs and RSAs are generally forfeited if the participant terminates service prior to vesting.
The following tables summarize RSU and RSA activity for the year ended December 31, 2020:2023:
Time-based RSUs and RSAs
| | | Total Number of RSUs | |
| | Total Number of RSUs | Total Number of RSAs | Total Number of Shares | Weighted-Average Grant Date Fair Value |
| Nonvested at December 31, 2019 | 1,104,729 | | 61,136 | | 1,165,865 | | $ | 48.47 | |
| Total Number of RSUs | |
| | Total Number of RSUs | | | | Weighted-Average Grant Date Fair Value |
| Nonvested at December 31, 2022 | |
| Granted | Granted | 932,517 | | 0 | | 932,517 | | 54.00 | |
| Vested | Vested | (661,923) | | (27,170) | | (689,093) | | 45.02 | |
| Forfeited | Forfeited | (145,252) | | (3,940) | | (149,192) | | 51.86 | |
| Nonvested at December 31, 2020 | 1,230,071 | | 30,026 | | 1,260,097 | | $ | 54.04 | |
| Nonvested at December 31, 2023 | |
| | | | | | | | | | | |
| |
| Year Ended December 31, |
| Additional Disclosures for equity-based plans | 2020 | 2019 | 2018 |
| Total grant date fair value of shares granted (in millions) | $ | 50 | | $ | 38 | | $ | 38 | |
| Total grant date fair value of shares vested (in millions) | $ | 31 | | $ | 30 | | $ | 28 | |
| Shares withheld to settle payroll tax liabilities related to vesting of shares held by employees | 230,569 | | 315,762 | | 348,010 | |
| | | | | | | | | | | |
| |
| Year Ended December 31, |
| Additional Disclosures for equity-based plans | 2023 | 2022 | 2021 |
| Total grant date fair value of shares granted (in millions) | $ | 60 | | $ | 85 | | $ | 47 | |
| Total grant date fair value of shares vested (in millions) | $ | 47 | | $ | 42 | | $ | 34 | |
| Shares withheld to settle payroll tax liabilities related to vesting of shares held by employees | 213,569 | | 204,191 | | 207,603 | |
Performance-based RSUs and RSAs | | | | | | | | | |
| | |
| | Total Number Shares | Weighted-Average Grant Date Fair Value |
| Nonvested at December 31, 2022 | | 202,586 | | $ | 86.82 | |
| Granted | | 177,067 | | 79.05 | |
| Vested | | (156,642) | | 86.22 | |
| | | |
| | | |
| Nonvested at December 31, 2023 | | 223,011 | | $ | 81.08 | |
| | | | | | | | | | | | | | |
| |
| Total Number of RSUs | Total Number of RSAs | Total Number Shares | Weighted-Average Grant Date Fair Value |
| Nonvested at December 31, 2019 | 15,752 | | 114,857 | | 130,609 | | $ | 49.70 | |
| Granted | 183,981 | | 0 | | 183,981 | | 52.86 | |
| Vested | (12,742) | | (87,769) | | (100,511) | | 49.28 | |
| | | | |
| Forfeited | (19,864) | | (11,036) | | (30,900) | | 50.98 | |
| Nonvested at December 31, 2020 | 167,127 | | 16,052 | | 183,179 | | $ | 52.89 | |
| | | | | | | | | | | |
| |
| Year Ended December 31, |
| Additional Disclosures for equity-based plans | 2023 | 2022 | 2021 |
Total grant date fair value of shares granted (in millions) (1) | $ | 14 | | $ | 20 | | $ | 16 | |
| Total grant date fair value of shares vested (in millions) | $ | 14 | | $ | 17 | | $ | 8 | |
| Shares withheld to settle payroll tax liabilities related to vesting of shares held by employees | 74,923 | | 119,901 | | 77,787 | |
| | | | | | | | | | | |
| |
| Year Ended December 31, |
| Additional Disclosures for equity-based plans | 2020 | 2019 | 2018 |
| Total grant date fair value of shares granted (in millions) | $ | 10 | | $ | 4 | | $ | 14 | |
| Total grant date fair value of shares vested (in millions) | $ | 5 | | $ | 11 | | $ | 7 | |
| Shares withheld to settle payroll tax liabilities related to vesting of shares held by employees | 48,787 | | 135,877 | | 110,222 | |
Employee Stock Purchase Plan
Our 2014 Employee Stock Purchase Plan (ESPP) offers eligible employees an option to purchase shares of our common stock through payroll deductions. The purchase price is equal to the lesser of 85% of the fair market value of our common stock on the offering date or 85% of the fair market value of our common stock on the applicable purchase date. Offering periods are approximately six months in duration and will end on or about May 15 and November 15 of each year. The plan is considered to be a compensatory plan. As of December 31, 2020,2023, approximately 45 million shares were reserved for future issuances under the ESPP.
In applying the Black Scholes option valuation model for the ESPP options, we use the following assumptions:
| | Year Ended December 31, |
| Year Ended December 31, | | | Year Ended December 31, |
| (in millions) | (in millions) | 2020 | 2019 | 2018 | (in millions) | 2023 | 2022 | 2021 |
| Expected Term (in Years) | Expected Term (in Years) | 0.5 | 0.5 | Expected Term (in Years) | 0.5 | 0.5 |
| Expected Volatility | Expected Volatility | 40-83% | 27-42% | 27-37% | Expected Volatility | 29-35% | 21-39% | 21-35% |
| Risk-Free Interest Rate | Risk-Free Interest Rate | 0.2-1.6% | 1.6-2.5% | 1.42-2.5% | Risk-Free Interest Rate | 5.3-5.4% | 0.7-4.5% | 0.4-0.7% |
| Expected Dividend Yield | Expected Dividend Yield | 0 | % | 0 | % | 0 | % | Expected Dividend Yield | 0 | % | 0 | % | 0 | % |
| | Shares Issued under ESPP | Shares Issued under ESPP | 236,887 | | 207,324 | | 175,966 | |
| Shares Issued under ESPP | |
| Shares Issued under ESPP | |
Stock Based Compensation
Stock based compensation expense is measured based on the fair value of the stock award on the grant date and recognized over the requisite service period for each separately vesting portion of the stock award. Stock based compensation expense and other disclosures for stock based awards made to our employees pursuant to the equity plans were as follows:
| | | | Year Ended December 31, | | Year Ended December 31, |
| (in millions) | (in millions) | 2020 | 2019 | 2018 | (in millions) | 2023 | 2022 | 2021 |
| Cost of providing services | Cost of providing services | $ | 9 | | $ | 8 | | $ | 10 | |
| Sales and marketing | Sales and marketing | 6 | | 3 | | 8 | |
| General and administrative | General and administrative | 26 | | 28 | | 22 | |
| Systems development and programming costs | Systems development and programming costs | 2 | | 2 | | 4 | |
| Total stock based compensation expense | Total stock based compensation expense | $ | 43 | | $ | 41 | | $ | 44 | |
| Total stock based compensation capitalized | Total stock based compensation capitalized | $ | 1 | | $ | 1 | | $ | 0 | |
| Income tax benefit related to stock based compensation expense | Income tax benefit related to stock based compensation expense | $ | 9 | | $ | 11 | | $ | 11 | |
| Tax benefit realized from stock options exercised and similar awards | $ | 14 | | $ | 18 | | $ | 23 | |
| Tax benefit realized | |
The table below summarizes unrecognized compensation expense for the year ended December 31, 20202023 associated with the following:
| | | | | | | | |
| Amount
(in millions) | Weighted-Average Period (in Years) |
| | |
| Nonvested RSUs | $ | 63 | | 2.47 |
| Nonvested RSAs | 9 | | 2.00 |
| | | | | | | | |
| Amount
(in millions) | Weighted-Average Period (in Years) |
| | |
| Nonvested time based RSUs | $ | 92 | | 2.47 |
| Nonvested performance based RSUs | 10 | | 1.66 |
NOTE 12.11. STOCKHOLDERS' EQUITY
Common Stock
The following table shows the beginning and ending balances of our issued and outstanding common stock for the year ended December 31, 2020, 2019,2023, 2022, and 2018:2021:
| | | | | | | | | | | |
| Year Ended
December 31, |
| 2020 | 2019 | 2018 |
| Shares issued and outstanding, beginning balance | 69,065,491 | | 70,596,559 | | 69,818,392 | |
Issuance of common stock from vested restricted stock units (1) | 659,689 | | 1,036,119 | | 1,634,271 | |
| Issuance of common stock from exercise of stock options | 81,026 | | 187,504 | | 617,157 | |
| Issuance of common stock for employee stock purchase plan | 236,887 | | 207,324 | | 175,966 | |
| Repurchase of common stock | (3,307,074) | | (2,510,376) | | (1,190,995) | |
| Awards effectively repurchased for required employee withholding taxes | (279,356) | | (451,639) | | (458,232) | |
| Shares issued and outstanding, ending balance | 66,456,663 | | 69,065,491 | | 70,596,559 | |
(1) Net of shares of common stock underlying cancelled RSAs | | | | | | | | | | | |
| Year Ended
December 31, |
| 2023 | 2022 | 2021 |
| Shares issued and outstanding, beginning balance | 60,555,661 | | 65,968,224 | | 66,456,663 | |
| Issuance of common stock from vested restricted stock units | 774,579 | | 841,861 | | 748,881 | |
| Issuance of common stock from exercise of stock options | 182,067 | | 116,592 | | 73,118 | |
| Issuance of common stock for employee stock purchase plan | 175,446 | | 158,134 | | 136,861 | |
| Issuance of common stock for the acquisition of Zenefits | — | | 193,221 | | — | |
| Repurchase of common stock | (10,734,790) | | (6,398,279) | | (1,161,909) | |
| Awards effectively repurchased for required employee withholding taxes | (288,492) | | (324,092) | | (285,390) | |
| Shares issued and outstanding, ending balance | 50,664,471 | | 60,555,661 | | 65,968,224 | |
Stock Repurchases
In February 2020, our board of directors authorized a $300 million incremental increase to our ongoing stock repurchase program. In February 2022 and November 2022, our board of directors authorized a further $300 million and $200 million, respectively, incremental increase to this stock repurchase program. In February 2023 and July 2023, our board of directors authorized a further $300 million and $1 billion, respectively, incremental increase to this stock repurchase program. This repurchase authorization has no expiration.
On March 17, 2022, we completed a tender offer through which we repurchased 3,653,690 shares of common stock at a price of $86.50 per share, for total consideration of approximately $319 million, which includes costs directly attributable to the purchase. On December 6, 2022. we completed a second tender offer and purchased 1,515,258 shares of common stock at a price of $72.00 per share, for total consideration of approximately $111 million, which includes costs directly attributable to the purchase.
In August 2023, we completed a tender offer through which we repurchased 5,981,308 shares of common stock at a price of $107.00 per share, for total consideration of approximately $640 million. In September 2023, we repurchased 3,364,486 shares of common stock at a price of $107.00 per share, for total consideration of approximately $360 million, through a purchase agreement with our largest stockholder, Atairos Group, Inc. Atairos Group, Inc. agreed to proportionally sell additional shares so as to continue to beneficially own approximately 36% of the outstanding Shares immediately following the completion of the Closing.
We retire shares in the period they are acquired and account for the payment as a reduction to stockholders' equity.equity (retained deficit).
The following table summarizes the share repurchases under this program for the years ended December 31, 2020, 20192023, 2022 and 2018:2021:
| | Year Ended
December 31, |
| 2020 | 2019 | 2018 |
| Year Ended
December 31, | | | Year Ended
December 31, |
| 2023 | | | 2023 | 2022 | 2021 |
| Total cost (in millions) | Total cost (in millions) | $ | 178 | | $ | 140 | | $ | 61 | |
| Total shares | Total shares | 3,307,074 | | 2,510,376 | | 1,190,995 | |
| Average price per share | Average price per share | $ | 53.85 | | $ | 55.64 | | $ | 51.22 | |
As of December 31, 2020, $3582023, $433 million remains available for repurchase under all authorizations approved by the board of directors.
Dividends
NOTE 13.12. INCOME TAXES
Provision for Income Taxes
We are subject to tax in U.S. federal and various state and local jurisdictions, as well as Canada.Canada and India. We are open to federal and significant state income tax examinations for tax year 20162018 and subsequent years. The provision for income taxes consists of the following:
| | Year Ended December 31, |
| Year Ended December 31, | | | Year Ended December 31, |
| (in millions) | (in millions) | 2020 | 2019 | 2018 | (in millions) | 2023 | 2022 | 2021 |
| Current: | Current: | |
| Federal | |
| Federal | |
| Federal | Federal | $ | 96 | | $ | 53 | | $ | 41 | |
| State | State | 30 | | 12 | | 7 | |
| Foreign | Foreign | 1 | | 0 | | 0 | |
| Total Current | Total Current | 127 | | 65 | | 48 | |
| Deferred: | Deferred: | |
| Federal | Federal | (33) | | (2) | | (3) | |
| Federal | |
| Federal | |
| State | State | (9) | | (5) | | 4 | |
| | Foreign | |
| | Total Deferred | Total Deferred | (42) | | (7) | | 1 | |
| Total Deferred | |
| Total Deferred | |
| Total | Total | $ | 85 | | $ | 58 | | $ | 49 | |
The U.S. federal statutory income tax rate reconciled to our effective tax rate is as follows:
| | Year Ended December 31, |
| 2020 | 2019 | 2018 |
| Year Ended December 31, | | | Year Ended December 31, |
| 2023 | | | 2023 | 2022 | 2021 |
| (in millions, except percent) | (in millions, except percent) | Pre-Tax Income | Tax Expense/(Benefit) | Percent of Pre-Tax Income (Loss) | Pre-Tax Income | Tax Expense/(Benefit) | Percent of Pre-Tax Income (Loss) | Pre-Tax Income | Tax Expense/(Benefit) | Percent of Pre-Tax Income (Loss) | (in millions, except percent) | Pre-Tax Income | Tax Expense/(Benefit) | Percent of Pre-Tax Income (Loss) | Pre-Tax Income | Tax Expense/(Benefit) | Percent of Pre-Tax Income (Loss) | Pre-Tax Income | Tax Expense/(Benefit) | Percent of Pre-Tax Income (Loss) |
| $ | 357 | | | $ | 270 | | | $ | 241 | | |
| $ | |
| U.S. federal statutory tax rate | |
| U.S. federal statutory tax rate | |
| U.S. federal statutory tax rate | U.S. federal statutory tax rate | | $ | 75 | | 21 | % | | $ | 57 | | 21 | % | | $ | 51 | | 21 | % | | $ | 105 | | 21 | 21 | % | | $ | 101 | | 21 | 21 | % | | $ | 93 | | 21 | 21 | % |
| State income taxes, net of federal benefit | State income taxes, net of federal benefit | | 25 | | 7 | | | 20 | | 7 | | | 18 | | 8 | |
| | Tax rate change | |
| Tax rate change | |
| Tax rate change | |
| | Nondeductible meals, entertainment and penalties | |
| Nondeductible meals, entertainment and penalties | |
| Nondeductible meals, entertainment and penalties | Nondeductible meals, entertainment and penalties | | 0 | | 0 | | | 1 | | 0 | | | 1 | | 0 | |
| Stock based compensation | Stock based compensation | | (2) | | 0 | | | (1) | | 0 | | | (9) | | (4) | |
| Uncertain tax positions | Uncertain tax positions | | 1 | | 0 | | | 0 | | 0 | | | 1 | | 0 | |
| Tax credits | Tax credits | | (6) | | (2) | | | (7) | | (3) | | | (5) | | (2) | |
| | State and tax return to provision adjustments | State and tax return to provision adjustments | | (7) | | (2) | | | (8) | | (3) | | | (7) | | (3) | |
| Sec 199 benefits | | 0 | | 0 | | | (1) | | 0 | | | 0 | | 0 | |
| | State and tax return to provision adjustments | |
| | State and tax return to provision adjustments | |
| | Other | |
| | Other | |
| | Other | Other | | (1) | | 0 | | | (3) | | (1) | | | (1) | | 0 | |
| Total | Total | | $ | 85 | | 24 | % | | $ | 58 | | 21 | % | | $ | 49 | | 20 | % | Total | | $ | 126 | | 25 | 25 | % | | $ | 127 | | 26 | 26 | % | | $ | 103 | | 23 | 23 | % |
Our effective income tax rate increaseddecreased by 3%1% to 24%25% in 20202023 from 21%26% in 2019.2022. The increasedecrease was primarily attributabledue to a decreasean increase in excludable income for state tax purposes aand an increase in tax benefits related to stock-based compensation. decrease in
The Inflation Reduction Act enacted on August 16, 2022 introduced new provisions including an excise tax creditson net stock repurchases made after December 31, 2022.
Global tax developments from the Organization for Economic Cooperation and Development proposes implementation of a benefit recorded inglobal minimum tax under the prior year from changes in valuation allowance.Pillar Two model rules. Management has determined this development applicable to multinational businesses does not have a material impact to our business, cash flows, or financial results.
Deferred Income Taxes
Significant components of our deferred tax assets and liabilities are as follows:
| | Year Ended December 31, |
| Year Ended December 31, | | | Year Ended December 31, |
| (in millions) | (in millions) | 2020 | 2019 | (in millions) | 2023 | 2022 |
| Deferred tax assets: | Deferred tax assets: | |
| Net operating losses (federal and state) | |
| Net operating losses (federal and state) | |
| Net operating losses (federal and state) | Net operating losses (federal and state) | $ | 3 | | $ | 3 | |
| Accrued expenses | Accrued expenses | 14 | | 8 | |
| Accrued workers' compensation costs | Accrued workers' compensation costs | 9 | | 9 | |
| Recovery credit | Recovery credit | 26 | | 0 | |
| Operating lease liabilities | Operating lease liabilities | 15 | | 17 | |
| Stock based compensation | Stock based compensation | 3 | | 3 | |
| Tax benefits relating to uncertain positions | Tax benefits relating to uncertain positions | 1 | | 1 | |
| Tax credits (federal and state) | 8 | | 7 | |
| Tax credits (federal, state and foreign) | |
| Section 174 Capitalized R&D | |
| Other | | Other | 2 | | 3 |
| | Total | |
| Total | |
| Total | Total | 79 | | 48 | |
| Valuation allowance | Valuation allowance | (5) | | (5) | |
| Total deferred tax assets | Total deferred tax assets | 74 | | 43 | |
| Deferred tax liabilities: | Deferred tax liabilities: | |
| Depreciation and amortization | Depreciation and amortization | (37) | | (27) | |
| Deferred service revenues | (20) | | (41) | |
| Depreciation and amortization | |
| Depreciation and amortization | |
| | Prepaid commission expenses | |
| | Prepaid commission expenses | |
| | Prepaid commission expenses | Prepaid commission expenses | (22) | | (19) | |
| Operating lease right-of-use assets | Operating lease right-of-use assets | (13) | | (15) | |
| Other | (2) | | (1) | |
| | Total deferred tax liabilities | |
| Total deferred tax liabilities | |
| Total deferred tax liabilities | Total deferred tax liabilities | (94) | | (103) | |
| Net deferred tax liabilities | Net deferred tax liabilities | $ | (20) | | $ | (60) | |
As of December 31, 2020,2023 and 2022, we have an acquired federal net operating loss of $1 million and $2 million, ofrespectively, which an immaterial amount, if unused, will expire in 2028 and the rest can be carried forward indefinitely. We have capital loss carryforwards of $3 million which will expire in 2027. As of December 31, 20202023 and 2019,2022, we have various state net operating loss carryforwards of $39$91 million and $53$94 million, respectively, most of which, if unused, will expire in years 20212024 through 2039 with the exception of an immaterial amount that will be carried forward indefinitely.2043. As of December 31, 20202023 and 2019,2022, we have state tax credit carryforwards (net of federal benefit) of $6$5 million and $6 million, respectively available that will begin expiring in 2021, which are offset by a valuation allowance2026. In addition, Canada tax credit carryforwards of $4$2 million and $4 million as of December 31, 2020 and 2019, respectively.
The provision for income taxes for the year ended December 31, 2020 included $4 million of excess tax benefits resulting from equity incentive plan activities.
We previously paid Notices of Proposed Assessments disallowing employment tax credits totaling $11 million, plus interest of $4 millionwill begin expiring in connection with the IRS examination of Gevity HR, Inc. and its subsidiaries, which was acquired by TriNet in June 2009. TriNet filed suit in June 2016 to recover the disallowed credits, and the issue is being resolved through the litigation process. TriNet and the U.S. filed cross motions for summary judgment in federal district court. On September 17, 2018, the district court granted our motion for summary judgment and denied the U.S.'s motion. On January 18, 2019, the district court entered judgment in favor of TriNet in the amount of $15 million, plus interest. The U.S. filed a notice of appeal of the federal district court's decision on March 18, 2019. The U.S. filed its opening brief in the court of appeals on June 10, 2019 and we filed our answering brief on July 24, 2019 to which the government filed its reply brief on September 6, 2019. Oral arguments occurred on March 11, 2020. On November 5, 2020, the court of appeals affirmed the district court’s judgement in favor of TriNet. The IRS has 150 days to petition the Supreme Court. We will continue to vigorously defend our position through the litigation process. Given the uncertainty of the outcome of any appeal, it remains possible that our recovery of the refund will be less than the total amount in dispute.2037.
Valuation Allowance
We have recorded a valuation allowance to reflect the estimated amount of deferred tax assets that may not be realized.realized, related to state tax credits, state net operating loss and capital loss carryforwards. A reconciliation of the beginning and ending amount of the valuation allowance is presented in the table below:
| | Year Ended December 31, |
| Year Ended December 31, | | | Year Ended December 31, |
| (in millions) | (in millions) | 2020 | 2019 | 2018 | (in millions) | 2023 | 2022 | 2021 |
| Valuation allowance at January 1 | Valuation allowance at January 1 | $ | 5 | | $ | 7 | | $ | 7 | |
| Credited/ charged to net income | 0 | | (2) | | 0 | |
| Charged to net income | |
| | Valuation allowance at December 31 | Valuation allowance at December 31 | 5 | | 5 | | 7 | |
| Valuation allowance at December 31 | |
| Valuation allowance at December 31 | |
Uncertain Tax Positions
As of December 31, 2020 and 2019, the total unrecognized tax benefits related to uncertain income tax positions, which would affect the effective tax rate if recognized, were $8 million and $7 million, respectively.
A reconciliation of the beginning and ending amount of unrecognized tax benefits (excluding interest and penalties) related to uncertain income tax provisions, which would affect the effective tax rate if recognized, is presented in the table below:
| | Year Ended December 31, |
| Year Ended December 31, | | | Year Ended December 31, |
| (in millions) | (in millions) | 2020 | 2019 | 2018 | (in millions) | 2023 | 2022 | 2021 |
| Unrecognized tax benefits at January 1 | Unrecognized tax benefits at January 1 | $ | 7 | | $ | 6 | | $ | 6 | |
| Additions for tax positions of prior periods | 1 | | 1 | | 1 | |
| | Additions for tax positions of current period | |
| Additions for tax positions of current period | |
| Additions for tax positions of current period | Additions for tax positions of current period | 1 | | 1 | | 0 | |
| | Reductions for tax positions of prior period: | Reductions for tax positions of prior period: | |
| Settlements with taxing authorities | (1) | | 0 | | 0 | |
| Reductions for tax positions of prior period: | |
| Reductions for tax positions of prior period: | |
| | Lapse of applicable statute of limitations | Lapse of applicable statute of limitations | 0 | | (1) | | (1) | |
| | Lapse of applicable statute of limitations | |
| | Lapse of applicable statute of limitations | |
| | Adjustments to tax positions | |
| Adjustments to tax positions | |
| Adjustments to tax positions | |
| Unrecognized tax benefits at December 31 | Unrecognized tax benefits at December 31 | $ | 8 | | $ | 7 | | $ | 6 | |
As of December 31, 20202023 and 2019,2022, the total amount of gross interest and penalties accrued were immaterial. The unrecognized tax benefit, including accrued interest and penalties, is included in other non-current liabilities on the consolidated balance sheets.
It is reasonably possible the amount of the unrecognized benefit could increase or decrease within the next twelve months, which would have an impact on net income.
NOTE 14.13. EARNINGS PER SHARE
Basic EPS is computed based on the weighted average shares of common stock outstanding during the period. Diluted EPS is computed based on those shares used in the basic EPS computation, plus potentially dilutive shares issuable under our equity-based compensation plans using the treasury stock method. Shares that are potentially anti-dilutive are excluded.
The following table presents the computation of our basic and diluted EPS attributable to our common stock:
| | | | Year Ended December 31, | | Year Ended December 31, |
| (in millions, except per share data) | (in millions, except per share data) | 2020 | 2019 | 2018 | (in millions, except per share data) | 2023 | 2022 | 2021 |
| Net income | Net income | $ | 272 | | $ | 212 | | $ | 192 | |
| Weighted average shares of common stock outstanding | Weighted average shares of common stock outstanding | 67 | | 70 | | 70 | |
| Basic EPS | Basic EPS | $ | 4.03 | | $ | 3.04 | | $ | 2.72 | |
| | Net income | Net income | $ | 272 | | $ | 212 | | $ | 192 | |
| Net income | |
| Net income | |
| Weighted average shares of common stock outstanding | Weighted average shares of common stock outstanding | 67 | | 70 | | 70 | |
| Dilutive effect of stock options and restricted stock units | Dilutive effect of stock options and restricted stock units | 1 | | 1 | | 2 | |
| Weighted average shares of common stock outstanding | Weighted average shares of common stock outstanding | 68 | | 71 | | 72 | |
| Diluted EPS | Diluted EPS | $ | 3.99 | | $ | 2.99 | | $ | 2.65 | |
| Common stock equivalents excluded from income per diluted share because of their anti-dilutive effect | Common stock equivalents excluded from income per diluted share because of their anti-dilutive effect | 1 | | 1 | | 1 | |
Common stock equivalents excluded from income per diluted share because of their anti-dilutive effect | |
Common stock equivalents excluded from income per diluted share because of their anti-dilutive effect | |
NOTE 15.14. 401(k) PLAN
The Company maintains a defined contribution 401(k) plan for the benefit of corporate employees. Under our 401(k) plan, eligible employees may elect to contribute based on their eligible compensation. The Company matches a portion of employee contributions, which amounted to $12$17 million, $14 million, and $11$15 million for the years ended December 31, 2020, 2019,2023, 2022, and 2018,2021, respectively.
We also maintain multiple employer defined contribution plans, which cover WSEs for client companies electing to participate in the plan and for their internal staff employees. We contribute, on behalf of each participating client, varying amounts based on the clients’ policies and serviced employee elections.
NOTE 16.15. RELATED PARTY TRANSACTIONS
We have service agreements with certain stockholders that we process their employees' payrolls and payroll taxes. From time to time, we also enter into sales and purchases agreements with various companies that have a relationship with our executive officers or members of our board of directors. The relationships are typically equity investment firm clients on which a board member serves in an executive role, an equity investment by those firms in a client/vendor company, or other clients/vendors on which our executive officer or board member serves as a member of the client/vendor company's board of directors. We have received $22$12 million, $25$16 million, and $20$14 million in total revenues from such related parties during the years ended December 31, 2020, 20192023, 2022 and 2018,2021, respectively.
We have also entered into various software license agreements with software service providers who have board members in common with us. We paid the software service providers $1$3 million, $10$2 million, and $5$2 million during the years ended December 31, 2020, 20192023, 2022 and 2018,2021, for services we received, respectively.
NOTE 17. ACQUISITION16. ACQUISITIONS
In July 2020,Zenefits
On February 15, 2022, the Company acquired all of the shares outstanding equity of Little BirdZenefits, a leading cloud HR Inc. ("Little Bird"),platform which provides innovative and intuitive HR, benefits, payroll and employee engagement software purpose-built for small and medium-size businesses. We believe the acquisition of Zenefits and its cloud-based HRIS software allows us to diversify our product and service offerings to all SMBs without using a privately held PEO specializing in benefitsco-employment model, and human resource solutions forenables us to dynamically service SMBs throughout their lifecycle and expand the education institution industry in the Greater New York area and East Coast region. This acquisition reflects our ability to identify attractive verticals and industries where our value proposition is particularly well-suited.customers we serve.
The Company recorded the acquisition using the acquisition method of accounting for business combinations in accordance with ASC 805 and recognized identifiable assets acquired and liabilities assumed at their fair value as of the date of acquisition, withacquisition. We measure goodwill as the excess recorded to goodwill. Theof the cash and stock consideration transferred, which we also measure at fair value, over the net of the acquisition date fair values of the identifiable assets acquired and liabilities assumed may changeassumed.
The purchase price was as follows:
| | | | | | |
| (in millions) | Amount | |
| Cash and stock consideration per agreement | $ | 220 | | |
| Closing adjustments | 3 | | |
| Total consideration payable | 223 | | |
| Less: Unvested Zenefits restricted stock | (14) | | |
| Total purchase price | $ | 209 | | |
The purchase price consisted of cash consideration paid of $192 million and 193,221 shares of TriNet common stock with a fair value of $17 million. In accordance with the merger agreement, certain holders of Zenefits stock received cash in lieu of stock. Holders of unvested Zenefits restricted stock received their pro-rata share of the consideration, payable in cash quarterly over 18 months, and was generally forfeited if the employee terminated service prior to vesting. This amount will be recorded as G&A expense over the measurement period18-month service period. Acquisition-related costs are recorded as additional information is received. The measurement period will end no later than one year fromG&A expense for the acquisition date.years ended December 31, 2023 and 2022 and were not material.
The following table summarizes the major classesfair value of the net assets acquired:acquired and allocation of the purchase price:
| | | | | | |
| (in millions) | December 31, 2020Amount | |
Accounts receivableTotal purchase price | $ | 2209 | | |
| | |
Customer contact listAsset Acquired: | | |
| Cash | 8 $ | 4 | |
| | |
GoodwillRestricted cash | 5 | | |
| Accounts receivable, net | 4 | | |
| Intangible assets | 96 | | |
| Operating lease right-of-use asset | 9 | | |
| Deferred tax asset | 2 | | |
| Other assets | 5 | | |
| Total assets acquired | 125 | | |
| | |
| Liabilities Assumed | | |
| Accounts payable and other current liabilities | $ | 9 | | |
| Deferred revenue | 13 | | |
| Operating lease liabilities | 15 | | |
| Deferred taxes | 18 | | |
| Total liabilities assumed | 55 | | |
| Net assets acquired | $ | 70 | | |
| | |
| Goodwill at acquisition | $ | 139 | | |
| Measurement period adjustments | (3) | | |
| Goodwill at December 31, 2022 | $ | 136 | | |
Goodwill represents future economic benefits we expect to achieve as a result of the acquisition, including revenue and cost synergies from our complementary business models. The results from this acquisitionof Zenefits have been included in the Company'sour consolidated financial statements since the closing of the acquisition. Pro forma financial information was not presented because the effect of the acquisition was not material to the Company'sour results of operations and financial condition. The goodwill associated with the acquisition is not deductible for income tax purposes.
The intangible assets acquired were as follows:
| | | | | | | | | |
| (in millions) | Amount | Estimated Useful Life | |
| Acquired technology | $ | 56 | | 6 years | |
| Customer relationships | 40 | | 7 years | |
| Total intangible assets | $ | 96 | | | |
Clarus R+D
On September 1, 2022, the Company acquired all of the shares outstanding of Clarus R+D, a provider of technology enabled tax expertise and services to SMBs claiming state and federal R&D tax credits. We believe the acquisition of Clarus R+D and its cloud-based software will allow us to provide additional services to our PEO Services and HCM Cloud Services customers.
87The Company recorded the acquisition using the acquisition method of accounting for business combinations in accordance with ASC 805 and recognized identifiable assets acquired and liabilities assumed at their fair value as of the date of acquisition. We measure goodwill as the excess of the cash and stock consideration transferred, which we also measure at fair value, over the net of the acquisition date fair values of the identifiable assets acquired and liabilities assumed. The values assigned to the assets acquired and liabilities assumed are based on preliminary estimates of fair value available as of the date of this Annual Report on Form 10-K and may change over the measurement period as the analysis of the assets acquired and liabilities assumed is finalized and additional information is received. The measurement period has ended as of December 31, 2023.
The total purchase price consisted of cash consideration paid of $48 million. Acquisition-related costs are recorded as G&A expense for the years ended December 31, 2023 and 2022 and were not material. In connection with the acquisition, we issued an immaterial amount of RSUs to the Clarus R+D employees who are required to provide ongoing services to vest.
The following table summarizes the fair value of the net assets acquired and preliminary allocation of the purchase price:
| | | | | | |
| (in millions) | Amount | |
| Total purchase price | $ | 48 | | |
| | |
| Asset Acquired: | | |
| Cash | $ | 3 | | |
| Accounts receivable, net | 3 | | |
| Intangible assets | 14 | | |
| Total assets acquired | 20 | | |
| | |
| Liabilities Assumed | | |
| Accounts payable and other current liabilities | $ | 1 | | |
| Deferred taxes | 3 | | |
| Total liabilities assumed | 4 | | |
| Net assets acquired | $ | 16 | | |
| | |
| Goodwill at acquisition | $ | 32 | | |
| | |
| Goodwill at December 31, 2022 | $ | 32 | | |
Goodwill represents future economic benefits we expect to achieve as a result of the acquisition, including revenue and cost synergies from our complementary business models. The results of Clarus R+D have been included in our consolidated financial statements since the closing of the acquisition. Pro forma financial information was not presented because the effect of the acquisition was not material to our results of operations and financial condition. The goodwill associated with the acquisition is not deductible for income tax purposes.
The intangible assets acquired were as follows:
| | | | | | | | | |
| (in millions) | Amount | Estimated Useful Life | |
| Acquired technology | $ | 9 | | 6 years | |
| Customer relationships | 5 | | 3 - 5 years | |
| Total intangible assets | $ | 14 | | | |
| | | | | |
| DISCLOSURE CONTROLS AND PROCEDURES | |
Item 9. Changes in and Disagreements with Accountants on Accounting and Financial Disclosure.
None.
Item 9A. Controls and Procedures
Evaluation of Disclosure Controls and Procedures
We have, with the participation of our Chief Executive Officer and our Chief Financial Officer, evaluated the effectiveness of our disclosure controls and procedures as of December 31, 2020,2023, as defined in Rules 13a-15(e) and 15d-15(e) under the Securities Exchange Act of 1934, as amended (the Exchange Act).
Based on the evaluation of our disclosure controls and procedures as of December 31, 2020,2023, our Chief Executive Officer and Chief Financial Officer have concluded that the Company’s disclosure controls and procedures were effective as of December 31, 20202023 in ensuring that
i.information required to be disclosed by the Company in reports that it files or submits under the Exchange Act is accumulated and communicated to the Company’s management, including the Chief Executive Officer and Chief Financial Officer, to allow timely decisions regarding required disclosure and
ii.such information is recorded, processed, summarized and reported within the time periods specified in the Securities and Exchange Commission's rules and forms.
Management’s Report on Internal Control Over Financial Reporting
We are responsible for establishing and maintaining adequate internal control over financial reporting as defined in Rules 13a-15(f) and 15d-15(f) promulgated under the Exchange Act to provide reasonable assurance regarding the reliability of financial reporting and the preparation of the financial statements for external purposes in accordance with GAAP.
Due to inherent limitations, internal control over financial reporting is not intended to provide absolute assurance that a misstatement of our financial statements would be prevented or detected. Also, projections of any evaluation of effectiveness to future periods are subject to the risk that controls may become inadequate because of changes in conditions or that the degree of compliance with policies or procedures may deteriorate.
We have performed an assessment of the effectiveness of our internal control over financial reporting as of December 31, 20202023 based upon criteria set forth in Internal Control - Integrated Framework (2013) issued by the Committee of Sponsoring Organizations of the Treadway Commission.
Based on this assessment, we determined that our internal control over financial reporting was effective as of December 31, 2020.2023.
Deloitte & Touche LLP, our independent registered public accounting firm, has issued an audit report on the effectiveness of our internal control over financial reporting as of December 31, 2020.2023. This audit report appears in Part II, Item 8. Financial Statements and Supplementary Data, of this Form 10-K.
Changes in Internal Control Over Financial Reporting
There were no changes in our internal control over financial reporting that occurred during the three months ended December 31, 20202023 that have materially affected, or are reasonably likely to materially affect, our internal control over financial reporting.
Item 9B. Other Information.
Not applicable.On November 6, 2023, Paul Chamberlain, a member of the Board of Directors, adopted a new written trading plan intended to satisfy the affirmative defense conditions of Rule 10b5-1(c) under the Exchange Act (the “Chamberlain Plan”). The first possible trade date under the Chamberlain Plan is February 20, 2024, and the end date of the Chamberlain Plan is November 10, 2024 (subject to customary exceptions), for a duration of approximately one year. The Chamberlain Plan provides for the sale of up to 2,875 shares of the Company’s common stock.
| | | | | |
| DISCLOSURE CONTROLS AND PROCEDURES | |
Item 9C. Disclosure Regarding Foreign Jurisdictions that Prevent Inspections.
Not applicable.
| | | | | |
| MANAGEMENT AND CERTAIN SECURITY HOLDERS | |
PART III
Item 10. Directors, Executive Officers and Corporate Governance.
Information required by this item is incorporated by reference to TriNet Group Inc.’s Proxy Statement for its 20212024 Annual Meeting of Stockholders to be filed with the SEC within 120 days after the end of the year ended December 31, 2020.2023.
Item 11. Executive Compensation.
Information required by this item is incorporated by reference to TriNet Group Inc.’s Proxy Statement for its 20212024 Annual Meeting of Stockholders to be filed with the SEC within 120 days after the end of the year ended December 31, 2020.2023.
Item 12. Security Ownership of Certain Beneficial Owners and Management and Related Stockholder Matters.
Information required by this item is incorporated by reference to TriNet Group Inc.’s Proxy Statement for its 20212024 Annual Meeting of Stockholders to be filed with the SEC within 120 days after the end of the year ended December 31, 2020.2023.
Item 13. Certain Relationships and Related Transactions, and Director Independence.
Information required by this item is incorporated by reference to TriNet Group Inc.’s Proxy Statement for its 20212024 Annual Meeting of Stockholders to be filed with the SEC within 120 days after the end of the year ended December 31, 2020.2023.
Item 14. Principal AccountingAccountant Fees and Services.
Information required by this item is incorporated by reference to TriNet Group Inc.’s Proxy Statement for its 20212024 Annual Meeting of Stockholders to be filed with the SEC within 120 days after the end of the year ended December 31, 2020.2023.
| | | | | |
| FINANCIAL STATEMENT SCHEDULES | |
PART IV
Item 15. Exhibits, Financial Statement Schedules.
(a) The following documents are filed as a part of the report:
(1) The financial statements filed as part of this report are listed in the “Index to Financial Statements” under Part II, Item 8. Financial Statements and Supplementary Data.
(2) Financial statement schedules have been omitted, since the required information is not applicable or is not present in amounts sufficient to require submission of the schedule, or because the information required is included in the consolidated financial statements and accompanying notes included in this Form 10-K.
Item 16. Form 10-K Summary.
None.
EXHIBIT INDEX
| | Incorporated by Reference | | |
| | | | Incorporated by Reference | |
Exhibit No. | |
Exhibit No. | |
Exhibit No. | Exhibit No. | | Description of Exhibit | | Form | | File No. | | Exhibit | | Filing | | Filed Herewith | | Description of Exhibit | | Form | | File No. | | Exhibit | | Filing | | Filed Herewith |
| | 3.1 | 3.1 | | | | 8-K | | 001-36373 | | 3.1 | | 4/1/2014 | | |
| 3.1 | |
| 3.1 | | | | | 8-K | | 001-36373 | | 3.1 | | 5/30/2023 | | |
| | | 3.2 | 3.2 | | | | 10-Q | | 001-36373 | | 3.1 | | | 11/2/2017 | |
| | 3.3 | | | | S-1/A | | 333-192465 | | 3.4 | | | 3/4/2014 | | |
| | 3.2 | |
| | 3.2 | | | | | 8-K | | 001-36373 | | 3.4 | | | 3/27/2023 | | |
| | 4.1 | |
| 4.1 | |
| 4.1 | 4.1 | | | | 8-K | | 001-36373 | | 4.1 | | | 2/2/2017 | |
| | 4.2 | 4.2 | | | | 10-K | | 001-36373 | | 4.2 | | | 2/13/2020 | |
| | 4.2 | |
| | 4.2 | |
| | 4.3 | |
| | 4.3 | |
| | 4.3 | |
| | 4.4 | |
| | 4.4 | |
| | 4.4 | |
| | 4.5 | |
| | 4.5 | |
| | 4.5 | |
| | 4.6 | |
| | 4.6 | |
| | 4.6 | |
| | 4.7 | |
| | 4.7 | |
| | 4.7 | |
| | 4.8 | |
| | 4.8 | |
| | 4.8 | |
| | 4.9 | |
| | 4.9 | |
| | 4.9 | |
| | 4.10 | |
| | 4.10 | |
| | 4.10 | |
| | 10.1* | 10.1* | | | | S-1/A | | 333-192465
| | 10.3 | | 3/14/2014 | |
| | 10.1* | |
| | 10.1* | |
| | | 10.2* | 10.2* | |
| | 10-Q | | 001-36373 | | 10.1 | | 5/8/2015 | |
| | | 10.2* | |
| | 10.2* | |
| | 10.3* | 10.3* | | | | S-1/A | | 333-192465 | | 10.4 | | | 3/4/2014 | |
| | 10.4* | | | | S-1/A | | 333-192465 | | 10.6 | | | 3/4/2014 | |
| | 10.5* | | | | 10-Q | | 001-36373 | | 10.1 | | | 4/30/2018 | |
| | 10.6* | | | | 10-Q | | 001-36373 | | 10.2 | | | 4/30/2018 | |
| 10.3* | |
| | 10.7* | | | | 10-Q | | 001-36373 | | 10.3 | | | 4/30/2018 | |
| | 10.8* | |
| | 10-Q | | 001-36373 | | 10.4 | | | 4/30/2018 | |
| | 10.9* | | | | 10-Q | | 001-36373 | | 10.2 | | | 4/29/2019 | |
| 10.3* | |
| |
| | | | | Incorporated by Reference | |
Exhibit No. | |
Exhibit No. | |
Exhibit No. | | | Description of Exhibit | | Form | | File No. | | Exhibit | | Filing | | Filed Herewith |
| 10.4* | |
| | | Incorporated by Reference | | |
Exhibit No. | | Description of Exhibit | | Form | | File No. | | Exhibit | | Filing | | Filed Herewith |
| | 10.5* | |
| | 10.5* | |
| | 10.5* | |
| | 10.6* | |
| | 10.6* | |
| | 10.6* | |
| | 10.7* | |
| | 10.7* | |
| | 10.7* | |
| | 10.8* | |
| | 10.8* | |
| | 10.8* | |
| | 10.9* | |
| | 10.9* | |
| | 10.9* | | | | | S-1/A | | 333-192465 | | 10.7 | | 3/14/2014 | | |
| | 10.10* | |
| 10.10* | |
| 10.10* | 10.10* | | | | 10-Q | | 001-36373 | | 10.3 | | | 4/29/2019 | |
| | 10.11* | 10.11* | | | | 10-Q | | 001-36373 | | 10.1 | | | 7/25/2019 | |
| | 10.11* | |
| | 10.11* | |
| | 10.12* | 10.12* | | | | 10-Q | | 001-36373 | | 10.4 | | | 4/28/2020 | |
| | 10.13* | | | | 10-Q | | 001-36373 | | 10.2 | | 4/28/2020 | |
| | 10.12* | |
| | 10.12* | |
| | 10.13 | |
| | 10.13 | |
| | 10.13 | |
| | 10.14* | 10.14* | | | | 10-Q | | 001-36373 | | 10.3 | | 4/28/2020 | |
| | 10.14* | |
| | 10.14* | |
| | 10.15* | 10.15* | | | | S-1/A | | 333-192465 | | 10.7 | | 3/14/2014 | | |
| | | 10.15* | |
| | 10.15* | |
| | 10.16* | 10.16* | | | | 8-K | | 001-36373 | | N/A | | 3/11/2015 | |
| | 10.16* | |
| | 10.16* | |
| | 10.17* | |
| | 10.17* | |
| | | 10.17* | 10.17* | | | | 8-K | | 001-36373 | | 10.1 | | 11/19/2020 | |
| | 10.18* | 10.18* | | | | 10-K | | 001-36373 | | 10.10 | | 4/1/2016 | |
| | 10.18* | |
| | 10.18* | |
| | 10.19* | |
| | 10.19* | |
| | 10.19* | 10.19* | | | | 8-K | | 001-36373 | | 10.1 | | 5/23/2017 | |
| | 10.20* | 10.20* | | | | 10-Q | | 001-36373 | | 10.5 | | 4/30/2018 | |
| | 10.21 | | | | S-1/A | | 333-192465 | | 10.8 | | 3/4/2014 | |
| 10.20* | |
| | 10.22* | | | | S-1/A | | 333-192465 | | 10.9 | | 2/13/2014 | |
| 10.20* | |
| | 10.23* | | | | 10-Q | | 001-36373 | | 10.1 | | | 8/1/2017 | |
| | 10.24 | | | | 10-Q | | 001-36373 | | 10.1 | | | 4/28/2020 | |
| | 10.25* | | | | 10-Q | | 001-36373 | | 10.2 | | 8/1/2017 | |
| | 10.26* | | | | 10-K | | 001-36373 | | 10.15 | | 2/27/2018 | | |
| | | | | | | | | | | | | | | | | | | | | | | | | | | | | | | | | | | | | | |
| | | | Incorporated by Reference | | |
Exhibit
No.
| | Description of Exhibit | | Form | | File No. | | Exhibit | | Filing | | Filed
Herewith
|
| | | | | | | | | | | | |
10.27* | | | | 10-K | | 001-36373 | | 10.22 | | 2/14/2019 | | |
| | | | | | | | | | | | |
10.28* | | | | 10-Q | | 001-36373 | | 10.1 | | 7/27/2020 | | |
| | | | | | | | | | | | |
10.29* | | | | 8-K | | 001-36373 | | 10.2 | | 11/19/2020 | | |
| | | | | | | | | | | | |
10.30* | | | | 10-Q | | 001-36373 | | 10.1 | | 10/26/2020 | | |
| | | | | | | | | | | | |
10.31* | | | | 8-K | | 001-36373 | | 10.1 | | 12/22/2016 | | |
| | | | | | | | | | | | |
| | | | | | | | | | | | |
| | | | | | | | | | | | |
21.1 | | | | | | | | | | | | X |
| | | | | | | | | | | | |
23.1 | | | | | | | | | | | | X |
| | | | | | | | | | | | |
24.1 | | | | | | | | | | | | |
| | | | | | | | | | | | |
31.1 | | | | | | | | | | | | X |
| | | | | | | | | | | | |
31.2 | | | | | | | | | | | | X |
| | | | | | | | | | | | |
32.1** | | | | | | | | | | | | X |
| | | | | | | | | | | | |
101.INS | | Inline XBRL Instance Document - the instance document does not appear in the Interactive Data File because its XBRL tags are embedded within the Inline XBRL document. | | | | | | | | | | X |
| | | | | | | | | | | | |
101.SCH | | Inline XBRL Taxonomy Extension Schema Document. | | | | | | | | | | X |
| | | | | | | | | | | | |
101.SCHCAL | | Inline XBRL Taxonomy Extension Schema Calculation Linkbase Document. | | | | | | | | | | X |
| | | | | | | | | | | | |
101.CALDEF | | Inline XBRL Taxonomy Extension Calculation Definition Linkbase Document. | | | | | | | | | | X |
| | | | | | | | | | | | |
101.DEFLAB | | Inline XBRL Taxonomy Extension Definition Label Linkbase Document. | | | | | | | | | | X |
| | | | | | | | | | | | |
101.LABPRE | | Inline XBRL Taxonomy Extension Label Presentation Linkbase Document. | | | | | | | | | | X |
| | | | | | | | | | | | |
101.PRE104 | | XBRL Taxonomy Extension Presentation Linkbase Document. Cover Page Interactive Data File (embedded with the Inline XBRL document). | | | | | | | | | | X |
| | | | | | | | | | | | | | | | | | | | | | | | | | | | | | | | | | | | | | |
| | | | Incorporated by Reference | | |
Exhibit No. | | Description of Exhibit | | Form | | File No. | | Exhibit | | Filing | | Filed Herewith |
| 10.21* | | | | 8-K | | 001-36373 | | 10.1 | | 12/22/2016 | | |
| | | | | | | | | | | | |
| 10.22 | | | | 10-K | | 001-36373 | | 10.22 | | 2/15/2023 | | |
| | | | | | | | | | | | |
| | | | | | | | | | | | |
| | | | | | | | | | | | |
| 10.23 | | | | 8-K | | 001-36373 | | 10.1 | | 7/31/2023 | | |
| | | | | | | | | | | | |
| 21.1 | | | | | | | | | | | | X |
| | | | | | | | | | | | |
| 23.1 | | | | | | | | | | | | X |
| | | | | | | | | | | | |
| 24.1 | | | | | | | | | | | | |
| | | | | | | | | | | | |
| 31.1 | | | | | | | | | | | | X |
| | | | | | | | | | | | |
| 31.2 | | | | | | | | | | | | X |
| | | | | | | | | | | | |
| 32.1** | | | | | | | | | | | | X |
| | | | | | | | | | | | |
| 101.INS | | Inline XBRL Instance Document - the instance document does not appear in the Interactive Data File because its XBRL tags are embedded within the Inline XBRL document. | | | | | | | | | | X |
| | | | | | | | | | | | |
| 101.SCH | | Inline XBRL Taxonomy Extension Schema Document. | | | | | | | | | | X |
| | | | | | | | | | | | |
| 101.SCHCAL | | Inline XBRL Taxonomy Extension Schema Calculation Linkbase Document. | | | | | | | | | | X |
| | | | | | | | | | | | |
| 101.CALDEF | | Inline XBRL Taxonomy Extension Calculation Definition Linkbase Document. | | | | | | | | | | X |
| | | | | | | | | | | | |
| 101.DEFLAB | | Inline XBRL Taxonomy Extension Definition Label Linkbase Document. | | | | | | | | | | X |
| | | | | | | | | | | | |
| 101.LABPRE | | Inline XBRL Taxonomy Extension Label Presentation Linkbase Document. | | | | | | | | | | X |
| | | | | | | | | | | | |
| 101.PRE104 | | XBRL Taxonomy Extension Presentation Linkbase Document. Cover Page Interactive Data File (embedded with the Inline XBRL document). | | | | | | | | | | X |
| | | | | | | | | | | | |
| * | Constitutes a management contract or compensatory plan or arrangement. |
| ** | Document has been furnished, is deemed not filed and is not to be incorporated by reference into any of the Company’s filings under the Securities Act of 1933, as amended, or the Securities Exchange Act of 1934, as amended, irrespective of any general incorporation language contained in any such filing. |
| | | | | |
EXHIBITSTRINET | 99 | 2023 FORM 10-K |
| | | | | | | | | | | | | | | | | | | | | | | | | | | | | | | | | | | | | | |
| | | | Incorporated by Reference | | |
Exhibit
No.
| | Description of Exhibit | | Form | | File No. | | Exhibit | | Filing | | Filed
Herewith
|
| | | | | | | | | | | | |
* | Constitutes a management contract or compensatory plan or arrangement. |
** | Document has been furnished, is deemed not filed and is not to be incorporated by reference into any of the Company’s filings under the Securities Act of 1933, as amended, or the Securities Exchange Act of 1934, as amended, irrespective of any general incorporation language contained in any such filing. |
SIGNATURES
Pursuant to the requirements of Section 13 or 15(d) of the Securities Exchange Act of 1934, the Registrant has duly caused this report to be signed on its behalf by the undersigned, thereunto duly authorized, in the City of Dublin, State of California, on the day of 1615th February, 2021.2023.
| | | | | | | | | | | |
| | TRINET GROUP, INC. |
| | |
Date: February 16, 202115, 2024 | | By: | /s/ Burton M. Goldfield |
| | | | Burton M. Goldfield |
| | | | Chief Executive Officer |
| | | | |
Date: February 16, 202115, 2024 | | By: | /s/ Kelly Tuminelli |
| | | | Kelly Tuminelli |
| | | | Chief Financial Officer |
KNOW ALL PERSONS BY THESE PRESENTS, that each person whose signature appears below constitutes and appoints Burton M. Goldfield and Kelly Tuminelli, and Samantha Wellington, and each of them, as his or her true and lawful attorneys-in-fact and agents, each with the full power of substitution, for him or her and in his or her name, place or stead, in any and all capacities, to sign any amendments to this report and to file the same, with exhibits thereto, and other documents in connection therewith, with the Securities and Exchange Commission, hereby ratifying and confirming all that any of said attorneys-in-fact and agents, or their or his or her substitute or substitutes, may lawfully do or cause to be done by virtue hereof.
Pursuant to the requirements of the Securities Exchange Act of 1934, this report has been signed by the following persons on behalf of the Registrant and in the capacities and on the dates indicated.
| | | | | | | | | | | | | | |
| Signature | | Title | | Date |
| | | | |
| /s/ Burton M. Goldfield | | Chief Executive Officer (principal executive officer) | | February 16, 202115, 2024 |
| Burton M. Goldfield | | |
| | | | |
| /s/ Kelly Tuminelli | | Chief Financial Officer (principal financial officer and principal accounting officer) | | February 16, 202115, 2024 |
| Kelly Tuminelli | | |
| | | | |
| /s/ Michael J. Angelakis | | Director | | February 16, 202115, 2024 |
| Michael J. Angelakis | | |
| | | | |
/s/ Katherine August-deWilde | | Director | | February 16, 2021 |
Katherine August-deWilde | | |
| | | | |
/s/ Martin Babinec | | Director | | February 16, 2021 |
Martin Babinec | | |
| | | | |
/s/ H. Raymond Bingham | | Director | | February 16, 2021 |
H. Raymond Bingham | | |
| | | | |
| /s/ Paul Chamberlain | | Director | | February 16, 202115, 2024 |
| Paul Chamberlain | | |
| | | | |
/s/ Shawn GuertinRalph Clark | | Director | | February 16, 202115, 2024 |
Shawn GuertinRalph Clark | | |
| | | | |
| /s/ Maria Contreras-Sweet | | Director | | February 15, 2024 |
| Maria Contreras-Sweet | | |
| | | | |
| /s/ David C. Hodgson | | Director | | February 16, 202115, 2024 |
| David C. Hodgson | | |
| | | | |
| /s/ Dr. Jacqueline Kosecoff | | Director | | February 16, 202115, 2024 |
| Dr. Jacqueline Kosecoff | | |
| | | | |
| /s/ Wayne B. Lowell | | Director | | February 16, 202115, 2024 |
| Wayne B. Lowell | | |
| | | | |
/s/ Maria Contreras-SweetMyrna Soto | | Director | | February 16, 202115, 2024 |
Maria Contreras-SweetMyrna Soto | | |
| | | | |