|
| | | | | | | | | | |
| UNITED STATES |
| SECURITIES AND EXCHANGE COMMISSION |
| Washington, D.C. 20549 |
| | |
| FORM | 10-K |
| | |
[X]☒ | ANNUAL REPORT PURSUANT TO SECTION 13 OR 15(d) OF THE SECURITIES EXCHANGE ACT OF 1934 |
| | |
| For the Fiscal Year Ended | September 30, 2019 2021 | OR |
| | |
[ ]☐ | TRANSITION REPORT PURSUANT TO SECTION 13 OR 15(d) OF THE SECURITIES EXCHANGE ACT OF 1934 | |
| | |
| Commission File Number: | 0-23333 |
| | |
| TIMBERLAND BANCORP, INC. |
| (Exact name of registrant as specified in its charter) |
|
| | | | | | | | | | | | | | | | |
| Washington | | 91-1863696 |
| (State or other jurisdiction of incorporation or organization) | | (I.R.S. Employer Identification Number) |
| | | | | |
624 Simpson Avenue, Hoquiam, Washington | Hoquiam, | Washington | | 98550 |
| (Address of principal executive offices) | | (Zip Code) |
| | | | | |
| Registrant’s telephone number, including area code: | | (360) | 533-4747 |
| | | | | |
| | | | | |
Securities registered pursuant to Section 12(b) of the Act:
|
| | | | | | | |
| Title of each class | Trading Symbol(s) | Name of each exchange on which registered |
| Common stock, $.01 par value | TSBK | The NASDAQ Stock Market LLC |
|
| | | | | | | |
| Securities registered pursuant to Section 12(g) of the Act: | | None |
Indicate by check mark if the registrant is a well-known seasoned issuer, as defined in Rule 405 of the Securities Act. YES NO XYes ☐ No ☒
Indicate by check mark if the registrant is not required to file reports pursuant to Section 13 or Section 15(d) of the Act. YES NO X Yes ☐ No ☒
Indicate by check mark whether the registrant (1) has filed all reports required to be filed by Section 13 or 15(d) of the Securities Exchange Act of 1934 during the preceding 12 months (or for such shorter period that the registrant was required to file such reports), and (2) has been subject to such filing requirements for the past 90 days. Yes ☒ No ☐
Indicate by check mark whether the registrant has submitted electronically every Interactive Data File required to be submitted pursuant to Rule 405 of Regulation S-T (§232.405 of this chapter) during the preceding 12 months (or for such shorter period that the registrant was required to submit such files) YES X NO Yes ☒ No ☐
Indicate by check mark if disclosure of delinquent filers pursuant to Item 405 of Regulation S-K (§229.405 of this chapter) is not contained herein, and will not be contained, to the best of registrant’s knowledge, in definitive proxy or information statements incorporated by reference in Part III of this Form 10-K or any amendment to this Form 10-K.
Indicate by check mark whether the registrant is a large accelerated filer, an accelerated filer, a non-accelerated filer, a smaller reporting company, or an emerging growth company. See the definitions of “large accelerated filer,” “accelerated filer,” “smaller reporting company” and "emerging growth company" in Rule 12b-2 of the Exchange Act: |
| | | | | | | | | | | | | |
| Large accelerated filer[ ] | ☐ | Accelerated filer [X] | ☐ |
| Non-accelerated filer[ ] | ☒ | Smaller reporting company[X] | ☒ |
| Emerging growth company[ ] | ☐ | | |
If an emerging growth company, indicate by check mark if the registrant has elected not to use the extended transition period for complying with any new or revised financial accounting standards provided pursuant to Section 13(a) of the Exchange Act. [_][☐]
Indicate by check mark whether the registrant has filed a report on and attestation to its management's assessment of the effectiveness of its internal control over financial reporting under Section 404(b) of the Sarbanes-Oxley Act (15 U.S.C. 7262(b)) by the registered public accounting firm that prepared or issued its audit report. ___
Indicate by check mark whether the registrant is a shell company (as defined in Rule 12b-2 of the Act). YES NO X Yes ☐ No ☒
As of November 30, 2019,December 2, 2021 the registrant had 8,345,0698,354,717 shares of common stock issued and outstanding. The aggregate market value of the common stock held by nonaffiliates of the registrant, based on the closing sales price of the registrant’s common stock as quoted on the NASDAQ Global Market on March 31, 2019,2021, was $233.3$232.53 million (8,336,419(8,361,457 shares at $27.98)$27.81). For purposes of this calculation, common stock held by officers and directors of the registrant was included.
DOCUMENTS INCORPORATED BY REFERENCE
1. Portions of Definitive Proxy Statement for the 20202022 Annual Meeting of Shareholders (Part III).
TIMBERLAND BANCORP, INC.
20192021 ANNUAL REPORT ON FORM 10-K
TABLE OF CONTENTS
|
| | | | | | | | | | | | | |
PART I. | Page |
| Item 1. | Business | |
| | | General | |
| | | Market Area | |
| | | Lending Activities | |
| | | Investment Activities | |
| | | Deposit Activities and Other Sources of Funds | |
| | | Bank Owned Life Insurance | |
| | | How We Are Regulated | 2627 |
| | | Taxation | |
| | | Competition | |
| | | Subsidiary Activities | 3435 |
| | | PersonnelEmployees and Human Capital Resources | |
| | | Executive Officers of the Registrant | 36 |
| Item 1A. | Risk Factors | 37 |
| Item 1B. | Unresolved Staff Comments | |
| Item 1A.2. | Risk FactorsProperties | 51 |
| Item 3. | Legal Proceedings | |
| Item 1B.4. | Mine Safety Disclosures | Unresolved Staff Comments
| |
| PART II. | Item 2. | Properties | 47 |
| Item 3. | Legal Proceedings | |
| Item 4. | Mine Safety Disclosures | |
PART II. | |
| Item 5. | Market for Registrant’s Common Equity, Related Stockholder Matters and Issuer Purchases of Equity Securities | 53 |
| Item 6. | Reserved | |
| Item 6. | Selected Financial Data | |
| Item 7. | Management’s Discussion and Analysis of Financial Condition and Results of Operations | |
| | | General | 5355 |
| | | | 5355 |
| | | Operating Strategy | 5456 |
| | | Selected Financial Data | 57 |
| | | Critical Accounting Policies and Estimates | 5559 |
| | | Market Risk and Asset and Liability Management | 5563 |
| | | Comparison of Financial Condition at September 30, 20192021 and September 30, 20182020 | 5663 |
| | | Comparison of Operating Results for the Years Ended September 30, 20192021 and 20182020 | 5966 |
| | | Average Balances, Interest and Average Yields/Cost | 6169 |
| | | Rate/Volume Analysis | 6371 |
| | | Liquidity and Capital Resources | 6371 |
| | | Effect of Inflation and Changing Prices | 65 |
| | | New Accounting Pronouncements | 6573 |
| Item 7A. | Quantitative and Qualitative Disclosures About Market Risk | 6573 |
| Item 8. | Financial Statements and Supplementary Data | 6573 |
| Item 9. | Changes in and Disagreements With Accountants on Accounting and Financial Disclosure | 121134 |
| Item 9A. | Controls and Procedures | 121134 |
| Item 9B. | Other Information | 124136 |
PART III. | Item 9C. | Disclosure Regarding Foreign Jurisdictions that Prevent Inspections | 136 |
| PART III. | |
| Item 10. | Directors, Executive Officers and Corporate Governance | 124136 |
| Item 11. | Executive Compensation | 124136 |
| Item 12. | Security Ownership of Certain Beneficial Owners and Management and Related Stockholder Matters | 124136 |
| Item 13. | Certain Relationships and Related Transactions, and Director Independence | 125137 |
| Item 14. | Principal Accounting Fees and Services | 125137 |
| PART IV. | |
| Item 15. | Exhibits and Financial Statement Schedules | 126138 |
| Item 16. | Form 10-K Summary | 126138 |
As used throughout this report, the terms "we," "our," or "us," refer to Timberland Bancorp, Inc. and its consolidated subsidiary, unless the context otherwise requires.
Special Note Regarding Forward-Looking Statements
Certain matters discussed in this Annual Report on Form 10-K may contain forward-looking statements within the meaning of the Private Securities Litigation Reform Act of 1995. These statements relate to our financial condition, results of operations, plans, objectives, future performance or business. Forward-looking statements are not statements of historical fact, are based on certain assumptions and often include the words "believes," "expects," "anticipates," "estimates," "forecasts," "intends," "plans," "targets," "potentially," "probably," "projects," "outlook" or similar expressions or future or conditional verbs such as "may," "will," "should," "would" and "could." Forward-looking statements include statements with respect to our beliefs, plans, objectives, goals, expectations, assumptions and statements about future economic performance. These forward-looking statements are subject to known and unknown risks, uncertainties and other factors that could cause our actual results to differ materially from the results anticipated or implied by our forward-looking statements, including, but not limited to: potential adverse impacts to economic conditions in our local market areas, other markets where the Company has lending relationships, or other aspects of the Company's business operations or financial markets, generally, resulting from the ongoing novel coronavirus of 2019 ("COVID-19") and any governmental or societal responses thereto; the credit risks of lending activities, including changes in the level and trend of loan delinquencies and write-offs and changes in our allowance for loan losses and provision for loan losses that may be impacted by deterioration in the housing and commercial real estate markets which may lead to increased losses and non-performing loans in our loan portfolio, and may result in our allowance for loan losses not being adequate to cover actual losses, and require us to materially increase our loan loss reserves; changes in general economic conditions, either nationally or in our market areas; changes in the levels of general interest rates, and the relative differences between short and long termlong-term interest rates, deposit interest rates, our net interest margin and funding sources; uncertainty regarding the future of the London Interbank Offered Rate ("LIBOR"), and the potential transition away from LIBOR toward new interest rate benchmarks; fluctuations in the demand for loans, the number of unsold homes, land and other properties and fluctuations in real estate values in our market areas; secondary market conditions for loans and our ability to sell loans in the secondary market; results of examinations of us by the Board of Governors of the Federal Reserve System and of our bank subsidiary by the Federal Deposit Insurance Corporation, the Washington State Department of Financial Institutions, Division of Banks or other regulatory authorities, including the possibility that any such regulatory authority may, among other things, institute a formal or informal enforcement action against us or our bank subsidiary which could require us to increase our allowance for loan losses, write-down assets, change our regulatory capital position or affect our ability to borrow funds or maintain or increase deposits or impose additional requirements or restrictions on us, any of which could adversely affect our liquidity and earnings; legislative or regulatory changes that adversely affect our business including changes in regulatory policies and principles, or the interpretation of regulatory capital or other rules including as a result of Basel III; the impact of the Dodd Frank Wall Street Reform and Consumer Protection Act and implementing regulations; our ability to attract and retain deposits; our ability to successfully integrate any assets, liabilities, customers, systems, and management personnel we may in the future acquire into our operations and our ability to realize related revenue synergies and cost savings within expected time frames and any goodwill charges related thereto; our ability to control operating costs and expenses; the use of estimates in determining fair value of certain of our assets, which estimates may prove to be incorrect and result in significant declines in valuation; difficulties in reducing risks associated with the loans on our consolidated balance sheet; staffing fluctuations in response to product demand or the implementation of corporate strategies that affect our work force and potential associated charges; disruptions, security breaches, or other adverse events, failures or interruptions in, or attacks on, our information technology systems or on the third-party vendors who perform several of our critical processing functions; our ability to retain key members of our senior management team; costs and effects of litigation, including settlements and judgments; our ability to implement our business strategies; our ability to manage loan delinquency rates; increased competitive pressures among financial services companies; changes in consumer spending, borrowing and savings habits; the availability of resources to address changes in laws, rules, or regulations or to respond to regulatory actions; our ability to pay dividends on our common stock; adverse changes in the securities markets; inability of key third-party providers to perform their obligations to us; changes in accounting policies and practices, as may be adopted by the financial institution regulatory agencies or the Financial Accounting Standards Board ("FASB"), including additional guidance and interpretation on accounting issues and details of the implementation of new accounting methods; the economic impact of war or any terrorist activities; other economic, competitive, governmental, regulatory, and technological factors affecting our operations;operations, pricing, products and services;services including the Coronavirus Aid, Relief, and Economic Security Act of 2020 ("CARES Act") and the Consolidated Appropriations Act, 2021 ("CAA 2021"); and other risks described elsewhere in this Form 10-K and in the Company's other reports filed with or furnished to the Securities and Exchange Commission.
Any of the forward-looking statements that we make in this Form 10-K and in the other public statements we make are based upon management's beliefs and assumptions at the time they are made. We do not undertake and specifically disclaim any obligation to publicly update or revise any forward-looking statements included in this annual report to reflect the occurrence of anticipated or unanticipated events or circumstances after the date of such statements or to update the reasons why actual results could differ from those contained in such statements, whether as a result of new information, future events or otherwise. In light of these risks, uncertainties and assumptions, the forward-looking statements discussed in this document might not occur and we caution readers not to place undue reliance on any forward-looking statements. These risks could cause our actual results for fiscal 20202022 and beyond to differ materially from those expressed in any forward-looking statements by, or on behalf of, us, and could negatively affect the Company's consolidated financial condition and results of operations as well as its stock price performance.
PART I
Item 1. Business
General
Timberland Bancorp, Inc. (“Timberland Bancorp" or the "Company”), a Washington corporation, was organized on September 8, 1997 for the purpose of becoming the holding company for Timberland Bank (the "Bank"). At September 30, 2019,2021, on a consolidated basis, the Company had total assets of $1.25$1.79 billion, net loans receivable of $886.66$968.45 million, total deposits of $1.07$1.57 billion and total shareholders’ equity of $171.07$206.90 million. The Company’s business activities generally are limited to passive investment activities and oversight of its investment in the Bank. Accordingly, the information set forth in this report, including consolidated financial statements and related data, relates primarily to the Bank and its subsidiary, Timberland Service Corporation.Corp.
The Bank opened for business in 1915 and serves consumers and businesses across Grays Harbor, Pierce, Thurston, Pierce, King, Kitsap and Lewis counties, Washington with a full range of lending and deposit services through its 24 branches (including its main office in Hoquiam). The Bank’s deposits are insured up to applicable legal limits by the Federal Deposit Insurance Corporation (“FDIC”). The Bank has been a member of the Federal Home Loan Bank System since 1937. The Bank is regulated by the Washington Department of Financial Institutions, Division of Banks (“Division” or “DFI”) and the FDIC. The Company is regulated by the Board of Governors of the Federal Reserve System ("Federal Reserve").
On October 1, 2018, the Company completed the acquisition of South Sound Bank, a Washington-state chartered bank, headquartered in Olympia, Washington ("South Sound Acquisition"). The Company acquired 100% of the outstanding common stock of South Sound Bank, and South Sound Bank was merged into the Bank. The results of operations of the acquired assets and assumed liabilities have been included in the Company's consolidated financial statements as of and for the period since the acquisition date. For additional details, see Note 2 of the Notes to Consolidated Financial Statements contained in "Item 8. Financial Statements and Supplementary Data."
Timberland Bank is a community-oriented bank which has traditionally offered a variety of savings products to its retail customers while concentrating its lending activities on real estate mortgage loans. Lending activities have been focused primarily on the origination of loans secured by real estate, including residential and commercial / multi-family construction loans, one- to four-family residential loans, multi-family loans, commercial real estate loans and land loans. The Bank originates adjustable-rate residential mortgage loans that do not qualify for sale in the secondary market. The Bank also originates commercial business loans and other consumer loans.
The Company maintains a website at www.timberlandbank.com. The information contained on that website is not included as a part of, or incorporated by reference into, this Annual Report on Form 10-K. Other than an investor’s own internet access charges, the Company makes available free of charge through that website the Company’s Annual Report on Form 10-K, quarterly reports on Form 10-Q and current reports on Form 8-K, and amendments to these reports, as soon as reasonably practicable after these materials have been electronically filed with, or furnished to, the Securities and Exchange Commission (“SEC”).
Market Area
The Bank considers Grays Harbor, Pierce, Thurston, Kitsap, King and Lewis counties, Washington as its primary market areas. The Bank conducts operations from:
•its main office in Hoquiam (Grays Harbor County);
•five branch offices in Grays Harbor County (Ocean Shores, Montesano, Elma and two branches in Aberdeen);
•five branch offices in Pierce County (Edgewood, Puyallup, Spanaway, Tacoma and Gig Harbor);
•seven branch offices in Thurston County (Tumwater, Yelm, three branches in Lacey and two branches in Olympia);
•two branch offices in Kitsap County (Poulsbo and Silverdale);
•a branch office in King County (Auburn); and
•three branch offices in Lewis County (Winlock, Toledo and Chehalis).
For additional information, see “Item 2. Properties.”
Hoquiam, with a population of approximately 8,600,8,800, is located in Grays Harbor County which is situated along Washington State’s central Pacific coast. Hoquiam is located approximately 110 miles southwest of Seattle, Washington and 145 miles northwest of Portland, Oregon.
The Bank considers its primary market area to include six sub-markets: primarily rural Grays Harbor County with its historical dependence on the timber and fishing industries; Thurston and Kitsap counties with their dependence on state and federal government; Pierce and King counties with their broadly diversified economic bases; and Lewis County with its dependence on retail trade, manufacturing, industrial services and local government. Each of these markets presents operating risks to the Bank. The Bank’s expansion into Pierce, Thurston, Kitsap, King and Lewis counties represents the Bank’s strategy to expand and diversify its primary market area to become less reliant on the economy of Grays Harbor County.
Grays Harbor County has a population of 74,00075,000 according to the United States ("U.S.") Census Bureau 20182021 estimates and a median family income of $63,500$67,300 according to 20192021 estimates from the Department of Housing and Urban Development (“HUD”). The economic base in Grays Harbor County has been historically dependent on the timber and fishing industries. Other industries that support the economic base are tourism, agriculture, shipping, transportation and technology. According to the Washington State Employment Security Department, the unemployment rate in Grays Harbor County increaseddecreased to 6.7%5.3% at September 30, 20192021 from 5.5%10.0% at September 30, 2018.2020. The median price of a resale home in Grays Harbor County for the quarter ended June 30, 20192021 increased 12.0%26.1% to $211,400$302,300 from $188,800$239,800 for the comparable prior year period. The number of home sales decreased 0.5%increased 11.2% for the quarter ended June 30, 20192021 compared to the same quarter one year earlier. The Bank has six branches (including its home office) located in the county.
Pierce County is the second most populous county in the state and has a population of 891,000917,000 according to the U.S. Census Bureau 20182021 estimates. The county’s median family income is $80,200$91,100 according to 20192021 HUD estimates. The economy in Pierce County is diversified with the presence of military related government employment (Joint Base Lewis-McChord), transportation and shipping employment (Port of Tacoma), and aerospace related employment. According to the Washington State Employment Security Department, the unemployment rate for the Pierce County area increaseddecreased to 5.0%4.2% at September 30, 20192021 from 4.4%8.6% at September 30, 2018.2020. The median price of a resale home in Pierce County for the quarter ended June 30, 20192021 increased 5.3%26.7% to $372,300$516,800 from $353,700$407,800 for the comparable prior year period. The number of home sales decreased 6.3%increased 11.3% for the quarter ended June 30, 20192021 compared to the same quarter one year earlier. The Bank has five branches located in Pierce County, and these branches have historically been responsible for a substantial portion of the Bank’s construction lending activities.
Thurston County has a population of 286,000295,000 according to the U.S. Census Bureau 20182021 estimates and a median family income of $83,700$90,200 according to 20192021 HUD estimates. Thurston County is home of Washington State’s capital (Olympia), and its economic base is largely driven by state government related employment. According to the Washington State Employment Security Department, the unemployment rate for the Thurston County area increaseddecreased to 4.8%3.5% at September 30, 20192021 from 4.1%7.1% at September 30, 2018.2020. The median price of a resale home in Thurston County for the quarter ended June 30, 20192021 increased 6.7%22.6% to $340,700$454,900 from $319,300$371,100 for the same quarter one year earlier. The number of home sales decreased 4.2%increased 5.0% for the quarter ended June 30, 20192021 compared to the same quarter one year earlier. The Bank has seven branches located in Thurston County. This county has historically had a stable economic base primarily attributable to the state government presence.
Kitsap County has a population of 270,000276,000 according to the U.S. Census Bureau 20182021 estimates and a median family income of $85,500$94,100 according to 20192021 HUD estimates. The Bank has two branches located in Kitsap County. The economic base of Kitsap County is largely supported by military related government employment through the U.S. Navy. According to the Washington State Employment Security Department, the unemployment rate for the Kitsap County area increaseddecreased to 4.5%3.4% at September 30, 20192021 from 4.1%6.8% at September 30, 2018.2020. The median price of a resale home in Kitsap County for the quarter ended June 30, 20192021 increased 7.1%23.2% to $380,800$506,900 from $355,600$411,400 for the same quarter one year earlier. The number of home sales decreased 7.7%increased 10.2% for the quarter ended June 30, 20192021 compared to the same quarter one year earlier.
King County is the most populous county in the state and has a population of 2.22.3 million according to the U.S. Census Bureau 20182021 estimates. The Bank has one branch located in King County. The county’s median family income is $108,600$115,700 according to 20192021 HUD estimates. King County’s economic base is diversified with many industries including shipping, transportation, aerospace, computer technology and biotech. According to the Washington State Employment Security Department, the unemployment rate for the King County area decreased to 3.0%4.3% at September 30, 20192021 from 3.4%7.0% at September 30, 2018.2020. The median price of a resale home in King County for the quarter ended June 30, 2019 decreased 3.9% 2021 increased 21.1%
to $701,200$866,700 from $729,800$715,400 for the same quarter one year earlier. The number of home sales decreased 6.8%increased 18.6% for the quarter ended June 30, 20192021 compared to the same quarter one year earlier.
Lewis County has a population of 80,00081,000 according to the U.S. Census Bureau 20182021 estimates and a median family income of $63,500$67,300 according to 20192021 HUD estimates. The economic base in Lewis County is supported by manufacturing, retail trade, local government and industrial services. According to the Washington State Employment Security Department, the unemployment rate in Lewis County increaseddecreased to 5.9%4.3% at September 30, 20192021 from 5.1%8.1% at September 30, 2018.2020. The median price of a resale home in Lewis County for the quarter ended June 30, 20192021 increased 15.2%24.0% to $258,300$361,200 from $224,300$291,400 for the same quarter one year earlier. The number of home sales decreased 3.1%increased 16.9% for the quarter ended June 30, 20192021 compared to the same quarter one year earlier. The Bank currently has three branches located in Lewis County.
Lending Activities
General. Historically, the principal lending activity of the Bank has consisted of the origination of loans secured by first mortgages on owner-occupied, one- to four-family residences, or bymulti-family properties, commercial real estate, and on raw or developed land, and the origination of construction loans, primarily for the construction of one- to four-family residences. The Bank’s net loans receivable totaled $886.66$968.45 million at September 30, 2019,2021, representing 71.1%54.0% of consolidated total assets, and at that date, commercial real estate, construction (including undisbursed loans in process), multi-family and land loans were $749.45$811.35 million, or 75.6%75.0% of total loans. Commercial real estate, construction, multi-family, and land loans typically have higher rates of return than one- to four-family loans; however, they also present a higher degree of risk.
The Bank’s internal loan policy limits the maximum amount of loans to one borrower to 20% of its capital plus surplus. According to the Washington Administrative Code, capital and surplus are defined as a bank's Tier 1 capital, Tier 2 capital and the balance of a bank's allowance for loan losses not included in the bank's Tier 2 capital as reported in the bank's call report. At September 30, 2019,2021, the maximum amount which the Bank could have lent to any one borrower and the borrower’s related entities was approximately $32.48$40.47 million under this policy. At September 30, 2019,2021, the largest amount outstanding to any one borrower and the borrower’s related entities was $18.30$32.08 million (including $10.49 million in available lines of credit), which was secured by multi-family andvarious commercial real estate and residential properties and other business assets located primarily in KingThurston County and Benton counties andthese borrowings were performing according to their loan repayment terms at September 30, 2019.2021. The next largest amount outstanding to any one borrower and the borrower’s related entities was $16.40 million.$31.86 million (including $17.75 million of undisbursed construction loan proceeds). These loans were secured by multi-family, one- to four-family and commercial real estate properties and other business assets located primarily in KingThurston County and were performing according to their loan repayment terms at September 30, 2019.
2021.
Loan Portfolio Analysis. The following table sets forth the composition of the Bank’s loan portfolio by type of loan at the dates indicated.
| | | | | | | | | | | | | | | | | | | | | | | | | | | | | | | | | | | | | | | | | | | | | | | | | | | | | | | | | | | |
| | At September 30, |
| | 2021 | | 2020 | | 2019 | | 2018 | | 2017 |
| | Amount | | Percent | | Amount | | Percent | | Amount | | Percent | | Amount | | Percent | | Amount | | Percent |
| | (Dollars in thousands) |
| Mortgage Loans: | | | | | | | | | | | | | | | | | | | |
| One- to four-family (1) | $ | 119,935 | | | 11.08 | % | | $ | 118,580 | | | 10.46 | % | | $ | 132,661 | | | 13.38 | % | | $ | 115,941 | | | 14.13 | % | | $ | 118,147 | | | 15.05 | % |
| Multi-family | 87,563 | | | 8.09 | | | 85,053 | | | 7.50 | | | 76,036 | | | 7.67 | | | 61,928 | | | 7.54 | | | 58,607 | | | 7.47 | |
| Commercial | 470,650 | | | 43.49 | | | 453,574 | | | 39.99 | | | 419,117 | | | 42.28 | | | 345,113 | | | 42.05 | | | 328,927 | | | 41.91 | |
| Construction - custom and owner/builder | 109,152 | | | 10.08 | | | 129,572 | | | 11.42 | | | 128,848 | | | 13.00 | | | 119,555 | | | 14.57 | | | 117,641 | | | 14.99 | |
| Construction - speculative one- to four-family | 17,813 | | | 1.65 | | | 14,592 | | | 1.29 | | | 16,445 | | | 1.66 | | | 15,433 | | | 1.88 | | | 9,918 | | | 1.26 | |
| Construction - commercial | 43,365 | | | 4.01 | | | 33,144 | | | 2.92 | | | 39,566 | | | 3.99 | | | 39,590 | | | 4.82 | | | 19,630 | | | 2.50 | |
| Construction - multi-family | 52,071 | | | 4.81 | | | 34,476 | | | 3.04 | | | 36,263 | | | 3.66 | | | 10,740 | | | 1.31 | | | 21,327 | | | 2.72 | |
| Construction - land development | 10,804 | | | 1.00 | | | 7,712 | | | 0.68 | | | 2,404 | | | 0.24 | | | 3,040 | | | 0.37 | | | — | | | — | |
| Land | 19,936 | | | 1.84 | | | 25,571 | | | 2.25 | | | 30,770 | | | 3.10 | | | 25,546 | | | 3.11 | | | 23,910 | | | 3.05 | |
| Total mortgage loans | 931,289 | | | 86.05 | | | 902,274 | | | 79.55 | | | 882,110 | | | 88.98 | | | 736,886 | | | 89.78 | | | 698,107 | | | 88.95 | |
| | | | | | | | | | | | | | | | | | | |
| Consumer Loans: | | | | | | | | | | | | | | | | | | | |
| Home equity and second mortgage | 32,988 | | | 3.05 | | | 32,077 | | | 2.83 | | | 40,190 | | | 4.05 | | | 37,341 | | | 4.55 | | | 38,420 | | | 4.90 | |
| Other | 2,512 | | | 0.23 | | | 3,572 | | | 0.31 | | | 4,312 | | | 0.44 | | | 3,515 | | | 0.43 | | | 3,823 | | | 0.49 | |
| Total consumer loans | 35,500 | | | 3.28 | | | 35,649 | | | 3.14 | | | 44,502 | | | 4.49 | | | 40,856 | | | 4.98 | | | 42,243 | | | 5.39 | |
| | | | | | | | | | | | | | | | | | | |
| Commercial Loans: | | | | | | | | | | | | | | | | | | | |
| Commercial business (2) | 74,579 | | | 6.89 | | | 69,540 | | | 6.13 | | | 64,764 | | | 6.53 | | | 43,053 | | | 5.24 | | | 44,444 | | | 5.66 | |
| U.S. Small Business Administration ("SBA") Paycheck Protection Program ("PPP") | 40,922 | | | 3.78 | | | 126,820 | | | 11.18 | | | — | | | — | | | — | | | — | | | — | | | — | |
| Total commercial business and SBA PPP loans | 115,501 | | | 10.67 | | | 196,360 | | | 17.31 | | | 64,764 | | | 6.53 | | | 43,053 | | | 5.24 | | | 44,444 | | | 5.66 | |
| Total loans receivable | 1,082,290 | | | 100.00 | % | | 1,134,283 | | | 100.00 | % | | 991,376 | | | 100.00 | % | | 820,795 | | | 100.00 | % | | 784,794 | | | 100.00 | % |
| | | | | | | | | | | | | | | | | | | |
| Less: | | | | | | | | | | | | | | | | | | | |
| Undisbursed portion of construction loans in process | (95,224) | | | | | (100,558) | | | | | (92,226) | | | | | (83,237) | | | | | (82,411) | | | |
| Deferred loan origination fees, net | (5,143) | | | | | (6,436) | | | | | (2,798) | | | | | (2,637) | | | | | (2,466) | | | |
| Allowance for loan losses | (13,469) | | | | | (13,414) | | | | | (9,690) | | | | | (9,530) | | | | | (9,553) | | | |
| Total loans receivable, net | $ | 968,454 | | | | | $ | 1,013,875 | | | | | $ | 886,662 | | | | | $ | 725,391 | | | | | $ | 690,364 | | | |
|
| | | | | | | | | | | | | | | | | | | | | | | | | | | | | | | | | | |
| | At September 30, |
| | 2019 | | 2018 | | 2017 | | 2016 | | 2015 |
| | Amount | | Percent | | Amount | | Percent | | Amount | | Percent | | Amount | | Percent | | Amount | | Percent |
| | (Dollars in thousands) |
| Mortgage Loans: | | | | | | | | | | | | | | | | | | | |
| One- to four-family (1) | $ | 132,661 |
| | 13.38 | % | | $ | 115,941 |
| | 14.13 | % | | $ | 118,147 |
| | 15.05 | % | | $ | 118,560 |
| | 16.38 | % | | $ | 116,664 |
| | 17.42 | % |
| Multi-family | 76,036 |
| | 7.67 |
| | 61,928 |
| | 7.54 |
| | 58,607 |
| | 7.47 |
| | 62,303 |
| | 8.61 |
| | 52,322 |
| | 7.81 |
|
| Commercial | 419,117 |
| | 42.28 |
| | 345,113 |
| | 42.05 |
| | 328,927 |
| | 41.91 |
| | 312,525 |
| | 43.18 |
| | 291,216 |
| | 43.47 |
|
| Construction - custom and owner/builder | 128,848 |
| | 13.00 |
| | 119,555 |
| | 14.57 |
| | 117,641 |
| | 14.99 |
| | 93,049 |
| | 12.85 |
| | 62,954 |
| | 9.40 |
|
| Construction - speculative one- to four-family | 16,445 |
| | 1.66 |
| | 15,433 |
| | 1.88 |
| | 9,918 |
| | 1.26 |
| | 8,106 |
| | 1.12 |
| | 6,668 |
| | 1.00 |
|
| Construction - commercial | 39,566 |
| | 3.99 |
| | 39,590 |
| | 4.82 |
| | 19,630 |
| | 2.50 |
| | 9,365 |
| | 1.29 |
| | 20,728 |
| | 3.09 |
|
| Construction - multi-family | 36,263 |
| | 3.66 |
| | 10,740 |
| | 1.31 |
| | 21,327 |
| | 2.72 |
| | 12,590 |
| | 1.74 |
| | 20,570 |
| | 3.07 |
|
| Construction - land development | 2,404 |
| | 0.24 |
| | 3,040 |
| | 0.37 |
| | — |
| | — |
| | — |
| | — |
| | — |
| | — |
|
| Land | 30,770 |
| | 3.10 |
| | 25,546 |
| | 3.11 |
| | 23,910 |
| | 3.05 |
| | 21,627 |
| | 2.99 |
| | 26,140 |
| | 3.90 |
|
| Total mortgage loans | 882,110 |
| | 88.98 |
| | 736,886 |
| | 89.78 |
| | 698,107 |
| | 88.95 |
| | 638,125 |
| | 88.16 |
| | 597,262 |
| | 89.16 |
|
| | | | | | | | | | | | | | | | | | | | |
| Consumer Loans: | |
| | |
| | |
| | |
| | |
| | |
| | |
| | |
| | |
| | |
|
| Home equity and second mortgage | 40,190 |
| | 4.05 |
| | 37,341 |
| | 4.55 |
| | 38,420 |
| | 4.90 |
| | 39,727 |
| | 5.49 |
| | 34,157 |
| | 5.10 |
|
| Other | 4,312 |
| | 0.44 |
| | 3,515 |
| | 0.43 |
| | 3,823 |
| | 0.49 |
| | 4,139 |
| | 0.57 |
| | 4,669 |
| | 0.70 |
|
| Total consumer loans | 44,502 |
| | 4.49 |
| | 40,856 |
| | 4.98 |
| | 42,243 |
| | 5.39 |
| | 43,866 |
| | 6.06 |
| | 38,826 |
| | 5.80 |
|
| Commercial business loans (2) | 64,764 |
| | 6.53 |
| | 43,053 |
| | 5.24 |
| | 44,444 |
| | 5.66 |
| | 41,837 |
| | 5.78 |
| | 33,763 |
| | 5.04 |
|
| Total loans receivable | 991,376 |
| | 100.00 | % | | 820,795 |
| | 100.00 | % | | 784,794 |
| | 100.00 | % | | 723,828 |
| | 100.00 | % | | 669,851 |
| | 100.00 | % |
| | | | | | | | | | | | | | | | | | | | |
| Less: | |
| | |
| | |
| | |
| | |
| | |
| | |
| | |
| | |
| | |
|
| Undisbursed portion of construction loans in process | (92,226 | ) | | | | (83,237 | ) | | |
| | (82,411 | ) | | |
| | (48,627 | ) | | |
| | (53,457 | ) | | |
|
| Deferred loan origination fees, net | (2,798 | ) | | | | (2,637 | ) | | |
| | (2,466 | ) | | |
| | (2,229 | ) | | |
| | (2,193 | ) | | |
|
| Allowance for loan losses | (9,690 | ) | | | | (9,530 | ) | | |
| | (9,553 | ) | | |
| | (9,826 | ) | | |
| | (9,924 | ) | | |
|
| Total loans receivable, net | $ | 886,662 |
| | | | $ | 725,391 |
| | |
| | $ | 690,364 |
| | |
| | $ | 663,146 |
| | |
| | $ | 604,277 |
| | |
|
______________
| |
(1) | Does not include loans held-for-sale of $6,071, $1,785, $3,515, $3,604 and $3,051 at September 30, 2019, 2018, 2017, 2016 and 2015, respectively. |
(2) (1)Does not include loans held-for-saleheld for sale of $3,217, $4,509, $6,071, $1,785 and $3,515 at September 30, 2021, 2020, 2019, 2018 and 2017, respectively.
(2)Does not include loans held for sale of $84 at September 30, 2017.
Residential One- to Four-Family Lending. At September 30, 2019, $132.662021, $119.94 million, or 13.4%11.1%, of the Bank’s loan portfolio consisted of loans secured by one- to four-family residences. The Bank originates both fixed-rate loans and adjustable-rate loans.
Generally, one- to four-family fixed-rate loans are originated to meet the requirements for sale in the secondary market to the Federal Home Loan Mortgage Corporation ("Freddie Mac") or the Federal Home Loan Bank of Des Moines ("FHLB"). From time to time, however, a portion of these fixed-rate loans may be retained in the loan portfolio to meet the Bank’s asset/liability management objectives. The Bank uses an automated underwriting program, which preliminarily qualifies a loan as conforming to Freddie Mac underwriting standards when the loan is originated. At September 30, 2019, $37.952021, $42.83 million, or 28.6%35.7%, of the Bank’s one- to four-family loan portfolio consisted of fixed-rate mortgage loans.
The Bank also offers adjustable-rate mortgage (“ARM”) loans. All of the Bank’s ARM loans are retained in its loan portfolio. The Bank offers several ARM products which adjust annually or every three to five years after an initial period ranging from one to five years and are typically subject to a limitation on the annual interest rate increase of 2% and an overall limitation of 6%. These ARM products generally are re-priced utilizing the weekly average yield on one yearone-year U.S. Treasury securities adjusted to a constant maturity of one year plus a margin of 2.75% to 4.00%. The Bank also offers ARM loans tied to Thethe Wall Street Journal prime lending rate ("Prime Rate") index which typically do not have periodic or lifetime adjustment limits. Loans tied to the Prime Rate normally have margins ranging up to 3.0%. ARM loans held in the Bank’s portfolio do not permit negative amortization of principal. Borrower demand for ARM loans versus fixed-rate mortgage loans is a function of the level of interest rates, the expectations of changes in the level of interest rates and the difference between the initial interest rates and fees charged for each type of loan. The relative amount of fixed-rate mortgage loans and ARM loans that can be originated atany time is largely determined by the demand for each in a competitive environment. At September 30, 2019, $94.712021, $77.11 million, or 71.4%64.3%, of the Bank’s one- to four- family loan portfolio consisted of ARM loans.
A portion of the Bank’s ARM loans are “non-conforming”,“non-conforming,” because they do not satisfy acreage limits or various other requirements imposed by Freddie Mac. Some of these loans are also originated to meet the needs of borrowers who cannot otherwise satisfy Freddie Mac credit requirements because of personal and financial reasons (i.e., divorce, bankruptcy, length of time employed, etc.), and other aspects, which do not conform to Freddie Mac’s guidelines. Such borrowers may have higher debt-to-income ratios, or the loans are secured by unique properties in rural markets for which there are no sales of comparable properties to support the value according to secondary market requirements. These loans are known as non-conforming loans, and the Bank may require additional collateral or lower loan-to-value ratios to reduce the risk of these loans. The Bank believes that these loans satisfy a need in its local market area. As a result, subject to market conditions, the Bank intends to continue to originate these types of loans.
The retention of ARM loans in the Bank’s loan portfolio helps reduce the Bank’s exposure to changes in interest rates. There are, however, unquantifiable credit risks resulting from the potential of increased interest to be paid by the customer as a result of increases in interest rates. It is possible that during periods of rising interest rates, the risk of default on ARM loans may increase as a result of repricing and the increased costs to the borrower. The Bank attempts to reduce the potential for delinquencies and defaults on ARM loans by qualifying the borrower based on the borrower’s ability to repay the ARM loan assuming a 2.0% increase in the initial interest rate. Another consideration is that although ARM loans allow the Bank to increase the sensitivity of its asset base due to changes in the interest rates, the extent of this interest sensitivity is limited by the periodic and lifetime interest rate adjustment limits. Because of these considerations, the Bank has no assurance that yield increases on ARM loans will be sufficient to offset increases in the Bank’s cost of funds.
While fixed-rate, single-family residential mortgage loans are normally originated with 15 to 30 year terms to maturity, these loans typically remain outstanding for substantially shorter periods, because borrowers often prepay their loans in full upon sale of the property pledged as security or upon refinancing the original loan. In addition, substantially all mortgage loans in the Bank’s loan portfolio contain due-on-sale clauses providing that the Bank may declare the unpaid amount due and payable upon the sale of the property securing the loan. Typically, the Bank enforces these due-on-sale clauses to the extent permitted by law and as business judgment dictates. Thus, average loan maturity is a function of, among other factors, the level of purchase and sale activity in the real estate market, prevailing interest rates and the interest rates received on outstanding loans.
The Bank requires that fire and extended coverage casualty insurance be maintained on the collateral for all of its real estate secured loans and flood insurance, if appropriate.
The Bank’s lending policies generally limit the maximum loan-to-value ratio on mortgage loans secured by owner-occupied properties to 95% of the lesser of the appraised value or the purchase price. However, the Bank usually obtains private mortgage insurance (“PMI”) on the portion of the principal amount that exceeds 80% of the appraised value of the security property. The maximum loan-to-value ratio on mortgage loans secured by non-owner-occupied properties is generally
80% (90% for loans
originated for sale in the secondary market to Freddie Mac or the FHLB). At September 30, 2019, three2021, two one- to four-family loans totaling $699,000$407,000 were on non-accrual status. See “Lending Activities - Non-performing Loans and Delinquencies.”
Multi-Family Lending. At September 30, 2019, $76.042021, $87.56 million, or 7.7%8.1%,of the Bank’s total loan portfolio was secured by multi-family dwelling units (more than four units) located primarily in the Bank’s primary market area. Multi-family loans are generally originated with variable rates of interest ranging from1.00% to 3.50% over the one-year constant maturity U.S. Treasury Bill Index, the Prime Rate or a matched term FHLB borrowing, with principal and interest payments fully amortizing over terms of up to 30 years. At September 30, 2019,2021, the Bank’s largest multi-family loan had an outstanding principal balance of $5.29$7.51 million and was secured by an apartment building located in ClarkPierce County. At September 30, 2019,2021, this loan was performing according to its repayment terms.
The maximum loan-to-value ratio for multi-family loans is generally limited to not more than 80%. The Bank generally requests its multi-family loan borrowers with loan balances in excess of $750,000 to submit financial statements and rent rolls annually on the properties securing such loans. The Bank also inspects such properties annually. The Bank generally imposes a minimum debt coverage ratio of 1.20 for loans secured by multi-family properties.
Multi-family mortgage lending affords the Bank an opportunity to receive interest at rates higher than those generally available from one- to four- family residential lending. However, loans secured by multi-family properties usually are greater in amount, more difficult to evaluate and monitor and, therefore, may involve a greater degree of risk than one- to four-family residential mortgage loans. Because payments on loans secured by multi-family properties are often dependent on the successful operation and management of the properties, repayment of such loans may be affected by adverse conditions in the real estate market or the economy. The Bank seeks to minimize these risks by scrutinizing the financial condition of the borrower, the quality of the collateral and the management of the property securing the loan. If the borrower is other than an individual, the Bank also generally obtains personal guarantees from the principals (with ownership interests of 20% or more) based on a review of personal financial statements. At September 30, 2019,2021, all multi-family loans were performing according to their repayment terms. See "Lending Activities - Non-performing Loans and Delinquencies."
Commercial Real Estate Lending. Commercial real estate loans totaled $419.12$470.65 million, or 42.3%43.5%, of the total loan portfolio at September 30, 2019.2021. The Bank originates commercial real estate loans generally at variable interest rates with principal and interest payments fully amortizing over terms of up to 30 years. These loans are secured by properties, such as industrial warehouses, office buildings, retail/wholesale facilities, mini-storage facilities, motels, nursing homes, restaurants and convenience stores, generally located in the Bank’s primary market area. At September 30, 2019,2021, the largest commercial real estate loan was secured by a medical buildingnursing home facility in Pierce County, had a balance of $7.93$7.70 million and was performing according to its repayment terms. At September 30, 2019,2021, twocommercial real estate loans totaling $779,000$773,000were on non-accrual status. See “Lending Activities - Non-performing Loans and Delinquencies.”
The Bank typically requires appraisals of properties securing commercial real estate loans. For loans that are less than $250,000, the Bank may use an evaluation provided by a third partythird-party vendor in lieu of an appraisal. Appraisals are performed by independent appraisers designated by the Bank. The Bank considers the quality and location of the real estate, the credit history of the borrower, the cash flow of the project and the quality of management involved with the property when making these loans. The Bank generally imposes a minimum debt coverage ratio of approximately 1.20 for loans secured by income producing commercial properties. Loan-to-value ratios on commercial real estate loans are generally limited to not more than 80%. If the borrower is other than an individual, the Bank also generally obtains personal guarantees from the principals (with ownership interests of 20% or more) based on a review of personal financial statements.
Commercial real estate lending affords the Bank an opportunity to receive interest at rates higher than those generally available from one- to four-family residential lending. However, loans secured by such properties usually are greater in amount, more difficult to evaluate and monitor and, therefore, involve a greater degree of risk than one- to four-family residential mortgage loans. Because payments on loans secured by commercial properties often depend upon the successful operation and management of the properties, repayment of these loans may be affected by adverse conditions in the real estate market or the economy. The Bank seeks to minimize these risks by generally limiting the maximum loan-to-value ratio to 80% and scrutinizing the financial condition of the borrower, the quality of the collateral and the management of the property securing the loan. The Bank also generally requests annual financial information and rent rolls on the subject property from the borrowers on loans over $750,000.
Construction Lending. The Bank currently originates two types of residential construction loans: (i) custom construction and owner/builder construction loans and (ii) speculative construction loans. The Bank believes that its lengthy experience in providing residential construction loans has enabled it to establish processing and disbursement procedures to meet the needs of its borrowers while reducing many of the risks inherent with construction lending. The Bank also originates
construction loans for multi-familycommercial properties, commercialmulti-family properties, and land development projects. The Bank's construction
loans generally provide for the payment of interest only during the construction phase, which is billed monthly, although during the term of some construction loans, no payment from the borrower is required since the accumulated interest is added to the principal of the loan through an interest reserve. At September 30, 2019,2021, the Bank's construction loans totaled $223.53$233.21 million, or 22.5%21.5% of the Bank's total loan portfolio, including undisbursed loans in process of $92.23$95.22 million. All construction loans were performing according to their repayment terms at September 30, 2019.2021. See "Lending Activities - Non-performing Loans and Delinquencies."
At September 30, 20192021 and 2018,2020, the composition of the Bank’s construction loan portfolio was as follows:
| | | | | | | | | | | | | | | | | | | | | | | |
| | At September 30, |
| | 2021 | | 2020 |
|
Balance | | Percent of
Total | |
Balance | | Percent of
Total |
| | (Dollars in thousands) |
| Custom and owner/builder | $ | 109,152 | | | 46.80 | % | | $ | 129,572 | | | 59.03 | % |
| Speculative one- to four-family | 17,813 | | | 7.64 | | | 14,592 | | | 6.65 | |
| Commercial real estate | 43,365 | | | 18.60 | | | 33,144 | | | 15.10 | |
| Multi-family | 52,071 | | | 22.33 | | | 34,476 | | | 15.71 | |
| Land development | 10,804 | | | 4.63 | | | 7,712 | | | 3.51 | |
| Total | $ | 233,205 | | | 100.00 | % | | $ | 219,496 | | | 100.00 | % |
|
| | | | | | | | | | | | | |
| | At September 30, |
| | 2019 | | 2018 |
| | Outstanding Balance | | Percent of Total | | Outstanding Balance | | Percent of Total |
| | (Dollars in thousands) |
| Custom and owner/builder | $ | 128,848 |
| | 57.64 | % | | $ | 119,555 |
| | 63.47 | % |
| Speculative one- to four-family | 16,445 |
| | 7.36 |
| | 15,433 |
| | 8.19 |
|
| Commercial real estate | 39,566 |
| | 17.70 |
| | 39,590 |
| | 21.02 |
|
| Multi-family | 36,263 |
| | 16.22 |
| | 10,740 |
| | 5.70 |
|
| Land development | 2,404 |
| | 1.08 |
| | 3,040 |
| | 1.62 |
|
| Total | $ | 223,526 |
| | 100.00 | % | | $ | 188,358 |
| | 100.00 | % |
Custom and owner/builder construction loans are originated to home owners and are typically converted to or refinanced into permanent loans at the completion of construction. The construction phase of these loans generally lasts up to 12 months with fixed interest rates typically ranging from 4.50% to 6.50% and with loan-to-value ratios of 80% (or up to 95% with PMI)of the appraised estimated value of the completed property. At the completion of construction, the loan is converted to or refinanced into either a fixed-rate mortgage loan, which conforms to secondary market standards, or an ARM loan for retention in the Bank’s portfolio. At September 30, 2019, custom and owner/builder construction loans totaled $128.85 million, or 57.6% of the total construction loan portfolio. At September 30, 2019,2021, the largest outstanding custom and owner/builder construction loan had an outstanding balance of $1.76 million$838,000 (including $788,000$181,000 of undisbursed loans in process) and was performing according to its repayment terms.
Speculative one- to four-family construction loans are made to home builders and are termed “speculative”, because the home builder does not have, at the time of loan origination, a signed contract with a home buyer who has a commitment for permanent financing with either the Bank or another lender for the finished home. The home buyer may be identified either during or after the construction period, with the risk that the builder will have to debt service the speculative construction loan and pay real estate taxes and other carrying costs of the completed home for a significant time after the completion of construction until the home buyer is identified and a sale is consummated. Rather than originating lines of credit to home builders to construct several homes at once, the Bank generally originates and underwrites a separate loan for each home. Speculative construction loans are generally originated for a term of 12 months, with current rates generally ranging from 5.00% to 7.00% 6.50%, and with a loan-to-value ratio of no more than80% of the appraised value of the completed property. At September 30, 2019, speculative one- to four-family construction loans totaled $16.45 million, or 7.4% of the total construction loan portfolio. At September 30, 2019,2021, the largest aggregate outstanding balance to one borrower for speculative one- to four-family construction loans totaled $2.60$4.84 million (including $1.48$2.41 million of undisbursed loans in process) and was comprised of eleventen loans that were performing according to their repayment terms.
The Bank also provides construction financing for multi-family and commercial properties. At September 30, 2019,2021, these loans amounted to $75.83$95.44 million, or 33.9%40.9%, of construction loan balances compared to $50.33 million, or 26.7%, of construction loan balances at September 30, 2018.balances. These loans are typically secured by apartment buildings, condominiums, mini-storage facilities, office buildings, hotels and retail rental space predominantly located in the Bank’s primary market area. AtSeptember 30, 2019,2021, thelargest outstanding multi-family construction loan was for $10.00 million secured by an apartment building project in Thurston County andwhich had a balance of $11.0 million (including $10.8 million of undisbursed construction loan proceeds) and was performing according to its repayment terms.not yet commenced construction. At September 30, 2019,2021, the largest outstanding commercial real estate construction loan was a purchased participation loan secured by an assisted living facility project in King CountySalem, Oregon and had a balance of $6.10 million.$5.31 million with no undisbursed funds available. This loan was performing according to its repayment terms at September 30, 2019.2021.
All construction loans must be approved by a member of one of the Bank’s Loan Committees or the Bank’s Board of Directors, or in the case of one- to four-family construction loans that meet Freddie Mac guidelines, by the Regional Manager of Community Lending, the Loan Department Supervisor or a Bank underwriter. See “- Lending“Lending Activities - Loan Solicitation and
Processing.” Prior to approval of any construction loan application, an independent fee appraiser inspects the site and prepares an appraisal on an "as completed" basis, and the Bank reviews the existing or proposed improvements, identifies the market for the proposed project and analyzes the pro-forma data and assumptions on the project. In the case of a speculative or
custom construction loan, the Bank reviews the experience and expertise of the builder. After this preliminary review, the application is processed, which includes obtaining credit reports, financial statements and tax returns or verification of income on the borrowers and guarantors, an independent appraisal of the project, and any other expert reports necessary to evaluate the proposed project. In the event of cost overruns, the Bank generally requires that the borrower increase the funds available for construction by paying the cost of such overruns directly or by depositing its own funds into a secured savings account, the proceeds of which are used to pay construction costs or to, the extent available, authorizes disbursements from a loan contingency line in the construction budget.
Loan disbursements during the construction period are made to the builder, materials supplier or subcontractor, based on a line item budget. Periodic on-site inspections are made by qualified independent inspectors to document the reasonableness of draw requests. For most builders, the Bank disburses loan funds by providing vouchers to borrowers, which when used by the borrower to purchase supplies are submitted by the supplier to the Bank for payment.
The Bank originates construction loan applications primarily through customer referrals, contacts in the business community and, occasionally, real estate brokers seeking financing for their clients.
Construction lending affords the Bank the opportunity to achieve higher interest rates and fees with shorter terms to maturity than does its single-family permanent mortgage lending. Construction lending, however, is generally considered to involve a higher degree of risk than single-family permanent mortgage lending, because funds are advanced upon the collateral for the project based on an estimate of the costs that will produce a future value at completion. Because of the uncertainties inherent in estimating construction costs, as well as the market value of the completed project and the effects of governmental regulation on real property, it is relatively difficult to evaluate accurately the total funds required to complete a project and the completed project loan-to-value ratio. With regard to loans originated to builders for speculative projects, changes in the demand, such as for new housing and higher than anticipated building costs, may cause actual results to vary significantly from those estimated. A downturn in the housing or the real estate market could increase loan delinquencies, defaults, and foreclosures, and significantly impair the value of our collateral and our ability to sell the collateral upon foreclosure. Some builders who have borrowed from us to fund construction projects on a speculative basis have more than one loan outstanding with us. Consequently, an adverse development with respect to one loan or one credit relationship can expose us to a significantly greater risk of loss.
In addition, during the term of many of our construction loans granted to builders who are building residential units for sale, no payment from the borrower is required since the accumulated interest is added to the principal of the loan through an interest reserve. As a result, these loans often involve the disbursement of funds with repayment substantially dependent on the success of the ultimate project and the ability of the borrower to sell or lease the property or obtain permanent take-out financing, rather than the ability of the borrower or guarantor to repay principal and interest. If our appraisal of the value of a completed project proves to be overstated, we may have inadequate security for the repayment of the loan upon completion of construction of the project and may incur a loss. Because construction loans require active monitoring of the building process, including cost comparisons and on-site inspections, these loans are more difficult and costly to monitor. Increases in market rates of interest may have a more pronounced effect on construction loans by rapidly increasing the end-purchasers' borrowing costs, thereby reducing the overall demand for the project. Properties under construction are often difficult to sell and typically must be completed in order to be successfully sold which also complicates the process of working out problem construction loans. This may require us to advance additional funds and/or contract with another builder to complete construction. Furthermore, in the case of speculative construction loans, there is an added risk associated with identifying an end-purchaser for the finished project.
The Bank historically originated loans to real estate developers with whom it had established relationships for the purpose of developing residential subdivisions (i.e., installing roads, sewers, water and other utilities; generally with ten to 50 lots). At September 30, 2019, land development loans totaled $2.40 million, or 1.1% of the total construction loan portfolio. Currently, the Bank is originating land development loans on a limited basis. Land development loans are secured by a lien on the property and typically are made for a period of two to five years with fixed or variable interest rates, with loan-to-value ratios generally not exceeding 75%.Land development loans are generally structured so that the Bank is repaid in full upon the sale by the borrower of approximately 80% of the subdivision lots. In addition, in the case of a corporate borrower, the Bank also generally obtains personal guarantees from corporate principals (with ownership interests in the borrowing entity of 20% or more) and reviews their personal financial statements. Land development loans secured by land under development involve greater risks than one- to four-family residential mortgage loans, because these loan funds are advanced upon the predicted future value of the developed property upon completion. If the estimate of the future value proves to be inaccurate, in the event of default and foreclosure, the Bank may be confronted with a property the value of which is insufficient to assure full repayment. The Bank has historically attempted to
minimize this risk by generally limiting the maximum loan-to-value ratio on land and land development loans to 75% of the estimated developed value of the secured property.
Land Lending. The Bank originates loans for the acquisition of land upon which the purchaser can then build or make improvements necessary to build or to use for recreational purposes. At September 30, 2019, land loans totaled $30.77 million, or 3.1%, of the Bank’s total loan portfolio.Land loans originated by the Bank generally have maturities of one to ten years. The largest land loan is secured by land in ThurstonClark County, had an outstanding balance of $2.02$1.62 million and was performing according to its repayment terms at September 30, 20192021. At September 30, 2019,2021, three land loans totaling $204,000$683,000 were on non-accrual status. See “Lending Activities - Non-performing Loans and Delinquencies.”
Loans secured by undeveloped land or improved lots involve greater risks than one- to four-family residential mortgage loans because these loans are more difficult to evaluate. If the estimate of value proves to be inaccurate, in the event of default and foreclosure, the Bank may be confronted with a property the value of which is insufficient to assure full repayment. Land loans also pose additional risk because of the lack of income being produced by the property and potential illiquid nature of the collateral. These risks can be significantly impacted by supply and demand conditions. The Bank attempts to minimize these risks by generally limiting the maximum loan-to-value ratio on land loans to 75%.
Consumer Lending. Consumer loans generally have shorter terms to maturity and may have higher interest rates than mortgage loans. Consumer loans include home equity lines of credit, second mortgage loans, savings account loans, automobile loans, boat loans, motorcycle loans, recreational vehicle loans and unsecured loans. Consumer loans are made with both fixed and variable interest rates and with varying terms. At September 30, 2019, consumer loans amounted to $44.50 million, or 4.5%, of the Bank's total loan portfolio.
At September 30, 2019, the largest component of the consumer loan portfolio consisted of second mortgage loans and home equity lines of credit, which totaled $40.19 million, or 4.1%, of the Bank's total loan portfolio. Home equity lines of credit and second mortgage loans are made for purposes such as the improvement of residential properties, debt consolidation and education expenses, among others. The majority of these loans are made to existing customers and are secured by a first or second mortgage on residential property. The loan-to-value ratio is typically 90% or less, when taking into account both the first and second mortgage loans. Second mortgage loans typically carry fixed interest rates with a fixed payment over a term between five and 15 years. Home equity lines of credit are generally made at interest rates tied to the Prime Rate. Second mortgage loans and home equity lines of credit have greater credit risk than one- to four-family residential mortgage loans in which the Bank is in the first lien position, because they are generally secured by mortgages subordinated to the existing first mortgage on the property. For those second mortgage loans and home equity lines credit which the Bank does not hold the existing first mortgage on the property, it is unlikely that the Bank will be successful in recovering all or a portion of the loan balance in the event of default unless the Bank is prepared to repay the first mortgage loan and such repayment and the costs associated with a foreclosure are justified by the value of the property.
Consumer loans entail greater risk than do residential mortgage loans, particularly in the case of consumer loans that are unsecured or secured by rapidly depreciating assets such as automobiles. In such cases, any repossessed collateral for a defaulted consumer loan may not provide an adequate source of repayment of the outstanding loan balance as a result of the greater likelihood of damage, loss or depreciation. The remaining deficiency often does not warrant further substantial collection efforts against the borrower beyond obtaining a deficiency judgment. In addition, consumer loan collections are dependent on the borrower’s continuing financial stability and are more likely to be adversely affected by job loss, divorce, illness or personal bankruptcy. Furthermore, the application of various federal and state laws, including federal and state bankruptcy and insolvency laws, may limit the amount that can be recovered on such loans. The Bank believes that these risks are not as prevalent in the case of the Bank’s consumer loan portfolio, because a large percentage of the portfolio consists of second mortgage loans and home equity lines of credit that are underwritten in a manner such that they result in credit risk that is substantially similar to one- to four-family residential mortgage loans. At September 30, 2019, eight2021, seven consumer loans totaling $626,000$533,000 were on non-accrual status. See “Lending Activities - Non-performing Loans and Delinquencies.”
Commercial Business Lending. Commercial business loans (excluding SBA PPP loans) totaled $64.76$74.58 million, or 6.5%6.9%, of the loan portfolio at September 30, 2019.2021. Commercial business loans are generally secured by business equipment, accounts receivable, inventory and/or other property and are made at variable rates of interest equal to a negotiated margin above the Prime Rate. The Bank also generally obtains personal guarantees from the principals based on a review of personal financial statements. The largest commercial business loan had an outstanding balance of $1.85$4.15 million at September 30, 20192021 and was performing according to its repayment terms. At September 30, 2019, ten2021, six commercial business loans totaling $725,000$458,000 were on non-accrual status. See “Lending Activities - Non-performing Loans and Delinquencies.”
The Bank has increased commercial business loan originations made under the U.S. Small Business Administration ("SBA") 7(a) program. Loans made by the Bank under the SBA 7(a) program generally are made to small businesses to provide working capital or to provide funding for the purchase of businesses, real estate, or equipment. These loans generally are secured by a combination of assets that may include equipment, receivables, inventory, business real property, and sometimes a lien on the personal residence of the borrower. The terms of these loans vary by purpose and type of underlying collateral. The loans are primarily underwritten on the basis of the borrower's ability to service the loan from income. Under the SBA 7(a) program, the loans carry a SBA guaranty for up to 85% of the loan. Typical maturities for this type of loan vary but can be up to ten years. SBA 7(a) loans are all adjustable rate loans based on the Prime Rate. Under the SBA 7(a) program, the Bank can sell in the secondary market the guaranteed portion of its SBA 7(a) loans and retain the related unguaranteed
portion of these loans, as well as the servicing on such loans, for which it is paid a fee. The loan servicing spread is generally a minimum of 1.00% on all SBA 7(a) loans. The Bank generally offers SBA 7(a) loans within a range of $50,000 to $1.50 million.
Within Timberland's commercial business loan portfolio are restaurant loans and loans to other retail and service businesses totaling $9.20 million at September 30, 2021 that were originated in conjunction with a third-party firm. As additional security for these loans, the Company holds cash collateral of 25% of the outstanding loan balance. Unless prior arrangements are made, and the Company consents, loans falling more than four weeks delinquent are eligible for purchase in accordance with a Marketing and Servicing Agreement in existence since March 6, 2014. As an accommodation, the Company has agreed to temporarily extend the purchase requirement to 12 weeks before a purchase is required from the loan portfolio. All of these loans were performing at September 30, 2021.
Commercial business lending generally involves greater risk than residential mortgage lending and involves risks that are different from those associated with residential and commercial real estate lending. Real estate lending is generally considered to be collateral based lending with loan amounts based on predetermined loan to collateral values, and liquidation of the underlying real estate collateral is viewed as the primary source of repayment in the event of borrower default. Although commercial business loans are often collateralized by equipment, inventory, accounts receivable and/or other business assets, the liquidation of collateral in the event of a borrower default is often an insufficient source of repayment because accounts receivable may be uncollectible and inventories and equipment may be obsolete or of limited use, among other things. Accordingly, the repayment of a commercial business loan depends primarily on the creditworthiness of the borrower (and any guarantors), while liquidation of collateral is a secondary and often insufficient source of repayment.
SBA PPP Lending. The CARES Act authorized the SBA to temporarily guarantee loans under a new loan program called the Paycheck Protection Program. As a qualified SBA lender, the Company was automatically authorized to originate PPP loans upon commencement of the program in April 2020 through the program's initial conclusion in August 2020. The CAA 2021, which was signed into law on December 27, 2020 renewed and extended the PPP until May 31, 2021, the final expiration date for PPP lending. PPP loans have: (a) an interest rate of 1.0%, (b) a two-year loan term to maturity for loans approved by the SBA prior to June 5, 2020, (unless the borrower and the Company mutually agree to extend the term of the loans to five years) and a five-year maturity for loans approved thereafter, and (c) principal and interest payments deferred for at least six months from the date of disbursement. The SBA guarantees 100% of the PPP loans made to eligible borrowers. The entire principal amount of the borrower's PPP loan, including any accrued interest, is eligible to be forgiven and repaid by the SBA. The largest SBA PPP loan had an outstanding balance of $2.00 million at September 30, 2021.
Loan Maturity. The following table sets forth certain information at September 30, 20192021 regarding the dollar amount of loans maturing in the Bank’s portfolio based on their contractual terms to maturity but does not include scheduled payments or potential prepayments. Loans having no stated maturity and overdrafts are reported as due in one year or less.
| | | | Within 1 Year | | After 1 Year Through 3 Years | | After 3 Years Through 5 Years | | After 5 Years Through 10 Years | | After 10 Years | | Total | | Within
1 Year | | After
1 Year
Through
3 Years | | After
3 Years
Through
5 Years | | After
5 Years
Through
10 Years | | After
10 Years | | Total |
| | (Dollars in thousands) | | (Dollars in thousands) |
| Mortgage loans: | | | | | | | | | | | | Mortgage loans: | | | | | | | | | | | |
| One- to four-family | $ | 1,161 |
| | $ | 1,978 |
| | $ | 4,488 |
| | $ | 49,452 |
| | $ | 75,582 |
| | $ | 132,661 |
| One- to four-family | $ | 3,104 | | | $ | 3,011 | | | $ | 12,501 | | | $ | 40,230 | | | $ | 61,089 | | | $ | 119,935 | |
| Multi-family | 799 |
| | 3,672 |
| | 8,604 |
| | 62,140 |
| | 821 |
| | 76,036 |
| Multi-family | 6,204 | | | 6,775 | | | 9,571 | | | 57,219 | | | 7,794 | | | 87,563 | |
| Commercial | 14,573 |
| | 29,954 |
| | 61,206 |
| | 302,260 |
| | 11,124 |
| | 419,117 |
| Commercial | 20,712 | | | 33,638 | | | 44,190 | | | 352,501 | | | 19,609 | | | 470,650 | |
| Construction (1) | 223,526 |
| | — |
| | — |
| | — |
| | — |
| | 223,526 |
| Construction (1) | 233,205 | | | — | | | — | | | — | | | — | | | 233,205 | |
| Land | 15,923 |
| | 7,805 |
| | 3,642 |
| | 2,014 |
| | 1,386 |
| | 30,770 |
| Land | 7,297 | | | 8,104 | | | 1,458 | | | 1,715 | | | 1,362 | | | 19,936 | |
| Consumer loans: | | | | | | | | | | | | Consumer loans: | |
| Home equity and second mortgage | 3,679 |
| | 5,675 |
| | 5,026 |
| | 15,015 |
| | 10,795 |
| | 40,190 |
| Home equity and second mortgage | 5,528 | | | 5,790 | | | 6,709 | | | 10,335 | | | 4,626 | | | 32,988 | |
| Other | 1,652 |
| | 249 |
| | 235 |
| | 533 |
| | 1,643 |
| | 4,312 |
| Other | 555 | | | 88 | | | 231 | | | 567 | | | 1,071 | | | 2,512 | |
| Commercial business loans | 29,533 |
| | 6,681 |
| | 9,065 |
| | 15,238 |
| | 4,247 |
| | 64,764 |
| |
| Commercial business | | Commercial business | 5,732 | | | 18,480 | | | 10,916 | | | 38,885 | | | 566 | | | 74,579 | |
| SBA PPP | | SBA PPP | 360 | | | 34 | | | 40,528 | | | — | | | — | | | 40,922 | |
| Total | $ | 290,846 |
| | $ | 56,014 |
| | $ | 92,266 |
| | $ | 446,652 |
| | $ | 105,598 |
| | 991,376 |
| Total | $ | 282,697 | | | $ | 75,920 | | | $ | 126,104 | | | $ | 501,452 | | | $ | 96,117 | | | 1,082,290 | |
| | | | | | | | | | | | | | | | | | | | | | | |
| Less: | |
| | |
| | |
| | |
| | |
| | |
| Less: | | | | | | | | | | | |
| Undisbursed portion of construction loans in process | |
| | |
| | |
| | |
| | |
| | (92,226 | ) | Undisbursed portion of construction loans in process | | | | | | | | | | | (95,224) | |
| Deferred loan origination fees, net | |
| | |
| | |
| | |
| | |
| | (2,798 | ) | Deferred loan origination fees, net | | | | | | | | | | | (5,143) | |
| Allowance for loan losses | |
| | |
| | |
| | |
| | |
| | (9,690 | ) | Allowance for loan losses | | | | | | | | | | | (13,469) | |
| Total loans receivable, net | |
| | |
| | |
| | |
| | |
| | $ | 886,662 |
| Total loans receivable, net | | | | | | | | | | | $ | 968,454 | |
_____________
(1) Includes $128.85$109.15 million of customer and owner/building construction/permanent loans, a portion of which may convert to permanent mortgage loans once construction is completed.
The following table sets forth the dollar amount of all loans due after one year from September 30, 2019,2021, which have fixed interest rates and have floating or adjustable interest rates: | | | | Fixed Rates | | Floating or Adjustable Rates | | Total | | Fixed
Rates | | Floating or
Adjustable Rates | | Total |
| | (Dollars in thousands) | | (Dollars in thousands) |
| Mortgage loans: | | | | | | Mortgage loans: | | | | | |
| One- to four-family | $ | 37,952 |
| | $ | 93,548 |
| | $ | 131,500 |
| One- to four-family | $ | 41,900 | | | $ | 74,931 | | | $ | 116,831 | |
| Multi-family | 2,222 |
| | 73,015 |
| | 75,237 |
| Multi-family | 27,540 | | | 53,819 | | | 81,359 | |
| Commercial | 83,840 |
| | 320,704 |
| | 404,544 |
| Commercial | 151,780 | | | 298,158 | | | 449,938 | |
| | Land | 9,726 |
| | 5,121 |
| | 14,847 |
| Land | 10,245 | | | 2,394 | | | 12,639 | |
| Consumer loans: | |
| | | | |
| Consumer loans: | | | |
| Home equity and second mortgage | 10,459 |
| | 26,052 |
| | 36,511 |
| Home equity and second mortgage | 4,430 | | | 23,030 | | | 27,460 | |
| Other | 1,610 |
| | 1,050 |
| | 2,660 |
| Other | 1,123 | | | 834 | | | 1,957 | |
| Commercial business loans | 12,905 |
| | 22,326 |
| | 35,231 |
| |
| Commercial business | | Commercial business | 35,823 | | | 33,024 | | | 68,847 | |
| SBA PPP | | SBA PPP | 40,562 | | | — | | | 40,562 | |
| Total | $ | 158,714 |
| | $ | 541,816 |
| | $ | 700,530 |
| Total | $ | 313,403 | | | $ | 486,190 | | | $ | 799,593 | |
Scheduled contractual principal repayments of loans do not reflect the actual life of these assets. The average life of loans is substantially less than their contractual terms because of prepayments. In addition, due-on-sale clauses on loans generally give the Bank the right to declare loans immediately due and payable in the event, among other things, that the borrower sells the real property subject to the mortgage and the loan is not repaid. The average life of mortgage loans tends to increase when current mortgage loan interest rates are substantially higher than interest rates on existing mortgage loans and, conversely, decrease when interest rates on existing mortgage loans are substantially higher than current mortgage loan interest rates.
Loan Solicitation and Processing. Loan originations are obtained from a variety of sources, including walk-in customers and referrals from builders and realtors. Upon receipt of a loan application from a prospective borrower, a credit report and other data are obtained to verify specific information relating to the loan applicant’s employment, income and credit standing. An appraisal of the real estate offered as collateral generally is undertaken by a certified appraiser retained by the Bank.
Loan applications are initiated by loan officers and are required to be approved by an authorized loan officer or Bank underwriter, one of the Bank’s Loan Committees or the Bank’s Board of Directors. The Bank’s Consumer Loan Committee consists of several underwriters, each of whom can approve one- to four-family mortgage loans and other consumer loans up to and including the current Freddie Mac single-family limit. Loan officers may also be granted individual approval authority for certain loans up to a maximum of $250,000. The approval authority for individual loan officers is granted on a case by case basis by the Bank's Chief Credit Administrator or President. All construction loans must be approved by a member of one of the Bank's Loan Committees or the Bank's Board of Directors, or in the case of one- to four- family construction loans that meet Freddie Mac guidelines, by the Regional Manager of Community Lending, the Loan Department Supervisor or a Bank underwriter, subject to their individual or Loan Committee loan limit. The Bank’s Commercial Loan Committee, which consists of the Bank’s President, Chief Credit Administrator, Executive Vice President of Lending, a commercial underwriter, and two Senior Vice Presidents of Commercial Lending, may approve commercial real estate loans and commercial business loans up to and including $3.00 million. The Bank’s President, Chief Credit Administrator and Executive Vice President of Lending also have individual lending authority for loans up to and including $750,000. The Bank’s Board Loan Committee, which consists of two rotating non-employee Directors and the Bank’s President, may approve loans up to and including $5.00 million. Loans in excess of $5.00 million, as well as loans of any amount granted to a single borrower whose aggregate loans exceed $5.00 million, must be approved by the Bank’s Board of Directors.
Loan Originations, Purchases and Sales. During the years ended September 30, 2019, 20182021, 2020 and 2017,2019, the Bank’s total gross loan originations were $356.04$602.34 million, $329.59$597.19 million and $340.61$356.04 million, respectively. Periodically, the Bank purchases loan participation interests in construction, commercial real estate and multi-family loans, secured by properties generally located in Washington State, from other banks. These participation loans are underwritten in accordance with the Bank’s underwriting guidelines and are without recourse to the seller other than for fraud. During the yearsyear ended September 30, 2021, the Bank purchased $9.04 million in loan participation interests. During the year ended September 30, 2020, the Bank did not purchase any loan participation interests. During the year ended September 30, 2019, 2018 and 2017, the Bank purchased loan participation interests of $8.66 million, $8.40 million and $13.10 million, respectively. million.
Consistent with its asset/liability management strategy, the Bank’s policy generally is to retain in its portfolio all ARM loans originated and to sell fixed ratefixed-rate one- to four-family mortgage loans in the secondary market to Freddie Mac; however, from time to time, a portion of fixed-rate loans may be retained in the Bank’s portfolio to meet its asset-liability objectives. The Bank also began selling the guaranteed portion of some of its SBA 7(a) loans in the secondary market during the year ended September
30, 2016. Loans sold in the secondary market are generally sold on a servicing retained basis. At September 30, 2019,2021, the Bank’s loan servicing portfolio, which is not included in the Company’s consolidated financial statements, totaled $399.12$419.68 million.
The Bank also periodically sells participation interests in construction loans, commercial real estate loans, multi-family and commercial business loans to other lenders. These sales are usually made to avoid concentrations in a particular loan type or concentrations to a particular borrower and to generate fee income. During the years ended September 30, 2019, 20182021, 2020 and 2017,2019, the Bank sold loan participation interests of $5.43$10.0 million, $253,000,$6.26 million and $9.28$5.43 million, respectively.
The following table shows total loans originated, purchased, sold and repaid during the periodsyears indicated.
| | | | | | | | | | | | | | | | | |
| | Year Ended September 30, |
| 2021 | | 2020 | | 2019 |
| Loans originated: | (Dollars in thousands) |
| Mortgage loans: | | | | | |
| One- to four-family | $ | 174,379 | | | $ | 172,838 | | | $ | 91,669 | |
| Multi-family | 10,727 | | | 12,237 | | | 12,503 | |
| Commercial | 110,063 | | | 74,927 | | | 48,040 | |
| Construction | 169,284 | | | 158,366 | | | 160,693 | |
| Land | 10,654 | | | 4,955 | | | 9,540 | |
| Consumer | 25,674 | | | 19,259 | | | 20,999 | |
| Commercial business loans | 36,672 | | | 27,071 | | | 12,591 | |
| SBA PPP loans | 64,891 | | | 127,535 | | | — | |
| Total loans originated | 602,344 | | | 597,188 | | | 356,035 | |
| | | | | |
| Loans acquired in the South Sound Acquisition (net of fair value discount) | | | | | |
| Mortgage loans: | | | | | |
| One- to four-family | — | | | — | | | 10,190 | |
| Multi-family | — | | | — | | | 7,807 | |
| Commercial | — | | | — | | | 64,967 | |
| Construction | — | | | — | | | 11,730 | |
| Consumer | — | | | — | | | 3,918 | |
| Commercial business loans | — | | | — | | | 22,932 | |
| Total loans acquired | — | | | — | | | 121,544 | |
| | | | | |
| Loans and loan participations purchased: | | | | | |
| Mortgage loans: | | | | | |
| | | | | |
| Commercial | 3,999 | | | — | | | 2,946 | |
| | | | | |
| Construction | — | | | — | | | 5,717 | |
| Commercial business | 5,042 | | | — | | | — | |
| Total loans purchased | 9,041 | | | — | | | 8,663 | |
| Total loans originated, acquired and purchased | 611,385 | | | 597,188 | | | 486,242 | |
| | | | | |
| Loans sold: | | | | | |
| Loan participation interests sold | (10,000) | | | (6,255) | | | (5,431) | |
| Whole loans sold | (140,202) | | | (160,987) | | | (67,600) | |
| Total loans sold | (150,202) | | | (167,242) | | | (73,031) | |
| | | | | |
| Loan principal repayments | (500,032) | | | (287,039) | | | (241,656) | |
| Other items, net | (6,572) | | | (15,694) | | | (10,284) | |
| Net increase (decrease) in loans receivable | $ | (45,421) | | | $ | 127,213 | | | $ | 161,271 | |
|
| | | | | | | | | | | |
| | Year Ended September 30, |
| | 2019 | | 2018 | | 2017 |
| Loans originated: | (Dollars in thousands) |
| Mortgage loans: | | | | | |
| One- to four-family | $ | 91,669 |
| | $ | 81,313 |
| | $ | 88,642 |
|
| Multi-family | 12,503 |
| | 10,362 |
| | 7,841 |
|
| Commercial | 48,040 |
| | 68,443 |
| | 58,777 |
|
| Construction | 160,693 |
| | 125,683 |
| | 144,349 |
|
| Land | 9,540 |
| | 16,300 |
| | 14,056 |
|
| Consumer | 20,999 |
| | 20,151 |
| | 21,999 |
|
| Commercial business loans | 12,591 |
| | 7,339 |
| | 4,947 |
|
| Total loans originated | 356,035 |
| | 329,591 |
| | 340,611 |
|
| | | | | | |
| Loans acquired in the South Sound Acquisition (net of fair value discount) | | | | | |
| Mortgage loans: | | | | | |
| One- to four-family | 10,190 |
| | — |
| | — |
|
| Multi-family | 7,807 |
| | — |
| | — |
|
| Commercial | 64,967 |
| | — |
| | — |
|
| Construction | 11,730 |
| | — |
| | — |
|
| Consumer | 3,918 |
| | — |
| | — |
|
| Commercial business loans | 22,932 |
| | — |
| | — |
|
| Total loans acquired | 121,544 |
| | — |
| | — |
|
| | | | | | |
| Loans and loan participations purchased: | |
| | |
| | |
|
| Mortgage loans: | |
| | |
| | |
|
| Commercial | 2,946 |
| | — |
| | — |
|
| Construction | 5,717 |
| | 7,548 |
| | 11,100 |
|
| Commercial business | — |
| | 855 |
| | 2,000 |
|
| Total loans purchased | 8,663 |
| | 8,403 |
| | 13,100 |
|
| Total loans originated, acquired and purchased | 486,242 |
| | 337,994 |
| | 353,711 |
|
| | | | | | |
| Loans sold: | |
| | |
| | |
|
| Loan participation interests sold | (5,431 | ) | | (253 | ) | | (9,284 | ) |
| Whole loans sold | (67,600 | ) | | (66,131 | ) | | (72,158 | ) |
| Total loans sold | (73,031 | ) | | (66,384 | ) | | (81,442 | ) |
| | | | | | |
| Loan principal repayments | (241,656 | ) | | (235,609 | ) | | (211,303 | ) |
| Other items, net | (10,284 | ) | | (974 | ) | | (33,748 | ) |
| Net increase in loans receivable | $ | 161,271 |
| | $ | 35,027 |
| | $ | 27,218 |
|
Loan Origination Fees. The Bank receives loan origination fees on many of its mortgage loans and commercial business loans. Loan fees are a percentage of the loan which are charged to the borrower for funding the loan. The amount of fees charged by the Bank (excluding SBA PPP loans) is generally up to 2.0% of the loan amount. In addition to the 1.0% interest earned on SBA PPP loans, the Bank earns a fee from the SBA to cover processing costs, which is amortized over the life of the loan and recognized fully at payoff or forgiveness. The Bank began processing loan forgiveness applications and receiving SBA PPP forgiveness payments during the three months ended December 31. 2020. Banks may not collect any fees from the SBA PPP loan applicants.
Accounting principles generally accepted in the United States of America ("GAAP") require fees received and certain loan origination costs for originating loans to be deferred and amortized into interest income over the contractual life of the loan. Net deferred fees or costs associated with loans that are prepaid are recognized as income/expense at the time of prepayment. Unamortized net deferred loan origination fees totaled $2.80$5.14 million (including $1.83 million for SBA PPP loans) at September 30, 2019.2021.
Non-performing Loans and Delinquencies. The Bank assesses late fees or penalty charges on delinquent loans of approximately 5% of the monthly loan payment amount. A majority of loan payments are due on the first day of the month;
however, the borrower is given a 15 day15-day grace period to make the loan payment. When a mortgage loan borrower fails to make a required payment when due, the Bank institutes collection procedures. A notice is mailed to the borrower 16 days after the date the payment iswas due. Attempts to contact the borrower by telephone generally begin on or before the 30th day of delinquency. If a satisfactory response is not obtained, continuous follow-up contacts are attempted until the loan has been brought current. Before the 90th day of delinquency, attempts are made to establish (i) the cause of the delinquency, (ii) whether the cause is temporary, (iii) the attitude of the borrower toward repaying the debt, and (iv) a mutually satisfactory arrangement for curing the default.
If the borrower is chronically delinquent and all reasonable means of obtaining payment on time have been exhausted, foreclosure is initiated according to the terms of the security instrument and applicable law. Interest income on loans in foreclosure is reduced by the full amount of accrued and uncollected interest.
When a consumer loan borrower or commercial business borrower fails to make a required payment on a loan by the payment due date, the Bank institutes similar collection procedures as for its mortgage loan borrowers. All loans becoming 90 days or more past due are placed on non-accrual status, with any accrued interest reversed against interest income, unless they are well secured and in the process of collection.
The Bank’s Board of Directors is updated monthly as to the status of loans that are delinquent by more than 30 days and the status of all foreclosed and repossessed property owned by the Bank.
In late March 2020, the Bank announced loan modification programs to support and provide relief for its borrowers during the COVID-19 pandemic. Loans subject to payment forbearance under the Bank's COVID-19 loan modification program are not reported as delinquent during the forbearance time period. For additional information, see "COVID-19 Loan Modifications" below.
The following table sets forth information with respect to the Company's non-performing assets at the dates indicated:
| | | | | | | | | | | | | | | | | | | | | | | | | | | | | |
| | At September 30, |
| | 2021 | | 2020 | | 2019 | | 2018 | | 2017 |
| Loans accounted for on a non-accrual basis: | (Dollars in thousands) |
| Mortgage loans: | | | | | | | | | |
| One- to four-family (1) | $ | 407 | | $ | 659 | | $ | 699 | | $ | 545 | | $ | 874 |
| | | | | | | | | |
| Commercial | 773 | | 858 | | 779 | | — | | 213 |
| | | | | | | | | |
| Land | 683 | | 394 | | 204 | | 243 | | 566 |
| Consumer loans | 533 | | 564 | | 626 | | 359 | | 258 |
| Commercial business loans | 458 | | 430 | | 725 | | 170 | | — |
| Total | 2,854 | | 2,905 | | 3,033 | | 1,317 | | 1,911 |
| | | | | | | | | |
| Accruing loans which are contractually past due 90 days or more | — | | — | | — | | — | | — |
| Total of non-accrual and 90 days or more past due loans | 2,854 | | 2,905 | | 3,033 | | 1,317 | | 1,911 |
| | | | | | | | | |
| Non-accrual investment securities | 159 | | 209 | | 294 | | 406 | | 533 |
| | | | | | | | | |
| Other real estate owned and other repossessed assets (2) | 157 | | 1,050 | | 1,683 | | 1,913 | | 3,301 |
| Total non-performing assets (3) | $ | 3,170 | | $ | 4,164 | | $ | 5,010 | | $ | 3,636 | | $ | 5,745 |
| | | | | | | | | |
| Troubled debt restructured loans on accrual status (4) | $ | 2,371 | | $ | 2,868 | | $ | 2,903 | | $ | 2,955 | | $ | 3,342 |
| | | | | | | | | |
| Non-accrual and 90 days or more past due loans as a percentage of loans receivable, net (5) | 0.29 | % | | 0.28 | % | | 0.34 | % | | 0.18 | % | | 0.27 | % |
| | | | | | | | | |
| Non-accrual and 90 days or more past due loans as a percentage of total assets | 0.16 | % | | 0.19 | % | | 0.24 | % | | 0.13 | % | | 0.20 | % |
| | | | | | | | | |
| Non-performing assets as a percentage of total assets | 0.18 | % | | 0.27 | % | | 0.40 | % | | 0.36 | % | | 0.60 | % |
| | | | | | | | | |
| Loans receivable, net (5) | $ | 981,923 | | $ | 1,027,289 | | $ | 896,352 | | $ | 734,921 | | $ | 699,917 |
| Total assets | $ | 1,792,180 | | $ | 1,565,978 | | $ | 1,247,132 | | $ | 1,018,290 | | $ | 952,024 |
|
| | | | | | | | | | | | | | | | | | | |
| | At September 30, |
| | 2019 | | 2018 | | 2017 | | 2016 | | 2015 |
| Loans accounted for on a non-accrual basis: | (Dollars in thousands) |
| Mortgage loans: | | | | | | | | | |
| One- to four-family (1) | $ | 699 |
| | $ | 545 |
| | $ | 874 |
| | $ | 914 |
| | $ | 2,368 |
|
| Multi-family | — |
| | — |
| | — |
| | — |
| | 760 |
|
| Commercial | 779 |
| | — |
| | 213 |
| | 612 |
| | 1,016 |
|
| Construction | — |
| | — |
| | — |
| | 367 |
| | — |
|
| Land | 204 |
| | 243 |
| | 566 |
| | 548 |
| | 1,558 |
|
| Consumer loans | 626 |
| | 359 |
| | 258 |
| | 432 |
| | 338 |
|
| Commercial business loans | 725 |
| | 170 |
| | — |
| | — |
| | — |
|
| Total | 3,033 |
| | 1,317 |
| | 1,911 |
| | 2,873 |
| | 6,040 |
|
| | | | | | | | | | |
| Accruing loans which are contractually past due 90 days or more | — |
| | — |
| | — |
| | 135 |
| | 151 |
|
| Total of non-accrual and 90 days past due loans | 3,033 |
| | 1,317 |
| | 1,911 |
| | 3,008 |
| | 6,191 |
|
| | | | | | | | | | |
| Non-accrual investment securities | 294 |
| | 406 |
| | 533 |
| | 734 |
| | 932 |
|
| | | | | | | | | | |
| Other real estate owned and other repossessed assets (2) | 1,683 |
| | 1,913 |
| | 3,301 |
| | 4,117 |
| | 7,854 |
|
| Total non-performing assets (3) | $ | 5,010 |
| | $ | 3,636 |
| | $ | 5,745 |
| | $ | 7,859 |
| | $ | 14,977 |
|
| | | | | | | | | | |
| Troubled debt restructured loans on accrual status (4) | $ | 2,903 |
| | $ | 2,955 |
| | $ | 3,342 |
| | $ | 7,629 |
| | $ | 12,485 |
|
| | |
| | |
| | |
| | |
| | |
|
| Non-accrual and 90 days or more past due loans as a percentage of loans receivable, net (5) | 0.34 | % | | 0.18 | % | | 0.27 | % | | 0.45 | % | | 1.02 | % |
| | |
| | |
| | |
| | |
| | |
|
| Non-accrual and 90 days or more past due loans as a percentage of total assets | 0.24 | % | | 0.13 | % | | 0.20 | % | | 0.34 | % | | 0.76 | % |
| | | | | | | | | | |
| Non-performing assets as a percentage of total assets | 0.40 | % | | 0.36 | % | | 0.60 | % | | 0.88 | % | | 1.84 | % |
| | | | | | | | | | |
| Loans receivable, net (5) | $ | 896,352 |
| | $ | 734,921 |
| | $ | 699,917 |
| | $ | 672,972 |
| | $ | 614,201 |
|
| Total assets | $ | 1,247,132 |
| | $ | 1,018,290 |
| | $ | 952,024 |
| | $ | 891,388 |
| | $ | 815,815 |
|
_______________
(1)Includes non-accrual one- to four-family properties in the process of foreclosure totaling $150, $0,
$100, $138150, $0 and $1,105$100 as of September 30, 2021, 2020, 2019, 2018 2017, 2016 and 2015,2017, respectively.
(2)Includes foreclosed residential real estate property totaling $0, $0, $875, $1,071,$0, $0 and $2,868$875
as of September 30, 2021, 2020, 2019, 2018 2017, 2016 and 2015,2017, respectively.
(3)Does not include troubled debt restructured loans on accrual status.
(4)Does not include troubled debt restructured loans totaling $182, $203, $366, $323 $253, $531 and $1,233$253
recorded as non-accrual loans as of September 30, 2021, 2020, 2019, 2018 2017, 2016 and 2015,2017, respectively.
(5)Loans receivable, net for purposes of this table includes the deductions for the undisbursed portion of construction loans in process
and deferred loan origination fees and does not include the deduction for the allowance for loan losses.
The Bank’s non-accrual loans indecreased by $1.71 millionby $51,000 to $3.03$2.85 million at September 30, 20192021 from $1.32$2.91 million at September 30, 2018, 2020, primarily as a result of a $779,000 increase in commercial real estate loans, a $555,000 increase in commercial business loans, a $267,000 increase in consumer loans, and a $154,000 increase$252,000 decrease in one- to four-family mortgage loans, an $85,000 decrease in commercial mortgage loans, and a $31,000 decrease in consumer loans, on non-accrual status. These increasesdecreases were partially offset by a $39,000 decrease$289,000 increase in land loans and a $28,000 increase on commercial business loans on non-accrual status. A discussion of the Bank's largest non-performing loans is set forth below under “Asset Classification.”
Additional interest income which would have been recorded for the year ended September 30, 20192021 had non-accruing loans been current in accordance with their original terms totaled $362,000.$375,000.
Other Real Estate Owned and Other Repossessed Assets. Real estate acquired by the Bank as a result of foreclosure or by deed-in-lieu of foreclosure is classified as other real estate owned (“OREO”) until sold. When property is acquired, it is recorded at the estimated fair market value less estimated costs to sell. At September 30, 2019, the Bank had $1.68 million of OREO and other repossessed assets consisting of 12 individual properties, a decrease of $230,000 from $1.91 million at September 30, 2018. The OREO properties consisted of 11 land parcels totaling $1.66 million, and one commercial real estate property with a book value of $25,000. The largest OREO property at September 30, 2019 was an undeveloped land parcel with a balance of $874,000 located in Lewis County.
Restructured Loans. Under GAAP, the Bank is required to account for certain loan modifications or restructurings as “troubled debt restructurings” or "troubled debt restructured loans." A troubled debt restructured loan ("TDR") is a loan for which the Company, for reasons related to a borrower's financial difficulties, grants a concession to the borrower that the Company would not otherwise consider. Examples of such concessions include but are not limited to: a reduction in the stated interest rate; an extension of the maturity at an interest rate below current market rates; a reduction in the face amount of the debt; a reduction in the accrued interest; or re-amortizations, extensions, deferrals and renewals. TDRs are considered impaired and are individually evaluated for impairment. TDRs are classified as either accrual or non-accrual. TDRs are classified as non-performing loans unless they have been performing in accordance with their modified terms for a period of at least six months. The Bank had TDRs at September 30, 20192021 and 20182020 totaling $3.27$2.55 million and $3.28$3.07 million, respectively, of which $366,000$182,000 and $323,000,$203,000, respectively, were on non-accrual status. None of the allowance for loan losses was allocated to TDRs at September 30, 2021. The allowance for loan losses allocated to TDR loans at September 30, 20192020 was $3,000. As previously noted, in late March 2020, the Bank announced COVID-19 loan modification programs to support and 2018 was $56,000provide relief for its borrowers during the COVID-19 pandemic. The Company has followed the CARES Act and $97,000, respectively.interagency guidance from the federal banking agencies when determining if a borrower's modification is subject to TDR classification. See "COVID-19 Loan Modifications" below.
Impaired Loans. In accordance with GAAP, a loan is considered impaired when based on current information and events it is probable that a creditor will be unable to collect all amounts (principal and interest) when due according to the contractual terms of the loan agreement. Smaller balance homogeneous loans, such as residential mortgage loans and consumer loans, may be collectively evaluated for impairment. When a loan has been identified as being impaired, the amount of the impairment is measured by using discounted cash flows, except when, as an alternative, the current estimated fair value of the collateral, reduced by estimated costs to sell (if applicable), or observable market price is used. The valuation of real estate collateral is subjective in nature and may be adjusted in future periods because of changes in economic conditions. Management considers third-party appraisals, as well as independent fair market value assessments from realtors or persons involved in selling real estate, in determining the estimated fair value of particular properties. In addition, as certain of these third-party appraisals and independent fair market value assessments are only updated periodically, changes in the values of specific properties may have occurred subsequent to the most recent appraisals. Accordingly, the amounts of any such potential changes and any related adjustments are generally recorded at the time such information is received. When the measurement of the impaired loan is less than the recorded investment in the loan (including accrued interest and net deferred loan origination fees or costs), impairment is recognized by creating or adjusting an allocation of the allowance for loan losses and uncollected accrued interest is reversed against interest income. If ultimate collection of principal is in doubt, all cash receipts on impaired loans are applied to reduce the principal balance.
The categories of non-accrual loans and impaired loans overlap, although they are not identical. The Bank considers all circumstances regarding the loan and borrower on an individual basis when determining whether an impaired loan should be
placed on non-accrual status, such as the financial strength of the borrower, the collateral value, reasons for delay, payment record, the amount past due and the number of days past due. At September 30, 2019,2021, the Bank had $5.94$5.23 million in impaired loans. For additional information on impaired loans, see Note 5 of the Notes to the Consolidated Financial Statements included in Item 8 of this Annual Report on Form 10-K.
Other Loans of Concern. Loans not reflected in the table above as non-performing, but where known information about possible credit problems of borrowers causes management to have doubts as to the ability of the borrower to comply with present repayment terms and that may result in disclosure of such loans as non-performing assets in the future, are commonly referred to as “other loans of concern” or “potential problem loans.” The amount included in potential problem loans results from an evaluation, on a loan-by-loan basis, of loans classified as “substandard” and “special mention,” as those terms are defined under “Asset Classification” below. The amount of potential problem loans (not included in the table above as non-performing) was $4.83$5.76 million at September 30, 2019.2021. The vast majority of these loans are collateralized by real estate. See “Asset Classification” below for additional information regarding the Bank's problem loans.
COVID-19 Loan Modifications. The CARES Act provided guidance around the modification of loans as a result of the COVID-19 pandemic, which outlined, among other criteria, that short-term modifications made on a good faith basis to borrowers who were current as defined under the CARES Act prior to any relief, are not TDRs. This includes short-term modifications such as payment deferrals, fee waivers, extensions of repayment terms, or other delays in payment that are insignificant. Borrowers are considered current under the CARES Act and related regulatory guidance if they are less than 30 days past due on their contractual payments at the time a modification program is implemented. During the year ended September 30, 2020, the Company made COVID-19 pandemic related modifications on 212 loans aggregating to $136.36 million. The majority of these borrowers had resumed making payments as of September 30, 2021, and only one loan with a balance of $323,000 remained on deferral status as of that date. Loan modifications in accordance with the CARES Act and related regulatory guidance are still subject to an evaluation in regard to determining whether or not a loan is deemed to be impaired. "See Notes 1 and Note 5" of the Notes to the Consolidated Financial Statements included in Item 8 of this Annual Report on Form 10-K for additional information. The CAA 2021 extended relief offered under the CARES Act related to restructured loans as a result of COVID-19 through January 1, 2022 or 60 days after the end of the national emergency declared by the President, whichever is earlier.
During the year ended September 30, 2020, the Company made COVID-19 pandemic related modifications on 212 loans aggregating to $136.36 million. The majority of these borrowers had resumed making payments as of September 30, 2021 and only one loan with a balance of $323,000 remained on deferral status as of that date.Loan modifications in accordance with the CARES Act and related regulatory guidance are still subject to an evaluation in regard to determining whether or not a loan is deemed to be impaired.See Notes 1 and 5 of the Notes to the Consolidated Financial Statements included in Item 8 of this Annual Report on Form 10-K for additional information.
Asset Classification. Applicable regulations require that each insured institution review and classify its assets on a regular basis. In addition, in connection with examinations of insured institutions, regulatory examiners have authority to identify problem assets and, if appropriate, require them to be classified. There are three classifications for problem assets: substandard, doubtful and loss. Substandard loans are classified as those loans that are inadequately protected by the current net worth and paying capacity of the obligor, or of the collateral pledged. Assets classified as substandard have a well-defined weakness or weaknesses that jeopardize the repayment of the debt. If the weakness or weaknesses are not corrected, there is the distinct possibility that some loss will be sustained. Doubtful assets have the weaknesses of substandard assets with the additional characteristic that the weaknesses make collection or liquidation in full on the basis of currently existing facts, conditions and values questionable, and there is a high possibility of loss. An asset classified as loss is considered uncollectible and of such little value that continuance as an asset of the Bank is not warranted. When the Bank classifies problem assets as either substandard or doubtful, it is required to establish allowances for loan losses in an amount deemed prudent by management. These allowances represent loss allowances which have been established to recognize the inherent risk associated with lending activities and the risks associated with particular problem assets. When the Bank classifies problem assets as loss, it charges off the balance of the asset against the allowance for loan losses. Assets which do not currently expose the Bank to sufficient risk to warrant classification in one of the aforementioned categories but possess weaknesses are designated by the Bank as special mention. Special mention loans are defined as those credits deemed by management to have some potential weakness that deserve management’s close attention. If left uncorrected, these potential weaknesses may result in the deterioration of the payment prospects of the loan. Assets in this category are not adversely classified and currently do not expose the Bank to sufficient risk to warrant a substandard classification. The Bank’s determination of the classification of its assets and the amount of its valuation allowances is subject to review by the FDIC and the Division which can require a different classification and the establishment of additional loss allowances.
The aggregate amounts of the Bank’s classified and special mention loans (as determined by the Bank), and the allowance for loan losses at the dates indicated, were as follows:
| | | | At September 30, | | At September 30, |
| | 2019 | | 2018 | | 2017 | | 2021 | | 2020 | | 2019 |
| | (Dollars in thousands) | | (Dollars in thousands) |
| Loss | $ | — |
| | $ | — |
| | $ | — |
| Loss | $ | — | | | $ | — | | | $ | — | |
| Doubtful | — |
| | — |
| | — |
| Doubtful | — | | | — | | | — | |
| Substandard (1)(2) | 5,320 |
| | 3,182 |
| | 3,253 |
| Substandard (1)(2) | 3,604 | | | 3,649 | | | 5,320 | |
| Special mention (1) | 2,547 |
| | 3,123 |
| | 7,783 |
| Special mention (1) | 5,012 | | | 5,864 | | | 2,547 | |
Total classified and special mention loans | $ | 7,867 |
| | $ | 6,305 |
| | $ | 11,036 |
| Total classified and special mention loans | $ | 8,616 | | | $ | 9,513 | | | $ | 7,867 | |
| | | | | | | | | | | | |
| Allowance for loan losses | $ | 9,690 |
| | $ | 9,530 |
| | $ | 9,553 |
| Allowance for loan losses | $ | 13,469 | | | $ | 13,414 | | | $ | 9,690 | |
_____________
| |
(1) | For further information concerning the change in classified assets, see “Non-performing Loans and Delinquencies" above. |
| |
(2) | Includes non-performing loans. |
(1)For further information concerning the change in classified assets, see “Non-performing Loans and Delinquencies" above.
(2)Includes non-performing loans.
Loans classified as substandard increaseddecreased by $2.14 million$45,000 to $5.32 million atSeptember 30, 2019 from $3.18$3.60 million at September 30, 2018.2021 from $3.65 million at September 30, 2020. At September 30, 2019, 442021, 31 loans were classified as substandard.Of the $5.32$3.60 million in loans classified as substandard at September 30, 2019, $3.032021, $2.85 million were on non-accrual status. The largest loan classified as substandard at
September 30, 20192021 had a balance of $524,000$494,000 and was secured by a single family homecommercial real estate property in Pierce County.Grays Harbor County and equipment. This loan was performing according to its payment termson non-accrual status at September 30, 2019.2021. The next largest loan classified as substandard at September 30, 20192021 had a balance of $493,000 and was secured by a single family home in Pierce County. This loan was performing according to its payment terms at September 30, 2019.
Loans classified as special mention decreased by $576,000 to $2.55 million atSeptember 30, 2019 from $3.12 million at September 30, 2018, primarily as a result of loans being upgraded to an improved risk grade category and loans being paid off during the year ended September 30, 2019. At September 30, 2019, ten loans were classified as special mention. The largest loan classified as special mention at September 30, 2019 had a balance of $623,000$362,000 and was secured by land in Grays Harbor County. This loan was performing according to its payment termson non-accrual status at September 30, 2019.2021.
Loans classified as special mention decreased by $852,000 to $5.01 million at September 30, 2021 from $5.86 million at September 30, 2020. At September 30, 2021, seven loans were classified as special mention. The next largest loancredit relationship classified as special mention at September 30, 20192021 had a balance of $561,000$4.40 million and was secured by a one- to four-family propertyhotel in Pierce County. This loan wasClackamas County, Oregon. The two loans in this credit relationship were performing according to its paymenttheir repayment terms at September 30, 2019.2021.
Allowance for Loan Losses. The allowance for loan losses is maintained to absorb probable losses inherent in the loan portfolio. The Bank has established a comprehensive methodology for the determination of provisions for loan losses that takes into consideration the need for an overall general valuation allowance. The Bank’s methodology for assessing the adequacy of its allowance for loan losses is based on its historic loss experience for various loan segments; adjusted for changes in economic conditions, delinquency rates and other factors. Using these loss estimate factors, management develops a range of probable loss for each loan category. Certain individual loans for which full collectibility may not be assured are evaluated individually with loss exposure based on estimated discounted cash flows or net realizable collateral values. The total estimated range of loss based on these two components of the analysis is compared to the loan loss allowance balance. When determining the appropriate loss factors in fiscal 2021, management also took into consideration the impact of the COVID-19 pandemic on such factors as the national and state unemployment rates and related trends, the amount of and timing of financial assistance provided by the government, consumer spending levels and trends, industries significantly impacted by the COVID-19 pandemic, and the Bank's COVID-19 loan modification program.
Based on this review, management will adjustincreased the qualitative factors for all loan categories due to deterioration of economic conditions as a result of the COVID-19 pandemic. The increase in factors resulted in a modest increase in the allowance for loan losses during the current fiscal year. Management will continue to closely monitor economic conditions and will work with borrowers as necessary.necessary to assist them through this challenging economic climate. If economic conditions worsen or do not improve in the near-term, and if future government programs, if any, do not provide adequate relief to borrowers, it is possible that the Bank's allowance for loan losses will need to increase in future periods.
In originating loans, the Bank recognizes that losses will be experienced and that the risk of loss will vary with, among other things, the type of loan being made, the creditworthiness of the borrower over the term of the loan, general economic conditions and, in the case of a secured loan, the quality of the security for the loan. The Bank increases its allowance for loan losses by charging provisions for loan losses against the Bank's operating income.
The Board of Directors reviews the adequacy of the allowance for loan losses at least quarterly based on management's assessment of current economic conditions, past loss and collection experience, and risk characteristics of the loan portfolio.
At September 30, 2019, the Bank’s allowance for loan losses totaled $9.69 million. The Bank’s allowance for loan losses as a percentage of total loans receivable and non-performing loans was 1.08%1.37% and 319.49%471.93%, respectively, at September 30, 20192021 and 1.30%1.31% and 723.61%461.76%, respectively, at September 30, 2018.2020. The decrease in$40.92 million balance of SBA PPP loans was omitted from the allowance for loan lossesloss calculation at September 30, 2021 as these loans are fully guaranteed by the SBA and management expects that the great majority of PPP borrowers will seek full or partial forgiveness of their loan obligations from the SBA within a percentage of total loans receivable was primarily due to loans acquiredshort time frame, which will in turn reimburse the South Sound Acquisition and improvements in several underlying credit quality metrics inBank for the loan portfolio. amount forgiven.
In accordance with GAAP, loans acquired in the South Sound Acquisition were recorded at their estimated fair value, which resulted in a net discount to the loan's contractual amount, of which a portion reflects a discount for possible credit losses. Credit discounts are included in the determination of fair value and, as a result, no allowance for loans losses is recorded for acquired loans at the acquisition date. The discount recorded on acquired loans is not reflected in the allowance for loan losses or the related allowance coverage ratios,ratios; however we believe that it should be considered when comparing the current ratios to similar ratios in periods prior to the South Sound Acquisition. The remaining fair value discount on loans acquired in the South Sound Acquisition was $1.39 million$449,000 at September 30, 2019.2021.
ManagementBased on its comprehensive analysis, management believes that the amount maintained in the allowance for loan losses is adequate to absorb probable losses inherent in the portfolio. Although management believes that it uses the best information available to make its determinations, future adjustments to the allowance for loan losses may be necessary, and results of operations could be significantly and adversely affected if circumstances differ substantially from the assumptions used in making the determinations.
While the Bank believes that it has established its existing allowance for loan losses in accordance with GAAP, there can be no assurance that regulators, in reviewing the Bank's loan portfolio, will not request the Bank to increase significantly its allowance for loan losses. In addition, because future events affecting borrowers and collateral cannot be predicted with certainty, there can be no assurance that the existing allowance for loan losses is adequate or that substantial increases will not be necessary should the quality of any loans deterioratedeteriorate. A further decline in national and local economic conditions, as a result of the COVID-19 pandemic or other factors, discussed above. Anycould result in a material increase in the allowance for loan losses which may adversely affect the Bank'sCompany's financial condition and results of operations.
The following table sets forth an analysis of the Bank's allowance for loan losses for the periodsyears indicated: | | | | Year Ended September 30, | | Year Ended September 30, |
| | 2019 | | 2018 | | 2017 | | 2016 | | 2015 | | 2021 | | 2020 | | 2019 | | 2018 | | 2017 |
| | (Dollars in thousands) | | (Dollars in thousands) |
| Allowance at beginning of year | $ | 9,530 |
| | $ | 9,553 |
| | $ | 9,826 |
| | $ | 9,924 |
| | $ | 10,427 |
| Allowance at beginning of year | $ | 13,414 | | | $ | 9,690 | | | $ | 9,530 | | | $ | 9,553 | | | $ | 9,826 | |
| Recapture of loan losses | — |
| | — |
| | (1,250 | ) | | — |
| | (1,525 | ) | |
| Provision for (recapture of) loan losses | | Provision for (recapture of) loan losses | — | | | 3,700 | | | — | | | — | | | (1,250) | |
| | | | | | | | | | | | |
Recoveries: | |
| | |
| | |
| | |
| | |
| Recoveries: | | | | | | | | | |
| Mortgage loans: | |
| | |
| | |
| | |
| | |
| Mortgage loans: | | | | | | | | | |
| One- to four-family | 104 |
| | — |
| | 21 |
| | 56 |
| | 264 |
| One- to four-family | — | | | 2 | | | 104 | | | — | | | 21 | |
| Multi-family | — |
| | — |
| | — |
| | — |
| | 3 |
| |
| | Commercial | 166 |
| | — |
| | 1,061 |
| | — |
| | 4 |
| Commercial | — | | | 6 | | | 166 | | | — | | | 1,061 | |
| Construction - custom and owner/builder | 2 |
| | — |
| | — |
| | — |
| | — |
| Construction - custom and owner/builder | — | | | 5 | | | 2 | | | — | | | — | |
| Construction - speculative one- to four-family | — |
| | 13 |
| | 6 |
| | 2 |
| | 2 |
| Construction - speculative one- to four-family | — | | | — | | | — | | | 13 | | | 6 | |
| | Construction - multi-family | — |
| | — |
| | — |
| | 181 |
| | 1,125 |
| Construction - multi-family | — | | | — | | | — | | | — | | | — | |
| Construction - land development | — |
| | — |
| | — |
| | — |
| | — |
| |
| | Land | 18 |
| | 19 |
| | 19 |
| | 24 |
| | 37 |
| Land | 45 | | | 20 | | | 18 | | | 19 | | | 19 | |
| Consumer loans: | |
| | |
| | |
| | |
| | |
| Consumer loans: | | | | | | | | | |
| Home equity and second mortgage | — |
| | — |
| | — |
| | — |
| | 2 |
| Home equity and second mortgage | — | | | 15 | | | — | | | — | | | — | |
| Other | 6 |
| | 1 |
| | 3 |
| | 2 |
| | 4 |
| Other | 4 | | | 3 | | | 6 | | | 1 | | | 3 | |
| Commercial business loans | 25 |
| | — |
| | — |
| | 5 |
| | 5 |
| Commercial business loans | 9 | | | — | | | 25 | | | — | | | — | |
| Total recoveries | 321 |
| | 33 |
| | 1,110 |
| | 270 |
| | 1,446 |
| Total recoveries | 58 | | | 51 | | | 321 | | | 33 | | | 1,110 | |
| | | | | | | | | | | |
Charge-offs: | |
| | |
| | |
| | |
| | |
| Charge-offs: | | | | | | | | | |
| Mortgage loans: | |
| | |
| | |
| | |
| | |
| Mortgage loans: | | | | | | | | | |
| One- to four-family | — |
| | — |
| | — |
| | (72 | ) | | (220 | ) | |
| | Commercial | — |
| | (28 | ) | | (13 | ) | | (209 | ) | | — |
| Commercial | — | | | — | | | — | | | (28) | | | (13) | |
| | Land | (49 | ) | | (22 | ) | | (110 | ) | | (61 | ) | | (145 | ) | Land | — | | | — | | | (49) | | | (22) | | | (110) | |
| Consumer loans: | |
| | |
| | |
| | |
| | |
| Consumer loans: | | | | | | | | | |
| Home equity and second mortgage | (5 | ) | | — |
| | — |
| | (18 | ) | | (50 | ) | Home equity and second mortgage | — | | | — | | | (5) | | | — | | | — | |
| Other | (5 | ) | | (6 | ) | | (10 | ) | | (8 | ) | | (9 | ) | Other | (1) | | | (12) | | | (5) | | | (6) | | | (10) | |
| Commercial business loans | (102 | ) | | — |
| | — |
| | — |
| | — |
| Commercial business loans | (2) | | | (15) | | | (102) | | | — | | | — | |
| Total charge-offs | (161 | ) | | (56 | ) | | (133 | ) | | (368 | ) | | (424 | ) | Total charge-offs | (3) | | | (27) | | | (161) | | | (56) | | | (133) | |
| Net recoveries (charge-offs) | 160 |
| | (23 | ) | | 977 |
| | (98 | ) | | 1,022 |
| Net recoveries (charge-offs) | 55 | | | 24 | | | 160 | | | (23) | | | 977 | |
| | | | | | | | | | | |
| Allowance at end of year | $ | 9,690 |
| | $ | 9,530 |
| | $ | 9,553 |
| | $ | 9,826 |
| | $ | 9,924 |
| Allowance at end of year | $ | 13,469 | | | $ | 13,414 | | | $ | 9,690 | | | $ | 9,530 | | | $ | 9,553 | |
| | | | | | | | | | | | | | | | | | | | |
| Allowance for loan losses as a percentage of total loans receivable (net) outstanding at the end of the year (1) | 1.08 | % | | 1.30 | % | | 1.36 | % | | 1.46 | % | | 1.62 | % | Allowance for loan losses as a percentage of total loans receivable (net) outstanding at the end of the year (1) | 1.37 | % | | 1.31 | % | | 1.08 | % | | 1.30 | % | | 1.36 | % |
| | |
| | | | |
| | | | | | | | | |
| Net recoveries (charge-offs) as a percentage of average loans outstanding during the year | 0.02 | % | | — | % | | 0.14 | % | | (0.02 | )% | | 0.17 | % | Net recoveries (charge-offs) as a percentage of average loans outstanding during the year | 0.01 | % | | 0.00 | % | | 0.02 | % | | 0.00 | % | | 0.14 | % |
| | |
| | |
| | |
| | |
| | |
| | | | | | | | | | |
| Allowance for loan losses as a percentage of non-performing loans at end of year | 319.49 | % | | 723.61 | % | | 499.90 | % | | 326.66 | % | | 160.30 | % | Allowance for loan losses as a percentage of non-performing loans at end of year | 471.93 | % | | 461.76 | % | | 319.49 | % | | 723.61 | % | | 499.90 | % |
______________
| |
(1) | Loans receivable, net for this table includes the deductions for the undisbursed portion of construction loans in process and net deferred loan origination fees and does not include the deduction for the allowance for loan losses. |
(1)Loans receivable, net for this table includes the deductions for the undisbursed portion of construction loans in process and net deferred loan origination fees and does not include the deduction for the allowance for loan losses.
The following table sets forth the allocation of the allowance for loan losses by loan category at the dates indicated:
| | | | | | | | | | | | | | | | | | | | | | | | | | | | | | | | | | | | | | | | | | | | | | | | | | | | | | | | | | | |
| | At September 30, |
| | 2021 | | 2020 | | 2019 | | 2018 | | 2017 |
| Amount | | Percent
of Loans
in Category
to Total
Loans | | Amount | | Percent
of Loans
in Category
to Total
Loans | | Amount | | Percent
of Loans
in Category
to Total
Loans | | Amount | | Percent
of Loans
in Category
to Total
Loans | | Amount | | Percent
of Loans
in Category
to Total
Loans |
| | (Dollars in thousands) |
| Mortgage loans: | | | | | | | | | | | | | | | | | | | |
| One- to four-family | $ | 1,154 | | | 11.08 | % | | $ | 1,163 | | | 10.46 | % | | $ | 1,167 | | | 13.38 | % | | $ | 1,086 | | | 14.13 | % | | $ | 1,082 | | | 15.05 | % |
| Multi-family | 765 | | | 8.09 | | | 718 | | | 7.50 | | | 481 | | | 7.67 | | | 433 | | | 7.54 | | | 447 | | | 7.47 | |
| Commercial | 6,813 | | | 43.49 | | | 7,144 | | | 39.99 | | | 4,154 | | | 42.28 | | | 4,248 | | | 42.05 | | | 4,184 | | | 41.91 | |
| Construction - custom and owner/builder | 644 | | | 10.08 | | | 832 | | | 11.42 | | | 755 | | | 13.00 | | | 671 | | | 14.57 | | | 699 | | | 14.99 | |
| Construction - speculative one- to four-family | 188 | | | 1.65 | | | 158 | | | 1.29 | | | 212 | | | 1.66 | | | 178 | | | 1.88 | | | 128 | | | 1.26 | |
| Construction - commercial | 784 | | | 4.01 | | | 420 | | | 2.92 | | | 338 | | | 3.99 | | | 563 | | | 4.82 | | | 303 | | | 2.50 | |
| Construction - multi-family | 436 | | | 4.81 | | | 238 | | | 3.04 | | | 375 | | | 3.66 | | | 135 | | | 1.31 | | | 173 | | | 2.72 | |
| Construction - land development | 124 | | | 1.00 | | | 133 | | | 0.68 | | | 67 | | | 0.24 | | | 49 | | | 0.37 | | | — | | | — | |
| Land | 470 | | | 1.84 | | | 572 | | | 2.25 | | | 697 | | | 3.10 | | | 844 | | | 3.11 | | | 918 | | | 3.05 | |
| Non-mortgage loans: | | | | | | | | | | | | | | | | | | | |
| Consumer loans | 578 | | | 3.28 | | | 664 | | | 3.14 | | | 722 | | | 4.49 | | | 766 | | | 4.98 | | | 1,104 | | | 5.39 | |
| Commercial business loans | 1,513 | | | 10.67 | | | 1,372 | | | 17.31 | | | 722 | | | 6.53 | | | 557 | | | 5.24 | | | 515 | | | 5.66 | |
| Total allowance for loan losses | $ | 13,469 | | | 100.00 | % | | $ | 13,414 | | | 100.00 | % | | $ | 9,690 | | | 100.00 | % | | $ | 9,530 | | | 100.00 | % | | $ | 9,553 | | | 100.00 | % |
|
| | | | | | | | | | | | | | | | | | | | | | | | | | | | | | | | | | |
| | At September 30, |
| | 2019 | | 2018 | | 2017 | | 2016 | | 2015 |
| | Amount | | Percent of Loans in Category to Total Loans | | Amount | | Percent of Loans in Category to Total Loans | | Amount | | Percent of Loans in Category to Total Loans | | Amount | | Percent of Loans in Category to Total Loans | | Amount | | Percent of Loans in Category to Total Loans |
| | (Dollars in thousands) |
| Mortgage loans: | | | | | | | | | | | | | | | | | | | |
| One- to four-family | $ | 1,167 |
| | 13.38 | % | | $ | 1,086 |
| | 14.13 | % | | $ | 1,082 |
| | 15.05 | % | | $ | 1,239 |
| | 16.38 | % | | $ | 1,480 |
| | 17.42 | % |
| Multi-family | 481 |
| | 7.67 |
| | 433 |
| | 7.54 |
| | 447 |
| | 7.47 |
| | 473 |
| | 8.61 |
| | 392 |
| | 7.81 |
|
| Commercial | 4,154 |
| | 42.28 |
| | 4,248 |
| | 42.05 |
| | 4,184 |
| | 41.91 |
| | 4,384 |
| | 43.18 |
| | 4,065 |
| | 43.47 |
|
| Construction - custom and owner/builder | 755 |
| | 13.00 |
| | 671 |
| | 14.57 |
| | 699 |
| | 14.99 |
| | 619 |
| | 12.85 |
| | 451 |
| | 9.40 |
|
| Construction - speculative one- to four-family | 212 |
| | 1.66 |
| | 178 |
| | 1.88 |
| | 128 |
| | 1.26 |
| | 130 |
| | 1.12 |
| | 123 |
| | 1.00 |
|
| Construction - commercial | 338 |
| | 3.99 |
| | 563 |
| | 4.82 |
| | 303 |
| | 2.50 |
| | 268 |
| | 1.29 |
| | 426 |
| | 3.09 |
|
| Construction - multi-family | 375 |
| | 3.66 |
| | 135 |
| | 1.31 |
| | 173 |
| | 2.72 |
| | 316 |
| | 1.74 |
| | 283 |
| | 3.07 |
|
| Construction - land development | 67 |
| | 0.24 |
| | 49 |
| | 0.37 |
| | — |
| | — |
| | — |
| | — |
| | — |
| | — |
|
| Land | 697 |
| | 3.10 |
| | 844 |
| | 3.11 |
| | 918 |
| | 3.05 |
| | 820 |
| | 2.99 |
| | 1,021 |
| | 3.90 |
|
| Non-mortgage loans: | | | |
| | |
| | | | |
| | |
| | | | |
| | |
| | |
|
| Consumer loans | 722 |
| | 4.49 |
| | 766 |
| | 4.98 |
| | 1,104 |
| | 5.39 |
| | 1,095 |
| | 6.06 |
| | 1,260 |
| | 5.80 |
|
| Commercial business loans | 722 |
| | 6.53 |
| | 557 |
| | 5.24 |
| | 515 |
| | 5.66 |
| | 482 |
| | 5.78 |
| | 423 |
| | 5.04 |
|
| Total allowance for loan losses | $ | 9,690 |
| | 100.00 | % | | $ | 9,530 |
| | 100.00 | % | | $ | 9,553 |
| | 100.00 | % | | $ | 9,826 |
| | 100.00 | % | | $ | 9,924 |
| | 100.00 | % |
Investment Activities
The investment policies of the Bank are established and monitored by the Board of Directors. The policies are designed primarily to provide and maintain liquidity, to generate a favorable return on investments without incurring undue interest rate and credit risk, and to compliment the Bank’s lending activities. These policies dictate the criteria for classifying investments in debt securities as either available for sale or held to maturity. The policies permit investment in various types of liquid assets permissible under applicable regulations, which include U.S. Treasury obligations, securities of various federal agencies, certificates of deposit of insured banks, federal funds, mortgage-backed securities, municipal bonds and mutual funds. The Company's investment policy also permits investment in equity securities in certain financial service companies.
Investments in equity securities are stated at fair value. Prior to October 1, 2018, changes in the fair value of investments in equity securities were excluded from earnings and reported in other comprehensive income (loss), net of income tax effects. On October 1, 2018, the Company adopted ASU 2016-01 and reclassified its mutual funds as investments in equity securities. Beginning October 1, 2018, changes in the fair value of investments in equity securities are recorded in other non-interest income.
At September 30, 2019,2021, the Bank’s investment portfolio was comprised of investments in debt securities that totaled $53.63$132.28 million, consisting of $3.00$28.76 million of U.S. Treasury and U.S. government agency securities, held to maturity, $28.10$39.84 million of mortgage-backed securities held to maturity, $500,000 of bank issued trust preferred securities held to maturity and $22.53$63.18 million of mortgage-backed securities available for sale. The Bank does not maintain a trading account for any investments. This compares with a total investment portfolio of $13.96$85.80 million at September 30, 2018,2020, consisting of $10.97 million of U.S. Treasury and U.S. government agency securities held to maturity, $1.85$27.39 million of mortgage-backed securities held to maturity, $917,000$500,000 of mutual funds available for salebank issued trust preferred securities held to maturity and $237,000$57.91 million of mortgage-backed securities available for sale. The composition of the portfolios by type of security at the dates indicated is presented in the following table:
| | | | | | | | | | | | | | | | | | | | | | | | | | | | | | | | | | | |
| | At September 30, |
| | 2021 | | 2020 | | 2019 |
| Recorded
Amount | | Percent of
Total | | Recorded
Amount | | Percent of
Total | | Recorded
Amount | | Percent of
Total |
| | (Dollars in thousands) |
| Held to Maturity: | | | | | | | | | | | |
| U.S.Treasury and U.S. government agency securities | $ | 28,760 | | | 21.74 | % | | $ | — | | | — | % | | $ | 2,999 | | | 5.59 | % |
| Mortgage-backed securities | 39,842 | | | 30.12 | | | 27,390 | | | 31.93 | | | 28,103 | | | 52.40 | |
| Bank issued trust preferred securities | 500 | | | 0.38 | | | 500 | | | 0.58 | | | — | | | — | |
| | | | | | | | | | | |
| Available for Sale: | | | | | | | | | | | |
| Mortgage-backed securities | 63,176 | | | 47.76 | | | 57,907 | | | 67.49 | | | 22,532 | | | 42.01 | |
| | | | | | | | | | | |
| Total portfolio | $ | 132,278 | | | 100.00 | % | | $ | 85,797 | | | 100.00 | % | | $ | 53,634 | | | 100.00 | % |
|
| | | | | | | | | | | | | | | | | | | | |
| | At September 30, |
| | 2019 | | 2018 | | 2017 |
| | Recorded Amount | | Percent of Total | | Recorded Amount | | Percent of Total | | Recorded Amount | | Percent of Total |
| | (Dollars in thousands) |
| Held to Maturity: | | | | | | | | | | | |
| | | | | | | | | | | | |
| U.S.Treasury and U.S. government agency securities | $ | 2,999 |
| | 5.59 | % | | $ | 10,965 |
| | 78.52 | % | | $ | 6,008 |
| | 71.69 | % |
| Mortgage-backed securities | 28,103 |
| | 52.40 |
| | 1,845 |
| | 13.21 |
| | 1,131 |
| | 13.50 |
|
| | | | | | | | | | | | |
| Available for Sale: | |
| | |
| | |
| | |
| | |
| | |
|
| | | | | | | | | | | | |
| Mortgage-backed securities | 22,532 |
| | 42.01 |
| | 237 |
| | 1.70 |
| | 289 |
| | 3.45 |
|
| Mutual funds | — |
| | — |
| | 917 |
| | 6.57 |
| | 952 |
| | 11.36 |
|
| | | | | | | | | | | | |
| Total portfolio | $ | 53,634 |
| | 100.0 | % | | $ | 13,964 |
| | 100.0 | % | | $ | 8,380 |
| | 100.0 | % |
The following table sets forth the maturities and weighted average yields of the debt securities in the Bank's portfolio at September 30, 2019.2021.
| | | | | | | | | | | | | | | | | | | | | | | | | | | | | | | | | | | | | | | | | | | | | | | |
| One Year or Less | | After One to
Five Years | | After Five to
Ten Years | | After Ten
Years |
| | Amount | | Yield | | Amount | | Yield | | Amount | | Yield | | Amount | | Yield |
| | (Dollars in thousands) |
| Held to Maturity: | | | | | | | | | | | | | | | |
| U.S. Treasury and U.S. government agency securities | $ | — | | | — | % | | $ | 6,111 | | | 0.48 | % | | $ | 22,649 | | | 1.13 | % | | $ | — | | | — | % |
| Mortgage-backed securities | — | | | — | | | 6,094 | | | 3.72 | | | 9,871 | | | 2.15 | | | 23,877 | | | 1.86 | |
| Bank issued trust preferred securities | — | | | — | | | — | | | — | | | 500 | | | 4.75 | | | — | | | — | |
| | | | | | | | | | | | | | | |
| Available for Sale: | | | | | | | | | | | | | | | |
| Mortgage-backed securities | 933 | | | 0.49 | | | 4,424 | | | 0.46 | | | 15,306 | | | 0.51 | | | 42,513 | | | 0.50 | |
| | | | | | | | | | | | | | | |
| Total portfolio | $ | 933 | | | 0.49 | % | | $ | 16,629 | | | 1.66 | % | | $ | 48,326 | | | 1.18 | % | | $ | 66,390 | | | 0.99 | % |
|
| | | | | | | | | | | | | | | | | | | | | | | | | | | |
| | One Year or Less | | After One to Five Years | | After Five to Ten Years | | After Ten Years |
| | Amount | | Yield | | Amount | | Yield | | Amount | | Yield | | Amount | | Yield |
| | (Dollars in thousands) |
| Held to Maturity: | | | | | | | | | | | | | | | |
| | | | | | | | | | | | | | | | |
| U.S. Treasury and U.S. government agency securities | $ | 2,999 |
| | 1.46 | % | | $ | — |
| | — | % | | $ | — |
| | — | % | | $ | — |
| | — | % |
| Mortgage-backed securities | 26 |
| | 3.38 |
| | 495 |
| | 3.13 |
| | 5,893 |
| | 3.23 |
| | 21,689 |
| | 3.75 |
|
| | | | | | | | | | | | | | | | |
| Available for Sale: | |
| | |
| | |
| | |
| | |
| | |
| | |
| | |
|
| | | | | | | | | | | | | | | | |
| Mortgage-backed securities | — |
| | — |
| | 145 |
| | 4.59 |
| | 130 |
| | 2.90 |
| | 22,257 |
| | 2.53 |
|
| | | | | | | | | | | | | | | | |
| Total portfolio | $ | 3,025 |
| | 1.48 | % | | $ | 640 |
| | 3.46 | % | | $ | 6,023 |
| | 3.22 | % | | $ | 43,946 |
| | 2.53 | % |
There were no securities which had an aggregate book value in excess of 10% of the Bank’s total equity at September 30, 2019.2021. At September 30, 2019,2021, the Bank had $317,000$13.93 million of private label mortgage-backed securities in the held to maturity investment securities portfolio, of which $294,000$159,000 were on non-accrual status. For additional information
regarding investment securities, see “Item 1A. Risk Factors – Our investment securities portfolio may be negatively impacted by fluctuations in market value and interest rates and result in losses” and Note 4 of the Notes to the Consolidated Financial Statements included in Item 8 of this Annual Report on Form 10-K.
Deposit Activities and Other Sources of Funds
General. Deposits and loan repayments are the major sources of the Bank's funds for lending and other investment purposes. Scheduled loan repayments are a relatively stable source of funds, while deposit inflows and outflows and loan prepayments are influenced significantly by general interest rates and money market conditions. Borrowings through the FHLB and the Federal Reserve Bank of San Francisco ("FRB") may be used to compensate for reductions in the availability of funds from other sources.
Deposit Accounts. Substantially all of the Bank's depositors are residents of Washington. Deposits are attracted from within the Bank's market area through the offering of a broad selection of deposit instruments, including money market deposit accounts, checking accounts, regular savings accounts and certificates of deposit. Deposit account terms vary, according to the minimum balance required, the time periods the funds must remain on deposit and the interest rate, among other factors. In determining the terms of its deposit accounts, the Bank considers current market interest rates, profitability to the Bank, matching deposit and loan products and its customer preferences and concerns. The Bank actively seeks consumer and commercial checking accounts through checking account acquisition marketing programs. The Bank also has checking accounts owned by businesses associated with the marijuana (or Initiative-502) industry in Washington State. It is generally permissible in Washington State to handle accounts associated with this industry in compliance with federal regulatory guidelines. At September 30, 2019,2021, the Bank had $31.43$32.90 million, or 2.9%2.10% of total deposits, from businesses associated with the marijuana industry. See "Risk Factors-"Item 1A. Risk Factors - We operate in a highly regulated environment and may be adversely affected by changes in federal and state laws and regulations that could increase our costs of operations."
At September 30, 2019,2021, the Bank had $29.21$21.78 million of jumbo certificates of deposit of $250,000 or more. The Bank had brokered certificates of deposit totaling $3.20 million, brokered non-interest bearing demand accounts totaling $7.74 million, and $8.39$11.38 million in brokered reciprocal money market deposits at September 30, 2019.2021. The Bank believes that its jumbo certificates of deposit, which represented 2.7%1.4% of total deposits at September 30, 2019,2021, present similar interest rate risks as compared to its other deposits.
The following table sets forth information concerning the Bank's deposits at September 30, 2019:2021:
| | | Category | | Amount | | Percentage
of Total Deposits | Category | | Amount | | Percentage
of Total
Deposits |
| | (Dollars in thousands) | | (Dollars in thousands) |
| Non-interest bearing demand | | $ | 296,472 |
| | 27.75 | % | Non-interest bearing demand | | $ | 535,212 | | | 34.08 | % |
| Negotiable order of withdrawal (“NOW”) checking | | 297,055 |
| | 27.81 |
| Negotiable order of withdrawal (“NOW”) checking | | 430,097 | | | 27.39 | |
| Savings | | 164,506 |
| | 15.40 |
| Savings | | 260,689 | | | 16.60 | |
| Money market | | 144,539 |
| | 13.53 |
| Money market | | 210,428 | | | 13.40 | |
| Subtotal | | 902,572 |
| | 84.49 |
| Subtotal | | 1,436,426 | | | 91.47 | |
| | | | | | |
| Certificates of Deposit (1) | | |
| | |
| Certificates of Deposit (1) | | | | |
| | | | | | | |
| Maturing within 1 year | | 92,266 |
| | 8.64 |
| Maturing within 1 year | | 81,422 | | | 5.18 | |
| Maturing after 1 year but within 2 years | | 38,724 |
| | 3.63 |
| Maturing after 1 year but within 2 years | | 26,441 | | | 1.68 | |
| Maturing after 2 years but within 5 years | | 34,665 |
| | 3.24 |
| Maturing after 2 years but within 5 years | | 26,266 | | | 1.67 | |
| Maturing after 5 years | | — |
| | — |
| |
| | Total certificates of deposit | | 165,655 |
| | 15.51 |
| Total certificates of deposit | | 134,129 | | | 8.53 | |
| Total deposits | | $ | 1,068,227 |
| | 100.00 | % | Total deposits | | $ | 1,570,555 | | | 100.00 | % |
______________________
| |
(1) | Based on remaining maturity of certificates. |
(1)Based on remaining maturity of certificates.
The following table indicates the amount of the Bank's jumbo certificates of deposit by time remaining until maturity as of September 30, 2019.2021. Jumbo certificates of deposit have principal balances of $250,000 or more, and the rates paid on these accounts are generally negotiable.
| | | | | | | | |
| Maturity Period | | Amount |
| | (Dollars in thousands) |
| | |
| Three months or less | | $ | 3,364 | |
| Over three through six months | | 3,612 | |
| Over six through twelve months | | 6,314 | |
| Over twelve months | | 8,491 | |
| Total | | $ | 21,781 | |
|
| | | | |
| Maturity Period | | Amount |
| | | (Dollars in thousands) |
| Three months or less | | $ | 5,912 |
|
| Over three through six months | | 5,754 |
|
| Over six through twelve months | | 6,133 |
|
| Over twelve months | | 11,412 |
|
| Total | | $ | 29,211 |
|
Deposit Flow. The following table sets forth the balances of deposits in the various types of accounts offered by the Bank at the dates indicated:
| | | | | | | | | | | | | | | | | | | | | | | | | | | | | | | | | | | | | | | | | | | | | | | |
| | At September 30, |
| | 2021 | | 2020 | | 2019 |
| Amount | | Percent
of
Total | | Increase
(Decrease) | | Amount | | Percent
of
Total | | Increase
(Decrease) | | Amount | | Percent
of
Total |
| | (Dollars in thousands) |
| Non-interest-bearing demand | $ | 535,212 | | | 34.08 | % | | $ | 93,323 | | | $ | 441,889 | | | 32.53 | % | | $ | 145,417 | | | $ | 296,472 | | | 27.75 | % |
| NOW checking | 430,097 | | | 27.39 | | | 53,198 | | | 376,899 | | | 27.75 | | | 79,844 | | | 297,055 | | | 27.81 | |
| Savings | 260,689 | | | 16.60 | | | 40,820 | | | 219,869 | | | 16.18 | | | 55,363 | | | 164,506 | | | 15.40 | |
| Money market | 210,428 | | | 13.40 | | | 49,203 | | | 161,225 | | | 11.87 | | | 16,686 | | | 144,539 | | | 13.53 | |
| Certificates of deposit which mature: | | | | | | | | | | | | | | | |
| Within 1 year | 81,422 | | | 5.18 | | | (21,440) | | | 102,862 | | | 7.57 | | | 10,596 | | | 92,266 | | | 8.64 | |
| After 1 year, but within 2 years | 26,441 | | | 1.68 | | | (2,914) | | | 29,355 | | | 2.16 | | | (9,369) | | | 38,724 | | | 3.63 | |
| After 2 years, but within 5 years | 26,266 | | | 1.67 | | | (41) | | | 26,307 | | | 1.94 | | | (8,358) | | | 34,665 | | | 3.24 | |
| | | | | | | | | | | | | | | |
| | | | | | | | | | | | | | | |
| Total | $ | 1,570,555 | | | 100.00 | % | | $ | 212,149 | | | $ | 1,358,406 | | | 100.00 | % | | $ | 290,179 | | | $ | 1,068,227 | | | 100.00 | % |
|
| | | | | | | | | | | | | | | | | | | | | | | | | | | | |
| | At September 30, |
| | 2019 | | 2018 | | 2017 |
| | Amount | | Percent of Total | | Increase (Decrease) | | Amount | | Percent of Total | | Increase (Decrease) | | Amount | | Percent of Total |
| | (Dollars in thousands) |
| Non-interest-bearing demand | $ | 296,472 |
| | 27.75 | % | | $ | 63,214 |
| | $ | 233,258 |
| | 26.22 | % | | $ | 27,306 |
| | $ | 205,952 |
| | 24.58 | % |
| NOW checking | 297,055 |
| | 27.81 |
| | 71,765 |
| | 225,290 |
| | 25.33 |
| | 4,975 |
| | 220,315 |
| | 26.29 |
|
| Savings | 164,506 |
| | 15.40 |
| | 13,102 |
| | 151,404 |
| | 17.02 |
| | 10,417 |
| | 140,987 |
| | 16.83 |
|
| Money market | 144,539 |
| | 13.53 |
| | 6,793 |
| | 137,746 |
| | 15.49 |
| | 6,744 |
| | 131,002 |
| | 15.64 |
|
| Certificates of deposit which mature: | |
| | |
| | |
| | |
| | |
| | |
| | |
| | |
|
| Within 1 year | 92,266 |
| | 8.64 |
| | 16,109 |
| | 76,157 |
| | 8.56 |
| | 717 |
| | 75,440 |
| | 9.00 |
|
| After 1 year, but within 2 years | 38,724 |
| | 3.63 |
| | 6,720 |
| | 32,004 |
| | 3.60 |
| | 4,234 |
| | 27,770 |
| | 3.31 |
|
| After 2 years, but within 5 years | 34,665 |
| | 3.24 |
| | 1,018 |
| | 33,647 |
| | 3.78 |
| | (2,640 | ) | | 36,287 |
| | 4.33 |
|
| Certificates maturing thereafter | — |
| | — |
| | — |
| | — |
| | — |
| | (145 | ) | | 145 |
| | 0.02 |
|
| Total | $ | 1,068,227 |
| | 100.0 | % | | $ | 178,721 |
| | $ | 889,506 |
| | 100.0 | % | | $ | 51,608 |
| | $ | 837,898 |
| | 100.00 | % |
Certificates of Deposit by Rates. The following table sets forth the certificates of deposit in the Bank classified by rates as of the dates indicated:
| | | | At September 30, | | At September 30, |
| | 2019 | | 2018 | | 2017 | | 2021 | | 2020 | | 2019 |
| | (Dollars in thousands) | | (Dollars in thousands) |
| 0.00 - 1.99% | $ | 82,953 |
| | $ | 108,527 |
| | $ | 133,050 |
| 0.00 - 1.99% | $ | 108,191 | | | $ | 99,150 | | | $ | 82,953 | |
| 2.00 - 3.99% | 78,274 |
| | 33,016 |
| | 6,332 |
| 2.00 - 3.99% | 25,678 | | | 59,114 | | | 78,274 | |
| 4.00 - 5.99% | 4,428 |
| | 265 |
| | 260 |
| 4.00 - 5.99% | 260 | | | 260 | | | 4,428 | |
| Total | $ | 165,655 |
| | $ | 141,808 |
| | $ | 139,642 |
| Total | $ | 134,129 | | | $ | 158,524 | | | $ | 165,655 | |
Certificates of Deposit by Maturities. The following table sets forth the amount and maturities of certificates of deposit by rate at September 30, 2019:2021:
| | | | | | | | | | | | | | | | | | | | | | | | | | | | | |
| | Amount Due |
| Less Than
One Year | | One to
Two
Years | | After
Two to
Five
Years | | After
Five Years | | Total |
| | (Dollars in thousands) |
| 0.00 - 1.99% | $ | 71,203 | | | $ | 22,202 | | | $ | 14,786 | | | $ | — | | | $ | 108,191 | |
| 2.00 - 3.99% | 10,219 | | | 4,136 | | | 11,323 | | | — | | | 25,678 | |
| 4.00 - 5.99% | — | | | 103 | | | 157 | | | — | | | 260 | |
| Total | $ | 81,422 | | | $ | 26,441 | | | $ | 26,266 | | | $ | — | | | $ | 134,129 | |
|
| | | | | | | | | | | | | | | | | | | |
| | Amount Due |
| | Less Than One Year | | One to Two Years | | After Two to Five Years | | After Five Years | | Total |
| | (Dollars in thousands) |
| 0.00 - 1.99% | $ | 55,732 |
| | $ | 14,454 |
| | $ | 12,767 |
| | $ | — |
| | $ | 82,953 |
|
| 2.00 - 3.99% | 36,325 |
| | 23,252 |
| | 18,697 |
| | — |
| | 78,274 |
|
| 4.00 - 5.99% | 209 |
| | 1,018 |
| | 3,201 |
| | — |
| | 4,428 |
|
| Total | $ | 92,266 |
| | $ | 38,724 |
| | $ | 34,665 |
| | $ | — |
| | $ | 165,655 |
|
Deposit Activities. The following table sets forth the deposit activities of the Bank for the periodsyears indicated:
| | | | | | | | | | | | | | | | | |
| | Year Ended September 30, |
| | 2021 | | 2020 | | 2019 |
| | (Dollars in thousands) |
| Beginning balance | $ | 1,358,406 | | | $ | 1,068,227 | | | $ | 889,506 | |
| Deposits acquired in South Sound Acquisition | — | | | — | | | 151,538 | |
| Net deposits before interest credited | 209,136 | | | 285,544 | | | 22,618 | |
| Interest credited | 3,013 | | | 4,635 | | | 4,565 | |
| Net increase in deposits | 212,149 | | | 290,179 | | | 178,721 | |
| Ending balance | $ | 1,570,555 | | | $ | 1,358,406 | | | $ | 1,068,227 | |
|
| | | | | | | | | | | |
| | Year Ended September 30, |
| | 2019 | | 2018 | | 2017 |
| | (Dollars in thousands) |
| Beginning balance | $ | 889,506 |
| | $ | 837,898 |
| | $ | 761,534 |
|
| Deposits acquired in South Sound Acquisition | 151,538 |
| | — |
| | — |
|
| Net deposits before interest credited | 22,618 |
| | 48,830 |
| | 74,146 |
|
| Interest credited | 4,565 |
| | 2,778 |
| | 2,218 |
|
| Net increase in deposits | 178,721 |
| | 51,608 |
| | 76,364 |
|
| Ending balance | $ | 1,068,227 |
| | $ | 889,506 |
| | $ | 837,898 |
|
Borrowings. Deposits and loan repayments are generally the primary source of funds for the Bank's lending and investment activities and for general business purposes. The Bank has the ability to use borrowings from the FHLB to supplement its supply of lendable funds and to meet deposit withdrawal requirements. The FHLB functions as a central reserve bank providing credit for member financial institutions. As a member of the FHLB, the Bank is required to own capital stock in the FHLB and is authorized to apply for borrowings on the security of such stock and certain mortgage loans and other assets (principally securities which are obligations of, or guaranteed by, the U.S. government) provided certain creditworthiness standards have been met. Borrowings are made pursuant to several different credit programs. Each credit program has its own interest rate and range of maturities. Depending on the program, limitations on the amount of borrowings are based on the financial condition of the member institution and the adequacy of collateral pledged to secure the credit. At September 30, 2019,2021, the Bank maintained an uncommitted credit facility with the FHLB that provided for immediately available borrowings up to an aggregate amount to 45% of the Bank’s total assets, limited by available collateral. The Bank had no outstanding balance on this borrowing line at September 30, 2019. The Bank also has a Letter of Credit ("LOC") of up to $23.00collateral, under which $5.0 million with the FHLB for the purpose of collateralizing Washington State public deposits. all of which was available to be drawn upon at September 30, 2019. The LOC amount reduces the Bank's available FHLB borrowings.in borrowings were outstanding. The Bank maintains a short-term borrowing line of credit with the FRB with total credit based on eligible collateral. At September 30, 2019,2021, the Bank had no outstanding balance and $84.36$73.81 million in unused borrowing capacity on this borrowing line of credit. A short-term borrowing line of credit of $10.00$50.00 million is also maintained at Pacific Coast Bankers' Bank ("PCBB"). The Bank had no outstanding balance on this borrowing line of credit at September 30, 2019.2021.
The following table sets forth certain information regarding borrowings including repurchase agreements, by the Bank at the end of and during the periods indicated:
| | | | | | | | | | | | | | | | | | | | |
| At or For the
Year Ended September 30, | |
| | 2021 | | 2020 | | 2019 | |
| | (Dollars in thousands) | |
| Average total borrowings | $ | 7,685 | | | $ | 5,685 | | | $ | — | | |
| | | | | | |
| Weighted average rate paid on total borrowings | 1.18 | % | | 1.16 | % | | — | % | |
| | | | | | |
| Total borrowings outstanding at end of period | $ | 5,000 | | | $ | 10,000 | | | $ | — | | |
|
| | | | | | | | | | | | |
| | At or For the Year Ended September 30, | |
| | 2019 | | 2018 | | 2017 | |
| | (Dollars in thousands) | |
| Average total borrowings | $ | — |
| | $ | — |
| | $ | 17,096 |
| |
| | | | | | | |
| Weighted average rate paid on total borrowings | — | % | | — | % | | 5.73 | % | (1) |
| | | | | | | |
| Total borrowings outstanding at end of period | $ | — |
| | $ | — |
| | $ | — |
| |
________________________
(1) Includes a prepayment penalty of $282. The weighted average rate without the prepayment penalty was 4.08%.
The Bank did not have any short-term borrowings for the years ended September 30, 2019, 20182021, 2020 and 2017.2019.
Bank Owned Life Insurance
The Bank has purchased life insurance policies covering certain officers. These policies are recorded at their cash surrender value, net of any cash surrender charges. Increases in cash surrender value, net of policy premiums, and proceeds from death benefits are recorded in non-interest income. At September 30, 2019,2021, the cash surrender value of bank owned life insurance (“BOLI”) was $21.01$22.19 million.
How We Are Regulated
General. As a bank holding company, Timberland Bancorp is subject to examination and supervision by, and is required to file certain reports with, the Federal Reserve. Timberland Bancorp is also subject to the rules and regulations of the SEC under the federal securities laws. As a state-chartered savings bank, the Bank is subject to regulation and oversight by the Division and the applicable provisions of Washington law and regulations of the Division adopted thereunder. The Bank also is subject to regulation and examination by the FDIC, which insures the deposits of the Bank to the maximum extent permitted by law, and requirements established by the Federal Reserve. State law and regulations govern the Bank's ability to take deposits
and pay interest thereon, to make loans on or invest in residential and other real estate, to make consumer loans, to invest in securities, to offer various banking services to its customers and to establish branch offices. Under state law, savings banks in Washington also generally have all of the powers that federal savings banks have under federal laws and regulations. The Bank is subject to periodic examination and reporting requirements by and of the Division and the FDIC. The Dodd-Frank Wall Street Reform and Consumer Protection Act of 2010 (the "Dodd-Frank Act") established the Consumer Financial Protection Bureau ("CFPB") as an independent bureau of the Federal Reserve with responsibility for the implementation of federal financial consumer protection and fair lending laws and regulations. The Bank is subject to consumer protection regulations issued by the CFPB, but as a smaller financial institution, is generally subject to supervision and enforcement by the FDIC and DFI with respect to its compliance with federal and state consumer financial protection laws and regulations.
The following is a brief description of certain laws and regulations applicable to Timberland Bancorp and the Bank. Descriptions of laws and regulations here and elsewhere in this report do not purport to be complete and are qualified in their entirety by reference to the actual laws and regulations. Legislation is introduced from time to time in the U.S. Congress or the Washington State Legislature that may affect the operations of Timberland Bancorp and the Bank. In addition, the regulations governing the Company and the Bank may be amended from time to time by the FDIC, DFI, Federal Reserve and the CFPB. Any such legislation or regulatory changes in the future could adversely affect the Company's and the Bank's operations and financial condition. We cannot predict whether any such changes may occur.
The DFI and FDIC have extensive enforcement authority over all Washington state-chartered savings banks, including the Bank.The Federal Reserve has the same type of authority over Timberland Bancorp. This enforcement authority includes, among other things, the ability to assess civil money penalties, issue cease-and-desist orders and removal orders and initiate injunctive actions. In general, these enforcement actions may be initiated for violations of laws and regulations and unsafe or unsound practices. Other actions or inactions may provide the basis for enforcement action, including misleading or untimely reports filed with the regulators.
Regulation of the Bank
The Bank, as a state-chartered savings bank, is subject to regulation and oversight by the FDIC and the Division extending to all aspects of its operations.
Federal and State Enforcement Authority and Actions. As part of its supervisory authority over Washington-chartered savings banks, the Division may initiate enforcement proceedings to obtain a consent order to cease and desist against an institution believed to have engaged in unsafe and unsound practices or to have violated a law, regulation, or other regulatory limit, including a written agreement. The FDIC also has the authority to initiate enforcement actions against insured institutions for similar reasons and may terminate the deposit insurance if it determines that an institution has engaged in unsafe or unsound practices or is in an unsafe or unsound condition. Both of these agencies may utilize less formal supervisory tools to address their concerns about the condition, operations or compliance status of a savings bank.
Insurance of Accounts and Regulation by the FDIC. The deposit insurance fund (the "DIF") of the FDIC insures deposit accounts in the BankBank’s deposits are insured up to $250,000 per separately insured deposit ownership right or category.category by the Deposit Insurance Fund (‘DIF”) of the FDIC. As insurer, the FDIC imposes deposit insurance premiums and is authorized to conduct examinations of, and to require reporting by, FDIC-insured institutions. The Bank'sFDIC assesses deposit insurance premiums for the year ended September 30, 2019 were $187,000.
Under the FDIC's system for assessingquarterly on each FDIC-insured institution applied to its deposit base, which is their average consolidated total assets minus its Tier 1 capital. No institution may pay a dividend if it is in default on its federal deposit insurance premiums, insured institutions that do not have assets of $10 billion are assessed based on CAMELS component ratings and certain financial ratios. For these institutions, totalassessment. Total base assessment rates currently range from 3 to 30 basis points subject to adjustment. Stronger institutions pay lower rates, while riskier institutions pay higher rates. Assessments are applied to an institution's assessment base, which is its average consolidated total assets minus average tangible equity.certain adjustments. The FDIC has authority to increase insurance assessments, and any significant increases would have an adverse effect on the operating expenses and results of operations of the Bank. Management cannot predict what assessment rates will be in the future.
In a banking industry emergency, the FDIC may also impose a special assessment. As insurer, the FDIC is authorized to conduct examinations of and to require reporting by FDIC-insured institutions. ItThe FDIC also may prohibit any FDIC-insuredinsured institution from engaging in any activity the FDIC determines by regulation or order to pose a serious threatrisk to the DIF. The FDIC also has the authority to take enforcement actions against banks and savings associations. Management is not aware of any existing circumstances which would result in termination of the Bank's deposit insurance.
A significant increase in insurance premiums would likely have an adverse effect on the operating expenses and results of operations of the Bank.
Capital Requirements. Effective January 1, 2015 (with some changes transitioned into full effectiveness over two to four years), Federally insured financial institutions, such as the Bank becameand their holding companies, are required to maintain a minimum level of regulatory capital. The Bank is subject to new capital regulations adopted by the FDIC, which createdestablish minimum required ratios for a new required ratio for common equity Tier 1 ("CET1"(“CET1”) capital increased the minimum leverage andto risk-based assets ratio, a Tier 1 capital ratios, changedto risk-based assets ratio, a total capital to risk-based assets ratio and a Tier 1 capital to total assets leverage ratio. The capital standards require the risk-weightings of certain assets for purposesmaintenance of the risk-based capital ratios, created an additional capital conservation buffer over the required capital ratios, and changed what qualifies as capital for purposes of meeting the capital requirements. The Federal Reserve adopted parallel regulations for bank holding companies. These regulations implement the regulatory capital reforms required by the Dodd Frank Act and the "Basel III" requirements.
Under the capital regulations, the requiredfollowing minimum capital level ratios areratios: (i) a CET1 capital ratio of 4.5%; (ii) a Tier 1 capital ratio of 6.0%6%; (iii) a total capital ratio of 8.0%8%; and (iv) a Tier 1 leverage ratio of 4.0%4%. CET1Consolidated regulatory capital requirements identical to those applicable to subsidiary banks generally consistsapply to bank holding companies.However, the Federal Reserve has provided a “Small Bank Holding Company” exception to its consolidated capital requirements, and bank holding companies with less than $3.0 billion of common stock; retained earnings; accumulated other comprehensive income ("AOCI") unless an institution elects to exclude AOCI from regulatory capital; and certain minority interests; allconsolidated assets are not subject to the consolidated holding company capital requirements unless otherwise directed by the Federal Reserve.
The Economic Growth, Regulatory Relief and Consumer Protection Act (“EGRRCPA”), enacted in May 2018, required the federal banking agencies, including the FDIC, to establish for institutions with assets of less than $10 billion a “community bank leverage ratio” or “CBLR” of between 8 to 10%.Institutions with capital meeting or exceeding the ratio and
otherwise complying with the specified requirements (including off-balance sheet exposures of 25% or less of total assets and trading assets and liabilities of 5% or less of total assets) and electing the alternative framework are considered to comply with the applicable regulatory adjustments and deductions. Tier 1 capital generally consists of CET1 and noncumulative perpetual preferred stock. Tier 2 capital generally consists of other preferred stock and subordinated debt meeting certain conditions plus an amount ofrequirements, including the allowance for loan and lease losses up to 1.25% of assets. Total capital is the sum of Tier 1 and Tier 2 capital.risk-based requirements. The leverage ratio is the ratio ofCBLR was established at 9% Tier 1 capital to total average consolidated assets, effective January 1, 2020. A qualifying institution may opt in and out of the community bank leverage ratio framework on its quarterly call report. An institution that temporarily ceases to meet any qualifying criteria is provided with a two-quarter grace period to again achieve compliance. Failure to meet the qualifying criteria within the grace period or maintain a leverage ratio of 8% or greater requires the institution to comply with the generally applicable capital requirements. The Bank has not elected to use the CBLR framework as reported on Call Reports, minus certain items deducted fromof September 30, 2021.
In order to be considered well-capitalized under the prompt corrective action regulations, the Bank must maintain a CET1 risk-based ratio of 6.5%, a Tier 1 capital.risk-based ratio of 8%, a total risk-based capital ratio of 10% and a leverage ratio of 5%, and the Bank must not be subject to an individualized order, directive or agreement under which its primary federal banking regulator requires it to maintain a specific capital level.
In addition to the minimum capital requirements, the Bank must maintain a capital conservation buffer that consists of additional CET1 capital greater than 2.5% of risk-weighted assets above the required minimum risk-based capital ratios in order to avoid limitations on paying dividends, repurchasing shares and paying certain discretionary bonuses. At September 30, 20192021, the conservation buffer was an amount greater than 2.5%.
In additionBank met the requirements to be "well capitalized", and the capital requirements, there have been a number of changes in what constitutes regulatory capital, subject to transition periods. These changes include the phasing-out of certain instruments of qualifying capital. The Bank did not have any of these instruments at September 30, 2019. Servicing rights and deferred tax assets over designated percentages of CET1 are deducted from capital, subject to a four-year transition period.Bank's CET1 capital consists of Tier 1 capital less all capital components that are not considered common equity. In addition, Tier 1 capital includes accumulated other comprehensive income (loss), which includes all unrealized gains and losses on available for sale debt securities, subject to a four-year transition period. Because ofexceeded the Bank's asset size, it was not considered an advanced approaches banking organization and elected in the first quarter of calendar year 2015 to take the one-time option of deciding to permanently opt-out of the inclusion of unrealized gains and losses on available for sale debt securities in its capital calculations.required conservation buffer.
The following table compares the Bank's actual capital amounts at September 30, 20192021 to its minimum regulatory capital requirements at that date (Dollars in thousands):
| | | | | | | | | | | | | | | | | | | | | | | | | | | | | | | | | | | |
| Actual | | Regulatory Minimum To Be "Adequately Capitalized | | Regulatory Minimum To Be "Well Capitalized" Under Prompt Corrective Action Provisions |
| Amount | | Ratio | | Amount | | Ratio | | Amount | | Ratio |
| Leverage Capital Ratio: | | | | | | | | | | | |
| Tier 1 capital | $ | 188,512 | | | 10.7 | % | | $ | 70,240 | | | 4.0 | % | | $ | 87,801 | | | 5.0 | % |
| | | | | | | | | | | |
| Risk-based Capital Ratios: | | | | | | | | | | | |
| CET1 capital | 188,512 | | | 20.6 | | | 41,257 | | | 4.5 | | | 59,593 | | | 6.5 | |
| | | | | | | | | | | |
| Tier 1 capital | 188,512 | | | 20.6 | | | 55,009 | | | 6.0 | | | 73,345 | | | 8.0 | |
| | | | | | | | | | | |
| Total capital | 200,002 | | | 21.8 | | | 73,345 | | | 8.0 | | | 91,682 | | | 10.0 | |
|
| | | | | | | | | | | | | | | | | | | | |
| | Actual | | Regulatory Minimum To Be "Adequately Capitalized | | Regulatory Minimum To Be "Well Capitalized" Under Prompt Corrective Action Provisions |
| | Amount | | Ratio | | Amount | | Ratio | | Amount | | Ratio |
| Leverage Capital Ratio: | | | | | | | | | | | |
| Tier 1 capital | $ | 152,926 |
| | 12.47 | % | | $ | 49,044 |
| | 4.00 | % | | $ | 61,305 |
| | 5.00 | % |
| | | | | | | | | | | | |
| Risk-based Capital Ratios: | | | | | | | | | | | |
| CET1 capital | 152,926 |
| | 18.10 |
| | 38,019 |
| | 4.50 |
| | 54,916 |
| | 6.50 |
|
| | | | | | | | | | | | |
| Tier 1 capital | 152,926 |
| | 18.10 |
| | 50,692 |
| | 6.00 |
| | 67,589 |
| | 8.00 |
|
| | | | | | | | | | | | |
| Total capital | 162,857 |
| | 19.28 |
| | 67,589 |
| | 8.00 |
| | 84,487 |
| | 10.00 |
|
The FDIC also has authority to establish individual minimum capital requirements in appropriate cases upon a determination that an institution's capital level is or may become inadequate in light of particular risks or circumstances. Management of the Bank believes that, under the current regulations, the Bank will continue to meet its minimum capital requirements in the foreseeable future.
For additional information regarding the Bank's regulatory capital requirements, see Note 1718 of the Notes to the Consolidated Financial Statements contained in "Item 8. Financial Statements and Supplementary Data" of this Form 10-K.
In September 2019,The Financial Accounting Standards Board has adopted a new accounting standard for GAAP that will be effective for us for our first fiscal year beginning after December 15, 2022. This standard, referred to as Current Expected Credit Loss, or CECL, requires FDIC-insured institutions and their holding companies (banking organizations) to recognize credit losses expected over the FDIClife of certain financial assets. CECL covers a broader range of assets than the current method of recognizing credit losses and generally results in earlier recognition of credit losses. Upon adoption of CECL, a banking organization must record a one-time adjustment to its credit loss allowances as of the beginning of the fiscal year of adoption equal to the difference, if any, between the amount of credit loss allowances under the current methodology and the amount required under CECL. For a banking organization, implementation of CECL is generally likely to reduce retained earnings, and to affect other items, in a manner that reduces its regulatory capital.
The federal banking agenciesregulators (the Federal Reserve, the Office of the Comptroller of the Currency and the FDIC) have adopted a final rule effective January 1, 2020, creatingthat gives a community bank leverage ratio ("CBLR") for institutions that have total consolidated assetsbanking organization the option to phase in over a three-year period the day-one adverse effects of $10 billion or less and meet other qualifying criteria. The CBLR provides a simple measure of capital adequacy for qualifying institutions. Qualifying institutions that elect to use the CBLR framework and that maintain a leverage capital ratio of greater than 9% will be considered to have satisfied the general applicable risk-based and leverage capital requirements in theCECL on its regulatory agencies' capital rules and to have met the well-capitalized ratio requirements. Management is still reviewing the CBLR framework.capital.
Prompt Corrective Action. Federal statutes establish a supervisory framework based on five capital categories: well capitalized, adequately capitalized, undercapitalized, significantly undercapitalized and critically undercapitalized. An institution’s category depends upon where its capital levels are in relation to relevant capital measures, which include a risk-basedrisk-
based capital measure, a leverage ratio capital measure and certain other factors. An institution that is not well capitalized is subject to certain restrictions on brokered deposits, including restrictions on the rates it can offer on its deposits generally. Any institution which is neither well capitalized nor adequately capitalized is considered undercapitalized. Under these regulations,The final rule establishing an elective "community bank leverage ratio" regulatory capital framework provides that a qualifying institution is treated as well capitalized if it has (i) a total risk-basedwhose capital ratioexceeds the CBLR and opts to use the framework will be considered "well capitalized" for purposes of 10.0% or more, (ii) a CET1 risk-based capital ratio of 6.5% or more, (iii) a Tier 1 risk-based capital ratio of 8.0% or more, and (iv) a leverage ratio of 5.0% or more, and is not subject to any of certain specified requirements to meet and maintain a specific capital level for any capital measure.prompt corrective action.
Undercapitalized institutions are subject to certain prompt corrective action requirements, regulatory controls and restrictions which become more extensive as an institution becomes more severely undercapitalized. Failure by an institution to comply with applicable capital requirements would, if unremedied, result in progressively more severe restrictions on its activities and lead to enforcement actions, including, but not limited to, the issuance of a capital directive to ensure the maintenance of required capital levels and, ultimately, the appointment of the FDIC as receiver or conservator. Banking regulators will take prompt corrective action with respect to depository institutions that do not meet minimum capital requirements. Additionally, approval of any regulatory application filed for their review may be dependent on compliance with capital requirements.
At September 30, 2019,2021, the Bank was categorized as “well capitalized” under the prompt corrective action regulations of the FDIC. For additional information regarding the Bank's minimum regulatory capital requirements, see "Capital Requirements" above and Note 1718 of the Notes to the Consolidated Financial Statements contained in “Item 8. Financial Statements and Supplementary Data” of this Form 10-K.
Federal Home Loan Bank System. The Bank is a member of the FHLB, one of 11 regional Federal Home Loan Banks that administer the home financing credit function of savings institutions, each serving as a reserve or central bank for its members within its assigned region. The FHLB is funded primarily from proceeds derived from the sale of consolidated obligations of the FHLB System. It makes loans to members in accordance with policies and procedures, established by the Board of Directors of the FHLB, which are subject to the oversight of the Federal Housing Finance Board. All borrowings from the FHLB are required to be fully secured by sufficient collateral as determined by the FHLB. In addition, all long-term borrowings are required to provide funds for residential home financing. See “Deposit Activities and Other Sources of Funds – Borrowings" above.
As a member, the Bank is required to purchase and maintain stock in the FHLB based on the Bank's asset size and level of borrowings from the FHLB. At September 30, 2019,2021, the Bank had $1.44$2.10 million in FHLB stock, which was in compliance with this requirement. The FHLB pays dividends quarterly, and the Bank received $51,000$70,000 in dividends during the year ended September 30, 2019.2021.
The Federal Home Loan Banks continue to contribute to low- and moderately-priced housing programs through direct loans or interest subsidies on borrowings targeted for community investment and low- and moderate-income housing projects. These contributions have adversely affected the level of FHLB dividends paid and could continue to do so in the future. These contributions could also have an adverse effect on the value of FHLB stock in the future. A reduction in value of the Bank's FHLB stock may result in a decrease in net income and possibly capital.
Standards for Safety and Soundness. The Each federal banking regulatory agencies have prescribed, by regulation,agency, including the FDIC, has adopted guidelines for all insured depository institutionsestablishing general standards relating to:to internal controls, information systems and internal audit systems,systems; loan documentation,documentation; credit underwriting,underwriting; interest rate risk exposure,exposure; asset growth,growth; asset quality, earnings,quality; earnings; and compensation, fees and benefits. TheIn general, the guidelines set forth the safetyrequire, among other things, appropriate systems and soundness standards that the federal banking agencies usepractices to identify and address problems at insured depository institutions before capital becomes impaired. Each insured depository institution must implement a comprehensive written information security program that includes administrative, technicalmanage the risks and physical safeguards appropriateexposures specified in the guidelines. The guidelines prohibit excessive compensation as an unsafe and unsound practice and describe compensation as excessive when the amounts paid are unreasonable or disproportionate to the institution’s size and complexity and the nature and scope of its activities. The information security program also must be
designed to ensure the security and confidentiality of customer information, protect against any unanticipated threatsservices performed by an executive officer, employee, director, or hazards to the security or integrity of such information, protect against unauthorized access to or use of such information that could result in substantial harm or inconvenience to any customer, and ensure the proper disposal of customer and consumer information. Each insured depository institution must also develop and implement a risk-based response program to address incidents of unauthorized access to customer information in customer information systems.principal shareholder. If the FDIC determines that the Bankan institution fails to meet any standard prescribed by theof these guidelines, it may require the Bankan institution to submit to the agencyFDIC an acceptable plan to achieve compliance with the standard. FDIC regulations establish deadlines for the submission and review of such safety and soundness compliance plans.compliance. Management of the Bank is not aware of any conditions relating to these safety and soundness standards which would require submission of a plan of compliance.
Real Estate Lending Standards. FDIC regulations require the Bank to adopt and maintain written policies that establish appropriate limits and standards for real estate loans. These standards, which must be consistent with safe and sound banking practices, must establish loan portfolio diversification standards, prudent underwriting standards (including loan-to-value ratio limits) that are clear and measurable, loan administration procedures, and documentation, approval and reporting requirements. The Bank is obligated to monitor conditions in its real estate markets to ensure that its standards continue to be appropriate for current market conditions. The Bank’s Board of Directors is required to review and approve the Bank’s standards at least annually. The FDIC has published guidelines for compliance with these regulations, including supervisory limitations on loan-to-value ratios for different categories of real estate loans. Under the guidelines, the aggregate amount of all
loans in excess of the supervisory loan-to-value ratios should not exceed 100% of total capital, and the total of all loans for commercial, agricultural, multi-family or other non-one- to four-family residential properties in excess of the supervisory loan-to-value ratio should not exceed 30% of total capital. Loans in excess of the supervisory loan-to-value ratio limitations must be identified in the Bank’s records and reported at least quarterly to the Bank’s Board of Directors. The Bank is in compliance with the record and reporting requirements. As of September 30, 2019,2021, the Bank’s aggregate loans in excess of the supervisory loan-to-value ratios were 0.3%0.2% of total capital, and the Bank's loans on commercial, agricultural, multi-family or other non-one- to four-family residential properties in excess of the supervisory loan-to-value ratios were 0.1% of total capital.
Activities and Investments of Insured State-Chartered Financial Institutions. Federal law generally limits the activities and equity investments of FDIC-insured state-chartered banks to those that are permissible for national banks. An insured state bank is not prohibited from, among other things, (i) acquiring or retaining a majority interest in a subsidiary, (ii) investing as a limited partner in a partnership, the sole purpose of which is direct or indirect investment in the acquisition, rehabilitation or new construction of a qualified housing project, provided that such limited partnership investments may not exceed 2% of the bank's total assets, (iii) acquiring up to 10% of the voting stock of a company that solely provides or reinsures directors' and officers' liability insurance coverage or bankers' blanket bond group insurance coverage for insured depository institutions, and (iv) acquiring or retaining the voting shares of a depository institution owned by another FDIC-insured institution if certain requirements are met.
Under the lawlaws of Washington State, Washington-chartered savings banks may exercise any of the powers of Washington-chartered commercial banks, national banks and federally-chartered savings banks, subject to the approval of the DirectorDFI in certain situations. In addition,Washington-chartered savings banks may charge the maximum interest rate allowable for loans and other extensions of credit by federally-chartered financial institutions to Washington residents.
Environmental Issues Associated With Real Estate Lending. The Comprehensive Environmental Response, Compensation and Liability Act (“CERCLA”) is a federal statute that generally imposes strict liability on all prior and present "owners and operators" of sites containing hazardous waste. However, Congress acted to protect secured creditors by providing that the term “owner and operator” excludes a person whose ownership is limited to protecting its security interest in the site. Since the enactment of the CERCLA, this “secured creditor exemption” has been the subject of judicial interpretations which have left open the possibility that lenders could be liable for cleanup costs on contaminated property that they hold as collateral for a loan.
To the extent that legal uncertainty exists in this area, all creditors, including the Bank, that have made loans secured by properties with potential hazardous waste contamination (such as petroleum contamination) could be subject to liability for cleanup costs, which costs often substantially exceed the value of the collateral property.
Federal Reserve System. The Federal Reserve requires that all depository institutions to maintain reserves onat specified levels against their transaction accounts, or non-personal time deposits. These reserves may be inprimarily checking accounts. In response to the form of cash or non-interest-bearing deposits with the regional Federal Reserve Bank. Negotiable order of withdrawal ("NOW") accounts and other types of accounts that permit payments or transfers to third parties fall within the definition of transaction accounts and are subject to reserve requirements, as are any non-personal time deposits at a savings bank. As of September 30, 2019, the Bank’s deposit withCOVID-19 pandemic, the Federal Reserve reduced reserve requirement ratios to zero percent effective on March 26, 2020, to support lending to households and vault cash exceeded its Regulation Dbusinesses. At September 30, 2021, the Bank was in compliance with the reserve requirements.requirements in place at that time.
Affiliate Transactions.Transactions with Affiliates. Timberland Bancorp, Inc. and the Bank are separate and distinct legal entities. The Bank is an affiliate of Timberland Bancorp, Inc. Federal laws strictly limit the ability of banks to engage in certain transactions with their affiliates, including their bank holding companies.affiliates. Transactions deemed to be a “covered transaction” under Section 23A of the Federal Reserve Act and between a subsidiary bank and its parent company or the nonbank subsidiaries of the bank holding companyan affiliate are limited to 10% of the bank subsidiary’sbank's capital and surplus and, with respect to the parent company and all such nonbank subsidiaries,affiliates, to an aggregate of 20% of the bank subsidiary’sbank's capital and surplus. Further, covered transactions that are loans and extensions of credit generally are required to be secured by eligible collateral in specified amounts. Federal law also requires that covered transactions and certain other transactions between a bank and its affiliates listed in Section 23B of the Federal Reserve Act between a bank and related regulations mustits affiliates be on terms as favorable to the bank as transactions with non-affiliates.
Community Reinvestment Act. Banks are also subject to the provisions of the Community Reinvestment Act of 1977 (“CRA”), which requires the appropriate federal bank regulatory agency to assess a bank’s performance under the CRA in meeting the credit needs of the community serviced by the bank, including low- and moderate-income neighborhoods. The regulatory agency’s assessment of the bank’s record is made available to the public. Further, a bank’s performance must be considered in connection with a bank’s application to, among other things, establish a new branch office that will accept deposits, relocate an existing office or merge or consolidate with, or acquire the assets or assume the liabilities of, a federally regulated financial institution. The Bank received a “satisfactory” rating during its most recent examination.
Dividends. Dividends from the Bank constitute the major source of funds available for dividends which may be paid to Company shareholders. The amount of dividends payable by the Bank to the Company depends upon the Bank's earnings and capital position, and is limited by federal and state laws, regulations and policies. According to Washington law,
the Bank may not declare or pay a cash dividend on its capital stock if it would cause its net worth to be reduced below (i) the amount required for liquidation accounts or (ii) the net worth requirements, if any, imposed by the Director of the Division. In addition, dividends on the Bank's capital stock may not be paid in an aggregate amount greater than the aggregate retained earnings of the Bank, without the approval of the Director of the Division. Dividends payable by the Bank can be limited or prohibited if the Bank does not meet the capital conservation buffer requirement.
The amount of dividends actually paid during any one period will be strongly affected by the Bank's management policy of maintaining a strong capital position. Federal law further provides that no insured depository institution may pay a cash dividend if it would cause the institution to be “undercapitalized,” as defined in the prompt corrective action regulations. Moreover, the federal bank regulatory agencies also have the general authority to limit the dividends paid by insured banks if such payments should be deemed to constitute an unsafe and unsound practice.
Anti-Money Laundering and Customer Identification. The Uniting and Strengthening America by Providing Appropriate Tools Required to Intercept and Obstruct Terrorism Act of 2001 (USA Patriot Act) was signed into law on October 26, 2001. The USA PATRIOT Act and the Bank Secrecy Act requires financial institutions to develop programs to prevent financial institutions from being used for money laundering and terrorist activities. If such activities are detected, financial institutions are obligated to file suspicious activity reports with the U.S. Treasury’s Office of Financial Crimes Enforcement Network. These rules require financial institutions to establish procedures for identifying and verifying the identity of customers seeking to open new financial accounts, and, effective in 2018, the beneficial owners of accounts. Bank regulators are directed to consider a holding company’s effectiveness in combating money laundering when ruling on Bank Holding Company Act and Bank Merger Act applications.
Privacy Standards. The Bank is subject to FDIC regulations implementing the privacy protection provisions of the Gramm-Leach-Bliley Financial Services Modernization Act of 1999. These regulations require the Bank to disclose its privacy policy, including informing consumers of its information sharing practices and informing consumers of their rights to opt out of certain practices. In addition, Washington and other state cybersecurity and data privacy laws and regulations may expose the Bank to risk and result in certain risk management costs.
Other Consumer Protection Laws and Regulations. The Bank is subject to a broad array of federal and state consumer protection laws and regulations that govern almost every aspect of its business relationships with consumers. While the list set forth below is not exhaustive, these include the Truth-in-Lending Act, the Truth in Savings Act, the Electronic Fund Transfer Act, the Expedited Funds Availability Act, the Equal Credit Opportunity Act, the Fair Housing Act, the Real Estate Settlement Procedures Act, the Home Mortgage Disclosure Act, the Fair Credit Reporting Act, the Fair Debt Collection Practices Act, the Right to Financial Privacy Act, the Home Ownership and Equity Protection Act, the Consumer Leasing Act, the Fair Credit Billing Act, the Homeowners Protection Act, the Check Clearing for the 21st Century Act, laws governing flood insurance, laws governing consumer protections in connection with the sale of insurance, federal and state laws prohibiting unfair and deceptive business practices, and various regulations that implement some or all of the foregoing. These laws and regulations mandate certain disclosure requirements and regulate the manner in which financial institutions must deal with customers when taking deposits, making loans, collecting loans, and providing other services. Failure to comply with these laws and regulations can subject the Bank to various penalties, including but not limited to, enforcement actions, injunctions, fines, civil liability, criminal penalties, punitive damages, and the loss of certain contractual rights.
Regulation of the Company
General. The Company, as the sole shareholder of the Bank, is a bank holding company registered with the Federal Reserve. Bank holding companies are subject to comprehensive regulation by the Federal Reserve under the Bank Holding Company Act of 1956, as amended (“BHCA”), and the regulations promulgated thereunder. This regulation and oversight is generally intended to ensure that the Company limits its activities to those allowed by law and that it operates in a safe and sound manner without endangering the financial health of the Bank.
As a bank holding company, the Company is required to file quarterly reports with the Federal Reserve and any additional information required by the Federal Reserve and is subject to regular examinations by the Federal Reserve. The Federal Reserve also has extensive enforcement authority over bank holding companies, including the ability to assess civil money penalties, to issue cease and desist or removal orders and to require that a holding company divest subsidiaries (including its bank
subsidiaries). In general, enforcement actions may be initiated for violations of laws and regulations and unsafe or unsound practices.
BHCA. The Company is supervised by the Federal Reserve under the BHCA. The Federal Reserve has a policy requires that a bank holding company is required to serve as a source of financial and managerial strength to its subsidiary banksbank and may not conduct its operations in an unsafe or unsound manner. In addition, the Dodd-Frank Act and earlier Federal Reserve providespolicy provide that a bank holding companiescompany should serve as a source of strength to its subsidiary banksbank by being preparedhaving the ability to use available resources to provide adequate capital funds
financial assistance to its subsidiary banksbank during periods of financial stress or adversity, and should maintaindistress to the financial flexibility and capital raising capacity to obtain additional resources for assisting its subsidiary banks.bank. A bank holding company'scompany’s failure to meet its obligation to serve as a source of strength to its subsidiary bank will generally be considered by the Federal Reserve to be an unsafe and unsound banking practice or a violation of the Federal Reserve'sReserve’s regulations or both. No regulations have yet been proposed by the Federal Reserve to implement the source of strength provisions required by the Dodd-Frank Act. Timberland Bancorp, Inc. and any subsidiaries that it may control are considered “affiliates” within the meaning of the Federal Reserve Act, and transactions between the Bank and affiliates are subject to numerous restrictions. With some exceptions, Timberland Bancorp, Inc. and its subsidiaries are prohibited from tying the provision of various services, such as extensions of credit, to other services offered by Timberland Bancorp, Inc. or by its affiliates.
Acquisitions.The Dodd-Frank Act essentially codified this policy.
BHCA prohibits a bank holding company, with certain exceptions, from acquiring ownership or control of more than 5% of the voting shares of any company that is not a bank or bank holding company and from engaging in activities other than those of banking, managing or controlling banks, or providing services for its subsidiaries. Under the BHCA, the Federal Reserve may approve the ownership of shares by a bank holding company in any company, the activities of which the Federal Reserve has determined to be so closely related to the business of banking or managing or controlling banks as to be a proper incident thereto. These activities generally include, among others,include: operating a savings institution, mortgage company, finance company, escrow company, credit card company or factoring company; performing certain data processing operations; providing certain investment and financial advice; underwriting and acting as an insurance agent for certain types of credit relatedcredit-related insurance; leasing property on a full payout,full-payout, non-operating basis; selling money orders, travelers’ checks and U.S. Savings Bonds; real estate and personal property appraising; providing tax planning and preparation services; and, subject to certain limitations, providing securities brokerage services for customers.
Acquisitions. The BHCA prohibitsFederal Reserve must approve the acquisition (or acquisition of control) of a bank or other FDIC-insured depository institution by a bank holding company, with certain exceptions, from acquiring directand the appropriate federal banking regulator must approve a bank’s acquisition (or acquisition of control) of another bank or indirect ownershipother FDIC-insured institution.
Acquisition of Control of a Bank Holding Company. Under federal law, a notice or application must be submitted to the appropriate federal banking regulator if any person (including a company), or group acting in concert, seeks to acquire “control” of a bank holding company. An acquisition of control can occur upon the acquisition of 10% or more than 5% of the voting shares of any company that is not a bank or bank holding company and from engaging directly or indirectly in activities other than those of banking, managing or controlling banks, or providing services for its subsidiaries. A bank holding company that meets certain supervisory and financial standards and elects to be designated as a financial holding company may also engage in certain securities, insurance and merchant banking activities and other activities determined to be financial in nature or incidental to financial activities.
Interstate Banking. The Federal Reserve may approve an applicationstock of a bank holding company to acquire control of, or acquire allas otherwise defined by federal regulations. In considering such a notice or substantially allapplication, the Federal Reserve takes into consideration certain factors, including the financial and managerial resources of the assets of, a bank located in a state other than such holding company's home state, without regard to whetheracquirer and the transaction is prohibited by the laws of any state except with respect to the acquisition of a bank that has not been in existence for the minimum time period, not exceeding five years, specified by the lawanti-trust effects of the host state. The Federal Reserve may not approve an application if the applicant controls or wouldacquisition. Any company that acquires control more than 10% of the insured deposits in the U.S. or 30% or more of the deposits in the target bank's home state or in any state in which the target bank maintains a branch. Federal law does not affect the authority of statesbecomes subject to limit the percentage of total insured deposits in the state that may be held or controlled byregulation as a bank holding companycompany. Depending on circumstances, a notice or application may be required to the extent such limitation does not discriminate against out-of-state banks or bank holding companies. Individual statesbe filed with appropriate state banking regulators and may also waive the 30% state-wide concentration limit contained in the federal law.
The federal banking agencies are authorized to approve interstate merger transactions without regard to whether such transaction is prohibited by the law of any state, unless the home state of one of the banks adopted a law prior to June 1, 1997 which applies equally to all out-of-state banks and expressly prohibits merger transactions involving out-of-state banks. Interstate acquisitions of branches will be permitted only if the law of the state in which the branch is located permits such acquisitions. Interstate mergers and branch acquisitions are also generally subject to the nationwide and statewide insured deposit concentration amounts described above.their approval or non-objection.
Dividends. Federal Reserve policy limits the payment of cash dividends by bank holding companies, which expresses the Federal Reserve's view that a bank holding company should pay cash dividends only to the extent that the company's net income for the past year is sufficient to cover both the cash dividends and a rate of earningearnings retention that is consistent with the company's capital needs, asset quality and overall financial condition, and that it is inappropriate for a company experiencing serious financial problems to borrow funds to pay dividends. Under Washington corporate law, the Company generally may not pay dividends if after that payment it would not be able to pay its liabilities as they become due in the usual course of business, or its total assets would be less than its total liabilities. The capital conservation buffer requirement can also limit dividends.
Stock Repurchases. Bank holding companies, except for certain “well-capitalized” and highly rated bank holding companies, are required to give the Federal Reserve prior written notice of any purchase or redemption of its outstanding equity securities if the consideration for the purchase or redemption, when combined with the net consideration paid for all such purchases or redemptions during the preceding 12 months, is equal to 10% or more of their consolidated net worth. The Federal Reserve may disapprove a purchase or redemption if it determines that the proposal would constitute an unsafe or unsound practice or
would violate any law, regulation, Federal Reserve order, or any condition imposed by, or written agreement with, the Federal Reserve.
Capital Requirements. As adiscussed above, pursuant to the “Small Bank Holding Company” exception, effective August 30, 2018, bank holding company registered with the Federal Reserve, the Company is subject to the capital adequacy requirements of the Federal Reserve under the BHCA and the regulations of the Federal Reserve. For a bank holding companycompanies with less than $3.00 billion in consolidated assets were generally no longer subject to the Federal Reserve’s capital regulations, which are generally the same as the capital guidelines apply onregulations applicable to the Bank. At the time of this change, Timberland Bancorp, Inc. was considered “well capitalized” as defined for a bank only basis,holding company with a total risk-based capital ratio of 10.0% or more and a Tier 1 risk-based capital ratio of 8.0% or more, and was not subject to an individualized order, directive or agreement under which the Federal Reserve expects the holding company's subsidiary bankrequires it to be well capitalized under the prompt corrective action regulations. maintain a specific capital level.If the Company were subject to regulatory guidelines for bank holding companies with $3.00 billion or more in assets, at September 30, 2019,2021, the Company would have exceeded all regulatory requirements.
The following table presents the regulatory capital ratios for the Company as of September 30, 20192021 (Dollars in thousands):
| | | | | | | | | | | |
| Actual |
| Amount | | Ratio |
| | | |
| Leverage Capital Ratio: | | | |
| Tier 1 capital | $ | 191,973 | | | 11.0 | % |
| | | |
| Risk-based Capital Ratios: | | | |
| CET1 capital | 191,973 | | | 20.9 | |
| | | |
| Tier 1 capital | 191,973 | | | 20.9 | |
| | | |
| Total capital | 203,475 | | | 22.2 | |
|
| | | | | | |
| | Actual |
| | Amount | | Ratio |
| | | | |
| Leverage Capital Ratio: | | | |
| Tier 1 capital | $ | 155,468 |
| | 12.65 | % |
| | | | |
| Risk-based Capital Ratios: | | | |
| CET1 capital | 155,468 |
| | 18.40 |
|
| | | | |
| Tier 1 capital | 155,468 |
| | 18.40 |
|
| | | | |
| Total capital | 165,399 |
| | 19.57 |
|
For additional information, see Note 1718 to the Consolidated Financial Statements contained in "Item 8. Financial Statements and Supplementary Data" of this Form 10-K.
The Dodd-Frank Wall Street Reform and Consumer ProtectionFederal Securities Laws. Timberland Bancorp, Inc.’s common stock is registered with the SEC under Section 12(b) of the Securities Exchange Act of 2010. On July 21, 2010, the Dodd-Frank Act was signed into law.1934, as amended (“Exchange Act”). The Dodd-Frank-Act imposed newCompany issubject to information, proxy solicitation, insider trading restrictions and an expanded frameworkother requirements under the Exchange Act. The SEC has adopted regulations and policies under the Sarbanes-Oxley Act of regulatory oversight for financial institutions, including depository institutions, and mandated new capital regulations discussed above under “Regulation and Supervision of the Bank - Capital Requirements.” In addition, among other changes, the Dodd-Frank Act requires public companies, such as2002 that apply to Timberland Bancorp, Inc. as a registered company under the Exchange Act. The stated goals of these requirements are to (i)increase corporate responsibility, provide their shareholders with a non-binding vote (a)for enhanced penalties for accounting and auditing improprieties at least once every three years onpublicly traded companies and to protect investors by improving the compensation paid to executive officersaccuracy and (b) at least once every six years on whether they should have a “say on pay” vote every one, two or three years; (ii) have a separate, non-binding shareholder vote regarding golden parachutes for named executive officers when a shareholder vote takes place on mergers, acquisitions, dispositions or other transactions that would trigger the parachute payments; (iii) provide disclosure in annual proxy materials concerning the relationship between the executive compensation paid and the financial performancereliability of the issuer; and (iv) amend Item 402 of Regulation S-K to require companies to disclose the ratio of the Chief Executive Officer's annual total compensationcorporate disclosures pursuant to the median annual total compensation of all other employees. For certain of these changes, the implementingsecurities laws. The SEC and Sarbanes-Oxley-related regulations have not been promulgated, so the full impact of the Dodd-Frank Act on public companies cannot be determined at this time.
2018 Regulatory Reform. In May 2018 the Economic Growth, Regulatory Relief and Consumer Protection Act (the “2018 Act”), was enacted to modify or remove certain financial reform rules and regulations, including some of those implemented under the Dodd-Frank Act. While the 2018 Act maintains most of the regulatory structure established by the Dodd-Frank Act, it amends certain aspects of the regulatory framework for small depository institutions with assets of less than $10 billion and for large banks with assets of more than $50 billion. Many of these changes could result in meaningful regulatory changes for community banks such as the Bank, and their holding companies.
The 2018 Act, among other matters, expands the definition of qualified mortgages which may be held by a financial institution and simplifies the regulatory capital rules for financial institutions and their holding companies with total consolidated assets of less than $10 billion by instructing the federal banking regulators to establish a single CBLR of between 8 and 10 percent, as described above. Any qualifying depository institution or its holding company that exceeds the CBLR will be considered to have met generally applicable leverage and risk-based regulatory capitalpolicies include very specific additional disclosure requirements and any qualifying depository institution that exceeds the new ratio will be considered to be “well capitalized” under the prompt corrective actioncorporate governance rules.
The 2018 Act also expands the category of holding companies that may rely on the “Small Bank Holding Company and Savings and Loan Holding Company Policy Statement” by raising the maximum amount of assets a qualifying holding company
may have from $1 billion to $3 billion. A major effect of this change is to exclude such holding companies from the minimum capital requirements of the Dodd-Frank Act. In addition, the 2018 Act includes regulatory relief for community banks regarding regulatory examination cycles, call reports, the Volcker Rule (proprietary trading prohibitions), mortgage disclosures and risk weights for certain high-risk commercial real estate loans.
It is difficult at this time to predict when or how any new standards under the 2018 Act will ultimately be applied to us or what specific impact the 2018 Act and the yet-to-be-written implementing rules and regulations will have on community banks.
Taxation
Federal Taxation
General. The Company and the Bank report their operations on a fiscal year basis using the accrual method of accounting and are subject to federal income taxation in the same manner as other corporations. The following discussion of tax matters is intended only as a summary and does not purport to be a comprehensive description of the tax rules applicable to the Bank or the Company.
On December 22, 2017, the U.S. Government enacted comprehensive tax legislation commonly referred to as the Tax Cuts and Jobs Act (the “Tax Act”). The Tax Act amends the Internal Revenue Code to reduce tax rates and modify policies, credits, and deductions for individuals and businesses. For businesses, the Tax Act reduces the corporate federal income tax rate from a maximum of 35.0% to a flat 21.0%. The corporate federal income tax rate reduction was effective January 1, 2018. Since the Company has a fiscal year end of September 30, the reduced federal corporate income tax rate for fiscal year 2018 was the result of the application of a blended federal statutory tax rate of 24.5%, which was based on the applicable tax rates before and after the Tax Act and corresponding number of days in the fiscal year before and after enactment, and then a 21.0% federal corporate income tax rate for fiscal 2019 and thereafter. The Tax Act also required a revaluation of the Company’s deferred tax assets and liabilities to account for the future impact of lower corporate income tax rates and other provisions of the legislation. As a result of the Company’s revaluation, the net deferred tax asset (“DTA”) was reduced through an increase to the provision for income taxes. The revaluation of our DTA balance resulted in a one-time increase for the fiscal year ended September 30, 2018 to federal income tax of $548,000. For additional details see Note 13 of the Notes to Consolidated Financial Statements contained in "Item 8. Financial Statements and Supplementary Data."
Dividends-Received Deduction. The Company may exclude from its income 100.0% of dividends received from the Bank as a member of the same affiliated group of corporations. The corporate dividends-received deduction is generally 70.0% in the case of dividends received from unaffiliated corporations with which the Company and the Bank will not file a consolidated tax return, except that if the Company or the Bank owns more than 20.0% of the stock of a corporation distributing a dividend, then 80.0% of any dividends received may be deducted.
Audits.The Company is no longer subject to U.S. federal tax examination by tax authorities for years ended on or before September 30, 2015.2017.
Washington Taxation
The Company and the Bank are subject to a business and occupation tax imposed under Washington law at the rate of 1.5%1.8% of gross receipts at September 30, 2019. This business and occupation tax rate is scheduled to increase to 1.8% of gross receipts starting on January 1, 2020.2021. Interest received on loans secured by mortgages or deeds of trust on residential properties, certain residential mortgage-backed securities, and certain U.S. government and agency securities is not subject to this tax.
Competition
The Bank operates in an intensely competitive market for the attraction of deposits (generally its primary source of lendable funds) and in the origination of loans. Historically, its most direct competition for deposits has come from commercial banks, thrift institutions and credit unions in its primary market area. In times of high interest rates, the Bank experiences additional significant competition for investors' funds from short-term money market securities and other corporate and
government securities. The Bank's competition for loans comes principally from mortgage bankers, commercial banks, thrift institutions and credit unions. Such competition for deposits and the origination of loans may limit the Bank's future growth and earnings prospects.
Subsidiary Activities
The Bank has one wholly-owned subsidiary, Timberland Service CorporationCorp. (“Timberland Service”), whose primary function is to provide escrow services.
Personnel
Employees and Human Capital Resources
Workforce. As of September 30, 2019,2021, the BankCompany had 286276 full-time employees and 12 part-time and on-call employees. The employees are not represented by a collective bargaining unit, and the BankCompany believes that its relationship with its employees is good. We believe our ability to attract and retain employees is a key to our success. Accordingly, we strive to offer competitive salaries and employee benefits to all employees and monitor salaries in our market areas. Our average tenure was 8.1 years as of September 30, 2021. Our workforce was 80% female and 20% male, and women held 76% of the Bank's management roles (including department supervisors and managers, as well as executive leadership). The average tenure of management was 13.7 years. The ethnicity of our workforce was 82% White, 6% Hispanic or Latinx, 5% two or more races, 4% Asian, 1% Native Hawaiian or Pacific Islander, 1% African American or Black and 1% American Indian or Alaska Native.
Benefits. The Company provides competitive comprehensive benefits to its employees. The Company values the health and well-being of its employees and strives to provide programs to support this. Benefit programs available to eligible employees may include 401(k) savings plan, employee stock ownership plan, health and life insurance, employee assistance program, paid holidays, paid time off, and other leave as applicable.
Response to COVID-19 pandemic. As an essential business, the Company responded quickly to implement procedures to assist employees in navigating the challenging impact from the pandemic, as well as protect the safety of both employees and customers. In response to Washington State's stay at home order, the Company moved eligible positions to remote work status. Safety measures were promptly implemented to protect employees working on site, which included installation of protective partitions and fully equipping locations with personal safety supplies. Employees who experienced a reduction in hours due to reduced branch operating hours continued to receive their full pay. Additional sick leave was authorized for employees impacted directly by the COVID-19 virus. As Washington State mandates change, the Company will continue to make adjustments to support employees and prioritize employee safety.
Training and education. The Company recognizes that the skills and knowledge of its employees are critical to the success of the organization, and promotes training and continuing education as an ongoing function for employees. The Bank's compliance training program provides annual training courses to assure that all employees and officers know the rules applicable to their jobs.
Executive Officers of the Registrant
The following table sets forth certain information with respect to the executive officers of the Company and the Bank:
Executive Officers of the Company and Bank
| | | | | | | | | | | | | | | | | | | | |
| | Age at
September
30, 2021 | | Position |
| Name | | | Company | | Bank |
| Michael R. Sand | | 67 | | President and Chief Executive Officer | | President and Chief Executive Officer |
| | | | | | |
| Dean J. Brydon | | 54 | | Executive Vice President, Chief Financial Officer and Secretary | | Executive Vice President, Chief Financial Officer and Secretary |
| | | | | | |
| | Age at
September
30, 2019
| | Position |
Name | | | Company | | Bank |
Michael R. Sand | | 65 | | President and Chief Executive Officer | | President and Chief Executive Officer |
| | | | | | |
Dean J. Brydon | | 52 | | Executive Vice President, Chief Financial Officer and Secretary | | Executive Vice President, Chief Financial Officer and Secretary |
| | | | | | |
| Robert A. Drugge | | 6870 | | Executive Vice President of Lending | | Executive Vice President of Lending |
| | | | | | |
| Jonathan A. Fischer | | 4547 | | Executive Vice President and Chief Operating Officer | | Executive Vice President and Chief Operating Officer |
| | | | | | |
| Edward C. Foster | | 6264 | | Executive Vice President and Chief Credit Administrator | | Executive Vice President and Chief Credit Administrator |
| | | | | | |
| Marci A. Basich | | 5052 | | Senior Vice President and Treasurer | | Senior Vice President and Treasurer |
| | | | | | |
Biographical Information.
Michael R. Sand has been affiliated with the Bank since 1977 and has served as President of the Bank and the Company since January 23, 2003. On September 30, 2003, he was appointed as Chief Executive Officer of the Bank and Company. Prior to appointment as President and Chief Executive Officer, Mr. Sand had served as Executive Vice President and Secretary of the Bank since 1993 and as Executive Vice President and Secretary of the Company since its formation in 1997.
Dean J. Brydon has been affiliated with the Bank since 1994 and has served as the Chief Financial Officer of the Company and the Bank since January 2000 and Secretary of the Company and the Bank since January 2004. Mr. Brydon is a Certified Public Accountant.
Robert A. Drugge has been affiliated with the Bank since April 2006 and has served as Executive Vice President of Lending since September 2006. Prior to joining Timberland, Mr. Drugge was employed at Bank of America as a senior officer and most recently served as Senior Vice President and Commercial Banking Manager. Mr. Drugge began his banking career at Seafirst in 1974, which was acquired by Bank America Corp. and became known as Bank of America.
Jonathan A. Fischer has been affiliated with the Bank since October 1997 and has served as Chief Operating Officer since August 23, 2012. Prior to that, Mr. Fischer had served as the Chief Risk Officer since October 2010. Mr. Fischer had also served as the Compliance Officer, Community Reinvestment Act Officer, and Privacy Officer since January 2000.
Edward C. Foster has been affiliated with the Bank and has served as Chief Credit Administrator since February 2012. Prior to joining the Bank, Mr. Foster was employed by the FDIC, where he served as a Loan Review Specialist from January 2011 to February 2012. Mr. Foster owned a credit administration consulting business from February 2010 to January 2011. Prior to that, Mr. Foster served as the Chief Credit Officer for Carson River Community Bank from April 2008 through February 2010. Before
joining Carson River Community Bank, Mr. Foster served as a Senior Regional Credit Officer for Omni National Bank from September 2006 through March 2008.
Marci A. Basich has been affiliated with the Bank since 1999 and has served as Treasurer of the Company and the Bank since January 2002. Ms. Basich is a Certified Public Accountant.
Item 1A. Risk Factors
Risk Factors Summary
We assume and manage a certain degree of risk in order to conduct our business strategy. In addition to the risk factors described below, other risks and uncertainties not specifically mentioned, or that are currently known to, or deemed to be immaterial by management, also may materially and adversely affect our financial position, results of operations and/or cash flows. Before making an investment decision, you should carefully consider the risks described below together with all of the other information included in this Form 10-K and our other filings with the SEC. If any of the circumstances described in the following risk factors actually occur to a significant degree, the value of our common stock could decline, and you could lose all or part of your investment. This report is qualified in its entirety by these risk factors.
The most significant risks include the following:
Risks Related to the COVID-19 Pandemic and Associated Economic Slowdown
•The COVID-19 pandemic has adversely impacted our ability to conduct business and is expected to adversely impact our financial results and those of our customers. The ultimate impact will depend on future developments, which are highly uncertain and cannot be predicted, including the scope and duration of the pandemic and actions taken by governmental authorities in response to the pandemic.Our business may be adversely affected by downturns in the national economy and in the economies in our market areas.
Risks Related to Economic Conditions
•Our business may be adversely affected by downturns in the national economy and in the economies in our market areas.
Risks Related to our Lending Activities
•Our real estate construction and land loans expose us to significant risks.
•Our emphasis on commercial real estate lending may expose us to increased lending risks.
•The level of our commercial real estate loan portfolio may subject us to additional regulatory scrutiny.
•Repayment of our commercial business loans is often dependent on the cash flows of the borrower, which may be unpredictable, and the collateral securing these loans may fluctuate in value.
•Our business may be adversely affected by credit risk associated with residential property.
•Our allowance for loan losses may prove to be insufficient to absorb losses in our loan portfolio.
•If our non-performing assets increase, our earnings will be adversely affected.
Risk Related to our Business Strategy
•We may be adversely affected by risks associated with completed and potential acquisitions.
Risk Related to Market Interest Rates
•Changes in interest rates may reduce our net interest income and may result in higher defaults in a rising rate environment.
•Our investment securities portfolio may be negatively impacted by fluctuations in market value and interest rates and result in losses.
•An increase in interest rates, change in the programs offered by Freddie Mac or our ability to qualify for their programs may reduce our mortgage revenues, which would negatively impact our non-interest income.
Risks Related to Laws and Regulations
•We operate in a highly regulated environment and may be adversely affected by changes in federal and state laws and regulations that could increase our costs of operations.
•Non-compliance with the USA PATRIOT Act, Bank Secrecy Act, or other laws and regulations could result in fines or sanctions and limit our ability to get regulatory approval of acquisitions.
Risks Related to Cybersecurity, Third Parties and Technology
•The financial services market is undergoing rapid technological changes, and if we are unable to stay current with those changes, we may not be able to effectively compete.
•We are subject to certain risks in connection with our use of technology.
•Our business may be adversely affected by an increasing prevalence of fraud and other financial crimes.
•Managing reputational risk is important to attracting and maintaining customers, investors and employees.
•We rely on other companies to provide key components of our business infrastructure.
Risks Related to Accounting Matters
•We may experience future goodwill impairment, which could reduce our earnings.
•We may experience decreases in the fair value of our loan servicing rights, which could reduce our earnings.
•The required accounting treatment of loans we acquire through acquisitions including purchase credit impaired loans could result in higher net interest margins and interest income in current periods and lower net interest margins and interest income in future periods.
•If our investments in real estate are not properly valued or sufficiently reserved to cover actual losses, or if we are required to increase our valuation allowances, our earnings could be reduced.
Other Risks Related to Our Business
•Ineffective liquidity management could adversely affect our financial results and condition.
•Our growth or future losses may require us to raise additional capital in the future, but that capital may not be available when it is needed or the cost of that capital may be very high.
•Our framework for managing risks may not be effective in mitigating risk and loss to us.
•We are dependent on key personnel, and the loss of one or more of those key personnel may materially and adversely affect our prospects.
•We will be required to transition from the use of the LIBOR interest rate index in the future.
•Societal responses to climate change could adversely affect our business and performance, including indirectly through impacts on our customers.
Risks Related to the COVID-19 Pandemic and Associated Economic Slowdown
The COVID-19 pandemic has adversely impacted our ability to conduct business and is expected to adversely impact our financial results and those of our customers. The ultimate impact will depend on future developments, which are highly uncertain and cannot be predicted, including the scope and duration of the pandemic and actions taken by governmental authorities in response to the pandemic.
The COVID-19 pandemic has adversely impacted our ability to conduct business, our financial results and those of our customers. The ultimate impact will depend on future developments, which are highly uncertain and cannot be predicted, including the scope and duration of the pandemic and actions taken by governmental authorities in response to the pandemic.
During our fiscal year ended September 30, 2021, the COVID-19 pandemic significantly adversely affected our operations and the way we provided banking services to businesses and individuals during government issued modified stay-at-home orders. As an essential business, we continue to provide banking and financial services to our customers with drive-thru access available at the majority of our branch locations and in-person services available by appointment. We have re-opened branch lobbies with modified access. In addition, we continue to provide access to banking and financial services through online banking, ATMs and by telephone. As the government issued orders were lifted during the latter part of fiscal year 2021 and vaccinations were becoming available, businesses were able to reopen, but mask and social distancing measures slowed the pace of an economic rebound. We continue to monitor the impact of the new variants of COVID-19 which has prompted many health officials and municipalities to reinstate mask mandates and reconsider lifting pandemic restrictions. If the COVID-19 pandemic again worsens it could limit or disrupt our ability to provide banking and financial services to our customers.
A number of our employees currently are working remotely to enable us to continue to provide banking services to our customers. Heightened cybersecurity, information security and operational risks may result from these remote work-from-home arrangements. We also could be adversely affected if key personnel or a significant number of employees were to become unavailable due to the effects and restrictions of the continued pandemic impacted by the new variants. We rely upon our third-party vendors to help us conduct aspects of our business and to process, record and monitor transactions. If any of these vendors are unable to continue to provide us with their services, it could also negatively impact our ability to serve our customers. Although we have business continuity plans and other safeguards in place, there is no assurance that such plans and safeguards will be effective.
There is a pervasive uncertainty surrounding the future economic conditions that will emerge in the months and years following the start of the pandemic. As a result, management is confronted with a significant and unfamiliar degree of uncertainty in estimating the impact of the pandemic on credit quality, revenues and asset values. To date, the COVID-19 pandemic has resulted in changes in the demand for certain loan types, including government sponsored programs such as the Paycheck Protection Program ("PPP") through May 2021, deposit availability, market interest rates and negatively impacted many of our business and consumer borrower’s ability to make their loan payments. Because the length of the pandemic and the efficacy of the extraordinary measures being put in place to address its economic consequences are unknown, including a
continued low targeted federal funds rate, until the pandemic subsides, we expect our net interest income and net interest margin will be adversely affected. Many of our borrowers have become unemployed or may face unemployment, and certain businesses are at risk of insolvency as their revenues decline precipitously, especially in businesses related to travel, hospitality, leisure and physical personal services. Businesses may ultimately not reopen as there is a significant level of uncertainty regarding the level of economic activity that will return to our markets over time, the impact of governmental assistance, the speed of economic recovery, the resurgence of COVID-19 in subsequent seasons and changes to demographic and social norms that will take place.
The impact of the pandemic may continue to adversely affect us during our 2022 fiscal year and possibly longer, as loan demand, market interest rates, and the ability of some customers to make timely loan payments has been significantly affected. Although the Company makes estimates of loan losses related to the pandemic as part of its evaluation of the allowance for loan losses, such estimates involve significant judgment and are made in the context of continued uncertainty as to the impact the pandemic will have on the credit quality of our loan portfolio. Consistent with guidance provided by banking regulators, we have modified loans by providing various loan payment deferral options to our borrowers affected by the COVID-19 pandemic. Notwithstanding these modifications, these borrowers may not be able to resume making full payments on their loans as the COVID-19 pandemic subsides. Any increases in the allowance for credit losses will result in a decrease in net income, and, most likely, capital, and may have a material negative effect on our financial condition and results of operations.
The SBA PPP loans made by the Bank are guaranteed by the SBA and, if used by the borrower for authorized purposes, may be fully forgiven. However, in the event of a loss resulting from a default on a SBA PPP loan and a determination by the SBA that there was a deficiency in the manner in which the PPP loan was originated, funded or serviced by the Bank, the SBA may deny its liability under the guaranty, reduce the amount of the guaranty, or, if it has already made payment under the guaranty, seek recovery of any loss related to the deficiency from the Bank. As of September 30, 2021, we hold and service SBA PPP loans with an aggregate balance of $40.92 million.
In accordance with GAAP, we record assets acquired and liabilities assumed at their fair value with the excess of the purchase consideration over the net assets acquired resulting in the recognition of goodwill. If adverse economic conditions or our stock price and market capitalization decreases as a result of the pandemic were to be deemed sustained rather than temporary, it may significantly affect the fair value of our goodwill and may trigger impairment charges. Any impairment charge could have a material adverse effect on our financial condition and results of operations.
We are an entity separate and distinct from our principal subsidiary, Timberland Bank, and derive substantially all of our revenue at the holding company level in the form of dividends from that subsidiary. If the COVID-19 pandemic were to materially adversely affect Timberland Bank’s regulatory capital levels or liquidity, it may result in Timberland Bank being unable to pay dividends to us, which may result in our not being able to pay dividends on our common stock at the same rate or at all.
Even after the COVID-19 pandemic subsides, the U.S. economy will likely require some time to recover from its effects, the length of which is unknown. and during which we may experience a recession. As a result, we anticipate that our business may be materially and adversely affected during this recovery. To the extent the effects of the COVID-19 pandemic adversely impact our business, financial condition, liquidity or results of operations, it may also have the effect of heightening many of the other risks described in this section.
Risks Related to Economic Conditions
Our business may be adversely affected by downturns in the national economy and in the economies in our market areas.
Substantially all of our loans are to businesses and individuals in the state of Washington. A decline in the economies of our local market areas of Grays Harbor, Pierce, Thurston, King, Kitsap and Lewis counties in which we operate, and which we consider to be our primary market areas, could have a material adverse effect on our business, financial condition, results of operations and prospects. Weakness in the global economy has adversely affected many businesses operating in our markets that are dependent upon international trade, and it is not known how the recent changes in tariffs being imposed on international trade may also affect these businesses.
While real estate values and unemployment rates have recently improved, a deteriorationDeterioration in economic conditions in the market areas we serve as a result of COVID-19 or other factors could result in the following consequences, any of which could have a materially adverse impact on our business, financial condition and results of operations:
•loan delinquencies, problem assets and foreclosures may increase;
•we may increase our allowance for loan losses;
•the sale of foreclosed assets may slow;
•demand for our products and services may decline possibly resulting in a decrease in our total loans or assets;
•collateral for loans made may decline in value, exposing us to increased risk loans, reducing customers’ borrowing power, and reducing the value of assets and collateral associated with existing loans;
•the net worth and liquidity of loan guarantors may decline, impairing their ability to honor commitments to us; and
•the amount of our low-cost or non-interest bearing deposits may decrease and the composition of our deposits may be adversely affected.
A decline in local economic conditions may have a greater effect on our earnings and capital than on the earnings and capital of larger financial institutions whose real estate loans are geographically diverse. Many of the loans in our portfolio are secured by real estate. Deterioration in the real estate markets where collateral for a mortgage loan is located could negatively affect the borrower's ability to repay the loan and the value of the collateral securing the loan. Real estate values are affected by various other factors, including changes in general or regional economic conditions, government rules or policies and natural disasters such as fires and earthquakes. If we are required to liquidate a significant amount of collateral during a period of reduced real estate values, our financial condition and profitability could be adversely affected.
Risks Related to our Lending Activities
Our real estate construction and land loans expose us to significant risks.
We make real estate construction loans to individuals and builders, primarily for the construction of residential properties. We originate these loans whether or not the collateral property underlying the loan is under contract for sale. At September 30, 2019,2021, construction loans totaled $223.53$233.21 million, or 22.5%21.5% of our total loan portfolio, of which $181.56$179.04 million were for residential real estate projects, $39.57$43.37 million for commercial real estate projects and $2.40$10.80 million for land development projects. This compares to total construction loans of $188.36$219.50 million, or 22.9%19.4% of our total loan portfolio at September 30, 2018,2020, or an increase of 18.7%6.3% during the past year. Approximately $128.85$109.15 million of our residential construction loans at September 30, 20192021 were made to finance the construction of owner-occupied homes and are structured to be converted to permanent loans at the end of the construction phase. In general, construction lending involves additional risks because funds are advanced upon estimates of costs in relation to values associated with the completed project. Construction lending involves additional risks when compared
with permanent residential lending because funds are advanced upon the collateral for the project based on an estimate of costs that will produce a future value at completion. Because of the uncertainties inherent in estimating construction costs, as well as the market value of the complete project and the effects of governmental regulationregulations on real property, it is relatively difficult to evaluate accurately the total funds required to complete a project and the completed project loan-to-value ratio. Changes in demand for new housing and higher than anticipated building costs may cause actual results to vary significantly from those estimated. For these reasons, this type of lending also typically involves higher loan principal amounts and may be concentrated with a small number of builders. A downturn in housing, or the real estate market, could increase delinquencies, defaults and foreclosures, and significantly impair the value of our collateral and our ability to sell the collateral upon foreclosure. Some of the builders we deal withwho are our customers have more than one loan outstanding with us. Consequently, an adverse development with respect to one loan or one credit relationship can expose us to a significantly greater risk of loss. In addition, during the term of some of our construction loans, no payment from the borrower is required since the accumulated interest is added to the principal of the loan through an interest reserve. As a result, these loans often involve the disbursement of funds with repayment substantially dependent on the success of the ultimate project and the ability of the borrower to sell or lease the property or obtain permanent take-out financing, rather than the ability of the borrower or guarantor to repay principal and interest. If our appraisal of the value of a completed project proves to be overstated, we may have inadequate security for the repayment of the loan upon completion of construction of the project and may incur a loss. Because construction loans require active monitoring of the building process, including cost comparisons and on-site inspections, these loans are more difficult and costly to monitor. Increases in market rates of interest may have a more pronounced effect on construction loans by rapidly increasing the end-purchaser's borrowing costs, thereby possibly reducing the homeowner's ability to finance the home upon completion or the overall demand for the project. Properties under construction are often difficult to sell and typically must be completed in order to be successfully sold which also complicates the process of working our problem construction loans. This may require us to advance additional funds and/or contract with another builder to complete construction and assume the market risk of selling the project at a future market price, which may or may not enable us to fully recover unpaid loan funds and associated construction and liquidation costs. Furthermore, in the case of speculative construction loans, there is the added risk associated with identifying an end-purchaser for the finished project. At September 30, 2019, $16.452021, $17.81 million of our construction portfolio was comprised of speculative one- to four-family construction loans. We also make land loans for the acquisition of land upon which the purchaser can then build or make improvements necessary to build or to use for recreational purposes. At September 30, 2019,2021, land loans totaled $30.77$19.94 million, or 3.1%1.8% of our total loan portfolio. Loans on land under development or held for future construction as well as land loans made to individuals for the future construction of a residence also pose additional risk because the length of time from financing to completion of a development project is significantly longer than for a traditional construction loan, whichloan. This makes
them more susceptible to declines in real estate values, declines in overall economic conditions which may delay the development of the land and changes in the political landscape that could affect the permitted and intended use of the land being financed, and the potential illiquid nature of the collateral. In addition, during this long period of time from financing to completion, the collateral often does not generate any cash flow to support the debt service. At September 30, 2019,2021, all construction loans were performing in accordance to their terms and $204,000$683,000 of land loans were non-performing. A material increase in our non-performing construction or land loans could have a material adverse effect on our financial condition and results of operation.
Our emphasis on commercial real estate lending may expose us to increased lending risks.
Our current business strategy includes an emphasis on commercial real estate lending. This type of lending activity, while potentially more profitable than single-family residential lending, is generally more sensitive to regional and local economic conditions, making loss levels more difficult to predict. Collateral evaluation and financial statement analysis in these types of loans requires a more detailed analysis at the time of loan underwriting and on an ongoing basis. In our primary market of western Washington, a downturn in the real estate market could increase loan delinquencies, defaults and foreclosures, and significantly impair the value of our collateral and our ability to sell the collateral upon foreclosure. Many of our commercial borrowers have more than one loan outstanding with us. Consequently, an adverse development with respect to one loan or one credit relationship can expose us to a significantly greater risk of loss.
At September 30, 2019,2021, we had $419.12$470.65 million of commercial real estate mortgage loans, representing 42.3%43.5% of our total loan portfolio. These loans typically involve higher principal amounts than other types of loans, and repayment is dependent upon income generated, or expected to be generated, by the property securing the loan in amounts sufficient to cover operating expenses and debt service, which may be adversely affected by changes in the economy or local market conditions. For example, if the cash flow from the borrower’s project is reduced as a result of leases not being obtained or renewed, the borrower’s ability to repay the loan may be impaired. Commercial real estate loans also expose a lender to greater credit risk than loans secured by residential real estate, because the collateral securing these loans typically cannot be sold as easily as residential real estate. In addition, many of our commercial real estate loans are not fully amortizing and contain large balloon payments upon maturity. Such balloon payments may require the borrower to either sell or refinance the underlying property in order to make the payment, which may increase the risk of default or non-payment.
A secondary market for most types of commercial real estate loans is not readily liquid, so we have less opportunity to mitigate credit risk by selling part or all of our interest in these loans. As a result of these characteristics, if we foreclose on a commercial real estate loan, our holding period for the collateral typically is longer than for one- to four-family residential mortgage loans because there are fewer potential purchasers of the collateral. Accordingly, charge-offs on commercial real estate loans may be larger as a percentage of the total principal outstanding than those incurred with our residential or consumer loan portfolios.
The level of our commercial real estate loan portfolio may subject us to additional regulatory scrutiny.
The FDIC, the Federal Reserve and the Office of the Comptroller of the Currency have promulgated joint guidance on sound risk management practices for financial institutions with concentrations in commercial real estate lending. Under this guidance, a financial institution that, like us, is actively involved in commercial real estate lending should perform a risk assessment to identify concentrations. A financial institution may have a concentration in commercial real estate lending if, among other factors (i) total reported loans for construction, land development and other land represent 100% or more of total capital, or (ii) total reported loans secured by multi-family and non-farm non-residential properties, loans for construction, land development and other land, and loans otherwise sensitive to the general commercial real estate market, including loans to commercial real estate related entities, represent 300% or more of total capital. The particular focus of the guidance is on exposure to commercial real estate loans that are dependent on the cash flow from the real estate held as collateral and that are likely to be at greater risk to conditions in the commercial real estate market (as opposed to real estate collateral held as a secondary source of repayment or as an abundance of caution). The purpose of the guidance is to guide banks in developing risk management practices and capital levels commensurate with the level and nature of real estate concentrations. The guidance states that management should employ heightened risk management practices including board and management oversight and strategic planning, development of underwriting standards, risk assessment and monitoring through market analysis and stress testing. We have concluded that we have a concentration in commercial real estate lending under the foregoing standards because our balance in commercial real estate loans (including owner-occupied loans) at September 30, 20192021 represents more than 300% of total capital. While we believe we have implemented policies and procedures with respect to our commercial real estate loan portfolio consistent with this guidance, bank regulators could require us to implement additional policies and procedures consistent with their interpretation of the guidance that may result in additional costs to us.
Repayment of our commercial business loans is often dependent on the cash flows of the borrower, which may be unpredictable, and the collateral securing these loans may fluctuate in value.
At September 30, 2019,2021, we had $64.76$74.58 million, or 6.5%6.9%, of total loans in commercial business loans.loans (excluding SBA PPP loans). Commercial business lending involves risks that are different from those associated with residential and commercial real estate lending. Real estate lending is generally considered to be collateral based lending with loan amounts based on predetermined loan to collateral values and liquidation of the underlying real estate collateral being viewed as the primary source of repayment in the event of borrower default. Our commercial business loans are primarily made based on the cash flow of the borrower and secondarily on the underlying collateral provided by the borrower. The borrowers' cash flow may be unpredictable, and collateral securing these loans may fluctuate in value. Although commercial business loans are often collateralized by equipment, inventory, accounts receivable, or other business assets, the liquidation of collateral in the event of default is often an insufficient source of repayment because accounts receivable may be uncollectible and inventories may be obsolete or of limited use, among other things. Accordingly, the repayment of commercial business loans depends primarily on the cash flow and credit worthiness of the borrower and secondarily on the underlying collateral provided by the borrower.
Our business may be adversely affected by credit risk associated with residential property.
At September 30, 2019, $172.852021, $152.92 million, or 17.4%14.1%, of our total loan portfolio was secured by one- to four-family mortgage loans and home equity loans. This type of lending is generally sensitive to regional and local economic conditions that significantly impact the ability of borrowers to meet their loan payment obligations, making loss levels difficult to predict. Recessionary conditions or declines in the volume of single-family real estate and/or the sales prices as well as elevated unemployment rates may result in higher than expected loan delinquencies or problem assets, and a decline in demand for our products and services. These potential negative events may cause us to incur losses, adversely affect our capital and liquidity and damage our financial condition and business operations. Further, the Tax Act enacted in December 2017 could negatively impact our customers because it lowers the existing caps on mortgage interest deductions and limits the state and local tax deductions. These changes could make it more difficult for borrowers to make their loan payments, and could also negatively impact the housing market, which could adversely affect our business and loan growth. Aa decline in residential real estate values resulting from a downturn in the Washington housing market may reduce the value of the real estate collateral securing these types of loans and increase our risk of loss if borrowers default on their loans.
Many of our residential mortgage loans are secured by liens on mortgage properties in which the borrowers have little or no equity because either we originated the loan with a relatively high combined loan-to-value ratio or because of the decline in home values in our market areas subsequent to when the loans were originated. Residential loans with combined higher loan-to-value ratios will be more sensitive to declining property values than those with lower combined loan-to-value ratios and therefore may experience a higher incidence of default and severity of losses. In addition, if the borrowers sell their homes, such borrowers may be unable to repay their loans in full from the sale proceeds. Further, a significant amount of our home equity lines of credit consist of second mortgage loans. For those home equity lines secured by a second mortgage, it is unlikely that we will be successful in recovering all or a portion of our loan proceeds in the event of default unless we are prepared to repay the first mortgage loan and such repayment and the costs associated with a foreclosure are justified by the value of the property. For these reasons, we may experience higher rates of delinquencies, default and losses on our residential loans.
Our allowance for loan losses may prove to be insufficient to absorb losses in our loan portfolio.
Lending money is a substantial part of our business, and each loan carries a certain risk that it will not be repaid in accordance with its terms or that any underlying collateral will not be sufficient to assure repayment. This risk is affected by, among other things:
•the cash flow of the borrower and/or the project being financed;
•the changes and uncertainties as to the future value of the collateral, in the case of a collateralized loan;
•the duration of the loan;
•the credit history of a particular borrower; and
•changes in economic and industry conditions.
We maintain an allowance for loan losses, which is a reserve established through a provision for loan losses charged against operating income, which we believe is appropriate to provide for probable losses in our loan portfolio. The amount of this allowance is determined by our management through periodic comprehensive reviews and consideration of several factors, including, but not limited to:
•an ongoing review of the quality, size and diversity of the loan portfolio;
•evaluation of non-performing loans;
•historical default and loss experience;
•existing economic conditions and management's expectations of future events;
•risk characteristics of the various classifications of loans;
•the amount and quality of collateral, including guarantees, securing the loans; and
•regulatory requirements and expectations.
The determination of the appropriate level of the allowance for loan losses inherently involves a high degree of subjectivity and requires us to make various assumptions and judgments about the collectability of our loan portfolio, including the creditworthiness of our borrowers and the value of the real estate and other assets serving as collateral for the repayment of many of our loans. In determining the amount of the allowance for loan losses, we review our loans and the loss experience and evaluate economic conditions and make significant estimates of current credit risks and future trends, all of which may undergo material changes. If our estimates are incorrect, the allowance for loan losses may not be sufficient to cover losses inherent in our loan portfolio, resulting in the need for increases in our allowance for loan losses through the provision for losses on loans which is charged against income. Management also recognizes that significant new growth in loan portfolios, new loan products and the refinancing of existing loans can result in portfolios comprised of unseasoned loans that may not perform in a historical or projected manner and will increase the risk that our allowance may be insufficient to absorb losses without significant additional provisions. Further, the Financial Accounting Standards BoardFASB has adopted a new accounting standard that will be effective for our fiscal year beginning October 1, 2023. This standard, referred to as Current Expected Credit Loss ("CECL") will require financial institutions to determine periodic estimates of lifetime expected credit losses on loans, and recognize the expected credit losses as allowances for credit losses. This will change the current method of providing allowances for credit losses that are probable. We anticipate that our allowance for loan losses will increase as a result of the implementation of CECL,CECL; however, until our evaluation is complete, the magnitude of the increase will be unknown.
Deterioration in economic conditions affecting borrowers, new information regarding existing loans, identification of additional problem loans and other factors, both within and outside of our control, may also require an increase in the allowance for loan losses. In addition, bank regulatory agencies periodically review our allowance for loan losses and may require an increase in the provision for possible loan losses or the recognition of further loan charge-offs, based on judgments different from those of management. If charge-offs in future periods exceed the allowance for loan losses, we will need additional provisions to replenish
the allowance for loan losses. Any additional provisions will result in a decrease in net income and possibly capital, and may have a material adverse effect on our financial condition and results of operations.
If our non-performing assets increase, our earnings will be adversely affected.
At September 30, 20192021, our non-performing assets (which consist of non-accruing loans, accruing loans 90 days or more past due, non-accrual investment securities, and OREO and other repossessed assets) were $5.01$3.17 million, or 0.40%0.18% of total assets. Our non-performing assets adversely affect our net income in various ways:
•We do not record interest income on non-accrual loans or non-performing investment securities, except on a cash basis when the collectibility of the principal is not in doubt.
•We must provide for probable loan losses through a current period charge to the provision for loan losses.
•Non-interest expense increases when we must write down the value of properties in our OREO portfolio to reflect changing market values.
•Non-interest income decreases when we must recognize other-than-temporary impairment on non-performing investment securities.
•There are legal fees associated with the resolution of problem assets, as well as carrying costs, such as taxes, insurance, and maintenance costs related to our OREO.
•The resolution of non-performing assets requires the active involvement of management, which can distract them from more profitable activity.activities.
If additional borrowers become delinquent and do not pay their loans and we are unable to successfully manage our non-performing assets, our losses and troubled assets could increase significantly, which could have a material adverse effect on our financial condition and results of operations. In addition to the non-performing loans, there were $2.90$2.37 million in loans classified as performing troubled debt restructurings at September 30, 2019.2021.
Risk Related to our Business Strategy
We may be adversely affected by risks associated with completed and potential acquisitions.
As part of our general growth strategy, on October 1, 2018, we completed the acquisition of South Sound Bank, a Washington-state chartered bank, headquartered in Olympia, Washington. Although our business strategy emphasizes organic expansion, we continue, from time to time in the ordinary course of business, to engage in preliminary discussions with potential acquisition targets. There can be no assurance that, in the future, we will successfully identify suitable acquisition candidates, complete acquisitions and successfully integrate acquired operations into our existing operations or expand into new markets.
The consummation of any future acquisitions may dilute shareholder value or may have an adverse effect upon our operating results while the operations of the acquired business are being integrated into our operations. In addition, once integrated, acquired operations may not achieve levels of profitability comparable to those achieved by our existing operations, or otherwise perform as expected. Further, transaction-related expenses may adversely affect our earnings. These adverse effects on our earnings and results of operations may have a negative impact on the value of our common stock. Acquiring banks, bank branches or businesses involves risks commonly associated with acquisitions, including:
•We may be exposed to potential asset quality issues or unknown or contingent liabilities of the banks, businesses, assets, and liabilities we acquire. If these issues or liabilities exceed our estimates, our results of operations and financial condition may be materially negatively affected;
Higher•We could experience higher than expected deposit attrition;
•The acquisition of other entities generally requires integration of systems, procedures and personnel of the acquired entity into our company to make the transaction economically successful. This integration process is complicated and time consuming and can also be disruptive to the customers of the acquired business. If the integration process is not conducted successfully and with minimal adverse effect on the acquired business and its customers, we may not be able to realize the anticipated economic benefits of particular acquisitions within the expected time frame, and we may lose customers or employees of the acquired business. We may also experience greater than anticipated customer losses even if the integration process is successful;
•To the extent that our costs of an acquisition exceed the fair value of the net assets acquired, the acquisition will generate goodwill. As discussed below, we are required to assess our goodwill for impairment at least annually, and any goodwill impairment charge could have a material adverse effect on our results of operation and financial condition;
•We expect that our net income will increase following an acquisition; however, we also expect our general and administrative expenses to increase, which could result to an increase in our efficiency ratio. Ultimately, we would expect our efficiency ratio to improve; however, if we are not successful in our integration process, this may not occur, and our acquisition or branching activities may not be accretive to earnings in the short or long-term.
Risk Related to Market Interest Rates
The required accounting treatment of loans we acquire through acquisitions including purchase credit impaired loans could
Changes in interest rates may reduce our net interest income and may result in higher net interest marginsdefaults in a rising rate environment.
Our earnings and interest income in current periods and lower net interest margins and interest income in future periods.
Under GAAP, wecash flows are required to record loans acquired through acquisitions, including purchase credit impaired loans, at fair value. Estimating the fair value of such loans requires management to make estimates based on available information and facts and circumstances on the acquisition date. Actual performance could differ from management’s initial estimates. If these loans outperformlargely dependent upon our original fair value estimates, the difference between our original estimate and the actual performance of the loan (the “discount”) is accreted into net interest income. Thus,Interest rates are highly sensitive to many factors that are beyond our net interest margins may initially increase duecontrol, including general economic conditions and policies of various governmental and regulatory agencies and, in particular, the Federal Reserve Board. In response to the discount accretion. We expectCOVID-19 pandemic, the yieldsFederal Reserve decreased the target federal funds rate by 150 basis points to a range of 0.00% to 0.25%. If the Federal Reserve Board increases the Fed Funds rate, overall interest rates will likely rise, which may negatively impact both the housing markets by reducing refinancing activity and new home purchases and the U.S. economy. In addition, inflationary pressures will increase our operational costs and could have a significant negative effect on our borrowers, especially our business borrowers.
We principally manage interest rate risk by managing our volume and mix of our earning assets and funding liabilities. Changes in monetary policy, including changes in interest rates, could influence not only the interest we receive on loans to decline as our acquired loan portfolio pays down or maturesand investments and the discount decreases,amount of interest we pay on deposits and we expect downward pressure onborrowings, but these changes could also affect: (1) our interest incomeability to the extent that the runoff on our acquired loan portfolio is not replaced with comparable high-yielding loans. This could result in higher net interest marginsoriginate and/or sell loans and interest income in current periods and lower net interest margins and lower interest income in future periods.
If our investments in real estate are not properly valued or sufficiently reserved to cover actual losses, or if we are required to increase our valuation allowances, our earnings could be reduced.
We obtain updated valuations in the form of appraisals and broker price opinions when a loan has been foreclosed and the property is taken in as OREO, and at certain other times during the asset's holding period. Our net book value (“NBV”) in the loan at the time of foreclosure and thereafter is compared to the updated estimated market value of the foreclosed property less estimated selling costs (fair value). A charge-off is recorded for any excess in the asset’s NBV over its fair value. If our valuation process is incorrect or if the property declines in value after foreclosure,deposits; (2) the fair value of our OREOfinancial assets and liabilities, which could negatively impact shareholders’ equity, and our ability to realize gains from the sale of such assets; (3) our ability to obtain and retain deposits in competition with other available investment alternatives; (4) the ability of our borrowers to repay adjustable or variable rate loans; and (5) the average duration of our investment securities portfolio and other interest-earning assets. If the interest rates paid on deposits and borrowings increase at a faster rate than the interest received on loans and other investments, our net interest income, and therefore earnings, could be adversely affected. Earnings could also be adversely affected if the interest rates received on loans and other investments decline more rapidly than the interest rates paid on deposits and other borrowings. In a changing interest rate environment, we may not be sufficientable to recovermanage this risk effectively. If we are unable to manage interest rate risk effectively, our NBVbusiness, financial condition and results of operations could be materially affected.
Changes in suchinterest rates could also have a negative impact on our results of operations by reducing the ability of borrowers to repay their current loan obligations or by reducing our margins and profitability. Our net interest margin is the difference between the yield we earn on our assets resultingand the interest rate we pay for deposits and our other sources of funding. Changes in interest rates (up or down) could adversely affect our net interest margin and, as a result, our net interest income. Although the yield we earn on our assets and our funding costs tends to move in the need forsame direction in response to changes in interest rates, one can rise or fall faster than the other, causing our net interest margin to expand or contract. Changes in the slope of the "yield curve," or the spread between short-term and long-term interest rates, could also reduce our net interest margin. Normally the yield curve is upward sloping, meaning short-term rates are lower than long-term rates. Because our
liabilities tend to be shorter in duration than our assets, when the yield curve flattens or even inverts, we could experience pressure on our net interest margin as our cost of funds increases relative to the yield we can earn on our assets. Also, interest rate decreases can lead to increased prepayments of loans and mortgage-backed securities as borrowers refinance their loans to reduce borrowing costs. Under these circumstances we are subject to reinvestment risk as we may have to redeploy such repayment proceeds into lower yielding investments, which would likely negatively impact our income.
A sustained increase or decrease in market interest rates could adversely affect our earnings. As is the case with many financial institutions, our emphasis on increasing the development of core deposits, those deposits bearing no or a valuation allowance.
relatively low rate of interest with no stated maturity, has resulted in our having a significant amount of these deposits bearing a relatively low rate of interest and having a shorter duration than our assets. At September 30, 2021, we had $81.42 million in certificates of deposit that mature within one year and $1.44 billion in non-interest bearing, NOW checking, savings and money market accounts. We would incur a higher cost of funds to retain these deposits in a rising interest rate environment. If the interest rates paid on deposits and other borrowings increase at a faster rate than the interest rates received on loans and other investments, our net interest income, and therefore earnings, could be adversely affected. In addition, bank regulators periodically reviewa substantial amount of our OREOresidential mortgage loans and home equity lines of credit have adjustable interest rates. As a result, these loans may require us to recognize further valuation allowances. Significant charge-offs toexperience a higher rate of default in a rising interest rate environment.
Changes in interest rates also affect the value of our OREO mayinterest-earning assets and in particular our investment securities portfolio. Generally, the fair value of fixed-rate securities fluctuates inversely with changes in interest rates. Unrealized gains and losses on investment securities available for sale are reported as a separate component of equity, net of tax. Decreases in the fair value of investment securities available for sale resulting from increases in interest rates could have an adverse effect on stockholders' equity.
Any substantial, unexpected or prolonged change in market interest rates could have a material adverse effect on our financial condition, liquidity and results of operations.
Uncertainty relating to Also, our interest rate risk modeling techniques and assumptions likely may not fully predict or capture the London Interbank Offered Rate ("LIBOR") calculation process and potential phasing outimpact of LIBOR may adversely affectactual interest rate changes on our resultsbalance sheet or projected operating results. For further discussion of operations.
On July 27, 2017, the Chief Executive of the United Kingdom Financial Conduct Authority, which regulates LIBOR, announced that it intends to stop persuading or compelling banks to submit rates for the calibration of LIBOR to the administrator of LIBOR after 2021. The announcement indicates that the continuation of LIBOR on the current basis cannot and will not be guaranteed after 2021. It is impossible to predict whether and to what extent banks will continue to provide LIBOR submissions to the administrator of LIBOR or whether any additional reforms to LIBOR may be enactedhow changes in the United Kingdom or elsewhere. At this time, no consensus exists as to what rate or rates may become acceptable alternatives to LIBOR and it is impossible to predict the effect of any such alternatives on the value of LIBOR-based securities and variable rate loans, or other securities or financial arrangements, given LIBOR's role in determining market interest rates globally. The Federal Reserve Board, in conjunction with the Alternative Reference Rates Committee, a steering committee comprised of large U.S. financial institutions, is considering replacing the U.S. dollar LIBOR with a new index calculated by short-term repurchase agreements, backed by Treasury securities ("SOFR"). SOFR is observedcould impact us, see "Part II, Item 7A. Quantitative and backward looking, which stands in contrast with LIBOR under the current methodology, which is an estimated forward-lookingQualitative Disclosures About Market Risk" for additional information about our interest rate and relies, to some degree, on the expert judgment of submitting panel members. Given that SOFR is a secured rate backed by government securities, it will be a rate that does not take into account bank credit risk (as is the case with LIBOR). SOFR is therefore likely to be lower than LIBOR and is less likely to correlate with the funding costs of financial institutions. Whether or not SOFR attains traction as a LIBOR replacement tool remains in question, although some transactions using SOFR have been completed in 2019, and the future of LIBOR remains uncertain as this time. Uncertainty as to the nature of alternative reference rates and as to potential changes or other reforms to LIBOR may adversely affect LIBOR rates and the value of LIBOR-based loans, and securities in our portfolio. If LIBOR rates are no longer available, and we are required to implement substitute indices for the calculation of interest rates under our loan agreements with our borrowers, we may experience significant expenses in effecting the transition, and may be subject to disputes or litigation with customers and creditors over the appropriateness or comparability to LIBOR of the substitute indices, which could have an adverse effect on our results of operations.management.
Our investment securities portfolio may be negatively impacted by fluctuations in market value and interest rates and result in losses.
Our investment securities portfolio may be impacted by fluctuations in market value, potentially reducing accumulated other comprehensive income (loss) and/or earnings. Fluctuations in market value may be caused by changes in market interest
rates, lower market prices for investment securities and limited investor demand. Our held to maturity and available for sale investment securities are evaluated for other-than-temporary-impairment ("OTTI"). If this evaluation shows impairment to the actual or projected cash flows associated with one or more investment securities, a potential loss to earnings may occur. Changes in interest rates can also have an adverse effect on our financial condition, as our available-for-sale investment securities are reported at their estimated fair value, and therefore are impacted by fluctuations in interest rates. We increaseShareholders' equity is increased or decrease our shareholders' equitydecreased by the amount of change in the estimated fair value of the available-for-sale investment securities, net of income taxes. There can be no assurance that the declines in market value, including as a result of the COVID-19 pandemic, will not result in OTTI of these assets, which would lead to accounting charges that could have a material adverse effect on our net income and capital levels.
During the yearyears ended September 30, 2021, 2020 and 2019, we recognized a $20,000, $120,000 and $59,000 recovery of OTTI charges on private label mortgage backedmortgage-backed securities we hold for investment. During the year ended September 30, 2018, we recognized a $68,000 recovery of OTTI charges on private label mortgage backed securities we hold for investment. During the year ended September 30, 2017, we recognized a $33,000 recovery of OTTI charges on private label mortgage backed securities we hold for investment.investment, respectively. At September 30, 2019,2021, our remaining private label mortgage backedmortgage-backed securities portfolio totaled $317,000$13.93 million of which $294,000$159,000 was on non-accrual status.
The valuation of our investment securities also is influenced by additional external market and other factors, including implementation of SecuritiesSEC and Exchange Commission and Financial Accounting Standards BoardFASB guidance on fair value accounting, default rates on residential mortgage securities and rating agency actions. Accordingly, there can be no assurance that future declines in the market value of our private label mortgage backedmortgage-backed securities or other investment securities will not result in additional OTTI of these assets and lead to accounting charges that could have an adverse effect on our results of operations.
An increase in interest rates, change in the programs offered by Freddie Mac or our ability to qualify for their programs may reduce our mortgage revenues, which would negatively impact our non-interest income.
The sale of residential mortgage loans to Freddie Mac provides a significant portion of our non-interest income. Any future changes in their program, our eligibility to participate in such program, the criteria for loans to be accepted or laws that
significantly affect the activity of Freddie Mac could, in turn, materially adversely affect our results of operations if we could not find other purchasers. Mortgage banking is generally considered a volatile source of income because it depends largely on the level of loan volume which, in turn, depends largely on prevailing market interest rates. In a rising or higher interest rate environment, the demand for mortgage loans, particularly refinancing of existing mortgage loans, tends to fall and our originations of mortgage loans may decrease, resulting in fewer loans that are available to be sold. This would result in a decrease in mortgage revenues and a corresponding decrease in non-interest income. In addition, our results of operations are affected by the amount of non-interest expense associated with our loan sale activities, such as salaries and employee benefits, occupancy, equipment and data processing expense and other operating costs. During periods of reduced loan demand, our results of operations may be adversely affected to the extent that we are unable to reduce expenses commensurate with the decline in loan originations. In addition, although we sell loans to Freddie Mac or into the secondary market without recourse, we are required to give customary representations and warranties about the loans we sell. If we breach those representations and warranties, we may be required to repurchase the loans and we may incur a loss on the repurchase.
Fluctuating interest rates can adversely affect our profitabilityRisks Related to Laws and Regulations
Our earnings and cash flows are largely dependent upon our net interest income. Interest rates are highly sensitive to many factors that are beyond our control, including general economic conditions and policies of various governmental and regulatory agencies and, in particular, the Federal Reserve Board. In an attempt to help the overall economy, the Federal Reserve Board kept interest rates low through its targeted Fed Funds rate for a number of years, however, the Federal Reserve Board had steadily increased the federal funds target rate in 2018 and 2017. Beginning in August 2019 the Federal Reserve Board has reduced the federal funds target rate 25 basis points three times to a current range of 1.50% to 1.75% in response to some recent weaknesses in economic data and indicated possible further decreases subject to economic conditions. If the Federal Reserve Board increases the Fed Funds rate, overall interest rates will likely rise, which may negatively impact both the housing markets by reducing refinancing activity and new home purchases and the U.S. economy. In addition, deflationary pressures, while possibly lowering our operational costs, could have a significant negative effect on our borrowers, especially our business borrowers, and the values of collateral securing loans which could negatively affect our financial performance.
We principally manage interest rate risk by managing our volume and mix of our earning assets and funding liabilities. Changes in monetary policy, including changes in interest rates, could influence not only the interest we receive on loans and investments and the amount of interest we pay on deposits and borrowings, but these changes could also affect: (1) our ability to originate and/or sell loans and obtain deposits; (2) the fair value of our financial assets and liabilities, which could negatively impact shareholders’ equity, and our ability to realize gains from the sale of such assets; (3) our ability to obtain and retain deposits
in competition with other available investment alternatives; (4) the ability of our borrowers to repay adjustable or variable rate loans; and (5) the average duration of our investment securities portfolio and other interest-earning assets. If the interest rates paid on deposits and borrowings increase at a faster rate than the interest received on loans and other investments, our net interest income, and therefore earnings, could be adversely affected. Earnings could also be adversely affected if the interest rates received on loans and other investments decline more rapidly than the interest rates paid on deposits and other borrowings. In a changing interest rate environment, we may not be able to manage this risk effectively. If we are unable to manage interest rate risk effectively, our business, financial condition and results of operations could be materially affected.
Changes in interest rates could also have a negative impact on our results of operations by reducing the ability of borrowers to repay their current loan obligations or by reducing our margins and profitability. Our net interest margin is the difference between the yield we earn on our assets and the interest rate we pay for deposits and our other sources of funding. Changes in interest rates (up or down) could adversely affect our net interest margin and, as a result, our net interest income. Although the yield we earn on our assets and our funding costs tends to move in the same direction in response to changes in interest rates, one can rise or fall faster than the other, causing our net interest margin to expand or contract. Changes in the slope of the "yield curve", or the spread between short-term and long-term interest rates, could also reduce our net interest margin. Normally the yield curve is upward sloping, meaning short-term rates are lower than long-term rates. Because our liabilities tend to be shorter in duration than our assets, when the yield curve flattens or even inverts, we could experience pressure on our net interest margin as our cost of funds increases relative to the yield we can earn on our assets. Also, interest rate decreases can lead to increased prepayments of loans and mortgage-backed securities as borrowers refinance their loans to reduce borrowing costs. Under these circumstances we are subject to reinvestment risk as we may have to redeploy such repayment proceeds into lower yielding investments, which would likely negatively impact our income.
A sustained increase or decrease in market interest rates could adversely affect our earnings. As a result of the exceptionally low interest rate environment, an increasing percentage of our deposits have been comprised of deposits bearing no or a relatively low rate of interest and having a shorter duration than our assets. At September 30, 2019, we had $92.27 million in certificates of deposit that mature within one year and $902.57 million in non-interest bearing, NOW checking, savings and money market accounts. We would incur a higher cost of funds to retain these deposits in a rising interest rate environment. If the interest rates paid on deposits and other borrowings increase at a faster rate than the interest rates received on loans and other investments, our net interest income, and therefore earnings, could be adversely affected. In addition, a substantial amount of our residential mortgage loans and home equity lines of credit have adjustable interest rates. As a result, these loans may experience a higher rate of default in a rising interest rate environment.
Changes in interest rates also affect the value of our interest-earning assets and in particular our investment securities portfolio. Generally, the fair value of fixed-rate securities fluctuates inversely with changes in interest rates. Unrealized gains and losses on investment securities available for sale are reported as a separate component of equity, net of tax. Decreases in the fair value of investment securities available for sale resulting from increases in interest rates could have an adverse effect on stockholders' equity.
Any substantial, unexpected or prolonged change in market interest rates could have a material adverse effect on our financial condition, liquidity and results of operations. Also, our interest rate risk modeling techniques and assumptions likely may not fully predict or capture the impact of actual interest rate changes on our balance sheet or projected operating results. For further discussion of how changes in interest rates could impact us, see "Part II, Item 7A. Quantitative and Qualitative Disclosures About Market Risk" for additional information about our interest rate risk management.
The financial services market is undergoing rapid technological changes, and if we are unable to stay current with those changes, we may not be able to effectively compete.
The financial services market, including banking services, is undergoing rapid changes with frequent introductions of new technology-driven products and services. Our future success will depend, in part, on our ability to keep pace with the technological changes and to use technology to satisfy and grow customer demand for our products and services and to create additional efficiencies in our operations. We expect that we will need to make substantial investments in our technology and information systems to compete effectively and to stay current with technological changes. Some of our competitors have substantially greater resources to invest in technological improvements and will be able to invest more heavily in developing and adopting new technologies, which may put us at a competitive disadvantage. We may not be able to effectively implement new technology-driven products and services or be successful in marketing these products and services to our customers. As a result, our ability to effectively compete to retain or acquire new business may be impaired, and our business, financial condition or results of operations may be adversely affected.
Liquidity risk could impair our ability to fund operations and jeopardize our financial condition, growth and prospects.
Liquidity is essential to our business. An inability to raise funds through deposits, borrowings, the sale of loans and other sources could have a substantial negative effect on our liquidity. We rely on customer deposits and at times, borrowings from the FHLB, borrowings from the FRB and other borrowings to fund our operations. At September 30, 2019, we had no FHLB borrowings outstanding and a letter of credit with an available balance of $23.00 million and an additional $380.03 million of available borrowing capacity through the FHLB and the FRB. Deposit flows and the prepayment of loans and mortgage-related securities are strongly influenced by such external factors as the direction of interest rates, whether actual or perceived, and the competition for deposits and loans in the markets we serve. Further, changes to the FHLB's underwriting guidelines for wholesale borrowings or lending policies may limit or restrict our ability to borrow, and could therefore have a significant adverse impact on our liquidity. Although we have historically been able to replace maturing deposits and borrowings if desired, we may not be able to replace such funds in the future if, among other things, our financial condition, the financial condition of the FHLB or FRB, or market conditions change. Our access to funding sources in amounts adequate to finance our activities or on terms which are acceptable could be impaired by factors that affect us specifically or the financial services industry or economy in general, such as a disruption in the financial markets or negative views and expectations about the prospects for the financial services industry. Additional factors that could detrimentally impact our access to liquidity sources include a decrease in the level of our business activity as a result of a downturn in the Washington markets where our deposits are concentrated or adverse regulatory action against us.
Our financial flexibility will be severely constrained if we are unable to maintain our access to funding or if adequate financing is not available to accommodate future growth at acceptable interest rates. Although we consider our sources of funds adequate for our liquidity needs, we may seek additional debt in the future to achieve our long-term business objectives. Additional borrowings, if sought, may not be available to us or, if available, may not be available on reasonable terms. If additional financing sources are unavailable, or are not available on reasonable terms, our financial condition, results of operations, growth and future prospects could be materially adversely affected. Finally, if we are required to rely more heavily on more expensive funding sources to support future growth, our income may not increase proportionately to cover our costs.
We operate in a highly regulated environment and may be adversely affected by changes in federal and state laws and regulations that could increase our costs of operations.
The banking industry is extensively regulated. Federal banking regulations are designed primarily to protect the deposit insurance funds and consumers, not to benefit a company's shareholders. These regulations may sometimes impose significant limitations on our operations. Certain significant federal and state banking regulations that affect us are described in this report under the heading "Item 1. Business-How We Are Regulated". These regulations, along with the currently existing tax, accounting, securities, insurance, and monetary laws, regulations, rules, standards, policies, and interpretations control the methods by which financial institutions conduct business, implement strategic initiatives and tax compliance, and govern financial reporting and disclosures. These laws, regulations, rules, standards, policies, and interpretations are constantly evolving and may change significantly over time. Any new regulations or legislation, change in existing regulationregulations or oversight, whether a change in regulatory policy or a change in a regulator's interpretation of a law or regulation, could have a material impact on our operations, increase our costs of regulatory compliance and of doing business and adversely affect our profitability. In this regard, the U.S. Department of the Treasury's Financial Crimes Enforcement Network ("FinCEN"), published guidelines in 2014 for financial institutions servicing marijuana businesses that are legal under state law. These guidelines allow us to work with marijuana-related businesses that are operating in accordance with state laws and regulations, soas long as we comply with required regulatory oversight of their accounts with us. In addition, a marijuana financial services billlegislation is currently pending in Congress that would allow banks and financial institutions to serve marijuana businesses in states where it is legal without any risk of federal prosecution. At September 30, 2019,2021, approximately 2.9%2.1% of our total deposits and a portion of our service charges from deposits are from legal marijuana-related businesses. Any adverse change in this FinCEN guidance, any new regulations or legislation, any change in existing regulations or oversight, whether a change in regulatory policy or a change in a regulator's interpretation of a law or regulation, could have a negative impact on our non-interest income, as well as the cost of our operations, increasing our cost of regulatory compliance and of doing business and/or otherwise affect us, which may materially affect our profitability.
Non-compliance with the USA PATRIOT Act, Bank Secrecy Act, or other laws and regulations could result in fines or sanctions and limit our ability to get regulatory approval of acquisitions.
The USA PATRIOT and Bank Secrecy Acts require financial institutions to develop programs to prevent financial institutions from being used for money laundering and terrorist activities. If such activities are detected, financial institutions are obligated to file suspicious activity reports with FinCEN. These rules require financial institutions to establish procedures for identifying and verifying the identity of customers seeking to open new financial accounts. Failure to comply with these regulations could result in fines or sanctions and limit our ability to get regulatory approval of acquisitions. Recently, several banking institutions
have received large fines for non-compliance with these laws and regulations. While we have developed policies and procedures designed to assist in compliance with these laws and regulations, no assurance can be given that these policies and procedures will be effective in preventing violations of these laws and regulations.
Our growth or future losses may require us to raise additional capital in the future, but that capital may not be available when it is needed or the cost of that capital may be very high.
We are required by federal regulatory authorities Failure to maintain and implement adequate levelsprograms to combat money laundering and terrorist financing could also have serious reputational consequences for us. Any of capital to support our operations. At some point, we may need to raise additional capital to support our growth or replenish future losses. Our ability to raise additional capital, if needed, will depend on conditions in the capital markets at that time, which are outside our control, and on our financial condition and performance. If we are able to raise capital it may not be on terms that are acceptable to us. Accordingly, we cannot make assurances that we will be able to raise additional capital if needed on terms that are acceptable to us, or at all. If we cannot raise additional capital when needed, our ability to further expand our operations could be materially impaired and our financial condition and liquidity could be materially and adversely affected. In addition, any additional capital we obtain may result in the dilution of the interests of existing holders of our common stock. Further, if we are unable to raise additional capital when required by our bank regulators, we may be subject to adverse regulatory action.
We may experience future goodwill impairment, which could reduce our earnings.
We performed our test for goodwill impairment for fiscal year 2019, and the test concluded that recorded goodwill was not impaired. Our test of goodwill for potential impairment is based on a qualitative assessment by management that takes into consideration macroeconomic conditions, industry and market conditions, cost or margin factors, financial performance and share price. Our evaluation of the fair value of goodwill involves a substantial amount of judgment. If our judgment was incorrect, or if events or circumstances change, and an impairment of goodwill was deemed to exist, we would be required to write down our goodwill resulting in a charge against operations, which would adversely affect ourthese results of operations, perhaps materially; however, it would have no impact on our liquidity, operations or regulatory capital. The acquisition of South Sound Bank on October 1, 2018 substantially increased our goodwill.
We may experience decreases in the fair value of our servicing rights, which could reduce our earnings.
Servicing rights are capitalized at estimated fair value when acquired through the origination of loans that are subsequently sold with servicing rights retained. At September 30, 2019, our servicing rights totaled $2.41 million. Servicing rights are amortized to servicing income on loans sold over the period of estimated net servicing income. The estimated fair value of servicing rights at the date of the sale of loans is determined based on the discounted present value of expected future cash flows using key assumptions for servicing income and costs and prepayment rates on the underlying loans. On a quarterly basis, we evaluate the fair value of servicing rights for impairment by comparing actual cash flows and estimated cash flows from the servicing assets to those estimated at the time servicing assets were originated. Our methodology for estimating the fair value of servicing rights is highly sensitive to changes in assumptions, such as prepayment speeds. The effect of changes in market interest rates on estimated rates of loan prepayments represents the predominant risk characteristic underlying the servicing rights portfolio. For example, a decrease in interest rates typically increases the prepayment speeds of servicing rights and therefore decreases the fair value of the servicing rights. Future decreases in interest rates could decrease the fair value of our servicing rights below their recorded amount, which would decrease our earnings.
Our framework for managing risks may not be effective in mitigating risk and loss to us.
We have established processes and procedures intended to identify, measure, monitor, report, analyze and control the types of risk to which we are subject. These risks include liquidity risk, credit risk, market risk, interest rate risk, operational risk, legal and compliance risk, and reputational risk, among others. We also maintain a compliance program to identify, measure, assess, and report on our adherence to applicable laws, policies and procedures. While we assess and improve these programs on an ongoing basis, there can be no assurance that our risk management or compliance programs, along with other related controls, will effectively mitigate all risk and limit losses in our business. As with any risk management framework, there are inherent limitations to our risk management strategies as there may exist, or develop in the future, risks that we have not appropriately anticipated or identified. If our risk management framework proves ineffective, we could suffer unexpected losses which could have a material adverse effect on our business, financial condition, and results of operations.operations and growth prospects.
Risks Related to Cybersecurity, Third-Parties and Technology
The financial services market is undergoing rapid technological changes, and if we are unable to stay current with those changes, we may not be able to effectively compete.
The financial services market, including banking services, is undergoing rapid changes with frequent introductions of new technology-driven products and services. Our future success will depend, in part, on our ability to keep pace with the technological changes and to use technology to satisfy and grow customer demand for our products and services and to create
additional efficiencies in our operations. We expect that we will need to make substantial investments in our technology and information systems to compete effectively and to stay current with technological changes. Some of our competitors have substantially greater resources to invest in technological improvements and will be able to invest more heavily in developing and adopting new technologies, which may put us at a competitive disadvantage. We may not be able to effectively implement new technology-driven products and services or be successful in marketing these products and services to our customers. As a result, our ability to effectively compete to retain or acquire new business may be impaired, and our business, financial condition or results of operations may be adversely affected.
We are subject to certain risks in connection with our use of technology.
Our security measures may not be sufficient to mitigate the risk of a cyber attack.cyber-attack. Communications and information systems are essential to the conduct of our business, as we use such systems to manage our customer relationships, our general
ledger and virtually all other aspects of our business. Our operations rely on the secure processing, storage, and transmission of confidential and other information in our computer systems and networks. Although we take protective measures and endeavor to modify them as circumstances warrant, the security of our computer systems, software, and networks may be vulnerable to breaches, fraudulent or unauthorized access, denial or degradation of service attacks, misuse, computer viruses, malware or other malicious code and cyber attackscyber-attacks that could have a security impact. If one or more of these events occur, this could jeopardize our or our customers' confidential and other information processed and stored in, and transmitted through, our computer systems and networks, or otherwise cause interruptions or malfunctions in our operations or the operations of our customers or counterparties. We may be required to expend significant additional resources to modify our protective measures or to investigate and remediate vulnerabilities or other exposures, and we may be subject to litigation and financial losses that are either not insured against or not fully covered through any insurance maintained by us. We could also suffer significant reputational damage.
Security breaches in our internet banking activities could further expose us to possible liability and damage our reputation. Increases in criminal activity levels and sophistication, advances in computer capabilities, new discoveries, vulnerabilities in third partythird-party technologies (including browsers and operating systems) or other developments could result in a compromise or breach of the technology, processes and controls that we use to prevent fraudulent transactions and to protect data about us, our clients and underlying transactions. Any compromise of our security could deter customers from using our internet banking services that involve the transmission of confidential information. We rely on standard internet security systems to provide the security and authentication necessary to effect secure transmission of data. Although we have developed and continue to invest in systems and processes that are designed to detect and prevent security breaches and cyber attacks and periodically test our security, these precautions may not protect our systems from compromises or breaches of our security measures, and could result in losses to us or our customers, our loss of business and/or customers, damage to our reputation, the incurrence of additional expenses, disruption to our business, our inability to grow our online services or other businesses, additional regulatory scrutiny or penalties, or our exposure to civil litigation and possible financial liability, any of which could have a material adverse effect on our business, financial condition and results of operation.
Our security measures may not protect us from system failures or interruptions. While we have established policies and procedures to prevent or limit the impact of systems failures and interruptions, there can be no assurance that such events will not occur or that they will be adequately addressed if they do. In addition, we outsource certain aspects of our data processing and other operational functions to certain third-party providers. While the Company selects third-party vendors carefully, it does not control their actions. If our third-party providers encounter difficulties, including those resulting from breakdowns, or other disruptions in communication services provided by a vendor, failure of a vendor to handle current or higher transaction volumes, cyber-attacks and security breaches or if we otherwise have difficulty in communicating with them, our ability to adequately process and account for transactions could be affected, and our ability to deliver products and services to our customers and otherwise conduct business operations could be adversely impacted. Replacing these third-party vendors could also entail significant delay and expense. Threats to information security also exist in the processing of customer information through various other vendors and their personnel.
We cannot assure you that such breaches, failures or interruptions will not occur or, if they do occur, that they will be adequately addressed by us or the third partiesthird-parties on which we rely. We may not be insured against all types of losses as a result of third-party failures and insurance coverage may be inadequate to cover all losses, resulting from breaches, systems failures or other disruptions. If any of our third partythird-party service providers experience financial, operational or technological difficulties, or if there is any other disruption in our relationships with them, we may be required to identify alternative sources of such services, and we cannot assure you that we could negotiate terms that are as favorable to us or could obtain services with similar functionality as found in our existing systems without the need to expend substantial resources, if at all. Further, the occurrence of any systems failure or interruption could damage our reputation and result in a loss of customers and business, could subject us to additional regulatory scrutiny, or could expose us to legal liability. Any of these occurrences could have a material adverse effect on our financial condition and results of operations.
The boardBoard of directorsDirectors oversees the risk management process, including the risk of cybersecurity, and engages with management on cybersecurity issues.
Our business may be adversely affected by an increasing prevalence of fraud and other financial crimes.
As a bank, we are susceptible to fraudulent activity that may be committed against us or our customers which may result in financial losses or increased costs to us or our customers, disclosure or misuse of our information or our customers' information, misappropriation of assets, privacy breaches against our customers, litigation or damage to our reputation. Such fraudulent activity may take many forms, including check fraud, electronic fraud, wire fraud, phishing, social engineering and other dishonest acts. Nationally, reported incidents of fraud and other financial crimes have increased. We have also experienced losses due to apparent
fraud and other financial crimes. While we have policies and procedures designed to prevent such losses, there can be no assurance that such losses will not occur.
Managing reputational risk is important to attracting and maintaining customers, investors and employees.
Threats to our reputation can come from many sources, including adverse sentiment about financial institutions generally, unethical practices, employee misconduct, failure to deliver minimum standards of service or quality, compliance deficiencies and questionable or fraudulent activities of our customers. We have policies and procedures in place to protect our reputation and promote ethical conduct, but these policies and procedures may not be fully effective. Negative publicity regarding our business, employees, or customers, with or without merit, may result in the loss of customers, investors and employees, costly litigation, a decline in revenues and increased governmental regulation.
We rely on other companies to provide key components of our business infrastructure.
We rely on numerous external vendors to provide us with products and services necessary to maintain our day-to-day operations. Accordingly, our operations are exposed to risk that these vendors will not perform in accordance with the contracted arrangements under service level agreements. The failure of an external vendor to perform in accordance with the contracted arrangements under service level agreements because of changes in the vendor's organizational structure, financial condition, support for existing products and services or strategic focus or for any other reason, could be disruptive to our operations, which in turn could have a material negative impact on our financial condition and results of operations. We also could be adversely affected to the extent that such an agreement is not renewed by a third-party vendor or is renewed on terms less favorable to us. Additionally, the bank regulatory agencies expect financial institutions to be responsible for all aspects of our vendors' performance, including aspects which they delegate to third-parties. Disruptions or failures in the physical infrastructure or operating systems that support our business and customers, or cyber-attacks or security breaches of the networks, systems or devices that our customers use to access our products and services could result in client attrition, regulatory fines, penalties or intervention, reputational damage, reimbursement or other compensation costs, and/or additional compliance costs, any of which could materially adversely affect our results of operations or financial condition.
Risks Related to Accounting Matters
We may experience future goodwill impairment, which could reduce our earnings.
We performed our test for goodwill impairment for fiscal year 2021, and the test concluded that recorded goodwill was not impaired. Our test of goodwill for potential impairment is based on a qualitative assessment by management that takes into consideration macroeconomic conditions, industry and market conditions, cost or margin factors, financial performance and share price. Our evaluation of the fair value of goodwill involves a substantial amount of judgment. If our judgment was incorrect, or if events or circumstances change, and an impairment of goodwill was deemed to exist, we would be required to write down our goodwill resulting in a charge against operations, which would adversely affect our results of operations, perhaps materially; however, it would have no impact on our liquidity, operations or regulatory capital. The acquisition of South Sound Bank on October 1, 2018 substantially increased our goodwill.
We may experience decreases in the fair value of our loan servicing rights, which could reduce our earnings.
Loan servicing rights are capitalized at estimated fair value when acquired through the origination of loans that are subsequently sold with servicing rights retained. At September 30, 2021, our loan servicing rights totaled $3.48 million (including a valuation allowance of $119,000). Loan servicing rights are amortized to servicing income on loans sold over the period of estimated net servicing income. The estimated fair value of loan servicing rights at the date of the sale of loans is determined based on the discounted present value of expected future cash flows using key assumptions for servicing income and costs and prepayment rates on the underlying loans. On a quarterly basis, we evaluate the fair value of loan servicing rights
for impairment by comparing actual cash flows and estimated cash flows from the loan servicing assets to those estimated at the time loan servicing assets were originated. Our methodology for estimating the fair value of loan servicing rights is highly sensitive to changes in assumptions, such as prepayment speeds. The effect of changes in market interest rates on estimated rates of loan prepayments represents the predominant risk characteristic underlying the loan servicing rights portfolio. For example, a decrease in interest rates typically increases the prepayment speeds of loan servicing rights and therefore decreases the fair value of the loan servicing rights. Future decreases in interest rates could decrease the fair value of our loan servicing rights below their recorded amount, which would decrease our earnings.
The required accounting treatment of loans we acquire through acquisitions including purchase credit impaired loans could result in higher net interest margins and interest income in current periods and lower net interest margins and interest income in future periods.
Under GAAP, we are required to record loans acquired through acquisitions, including purchase credit impaired loans, at fair value. Estimating the fair value of such loans requires management to make estimates based on available information and facts and circumstances on the acquisition date. Actual performance could differ from management’s initial estimates. If these loans outperform our original fair value estimates, the difference between our original estimate and the actual performance of the loan (the “discount”) is accreted into net interest income. Thus, our net interest margins may initially increase due to the discount accretion. We expect the yields on our loans to decline as our acquired loan portfolio pays down or matures and the discount decreases, and we expect downward pressure on our interest income to the extent that the runoff on our acquired loan portfolio is not replaced with comparable high-yielding loans. This could result in higher net interest margins and interest income in current periods and lower net interest margins and lower interest income in future periods.
If our investments in real estate are not properly valued or sufficiently reserved to cover actual losses, or if we are required to increase our valuation allowances, our earnings could be reduced.
We obtain updated valuations in the form of appraisals and broker price opinions when a loan has been foreclosed and the property is taken in as OREO, and at certain other times during the asset's holding period. Our net book value (“NBV”) in the loan at the time of foreclosure and thereafter is compared to the updated estimated market value of the foreclosed property less estimated selling costs (fair value). A charge-off is recorded for any excess in the asset’s NBV over its fair value. If our valuation process is incorrect or if the property declines in value after foreclosure, the fair value of our OREO may not be sufficient to recover our NBV in such assets, resulting in the need for a valuation allowance.
In addition, bank regulators periodically review our OREO and may require us to recognize further valuation allowances. Significant charge-offs to our OREO may have an adverse effect on our financial condition and results of operations.
Other Risks Related to Our Business
Ineffective liquidity management could adversely affect our financial results and condition.
Effective liquidity management is essential for the operation of our business. We require sufficient liquidity to meet customer loan requests, customer deposit maturities and withdrawals, payments on our debt obligations as they come due and other cash commitments under both normal operating conditions and other unpredictable circumstances causing industry or general financial market stress. An inability to raise funds through deposits, borrowings, the sale of loans and other sources could have a substantial negative effect on our liquidity. We rely on customer deposits and at times, borrowings from the FHLB, borrowings from the FRB and other borrowings to fund our operations. At September 30, 2021, we had $5.00 million in outstanding FHLB borrowings and an additional $465.02 million of available borrowing capacity through the FHLB and the FRB. Deposit flows and the prepayment of loans and mortgage-related securities are strongly influenced by such external factors as the direction of interest rates, whether actual or perceived, and the competition for deposits and loans in the markets we serve. Further, changes to the FHLB's underwriting guidelines for wholesale borrowings or lending policies may limit or restrict our ability to borrow, and could therefore have a significant adverse impact on our liquidity. Although we have historically been able to replace maturing deposits and borrowings if desired, we may not be able to replace such funds in the future if, among other things, our financial condition, the financial condition of the FHLB or FRB, or market conditions change. Our access to funding sources in amounts adequate to finance our activities or on terms which are acceptable to us could be impaired by factors that affect us specifically or the financial services industry or economy in general, such as a disruption in the financial markets or negative views and expectations about the prospects for the financial services industry. Additional factors that could detrimentally impact our access to liquidity sources include a decrease in the level of our business activity as a result of a downturn in the Washington markets where our loans and deposits are concentrated or adverse regulatory action against us. Our access to deposits may also be affected by the liquidity needs of our depositors. In particular, a majority of our liabilities are checking accounts and other liquid deposits, which are payable on demand or upon several days’ notice, while by
comparison, a substantial majority of our assets are loans, which cannot be called or sold in the same time frame. Although we have historically been able to replace maturing deposits and borrowings as necessary, we might not be able to replace such funds in the future, especially if a large number of our depositors seek to withdraw their accounts, regardless of the reason. A failure to maintain adequate liquidity could materially and adversely affect our business, results of operations, or financial condition.
Our financial flexibility will be severely constrained if we are unable to maintain our access to funding or if adequate financing is not available to accommodate future growth at acceptable interest rates. Although we consider our sources of funds adequate for our liquidity needs, we may seek additional debt in the future to achieve our long-term business objectives. Additional borrowings, if sought, may not be available to us or, if available, may not be available on reasonable terms. If additional financing sources are unavailable, or are not available on reasonable terms, our financial condition, results of operations, growth and future prospects could be materially adversely affected. Finally, if we are required to rely more heavily on more expensive funding sources to support future growth, our income may not increase proportionately to cover our costs.
Our growth or future losses may require us to raise additional capital in the future, but that capital may not be available when it is needed or the cost of that capital may be very high.
We are required by federal regulatory authorities to maintain adequate levels of capital to support our operations. Our ability to raise additional capital, if needed, will depend on conditions in the capital markets at that time, which are outside our control, and on our financial condition and performance. If we are able to raise capital, it may not be on terms that are acceptable to us. Accordingly, we cannot make assurances that we will be able to raise additional capital if needed on terms that are acceptable to us, or at all. If we cannot raise additional capital when needed, our ability to further expand our operations could be materially impaired and our financial condition and liquidity could be materially and adversely affected. In addition, any additional capital we obtain may result in the dilution of the interests of existing holders of our common stock. Further, if we are unable to raise additional capital when required by our bank regulators, we may be subject to adverse regulatory action.
Our framework for managing risks may not be effective in mitigating risk and loss to us.
We have established processes and procedures intended to identify, measure, monitor, report, analyze and control the types of risk to which we are subject. These risks include liquidity risk, credit risk, market risk, interest rate risk, operational risk, legal and compliance risk, and reputational risk, among others. We also maintain a compliance program to identify, measure, assess, and report on our adherence to applicable laws, policies and procedures. While we assess and improve these programs on an ongoing basis, there can be no assurance that our risk management or compliance programs, along with other related controls, will effectively mitigate all risk and limit losses in our business. As with any risk management framework, there are inherent limitations to our risk management strategies as there may exist, or develop in the future, risks that we have not appropriately anticipated or identified. If our risk management framework proves ineffective, we could suffer unexpected losses which could have a material adverse effect on our financial condition and results of operations.
We are dependent on key personnel, and the loss of one or more of those key personnel may materially and adversely affect our prospects.
Competition for qualified employees and personnel in the banking industry is intense, and there are a limited number of qualified persons with knowledge of, and experience in, the community banking industry where the Bank conducts its business. The process of recruiting personnel with the combination of skills and attributes required to carry out our strategies is often lengthy. Our success depends to a significant degree upon our ability to attract and retain qualified management, loan origination, finance, administrative, marketing and technical personnel and upon the continued contributions of our management and personnel. In particular, our success has been and continues to be highly dependent upon the abilities of key executives, including our President, and certain other employees. In addition, our success has been and continues to be highly dependent upon the services of our directors, and we may not be able to identify and attract suitable candidates to replace such directors.
Managing reputational risk is importantWe will be required to attracting and maintaining customers, investors and employees.transition from the use of the LIBOR interest rate index in the future.
Threats to our reputation can come from many sources, including adverse sentiment about financial institutions generally, unethical practices, employee misconduct, failure to deliver minimum standards of service or quality, compliance deficiencies and questionable or fraudulent activitiesSome of our customers. We have policiesloans are indexed to LIBOR to calculate the loan interest rate. LIBOR will be discontinued on December 31, 2021. Although we expect that the capital and procedures in placedebt markets will cease to protect our reputation and promote ethical conduct, but these policies and procedures may not be fully effective. Negative publicity regarding our business, employees, or customers, with or without merit, may resultuse LIBOR as a benchmark in the lossnear future and the administrator of customers, investors and employees, costly litigation,LIBOR has announced its intention to extend the publication of most tenors of LIBOR for U.S. dollars through June 30, 2023, we cannot predict whether or when LIBOR will actually cease to be available, whether the Secured Overnight Funding Rate, or SOFR, will become the market benchmark in its place or what impact such a decline in revenues and increased governmental regulation.
We relytransition may have on other companies to provide key components of our business, infrastructure.
We rely on numerous external vendors to provide us with products and services necessary to maintain our day-to-day operations. Accordingly, our operations are exposed to risk that these vendors will not perform in accordance with the contracted arrangements under service level agreements. The failure of an external vendor to perform in accordance with the contracted arrangements under service level agreements because of changes in the vendor's organizational structure, financial condition, support for existing products and services or strategic focus or for any other reason, could be disruptive to our operations, which in turn could have a material negative impact on our financial condition and results of operations. We also could be adversely affected
At this time, no consensus exists as to what rate or rates may become acceptable alternatives to LIBOR. Regulators, industry groups and certain committees (e.g. the extentAlternative Reference Rates Committee) have published recommended fallback language for LIBOR-linked financial instruments, identified recommended alternatives for the LIBOR, such an agreementas SOFR, and proposed implementations of the recommended alternatives in floating-rate financial instruments. At this time, it is not renewed bypossible to predict whether these specific recommendations and proposals will be broadly accepted. The implementation of a third party vendorsubstitute index or is renewedindices for the calculation of interest rates under our loan agreements with our borrowers may result in our incurring significant expenses in implementing the transition, may result in reduced loan balances if borrowers do not accept the substitute index or indices, and may result in disputes or litigation with customers over the appropriateness or comparability to LIBOR of the substitute index or indices, which could have an adverse effect on terms less favorableour results of operations.
Societal responses to us. Additionally, the bank regulatory agencies expect financial institutions to be responsible for all aspects of our vendors' performance, including aspects which they delegate to third parties. Disruptions or failures in the physical infrastructure or operating systems that supportclimate change could adversely affect our business and customers, or cyber-attacks or security breachesperformance, including indirectly through impacts on our customers.
Concerns over the long-term impacts of climate change have led and will continue to lead to governmental efforts around the networks, systems or devices thatworld to mitigate those impacts. Consumers and businesses also may change their behavior on their own as a result of these concerns. We and our customers usewill need to accessrespond to new laws and regulations as well as consumer and business preferences resulting from climate change concerns. We and our customers may face cost increases, asset value reductions and operating process changes. The impact on our customers will likely vary depending on their specific attributes, including reliance on or role in carbon intensive activities. Among the impacts to us could be a drop in demand for our products and services, particularly in certain industry sectors. In addition, we could resultface reductions in client attrition, regulatory fines, penaltiescreditworthiness on the part of some customers or intervention, reputational damage, reimbursementin the value of assets securing loans. Our efforts to take these risks into account in making lending and other decisions, including by increasing our business with climate-friendly companies, may not be effective in protecting us from the negative impact of new laws and regulations or other compensation costs, and/changes in consumer or additional compliance costs, any of which could materially adversely affect our results of operations or financial condition.business behavior.
Item 1B. Unresolved Staff Comments
Not applicable.
Item 2. Properties
At September 30, 2019,2021, the Bank operated 24 full service facilities. The following table sets forth certain information regarding the Bank’s offices, all of which are owned, except for the Tacoma office, the Lacey office at 1751 Circle Lane SE and the Lacey office at 4530 Lacey Blvd SE, which are leased.
| | | | | | | | | | | | | | | | | | | | |
Location | | Year Opened | | Approximate
Square Footage | | Deposits at
September 30, 2021 |
| | | | | | | (In thousands) |
| Main Office: | | | | | | |
| | | | | | |
624 Simpson Avenue
Hoquiam, Washington 98550 | | 1966 | | 7,700 | | | $ | 87,727 | |
| | | | | | |
| Branch Offices: | | | | | | |
| | | | | | |
300 N. Boone Street
Aberdeen, Washington 98520 | | 1974 | | 3,400 | | | 48,911 | |
| | | | | | . |
201Main Street South
Montesano, Washington 98563 | | 2004 | | 3,200 | | | 53,719 | |
| | | | | | |
361 Damon Road
Ocean Shores, Washington 98569 | | 1977 | | 2,100 | | | 46,768 | |
| (table continued on the following page) |
|
| | | | | | | | | |
Location | | Year Opened | | Approximate Square Footage | | Deposits at September 30, 2019 |
| | | | | | | (In thousands) |
| Main Office: | | | | | | |
| | | | | | | |
624 Simpson Avenue Hoquiam, Washington 98550 | | 1966 | | 7,700 |
| | $ | 68,981 |
|
| | | | | |
| | |
|
| Branch Offices: | | | | |
| | |
|
| | | | | | | |
300 N. Boone Street Aberdeen, Washington 98520 | | 1974 | | 3,400 |
| | 36,425 |
|
| | | | | |
| | |
|
201 Main Street South Montesano, Washington 98563 | | 2004 | | 3,200 |
| | 41,519 |
|
| | | | | |
| | |
|
361 Damon Road Ocean Shores, Washington 98569 | | 1977 | | 2,100 |
| | 36,050 |
|
| | | | | |
| | |
|
2418 Meridian Avenue East Edgewood, Washington 98371 | | 1980 | | 2,400 |
| | 52,130 |
|
| | | | | | | |
202 Auburn Way South Auburn, Washington 98002 | | 1994 | | 4,200 |
| | 31,617 |
|
| | | | | | | |
12814 Meridian Avenue East (South Hill) Puyallup, Washington 98373 | | 1996 | | 4,200 |
| | 43,118 |
|
| | | | | | | |
1201 Marvin Road, N.E. Lacey, Washington 98516 | | 1997 | | 4,400 |
| | 29,725 |
|
| | | | | | | |
101 Yelm Avenue W. Yelm, Washington 98597 | | 1999 | | 3,400 |
| | 35,025 |
|
| | | | | | | |
20464 Viking Way NW Poulsbo, Washington 98370 | | 1999 | | 1,800 |
| | 23,196 |
|
| | | | | | | |
2419 224th Street E. Spanaway, Washington 98387 | | 1999 | | 3,900 |
| | 44,448 |
|
| | | | | | | |
|
801 Trosper Road SW Tumwater, Washington 98512 | | 2001 | | 3,300 |
| | 41,343 |
|
| |
7805 South Hosmer Street
Tacoma, Washington 98408 | | 2001 | | 5,000 |
| | 74,996 |
|
| | | | | | | |
|
2401 Bucklin Hill Road
Silverdale, Washington 98383 | | 2003 | | 4,000 |
| | 45,390 |
|
| | | | | |
| | |
|
423 Washington Street SE
Olympia, Washington 98501 | | 2003 | | 3,000 |
| | 51,655 |
|
| | | | | | | |
3105 Judson Street
Gig Harbor, Washington 98335 | | 2004 | | 2,700 |
| | 36,844 |
|
| | | | | |
| | |
117 N. Broadway
Aberdeen, Washington 98520 | | 2004 | | 3,700 |
| | 49,546 |
|
| | | | | |
| | |
|
313 West Waldrip Street
Elma, Washington 98541 | | 2004 | | 5,900 |
| | 34,540 |
|
| | | | | | | |
| (table continued on the following page) |
|
| | | | | | | | | | | | | | | | | | | |
Location | | Year Opened | | Approximate
Square Footage
| | Deposits at
September 30, 2019
2021 |
| | | | | | (In(In thousands) |
| 2418 Meridian Avenue East
Edgewood, Washington 98371 | | 2418 Meridian Avenue East
Edgewood, Washington 98371 | | 1980 | | 2,400 | | | $ | 71,575 | |
| 202 Auburn Way South
Auburn, Washington 98002 | | 202 Auburn Way South
Auburn, Washington 98002 | | 1994 | | 4,200 | | | 49,255 | |
| 12814 Meridian Avenue East (South Hill)
Puyallup, Washington 98373 | | 12814 Meridian Avenue East (South Hill)
Puyallup, Washington 98373 | | 1996 | | 4,200 | | | 59,952 | |
| 1201 Marvin Road, N.E.
Lacey, Washington 98516 | | 1201 Marvin Road, N.E.
Lacey, Washington 98516 | | 1997 | | 4,400 | | | 41,052 | |
| 101 Yelm Avenue W.
Yelm, Washington 98597 | | 101 Yelm Avenue W.
Yelm, Washington 98597 | | 1999 | | 3,400 | | | 46,842 | |
| 20464 Viking Way NW
Poulsbo, Washington 98370 | | 20464 Viking Way NW
Poulsbo, Washington 98370 | | 1999 | | 1,800 | | | 36,135 | |
| 2419 224th Street E. Spanaway, Washington 98387 | | 2419 224th Street E. Spanaway, Washington 98387 | | 1999 | | 3,900 | | | 66,308 | |
| | | | |
801 Trosper Road SW
Tumwater, Washington 98512 | | 801 Trosper Road SW
Tumwater, Washington 98512 | | 2001 | | 3,300 | | | 60,357 | |
| | | | |
7805 South Hosmer Street
Tacoma, Washington 98408 | | 7805 South Hosmer Street
Tacoma, Washington 98408 | | 2001 | | 5,000 | | | 141,283 | |
| | | | |
2401 Bucklin Hill Road
Silverdale, Washington 98383 | | 2401 Bucklin Hill Road
Silverdale, Washington 98383 | | 2003 | | 4,000 | | | 54,052 | |
423 Washington Street SE
Olympia, Washington 98501 | | 423 Washington Street SE
Olympia, Washington 98501 | | 2003 | | 3,000 | | | 80,498 | |
| | | | | | |
3105 Judson Street
Gig Harbor, Washington 98335 | | 3105 Judson Street
Gig Harbor, Washington 98335 | | 2004 | | 2,700 | | | 58,416 | |
| | | | | | |
117 N. Broadway
Aberdeen, Washington 98520 | | 117 N. Broadway
Aberdeen, Washington 98520 | | 2004 | | 3,700 | | | 71,051 | |
| | | | | | |
313 West Waldrip Street
Elma, Washington 98541 | | 313 West Waldrip Street
Elma, Washington 98541 | | 2004 | | 5,900 | | | 71,278 | |
| | | | | | | | | | | | |
1751 Circle Lane SE
Lacey, Washington 98503 | | 2004 | | 900 |
| | 18,486 |
| 1751 Circle Lane SE
Lacey, Washington 98503 | | 2004 | | 900 | | | 19,844 | |
| | | | | |
| | |
| | | | | |
101 2nd Street
Toledo, Washington 98591 | | 2004 | | 1,800 |
| | 41,056 |
| |
101 2nd Street Toledo, Washington 98591 | | 101 2nd Street Toledo, Washington 98591 | | 2004 | | 1,800 | | | 61,404 | |
| | | | | |
| | |
| | | | | |
209 NE 1st Street
Winlock, Washington 98586 | | 2004 | | 3,400 |
| | 22,795 |
| |
209 NE 1st Street Winlock, Washington 98586 | | 209 NE 1st Street Winlock, Washington 98586 | | 2004 | | 3,400 | | | 30,594 | |
| | | | | |
| | |
| | | | | |
714 W. Main Street
Chehalis, Washington 98532 | | 2009 | | 4,600 |
| | 56,692 |
| 714 W. Main Street
Chehalis, Washington 98532 | | 2009 | | 4,600 | | | 60,638 | |
| | | | | |
| | |
| |
| 2850 Harrison Ave NW Olympia, Washington 98502 | | 2018 | | 7,800 |
| | 65,489 |
| |
2850 Harrison Ave
Olympia, Washington 98502 | | 2850 Harrison Ave
Olympia, Washington 98502 | | 2018 | | 7,755 | | | 93,023 | |
| | | | | | |
| 4530 Lacey Blvd SE Lacey, Washington 98503 | | 2018 | | 3,700 |
| | 87,161 |
| 4530 Lacey Blvd SE
Lacey, Washington 98503 | | 2018 | | 3,700 | | | 159,873 | |
| | | | | | | | | | | |
| Loan Center/Data Center: | | | | |
| | |
| Loan Center/Data Center: | | | | | | |
| | | | | | |
120 Lincoln Street
Hoquiam, Washington 98550 | | 2003 | | 6,000 |
| | N/A |
| 120 Lincoln Street
Hoquiam, Washington 98550 | | 2003 | | 6,000 | | | N/A |
| | | | | |
| | |
| | | | | | |
| Administrative Offices: | | | | |
| | |
| Administrative Offices: | | | | | | |
| | | | | | |
| 305 8th Street Hoquiam, Washington 98550 | | 2004 | | 4,100 |
| | N/A |
| 305 8th Street Hoquiam, Washington 98550 | | 2004 | | 4,100 | | | N/A |
Management believes that all facilities are appropriately insured and are adequately equipped for carrying on the business of the Bank.
At September 30, 2019,2021, the Bank operated 25 proprietary automated teller machines ("ATMs") that are part of a nationwide cash exchange network.
The Company adopted Accounting Standards Codification ("ASC") 842 ("ASC 842") on October 1, 2019 and began recording operating lease liabilities and operating lease right-of-use ("ROU") assets in the consolidated balance sheets. The Company has operating leases for three retail bank branch offices. The ROU assets totaled $2.89 million at October 1, 2019. The Company's leases have remaining lease terms of ten months to ten years, some of which include options to extend the leases for up to five years. For additional information regarding operating lease liabilities and operating lease ROU assets, see Note 10 of the Notes to the Consolidated Financial Statements included in Item 8 of this Annual Report on Form 10-K.
Item 3. Legal Proceedings
Periodically, there have been various claims and lawsuits involving the Company, such as claims to enforce liens, condemnation proceedings on properties in which the Company holds security interests, claims involving the making and servicing of real property loans and other issues incident to the Company's business. The Company is not a party to any pending legal proceedings that it believes would have a material adverse effect on the financial condition or operations of the Company.
Item 4. Mine Safety Disclosures
Not applicable.
PART II
Item 5. Market for Registrant's Common Equity, Related Stockholder Matters and Issuer Purchases of Equity Securities
The Company's common stock is traded on the Nasdaq Global Market under the symbol “TSBK.” As of November 30, 2019,December 2, 2021, there were 8,345,0698,354,717 shares of common stock issued and approximately 488436 shareholders of record. Our cash dividend payout policy is reviewed regularly by management and the Board of Directors. Our Board of directors has declared quarterly cash dividends on our common stock for 36 consecutive quarters. Any dividends declared and paid in the future would depend upon a number of factors, including capital requirements, our financial condition and results of operations, tax considerations, statutory and regulatory limitations, and general economic conditions. No assurances can be given that any dividends will be paid or that, if paid, will not be reduced or eliminated in future periods. Our future payment of dividends may depend, in part, upon receipt of dividends from the Bank, which are restricted by banking regulations.
Stock Repurchases
The Company is subject to certain restrictions on its ability to repurchase its common stock. The Company is required to give the Federal Reserve prior written notice of any purchase or redemption of its outstanding equity securities if the consideration for the purchase or redemption, when combined with the net consideration paid for all such purchases or redemptions during the preceding 12 months, is equal to 10% or more of its consolidated net worth. The Federal Reserve may disapprove a purchase or redemption if it determines that the proposal would constitute an unsafe or unsound practice or would violate any law, regulation, Federal Reserve order, or any condition imposed by, or written agreement with, the Federal Reserve.
The Company has had various stock repurchase programs since January 1998. On July 28, 2015,February 24, 2021, the Company announced a plan to repurchase 352,681415,970 shares of the Company's common stock. This marked the Company's 17th18th stock repurchase plan. As of September 30, 2019,2021, the Company had repurchased 151,22816,688 shares under this plan at an average price of $13.41$28.08 per share. Cumulatively, since January 1998, the Company has repurchased 7,935,1628,011,351 shares at an average price of $9.06$9.19 per share.
The following table sets forth the Company's repurchases of its outstanding Common Stock during the fourth quarter of the year ended September 30, 2019:2021:
|
| | | | | | | | | | | | | |
| Period | | Total Number of Shares Purchased | | Average Price Paid per Share | | Total Number of Shares Purchased as Part of Publicly Announced Plans | | Maximum Number (or Approximate Dollar Value) of Shares that May Yet Be Purchased Under the Plans |
| | | | | | | | | |
| July 1, 2019 - July 31, 2019 | | — |
| | $ | — |
| | — |
| | 219,062 |
|
| | | | | | | | | |
| August 1, 2019 - August 31, 2019 | | 17,609 |
| | 24.33 |
| | 17,609 |
| | 201,453 |
|
| | | | | | | | | |
| September 1, 2019 - September 30, 2019 | | — |
| | — |
| | — |
| | 201,453 |
|
| | | | | | | | | |
| Total | | 17,609 |
| | $ | 24.33 |
| | 17,609 |
| | 201,453 |
|
| | | | | | | | | | | | | | | | | | | | | | | | | | |
| Period | | Total Number of Shares Purchased | | Average Price Paid per Share | | Total Number of Shares Purchased as Part of Publicly Announced Plans | | Maximum Number (or Approximate Dollar Value) of Shares that May Yet Be Purchased Under the Plans |
| | | | | | | | |
| July 1, 2021 - July 31, 2021 | | — | | | $ | — | | | — | | | 399,282 | |
| | | | | | | | |
| August 1, 2021 - August 31, 2021 | | — | | | — | | | — | | | 399,282 | |
| | | | | | | | |
| September 1, 2021 - September 30, 2021 | | — | | | — | | | — | | | 399,282 | |
| | | | | | | | |
| Total | | — | | | $ | — | | | — | | | 399,282 | |
Five-Year Stock Performance Graph
The following graph compares the cumulative total shareholder return on our common stock with the cumulative total return on the Nasdaq U.S. CompaniesComposite Index and with the SNL $500 million to $1 Billion Asset ThriftS&P 600 Thrifts & Mortgage Finance Index, peer group indices. The S&P 600 Thrifts & Mortgage Finance Index replaces the SNL Thrift $500M-$1B Index used in prior years as this index was retired in August 2021. Total return assumes the reinvestment of all dividends and that the value of the Company’s Common Stock and each index was $100 on September 30, 2014.2016.
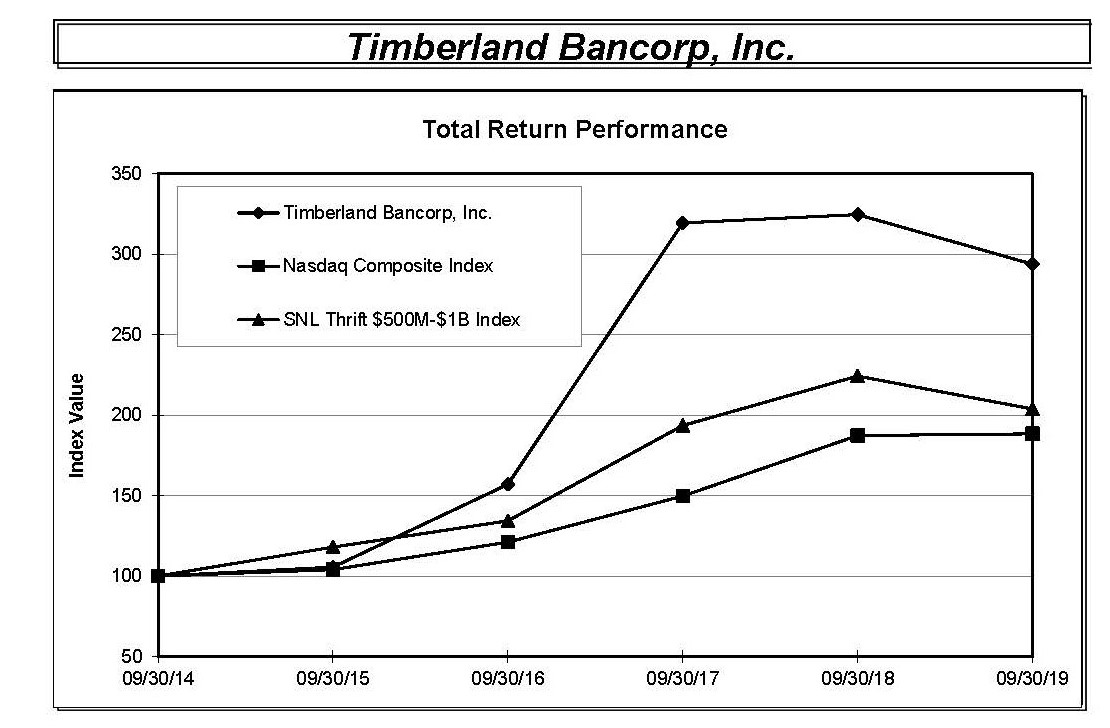
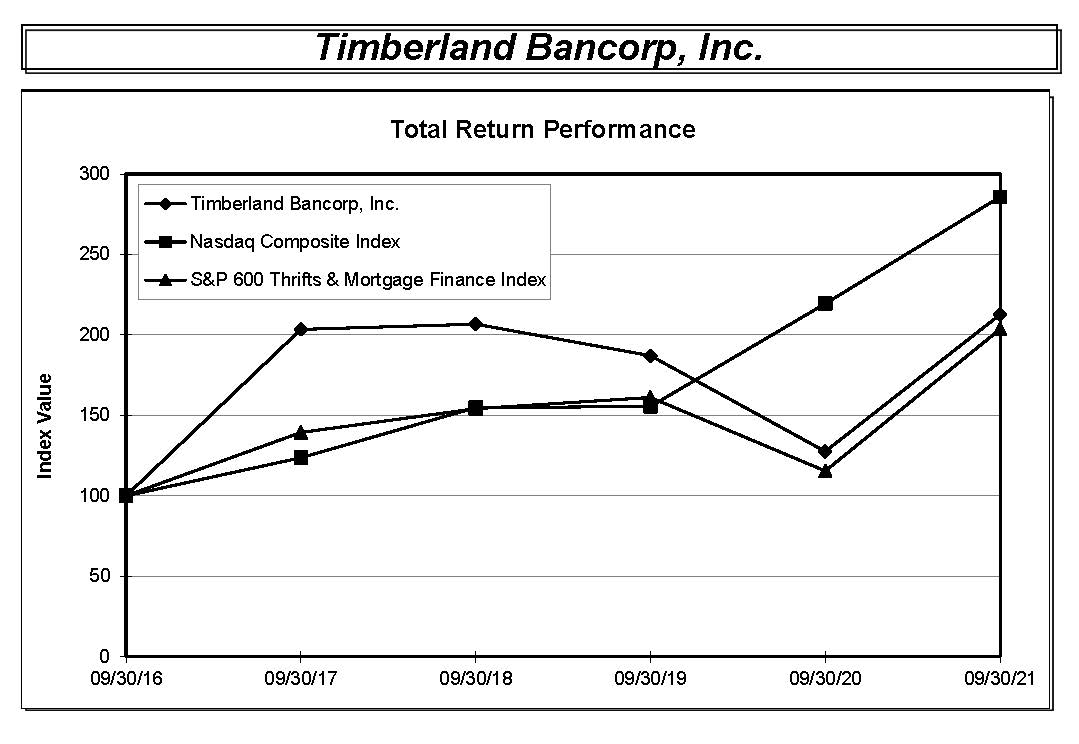
|
| | | | | | | | | | | | | | | | | | | |
| | | Year Ended | | |
| | Index | 9/30/2014 |
| 9/30/2015 |
| 9/30/2016 |
| 9/30/2017 |
| 9/30/2018 |
| 9/30/2019 |
|
| | Timberland Bancorp | $ | 100.00 |
| $ | 105.65 |
| $ | 157.02 |
| $ | 319.48 |
| $ | 324.68 |
| $ | 293.90 |
|
| | NASDAQ Composite | 100.00 |
| 104.00 |
| 121.08 |
| 149.75 |
| 187.44 |
| 188.43 |
|
| | SNL $500M-$1B Thrift Index * | 100.00 |
| 118.08 |
| 134.39 |
| 193.64 |
| 224.33 |
| 203.84 |
|
| | | | | | | | | | | | | | | | | | | | | | | |
| | Year Ended | | |
| Index | 9/30/2016 | 9/30/2017 | 9/30/2018 | 9/30/2019 | 9/30/2020 | 9/30/2021 |
| Timberland Bancorp, Inc. | $ | 100.00 | | $ | 203.46 | | $ | 206.77 | | $ | 187.17 | | $ | 127.54 | | $ | 212.65 | |
| NASDAQ Composite Index | 100.00 | | 123.68 | | 154.82 | | 155.63 | | 219.37 | | 285.75 | |
| S&P 600 Thrifts & Mortgage Finance Index | 100.00 | | 139.42 | | 154.10 | | 161.15 | | 115.47 | | 203.53 | |
* Source: S&P Global Market Intelligence
For additional information, see Part III, Item 12 of this Form 10-K for information regarding the Company's Equity Compensation Plans, which is incorporated into this Item 5 by reference.
Item 6. Selected Financial DataReserved
The following table sets forth certain information concerning the consolidated financial position and results of operations of the Company and its subsidiary at and for the dates indicated. The consolidated data is derived in part from, and should be read in conjunction with, the Consolidated Financial Statements of the Company and its subsidiary presented herein.
|
| | | | | | | | | | | | | | | | | | | |
| | At September 30, |
| | 2019 | | 2018 | | 2017 | | 2016 | | 2015 |
| | (Dollars in thousands) |
| SELECTED FINANCIAL CONDITION DATA: | | | | | | | | | |
| | | | | | | | | | |
| Total assets | $ | 1,247,132 |
| | $ | 1,018,290 |
| | $ | 952,024 |
| | $ | 891,388 |
| | $ | 815,815 |
|
| Loans receivable, net | 886,662 |
| | 725,391 |
| | 690,364 |
| | 663,146 |
| | 604,277 |
|
| Investment securities held to maturity | 31,102 |
| | 12,810 |
| | 7,139 |
| | 7,511 |
| | 7,913 |
|
| Investment securities available for sale | 22,532 |
| | 1,154 |
| | 1,241 |
| | 1,342 |
| | 1,392 |
|
| FHLB stock | 1,437 |
| | 1,190 |
| | 1,107 |
| | 2,204 |
| | 2,699 |
|
| Other investments | 3,000 |
| | 3,000 |
| | 3,000 |
| | — |
| | — |
|
| Cash and due from financial institutions and interest-bearing deposits in banks | 143,015 |
| | 148,864 |
| | 148,188 |
| | 108,941 |
| | 92,289 |
|
| Certificates of deposit held for investment | 78,346 |
| | 63,290 |
| | 43,034 |
| | 53,000 |
| | 48,611 |
|
| OREO and other repossessed assets, net | 1,683 |
| | 1,913 |
| | 3,301 |
| | 4,117 |
| | 7,854 |
|
| Deposits | 1,068,227 |
| | 889,506 |
| | 837,898 |
| | 761,534 |
| | 678,912 |
|
| FHLB borrowings | — |
| | — |
| | — |
| | 30,000 |
| | 45,000 |
|
| Shareholders' equity | 171,067 |
| | 124,657 |
| | 111,000 |
| | 96,834 |
| | 89,187 |
|
| | | | | | | | | | |
| | Year Ended September 30, |
| | 2019 |
| | 2018 |
| | 2017 |
| | 2016 |
| | 2015 |
|
| | (Dollars in thousands, except per share data) |
| SELECTED OPERATING DATA: | |
| | |
| | |
| | |
| | |
|
| | | | | | | | | | |
| Interest and dividend income | $ | 55,725 |
| | $ | 41,833 |
| | $ | 38,338 |
| | $ | 34,875 |
| | $ | 31,168 |
|
| Interest expense | 4,565 |
| | 2,778 |
| | 3,197 |
| | 4,072 |
| | 3,890 |
|
| Net interest income | 51,160 |
| | 39,055 |
| | 35,141 |
| | 30,803 |
| | 27,278 |
|
| Recapture of loan losses | — |
| | — |
| | (1,250 | ) | | — |
| | (1,525 | ) |
| Net interest income after recapture of loan losses | 51,160 |
| | 39,055 |
| | 36,391 |
| | 30,803 |
| | 28,803 |
|
| Non-interest income | 14,341 |
| | 12,544 |
| | 12,368 |
| | 10,889 |
| | 9,522 |
|
| Non-interest expense | 35,580 |
| | 29,177 |
| | 27,516 |
| | 26,637 |
| | 25,841 |
|
| Income before income taxes | 29,921 |
| | 22,422 |
| | 21,243 |
| | 15,055 |
| | 12,484 |
|
| Provision for income taxes | 5,901 |
| | 5,701 |
| | 7,076 |
| | 4,901 |
| | 4,192 |
|
| Net income | $ | 24,020 |
| | $ | 16,721 |
| | $ | 14,167 |
| | $ | 10,154 |
| | $ | 8,292 |
|
| | | | | | | | | | |
| Net income per common share: | |
| | |
| | |
| | |
| | |
|
| Basic | $ | 2.89 |
| | $ | 2.28 |
| | $ | 1.99 |
| | $ | 1.48 |
| | $ | 1.20 |
|
| Diluted | $ | 2.84 |
| | $ | 2.22 |
| | $ | 1.92 |
| | $ | 1.43 |
| | $ | 1.17 |
|
| Dividends per common share | $ | 0.78 |
| | $ | 0.60 |
| | $ | 0.50 |
| | $ | 0.37 |
| | $ | 0.24 |
|
| Dividend payout ratio (1) | 27.04 | % | | 26.50 | % | | 25.70 | % | | 25.39 | % | | 20.42 | % |
_______________
| |
(1) | Cash dividends to common shareholders divided by net income to common shareholders. |
|
| | | | | | | | | | | | | | |
| | At September 30, |
| | 2019 | | 2018 | | 2017 | | 2016 | | 2015 |
| OTHER DATA: | | | | | | | | | |
| | | | | | | | | | |
| Number of real estate loans outstanding | 2,766 |
| | 2,550 |
| | 2,593 |
| | 2,615 |
| | 2,545 |
|
| Deposit accounts | 59,547 |
| | 55,441 |
| | 54,707 |
| | 53,611 |
| | 52,343 |
|
| Full-service offices | 24 |
| | 22 |
| | 22 |
| | 22 |
| | 22 |
|
|
| | | | | | | | | | | | | | |
| | At or For the Year Ended September 30, |
| | 2019 | | 2018 | | 2017 | | 2016 | | 2015 |
| KEY FINANCIAL RATIOS: | | | | | | | | | |
| | | | | | | | | | |
| Performance Ratios: | | | | | | | | | |
| Return on average assets (1) | 1.96 | % | | 1.70 | % | | 1.53 | % | | 1.19 | % | | 1.07 | % |
| Return on average equity (2) | 14.91 |
| | 14.27 |
| | 13.65 |
| | 11.00 |
| | 9.70 |
|
| Interest rate spread (3) | 4.31 |
| | 4.10 |
| | 3.93 |
| | 3.72 |
| | 3.66 |
|
| Net interest margin (4) | 4.50 |
| | 4.23 |
| | 4.07 |
| | 3.88 |
| | 3.80 |
|
| Average interest-earning assets to average interest-bearing liabilities | 148.15 |
| | 144.17 |
| | 137.75 |
| | 131.69 |
| | 126.41 |
|
| Non-interest expense as a percent of average total assets | 2.91 |
| | 2.96 |
| | 2.98 |
| | 3.13 |
| | 3.33 |
|
| | | | | | | | | | |
| Efficiency ratio (5) | 54.32 |
| | 56.55 |
| | 57.92 |
| | 63.89 |
| | 70.22 |
|
| | | | | | | | | | |
| Asset Quality Ratios: | |
| | |
| | |
| | |
| | |
|
| Non-accrual and 90 days or more past due loans as a percent of total loans receivable, net | 0.34 | % | | 0.18 | % | | 0.28 | % | | 0.45 | % | | 1.02 | % |
| Non-performing assets as a percent of total assets (6) | 0.40 |
| | 0.36 |
| | 0.60 |
| | 0.88 |
| | 1.84 |
|
| Allowance for loan losses as a percent of total loans receivable, net (7) | 1.08 |
| | 1.30 |
| | 1.36 |
| | 1.46 |
| | 1.62 |
|
| Allowance for loan losses as a percent of non-performing loans (8) | 319.49 |
| | 723.61 |
| | 499.90 |
| | 326.66 |
| | 160.30 |
|
| Net charge-offs (recoveries) to average outstanding loans | (0.02 | ) | | — |
| | (0.14 | ) | | 0.02 |
| | (0.17 | ) |
| | | | | | | | | | |
| Capital Ratios: | | | |
| | |
| | |
| | |
|
| Total equity-to-assets ratio | 13.71 | % | | 12.24 | % | | 11.66 | % | | 10.86 | % | | 10.93 | % |
| Average equity to average assets | 13.17 |
| | 11.90 |
| | 11.25 |
| | 10.84 |
| | 11.01 |
|
__________________
| |
(1) | Net income divided by average total assets. |
| |
(2) | Net income divided by average total equity. |
| |
(3) | Difference between weighted average yield on interest-earning assets and weighted average cost of interest-bearing liabilities. |
| |
(4) | Net interest income before provision for (recapture of) loan losses as a percentage of average interest-earning assets. |
| |
(5) | Non-interest expenses divided by the sum of net interest income and non-interest income. |
| |
(6) | Non-performing assets include non-accrual loans, loans past due 90 days or more and still accruing, non-accrual investment securities, OREO and other repossessed assets. |
| |
(7) | Loans receivable is before the allowance for loan losses. |
| |
(8) | Non-performing loans include non-accrual loans and loans past due 90 days or more and still accruing. TDRs that are on accrual status are not included. |
Item 7. Management's Discussion and Analysis of Financial Condition and Results of Operations
MANAGEMENT'S DISCUSSION AND ANALYSIS OF
FINANCIAL CONDITION AND RESULTS OF OPERATIONS
General
Management's Discussion and Analysis of Financial Condition and Results of Operations is intended to assist in understanding the consolidated financial condition and results of operations of the Company. The information contained in this section should be read in conjunction with the Consolidated Financial Statements and accompanying notes thereto included in Item 8 of this Annual Report on Form 10-K.
Overview
Timberland Bancorp, Inc., a Washington corporation, is the holding company for Timberland Bank. The Bank opened for business in 1915 and serves consumers and businesses across Grays Harbor, Thurston, Pierce, King, Kitsap and Lewis counties, Washington with a full range of lending and deposit services through its 24 branches (including its main office in Hoquiam). At September 30, 2019,2021, the Company had total assets of $1.25$1.79 billion, net loans receivable of $886.66$968.45 million, total deposits of $1.07$1.57 billion and total shareholders’ equity of $171.07$206.90 million. The Company’s business activities generally are limited to passive investment activities and oversight of its investment in the Bank. Accordingly, the information set forth in this report relates primarily to the Bank’s operations.
On October 1, 2018, the Company completed the South Sound Acquisition. The operating results for the yearyears ended September 30, 2019, 2020 and 2021 include the operating results produced by the net assets acquired in the South Sound Acquisition. For additional information on the South Sound Acquisition, see Note 2 to the Consolidated Financial Statements contained in "Item 8. Financial Statements and Supplementary Data."
The Bank is a community-oriented bank which has traditionally offered a variety of savings products to its retail and business customers while concentrating its lending activities on real estate secured loans. Lending activities have been focused primarily on the origination of loans secured by real estate, including residential construction loans, one- to four-family residential loans, multi-family loans and commercial real estate loans. The Bank originates adjustable-rate residential mortgage loans, some of which do not qualify for sale in the secondary market. The Bank also originates commercial business loans and other consumer loans.
The profitability of the Company’s operations depends primarily on its net interest income after provision for (recapture of) loan losses. Net interest income is the difference between interest income, which is the income that the Company earns on interest-earning assets, which are primarily loans and investments, and interest expense, the amount the Company pays on its interest-bearing liabilities, which are primarily deposits and borrowings (as needed). Net interest income is affected by changes in the volume and mix of interest-earning assets, the interest earned on those assets, the volume and mix of interest-bearing liabilities and the interest paid on those interest-bearing liabilities. Management attempts to maintain a net interest margin placing it within the top quartile of its Washington State peers. Because of the length of the COVID-19 pandemic and the efficacy of the extraordinary measures being put in place to address its economic consequences are unknown until the pandemic subsides, the Company expects its net interest income and net interest margin will be adversely affected.
The provision for (recapture of) loan losses is dependent on changes in the loan portfolio and management’s assessment of the collectability of the loan portfolio as well as prevailing economic and market conditions. The allowance for loan losses reflects the amount that the Company believes is adequate to cover probable credit losses inherent in its loan portfolio. The Company did not record a provision for loan losses for the year ended September 30, 2021, primarily reflecting the improving economy and the resulting decline in forecasted probable loan losses from COVID-19 during this fiscal year. The Company recorded a provision for loan losses of $3.70 million for the year ended September 30, 2020, which was due primarily to forecasted probable loan losses reflecting the potential future impact of the COVID-19 pandemic on the economy based on the economic outlook at that time..
The Company maintains its commitment to supporting its community and customers during these unprecedented times as a result of the COVID-19 pandemic. The Company remains focused on keeping its employees safe and the Bank running effectively to serve its customers. The Bank is managing branch access and occupancy levels in relation to cases and close contact scenarios, following governmental restrictions and public health authority guidelines. Some of the Company's employees are working remotely or have flexible work schedules, and protective measures within the Company's offices have been established to help ensure the safety of those employees who must work on-site.
The Company has worked with loan customers on loan deferral and forbearance plans. In response to requests from borrowers, the Company made payment deferral modifications (typically 90-day payment deferrals with interest continuing to accrue or scheduled to be paid monthly) on a number of loans. The majority of these borrowers had resumed making payments as of September 30, 2021 with one loan totaling $233,000 on deferral status compared to five loans totaling $5.87 million on deferral status as of September 30, 2020. These modifications were not classified as TDRs at September 30, 2021 and 2020 in accordance with guidance of the CARES Act and related regulatory guidance. The CARES Act also authorized the SBA to temporarily guarantee loans under a new loan program called the Paycheck Protection Program. As a qualified SBA lender, the Company was automatically authorized to originate PPP loans upon commencement of the program in April 2020 through the program's initial conclusion in August 2020. The CAA 2021, which was signed into law on December 27, 2020, renewed and extended the PPP until May 31, 2021. As a result, the Company began originating PPP loans again in January 2021. As of September 30, 2021, the Company had $40.92 million in PPP loans to new and existing customers who are small to midsize businesses as well as non-profit organizations, independent contractors, and partnerships as allowed under PPP guidance.
Net income is also affected by non-interest income and non-interest expense. For the year ended September 30, 2019,2021, non-interest income consisted primarily of service charges on deposit accounts, gain on sales of loans, ATM and debit card interchange transaction fees, a BOLI death benefit claim, an increase in the cash surrender value of BOLI, servicing income on loans sold, escrow fee and other operating income. Non-interest income is also increased by net recoveries on investment securities and reduced by net OTTI losses on investment securities, if any. Non-interest income is also decreased by valuation allowances on loan servicing rights and increased by recoveries of valuation allowances on loan servicing rights, if any. Non-interest expense consisted primarily of salaries and employee benefits, premises and equipment, advertising, ATM and debit card interchange transaction fees, postage and courier expenses, amortization of CDI, state and local taxes, professional fees, FDIC insurance premiums, loan administration and foreclosure expenses, data processing and telecommunication expenses, deposit operation expenses and other non-interest expenses. Non-interest expense in certain periods are reduced by gains on the sale of premises and equipment and by gains on the sale of OREO. Non-interest income and non-interest expense are affected by the growth of the Company's operations and growth in the number and balances of loan and deposit accounts.
Results of operations may be affected significantly by general and local economic and competitive conditions, changes in market interest rates, governmental policies and actions of regulatory authorities.
Operating Strategy
The Company is a bank holding company which operates primarily through its subsidiary, the Bank. The Company's primary objective is to operate the Bank as a well capitalized, profitable, independent, community-oriented financial institution, serving customers in its primary market area of Grays Harbor, Pierce, Thurston, Kitsap, King and Lewis counties. The Company's strategy is to provide products and superior service to small businesses and individuals located in its primary market area.
The Company's goal is to deliver returns to shareholders by focusing on the origination of higher-yielding assets (in particular, commercial real estate, construction, and commercial business loans), increasing core deposit balances, managing problem assets, efficiently managing expenses, and seeking expansion opportunities. The Company seeks to achieve these results by focusing on the following objectives:
Expand our presence within our existing market areas by capturing opportunities resulting from changes in the competitive environment. We currently conduct our business primarily in western Washington. We have a community bank strategy that emphasizes responsive and personalized service to our customers. As a result of the consolidation of banks in our market areas, we believe that there is an opportunity for a community and customer focused bank to expand its customer base. By offering timely decision making, delivering appropriate banking products and services, and providing customer access to our senior managers, that we believe that community banks, such as Timberland Bank, can distinguish themselves from larger banks operating in our market areas. We believe that we have a significant opportunity to attract additional borrowers and depositors and expand our market presence and market share within our extensive branch footprint.
Portfolio diversification. In recent years, we have limited the origination of speculative construction loans and land development loans in favor of loans that possess credit profiles representing less risk to the Bank. We continue originating owner/builder and custom construction loans, multi-family loans, commercial business loans and commercial real estate loans which offer higher risk adjusted returns, shorter maturities and more sensitivity to interest rate fluctuations than fixed ratefixed-rate one-to four-family loans. We anticipate capturing more of each customer's banking relationship by cross selling our loan and deposit products and offering additional services to our customers.
Increase core deposits and other retail deposit products. We focus on establishing a total banking relationship with our customers with the intent of internally funding our loan portfolio. We anticipate that the continued focus on customer relationships will increase our level of core deposits. In addition to our retail branches, we maintain technology based products such as business cash management and a business remote deposit product that enable us to compete effectively with banks of all sizes.
Managing exposure to fluctuating interest rates. For many years, the majority of the loans the Bank has retained in its portfolio have generally possessed periodic interest rate adjustment features or have been relatively short termshort-term in nature. Loans originated for portfolio retention have generally included ARM loans, short termshort-term construction loans, and, to a lesser extent, commercial business loans with interest rates tied to a market index such as the Prime Rate. Longer term fixed-rate mortgage loans have generally been originated for sale into the secondary market, although from time to time, the Bank may retain a portion of its fixed-rate mortgage loan originations and extend the initial fixed ratefixed-rate period of its hybrid ARM commercial real estate loans for asset/liability purposes.
Continue generating revenues through mortgage banking operations. The substantial majority of the fixed-rate residential mortgage loans we originate are sold into the secondary market with servicing retained. This strategy produces gains on the sale of such loans and reduces the interest rate and credit risk associated with fixed-rate residential lending. We continue to originate custom construction and owner owner/builder construction loans for sale into the secondary market upon the completion of construction.
Maintaining strong asset quality. We believe that strong asset quality is a key to our long-term financial success. The percentage of non-performing loans to loans receivable, net was 0.34%0.29% and 0.18%0.28% at September 30, 20192021 and 2018,2020, respectively. The Company's percentage of non-performing assets to total assets at September 30, 20192021 was 0.40%0.18% compared to 0.36%0.27% at September 30, 2018.2020. Non-performing assets have decreased to $5.01$3.17 million at September 30, 20192021 from $21.91$14.98 million at September 30, 2014.2015. We continue to seek to reduce the level of non-performing assets through collections, write-downs, modifications and sales of OREO. We also take proactive steps to resolve our non-performing loans, including negotiating payment plans, forbearances, loan modifications and loan extensions and accepting short payoffs on delinquent loans when such actions
have been deemed appropriate. We have also accepted short payoffs on delinquent loans, particularly when such payoffs result in a smaller loss to us than foreclosure. Although the Company plans to continue to place emphasis on certain lending products, such as commercial real estate loans, construction loans, and commercial business loans, the Company expects to continue to manage its credit exposures through the use of experienced bankers and an overall conservative approach to lending.
Selected Financial Data
The following table sets forth certain information concerning the consolidated financial position and results of operations of the Company and its subsidiary at and for the dates indicated. The consolidated data is derived in part from, and should be read in conjunction with, the Consolidated Financial Statements of the Company and its subsidiary presented herein.
| | | | | | | | | | | | | | | | | | | | | | | | | | | | | |
| | At September 30, |
| | 2021 | | 2020 | | 2019 | | 2018 | 2 | 2017 |
| | (In thousands) |
| SELECTED FINANCIAL CONDITION DATA: | | | | | | | | |
| | | | | | | | | |
| Total assets | $ | 1,792,180 | | | $ | 1,565,978 | | | $ | 1,247,132 | | | $ | 1,018,290 | | | $ | 952,024 | |
| Loans receivable, net | 968,454 | | | 1,013,875 | | | 886,662 | | | 725,391 | | | 690,364 | |
| MBS and other investments held-to-maturity | 69,102 | | | 27,890 | | | 31,102 | | | 12,810 | | | 7,139 | |
| MBS and other investments available-for-sale | 63,176 | | | 57,907 | | | 22,532 | | | 1,154 | | | 1,241 | |
| FHLB Stock | 2,103 | | | 1,922 | | | 1,437 | | | 1,190 | | | 1,107 | |
| Other investments | 3,000 | | | 3,000 | | | 3,000 | | | 3,000 | | | 3,000 | |
| Cash and due from financial institutions, interest-bearing deposits in banks and fed funds sold | 580,196 | | | 314,452 | | | 143,015 | | | 148,864 | | | 148,188 | |
| Certificates of deposit held for investment | 28,482 | | | 65,545 | | | 78,346 | | | 63,290 | | | 43,034 | |
| OREO and other repossessed assets | 157 | | | 1,050 | | | 1,683 | | | 1,913 | | | 3,301 | |
| Deposits | 1,570,555 | | | 1,358,406 | | | 1,068,227 | | | 889,506 | | | 837,898 | |
| FHLB advances | 5,000 | | | 10,000 | | | — | | | — | | | — | |
| | | | | | | | | |
| Shareholders' equity | 206,899 | | | 187,630 | | | 171,067 | | | 124,657 | | | 111,000 | |
| | | | | | | | | |
| | | | | | | | | |
| | | | | | | | | |
| | | | | | | | | |
| | | | | | | | | |
| | Year Ended September 30, |
| | 2021 | | 2020 | | 2019 | | 2018 | | 2017 |
| | (In thousands, except per share data) |
| SELECTED OPERATING DATA: | | | | | | | | | |
| | | | | | | | | |
| Interest and dividend income | $ | 54,962 | | | $ | 55,583 | | | $ | 55,725 | | | $ | 41,833 | | | $ | 38,338 | |
| Interest expense | 3,104 | | | 4,701 | | | 4,565 | | | 2,778 | | | 3,197 | |
| Net interest income | 51,858 | | | 50,882 | | | 51,160 | | | 39,055 | | | 35,141 | |
| Provision for loan losses | — | | | 3,700 | | | — | | | — | | | (1,250) | |
| Net interest income after provision for loan losses | 51,858 | | | 47,182 | | | 51,160 | | | 39,055 | | | 36,391 | |
| Non-interest income | 17,161 | | | 17,188 | | | 14,341 | | | 12,544 | | | 12,368 | |
| Non-interest expense | 34,591 | | | 34,063 | | | 35,580 | | | 29,177 | | | 27,516 | |
| Income (loss) before income taxes | 34,428 | | | 30,307 | | | 29,921 | | | 22,422 | | | 21,243 | |
| Provision for state income taxes | — | | | — | | | — | | | — | | | — | |
| Provision (benefit) for federal income taxes | 6,845 | | | 6,038 | | | 5,901 | | | 5,701 | | | 7,076 | |
| Net income (loss) | $ | 27,583 | | | $ | 24,269 | | | $ | 24,020 | | | $ | 16,721 | | | $ | 14,167 | |
| | | | | | | | | |
| | | | | | | | | |
| | | | | | | | | |
| | | | | | | | | |
| | | | | | | | | |
| Net income (loss) per common share: | | | | | | | | | |
| Basic | $ | 3.31 | | | $ | 2.91 | | | $ | 2.89 | | | $ | 2.28 | | | $ | 1.99 | |
| Diluted | $ | 3.27 | | | $ | 2.88 | | | $ | 2.84 | | | $ | 2.22 | | | $ | 1.92 | |
| Dividends per common share | $ | 1.03 | | | $ | 0.85 | | | $ | 0.78 | | | $ | 0.60 | | | $ | 0.50 | |
| Dividend payout ratio (1) | 31.14 | % | | 29.19 | % | | 27.04 | % | | 26.5 | % | | 25.7 | % |
______________(1)Cash dividends to common shareholders divided by net income to common shareholders.
| | | | | | | | | | | | | | | | | | | | | | | | | | | | | |
| | At September 30, |
| 2021 | | 2020 | | 2019 | | 2018 | | 2017 |
| OTHER DATA: | | | | | | | | | |
| | | | | | | | | |
| Number of real estate loans outstanding | 2,290 | | | 2,508 | | | 2,766 | | | 2,550 | | | 2,593 | |
| Deposit accounts | 58,454 | | | 58,566 | | | 59,547 | | | 55,441 | | | 54,707 | |
| Full-service offices | 24 | | | 24 | | | 24 | | | 22 | | | 22 | |
| | | | | | | | | |
| | | | | | | | | |
| | At or For the Year Ended September 30, |
| | 2021 | | 2020 | | 2019 | | 2018 | | 2017 |
| KEY FINANCIAL RATIOS: | | | | | | | | | |
| | | | | | | | | |
| Performance Ratios: | | | | | | | | | |
| Return (loss) on average assets (1) | 1.64 | % | | 1.75 | % | | 1.96 | % | | 1.70 | % | | 1.53 | % |
| Return (loss) on average equity (2) | 13.98 | | | 13.59 | | | 14.91 | | | 14.27 | | | 13.65 | |
| Interest rate spread (3) | 3.13 | | | 3.70 | | | 4.31 | | | 4.10 | | | 3.93 | |
| Net interest margin (4) | 3.25 | | | 3.90 | | | 4.50 | | | 4.23 | | | 4.07 | |
| Average interest-earning assets to average interest-bearing liabilities | 162.08 | | | 155.98 | | | 148.15 | | | 144.17 | | | 137.75 | |
| Non-interest expense as a percent of average total assets | 2.06 | | | 2.45 | | | 2.91 | | | 2.96 | | | 2.98 | |
| | | | | | | | | |
| Efficiency ratio (5) | 50.12 | | | 50.04 | | | 54.32 | | | 56.55 | | | 57.92 | |
| | | | | | | | | |
| Asset Quality Ratios: | | | | | | | | | |
| Non-accrual and 90 days or more past due loans as a percent of total loans receivable, net | 0.29 | % | | 0.28 | % | | 0.34 | % | | 0.18 | % | | 0.28 | % |
| Non-performing assets as a percent of total assets (6) | 0.18 | | | 0.27 | | | 0.40 | | | 0.36 | | | 0.60 | |
| Allowance for loan losses as a percent of total loans receivable, net (7) | 1.37 | | | 1.31 | | | 1.08 | | | 1.30 | | | 1.36 | |
| Allowance for loan losses as a percent of non-performing loans (8) | 471.93 | | | 461.76 | | | 319.49 | | | 723.61 | | | 499.90 | |
| Net charge-offs (recoveries) to average outstanding loans | — | | | — | | | (0.02) | | | — | | | (0.14) | |
| Capital Ratios: | | | | | | | | | |
| Total equity-to-assets ratio | 11.54 | % | | 11.98 | % | | 13.71 | % | | 12.24 | % | | 11.66 | % |
| Average equity to average assets | 11.74 | | | 12.85 | | | 13.17 | | | 11.90 | | | 11.25 | |
__________________(1)Net income divided by average total assets.
(2)Net income divided by average total equity.
(3)Difference between weighted average yield on interest-earning assets and weighted average cost of interest-bearing liabilities.
(4)Net interest income before provision for (recapture of) loan losses as a percentage of average interest-earning assets.
(5)Non-interest expenses divided by the sum of net interest income and non-interest income.
(6)Non-performing assets include non-accrual loans, loans past due 90 days or more and still accruing, non-accrual investment securities, OREO and other repossessed assets.
(7)Loans receivable is before the allowance for loan losses.
(8)Non-performing loans include non-accrual loans and loans past due 90 days or more and still accruing. TDRs that are on accrual status are not included.
Critical Accounting Policies and Estimates
The Company has established various accounting policies that govern the application of GAAP in the preparation of the Company's Consolidated Financial Statements. The Company has identified six policies that, as a result of judgments,
estimates and assumptions inherent in those policies, are critical to an understanding of the Company's Consolidated Financial Statements. These policies relate to the methodology for the determination of the allowance for loan losses, the determination of any OTTI in the fair value of investment securities, the valuation of loan servicing rights, the valuation of OREO, the valuation of assets acquired and liabilities assumed in the South Sound Acquisitionacquisitions and the valuation of goodwill for potential impairment. These policies and the judgments, estimates and assumptions are described in greater detail in the notes to the Consolidated Financial Statements contained in Item 8 of this Form 10-K. In particular, Note 1 to the Consolidated Financial Statements, “Summary of Significant Accounting Policies,” generally describes the Company's accounting policies. Management believes that the judgments, estimates and assumptions used in the preparation of the Company's Consolidated Financial Statements are appropriate given the factual circumstances at the time. However, given the sensitivity of the Company's Consolidated Financial Statements to these critical policies, the use of other judgments, estimates and assumptions could result in material differences in the Company's results of operations or financial condition.
Further, subsequent changes in economic or market conditions could have a material impact on these estimates and our financial condition and operating results in future periods. There have been no significant changes in our application of accounting policies since September 30, 2021. For additional information concerning critical accounting policies, see Note 1 of the Notes to Consolidated Financial Statements contained in "Item 8. Financial Statements and Supplementary Data." and the following:
Provision and Allowance for Loan Losses
The methodology for determining the allowance for loan losses is considered a critical accounting policy by management because of the high degree of judgment involved, the subjectivity of the assumptions used, and the potential for changes in the economic environment that could result in changes to the amount of the recorded allowance for loan losses. The provision for loan losses reflects the amount required to maintain the allowance for loan losses at an appropriate level based upon management’s evaluation of the adequacy of general and specific loss reserves. Determining the amount of the allowance for loan losses involves a high degree of judgment. Among the material estimates required to establish the allowance for loan losses are: overall economic conditions; value of collateral; strength of guarantors; loss exposure at default; the amount and timing of future cash flows on impaired loans; and determination of loss factors to be applied to the various elements of the portfolio. All of these estimates are susceptible to significant change. We have established systematic methodologies for the determination of the adequacy of our allowance for loan losses. The methodologies are set forth in a formal policy and take into consideration the need for an overall general valuation allowance as well as specific allowances that are tied to individual problem loans. We increase our allowance for loan losses by charging provisions for probable loan losses against our income.
The allowance for loan losses is maintained at a level sufficient to provide for probable losses based on evaluating known and inherent risks in the loan portfolio and upon our continuing analysis of the factors underlying the quality of the loan portfolio. These factors include, among others, changes in the size and composition of the loan portfolio, delinquency rates, actual loan loss experience, current and economic conditions, detailed analysis of individual loans for which full collectability may not be assured, and determination of the existence and realizable value of the collateral and guarantees securing the loans. Realized losses related to specific assets are applied as a reduction of the carrying value of the assets and charged immediately against the allowance for loan loss reserve. Recoveries on previously charged off loans are credited to the allowance for loan losses. The reserve is based upon factors and trends identified by us at the time financial statements are prepared. Although we use the best information available, future adjustments to the allowance for loan losses may be necessary due to economic, operating, regulatory and other conditions beyond our control. The adequacy of general and specific reserves is based on our continuing evaluation of the pertinent factors underlying the quality of the loan portfolio as well as individual review of certain large balance loans. Loans are considered impaired when, based on current information and events, we determine that it is probable that we will be unable to collect all amounts due according to the contractual terms of the loan agreement. Factors involved in determining impairment include, but are not limited to, the financial condition of the borrower, the value of the underlying collateral less selling costs and the current status of the economy. Impaired loans are measured based on the present value of expected future cash flows discounted at the loan’s effective interest rate or, as a practical expedient, at the loan’s observable market price or the fair value of collateral if the loan is collateral dependent. We continue to assess the collateral of these loans and update our appraisals on large balance impaired loans on an annual basis. To the extent the property values decline, there could be additional losses on these impaired loans, which may be material. Subsequent changes in the value of impaired loans are included within the provision for loan losses in the same manner in which impairment initially was recognized or as a reduction in the provision that would otherwise be reported. Large groups of smaller-balance homogeneous loans are collectively evaluated for impairment. Loans that are collectively evaluated for impairment include residential real estate and consumer loans and, as appropriate, smaller balance non-homogeneous loans. Larger balance non-homogeneous residential construction and land, commercial real estate, commercial business loans and unsecured loans are individually evaluated for impairment.
Our methodology for assessing the appropriateness of the allowance for loan losses consists of several key elements, which include specific allowances, an allocated formula allowance and an unallocated allowance. Losses on specific loans are provided for when the losses are probable and estimable. General loan loss reserves are established to provide for inherent loan portfolio risks not specifically provided for. The level of general reserves is based on analysis of potential exposures existing in
our loan portfolio including evaluation of historical trends, current market conditions and other relevant factors identified by us at the time the financial statements are prepared. The formula allowance is calculated by applying loss factors to outstanding loans, excluding those loans that are subject to individual analysis for specific allowances. Loss factors are based on our historical loss experience adjusted for significant environmental considerations, including the experience of other banking organizations, which in our judgment affect the collectability of the loan portfolio as of the evaluation date. The unallocated allowance is based upon our evaluation of various factors that are not directly measured in the determination of the formula and specific allowances. This methodology may result in actual losses or recoveries differing significantly from the allowance for loan losses in the Consolidated Financial Statements.
While we believe the estimates and assumptions used in our determination of the adequacy of the allowance for loan losses are reasonable, there can be no assurance that such estimates and assumptions will not be proven incorrect in the future, or that the actual amount of future provisions will not exceed the amount of past provisions or that any increased provisions that may be required will not adversely impact our financial condition and results of operations. In addition, the determination of the amount of the Banks’ allowance for loan losses is subject to review by bank regulators as part of the routine examination process, which may result in the adjustment of reserves based upon their judgment of information available to them at the time of their examination.
Fair Value Accounting and Measurement
We use fair value measurements to record fair value adjustments to certain financial assets and liabilities and to determine fair value disclosures. We include in the Notes to the Consolidated Financial Statements information about the extent to which fair value is used to measure financial assets and liabilities, the valuation methodologies used and the impact on our results of operations and financial condition. Additionally, for financial instruments not recorded at fair value we disclose, where required, our estimate of their fair value. For more information regarding fair value accounting, please refer to Note 18 in the Notes to the Consolidated Financial Statements.
Loan Servicing Rights
Loan servicing rights are recognized as separate assets when rights are acquired through purchase or through sale of loans. Generally, purchased loan servicing rights are capitalized at the cost to acquire the rights. For sales of mortgage loans, the value of the loan servicing right is estimated and capitalized. Fair value is based on market prices for comparable loan servicing contracts. The fair value of the loan servicing rights includes an estimate of the life of the underlying loans which is affected by estimated prepayment speeds. The estimate of prepayment speeds is based on current market conditions. Actual market conditions could vary significantly from current conditions which could result in the estimated life of the underlying loans being different which would change the fair value of the loan servicing right. Capitalized loan servicing rights are reported in other assets and are amortized into non-interest income in proportion to, and over the period of, the estimated future net servicing income of the underlying financial assets.
Valuation of OREO
Real estate properties acquired through foreclosure or by deed-in-lieu of foreclosure are recorded at the lower of cost or fair value less estimated costs to sell. Fair value is generally determined by management based on a number of factors, including third-party appraisals of fair value in an orderly sale. Accordingly, the valuation of OREO is subject to significant external and internal judgment. If the carrying value of the loan at the date a property is transferred into OREO exceeds the fair value less estimated costs to sell, the excess is charged to the allowance for loan losses. Management periodically reviews OREO values to determine whether the property continues to be carried at the lower of its recorded book value or fair value, net of estimated costs to sell. Any further decreases in the value of OREO are considered valuation adjustments and are charged to non-interest expense in the Consolidated Income Statements. Expenses and income from the maintenance and operations and any gains or losses from the sales of OREO are included in non-interest expense.
Business Combinations
The Company applies the acquisition method of accounting for business combinations. Under the acquisition method, the acquiring entity in a business combination recognizes all of the identifiable assets acquired and liabilities assumed at their acquisition date fair values. Management utilizes prevailing valuation techniques appropriate for the asset or liability being measured in determining these fair values. Any excess of the purchase price over amounts allocated to assets acquired, including identifiable intangible assets, and liabilities assumed is recorded as goodwill. Where amounts allocated to assets acquired and liabilities assumed is greater than the purchase price, a bargain purchase gain is recognized. Acquisition-related costs are expensed as incurred unless they are directly attributable to the issuance of the Company's common stock in a business combination and the Company chooses to record these acquisition-related costs through stockholders' equity. There were no
business combinations during the years ended September 30, 2021 and September 30, 2020. For additional information see Note (2) Business Combination of the Notes to Consolidated Financial Statements included in Item 8. Financial Statements..
Goodwill
Goodwill represents the excess of the purchase consideration paid over the fair value of the assets acquired, net of the fair values of liabilities assumed in a business combination and is not amortized but is reviewed annually, or more frequently as current circumstances and conditions warrant, for impairment. An assessment of qualitative factors is completed to determine if it is more likely than not that the fair value of a reporting unit is less than its carrying amount. The qualitative assessment involves judgment by management on determining whether there have been any triggering events that have occurred which would indicate potential impairment. If the qualitative analysis concludes that further analysis is required, then a quantitative impairment test would be completed. The quantitative goodwill impairment test is used to identify the existence of impairment and the amount of impairment loss and compares the reporting unit's estimated fair values, including goodwill, to its carrying amount. If the fair value exceeds the carry amount then goodwill is not considered impaired. If the carrying amount exceeds its fair value, an impairment loss would be recognized equal to the amount of excess, limited to the amount of total goodwill allocated to the reporting unit. The impairment loss would be recognized as a charge to earnings.
Market Risk and Asset and Liability Management
General. Market risk is the risk of loss from adverse changes in market prices and rates. The Bank's market risk arises primarily from interest rate risk inherent in its lending, investment, deposit and borrowing activities. The Bank, like other financial institutions, is subject to interest rate risk to the extent that its interest-earning assets reprice differently than its interest-bearing liabilities. Management actively monitors and manages its interest rate risk exposure. Although the Bank manages other risks, such as credit quality and liquidity risk, in the normal course of business, management considers interest rate risk to be its most significant market risk that could potentially have the largest material effect on the Bank's financial condition and results of operations. The Bank does not maintain a trading account for any class of financial instruments nor does it engage in hedging activities. Furthermore, the Bank is not subject to foreign currency exchange rate risk or commodity price risk.
Qualitative Aspects of Market Risk. The Bank's principal financial objective is to achieve long-term profitability while reducing its exposure to fluctuating market interest rates. The Bank has sought to reduce the exposure of its earnings to changes in market interest rates by attempting to manage the difference between asset and liability maturities and interest rates. The principal element in achieving this objective is to increase the interest rate sensitivity of the Bank's interest-earning assets by retaining in its portfolio, short-term loans and loans with interest rates subject to periodic adjustments. The Bank relies on retail deposits as its primary source of funds. As part of its interest rate risk management strategy, the Bank promotes transaction accounts and certificates of deposit with terms of up to five years.
The Bank has adopted a strategy that is designed to substantially match the interest rate sensitivity of assets relative to its liabilities. The primary elements of this strategy involve originating ARM loans for its portfolio, maintaining residential construction loans as a portion of total net loans receivable because of their generally shorter terms and higher yields than other one- to four-family residential mortgage loans, matching asset and liability maturities, investing in short-term securities, and originating fixed-rate loans for retention or sale in the secondary market while retaining the related loan servicing rights.
Sharp increases or decreases in interest rates may adversely affect the Bank's earnings. Management of the Bank monitors the Bank's interest rate sensitivity through the use of a model provided by NXTsoft Data Analytics, LLC (“NXTsoft”), a company that specializes in providing interest rate risk and balance sheet management services to the financial services industry. Based on a rate shock analysis prepared by NXTsoft based onusing data at September 30, 2019,2021, an immediate increase in interest rates of 100 basis points would increase the Bank’s projected net interest income by approximately 4.1%11.6%, primarily because a larger portion of the Bank's interest rate sensitive assets than interest rate sensitive liabilities would reprice within a one yearone-year period. Conversely, an immediate decrease in interest rates of 100 basis points would decrease the Bank's projected net interest income by approximately 6.9%4.7%. See “Quantitative Aspects of Market Risk” below for additional information. Management has sought to sustain the match between asset and liability maturities and rates, while maintaining an acceptable interest rate spread. Pursuant to this strategy, the Bank actively originates adjustable-rate loans for retention in its loan portfolio. Fixed-rate mortgage loans with maturities greater than seven years generally are originated for the immediate or future resale in the secondary mortgage market. Although the Bank has sought to originate ARM loans, the ability to originate such loans depends to a great extent on market interest rates and borrowers' preferences. In lower interest rate environments, borrowers often prefer fixed-rate loans.
Consumer, commercial business and construction loans typically have shorter terms and higher yields than permanent residential mortgage loans and, accordingly, reduce the Bank’s exposure to fluctuations in interest rates. At September 30, 2019,2021, the consumer, commercial business and construction loan portfolios amounted to $44.50$35.50 million, $64.76$115.50 million and $223.53$233.21 million, respectively or 4.5%3.3%, 6.5%10.7% and 22.5%21.5%, respectively of total loans receivable, respectively.receivable.
Quantitative Aspects of Market Risk. The model provided for the Bank by NXTsoft estimates the changes in net portfolio value ("NPV") and net interest income in response to a range of assumed changes in market interest rates. The model first estimates the level of the Bank's NPV (market value of assets, less market value of liabilities, plus or minus the market value of any off-balance sheet items) under the current rate environment. In general, market values are estimated by discounting the estimated cash flows of each instrument by appropriate discount rates. The model then recalculates the Bank's NPV under different interest rate scenarios. The change in NPV under the different interest rate scenarios provides a measure of the Bank's exposure to interest rate risk. The following table is provided by NXTsoft based on data at September 30, 2019:2021:
| | | Hypothetical | | Net Interest Income (1)(2) | | Current Market Value | Hypothetical | | Net Interest Income (1)(2) | | Current Market Value |
| Interest Rate | | Estimated | | $ Change | | % Change | | Estimated | | $ Change | | % Change | Interest Rate | | Estimated | | $ Change | | % Change | | Estimated | | $ Change | | % Change |
| Scenario (3) | | Value | | from Base | | from Base | | Value | | from Base | | from Base | Scenario (3) | | Value | | from Base | | from Base | | Value | | from Base | | from Base |
| (Basis Points) | | (Dollars in thousands) | (Basis Points) | | (Dollars in thousands) |
| +400 | | $ | 56,253 |
| | $ | 8,022 |
| | 16.63 | % | | $ | 298,884 |
| | $ | 49,110 |
| | 19.66 | % | +400 | | $ | 64,979 | | | $ | 21,229 | | | 48.52 | % | | $ | 380,546 | | | $ | 77,037 | | | 25.38 | % |
| +300 | | 54,204 |
| | 5,973 |
| | 12.38 |
| | 287,693 |
| | 37,919 |
| | 15.18 |
| +300 | | 59,502 | | | 15,752 | | | 36.00 | | | 362,045 | | | 58,536 | | | 19.29 | |
| +200 | | 52,218 |
| | 3,987 |
| | 8.27 |
| | 276,148 |
| | 26,374 |
| | 10.56 |
| +200 | | 54,114 | | | 10,364 | | | 23.69 | | | 343,326 | | | 39,817 | | | 13.12 | |
| +100 | | 50,201 |
| | 1,970 |
| | 4.08 |
| | 263,419 |
| | 13,645 |
| | 5.46 |
| +100 | | 48,813 | | | 5,063 | | | 11.57 | | | 323,599 | | | 20,090 | | | 6.62 | |
| BASE | | 48,231 |
| | — |
| | — |
| | 249,774 |
| | — |
| | — |
| BASE | | 43,750 | | | — | | | — | | | 303,509 | | | — | | | — | |
| -100 | | 44,887 |
| | (3,344 | ) | | (6.93 | ) | | 228,935 |
| | (20,839 | ) | | (8.34 | ) | -100 | | 41,683 | | | (2,067) | | | (4.73) | | | 272,535 | | | (30,974) | | | (10.21) | |
| -200 | | 42,354 |
| | (5,877 | ) | | (12.19 | ) | | 209,148 |
| | (40,626 | ) | | (16.26 | ) | -200 | | 41,017 | | | (2,733) | | | (6.25) | | | 263,110 | | | (40,399) | | | (13.31) | |
| -300 | | 42,014 |
| | (6,217 | ) | | (12.89 | ) | | 231,509 |
| | (18,265 | ) | | (7.31 | ) | |
|
___________
| |
(1) | Does not include loan fees. |
| |
(2) | Includes BOLI income, which is included in non-interest income in the Consolidated Financial Statements. |
| |
(3) | No rates in the model are allowed to go below zero. |
(1)Does not include loan fees.
(2)Includes BOLI income, which is included in non-interest income in the Consolidated Financial Statements.
(3)No rates in the model are allowed to go below zero.
Computations of prospective effects of hypothetical interest rate changes are based on numerous assumptions, including relative levels of market interest rates, loan repayments and deposit decay, and should not be relied upon as indicative of actual results. Furthermore, the computations do not reflect any actions management may undertake in response to changes in interest rates.
In the event of a 100 basis point decrease in interest rates, the Bank would be expected to experience an 8.3%a 10.6% decrease in NPV and a 6.9%4.7% decrease in net interest income. In the event of a 100 basis point increase in interest rates, a 5.5%6.9% increase in NPV and a 4.1%11.6% increase in net interest income would be expected. Based upon the modeling described above, the Bank's asset and liability structure generally results in increases in net interest income and NPV in a rising interest rate scenario and decreases in net interest income and NPV in a declining interest rate scenario.
As with any method of measuring interest rate risk, certain shortcomings are inherent in the method of analysis presented in the foregoing table. For example, although certain assets and liabilities may have similar maturities or periods to repricing, they may react in different degrees to changes in market interest rates. Also, the interest rates on certain types of assets and liabilities may fluctuate in advance of changes in market interest rates, while interest rates on other types may lag behind changes in market rates. Additionally, certain assets have features which restrict changes in interest rates on a short-term basis and over the life of the asset. Further, in the event of a change in interest rates, expected rates of prepayments on loans and early withdrawals from certificates of deposit could possibly deviate significantly from those assumed in calculating the table.
Comparison of Financial Condition at September 30, 20192021 and September 30, 20182020
The Company's total assets increased by $228.84$226.20 million, or 22.5%14.4%, to $1.25$1.79 billion at September 30, 20192021 from $1.02$1.57 billion at September 30, 2018.2020. The increase in assets was primarily due to an increase in total cash and cash equivalents, and to a much lesser extent, an increase in investment securities, partially offset by decreases in CDs held for investment and loans receivable. The increase in total assets was funded primarily due to the South Sound Acquisition, which resulted in
a $183.10 millionby an increase in total assets (including goodwill and net of cash consideration paid) at the acquisition date (October 1, 2018) and to a lesser extent, organic growth.deposits.
Net loans receivable increaseddecreased by $161.27$45.42 million, or 22.2%(4.5)%, to $886.66$968.45 million at September 30, 20192021 from $725.39 million$1.01 billion at September 30, 2018,2020, primarily due to decreases in SBA PPP loans, acquiredand smaller decreases in the South Sound Acquisition ($121.54 million at the acquisition date)several other loan categories. These decreases to net loans receivable were partially offset by increases in commercial real estate and to a lesser extent, organicconstruction loans, and smaller increases in several other loan growth.categories.
Total deposits increased by $178.72$212.15 million, or 20.1%15.6%, to $1.07$1.57 billion at September 30, 20192021 from $889.51 million$1.36 billion at September 30, 2018,2020, primarily due to deposits acquiredincreases in the South Sound Acquisition ($151.54 million at the acquisition date)non-interest-bearing demand account balances, NOW checking account balances, money market account balances, and tosavings account balances. These increases were partially offset by a lesser extent, organicdecrease in certificates of deposit growth.account balances.
Shareholders' equity increased by $46.41$19.27 million, or 37.2%10.3%, to $171.07$206.90 million at September 30, 20192021 from $124.66$187.63 million at September 30, 2018.2020. The increase was primarily due to $28.27 million in common stock issued in the South Sound Acquisition and net income for the year ended September 30, 20192021 of $24.02$27.58 million which was partially offset by $8.59 million in dividends paid to shareholders of $6.50 million.shareholders.
A more detailed explanation of the changes in significant balance sheet categories follows:
Cash and Cash Equivalents: Cash and cash equivalents decreasedincreased by $5.85$265.74 million, or 3.9%84.5%, to $143.02$580.20 million at September 30, 20192021 from $148.86$314.45 million at September 30, 2018.2020. The decreaseincrease was primarily a result of an increase in total deposits, which exceeded the Company investing a portionfunds required for loan originations and purchases of its overnight liquidity intoinvestment securities.
CDs Held for Investment: CDs held for investment and investment securities.
decreased by $37.06 million, or 56.5%, to $28.48 million at September 30, 2021 from $65.55 million at September 30, 2020. Funds received as CDs Held for Investment:matured were invested into other higher yielding interest-earning assets as interest rates on CDs held for investment increased by $15.06 million, or 23.8%, to $78.35 million at September 30, 2019 from $63.29 million. The level of CDs held for investment increased as a portion ofdecreased during the Company's overnight liquidity was invested in CDs earning higher interest.year.
Investment Securities and Investments in Equity Securities: Investment securities and investments in equity securities increased by $40.63$46.46 million, or 290.9%53.6%, to $54.59$133.23 million at September 30, 20192021 from $13.96$86.77 million at September 30, 2018.2020. The increase was primarily due to investment securities that were acquired in the South Sound Acquisition ($24.72 million at the acquisition date) and the purchase of U.S. Treasury and U.S. government agency securities and additional agency and private label residential mortgage-backed investment securities as the Company put a portion of its excess overnight liquidity into higher-earning investment securities during the year ended September 30, 2019. Partially offsetting these2021. These increases was the sale of several investment securities acquired in the South Sound Acquisition along withwere partially offset by maturities, prepayments and scheduled amortization of other investment securities. For additional details on investment securities, see "Item 1. Business - Investment Activities" and Note 4 to the Consolidated Financial Statements contained in "Item 8. Financial Statements and Supplementary Data."
FHLB Stock: FHLB stock increased by $247,000,$181,000 or 20.8%9.4%, to $1.44$2.10 million at September 30, 20192021 from $1.11$1.92 million at September 30, 2018,2020, due to FHLB stock acquired in the South Sound Acquisition and purchases required by the FHLB due toas a result of the increase in total assets.
Other Investments: Other investments consist solely of the Company's investment in the Solomon Hess SBA Loan Fund LLC, which was unchanged at both September 30, 20192021 and September 30, 2018.2020. This investment is utilized to help satisfy compliance with the Company's Community Reinvestment Act ("CRA") investment test requirements.
Loans Held for Sale: Loans held for sale increased to $6.07decreased by $1.29 million, or 240.1%28.7%, at September 30, 2019 from $1.79to $3.22 million at September 30, 2018,2021 from $4.51 million at September 30, 2020, primarily due to the timing and volume of mortgage banking loan sales. The Company sells longer-term fixed-rate residential loans and the guaranteed portion of SBA commercial business loans for asset-liability management purposes and to generate non-interest income. The Company sold $73.03$150.20 million in loans during the year ended September 30, 20192021 compared to $66.38$167.24 million for the year ended September 30, 2018.2020. Sales of loans over the past two years have increased, from historical levels, primarily due to increased refinance activity for one- to four-family loans due to the decrease in mortgage interest rates.
Loans Receivable, Net of Allowance for Loan Losses: Net loans receivable increaseddecreased by $161.27$45.42 million, or 22.2%(4.5)%, to $886.66$968.45 million at September 30, 20192021 from $725.39 million$1.01 billion at September 30, 2018.2020. The increasedecrease was primarily due to an $85.90 million decrease in SBA PPP loans, acquireda $5.64 million decrease in the South Sound Acquisition ($121.54 million at the acquisition date)land loans, and tosmaller decreases in several other loan categories. These decreases were partially offset by a lesser extent, organic loan growth. The increase consisted of a $74.00$17.08 million increase in commercial real estate loans, a $35.17$13.71 million increase in construction loans, a $21.71 million increase in commercial business loans, a $16.72 million increase in one- to four-family loans, a $14.11 million increase in multi-family loans, and smaller increases in several other loan categories. These increases wereThe SBA PPP loan balances decreased primarily due to borrowers applying for forgiveness from the SBA and the loans being subsequently paid off by the SBA and was partially offset by a $9.00 million increasenew SBA PPP loans funded after the renewal of the program in the undisbursed portion of construction loans in process.December 2020.
Loan originations increased by $26.44$5.16 million, or 8.0%0.9%, to $356.04$602.34 million for the year ended September 30, 20192021 from $329.59$597.19 million for the year ended September 30, 2018.2020. The increase in loan originations was primarily due to an increase in
increased demand for commercial real estate and construction loans, originated as compared to the prior fiscal year. which was partially offset by a decrease in SBA PPP loans funded.
For additional information on loans, see "Item 1. Business - Lending Activities" and Note 5 to the Consolidated Financial Statements contained in "Item 8, Financial Statements and Supplementary Data."
Premises and Equipment:Equipment, Net: Premises and equipment increaseddecreased by $3.88 million,$668,000, or 20.5%2.9%, to $22.83$22.37 million at September 30, 20192021 from $18.95$23.04 million at September 30, 2018.2020. The increasedecrease was primarily due to premises and equipment acquired in the South Sound Acquisition ($3.34 million at the acquisition date) and a branch remodeling project, which was partially offset by normal depreciation. For additional information on premises and equipment, see "Item 2. Properties" and Note 6 to the Consolidated Financial Statements contained in "Item 8. Financial Statements and Supplementary Data."
OREO and Other Repossessed Assets: OREO and other repossessed assets decreased by $230,000,$893,000, or 12.0%85.0%, to $1.68$157,000 at September 30, 2021 from $1.05 million at September 30, 2019 from $1.91 million at September 30, 2018.2020. The decrease was primarily due to the sales of $524,000$893,000 in OREO properties and other repossessed assets and OREO valuation write-downs of $24,000. These decreases inproperties. At September 30, 2021, total OREO and other repossessed assets were partially offset by the addition of $318,000 in OREO properties and other repossessed assets. At September 30, 2019, the OREO balance was comprised of 12 individual properties. The properties consisted of 11three land parcels totaling $1.66 million, and one commercial real estate properties totaling $25,000. The largest OREO property at September 30, 2019 was an undeveloped land parcel located in Lewis County with a balance of $874,000.$157,000. For additional information on OREO and other repossessed assets, see "Item 1. Business - Lending Activities - Other Real Estate Owned and Other Repossessed Assets" and Note 7 to the Consolidated Financial Statements contained in "Item 8. Financial Statements and Supplementary Data."
Bank Owned Life Insurance ("BOLI"): BOLI increased by $1.19 million,$597,000, or 6.0%2.8%, to $21.01$22.19 million at September 30, 20192021 from $19.81$21.60 million at September 30, 2018.2020. The increase was primarily due to net BOLI acquiredearnings, representing the increase in the South Sound Acquisition ($2.63 million at the acquisition date) and normal increases in the cash surrender value of BOLI policies. These increases were partially offset by a death benefit claim during the year which reduced the BOLI cash surrender value by $2.05 million.policies.
Goodwill: The recorded amount of goodwill increased by $9.48 million, or 167.8%, toremained unchanged at $15.13 million at both September 30, 2019 from $5.65 million at2021 and September 30, 2018, due to the goodwill recorded in the South Sound Acquisition.2020. The Company performed its annual review of goodwill during the quarter ended June 30, 20192021 and determined that there was no impairment. As of September 30, 2019,2021, management believes that there had been no subsequent events or changes in circumstances that would indicate a potential impairment of goodwill. For additional information on goodwill, see Note 8 to the Consolidated Financial Statements contained in "Item 8. Financial Statements and Supplementary Data."
CDI: CDI increaseddecreased by $361,000, or 22.2% to $2.03$1.26 million at September 30, 20192021 from $1.63 million at September 30, 2020 due to $2.48 million of CDI recorded in the South Sound Acquisition, net of $452,000 in amortization for the year.scheduled amortization. For additional information on CDI, see Note 8 to the Consolidated Financial Statements contained in "Item 8. Financial Statements and Supplementary Data."
Loan Servicing Rights: ServicingRights, Net: Loan servicing rights increased by $380,000,$387,000, or 18.7%12.5%, to $2.41$3.48 million at September 30, 20192021 from $2.03$3.10 million at September 30, 2018,2020, primarily due to SBA servicing rights acquired in the South Sound Acquisition ($281,000 at the acquisition date) and additional capitalized Freddie Mac servicing rights for new loans being serviced,sold with servicing retained, and a $110,000 valuation recovery, which was partially offset by amortization. The principal amount of loans serviced for Freddie Mac and the SBA increaseddecreased by $27.44 million, or 7.4%,$144,000 to $399.12$426.44 million at September 30, 20192021 from $371.68$426.58 million at September 30, 2018.2020. For additional information on loan servicing rights, see Note 9 to the Consolidated Financial Statements contained in "Item 8. Financial Statements and Supplementary Data."
OtherOperating Lease Right-of-Use Assets: OtherOperating lease ROU assets increaseddecreased by $2.65 million,$304,000, or 99.2%11.8%, to $5.32$2.28 million at September 30, 20192021 from $2.67$2.59 million at September 30, 2018.2020, primarily due to the amortization of the ROU assets. The increaseoperating lease ROU assets at September 30, 2021 represented the present value of three operating leases on branch facilities. For additional information on leases, see Note 10 to the Consolidated Financial Statements contained in "Item 8. Financial Statements and Supplementary Data."
Other Assets: Other assets decreased by $425,000, or 12.9%, to $2.87 million at September 30, 2021 from $3.30 million at September 30, 2020. The decrease was primarily due to a $1.21 milliondecreases in miscellaneous receivables (including income tax receivable at September 30, 2019receivables) and other assets acquired in the South Sound Acquisition.prepaid expenses.
Deposits: Deposits increased by $178.72$212.15 million, or 20.1%15.6%, to $1.07$1.57 billion at September 30, 20192021 from $889.51 million$1.36 billion at September 30, 2018.2020. The increase in total deposits was primarily due to deposits acquired in the South Sound Acquisition ($151.54 million at the acquisition date) and, to a lesser extent, organic deposit growth. The increase in total deposits consisted of a $71.77$93.32 million increase in non-interest bearing demand account balances, a $53.20 million increase in NOW checking account balances, a $63.21 million increase in non-interest-bearing demand account balances, a $23.85 million increase in CD account balances, a $13.10 million increase in savings account balances and a $6.79$49.20 million increase in money market account balances, and a $40.82 increase in savings account balances. These increases were partially offset by a $24.40 million decrease in certificates of deposit account balances. The organic increase in deposits was primarily due to increased commercialdriven by proceeds from SBA PPP loans and consumer checkinggovernment stimulus checks deposited directly into customer accounts, as the Company continued to emphasize increasing its transactionorganic growth in customer relationships and reduced withdrawals from deposit accounts base. The Company also experienced deposit inflows due to a numberchange in spending habits as a result of customers transferring funds from other financial institutions that consolidated or closed branches during the year ended September 30, 2019.COVID-19. For additional information on deposits, see "Item 1. Business - Deposit Activities and Other Sources of Funds" and Note 11 to the Consolidated Financial Statements contained in "Item 8. Financial Statements and Supplementary Data."
FHLB Borrowings: The Company has short- and long-term borrowing lines with the FHLB with total credit available on the lines equal to 45% of the Bank's total assets, limited by available collateral. FHLB borrowings decreased to $5.00 million at September 30, 2021 from $10.00 million at September 30, 2020. At September 30, 2021, FHLB borrowings
consisted of a single $5.00 million borrowing, with a scheduled maturity in March 2025. For additional information on FHLB borrowings, see Note 12 to the Consolidated Financial Statements contained in "Item 8. Financial Statements and Supplementary Data".
Operating Lease Liabilities: Operating lease liabilities decreased by $271,000, or 10.3%, to $2.36 million at September 30, 2021 from $2.63 million at September 30, 2020, primarily due to required annual lease payments. The operating lease liability at September 30, 2021 represented the present value of three operating leases on branch facilities. For additional information on leases, see Note 10 to the Consolidated Financial Statements contained in "Item 8. Financial Statements and Supplementary Data."
Other Liabilities and Accrued Expenses:Other liabilities and accrued expenses increased by $3.71 million,$55,000, or 89.9%0.8%, to $7.84$7.37 million at September 30, 20192021 from $4.13$7.31 million at September 30, 2018.2020. The increase was primarily due to liabilities assumedtiming differences in the South Sound Acquisition.normal course of business.
Shareholders' Equity: Total shareholders' equity increased by $46.41$19.27 million, or 37.2%10.3%, to $171.07$206.90 million at September 30, 20192021 from $124.66$187.63 million at September 30, 2018.2020. The increase was primarily due to $28.27 million in common stock issued in the South Sound Acquisition and net income of $24.02$27.58 million for the year ended September 30, 2019,2021, which was partially offset by the payment of $6.50$8.59 million in dividends to common shareholders and the repurchase of 20,44019,588 shares of the Company's common stock for $499,000$527,000 during the year ended September 30, 2019.2021. For additional information on shareholders' equity, see the Consolidated Statements of Shareholders' Equity contained in "Item 8. Financial Statements and Supplementary Data."
Comparison of Operating Results for the Years Ended September 30, 20192021 and 20182020
Net income for the year ended September 30, 20192021 increased by $7.30$3.31 million, or 43.7%13.7%, to $24.02$27.58 million from $16.72$24.27 million for the year ended September 30, 2018.2020. Net income per diluted common share increased by $0.62,$0.39, or 27.9%13.5%, to $2.84$3.27 for the year ended September 30, 20192021 from $2.22$2.88 for the year ended September 30, 2018.2020. The increase in net income was primarily due to a $3.70 million decrease in the provision for loan losses and a $976,000 increase in net-interest income. These increases in net interest income and non-interest income and a decrease in the Company's effective income tax rate. These increases to net income were partially offset by ana $528,000 increase in non-interest expense. The increases in net interest incomeexpense and non-interest expense were primarily the result of the South Sound Acquisition. Thean $807,000 increase in non-interestthe provision for income was primarily due to an increase in BOLI net earnings as a result of a death benefit claim.taxes.
A more detailed explanation of the income statement categories is presented below.
Net Interest Income: Net interest income increased by $12.11 million,$976,000, or 31.0%1.9%, to $51.16$51.86 million for the year ended September 30, 20192021 from $39.06$50.88 million for the year ended September 30, 2018.2020. The increase in net interest income was primarily due to an increase in the average balance of interest-earning assets and a decrease in the average cost of deposits, which was partially offset by a decrease in the average yield on interest-earning assets.
Total interest and dividend income decreased by $621,000, or 1.1%,to$54.96 million for the year ended September 30, 2021 from $55.58 million for the year ended September 30, 2020, primarily due to a decrease in the average yield on interest-earning assets, which was partially offset by an increase in interest expense.
Total interest and dividend income increased by $13.89 million, or 33.2%,the average balance of interest-earning assets. The average yield on interest-earnings assets decreased to $55.73 million3.45% for the year ended September 30, 20192021 from $41.83 million4.26% for the year ended September 30, 2018, primarily due2020, as market rates decreased following the 150 basis point decrease in the targeted federal funds rate in March 2020 in response to increasesthe COVID-19 pandemic, to a range of 0.00% to 0.25% at September 30, 2021 putting downward pressure on adjustable rate instruments combined with the impact of the low loan yields on the SBA PPP loan portfolio and lower loan yields on new loan originations. The substantial increase in both the average balance of interest-bearing deposits in banks and CDs balances as a result of the increase in deposit balances, is also negatively impacting the average yield on interest-earning assets.. Partially offsetting the decrease in the average yield on interest-earning assets was an increase in the average balance of interest-earning assets. Average total interest-earning assets increased by $213.42$291.83 million, or 22.4%, to $1.14$1.60 billion for the year ended September 30, 20192021 from $923.44 million$1.30 billion for the year ended September 30, 2018, primarily due to interest-earning assets acquired in the South Sound Acquisition. The yield on average interest-earning assets increased to 4.90% for the year ended September 30, 2019 from 4.53% for the year ended September 30, 2018.
2020. Interest income on loans receivable and loans held for sale increased by $10.83$1.19 million, or 28.3%2.3%, to $49.13$52.54 million for the year ended September 30, 20192021 from $38.30$51.34 million for the year ended September 30, 2018,2020, primarily due to ana $56.34 million increase in the average balance of loans receivable of $157.51 million during the year and tocurrent year. This increase was partially offset by a lesser extent, an increasedecrease in the average yield on loans receivable to 5.59%5.12% for the year ended September 30, 2021 from 5.31%. 5.29% for the year ended September 30, 2020.
During the year ended September 30, 2019,2021, the accretion of the purchase accounting fair value discount on loans acquired in the South Sound Acquisition increased interest income on loans by $645,000.$340,000 compared to $597,000 for the year ended September 30, 2020. The accretion of the net fair value discount on acquired loans increased the average yield on loans by seventhree basis points duringfor the year ended September 30, 2019.2021 and six basis points for the year ended September 30, 2020. The incremental accretion and the impact on loan yield will change during any period based on the volume of prepayments, but it is
expected to decrease over time as the balance of the net discount declines. The remaining net discount on these acquired loans was $1.39 million$449,000 at September 30, 2019. Partially offsetting these increases was a $130,000 decrease in non-accrual interest and prepayment penalties collected during the year ended September 30, 2019.2021. During the year ended September 30, 2019,2021, a total of $372,000$942,000 in non-accrual interest, pre-payment penalties and prepayment penaltieslate fees was collected compared to a total of $502,000$911,000 for the year ended September 30, 2018. 2020.
Also impacting the average yield and average interest-earning asset balances during the years ended September 30, 2021 and 2020 were SBA PPP loans originated. These PPP loans have a prescribed interest rate of 1.00% and are also subject to loan origination fees which are accreted into interest income over the life of each loan. For the year ended September 30, 2021, average PPP loans were $107.00 million and the Company recorded $1.06 million in interest income and accreted $5.07 million in PPP loan origination fees into income compared to average PPP loans of $55.40 million, $556,000 in interest income and $1.04 million in PPP loan origination fees for the year ended September 30, 2020. The Company anticipates that interest income related to PPP loans will decrease significantly during the year ending September 30, 2022 as the remaining PPP loan balances and deferred loan originations fees have been reduced. At September 30, 2021, the Company had $1.83 million in PPP deferred loan origination fees, which will be accreted into interest income over the remaining life of the PPP loans.
Interest income on investment securities increaseddecreased by $1.05 million,$384,000, or 482.5%24.3%, to $1.26$1.20 million for the year ended September 30, 20192021 from $217,000$1.58 million for the year ended September 30, 20182020 primarily due to increases in both the average balance of investment securities (in large part due to the South Sound Acquisition) anda decrease in the average yield on investment securities, which was partially offset by an increase in the average balance of investment securities. Interest income on interest-bearing deposits in banks and CDs increaseddecreased by $1.97$1.42 million, or 61.7%56.0%, to $5.17$1.12 million for the year ended September 30, 20192021 from $3.20$2.54 million for the year ended September 30, 2018,2020, primarily due to an increasedecrease in the average yield to 2.41%0.24% from 1.70% and, to a lesser extent, a $26.40 million1.00% as market rates decreased. The decrease in the average yield was partially offset by an increase in the average balance of interest-bearing deposits in banks and CDs. The increase in average yield on interest-earning assets was primarily due to increases in average short-term interest rates as the Federal Reserve continued to increase the targeted Fed Funds rate 25 basis points in each quarter of 2018, before beginning to reduce interest rates in August 2019.
Total interest expense increaseddecreased by $1.79$1.60 million, or 64.3%34.0%, to $4.57$3.10 million for the year ended September 30, 20192021 from $2.78$4.70 million for the year ended September 30, 2018.2020. The increasedecrease in interest expense was primarily due to increasesa decrease in the average cost and, to a lesser extent,of interest-bearing liabilities, primarily deposits, which was partially offset by an increase in the average balance of interest-bearing deposits.liabilities. The average cost of interest-bearing deposits increased
liabilities decreased to 0.59%0.32% for the year ended September 30, 20192021 from 0.43%0.56% for the year ended September 30, 20182020 as market interest rates for deposits increased.decreased. Average interest-bearing deposits increased by $126.87$146.61 million, or 19.8%17.7%, to $767.39$976.52 million for the year ended September 30, 20192021 from $640.52$829.91 million for the year ended September 30, 2018, primarily due to the2020. The average balance of interest-bearing deposits acquired in the South Sound Acquisition and, to a lesser extent, organic deposit growth.
Asincreased, however, interest expense on deposits decreased by $1.62 million as a result of these changes, the decrease in the average cost of interest-bearing deposits primarily as a result of the Company decreasing the interest rates paid on deposit products because of the decreasing rate environment. The increase in the average balance of interest-bearing deposits is due primarily to proceeds from SBA PPP loans deposited directly into customer accounts, government stimulus checks and an increase in savings trends and reduced withdrawals from deposit accounts due to a change in spending habits as a result of COVID-19.
The net interest margin increased 27decreased 65 basis points to 4.50%3.25% for the year ended September 30, 20192021 from 4.23%3.90% for the year ended September 30, 2018.2020.
Provision for (Recapture of) Loan Losses: There was no provision for (recapture of) loanloans losses for both the years ended September 30, 2019 and 2018. There were net recoveries of $160,000 for the year ended September 30, 20192021 compared to net charge-offsa provision for loan losses of $23,000$3.70 million for the year ended September 30, 2018.2020, due primarily to improvement in forecasted probable credit losses from the COVID-19 pandemic on the economy as of September 30, 2021. The provision for loan losses for the prior fiscal year was primarily due to the deteriorating economic conditions and probable loan losses driven by the impact of the COVID-19 pandemic on the U.S. and global economies. The Company had net recoveries of $55,000 for the year ended September 30, 2021 and net recoveries of $24,000 for the year ended September 30, 2020. The net charge-offs (recoveries) to average outstanding loans ratio was (0.02%)(0.01)% for the year ended September 30, 20192021 and 0.00% for the year ended September 30, 2018.2020. The level of delinquent loans (loans 30 or more days past due) increaseddecreased by $1.37 million,$709,000, or 53.6%18.9%, to $3.93$3.04 million at September 30, 20192021 from $2.56$3.75 million at September 30, 20182020 and the level of loans graded substandard increaseddecreased by $2.14 million,$45,000, or 67.2%1.2%, to $5.32$3.60 million at September 30, 20192021 from $3.18$3.65 million at September 30, 2018.2020. Special mention loans decreased by $576,000,$852,000 or 21.5%14.5%, to $2.55$5.01 million at September 30, 20192021 from $3.12$5.86 million at September 30, 2018.2020. Non-accrual loans increaseddecreased by $1.72 million,$51,000, or 130.3%1.8%, to $3.03$2.85 million at September 30, 20192021 from $1.32$2.91 million at September 30, 2018.2020.
The Company has worked with loan customers impacted by the COVID-19 pandemic on loan deferral and forbearance plans. In response to requests from borrowers, the Company made payment deferral modifications (typically 90-day payment deferrals with interest continuing to accrue or scheduled to be paid monthly) on a number of loans since the COVID-19 pandemic began. Most of these borrowers have resumed making payments, and only one loan totaling $233,000 was on deferred status as of September 30, 2021 compared to five loans totaling $5.87 million of deferral status as of September 30, 2020. These modifications were not classified as TDRs in accordance with guidance of the CARES Act and related regulatory guidance.
The $40.92 million balance of SBA PPP loans was omitted from the Company's normal allowance for loan losses calculation at September 30, 2021, as these loans are fully guaranteed by the SBA and management expects that most PPP borrowers will seek full or partial forgiveness of their loan obligations from the SBA within a short time frame, which will in turn reimburse the Bank for the amount forgiven.
The Company has established a comprehensive methodology for determining the allowance for loan losses. On a quarterly basis, the Company performs an analysis that considers pertinent factors underlying the quality of the loan portfolio. These factors include changes in the amount and composition of the loan portfolio, historic loss experience for various loan segments, changes in economic conditions, delinquency rates, a detailed analysis of impaired loans, and other factors to determine an appropriate level of allowance for loan losses. Impaired loans are subject to an impairment analysis to determine an appropriate reserve amount to be allocated to each loan. The aggregate principal impairment amount determined at September 30, 20192021 was $172,000$247,000 compared to $97,000$41,000 at September 30, 2018.2020.
In accordance with GAAP, loans acquired in the South Sound Acquisition were recorded at their estimated fair value, which resulted in a net discount to the loans' contractual amounts, of which a portion reflects a discount for possible credit losses. Credit discounts are included in the determination of fair value and, as a result, no allowance for loan losses is recorded for acquired loans at the acquisition date. The discount recorded on the acquired loans is not reflected in the allowance for loan losses or related allowance coverage ratios. The remaining fair value discount on loans acquired in the South Sound Acquisition was $1.39 million$449,000 at September 30, 2019.2021. The Company believes this should be considered by investors when comparing the Company's allowance for loan losses to total loans in periods prior to the South Sound Acquisition.
Based on the comprehensive methodology, management believes that the allowance for loan losses of $9.69$13.47 million at September 30, 2019 (1.08%2021 (1.37% of loans receivable and 319.5%471.9% of non-performing loans) was adequate to provide for probable losses based on an evaluation of known and inherent risks in the loan portfolio at that date. While the Company believes that it has established its existing allowance for loan losses in accordance with GAAP, there can be no assurance that bank regulators, in reviewing the Company's loan portfolio, will not request the Company to increase significantly its allowance for loan losses. In addition, because future events affecting borrowers and collateral cannot be predicted with certainty, there can be no assurance that the existing allowance for loan losses is adequate or that substantial increases will not be necessary should the quality of any loans deteriorate. Any material increase in the allowance for loan losses would adversely affect the Company's financial condition and results of operations. For additional information, see "Item 1. Business - Lending Activities -- Allowance for Loan Losses."
Non-interest Income: Total non-interest income increaseddecreased by $1.80 million,$27,000, or 14.3%0.2%, to $14.34$17.16 million for the year ended September 30, 20192021 from $12.54$17.19 million for the year ended September 30, 2018. This increase2020. The decrease was primarily due to increasesa $483,000 decrease in recoveries of $1.09 millionpreviously charged off receivables acquired in BOLI net earnings, $466,000the South Sound Acquisition (which are recorded in the "Other, net" non- interest income category), a $236,000 decrease in service charges on deposits, a $186,000 decrease in servicing income on loans sold and smaller decreases in several other categories. These decreases were partially offset by a $706,000 increase in ATM and debit card interchange transaction fees, $323,000a $110,000 valuation recovery on loan servicing rights (compared to a $221,000 valuation allowance in service charges on depositsthe prior year), and smaller increases in several other categories. These increases were partially offset by a $139,000The decrease in gainservice charges on sales of loans and smaller decreases in several other categories. The increase in BOLI net earningsdeposits was primarily the resultdue to a decrease in overdraft fee income. The decrease in servicing income on loans sold was primarily due to increased amortization of a $1.03 million BOLI death benefit claim.loan servicing rights. The increase in ATM and debit card interchange transaction fees was primarily due to an increase in the dollar volume of debit card transactions, which was in part a result of the transaction accounts acquired in the South Sound Acquisition.transactions. The increase in service chargesvaluation recovery on depositsloan servicing rights was primarily due to fee income from the deposit accounts acquireda decrease in the South Sound Acquisition. projected mortgage prepayment speeds.
The Company's gain on sales of loans decreased by $75,000, or 1.3%, to $5.90 million for the year ended September 30, 2021 from $5.98 million for the year ended September 30, 2020, and increased by $4.15 million, or 236.6%, from $1.75 million for the year ended September 30, 2019. The Company's gain on sales of loans over the past two fiscal years have been higher than historical averages primarily due to an increase in the dollar amount of fixed rate one- to four-family loans originated and sold and an increase in the average pricing margin. The increased mortgage banking volumes over the past two fiscal years have been largely driven by increased refinance activity for single family homes due to lower mortgage interest rates. The Company anticipates that refinance activity for single family homes will decrease and pricing spreads will compress during the year ending September 30, 2022, which will correspondingly result in a decrease in gain on sales of loans was primarily duecompared to a lower average loan sale margin on loans sold during the year.years ended September 30, 2021 and 2020.
Non-interest Expense: Total non-interest expense increased by $6.40 million,$528,000, or 21.9%1.6%, to $35.58$34.59 million for the year ended September 30, 20192021 from $29.18$34.06 million for the year ended September 30, 2018. This2020. The increase was primarily due to increases of $2.81 milliona $399,000 increase in salaries and employee benefits expense, $1.77 million in data processing and telecommunication expense, $600,000 in premises and equipment expense, $452,000 in CDI amortization and smaller increases and decreases in
several other categories. During the year ended September 30, 2019, the Company incurred acquisition-related expenses of $462,000 related to the South Sound Acquisition, of which $317,000 is includeda $225,000 increase in data processing and telecommunications expensesexpense, a $211,000 increase in FDIC insurance expense, a $203,000 increase in ATM and $145,000 is includeddebit card interchange transaction fees, and smaller increases in professional fees. During the year ended September 30, 2018, the Company incurred acquisition-related expenses of $616,000 related to the South Sound Acquisition, which are all includedseveral other expense categories. These increases were partially offset by a $363,000 decrease in professional fees.
OREO and other repossessed assets expense. The increase in salaries and employee benefits expense was primarily due to the additional employees added as a result of the South Sound Acquisition and
annual salary adjustments. The increase in data processing and telecommunicationtelecommunications expense was primarily a resultdue to the addition of expenses associated with the core operating system conversionseveral technology products and increased processing volumes. The increases in FDIC insurance expense was primarily due to Jack Henry Silverlake platforman increase in total assets and the conversionabsence of an assessment credit which reduced the branches acquiredexpense in the South Sound Acquisition to the Silverlake platform.year ended September 30, 2020. The increase in premisesATM and equipmentdebit card interchange fees was primarily due to increased debit card transaction volumes. The improvement in OREO and other repossessed assets expense was primarily due to gains on the sale of OREO and a result of the additional branch facilities acquiredreduction in the South Sound Acquisition and an increase in building maintenance expenses.remaining OREO properties. The efficiency ratio for the year ended September 30, 2019 improved2021 was 50.12% compared to 54.32% from 56.55%50.04% for the year ended September 30, 2018 as the2020.
The Company anticipates increases in net interest incomenon-interest expense during the year ending September 30, 2022, primarily due to inflationary pressures and non-interest income outpaced the increase in non-interest expense.hiring of additional lending personnel.
Provision for Income Taxes: The provision for income taxes increased by $200,000,$807,000, or 3.5%13.4% to $5.90$6.85 million for the year ended September 30, 20192021 from $5.70$6.04 million for the year ended September 30, 2018.2020. The increase in the provision for income taxes was primarily due to increasedhigher income before income taxes, which was partially offset by a lower effective income tax rate.taxes. The Company's effective income tax rate was 19.7%19.9% for both the yearyears ended September 30, 2019 compared to 25.4% for the year ended September 30, 2018. The change in effective income tax rates was primarily a result of the Tax Act enacted in December 2017 which decreased the federal corporate income tax rate to 21.0% from 35.0% effective January 1, 2018,2021 and also required a revaluation of the Company's net deferred tax asset ("DTA") to account for the future impact of lower corporate income tax rates and other provisions of the legislation. Since the Company is a September 30th fiscal-year end corporation, the reduction in the federal corporate income tax rate resulted in the use of a blended federal income tax rate of 24.5% for the fiscal year ended September 30, 2018, and a 21.0% federal corporate income tax rate thereafter. The revaluation of the Company's DTA resulted in a one-time increase to income tax expense of $548,000 during the year ended September 30, 2018. Also contributing to the lower effective income tax rate for the year ended September 30, 2019 was a higher percentage of tax-exempt income, primarily due to the BOLI death benefit claim.2020. For additional information on income taxes, see Note 1314 of the Consolidated Financial Statements contained in "Item 8. Financial Statements and Supplementary Data."
Average Balances, Interest and Average Yields/Cost
The earnings of the Company depend largely on the spread between the yield on interest-earning assets and the cost of interest-bearing liabilities, as well as the relative amount of the Company's interest-earning assets and interest- bearing liability portfolios.
The following table sets forth, for the periods indicated, information regarding average balances of assets and liabilities as well as the total dollar amounts of interest income from average interest-earning assets and interest expense on average interest-bearing liabilities and average yields and costs. Such yields and costs for the periods indicated are derived by dividing income or expense by the average daily balance of assets or liabilities, respectively, for the periods presented.
| | | | | | | | | | | | | | | | | | | | | | | | | | | | | | | | | | | | | | | | | | | | | | | | | | | | | |
| | Year Ended September 30, |
| | 2021 | | 2020 | | 2019 |
| Average
Balance | | Interest
and
Dividends | | Yield/
Cost | | Average
Balance | | Interest
and
Dividends | | Yield/
Cost | | Average
Balance | | Interest
and
Dividends | | Yield/
Cost |
| | | | | | | | (Dollars in thousands) | | | | | | |
| Interest-earning assets: | | | | | | | | | | | | | | | | | |
| Loans receivable (1)(2) | $ | 1,026,742 | | | $ | 52,539 | | | 5.12 | % | | $ | 970,400 | | | $ | 51,341 | | | 5.29 | % | | $ | 878,984 | | | $ | 49,127 | | | 5.59 | % |
| Investment securities (2) | 103,328 | | | 1,195 | | | 1.16 | | | 72,652 | | | 1,579 | | | 2.17 | | | 38,070 | | | 1,264 | | | 3.32 | |
| Dividends from mutual funds, FHLB stock and other investments | 5,989 | | | 111 | | | 1.85 | | | 5,760 | | | 128 | | | 2.22 | | | 5,324 | | | 162 | | | 3.04 | |
| Interest-bearing deposits in banks and CDs | 459,145 | | | 1,117 | | | 0.24 | | | 254,558 | | | 2,535 | | | 1.00 | | | 214,481 | | | 5,172 | | | 2.41 | |
| Total interest-earning assets | 1,595,204 | | | 54,962 | | | 3.45 | | | 1,303,370 | | | 55,583 | | | 4.26 | | | 1,136,859 | | | 55,725 | | | 4.90 | |
| Non-interest-earning assets | 85,939 | | | | | | | 85,842 | | | | | | | 86,494 | | | | | |
| | | | | | | | | | | | | | | | | |
| Total assets | $ | 1,681,143 | | | | | | | $ | 1,389,212 | | | | | | | $ | 1,223,353 | | | | | |
| | | | | | | | | | | | | | | | | |
| Interest-bearing liabilities: | | | | | | | | | | | | | | | | | |
| Savings accounts | $ | 242,598 | | | 201 | | | 0.08 | | | $ | 191,618 | | | 188 | | | 0.10 | | | $ | 162,266 | | | 106 | | | 0.07 | |
| Money market accounts | 186,489 | | | 560 | | | 0.30 | | | 148,506 | | | 735 | | | 0.49 | | | 154,375 | | | 1,119 | | | 0.72 | |
| NOW checking accounts | 402,430 | | | 605 | | | 0.15 | | | 323,261 | | | 882 | | | 0.27 | | | 291,348 | | | 840 | | | 0.29 | |
| Certificates of deposit accounts | 145,006 | | | 1,647 | | | 1.14 | | | 166,524 | | | 2,830 | | | 1.70 | | | 159,397 | | | 2,500 | | | 1.57 | |
| | | | | | | | | | | | | | | | | |
| Long-term borrowings (3) | 7,686 | | | 91 | | | 1.18 | | | 5,685 | | | 66 | | | 1.16 | | | — | | | — | | | — | |
| Total interest-bearing liabilities | 984,209 | | | 3,104 | | | 0.32 | | | 835,594 | | | 4,701 | | | 0.56 | | | 767,386 | | | 4,565 | | | 0.59 | |
| Non-interest-bearing deposits | 488,833 | | | | | | | 364,971 | | | | | | | 290,653 | | | | | |
| Other liabilities | 10,816 | | | | | | | 10,110 | | | | | | | 4,229 | | | | | |
| Total liabilities | 1,483,858 | | | | | | | 1,210,675 | | | | | | | 1,062,268 | | | | | |
| | | | | | | | | | | | | | | | | |
| Shareholders' equity | 197,285 | | | | | | | 178,540 | | | | | | | 161,085 | | | | | |
| Total liabilities and shareholders' equity | $ | 1,681,143 | | | | | | | $ | 1,389,215 | | | | | | | $ | 1,223,353 | | | | | |
| | | | | | | | | | | | | | | | | |
| Net interest income | | | $ | 51,858 | | | | | | | $ | 50,882 | | | | | | | $ | 51,160 | | | |
| Interest rate spread | | | | | 3.13 | % | | | | | | 3.70 | % | | | | | | 4.31 | % |
| Net interest margin (4) | | | | | 3.25 | % | | | | | | 3.90 | % | | | | | | 4.50 | % |
| Ratio of average interest-earning assets to average interest-bearing liabilities | | | | | 162.08 | % | | | | | | 155.98 | % | | | | | | 148.15 | % |
(1)Does not include interest on loans on non-accrual status. Includes loans held for sale and interest earned on loans held for sale. Amortized net deferred loan fees, late fees, extension fees and prepayment penalties (year ended September 30, 2021 - $6,859; year ended September 30, 2020 - $3,196 and year ended September 30, 2019 - $1,743) are included with interest and dividends. Accretion of the fair value discount on loans acquired in the South Sound Acquisition for the years ended September 30, 2021, 2020 and 2019 of $340, $597 and $645, respectively, is included with interest and dividends.
(2)Average balances include loans and investment securities on non-accrual status.
(3)Includes FHLB borrowings with original maturities of one year or greater.
(4)Net interest income divided by total average interest-earning assets.
|
| | | | | | | | | | | | | | | | | | | | | | | | | | | | | | | | |
| | Year Ended September 30, |
| | 2019 | | 2018 | | 2017 |
| | Average
Balance | | Interest
and
Dividends | | Yield/
Cost | | Average
Balance | | Interest
and
Dividends | | Yield/
Cost | | Average
Balance | | Interest
and
Dividends | | Yield/
Cost |
| | | | | | | | (Dollars in thousands) | | | | | | |
| Interest-earning assets: | | | | | | | | | | | | | | | | | |
| Loans receivable (1)(2) | $ | 878,984 |
| | $ | 49,127 |
| | 5.59 | % | | $ | 721,472 |
| | $ | 38,298 |
| | 5.31 | % | | $ | 692,278 |
| | $ | 36,385 |
| | 5.26 | % |
| Investment securities (2) | 38,070 |
| | 1,264 |
| | 3.32 |
| | 8,807 |
| | 217 |
| | 2.46 |
| | 7,651 |
| | 279 |
| | 3.65 |
|
| Dividends from mutual funds, FHLB stock and other investments | 5,324 |
| | 162 |
| | 3.04 |
| | 5,078 |
| | 120 |
| | 2.36 |
| | 4,066 |
| | 88 |
| | 2.16 |
|
| Interest-bearing deposits in banks and CDs | 214,481 |
| | 5,172 |
| | 2.41 |
| | 188,080 |
| | 3,198 |
| | 1.70 |
| | 160,165 |
| | 1,586 |
| | 0.99 |
|
| Total interest-earning assets | 1,136,859 |
| | 55,725 |
| | 4.90 |
| | 923,437 |
| | 41,833 |
| | 4.53 |
| | 864,160 |
| | 38,338 |
| | 4.44 |
|
| Non-interest-earning assets | 86,494 |
| | |
| | |
| | 60,728 |
| | |
| | |
| | 58,834 |
| | |
| | |
|
| | | | | | | | | | | | | | | | | | |
| Total assets | $ | 1,223,353 |
| | |
| | |
| | $ | 984,165 |
| | |
| | |
| | $ | 922,994 |
| | |
| | |
|
| | | | | | | | | | | | | | | | | | |
| Interest-bearing liabilities: | |
| | |
| | |
| | |
| | |
| | |
| | |
| | |
| | |
|
| Savings accounts | $ | 162,266 |
| | 106 |
| | 0.07 |
| | $ | 145,670 |
| | 85 |
| | 0.06 |
| | $ | 134,495 |
| | 78 |
| | 0.06 |
|
| Money market accounts | 154,375 |
| | 1,119 |
| | 0.72 |
| | 139,138 |
| | 722 |
| | 0.52 |
| | 125,296 |
| | 434 |
| | 0.35 |
|
| NOW checking accounts | 291,348 |
| | 840 |
| | 0.29 |
| | 215,249 |
| | 451 |
| | 0.21 |
| | 207,300 |
| | 460 |
| | 0.22 |
|
| Certificates of deposit accounts | 159,397 |
| | 2,500 |
| | 1.57 |
| | 140,464 |
| | 1,520 |
| | 1.08 |
| | 143,171 |
| | 1,246 |
| | 0.87 |
|
| Long-term borrowings (3) | — |
| | — |
| | — |
| | — |
| | — |
| | — |
| | 17,096 |
| | 979 |
| | 5.73 |
|
| Total interest-bearing liabilities | 767,386 |
| | 4,565 |
| | 0.59 |
| | 640,521 |
| | 2,778 |
| | 0.43 |
| | 627,358 |
| | 3,197 |
| | 0.51 |
|
| Non-interest-bearing deposits | 290,653 |
| | | | | | 221,953 |
| | | | | | 187,368 |
| | | | |
| Other liabilities | 4,229 |
| | |
| | |
| | 4,549 |
| | |
| | |
| | 4,450 |
| | |
| | |
|
| Total liabilities | 1,062,268 |
| | |
| | |
| | 867,023 |
| | |
| | |
| | 819,176 |
| | |
| | |
|
| | | | | | | | | | | | | | | | | | |
| Shareholders' equity | 161,085 |
| | |
| | |
| | 117,142 |
| | |
| | |
| | 103,818 |
| | |
| | |
|
| Total liabilities and shareholders' equity | $ | 1,223,353 |
| | |
| | |
| | $ | 984,165 |
| | |
| | |
| | $ | 922,994 |
| | |
| | |
|
| | | | | | | | | | | | | | | | | | |
| Net interest income | |
| | $ | 51,160 |
| | |
| | |
| | $ | 39,055 |
| | |
| | |
| | $ | 35,141 |
| | |
|
| Interest rate spread | |
| | |
| | 4.31 | % | | |
| | |
| | 4.10 | % | | |
| | |
| | 3.93 | % |
| Net interest margin (4) | |
| | | | 4.50 | % | | |
| | | | 4.23 | % | | |
| | |
| | 4.07 | % |
| Ratio of average interest-earning assets to average interest-bearing liabilities | |
| | | | 148.15 | % | | |
| | | | 144.17 | % | | |
| | |
| | 137.75 | % |
| |
| Does not include interest on loans on non-accrual status. Includes loans held for sale and interest earned on loans held for sale. Amortized net deferred loan fees, late fees, extension fees and prepayment penalties (year ended September 30, 2019 - $1,743; year ended September 30, 2018 - $1,426; and year ended September 30, 2017 - $1,328) are included with interest and dividends. Accretion of the fair value discount on loans acquired in the South Sound Acquisition for the year ended September 30, 2019 of $645 is included with interest and dividends. |
| |
(2)
| Average balances include loans and investment securities on non-accrual status. |
| |
(3) | Includes FHLB borrowings with original maturities of one year or greater. Includes pre-payment penalties of $282 for the year ended September 30, 2017. |
| |
(4) | Net interest income divided by total average interest-earning assets. |
Rate/Volume Analysis
The following table sets forth the effects of changing rates and volumes on net interest income on the Company. Information is provided with respect to the (i) effects on interest income attributable to changes in volume (changes in volume multiplied by prior rate), (ii) effects on interest income attributable to changes in rate (changes in rate multiplied by prior volume), and (iii) the net change (sum of the prior columns). Changes in both rate and volume have been allocated to rate and volume variances based on the absolute values of each.
| | | | Year Ended September 30,
2019 Compared to Year
Ended September 30, 2018
Increase (Decrease)
Due to | | Year Ended September 30,
2018 Compared to Year
Ended September 30, 2017
Increase (Decrease)
Due to | | Year Ended September 30,
2021 Compared to Year
Ended September 30, 2020
Increase (Decrease)
Due to | | Year Ended September 30,
2020 Compared to Year
Ended September 30, 2019
Increase (Decrease)
Due to |
| | Rate | | Volume | | Net Change | | Rate | | Volume | | Net Change | | Rate | | Volume | | Net
Change | | Rate | | Volume | | Net
Change |
| | | | | | (Dollars in thousands) | | | | | | | | | | (Dollars in thousands) | | | | |
| Interest-earning assets: | | | | | | | | | | | | Interest-earning assets: | | | | | | | | | | | |
| Loans receivable (1) | $ | 2,112 |
| | $ | 8,717 |
| | $ | 10,829 |
| | $ | 366 |
| | $ | 1,547 |
| | $ | 1,913 |
| Loans receivable (1) | $ | (1,721) | | | $ | 2,919 | | | $ | 1,198 | | | $ | (2,714) | | | $ | 4,928 | | | $ | 2,214 | |
| Investment securities | 99 |
| | 948 |
| | 1,047 |
| | (100 | ) | | 38 |
| | (62 | ) | Investment securities | (903) | | | 519 | | | (384) | | | (546) | | | 861 | | | 315 | |
| Dividends from mutual funds, FHLB stock and other investments | 36 |
| | 6 |
| | 42 |
| | 8 |
| | 24 |
| | 32 |
| Dividends from mutual funds, FHLB stock and other investments | (22) | | | 5 | | | (17) | | | (46) | | | 12 | | | (34) | |
| Interest-bearing deposits in banks and CDs | 1,478 |
| | 496 |
| | 1,974 |
| | 1,296 |
| | 316 |
| | 1,612 |
| Interest-bearing deposits in banks and CDs | (2,661) | | | 1,243 | | | (1,418) | | | (3,468) | | | 831 | | | (2,637) | |
| Total net change in income on interest-earning assets | 3,725 |
| | 10,167 |
| | 13,892 |
| | 1,570 |
| | 1,925 |
| | 3,495 |
| Total net change in income on interest-earning assets | (5,307) | | | 4,686 | | | (621) | | | (6,774) | | | 6,632 | | | (142) | |
| | | | | | | | | | | | | |
| Interest-bearing liabilities: | |
| | |
| | |
| | |
| | |
| | |
| Interest-bearing liabilities: | | | | | | | | | | | |
| Savings accounts | 11 |
| | 10 |
| | 21 |
| | — |
| | 7 |
| | 7 |
| Savings accounts | (32) | | | 45 | | | 13 | | | 60 | | | 22 | | | 82 | |
| Money market accounts | 311 |
| | 86 |
| | 397 |
| | 236 |
| | 52 |
| | 288 |
| Money market accounts | (333) | | | 158 | | | (175) | | | (342) | | | (42) | | | (384) | |
| NOW checking accounts | 201 |
| | 188 |
| | 389 |
| | (27 | ) | | 18 |
| | (9 | ) | NOW checking accounts | (459) | | | 182 | | | (277) | | | (47) | | | 89 | | | 42 | |
| Certificates of deposit accounts | 754 |
| | 226 |
| | 980 |
| | 298 |
| | (24 | ) | | 274 |
| Certificates of deposit accounts | (852) | | | (331) | | | (1,183) | | | 215 | | | 115 | | | 330 | |
| FHLB borrowings | — |
| | — |
| | — |
| | — |
| | (979 | ) | | (979 | ) | FHLB borrowings | 1 | | | 24 | | | 25 | | | 33 | | | 33 | | | 66 | |
| Total net change in expense on interest-bearing liabilities | 1,277 |
| | 510 |
| | 1,787 |
| | 507 |
| | (926 | ) | | (419 | ) | Total net change in expense on interest-bearing liabilities | (1,675) | | | 78 | | | (1,597) | | | (81) | | | 217 | | | 136 | |
| Net change in net interest income | $ | 2,448 |
| | $ | 9,657 |
| | $ | 12,105 |
| | $ | 1,063 |
| | $ | 2,851 |
| | $ | 3,914 |
| Net change in net interest income | $ | (3,632) | | | $ | 4,608 | | | $ | 976 | | | $ | (6,693) | | | $ | 6,415 | | | $ | (278) | |
______________
| |
(1) | Excludes interest on loans on non-accrual status. Includes loans held for sale and interest earned on loans held for sale. |
(1)Excludes interest on loans on non-accrual status. Includes loans held for sale and interest earned on loans held for sale.
Liquidity and Capital Resources
The Company's primary sources of funds are customer deposits, proceeds from principal and interest payments on loans, the sale of loans, maturing investment securities, maturing CDs held for investment and FHLB borrowings (if needed). While the maturities and the scheduled amortization of loans are a predictable source of funds, deposit flows and mortgage prepayments are greatly influenced by general interest rates, economic conditions and competition.
The Bank must maintain an adequate level of liquidity to help ensure the availability of sufficient funds to fund loan originations and deposit withdrawals, to satisfy other financial commitments and to take advantage of investment opportunities.its operations. The Bank generally maintains sufficient cash and short-term investments to meet short-term liquidity needs. At September 30, 2019,2021, the Bank's regulatory liquidity ratio (net cash, and short-term and marketable assets, as a percentage of net deposits and short-term liabilities) was 23.2%43.3%. At September 30, 2019,2021, the Bank maintained an uncommitted credit facility with the FHLB that provided for immediately available borrowings up to an aggregate amount equal to 45% of total assets, limited by available collateral.collateral, under which $5.00 million was outstanding. The Bank had $295.67$391.21 million available for additional borrowings with the FHLB at September 30, 2019. The Bank also has a LOC of up to $23.00 million with the FHLB for the purpose of collateralizing Washington State public deposits, all of which was available to be drawn upon at September 30, 2019. The LOC amount reduces the Bank's available borrowings under the FHLB
advance agreement.2021. The Bank maintains a short-term borrowing line with the FRB with total credit based on eligible collateral. At September 30, 2019,2021, the Bank had no outstanding balance on this borrowing line, under which $84.36$73.81 million was available for future borrowings. The Bank also maintains a $10.00$50.00 million overnight borrowing line with PCBB. At September 30, 2019,2021, the Bank did not have an outstanding balance on this borrowing line. Subject to market conditions, the Bank expects to utilize these borrowing facilities from time to time in the future to fund loan
originations and deposits withdrawals, to satisfy other financial commitments, repay maturing debt and to take advantage of investment opportunities to the extent feasible.
Liquidity management is both a short and long-term responsibility of the Bank's management. The Bank adjusts its investments in liquid assets based upon management's assessment of (i) expected loan demand, (ii) projected loan sales, (iii) expected deposit flows, and (iv) yields available on interest-bearing deposits. Excess liquidity is invested generally in interest-bearing overnight deposits, CDs held for investment and short-term government and agency obligations. If the Bank requires funds beyond its ability to generate them internally, it has additional borrowing capacity with the FHLB, the FRB and PCBB.
The Bank's primary investing activity is the origination of loans.loans and, to a lesser extent, the purchase of investment securities. During the years ended September 30, 2019, 20182021, 2020 and 2017,2019, the Bank originated $356.04$602.34 million, $329.59$597.19 million and $340.61$356.04 million of loans, respectively. At September 30, 2019,2021, the Bank had loan commitments totaling $96.76$163.29 million and undisbursed construction loans in process totaling $92.23$95.22 million. The Bank anticipates that it will have sufficient funds available to meet current loan commitments. CDs that are scheduled to mature in less than one year fromInvestment securities purchased during the years ended September 30, 2021, 2020 and 2019 totaled $92.27 million. Historically, the Bank has been able to retain a significant amount of its deposits as they mature.$71.75 million, $51.47 million and $34.08 million, respectively.
The Bank’s liquidity is also affected by the volume of loans sold and loan principal payments. During the years ended September 30, 2019, 20182021, 2020 and 2017,2019, the Bank sold $150.20 million, $167.24 million and $73.03 million, $66.38 million and $81.40 millionrespectively, in loans and loan participation interests, respectively.interests. During the years ended September 30, 2019, 20182021, 2020 and 2017,2019, the Bank received $500.03 million, $287.04 million and $241.66 million, $235.61 million and $211.30 millionrespectively, in principal repayments, respectively.repayments.
The Bank’s liquidity has been positively impacted by increases in deposit levels. During the years ended September 30, 2019, 20182021, 2020 and 2017,2019, deposits increased by $212.15 million, $290.18 million and $178.72 million, $51.61 million and $76.40 million, respectively.
Cash As a result, our liquid assets in the form of cash and cash equivalents, CDs held for investment and investment securities increased to $275.00$740.96 million at September 30, 20192021 from $226.12$465.79 million at September 30, 2018.2020. CDs that are scheduled to mature in less than one year from September 30, 2021 totaled $81.42 million. Historically, the Bank has been able to retain a significant amount of its deposits as they mature.
Capital expenditures are incurred on an ongoing basis to expand and improve the Bank's product offerings, enhance and modernize technology infrastructure, and to introduce new technology-based products to compete effectively in the various markets. Capital expenditure projects are evaluated on a variety of factors, including expected strategic impacts (such as forecasted impact on revenue growth, productivity, expenses, service levels and customer retention) and the expected return on investment. The amount of capital investment is influenced by, among other things, current and projected demand for services and products, cash flow generated by operating activities, cash required for other purposes and regulatory considerations.
Based on current objectives, there are no projects scheduled for capital investments in premises and equipment during the fiscal year ending September 30, 2022 that would materially impact liquidity. The Company currently expects to continue the current practice of paying quarterly cash dividends on common stock subject to the Board of Directors' discretion to modify or terminate this practice at any time and for any reason without prior notice. The current quarterly common stock dividend rate is $0.21 per share, as approved by the Board of Directors, which is a dividend rate per share that enables the Company to balance multiple objectives of managing and investing in the Bank, and returning a substantial portion of cash to shareholders. Assuming continued payment during 2022 at this rate of $0.21 per share, the average total dividend paid each quarter would be approximately $1.76 million based on the number of current outstanding shares (which assumes no increases or decreases in the number of shares).
For the fiscal year ending September 30, 2022, the Bank projects that fixed commitments will include $342,000 of operating lease payments. There are no scheduled payments and maturities of FHLB borrowings during fiscal year 2022. In addition, at September 30, 2021, there were other future obligations and accrued expenses of $7.37 million. For additional information, see Note 13 to the Consolidated Financial Statements contained in "Item 8. Financial Statements and Supplementary Data."
The Bank's management believes that the liquid assets combined with the available lines of credit provide adequate liquidity to meet current financial obligations for at least the next 12 months.
Timberland Bancorp is a separate legal entity from the Bank and must provide for its own liquidity and pay its own operating expenses. Sources of capital and liquidity for Timberland Bancorp include distributions from the Bank and the issuance of debt or equity securities. At September 30, 2019,2021, Timberland Bancorp (on an unconsolidated basis) had liquid assets of $2.89$2.93 million.
Bank holding companies and federally-insured state-chartered banks are required to maintain minimum levels of regulatory capital. At September 30, 2019,2021, Timberland Bancorp and the Bank were in compliance with all applicable capital
requirements. For additional details, see Note 1718 to the Consolidated Financial Statements contained in “Item 8. Financial Statements and Supplementary Data” and “Item 1. Business - Regulation of the Bank - Capital Requirements.”
Contractual obligations. The following table presents, as of September 30, 2019, the Company’s significant fixed and determinable contractual operating lease obligations by payment date. There were no other fixed determinable contractual obligations outstanding at September 30, 2019.
|
| | | | | | | | | | | | | | | | | | | |
| | Payments due by period |
| | Less than 1 year | | 1 year through 3 years | | After 3 years through 5 years | | After 5 years | | Total |
| Contractual obligations |
| | (Dollars in thousands) |
| Operating lease obligations | $ | 315 |
| | $ | 264 |
| | $ | — |
| | $ | — |
| | $ | 579 |
|
| Total contractual obligations | $ | 315 |
| | $ | 264 |
| | $ | — |
| | $ | — |
| | $ | 579 |
|
Off-Balance Sheet Activities. The Company is a party to financial instruments with off-balance sheet risk in the normal course of business in order to meet the financial needs of its customers. For information regarding our commitments and off-balance sheet arrangements, see Note 16 of the Notes to Consolidated Financial Statements included in Item 8. "Financial Statements and Supplementary Data" of this Form 10-K.
A summary of the Company's commitments at September 30, 2019 and 2018 is as follows (in thousands):
|
| | | | | | | |
| | 2019 | | 2018 |
| Undisbursed portion of construction loans in process | $ | 92,226 |
| | $ | 83,237 |
|
| Undisbursed lines of credit | 80,184 |
| | 49,525 |
|
| Commitments to extend credit | 16,578 |
| | 17,665 |
|
| Total commitments | $ | 188,988 |
| | $ | 150,427 |
|
Effect of Inflation and Changing Prices
The consolidated financial statements and related financial data presented herein have been prepared in accordance with GAAP which require the measurement of financial position and operating results in terms of historical dollars, without considering the change in the relative purchasing power of money over time due to inflation. The primary impact of inflation on the operation of the Company is reflected in increased operating costs. Unlike most industrial companies, virtually all the assets and liabilities of a financial institution are monetary in nature. As a result, interest rates generally have a more significant impact on a financial institution's performance than do general levels of inflation. Interest rates do not necessarily move in the same direction or to the same extent as the prices of goods and services.
New Accounting Pronouncements
For a discussion of new accounting pronouncements and their impact on the Company, see Note 1 to the Consolidated Financial Statements contained in "Item 8. Financial Statements and Supplementary Data".
Item 7A. Quantitative and Qualitative Disclosures About Market Risk
The information contained under “Item 7. Management's Discussion and Analysis of Financial Condition and Results of Operations - Market Risk and Asset and Liability Management” of this Form 10-K is incorporated herein by reference.
Item 8. Financial Statements and Supplementary Data
TIMBERLAND BANCORP, INC. AND SUBSIDIARY
Index to Consolidated Financial Statements
|
| | | | |
| Page |
|
| Report of Independent Registered Public Accounting Firm | 6674 |
Consolidated Balance Sheets as of September 30, 20192021 and 20182020 | 6876 |
| Consolidated Statements of Income for the Years Ended |
September 30, 2019, 20182021, 2020 and 20172019 | 7078 |
| Consolidated Statements of Comprehensive Income for the |
Years Ended September 30, 2019, 20182021, 2020 and 20172019 | 7280 |
| Consolidated Statements of Shareholders' Equity for the |
Years Ended September 30, 2019, 20182021, 2020 and 20172019 | 7381 |
| Consolidated Statements of Cash Flows for the Years Ended |
September 30, 2019, 20182021, 2020 and 20172019 | 7583 |
| Notes to Consolidated Financial Statements | 7785 |
|
| |
| Report of Independent Registered Public Accounting Firm |
To the Board of Directors and Shareholders of
Timberland Bancorp, Inc.
OpinionsOpinion on the Financial Statements and Internal Control over Financial Reporting
We have audited the accompanying consolidated balance sheets of Timberland Bancorp, Inc. and Subsidiary (collectively, "the Company") as of September 30, 20192021 and 2018,2020, and the related consolidated statements of income, comprehensive income, shareholders' equity, and cash flows for each of the years in the three-year period ended September 30, 2019,2021, and the related notes (collectively referred to as "the financial statements"). We have also audited the Company's internal control over financial reporting as of September 30, 2019, based on criteria established in Internal Control – Integrated Framework (2013) issued by the Committee of Sponsoring Organizations of the Treadway Commission (COSO).
In our opinion, the financial statements referred to above present fairly, in all material respects, the financial position of the Company as of September 30, 20192021 and 2018,2020, and the results of its operations and its cash flows for each of the years in the three-year period ended September 30, 2019,2021, in conformity with accounting principles generally accepted in the United States of America (U.S.). Also, in our opinion, the Company maintained, in all material respects, effective internal control over financial reporting as of September 30, 2019, based on criteria established in Internal Control – Integrated Framework (2013) issued by COSO.
Basis for Opinion
The Company's management is responsible for theseThese financial statements for maintaining effective internal control over financial reporting, and for its assessmentare the responsibility of the effectiveness of internal control over financial reporting included in the accompanying Management's Report on Internal Control Over Financial Reporting.Company's management. Our responsibility is to express an opinion on the Company's financial statements and an opinion on the Company's internal control over financial reporting based on our audits. We are a public accounting firm registered with the Public Company Accounting Oversight Board (United States) (PCAOB) and are required to be independent with respect to the Company in accordance with the U.S. federal securities laws and the applicable rules and regulations of the Securities and Exchange Commission and the PCAOB.
We conducted our audits in accordance with the standards of the PCAOB. Those standards require that we plan and perform the auditsaudit to obtain reasonable assurance about whether the financial statements are free of material misstatement, whether due to error or fraud, and whether effectivefraud. The Company is not required to have, nor were we engaged to perform, an audit of its internal control over financial reporting. As part of our audits, we are required to obtain an understanding of internal control over financial reporting, was maintained in all material respects.but not for the purpose of expressing an opinion on the effectiveness of the Company's internal control over financial reporting. Accordingly, we express no such opinion.
Our audits of the financial statements included performing procedures to assess the risks of material misstatement of the financial statements, whether due to error or fraud, and performing procedures that respond to those risks. Such procedures included examining, on a test basis, evidence regarding the amounts and disclosures in the financial statements. Our audits also included evaluating the accounting principles used and significant estimates made by management, as well as evaluating the overall presentation of the financial statements. Our audit of internal control over financial reporting included obtaining an understanding of internal control over financial reporting, assessing the risk that a material weakness exists, and testing and evaluating the design and operating effectiveness of internal control based on the assessed risk. Our audits also included performing such other procedures as we considered necessary in the circumstances. We believe that our audits provide a reasonable basis for our opinions.opinion.
Critical Audit Matter
Definition and Limitations of Internal Control over Financial Reporting
A company’s internal control over financial reportingThe critical audit matter communicated below is a process designedmatter arising from the current period audit of the financial statements that was communicated or required to providebe communicated to the audit committee and that: (1) relates to an account or disclosures that are material to the financial statements and (2) involved our especially challenging, subjective, or complex judgments. The communication of the critical audit matter does not alter in any way our opinion on the financial statements, taken as a whole, and we are not, by communicating the critical audit matter below, providing separate opinions on the critical audit matter or on the accounts or disclosures to which it relates.
Allowance for Loan Losses
Critical Audit Matter Description
As described in Notes 1 and 5 to the financial statements, the Company's allowance for loan losses (ALL) is a valuation account that reflects the estimated loan losses based on known and inherent risks in the loan portfolio to
the extent they are both probable and reasonable assurance regardingto estimate. The ALL was approximately $13,469,000 as of September 30, 2021, which consists of specific and general components in the amounts of $247,000 and $13,222,000, respectively.
The specific component relates to loans that are classified as impaired. The Company measures impairment and the related asset specific allowance for impaired loans based on the difference between the recorded investment of the loan and the present value of the expected future cash flows, discounted at the original effective interest rate of the loan. However, if the loan is collateral-dependent, the Company measures impairment based upon the fair value of the underlying collateral, which the Company determines based on the current fair value of the collateral less estimated selling costs. Loans are identified as collateral-dependent if the Company believes that collateral is the sole source of repayment.
The general component is based on historical losses, general economic conditions, and other qualitative risk factors – both internal and external to the Company. The historical loss ratio and valuation allowance are established for each pool of similar loans and updated periodically based on actual charge-off experience and current events. The qualitative risk factors are generally determined by evaluating, among other things: (i) lending
policies and procedures, including underwriting standards and collection, charge-off, and recovery practices; (ii) national and local economic trends and conditions; (iii) nature and volume of the portfolio and terms of loans; (iv) experience, ability, and depth of lending management and staff; (v) volume and severity of past due, classified, and nonaccrual loans, as well as other loan modifications; (vi) quality of the Company's loan review system; (vii) existence and effect of any concentrations of credit and changes in the level of such concentrations; (viii) changes in the value of underlying collateral, and (ix) other external factors such as competition and legal and regulatory requirements. The evaluation of the qualitative factor adjustments requires a significant amount of judgment by management and involves a high degree of subjectivity.
We identified the ALL as a critical audit matter, as auditing the underlying qualitative factors required significant auditor judgment given that amounts determined by management rely on analysis that is highly subjective and includes significant estimation uncertainty.
How the Critical Audit Matter Was Addressed in the Audit
The primary audit procedures we performed to address this critical audit matter included the following, among others:
•We obtained an understanding of the relevant controls related to management’s establishment of the qualitative factors, assessment, and review and approval of the qualitative factors, and the data used in determining the qualitative factors.
•We obtained an understanding of how management developed the estimates and related assumptions, including:
◦Testing completeness and accuracy of key data inputs used in forming assumptions or calculations and testing the reliability of financial reportingthe underlying data on which these factors are based by comparing information to source documents and external information sources, as well as evaluating the preparationestimated correlation to potential loss.
◦Evaluating the reasonableness of financial statements for external purposes in accordance with generally accepted accounting principles. A company’s internal control over financial reporting includes those policies and procedures that (1) pertainthe qualitative factors established by management as compared to the maintenance of records that, in reasonable detail, accurately and fairly reflect the transactions and dispositionsunderlying internal or external information sources.
•We obtained an understanding of the assetsloans excluded from the general component calculation for propriety of the company; (2) provide reasonable assurance that transactions are recordedclassification as necessary to permit preparation of financial statements in accordance with generally accepted accounting principles, and that receipts and expenditures of the company are being made only in accordance with authorizations of management and directors of the company; and (3) provide reasonable assurance regarding preventionacquired or timely detection of unauthorized acquisition, use, or disposition of the company’s assets that could have a material effect on the financial statements.impaired loans.
Because of its inherent limitations, internal control over financial reporting may not prevent or detect misstatements. Also, projections of any evaluation of effectiveness to future periods are subject to the risk that controls may become inadequate because of changes in conditions, or that the degree of compliance with the policies or procedures may deteriorate.
/s/ Delap LLP
We have served as the Company's auditorauditors since 2010.
Lake Oswego, Oregon
December 9, 20198, 2021
|
| |
| Consolidated Balance Sheets |
(Dollars in Thousands, Except Per Share Amounts)
Timberland Bancorp, Inc. and Subsidiary
September 30, 20192021 and 20182020
| | | | | | | | | | | |
| 2021 | | 2020 |
| Assets | | | |
| Cash and cash equivalents: | | | |
| Cash and due from financial institutions | $ | 26,316 | | | $ | 21,877 | |
| Interest-bearing deposits in banks | 553,880 | | | 292,575 | |
| Total cash and cash equivalents | 580,196 | | | 314,452 | |
| | | |
Certificates of deposit (“CDs”) held for investment (at cost, which
approximates fair value) | 28,482 | | | 65,545 | |
| Investment securities held to maturity, at amortized cost (estimated fair value $70,109 and $29,827) | 69,102 | | | 27,890 | |
| Investment securities available for sale, at fair value | 63,176 | | | 57,907 | |
| Investments in equity securities, at fair value | 955 | | | 977 | |
| Federal Home Loan Bank of Des Moines (“FHLB”) stock | 2,103 | | | 1,922 | |
| Other investments, at cost | 3,000 | | | 3,000 | |
| Loans held for sale | 3,217 | | | 4,509 | |
| | | |
| Loans receivable, net of allowance for loan losses of $13,469 and $13,414 | 968,454 | | | 1,013,875 | |
| | | |
| Premises and equipment, net | 22,367 | | | 23,035 | |
| Other real estate owned (“OREO”) and other repossessed assets, net | 157 | | | 1,050 | |
| Accrued interest receivable | 3,745 | | | 4,484 | |
| Bank owned life insurance (“BOLI”) | 22,193 | | | 21,596 | |
| Goodwill | 15,131 | | | 15,131 | |
| Core deposit intangible (“CDI”), net | 1,264 | | | 1,625 | |
| Loan servicing rights, net | 3,482 | | | 3,095 | |
| Operating lease right-of-use ("ROU") assets | 2,283 | | | 2,587 | |
| Other assets | 2,873 | | | 3,298 | |
| Total assets | $ | 1,792,180 | | | $ | 1,565,978 | |
| | | |
| Liabilities and shareholders’ equity | | | |
| Liabilities | | | |
| Deposits: | | | |
| Non-interest-bearing demand | $ | 535,212 | | | $ | 441,889 | |
| Interest-bearing | 1,035,343 | | | 916,517 | |
| Total deposits | 1,570,555 | | | 1,358,406 | |
| | | |
| Operating lease liabilities | 2,359 | | | 2,630 | |
| FHLB borrowings | 5,000 | | | 10,000 | |
| Other liabilities and accrued expenses | 7,367 | | | 7,312 | |
| Total liabilities | 1,585,281 | | | 1,378,348 | |
| | | |
Commitments and contingencies (See Note 17) | 0 | | 0 |
|
| | | | | | | |
| | 2019 |
| | 2018 |
|
| Assets | | | |
| Cash and cash equivalents: | | | |
| Cash and due from financial institutions | $ | 25,179 |
| | $ | 20,238 |
|
| Interest-bearing deposits in banks | 117,836 |
| | 128,626 |
|
| Total cash and cash equivalents | 143,015 |
| | 148,864 |
|
| | | | |
Certificates of deposit (“CDs”) held for investment (at cost, which
approximates fair value) | 78,346 |
| | 63,290 |
|
| Investment securities held to maturity, at amortized cost (estimated fair value $32,580 and $13,264) | 31,102 |
| | 12,810 |
|
| Investment securities available for sale, at fair value | 22,532 |
| | 1,154 |
|
| Investments in equity securities, at fair value | 958 |
| | — |
|
| Federal Home Loan Bank of Des Moines (“FHLB”) stock | 1,437 |
| | 1,190 |
|
| Other investments, at cost | 3,000 |
| | 3,000 |
|
| Loans held for sale | 6,071 |
| | 1,785 |
|
| Loans receivable, net of allowance for loans losses of $9,690 and $9,530 | 886,662 |
| | 725,391 |
|
| Premises and equipment, net | 22,830 |
| | 18,953 |
|
| Other real estate owned (“OREO”) and other repossessed assets, net | 1,683 |
| | 1,913 |
|
| Accrued interest receivable | 3,598 |
| | 2,877 |
|
| Bank owned life insurance (“BOLI”) | 21,005 |
| | 19,813 |
|
| Goodwill | 15,131 |
| | 5,650 |
|
| Core deposit intangible (“CDI”), net | 2,031 |
| | — |
|
| Servicing rights, net | 2,408 |
| | 2,028 |
|
| Escrow deposit for business combination | — |
| | 6,900 |
|
| Other assets | 5,323 |
| | 2,672 |
|
| Total assets | $ | 1,247,132 |
| | $ | 1,018,290 |
|
| | | | |
| Liabilities and shareholders’ equity | |
| | |
|
| Liabilities | |
| | |
|
| Deposits: | | | |
| Non-interest-bearing demand | $ | 296,472 |
| | $ | 233,258 |
|
| Interest-bearing | 771,755 |
| | 656,248 |
|
| Total deposits | 1,068,227 |
| | 889,506 |
|
| | | | |
| Other liabilities and accrued expenses | 7,838 |
| | 4,127 |
|
| Total liabilities | 1,076,065 |
| | 893,633 |
|
| | | | |
Commitments and contingencies (See Note 16) |
|
| |
|
|
See notes to consolidated financial statements
|
| |
| Consolidated Balance Sheets (continued) |
(Dollars in Thousands, Except Per Share Amounts)
Timberland Bancorp, Inc. and Subsidiary
September 30, 20192021 and 20182020
| | | | | | | | | | | |
| Shareholders’ equity | 2021 | | 2020 |
| Preferred stock, $0.01 par value; 1,000,000 shares authorized; none issued | $ | — | | | $ | — | |
Common stock, $0.01 par value; 50,000,000 shares authorized; 8,355,469 shares issued and outstanding - September 30, 2021 8,310,793 shares issued and outstanding - September 30, 2020 | 42,673 | | | 42,396 | |
| | | |
| Retained earnings | 164,167 | | | 145,173 | |
| Accumulated other comprehensive income | 59 | | | 61 | |
| Total shareholders’ equity | 206,899 | | | 187,630 | |
| Total liabilities and shareholders’ equity | $ | 1,792,180 | | | $ | 1,565,978 | |
|
| | | | | | | |
| Shareholders’ equity | 2019 |
| | 2018 |
|
| Preferred stock, $0.01 par value; 1,000,000 shares authorized; none issued | $ | — |
| | $ | — |
|
Common stock, $0.01 par value; 50,000,000 shares authorized; 8,329,419 shares issued and outstanding - September 30, 2019 7,401,177 shares issued and outstanding - September 30, 2018 | 43,030 |
| | 14,394 |
|
| Unearned shares issued to Employee Stock Ownership Plan (“ESOP”) | — |
| | (133 | ) |
| Retained earnings | 127,987 |
| | 110,525 |
|
| Accumulated other comprehensive income (loss) | 50 |
| | (129 | ) |
| Total shareholders’ equity | 171,067 |
| | 124,657 |
|
| Total liabilities and shareholders’ equity | $ | 1,247,132 |
| | $ | 1,018,290 |
|
See notes to consolidated financial statements
|
| |
| Consolidated Statements of Income |
(Dollars in Thousands, Except Per Share Amounts)
Timberland Bancorp, Inc. and Subsidiary
Years Ended September 30, 2019, 20182021, 2020 and 20172019
| | | | | | | | | | | | | | | | | | |
| | 2021 | | 2020 | | 2019 | |
| Interest and dividend income | | | | | | |
| Loans receivable and loans held for sale | $ | 52,539 | | | $ | 51,341 | | | $ | 49,127 | | |
| Investment securities | 1,195 | | | 1,579 | | | 1,264 | | |
| Dividends from mutual funds, FHLB stock and other investments | 111 | | | 128 | | | 162 | | |
| Interest-bearing deposits in banks and CDs | 1,117 | | | 2,535 | | | 5,172 | | |
| Total interest and dividend income | 54,962 | | | 55,583 | | | 55,725 | | |
| | | | | | |
| Interest expense | | | | | | |
| Deposits | 3,013 | | | 4,635 | | | 4,565 | | |
| FHLB borrowings | 91 | | | 66 | | | — | | |
| Total interest expense | 3,104 | | | 4,701 | | | 4,565 | | |
| | | | | | |
| Net interest income | 51,858 | | | 50,882 | | | 51,160 | | |
| | | | | | |
| Provision for loan losses | — | | | 3,700 | | | — | | |
| | | | | | |
| Net interest income after provision for loan losses | 51,858 | | | 47,182 | | | 51,160 | | |
| | | | | | |
| Non-interest income | | | | | | |
| Recoveries on investment securities | 20 | | | 120 | | | 71 | | |
| Adjustment for portion of other than temporary impairment ("OTTI") transferred from other comprehensive income (loss) (before income taxes) | — | | | — | | | (12) | | |
| Net recoveries on investment securities | 20 | | | 120 | | | 59 | | |
| | | | | | |
| Gain on sales of investment securities, net | — | | | — | | | 47 | | |
| Service charges on deposits | 3,911 | | | 4,147 | | | 4,904 | | |
| ATM and debit card interchange transaction fees | 5,084 | | | 4,378 | | | 4,036 | | |
| BOLI net earnings | 597 | | | 591 | | | 1,641 | | |
| Gain on sales of loans, net | 5,904 | | | 5,979 | | | 1,754 | | |
| Escrow fees | 290 | | | 273 | | | 197 | | |
| Servicing income on loans sold | 7 | | | 193 | | | 466 | | |
| Valuation recovery (allowance) on loan servicing rights, net | 110 | | | (221) | | | (4) | | |
| Fee income from non-deposit investment sales | 23 | | | 22 | | | 46 | | |
| Other, net | 1,215 | | | 1,706 | | | 1,195 | | |
| Total non-interest income, net | 17,161 | | | 17,188 | | | 14,341 | | |
|
| | | | | | | | | | | |
| | 2019 |
| | 2018 |
| | 2017 |
|
| Interest and dividend income | | | | | |
| Loans receivable and loans held for sale | $ | 49,127 |
| | $ | 38,298 |
| | $ | 36,385 |
|
| Investment securities | 1,264 |
| | 217 |
| | 279 |
|
| Dividends from mutual funds, FHLB stock and other investments | 162 |
| | 120 |
| | 88 |
|
| Interest-bearing deposits in banks and CDs | 5,172 |
| | 3,198 |
| | 1,586 |
|
| Total interest and dividend income | 55,725 |
| | 41,833 |
| | 38,338 |
|
| | | | | | |
| Interest expense | | | | | |
| Deposits | 4,565 |
| | 2,778 |
| | 2,218 |
|
| FHLB borrowings | — |
| | — |
| | 979 |
|
| Total interest expense | 4,565 |
| | 2,778 |
| | 3,197 |
|
| | | | | | |
| Net interest income | 51,160 |
| | 39,055 |
| | 35,141 |
|
| | | | | | |
| Recapture of loan losses | — |
| | — |
| | (1,250 | ) |
| | | | | | |
| Net interest income after recapture of loan losses | 51,160 |
| | 39,055 |
| | 36,391 |
|
| | | | | | |
| Non-interest income | | | | | |
| Recoveries on investment securities | 71 |
| | 73 |
| | 38 |
|
| Adjustment for portion of other than temporary impairment ("OTTI") transferred from other comprehensive income (loss) (before income taxes) | (12 | ) | | (5 | ) | | (5 | ) |
| Net recoveries on investment securities | 59 |
| | 68 |
| | 33 |
|
| | | | | | |
| Gain on sales of investment securities, net | 47 |
| | — |
| | — |
|
| Service charges on deposits | 4,904 |
| | 4,581 |
| | 4,518 |
|
| ATM and debit card interchange transaction fees | 4,036 |
| | 3,570 |
| | 3,343 |
|
| BOLI net earnings | 1,641 |
| | 547 |
| | 545 |
|
| Gain on sales of loans, net | 1,754 |
| | 1,893 |
| | 2,157 |
|
| Escrow fees | 197 |
| | 211 |
| | 242 |
|
| Servicing income on loans sold | 462 |
| | 480 |
| | 417 |
|
| Fee income from non-deposit investment sales | 46 |
| | 109 |
| | 63 |
|
| Other, net | 1,195 |
| | 1,085 |
| | 1,050 |
|
| Total non-interest income, net | 14,341 |
| | 12,544 |
| | 12,368 |
|
See notes to consolidated financial statements
|
| |
| Consolidated Statements of Income (continued) |
(Dollars in Thousands, Except Per Share Amounts)
Timberland Bancorp, Inc. and Subsidiary
Years Ended September 30, 2019, 20182021, 2020 and 20172019
| | | | | | | | | | | | | | | | | |
| | 2021 | | 2020 | | 2019 |
| Non-interest expense | | | | | |
| Salaries and employee benefits | $ | 18,750 | | | $ | 18,351 | | | $ | 18,545 | |
| Premises and equipment | 3,942 | | | 3,962 | | | 3,831 | |
| Loss (gain) on sales/dispositions of premises and equipment, net | — | | | (98) | | | 7 | |
| Advertising | 625 | | | 631 | | | 696 | |
| OREO and other repossessed assets, net | (87) | | | 276 | | | 221 | |
| ATM and debit card interchange transaction fees | 1,831 | | | 1,628 | | | 1,583 | |
| Postage and courier | 587 | | | 568 | | | 514 | |
| Amortization of CDI | 361 | | | 406 | | | 452 | |
| State and local taxes | 1,088 | | | 998 | | | 873 | |
| Professional fees | 1,006 | | | 1,107 | | | 1,019 | |
| Federal Deposit Insurance Corporation ("FDIC") insurance | 415 | | | 204 | | | 187 | |
| | | | | |
| Loan administration and foreclosure | 471 | | | 448 | | | 382 | |
| Data processing and telecommunications | 2,510 | | | 2,285 | | | 3,707 | |
| Deposit operations | 1,091 | | | 1,114 | | | 1,358 | |
| Other | 2,001 | | | 2,183 | | | 2,205 | |
| Total non-interest expense, net | 34,591 | | | 34,063 | | | 35,580 | |
| | | | | |
| Income before income taxes | 34,428 | | | 30,307 | | | 29,921 | |
| | | | | |
| | | | | |
| Provision for income taxes | 6,845 | | | 6,038 | | | 5,901 | |
| | | | | |
| | | | | |
| | | | | |
| | | | | |
| | | | | |
| Net income | $ | 27,583 | | | $ | 24,269 | | | $ | 24,020 | |
| | | | | |
| Net income per common share | | | | | |
| Basic | $ | 3.31 | | | $ | 2.91 | | | $ | 2.89 | |
| Diluted | $ | 3.27 | | | $ | 2.88 | | | $ | 2.84 | |
| | | | | |
|
| | | | | | | | | | | |
| | 2019 |
| | 2018 |
| | 2017 |
|
| Non-interest expense | | | | | |
| Salaries and employee benefits | $ | 18,545 |
| | $ | 15,740 |
| | $ | 14,908 |
|
| Premises and equipment | 3,831 |
| | 3,231 |
| | 3,082 |
|
| Loss (gain) on sales/dispositions of premises and equipment, net | 7 |
| | (102 | ) | | 5 |
|
| Advertising | 696 |
| | 782 |
| | 698 |
|
| OREO and other repossessed assets, net | 221 |
| | 140 |
| | 22 |
|
| ATM and debit card interchange transaction fees | 1,583 |
| | 1,296 |
| | 1,405 |
|
| Postage and courier | 514 |
| | 456 |
| | 435 |
|
| Amortization of CDI | 452 |
| | — |
| | — |
|
| State and local taxes | 873 |
| | 687 |
| | 609 |
|
| Professional fees | 1,019 |
| | 1,390 |
| | 887 |
|
| Federal Deposit Insurance Corporation ("FDIC") insurance | 187 |
| | 294 |
| | 362 |
|
| Loan administration and foreclosure | 382 |
| | 336 |
| | 205 |
|
| Data processing and telecommunications | 3,707 |
| | 1,938 |
| | 1,870 |
|
| Deposit operations | 1,358 |
| | 1,192 |
| | 1,074 |
|
| Other | 2,205 |
| | 1,797 |
| | 1,954 |
|
| Total non-interest expense, net | 35,580 |
| | 29,177 |
| | 27,516 |
|
| | | | | | |
| Income before income taxes | 29,921 |
| | 22,422 |
| | 21,243 |
|
| | | | | | |
| Provision for income taxes | 5,901 |
| | 5,701 |
| | 7,076 |
|
| Net income | $ | 24,020 |
| | $ | 16,721 |
| | $ | 14,167 |
|
| | | | | | |
| Net income per common share | | | | | |
| Basic | $ | 2.89 |
| | $ | 2.28 |
| | $ | 1.99 |
|
| Diluted | $ | 2.84 |
| | $ | 2.22 |
| | $ | 1.92 |
|
| | | | | | |
See notes to consolidated financial statements
|
| |
| Consolidated Statements of Comprehensive Income |
(Dollars in Thousands)
Timberland Bancorp, Inc. and Subsidiary
Years Ended September 30, 2019, 20182021, 2020 and 20172019
| | | | | | | | | | | | | | | | | |
| | 2021 | | 2020 | | 2019 |
| Comprehensive income | | | | | |
| Net income | $ | 27,583 | | | $ | 24,269 | | | $ | 24,020 | |
| Other comprehensive income (loss) | | | | | |
| Unrealized holding gain (loss) on investment securities available for sale, net of income taxes of $(2), $(1), and $23, respectively | (12) | | | (3) | | | 85 | |
| | | | | |
| Change in OTTI on investment securities held to maturity, net of income taxes: | | | | | |
| | | | | |
| Adjustments related to other factors for which OTTI was previously recognized, net of income taxes of $1, $(1), and $(1), respectively | 2 | | | (3) | | | (3) | |
Amount reclassified to credit loss for previously recorded market loss, net of income taxes of $0, $0, and $3, respectively | — | | | — | | | 9 | |
| Accretion of OTTI on investment securities held to maturity, net of income taxes of $2, $4, and $6, respectively | 8 | | | 17 | | | 25 | |
| | | | | |
| Total other comprehensive income (loss), net of income taxes | (2) | | | 11 | | | 116 | |
| | | | | |
| Total comprehensive income | $ | 27,581 | | | $ | 24,280 | | | $ | 24,136 | |
|
| | | | | | | | | | | |
| | 2019 |
| | 2018 |
| | 2017 |
|
| Comprehensive income | | | | | |
| Net income | $ | 24,020 |
| | $ | 16,721 |
| | $ | 14,167 |
|
| Other comprehensive income (loss) | | | | | |
| Unrealized holding gain (loss) on investment securities available for sale, net of income taxes of $23, ($8), and ($12), respectively | 85 |
| | (39 | ) | | (23 | ) |
| Change in OTTI on investment securities held to maturity, net of income taxes: | | | | | |
| Adjustments related to other factors for which OTTI was previously recognized, net of income taxes of ($1), ($2), and $12, respectively | (3 | ) | | (7 | ) | | 22 |
|
Amount reclassified to credit loss for previously recorded market loss, net of income taxes of $3, $1, and $2, respectively | 9 |
| | 4 |
| | 3 |
|
| Accretion of OTTI on investment securities held to maturity, net of income taxes of $6, $10, and $26, respectively | 25 |
| | 37 |
| | 49 |
|
| | | | | | |
| Total other comprehensive income (loss), net of income taxes | 116 |
| | (5 | ) | | 51 |
|
| | | | | | |
| Total comprehensive income | $ | 24,136 |
|
| $ | 16,716 |
|
| $ | 14,218 |
|
See notes to consolidated financial statements
|
| |
| Consolidated Statements of Shareholders’ Equity |
(Dollars in Thousands, Except Per Share Amounts)
Timberland Bancorp, Inc. and Subsidiary
Years Ended September 30, 2019, 20182021, 2020 and 20172019
| | | | | | | | | | | | | | | | | | | | | | | | | | | | | | | | | | | | | | | | | |
| | Common Stock | | Unearned
Shares Issued to
Employee Stock Ownership Plan ("ESOP") | | | | Accumulated
Other
Comprehensive
Income (Loss) | | |
| | | | Number of Shares | | | | Amount | | | Retained
Earnings | | | Total |
| Balance, September 30, 2018 | | | 7,401,177 | | | | | $ | 14,394 | | | $ | (133) | | | $ | 110,525 | | | $ | (129) | | | $ | 124,657 | |
| | | | | | | | | | | | | | | |
| Net income | | | — | | | | | — | | | — | | | 24,020 | | | — | | | 24,020 | |
| Other comprehensive income | | | — | | | | | — | | | — | | | — | | | 116 | | | 116 | |
| Repurchase of common stock | | | (20,440) | | | | | (499) | | | — | | | — | | | — | | | (499) | |
| Common stock issued for business combination | | | 904,826 | | | | | 28,267 | | | — | | | — | | | — | | | 28,267 | |
| | | | | | | | | | | | | | | |
| | | | | | | | | | | | | | | |
| | | | | | | | | | | | | | | |
| Exercise of stock options | | | 43,856 | | | | | 401 | | | — | | | — | | | — | | | 401 | |
| | | | | | | | | | | | | | | |
| | | | | | | | | | | | | | | |
| Common stock dividends ($0.78 per common share) | | | — | | | | | — | | | — | | | (6,495) | | | — | | | (6,495) | |
| Earned ESOP shares, net of income taxes | | | — | | | | | 308 | | | 133 | | | — | | | — | | | 441 | |
| | | | | | | | | | | | | | | |
| Stock option compensation expense | | | — | | | | | 159 | | | — | | | — | | | — | | | 159 | |
| Adoption of Accounting Standards Update ("ASU") 2016-01 | | | — | | | | | — | | | — | | | (63) | | | 63 | | | — | |
| | | | | | | | | | | | | | | |
| Balance, September 30, 2019 | | | 8,329,419 | | | | | 43,030 | | | — | | | 127,987 | | | 50 | | | 171,067 | |
| | | | | | | | | | | | | | | |
| Net income | | | — | | | | | — | | | — | | | 24,269 | | | — | | | 24,269 | |
| Other comprehensive income | | | — | | | | | — | | | — | | | — | | | 11 | | | 11 | |
| Repurchase of common stock | | | (56,601) | | | | | (1,238) | | | — | | | — | | | — | | | (1,238) | |
| | | | | | | | | | | | | | | |
| | | | | | | | | | | | | | | |
| | | | | | | | | | | | | | | |
| | | | | | | | | | | | | | | |
| Exercise of stock options | | | 37,975 | | | | | 391 | | | — | | | — | | | — | | | 391 | |
| | | | | | | | | | | | | | | |
| | | | | | | | | | | | | | | |
| Common stock dividends ($0.85 per common share) | | | — | | | | | — | | | — | | | (7,083) | | | — | | | (7,083) | |
| Earned ESOP shares, net of income taxes | | | — | | | | | 31 | | | — | | | — | | | — | | | 31 | |
| | | | | | | | | | | | | | | |
| Stock option compensation expense | | | — | | | | | 182 | | | — | | | — | | | — | | | 182 | |
| | | | | | | | | | | | | | | |
| | | | | | | | | | | | | | | |
| Balance, September 30, 2020 | | | 8,310,793 | | | | | 42,396 | | | — | | | 145,173 | | | 61 | | | 187,630 | |
| | | | | | | | | | | | | | | |
|
| | | | | | | | | | | | | | | | | | | | | | |
| | Common Stock | | Unearned Shares Issued to
ESOP | | | | Accumulated Other Comprehensive
Loss | | |
| | Number of Shares | | Amount | | | Retained Earnings | | | Total |
| Balance, September 30, 2016 | 6,943,868 |
| | $ | 9,961 |
| | $ | (661 | ) | | $ | 87,709 |
| | $ | (175 | ) | | $ | 96,834 |
|
| | | | | | | | | | | | |
| Net income | — |
| | — |
| | — |
| | 14,167 |
| | — |
| | 14,167 |
|
| Other comprehensive income | — |
| | — |
| | — |
| | — |
| | 51 |
| | 51 |
|
| Exercise of stock warrant | 370,899 |
| | 2,496 |
| | — |
| | — |
| | — |
| | 2,496 |
|
| Exercise of stock options | 46,310 |
| | 332 |
| | — |
| | — |
| | — |
| | 332 |
|
| Common stock dividends ($0.50 per common share) | — |
| | — |
| | — |
| | (3,641 | ) | | — |
| | (3,641 | ) |
| Earned ESOP shares, net of income taxes | — |
| | 341 |
| | 264 |
| | — |
| | — |
| | 605 |
|
| Stock option compensation expense | — |
| | 156 |
| | — |
| | — |
| | — |
| | 156 |
|
| | | | | | | | | | | | |
| Balance, September 30, 2017 | 7,361,077 |
| | 13,286 |
| | (397 | ) | | 98,235 |
| | (124 | ) | | 111,000 |
|
| | | | | | | | | | | | |
| Net income | — |
| | — |
| | — |
| | 16,721 |
| | — |
| | 16,721 |
|
| Other comprehensive loss | — |
| | — |
| | — |
| | — |
| | (5 | ) | | (5 | ) |
| Exercise of stock options | 40,100 |
| | 318 |
| | — |
| | — |
| | — |
| | 318 |
|
| Common stock dividends ($0.60 per common share) | — |
| | — |
| | — |
| | (4,431 | ) | | — |
| | (4,431 | ) |
| Earned ESOP shares, net of income taxes | — |
| | 618 |
| | 264 |
| | — |
| | — |
| | 882 |
|
| Stock option compensation expense | — |
| | 172 |
| | — |
| | — |
| | — |
| | 172 |
|
| | | | | | | | | | | | |
| Balance, September 30, 2018 | 7,401,177 |
| | 14,394 |
| | (133 | ) | | 110,525 |
| | (129 | ) | | 124,657 |
|
See notes to consolidated financial statements
|
| |
| Consolidated Statements of Shareholders’ Equity (continued) |
(Dollars in Thousands, Except Per Share Amounts)
Timberland Bancorp, Inc. and Subsidiary
Years Ended September 30, 2019, 20182021, 2020 and 20172019
| | | | | | | | | | | | | | | | | | | | | | | | | | | | | | | | | | | | | |
| | | | Common Stock | | | | | | Accumulated
Other
Comprehensive
Income (Loss) | | |
| | | | Number of Shares | | | | Amount | | | Retained
Earnings | | | Total |
| Balance, September 30, 2020 | | | 8,310,793 | | | | | $ | 42,396 | | | | | $ | 145,173 | | | $ | 61 | | | $ | 187,630 | |
| | | | | | | | | | | | | | | |
| Net income | | | — | | | | | — | | | | | 27,583 | | | — | | | 27,583 | |
| Other comprehensive loss | | | — | | | | | — | | | | | — | | | (2) | | | (2) | |
| Repurchase of common stock | | | (19,588) | | | | | (527) | | | | | — | | | — | | | (527) | |
| | | | | | | | | | | | | | | |
| | | | | | | | | | | | | | | |
| | | | | | | | | | | | | | | |
| | | | | | | | | | | | | | | |
| Exercise of stock options | | | 64,264 | | | | | 631 | | | | | — | | | — | | | 631 | |
| | | | | | | | | | | | | | | |
| | | | | | | | | | | | | | | |
| Common stock dividends ($1.03 per common share) | | | — | | | | | — | | | | | (8,589) | | | — | | | (8,589) | |
| | | | | | | | | | | | | | | |
| | | | | | | | | | | | | | | |
| Stock option compensation expense | | | — | | | | | 173 | | | | | — | | | — | | | 173 | |
| | | | | | | | | | | | | | | |
| | | | | | | | | | | | | | | |
| Balance, September 30, 2021 | | | 8,355,469 | | | | | $ | 42,673 | | | | | $ | 164,167 | | | $ | 59 | | | $ | 206,899 | |
|
| | | | | | | | | | | | | | | | | | | | | | |
| | Common Stock | | Unearned Shares Issued to
ESOP | | | | Accumulated Other Comprehensive Income (Loss) | | |
| | Number of Shares | | Amount | | | Retained Earnings | | | Total |
| Balance, September 30, 2018 | 7,401,177 |
| | $ | 14,394 |
| | $ | (133 | ) | | $ | 110,525 |
| | $ | (129 | ) | | $ | 124,657 |
|
| | | | | | | | | | | | |
| Net income | — |
| | — |
| | — |
| | 24,020 |
| | — |
| | 24,020 |
|
| Other comprehensive income | — |
| | — |
| | — |
| | — |
| | 116 |
| | 116 |
|
| Repurchase of common stock | (20,440 | ) | | (499 | ) | | — |
| | — |
| | — |
| | (499 | ) |
| Common stock issued for business combination | 904,826 |
| | 28,267 |
| | — |
| | — |
| | — |
| | 28,267 |
|
| Exercise of stock options | 43,856 |
| | 401 |
| | — |
| | — |
| | — |
| | 401 |
|
| Common stock dividends ($0.78 per common share) | — |
| | — |
| | — |
| | (6,495 | ) | | — |
| | (6,495 | ) |
| Earned ESOP shares, net of income taxes | — |
| | 308 |
| | 133 |
| | — |
| | — |
| | 441 |
|
| Stock option compensation expense | — |
| | 159 |
| | — |
| | — |
| | — |
| | 159 |
|
| Adoption of Accounting Standards Update ("ASU") 2016-01 | — |
| | — |
| | — |
| | (63 | ) | | 63 |
| | — |
|
| | | | | | | | | | | | |
| Balance, September 30, 2019 | 8,329,419 |
| | $ | 43,030 |
| | $ | — |
| | $ | 127,987 |
| | $ | 50 |
| | $ | 171,067 |
|
See notes to consolidated financial statements
|
| |
| Consolidated Statements of Cash Flows |
(Dollars in Thousands)
Timberland Bancorp, Inc. and Subsidiary
Years Ended September 30, 2019, 20182021, 2020 and 20172019
| | | | | | | | | | | | | | | | | |
| | 2021 | | 2020 | | 2019 |
| Cash flows from operating activities | | | | | |
| Net income | $ | 27,583 | | | $ | 24,269 | | | $ | 24,020 | |
| Adjustments to reconcile net income to net cash provided by operating activities: | | | | | |
| Depreciation | 1,563 | | | 1,572 | | | 1,604 | |
| Deferred income taxes | 275 | | | 76 | | | 703 | |
| Amortization of CDI | 361 | | | 406 | | | 452 | |
| Earned ESOP shares | — | | | 31 | | | 441 | |
| Accretion of discount on purchased loans | (340) | | | (597) | | | (645) | |
| Stock option compensation expense | 173 | | | 182 | | | 159 | |
| | | | | |
| Gain on sales of investment securities | — | | | — | | | (47) | |
| Net recoveries on investment securities | (20) | | | (120) | | | (59) | |
| Change in fair value of investments in equity securities | 22 | | | (19) | | | (41) | |
| Gain on sales of OREO and other repossessed assets, net | (92) | | | (35) | | | (89) | |
| Amortization (accretion) of discounts and premiums on securities | 118 | | | (183) | | | 167 | |
| Provision for OREO losses | — | | | 173 | | | 24 | |
| Gain on sales of loans, net | (5,904) | | | (5,979) | | | (1,754) | |
| Loss (gain) on sales/dispositions of premises and equipment, net | — | | | (98) | | | 7 | |
| Provision for loan losses | — | | | 3,700 | | | — | |
| Loans originated for sale | (133,006) | | | (153,446) | | | (70,132) | |
| Proceeds from sales of loans | 140,202 | | | 160,987 | | | 67,600 | |
| Amortization of loan servicing rights | 1,111 | | | 838 | | | 646 | |
| Valuation adjustment on loan servicing rights, net | (110) | | | 221 | | | 8 | |
| BOLI net earnings | (597) | | | (591) | | | (613) | |
| BOLI death benefit in excess of cash surrender value | — | | | — | | | (1,028) | |
| Increase (decrease) in deferred loan origination fees | (1,293) | | | 3,637 | | | 161 | |
| Net change in accrued interest receivable and other assets, and other liabilities and accrued expenses | (411) | | | (1,168) | | | (3,476) | |
| Net cash provided by operating activities | 29,635 | | | 33,856 | | | 18,108 | |
| | | | | |
| Cash flows from investing activities | | | | | |
| Net decrease (increase) in CDs held for investment | 37,063 | | | 12,801 | | | (12,083) | |
| Purchase of investment securities held to maturity | (53,049) | | | (10,255) | | | (13,166) | |
| Purchase of investment securities available for sale | (18,698) | | | (41,212) | | | (20,909) | |
Proceeds from maturities and prepayments of investment securities held to maturity | 12,004 | | | 13,818 | | | 11,784 | |
| Proceeds from maturities and prepayments of investment securities available for sale | 13,162 | | | 5,802 | | | 1,412 | |
| Proceeds from sale of investment securities held to maturity | — | | | — | | | 2,937 | |
| Proceeds from sales of investment securities available for sale | — | | | — | | | 2,332 | |
| Purchase of FHLB stock | (181) | | | (485) | | | (42) | |
| | | | | |
| | | | | |
| Decrease (increase) in loans receivable, net | 47,054 | | | (133,953) | | | (39,536) | |
| Purchase of premises and equipment | (895) | | | (1,986) | | | (2,151) | |
| | | | | |
| Proceeds from sales of OREO and other repossessed assets | 985 | | | 495 | | | 613 | |
| Proceeds from sales/dispositions of premises and equipment | — | | | 307 | | | — | |
| Proceeds from death benefit on BOLI | — | | | — | | | 3,078 | |
| Cash acquired, net of cash consideration paid in business combination | — | | | — | | | 14,284 | |
| Escrow deposit for business combination | — | | | — | | | 6,900 | |
| Net cash provided by (used in) investing activities | 37,445 | | | (154,668) | | | (44,547) | |
|
| | | | | | | | | | | |
| | 2019 |
| | 2018 |
| | 2017 |
|
| Cash flows from operating activities | | | | | |
| Net income | $ | 24,020 |
| | $ | 16,721 |
| | $ | 14,167 |
|
| Adjustments to reconcile net income to net cash provided by operating activities: | |
| | |
| | |
| Depreciation | 1,604 |
| | 1,290 |
| | 1,262 |
|
| Deferred income taxes | 703 |
| | 797 |
| | 385 |
|
| Amortization of CDI | 452 |
| | — |
| | — |
|
| Earned ESOP shares | 441 |
| | 882 |
| | 605 |
|
| Accretion of discount on purchased loans | (645 | ) | | — |
| | — |
|
| Stock option compensation expense | 159 |
| | 172 |
| | 156 |
|
| Gain on sales of investment securities | (47 | ) | | — |
| | — |
|
| Net recoveries on investment securities | (59 | ) | | (68 | ) | | (33 | ) |
| Change in fair value of investments in equity securities | (41 | ) | | — |
| | — |
|
| Gain on sales of OREO and other repossessed assets, net | (89 | ) | | (229 | ) | | (54 | ) |
| Provision for OREO losses | 24 |
| | 248 |
| | 42 |
|
| Gain on sales of loans, net | (1,754 | ) | | (1,893 | ) | | (2,157 | ) |
| (Gain) loss on sales/dispositions of premises and equipment, net | 7 |
| | (102 | ) | | 5 |
|
| Recapture of loan losses | — |
| | — |
| | (1,250 | ) |
| Loans originated for sale | (70,489 | ) | | (62,677 | ) | | (69,996 | ) |
| Proceeds from sales of loans | 67,957 |
| | 66,384 |
| | 72,158 |
|
| Amortization of servicing rights | 646 |
| | 491 |
| | 487 |
|
| Valuation adjustment on servicing rights, net | 4 |
| | — |
| | — |
|
| BOLI net earnings | (613 | ) | | (547 | ) | | (545 | ) |
| BOLI death benefit in excess of cash surrender value | (1,028 | ) | | — |
| | — |
|
| Increase in deferred loan origination fees | 161 |
| | 171 |
| | 237 |
|
| Net change in accrued interest receivable and other assets, and other liabilities and accrued expenses | (3,305 | ) | | (190 | ) | | (1,610 | ) |
| Net cash provided by operating activities | 18,108 |
| | 21,450 |
| | 13,859 |
|
| | | | | | |
| Cash flows from investing activities | |
| | |
| | |
| Net (increase) decrease in CDs held for investment | (12,083 | ) | | (20,256 | ) | | 9,966 |
|
| Purchase of investment securities held to maturity | (13,166 | ) | | (6,073 | ) | | — |
|
| Purchase of investment securities available for sale | (20,909 | ) | | — |
| | — |
|
Proceeds from maturities and prepayments of investment securities held to maturity | 11,784 |
| | 554 |
| | 609 |
|
Proceeds from maturities and prepayments of investment securities available for sale | 1,412 |
| | 41 |
| | 68 |
|
| Proceeds from sale of investment securities held to maturity | 2,937 |
| | — |
| | — |
|
| Proceeds from sales of investment securities available for sale | 2,332 |
| | — |
| | — |
|
| Purchase of FHLB stock | (42 | ) | | (83 | ) | | (103 | ) |
| Proceeds from redemption of FHLB stock | — |
| | — |
| | 1,200 |
|
| Purchase of other investments | — |
| | — |
| | (3,000 | ) |
| Increase in loans receivable, net | (39,536 | ) | | (35,522 | ) | | (26,956 | ) |
| Additions to premises and equipment | (2,151 | ) | | (2,186 | ) | | (3,526 | ) |
| Proceeds from sales of OREO and other repossessed assets | 613 |
| | 1,693 |
| | 1,579 |
|
| Proceeds from sales/dispositions of premises and equipment | — |
| | 463 |
| | — |
|
| Proceeds from death benefit on BOLI | 3,078 |
| | — |
| | — |
|
| Cash acquired, net of cash consideration paid in business combination | 14,284 |
| | — |
| | — |
|
| Escrow deposit for business combination | 6,900 |
| | (6,900 | ) | | — |
|
| Net cash used in investing activities | (44,547 | ) | | (68,269 | ) | | (20,163 | ) |
See notes to consolidated financial statements
|
| |
| Consolidated Statements of Cash Flows (continued) |
(Dollars in Thousands)
Timberland Bancorp, Inc. and Subsidiary
Years Ended September 30, 2019, 20182021, 2020 and 20172019
| | | | | | | | | | | | | | | | | |
| | 2021 | | 2020 | | 2019 |
| Cash flows from financing activities | | | | | |
| Net increase in deposits | $ | 212,149 | | | $ | 290,179 | | | $ | 27,183 | |
| | | | | |
| Proceeds from (repayment of) FHLB borrowings | (5,000) | | | 10,000 | | | — | |
| | | | | |
| | | | | |
| Proceeds from exercise of stock options | 631 | | | 391 | | | 401 | |
| | | | | |
| | | | | |
| | | | | |
| | | | | |
| Repurchase of common stock | (527) | | | (1,238) | | | (499) | |
| Payment of dividends | (8,589) | | | (7,083) | | | (6,495) | |
| Net cash provided by financing activities | 198,664 | | | 292,249 | | | 20,590 | |
| | | | | |
| Net increase (decrease) in cash and cash equivalents | 265,744 | | | 171,437 | | | (5,849) | |
| | | | | |
| Cash and cash equivalents | | | | | |
| Beginning of year | 314,452 | | | 143,015 | | | 148,864 | |
| End of year | $ | 580,196 | | | $ | 314,452 | | | $ | 143,015 | |
| | | | | |
| | | | | |
| Supplemental disclosure of cash flow information | | | | | |
| Income taxes paid | $ | 5,965 | | | $ | 5,522 | | | $ | 6,593 | |
| Interest paid | 3,244 | | | 4,760 | | | 4,457 | |
| | | | | |
| Supplemental disclosure of non-cash investing activities | | | | | |
| Loans transferred to OREO and other repossessed assets | $ | — | | | $ | — | | | $ | 293 | |
| Other comprehensive income (loss) related to investment securities | (2) | | | 11 | | | 116 | |
| Operating lease liabilities arising from recording of ROU assets | — | | | 2,889 | | | — | |
| | | | | |
|
| | | | | | | | | | | |
| | 2019 |
| | 2018 |
| | 2017 |
|
| Cash flows from financing activities | |
| | |
| | |
| Net increase in deposits | $ | 27,183 |
| | $ | 51,608 |
| | $ | 76,364 |
|
| Repayment of FHLB borrowings | — |
| | — |
| | (30,000 | ) |
| Proceeds from exercise of stock options | 401 |
| | 318 |
| | 332 |
|
| Proceeds from exercise of stock warrant | — |
| | — |
| | 2,496 |
|
| Repurchase of common stock | (499 | ) | | — |
| | — |
|
| Payment of dividends | (6,495 | ) | | (4,431 | ) | | (3,641 | ) |
| Net cash provided by financing activities | 20,590 |
|
| 47,495 |
|
| 45,551 |
|
| | |
| | |
| | |
| Net increase (decrease) in cash and cash equivalents | (5,849 | ) | | 676 |
| | 39,247 |
|
| | | | | | |
| Cash and cash equivalents | |
| | |
| | |
| Beginning of period | 148,864 |
| | 148,188 |
| | 108,941 |
|
| End of period | $ | 143,015 |
| | $ | 148,864 |
| | $ | 148,188 |
|
| | | | | | |
| | | | | | |
| Supplemental disclosure of cash flow information | |
| | |
| | |
| Income taxes paid | $ | 6,593 |
| | $ | 4,462 |
| | $ | 7,596 |
|
| Interest paid | 4,457 |
| | 2,714 |
| | 3,283 |
|
| | | | | | |
| Supplemental disclosure of non-cash investing activities | |
| | |
| | |
| Loans transferred to OREO and other repossessed assets | $ | 293 |
| | $ | 324 |
| | $ | 751 |
|
| Other comprehensive income (loss) related to investment securities | 116 |
| | (5 | ) | | 51 |
|
See notes to consolidated financial statements
Notes to Consolidated Financial Statements_________________________________________________________________84
| | | | | | | | |
| Notes to Consolidated Financial Statements | |
Timberland Bancorp, Inc. and Subsidiary
September 30, 20192021 and 20182020
Note 1 - Summary of Significant Accounting Policies
Principles of Consolidation
The accompanying consolidated financial statements include the accounts of Timberland Bancorp, Inc. (“Timberland Bancorp”); its wholly owned subsidiary, Timberland Bank (the “Bank”); and the Bank’s wholly owned subsidiary, Timberland Service Corp. (collectively, the "Company”). All significant intercompany transactions and balances have been eliminated in consolidation.
On October 1, 2018, the Company completed the acquisition of South Sound Bank, a Washington-state chartered bank, headquartered in Olympia, Washington ("South Sound Acquisition"). The Company acquired 100% of the outstanding common stock of South Sound Bank, and South Sound Bank was merged into the Bank. The results of operations of the acquired assets and assumed liabilities have been included in the Company's consolidated financial statements as of and for the period since the acquisition date. See Note 2 for additional information on the South Sound Acquisition.
Nature of Operations
Timberland Bancorp is a bank holding company which operates primarily through its subsidiary, the Bank. The Bank was established in 1915 and, through its 24 branches located in Grays Harbor, Pierce, Thurston, Kitsap, King and Lewis counties in Washington State, attracts deposits from the general public, and uses those funds, along with other borrowings, primarily to provide residential real estate, construction, commercial real estate, commercial business and consumer loans to borrowers primarily in western Washington.
Consolidated Financial Statement Presentation
The consolidated financial statements have been prepared in accordance with accounting principles generally accepted in the United States of America ("U.S.") (“GAAP”) and prevailing practices within the banking industry. The preparation of consolidated financial statements requires management to make estimates and assumptions that affect the reported amounts of assets and liabilities, and the disclosure of contingent assets and liabilities, as of the date of the consolidated balance sheets, and the reported amounts of income and expenses during the reporting period.periods. Actual results could differ from those estimates. Material estimates that are particularly susceptible to significant change in the near termnear-term relate to the determination of the allowance for loan losses, the determination of any OTTI in the fair value of investment securities, the valuation of loan servicing rights, the valuation of OREO, the valuation of assets acquired and liabilities assumed in the South Sound Acquisitionacquisitions and the valuation of goodwill for potential impairment.
Certain prior year amounts have been reclassified to conform to the 20192021 fiscal year presentation with no change to previously reported net income or shareholders’ equity.
Segment Reporting
The Company has one1 reportable operating segment which is defined as community banking in western Washington under the operating name “Timberland Bank.”
Cash and Cash Equivalents and Cash Flows
The Company considers amounts included in the consolidated balance sheets’ captions “Cash and due from financial institutions” and “Interest-bearing deposits in banks,” all of which mature within ninety days, to be cash equivalents for purposes of reporting cash flows.
Interest-bearing deposits in banks as of September 30, 20192021 and 20182020 included deposits with the Federal Reserve Bank of San Francisco ("FRB") of $102,189,000$537,222,000 and $123,745,000,$266,171,000, respectively. The Company also maintains balances in correspondent bank accounts which, at times, may exceed the FDIC insurance limit of $250,000 per correspondent bank. Management believes that its risk of loss associated with such balances is minimal due to the financial strength of the FRB and the correspondent banks.
Notes to Consolidated Financial Statements_________________________________________________________________85
| | | | | | | | |
| Notes to Consolidated Financial Statements | |
Timberland Bancorp, Inc. and Subsidiary
September 30, 20192021 and 20182020
CDs Held for Investment
CDs held for investment include amounts invested with other FDIC-insured financial institutions for a stated interest rate and with a fixed maturity date. Such CDs generally have maturities of 12 to 60 months from the date of purchase by the Company. Early withdrawal penalties may apply; however, the Company intends to hold these CDs to maturity. The Company generally limits its purchases of CDs to a maximum of $250,000 (the FDIC insurance coverage limit) with any single financial institution.
Investment Securities
Investments in debt securities are classified upon acquisition as held to maturity or available for sale. Investments in debt securities that the Company has the positive intent and ability to hold to maturity are classified as held to maturity and reported at amortized cost. Investments in debt securities classified as available for sale are reported at fair value, with unrealized gains and losses excluded from earnings and reported in other comprehensive income (loss), net of income tax effects. Premiums and discounts are amortized to interest income using the interest method over the contractual lives of the securities. Gains and losses on sales of investment securities are recognized on the trade date and determined using the specific identification method.
In estimating whether there are any OTTI losses, management considers (1) the length of time and the extent to which the fair value has been less than amortized cost, (2) the financial condition and near termnear-term prospects of the issuer, (3) the impact of changes in market interest rates and (4) the intent and ability of the Company to retain its investment for a period of time sufficient to allow for any anticipated recovery in fair value.
Declines in the fair value of individual debt securities available for sale that are deemed to be other than temporary are recognized in earnings when identified. The fair value of the debt security then becomes the new cost basis. For individual debt securities that are held to maturity which the Company does not intend to sell, and it is not more likely than not that the Company will be required to sell before recovery of its amortized cost basis, the other than temporary decline in the fair value of the debt security related to: (1) credit loss is recognized in earnings and (2) market or other factors is recognized in other comprehensive income (loss). Credit loss is recorded if the present value of expected future cash flows is less than the amortized cost. For individual debt securities which the Company intends to sell or more likely than not will not recover all of its amortized cost, the OTTI is recognized in earnings equal to the entire difference between the debt security’s cost basis and its fair value at the consolidated balance sheet date. For individual debt securities for which credit loss has been recognized in earnings, interest accruals and amortization and accretion of premiums and discounts are suspended when the credit loss is recognized. Interest received after accruals have been suspended is recognized on a cash basis.
Investments in Equity Securities
Investments in equity securities are stated at fair value. Prior to October 1, 2018, changes in the fair value of investments in equity securities were excluded from earnings and reported in other comprehensive income (loss), net of income tax effects. On October 1, 2018, the Company adopted ASU 2016-01 and reclassified its mutual funds as investments in equity securities. Beginning October 1, 2018, changesChanges in the fair value of investments in equity securities are recorded in other non-interest income.
FHLB Stock
The Bank, as a member of the FHLB, is required to maintain an investment in capital stock of the FHLB in an amount equal to 0.12% of the Bank's total assets plus 4.00% of any borrowings from the FHLB. No ready market exists for this stock, and it has no quoted market value. However, redemption of FHLB stock has historically been at par value. The Company's investment in FHLB stock is carried at cost, which approximates fair value.
The Company evaluates its FHLB stock for impairment as needed. The Company's determination of whether this investment is impaired is based on its assessment of the ultimate recoverability of cost rather than by recognizing temporary declines in value. The determination of whether a decline affects the ultimate recoverability of cost is influenced by criteria such as (1) the significance of any decline in net assets of the FHLB as compared with the capital stock amount and the length of time any decline has persisted; (2) commitments by the FHLB to make payments required by law or regulation and the level of such payments in relation to the operating performance of the FHLB; (3) the impact of legislative and regulatory changes on
Notes to Consolidated Financial Statements_________________________________________________________________
Timberland Bancorp, Inc. and Subsidiary
September 30, 2019 and 2018
institutions and, accordingly, the customer base of the FHLB; and (4) the liquidity position of the FHLB. Based on its evaluation, the Company determined that there was no impairment of FHLB stock at September 30, 20192021 and 2018.2020.
| | | | | | | | |
| Notes to Consolidated Financial Statements | |
Timberland Bancorp, Inc. and Subsidiary
September 30, 2021 and 2020
Other Investments
The Bank invests in the Solomon Hess SBA Loan Fund LLC - a private investment fund - to help satisfy compliance with the Bank's Community Reinvestment Act ("CRA") investment test requirements. Shares in this fund are not publicly traded and, therefore, have no readily determinable fair value. The Bank's investment in the fund is recorded at cost. An investor can have its investment in the fund redeemed for the balance of its capital account at any quarter endquarter-end with a 60 day notice to the fund.
Loans Held for Sale
Mortgage loans and commercial business loans originated and intended for sale in the secondary market are stated in the aggregate at the lower of cost or estimated fair value. Net unrealized losses, if any, are recognized through a valuation allowance by charges to income. Gains or losses on sales of loans are recognized at the time of sale. The gain or loss is the difference between the net sales proceeds and the recorded value of the loans, including any remaining unamortized deferred loan origination fees.
Loans Receivable
Loans are stated at the amount of unpaid principal, reduced by the undisbursed portion of construction loans in process, net deferred loan origination fees and the allowance for loan losses.
Interest on loans is accrued daily based on the principal amount outstanding. Generally, the accrual of interest on loans is discontinued when, in management’s opinion, the borrower may be unable to make payments as they become due or when they are past due 90 days as to either principal or interest (based on contractual terms), unless the loan is well secured and in the process of collection. In determining whether a borrower may be able to make payments as they become due, management considers circumstances such as the financial strength of the borrower, the estimated collateral value, reasons for the delays in payments, payment record, the amounts past due and the number of days past due. All interest accrued but not collected for loans that are placed on non-accrual status or charged off is reversed against interest income. Subsequent collections on a cash basis are applied proportionately to past due principal and interest, unless collectability of principal is in doubt, in which case all payments are applied to principal. Loans are returned to accrual status when the loan is deemed current, and the collectability of principal and interest is no longer doubtful, or, in the case of one- to four-family loans, when the loan is less than 90 days delinquent. The categories of non-accrual loans and impaired loans overlap, although they are not identical.
The Company charges fees for originating loans. These fees, net of certain loan origination costs, are deferred and amortized to income on the level-yield basis over the loan term. If the loan is repaid prior to maturity, the remaining unamortized deferred loan origination fee is recognized in income at the time of repayment.
Acquired Loans
Purchased loans, including loans acquired in business combinations, are recorded at their estimated fair value at the acquisition date. Credit discounts are included in the determination of fair value; therefore, an allowance for loan losses is not recorded at the acquisition date. Acquired loans are evaluated upon acquisition and classified as either purchased credit-impaired ("PCI") or purchased non-credit-impaired. PCI loans reflect credit deterioration since origination such that it is probable at acquisition that the Company will be unable to collect all contractually required payments. The excess of the cash flows expected to be collected over a PCI loan's carrying value is considered to be the accretable yield and is recognized as interest income over the estimated life of the PCI loan using the effective yield method. The excess of the undiscounted contractual balances due over the cash flows expected to be collected is considered to be the nonaccretable difference. The nonaccretable difference represents the Company's estimate of the credit losses expected to occur and would be considered in determining the estimated
fair value of the loans as of the acquisition date. Subsequent to the acquisition date, any increases in expected cash flows over those expected at the purchase date in excess of fair value are adjusted through a change to the accretable yield on a prospective basis. Any subsequent decreases in expected cash flows attributable to credit deterioration are recognized by recording an allowance for loan losses. PCI loans were insignificant as of September 30, 2019,2021 and the Company had no PCI loans as of September 30, 2018.2020.
Notes to Consolidated Financial Statements_________________________________________________________________
Timberland Bancorp, Inc. and Subsidiary
September 30, 2019 and 2018
For purchased non-credit-impaired loans, the difference between the fair value and unpaid principal balance of the loan at the acquisition date is amortized or accreted to interest income over the life of the loans. Any subsequent deterioration in credit quality is recognized by recording an allowance for loan losses.
| | | | | | | | |
| Notes to Consolidated Financial Statements | |
Timberland Bancorp, Inc. and Subsidiary
September 30, 2021 and 2020
Troubled Debt Restructured Loans
A troubled debt restructured loan ("TDR") is a loan for which the Company, for reasons related to a borrower’s financial difficulties, grants a concession to the borrower that the Company would not otherwise consider. Examples of such concessions include, but are not limited to: a reduction in the stated interest rate; an extension of the maturity at an interest rate below current market rates; a reduction in the face amount of the debt; a reduction in the accrued interest; or re-amortizations, extensions, deferrals and renewals. TDRs are considered impaired and are individually evaluated for impairment. TDRs are classified as non-accrual (and considered to be non-performing) unless they have been performing in accordance with modified terms for a period of at least six months.
In March 2020, the Company announced loan modification programs to support and provide relief for its borrowers during the novel coronavirus of 2019 ("COVID-19") pandemic. The Company has followed the loan modification criteria within the Coronavirus Aid, Relief, and Economic Security Act of 2020 ("CARES Act"), which was signed into law on March 27, 2020, and interagency guidance from the federal banking agencies when determining if a borrower's modification is subject to a TDR classification. On March 22, 2020, federal banking regulators issued an interagency statement that included guidance on their approach for the accounting of loan modifications in light of the economic impact of the COVID-19 pandemic. The guidance interprets current accounting standards and indicates that a lender can conclude that a borrower is not experiencing financial difficulty if short-term modifications are made in response to COVID-19, such as payment deferrals, fee waivers, extensions of repayment terms, or other delays in payment that are insignificant related to the loans in which the borrower is less than 30 days past due on its contractual payments at the time a modification is implemented. The agencies confirmed in working with the staff of the FASB that short-term modification made on a good faith basis in response to COVID-19 to borrowers who were current prior to any relief are not troubled debt restructurings. If it is determined that the modification does not meet the criteria under the CARES Act or interagency guidance to be excluded from TDR classification, the Company evaluates the loan modifications under its existing TDR framework. Loans subject to forbearance under the COVID-19 loan modification program are not reported as past due or placed on non-accrual status during the forbearance time period, and interest income continues to be recognized over the contractual life of the loans.
Allowance for Loan Losses
The allowance for loan losses is maintained at a level sufficient to provide for probable losses inherent in the loan portfolio. The allowance is provided based upon management's comprehensive analysis of the pertinent factors underlying the quality of the loan portfolio. These factors include changes in the amount and composition of the loan portfolio, delinquency levels, actual loan loss experience, current economic conditions, and a detailed analysis of individual loans for which full collectability may not be assured. The detailed analysis includes methods to estimate the fair value of loan collateral and the existence of potential alternative sources of repayment. The allowance consists of specific and general components. The specific component relates to loans that are deemed impaired. For loans that are classified as impaired, an allowance is established when the discounted cash flows, collateral value less selling costs (if applicable), or observable market price of the impaired loan is lower than the recorded value of that loan. The general component covers non-impaired loans and is based on historical loss experience adjusted for qualitative factors. The Company's historical loss experience is determined by evaluating the average net charge-offs over the most recent economic cycle, but not to exceed six years. Qualitative factors are determined by loan type and allow management to adjust reserve levels to reflect the current general economic environment and portfolio performance trends including recent charge-off trends. Allowances are provided based on management’s continuing evaluation of the pertinent factors underlying the quality of the loan portfolio, including changes in the size and composition of the loan portfolio, actual loan loss experience, current economic conditions, collateral values, geographic concentrations, seasoning of the loan portfolio, specific industry conditions, the duration of the current business cycle, and regulatory requirements and expectations. When determining the appropriate historical loss and qualitative factors, management took into consideration the impact of the COVID-19 pandemic on such factors as the national and state unemployment rates and related trends, the amount and timing of financial assistance provided by the government, consumer spending levels and trends, industries significantly impacted by the COVID-19 pandemic, and the Company's COVID-19 loan modification program. The appropriateness of the allowance for loan losses is estimated based upon these factors and trends identified by management at the time the consolidated financial statements are prepared.
A loan is considered impaired when it is probable that the Company will be unable to collect all amounts (principal and interest) when due according to the contractual terms of the loan agreement. Smaller balance homogeneous loans, such as residential mortgage loans and consumer loans, may be collectively evaluated for impairment. When a loan has been identified as being impaired, the amount of the impairment is measured by using discounted cash flows, except when, as an alternative, the current
| | | | | | | | |
| Notes to Consolidated Financial Statements | |
Timberland Bancorp, Inc. and Subsidiary
September 30, 2021 and 2020
estimated fair value of the collateral (reduced by estimated costs to sell, if applicable) or observable market price is used. The valuation of real estate collateral is subjective in nature and may be adjusted in future periods because of changes in economic conditions. Management considers third-party appraisals, as well as independent fair market value assessments from realtors or persons involved in selling real estate, in determining the estimated fair value of particular properties. In addition, as certain of
these third-party appraisals and independent fair market value assessments are only updated periodically, changes in the values of specific properties may have occurred subsequent to the most recent appraisals. Accordingly, the amounts of any such potential changes and any related adjustments are generally recorded at the time such information is received. When the estimated net realizable value of the impaired loan is less than the recorded investment in the loan (including accrued interest and net deferred loan origination fees or costs), impairment is recognized by creating or adjusting an allocation of the allowance for loan losses, and uncollected accrued interest is reversed against interest income. If the ultimate collection of principal is in doubt, all cash receipts on impaired loans are applied to reduce the principal balance.
A provision for (recapture of) loan losses is charged (credited) to operations and is added to (deducted from) the allowance for loan losses based on a quarterly comprehensive analysis of the loan portfolio. The allowance for loan losses is allocated to
certain loan categories based on the relative risk characteristics, asset classifications and actual loss experience of the loan portfolio. While management has allocated the allowance for loan losses to various loan portfolio segments, the allowance is general in nature and is available for the loan portfolio in its entirety.
Notes to Consolidated Financial Statements_________________________________________________________________
Timberland Bancorp, Inc. and Subsidiary
September 30, 2019 and 2018
The ultimate recovery of all loans is susceptible to future market factors beyond the Company’s control. These factors may result in losses or recoveries differing significantly from those provided in the consolidated financial statements. If real estate values decline and as updated appraisals are received on collateral for impaired loans, the Company may need to increase the allowance for loan losses appropriately.as appropriate. In addition, regulatory agencies, as an integral part of their examination process, periodically review the Company’s allowance for loan losses and may require the Company to make additions to the allowance based on their judgment about information available to them at the time of their examinations.
Premises and Equipment
Premises and equipment are recorded at cost. Depreciation is computed using the straight-line method over the following estimated useful lives: buildings and improvements - five to 40forty years and furniture and equipment - three to seven years. The cost of maintenance and repairs is charged to expense as incurred. Gains and losses on dispositions are reflected in current earnings.
Impairment of Long-Lived Assets
Long-lived assets, consisting of premises and equipment, are reviewed for impairment whenever events or changes in circumstances indicate that the recorded amount of an asset may not be recoverable. Recoverability of assets to be held and used is measured by a comparison of the recorded amount of an asset to undiscounted future net cash flows expected to be generated by the asset. If such assets are considered to be impaired, the impairment to be recognized is measured by the amount by which the recorded amount of the assets exceeds the discounted recovery amount or estimated fair value of the assets. No events or changes in circumstances have occurred during the years ended September 30, 20192021 or 20182020 that would cause management to evaluatere-evaluate the recoverability of the Company’s long-lived assets.
OREO and Other Repossessed Assets
OREO and other repossessed assets consist of properties or assets acquired through or in lieu of foreclosure, and are recorded initially at the estimated fair value of the properties less estimated costs of disposal, establishing a new cost basis. These assets are subsequently accounted for at the lower of cost or fair value less estimated costs to sell. When the property is acquired, any excess of the loan balance over the estimated net realizable value is charged to the allowance for loan losses. The valuation of real estate is subjective in nature and may be adjusted in future periods because of changes in economic conditions. Management considers third-party appraisals, as well as independent fair market value assessments from realtors or persons involved in selling real estate, in determining the estimated fair values of particular properties. In addition, as certain of these third-party appraisals and independent fair market value assessments are only updated periodically, changes in the values of specific properties may have occurred subsequent to the most recent appraisals. Accordingly, the amounts of any such potential changes and any related adjustments are generally recorded at the time such information is received. Costs relating to development and improvement of the properties or assets are capitalized, while costs relating to holding the properties or assets are expensed.
| | | | | | | | |
| Notes to Consolidated Financial Statements | |
Timberland Bancorp, Inc. and Subsidiary
September 30, 2021 and 2020
BOLI
BOLI policies are recorded at their cash surrender value less applicable cash surrender charges. Income from BOLI is recognized when earned.
Goodwill
Goodwill is initially recorded when the purchase price paid in a business combination exceeds the estimated fair value of the net identified tangible and intangible assets acquired and liabilities assumed. Goodwill is presumed to have an indefinite useful life and is analyzed annually for impairment. The Company performs an annual review during the third quarter of each fiscal year, or more frequently if indicators of potential impairment exist, to determine if the recorded goodwill is impaired. For purposes of goodwill impairment testing, the services offered through the Bank and its subsidiary are managed as one strategic unit and represent the Company's only reporting unit.
The annual goodwill impairment test begins with a qualitative assessment of whether it is "more likely than not" that the reporting unit's fair value is less than its carrying amount. If an entity concludes that it is not "more likely than not" that the fair value of a reporting unit is less than its carrying amount, it need not perform a two-step impairment test. If the Company's qualitative assessment concluded that it is "more likely than not" that the fair value of its reporting unit is less than its carrying
Notes to Consolidated Financial Statements_________________________________________________________________
Timberland Bancorp, Inc. and Subsidiary
September 30, 2019 and 2018
amount, it must perform the two-step impairment test to identify potential goodwill impairment and measure the amount of goodwill impairment loss to be recognized, if any. The first step of the goodwill impairment test compares the estimated fair value of the reporting unit with its carrying amount, or the book value, including goodwill. If the estimated fair value of the reporting unit equals or exceeds its book value, goodwill is considered not impaired, and the second step of the impairment test is unnecessary.
The second step, if necessary, measures the amount of goodwill impairment loss to be recognized. The reporting unit must determine fair value for all assets and liabilities, excluding goodwill. The net of the assigned fair value of assets and liabilities is then compared to the book value of the reporting unit, and any excess book value becomes the implied fair value of goodwill. If the carrying amount of the goodwill exceeds the newly calculated implied fair value of goodwill, an impairment loss is recognized in the amount required to write-down the goodwill to the implied fair value.
Management's qualitative assessment takes into consideration macroeconomic conditions, industry and market considerations, cost or margin factors, financial performance and the share price of the Company's common stock. The Company performed its fiscal year 2021 goodwill impairment test during the quarter ended June 30, 2021. Based on this assessment, the Company determined that it is not "more likely than not" that the Company's fair value is less than its carrying amount, and, therefore, goodwill was determined not to be impaired at May 31, 2019.2021.
A significant amount of judgment is involved in determining if an indicator of goodwill impairment has occurred. Such indicators may include, among others: a significant decline in expected future cash flows; a sustained, significant decline in the Company's stock price and market capitalization; a significant adverse change in legal factors or in the business climate; adverse assessment or action by a regulator; and unanticipated competition. Any change in these indicators could have a significant negative impact on the Company's financial condition, impact the goodwill impairment analysis or cause the Company to perform a goodwill impairment analysis more frequently than once per year.
As of September 30, 2019,2021, management believes that there were no events or changes in the circumstances since May 31, 20192021 that would indicate a potential impairment of goodwill. No assurances can be given, however, that the Company will not record an impairment loss on goodwill in the future. If adverse economic conditions or decreases in the Company's stock price and market capitalization as a result of the COVID-19 pandemic were deemed to be other than temporary, it may significantly affect the fair value of the Company's goodwill and may trigger impairment charges. Any impairment charge could have a material adverse effect on the Company's results of operation and financial condition.
CDI
CDI represents the future economic benefit of the potential cost savings from acquiring core deposits as part of a business combination compared to the cost of alternative funding sources. CDI is amortized to non-interest expense using an accelerated method based on an estimated runoff of related deposits over a period of ten years. CDI is evaluated for impairment whenever
| | | | | | | | |
| Notes to Consolidated Financial Statements | |
Timberland Bancorp, Inc. and Subsidiary
September 30, 2021 and 2020
events or changes in circumstances indicate that its carrying amount may not be recoverable, with any changes in estimated useful life accounted for prospectively over the revised remaining life.
Loan Servicing Rights
The Company holds rights to service (1) loans that it has originated and sold to the Federal Home Loan Mortgage Corporation (“Freddie Mac”) and (2) the guaranteed portion of U.S. Small Business Administration ("SBA") loans sold in the secondary market. ServicingLoan servicing rights are capitalized at estimated fair value when acquired through the origination of loans that are subsequently sold with the servicing rights retained. ServicingLoan servicing rights are amortized to servicing income on loans sold approximately in proportion to and over the period of estimated net servicing income. The value of loan servicing rights at the date of the sale of loans is estimated based on the discounted present value of expected future cash flows using key assumptions for servicing income and costs and expected prepayment rates on the underlying loans. The estimated fair value is periodically evaluated for impairment by comparing actual cash flows and estimated future cash flows from the loan servicing assets to those estimated at the time the loan servicing assets were originated. Fair values are estimated using expected future discounted cash flows based on current market rates of interest. For purposes of measuring impairment, the loan servicing rights must be stratified by one or more predominant risk characteristics of the underlying loans. The Company stratifies its capitalized loan servicing rights based on product type and term of the underlying loans. The amount of impairment recognized is the amount, if any, by which the amortized cost of the loan servicing rights exceeds their fair value. Impairment, if deemed temporary, is recognized through a valuation allowance to the extent that fair value is less than the recorded amount.
Notes to Consolidated Financial Statements_________________________________________________________________
Timberland Bancorp, Inc. and Subsidiary
September 30, 2019 and 2018
Transfers of Financial Assets
Transfers of financial assets are accounted for as sales when control over the assets has been surrendered. Control over transferred assets is deemed to be surrendered when (1) the assets have been isolated from the Company, (2) the transferee obtains the right (free of conditions that constrain it from taking advantage of that right) to pledge or exchange the transferred assets, and (3) the Company does not maintain effective control over the transferred assets through an agreement to repurchase them before their maturity.
Income Taxes
The Company files a consolidated federal and various state income tax returns. The Bank provides for income taxes separately and remits to (receives from) Timberland Bancorp amounts currently due (receivable).
Deferred income taxes result from temporary differences between the tax basis of assets and liabilities and their reported amounts in the consolidated financial statements. These temporary differences will result in differences between income for tax purposes and income for financial reporting purposes in future years. As changes in tax laws or rates are enacted, deferred tax assets and liabilities are adjusted through the provision for income taxes. Valuation allowances are established to reduce the net recorded amount of deferred tax assets if it is determined to be more likely than not that all or some portion of the potential deferred tax asset will not be realized.
With respect to accounting for uncertainty in incomes taxes, a tax provision is recognized as a benefit only if it is “more likely than not” that the tax position would be sustained in a tax examination, with a tax examination being presumed to occur. The amount recognized is the largest amount of tax benefit that is greater than 50% likely to be realized upon examination. For tax positions not meeting the “more likely than not” test, no tax benefit is recorded. The Company recognizes interest and/or penalties related to income tax matters as income tax expense. The Company is no longer subject to U.S. federal income tax examination by tax authorities for years ended on or before September 30, 2015.2017.
ESOP
The Bank sponsors a leveraged ESOP; however, all ESOP debt was fully repaid during the year ended September 30, 2019. The debt of the ESOP was payable to Timberland Bancorp, was recorded as other borrowed funds of the Bank, and was eliminated in the consolidated financial statements. The shares of the Company's common stock pledged as collateral for the ESOP's debt were reported as unearned shares issued to the ESOP in the consolidated financial statements. As shares were released from collateral, compensation expense was recorded equal to the average market price of the shares for the period, and the shares became available for net income per common share calculations. Dividends paid on unallocated shares reduced the Company’s cash contributions to the ESOP.
| | | | | | | | |
| Notes to Consolidated Financial Statements | |
Timberland Bancorp, Inc. and Subsidiary
September 30, 2021 and 2020
Advertising
Costs for advertising and marketing are expensed as incurred.
Stock-Based Compensation
The Company measures compensation cost for all stock-based awards based on the grant-date fair value of the stock-based awards and recognizes compensation cost over the service period of stock-based awards. The fair value of stock options is determined using the Black-Scholes valuation model. Stock option forfeitures are accounted for as they occur.
Net Income Per Common Share
Basic net income per common share is computed by dividing net income to common shareholders by the weighted average number of common shares outstanding during the period, without considering any dilutive items. Diluted net income per common share is computed by dividing net income to common shareholders by the weighted average number of common shares and common stock equivalents for items that are dilutive, net of shares assumed to be repurchased using the treasury stock method at the average share price for the Company's common stock during the period. Common stock equivalents arise from the assumed conversion of outstanding stock options and outstanding warrants to purchase common stock.options. Shares owned
Notes to Consolidated Financial Statements_________________________________________________________________
Timberland Bancorp, Inc. and Subsidiary
September 30, 2019 and 2018
by the Bank’s ESOP that havehad not been allocated arewere not considered to be outstanding for the purpose of computing basic and diluted net income per common share.
Related Party Transactions
The Chairman of the Board of the Bank and Timberland Bancorp is a member of the law firm that provides general counsel to the Company. Legal and other fees paid to this law firm for the years ended September 30, 2021, 2020 and 2019 2018totaled $67,000, $78,000 and 2017 totaled $69,000, $94,000 and $99,000, respectively.
Recent Accounting Pronouncements
In May 2014,June 2016, the Financial Accounting Standards Board ("FASB") issued ASU 2014-09, Revenue from Contracts with Customers, which created FASB Accounting Standards CodificationUpdate ("ASC"ASU") Topic 606 ("ASC 606"). The core principle of ASC 606 is that an entity recognizes revenue to depict the transfer of promised goods or services to customers in an amount that reflects the consideration to which the entity expects to be entitled in exchange for those goods or services. To achieve that core principle, an entity should apply the following steps: (1) identify the contract(s) with a customer, (2) identify the performance obligations in the contract, (3) determine the transaction price, (4) allocate the transaction price to the performance obligations in the contract and (5) recognize revenue when (or as) the entity satisfies a performance obligation. ASC 606 was effective for fiscal years beginning after December 15, 2017, including interim periods within those fiscal years. The Company adopted ASC 606 on October 1, 2018 using the modified retrospective approach. Therefore, the comparative information has not been adjusted and continues to be reported under the superseded ASC 605. There was no cumulative effect adjustment as of October 1, 2018, and there were no material changes to the timing or amount of revenue recognized for the year ended September 30, 2019; however, additional disclosures were incorporated in the footnotes upon adoption. The majority of the Company's revenue is comprised of interest income from financial assets, which is explicitly excluded from the scope of ASC 606. The Company elected to apply the practical expedient pursuant to ASC 606 and therefore does not disclose information about remaining performance obligations that have an original expected term of one year or less and allows the Company to expense costs related to obtaining a contract as incurred when the amortization period would have been one year or less. See Note 23 for additional information.
In January 2016, the FASB issued ASU 2016-01, Financial Instruments - Overall (Subtopic 825-10): Recognition and Measurement of Financial Assets and Financial Liabilities. ASU 2016-01 generally requires equity investments - except those accounted for under the equity method of accounting or those that result in consolidation of the investee - to be measured at fair value with changes in fair value recognized in net income. However, an entity may choose to measure equity investments that do not have readily determinable fair values at cost minus impairment, if any, plus or minus changes resulting from observable price changes in orderly transactions for the identical or a similar investment of the same issuer. ASU 2016-01 is intended to simplify the impairment assessment of equity investments without readily determinable fair values by requiring a qualitative assessment to identify impairment. ASU 2016-01 also eliminates certain disclosures related to the fair value of financial instruments and requires entities to use the exit price notion when measuring the fair value of financial instruments for disclosure purposes. ASU 2016-01 was effective for fiscal years beginning after December 15, 2017, including interim periods within those fiscal years. The Company adopted ASU 2016-01 on October 1, 2018. As required by ASU 2016-01, on October 1, 2018 the Company recorded a one-time cumulative effect adjustment of $63,000 representing net unrealized losses on equity securities (mutual funds) between accumulated other comprehensive loss and retained earnings on the accompanying consolidated balance sheet. Additionally, the fair values of financial instruments for disclosure purposes were computed using an exit price notion and deposits with no stated maturity are no longer included in the fair value disclosures in Note 21.
In February 2016, the FASB issued ASU 2016-02, Leases (Topic 842), which created FASB ASC Topic 842 ("ASC 842") and is intended to increase transparency and comparability among organizations by requiring the recognition of lease assets and lease liabilities on the balance sheet and disclosure of key information about leasing arrangements. The principal change required by ASC 842 relates to lessee accounting, and is that for operating leases, a lessee is required to (1) recognize a right-of-use asset and a lease liability, initially measured at the present value of the lease payments, in the statement of financial position, (2) recognize a single lease cost, calculated so that the cost of the lease is allocated over the lease term generally on a straight-line basis, and (3) classify all cash payments within operating activities in the statement of cash flows. For leases with a term of 12 months or less, a lessee is permitted to make an accounting policy election by class of underlying asset not to recognize lease assets and lease liabilities. If a lessee makes this election, it should recognize lease expense for such leases generally on a straight-line basis over the lease term. ASC 842 also changes disclosure requirements related to leasing activities and requires certain qualitative disclosures along with specific quantitative disclosures. ASC 842 also provides an optional transition
Notes to Consolidated Financial Statements_________________________________________________________________
Timberland Bancorp, Inc. and Subsidiary
September 30, 2019 and 2018
method for adoption, under which an entity initially applies ASC 842 at the adoption date and recognizes a cumulative-effect adjustment to the opening balance of retained earnings in the period of adoption. Consequently, an entity's reporting for the comparative periods presented in the financial statements in which it adopts ASC 842 will continue to be in accordance with current GAAP. ASC 842 is effective for annual periods, and interim periods within those annual periods, beginning after December 15, 2018. Early application of ASC 842 is permitted. The Company adopted the provisions of ASC 842 effective October 1, 2019 utilizing the optional transition method and will not restate comparative periods. The Company also elected the package of practical expedients permitted under ASC 842's transition guidance, which allows the Company to carryforward its historical lease classifications and its assessment as to whether a contract is or contains a lease. The Company also elected to not recognize lease assets and lease liabilities for leases with an initial term of 12 months or less. The Company expects the adoption of ASC 842 will result in an increase in other assets and an increase in other liabilities of approximately $2.9 million. The Company does not expect the adoption of ASC 842 to have a material impact on its future consolidated statements of income.
In June 2016, the FASB issued ASU 2016-13, Financial Instruments - Credit Losses; Measurement of Credit Losses on Financial Instruments, as amended by ASU 2018-19, ASU 2019-04, ASU 2019-05, ASU 2019-10 and ASU 2019-05. This2019-11. ASU 2016-13 replaces the existing incurred losses methodology with a current expected losses methodology with respect to most financial assets measured at amortized cost and certain other instruments, including trade and other receivables, loans, held to maturity investment securities and off-balance sheet commitments. In addition, this ASU 2016-13 requires credit losses relating to available for sale debt securities to be recorded through an allowance for credit losses rather than as a reduction of the carrying amount. ASU 2016-13 also changes the accounting for purchased credit-impairedPCI debt securities and loans. ASU 2016-13 retains many of the current disclosure requirements in GAAP and expands certain disclosure requirements. As a "smaller reporting company" filer with the U.S. Securities and Exchange Commission, ASU 2016-13 is effective for fiscal years beginning after December 15, 2022, including interim periods within those fiscal years. Upon adoption, the Company expects a change in the processes and procedures to calculate the allowance for loan losses, including changes in the assumptions and estimates to consider expected credit losses over the life of the loan versus the current accounting practice that utilizes the incurred loss model. In addition, the current policy for other-than-temporary impairmentOTTI on investment securities available for sale will be replaced with an allowance approach. The Company is reviewing the requirements of ASU 2016-13 and has begun developing and implementing processes and procedures to help ensure it is fully compliant with the amendments at the adoption date. At this time, the Company anticipates that the allowance for loan losses will increase as a result of the implementation of this ASU;ASU 2016-13; however, until its evaluation is complete, the magnitude of the increase will be unknown.
In January 2017, the FASB issued ASU 2017-04, Intangibles - Goodwill and Other: Simplifying the Test for Goodwill Impairment. This ASU simplifies the subsequent measurement of goodwill and eliminates Step 2 from the goodwill impairment test. In computing the implied fair value of goodwill under Step 2, an entity had to perform procedures to determine the fair value of its assets and liabilities (including unrecognized assets and liabilities) at the impairment testing date following the procedure that would be required in determining the fair value of assets acquired and liabilities assumed in a business combination. Under ASU 2017-04, an entity should perform its annual, or interim, goodwill impairment test by comparing the fair value of a reporting unit with its carrying amount. An entity should recognize an impairment charge for the amount by
which the carrying amount exceeds the reporting unit's fair value; however, the loss recognized should not exceed the total amount of goodwill allocated to that reporting unit. Additionally, an entity should consider income tax effects from any tax
| | | | | | | | |
| Notes to Consolidated Financial Statements | |
Timberland Bancorp, Inc. and Subsidiary
September 30, 2021 and 2020
deductible goodwill on the carrying amount of the reporting unit when measuring the goodwill impairment loss, if applicable. ASU 2017-04 will beis effective for annual or interim goodwill impairment tests in fiscal years beginning after December 15, 2019. Early application of this ASU is permitted for interim or annual goodwill impairment tests performed on testing dates after January 1, 2017.2022. The adoption of ASU 2017-04 is not expected to a have a material impact on the Company's future consolidated financial statements.
In March 2017, the FASB issued ASU 2017-08, Receivables - Nonrefundable Fees and Other Costs (Subtopic 310-20): Premium Amortization on Purchased Callable Debt Securities. This ASU shortens the amortization period for certain callable debt securities held at a premium to the earliest call date. This ASU is effective for fiscal years, including interim periods within those fiscal years, beginning after December 15, 2018. The adoption of ASU 2017-08 is not expected to have a material impact on the Company's future consolidated financial statements.
In May 2017, the FASB issued ASU 2017-09, Compensation-Stock Compensation (Topic 718): Scope of Modification Accounting. This ASU was issued to provide clarity as to when to apply modification accounting when there is a change in the terms or conditions of a share-based payment award. According to the ASU, an entity should account for the effects of a modification unless the fair value, vesting conditions, and balance sheet classification of the award are the same after the modification as compared to the original award prior to modification. ASU 2017-09 was effective for fiscal years, including
Notes to Consolidated Financial Statements_________________________________________________________________
Timberland Bancorp, Inc. and Subsidiary
September 30, 2019 and 2018
interim periods within those fiscal years, beginning after December 15, 2017, with early adoption permitted. The Company adopted this ASU on October 1, 2018. The adoption of ASU 2017-09 did not have a material impact on the Company's consolidated financial statements.
In June 2018, the FASB issued ASU 2018-07, Compensation - Stock Compensation (Topic 718): Improvements to Nonemployee Share-Based Payment Accounting. This ASU was issued to expand the scope of Topic 718 to include share-based payment transactions for acquiring goods and services from nonemployees. Previously, these awards were recorded at the fair value of consideration received or the fair value of the equity instruments issued and were measured at the earlier of the commitment date or the date performance was completed. The amendments in this ASU require nonemployee share-based payment awards to be measured at the grant-date fair value of the equity instrument. ASU 2018-07 is effective for fiscal years, including interim periods within those fiscal years, beginning after December 15, 2018. Early adoption is permitted, but no earlier than an entity's adoption of ASC 606. The adoption of ASU 2018-07 is not expected to have a material impact on the Company's future consolidated financial statements.
In August 2018, the FASB issued ASU 2018-13, Fair Value Measurement (Topic 820): Disclosure Framework - Changes to the Disclosure Requirements for Fair Value Measurement. This ASU modifies the disclosure requirements for fair value measurements. The following disclosure requirements were removed from ASC Topic 820, Fair Value Measurement: (1) the amount of and reasons for transfers between Level 1 and Level 2 of the fair value hierarchy; (2) the policy for timing of transfers between levels; and (3) the valuation process for Level 3 fair value measurements. This ASU clarifies that the measurement uncertainty disclosure is to communicate information about the uncertainty in measurement as of the reporting date. This ASU adds the following disclosure requirements for Level 3 measurements: (1) changes in unrealized gains and losses for the period included in other comprehensive income for the recurring Level 3 fair value measurements held at the end of the reporting period, and (2) the range and weighted average of significant unobservable inputs used to develop Level 3 fair value measurements. ASU 2018-13 iswas effective for fiscal years beginning after December 15, 2019, including interim periods within those fiscal years. Early adoption is permitted for any removed or modified disclosures. The adoption ofCompany adopted ASU 2018-13 iseffective October 1, 2020, and it did not expected to have a material impact on the Company's future consolidated financial statements.
In August 2018, the FASB issued ASU 2018-15, Intangibles - Goodwill and Other - Internal-Use Software (Subtopic 350-40), Customer's Accounting for Implementation Costs Incurred in a Cloud Computing Arrangement That Is a Service Contract. The amendments in this ASU broaden the scope of ASC Subtopic 350-40 to include costs incurred to implement a hosting arrangement that is a service contract. The amendments align the requirements for capitalizing implementation costs incurred in a hosting arrangement that is a service contract with the requirements for capitalizing implementation costs incurred to develop or obtain internal-use software (and hosting arrangements that include an internal-use software license). The costs are capitalized or expensed depending on the nature of the costs and the project stage during which they are incurred, consistent with the accounting for internal-use software costs. The amendments in this ASU result in consistent capitalization of implementation costs of a hosting arrangement that is a service contract and implementation costs incurred to develop or obtain internal useinternal-use software (and hosting arrangements that include an internal-use software license). The accounting for the service element of a hosting arrangement that is a service contract is not affected by the amendments in this ASU. ASU 2018-15 iswas effective for fiscal years beginning after December 15, 2019, including interim periods within those fiscal years. The Company adopted ASU 2018-15 effective October 1, 2020, and it did not have a material impact on the Company's consolidated financial statements.
In December 2019, the FASB issued ASU 2019-12, Income Taxes (Topic 740), Simplifying the Accounting for Income Taxes. The amendments in this ASU simplify the accounting for income taxes by removing certain exceptions to the general principles in Topic 740. The amendments also improve consistent application of and simplify GAAP for other areas of Topic 740 by clarifying and amending existing guidelines. ASU 2019-12 is effective for public companies for fiscal years beginning after December 15, 2020, including interim periods within fiscal years. The Company adoption ASU 2019-12 effective December 31, 2020 and it did not have a material impact on the Company's future consolidated financial statements.
In March 2020, the FASB issued ASU No. 2020-04, Reference Rate Reform (Topic 848): Facilitation of the Effects of Reference Rate Reform on Financial Reporting. This ASU applies to contracts, hedging relationships and other transactions that reference the London Interbank Offered Rate ("LIBOR") or other rate references expected to be discontinued because of reference rate reform. The ASU permits an entity to make necessary modifications to eligible contracts or transactions without requiring contract remeasurement or reassessment of a previous accounting determination. This ASU is effective for all entities as of March 12, 2020 through December 31, 2022. The Company has not adopted ASU 2020-04 as of September 30, 2021. The adoption of ASU 2018-152020-04 is not expected to have a material impact on the Company's future consolidated financial statements.
| | | | | | | | |
| Notes to Consolidated Financial Statements | |
Timberland Bancorp, Inc. and Subsidiary
September 30, 2021 and 2020
Note 2 - Business Combination
On October 1, 2018, the Company completed the South Sound Acquisition. The primary reason for the acquisition was to expand the Company's presence along Washington State's economically important I-5 corridor.
Pursuant to the terms of the merger agreement, South Sound Bank shareholders received 0.746 of a share of the Company's common stock and $5.68825 in cash per share of South Sound Bank common stock. The Company issued 904,826 shares of its common stock (valued at $28,267,000 based on the Company's closing stock price on September 30, 2018 of $31.24 per share) and paid $6,903,000 in cash in the transaction for total consideration paid of $35,170,000.
The South Sound Acquisition constitutes a business combination as defined by GAAP, which establishes principles and requirements for how the acquirer in a business combination recognizes and measures in its consolidated financial statements the identifiable assets acquired and liabilities assumed. The Company was considered the acquirer in this transaction. Accordingly, the estimated fair values of the acquired assets, including the identifiable intangible assets, and the assumed liabilities in the South Sound Acquisition were measured and recorded as of October 1, 2018. The excess of the total consideration paid over the fair
Notes to Consolidated Financial Statements_________________________________________________________________
Timberland Bancorp, Inc. and Subsidiary
September 30, 2019 and 2018
value of the net assets acquired was allocated to goodwill. The South Sound Acquisition resulted in $9,481,000 of goodwill. The goodwill arising from this transaction consists largely of the synergies and expected economies of scale from combining the operations of the Company and South Sound Bank. This goodwill is not deductible for tax purposes.
In most instances, determining the estimated fair values of the acquired assets and assumed liabilities requires the Company to estimate cash flows expected to result from those assets and liabilities and to discount those cash flows at the appropriate rate of interest. Differences may arise between contractually required payments and the expected cash flows at the acquisition date due to items such as estimated credit losses, prepayments or early withdrawal, and other factors. One of the most significant of those determinations relates to the valuation of acquired loans. For such loans, the excess of cash flows expected at acquisition over the estimated fair value is recognized as interest income over the remaining lives of the loans. In accordance with GAAP, there was no carry-over of South Sound Bank's previously established allowance for loan losses.
| | | | | | | | |
| Notes to Consolidated Financial Statements | |
Timberland Bancorp, Inc. and Subsidiary
September 30, 2021 and 2020
The following table summarizes the fair value of consideration paid, the estimated fair values of assets acquired and liabilities assumed as of the acquisition date, and the resulting goodwill relating to the transaction:
| | | | | | | | | | | | | | | | | |
| At October 1, 2018 |
| Book Value | | Fair Value Adjustment | | Estimated Fair Value |
| (Dollars in thousands) |
| Total acquisition consideration | | | | | $ | 35,170 | |
| | | | | |
| Recognized amounts of identifiable assets acquired and liabilities assumed | | | | | |
| Identifiable assets acquired: | | | | | |
| Cash and cash equivalents | $ | 21,187 | | | $ | — | | | 21,187 | |
| CDs held for investment | 2,973 | | | — | | | 2,973 | |
| FHLB stock | 205 | | | — | | | 205 | |
| Investment securities held to maturity | 19,891 | | | (189) | | | 19,702 | |
| Investment securities available for sale | 5,022 | | | — | | | 5,022 | |
| Loans receivable | 123,627 | | | (2,083) | | | 121,544 | |
| Premises and equipment | 3,225 | | | 112 | | | 3,337 | |
| OREO | 25 | | | — | | | 25 | |
| Accrued interest receivable | 554 | | | — | | | 554 | |
| BOLI | 2,629 | | | — | | | 2,629 | |
| CDI | — | | | 2,483 | | | 2,483 | |
| Loan servicing rights | 285 | | | (4) | | | 281 | |
| Other assets | 1,087 | | | (511) | | | 576 | |
| Total assets | 180,710 | | | (192) | | | 180,518 | |
| | | | | |
| Liabilities assumed: | | | | | |
| Deposits | 151,378 | | | 160 | | | 151,538 | |
| Other liabilities and accrued expenses | 3,291 | | | — | | | 3,291 | |
| Total liabilities assumed | 154,669 | | | 160 | | | 154,829 | |
| Total identifiable net assets acquired | $ | 26,041 | | | $ | (352) | | | 25,689 | |
| Goodwill recognized | | | | | $ | 9,481 | |
|
| | | | | | | | | | | |
| | At October 1, 2018 |
| | Book Value | | Fair Value Adjustment | | Estimated Fair Value |
| | (Dollars in thousands) |
| Total acquisition consideration | | | | | $ | 35,170 |
|
| | | | | | |
| Recognized amounts of identifiable assets acquired and liabilities assumed | | | | | |
| Identifiable assets acquired: | | | | | |
| Cash and cash equivalents | $ | 21,187 |
| | $ | — |
| | 21,187 |
|
| CDs held for investment | 2,973 |
| | — |
| | 2,973 |
|
| FHLB stock | 205 |
| | — |
| | 205 |
|
| Investment securities held to maturity | 19,891 |
| | (189 | ) | | 19,702 |
|
| Investment securities available for sale | 5,022 |
| | — |
| | 5,022 |
|
| Loans receivable | 123,627 |
| | (2,083 | ) | | 121,544 |
|
| Premises and equipment | 3,225 |
| | 112 |
| | 3,337 |
|
| OREO | 25 |
| | — |
| | 25 |
|
| Accrued interest receivable | 554 |
| | — |
| | 554 |
|
| BOLI | 2,629 |
| | — |
| | 2,629 |
|
| CDI | — |
| | 2,483 |
| | 2,483 |
|
| Servicing rights | 285 |
| | (4 | ) | | 281 |
|
| Other assets | 1,087 |
| | (511 | ) | | 576 |
|
| Total assets | 180,710 |
| | (192 | ) | | 180,518 |
|
| | | | | | |
| Liabilities assumed: | | | | | |
| Deposits | 151,378 |
| | 160 |
| | 151,538 |
|
| Other liabilities and accrued expenses | 3,291 |
| | — |
| | 3,291 |
|
| Total liabilities assumed | 154,669 |
| | 160 |
| | 154,829 |
|
| Total identifiable net assets acquired | $ | 26,041 |
| | $ | (352 | ) | | 25,689 |
|
| Goodwill recognized | | | | | $ | 9,481 |
|
The acquired loan portfolio was valued using Level 3 inputs (see Note 21)22) and included the use of present value techniques, including cash flow estimates and incorporated assumptions that the Company believes that marketplace participants would use in estimating fair values.
Notes to Consolidated Financial Statements_________________________________________________________________
Timberland Bancorp, Inc. and Subsidiary
September 30, 2019 and 2018
The operating results of the Company for the yearyears ended September 30, 2021, 2020 and 2019 include the operating results produced by the net assets acquired in the South Sound Acquisition since the October 1, 2018 acquisition date. The Company determined that the disclosure requirements related to the amounts of revenues and earnings from the net assets acquired in the South Sound
Acquisition since the October 1, 2018 acquisition date is impracticable. The financial activity and operating results of the net assets acquired in the South Sound Acquisition were commingled with the Company's financial activity and operating results as of the acquisition date.
For illustrative purposes only,During the following table presents certain unaudited pro forma information for the years ended September 30, 2019 and 2018. This unaudited estimated pro forma information was calculated as if South Sound Bank had been acquired as of the beginning of the fiscal year ended September 30, 2018. The unaudited estimated pro forma information combines2020, the historical resultsCompany incurred acquisition-related expenses of $2,000 related to the South Sound Bank with the Company's consolidated historical results and includes certain adjustments reflecting the estimated impact of certain fair value adjustments for the respective periods. The pro forma information is not indicative of what would have occurred had the transaction occurred at the beginning of the fiscal year ended September 30, 2018. The unaudited pro forma information does not consider any changes to the provision for loan losses resulting from recording loans at fair value. Additionally, the Company expects to achieve further operating cost savings and other business synergies, including revenue growth as a result of the acquisition, which are not reflected in the pro forma amounts that follow. As a result, actual amounts would have differed from the unaudited pro forma information presented.
|
| | | | | | | |
| | Pro Forma for the Year Ended September 30, |
| | 2019 | | 2018 |
| | (Dollars in thousands, except per share amounts) |
| Total revenues (net interest income plus non-interest income) | $ | 65,501 |
| | $ | 59,184 |
|
| Net income | 24,385 |
| | 18,825 |
|
| Basic net income per common share | 2.93 |
| | 2.28 |
|
| Diluted net income per common share | 2.88 |
| | 2.23 |
|
Acquisition. During the year ended September 30, 2019, the Company incurred acquisition-related expenses of $462,000 related to the South Sound Acquisition, of which $317,000 is included in data processing and telecommunications and $145,000 is included in
professional fees in the accompanying consolidated statements of income. During the year ended September 30, 2018, the Company incurred acquisition-related expenses of $616,000 related to the South Sound Acquisition, which are all included in professional fees in the accompanying2019 consolidated statement of income. South Sound Bank incurred acquisition-related expenses of $1,598,000 for the fiscal year ended
| | | | | | | | |
| Notes to Consolidated Financial Statements | |
Timberland Bancorp, Inc. and Subsidiary
September 30, 2018 related to the South Sound Acquisition. The acquisition-related expenses incurred by the Company2021 and South Sound Bank are not included in the unaudited pro forma information presented for the years ended September 30, 2019 and 2018.2020
Note 3 - Restricted Assets
Federal Reserve regulations require that the Bank maintain certain minimum reserve balances on hand or on deposit with the FRB, based on a percentage of transaction account deposits. The amounts ofIn response to the COVID-19 pandemic, the Federal Reserve reduced the reserve requirement balances as of September 30, 2019 and 2018 were $1,898,000 and $1,609,000, respectively.ratio to zero percent, effective March 26, 2020. Currently, the FRB has not announced plans to re-impose a reserve requirement, however, the FRB may adjust reserve requirement ratios in its sole discretion.
Notes to Consolidated Financial Statements_________________________________________________________________
Timberland Bancorp, Inc. and Subsidiary
September 30, 2019 and 2018
Note 4 - Investment Securities
Held to maturity and available for sale investment securities were as follows as of September 30, 20192021 and 20182020 (dollars in thousands):
| | | | | | | | | | | | | | | | | | | | | | | |
| Amortized
Cost | | Gross
Unrealized
Gains | | Gross
Unrealized
Losses | | Estimated
Fair Value |
| September 30, 2021 | | | | | | | |
| Held to Maturity | | | | | | | |
| U.S. Treasury and U.S. government agency securities | $ | 28,760 | | | $ | 8 | | | $ | (99) | | | $ | 28,669 | |
| Mortgage-backed securities ("MBS"): | | | | | | | |
| U.S. government agencies | 25,913 | | | 936 | | | (122) | | | 26,727 | |
| Private label residential | 13,929 | | | 302 | | | (23) | | | 14,208 | |
| | | | | | | |
| Bank issued trust preferred securities | 500 | | | 5 | | | — | | | 505 | |
| Total | $ | 69,102 | | | $ | 1,251 | | | $ | (244) | | | $ | 70,109 | |
| | | | | | | |
| Available for Sale | | | | | | | |
| MBS: U.S. government agencies | $ | 63,080 | | | $ | 210 | | | $ | (114) | | | $ | 63,176 | |
| Total | $ | 63,080 | | | $ | 210 | | | $ | (114) | | | $ | 63,176 | |
| | | | | | | |
| September 30, 2020 | | | | | | | |
| Held to Maturity | | | | | | | |
| MBS: | | | | | | | |
| U.S. government agencies | $ | 27,161 | | | $ | 1,635 | | | $ | (3) | | | $ | 28,793 | |
| Private label residential | 229 | | | 307 | | | (1) | | | 535 | |
| | | | | | | |
| Bank issued trust preferred securities | 500 | | | — | | | (1) | | | 499 | |
| Total | $ | 27,890 | | | $ | 1,942 | | | $ | (5) | | | $ | 29,827 | |
| | | | | | | |
| Available for Sale | | | | | | | |
| MBS: U.S. government agencies | $ | 57,797 | | | $ | 178 | | | $ | (68) | | | $ | 57,907 | |
| | | | | | | |
| | | | | | | |
| Total | $ | 57,797 | | | $ | 178 | | | $ | (68) | | | $ | 57,907 | |
|
| | | | | | | | | | | | | | | |
| | Amortized Cost | | Gross Unrealized Gains | | Gross Unrealized Losses | | Estimated Fair Value |
| September 30, 2019 | | | | | | | |
| Held to Maturity | | | | | | | |
| Mortgage-backed securities ("MBS"): | | | | | | | |
| U.S. government agencies | $ | 27,786 |
| | $ | 999 |
| | $ | (2 | ) | | $ | 28,783 |
|
| Private label residential | 317 |
| | 490 |
| | (1 | ) | | 806 |
|
| U.S. Treasury and U.S. government agency securities | 2,999 |
| | — |
| | (8 | ) | | 2,991 |
|
| Total | $ | 31,102 |
| | $ | 1,489 |
| | $ | (11 | ) | | $ | 32,580 |
|
| | | | | | | | |
| Available for Sale | |
| | |
| | |
| | |
|
| MBS: U.S. government agencies | $ | 22,418 |
| | $ | 114 |
| | $ | — |
| | $ | 22,532 |
|
| Total | $ | 22,418 |
| | $ | 114 |
| | $ | — |
| | $ | 22,532 |
|
| | | | | | | | |
| September 30, 2018 | | | | | | | |
| Held to Maturity | |
| | |
| | |
| | |
|
| MBS: | |
| | |
| | |
| | |
|
| U.S. government agencies | $ | 1,385 |
| | $ | 8 |
| | $ | (21 | ) | | $ | 1,372 |
|
| Private label residential | 460 |
| | 552 |
| | (2 | ) | | 1,010 |
|
| U.S. Treasury and U.S. government agency securities | 10,965 |
| | — |
| | (83 | ) | | 10,882 |
|
| Total | $ | 12,810 |
| | $ | 560 |
| | $ | (106 | ) | | $ | 13,264 |
|
| | | | | | | | |
| Available for Sale | |
| | |
| | |
| | |
|
| MBS: U.S. government agencies | $ | 231 |
| | $ | 7 |
| | $ | (1 | ) | | $ | 237 |
|
| Mutual funds | 1,000 |
| | — |
| | (83 | ) | | 917 |
|
| Total | $ | 1,231 |
| | $ | 7 |
| | $ | (84 | ) | | $ | 1,154 |
|
| | | | | | | | |
| Notes to Consolidated Financial Statements | |
Held to maturity investment securities with unrealized losses were as follows as of September 30, 2019 (dollars in thousands):
|
| | | | | | | | | | | | | | | | | | | | | | | | | | | | | |
| | Less Than 12 Months | | 12 Months or Longer | | Total |
| | Estimated Fair Value | | Gross Unrealized Losses | | Qty | | Estimated Fair Value | | Gross Unrealized Losses | | Qty | | Estimated Fair Value | | Gross Unrealized Losses |
| Held to Maturity | |
| | |
| | |
| | |
| | |
| | |
| | |
| | |
|
| MBS: | |
| | |
| | |
| | |
| | |
| | |
| | |
| | |
|
| U.S. government agencies | $ | 291 |
| | $ | (1 | ) | | 2 |
| | $ | 76 |
| | $ | (1 | ) | | 6 |
| | $ | 367 |
| | $ | (2 | ) |
| Private label residential | — |
| | — |
| | — |
| | 23 |
| | (1 | ) | | 5 |
| | 23 |
| | (1 | ) |
| U.S. Treasury and U.S. government agency securities | — |
| | — |
| | — |
| | 2,991 |
| | (8 | ) | | 1 |
| | 2,991 |
| | (8 | ) |
Total | $ | 291 |
| | $ | (1 | ) | | 2 |
| | $ | 3,090 |
| | $ | (10 | ) | | 12 |
| | $ | 3,381 |
| | $ | (11 | ) |
| | | | | | | | | | | | | | | | |
Notes to Consolidated Financial Statements_________________________________________________________________
Timberland Bancorp, Inc. and Subsidiary
September 30, 20192021 and 20182020
Held to maturity and available for sale investment securities with unrealized losses were as follows as of September 30, 20182021 (dollars in thousands):
| | | | | | | | | | | | | | | | | | | | | | | | | | | | | | | | | | | | | | | | | | | | | | | |
| | Less Than 12 Months | | 12 Months or Longer | | Total |
| | Estimated
Fair
Value | | Gross
Unrealized
Losses | | Qty | | Estimated
Fair
Value | | Gross
Unrealized
Losses | | Qty | | Estimated
Fair
Value | | Gross
Unrealized
Losses |
| Held to Maturity | | | | | | | | | | | | | | | |
| U.S. Treasury and U.S. government agency securities | $ | 18,795 | | | $ | (99) | | | 5 | | | $ | — | | | $ | — | | | — | | | $ | 18,795 | | | $ | (99) | |
| MBS: | | | | | | | | | | | | | | | |
| U.S. government agencies | 8,091 | | | (122) | | | 5 | | | 15 | | | — | | | 3 | | | 8,106 | | | (122) | |
| Private label residential | 9,712 | | | (23) | | | 4 | | | 1 | | | — | | | 1 | | | 9,713 | | | (23) | |
| | | | | | | | | | | | | | | |
Total | $ | 36,598 | | | $ | (244) | | | 14 | | | $ | 16 | | | $ | — | | | 4 | | | $ | 36,614 | | | $ | (244) | |
| | | | | | | | | | | | | | | |
| Available for Sale | | | | | | | | | | | | | | | |
| MBS: | | | | | | | | | | | | | | | |
| U.S. government agencies | $ | 20,146 | | | $ | (103) | | | 13 | | | $ | 5,491 | | | $ | (11) | | | 3 | | | $ | 25,637 | | | $ | (114) | |
Total | $ | 20,146 | | | $ | (103) | | | 13 | | | $ | 5,491 | | | $ | (11) | | | 3 | | | $ | 25,637 | | | $ | (114) | |
Held to maturity and available for sale investment securities with unrealized losses were as follows as of September 30, 2020 (dollars in thousands):
| | | | | | | | | | | | | | | | | | | | | | | | | | | | | | | | | | | | | | | | | | | | | | | |
| | Less Than 12 Months | | 12 Months or Longer | | Total |
| | Estimated
Fair
Value | | Gross
Unrealized
Losses | | Qty | | Estimated
Fair
Value | | Gross
Unrealized
Losses | | Qty | | Estimated
Fair
Value | | Gross
Unrealized
Losses |
| Held to Maturity | | | | | | | | | | | | | | | |
| MBS: | | | | | | | | | | | | | | | |
| U.S. government agencies | $ | 5,130 | | | $ | (2) | | | 4 | | | $ | 39 | | | $ | (1) | | | 4 | | | $ | 5,169 | | | $ | (3) | |
| Private label residential | 7 | | | — | | | 1 | | | 11 | | | (1) | | | 2 | | | 18 | | | (1) | |
| | | | | | | | | | | | | | | |
| Bank issued trust preferred securities | 499 | | | (1) | | | 1 | | | — | | | — | | | — | | | 499 | | | (1) | |
Total | $ | 5,636 | | | $ | (3) | | | 6 | | | $ | 50 | | | $ | (2) | | | 6 | | | $ | 5,686 | | | $ | (5) | |
| | | | | | | | | | | | | | | |
| Available for Sale | | | | | | | | | | | | | | | |
| MBS: | | | | | | | | | | | | | | | |
| U.S. government agencies | $ | 21,464 | | | $ | (68) | | | 11 | | | $ | — | | | $ | — | | | — | | | $ | 21,464 | | | $ | (68) | |
| | | | | | | | | | | | | | | |
| | | | | | | | | | | | | | | |
Total | $ | 21,464 | | | $ | (68) | | | 11 | | | $ | — | | | $ | — | | | — | | | $ | 21,464 | | | $ | (68) | |
|
| | | | | | | | | | | | | | | | | | | | | | | | | | | | | |
| | Less Than 12 Months | | 12 Months or Longer | | Total |
| | Estimated Fair Value | | Gross Unrealized Losses | | Qty | | Estimated Fair Value | | Gross Unrealized Losses | | Qty | | Estimated Fair Value | | Gross Unrealized Losses |
| Held to Maturity | |
| | |
| | |
| | |
| | |
| | |
| | |
| | |
|
| MBS: | |
| | |
| | |
| | |
| | |
| | |
| | |
| | |
|
| U.S. government agencies | $ | 954 |
| | $ | (20 | ) | | 2 |
| | $ | 64 |
| | $ | (1 | ) | | 5 |
| | $ | 1,018 |
| | $ | (21 | ) |
| Private label residential | — |
| | — |
| | — |
| | 50 |
| | (2 | ) | | 8 |
| | 50 |
| | (2 | ) |
| U.S. Treasury and U.S. government agency securities | 7,946 |
| | (22 | ) | | 2 |
| | 2,935 |
| | (61 | ) | | 1 |
| | 10,881 |
| | (83 | ) |
Total | $ | 8,900 |
| | $ | (42 | ) | | 4 |
| | $ | 3,049 |
| | $ | (64 | ) | | 14 |
| | $ | 11,949 |
| | $ | (106 | ) |
| | | | | | | | | | | | | | | | |
| Available for Sale | |
| | |
| | |
| | |
| | |
| | |
| | |
| | |
|
| MBS: U.S. government agencies | $ | 34 |
| | $ | (1 | ) | | 1 |
| | $ | — |
| | $ | — |
| | — |
| | $ | 34 |
| | $ | (1 | ) |
| Mutual Funds | — |
| | — |
| | — |
| | 917 |
| | (83 | ) | | 1 |
| | 917 |
| | (83 | ) |
Total | $ | 34 |
| | $ | (1 | ) | | 1 |
| | $ | 917 |
| | $ | (83 | ) | | 1 |
| | $ | 951 |
| | $ | (84 | ) |
| | | | | | | | |
| Notes to Consolidated Financial Statements | |
Timberland Bancorp, Inc. and Subsidiary
September 30, 2021 and 2020
The Company has evaluated the investment securities in the above tables and has determined that the decline in their fair value is temporary. The unrealized losses are primarily due to changes in market interest rates and spreads in the market for mortgage-related products. The fair value of these securities is expected to recover as the securities approach their maturity dates and/or as the pricing spreads narrow on mortgage-related securities. The Company has the ability and the intent to hold the investments until the fair value of these securities recovers. Additional deterioration in market and economic conditions related to the COVID-19 pandemic may, however, have an adverse impact on credit quality in the future and result in OTTI charges.
The Company bifurcates OTTI into (1) amounts related to credit losses which are recognized through earnings and (2) amounts related to all other factors which are recognized as a component of other comprehensive income (loss).
To determine the component of the gross OTTI related to credit losses, the Company compared the amortized cost basis of the OTTI security to the present value of its revised expected cash flows, discounted using its pre-impairment yield. The revised expected cash flow estimates for individual securities are based primarily on an analysis of default rates, prepayment speeds and
third-party analytic reports. Significant judgment by management is required in this analysis that includes, but is not limited to, assumptions regarding the collectability of principal and interest, net of related expenses, on the underlying loans.
The following table presents a summary of the significant inputs utilized to measure management’s estimates of the credit loss component on OTTI securities as of September 30, 2019, 20182021, 2020 and 2017:2019:
| | | | | | | | | Range | | Weighted |
| | Range | | Weighted | | Minimum | | Maximum | | Average |
| September 30, 2021 | | September 30, 2021 | | | | | |
| Constant prepayment rate | | Constant prepayment rate | 6.00 | % | | 15.00 | % | | 10.20 | % |
| Collateral default rate | | Collateral default rate | 1.47 | % | | 17.55 | % | | 12.19 | % |
| Loss severity rate | | Loss severity rate | — | % | | 12.96 | % | | 4.55 | % |
| | September 30, 2020 | | September 30, 2020 | | | | | |
| Constant prepayment rate | | Constant prepayment rate | 6.00 | % | | 15.00 | % | | 8.97 | % |
| Collateral default rate | | Collateral default rate | 2.17 | % | | 27.39 | % | | 14.37 | % |
| Loss severity rate | | Loss severity rate | — | % | | 11.27 | % | | 2.87 | % |
| | Minimum | | Maximum | | Average | |
| September 30, 2019 | | | | | | September 30, 2019 | |
| Constant prepayment rate | 6.00 | % | | 15.00 | % | | 10.67 | % | Constant prepayment rate | 6.00 | % | | 15.00 | % | | 10.67 | % |
| Collateral default rate | 3.00 | % | | 19.70 | % | | 10.40 | % | Collateral default rate | 3.00 | % | | 19.70 | % | | 10.40 | % |
| Loss severity rate | — | % | | 10.59 | % | | 4.07 | % | Loss severity rate | — | % | | 10.59 | % | | 4.07 | % |
| | | | | | | |
| September 30, 2018 | | | | | | |
| Constant prepayment rate | 6.00 | % | | 15.00 | % | | 12.91 | % | |
| Collateral default rate | — | % | | 10.42 | % | | 5.03 | % | |
| Loss severity rate | — | % | | 75.00 | % | | 37.25 | % | |
| | | | | | | |
| September 30, 2017 | | | | | | |
| Constant prepayment rate | 6.00 | % | | 15.00 | % | | 10.40 | % | |
| Collateral default rate | 0.03 | % | | 10.75 | % | | 4.84 | % | |
| Loss severity rate | 1.00 | % | | 62.00 | % | | 41.75 | % | |
Notes to Consolidated Financial Statements_________________________________________________________________
Timberland Bancorp, Inc. and Subsidiary
September 30, 2019 and 2018
The following table presents the OTTI recoveries for the years ended September 30, 2019, 20182021, 2020 and 20172019 (dollars in thousands):
| | | | | | | | | | | | | | | | | | | | | | | | | |
| | 2021 | | | | 2020 | | | | 2019 | | |
| | Held To
Maturity | | | | Held To
Maturity | | | | Held To Maturity | | |
| Total recoveries | $ | 20 | | | | | $ | 120 | | | | | $ | 71 | | | |
| Adjustment for portion of OTTI transferred from other comprehensive income (loss) before income taxes (1) | — | | | | | — | | | | | (12) | | | |
| Net recoveries recognized in earnings (2) | $ | 20 | | | | | $ | 120 | | | | | $ | 59 | | | |
|
| | | | | | | | | | | | |
| | 2019 | | 2018 | | 2017 | |
| | Held To Maturity | | Held To Maturity | | Held To Maturity | |
| Total recoveries | $ | 71 |
| | $ | 73 |
| | $ | 38 |
| |
| Adjustment for portion of OTTI transferred from other comprehensive income (loss) before income taxes (1) | (12 | ) | | (5 | ) | | (5 | ) | |
| Net recoveries recognized in earnings (2) | $ | 59 |
| | $ | 68 |
| | $ | 33 |
| |
________________________
(1)Represents OTTI related to all other factors.
(2)Represents OTTI related to credit losses.
| | | | | | | | |
(1) | Represents OTTI relatedNotes to all other factors. |
| Consolidated Financial Statements | |
(2) | Represents OTTI related to credit losses. |
Timberland Bancorp, Inc. and Subsidiary
September 30, 2021 and 2020
The following table presents a roll forward of the credit loss component of held to maturity and available for sale debt securities that have been written down for OTTI with the credit loss component recognized in earnings for the years ended September 30, 2019, 20182021, 2020 and 20172019 (dollars in thousands):
| | | | | | | | | | | | | | | | | |
| | 2021 | | 2020 | | 2019 |
| Balance, beginning of year | $ | 885 | | | $ | 1,071 | | | $ | 1,153 | |
| | | | | |
| Additions: | | | | | |
| | | | | |
Additional increases to the amount
related to credit loss for which OTTI
was previously recognized | 2 | | | 3 | | | 13 | |
| Subtractions: | | | | | |
Realized losses previously recorded as credit losses | (12) | | | (66) | | | (23) | |
| Recovery of prior credit loss | (22) | | | (123) | | | (72) | |
| Balance, end of year | $ | 853 | | | $ | 885 | | | $ | 1,071 | |
|
| | | | | | | | | | | |
| | 2019 |
| | 2018 |
| | 2017 |
|
| Balance, beginning of year | $ | 1,153 |
| | $ | 1,301 |
| | $ | 1,505 |
|
| | | | | | |
| Additions: | |
| | |
| | |
|
Additional increases to the amount related to credit loss for which OTTI was previously recognized | 13 |
| | 14 |
| | 18 |
|
| Subtractions: | | | |
| | |
|
Realized losses previously recorded as credit losses | (23 | ) | | (80 | ) | | (171 | ) |
| Recovery of prior credit loss | (72 | ) | | (82 | ) | | (51 | ) |
| Balance, end of year | $ | 1,071 |
| | $ | 1,153 |
| | $ | 1,301 |
|
During the year ended September 30, 2019,2021, the Company recorded a $23,000$12,000 net realized loss (as a result of investment securities being deemed worthless) on seventeen nineteen held to maturity investment securities, all of which had been recognized previously as a credit loss. During the year ended September 30, 2018,2020, the Company recorded an $80,000a $66,000 net realized loss (as a result of investment securities being deemed worthless) on sixteen19 held to maturity investment securities, all of which had been recognized previously as a credit loss. During the year ended September 30, 2017,2019, the Company recorded a $171,000an $23,000 net realized loss (as a result of investment securities being deemed worthless) on twenty-two17 held to maturity investment securities, all of which had been recognized previously as a credit loss.
The recorded amount of investment securities pledged as collateral for public fund deposits, federal treasury tax and loan deposits and FHLB collateral totaled $18,587,000$97,602,000 and $12,100,000$81,028,000 at September 30, 20192021 and 2018,2020, respectively.
The contractual maturities of debt securities at September 30, 20192021 are as follows (dollars in thousands). Expected maturities may differ from scheduled maturities due to the prepayment of principal or call provisions.
Notes to Consolidated Financial Statements_________________________________________________________________
| | | | | | | | | | | | | | | | | | | | | | | |
| | Held to Maturity | | Available for Sale |
| | Amortized
Cost | | Estimated
Fair
Value | | Amortized
Cost | | Estimated
Fair
Value |
| Due within one year | $ | — | | | $ | — | | | $ | 934 | | | $ | 933 | |
| Due after one year to five years | 12,205 | | | 12,262 | | | 4,425 | | | 4,424 | |
| Due after five years to ten years | 33,020 | | | 33,437 | | | 15,265 | | | 15,306 | |
| Due after ten years | 23,877 | | | 24,410 | | | 42,456 | | | 42,513 | |
| Total | $ | 69,102 | | | $ | 70,109 | | | $ | 63,080 | | | $ | 63,176 | |
| | | | | | | | |
| Notes to Consolidated Financial Statements | |
Timberland Bancorp, Inc. and Subsidiary
September 30, 20192021 and 20182020
|
| | | | | | | | | | | | | | | |
| | Held to Maturity | | Available for Sale |
| | Amortized Cost | | Estimated Fair Value | | Amortized Cost | | Estimated Fair Value |
| Due within one year | $ | 3,025 |
| | $ | 3,017 |
| | $ | — |
| | $ | — |
|
| Due after one year to five years | 495 |
| | 498 |
| | 145 |
| | 145 |
|
| Due after five years to ten years | 5,893 |
| | 6,272 |
| | 129 |
| | 130 |
|
| Due after ten years | 21,689 |
| | 22,793 |
| | 22,144 |
| | 22,257 |
|
| Total | $ | 31,102 |
| | $ | 32,580 |
| | $ | 22,418 |
| | $ | 22,532 |
|
Note 5 - Loans Receivable and Allowance for Loan Losses
Loans receivable by portfolio segment consisted of the following at September 30, 20192021 and 20182020 (dollars in thousands):
| | | | | | | | | | | |
| | 2021 | | 2020 |
| Mortgage loans: | | | |
| One- to four-family | $ | 119,935 | | | $ | 118,580 | |
| Multi-family | 87,563 | | | 85,053 | |
| Commercial | 470,650 | | | 453,574 | |
| Construction – custom and owner/builder | 109,152 | | | 129,572 | |
| Construction – speculative one- to four-family | 17,813 | | | 14,592 | |
| Construction – commercial | 43,365 | | | 33,144 | |
| Construction – multi-family | 52,071 | | | 34,476 | |
| Construction – land development | 10,804 | | | 7,712 | |
| Land | 19,936 | | | 25,571 | |
Total mortgage loans | 931,289 | | | 902,274 | |
| Consumer loans: | | | |
| Home equity and second mortgage | 32,988 | | | 32,077 | |
| Other | 2,512 | | | 3,572 | |
Total consumer loans | 35,500 | | | 35,649 | |
| | | |
| Commercial loans: | | | |
| Commercial business | 74,579 | | | 69,540 | |
| SBA Paycheck Protection Program ("PPP") | 40,922 | | | 126,820 | |
| Total commercial business and SBA PPP loans | 115,501 | | | 196,360 | |
Total loans receivable | 1,082,290 | | | 1,134,283 | |
| Less: | | | |
| Undisbursed portion of construction loans in process | 95,224 | | | 100,558 | |
| Deferred loan origination fees, net | 5,143 | | | 6,436 | |
| Allowance for loan losses | 13,469 | | | 13,414 | |
| | 113,836 | | | 120,408 | |
| Loans receivable, net | $ | 968,454 | | | $ | 1,013,875 | |
|
| | | | | | | |
| | 2019 |
| | 2018 |
|
| Mortgage loans: | | | |
| One- to four-family | $ | 132,661 |
| | $ | 115,941 |
|
| Multi-family | 76,036 |
| | 61,928 |
|
| Commercial | 419,117 |
| | 345,113 |
|
| Construction – custom and owner/builder | 128,848 |
| | 119,555 |
|
| Construction – speculative one- to four-family | 16,445 |
| | 15,433 |
|
| Construction – commercial | 39,566 |
| | 39,590 |
|
| Construction – multi-family | 36,263 |
| | 10,740 |
|
| Construction – land development | 2,404 |
| | 3,040 |
|
| Land | 30,770 |
| | 25,546 |
|
Total mortgage loans | 882,110 |
| | 736,886 |
|
| Consumer loans: | |
| | |
|
| Home equity and second mortgage | 40,190 |
| | 37,341 |
|
| Other | 4,312 |
| | 3,515 |
|
Total consumer loans | 44,502 |
| | 40,856 |
|
| | | | |
| Commercial business loans | 64,764 |
| | 43,053 |
|
Total loans receivable | 991,376 |
| | 820,795 |
|
| Less: | |
| | |
|
| Undisbursed portion of construction loans in process | 92,226 |
| | 83,237 |
|
| Deferred loan origination fees, net | 2,798 |
| | 2,637 |
|
| Allowance for loan losses | 9,690 |
| | 9,530 |
|
| | 104,714 |
| | 95,404 |
|
| Loans receivable, net | $ | 886,662 |
| | $ | 725,391 |
|
Loans receivable at September 30, 20192021 and 2020 are reported net of unamortized discounts totaling $1,386,000. There were no unamortized discounts on loans receivable at September 30, 2018.$449,000 and $790,000, respectively.
Significant Concentrations of Credit Risk
Most of the Company’s lending activity is with customers located in the state of Washington and involves real estate. At September 30, 2019,2021, the Company had $922,300,000$964,277,000 (including $92,226,000$95,224,000 of undisbursed construction loans in process) in loans secured by real estate, which represented 93.0%89.1% of total loans receivable. The real estate loan portfolio is primarily secured by one- to four-family properties, multi-family properties, land, and a variety of commercial real estate property
Notes to Consolidated Financial Statements_________________________________________________________________
Timberland Bancorp, Inc. and Subsidiary
September 30, 2019 and 2018
types. At September 30, 2019,2021, there were no concentrations of real estate loans to a specific industry or secured by a specific collateral type that equaled or exceeded 20% of the Company’s total loan portfolio, other than loans secured by one-to four-
family properties. The ultimate collectability of a substantial portion of the loan portfolio is susceptible to changes in economic and market conditions in the region and the impact of those changes on the real estate market. The Company typically originates real estate loans with loan-to-value ratios of no greater than 90%. Collateral and/or guarantees are required for all loans.
| | | | | | | | |
| Notes to Consolidated Financial Statements | |
Timberland Bancorp, Inc. and Subsidiary
September 30, 2021 and 2020
Related Party Loans
Certain related parties of the Company, principally Bank directors and officers, are loan customers of the Bank in the ordinary course of business. Such related party loans were performing according to their repayment terms at September 30, 20192021 and 2018.2020. Activity in related party loans during the years ended September 30, 2019, 20182021, 2020 and 20172019 was as follows (dollars in thousands):
| | | | | | | | | | | | | | | | | |
| | 2021 | | 2020 | | 2019 |
| Balance, beginning of year | $ | 248 | | | $ | 94 | | | $ | 119 | |
| New loans or borrowings | 316 | | | 178 | | | 1 | |
| Repayments and reclassifications | (98) | | | (24) | | | (26) | |
| Balance, end of year | $ | 466 | | | $ | 248 | | | $ | 94 | |
|
| | | | | | | | | | | |
| | 2019 |
| | 2018 |
| | 2017 |
|
| Balance, beginning of year | $ | 119 |
| | $ | 741 |
| | $ | 230 |
|
| New loans or borrowings | 1 |
| | 368 |
| | 592 |
|
| Repayments and reclassifications | (26 | ) | | (990 | ) | | (81 | ) |
| Balance, end of year | $ | 94 |
| | $ | 119 |
| | $ | 741 |
|
Loan Segment Risk Characteristics
The Company believes that its loan classes are the same as its loan segments.
One- To Four-Family Residential Lending: The Company originates both fixed-rate and adjustable-rate loans secured by one- to four-family residences. A portion of the fixed-rate one- to four-family loans are sold in the secondary market for asset/liability management purposes and to generate non-interest income. The Company’s lending policies generally limit the maximum loan-to-value on one- to four-family loans to 90% of the lesser of the appraised value or the purchase price. However, the Company usually obtains private mortgage insurance on the portion of the principal amount that exceeds 80% of the appraised value of the property.
Multi-Family Lending: The Company originates loans secured by multi-family dwelling units (more than four units). Multi-family lending generally affords the Company an opportunity to receive interest at rates higher than those generally available from one- to four-family residential lending. However, loans secured by multi-family properties usually are greater in amount, more difficult to evaluate and monitor and, therefore, involve a greater degree of risk than one- to four-family residential mortgage loans. Because payments on loans secured by multi-family properties are often dependent on the successful operation and management of the properties, repayment of such loans may be affected by adverse conditions in the real estate market or economy. The Company attempts to minimize these risks by scrutinizing the financial condition of the borrower, the quality of the collateral and the management of the property securing the loan.
Commercial Mortgage Lending: The Company originates commercial real estate loans secured by properties such as office buildings, retail/wholesale facilities, motels, restaurants, mini-storage facilities and other commercial properties. Commercial real estate lending generally affords the Company an opportunity to receive interest at higher rates than those available from one- to four-family residential lending. However, loans secured by such properties usually are greater in amount, more difficult to evaluate and monitor and, therefore, involve a greater degree of risk than one- to four-family residential mortgage loans. Because payments on loans secured by commercial properties are often dependent on the successful operation and management of the properties, repayment of these loans may be affected by adverse conditions in the real estate market or economy. The Company attempts to mitigate these risks by generally limiting the maximum loan-to-value ratio to 80% and scrutinizing the financial condition of the borrower, the quality of the collateral and the management of the property securing the loan.
Construction Lending: The Company currently originates the following types of construction loans: custom construction loans, owner/builder construction loans, speculative construction loans, commercial real estate construction loans, multi-family construction loans and land development loans.
Construction lending affords the Company the opportunity to achieve higher interest rates and fees with shorter terms to maturity than does its single-family permanent mortgage lending. Construction lending, however, is generally considered to
Notes to Consolidated Financial Statements_________________________________________________________________
Timberland Bancorp, Inc. and Subsidiary
September 30, 2019 and 2018
involve a higher degree of risk than one- to four family residential lending because of the inherent difficulty in estimating both a property’s value at completion of the project and the estimated cost of the project. The nature of these loans is such that they are generally more difficult to evaluate and monitor. If the estimated cost of construction proves to be inaccurate, the Company may be required to advance funds beyond the amount originally committed to complete the project. If the estimate of value upon completion proves to be inaccurate, the Company may be confronted with a project whose value is insufficient to assure full repayment, and the Company may incur a loss. Projects may also be jeopardized by disagreements between borrowers and builders and by the failure of builders to pay subcontractors. Loans to construct homes for which no purchaser has been
| | | | | | | | |
| Notes to Consolidated Financial Statements | |
Timberland Bancorp, Inc. and Subsidiary
September 30, 2021 and 2020
identified carry more risk because the payoff for the loan depends on the builder’s ability to sell the property prior to the time that the construction loan is due. The Company attempts to mitigate these risks by adhering to its underwriting policies, disbursement procedures and monitoring practices.
Construction Lending – Custom and Owner/Builder: Custom construction and owner/builder construction loans are originated to home owners and are typically refinanced into permanent loans at the completion of construction.
Construction Lending – Speculative One- To Four-Family: Speculative one-to four-family construction loans are made to home builders and are termed “speculative” because the home builder does not have, at the time of the loan origination, a signed contract with a home buyer who has a commitment for permanent financing with the Company or another lender for the finished home. The home buyer may be identified either during or after the construction period.
Construction Lending – Commercial: Commercial construction loans are originated to construct properties such as office buildings, hotels, retail rental space and mini-storage facilities.
Construction Lending – Multi-Family: Multi-family construction loans are originated to construct apartment buildings and condominium projects.
Construction Lending -– Land Development: Land development loans are originated to real estate developers for the purpose of developing residential subdivisions. The Company is currently originating land development loans on a limited basis.
Land Lending: The Company originates loans for the acquisition of land upon which the purchaser can then build or make improvements necessary to build or to sell as improved lots. Loans secured by undeveloped land or improved lots involve greater risks than one- to four-family residential mortgage loans because these loans are more difficult to evaluate. If the estimate of value proves to be inaccurate, in the event of default or foreclosure, the Company may be confronted with a property value which is insufficient to assure full repayment. The Company attempts to minimize this risk by generally limiting the maximum loan-to-value ratio on land loans to 75%.
Consumer Lending – Home Equity and Second Mortgage: The Company originates home equity lines of credit and second mortgage loans. Home equity lines of credit and second mortgage loans have a greater credit risk than one- to four-family residential mortgage loans because they are secured by mortgages subordinated to the existing first mortgage on the property, which may or may not be held by the Company. The Company attempts to mitigate these risks by adhering to its underwriting policies in evaluating the collateral and the credit-worthiness of the borrower.
Consumer Lending – Other: The Company originates other consumer loans, which include automobile loans, boat loans, motorcycle loans, recreational vehicle loans, savings account loans and unsecured loans. Other consumer loans generally have shorter terms to maturity than mortgage loans. Other consumer loans generally involve a greater degree of risk than do residential mortgage loans, particularly in the case of consumer loans that are unsecured or secured by rapidly depreciating assets such as automobiles. In such cases, any repossessed collateral for a defaulted consumer loan may not provide an adequate source of repayment of the outstanding loan balance as a result of the greater likelihood of damage, loss or depreciation. The Company attempts to mitigate these risks by adhering to its underwriting policies in evaluating the credit-worthiness of the borrower.
Commercial Business Lending:Lending: The Company originates commercial business loans which, excluding SBA PPP loans, are generally secured by business equipment, accounts receivable, inventory or other property. The Company also generally obtains personal guarantees from the business owners based on a review of personal financial statements. Commercial business lending generally involves risks that are different from those associated with residential and commercial real estate lending. Real estate lending is generally considered to be collateral based lending with loan amounts based on predetermined loan to collateral values, and liquidation of the underlying real estate collateral is viewed as the primary source of repayment in the event of borrower default. Although commercial business loans are often collateralized by equipment, inventory, accounts receivable or other business assets, the liquidation of collateral in the event of a borrower default is often an insufficient source of repayment, because accounts
Notes to Consolidated Financial Statements_________________________________________________________________
Timberland Bancorp, Inc. and Subsidiary
September 30, 2019 and 2018
receivable may be uncollectible and inventories and equipment may be obsolete or of limited use. Accordingly, the repayment of a commercial business loan depends primarily on the credit-worthiness of the borrower (and any guarantors), while the liquidation of collateral is a secondary and potentially insufficient source of repayment. The Company attempts to mitigate
these risks by adhering to its underwriting policies in evaluating the management of the business and the credit-worthiness of the borrowers and the guarantors.
| | | | | | | | |
| Notes to Consolidated Financial Statements | |
Timberland Bancorp, Inc. and Subsidiary
September 30, 2021 and 2020
SBA PPP: The CARES Act authorized the SBA to temporarily guarantee loans under the PPP. As a qualified SBA lender, the Company was automatically authorized to originate PPP loans upon commencement of the program in April 2020 through the program's initial conclusion in August 2020. The Consolidated Appropriations Act, 2021 ("CAA 2021"), which was signed into law on December 27, 2020, renewed and extended the PPP until May 31, 2021. As a result, the Company began originating PPP loans again in January 2021. The SBA guarantees 100% of PPP loans made to eligible borrowers, and the entire amount of the borrower's PPP loan, including any accrued interest, is eligible to be forgiven and repaid by the SBA. PPP loans have: (a) an interest rate of 1%, (b) a two-year loan term to maturity for loans approved by the SBA prior to June 5, 2020 (unless the borrower and the Company mutually agree to extend the term of the loan to five years) and a five-year maturity for loans approved thereafter; and (c) principal and interest payments deferred for at least six months from the date of disbursement.
Allowance for Loan Losses
The following table sets forth information for the year ended September 30, 2021 regarding activity in the allowance for loan losses by portfolio segment (dollars in thousands):
| | | | | | | | | | | | | | | | | | | | | | | | | | | | | |
| | Beginning
Allowance | | Provision for (Recapture of) Loan Losses | | Charge-
offs | | Recoveries | | Ending
Allowance |
| Mortgage loans: | | | | | | | | | |
| One- to four-family | $ | 1,163 | | | $ | (9) | | | $ | — | | | $ | — | | | $ | 1,154 | |
| Multi-family | 718 | | | 47 | | | — | | | — | | | 765 | |
| Commercial | 7,144 | | | (331) | | | — | | | — | | | 6,813 | |
| Construction – custom and owner/builder | 832 | | | (188) | | | — | | | — | | | 644 | |
| Construction – speculative one- to four-family | 158 | | | 30 | | | — | | | — | | | 188 | |
| Construction – commercial | 420 | | | 364 | | | — | | | — | | | 784 | |
| Construction – multi-family | 238 | | | 198 | | | — | | | — | | | 436 | |
| Construction – land development | 133 | | | (9) | | | — | | | — | | | 124 | |
| Land | 572 | | | (147) | | | — | | | 45 | | | 470 | |
| Consumer loans: | | | | | | | | | |
| Home equity and second mortgage | 593 | | | (65) | | | — | | | — | | | 528 | |
| Other | 71 | | | (24) | | | (1) | | | 4 | | | 50 | |
| Commercial business loans | 1,372 | | | 134 | | | (2) | | | 9 | | | 1,513 | |
Total | $ | 13,414 | | | $ | — | | | $ | (3) | | | $ | 58 | | | $ | 13,469 | |
| | | | | | | | |
| Notes to Consolidated Financial Statements | |
Timberland Bancorp, Inc. and Subsidiary
September 30, 2021 and 2020
The following table sets forth information for the year ended September 30, 2020 regarding activity in the allowance for loan losses by portfolio segment (dollars in thousands):
| | | | | | | | | | | | | | | | | | | | | | | | | | | | | |
| | Beginning
Allowance | | Provision for (Recapture of) Loan Losses | | Charge-
offs | | Recoveries | | Ending
Allowance |
| Mortgage loans: | | | | | | | | | |
| One- to four-family | $ | 1,167 | | | $ | (6) | | | $ | — | | | $ | 2 | | | $ | 1,163 | |
| Multi-family | 481 | | | 237 | | | — | | | — | | | 718 | |
| Commercial | 4,154 | | | 2,984 | | | — | | | 6 | | | 7,144 | |
| Construction – custom and owner/builder | 755 | | | 72 | | | — | | | 5 | | | 832 | |
| Construction – speculative one- to four-family | 212 | | | (54) | | | — | | | — | | | 158 | |
| Construction – commercial | 338 | | | 82 | | | — | | | — | | | 420 | |
| Construction – multi-family | 375 | | | (137) | | | — | | | — | | | 238 | |
| Construction – land development | 67 | | | 66 | | | — | | | — | | | 133 | |
| Land | 697 | | | (145) | | | — | | | 20 | | | 572 | |
| Consumer loans: | | | | | | | | | |
| Home equity and second mortgage | 623 | | | (45) | | | — | | | 15 | | | 593 | |
| Other | 99 | | | (19) | | | (12) | | | 3 | | | 71 | |
| Commercial business loans | 722 | | | 665 | | | (15) | | | — | | | 1,372 | |
Total | $ | 9,690 | | | $ | 3,700 | | | $ | (27) | | | $ | 51 | | | $ | 13,414 | |
The following table sets forth information for the year ended September 30, 2019 regarding activity in the allowance for loan losses by portfolio segment (dollars in thousands):
| | | | | | | | | | | | | | | | | | | | | | | | | | | | | |
| | Beginning
Allowance | | Provision for (Recapture of) Loan Losses | | Charge-
offs | | Recoveries | | Ending
Allowance |
| Mortgage loans: | | | | | | | | | |
| One- to four-family | $ | 1,086 | | | $ | (23) | | | $ | — | | | $ | 104 | | | $ | 1,167 | |
| Multi-family | 433 | | | 48 | | | — | | | — | | | 481 | |
| Commercial | 4,248 | | | (260) | | | — | | | 166 | | | 4,154 | |
| Construction – custom and owner/builder | 671 | | | 82 | | | — | | | 2 | | | 755 | |
| Construction – speculative one- to four-family | 178 | | | 34 | | | — | | | — | | | 212 | |
| Construction – commercial | 563 | | | (225) | | | — | | | — | | | 338 | |
| Construction – multi-family | 135 | | | 240 | | | — | | | — | | | 375 | |
| Construction – land development | 49 | | | 18 | | | — | | | — | | | 67 | |
| Land | 844 | | | (116) | | | (49) | | | 18 | | | 697 | |
| Consumer loans: | | | | | | | | | |
| Home equity and second mortgage | 649 | | | (21) | | | (5) | | | — | | | 623 | |
| Other | 117 | | | (19) | | | (5) | | | 6 | | | 99 | |
| Commercial business loans | 557 | | | 242 | | | (102) | | | 25 | | | 722 | |
Total | $ | 9,530 | | | $ | — | | | $ | (161) | | | $ | 321 | | | $ | 9,690 | |
|
| | | | | | | | | | | | | | | | | | | |
| | Beginning Allowance | | Provision for (Recapture of) Loan Losses | | Charge- offs | | Recoveries | | Ending Allowance |
| Mortgage loans: | | | | | | | | | |
| One- to four-family | $ | 1,086 |
| | $ | (23 | ) | | $ | — |
| | $ | 104 |
| | $ | 1,167 |
|
| Multi-family | 433 |
| | 48 |
| | — |
| | — |
| | 481 |
|
| Commercial | 4,248 |
| | (260 | ) | | — |
| | 166 |
| | 4,154 |
|
| Construction – custom and owner/builder | 671 |
| | 82 |
| | — |
| | 2 |
| | 755 |
|
| Construction – speculative one- to four-family | 178 |
| | 34 |
| | — |
| | — |
| | 212 |
|
| Construction – commercial | 563 |
| | (225 | ) | | — |
| | — |
| | 338 |
|
| Construction – multi-family | 135 |
| | 240 |
| | — |
| | — |
| | 375 |
|
| Construction – land development | 49 |
| | 18 |
| | — |
| | — |
| | 67 |
|
| Land | 844 |
| | (116 | ) | | (49 | ) | | 18 |
| | 697 |
|
| Consumer loans: | |
| |
|
| | |
| | |
| | |
|
| Home equity and second mortgage | 649 |
| | (21 | ) | | (5 | ) | | — |
| | 623 |
|
| Other | 117 |
| | (19 | ) | | (5 | ) | | 6 |
| | 99 |
|
| Commercial business loans | 557 |
| | 242 |
| | (102 | ) | | 25 |
| | 722 |
|
Total | $ | 9,530 |
| | $ | — |
| | $ | (161 | ) | | $ | 321 |
| | $ | 9,690 |
|
| | | | | | | | |
| Notes to Consolidated Financial Statements | |
The following table sets forth information for the year ended September 30, 2018 regarding activity in the allowance for loan losses by portfolio segment (dollars in thousands):
|
| | | | | | | | | | | | | | | | | | | |
| | Beginning Allowance | | Provision for (Recapture of) Loan Losses | | Charge- offs | | Recoveries | | Ending Allowance |
| Mortgage loans: | | | | | | | | | |
| One- to four-family | $ | 1,082 |
| | $ | 4 |
| | $ | — |
| | $ | — |
| | $ | 1,086 |
|
| Multi-family | 447 |
| | (14 | ) | | — |
| | — |
| | 433 |
|
| Commercial | 4,184 |
| | 92 |
| | (28 | ) | | — |
| | 4,248 |
|
| Construction – custom and owner/builder | 699 |
| | (28 | ) | | — |
| | — |
| | 671 |
|
| Construction – speculative one- to four-family | 128 |
| | 37 |
| | — |
| | 13 |
| | 178 |
|
| Construction – commercial | 303 |
| | 260 |
| | — |
| | — |
| | 563 |
|
| Construction – multi-family | 173 |
| | (38 | ) | | — |
| | — |
| | 135 |
|
| Construction – land development | — |
| | 49 |
| | — |
| | — |
| | 49 |
|
| Land | 918 |
| | (71 | ) | | (22 | ) | | 19 |
| | 844 |
|
| Consumer loans: | |
| | |
| | |
| | |
| | |
|
| Home equity and second mortgage | 983 |
| | (334 | ) | | — |
| | — |
| | 649 |
|
| Other | 121 |
| | 1 |
| | (6 | ) | | 1 |
| | 117 |
|
| Commercial business loans | 515 |
| | 42 |
| | — |
| | — |
| | 557 |
|
Total | $ | 9,553 |
| | $ | — |
| | $ | (56 | ) | | $ | 33 |
| | $ | 9,530 |
|
Notes to Consolidated Financial Statements_________________________________________________________________
Timberland Bancorp, Inc. and Subsidiary
September 30, 20192021 and 20182020
The following table sets forth information for the year ended September 30, 2017 regarding activity in the allowance for loan losses by portfolio segment (dollars in thousands):
|
| | | | | | | | | | | | | | | | | | | |
| | Beginning Allowance | | Provision for (Recapture of) Loan Losses | | Charge- offs | | Recoveries | | Ending Allowance |
| Mortgage loans: | | | | | | | | | |
| One- to four-family | $ | 1,239 |
| | $ | (178 | ) | | $ | — |
| | $ | 21 |
| | $ | 1,082 |
|
| Multi-family | 473 |
| | (26 | ) | | — |
| | — |
| | 447 |
|
| Commercial | 4,384 |
| | (1,248 | ) | | (13 | ) | | 1,061 |
| | 4,184 |
|
| Construction – custom and owner/builder | 619 |
| | 80 |
| | — |
| | — |
| | 699 |
|
| Construction – speculative one- to four-family | 130 |
| | (8 | ) | | — |
| | 6 |
| | 128 |
|
| Construction – commercial | 268 |
| | 35 |
| | — |
| | — |
| | 303 |
|
| Construction – multi-family | 316 |
| | (143 | ) | | — |
| | — |
| | 173 |
|
| Land | 820 |
| | 189 |
| | (110 | ) | | 19 |
| | 918 |
|
| Consumer loans: | |
| | |
| | |
| | |
| | |
|
| Home equity and second mortgage | 939 |
| | 44 |
| | — |
| | — |
| | 983 |
|
| Other | 156 |
| | (28 | ) | | (10 | ) | | 3 |
| | 121 |
|
| Commercial business loans | 482 |
| | 33 |
| | — |
| | — |
| | 515 |
|
Total | $ | 9,826 |
| | $ | (1,250 | ) | | $ | (133 | ) | | $ | 1,110 |
| | $ | 9,553 |
|
The following table presents information on loans evaluated individually and collectively for impairment in the allowance for loan losses by portfolio segment at September 30, 20192021 (dollars in thousands):
| | | | | | | | | | | | | | | | | | | | | | | | | | | | | | | | | | | |
| | Allowance for Loan Losses | | Recorded Investment in Loans |
| | Individually
Evaluated for
Impairment | | Collectively
Evaluated for
Impairment | | Total | | Individually
Evaluated for
Impairment | | Collectively
Evaluated for
Impairment | | Total |
| Mortgage loans: | | | | | | | | | | | |
| One- to four-family | $ | — | | | $ | 1,154 | | | $ | 1,154 | | | $ | 407 | | | $ | 119,528 | | | $ | 119,935 | |
| Multi-family | — | | | 765 | | | 765 | | | — | | | 87,563 | | | 87,563 | |
| Commercial | — | | | 6,813 | | | 6,813 | | | 3,143 | | | 467,507 | | | 470,650 | |
| Construction – custom and owner/ builder | — | | | 644 | | | 644 | | | — | | | 61,003 | | | 61,003 | |
| Construction – speculative one- to four-family | — | | | 188 | | | 188 | | | — | | | 9,657 | | | 9,657 | |
| Construction – commercial | — | | | 784 | | | 784 | | | — | | | 38,931 | | | 38,931 | |
| Construction – multi-family | — | | | 436 | | | 436 | | | — | | | 22,888 | | | 22,888 | |
| Construction – land development | — | | | 124 | | | 124 | | | — | | | 5,502 | | | 5,502 | |
| Land | 76 | | | 394 | | | 470 | | | 683 | | | 19,253 | | | 19,936 | |
| Consumer loans: | | | | | | | | | | | |
| Home equity and second mortgage | — | | | 528 | | | 528 | | | 516 | | | 32,472 | | | 32,988 | |
| Other | — | | | 50 | | | 50 | | | 17 | | | 2,495 | | | 2,512 | |
| Commercial business loans | 171 | | | 1,342 | | | 1,513 | | | 458 | | | 74,121 | | | 74,579 | |
| SBA PPP loans | — | | | — | | | — | | | — | | | 40,922 | | | 40,922 | |
| Total | $ | 247 | | | $ | 13,222 | | | $ | 13,469 | | | $ | 5,224 | | | $ | 981,842 | | | $ | 987,066 | |
|
| | | | | | | | | | | | | | | | | | | | | | | |
| | Allowance for Loan Losses | | Recorded Investment in Loans |
| | Individually Evaluated for Impairment | | Collectively Evaluated for Impairment | | Total | | Individually Evaluated for Impairment | | Collectively Evaluated for Impairment | | Total |
| Mortgage loans: | | | | | | | | | | | |
| One- to four-family | $ | — |
| | $ | 1,167 |
| | $ | 1,167 |
| | $ | 1,192 |
| | $ | 131,469 |
| | $ | 132,661 |
|
| Multi-family | — |
| | 481 |
| | 481 |
| | — |
| | 76,036 |
| | 76,036 |
|
| Commercial | — |
| | 4,154 |
| | 4,154 |
| | 3,190 |
| | 415,927 |
| | 419,117 |
|
| Construction – custom and owner/ builder | — |
| | 755 |
| | 755 |
| | — |
| | 75,411 |
| | 75,411 |
|
| Construction – speculative one- to four-family | — |
| | 212 |
| | 212 |
| | — |
| | 10,779 |
| | 10,779 |
|
| Construction – commercial | — |
| | 338 |
| | 338 |
| | — |
| | 24,051 |
| | 24,051 |
|
| Construction – multi-family | — |
| | 375 |
| | 375 |
| | — |
| | 19,256 |
| | 19,256 |
|
| Construction – land development | — |
| | 67 |
| | 67 |
| | — |
| | 1,803 |
| | 1,803 |
|
| Land | 27 |
| | 670 |
| | 697 |
| | 204 |
| | 30,566 |
| | 30,770 |
|
| Consumer loans: | |
| |
|
| | |
| |
|
| |
|
| | |
|
| Home equity and second mortgage | — |
| | 623 |
| | 623 |
| | 603 |
| | 39,587 |
| | 40,190 |
|
| Other | 17 |
| | 82 |
| | 99 |
| | 23 |
| | 4,289 |
| | 4,312 |
|
| Commercial business loans | 128 |
| | 594 |
| | 722 |
| | 725 |
| | 64,039 |
| | 64,764 |
|
| Total | $ | 172 |
| | $ | 9,518 |
| | $ | 9,690 |
| | $ | 5,937 |
| | $ | 893,213 |
| | $ | 899,150 |
|
| | | | | | | | |
| Notes to Consolidated Financial Statements | |
Notes to Consolidated Financial Statements_________________________________________________________________
Timberland Bancorp, Inc. and Subsidiary
September 30, 20192021 and 20182020
The following table presents information on loans evaluated individually and collectively for impairment in the allowance for loan losses by portfolio segment at September 30, 20182020 (dollars in thousands):
| | | | | | | | | | | | | | | | | | | | | | | | | | | | | | | | | | | |
| | Allowance for Loan Losses | | Recorded Investment in Loans |
| | Individually
Evaluated for
Impairment | | Collectively
Evaluated for
Impairment | | Total | | Individually
Evaluated for
Impairment | | Collectively
Evaluated for
Impairment | | Total |
| Mortgage loans: | | | | | | | | | | | |
| One- to four-family | $ | 3 | | | $ | 1,160 | | | $ | 1,163 | | | $ | 1,143 | | | $ | 117,437 | | | $ | 118,580 | |
| Multi-family | — | | | 718 | | | 718 | | | — | | | 85,053 | | | 85,053 | |
| Commercial | — | | | 7,144 | | | 7,144 | | | 3,242 | | | 450,332 | | | 453,574 | |
| Construction – custom and owner/ builder | — | | | 832 | | | 832 | | | — | | | 75,332 | | | 75,332 | |
| Construction – speculative one- to four-family | — | | | 158 | | | 158 | | | — | | | 7,108 | | | 7,108 | |
| Construction – commercial | — | | | 420 | | | 420 | | | — | | | 20,927 | | | 20,927 | |
| Construction – multi-family | — | | | 238 | | | 238 | | | — | | | 10,832 | | | 10,832 | |
| Construction – land development | — | | | 133 | | | 133 | | | — | | | 4,739 | | | 4,739 | |
| Land | — | | | 572 | | | 572 | | | 394 | | | 25,177 | | | 25,571 | |
| Consumer loans: | | | | | | | | | | | |
| Home equity and second mortgage | — | | | 593 | | | 593 | | | 555 | | | 31,522 | | | 32,077 | |
| Other | — | | | 71 | | | 71 | | | 9 | | | 3,563 | | | 3,572 | |
| Commercial business loans | 38 | | | 1,334 | | | 1,372 | | | 430 | | | 69,110 | | | 69,540 | |
| SBA PPP loans | — | | | — | | | — | | | — | | | 126,820 | | | 126,820 | |
| Total | $ | 41 | | | $ | 13,373 | | | $ | 13,414 | | | $ | 5,773 | | | $ | 1,027,952 | | | $ | 1,033,725 | |
| | | | | | | | |
| Notes to Consolidated Financial Statements | |
Timberland Bancorp, Inc. and Subsidiary
September 30, 2021 and 2020
|
| | | | | | | | | | | | | | | | | | | | | | | |
| | Allowance for Loan Losses | | Recorded Investment in Loans |
| | Individually Evaluated for Impairment | | Collectively Evaluated for Impairment | | Total | | Individually Evaluated for Impairment | | Collectively Evaluated for Impairment | | Total |
| Mortgage loans: | | | | | | | | | | | |
| One- to four-family | $ | — |
| | $ | 1,086 |
| | $ | 1,086 |
| | $ | 1,054 |
| | $ | 114,887 |
| | $ | 115,941 |
|
| Multi-family | — |
| | 433 |
| | 433 |
| | — |
| | 61,928 |
| | 61,928 |
|
| Commercial | — |
| | 4,248 |
| | 4,248 |
| | 2,446 |
| | 342,667 |
| | 345,113 |
|
| Construction – custom and owner/ builder | — |
| | 671 |
| | 671 |
| | — |
| | 67,024 |
| | 67,024 |
|
| Construction – speculative one- to four-family | — |
| | 178 |
| | 178 |
| | — |
| | 7,107 |
| | 7,107 |
|
| Construction – commercial | — |
| | 563 |
| | 563 |
| | — |
| | 23,440 |
| | 23,440 |
|
| Construction – multi-family | — |
| | 135 |
| | 135 |
| | — |
| | 5,983 |
| | 5,983 |
|
| Construction – land development | — |
| | 49 |
| | 49 |
| | — |
| | 1,567 |
| | 1,567 |
|
| Land | 34 |
| | 810 |
| | 844 |
| | 243 |
| | 25,303 |
| | 25,546 |
|
| Consumer loans: | |
| | |
| | |
| | |
| | |
| | |
|
| Home equity and second mortgage | — |
| | 649 |
| | 649 |
| | 359 |
| | 36,982 |
| | 37,341 |
|
| Other | — |
| | 117 |
| | 117 |
| | — |
| | 3,515 |
| | 3,515 |
|
| Commercial business loans | 63 |
| | 494 |
| | 557 |
| | 170 |
| | 42,883 |
| | 43,053 |
|
| Total | $ | 97 |
| | $ | 9,433 |
| | $ | 9,530 |
| | $ | 4,272 |
| | $ | 733,286 |
| | $ | 737,558 |
|
The following table presents an analysis of loans by aging category and portfolio segment at September 30, 20192021 (dollars in thousands): |
| | | | | | | | | | | | | | | | | | | | | | | | | | | |
| | 30-59 Days Past Due | | 60-89 Days Past Due | | Non- Accrual(1) | | Past Due 90 Days or More and Still Accruing | | Total Past Due | | Current | | Total Loans |
| Mortgage loans: | | | | | | | | | | | | | |
| One- to four-family | $ | — |
| | $ | 286 |
| | $ | 699 |
| | $ | — |
| | $ | 985 |
| | $ | 131,676 |
| | $ | 132,661 |
|
| Multi-family | — |
| | — |
| | — |
| | — |
| | — |
| | 76,036 |
| | 76,036 |
|
| Commercial | 94 |
| | 218 |
| | 779 |
| | — |
| | 1,091 |
| | 418,026 |
| | 419,117 |
|
| Construction – custom and owner/ builder | — |
| | — |
| | — |
| | — |
| | — |
| | 75,411 |
| | 75,411 |
|
| Construction – speculative one- to four-family | — |
| | — |
| | — |
| | — |
| | — |
| | 10,779 |
| | 10,779 |
|
| Construction – commercial | — |
| | — |
| | — |
| | — |
| | — |
| | 24,051 |
| | 24,051 |
|
| Construction – multi-family | — |
| | — |
| | — |
| | — |
| | — |
| | 19,256 |
| | 19,256 |
|
| Construction – land development | — |
| | — |
| | — |
| | — |
| | — |
| | 1,803 |
| | 1,803 |
|
| Land | 5 |
| | 193 |
| | 204 |
| | — |
| | 402 |
| | 30,368 |
| | 30,770 |
|
| Consumer loans: | |
| | |
| | |
| | |
| | |
| |
|
| |
|
|
| Home equity and second mortgage | 94 |
| | — |
| | 603 |
| | — |
| | 697 |
| | 39,493 |
| | 40,190 |
|
| Other | — |
| | — |
| | 23 |
| | — |
| | 23 |
| | 4,289 |
| | 4,312 |
|
| Commercial business loans | — |
| | 2 |
| | 725 |
| | — |
| | 727 |
| | 64,037 |
| | 64,764 |
|
Total | $ | 193 |
| | $ | 699 |
| | $ | 3,033 |
| | $ | — |
| | $ | 3,925 |
| | $ | 895,225 |
| | $ | 899,150 |
|
| | | | | | | | | | | | | | | | | | | | | | | | | | | | | | | | | | | | | | | | | |
| | 30-59
Days
Past Due | | 60-89
Days
Past Due | | Non-
Accrual(1) | | Past Due
90 Days
or More
and Still
Accruing | | Total
Past Due | | Current | | Total
Loans |
| Mortgage loans: | | | | | | | | | | | | | |
| One- to four-family | $ | — | | | $ | 180 | | | $ | 407 | | | $ | — | | | $ | 587 | | | $ | 119,348 | | | $ | 119,935 | |
| Multi-family | — | | | — | | | — | | | — | | | — | | | 87,563 | | | 87,563 | |
| Commercial | — | | | — | | | 773 | | | — | | | 773 | | | 469,877 | | | 470,650 | |
| Construction – custom and owner/ builder | — | | | — | | | — | | | — | | | — | | | 61,003 | | | 61,003 | |
| Construction – speculative one- to four-family | — | | | — | | | — | | | — | | | — | | | 9,657 | | | 9,657 | |
| Construction – commercial | — | | | — | | | — | | | — | | | — | | | 38,931 | | | 38,931 | |
| Construction – multi-family | — | | | — | | | — | | | — | | | — | | | 22,888 | | | 22,888 | |
| Construction – land development | — | | | — | | | — | | | — | | | — | | | 5,502 | | | 5,502 | |
| Land | — | | | — | | | 683 | | | — | | | 683 | | | 19,253 | | | 19,936 | |
| Consumer loans: | | | | | | | | | | | | | |
| Home equity and second mortgage | — | | | — | | | 516 | | | — | | | 516 | | | 32,472 | | | 32,988 | |
| Other | — | | | — | | | 17 | | | — | | | 17 | | | 2,495 | | | 2,512 | |
| Commercial business loans | 5 | | | — | | | 458 | | | — | | | 463 | | | 74,116 | | | 74,579 | |
| SBA PPP loans | — | | | — | | | — | | | — | | | — | | | 40,922 | | | 40,922 | |
Total | $ | 5 | | | $ | 180 | | | $ | 2,854 | | | $ | — | | | $ | 3,039 | | | $ | 984,027 | | | $ | 987,066 | |
__________________
(1)Includes non-accrual loans past due 90 days or more and other loans classified as non-accrual.
| | | | | | | | |
(1)Notes to Consolidated Financial Statements | Includes non-accrual loans past due 90 days or more and other loans classified as non-accrual. |
Notes to Consolidated Financial Statements_________________________________________________________________
Timberland Bancorp, Inc. and Subsidiary
September 30, 20192021 and 20182020
The following table presents an analysis of loans by aging category and portfolio segment at September 30, 20182020 (dollars in thousands):
| | | | 30-59 Days Past Due | | 60-89 Days Past Due | | Non- Accrual(1) | | Past Due 90 Days or More and Still Accruing | | Total Past Due | | Current | | Total Loans | | 30-59
Days
Past Due | | 60-89
Days
Past Due | | Non-
Accrual(1) | | Past Due
90 Days
or More
and Still
Accruing | | Total
Past Due | | Current | | Total
Loans |
| Mortgage loans: | | | | | | | | | | | | | | Mortgage loans: | | | | | | | | | | | | | |
| One- to four-family | $ | 557 |
| | $ | — |
| | $ | 545 |
| | $ | — |
| | $ | 1,102 |
| | $ | 114,839 |
| | $ | 115,941 |
| One- to four-family | $ | — | | | $ | 68 | | | $ | 659 | | | $ | — | | | $ | 727 | | | $ | 117,853 | | | $ | 118,580 | |
| Multi-family | — |
| | — |
| | — |
| | — |
| | — |
| | 61,928 |
| | 61,928 |
| Multi-family | — | | | — | | | — | | | — | | | — | | | 85,053 | | | 85,053 | |
| Commercial | 574 |
| | — |
| | — |
| | — |
| | 574 |
| | 344,539 |
| | 345,113 |
| Commercial | — | | | 519 | | | 858 | | | — | | | 1,377 | | | 452,197 | | | 453,574 | |
| Construction – custom and owner/ builder | — |
| | — |
| | — |
| | — |
| | — |
| | 67,024 |
| | 67,024 |
| Construction – custom and owner/ builder | — | | | — | | | — | | | — | | | — | | | 75,332 | | | 75,332 | |
| Construction – speculative one- to four-family | — |
| | — |
| | — |
| | — |
| | — |
| | 7,107 |
| | 7,107 |
| Construction – speculative one- to four-family | — | | | — | | | — | | | — | | | — | | | 7,108 | | | 7,108 | |
| Construction – commercial | — |
| | — |
| | — |
| | — |
| | — |
| | 23,440 |
| | 23,440 |
| Construction – commercial | — | | | — | | | — | | | — | | | — | | | 20,927 | | | 20,927 | |
| Construction – multi-family | — |
| | — |
| | — |
| | — |
| | — |
| | 5,983 |
| | 5,983 |
| Construction – multi-family | — | | | — | | | — | | | — | | | — | | | 10,832 | | | 10,832 | |
| Construction – land development | — |
| | — |
| | — |
| | — |
| | — |
| | 1,567 |
| | 1,567 |
| Construction – land development | — | | | 38 | | | — | | | — | | | 38 | | | 4,701 | | | 4,739 | |
| Land | 40 |
| | — |
| | 243 |
| | — |
| | 283 |
| | 25,263 |
| | 25,546 |
| Land | — | | | 144 | | | 394 | | | — | | | 538 | | | 25,033 | | | 25,571 | |
| Consumer loans: | |
| | |
| | |
| | |
| | |
| | | | |
| Consumer loans: | | | | | | | | | | | |
| Home equity and second mortgage | 42 |
| | — |
| | 359 |
| | — |
| | 401 |
| | 36,940 |
| | 37,341 |
| Home equity and second mortgage | — | | | 22 | | | 555 | | | — | | | 577 | | | 31,500 | | | 32,077 | |
| Other | 10 |
| | 16 |
| | — |
| | — |
| | 26 |
| | 3,489 |
| | 3,515 |
| Other | 3 | | | — | | | 9 | | | — | | | 12 | | | 3,560 | | | 3,572 | |
| Commercial business loans | — |
| | — |
| | 170 |
| | — |
| | 170 |
| | 42,883 |
| | 43,053 |
| Commercial business loans | 49 | | | — | | | 430 | | | — | | | 479 | | | 69,061 | | | 69,540 | |
| SBA PPP loans | | SBA PPP loans | — | | | — | | | — | | | — | | | — | | | 126,820 | | | 126,820 | |
Total | $ | 1,223 |
| | $ | 16 |
| | $ | 1,317 |
| | $ | — |
| | $ | 2,556 |
| | $ | 735,002 |
| | $ | 737,558 |
| Total | $ | 52 | | | $ | 791 | | | $ | 2,905 | | | $ | — | | | $ | 3,748 | | | $ | 1,029,977 | | | $ | 1,033,725 | |
___________________
(1)Includes non-accrual loans past due 90 days or more and other loans classified as non-accrual.
Credit Quality Indicators
The Company uses credit risk grades which reflect the Company’s assessment of a loan’s risk or loss potential. The Company categorizes loans into risk grade categories based on relevant information about the ability of borrowers to service their debt such as: current financial information, historical payment experience, credit documentation, public information and current economic trends, among other factors such as the estimated fair value of the collateral. The Company uses the following definitions for credit risk ratings as part of the on-going monitoring of the credit quality of its loan portfolio:
Pass: Pass loans are defined as those loans that meet acceptable quality underwriting standards.
Watch: Watch loans are defined as those loans that still exhibit acceptable quality but have some concerns that justify greater attention. If these concerns are not corrected, a potential for further adverse categorization exists. These concerns could relate to a specific condition peculiar to the borrower, its industry segment or the general economic environment.
Special Mention: Special mention loans are defined as those loans deemed by management to have some potential weaknesses that deserve management’s close attention. If left uncorrected, these potential weaknesses may result in the deterioration of the payment prospects of the loan.
Substandard: Substandard loans are defined as those loans that are inadequately protected by the current net worth and paying capacity of the obligor, or of the collateral pledged. Loans classified as substandard have a well-defined weakness or weaknesses that jeopardize the repayment of the debt. If the weakness or weaknesses are not corrected, there is the distinct possibility that some loss will be sustained.
| | | | | | | | |
| Notes to Consolidated Financial Statements | |
Timberland Bancorp, Inc. and Subsidiary
September 30, 2021 and 2020
Doubtful: Loans in this classification have the weaknesses of substandard loans with the additional characteristic that the weaknesses make the collection or liquidation in full on the basis of currently existing facts, conditions and values questionable, and there is a high possibility of loss. At September 30, 2021 and 2020, there were no loans classified as doubtful.
Loss: Loans in this classification are considered uncollectible and of such little value that continuance as an asset is not warranted. This classification does not mean that the loan has absolutely no recovery or salvage value, but rather it is not
Notes to Consolidated Financial Statements_________________________________________________________________
Timberland Bancorp, Inc. and Subsidiary
September 30, 2019 and 2018
practical or desirable to defer writing off this loan even though partial recovery may be realized in the future. At September 30, 20192021 and 2018,2020, there were no loans classified as loss.
The following table presents an analysis of loans by credit quality indicator and portfolio segment at September 30, 20192021 (dollars in thousands):
| | | | | | | | | | | | | | | | | | | | | | | | | | | | | |
| | Loan Grades | | |
| | Pass | | Watch | | Special Mention | | Substandard | | Total |
| Mortgage loans: | | | | | | | | | |
| One- to four-family | $ | 118,857 | | | $ | 129 | | | $ | 537 | | | $ | 412 | | | $ | 119,935 | |
| Multi-family | 87,563 | | | — | | | — | | | — | | | 87,563 | |
| Commercial | 456,188 | | | 10,285 | | | 2,921 | | | 1,256 | | | 470,650 | |
| Construction – custom and owner / builder | 59,699 | | | 1,304 | | | — | | | — | | | 61,003 | |
| Construction – speculative one- to four-family | 9,657 | | | — | | | — | | | — | | | 9,657 | |
| Construction – commercial | 37,414 | | | — | | | 1,517 | | | — | | | 38,931 | |
| Construction – multi-family | 22,888 | | | — | | | — | | | — | | | 22,888 | |
| Construction – land development | 5,467 | | | — | | | — | | | 35 | | | 5,502 | |
| Land | 18,648 | | | 558 | | | — | | | 730 | | | 19,936 | |
| Consumer loans: | | | | | | | | | |
| Home equity and second mortgage | 32,190 | | | 145 | | | — | | | 653 | | | 32,988 | |
| Other | 2,465 | | | 30 | | | — | | | 17 | | | 2,512 | |
| Commercial business loans | 73,992 | | | 49 | | | 37 | | | 501 | | | 74,579 | |
| SBA PPP loans | 40,922 | | | — | | | — | | | — | | | 40,922 | |
Total | $ | 965,950 | | | $ | 12,500 | | | $ | 5,012 | | | $ | 3,604 | | | $ | 987,066 | |
| | | | | | | | |
| Notes to Consolidated Financial Statements | |
Timberland Bancorp, Inc. and Subsidiary
September 30, 2021 and 2020
|
| | | | | | | | | | | | | | | | | | | |
| | Loan Grades | | |
| | Pass | | Watch | | Special Mention | | Substandard | | Total |
| Mortgage loans: | | | | | | | | | |
| One- to four-family | $ | 129,748 |
| | $ | 296 |
| | $ | 562 |
| | $ | 2,055 |
| | $ | 132,661 |
|
| Multi-family | 76,036 |
| | — |
| | — |
| | — |
| | 76,036 |
|
| Commercial | 405,165 |
| | 11,944 |
| | 683 |
| | 1,325 |
| | 419,117 |
|
| Construction – custom and owner / builder | 75,178 |
| | 233 |
| | — |
| | — |
| | 75,411 |
|
| Construction – speculative one- to four-family | 10,779 |
| | — |
| | — |
| | — |
| | 10,779 |
|
| Construction – commercial | 24,051 |
| | — |
| | — |
| | — |
| | 24,051 |
|
| Construction – multi-family | 19,256 |
| | — |
| | — |
| | — |
| | 19,256 |
|
| Construction – land development | 1,659 |
| | — |
| | — |
| | 144 |
| | 1,803 |
|
| Land | 28,390 |
| | 952 |
| | 1,217 |
| | 211 |
| | 30,770 |
|
| Consumer loans: | |
| | |
| | |
| | |
| | |
|
| Home equity and second mortgage | 39,364 |
| | 41 |
| | — |
| | 785 |
| | 40,190 |
|
| Other | 4,257 |
| | 33 |
| | — |
| | 22 |
| | 4,312 |
|
| Commercial business loans | 63,669 |
| | 232 |
| | 85 |
| | 778 |
| | 64,764 |
|
Total | $ | 877,552 |
| | $ | 13,731 |
| | $ | 2,547 |
| | $ | 5,320 |
| | $ | 899,150 |
|
The following table presents an analysis of loans by credit quality indicator and portfolio segment at September 30, 20182020 (dollars in thousands):
|
| | | | | | | | | | | | | | | | | | | |
| | Loan Grades | | |
| | Pass | | Watch | | Special Mention | | Substandard | | Total |
| Mortgage loans: | | | | | | | | | |
| One- to four-family | $ | 113,148 |
| | $ | 882 |
| | $ | 581 |
| | $ | 1,330 |
| | $ | 115,941 |
|
| Multi-family | 61,928 |
| | — |
| | — |
| | — |
| | 61,928 |
|
| Commercial | 334,908 |
| | 8,375 |
| | 988 |
| | 842 |
| | 345,113 |
|
| Construction – custom and owner / builder | 66,720 |
| | 304 |
| | — |
| | — |
| | 67,024 |
|
| Construction – speculative one- to four-family | 7,107 |
| | — |
| | — |
| | — |
| | 7,107 |
|
| Construction – commercial | 23,440 |
| | — |
| | — |
| | — |
| | 23,440 |
|
| Construction – multi-family | 5,983 |
| | — |
| | — |
| | — |
| | 5,983 |
|
| Construction – land development | 1,567 |
| | — |
| | — |
| | — |
| | 1,567 |
|
| Land | 22,810 |
| | 988 |
| | 1,505 |
| | 243 |
| | 25,546 |
|
| Consumer loans: | |
| | |
| | |
| | |
| | |
|
| Home equity and second mortgage | 36,697 |
| | 82 |
| | — |
| | 562 |
| | 37,341 |
|
| Other | 3,480 |
| | — |
| | — |
| | 35 |
| | 3,515 |
|
| Commercial business loans | 42,812 |
| | 22 |
| | 49 |
| | 170 |
| | 43,053 |
|
Total | $ | 720,600 |
| | $ | 10,653 |
| | $ | 3,123 |
| | $ | 3,182 |
| | $ | 737,558 |
|
| | | | | | | | | | | | | | | | | | | | | | | | | | | | | |
| | Loan Grades | | |
| | Pass | | Watch | | Special Mention | | Substandard | | Total |
| Mortgage loans: | | | | | | | | | |
| One- to four-family | $ | 115,992 | | | $ | 1,369 | | | $ | 551 | | | $ | 668 | | | $ | 118,580 | |
| Multi-family | 85,053 | | | — | | | — | | | — | | | 85,053 | |
| Commercial | 441,037 | | | 7,712 | | | 3,447 | | | 1,378 | | | 453,574 | |
| Construction – custom and owner / builder | 74,529 | | | 803 | | | — | | | — | | | 75,332 | |
| Construction – speculative one- to four-family | 7,108 | | | — | | | — | | | — | | | 7,108 | |
| Construction – commercial | 19,525 | | | — | | | 1,402 | | | — | | | 20,927 | |
| Construction – multi-family | 10,832 | | | — | | | — | | | — | | | 10,832 | |
| Construction – land development | 4,701 | | | — | | | — | | | 38 | | | 4,739 | |
| Land | 23,290 | | | 1,518 | | | 370 | | | 393 | | | 25,571 | |
| Consumer loans: | | | | | | | | | |
| Home equity and second mortgage | 31,344 | | | 53 | | | — | | | 680 | | | 32,077 | |
| Other | 3,531 | | | 32 | | | — | | | 9 | | | 3,572 | |
| Commercial business loans | 68,904 | | | 59 | | | 94 | | | 483 | | | 69,540 | |
| SBA PPP loans | 126,820 | | | — | | | — | | | — | | | 126,820 | |
Total | $ | 1,012,666 | | | $ | 11,546 | | | $ | 5,864 | | | $ | 3,649 | | | $ | 1,033,725 | |
Notes to Consolidated Financial Statements_________________________________________________________________110
| | | | | | | | |
| Notes to Consolidated Financial Statements | |
Timberland Bancorp, Inc. and Subsidiary
September 30, 20192021 and 20182020
The following table is a summary of information related to impaired loans by portfolio segment as of and for the year ended September 30, 2021 (dollars in thousands):
| | | | | | | | | | | | | | | | | | | | | | | | | | | | | | | | | | | |
| | September 30, 2021 | | For the Year Ended September 30, 2021 |
| | Recorded
Investment | | Unpaid Principal
Balance (Loan
Balance Plus
Charge Off) | | Related
Allowance | | Average
Recorded
Investment | | Interest
Income
Recognized | | Cash Basis
Interest
Income
Recognized |
| With no related allowance recorded: | | | | | | | | | | | |
| Mortgage loans: | | | | | | | | | | | |
| One- to four-family | $ | 407 | | | $ | 450 | | | $ | — | | | $ | 655 | | | $ | 58 | | | $ | 52 | |
| | | | | | | | | | | |
| Commercial | 3,143 | | | 3,143 | | | — | | | 3,039 | | | 159 | | | 127 | |
| | | | | | | | | | | |
| | | | | | | | | | | |
| | | | | | | | | | | |
| | | | | | | | | | | |
| Land | 321 | | | 321 | | | — | | | 292 | | | 2 | | | 2 | |
| Consumer loans: | | | | | | | | | | | |
| Home equity and second mortgage | 516 | | | 516 | | | — | | | 552 | | | 1 | | | 1 | |
| Other | 17 | | | 17 | | | — | | | 12 | | | — | | | — | |
| Commercial business loans | 164 | | | 168 | | | — | | | 200 | | | — | | | — | |
Subtotal | 4,568 | | | 4,615 | | | — | | | 4,750 | | | 220 | | | 182 | |
| With an allowance recorded: | | | | | | | | | | | |
| Mortgage loans: | | | | | | | | | | | |
| One- to four-family | — | | | — | | | — | | | 97 | | | — | | | — | |
| | | | | | | | | | | |
| | | | | | | | | | | |
| | | | | | | | | | | |
| | | | | | | | | | | |
| | | | | | | | | | | |
| | | | | | | | | | | |
| Land | 362 | | | 362 | | | 76 | | | 72 | | | — | | | — | |
| | | | | | | | | | | |
| | | | | | | | | | | |
| | | | | | | | | | | |
| Commercial business loans | 294 | | | 294 | | | 171 | | | 285 | | | — | | | — | |
Subtotal | 656 | | | 656 | | | 247 | | | 454 | | | — | | | — | |
| Total: | | | | | | | | | | | |
| Mortgage loans: | | | | | | | | | | | |
| One- to four-family | 407 | | | 450 | | | — | | | 752 | | | 58 | | | 52 | |
| | | | | | | | | | | |
| Commercial | 3,143 | | | 3,143 | | | — | | | 3,039 | | | 159 | | | 127 | |
| | | | | | | | | | | |
| | | | | | | | | | | |
| | | | | | | | | | | |
| | | | | | | | | | | |
| Land | 683 | | | 683 | | | 76 | | | 364 | | | 2 | | | 2 | |
| Consumer loans: | | | | | | | | | | | |
| Home equity and second mortgage | 516 | | | 516 | | | — | | | 552 | | | 1 | | | 1 | |
| Other | 17 | | | 17 | | | — | | | 12 | | | — | | | — | |
| Commercial business loans | 458 | | | 462 | | | 171 | | | 485 | | | — | | | — | |
Total | $ | 5,224 | | | $ | 5,271 | | | $ | 247 | | | $ | 5,204 | | | $ | 220 | | | $ | 182 | |
| | | | | | | | |
| Notes to Consolidated Financial Statements | |
Timberland Bancorp, Inc. and Subsidiary
September 30, 2021 and 2020
The following table is a summary of information related to impaired loans by portfolio segment as of and for the year ended September 30, 2020 (dollars in thousands):
| | | | | | | | | | | | | | | | | | | | | | | | | | | | | | | | | | | |
| | September 30, 2020 | | For the Year Ended September 30, 2020 |
| | Recorded
Investment | | Unpaid Principal
Balance (Loan
Balance Plus
Charge Off) | | Related
Allowance | | Average
Recorded
Investment | | Interest
Income
Recognized | | Cash Basis
Interest
Income
Recognized |
| With no related allowance recorded: | | | | | | | | | | | |
| Mortgage loans: | | | | | | | | | | | |
| One- to four-family | $ | 659 | | | $ | 703 | | | $ | — | | | $ | 1,127 | | | $ | 44 | | | $ | 34 | |
| | | | | | | | | | | |
| Commercial | 3,242 | | | 3,242 | | | — | | | 3,236 | | | 133 | | | 107 | |
| | | | | | | | | | | |
| | | | | | | | | | | |
| | | | | | | | | | | |
| | | | | | | | | | | |
| Land | 394 | | | 438 | | | — | | | 125 | | | — | | | — | |
| Consumer loans: | | | | | | | | | | | |
| Home equity and second mortgage | 555 | | | 555 | | | — | | | 581 | | | — | | | — | |
| Other | 9 | | | 9 | | | — | | | 6 | | | — | | | — | |
| Commercial business loans | 182 | | | 182 | | | — | | | 176 | | | — | | | — | |
Subtotal | 5,041 | | | 5,129 | | | — | | | 5,251 | | | 177 | | | 141 | |
| With an allowance recorded: | | | | | | | | | | | |
| Mortgage loans: | | | | | | | | | | | |
| One- to four-family | 484 | | | 484 | | | 3 | | | 194 | | | 16 | | | 8 | |
| | | | | | | | | | | |
| | | | | | | | | | | |
| | | | | | | | | | | |
| | | | | | | | | | | |
| | | | | | | | | | | |
| | | | | | | | | | | |
| Land | — | | | — | | | — | | | 110 | | | — | | | — | |
| Consumer loans: | | | | | | | | | | | |
| | | | | | | | | | | |
| Other | — | | | — | | | — | | | 7 | | | — | | | — | |
| Commercial business loans | 248 | | | 248 | | | 38 | | | 370 | | | — | | | — | |
Subtotal | 732 | | | 732 | | | 41 | | | 681 | | | 16 | | | 8 | |
| Total: | | | | | | | | | | | |
| Mortgage loans: | | | | | | | | | | | |
| One- to four-family | 1,143 | | | 1,187 | | | 3 | | | 1,321 | | | 60 | | | 42 | |
| | | | | | | | | | | |
| Commercial | 3,242 | | | 3,242 | | | — | | | 3,236 | | | 133 | | | 107 | |
| | | | | | | | | | | |
| | | | | | | | | | | |
| | | | | | | | | | | |
| | | | | | | | | | | |
| Land | 394 | | | 438 | | | — | | | 235 | | | — | | | — | |
| Consumer loans: | | | | | | | | | | | |
| Home equity and second mortgage | 555 | | | 555 | | | — | | | 581 | | | — | | | — | |
| Other | 9 | | | 9 | | | — | | | 13 | | | — | | | — | |
| Commercial business loans | 430 | | | 430 | | | 38 | | | 546 | | | — | | | — | |
Total | $ | 5,773 | | | $ | 5,861 | | | $ | 41 | | | $ | 5,932 | | | $ | 193 | | | $ | 149 | |
| | | | | | | | |
| Notes to Consolidated Financial Statements | |
Timberland Bancorp, Inc. and Subsidiary
September 30, 2021 and 2020
The following table is a summary of information related to impaired loans by portfolio segment as of and for the year ended September 30, 2019 (dollars in thousands):
| | | | | | | | | | | | | | | | | | | | | | | | | | | | | | | | | | | |
| | September 30, 2019 | | For the Year Ended September 30, 2019 |
| | Recorded
Investment | | Unpaid Principal
Balance (Loan
Balance Plus
Charge Off) | | Related
Allowance | | Average
Recorded
Investment | | Interest
Income
Recognized | | Cash Basis
Interest
Income
Recognized |
| With no related allowance recorded: | | | | | | | | | | | |
| Mortgage loans: | | | | | | | | | | | |
| One- to four-family | $ | 1,192 | | | $ | 1,236 | | | $ | — | | | $ | 1,110 | | | $ | 71 | | | $ | 62 | |
| | | | | | | | | | | |
| Commercial | 3,190 | | | 3,190 | | | — | | | 2,920 | | | 227 | | | 192 | |
| | | | | | | | | | | |
| | | | | | | | | | | |
| | | | | | | | | | | |
| | | | | | | | | | | |
| | | | | | | | | | | |
| Land | 63 | | | 126 | | | — | | | 100 | | | 3 | | | 3 | |
| Consumer loans: | | | | | | | | | | | |
| Home equity and second mortgage | 603 | | | 603 | | | — | | | 459 | | | — | | | — | |
| | | | | | | | | | | |
| Commercial business loans | 189 | | | 291 | | | — | | | 142 | | | 30 | | | 30 | |
Subtotal | 5,237 | | | 5,446 | | | — | | | 4,731 | | | 331 | | | 287 | |
| With an allowance recorded: | | | | | | | | | | | |
| Mortgage loans: | | | | | | | | | | | |
| | | | | | | | | | | |
| | | | | | | | | | | |
| | | | | | | | | | | |
| | | | | | | | | | | |
| | | | | | | | | | | |
| | | | | | | | | | | |
| | | | | | | | | | | |
| Land | 141 | | | 141 | | | 27 | | | 246 | | | — | | | — | |
| Consumer loans: | | | | | | | | | | | |
| | | | | | | | | | | |
| Other | 23 | | | 23 | | | 17 | | | 10 | | | — | | | — | |
| Commercial business loans | 536 | | | 536 | | | 128 | | | 350 | | | 30 | | | 30 | |
Subtotal | 700 | | | 700 | | | 172 | | | 606 | | | 30 | | | 30 | |
| Total: | | | | | | | | | | | |
| Mortgage loans: | | | | | | | | | | | |
| One- to four-family | 1,192 | | | 1,236 | | | — | | | 1,110 | | | 71 | | | 62 | |
| | | | | | | | | | | |
| Commercial | 3,190 | | | 3,190 | | | — | | | 2,920 | | | 227 | | | 192 | |
| | | | | | | | | | | |
| | | | | | | | | | | |
| | | | | | | | | | | |
| | | | | | | | | | | |
| | | | | | | | | | | |
| Land | 204 | | | 267 | | | 27 | | | 346 | | | 3 | | | 3 | |
| Consumer loans: | | | | | | | | | | | |
| Home equity and second mortgage | 603 | | | 603 | | | — | | | 459 | | | — | | | — | |
| Other | 23 | | | 23 | | | 17 | | | 10 | | | — | | | — | |
| Commercial business loans | 725 | | | 827 | | | 128 | | | 492 | | | 60 | | | 60 | |
Total | $ | 5,937 | | | $ | 6,146 | | | $ | 172 | | | $ | 5,337 | | | $ | 361 | | | $ | 317 | |
|
| | | | | | | | | | | | | | | | | | | | | | | |
| | September 30, 2019 | | For the Year Ended September 30, 2019 |
| | Recorded Investment | | Unpaid Principal Balance (Loan Balance Plus Charge Off) | | Related Allowance | | Average Recorded Investment | | Interest Income Recognized | | Cash Basis Interest Income Recognized |
| With no related allowance recorded: | | | | | | | | | | | |
| Mortgage loans: | | | | | | | | | | | |
| One- to four-family | $ | 1,192 |
| | $ | 1,236 |
| | $ | — |
| | $ | 1,110 |
| | $ | 71 |
| | $ | 62 |
|
| Commercial | 3,190 |
| | 3,190 |
| | — |
| | 2,920 |
| | 227 |
| | 192 |
|
| Land | 63 |
| | 126 |
| | — |
| | 100 |
| | 3 |
| | 3 |
|
| Consumer loans: | | | |
| | | | |
| | |
| | |
|
| Home equity and second mortgage | 603 |
| | 603 |
| | — |
| | 459 |
| | — |
| | — |
|
| Commercial business loans | 189 |
| | 291 |
| | — |
| | 142 |
| | 30 |
| | 30 |
|
Subtotal | 5,237 |
| | 5,446 |
| | — |
| | 4,731 |
| | 331 |
| | 287 |
|
| With an allowance recorded: | |
| | |
| | |
| | |
| | |
| | |
|
| Mortgage loans: | |
| | |
| | |
| | |
| | |
| | |
|
| Land | 141 |
| | 141 |
| | 27 |
| | 246 |
| | — |
| | — |
|
| Consumer loans: | |
| | |
| | |
| | |
| | |
| | |
|
| Other | 23 |
| | 23 |
| | 17 |
| | 10 |
| | — |
| | — |
|
| Commercial business loans | 536 |
| | 536 |
| | 128 |
| | 350 |
| | 30 |
| | 30 |
|
Subtotal | 700 |
| | 700 |
| | 172 |
| | 606 |
| | 30 |
| | 30 |
|
| Total: | |
| | |
| | |
| | |
| | |
| | |
|
| Mortgage loans: | |
| | |
| | |
| | |
| | |
| | |
|
| One- to four-family | 1,192 |
| | 1,236 |
| | — |
| | 1,110 |
| | 71 |
| | 62 |
|
| Commercial | 3,190 |
| | 3,190 |
| | — |
| | 2,920 |
| | 227 |
| | 192 |
|
| Land | 204 |
| | 267 |
| | 27 |
| | 346 |
| | 3 |
| | 3 |
|
| Consumer loans: | |
| | |
| | | | |
| | |
| | |
|
| Home equity and second mortgage | 603 |
| | 603 |
| | — |
| | 459 |
| | — |
| | — |
|
| Other | 23 |
| | 23 |
| | 17 |
| | 10 |
| | — |
| | — |
|
| Commercial business loans | 725 |
| | 827 |
| | 128 |
| | 492 |
| | 60 |
| | 60 |
|
Total | $ | 5,937 |
| | $ | 6,146 |
| | $ | 172 |
| | $ | 5,337 |
| | $ | 361 |
| | $ | 317 |
|
| | | | | | | | |
| Notes to Consolidated Financial Statements | |
Notes to Consolidated Financial Statements_________________________________________________________________
Timberland Bancorp, Inc. and Subsidiary
September 30, 20192021 and 20182020
The CARES Act provided guidance around the modification of loans as a result of the COVID-19 pandemic, which outlined, among other criteria, that short-term modifications made on a good faith basis to borrowers who were current as defined under the CARES Act prior to any relief, are not TDRs. This includes short-term (e.g., six months) modifications such as payment deferrals, fee waivers, extensions of repayment terms, or other delays in payment that are insignificant. Borrowers are considered current under the CARES Act and related regulatory guidance if they are less than 30 days past due on their contractual payments at the time a modification program is implemented. In response to requests from borrowers, the Company made payment deferral modifications (typically 90-day payment deferrals with interest continuing to accrue or scheduled to be paid monthly) on a number of loans. The majority of these borrowers had resumed making payments as of September 30, 2021, and only one loan with a balance of $323,000 remained on deferral status under COVID-19 loan modification forbearance agreements as of that date. Loan modifications in accordance with the CARES Act and related regulatory guidance are still subject to an evaluation in regard to determining whether or not a loan is deemed to be impaired.
The following table is a summary of information related to impaired loans by portfolio segmentdetails the COVID-19 loan modifications on deferral status as of and for the year ended September 30, 20182021 (dollars in thousands):
|
| | | | | | | | | | | | | | | | | | | | | | | |
| | September 30, 2018 | | For the Year Ended September 30, 2018 |
| | Recorded
Investment | | Unpaid Principal
Balance (Loan
Balance Plus
Charge Off) | | Related
Allowance | | Average
Recorded
Investment | | Interest
Income
Recognized | | Cash Basis
Interest
Income
Recognized |
| With no related allowance recorded: | | | | | | | | | | | |
| Mortgage loans: | | | | | | | | | | | |
| One- to four-family | $ | 1,054 |
| | $ | 1,200 |
| | $ | — |
| | $ | 1,422 |
| | $ | 80 |
| | $ | 69 |
|
| Commercial | 2,446 |
| | 2,446 |
| | — |
| | 2,389 |
| | 121 |
| | 93 |
|
| Land | 90 |
| | 195 |
| | — |
| | 283 |
| | 11 |
| | 10 |
|
| Consumer loans: | | | |
| | | | |
| | |
| | |
|
| Home equity and second mortgage | 359 |
| | 359 |
| | — |
| | 210 |
| | 3 |
| | 3 |
|
Subtotal | 3,949 |
| | 4,200 |
| | — |
| | 4,304 |
| | 215 |
| | 175 |
|
| With an allowance recorded: | |
| | |
| | |
| | |
| | |
| | |
|
| Mortgage loans: | |
| | |
| | |
| | |
| | |
| | |
|
| One- to four-family | — |
| | — |
| | — |
| | 9 |
| | — |
| | — |
|
| Commercial | — |
| | — |
| | — |
| | 760 |
| | 28 |
| | 21 |
|
| Land | 153 |
| | 153 |
| | 34 |
| | 383 |
| | 9 |
| | 8 |
|
| Consumer loans: | |
| | |
| | |
| | |
| | |
| | |
|
| Home equity and second mortgage | — |
| | — |
| | — |
| | 310 |
| | 16 |
| | 13 |
|
| Commercial business loans | 170 |
| | 170 |
| | 63 |
| | 141 |
| | — |
| | — |
|
Subtotal | 323 |
| | 323 |
| | 97 |
| | 1,603 |
| | 53 |
| | 42 |
|
| Total: | |
| | |
| | |
| | |
| | |
| | |
|
| Mortgage loans: | |
| | |
| | |
| | |
| | |
| | |
|
| One- to four-family | 1,054 |
| | 1,200 |
| | — |
| | 1,431 |
| | 80 |
| | 69 |
|
| Commercial | 2,446 |
| | 2,446 |
| | — |
| | 3,149 |
| | 149 |
| | 114 |
|
| Land | 243 |
| | 348 |
| | 34 |
| | 666 |
| | 20 |
| | 18 |
|
| Consumer loans: | |
| | |
| | | | |
| | |
| | |
|
| Home equity and second mortgage | 359 |
| | 359 |
| | — |
| | 520 |
| | 19 |
| | 16 |
|
| Commercial business loans | 170 |
| | 170 |
| | 63 |
| | 141 |
| | — |
| | — |
|
Total | $ | 4,272 |
| | $ | 4,523 |
| | $ | 97 |
| | $ | 5,907 |
| | $ | 268 |
| | $ | 217 |
|
| | | | | | | | | | | | | | | | | | | | |
| COVID-19 Loan Modifications | | | | | | |
| Mortgage loans | | Number | | Balance | | Percent |
| One- to four-family | | 1 | | $ | 323 | | | 100.0 | % |
| | | | | | |
| | | | | | |
| | | | | | |
| | | | | | |
| | | | | | |
| | | | | | |
| | | | | | |
| | | | | | |
| | | | | | |
| | | | | | |
| | | | | | |
| | | | | | |
| Total COVID-19 modifications | | 1 | | $ | 323 | | | 100.0 | % |
Notes to Consolidated Financial Statements_________________________________________________________________
Timberland Bancorp, Inc. and Subsidiary
September 30, 2019 and 2018
The following table is a summary of information related to impaired loans by portfolio segmentdetails the COVID-19 loan modifications on deferral status as of and for the year ended September 30, 20172020 (dollars in thousands): |
| | | | | | | | | | | | | | | | | | | | | | | |
| | September 30, 2017 | | For the Year Ended September 30, 2017 |
| | Recorded
Investment | | Unpaid Principal
Balance (Loan
Balance Plus
Charge Off) | | Related
Allowance | | Average
Recorded
Investment | | Interest
Income
Recognized | | Cash Basis
Interest
Income
Recognized |
| With no related allowance recorded: | | | | | | | | | | | |
| Mortgage loans: | | | | | | | | | | | |
| One- to four-family | $ | 1,443 |
| | $ | 1,589 |
| | $ | — |
| | $ | 1,108 |
| | $ | 68 |
| | $ | 62 |
|
| Commercial | 1,967 |
| | 1,967 |
| | — |
| | 3,901 |
| | 188 |
| | 143 |
|
| Construction – custom and owner / builder | — |
| | — |
| | — |
| | 147 |
| | 7 |
| | 7 |
|
| Land | 297 |
| | 410 |
| | — |
| | 512 |
| | 8 |
| | 6 |
|
| Consumer loans: | | | |
| | | | |
| | |
| | |
|
| Home equity and second mortgage | 123 |
| | 123 |
| | — |
| | 284 |
| | — |
| | — |
|
| Commercial business loans | — |
| | — |
| | — |
| | 11 |
| | — |
| | — |
|
Subtotal | 3,830 |
| | 4,089 |
| | — |
| | 5,963 |
| | 271 |
| | 218 |
|
| With an allowance recorded: | |
| | |
| | |
| | |
| | |
| | |
|
| Mortgage loans: | |
| | |
| | |
| | |
| | |
| | |
|
| One- to four-family | — |
| | — |
| | — |
| | 721 |
| | 50 |
| | 38 |
|
| Commercial | 1,906 |
| | 1,906 |
| | 26 |
| | 3,326 |
| | 182 |
| | 144 |
|
| Land | 822 |
| | 881 |
| | 125 |
| | 666 |
| | 35 |
| | 29 |
|
| Consumer loans: | |
| | |
| | |
| | |
| | |
| | |
|
| Home equity and second mortgage | 434 |
| | 434 |
| | 325 |
| | 530 |
| | 29 |
| | 26 |
|
| Other | — |
| | — |
| | — |
| | 17 |
| | — |
| | — |
|
Subtotal | 3,162 |
| | 3,221 |
| | 476 |
| | 5,260 |
| | 296 |
| | 237 |
|
| Total: | |
| | |
| | |
| | |
| | |
| | |
|
| Mortgage loans: | |
| | |
| | |
| | |
| | |
| | |
|
| One- to four-family | 1,443 |
| | 1,589 |
| | — |
| | 1,829 |
| | 118 |
| | 100 |
|
| Commercial | 3,873 |
| | 3,873 |
| | 26 |
| | 7,227 |
| | 370 |
| | 287 |
|
| Construction – custom and owner / builder | — |
| | — |
| | — |
| | 147 |
| | 7 |
| | 7 |
|
| Land | 1,119 |
| | 1,291 |
| | 125 |
| | 1,178 |
| | 43 |
| | 35 |
|
| Consumer loans: | |
| | |
| | |
| | |
| | |
| | |
|
| Home equity and second mortgage | 557 |
| | 557 |
| | 325 |
| | 814 |
| | 29 |
| | 26 |
|
| Other | — |
| | — |
| | — |
| | 17 |
| | — |
| | — |
|
| Commercial business loans | — |
| | — |
| | — |
| | 11 |
| | — |
| | — |
|
Total | $ | 6,992 |
| | $ | 7,310 |
| | $ | 476 |
| | $ | 11,223 |
| | $ | 567 |
| | $ | 455 |
|
Notes to Consolidated Financial Statements_________________________________________________________________ | | | | | | | | | | | | | | | | | | | | |
| COVID-19 Loan Modifications | | | | | | |
| Mortgage loans | | Number | | Balance | | Percent |
| One- to four-family | | 1 | | $ | 467 | | | 8.0 | % |
| | | | | | |
| Commercial | | 2 | | 3,951 | | | 67.2 | |
| Construction | | 1 | | 1,402 | | | 23.9 | |
| | | | | | |
| Total mortgage loans | | 4 | | 5,820 | | | 99.1 | |
| | | | | | |
| Consumer loans | | | | | | |
| Home equity and second mortgage | | 1 | | 50 | | 0.9 | |
| | | | | | |
| Total consumer loans | | 1 | | 50 | | 0.9 | |
| | | | | | |
| | | | | | |
| Total COVID-19 Modifications | | 5 | | $ | 5,870 | | | 100.0 | % |
Timberland Bancorp, Inc. and Subsidiary
September 30, 2019 and 2018
The Company had $3,269,000$2,553,000 in TDRs included in impaired loans at September 30, 20192021 and had no commitments to lend additional funds on these loans. The Company had $3,278,000$3,071,000 in TDRs included in impaired loans at September 30, 20182020 and had no commitments to lend additional funds on these loans. None of the allowance for loan losses was allocated to TDRs at September 30, 2021. The allowance for loan losses allocated to TDRs at September 30, 2019 and 20182020 was $56,000 and $97,000, respectively.$3,000.
The following tables set forth information with respect to the Company’s TDRs by interest accrual status as of September 30, 20192021 and 20182020 (dollars in thousands): | | | | | | | | | | | | | | | | | |
| | 2021 |
| | Accruing | | Non-Accrual | | Total |
| Mortgage loans: | | | | | |
| | | | | |
| | | | | |
| Commercial | $ | 2,371 | | | $ | — | | | $ | 2,371 | |
| Land | — | | | 119 | | | 119 | |
| Consumer loans: | | | | | |
| Home equity and second mortgage | — | | | 63 | | | 63 | |
| | | | | |
Total | $ | 2,371 | | | $ | 182 | | | $ | 2,553 | |
| | | | | | | | |
| Notes to Consolidated Financial Statements | |
Timberland Bancorp, Inc. and Subsidiary
September 30, 2021 and 2020
|
| | | | | | | | | | | |
| | 2019 |
| | Accruing | | Non- Accrual | | Total |
| Mortgage loans: | | | | | |
| One- to four-family | $ | 493 |
| | $ | 141 |
| | $ | 634 |
|
| Commercial | 2,410 |
| | — |
| | 2,410 |
|
| Consumer loans: | |
| | |
| | |
|
| Home equity and second mortgage | — |
| | 82 |
| | 82 |
|
| Commercial business loans | — |
| | 143 |
| | 143 |
|
Total | $ | 2,903 |
| | $ | 366 |
| | $ | 3,269 |
|
| | | | | | | | | | | | | | | | | |
| | 2020 |
| | Accruing | | Non-Accrual | | Total |
| Mortgage loans: | | | | | |
| One- to four-family | $ | 483 | | | $ | — | | | $ | 483 | |
| | | | | |
| Commercial | 2,385 | | | — | | | 2,385 | |
| | | | | |
| | | | | |
| Land | — | | | 130 | | | 130 | |
| Consumer loans: | | | | | |
| Home equity and second mortgage | — | | | 73 | | | 73 | |
| | | | | |
Total | $ | 2,868 | | | $ | 203 | | | $ | 3,071 | |
|
| | | | | | | | | | | |
| | 2018 |
| | Accruing | | Non- Accrual | | Total |
| Mortgage loans: | | | | | |
| One- to four-family | $ | 509 |
| | $ | — |
| | $ | 509 |
|
| Commercial | 2,446 |
| | — |
| | 2,446 |
|
| Land | — |
| | 153 |
| | 153 |
|
| Commercial business loans | — |
| | 170 |
| | 170 |
|
Total | $ | 2,955 |
| | $ | 323 |
| | $ | 3,278 |
|
There were no new TDRs recognized during the years ended September 30, 2021 and 2020. There was one new TDR during the year ended September 30, 2019. There were three new TDRs during the year ended September 30, 2018. There were no new TDRs during the year ended September 30, 2017. The following table sets forth information with respect to the Company's TDRs, by portfolio segment, added during the yearsyear ended September 30, 2019 and 2018 (dollars in thousands):2019:
|
| | | | | | | | | | | | | |
| 2019 | Number of Contracts | | Pre-Modification Outstanding Recorded Investment | | Post- Modification Outstanding Recorded Investment | | End of Period Balance |
| Home equity and second mortgage loan (1) | 1 | | $ | 85 |
| | $ | 85 |
| | $ | 82 |
|
| Total | 1 | | $ | 85 |
| | $ | 85 |
| | $ | 82 |
|
| | | | | | | | |
| 2018 | | | | | | | |
| Land loans (2) | 1 | | $ | 244 |
| | $ | 155 |
| | $ | 153 |
|
| Commercial business loans (1) | 2 | | 183 |
| | 183 |
| | 170 |
|
| Total | 3 | | $ | 427 |
| | $ | 338 |
| | $ | 323 |
|
| |
| |
|
| |
|
| |
|
|
| (1) Modifications were a result of reduction in interest rates or monthly payment amounts. | | | | |
| (2) Modification was a result of a reduction in principal balance. | | | | | | |
| | | | | | | | | | | | | | | | | | | | | | | |
| 2019 | Number of
Contracts | | Pre-Modification
Outstanding
Recorded
Investment | | Post- Modification
Outstanding
Recorded
Investment | | End of
Period
Balance |
| Home equity and second mortgage loans (1) | 1 | | $ | 85 | | | $ | 85 | | | $ | 82 | |
| | | | | | | |
| Total | 1 | | $ | 85 | | | $ | 85 | | | $ | 82 | |
| | | | | | | |
There were no TDRs for which there was a payment default within the first 12 months of modification during the years ended September 30, 2019, 20182021, 2020 or 2017.2019.
Notes to Consolidated Financial Statements_________________________________________________________________
Timberland Bancorp, Inc. and Subsidiary
September 30, 2019 and 2018
Note 6 - Premises and Equipment
Premises and equipment consisted of the following at September 30, 20192021 and 20182020 (dollars in thousands):
| | | | | | | | | | | |
| | 2021 | | 2020 |
| Land | $ | 5,404 | | | $ | 5,404 | |
| Buildings and improvements | 24,718 | | | 24,636 | |
| Furniture and equipment | 10,307 | | | 9,978 | |
| Property held for future expansion | 129 | | | 129 | |
| Construction and purchases in progress | 225 | | | 138 | |
| | 40,783 | | | 40,285 | |
| Less accumulated depreciation | 18,416 | | | 17,250 | |
| Premises and equipment, net | $ | 22,367 | | | $ | 23,035 | |
|
| | | | | | | |
| | 2019 |
| | 2018 |
|
| Land | $ | 5,404 |
| | $ | 4,400 |
|
| Buildings and improvements | 23,847 |
| | 20,636 |
|
| Furniture and equipment | 9,012 |
| | 8,026 |
|
| Property held for future expansion | 334 |
| | 129 |
|
| Construction and purchases in progress | 338 |
| | 566 |
|
| | 38,935 |
| | 33,757 |
|
| Less accumulated depreciation | 16,105 |
| | 14,804 |
|
| Premises and equipment, net | $ | 22,830 |
| | $ | 18,953 |
|
| | | | | | | | |
| Notes to Consolidated Financial Statements | |
The Company leases certain premises under operating lease agreements. Certain leases contain renewal options from five to ten yearsTimberland Bancorp, Inc. and escalation clauses. Total rental expense was $332,000, $206,000 and $275,000 for the years ended Subsidiary
September 30, 2019, 20182021 and 2017, respectively, which is included in premises and equipment expense in the accompanying consolidated statements of income.2020
Minimum net rental commitments under non-cancellable leases having an original or remaining term of more than one year for fiscal years ending subsequent to September 30, 2019 are as follows (dollars in thousands):
|
| | | |
| 2020 | $ | 315 |
|
| 2021 | 229 |
|
| 2022 | 35 |
|
| Total minimum payments required | $ | 579 |
|
Note 7 – OREO and Other Repossessed Assets
The following table presents the activity related to OREO and other repossessed assets for the years ended September 30, 20192021 and 20182020 (dollars in thousands):
| | | | | | | | | | | | | | | | | | | | | | | |
| 2021 | | 2020 |
| | Amount | | Number | |
Amount | | Number |
| Balance, beginning of year | $ | 1,050 | | | 6 | | | $ | 1,683 | | | 12 | |
| | | | | | | |
| | | | | | | |
| | | | | | | |
| Writedowns | — | | | — | | | (173) | | | — | |
| Sales | (893) | | | (3) | | | (460) | | | (6) | |
| Balance, end of year | $ | 157 | | | 3 | | | $ | 1,050 | | | 6 | |
|
| | | | | | | | | | | | | |
| | 2019 | | 2018 |
| | Amount |
| | Number |
| |
Amount |
| | Number |
|
| Balance, beginning of year | $ | 1,913 |
| | 12 |
| | $ | 3,301 |
| | 16 |
|
| Addition due to South Sound Acquisition | 25 |
| | 1 |
| | — |
| | — |
|
| Other additions | 293 |
| | 2 |
| | 324 |
| | 2 |
|
| Writedowns | (24 | ) | | — |
| | (248 | ) | | — |
|
| Sales | (524 | ) | | (3 | ) | | (1,464 | ) | | (6 | ) |
| Balance, end of year | $ | 1,683 |
| | 12 |
| | $ | 1,913 |
| | 12 |
|
At both September 30, 20192021 and 2018,2020, OREO and other repossessed assets consisted of 12 OREO properties in Washington, with balances ranging from $13,000 to $874,000.Washington. The Company recorded net gains on sales of OREO and other repossessed assets of $89,000, $229,000,$92,000, $35,000, and $54,000$89,000 for the years ended September 30, 2019, 20182021, 2020 and 2017,2019, respectively. Gains and losses on sales of OREO and other repossessed assets are recorded in the OREO and other repossessed assets, net category in non-interest expense in the accompanying consolidated statements of income.
At September 30, 2019,2021, there were no foreclosed residential real estate properties held in OREO as a result of obtaining physical possession, and the amount ofthere was 1 one- to four-family propertiesproperty with a balance of $30,000 in the process of foreclosure totaled $150,000.foreclosure. At September 30, 2018,2020, there were no foreclosed residential real estate properties held in OREO as a result of obtaining physical possession, and there were no one- to four-family properties in the process of foreclosure.
Notes to Consolidated Financial Statements_________________________________________________________________
Timberland Bancorp, Inc. and Subsidiary
September 30, 2019 and 2018
Note 8 - Goodwill and CDI
Goodwill
The following table presents the change in the recorded amount of goodwill for the year ended September 30, 2019 (dollars in thousands). There were no changes to the recorded amount of goodwill for theboth years ended September 30, 20182021 and 2017.2020.
|
| | | |
| Balance, beginning of year | $ | 5,650 |
|
| Addition as a result of the South Sound Acquisition (see Note 2) | 9,481 |
|
| Balance, end of year | $ | 15,131 |
|
CDI
During the year ended September 30, 2019, the Company recorded a CDI of $2,483,000 in connection with the South Sound Acquisition. The net unamortized CDI totaled $2,031,000 at September 30, 2019. The CDI amortization expense totaled $361,000, $406,000 and $452,000 for the yearyears ended September 30, 2019.2021, 2020 and 2019, respectively.
Amortization expense for the CDI for fiscal years ending subsequent to September 30, 20192021 is estimated to be as follows (dollars in thousands):
| | | | | |
| 2022 | $ | 316 | |
| 2023 | 271 | |
| 2024 | 226 | |
| 2025 | 181 | |
| 2026 | 135 | |
| Thereafter | 135 | |
| Total | $ | 1,264 | |
|
| | | |
| 2020 | $ | 406 |
|
| 2021 | 361 |
|
| 2022 | 316 |
|
| 2023 | 271 |
|
| 2024 | 226 |
|
| Thereafter | 451 |
|
| Total | $ | 2,031 |
|
Note 9 - Loan Servicing Rights
The Company services one- to four-family mortgage loans for Freddie Mac and also provides servicing for secondary market purchasers of the guaranteed portion of SBA loans; such loans are not included in the accompanying consolidated balance sheets. The principal amount of loans serviced for Freddie Mac at September 30, 2021, 2020 and 2019 2018was $419,675,000,
| | | | | | | | |
| Notes to Consolidated Financial Statements | |
Timberland Bancorp, Inc. and 2017 wasSubsidiary
September 30, 2021 and 2020
$418,559,000 and $386,357,000, $370,928,000 and $358,173,000, respectively. The guaranteed principal amount of SBA loans serviced for others at September 30, 2021, 2020 and 2019 2018was $6,761,000, $8,022,000 and 2017 was $12,765,000, $754,000 and $697,000, respectively.
The following is an analysis of the changes in Freddie Mac loan servicing rights for the years ended September 30, 2019, 20182021, 2020 and 20172019 (dollars in thousands):
| | | | | | | | | | | | | | | | | |
| | 2021 | | 2020 | | 2019 |
| Balance, beginning of year | $ | 2,980 | | | $ | 2,206 | | | $ | 2,022 | |
| Additions | 1,388 | | | 1,733 | | | 747 | |
| Amortization | (1,022) | | | (748) | | | (563) | |
| Valuation recovery (allowance) | 92 | | | (211) | | | — | |
| | | | | |
| Balance, end of year | $ | 3,438 | | | $ | 2,980 | | | $ | 2,206 | |
|
| | | | | | | | | | | |
| | 2019 |
| | 2018 |
| | 2017 |
|
| Balance, beginning of year | $ | 2,022 |
| | $ | 1,823 |
| | $ | 1,570 |
|
| Additions | 747 |
| | 687 |
| | 739 |
|
| Amortization | (563 | ) | | (488 | ) | | (486 | ) |
| Balance, end of year | $ | 2,206 |
| | $ | 2,022 |
| | $ | 1,823 |
|
At September 30, 2019, 20182021, 2020 and 2017,2019, the estimated fair value of Freddie Mac servicing rights totaled $3,694,000, $4,171,000$3,656,000, $3,120,000 and $3,556,000,$3,694,000, respectively. The Freddie Mac servicing rights' fair values at September 30, 2019, 20182021, 2020 and 20172019 were estimated using discounted cash flow analyses with an average discount rates of 9.00% for all years, 8.99% and 9.52%, respectively, and average conditional prepayment rates of 12.71%, 14.42% and 11.31%, 8.10% and 9.90%, respectively.respectively. At September 30, 2021, there was a valuation allowance of $119,000. At September 30, 2020, there was a valuation allowance of $211,000. At September 30, 2019, 2018 and 2017, there werewas no valuation allowancesallowance on the Freddie Mac servicing rights.
Notes to Consolidated Financial Statements_________________________________________________________________
Timberland Bancorp, Inc. and Subsidiary
September 30, 2019 and 2018
The following is an analysis of the changes in SBA loan servicing rights for the years ended September 30, 2019, 20182021, 2020 and 20172019 (dollars in thousands):
| | | | | | | | | | | | | | | | | |
| 2021 | | 2020 | | 2019 |
| Balance, beginning of year | $ | 115 | | | $ | 202 | | | $ | 6 | |
| Additions due to South Sound Acquisition | — | | | — | | | 285 | |
| Other additions | — | | | 13 | | | 2 | |
| Amortization | (89) | | | (90) | | | (83) | |
| Valuation allowance - South Sound Acquisition | — | | | — | | | (4) | |
| Valuation recovery (allowance) | 18 | | | (10) | | | (4) | |
| | | | | |
| Balance, end of year | $ | 44 | | | $ | 115 | | | $ | 202 | |
|
| | | | | | | | | | | |
| | 2019 |
| | 2018 |
| | 2017 |
|
| Balance, beginning of year | $ | 6 |
| | $ | 2 |
| | $ | 3 |
|
| Additions due to South Sound Acquisition | 281 |
| | — |
| | — |
|
| Other additions | 2 |
| | 7 |
| | — |
|
| Amortization | (83 | ) | | (3 | ) | | (1 | ) |
| Valuation allowance | (4 | ) | | — |
| | — |
|
| Balance, end of year | $ | 202 |
| | $ | 6 |
| | $ | 2 |
|
At September 30, 2021, 2020 and 2019, the estimated fair value of SBA servicing rights totaled $202,000.$99,000, $115,000 and $202,000, respectively. The SBA servicing rights' fair values at September 30, 2021, 2020 and 2019 were estimated using discounted cash flow analyses with an average discount ratesrate of 15.00% for all years and average conditional prepayment rates of 17.85%, 16.29% and 16.13%., respectively. At September 30, 2021, 2020 and 2019, there was a $4,000were valuation allowanceallowances of $0, $18,000 and $8,000, respectively, on SBA servicing rights. At September 30, 2018 and 2017 the SBA servicing rights were insignificant.
Note 10 - Leases
The Company adopted ASC 842 on October 1, 2019 and began recording operating lease liabilities and operating lease ROU assets in the consolidated balance sheets. The Company has operating leases for three retail bank branch offices. The ROU assets totaled $2.89 million at October 1, 2019. The Company's leases have remaining lease terms of ten months to ten years, some of which include options to extend the leases for up to five years. Lease extensions are not certain and the Company evaluates each lease based on the specific circumstances for the location to determine the probability of exercising the extensions in the calculation of ROU.
| | | | | | | | |
| Notes to Consolidated Financial Statements | |
Timberland Bancorp, Inc. and Subsidiary
September 30, 2021 and 2020
The components of lease cost (included in the premises and equipment expense category in the consolidated statements of income) are as follows for the years ended September 30, 2021 and 2020 (dollars in thousands):
| | | | | | | | | | | |
| Lease cost: | 2021 | | 2020 |
| Operating lease cost | $ | 395 | | | $ | 377 | |
| Short-term lease cost | — | | | — | |
| Total lease cost | $ | 395 | | | $ | 377 | |
Lease expense was $322,000 for the year ended September 30, 2019.
The following table provides supplemental information related to operating leases at or for the years ended September 30, 2021 and 2020 (dollars in thousands):
| | | | | | | | | | | | | | | | | |
| 2021 | | | 2020 | |
| Cash paid for amounts included in the measurement of lease liabilities: | | | | | |
| Operating cash flows from operating leases | $ | 327 | | | | $ | 318 | | |
| Weighted average remaining lease term-operating leases | 8.44 | years | | 9.24 | years |
| Weighted average discount rate-operating leases | 2.24 | % | | | 2.22 | % | |
The Company's leases typically do not contain a discount rate implicit in the lease contract. As an alternative, the weighted average discount rate used to estimate the present value of future lease payments in calculating the value of the ROU asset. The lease liability was determined by utilizing the September 30, 2019 fixed-rate advances issued by the FHLB, for all leases entered into prior to October 1, 2019.
Maturities of operating lease liabilities at September 30, 2021 for fiscal years ended subsequent to September 30, 2021 are as follows (dollars in thousands):
| | | | | | | | |
| 2022 | | $ | 342 | |
| 2023 | | 310 | |
| 2024 | | 313 | |
| 2025 | | 317 | |
| 2026 | | 284 | |
| Thereafter | | 1,038 | |
| Total lease payments | | 2,604 | |
| Less imputed interest | | 245 | |
| Total | | $ | 2,359 | |
Note 11 - Deposits
Deposits consisted of the following at September 30, 20192021 and 20182020 (dollars in thousands):
| | | | | | | | | | | |
| | 2021 | | 2020 |
| Non-interest-bearing demand | $ | 535,212 | | | $ | 441,889 | |
| NOW checking | 430,097 | | | 376,899 | |
| Savings | 260,689 | | | 219,869 | |
| Money market | 210,428 | | | 161,225 | |
| Certificates of deposit | 134,129 | | | 158,524 | |
| Total | $ | 1,570,555 | | | $ | 1,358,406 | |
|
| | | | | | | |
| | 2019 |
| | 2018 |
|
| Non-interest-bearing demand | $ | 296,472 |
| | $ | 233,258 |
|
| NOW checking | 297,055 |
| | 225,290 |
|
| Savings | 164,506 |
| | 151,404 |
|
| Money market | 144,539 |
| | 137,746 |
|
| Certificates of deposit | 165,655 |
| | 141,808 |
|
| Total | $ | 1,068,227 |
| | $ | 889,506 |
|
| | | | | | | | |
| Notes to Consolidated Financial Statements | |
Timberland Bancorp, Inc. and Subsidiary
September 30, 2021 and 2020
Individual certificates of deposit in amounts of $250,000 or greater totaled $29,211,000$21,781,000 and $18,164,000$28,945,000 at September 30, 20192021 and 2018,2020, respectively. The Company had brokered deposits totaling $19,327,000$11,383,000 and $17,202,000$11,303,000 at September 30, 20192021 and 2018,2020, respectively.
Scheduled maturities of certificates of deposit for fiscal years ending subsequent to September 30, 20192021 are as follows (dollars in thousands):
| | | | | |
| 2022 | $ | 81,422 | |
| 2023 | 26,441 | |
| 2024 | 10,420 | |
| 2025 | 9,034 | |
| 2026 | 6,812 | |
| |
| Total | $ | 134,129 | |
|
| | | |
| 2020 | $ | 92,266 |
|
| 2021 | 38,724 |
|
| 2022 | 17,746 |
|
| 2023 | 8,113 |
|
| 2024 | 8,806 |
|
| Total | $ | 165,655 |
|
Interest expense on deposits by account type was as follows for the years ended September 30, 2019, 20182021, 2020 and 20172019 (dollars in thousands):
| | | | | | | | | | | | | | | | | |
| | 2021 | | 2020 | | 2019 |
| NOW checking | $ | 605 | | | $ | 882 | | | $ | 840 | |
| Savings | 201 | | | 188 | | | 106 | |
| Money market | 560 | | | 735 | | | 1,119 | |
| Certificates of deposit | 1,647 | | | 2,830 | | | 2,500 | |
| Total | $ | 3,013 | | | $ | 4,635 | | | $ | 4,565 | |
|
| | | | | | | | | | | |
| | 2019 |
| | 2018 |
| | 2017 |
|
| NOW checking | $ | 840 |
| | $ | 451 |
| | $ | 460 |
|
| Savings | 106 |
| | 85 |
| | 78 |
|
| Money market | 1,119 |
| | 722 |
| | 434 |
|
| Certificates of deposit | 2,500 |
| | 1,520 |
| | 1,246 |
|
| Total | $ | 4,565 |
| | $ | 2,778 |
| | $ | 2,218 |
|
Notes to Consolidated Financial Statements_________________________________________________________________
Timberland Bancorp, Inc. and Subsidiary
September 30, 2019 and 2018
Note 1112 – FHLB Borrowings and Other Borrowings
The Bank has long- and short-term borrowing lines with the FHLB with total credit on the lines equal to 45% of the Bank’s total assets, limited by available collateral. The Bank had noa single $5,000,000 long-term FHLB borrowing outstanding at September 30, 2021, with scheduled maturity in March 2025, and which bears interest at 1.19%. The Bank had $10,000,000 in FHLB borrowings outstanding at both September 30, 2019 and 2018.2020. Under the Advances, Pledge and Security Agreement entered into with the FHLB ("FHLB Borrowing Agreement"), virtually all of the Bank’s assets, not otherwise encumbered, are pledged as collateral for borrowings.
The Bank also has a letter of credit ("LOC") with the FHLB for the purpose of collateralizing Washington State public deposits. The LOC amount reduces the Bank's available borrowings under the FHLB Borrowing Agreement. The LOC had a limit of $23,000,000 as of September 30, 2019, all of which was available to draw upon.
The Bank also maintains a short-term borrowing line with the FRB with total credit based on eligible collateral. At September 30, 20192021, the Bank had a borrowing capacity on this line of $84,356,000.$73,809,000. The Bank had no outstanding borrowings on this line at both September 30, 20192021 and 2018.2020.
The Bank has a short-term $10,000,000$50,000,000 overnight borrowing line with Pacific Coast Bankers' Bank. The borrowing line may be reduced or withdrawn at any time. The Bank had no outstanding borrowings on this line at both September 30, 20192021 and 2018.2020.
Note 1213 - Other Liabilities and Accrued Expenses
Other liabilities and accrued expenses were comprised of the following at September 30, 20192021 and 20182020 (dollars in thousands):
| | | | | | | | | | | |
| | 2021 | | 2020 |
| Accrued deferred compensation, profit sharing plans and bonuses payable | $ | 3,074 | | | $ | 3,110 | |
| Accrued interest payable on deposits | 134 | | | 274 | |
| Accounts payable and accrued expenses - other | 4,159 | | | 3,928 | |
| Total other liabilities and accrued expenses | $ | 7,367 | | | $ | 7,312 | |
|
| | | | | | | |
| | 2019 |
| | 2018 |
|
| Accrued deferred compensation, profit sharing plans and bonuses payable | $ | 3,131 |
| | $ | 1,235 |
|
| Accrued interest payable on deposits | 333 |
| | 225 |
|
| Accounts payable and accrued expenses - other | 4,374 |
| | 2,667 |
|
| Total other liabilities and accrued expenses | $ | 7,838 |
| | $ | 4,127 |
|
| | | | | | | | |
| Notes to Consolidated Financial Statements | |
Timberland Bancorp, Inc. and Subsidiary
September 30, 2021 and 2020
Note 1314 - Income Taxes
On December 22, 2017, the federal government enacted the Tax Cuts and Jobs Act (the "Tax Act"). The Tax Act significantly revised the future ongoing federal corporate income tax by, among other things, decreasing the federal corporate income tax rate to 21.0% from 35.0% effective January 1, 2018. As the Company has a September 30 fiscal year-end, the lower corporate income tax rate was phased in, resulting in a blended federal income tax rate of approximately 24.5% for the Company's fiscal year ended September 30, 2018, and 21.0% for subsequent fiscal years. In addition, the reduction of the corporate federal income tax rate required the Company to revalue its deferred tax assets and liabilities based on the lower federal income tax rate of 21.0%.
As a result of the Tax Act, during the year ended September 30, 2018, the Company recorded a one-time income tax expense of $548,000 in conjunction with remeasuring its net deferred tax assets. The impact of using the 24.5% blended federal income tax rate for the year ended September 30, 2018 versus a 35.0% rate reduced the provision for income taxes by approximately $2.21 million, which was partially offset by the $548,000 one-time net deferred tax asset remeasurement.
The components of the provision for income taxes for the years ended September 30, 2019, 20182021, 2020 and 20172019 were as follows (dollars in thousands):
| | | | | | | | | | | | | | | | | |
| | 2021 | | 2020 | | 2019 |
| Current: | | | | | |
| Federal | $ | 6,570 | | | $ | 5,962 | | | $ | 5,198 | |
| | | | | |
| Deferred | 275 | | | 76 | | | 703 | |
| Provision for income taxes | $ | 6,845 | | | $ | 6,038 | | | $ | 5,901 | |
|
| | | | | | | | | | | |
| | 2019 |
| | 2018 |
| | 2017 |
|
| Current: | | | | | |
| Federal | $ | 5,198 |
| | $ | 4,900 |
| | $ | 6,656 |
|
| State | — |
| | 4 |
| | 35 |
|
| Deferred | 703 |
| | 797 |
| | 385 |
|
| Provision for income taxes | $ | 5,901 |
| | $ | 5,701 |
| | $ | 7,076 |
|
Notes to Consolidated Financial Statements_________________________________________________________________
Timberland Bancorp, Inc. and Subsidiary
September 30, 2019 and 2018
At September 30, 20192021, the Company had income taxes payable of $42,000, which is included in other liabilities in the accompanying 2021 consolidated balance sheet. At September 30, 2020, the Company had income taxes receivable of $1,210,000,$781,000, which is included in other assets in the accompanying 2019 consolidated balance sheet. At September 30, 2018 the Company had income taxes payable of $151,000, which is included in other liabilities in the accompanying 20182020 consolidated balance sheet.
The components of the Company’s deferred tax assets and liabilities at September 30, 20192021 and 20182020 were as follows (dollars in thousands):
| | | | | | | | | | | |
| | 2021 | | 2020 |
| Deferred Tax Assets | | | |
| Allowance for loan losses | $ | 2,613 | | | $ | 2,440 | |
| Allowance for OREO losses | 42 | | | 171 | |
| | | |
| | | |
| OTTI credit impairment on investment securities | 64 | | | 64 | |
| | | |
| | | |
| Accrued interest on loans | 75 | | | 8 | |
| | | |
| Deferred compensation and bonuses | 301 | | | 372 | |
| Reserve for loan commitments | 76 | | | 81 | |
| Operating lease liabilities | 495 | | | 552 | |
| Other | 46 | | | 69 | |
| Total deferred tax assets | 3,712 | | | 3,757 | |
|
| | | | | | | |
| | 2019 |
| | 2018 |
|
| Deferred Tax Assets | | | |
| Allowance for loan losses | $ | 1,550 |
| | $ | 2,021 |
|
| Allowance for OREO losses | 218 |
| | 311 |
|
| Unearned ESOP shares | — |
| | 32 |
|
| Core deposit intangible | — |
| | 31 |
|
| OTTI credit impairment on investment securities | 97 |
| | 104 |
|
| Accrued interest on loans | 76 |
| | 10 |
|
| Net unrealized losses on investment securities | — |
| | 42 |
|
| Deferred compensation and bonuses | 520 |
| | 56 |
|
| Reserve for loan commitments | 51 |
| | 43 |
|
| Other | 82 |
| | 29 |
|
| Total deferred tax assets | 2,594 |
| | 2,679 |
|
| | | | | | | | | | | |
| | | |
| Deferred Tax Liabilities | | | |
| Goodwill | 1,187 | | | 1,187 | |
| Loan servicing rights | 731 | | | 650 | |
| Depreciation | 787 | | | 778 | |
| Loan fees/costs | 584 | | | 428 | |
| FHLB stock dividends | 38 | | | 81 | |
| Prepaid expenses | 162 | | | 98 | |
| Purchase accounting adjustment | 233 | | | 207 | |
| Net unrealized gains on investment securities and investments in equity securities | 20 | | | 23 | |
| Operating lease ROU assets | 480 | | | 543 | |
| | | |
| Total deferred tax liabilities | 4,222 | | | 3,995 | |
| | | |
| | | |
| | | |
| Net deferred tax liabilities | $ | (510) | | | $ | (238) | |
Deferred tax liabilities are included in other liabilities in the accompanying consolidated balance sheets.
|
| | | | | | | |
| Deferred Tax Liabilities | | | |
| Goodwill | 1,187 |
| | 1,107 |
|
| Servicing rights | 506 |
| | 426 |
|
| Depreciation | 494 |
| | 283 |
|
| Loan fees/costs | 267 |
| | 121 |
|
| FHLB stock dividends | 82 |
| | 82 |
|
| Prepaid expenses | 70 |
| | 74 |
|
| Purchase accounting adjustment | 110 |
| | — |
|
| Net unrealized gains on investment securities and investments in equity securities | 15 |
| | — |
|
| Other | — |
| | 2 |
|
| Total deferred tax liabilities | 2,731 |
| | 2,095 |
|
| | | | |
| Net deferred tax assets (liabilities) | $ | (137 | ) | | $ | 584 |
|
| | | | | | | | |
| Notes to Consolidated Financial Statements | |
Timberland Bancorp, Inc. and Subsidiary
September 30, 2021 and 2020
The provision for income taxes for the years ended September 30, 2019, 20182021, 2020 and 20172019 differs from that computed at the federal statutory corporate tax rate as follows (dollars in thousands):
| | | | | | | | | | | | | | | | | |
| | 2021 | | 2020 | | 2019 |
| Expected federal income tax provision at statutory rate | $ | 7,230 | | | $ | 6,365 | | | $ | 6,283 | |
| | | | | |
| BOLI income | (125) | | | (124) | | | (345) | |
| | | | | |
| Dividends on ESOP | (88) | | | (75) | | | (73) | |
| Stock options tax effect | (167) | | | (33) | | | (87) | |
| Other, net | (5) | | | (95) | | | 123 | |
| Provision for income taxes | $ | 6,845 | | | $ | 6,038 | | | $ | 5,901 | |
|
| | | | | | | | | | | |
| | 2019 |
| | 2018 |
| | 2017 |
|
| Expected federal income tax provision at statutory rate | $ | 6,283 |
| | $ | 5,500 |
| | $ | 7,435 |
|
| Net impact of the Tax Act | — |
| | 548 |
| | — |
|
| BOLI income | (345 | ) | | (134 | ) | | (191 | ) |
| Dividends on ESOP | (73 | ) | | (71 | ) | | (102 | ) |
| Stock options tax effect | (87 | ) | | (157 | ) | | (188 | ) |
| Other, net | 123 |
| | 15 |
| | 122 |
|
| Provision for income taxes | $ | 5,901 |
| | $ | 5,701 |
| | $ | 7,076 |
|
No valuation allowance for deferred tax assets was recorded as of September 30, 20192021 and 2018,2020, as management believes that it is more likely than not that all of the deferred tax assets will be realized based on management's expectations of future taxable income.
Notes to Consolidated Financial Statements_________________________________________________________________
Timberland Bancorp, Inc. and Subsidiary
September 30, 2019 and 2018
Note 1415 - Employee Stock Ownership and 401(k) Plan
The Timberland Bank Employee Stock Ownership and 401(k) Plan (“KSOP”) is comprised of two2 components, the ESOP and the 401(k) Plan. The KSOP benefits employees with at least one year of service who are 18 years of age or older. The Bank may fund the ESOP with contributions of cash or stock, and may fund the 401(k) Plan with contributions of cash. Employee vesting occurs over six years.
ESOP
In January 1998, the ESOP borrowed $7,930,000 from the Company to purchase 1,058,000 shares of common stock of the Company. The loan was repaid primarily from the Bank’s contributions to the ESOP and was fully repaid by March 31, 2019. The interest rate on the loan was 8.5%. Interest expense on the ESOP debt was $9,000, $53,000 and $96,000 for the years ended September 30, 2019, 2018 and 2017, respectively.
The amount of the Bank's annual contribution is discretionary, except that it must behave been sufficient to enable the ESOP to service its debt. All dividends received by the ESOP were used to pay debt service through March 31, 2019. The dividends received after March 31, 2019 have been paid directly to participants. Dividends of $176,000 $291,000 and $293,000 were used to service the debt during the yearsyear ended September 30, 2019, 2018 and 2017, respectively.2019. As the Plan made each payment of principal and interest, an appropriate percentage of stock was released and allocated annually to eligible employee accounts, in accordance with applicable regulations.As of September 30, 2019,2021, an aggregate of 632,719660,374 ESOP shares, which were previously released for allocation to participants, had been distributed to participants.
SharesTotal shares held by the ESOP as of September 30, 2021, 2020 and 2019 2018were 397,626, 415,698 and 2017 were classified as follows:425,281, respectively.
|
| | | | | | | | |
| | 2019 |
| | 2018 |
| | 2017 |
|
| Unallocated shares | — |
| | 17,639 |
| | 52,905 |
|
| Shares released for allocation | 425,281 |
| | 451,644 |
| | 489,665 |
|
| Total ESOP shares | 425,281 |
| | 469,283 |
| | 542,570 |
|
The approximate fair market value of the ESOP’s unallocated shares at September 30, 2018 and 2017There was $551,000 and $1,658,000, respectively. Compensationno compensation expense recognized underfor the ESOP for the years ended September 30, 2021 and 2020. Compensation expense recognized for the ESOP for the year ended September 30, 2019 2018 and 2017 was $318,000, $823,000, and $495,000, respectively.$318,000.
401(k) Plan
Eligible employees may contribute a portion of their wages to the 401(k) Plan up to the maximum established under the Internal Revenue Code. Contributions by the Bank are at the discretion of the Board except for a safe harbor contribution of 3% of eligible employees' wages, which is mandatory according to the plan document. Bank contributions totaled $743,000, $379,000$931,000, $908,000 and $358,000$743,000 for the years ended September 30, 2021, 2020 and 2019, 2018 and 2017, respectively.
Note 1516 - Stock Compensation Plans
Under the Company’s 2003 Stock Option Plan, the Company was able to grant options for up to 300,000 shares of common stock to employees, officers, directors and directors emeriti. Under the Company's 2014 Equity Incentive Plan, the Company is able to grant options and awards of restricted stock (with or without performance measures) for up to 352,366 shares of common stock to employees, officers, directors and directors emeriti. Under the Company's 2019 Equity Incentive Plan the
| | | | | | | | |
| Notes to Consolidated Financial Statements | |
Timberland Bancorp, Inc. and Subsidiary
September 30, 2021 and 2020
Company is able to grant options and awards of restricted stock (with or without performance measures) for up to 350,000 shares of common stock, of which 300,000 shares are reserved to be awarded to employees and officers and 50,000 shares are reserved to be awarded to directors and directors emeriti. Shares issued may be purchased in the open market or may be issued from authorized and unissued shares. The exercise price of each option equals the fair market value of the Company’s common stock on the date of grant. Generally, options and restricted stock vest in 20% annual installments on each of the five anniversaries from the date of the grant, and options generally have a maximum contractual term of ten years from the date of the grant. At September 30, 2019,2021, there were 30,07617,926 shares of common stock available which may be awarded as options or restricted stock pursuant to future grants under the 2014 Equity Incentive Plan. At September 30, 2021, there were 231,000 shares of common stock available which may be awarded as options or restricted stock pursuant to future grants under the 2019 Equity Incentive Plan.
At both September 30, 20192021 and 2018,2020, there were no unvested restricted stock awards. There were no restricted stock grants awarded during the years ended September 30, 2019, 20182021, 2020 and 2017.2019.
Notes to Consolidated Financial Statements_________________________________________________________________
Timberland Bancorp, Inc. and Subsidiary
September 30, 2019 and 2018
Stock option activity for the years ended September 30, 2019, 20182021, 2020 and 20172019 is summarized as follows: | | | | | | | Number of
Shares | | Weighted Average
Exercise Price |
| | Number of
Shares |
| | Weighted Average
Exercise Price |
| |
| Outstanding September 30, 2016 | 373,130 |
| | $ | 9.82 |
| |
| Outstanding September 30, 2018 | | Outstanding September 30, 2018 | 380,820 | | | $ | 16.03 | |
| Options granted | 58,250 |
| | 29.69 |
| Options granted | 46,840 | | | 27.14 | |
| Options exercised | (46,310 | ) | | 7.17 |
| Options exercised | (43,856) | | | 9.14 | |
| Options forfeited | (4,950 | ) | | 6.28 |
| Options forfeited | (5,500) | | | 19.89 | |
| Outstanding September 30, 2017 | 380,120 |
| | 13.23 |
| |
| Outstanding September 30, 2019 | | Outstanding September 30, 2019 | 378,304 | | | 18.15 | |
| | | | | |
| Options granted | 45,950 |
| | 31.80 |
| Options granted | 69,150 | | | 17.01 | |
| Options exercised | (40,100 | ) | | 7.92 |
| Options exercised | (37,975) | | | 10.31 | |
| Options forfeited | (5,150 | ) | | 13.39 |
| Options forfeited | (14,130) | | | 25.36 | |
| Outstanding September 30, 2018 | 380,820 |
| | 16.03 |
| |
| Outstanding September 30, 2020 | | Outstanding September 30, 2020 | 395,349 | | | 18.45 | |
| | | | | |
| Options granted | 46,840 |
| | 27.14 |
| Options granted | 81,000 | | | 28.06 | |
| Options exercised | (43,856 | ) | | 9.14 |
| Options exercised | (64,264) | | | 9.81 | |
| Options forfeited | (5,500 | ) | | 19.89 |
| Options forfeited | (5,270) | | | 26.91 | |
| Outstanding September 30, 2019 | 378,304 |
| | $ | 18.15 |
| |
| Outstanding September 30, 2021 | | Outstanding September 30, 2021 | 406,815 | | | $ | 21.62 | |
The aggregate intrinsic value of options exercised during the years ended September 30, 2021, 2020 and 2019 was $1,143,000, $640,000 and 2018 was $864,000, and $894,000, respectively.
The Company uses the Black-Scholes option pricing model to estimate the fair value of stock-based awards with the weighted average assumptions noted in the following table. The risk-free interest rate is based on the rate of a U.S. Treasury security with a similar term as the expected life of the stock option at the particular grant date. The expected life is based on historical data, vesting terms and estimated exercise dates. The expected dividend yield is based on the most recent quarterly dividend on an annualized basis in effect at the time that the options were granted, adjusted, if appropriate, for management's expectations regarding future dividends. The expected volatility is based on historical volatility of the Company’s stock price. There were 58,250 options granted during the year ended September 30, 2017 with an aggregate grant date fair value of $224,000. There were 45,950 options granted during the year ended September 30, 2018 with an aggregate grant date fair value of $206,000. There were 46,840 options granted during the year ended September 30, 2019 with an aggregate grant date fair value of $240,000. There were 69,150 options granted during the year ended September 30, 2020 with an aggregate grant date fair value of $187,000. There were 81,000 options granted during the year ended September 30, 2021 with an aggregate grant date fair value of $502,000.
| | | | | | | | |
| Notes to Consolidated Financial Statements | |
Timberland Bancorp, Inc. and Subsidiary
September 30, 2021 and 2020
The weighted average assumptions for options granted during the years ended September 30, 2019, 20182021, 2020 and 20172019 were as follows:
| | | | | | | | | | | | | | | | | |
| | 2021 | | 2020 | | 2019 |
| Expected volatility | 35 | % | | 33 | % | | 29 | % |
| Expected life (in years) | 5 | | 5 | | 5 |
| Expected dividend yield | 3.39 | % | | 5.36 | % | | 3.28 | % |
| Risk free interest rate | 1.02 | % | | 0.28 | % | | 1.53 | % |
| Grant date fair value per share | $ | 6.20 | | | $ | 2.70 | | | $ | 5.12 | |
|
| | | | | | | | | | | |
| | 2019 |
| | 2018 |
| | 2017 |
|
| Expected volatility | 29 | % | | 17 | % | | 16 | % |
| Expected life (in years) | 5 |
| | 5 |
| | 5 |
|
| Expected dividend yield | 3.28 | % | | 2.61 | % | | 1.85 | % |
| Risk free interest rate | 1.53 | % | | 2.97 | % | | 1.89 | % |
| Grant date fair value per share | $ | 5.12 |
| | $ | 4.48 |
| | $ | 3.84 |
|
There were 49,928 options that vested during the year ended September 30, 2021 with a total fair value of $170,000. There were 58,548 options that vested during the year ended September 30, 2020 with a total fair value of $176,000. There were 77,540 options that vested during the year ended September 30, 2019 with a total fair value of $203,000. There were 76,450 options that vested during the year ended September 30, 2018 with a total fair value of $181,000. There were 69,800 options that vested during the year ended September 30, 2017 with a total fair value of $145,000.
At September 30, 2019,2021, there were 160,750187,664 unvested options with an aggregate grant date fair value of $605,000,$892,000, all of which the Company assumes will vest. The unvested options had an aggregate intrinsic value of $658,000$766,000 at September 30, 2019. 2021.
At September 30, 2018,2020, there were 196,750159,192 unvested options with an aggregate grant date fair value of $582,000.$571,000.
Notes to Consolidated Financial Statements_________________________________________________________________
Timberland Bancorp, Inc. and Subsidiary
September 30, 2019 and 2018
Additional information regarding options outstanding at September 30, 20192021 is as follows:
| | | | | | | | | | | | | | | | | | | | | | | | | | | | | | | | | | | | | | | | | | | | |
| | | | | Options Outstanding | | Options Exercisable |
Range of
Exercise
Prices ($) | | Number | | Weighted
Average
Exercise
Price | | Weighted
Average
Remaining
Contractual
Life (Years) | | Number | | Weighted
Average
Exercise
Price | | Weighted
Average
Remaining
Contractual
Life (Years) |
| | | | | | | | | | | | | | |
| 5.86 | - | 6.00 | | | 4,000 | | | 5.93 | | | 1.0 | | 4,000 | | | 5.93 | | | 1.0 |
| 9.00 | | | | 26,000 | | | 9.00 | | | 2.1 | | 26,000 | | | 9.00 | | | 2.1 |
| 10.26 | - | 10.71 | | | 60,075 | | | 10.57 | | | 3.5 | | 60,075 | | | 10.57 | | | 3.5 |
| 15.67 | - | 19.13 | | | 103,000 | | | 16.50 | | | 7.7 | | 47,480 | | | 16.01 | | | 6.2 |
| 26.50 | - | 27.14 | | | 43,990 | | | 27.13 | | | 8.0 | | 17,396 | | | 27.13 | | | 8.0 |
| 28.23 | - | 29.69 | | 129,750 | | | 28.80 | | | 8.5 | | 40,200 | | | 29.69 | | | 6.0 |
| 31.80 | | | | 40,000 | | | 31.80 | | | 7.0 | | 24,000 | | | 31.80 | | | 7.0 |
| | | | | 406,815 | | | $ | 21.62 | | | 6.9 | | 219,151 | | | $ | 18.63 | | | 5.1 |
|
| | | | | | | | | | | | | | | | | | |
| | | Options Outstanding | | Options Exercisable |
Range of Exercise Prices ($) | | Number |
| | Weighted Average Exercise Price |
| | Weighted Average Remaining Contractual Life (Years) | | Number |
| | Weighted Average Exercise Price |
| | Weighted Average Remaining Contractual Life (Years) |
| $ 4.01 - 4.55 | | 2,500 |
| | $ | 4.33 |
| | 0.9 | | 2,500 |
| | $ | 4.33 |
| | 0.9 |
| 5.86 - 6.00 | | 19,100 |
| | 5.97 |
| | 3.1 | | 19,100 |
| | 5.97 |
| | 3.1 |
| 9.00 | | 49,975 |
| | 9.00 |
| | 4.1 | | 49,975 |
| | 9.00 |
| | 4.1 |
| 10.26 - 10.71 | | 110,839 |
| | 10.58 |
| | 5.5 | | 87,589 |
| | 10.57 |
| | 5.5 |
| 15.67 | | 48,000 |
| | 15.67 |
| | 7.0 | | 27,000 |
| | 15.67 |
| | 7.0 |
| 27.14 | | 46,840 |
| | 27.14 |
| | 10.0 | | — |
| | N/A |
| | N/A |
| 29.69 | | 55,600 |
| | 29.69 |
| | 8.0 | | 22,300 |
| | 29.69 |
| | 8.0 |
| 31.80 | | 45,450 |
| | 31.80 |
| | 9.0 | | 9,090 |
| | 31.80 |
| | 9.0 |
| | | 378,304 |
| | $ | 18.15 |
| | 6.7 | | 217,554 |
| | $ | 13.21 |
| | 5.5 |
The aggregate intrinsic value of options outstanding at September 30, 2021, 2020 and 2019 2018was $3,119,000, $1,416,000, and 2017 was $3,854,000, $5,813,000, and $6,882,000, respectively.
As of September 30, 2019,2021, unrecognized compensation cost related to non-vested stock options was $604,000,$904,000, which is expected to be recognized over a weighted average period of 2.452.54 years.
Note 1617 - Commitments and Contingencies
In the normal course of business the Company is party to financial instruments with off-balance-sheet risk to meet the financing needs of its customers. These financial instruments include commitments to extend credit. These instruments involve, to varying degrees, elements of credit risk not recognized in the consolidated balance sheets. The Company’s exposure to credit loss in the event of nonperformance by the other party to the financial instrument for commitments to extend credit is represented by the contractual amount of those instruments. The Bank uses the same credit policies in making commitments as it does for on-balance-sheet instruments.
| | | | | | | | |
| Notes to Consolidated Financial Statements | |
Timberland Bancorp, Inc. and Subsidiary
September 30, 2021 and 2020
Commitments to extend credit are agreements to lend to a customer as long as there is no violation of any condition established in the contract. Since commitments may expire without being drawn upon, the total commitment amounts do not necessarily represent future cash requirements. The Company evaluates each customer’s credit-worthiness on a case-by-case basis. The amount of collateral obtained, if deemed necessary by the Company upon extension of credit, is based on management’s credit evaluation of the party. However, such loan to value ratios will subsequently change, based on increases and decreases in the supporting collateral values. Collateral held varies, but may include accounts receivable, inventory, property and equipment, residential real estate, land and income-producing commercial properties.
A summary of the Company’s commitments at September 30, 20192021 and 20182020 is as follows (dollars in thousands):
| | | | | | | | | | | |
| | 2021 | | 2020 |
| Undisbursed portion of construction loans in process (see Note 5) | $ | 95,224 | | | $ | 100,558 | |
| Undisbursed lines of credit | 115,865 | | | 103,030 | |
| Commitments to extend credit | 47,422 | | | 38,581 | |
|
| | | | | | | |
| | 2019 |
| | 2018 |
|
| Undisbursed portion of construction loans in process (see Note 5) | $ | 92,226 |
| | $ | 83,237 |
|
| Undisbursed lines of credit | 80,184 |
| | 49,525 |
|
| Commitments to extend credit | 16,578 |
| | 17,665 |
|
The Company maintains a separate reserve for losses related to unfunded loan commitments. Management estimates the amount of probable losses related to unfunded loan commitments by applying the loss factors used in the allowance for loan loss methodology to an estimate of the expected amount of funding and applies this adjusted factor to the unused portion of unfunded loan commitments. The reserve for unfunded loan commitments totaled $241,000$365,000 and $207,000$384,000 at September 30, 20192021 and 2018,2020, respectively. These amounts are included in other liabilities and accrued expenses in the accompanying
Notes to Consolidated Financial Statements_________________________________________________________________
Timberland Bancorp, Inc. and Subsidiary
September 30, 2019 and 2018
consolidated balance sheets. Increases (decreases) in the reserve for unfunded loan commitments are recorded in non-interest expense in the accompanying consolidated statements of income.
The Bank has an employee severance compensation plan which expires in 2027 and which provides severance pay benefits to eligible employees in the event of a change in control of Timberland Bancorp or the Bank (as defined in the plan). In general, all employees with two or more years of service will be eligible to participate in the plan. Under the plan, in the event of a change in control of Timberland Bancorp or the Bank, eligible employees who are terminated or who terminate employment (but only upon the occurrence of events specified in the plan) within 12 months of the effective date of a change in control would be entitled to a payment based on years of service or officer rank with the Bank. The maximum payment for any eligible employee would be equal to 18 months of the employee’s current compensation.
The CompanyTimberland Bancorp has employment agreements with the Chief Executive Officer and the Chief Financial Officer which provide for a severance payment and other benefits if the officers are involuntarily terminated following a change in control of the CompanyTimberland Bancorp or the Bank. The maximum value of the severance benefits under the employment agreements is 2.99 times the officer's average annual compensation during the five-yearfive-year period prior to the effective date of the change in control.
Because of the nature of its activities, the Company is subject to various pending and threatened legal actions which arise in the ordinary course of business. In the opinion of management, liabilities arising from these claims, if any, will not have a material effect on the future consolidated financial position of the Company.
Note 1718 - Regulatory Matters
The Bank, as a state-chartered, federally insured savings bank, is subject to the capital requirements established by the FDIC. Under the FDIC's capital adequacy guidelines and the regulatory framework for prompt corrective action, the Bank must meet specific capital guidelines that involve quantitative measures of the Bank's assets, liabilities and certain off-balance-sheet items as calculated under regulatory accounting practices. The Bank's capital amounts and classification are also subject to qualitative judgments by the regulators about components, risk weighting and other factors. Failure to meet minimum capital requirements can initiate certain mandatory and possibly additional discretionary actions by bank regulators that, if undertaken, could have a direct material effect on the Company's consolidated financial statements.
The minimum requirements are a common equity Tier 1 ("CET1") capital ratio of 4.5%, a Tier 1 capital ratio of 6.0%, a total capital ratio of 8.0% and a leverage ratio of 4.0%. In addition to the minimum regulatory capital ratios, the Bank is required to maintain a capital conservation buffer consisting of additional CET1 capital greater than 2.5% of risk-weighted assets above the required minimum levels in order to avoid limitations on paying dividends, engaging in share repurchases, and paying
| | | | | | | | |
| Notes to Consolidated Financial Statements | |
Timberland Bancorp, Inc. and Subsidiary
September 30, 2021 and 2020
discretionary bonuses based on percentages of retained income that could be utilized for such actions. At September 30, 2019,2021, the Bank's CET1 capital exceeded the required capital conservation buffer.
At September 30, 20192021 and 20182020, the Bank exceeded all regulatory capital requirements. The Bank was categorized as "well capitalized" at September 30, 20192021 and 20182020 under the regulations of the FDIC. The following tables compare the Bank’s actual capital amounts at September 30, 20192021 and 20182020 to its minimum regulatory capital requirements and "Well Capitalized" regulatory capital at those dates (dollars in thousands):
| | | | | | | | | | | | | | | | | | | | | | | | | | | | | | | | | | | |
| Actual | | Regulatory Minimum To Be "Adequately Capitalized" | | Regulatory Minimum To Be "Well Capitalized" Under Prompt Corrective Action Provisions |
| September 30, 2021 | Amount | | Ratio | | Amount | | Ratio | | Amount | | Ratio |
| Leverage Capital Ratio: | | | | | | | | | | | |
| Tier 1 capital | $ | 188,512 | | | 10.7 | % | | $ | 70,240 | | | 4.0 | % | | $ | 87,801 | | | 5.0 | % |
| Risk-based Capital Ratios: | | | | | | | | | | | |
| Common equity Tier 1 capital | 188,512 | | | 20.6 | | | 41,257 | | | 4.5 | | | 59,593 | | | 6.5 | |
| Tier 1 capital | 188,512 | | | 20.6 | | | 55,009 | | | 6.0 | | | 73,345 | | | 8.0 | |
| Total capital | 200,002 | | | 21.8 | | | 73,345 | | | 8.0 | | | 91,682 | | | 10.0 | |
| | | September 30, 2019 | Actual | | Regulatory Minimum To Be "Adequately Capitalized" | | Regulatory MinimumTo Be "Well Capitalized" Under Prompt Corrective Action Provisions | |
| | Amount | | Ratio | | Amount | | Ratio | | Amount | | Ratio | |
| September 30, 2020 | | September 30, 2020 | |
| Leverage Capital Ratio: | | | | | | | | | | | | Leverage Capital Ratio: | |
| Tier 1 capital | $ | 152,926 |
| | 12.5 | % | | $ | 49,044 |
| | 4.0 | % | | $ | 61,305 |
| | 5.0 | % | Tier 1 capital | $ | 168,937 | | | 11.1 | % | | $ | 60,993 | | | 4.0 | % | | $ | 76,241 | | | 5.0 | % |
| Risk-based Capital Ratios: | | | | | | | | | | | | Risk-based Capital Ratios: | |
| Common equity Tier 1 capital | 152,926 |
| | 18.1 |
| | 38,019 |
| | 4.5 |
| | 54,916 |
| | 6.5 |
| Common equity Tier 1 capital | 168,937 | | | 19.7 | | | 38,504 | | | 4.5 | | | 55,618 | | | 6.5 | |
| Tier 1 capital | 152,926 |
| | 18.1 |
| | 50,692 |
| | 6.0 |
| | 67,589 |
| | 8.0 |
| Tier 1 capital | 168,937 | | | 19.7 | | | 51,339 | | | 6.0 | | | 68,452 | | | 8.0 | |
| Total capital | 162,857 |
| | 19.3 |
| | 67,589 |
| | 8.0 |
| | 84,487 |
| | 10.0 |
| Total capital | 179,671 | | | 21.0 | | | 68,452 | | | 8.0 | | | 85,566 | | | 10.0 | |
Notes to Consolidated Financial Statements_________________________________________________________________
Timberland Bancorp, Inc. and Subsidiary
September 30, 2019 and 2018
|
| | | | | | | | | | | | | | | | | | | | |
| September 30, 2018 | Actual | | Regulatory Minimum To Be "Adequately Capitalized" | | Regulatory Minimum To Be "Well Capitalized" Under Prompt Corrective Action Provisions |
| | Amount | | Ratio | | Amount | | Ratio | | Amount | | Ratio |
| Leverage Capital Ratio: | | | | | | | | | | | |
| Tier 1 capital | $ | 117,336 |
| | 11.7 | % | | $ | 40,024 |
| | 4.0 | % | | $ | 50,031 |
| | 5.0 | % |
| Risk-based Capital Ratios: | | | | | | | | | | | |
| Common equity Tier 1 capital | 117,336 |
| | 16.7 |
| | 31,539 |
| | 4.5 |
| | 45,557 |
| | 6.5 |
|
| Tier 1 capital | 117,336 |
| | 16.7 |
| | 42,052 |
| | 6.0 |
| | 56,070 |
| | 8.0 |
|
| Total capital | 126,109 |
| | 18.0 |
| | 56,070 |
| | 8.0 |
| | 70,087 |
| | 10.0 |
|
Timberland Bancorp is a bank holding company registered with the Federal Reserve. Bank holding companies are subject to capital adequacy requirements of the Federal Reserve under the Bank Holding Company Act of 1956, as amended, and the regulations of the Federal Reserve. For a bank holding company with less than $3.0 billion in assets, the capital guidelines apply on a bank only basis, and the Federal Reserve expects the holding company's subsidiary bank to be well capitalized under the prompt corrective action regulations. If Timberland Bancorp were subject to regulatory guidelines for bank holding companies with $3.0 billion or more in assets at September 30, 2019,2021, Timberland Bancorp would have exceeded all regulatory requirements.
The following table presents the regulatory capital ratios for Timberland Bancorp at September 30, 20192021 and 20182020 assuming that Timberland Bancorp was subject to regulatory guidelines for bank holding companies with $3.0 billion or more in assets (dollars in thousands):
| | | | | | | | | | | | | | | | | | | | | | | |
| 2021 | | 2020 |
| | | |
| Amount | | Ratio | | Amount | | Ratio |
| | | | | | | |
| Leverage Capital Ratio: | | | | | | | |
| Tier 1 capital | $ | 191,973 | | | 11.0 | % | | $ | 172,000 | | | 11.3 | % |
| Risk-based Capital Ratios: | | | | | | | |
| Common equity Tier 1 capital | 191,973 | | | 20.9 | | | 172,000 | | | 20.1 | |
| Tier 1 capital | 191,973 | | | 20.9 | | | 172,000 | | | 20.1 | |
| Total capital | 203,475 | | | 22.2 | | | 182,805 | | | 21.3 | |
| | | | | | | | |
| Notes to Consolidated Financial Statements | |
Timberland Bancorp, Inc. and Subsidiary
September 30, 2021 and 2020
|
| | | | | | | | | | | | | |
| | 2019 | | 2018 |
| | Amount | | Ratio | | Amount | | Ratio |
| Leverage Capital Ratio: | | | | | | | |
| Tier 1 capital | $ | 155,468 |
| | 12.7 | % | | $ | 120,175 |
| | 12.0 | % |
| Risk-based Capital Ratios: | | | | | | | |
| Common equity Tier 1 capital | 155,468 |
| | 18.4 |
| | 120,175 |
| | 17.1 |
|
| Tier 1 capital | 155,468 |
| | 18.4 |
| | 120,175 |
| | 17.1 |
|
| Total capital | 165,399 |
| | 19.6 |
| | 128,955 |
| | 18.4 |
|
Note 1819 - Condensed Financial Information - Parent Company Only
Condensed Balance Sheets - September 30, 20192021 and 20182020
(dollars in thousands)
| | | | | | | | | | | |
| | 2021 | | 2020 |
| Assets | | | |
| Cash and cash equivalents: | | | |
| Cash and due from financial institutions | $ | 379 | | | $ | 505 | |
| Interest-bearing deposits in banks | 2,553 | | | 2,128 | |
Total cash and cash equivalents | 2,932 | | | 2,633 | |
| | | |
| Investment securities held to maturity, at amortized cost (estimated fair value $505 and $499) | 500 | | | 500 | |
| Investment in Bank | 203,440 | | | 184,567 | |
| Other assets | 107 | | | 23 | |
| Total assets | $ | 206,979 | | | $ | 187,723 | |
| | | |
| Liabilities and shareholders’ equity | | | |
| Accrued expenses | $ | 80 | | | $ | 93 | |
| Shareholders’ equity | 206,899 | | | 187,630 | |
| Total liabilities and shareholders’ equity | $ | 206,979 | | | $ | 187,723 | |
|
| | | | | | | |
| | 2019 |
| | 2018 |
|
| Assets | | | |
| Cash and cash equivalents: | | | |
| Cash and due from financial institutions | $ | 336 |
| | $ | 306 |
|
| Interest-bearing deposits in banks | 2,555 |
| | 2,588 |
|
Total cash and cash equivalents | 2,891 |
| | 2,894 |
|
| | | | |
| Loan receivable from ESOP | — |
| | 285 |
|
| Investment in Bank | 168,525 |
| | 121,818 |
|
| Other assets | 15 |
| | 15 |
|
| Total assets | $ | 171,431 |
| | $ | 125,012 |
|
| | | | |
| Liabilities and shareholders’ equity | |
| | |
|
| Accrued expenses | $ | 364 |
| | $ | 355 |
|
| Shareholders’ equity | 171,067 |
| | 124,657 |
|
| Total liabilities and shareholders’ equity | $ | 171,431 |
| | $ | 125,012 |
|
Notes to Consolidated Financial Statements_________________________________________________________________
Timberland Bancorp, Inc. and Subsidiary
September 30, 2019 and 2018
Condensed Statements of Income - Years Ended September 30, 2019, 20182021, 2020 and 20172019
(dollars in thousands)
| | | | | | | | | | | | | | | | | |
| | 2021 | | 2020 | | 2019 |
| Operating income | | | | | |
| Interest on deposits in banks | $ | 5 | | | $ | 26 | | | $ | 67 | |
| Interest on loan receivable from ESOP | — | | | — | | | 9 | |
| Interest on investment securities | 24 | | | 5 | | | — | |
| Dividends from Bank | 9,085 | | | 8,762 | | | 6,607 | |
| Total operating income | 9,114 | | | 8,793 | | | 6,683 | |
| | | | | |
| Operating expenses | 495 | | | 554 | | | 525 | |
| | | | | |
Income before income taxes and equity in undistributed
income of Bank | 8,619 | | | 8,239 | | | 6,158 | |
| Benefit for income taxes | (238) | | | (186) | | | (169) | |
| | | | | |
| Income before undistributed income of Bank | 8,857 | | | 8,425 | | | 6,327 | |
| | | | | |
| Equity in undistributed income of Bank | 18,726 | | | 15,844 | | | 17,693 | |
| Net income | $ | 27,583 | | | $ | 24,269 | | | $ | 24,020 | |
| | | | | |
| | | | | |
| | | | | |
| | | | | |
| | | | | | | | |
| Notes to Consolidated Financial Statements | |
Timberland Bancorp, Inc. and Subsidiary
September 30, 2021 and 2020
|
| | | | | | | | | | | |
| | 2019 |
| | 2018 |
| | 2017 |
|
| Operating income | | | | | |
| Interest on deposits in banks | $ | 67 |
| | $ | 37 |
| | $ | 27 |
|
| Interest on loan receivable from ESOP | 9 |
| | 53 |
| | 96 |
|
| Dividends from Bank | 6,607 |
| | 4,429 |
| | 1,390 |
|
| Total operating income | 6,683 |
| | 4,519 |
| | 1,513 |
|
| | | | | | |
| Operating expenses | 525 |
| | 591 |
| | 467 |
|
| | | | | | |
Income before income taxes and equity in undistributed income of Bank | 6,158 |
| | 3,928 |
| | 1,046 |
|
| Benefit for income taxes | (169 | ) | | (198 | ) | | (385 | ) |
| | | | | | |
| Income before undistributed income of Bank | 6,327 |
| | 4,126 |
| | 1,431 |
|
| | | | | | |
| Equity in undistributed income of Bank | 17,693 |
| | 12,595 |
| | 12,736 |
|
| Net income | $ | 24,020 |
| | $ | 16,721 |
| | $ | 14,167 |
|
Condensed Statements of Cash Flows - Years Ended September 30, 2019, 20182021, 2020 and 20172019
(dollars in thousands)
| | | | | | | | | | | | | | | | | |
| | 2021 | | 2020 | | 2019 |
| Cash flows from operating activities | | | | | |
| Net income | $ | 27,583 | | | $ | 24,269 | | | $ | 24,020 | |
| Adjustments to reconcile net income to net cash provided by operating activities: | | | | | |
| Equity in undistributed income of Bank | (18,726) | | | (15,844) | | | (17,693) | |
| Earned ESOP shares | — | | | 31 | | | 441 | |
| | | | | |
| Stock option compensation expense | 173 | | | 182 | | | 159 | |
| | | | | |
| Other, net | (97) | | | (279) | | | 9 | |
| Net cash provided by operating activities | 8,933 | | | 8,359 | | | 6,936 | |
| | | | | |
| Cash flows from investing activities | | | | | |
| Investment in Bank | (149) | | | (187) | | | (14,915) | |
| Purchase of investment securities held to maturity | — | | | (500) | | | — | |
| Principal repayments on loan receivable from ESOP | — | | | — | | | 285 | |
| Cash acquired, net of cash consideration paid in business combination | — | | | — | | | 14,284 | |
| Net cash used in investing activities | (149) | | | (687) | | | (346) | |
| | | | | |
| Cash flows from financing activities | | | | | |
| | | | | |
| | | | | |
| Proceeds from exercise of stock options | 631 | | | 391 | | | 401 | |
| | | | | |
| | | | | |
| | | | | |
| Repurchase of common stock | (527) | | | (1,238) | | | (499) | |
| Payment of dividends | (8,589) | | | (7,083) | | | (6,495) | |
| Net cash used in financing activities | (8,485) | | | (7,930) | | | (6,593) | |
| | | | | |
| Net (decrease) increase in cash and cash equivalents | 299 | | | (258) | | | (3) | |
| | | | | |
| Cash and cash equivalents | | | | | |
| Beginning of year | 2,633 | | | 2,891 | | | 2,894 | |
| End of year | $ | 2,932 | | | $ | 2,633 | | | $ | 2,891 | |
|
| | | | | | | | | | | |
| | 2019 |
| | 2018 |
| | 2017 |
|
| Cash flows from operating activities | | | | | |
| Net income | $ | 24,020 |
| | $ | 16,721 |
| | $ | 14,167 |
|
| Adjustments to reconcile net income to net cash provided by operating activities: | |
| | |
| | |
|
| Equity in undistributed income of Bank | (17,693 | ) | | (12,595 | ) | | (12,736 | ) |
| Earned ESOP shares | 441 |
| | 882 |
| | 605 |
|
| Stock option compensation expense | 159 |
| | 172 |
| | 156 |
|
| Other, net | 9 |
| | 280 |
| | 33 |
|
| Net cash provided by operating activities | 6,936 |
| | 5,460 |
| | 2,225 |
|
| | | | | | |
| Cash flows from investing activities | |
| | |
| | |
|
| Investment in Bank | (14,915 | ) | | (1,271 | ) | | (930 | ) |
| Principal repayments on loan receivable from ESOP | 285 |
| | 536 |
| | 493 |
|
| Cash acquired, net of cash consideration paid in business combination | 14,284 |
| | — |
| | — |
|
| Net cash used in investing activities | (346 | ) | | (735 | ) | | (437 | ) |
| | | | | | |
| Cash flows from financing activities | |
| | |
| | |
|
| Proceeds from exercise of stock options | 401 |
| | 318 |
| | 332 |
|
| Proceeds from exercise of stock warrant | — |
| | — |
| | 2,496 |
|
| Repurchase of common stock | (499 | ) | | — |
| | — |
|
| Payment of dividends | (6,495 | ) | | (4,431 | ) | | (3,641 | ) |
| Net cash used in financing activities | (6,593 | ) | | (4,113 | ) | | (813 | ) |
| | | | | | |
| Net (decrease) increase in cash and cash equivalents | (3 | ) | | 612 |
| | 975 |
|
| | | | | | |
| Cash and cash equivalents | |
| | |
| | |
|
| Beginning of period | 2,894 |
| | 2,282 |
| | 1,307 |
|
| End of period | $ | 2,891 |
| | $ | 2,894 |
| | $ | 2,282 |
|
Notes to Consolidated Financial Statements_________________________________________________________________
Timberland Bancorp, Inc. and Subsidiary
September 30, 2019 and 2018
Note 1920 - Net Income Per Common Share
Information regarding the calculation of basic and diluted net income per common share for the years ended September 30, 2019, 20182021, 2020 and 20172019 is as follows (dollars in thousands, except per share amounts):
| | | | | | | | | | | | | | | | | |
| | 2021 | | 2020 | | 2019 |
| Basic net income per common share computation | | | | | |
| | | | | |
| | | | | |
| | | | | |
| | | | | |
| Numerator - net income | $ | 27,583 | | | $ | 24,269 | | | $ | 24,020 | |
| | | | | |
| Denominator - weighted average common shares outstanding | 8,340,983 | | | 8,326,600 | | | 8,318,928 | |
| | | | | |
| Basic net income per common share | $ | 3.31 | | | $ | 2.91 | | | $ | 2.89 | |
| | | | | |
| Diluted net income per common share computation | | | | | |
| | | | | |
| | | | | |
| | | | | |
| | | | | |
| Numerator - net income | $ | 27,583 | | | $ | 24,269 | | | $ | 24,020 | |
| | | | | |
| Denominator - weighted average common shares outstanding | 8,340,983 | | | 8,326,600 | | | 8,318,928 | |
| Effect of dilutive stock options (1) | 103,350 | | | 95,886 | | | 149,298 | |
| | | | | |
| Weighted average common shares outstanding-assuming dilution | 8,444,333 | | | 8,422,486 | | | 8,468,226 | |
| | | | | |
| Diluted net income per common share | $ | 3.27 | | | $ | 2.88 | | | $ | 2.84 | |
|
| | | | | | | | | | | |
| | 2019 |
| | 2018 |
| | 2017 |
|
| Basic net income per common share computation | | | | | |
| Numerator - net income to common shareholders | $ | 24,020 |
| | $ | 16,721 |
| | $ | 14,167 |
|
| | | | | | |
| Denominator - weighted average common shares outstanding | 8,318,928 |
| | 7,334,577 |
| | 7,136,690 |
|
| | | | | | |
| Basic net income per common share | $ | 2.89 |
| | $ | 2.28 |
| | $ | 1.99 |
|
| | | | | | |
| Diluted net income per common share computation | |
| | |
| | |
|
| Numerator - net income to common shareholders | $ | 24,020 |
| | $ | 16,721 |
| | $ | 14,167 |
|
| | | | | | |
| Denominator - weighted average common shares outstanding | 8,318,928 |
| | 7,334,577 |
| | 7,136,690 |
|
| Effect of dilutive stock options (1) | 149,298 |
| | 191,767 |
| | 163,773 |
|
| Effect of dilutive stock warrant (2) | — |
| | — |
| | 79,590 |
|
| Weighted average common shares outstanding-assuming dilution | 8,468,226 |
| | 7,526,344 |
| | 7,380,053 |
|
| | | | | | |
| Diluted net income per common share | $ | 2.84 |
| | $ | 2.22 |
| | $ | 1.92 |
|
| | | | | | | | |
| Notes to Consolidated Financial Statements | |
Timberland Bancorp, Inc. and Subsidiary
September 30, 2021 and 2020
___________________
(1) For the years ended September 30, 2019, 20182021, 2020 and 2017,2019, average options to purchase 102,920, 29,581136,148, 131,186 and 1,117102,920 shares of common stock, respectively, were outstanding but not included in the computation of diluted net income per common share, because their effect would have been anti-dilutive.
(2) Represented a warrant to purchase 370,899 shares of the Company's common stock at an exercise price of $6.73 per share (subject to anti-dilution adjustments) at any time through December 23, 2018 (the "Warrant"). The Warrant was granted on December 23, 2008 to the U.S. Treasury Department ("Treasury") as part of the Company's participation in the Treasury's Troubled Asset Relief Program. On June 12, 2013, the Treasury sold the Warrant to private investors. On January 31, 2017, the Warrant was exercised and 370,899 shares of the Company's common stock were issued in exchange for $2,496,000.
Note 2021 - Accumulated Other Comprehensive Income (Loss)
The changes in accumulated other comprehensive income (loss) ("AOCI") by component during the years ended September 30, 2019, 20182021, 2020 and 20172019 are as follows (dollars in thousands):
|
| | | | | | | | | | | |
| | Changes in fair value of available for sale securities [1] | | Changes in OTTI on held to maturity securities [1] | | Total [1] |
| 2019 | | | | | |
| Balance of AOCI at the beginning of period | $ | (58 | ) | | $ | (71 | ) | | $ | (129 | ) |
| Other comprehensive income | 85 |
| | 31 |
| | 116 |
|
| Adoption of ASU 2016-01 | 63 |
| | — |
| | 63 |
|
| Balance of AOCI at the end of period | $ | 90 |
| | $ | (40 | ) | | $ | 50 |
|
| | | | | | |
Notes to Consolidated Financial Statements_________________________________________________________________
Timberland Bancorp, Inc. and Subsidiary
September 30, 2019 and 2018
| | | | | | | | | | Changes in fair value of available for sale securities [1] | | Changes in OTTI on held to maturity securities [1] | | Total [1] |
| 2018 | | | | | | |
| 2021 | | 2021 | | | | | |
| Balance of AOCI at the beginning of period | $ | (19 | ) | | $ | (105 | ) | | $ | (124 | ) | Balance of AOCI at the beginning of period | $ | 87 | | | $ | (26) | | | $ | 61 | |
| Other comprehensive loss | (39 | ) | | 34 |
| | (5 | ) | |
| Other comprehensive income (loss) | | Other comprehensive income (loss) | (12) | | | 10 | | | (2) | |
| | Balance of AOCI at the end of period | $ | (58 | ) | | $ | (71 | ) | | $ | (129 | ) | Balance of AOCI at the end of period | $ | 75 | | | $ | (16) | | | $ | 59 | |
| | | | | | | | | | | | |
| 2017 | | | | | | |
| 2020 | | 2020 | |
| Balance of AOCI at the beginning of period | | Balance of AOCI at the beginning of period | $ | 90 | | | $ | (40) | | | $ | 50 | |
| Other comprehensive income (loss) | | Other comprehensive income (loss) | (3) | | | 14 | | | 11 | |
| | Balance of AOCI at the end of period | | Balance of AOCI at the end of period | $ | 87 | | | $ | (26) | | | $ | 61 | |
| | 2019 | | 2019 | |
| Balance of AOCI at the beginning of period | $ | 4 |
| | $ | (179 | ) | | $ | (175 | ) | Balance of AOCI at the beginning of period | $ | (58) | | | $ | (71) | | | $ | (129) | |
| Other comprehensive income | (23 | ) | | 74 |
| | 51 |
| Other comprehensive income | 85 | | | 31 | | | 116 | |
| Adoption of ASU 2016-01 | | Adoption of ASU 2016-01 | $ | 63 | | | $ | — | | | $ | 63 | |
| Balance of AOCI at the end of period | $ | (19 | ) | | $ | (105 | ) | | $ | (124 | ) | Balance of AOCI at the end of period | $ | 90 | | | $ | (40) | | | $ | 50 | |
___________________
[1] All amounts are net of income taxes.
Note 2122 - Fair Value Measurements
Fair value is defined under GAAP as the exchange price that would be received for an asset or paid to transfer a liability (exit price) in the principal or most advantageous market for the asset or liability in an orderly transaction between market participants on the measurement date. GAAP requires that valuation techniques maximize the use of observable inputs and minimize the use of unobservable inputs. GAAP also establishes a fair value hierarchy which prioritizes the valuation inputs into three broad levels. Based on the underlying inputs, each fair value measurement in its entirety is reported in one of three levels. These levels are:
Level 1: Quoted prices (unadjusted) in active markets for identical assets or liabilities that the reporting entity has the ability to access at the measurement date.
Level 2: Significant observable inputs other than quoted prices included within Level 1, such as quoted prices for similar (as opposed to identical) assets or liabilities in active markets, quoted prices for identical or similar assets or liabilities in markets that are not active, and inputs other than quoted prices that are observable or can be corroborated by observable market data.
Level 3: Significant unobservable inputs that reflect a company’s own assumptions about the assumptions that market participants would use in pricing an asset or liability based on the best information available in the circumstances.
| | | | | | | | |
| Notes to Consolidated Financial Statements | |
Timberland Bancorp, Inc. and Subsidiary
September 30, 2021 and 2020
The Company's assets measured at fair value on a recurring basis consist of investment securities available for sale and investments in equity securities. The estimated fair values of MBS are based upon market prices of similar securities or observable inputs (Level 2). The estimated fair values of mutual funds are based upon quoted market prices (Level 1).
The Company had no liabilities measured at fair value on a recurring basis at September 30, 20192021 and 2018.2020. The Company's assets measured at estimated fair value on a recurring basis at September 30, 20192021 and 20182020 are as follows (dollars in thousands):
| | | | | | | | | | | | | | | | | | | | | | | |
| | Estimated Fair Value |
| September 30, 2021 | Level 1 | | Level 2 | | Level 3 | | Total |
| Available for sale investment securities | | | | | | | |
| | | | | | | |
| MBS: U.S. government agencies | $ | — | | | $ | 63,176 | | | $ | — | | | $ | 63,176 | |
| | | | | | | |
| Investments in equity securities | | | | | | | |
| Mutual funds | 955 | | | — | | | — | | | 955 | |
| Total | $ | 955 | | | $ | 63,176 | | | $ | — | | | $ | 64,131 | |
| | | September 30, 2020 | | September 30, 2020 | |
| Available for sale investment securities | | Available for sale investment securities | | | | | | | |
| | Estimated Fair Value | |
| September 30, 2019 | Level 1 | | Level 2 | | Level 3 | | Total | |
| Available for sale investment securities | | | | | | | | |
| MBS: U.S. government agencies | $ | — |
| | $ | 22,532 |
| | $ | — |
| | $ | 22,532 |
| MBS: U.S. government agencies | $ | — | | | $ | 57,907 | | | $ | — | | | $ | 57,907 | |
| | Investments in equity securities | | | | | | | | Investments in equity securities | |
| Mutual funds | 958 |
| | — |
| | — |
| | 958 |
| Mutual funds | 977 | | | — | | | — | | | 977 | |
| Total | $ | 958 |
| | $ | 22,532 |
| | $ | — |
| | $ | 23,490 |
| Total | $ | 977 | | | $ | 57,907 | | | $ | — | | | $ | 58,884 | |
Notes to Consolidated Financial Statements_________________________________________________________________
Timberland Bancorp, Inc. and Subsidiary
September 30, 2019 and 2018
|
| | | | | | | | | | | | | | | |
| September 30, 2018 | | | | | | | |
| Available for sale investment securities | | | | | | | |
| MBS: U.S. government agencies | $ | — |
| | $ | 237 |
| | $ | — |
| | $ | 237 |
|
| Mutual funds | 917 |
| | — |
| | — |
| | 917 |
|
| Total | $ | 917 |
| | $ | 237 |
| | $ | — |
| | $ | 1,154 |
|
There were no transfers among Level 1, Level 2 and Level 3 during the years ended September 30, 20192021 and 2018.2020.
The Company may be required, from time to time, to measure certain assets and liabilities at fair value on a non-recurring basis in accordance with GAAP. These include assets that are measured at the lower of cost or market value that were recognized at fair value below cost at the end of the period.
The Company uses the following methods and significant assumptions to estimate fair value on a non-recurring basis:
Impaired Loans: The estimated fair value of impaired loans is calculated using the collateral value method or on a discounted cash flow basis. The specific reserve for collateral dependent impaired loans is based on the estimated fair value of the collateral less estimated costs to sell, if applicable. In some cases, adjustments are made to the appraised values due to various factors including age of the appraisal, age of comparables included in the appraisal and known changes in the market and in the collateral. Such adjustments may be significant and typically result in a Level 3 classification of the inputs for determining fair value. Impaired loans are evaluated on a quarterly basis for additional impairment and adjusted accordingly.
Investment Securities Held to Maturity: The estimated fair value of investment securities held to maturity is based upon the assumptions market participants would use in pricing the investment security. Such assumptions include quoted market prices (Level 1), market prices of similar securities or observable inputs (Level 2) and unobservable inputs such as dealer quotes, discounted cash flows or similar techniques (Level 3).
OREO and Other Repossessed Assets, net: OREO and other repossessed assets are recorded at estimated fair value less estimated costs to sell. Estimated fair value is generally determined by management based on a number of factors, including third-party appraisals of estimated fair value in an orderly sale. Estimated costs to sell are based on standard market factors. The valuation of OREO and other repossessed assets is subject to significant external and internal judgment (Level 3).
| | | | | | | | |
| Notes to Consolidated Financial Statements | |
Timberland Bancorp, Inc. and Subsidiary
September 30, 2021 and 2020
The following table summarizes the balances of assets measured at estimated fair value on a non-recurring basis at September 30, 20192021 (dollars in thousands):
| | | | | | | | | | | | | | | | | |
| | Estimated Fair Value |
| Impaired loans: | Level 1 | | Level 2 | | Level 3 |
| Mortgage loans: | | | | | |
| | | | | |
| | | | | |
| | | | | |
| | | | | |
| Land | $ | — | | | $ | — | | | $ | 286 | |
| | | | | |
| | | | | |
| | | | | |
| Commercial business loans | — | | | — | | | 123 | |
| Total impaired loans | — | | | — | | | 409 | |
| | | | | |
| Investment securities – held to maturity: | | | | | |
| MBS - Private label residential | — | | | 10 | | | — | |
| OREO and other repossessed assets | — | | | — | | | 157 | |
| Total | $ | — | | | $ | 10 | | | $ | 566 | |
|
| | | | | | | | | | | |
| | Estimated Fair Value |
| Impaired loans: | Level 1 | | Level 2 | | Level 3 |
| Mortgage loans: | | | | | |
| Land | $ | — |
| | $ | — |
| | $ | 114 |
|
| Consumer loans: | |
| | |
| | |
|
| Other |
|
| |
|
| | 6 |
|
| Commercial business loans | — |
| | — |
| | 408 |
|
| Total impaired loans | — |
| | — |
| | 528 |
|
| | | | | | |
| Investment securities – held to maturity: | |
| | |
| | |
|
| MBS - Private label residential | — |
| | 2 |
| | — |
|
| OREO and other repossessed assets | — |
| | — |
| | 1,683 |
|
| Total | $ | — |
| | $ | 2 |
| | $ | 2,211 |
|
Notes to Consolidated Financial Statements_________________________________________________________________
Timberland Bancorp, Inc. and Subsidiary
September 30, 2019 and 2018
The following table presents quantitative information about Level 3 fair value measurements for financial instruments measured at fair value on a non-recurring basis as of September 30, 20192021 (dollars in thousands):
| | | | | | | | | | | | | | | | | | | | | | | |
| Estimated Fair Value | | Valuation Technique(s) | |
Unobservable Input(s) | |
Range |
Impaired loans | $ | 409 | | | Market approach | | Appraised value less estimated selling costs | | NA |
| | | | | | | |
| OREO and other repossessed assets | 157 | | | Market approach | | Lower of appraised value or
listing price less estimated selling costs | | NA |
| | | | | | | |
|
| | | | | | | | | |
| | Estimated Fair Value | | Valuation Technique(s) | | Unobservable Input(s) | | Range |
Impaired loans | $ | 528 |
| | Market approach | | Appraised value less estimated selling costs | | NA |
| | | | | | | | |
| OREO and other repossessed assets | 1,683 |
| | Market approach | | Lower of appraised value or listing price less estimated selling costs | | NA |
| | | | | | | | |
The following table summarizes the balances of assets measured at estimated fair value on a non-recurring basis at September 30, 20182020 (dollars in thousands): | | | | | | | | | | | | | | | | | |
| Estimated Fair Value |
| Impaired loans: | Level 1 | | Level 2 | | Level 3 |
| Mortgage loans: | | | | | |
| One- to four-family | $ | — | | | $ | — | | | $ | 481 | |
| | | | | |
| | | | | |
| | | | | |
| | | | | |
| | | | | |
| | | | | |
| | | | | |
| | | | | |
| | | | | |
| Commercial business loans | — | | | — | | | 210 | |
| Total impaired loans | — | | | — | | | 691 | |
| | | | | |
| Investment securities – held to maturity: | | | | | |
| MBS - Private label residential | — | | | 8 | | | — | |
| OREO and other repossessed assets | — | | | — | | | 1,050 | |
| Total | $ | — | | | $ | 8 | | | $ | 1,741 | |
|
| | | | | | | | | | | |
| | Estimated Fair Value |
| Impaired loans: | Level 1 | | Level 2 | | Level 3 |
| Mortgage loans: | | | | | |
| Land | $ | — |
| | $ | — |
| | $ | 119 |
|
| Commercial business loans | — |
| | — |
| | 107 |
|
| Total impaired loans | — |
| | — |
| | 226 |
|
| | | | | | |
| Investment securities – held to maturity: | |
| | |
| | |
|
| MBS - Private label residential | — |
| | 3 |
| | — |
|
| OREO and other repossessed assets | — |
| | — |
| | 1,913 |
|
| Total | $ | — |
| | $ | 3 |
| | $ | 2,139 |
|
The following table presents quantitative information about Level 3 fair value measurements for financial instruments measured at fair value on a non-recurring basis as of September 30, 20182020 (dollars in thousands):
| | | | | | | | | | | | | | | | | | | | | | | |
| Estimated Fair Value | | Valuation Technique(s) | | Unobservable Input(s) | | Range |
Impaired loans | $ | 691 | | | Market approach | | Appraised value less estimated selling costs | | NA |
| | | | | | | |
| OREO and other repossessed assets | 1,050 | | | Market approach | | Lower of appraised value or
listing price less estimated selling costs | | NA |
| | | | | | | |
|
| | | | | | | | | |
| | Estimated Fair Value | | Valuation Technique(s) | | Unobservable Input(s) | | Range |
Impaired loans | $ | 226 |
| | Market approach | | Appraised value less estimated selling costs | | NA |
| | | | | | | | |
| OREO and other repossessed assets | 1,913 |
| | Market approach | | Lower of appraised value or listing price less estimated selling costs | | NA |
| | | | | | | | |
| | | | | | | | |
| Notes to Consolidated Financial Statements | |
Timberland Bancorp, Inc. and Subsidiary
September 30, 2021 and 2020
GAAP requires disclosure of estimated fair values for financial instruments. Such estimates are subjective in nature, and significant judgment is required regarding the risk characteristics of various financial instruments at a discrete point in time. Therefore, such estimates could vary significantly if assumptions regarding uncertain factors were to change. In addition, as the Company normally intends to hold the majority of its financial instruments until maturity, it does not expect to realize many of the estimated amounts disclosed. The disclosures also do not include estimated fair value amounts for certain items which are not defined as financial instruments but which may have significant value. The Company does not believe that it would be practicable to estimate a fair value for these types of items as of September 30, 20192021 and 2018.2020. Because GAAP excludes certain items from fair value disclosure requirements, any aggregation of the fair value amounts presented would not represent the underlying value of the Company. Additionally, in accordance with ASU 2016-01, which the Company adopted on October 1, 2018 on a prospective basis, the Company uses the exit price notion in calculating the fair values of financial instruments not measured at fair value on a recurring basis.
Notes to Consolidated Financial Statements_________________________________________________________________
Timberland Bancorp, Inc. and Subsidiary
September 30, 2019 and 2018
The recorded amounts and estimated fair values of financial instruments were as follows as of September 30, 20192021 (dollars in thousands):
| | | | | | | | | | | | | | | | | | | | | | | | | | | | | |
| | | | | | Fair Value Measurements Using: |
| | Recorded
Amount | | Estimated Fair Value | | Level 1 | | Level 2 | | Level 3 |
| Financial Assets | | | | | | | | | |
| Cash and cash equivalents | $ | 580,196 | | | $ | 580,196 | | | $ | 580,196 | | | $ | — | | | $ | — | |
| CDs held for investment | 28,482 | | | 28,482 | | | 28,482 | | | — | | | — | |
| Investment securities | 132,278 | | | 133,286 | | | 28,670 | | | 104,616 | | | — | |
| Investments in equity securities | 955 | | | 955 | | | 955 | | | — | | | — | |
| FHLB stock | 2,103 | | | 2,103 | | | 2,103 | | | — | | | — | |
| Other investments | 3,000 | | | 3,000 | | | 3,000 | | | — | | | — | |
| Loans held for sale | 3,217 | | | 3,290 | | | 3,290 | | | — | | | — | |
| Loans receivable, net | 968,454 | | | 981,905 | | | — | | | — | | | 981,905 | |
| Accrued interest receivable | 3,745 | | | 3,745 | | | 3,745 | | | — | | | — | |
| | | | | | | | | |
| Financial Liabilities | | | | | | | | | |
| Certificates of deposit | 134,129 | | | 135,178 | | | — | | | — | | | 135,178 | |
| | | | | | | | | |
| Accrued interest payable | 134 | | | 134 | | | 134 | | | — | | | — | |
|
| | | | | | | | | | | | | | | | | | | |
| | | | | | Fair Value Measurements Using: |
| | Recorded Amount | | Estimated Fair Value | | Level 1 | | Level 2 | | Level 3 |
| Financial Assets | | | | | | | | | |
| Cash and cash equivalents | $ | 143,015 |
| | $ | 143,015 |
| | $ | 143,015 |
| | $ | — |
| | $ | — |
|
| CDs held for investment | 78,346 |
| | 78,346 |
| | 78,346 |
| | — |
| | — |
|
| Investment securities | 53,634 |
| | 55,112 |
| | 3,949 |
|
| 51,163 |
| | — |
|
| Investments in equity securities | 958 |
| | 958 |
| | 958 |
| | — |
| | — |
|
| FHLB stock | 1,437 |
| | 1,437 |
| | 1,437 |
| | — |
| | — |
|
| Other investments | 3,000 |
| | 3,000 |
| | 3,000 |
| | — |
| | — |
|
| Loans held for sale | 6,071 |
| | 6,260 |
| | 6,260 |
| | — |
| | — |
|
| Loans receivable, net | 886,662 |
| | 892,495 |
| | — |
| | — |
| | 892,495 |
|
| Accrued interest receivable | 3,598 |
| | 3,598 |
| | 3,598 |
| | — |
| | — |
|
| | | | | | | | | | |
| Financial Liabilities | |
| | |
| | |
| | |
| | |
|
| Certificates of deposit | 165,655 |
| | 166,852 |
| | — |
| | — |
| | 166,852 |
|
| Accrued interest payable | 333 |
| | 333 |
| | 333 |
| | — |
| | — |
|
The recorded amounts and estimated fair values of financial instruments were as follows as of September 30, 20182020 (dollars in thousands): | | | | | | | | | | | | | | | | | | | | | | | | | | | | | |
| | | | | | Fair Value Measurements Using: |
| | Recorded
Amount | | Estimated Fair Value | | Level 1 | | Level 2 | | Level 3 |
| Financial Assets | | | | | | | | | |
| Cash and cash equivalents | $ | 314,452 | | | $ | 314,452 | | | $ | 314,452 | | | $ | — | | | $ | — | |
| CDs held for investment | 65,545 | | | 65,545 | | | 65,545 | | | — | | | — | |
| Investment securities | 85,797 | | | 87,734 | | | — | | | 87,235 | | | 499 | |
| Investments in equity securities | 977 | | | 977 | | | 977 | | | — | | | — | |
| FHLB stock | 1,922 | | | 1,922 | | | 1,922 | | | — | | | — | |
| Other investments | 3,000 | | | 3,000 | | | 3,000 | | | — | | | — | |
| Loans held for sale | 4,509 | | | 4,664 | | | 4,664 | | | — | | | — | |
| Loans receivable, net | 1,013,875 | | | 1,034,876 | | | — | | | — | | | 1,034,876 | |
| Accrued interest receivable | 4,484 | | | 4,484 | | | 4,484 | | | — | | | — | |
| | | | | | | | | |
| Financial Liabilities | | | | | | | | | |
| Certificates of deposit | 158,524 | | | 160,921 | | | — | | | — | | | 160,921 | |
| | | | | | | | | |
| Accrued interest payable | 274 | | | 274 | | | 274 | | | — | | | — | |
|
| | | | | | | | | | | | | | | | | | | |
| | | | | | Fair Value Measurements Using: |
| | Recorded Amount | | Estimated Fair Value | | Level 1 | | Level 2 | | Level 3 |
| Financial Assets | | | | | | | | | |
| Cash and cash equivalents | $ | 148,864 |
| | $ | 148,864 |
| | $ | 148,864 |
| | $ | — |
| | $ | — |
|
| CDs held for investment | 63,290 |
| | 63,290 |
| | 63,290 |
| | — |
| | — |
|
| Investment securities | 13,964 |
| | 14,418 |
| | 8,812 |
| | 5,606 |
| | — |
|
| FHLB stock | 1,190 |
| | 1,190 |
| | 1,190 |
| | — |
| | — |
|
| Other investments | 3,000 |
| | 3,000 |
| | 3,000 |
| | — |
| | — |
|
| Loans held for sale | 1,785 |
| | 1,814 |
| | 1,814 |
| | — |
| | — |
|
| Loans receivable, net | 725,391 |
| | 711,071 |
| | — |
| | — |
| | 711,071 |
|
| Accrued interest receivable | 2,877 |
| | 2,877 |
| | 2,877 |
| | — |
| | — |
|
| | | | | | | | | | |
| Financial Liabilities | |
| | |
| | |
| | |
| | |
|
| Certificates of deposit | 141,808 |
| | 140,831 |
| | — |
| | — |
| | 140,831 |
|
| Accrued interest payable | 225 |
| | 225 |
| | 225 |
| | — |
| | — |
|
| | | | | | | | |
| Notes to Consolidated Financial Statements | |
Timberland Bancorp, Inc. and Subsidiary
September 30, 2021 and 2020
The Company assumes interest rate risk (the risk that general interest rate levels will change) as a result of its normal operations. As a result, the estimated fair value of the Company’s financial instruments will change when interest rate levels change, and that change may either be favorable or unfavorable to the Company. Management attempts to match maturities of assets and liabilities to the extent believed necessary to appropriately manage interest rate risk. However, borrowers with fixed interest rate obligations are less likely to prepay in a rising interest rate environment and more likely to prepay in a falling
interest rate environment. Conversely, depositors who are receiving fixed interest rates are more likely to withdraw funds before maturity in a rising interest rate environment and less likely to do so in a falling interest rate environment. Management monitors interest rates and maturities of assets and liabilities, and attempts to manage interest rate risk by adjusting terms of new loans and deposits and by investing in securities with terms that mitigate the Company’s overall interest rate risk.
Notes to Consolidated Financial Statements_________________________________________________________________
Timberland Bancorp, Inc. and Subsidiary
September 30, 2019 and 2018
Note 2223 - Selected Quarterly Financial Data (Unaudited)
The following selected financial data is presented for the quarters ended (dollars in thousands, except per share amounts):
| | | | | | | | | | | | | | | | | | | | | | | |
| | September 30,
2021 | | June 30,
2021 | | March 31,
2021 | | December 31,
2020 |
| Interest and dividend income | $ | 13,780 | | | $ | 13,865 | | | $ | 13,360 | | | $ | 13,957 | |
| Interest expense | (670) | | | (708) | | | (793) | | | (933) | |
| Net interest income | 13,110 | | | 13,157 | | | 12,567 | | | 13,024 | |
| | | | | | | |
| | | | | | | |
| Non-interest income | 3,450 | | | 4,266 | | | 4,886 | | | 4,559 | |
| Non-interest expense | (9,017) | | | (8,613) | | | (8,551) | | | (8,410) | |
| | | | | | | |
| Income before income taxes | 7,543 | | | 8,810 | | | 8,902 | | | 9,173 | |
| | | | | | | |
| Provision for income taxes | 1,525 | | | 1,786 | | | 1,651 | | | 1,883 | |
| Net income | $ | 6,018 | | | $ | 7,024 | | | $ | 7,251 | | | $ | 7,290 | |
| | | | | | | |
| | | | | | | |
| | | | | | | |
| | | | | | | |
| | | | | | | |
| | | | | | | |
| | | | | | | |
| Net income per common share | | | | | | | |
| Basic | $ | 0.72 | | | $ | 0.84 | | | $ | 0.87 | | | $ | 0.88 | |
| Diluted | $ | 0.71 | | | $ | 0.83 | | | $ | 0.86 | | | $ | 0.87 | |
| | | | September 30,
2019 |
| | June 30,
2019 |
| | March 31,
2019 |
| | December 31,
2018 |
| | September 30,
2020 | | June 30,
2020 | | March 31,
2020 | | December 31,
2019 |
| Interest and dividend income | $ | 14,384 |
| | $ | 14,185 |
| | $ | 13,841 |
| | $ | 13,315 |
| Interest and dividend income | $ | 13,593 | | | $ | 13,668 | | | $ | 14,131 | | | $ | 14,191 | |
| Interest expense | (1,233 | ) | | (1,248 | ) | | (1,113 | ) | | (971 | ) | Interest expense | (1,073) | | | (1,188) | | | (1,251) | | | (1,189) | |
| Net interest income | 13,151 |
| | 12,937 |
| | 12,728 |
| | 12,344 |
| Net interest income | 12,520 | | | 12,480 | | | 12,880 | | | 13,002 | |
| | | | | | | | | |
| Provision for loan losses | | Provision for loan losses | 500 | | | 1,000 | | | 2,000 | | | 200 | |
| Non-interest income | 3,597 |
| | 3,538 |
| | 3,940 |
| | 3,266 |
| Non-interest income | 4,715 | | | 4,855 | | | 3,680 | | | 3,938 | |
Non-interest expense (1) | (8,774 | ) | | (8,967 | ) | | (9,277 | ) | | (8,562 | ) | (8,743) | | | (8,661) | | | (8,286) | | | (8,373) | |
| | | | | | | | | | | | | | | | |
| Income before income taxes | 7,974 |
| | 7,508 |
| | 7,391 |
| | 7,048 |
| Income before income taxes | 7,992 | | | 7,674 | | | 6,274 | | | 8,367 | |
| | | | | | | | | |
| Provision for income taxes | 1,639 |
| | 1,552 |
| | 1,277 |
| | 1,433 |
| Provision for income taxes | 1,635 | | | 1,463 | | | 1,225 | | | 1,715 | |
| | Net income | $ | 6,335 |
| | $ | 5,956 |
| | $ | 6,114 |
| | $ | 5,615 |
| Net income | $ | 6,357 | | | $ | 6,211 | | | $ | 5,049 | | | $ | 6,652 | |
| | | | | | | | | | | | | | | | |
| Net income per common share | | | | | | | | Net income per common share | |
| Basic | $ | 0.76 |
| | $ | 0.71 |
| | $ | 0.74 |
| | $ | 0.68 |
| |
| Diluted (2) | $ | 0.75 |
| | $ | 0.70 |
| | $ | 0.72 |
| | $ | 0.66 |
| |
| Basic (1) | | Basic (1) | $ | 0.76 | | | $ | 0.75 | | | $ | 0.61 | | | $ | 0.80 | |
| Diluted | | Diluted | $ | 0.76 | | | $ | 0.74 | | | $ | 0.60 | | | $ | 0.78 | |
(1) During the quarters ended December 31, 2018, March 31, 2019, June 30, 2019 and September 30, 2019 the Company incurred expenses related to the acquisition of South Sound Bank of $64, $55, $328, and $15, respectively.
(2) The net income per common share amounts for the quarters do not add to the total for the fiscal year due to rounding.
|
| | | | | | | | | | | | | | | |
| | September 30,
2018 |
| | June 30,
2018 |
| | March 31,
2018 |
| | December 31,
2017 |
|
| Interest and dividend income | $ | 11,051 |
| | $ | 10,457 |
| | $ | 10,290 |
| | $ | 10,035 |
|
| Interest expense | (781 | ) | | (730 | ) | | (666 | ) | | (601 | ) |
| Net interest income | 10,270 |
| | 9,727 |
| | 9,624 |
| | 9,434 |
|
| | | | | | | | |
| Non-interest income | 3,180 |
| | 3,145 |
| | 3,082 |
| | 3,137 |
|
| Non-interest expense (1) | (7,658 | ) | | (7,122 | ) | | (7,221 | ) | | (7,176 | ) |
| | | | | | | | |
| Income before income taxes | 5,792 |
| | 5,750 |
| | 5,485 |
| | 5,395 |
|
| | | | | | | | |
| Provision for income taxes | 1,370 |
| | 1,334 |
| | 1,216 |
| | 1,781 |
|
| Net income | $ | 4,422 |
| | $ | 4,416 |
| | $ | 4,269 |
| | $ | 3,614 |
|
| | | | | | | | |
| Net income per common share | | | | | | | |
| Basic (2) | $ | 0.60 |
| | $ | 0.60 |
| | $ | 0.58 |
| | $ | 0.49 |
|
| Diluted (2) | $ | 0.59 |
| | $ | 0.59 |
| | $ | 0.57 |
| | $ | 0.48 |
|
(1) During the quarters ended December 31, 2017, March 31, 2018, June 30, 2018, and September 30, 2018 the Company incurred expenses related to the acquisition of South Sound Bank of $9, $80, $181, and $346, respectively. | | | | | | | | |
| Notes to Consolidated Financial Statements | |
(2) The net income per common share amounts for the quarters do not add to the total for the fiscal year due to rounding.
Notes to Consolidated Financial Statements_________________________________________________________________
Timberland Bancorp, Inc. and Subsidiary
September 30, 20192021 and 20182020
Note 2324 - Revenue from Contracts with Customers
In accordance with ASU 2014-09, Revenue from Contracts with Customers ("ASC 606,606"), revenues are recognized when control of promised goods or services is transferred to customers in an amount that reflects the consideration that the Company expects to be entitled to in exchange for those goods or services. To determine revenue recognition for arrangements that the Company determines are within the scope of ASC 606, the Company performs the following five steps: (i)(1) identify the contract(s) with a customer; (ii)(2) identify the performance obligations in the contract; (iii)(3) determine the transaction price; (iv)(4) allocate the transaction price to the performance obligations in the contract; and (v)(5) recognize revenue when (or as) the Company satisfies a performance obligation. The Company only applies the five-step model to contracts when it is probable that the Company will collect the consideration that it is entitled to in exchange for the goods or services it transfers to the customer. At contract inception, once the contract is determined to be within the scope of ASC 606, the Company assesses the goods or services that are promised within each contract and identifies those that contain performance obligations, and assesses whether each promised good or service is distinct. The Company then recognizes as revenue the amount of the transaction price that is allocated to the respective performance obligation when (or as) the performance obligation is satisfied.
ASC 606 applies to all contracts with customers to provide goods or services in the ordinary course of business, except for contracts that are specifically excluded from its scope. The majority of the Company's revenues are composed of interest income, deferred loan fee accretion, premium/discount accretion, gains on sales of loans and investments, BOLI net earnings, servicing income on loans sold and other loan fee income, which are not within the scope of ASC 606. Revenue reported as service charges on deposits, ATM and debit card interchange transaction fees, merchant services fees, non-deposit investment fees and escrow fees are within the scope of ASC 606. All of the Company's revenue from contracts with customers inwithin the scope of ASC 606 is recognized in non-interest income with the exception of gains on salesales of OREO and gains on sales/dispositiondispositions of premises and equipment, which are included in non-interest expense and were not significant for the year ended September 30, 2019.expense. For the year ended September 30, 2019,2021, the Company recognized $4,904,000$3,911,000 in servicesservice charges on deposits, $4,036,000$5,084,000 in ATM and debit card interchange fees, $197,000$290,000 in escrow fees and $46,000$23,000 in fee income from non-deposit investment sales, all considered within the scope of ASC 606. For the year ended September 30, 2020, the Company recognized $4,147,000 in service charges on deposits, $4,378,000 in ATM and debit card interchange fees, $273,000 in escrow fees and $22,000 in fee income from non-deposit investment sales, all considered within the scope of ASC 606.
Descriptions of the Company's revenue-generating activities that are within the scope of ASC 606 are as follows:
•Service Charges on Deposits: The Company earns fees from its deposit customers from a variety of deposit products and services. Non-transaction based fees such as account maintenance fees and monthly statement fees are considered to be provided to the customer under a day-to-day contract with ongoing renewals. Revenue for these non-transaction fees are earned over the course of a month, representing the period over which the Company satisfies the performance obligation. Transaction based-feesTransaction-based fees such as non-sufficient fund charges, stop payment charges and wire fees are recognized at the time that the transaction is executed, as the contract duration does not extend beyond the service performed.
•ATM and Debit Card Interchange Transaction Fees: The Company earns fees from cardholder transactions conducted through third partythird-party payment network providers which consist of interchange fees earned from the payment networks as a debit card issuer. These fees are recognized when the transaction occurs but may settle on a daily or monthly basis.
•Escrow Fees: The Company earns fees from real estate escrow contracts with customers. The Company receives and disburses money and/or property peraccording to the customer's contract. FeesSuch fees are recognized when the escrow contract closes.
•Fee income from Non-Deposit Investment Sales: The Company earns fees from contracts with customers for investment activities. Revenues are generally recognized on a monthly basis and are generally based on a percentage of the customer's assets under management or based on investment solutions that are implemented for the customer.
Item 9. Changes in and Disagreements with Accountants on Accounting and Financial Disclosure
None.
Item 9A. Controls and Procedures
(a) Evaluation of Disclosure Controls and Procedures: An evaluation of the Company’s disclosure controls and procedures (as defined in Rule 13a-15(e) of the Securities Exchange Act of 1934 (the “Exchange Act”)) was carried out under the supervision and with the participation of the Company’s Chief Executive Officer, Chief Financial Officer and several other members of the Company’s senior management as of the end of the period covered by this annual report. The Company’s Chief Executive Officer and Chief Financial Officer concluded that as of September 30, 20192021 the Company’s disclosure controls and procedures
were effective in ensuring that the information required to be disclosed by the Company in the reports it files or submits under the Exchange Act is (i) accumulated and communicated to the Company’s management (including the Chief Executive Officer and Chief Financial Officer) in a timely manner, and (ii) recorded, processed, summarized and reported within the time periods specified in the SEC’s rules and forms.
(b) Changes in Internal Controls: There have been no changes in our internal control over financial reporting (as defined in 13a-15(f) of the Exchange Act) that occurred during the quarter ended September 30, 2019,2021, that have materially affected, or are reasonably likely to materially affect, our internal control over financial reporting. The Company continued, however, to implement suggestions from its internal auditor and independent auditor on ways to strengthen existing controls. The Company does not expect that its disclosure controls and procedures and internal controls over financial reporting will prevent all errors and fraud. A control procedure, no matter how well conceived and operated, can provide only reasonable, not absolute, assurance that the objectives of the control procedure are met. Because of the inherent limitations in all control procedures, no evaluation of controls can provide absolute assurance that all control issues and instances of fraud, if any, within the Company have been detected. These inherent limitations include the realities that judgments in decision-making can be faulty, and that breakdowns in controls or procedures can occur because of simple error or mistake. Additionally, controls can be circumvented by the individual acts of some persons, by collusion of two or more people, or by management override of the control. The design of any control procedure is based in part upon certain assumptions about the likelihood of future events, and there can be no assurance that any design will succeed in achieving its stated goals under all potential future conditions; over time, controls become inadequate because of changes in conditions, or the degree of compliance with the policies or procedures may deteriorate. Because of the inherent limitations in a cost-effective control procedure, misstatements due to error or fraud may occur and not be detected.
Management’s Report on Internal Control Over Financial Reporting
Management of Timberland Bancorp, Inc. (the “Company”) is responsible for establishing and maintaining adequate internal control over financial reporting as defined in Rule 13(a)-15(f) of the Securities Exchange Act of 1934.Act. The Company's internal control over financial reporting is designed to provide reasonable assurance regarding the reliability of financial reporting and the preparation of financial statements for external purposes in accordance with generally accepted accounting principles.
To comply with the requirements of Section 404 of the Sarbanes-Oxley Act of 2002, the Company designed and implemented a structured and comprehensive assessment process to evaluate its internal control over financial reporting across the enterprise. The assessment of the effectiveness of the Company's internal control over financial reporting was based on criteria established in Internal Control-Integrated Framework (2013) issued by the Committee of Sponsoring Organizations of the Treadway Commission.
The Company's internal control over financial reporting includes policies and procedures that (i) pertain to the maintenance of records that, in reasonable detail, accurately and fairly reflect the transactions of the Company; (ii) provide reasonable assurance that transactions are recorded as necessary to permit preparation of financial statements in accordance with generally accepted accounting principles, and that receipts and expenditures of the Company are being made only in accordance with authorizations of management and directors of the Company; and (iii) provide reasonable assurance regarding prevention or timely detection of unauthorized acquisition, use, or disposition of the Company's assets that could have a material effect on the financial statements.
A control procedure, no matter how well conceived and operated, can provide only reasonable, not absolute, assurance that the objectives of the control system are met. Also, because of the inherent limitations in all control procedures, no evaluation of controls can provide absolute assurance that all control issues and instances of fraud, if any, within the Company have been detected. Additionally, in designing disclosure controls and procedures, our management was required to apply its judgment in evaluating the cost-benefit relationship of possible disclosure controls and procedures. The design of any
disclosure controls and procedures is also based in part upon certain assumptions about the likelihood of future events, and there can be no assurance that any design will succeed in achieving its stated goals under all potential future conditions. As a result of these inherent limitations, internal control over financial reporting may not prevent or detect misstatements. Furthermore, projections of any evaluation of effectiveness to future periods are subject to risk that controls may become inadequate because of changes in conditions or that the degree of compliance with the policies or procedures may deteriorate.
Based on its assessment, management has concluded that the Company's internal control over financial reporting was effective as of September 30, 2019.2021.
The effectiveness of internal control over financial reporting as of September 30, 2019, has been audited by Delap LLP, the independent registered public accounting firm who also audited the Company's consolidated financial statements. Delap LLP's attestation report on the Company's internal control over financial reporting is included in "Item 8. Financial Statements and Supplementary Data."
The management of the Company has assessed the Company's compliance with the Federal laws and regulations pertaining to insider loans and the Federal and, if applicable, State laws and regulations pertaining to dividend restrictions during the fiscal year that ended on September 30, 2019.2021. Management has concluded that the Company complied with the Federal laws and regulations pertaining to insider loans and the Federal and, if applicable, State laws and regulations.
Date: December 9, 2019 8, 2021
|
| | | | | | | |
| /s/ Michael R. Sand | | /s/ Dean J. Brydon |
| Michael R. Sand | | Dean J. Brydon |
| President and Chief Executive Officer | | Chief Financial Officer |
Item 9B. Other Information
None.
Item 9C. Disclosure Regarding Foreign Jurisdictions that Prevent Inspections
Not applicable.
PART III
Item 10. Directors, Executive Officers and Corporate Governance
The information required by this item is contained under the section captioned “Proposal I - Election of Directors” in the Company’s Definitive Proxy Statement for the 20192021 Annual Meeting of Stockholders (“Proxy Statement”) and is incorporated herein by reference.
For information regarding the executive officers of the Company and the Bank, see “Item 1. Business - Executive Officers of the Registrant.”
Compliance with Section 16(a) of the Exchange Act
The information required by this item is contained under the section captioned “Section 16(a) Beneficial Ownership Reporting Compliance” included in the Company’s Proxy Statement and is incorporated herein by reference.
Audit Committee Matters and Audit Committee Financial Expert
The Company has a separately designated standing Audit Committee, which as of September 30, 20192021 was composed of Directors Stoney, Smith, Goldberg and Davis.Suter. Each member of the Audit Committee is “independent” as defined in the Nasdaq Stock Market listing standards. The Company’s Board of Directors has designated DirectorDirectors Stoney and Suter as the Audit Committee financial expert,experts, as defined in the SEC’s Regulation S-K. Directors Stoney, Smith, Goldberg and DavisSuter are independent as that term is used in Item 7(c) of Schedule 14A promulgated under the Exchange Act.
Code of Ethics
The Board of Directors ratified its Code of Ethics for the Company’s officers (including its senior financial officers), directors and employees during the year ended September 30, 2019.2021. The Code of Ethics requires the Company’s officers, directors and employees to maintain the highest standards of professional conduct. The Company’s Code of Ethics was filed as an exhibit to its Annual Report on Form 10-K for the year ended September 30, 2003 and is available on our website at www.timberlandbank.com.
Nomination Procedures
There have been no material changes to the procedures by which stockholders may recommend nominees to the Company’s Board of Directors.
Item 11. Executive Compensation
The information required by this item is contained under the sections captioned “Executive Compensation” and “Directors’ Compensation” included in the Company’s Proxy Statement and is incorporated herein by reference.
Item 12. Security Ownership of Certain Beneficial Owners and Management and Related Stockholder Matters
(a)Security Ownership of Certain Beneficial Owners.
The information required by this item is contained under the section captioned “Security Ownership of Certain Beneficial Owners and Management” included in the Company’s Proxy Statement and is incorporated herein by reference.
(b)Security Ownership of Management.
The information required by this item is contained under the sections captioned “Security Ownership of Certain Beneficial Owners and Management” and “Proposal I - Election of Directors” included in the Company’s Proxy Statement and is incorporated herein by reference.
(c)Changes In Control.
The Company is not aware of any arrangements, including any pledge by any person of securities of the Company, the operation of which may at a subsequent date result in a change in control of the Company.
(d)Equity Compensation Plan Information.
Equity Compensation Plan Information
The following table summarizes share and exercise price information about the Company’s equity compensation plans as of September 30, 2019:2021:
| | | | | | | | | | | | | | | | | | | | | | | | | | | | | |
| Plan category | Number of securities to be issued upon exercise of outstanding options, warrants and rights | | Weighted-average exercise price of outstanding options, warrants and rights | | Number of securities remaining available for future issuance under equity compensation plans (excluding securities reflected in column (a)) |
| (a) | | (b) | | (c) |
Equity compensation plans
approved by security holders: | | | | | |
| 2003 Stock Option Plan | 42,000 | | | | $ | 9.10 | | | | — | | |
| | | | | |
Timberland Bancorp, Inc. 2014
Equity Incentive Plan: | 245,815 | | | | | 22.92 | | | | 17,926 | | |
| | | | | |
Timberland Bancorp, Inc. 2019
Equity Incentive Plan: | 119,000 | | | | | 23.33 | | | | 231,000 | | |
Equity compensation plans
not approved by security holders | — | | | | — | | | | — | | |
| | | | | |
| Total | 406,815 | | | | $ | 21.62 | | | | 248,926 | | |
|
| | | | | | | | | | | | |
| Plan category | Number of securities to be issued upon exercise of outstanding options, warrants and rights | | Weighted-average exercise price of outstanding options, warrants and rights | | Number of securities remaining available for future issuance under equity compensation plans (excluding securities reflected in column (a)) |
| | (a) | | (b) | | (c) |
Equity compensation plans approved by security holders: | | | | | |
| 2003 Stock Option Plan | 87,575 |
| | | $ | 8.45 |
| | | — |
| |
| | | | | | |
Timberland Bancorp, Inc. 2014 Equity Incentive Plan: | 290,729 |
| | | | 21.07 |
| | | 30,076 |
| |
| | | | | | |
Equity compensation plans not approved by security holders | — |
| | | — | | | | — |
| |
| | | | | | |
| Total | 378,304 |
| | | $ | 18.15 |
| | | 30,076 |
| |
Item 13. Certain Relationships and Related Transactions, and Director Independence
The information required by this item is contained under the sections captioned “Meetings and Committees of the Board of Directors And Corporate Governance Matters - Corporate Governance - Related Party Transactions” and “Meetings and Committees of the Board of Directors and Corporate Governance Matters - Corporate Governance - Director Independence” included in the Company's Proxy Statement and are incorporated herein by reference.
Item 14. Principal Accounting Fees and Services
The information required by this item is contained under the section captioned “Proposal 4-Ratification3 - Ratification of Selection of Independent Auditor” included in the Company’s Proxy Statement and is incorporated herein by reference.
PART IV
Item 15. Exhibits and Financial Statement Schedules
(a) Exhibits
|
| | | | | | | |
2.13.1 | | |
3.1 | | |
3.33.2 | | |
| 4.1 | | |
| 4.2 | | |
| 10.1 | | |
| 10.2 | | |
10.3 | | |
| | |
| 10.3 | | |
| 10.4 | | |
| 10.5 | | |
| 10.6 | | |
| 10.7 | | |
| 10.8 | | |
| 10.9 | | |
1410.10 | | |
| 10.11 | | |
| 10.12 | | |
| 10.13 | | |
| 14 | | |
| 21 | | |
| 23.1 | | |
| 31.1 | | |
| 31.2 | | |
| 32 | | |
| 101 | | The following materials from Timberland Bancorp, Inc.’s Annual Report on Form 10-K for the year ended September 30, 2019,2021, formatted in Extensible Business Reporting Language (XBRL): (a) Consolidated Balance Sheets; (b) Consolidated Statements of Income; (c) Consolidated Statements of Comprehensive Income; (d) Consolidated Statements of Shareholders’ Equity; (e) Consolidated Statements of Cash Flows; and (f) Notes to Consolidated Financial Statements |
____________
| |
(1) | Incorporated by reference to the Registrant's Current Report on Form 8-K filed May 23, 2018. |
| |
(2) | Filed as an exhibit to the Registrant's Registration Statement on Form S-1 (333-35817) and incorporated by reference. |
| |
(3) | Incorporated by reference to the Registrant’s Current Report on Form 8-K filed October 1, 2018. |
| |
(4) | Filed as an exhibit to the Registrant's Statement on Form S-1 (333-35817) and incorporated by reference. |
| |
(5) | Incorporated by reference to the Registrant's Current Report on Form 8-K filed April 16, 2007. |
| |
(6) | Incorporated by reference to the Registrant's 2004 Annual Meeting Proxy Statement dated December 24, 2003. |
| |
(7) | Incorporated by reference to Exhibit 99.2 included in the Registrant’s Registration Statement on Form S-8 (333-1161163). |
| |
(8) | Incorporated by reference to the Registrant’s Current Report of Form 8-K filed on March 29, 2013. |
| |
(9) | Attached as Appendix A to the Registrant's Annual Meeting Proxy Statement filed on December 19, 2014. |
| |
(10) | Incorporated by reference to the Registrant's Annual Report on Form 10-K for the year ended September 30, 2003. |
___________
(1)Filed as an exhibit to the Registrant's Registration Statement on Form S-1 (333-35817) and incorporated by reference.
(2)Incorporated by reference to the Registrant’s Current Report on Form 8-K filed August 25, 2021. (3)Filed as an exhibit to the Registrant's Statement on Form S-1 (333-35817) and incorporated by reference.
(4)Incorporated by reference to the Registrant's Annual Report on Form 10-K for year ended September 30, 2019.
(5)Incorporated by reference to the Registrant's Current Report on Form 8-K filed April 16, 2007.
(6)Incorporated by reference to the Registrant's 2004 Annual Meeting Proxy Statement dated December 24, 2003.
(7)Incorporated by reference to Exhibit 99.2 included in the Registrant’s Registration Statement on Form S-8(333-116163).
(8)Incorporated by reference to the Registrant’s Current Report of Form 8-K filed on March 29, 2013.
(9)Attached as Appendix A to the Registrant's Annual Meeting Proxy Statement filed on December 19, 2014.
(10)Attached as Appendix A to the Registrant's Annual Meeting Proxy Statement filed on December 18, 2019.
(11)Incorporated by reference and included in the Registrant's Registration Statement on Form S-8 (333-240040).
(12)Incorporated by reference to the Registrant's Annual Report on Form 10-K for the year ended September 30, 2003.
Item 16. Form 10-K Summary
None.
SIGNATURES
Pursuant to the requirements of Section 13 or 15(d) of the Securities Exchange Act of 1934, the registrant has duly caused this report to be signed on its behalf by the undersigned, thereunto duly authorized.
|
| | | | | | | | | | |
| TIMBERLAND BANCORP, INC. |
| | |
Date: December 9, 20198, 2021 | By: | /s/Michael R. Sand |
| | | Michael R. Sand |
| | | President and Chief Executive Officer |
Pursuant to the requirements of the Securities Exchange Act of 1934, this report has been signed below by the following persons on behalf of the registrant and in the capacities and on the dates indicated.
| | | | | | | | |
| SIGNATURES | TITLE | DATE |
|
| /s/Michael R. Sand | President, Chief Executive Officer and | December 8, 2021 |
| Michael R. Sand | Director |
| (Principal Executive Officer) | |
|
| /s/Jon C. Parker | Chairman of the Board | December 8, 2021 |
| Jon C. Parker | |
| | |
| /s/Dean J. Brydon | Chief Financial Officer | December 8, 2021 |
| Dean J. Brydon | (Principal Financial and Accounting Officer) |
|
| /s/Parul Bhandari | Director | December 8, 2021 |
| Parul Bhandari | | |
|
| /s/Andrea M. Clinton | Director | December 8, 2021 |
| Andrea M. Clinton | | |
| | |
SIGNATURES | TITLE | DATE |
|
/s/Michael R. Sand | President, Chief Executive Officer and | December 9, 2019 |
Michael R. Sand | Director |
| (Principal Executive Officer) | |
|
/s/Jon C. Parker | Chairman of the Board | December 9, 2019 |
Jon C. Parker | |
| | |
/s/Dean J. Brydon | Chief Financial Officer | December 9, 2019 |
Dean J. Brydon | (Principal Financial and Accounting Officer) |
|
/s/Andrea M. Clinton | Director | December 9, 2019 |
Andrea M. Clinton |
|
/s/James A. Davis | Director | December 9, 2019 |
James A. Davis | | |
| | |
/s/Larry D. Goldberg | Director | December 9, 2019 |
Larry D. Goldberg |
| | |
| /s/Kathy D. Leodler | Director | December 9, 20198, 2021 |
| Kathy D. Leodler | | |
|
/s/David A. Smith | Director | December 9, 2019 |
David A. Smith |
|
/s/Michael J. Stoney | Director | December 9, 2019 |
Michael J. Stoney |
| | |
/s/Daniel D. Yerrington | Director | December 9, 2019 |
Daniel D. Yerrington |
EXHIBIT INDEX
|
| | |
| /s/David A. Smith | Director | December 8, 2021 |
| David A. Smith | | |
Exhibit No. |
| Director | Description of Exhibit _______ __, 2021 |
| Michael J. Stoney | |
|
| | |
4.2/s/Kelly A. Suter | Director | December 8, 2021 |
21Kelly A. Suter | | |
23.1 | | |
31.1 | | |
31.2 | | |
32 | | |
101 | | The following materials from Timberland Bancorp, Inc.’s Annual Report on Form 10-K for the year ended September 30, 2019, formatted in Extensible Business Reporting Language (XBRL): (a) Consolidated Balance Sheets; (b) Consolidated Statements of Income; (c) Consolidated Statements of Comprehensive Income; (d) Consolidated Statements of Shareholders’ Equity; (e) Consolidated Statements of Cash Flows; and (f) Notes to Consolidated Financial Statements
|