UNITED STATES
SECURITIES AND EXCHANGE COMMISSION | x |
TANNUAL REPORT PURSUANT TO SECTION 13 OR 15(d) OF THE SECURITIES EXCHANGE ACT OF 1934
|
| |
For the fiscal year ended March 31, 2009 2012 |
| |
OR |
| |
£ o
| TRANSITION REPORT PURSUANT TO SECTION 13 OR 15(d) OF THE SECURITIES EXCHANGE ACT OF 1934 |
|
For the transition period from ___________ to ___________ |
| Commission File Number 000-28827 |
Commission File Number 000-28827
(Exact name of registrant as specified in its charter)
| FLORIDA | 65-0680967 |
FLORIDA
| 65-0680967
|
(State or other jurisdiction of | (IRS Employer |
incorporation or organization) | Identification No.) |
| |
1441 S.W. 29th Avenue, Pompano Beach, Florida 33069 |
(Address of principal executive offices) (Zip Code) |
|
Registrant’s telephone number, including area code: (954) 979-5995 |
|
Securities registered under Section 12(b) of the Act: |
|
Title of each class |
| Name of each exchange on which registered | |
| | | | |
| COMMON STOCK, $.001 PAR VALUE | | The NASDAQ Stock Market LLC (NASDAQ Global Select Market) | |
| | |
| Securities registered under Section 12(g) of the Act: | |
| | |
| NONE | |
___________________________
Indicate by check mark if the registrant is a well-known seasoned issuer, as defined in Rule 405 of the Securities Act. Yes£o NoSx
Indicate by check mark if the registrant is not required to file reports pursuant to Section 13 or Section 15(d) of the Act. Yes£o NoSx
Indicate by check mark whether the registrant (1) has filed all reports required to be filed by Section 13 or 15(d) of the Securities Exchange Act of 1934 during the preceding 12 months (or for such shorter period that the registrant was required to file such reports), and (2) has been subject to such filing requirements for the past 90 days. YesSx No£o
Indicate by check mark whether the registrant has submitted electronically and posted on its corporate website, if any, every Interactive Data File required to be submitted and posted pursuant to Rule 405 of Regulation S-T (§ 229.405 of this chapter) during the preceeding12 months (or for such shorter period that the registrant was required to submit and post such files). Yes£x No£o
Indicate by check mark if disclosure of delinquent filers pursuant to Item 405 of Regulation S-K is not contained herein, and will not be contained, to the best of registrant'sregistrant’s knowledge, in definitive proxy or information statements incorporated by reference in Part III of this Form 10-K or any amendment to this Form 10-K. Sx
Indicate by check mark whether the registrant is a large accelerated filer, an accelerated filer, a non-accelerated filer, or a smaller reporting company. See definition of “accelerated filer”, “large accelerated filer”, and “smaller reporting company” in Rule 12b-2 of the Exchange Act. (check one):
| | | | |
| Large accelerated filer | £
o | | Accelerated filer | S
x |
| Non-accelerated filer | £
o | | Smaller reporting company | £
|
(Do not check if smaller reporting company)
| | | | o |
Indicate by check mark whether the registrant is a shell company (as defined in Rule 12b-2 of the Exchange Act). Yes£o NoSx
The aggregate market value of the registrant’s common stock held by non-affiliates of the registrant as of September 30,
2008,2011, the last business day of the registrant’s most recently completed second fiscal quarter, was
$363,284,000$177.0 million based on the closing sales price of the registrant’s Common Stock on that date, as reported on the NASDAQ Global Select Market.
The number of shares of the registrant’s Common Stock outstanding as of
June 1, 2009May 28, 2012 was
22,722,803.
20,334,941.
DOCUMENTS INCORPORATED BY REFERENCE
Information to be set forth in our Proxy Statement relating to our
20092012 Annual Meeting of Stockholders to be held on July
31, 200927, 2012 is incorporated by reference in Items 10, 11, 12, 13, and 14 of Part III of this report.
2012 Annual Report on Form 10-K
TABLE OF CONTENTS
| | | | | Page |
PART I | | Page
| | 1 |
PART I
| Item 1. | | Business | | 1 |
| Item 1. Business1A. | 1
| Risk Factors | | 6 |
| Item 1A. Risk Factors
| 6
|
| Item 1B. | | Unresolved Staff Comments | | 11 |
| Item 2. Properties | | Properties | | 11 |
| Item 3. | | Legal Proceedings | | 11 |
| Item 4. Submission of Matters to a Vote of Security Holders | | Mine Safety Disclosures | | 11 |
| | | | | |
PART II | | | | 12 |
| Item 5. | | Market for Registrant'sRegistrant’s Common Equity, Related Stockholder
Matters and Issuer Purchases of Equity Securities | | 12 |
| Item 6. | | Selected Financial Data | | 15 |
| Item 7. | | Management’s Discussion and Analysis of Financial Condition
and Results of Operations | | 16 |
| Item 7A. | | Quantitative and Qualitative Disclosures About Market Risk | 24
| 23 |
| Item 8. | | Financial Statements and Supplementary Data | 25
| 24 |
| Item 9. | | Changes in and Disagreements With Accountants on Accounting
and Financial Disclosure | 48
| 44 |
| Item 9A. | | Controls and Procedures | 48
| 44 |
| Item 9B. | | Other Information | 48
| 44 |
| | | | | |
PART III | | 49
| | 45 |
| Item 10. | | Directors, Executive Officers, and Corporate Governance | 49
| 45 |
| Item 11. | | Executive Compensation | 49
| 45 |
| Item 12. | | Security Ownership of Certain Beneficial Owners and
Management and Related Stockholder Matters | 49
| 45 |
| Item 13. | | Certain Relationships and Related Transactions, and Director
Independence | 49
| 45 |
| Item 14. | | Principal Accountant Fees and Services | 49
| 45 |
| | | | | |
PART IV | | 50
| | 46 |
| Item 15. | | Exhibits, Financial Statement Schedules | 50
| 46 |
| | | | | |
SIGNATURES | | 51
47 |
CAUTIONARY STATEMENT REGARDING FORWARD-LOOKING INFORMATION
Certain information in this Annual Report on Form 10-K includes forward-looking statements within the meaning of Section 27A of the Securities Act of 1933 and Section 21E of the Securities Exchange Act of 1934. You can identify these forward-looking statements by the words "believes," "intends," "expects," "may," "will," "should," "plan," "projects," "contemplates," "intends," "budgets," "predicts," "estimates," "anticipates,"“believes,” “intends,” “expects,” “may,” “will,” “should,” “plan,” “projects,” “contemplates,” “intends,” “budgets,” “predicts,” “estimates,” “anticipates,” or similar expressions. These statements are based on our beliefs, as well as assumptions we have used based upon information currently available to us. Because these statements reflect our current views concerning future events, these statements involve risks, uncertainties and assumptions. Actual future re sultsresults may differ significantly from the results discussed in the forward-looking statements. A reader, whether investing in our common stock or not, should not place undue reliance on these forward-looking statements, which apply only as of the date of this Annual Report.
When used in this Annual Report on Form 10-K, "PetMed“PetMed Express," "1-800-PetMeds,"” “1-800-PetMeds,” “PetMeds,” "PetMed,"“PetMed,” “PetMeds.com,” "PetMed“PetMed Express.com," "the” “the Company," "we," "our,"” “we,” “our,” and "us"“us” refer to PetMed Express, Inc. and our wholly-owned subsidiaries.
PetMed Express, Inc. and subsidiaries, d/b/a 1-800-PetMeds, is a leading nationwide pet pharmacy. The Company markets prescription and non-prescription pet medications, and other health products for dogs
cats, and
horsescats, direct to the consumer. The Company offers consumers an attractive alternative for obtaining pet medications in terms of convenience, price, and speed of delivery.
The Company markets its products through national television, online, and direct mail/print advertising campaigns, which aim to increase the recognition of the “1-800-PetMeds” brand name, and “PetMeds” family of trademarks, increase traffic on its website atwww.1800petmeds.com,acquire new customers, and maximize repeat purchases. Our fiscal year end is March 31, our executive offices are located at 1441 S.W. 29th Avenue, Pompano Beach, Florida 33069, and our telephone number is (954) 979-5995.
We offer a broad selection of products for dogs
cats, and
horses.cats. Our current product line contains approximately
750 skus.1200 SKUS. These products include a majority of the well-known brands of medication, such as Frontline Plus®, K9 Advantix®
, II, Advantage®
, II, Heartgard Plus®, Sentinel®, Interceptor®, Program®, Revolution®, Deramaxx®, and Rimadyl®. Generally, our prices are competitive with the prices for medications charged by veterinarians and retailers.
In March 2010, the Company started offering for sale additional pet supplies on our website, which are drop shipped to our customers by third parties. These pet supplies include: food, beds, crates, stairs, strollers, and other popular pet supplies.
We research new products, and regularly select new products or the latest generation of existing products to become part of our product selection. In addition, we also refine our current products to respond to changing consumer-purchasing habits. Our website is designed to give us the flexibility to change featured products or promotions. Our product line provides customers with a wide variety of selections across the most popular health categories for dogs
cats, and
horses.cats. Our current products include:
Non-Prescription Medications (OTC) and supplies: Flea and tick control products, bone and joint care products, vitamins, andtreats, nutritional supplements, hygiene products, and hygiene products.
supplies.
Prescription Medications (Rx): Heartworm preventatives, arthritis, thyroid, and arthritisdiabetes, pain medications, antibiotics, and other specialty medications, as well as generic substitutes.
The following table provides a breakdown of the percentage of our total sales by each category during the indicated periods:
| | | | | |
| Year Ended March 31, |
| 2009 | | 2008 | | 2007 |
Non-prescription medications | 68% | | 69% | | 70% |
Prescription medications | 31% | | 30% | | 29% |
Shipping and handling charges and other | 1% | | 1% | | 1% |
Total | 100% | | 100% | | 100% |
| | | Year Ended March 31, | |
| | | 2012 | | | 2011 | | | 2010 | |
Non-prescription medications and supplies | | | 59 | % | | | 61 | % | | | 64 | % |
| Prescription medications | | | 40 | % | | | 38 | % | | | 35 | % |
| Shipping and handling charges and other | | | 1 | % | | | 1 | % | | | 1 | % |
| Total | | | 100 | % | | | 100 | % | | | 100 | % |
We offer our products through three main sales channels: Internet through our website, telephone contact center through our toll-free number, and direct mail/print through 1-800-PetMeds catalogs, brochures, and postcards. We have designed our catalogs and website to provide a convenient, cost-effective, and informative shopping experience that encourages consumers to purchase products important for a pet’s health and quality of life. We believe that these multiple channels allow us to increase the visibility of our brand name and provide our customers with increased shopping flexibility and excellent service.
We seek to combine our product selection and pet health information with the shopping ease of the Internet to deliver a convenient and personalized shopping experience. Our website offers health and nutritional product selections for dogs
cats, and
horses,cats, and relevant editorial and easily obtainable or retrievable resource information. From our home page, customers can search our website for products and access resources on a variety of information on dogs
cats, and
horses.cats. Customers can shop at our website by category, product line,
individual product, or
individual product.symptom. We attracted approximately
1619.1 million visitors to our website during fiscal
2009,2012, approximately
12%13% of those visitors placed an order, and our website generated approximately
65%75% of our total sales for the same time period.
In February 2006, we began sponsorship of a website called "PetHealth101"“PetHealth101” which is located atwww.PetHealth101.com. In PetHealth101, pet owners have access to health information covering pets’ behavior and illnesses, and natural and pharmaceutical remedies specifically for a pet’s problems. During fiscal 2012, the PetHealth101 content was incorporated into our main website. The pet education content on our main website is continuallyperiodically updated with the latest research for pet owners.
Our customer care representatives receive and process inbound
and outbound customer calls,
facilitate our outbound campaigns around maximizing customers’ reorders, facilitate our live web chat, and process customer e-mails. Our telephone system is equipped with certain features including pop-up screens and call blending capabilities that give us the ability to efficiently utilize our customer care representatives’ time, providing excellent customer care, service, and support. Our customer care representatives receive a base salary and are rewarded with commissions for sales, and bonuses and other awards for achieving certain
quality goals.
The 1-800-PetMeds catalog is a full-color catalog that features our most popular products. The catalog is produced by a combination of in-house writers, production artists, and independent contractors. We mail catalogs, brochures, and postcards in response to requests generated from our advertising and as part of direct mail campaigns to our customers.
Approximately
2,500,0002.7 million customers have purchased from us within the last two years. We attracted approximately
802,000722,000 and
710,000645,000 new customers in fiscal
20092012 and
2008,2011, respectively. Our customers are located throughout the United States, with approximately 50% of customers residing in California, Florida,
Texas, New York,
Texas, Pennsylvania, Virginia,
Georgia, North Carolina, and New Jersey.
While ourOur primary focus has been on retail customers
we have also sold various non-prescription medications wholesale to a variety of businesses, including pet stores, groomers, and
traditional retailers in the
United States. For the fiscal year ended March 31, 2009, the majority of our sales were made to retail customers with less than 1% of our sales made to wholesale customers. The average
retail purchase was approximately
$82$76 for fiscal
20092012 compared to
$80$79 for fiscal
2008.
2011.The goal of our marketing strategy is to build brand recognition, increase customer traffic, add new customers, build strong customer loyalty, maximize reorders, and develop incremental revenue opportunities. We have an integrated marketing campaign that includes television advertising,
online marketing, direct mail/print and
e-mail, and online marketing.
e-mail.
Our television advertising is designed to build brand equity, create brand awareness, and generate initial purchases of products via the telephone and the Internet. We have used :30 and :15 second television commercials to attract new customer orders. Our television commercials typically focus on our ability to rapidly deliver to customers the same medications offered by veterinarians, but at reduced prices. We generally purchase advertising on national cable channels to target our key demographic group – women, ages 30 to 65. We believe that television advertising is particularly effective and instrumental in building brand awareness.
Our most current television commercial, airing nationally, speaks to pet owners about the savings and convenience of purchasing the same exact pet medications from 1-800-PetMeds, compared to purchasing the medications from a veterinarian. Direct Mail/Print and E-mail
We use direct mail/print and e-mail to acquire new customers and to remind our existing customers to reorder.
We supplement our traditional advertising with online advertising and marketing efforts. We make our brand available to Internet consumers by purchasing targeted keywords and achieving prominent placement on the top search engines and search engine networks, including Google, Microsoft Network,Bing™, and Yahoo.Yahoo®. We utilize Internet bannerdisplay and video advertisements, social media, and comparison shopping, and we are also members of the LinkShare Network, which is an affiliate program with merchant clients and affiliate websites. This network
Direct Mail/Print and E-mail
We use direct mail/print and e-mail to acquire new customers and to remind our existing customers to reorder.
Operations
Order Processing
Our website allows customers to easily browse and purchase all of our products online. Our website is designed to
developbe fast, secure, and
build a long-term, branded affiliate program ineasy to use with order
to increaseand shipping confirmations, and with online
sales and establish an Internet presence. The LinkShare Network enables us to establish link arrangements with other websites, as well as with portals and search engines.
Operations
Purchasing
We purchase our products from a variety of sources, including certain manufacturers, domestic distributors, and wholesalers. We have multiple suppliers for each of our products to obtain the lowest cost. There are currently three suppliers from whom we purchased approximately 50% of all products in fiscal 2009. We purchase the majority of our health and nutritional supplements directly from manufacturers. We believe having strong relationships with product manufacturers will ensure the availability of an adequate volume of products ordered by our customers, and will enable us to provide more and better product information. Historically, substantially all the major manufacturers of prescription and non-prescription medications have declined to sell these products to direct marketing companies, such as our Company. (See Risk Factors.) Part of our growth strategy includes develo ping direct relationships with the leading pharmaceutical manufacturers of the more popular prescription and non-prescription medications.
Order Processing
order tracking capabilities. We provide our customers with toll-free telephone access to our customer care representatives. Our call center generally operates from 8:00 AM to 11:00 PM, Monday through Thursday, 8:00 AM to 9:00 PM on Friday, 9:00 AM to 6:00 PM on Saturday, and 10:00 AM to 5:00 PM on Sunday, Eastern Time. The process of customers purchasing products from 1-800-PetMeds consists of a few simple steps. A customer first places a call to our toll-free telephone number or visits our website. The following information is needed to process prescription orders: general pet information, prescription information, and the veterinarian’s name and phone number. This information is entered into our computer system. Then our pharmacists and pharmacy technicians verify all prescriptions. The order process system checks for the verification for prescription medication orders and a valid payment method fo rfor all orders. An invoice is generated and printed in our fulfillment center, where items are picked, for shipping. The product(s) in the customer’s order areand then selected from the Company's inventory and
shipped via United States Postal Service, United Parcel Service,Federal Express, or Federal Express.UPS. Our customers enjoy the convenience of rapid home delivery, with approximately 75%80% of all orders being shipped within 24 hours of ordering. Our website allows customers to easily browse and purchase substantially all of our products online. Our website is designed to be fast, secure, and easy to use with order and shipping confirmations, and with online order tracking capabilities.
Warehousing and Shipping
We inventory our products and fill all customer orders from our corporate headquarters in Pompano Beach, Florida. We have an in-house fulfillment and distribution operation, which is used to manage the entire supply chain, beginning with the placement of the order, continuing through order processing, and then fulfilling and shipping of the product to the customer. We offer a variety of shipping options, including next day delivery. We ship to anywhere in the United States served by the United States Postal Service, United Parcel Service, or Federal Express. Priority orders are expedited in our fulfillment process. Our goal is to ship the products the same day that the order is received. For prescription medications, our goal is to ship the product immediately after the prescription has been authorized by the customer’s veterinarian.
Customer Care and Support
We believe that a high level of customer care and support is critical in retaining and expanding our customer base. Customer care representatives participate in ongoing training programs under the supervision of our training managers. These training sessions include a variety of topics such as product knowledge, computer usage, customer service tips, and the relationship between our Company and veterinarians. Our customer care representatives respond to customers’ e-mails and calls that are related to products, order status, prices, and shipping. Our customer care representatives also respond to customers through our live web chat. We believe our customer care representatives are a valuable source of feedback regarding customer satisfaction. Our customer returns and credits
averageaveraged approximately
1.5 %1.5% of total
sales.
sales for fiscal 2012.
Warehousing and Shipping
We inventory our products and fill most customer orders from our corporate headquarters in Pompano Beach, Florida. We have an in-house fulfillment and distribution operation, which is used to manage the entire supply chain, beginning with the placement of the order, continuing through order processing, and then fulfilling and shipping of the product to the customer. We offer a variety of shipping options, including next day delivery. We ship to anywhere in the United States served by the United States Postal Service, Federal Express, or UPS. Priority orders are expedited in our fulfillment process. Our goal is to ship the products the same day that the order is received. For prescription medications, our goal is to ship the product immediately after the prescription has been authorized by the customer’s veterinarian.
Purchasing
We purchase our products from a variety of sources, including certain manufacturers, domestic distributors, and wholesalers. There were four suppliers from whom we purchased approximately 50% of all products in fiscal 2012. We purchase the majority of our health and nutritional supplements directly from manufacturers. We believe having strong relationships with product manufacturers will ensure the availability of an adequate volume of products ordered by our customers, and will enable us to provide more and better product information. Historically, substantially all the major manufacturers of prescription and non-prescription medications have declined to sell these products to direct marketing companies, such as our Company. (See Risk Factors.) Part of our growth strategy includes developing direct relationships with the leading pharmaceutical manufacturers of the more popular prescription and non-prescription medications. In March 2010 Bayer started making their products available directly to pet specialty retailers and internet sites, including our Company.
We utilize integrated technologies in our call centers, e-commerce, order entry, and inventory control/fulfillment operations. Our systems are custom configured by the Company to optimize our computer telephone integration and mail-order processing. The systems are designed to maintain a large database of specialized information and process a large volume of orders efficiently and effectively. Our systems provide our customer care representatives, and our customers on our website, with real time product availability information and updated customer information to enhance our customer care. We also have an integrated direct connection for processing credit cards to ensure that a valid credit card number and authorization have been received at the same time our customer care representatives are on the phone with the customer or when a customer submits an order on our website. Our
informati oninformation systems provide our customer care representatives with records of all prior contact with a customer, including the customer’s address, phone number, e-mail address,
fax number, prescription information, order history, payment history, and notes.
The pet medications market is competitive and highly fragmented. Our competitors consist of veterinarians,
online and traditional
retailers, and other mail-order and online retailers of pet medications and other health products.retailers. We believe that the following are the principal competitive factors in our market:
·
Product selection and availability, including the availability of prescription and non-prescription medications;
·
Brand recognition;
·
Reliability and speed of delivery;
·
Personalized service and convenience;
·
Price; and
·
Quality of website content.
| ● | Product selection and availability, including the availability of prescription and non-prescription medications; |
| ● | Reliability and speed of delivery; |
| ● | Personalized service and convenience; |
| ● | Quality of website content. |
We compete with veterinarians for the sale of prescription and non-prescription pet medications and other health products. Many pet owners may prefer the convenience of purchasing their pet medications or other health products at the time of a veterinarian visit, or may be hesitant to offend their veterinarian by not purchasing these products from the veterinarian. In order to effectively compete with veterinarians, we must continue to educate pet owners about the service, convenience, and savings offered by our Company.
According to the American Pet Products Manufacturers Association, pet spending in the United States increased 5.3% to
$43.4$51.0 billion in
2008.2011. Pet supplies and medications represented
$10.3$11.8 billion, or
24%23% of the total spending on pets in the United States. The pet medication market that we participate in is estimated to be approximately
$3.6$4.0 billion, with veterinarians having the majority of the market share. The dog and cat population is approximately
163165 million, with approximately
63%62% of all households owning a pet.
We believe that the following are the main competitive strengths that differentiate 1-800-PetMeds from the competition:
·
“1-800-PetMeds” brand name;
·
Exceptional customer care and support;
·
Consumer benefit structure of savings and convenience; and
·
Licensed pharmacy to conduct business in 50 states.
| ● | Channel leader, in an estimated $4.0 billion industry; |
| ● | “1-800-PetMeds” brand name; |
| ● | Licensed pharmacy to conduct business in 50 states, and awarded Vet-VIPPSCM (Veterinary-Verified Internet Pharmacy Practice Site) accreditation by the National Association of Boards of Pharmacy®; |
| ● | Exceptional customer care and support |
We conduct our business under the trade name “1-800-PetMeds” and use a family of names all containing the term “PetMeds” or “PetMed” in some form. We believe this trade name, which is also our toll-free telephone number, and the “PetMeds” family of trademarks, have added significant value and are an important factor in the marketing of our products. We have also obtained the right to use and control the Internet addresseswww.1800petmeds.com, www.1888petmeds.com, www.petmedexpress.com,www.1888petmeds.com,www.petmedexpress.com,www.petmed.com, andwww.petmeds.com. We do not expect to lose the ability to use the Internet addresses; however, there can be no assur anceassurance in this regard and the loss of these addresses may have a material adverse effect on our financial position and results of operations. We are the exclusive owners of United States Trademark Registrations for “PetMed Express and Design®,” “1888PetMeds and Design®,” “1-800-PetMeds and Design®,” 1-800-PetMeds®,” and “PetMeds®.”
Dispensing prescription medications is governed at the state level by the
BoardBoards of Pharmacy, or similar regulatory agencies, of each state where prescription medications are dispensed. We are subject to regulation by the State of Florida and are licensed as a community pharmacy by the Florida Board of Pharmacy. Our current license is valid until February 28,
20112013, and prior to that date a renewal application will be submitted to the Board of Pharmacy. Our pharmacy practice is also licensed and/or regulated by 49 other state pharmacy boards and, with respect to our products, by other regulatory authorities including, but not necessarily limited to, the United States Food and Drug Administration (“FDA”) and the United States Environmental Protection Agency. As a licensed pharmacy in the State of Florida, we are subject to the Florida Pharmacy Act and regulations promulgated thereunder. To the extent that we are unable to maintain our license as a community pharmacy with the Florida Board of Pharmacy, or if we do not maintain the licenses granted by other state pharmacy boards, or if we become subject to actions by the FDA, or other enforcement regulators, our distribution of prescription medications to pet owners could cease, which could have a material adverse effect on our financial condition and results of operations.
We currently have
248207 full time employees, including:
143125 in customer care and marketing;
3433 in fulfillment and purchasing;
5835 in our pharmacy; 4 in information technology;
43 in administrative positions; and
57 in management. None of our employees are represented by a labor union, or governed by any collective bargaining agreements. We consider relations with our employees to be satisfactory.
We file annual, quarterly, and current reports, proxy statements, and other information with the Securities and Exchange Commission ("SEC"(“SEC”). Our SEC filings, including our annual reports on Form 10-K, quarterly reports on Form 10-Q, current reports on Form 8-K, and any amendments to those reports filed or furnished pursuant to Section 13(a) of the Exchange Act are available to the public free of charge over the Internet aton our website atwww.1800petmeds.com or at the SEC'sSEC’s web site atwww.sec.gov. Our SEC filings will be available through our website as soon as reasonably practicable after we have electronically filed or furnished them to the SEC. Information contained on our website is not incorporated by reference into this annual report on Form 10-K.
5
You may also read and copy any materials we file with the SEC at the SEC's Public Reference Room at 100 F Street, NE, Room 1580, Washington D.C. 20549. You may obtain information on the operation of the Public Reference Room by calling the SEC at 1-800-SEC-0330 or on the Internet atwww.sec.gov/info/edgar/prrrules.htm. The Company’s Code of Business Conduct and Ethics and the charters for each of our committees of the Board of Directors may be found in our 2004 Proxy which was filed on June 30, 2004. You may also obtain a copy of our Code of Business Conduct and Ethics and the charters for each of our committees of the Board of Directors free of charge by contacting investor relations at 1-800-738-6337.
You should carefully consider the risks and uncertainties described below, and all the other information included in this Annual Report on Form 10-K before you decide to invest in our common stock. Any of the following risks could materially adversely affect our business, financial condition, or operating results and could result in a loss of your investment.
We may inadvertently fail to comply with various state regulations covering the dispensing of prescription pet medications which may subject us to reprimands, sanctions, probations, fines, suspensions, or the loss of one or more of our pharmacy licenses. The sale and delivery of prescription pet medications is generally governed by state laws and state regulations. Since our pharmacy is located in the State of Florida, the Company is governed by the laws and regulations of the State of Florida. Each prescription pet medication sale we make is likely also to be covered by the laws of the state where the customer is located. The laws and regulations relating to the sale and delivery of prescription pet medications vary from state to state, but generally require that prescription pet medications be dispensed with the authorization from a prescribing veterinarian. To the extent that we are unable to maintain our license as a community pharmacy with the Florida Board of Pharmacy, or if we do not maintain the licenses granted by other state boards, or if we become subject to actions by the FDA, or other enforcement regulators, our distribution of
pr escriptionprescription medications to pet owners could cease, which could have a material adverse effect on our operations.
The Company is a party to routine litigation and administrative complaints incidental to its business. Management does not believe that the resolution of any or all of such routine litigation and administrative complaints is likely to have a material adverse effect on the Company’s financial condition or results of operations. While we make every effort to fully comply with all applicable state rules, laws, and regulations, from time to time we have been the subject of administrative complaints regarding the authorization of prescriptions prior to shipment. We cannot assure you that we will not continue to be the subject of administrative complaints in the future. We cannot guarantee you that we will not be subject to reprimands, sanctions, probations, or fines, or that one or more of our pharmacy licenses will not be suspended or revoked. If we were unable to maintain our license
a sas a community pharmacy in the State of Florida, or if we are not granted licensure in a state that begins to require licensure, or if one or more of the licenses granted by other state boards should be suspended or revoked, our ability to continue to sell prescription medications and to continue our business as it is presently conducted could be in jeopardy.
We currently purchase a portion of our prescription and non-prescription medications from third party distributors and we are not an authorized distributor of these products. We do not have any guaranteed supply of medications at any pre-established prices.
The majority of our sales were attributable to sales of prescription and non-prescription medications. Historically, substantially all the major pharmaceutical manufacturers have declined to sell prescription and non-prescription pet medications directly to us. In order to assure a supply of these products, we purchase medications from various secondary sources, including a variety of domestic distributors. Our business strategy includes seeking to establish direct purchasing arrangements with major pet pharmaceutical manufacturing companies. If we are not successful in achieving this goal, we will continue to rely upon secondary sources.
We cannot guarantee that if we continue to purchase prescription and non-prescription pet medications from secondary sources that we will be able to purchase an adequate supply to meet our customers’ demands, or that we will be able to purchase these products at competitive prices. As these products represent a significant portion of our sales, our failure to fill customer orders for these products could adversely impact our sales. If we are forced to pay higher prices for these products to ensure an adequate supply, we cannot guarantee that we will be able to pass along to our customers any increases in the prices we pay for these medications. This inability to pass along increased prices could materially adversely affect our financial condition and results of operations.
Our failure to properly manage our inventory may result in excessive inventory carrying costs, or inadequate supply of products, which could materially adversely affect our financial condition and results of operations.
Our current product line contains approximately
7501200 SKUs. A significant portion of our sales is attributable to products representing approximately 90
SKUs.SKUs, including the most popular flea and tick, and heartworm preventative brands. We need to properly manage our inventory to provide an adequate supply of these products and avoid excessive inventory of the products representing the balance of the SKUs. We generally place orders for products with our suppliers based upon our internal estimates of the amounts of inventory we will need to fill future orders. These estimates may be significantly different from the actual orders we receive.
In the event that subsequent orders fall short of original estimates, we may be left with excess inventory. Significant excess inventory could result in price discounts and increased inventory carrying costs. Similarly, if we fail to have an adequate supply of some SKUs, we may lose sales opportunities. We cannot guarantee that we will maintain appropriate inventory levels. Any failure on our part to maintain appropriate inventory levels may have a material adverse effect on our financial condition and results of operations.
Resistance from veterinarians to authorize prescriptions, or attempts/efforts on their part to discourage pet owners to purchase from internet mail-order pharmacies could cause our sales to decrease and could materially adversely affect our financial condition and results of operations.
Since we began our operations some veterinarians have resisted providing our customers with a copy of their pet’s prescription or authorizing the prescription to our pharmacy staff, thereby effectively preventing us from filling such prescriptions under state law. We have also been informed by customers and consumers that veterinarians have tried to discourage pet owners from purchasing from internet mail-order pharmacies. Sales of prescription medications represented approximately
31%40% of our sales for the fiscal year. Although veterinarians in some states are required by law to provide a pet owner with a prescription if medically appropriate, if the number of veterinarians who refuse to authorize prescriptions should increase, or if veterinarians are successful in discouraging pet owners from purchasing from internet mail-order pharmacies, our sales could decrease and our financial condition
a ndand results of operations may be materially adversely affected.
Significant portions of our sales are made to residents of
nineeight states. If we should lose our pharmacy license in one or more of these states, our financial condition and results of operations would be materially adversely affected.
While we ship pet medications to customers in all 50 states, approximately 50% of our sales for the fiscal year ended March 31,
20092012 were made to customers located in the states of California, Florida,
Texas, New York,
Texas, Pennsylvania, Virginia,
Georgia, North Carolina, and New Jersey. If for any reason our license to operate a pharmacy in one or more of those states should be suspended or revoked, or if it is not granted or renewed, our ability to sell prescription medications to residents of those states would cease and our financial condition and results of operations in future periods would be materially adversely affected.
We face significant competition from veterinarians and online and traditional retailers and may not be able to compete profitably with them.
We compete directly and indirectly with veterinarians for the sale of pet medications and other health products. Veterinarians hold a competitive advantage over us because many pet owners may find it more convenient or preferable to purchase these products directly from their veterinarians at the time of an office visit. We also compete directly and indirectly with both online and traditional
retailers of pet medications and health and nutritional supplements.retailers. Both online and traditional retailers may hold a competitive advantage over us because of longer operating histories, established brand names, greater resources, and/or an established customer base. Online retailers may have a competitive advantage over us because of established affiliate relationships to drive traffic to their website. Traditional retailers may hold a competitive advantage over us because pet owners may prefer to purchase these products from a store instead of online or through catalog or telephone methods. In order to effectively compete in the future, we may be required to offer promotions and other incentives, which may result in lower operating margins
orand adversely affect the results of operations.
We also face a significant challenge from our competitors forming alliances with each other, such as those between online and traditional retailers. These relationships may enable both their retail and online stores to negotiate better pricing and better terms from suppliers by aggregating the demand for products and negotiating volume discounts, which could be a competitive disadvantage to us.
The content of our website could expose us to various kinds of liability, which, if prosecuted successfully, could negatively impact our business.
Because we post product and pet health information and other content on our website, we face potential liability for negligence, copyright infringement, patent infringement, trademark infringement, defamation, and/or other claims based on the nature and content of the materials we post. Various claims have been brought, and sometimes successfully prosecuted, against Internet content distributors. We could be exposed to liability with respect to the unauthorized duplication of content or unauthorized use of other parties’ proprietary technology.
Although we maintain general liability insurance, our insurance may not cover potential claims of this type, or may not be adequate to indemnify us for all liability that may be imposed. Any imposition of liability that is not covered by insurance, or is in excess of insurance coverage, could materially adversely affect our financial condition and results of operations.
We may not be able to protect our intellectual property rights, and/or we may be found to infringe on the proprietary rights of others.
We rely on a combination of trademarks, trade secrets, copyright laws, and contractual restrictions to protect our intellectual property rights. These afford only limited protection. Despite our efforts to protect our proprietary rights, unauthorized parties may attempt to copy our non-prescription private label generic equivalents, when and if developed, as well as aspects of our sales formats, or to obtain and use information that we regard as proprietary, including the technology used to operate our website and our content, and our trademarks. Litigation or proceedings before the United States Patent and Trademark Office or other bodies may be necessary in the future to enforce our intellectual property rights, to protect our trade secrets and domain names,
andor to determine the validity and scope of the proprietary rights of others. Any litigation or adverse proceeding could result in substantial costs and diversion of resources, and could seriously harm our business and operating results.
Third parties may also claim infringement by us with respect to past, current, or future technologies. We expect that participants in our market will be increasingly involved in infringement claims as the number of services and competitors in our industry segment grows. Any claim, whether meritorious or not, could be time-consuming, result in costly litigation, cause service upgrade delays, or require us to enter into royalty or licensing agreements. These royalty or licensing agreements might not be available on terms acceptable to us or at all.
If we are unable to protect our Internet addresses or to prevent others from using Internet addresses that are confusingly similar, our business may be adversely impacted.
Our Internet addresses,www.1800petmeds.com, www.1888petmeds.com, www.petmedexpress.com, www.1888petmeds.com,www.petmedexpress.com,www.petmed.com, andwww.petmeds.comare critical to our brand recognition and our overall success. If we are unable to protect these Internet addresses, our competitors could capitalize on our brand recognition. We are aware of substantiallyThere may be similar Internet addressesusedaddresses used by competitors. Governmental agencies and their designees generally regulate the acquisition and maintenance of Internet addresses. The regulation of Internet addresses in the United States and in foreign countries has changed, and may undergo further change in the near future. Further more,Furthermore, the relationship between regulations governing Internet addresses and laws protecting trademarks and similar proprietary rights is unclear. Therefore, we may not be able to protect our own Internet addresses, or prevent third parties from acquiring Internet addresses that are confusingly similar to, infringe upon, or otherwise decrease the value of our Internet addresses.
Since all of our operations are housed in a single location, we are more susceptible to business interruption in the event of damage to or disruptions in our facility.
Our headquarters and distribution center are located in two buildings in
one location in South Florida, and
allmost of our shipments of products to our customers are made from this sole distribution center. We have no present plans to establish any additional distribution centers or offices. Because we consolidate our operations in one location, we are more susceptible to power and equipment failures, and business interruptions in the event of fires, floods, and other natural disasters than if we had additional locations. Furthermore, because we are located in South Florida, which is a hurricane-sensitive area, we are particularly susceptible to the risk of damage to, or total destruction of, our headquarters and distribution center and surrounding transportation infrastructure caused by a hurricane. We cannot assure you that we are adequately insured to cover the amount of any losses relating to any of these
pot entialpotential events, business interruptions resulting from damage to or destruction of our headquarters and distribution center, or power and equipment failures relating to our call center or websites, or interruptions or disruptions to major transportation infrastructure, or other events that do not occur on our premises. The
occurrence of one or more of these events could adversely impact our ability to generate revenues in future periods.
A portion of our sales are seasonal and our
Our operating results are difficult to predict and may
fluctuate.
fluctuate, and a portion of our sales are seasonal.
Factors that may cause our operating results to fluctuate include:
| ● | Our ability to obtain new customers at a reasonable cost, retain existing customers, or encourage reorders; |
| ● | Our ability to increase the number of visitors to our website, or our ability to convert visitors to our website into customers; |
| ● | The mix of medications and other pet products sold by us; |
| ● | Our ability to manage inventory levels or obtain an adequate supply of products; |
| ● | Our ability to adequately maintain, upgrade, and develop our website, the systems that we use to process customers’ orders and payments, or our computer network; |
| ● | Increased competition within our market niche; |
| ● | New products introduced to the market, including generics; |
| ● | Increases in the cost of advertising; |
| ● | The amount and timing of operating costs and capital expenditures relating to expansion of our product line or operations; |
| ● | Disruption of our toll-free telephone service, technical difficulties, or systems and Internet outages or slowdowns; and |
| ● | Unfavorable general economic trends. |
Because our operating results are difficult to predict, we believe that quarter-to-quarter comparisons of our operating results are not a good indication of our future performance. The majority of our product sales are affected by the seasons, due to the seasonality of mainly heartworm, and flea and tick medications. For the quarters ended June 30,
2008,2011, September 30,
2008,2011, December 31,
2008,2011, and March 31,
2009,2012, Company sales were 31%,
27%24%,
20%21%, and
22%24%, respectively. In addition to the seasonality of our sales, our annual and quarterly operating results have fluctuated in the past and may fluctuate significantly in the future due to a variety of factors, many of which are out of our control.
Factors that may cause our operating results to fluctuate include:
·
Our ability to obtain new customers at a reasonable cost, retain existing customers, or encourage reorders;
·
Our ability to increase the number of visitors to our website, or our ability to convert visitors to our website into customers;
·
The mix of medications and other pet products sold by us;
·
Our ability to manage inventory levels or obtain an adequate supply of products;
·
Our ability to adequately maintain, upgrade, and develop our website, the systems that we use to process customers’ orders and payments, or our computer network;
·
Increased competition within our market niche;
·
Price competition;
·
Increases in the cost of advertising;
·
The amount and timing of operating costs and capital expenditures relating to expansion of our product line or operations; and
·
Disruption of our toll-free telephone service, technical difficulties, or systems and Internet outages or slowdowns.
Any change in one or more of these factors could materially adversely affect our financial condition and results of operations in future periods.
Our stock price fluctuates from time to time and may fall below expectations of securities analysts and investors, and could subject us to litigation, which may result in you suffering a loss on your investment.
The market price of our common stock may fluctuate significantly in response to a number of factors, many of which are out of our control. These factors include: quarterly variations in operating results; changes in accounting treatments or principles; announcements by us or our competitors of new products and services offerings; significant contracts, acquisitions, or strategic relationships; additions or departures of key personnel; any future sales of our common stock or other securities; stock market price and volume fluctuations of publicly-traded companies; and general political, economic, and market conditions.
In some future quarter our operating results may fall below the expectations of securities analysts and investors, which could result in a decrease in the trading price of our common stock. In the past, securities class action litigation has often been brought against a company following periods of volatility in the market price of its securities. We may be the target of similar litigation in the future. Securities litigation could result in substantial costs and divert
management'smanagement’s attention and resources, which could seriously harm our business and operating results.
We may issue additional shares of preferred stock that could defer a change of control or dilute the interests of our common stockholders. Our charter documents could defer a takeover effort which could inhibit your ability to receive an acquisition premium for your shares.
Our charter permits our Board of Directors to issue up to
5,000,0005.0 million shares of preferred stock without stockholder approval. Currently there are 2,500 shares of our Convertible Preferred Stock issued and outstanding. This leaves
4,997,500a little less than 5.0 million shares of preferred stock available for issuance at the discretion of our Board of Directors. These shares, if issued, could contain dividend, liquidation, conversion, voting, or other rights which could adversely affect the rights of our common stockholders and which could also be utilized, under some circumstances, as a method of discouraging, delaying, or preventing a change in control. Provisions of our articles of incorporation, bylaws and Florida law could make it more difficult for a third party to acquire us, even if many of our stockholders believe it is in their best interest.
9
Our investments in auction rate securities are subject to risks which may adversely affect our liquidity.
At March 31, 2009, the Company had $14,650,000 (par) invested in auction rate securities (“ARS”) which were classified as long term investments in our financial statements as of March 31, 2009. Our ARS investments are not mortgage-backed based but are municipal-based and the securities underlying the ARS are currently rated AAA, the highest rating available by a rating agency. Our ARS consist of closed-end fund preferred ARS, whose interest rates are reset, typically every seven to twenty-eight days. Liquidity for our ARS historically has been provided by an auction process which has allowed us the opportunity to sell the securities at each auction date, and for those securities not sold, resets the applicable interest rate every seven or twenty-eight days. Although auctions had been successful for periods immediately subsequent to February 2008, recently auctions for our ARS ha ve failed which therefore has eliminated our ability to sell these securities through the standard auction process. Currently there is no liquid market for these securities. There is no assurance that future auctions in our ARS will succeed. An auction failure means that the parties wishing to sell their securities cannot be matched with an adequate volume of buyers. In the event that there is a failed auction the indenture governing the security requires the issuer to pay interest at a contractually defined rate which may or may not correspond to market rates for other types of similar short-term instruments. Our securities for which auctions have failed will continue to accrue interest at the contractual rate and be subject to the auction process every seven or twenty-eight days until the auction succeeds, the issuer redeems the securities, or the security matures. As a result, our ability to liquidate our investment in these securities and use the cash proceeds in the near term may be limited.
The fair value of our ARS investments was determined based on quoted market prices at the reporting date for those instruments in fiscal 2008, and in fiscal 2009 the fair value was based upon a valuation assessment by an outside third party. As of March 31, 2009, the Company held $14,650,000 (par) in ARS, which were classified as long term investments and the Company recorded an unrealized impairment loss of $219,750, in the fourth quarter of fiscal 2009, within accumulated other comprehensive income (loss), based upon an assessment of the fair value of these ARS. The $219,750 impairment was recorded as temporary due to the fact that the Company has both the ability and intent to hold these securities until anticipated recovery or maturity. However, it could take until the final maturity or issuer refinancing of the underlying debt for us to realize the recorded value of our investments in these sec urities. If the issuers of our ARS are unable to successfully close future auctions or redeem or refinance the securities and their credit ratings deteriorate, we may in the future be required to record an additional impairment charge on these investments, or may need to sell these securities on a secondary market. Although we believe we will be able to liquidate our investments in these securities without any significant loss, the timing and financial impact of such an outcome is uncertain. Based on our expected cash expenditures, our cash and cash equivalents balance, and other potential sources of cash, we do not anticipate that the potential lack of liquidity of these investments in the near term will adversely affect our ability to execute our current business plan.
The United States Environmental Protection Agency (“EPA”) has
issued an advisory regarding increased scrutiny ofannounced its intention to increase restrictions on flea and tick
control products
for pets.and to caution consumers to use these products with extra care. The Company’s sales and profits in future periods could be adversely impacted if sales for these products decline.
The EPA is intensifying its evaluationtaking a series of actions to increase the safety of spot-on pesticide products for flea and tick control due to recent increases in the number of reported adverse reactions in pets treated with these products,for cats and has issued a an advisory.dogs. In 2008 the EPA received 44,000 complaints about certain “spot-on” pest prevention products, including some flea and tick control products that the Company currently sells. The complaints reported adverse reactions ranging from mild effects such as skin irritations to more serious effects such as seizures and, in some cases, death of the pet. While,Since that time, the EPA has statedreceived additional information from the pet spot-on pesticide registrants and others and began an intensive evaluation of these products. Among immediate actions that its main objective with the advisoryEPA is going to simply advise consumerspursue are: requiring manufacturers of spot-on pesticide products to improve labeling, making instructions clearer to prevent product misuse; requiring more precise label instructions to ensure proper dosage per pet weight; requiring clear markings to differentiate between dog and pet owners to exercise caution when using thesecat products, and to ensure that product instructions are followed carefullydisallowing similar brand names for dog and correctly, therecat products. There can be no assurances that this advisoryaction by the EPA will not adversely affect our f uturefuture sales and profits.
profits. A failure of our information systems or any security breach or unauthorized disclosure of confidential information could have a material adverse effect on our business.
Our business is dependent upon the efficient operation of our information systems. In particular, we rely on our information systems to effectively manage our business model strategy, with tools to track and manage sales, inventory, marketing, customer service efforts, the preparation of our consolidated financial and operating data, credit card information, and customer information. The failure of our information systems to perform as designed or the failure to maintain and enhance or protect the integrity of these systems could disrupt our business operations, impact sales and the results of operations, expose us to customer or third-party claims, or result in adverse publicity. Additionally, we collect, process, and retain sensitive and confidential customer information in the normal course of our business. Despite the security measures we have in place and any additional measures we may implement in the future, our facilities and systems, and those of our third-party service providers, could be vulnerable to security breaches, computer viruses, lost or misplaced data, programming errors, human errors, acts of vandalism, or other events. Any security breach or event resulting in the misappropriation, loss, or other unauthorized disclosure of confidential information, whether by us directly or our third-party service providers, could damage our reputation, expose us to the risks of litigation and liability, disrupt our business, or otherwise affect our results of operations.
ITEM 1B. UNRESOLVED STAFF COMMENTS
None
Our facilities, including our principal executive offices, are located at 1441 S.W. 29th Avenue and 2900 Gateway Drive, Pompano Beach, Florida 33069. The Company leases its 50,00065,300 square foot executive offices, and warehouse facility and its 15,300 square foot customer service and pharmacy contact centers under a non-cancelable operating lease, through May 31, 2012.2015. The Company is responsible for certain maintenance costs, taxes, and insurance under this lease. The future minimum annual lease payments are as follows: $702,000$767,000 for fiscal 2010, $723,0002013, $784,000 for fiscal 2011, $745,0002014, $794,000 for fiscal 2012,2015, and $125,000$133,000 for fiscal 2013.2016, a lease payment total of $2.5 million. Rent expense was $745,000, $724,000, and $703,000 for the years ended March 31, 2012, 2011 and 2010, respectively. We believe that our facilities are sufficient for our current needs and are in good condition in all material respects.
ITEM 3. LEGAL PROCEEDINGS
In October 2009, the Company was notified that it was named as a defendant in a multi-defendant lawsuit, filed in the United States District Court for the Eastern District of Texas, Marshall Division, seeking declaratory, injunctive, and monetary relief styled Charles E. Hill & Associates, Inc. v. ABT Electronics, Inc., et al, Cause No. 2:09-CV-313. The lawsuit alleges that the Company is infringing on patents related to electronic catalog systems. From the outset, the vendor that provides the Company with the Internet software had been defending and indemnifying the Company. However, effective February 15, 2011, the company that acquired this vendor declined to provide any further indemnification of the Company. On October 5, 2011, the parties engaged in court-ordered mediation, which was unsuccessful. Without admitting any liability or wrongdoing, and with no finding or admission as to the merit or lack of merit of any claim or defense asserted in connection with the litigation, in May 2012, the Company entered into a licensing agreement, for a confidential amount, and a Stipulation of Dismissal was filed with the Court, dismissing the lawsuit against the Company.
The Company has settled complaints that had been filed with various states’ pharmacy boards in the past. There can be no assurances made that other states will not attempt to take similar actions against the Company in the future. The Company initiates litigation to protect its trade or service marks. There can be no assurance that the Company will be successful in protecting its trade or service marks. Legal costs related to the above matters are expensed as incurred.
ITEM 4.
SUBMISSION OF MATTERS TO A VOTE OF SECURITY HOLDERSNo matter was submitted to a vote of our stockholders during the fourth quarter of the fiscal year ended March 31, 2009.
MINE SAFETY DISCLOSURESNot applicable.
PART II
ITEM 5. MARKET FOR REGISTRANT’S COMMON EQUITY, RELATED STOCKHOLDER MATTERS AND ISSUER PURCHASES OF EQUITY SECURITIES
Our common stock, par value $.001 per share, began trading publicly in 1997.
Our common stock is
currently traded on the NASDAQ Global Select Market (“NASDAQ”) under the symbol “PETS.” The prices set forth below reflect the range of high and low closing sale prices per share in each of the quarters of fiscal
20092012 and
20082011 as reported by the NASDAQ.
These prices represent quotations among dealers without adjustments for retail mark-ups, markdowns, or commissions, and may not represent actual transactions.
| | |
Fiscal 2009: | High | Low |
First Quarter | $14.00 | $10.96 |
Second Quarter | $15.90 | $12.21 |
Third Quarter | $19.00 | $13.02 |
Fourth Quarter | $18.29 | $13.26 |
| | |
Fiscal 2008: | High | Low |
First Quarter | $13.60 | $10.78 |
Second Quarter | $15.98 | $12.88 |
Third Quarter | $15.07 | $11.99 |
Fourth Quarter | $13.47 | $10.45 |
| | Fiscal 2012: | | High | | | Low | |
| | First Quarter | | $ | 15.89 | | | $ | 11.53 | |
| | Second Quarter | | $ | 12.28 | | | $ | 8.91 | |
| | Third Quarter | | $ | 10.55 | | | $ | 8.57 | |
| | Fourth Quarter | | $ | 12.72 | | | $ | 10.17 | |
| | | | | | | | | | |
| | Fiscal 2011: | | High | | | Low | |
| | First Quarter | | $ | 24.50 | | | $ | 17.34 | |
| | Second Quarter | | $ | 18.45 | | | $ | 15.45 | |
| | Third Quarter | | $ | 18.80 | | | $ | 15.21 | |
| | Fourth Quarter | | $ | 17.89 | | | $ | 14.39 | |
There were
8988 holders of record of our common stock at May
31, 2009,28, 2012, and
we estimate there were approximately 12,000
of our holders are “street name” or beneficial
stockholders on that date.
holders, whose shares are held by banks, brokers, or other financial institutions.
Dividend Policy
The Company has never paid cash dividends
On August 3, 2009, the Company’s Board of Directors declared its first quarterly dividend of $0.10 per share on its common stock. We presently intendOn August 2, 2010, the Company’s Board of Directors increased the quarterly dividend to retain$0.125 per share, and then on January 27, 2012, the Company’s Board of Directors increased the quarterly dividend to $0.15 per share. The Company intends to continue to pay regular quarterly dividends; however the declaration and payment of future earningsdividends is discretionary and will be subject to financea determination by the expansionBoard of Directors each quarter following its review of the Company’s financial performance.
During fiscal 2012, our business. Our futureBoard of Directors declared the following dividends:
| | | | Per Share | | | | Total Amount | | |
| | Declaration Date | | Dividend | | Record Date | | (In thousands) | | Payment Date |
| | May 6, 2011 | | $ | 0.125 | | May 16, 2011 | | $ | 2,782 | | May 27, 2011 |
| | July 29, 2011 | | $ | 0.125 | | August 12, 2011 | | $ | 2,626 | | August 26, 2011 |
| | October 28, 2011 | | $ | 0.125 | | November 11, 2011 | | $ | 2,542 | | November 25, 2011 |
| | January 27, 2012 | | $ | 0.150 | | February 10, 2012 | | $ | 3,051 | | February 24, 2012 |
On May 4, 2012, the Company’s Board of Directors declared a quarterly dividend
policy will dependof $0.15 per share on
our earnings, capital requirements, expansion plans, financial condition, and other relevant factors.
Securities Authorized for Issuance under Equity Compensation Plans
its common stock. The following table sets forth securities authorized for issuance under equity compensation plans, including individual compensation arrangements, by us under our 1998 Stock Option Plan, 2006 Employee Equity Compensation Restricted Stock Plan, and 2006 Outside Director Equity Compensation Restricted Stock Plan as$3.1 million dividend was paid on May 25, 2012, to shareholders of March 31, 2009:
| | | | | | | |
EQUITY COMPENSATION PLAN INFORMATION |
| | | | | | | |
| | Number of securities | | | | | |
| | to be issued upon | | Weighted average | | | |
| | exercise of outstanding | | exercise price of | | Number of securities | |
| | options, warrants | | outstanding options, | | remaining available | |
Plan category | | and rights | | warrants and rights | | for future issuance | |
| | | | | | | |
1998 Stock Option Plan (1) | | 147,914 | | $7.27 | | - | |
| | | | | | | |
2006 Employee Restricted Stock Plan | 247,609 | | - | | 752,391 | |
| | | | | | | |
2006 Director Restricted Stock Plan | | 68,000 | | - | | 132,000 | |
| | | | | | | |
Total | | 463,523 | | | | 884,391 | |
(1) The 1998 Stock Option Plan expiredrecord at the close of business on July 31, 2008.
May 14, 2012.
On November 8, 2006, the
Company announced that theCompany’s Board of Directors
authorized theapproved a share repurchase
plan of up to
$20,000,000 of the Company’s common stock.$20.0 million. On October 31, 2008,
November 1, 2010, and August 1, 2011, the Company’s Board of Directors approved a second,
third, and fourth share repurchase
program of up to $20,000,000. Thisplan, respectively, each for an additional $20.0 million. The repurchase plan is intended to be implemented through purchases made from time to time in either the open market or through private transactions at the
Company'sCompany’s discretion, subject to market conditions and other factors, in accordance with Securities and Exchange Commission requirements.
There can be no assurances as to the precise number of shares that will be repurchased under the share repurchase plan, and the Company may discontinue the share repurchase plan at any time subject to compliance with applicable regulatory requirements. Shares purchased pursuant to the share repurchase plan will either be retiredcancelled or held in the Company'sCompany’s treasury. Any share repurchase would reduce our available cash.
During fiscal
2009 we2012 the Company repurchased approximately
1,347,0002.1 million shares of
ourthe Company’s outstanding common stock for approximately
$18,448,000,$23.7 million, averaging approximately
$13.70$11.36 per share. As of March 31, 2012, the Company had approximately $14.0 million remaining under the Company’s share repurchase plan. During fiscal 2011 the Company repurchased approximately 791,000 shares of the Company’s outstanding common stock for approximately $12.2 million, averaging approximately $15.47 per share. All shares repurchased in fiscal
20092012 and 2011 were subsequently retired.
The table below provides information with respect to purchases by the Company of shares of common stock during the three months ended March 31, 2009:
| | | | | | | | | | |
Month / Year | | Total Number of Shares Purchased | | Average Price Paid Per Share | | Total Number of Shares Purchased as Part of Publicly Announced Program | | Approximate Dollar Value of Shares That May Yet Be Purchased Under the Program |
| | | | | | | | |
January 2009
(January 1, 2009 to January 31, 2009) | | 180,617 | | $ | 14.72 | | 180,617 | | $ | 18,964,580 |
| | | | | | | | | | |
February 2009
(February 1, 2009 to February 28, 2009) | | 541,228 | | $ | 14.02 | | 541,228 | | $ | 11,378,394 |
| | | | | | | | | | |
March 2009
(March 1, 2009 to March 31, 2009) | | 106,700 | | $ | 13.37 | | 106,700 | | $ | 9,951,739 |
Since the inception of the share repurchase plan, approximately 2,299,0005.2 million shares have been repurchased under the plan for approximately $30,048,000, and$66.0 million, averaging approximately $9,952,000 remains$12.75 per share, with approximately $14.0 million remaining available for repurchase, as of June 1, 2009.
May 28, 2012.
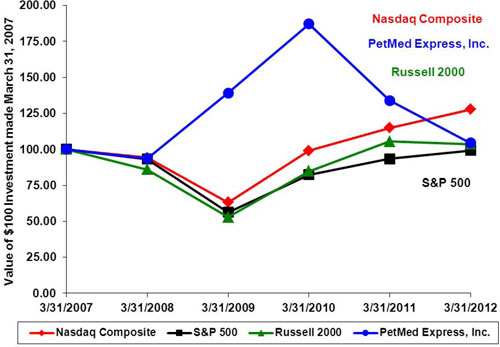
Set forth below is a graph comparing the five year cumulative performance of our Common Stock with the Standard & Poor’s Composite-500 Stock Index (the “S&P 500”), the Nasdaq Composite, and the Russell 2000, from March 31,
20042007 to March 31,
2009.2012. The graph assumes that $100 was invested on March 31,
20042007 in each of our Common Stock, the S&P 500, the Nasdaq Composite, and the Russell 2000 and that all dividends were reinvested. The performance graph and related information below shall not be deemed “filed” with the Securities and Exchange Commission, nor shall such information be incorporated by reference into any future filing under the Securities Act of 1933 or Securities Exchange Act of 1934, each as amended, except to the extent that we specifically incorporate it by reference into such filing.

Performance graph data:
| | | | | | |
| Fiscal Year Ended March 31, |
| 2004 | 2005 | 2006 | 2007 | 2008 | 2009 |
Nasdaq Composite | 100.00 | 100.25 | 117.33 | 121.43 | 114.29 | 76.65 |
S&P 500 | 100.00 | 104.83 | 114.98 | 126.16 | 117.45 | 70.85 |
Russell 2000 | 100.00 | 104.19 | 129.62 | 135.64 | 116.54 | 71.61 |
PetMed Express, Inc. | 100.00 | 67.36 | 161.55 | 107.73 | 100.82 | 149.82 |
| | | Fiscal Year Ended March 31, | |
| | | 2007 | | | 2008 | | | 2009 | | | 2010 | | | 2011 | | | 2012 | |
| Nasdaq Composite | | | 100.00 | | | | 94.11 | | | | 63.12 | | | | 99.02 | | | | 114.84 | | | | 127.66 | |
| S&P 500 | | | 100.00 | | | | 93.09 | | | | 56.15 | | | | 82.30 | | | | 93.31 | | | | 99.13 | |
| Russell 2000 | | | 100.00 | | | | 85.92 | | | | 52.80 | | | | 84.75 | | | | 105.35 | | | | 103.70 | |
| PetMed Express, Inc. | | | 100.00 | | | | 93.59 | | | | 139.07 | | | | 187.09 | | | | 133.84 | | | | 104.47 | |
Securities Authorized for Issuance under Equity Compensation Plans
The following table sets forth securities authorized for issuance under equity compensation plans, including individual compensation arrangements, by us under our 2006 Employee Equity Compensation Restricted Stock Plan and 2006 Outside Director Equity Compensation Restricted Stock Plan as of March 31, 2012:
| EQUITY COMPENSATION PLAN INFORMATION | |
| (In thousands, except for per share amounts) | |
| | | Number of securities | | | | | | Number of securities | |
| | | to be issued upon | | | Weighted average | | | remaining available | |
| | | exercise of outstanding | | | exercise price of | | | for future issuance | |
| | | options, warrants | | | outstanding options, | | | under equity | |
| Plan category | | and rights | | | warrants and rights | | | compensation plans | |
| | | | | | | | | | |
| 2006 Employee Restricted Stock Plan | | | 542 | | | | - | | | | 458 | |
| | | | | | | | | | | | | |
| 2006 Director Restricted Stock Plan | | | 152 | | | | - | | | | 48 | |
| | | | | | | | | | | | | |
| Total | | | 694 | | | | | | | | 506 | |
ITEM 6. SELECTED FINANCIAL DATA
The following selected financial data should be read together with "Management's“Management’s Discussion and Analysis of Financial Condition and Results of Operations,"” the Consolidated Financial Statements and notes thereto, and other financial information included elsewhere in this Annual Report on Form 10-K. The Consolidated Statements of Income data set forth below for the fiscal years ended March 31, 2009, 2008,2012, 2011, and 20072010 and the Consolidated Balance Sheet data as of March 31, 20092012 and 20082011 have been derived from our audited Consolidated Financial Statements which are included elsewhere in this Annual Report on Form 10-K. The Consolidated Statements of Income data set forth below for the fiscal years ended March 31, 20062009 and 20052008 and the Consolidated Balance Sheet data as of March 31, 2007, 20062010, 2009 and 20052008 have been derived from our audited Consolidated Financial Statements which are not included in this A nnualAnnual Report on Form 10-K. CONSOLIDATED STATEMENTS OF INCOME DATA
(In thousands, except for per share amounts)
| | | Fiscal Year Ended March 31, | |
| | | 2012 | | | 2011 | | | 2010 | | | 2009 | | | 2008 | |
| | | | | | | | | | | | | | | | |
| Sales | | $ | 238,250 | | | $ | 231,642 | | | $ | 238,266 | | | $ | 219,412 | | | $ | 188,336 | |
| Cost of sales | | | 158,085 | | | | 147,686 | | | | 146,405 | | | | 134,085 | | | | 114,122 | |
| Gross profit | | | 80,165 | | | | 83,956 | | | | 91,861 | | | | 85,328 | | | | 74,214 | |
| Operating expenses | | | 54,143 | | | | 50,932 | | | | 51,319 | | | | 51,127 | | | | 46,218 | |
| Net income | | | 16,659 | | | | 20,871 | | | | 26,002 | | | | 22,976 | | | | 20,022 | |
| Net income per common share: | | | | | | | | | | | | | | | | | | | | |
| Basic | | | 0.81 | | | | 0.93 | | | | 1.15 | | | | 0.99 | | | | 0.83 | |
| Diluted | | | 0.80 | | | | 0.92 | | | | 1.14 | | | | 0.98 | | | | 0.82 | |
Weighted average number of common shares outstanding: | | | | | | | | | | | | | | | | | | | | |
| Basic | | | 20,613 | | | | 22,514 | | | | 22,617 | | | | 23,306 | | | | 24,088 | |
| Diluted | | | 20,708 | | | | 22,643 | | | | 22,746 | | | | 23,482 | | | | 24,299 | |
Cash dividends declared per common share | | | 0.525 | | | | 0.475 | | | | 0.300 | | | | - | | | | - | |
CONSOLIDATED BALANCE SHEET DATA DATA
(In thousands)
| | | March 31, | |
| | | 2012 | | | 2011 | | | 2010 | | | 2009 | | | 2008 | |
| | | | | | | | | | | | | | | | |
| Working capital | | $ | 78,216 | | | $ | 80,643 | | | $ | 79,412 | | | $ | 54,630 | | | $ | 38,804 | |
| Total assets | | | 91,064 | | | | 106,287 | | | | 104,170 | | | | 81,963 | | | | 73,455 | |
| Total liabilities | | | 9,883 | | | | 9,282 | | | | 7,313 | | | | 6,995 | | | | 6,421 | |
| Shareholders’ equity | | | 81,181 | | | | 97,005 | | | | 96,857 | | | | 74,968 | | | | 67,034 | |
NON FINANCIAL DATA (UNAUDITED) | | | | | | | | | | |
STATEMENTS OF INCOME |
| |
| Fiscal Year Ended March 31, |
| 2009 | 2008 | 2007 | 2006 | 2005 |
| | | | | |
Sales | $ | 219,412,247 | $ | 188,336,469 | $ | 162,246,407 | $ | 137,583,155 | $ | 108,357,747 |
Cost of sales | | 134,084,680 | | 114,122,433 | | 97,680,238 | | 83,244,366 | | 64,700,002 |
Gross profit | | 85,327,567 | | 74,214,036 | | 64,566,169 | | 54,338,789 | | 43,657,745 |
Operating expenses | | 51,126,582 | | 46,218,424 | | 43,066,144 | | 36,193,545 | | 31,156,119 |
Net income | | 22,976,411 | | 20,022,231 | | 14,443,502 | | 12,063,514 | | 8,010,370 |
Net income per common share: | | | | | | | | | | |
Basic | | 0.99 | | 0.83 | | 0.60 | | 0.51 | | 0.35 |
Diluted | | 0.98 | | 0.82 | | 0.60 | | 0.50 | | 0.34 |
Weighted average number of | | | | | | | | | | |
common shares outstanding: | | | | | | | | | | |
Basic | | 23,305,726 | | 24,088,258 | | 24,109,035 | | 23,658,722 | | 22,862,417 |
Diluted | | 23,482,177 | | 24,299,364 | | 24,270,879 | | 24,211,955 | | 23,833,189 |
| | | | | | | | | | |
BALANCE SHEET DATA |
| | | | | |
| March 31, |
| 2009 | 2008 | 2007 | 2006 | 2005 |
| | | | | |
Working capital | $ | 54,630,193 | $ | 38,803,828 | $ | 50,613,455 | $ | 34,968,771 | $ | 21,968,784 |
Total assets | | 81,962,939 | | 73,454,647 | | 61,218,487 | | 42,624,159 | | 28,119,483 |
Total liabilities | | 6,994,935 | | 6,420,672 | | 7,354,914 | | 4,984,630 | | 3,902,419 |
Shareholders' equity | | 74,968,004 | | 67,033,975 | | 53,863,573 | | 37,639,529 | | 24,217,064 |
| | | | | |
NON FINANCIAL DATA (UNAUDITED) |
| | | | | |
| March 31, |
| 2009 | 2008 | 2007 | 2006 | 2005 |
| | | | | |
New customers acquired | 802,000 | 710,000 | 681,000 | 624,000 | 510,000 |
Total accumulated customers (1) | 4,648,000 | 3,846,000 | 3,136,000 | 2,455,000 | 1,831,000 |
| | | | | |
(1) includes both active and inactive customers | | | | | |
(In thousands) | | | March 31, | |
| | | 2012 | | | 2011 | | | 2010 | | | 2009 | | | 2008 | |
| | | | | | | | | | | | | | | | |
| New customers acquired | | | 722 | | | | 645 | | | | 815 | | | | 802 | | | 710 | |
| Total accumulated customers (1) | | | 6,830 | | | | 6,108 | | | | 5,463 | | | | 4,648 | | | | 3,846 | |
(1) includes both active and inactive customers
ITEM 7. MANAGEMENT’S DISCUSSION AND ANALYSIS OF FINANCIAL CONDITION AND RESULTS OF OPERATIONS
PetMed Express was incorporated in the state of Florida in January 1996. The Company’s common stock is traded on the NASDAQ Global Select Market under the symbol “PETS.” The Company began selling pet medications and other pet health products in September 1996.
In March 2010 the Company started offering for sale additional pet supplies on its website, and these items are drop shipped to customers by third party vendors. Presently, the Company’s product line includes approximately
7501,200 of the most popular pet medications,
and other health products,
and supplies for dogs
cats, and
horses.cats.
The Company markets its products through national television, online, and direct mail/print advertising campaigns which direct consumers to order by phone or on the Internet, and aim to increase the recognition of the “1-800-PetMeds” brand name, and “PetMeds” family of trademarks.trademarks, increase traffic on its website at www.1800petmeds.com, acquire new customers, and maximize repeat purchases. Approximately 65%75% of all sales were generated via the Internet in both fiscal 2009 and2012, compared to 71% in fiscal 2008.
2011. The Company’s sales consist of products sold mainly to retail consumers and minimally to wholesale customers. Typically, the Company’s customers pay by credit card or check at the time the order is shipped. The Company usually receives cash settlement in two to three banking days for sales paid by credit cards, which minimizes the accounts receivable balances relative to the Company’s sales.consumers. The Company’s sales returns average was approximately 1.5% of sales for both the fiscal yearsyear ended March 31, 20092012 and 2008.approximately 1.4% for the fiscal year ended March 31, 2011. The twelve-month average purchase was approximately $82$76 and $80$79 per order for the fiscal years ended March 31, 20092012 and 2008,2011, respectively.
Critical Accounting Policies
Our discussion and analysis of our financial condition and the results of our operations are based upon our Consolidated Financial Statements and the data used to prepare them. The Company’s Consolidated Financial Statements have been prepared in accordance with accounting principles generally accepted in the United States of America. On an ongoing basis we re-evaluate our judgments and estimates including those related to product returns, bad debts, inventories,
long term investments, and income taxes. We base our estimates and judgments on our historical experience, knowledge of current conditions, and our beliefs of what could occur in the future considering available information. Actual results may differ from these estimates under different assumptions or conditions. Our estimates are guided by observing the following critical accounting policies.
The Company generates revenue by selling pet medication
and health products and pet supplies primarily to retail
consumers and minimally to wholesale customers.consumers. The Company’s policy is to recognize revenue from product sales upon shipment, when the rights of ownership and risk of loss have passed to the customer. Outbound shipping and handling fees are included in sales and are billed upon shipment. Shipping expenses are included in cost of sales.
The majority of the Company’s sales are paid by credit cards and the Company usually receives the cash settlement in two to three banking days. Credit card sales minimize accounts receivable balances relative to sales. The Company maintains an allowance for doubtful accounts for losses that the Company estimates will arise from customers’ inability to make required payments, arising from either credit card charge-backs or insufficient funds checks. The Company determines its estimates of the uncollectibility of accounts receivable by analyzing historical bad debts and current economic trends. At March 31, 20092012 and 20082011 the allowance for doubtful accounts was approximately $59,000$5,000 and $32,000,$6,000, respectively.
Inventories consist of prescription and non-prescription pet medications
health products, and pet supplies that are available for sale and are priced at the lower of cost or market value using a weighted average cost method. The Company writes down its inventory for estimated obsolescence. The inventory reserve was approximately
$202,000$66,000 and
$135,000 for the fiscal years ended$63,000 as of March 31,
20092012 and
2008,2011, respectively.
The
Company'sCompany’s advertising expense consists primarily of television advertising, Internet marketing, and direct mail/print advertising. Television advertising costs are expensed as the advertisements are televised. Internet costs are expensed in the month incurred and direct mail/print advertising costs are expensed when the related catalogs, brochures, and postcards are produced, distributed, or superseded.
Accounting for income taxes
The Company accounts for income taxes under the provisions of SFAS No. 109,ASC Topic 740, (“Accounting for Income TaxesTaxes”), which generally requires the recognition of deferred tax assets and liabilities for the expected future tax benefits or consequences of events that have been included in the consolidated financial statementsConsolidated Financial Statements or tax returns. Under this method, deferred tax assets and liabilities are determined based on differences between the financial reporting carrying values and the tax bases of assets and liabilities, and are measured by applying enacted tax rates and laws for the taxable years in which those differences are expected to reverse.
The following should be read in conjunction with the Company’s Consolidated Financial Statements and the related notes thereto included elsewhere herein. The following table sets forth, as a percentage of sales, certain operating data appearing in the Company’s Consolidated Statements of Income:
| | | Fiscal Year Ended March 31, | |
| | | 2012 | | | 2011 | | | 2010 | |
| | | | | | | | | | |
| Sales | | | 100.0 | % | | | 100.0 | % | | | 100.0 | % |
| Cost of sales | | | 66.3 | | | | 63.8 | | | | 61.4 | |
| | | | | | | | | | | | | |
| Gross profit | | | 33.7 | | | | 36.2 | | | | 38.6 | |
| | | | | | | | | | | | | |
| Operating expenses: | | | | | | | | | | | | |
| General and administrative | | | 9.4 | | | | 9.6 | | | | 9.4 | |
| Advertising | | | 12.8 | | | | 11.8 | | | | 11.6 | |
| Depreciation | | | 0.6 | | | | 0.6 | | | | 0.6 | |
| Total operating expenses | | | 22.8 | | | | 22.0 | | | | 21.6 | |
| | | | | | | | | | | | | |
| Income from operations | | | 10.9 | | | | 14.2 | | | | 17.0 | |
| | | | | | | | | | | | | |
| Total other income | | | 0.2 | | | | 0.2 | | | | 0.1 | |
| | | | | | | | | | | | | |
| Income before provision for income taxes | | | 11.1 | | | | 14.4 | | | | 17.1 | |
| | | | | | | | | | | | | |
| Provision for income taxes | | | 4.1 | | | | 5.4 | | | | 6.2 | |
| | | | | | | | | | | | | |
| Net income | | | 7.0 | % | | | 9.0 | % | | | 10.9 | % |
| | | | | | |
| Fiscal Year Ended March 31, | |
| | | | | | |
| 2009 | | 2008 | | 2007 | |
Sales | 100.0 | % | 100.0 | % | 100.0 | % |
Cost of sales | 61.1 | | 60.6 | | 60.2 | |
| | | | | | |
Gross profit | 38.9 | | 39.4 | | 39.8 | |
| | | | | | |
Operating expenses: | | | | | | |
General and administrative | 9.8 | | 10.8 | | 10.6 | |
Advertising | 13.1 | | 13.4 | | 15.6 | |
Depreciation and amortization | 0.4 | | 0.3 | | 0.3 | |
Total operating expenses | 23.3 | | 24.5 | | 26.5 | |
| | | | | | |
Income from operations | 15.6 | | 14.9 | | 13.3 | |
| | | | | | |
Total other income (expense) | 0.7 | | 1.2 | | 1.0 | |
| | | | | | |
Income before provision for income taxes | 16.3 | | 16.1 | | 14.3 | |
| | | | | | |
Provision for income taxes | 5.8 | | 5.5 | | 5.4 | |
| | | | | | |
Net income | 10.5 | % | 10.6 | % | 8.9 | % |
Fiscal 20092012 Compared to Fiscal 2008
2011
Sales increased by approximately
$31,076,000,$6.7 million, or
16.5%2.9%, to approximately
$219,412,000$238.3 million for the fiscal year ended March 31,
2009,2012, from approximately
$188,336,000$231.6 million for the fiscal year ended March 31,
2008.2011. The increase in sales for the fiscal year ended March 31,
20092012 was primarily due to increased
retail reordersnew order and
reorder sales. The increase in new
orders. The Company has committed certain dollar amounts specifically designated towards television, direct mail/print, and onlineorder sales may be attributed to increased advertising
to stimulate sales, create brand awareness, and acquire new customers.expenses, with flat customer acquisition costs. The Company acquired approximately
802,000722,000 new customers for the year ended March 31,
2009,2012, compared to approximately
710,000645,000 new customers for the same period the prior year.
There can be no assurances that this growth trend will continue, due to increasing competition from veterinarians and traditional and online retailers.
The following chart illustrates sales by various sales classifications:
| | | | | | | | | | | | | | | | | |
Year Ended March 31, |
| 2009 | | % | | 2008 | | % | | $ Variance | | % Variance |
| | | | | | | | | | | |
Reorder Sales | $ | 156,781,000 | | 71.5 | % | | $ | 134,349,000 | | 71.3 | % | | $ | 22,432,000 | | 16.7 | % |
New Order Sales | $ | 62,478,000 | | 28.5 | % | | $ | 53,766,000 | | 28.6 | % | | $ | 8,712,000 | | 16.2 | % |
Wholesale Sales | $ | 153,000 | | - | % | | $ | 221,000 | | 0.1 | % | | $ | (68,000) | | -30.8 | % |
| | | | | | | | | | | | | | | | | |
Total Net Sales | $ | 219,412,000 | | 100.0 | % | | $ | 188,336,000 | | 100.0 | % | | $ | 31,076,000 | | 16.5 | % |
| | | | | | | | | | | | | | | | | |
Internet Sales | $ | 143,284,000 | | 65.3 | % | | $ | 122,484,000 | | 65.0 | % | | $ | 20,800,000 | | 17.0 | % |
Contact Center Sales | $ | 76,128,000 | | 34.7 | % | | $ | 65,852,000 | | 35.0 | % | | $ | 10,276,000 | | 15.6 | % |
| | | | | | | | | | | | | | | | | |
Total Net Sales | $ | 219,412,000 | | 100.0 | % | | $ | 188,336,000 | | 100.0 | % | | $ | 31,076,000 | | 16.5 | % |
| | | Year Ended March 31, | | | | | | | |
| Sales (In thousands) | | 2012 | | | % | | | 2011 | | | % | | | $ Variance | | | % Variance | |
Reorder Sales | | $ | 186,991 | | | | 78.5 | % | | $ | 184,341 | | | | 79.6 | % | | $ | 2,650 | | | | 1.4 | % |
| New Order Sales | | $ | 51,259 | | | | 21.5 | % | | $ | 47,301 | | | | 20.4 | % | | $ | 3,958 | | | | 8.4 | % |
| Total Net Sales | | $ | 238,250 | | | | 100.0 | % | | $ | 231,642 | | | | 100.0 | % | | $ | 6,608 | | | | 2.9 | % |
| Internet Sales | | $ | 178,758 | | | | 75.0 | % | | $ | 165,473 | | | | 71.4 | % | | $ | 13,285 | | | | 8.0 | % |
| Contact Center Sales | | $ | 59,492 | | | | 25.0 | % | | $ | 66,169 | | | | 28.6 | % | | $ | (6,677 | ) | | | -10.1 | % |
| Total Net Sales | | $ | 238,250 | | | | 100.0 | % | | $ | 231,642 | | | | 100.0 | % | | $ | 6,608 | | | | 2.9 | % |
Sales may be adversely affected in fiscal 2013 due to increased competition and consumers giving more consideration to price and trading down to less expensive brands, including generics. In response to these trends, the Company will maintain a more aggressive advertising and pricing strategy combined with expanding our product offerings to pet supplies and generics. This more aggressive pricing strategy has resulted in a decrease to gross profit margins, and no guarantees can be made that the Company’s efforts will be successful, or that sales will grow in the future. The majority of our product sales are affected by the seasons, due to the seasonality of mainly heartworm, and flea and tick medications. For the quarters ended June 30, September 30, December 31, and March 31 of fiscal
2009,2012, the Company’s sales were approximately 31%,
27%24%,
20%21%, and
22%24%, respectively.
In January 2012, the manufacturer Novartis Consumer Health, Inc. announced that it halted production of their animal health products, including the following brands: Sentinel®, Interceptor®, Program®, Deramaxx®, and Clomicalm®. This disruption is industry wide, and at this time, there is no expected date for production to resume. We are currently asking prescribing veterinarians to prescribe alternate brands as we run out of inventory. This disruption in production has negatively impacted our sales, and if the disruption is prolonged it may negatively impact future sales.
Cost of sales increased by
$19,963,000,$10.4 million, or
17.5%7.0%, to
$134,085,000$158.1 million for the fiscal year ended March 31,
2009,2012, from
$114,122,000$147.7 million for the fiscal year ended March 31,
2008.2011. The increase in cost of sales is directly related to
the increase inincreased sales
in fiscal 2009 as compared to fiscal 2008.and increased product costs. As a
percentpercentage of sales,
the cost of sales was
61.1%66.3% in fiscal
2009,2012, as compared to
60.6%63.8% in fiscal
2008.2011. The
cost of sales percentage increase can be mainly attributed to
more aggressive sales pricing and increases in our product
costs, offset by a reduction in freight expenses due to a shift from priority to standard shipping.
costs.
Gross profit
increaseddecreased by
$11,114,000,$3.8 million, or
15.0%4.5%, to
$85,328,000$80.2 million for the fiscal year ended March 31,
2009,2012, from
$74,214,000$84.0 million for the fiscal year ended March 31,
2008.2011. Gross profit as a percentage of sales for fiscal
20092012 and
20082011 was
38.9%33.7% and
39.4%36.2%, respectively. The gross profit percentage decrease can be mainly attributed to
more aggressive sales promotions and increases in our product
costs, offset by a reduction in freight expenses due to a shift from priority to standard shipping.
costs.
General and administrative expenses
General and administrative expenses increased by
$1,238,000,$163,000, or
6.1%0.7%, to
$21,605,000$22.4 million for the fiscal year ended March 31,
20092012 from
$20,367,000$22.2 million for the fiscal year ended March 31,
2008. General and administrative expenses as a percentage of sales was 9.8% compared to 10.8% for the fiscal years ended March 31, 2009 and 2008, respectively.2011. The increase in general and administrative expenses for the fiscal year ended March 31,
20092012 was primarily due to the following: a
$754,000$307,000 increase in payroll expenses
which can be attributedrelating to
the addition of new employees in the customer care and pharmacy departments
enabling the Company to sustain its growth;and a
$619,000$220,000 increase in
credit card and bank service feesproperty expenses which
is directly attributablewas primarily related to
increased sales inour website. Offsetting the
fiscal year;increase was a
$367,000 increase$220,000 decrease in professional fees, with the majority of the
increase relateddecrease relating to
increased legal fees; a $212,000 increase in prop erty expenses which can be directly attributed to increased rent due to the 15,000 square feet warehouseinvestor relations and pharmacy
expansion;fees, a
$82,000 increase$98,000 decrease in
telephone expenses which can be directly attributed to increased sales; and a $56,000 net increase in bad debt, license, travel, and insurance expenses. Offsetting the increase was a $466,000 reduction in office expenses, a portion of which wasbank service fees due to a
changereduction in
our shipping policy,credit card fees, and a
shift from priority$46,000 net decrease in other expenses including telephone, office expenses, and licenses. General and administrative expenses as a percentage of sales was 9.4% compared to
standard shipping, enacted9.6% for the fiscal years ended March 31, 2012 and 2011, respectively. The decrease in
fiscal 2009. Shipping expenses formerly chargeable as general and administrative expenses
are now qualified as
costa percentage of
sales. Also, offsetting the increase wassales can mainly be attributed to a
$386,000 one-time state/county sales tax charge which was bookedreduction in bank service fees and professional fees in fiscal
2008, relating to state/county sales tax which was not collected on behalf of our customers.
2012.Advertising expenses increased by approximately $3,446,000,$3.0 million, or approximately 13.6%11.0%, to approximately $28,707,000$30.4 million for the fiscal year ended March 31, 20092012, from approximately $25,261,000$27.4 million for the fiscal year ended March 31, 2008.2011. The increase in advertising expenses for fiscal 2012 can be mainly attributed to a more aggressive advertising strategy during the fiscal year ended March 31, 2009 was due to the Company’s plan to commit certain amounts specifically designated towards television, direct mail/print, and online advertising to stimulate sales, create brand awareness, and acquire new customers.year. The advertising costcosts of acquiring a new customer, defined as total advertising costcosts divided by new customers acquired, was $36$42 for both the fiscal years ended March 31, 20092012 and 2008.2011. Advertising cost of acquiring a new customer can be impacted by the advertising environment, the effectiveness of our advertising creative, increased advertising spending, and price competition. Historically, the advertising environment fluctuates due to supply and demand. A more favorable advertising environment may positively impact future new order sales, whereas a less favorable advertising environment may negatively impact future new order sales.
As a percentage of sales, advertising expense was 12.8 % and 11.8% for the fiscal years ended March 31, 2012 and 2011, respectively. The increase in advertising expense as a percentage of total sales for the fiscal year ended March 31, 2012 can be attributed to a more aggressive advertising strategy during fiscal 2012. The Company currently anticipates advertising as a percentage of sales to be approximately 13% for fiscal 2013. However, the advertising percentage will fluctuate quarter to quarter due to seasonality and advertising availability. For the fiscal year ended March 31, 2012, quarterly advertising expenses as a percentage of sales ranged between 11% and 14%.
Depreciation
Depreciation increased by approximately $36,000, to approximately $1.4 million for the year ended March 31, 2012, from approximately $1.4 million for the year ended March 31, 2011. This increase to depreciation for the year ended March 31, 2012 can be attributed to new property and equipment additions relating to the warehouse, pharmacy, and customer call center over the past 2 fiscal years.
Other income
Other income increased by approximately $96,000, to approximately $349,000 for the year ended March 31, 2012 from approximately $253,000 for the year ended March 31, 2011. The increase to other income for the year ended March 31, 2012 can be attributed to the recognition of a federal tax penalty in fiscal 2011. Interest income may decrease in the future as the Company utilizes its cash balances on its share repurchase plan, with approximately $14.0 million remaining as of March 31, 2012, on any quarterly dividend payment, or on its operating activities.
Provision for income taxes
For the fiscal years ended March 31, 2012 and 2011, the Company recorded an income tax provision for approximately $9.7 million and $12.4 million, respectively. The effective tax rate for the fiscal years ended March 31, 2012 and 2011 were 36.8% and 37.3%, respectively. The effective tax rate decrease for the fiscal year ended March 31, 2012, was due to a one-time $280,000 tax adjustment, which was recognized in fiscal 2011, to reconcile the remaining net operating loss carryforward. The Company estimates its effective tax rate will be approximately 37.0% for fiscal 2013.
Net income
Net income decreased by approximately $4.2 million, or 20.2%, to approximately $16.7 million for the fiscal year ended March 31, 2012 from approximately $20.9 million for the fiscal year ended March 31, 2011. The decrease was primarily due to a decrease in gross profit margins as a result of more aggressive pricing, and an increase in advertising spending to revitalize sales in fiscal 2012.
Fiscal 2011 Compared to Fiscal 2010
Sales
Sales decreased by approximately $6.7 million, or 2.8%, to approximately $231.6 million for the fiscal year ended March 31, 2011, from approximately $238.3 million for the fiscal year ended March 31, 2010. The decrease in sales for the fiscal year ended March 31, 2011 was primarily due to decreased new order sales offset by an increase in reorder sales. The decrease in new order sales may be attributed to an increase in customer
acquisition costs, due to a reduction in response rates, as a result of increased competition and softer demand. The Company acquired approximately 645,000 new customers for the year ended March 31, 2011, compared to approximately 815,000 new customers for the same period the prior year.
The following chart illustrates sales by various sales classifications:
| Year Ended March 31, | |
| Sales (In thousands) | | 2011 | | | % | | | 2010 | | | % | | | $ Variance | | | % Variance | |
| | | | | | | | | | | | | | | | | | | |
| Reorder Sales | | $ | 184,341 | | | | 79.6 | % | | $ | 177,805 | | | | 74.6 | % | | $ | 6,536 | | | | 3.7 | % |
| New Order Sales | | $ | 47,301 | | | | 20.4 | % | | $ | 60,461 | | | | 25.4 | % | | $ | (13,160 | ) | | | -21.8 | % |
| Total Net Sales | | $ | 231,642 | | | | 100.0 | % | | $ | 238,266 | | | | 100.0 | % | | $ | (6,624 | ) | | | -2.8 | % |
| Internet Sales | | $ | 165,473 | | | | 71.4 | % | | $ | 162,803 | | | | 68.3 | % | | $ | 2,670 | | | | 1.6 | % |
| Contact Center Sales | | $ | 66,169 | | | | 28.6 | % | | $ | 75,463 | | | | 31.7 | % | | $ | (9,294 | ) | | | -12.3 | % |
| Total Net Sales | | $ | 231,642 | | | | 100.0 | % | | $ | 238,266 | | | | 100.0 | % | | $ | (6,624 | ) | | | -2.8 | % |
Sales may be adversely affected in fiscal 2012 due to increased competition and consumers giving more consideration to price and trading down to less expensive brands, including generics, some of which we may not carry. In response to these trends, the Company implemented a more aggressive pricing strategy combined with increased advertising while continuing to expand our product offerings into pet supplies. This more aggressive pricing strategy will result in a decrease to gross profit margins, and no guarantees can be made that the Company’s efforts will be successful, or that sales will grow in the future.
The majority of our product sales are affected by the seasons, due to the seasonality of mainly heartworm, and flea and tick medications. For the quarters ended June 30, September 30, December 31, and March 31 of fiscal 2011, the Company’s sales were approximately 32%, 26%, 20%, and 22%, respectively.
Cost of sales
Cost of sales increased by $1.3 million, or 0.9%, to $147.7 million for the fiscal year ended March 31, 2011, from veteri narians$146.4 million for the fiscal year ended March 31, 2010. The increase in cost of sales is directly related to increased product costs. As a percentage of sales, cost of sales was 63.8% in fiscal 2011, as compared to 61.4% in fiscal 2010. The cost of sales percentage increase can be mainly attributed to more aggressive sales promotions, reduced product retail pricing, and increases in our product costs.
Gross profit
Gross profit decreased by $7.9 million, or 8.6%, to $84.0 million for the fiscal year ended March 31, 2011, from $91.9 million for the fiscal year ended March 31, 2010. Gross profit as a percentage of sales for fiscal 2011 and 2010 was 36.2% and 38.6%, respectively. The gross profit percentage decrease can be mainly attributed to more aggressive sales promotions, reduced product retail pricing, and increases in our product costs.
General and administrative expenses
General and administrative expenses decreased by $141,000, or 0.6%, to $22.2 million for the fiscal year ended March 31, 2011 from $22.3 million for the fiscal year ended March 31, 2010. The decrease in general and administrative expenses for the fiscal year ended March 31, 2011 was primarily due to the following: a $153,000 decrease in insurance expenses, due to a reduction in insurance premiums; a $78,000 decrease to licenses and fees, due to a one-time charge recognized in fiscal 2010; and a $58,000 net decrease in other retailersexpenses, including telephone expenses, travel expense, bank service fees, payroll expenses, and office expenses. Offsetting the decrease was a $60,000 increase in professional fees, which includes investor relations and pharmacy fees; a $58,000 increase in property expenses, and a $30,000 increase to bad debt expense. General and administrative expenses as a percentage of pet medications. sales was 9.6% compared to 9.4% for the fiscal years ended March 31, 2011 and 2010, respectively. The increase in general and administrative expenses as a percentage of sales can mainly be attributed to a reduction in sales in fiscal 2011.
Advertising expenses
Advertising expenses decreased by approximately $300,000, or 1.1%, to approximately $27.4 million for the year ended March 31, 2011, from approximately $27.7 million for the year ended March 31, 2010. The decrease in advertising expenses for fiscal 2011 can be attributed to a reduction in television remnant space inventory at prices the Company was willing to pay. The advertising costs of acquiring a new customer, defined as total advertising costs divided by new customers acquired, increased to $42 for the year ended March 31, 2011, compared to $34 for the year ended March 31, 2010. Advertising cost of acquiring a new customer can be impacted by the advertising environment, the effectiveness of our advertising creative, increased advertising spending, and price competition.
Historically, the advertising environment fluctuates due to supply and demand. A more favorable advertising environment may positively impact future new order sales, whereas a less favorable advertising environment may negatively impact future new order sales. As a percentage of sales, advertising expense was
13.1% in fiscal 2009, as compared to 13.4% in fiscal 2008.11.8 % and 11.6% for the years ended March 31, 2011 and 2010, respectively. The
decreaseincrease in advertising expense as a percentage of total sales for
fiscal 2009the year ended March 31, 2011 can be attributed to
increaseddecreased sales
withand increased new customer acquisition costs
remaining relatively flat.due to a reduction in response rates, as a result of increased competition and softer demand. The Company currently anticipates advertising as a percentage of sales to
range frombe approximately
12.0% to 13.0% in13% for fiscal
2010.2012. However, the advertising percentage will fluctuate quarter to quarter due to seasonality and advertising availability. For the fiscal year ended March 31,
2009,2011, quarterly advertising expenses as a percentage of sales ranged between
11%10% and
15%14%.
Depreciation
and amortization
Depreciation
and amortization increased by approximately
$225,000,$54,000, or
38.1%4.1%, to approximately
$815,000$1.4 for the
fiscal year ended March 31,
20092011, from approximately
$590,000$1.3 million for the
fiscal year ended March 31,
2008.2010. This increase to depreciation
and amortization expense for
fiscal 2009the year ended March 31, 2011 can be attributed to an increase in new property and equipment additions relating to the warehouse, pharmacy, and customer
care call
centers expansion incenter over the past 2 fiscal
2009.
years.
Other income
decreasedincreased by approximately
$960,000, or 39.7%,$53,000, to approximately
$1,456,000$253,000 for the
fiscal year ended March 31,
2009,2011 from approximately
$2,416,000$200,000 for the
fiscal year ended March 31,
2008.2010. The
decreaseincrease to other income
can be primarily attributed to decreased interest income due to a reduction in interest rates and a reduced cash balance due tofor the
Company’s share repurchase plan. The decreaseyear ended March 31, 2011 can
also be attributed to
a reduction in advertising revenue generated from our website. Also, during fiscal 2009, the Company booked a charge of $140,000 inincreased interest
and penalties due to a late payment of federal income taxes.income. Interest income may decrease in the future
due to a reduction in interest rates and also as the Company utilizes its cash balances on its
$20,000,000 share repurchase plan, with approximately
$9,952,000$17.7 million remaining as of
May 29, 2009,March 31, 2011, on any quarterly dividend payment, or on its operating activities.
Provision for income taxes
For the fiscal years ended March 31, 20092011 and 2008,2010, the Company recorded an income tax provision for approximately $12,680,000$12.4 and $10,389,000,$14.7 million, respectively. The effective tax rate for the fiscal years ended March 31, 20092011 and 20082010 were 35.6%37.3% and 34.2%36.2%, respectively. The effective tax rate increase can befor the year ended March 31, 2011 was attributed to ana one-time $280,000 tax charge to reconcile the remaining net operating loss carryforward in the first quarter of fiscal 2011. The Company estimates its effective tax rate will be approximately 37.0% for fiscal 2012.
Net income tax benefit of
Net income decreased by approximately
$308,000 that was recognized in fiscal 2008, which relates$5.1 million, or 19.7%, to
an income tax over-accrualapproximately $20.9 million for the fiscal year ended March 31,
2007. During the first quarter of fiscal 2008, it was determined that the Company was no longer a full tax payer in the state of Florida, due to the fact that it established nexus in another state. This event triggered a lower effective tax rate in fiscal 2008. The Company estimates its effective tax rate to be2011 from approximately
36.0% in fiscal 2010.
Net income
Net income increased by approximately $2,954,000, or 14.8%, to approximately $22,976,000$26.0 million for the fiscal year ended March 31, 2009 from approximately $20,022,000 for the fiscal year ended March 31, 2008.2010. The increasedecrease was mainly attributable to the reduction in gross profit margin and new order sales in fiscal 2011.
Liquidity and Capital Resources
The Company’s
sales growth and our success in leveraging our operating and advertising expenses.
Fiscal 2008 Compared to Fiscal 2007
Sales
Sales increased by approximately $26,090,000, or 16.1%, to approximately $188,336,000 for the fiscal year endedworking capital at March 31, 2008, from2012 and 2011 was approximately $162,246,000 for the fiscal year ended March 31, 2007.$78.2 million and approximately $80.6 million, respectively. The increase$2.4 million decrease in sales for the fiscal year ended March 31, 2008working capital was primarily dueattributable to increased retail reordersshare repurchases and new orders,dividends paid during fiscal 2012, offset by decreased wholesale sales. The Company has committed certain dollar amounts specifically designated towards television, direct mail/print, and online advertising to stimulate sales, create brand awareness, and acquire new customers. The Company acquired approximately 710,000 new customers for the year ended March 31, 2008, compared to approximately 681,000 new customers for the same period the prior year. There can be no assurances that this growth trend will continue, due to increased price competitioncash flow generated from veterinarians and traditional and online retailers. &n bsp;
The following chart illustrates sales by various sales classifications:
| | | | | | | | | | | | | | | | | |
Year Ended March 31, |
| 2008 | | % | | 2007 | | % | | $ Variance | | % Variance |
| | | | | | | | | | | |
Reorder Sales | $ | 134,349,000 | | 71.3 | % | | $ | 110,540,000 | | 68.1 | % | | $ | 23,809,000 | | 21.5 | % |
New Order Sales | $ | 53,766,000 | | 28.6 | % | | $ | 51,096,000 | | 31.5 | % | | $ | 2,670,000 | | 5.2 | % |
Wholesale Sales | $ | 221,000 | | 0.1 | % | | $ | 610,000 | | 0.4 | % | | $ | (389,000) | | -63.6 | % |
| | | | | | | | | | | | | | | | | |
Total Net Sales | $ | 188,336,000 | | 100.0 | % | | $ | 162,246,000 | | 100.0 | % | | $ | 26,090,000 | | 16.1 | % |
| | | | | | | | | | | | | | | | | |
Internet Sales | $ | 122,484,000 | | 65.0 | % | | $ | 100,916,000 | | 62.2 | % | | $ | 21,568,000 | | 21.4 | % |
Contact Center Sales | $ | 65,852,000 | | 35.0 | % | | $ | 61,330,000 | | 37.8 | % | | $ | 4,522,000 | | 7.4 | % |
| | | | | | | | | | | | | | | | | |
Total Net Sales | $ | 188,336,000 | | 100.0 | % | | $ | 162,246,000 | | 100.0 | % | | $ | 26,090,000 | | 16.1 | % |
Leading up to the 2004 presidential election we experienced an increase in the advertising cost of acquiring a new customeroperations and a decrease in new customer sales, which may have been attributed to a shortage of television advertising inventory. There can be no assurances that the 2008 presidential election will not have a similar impact on the advertising cost of acquiring a new customerlong term investments. Net cash provided by operating activities was $20.4 million and new customer sales.
The majority of our product sales are affected by the seasons, due to the seasonality of mainly heartworm, and flea and tick medications. For the quarters ended June 30, September 30, December 31, and March 31 of fiscal 2008, the Company’s sales were approximately 31%, 27%, 20%, and 22%, respectively.
Cost of sales
Cost of sales increased by $16,442,000, or 16.8%, to $114,122,000 for the fiscal year ended March 31, 2008, from $97,680,000 for the fiscal year ended March 31, 2007. The increase in cost of sales is directly related to the increase in retail sales in fiscal 2008 as compared to fiscal 2007. As a percent of sales, the cost of sales was 60.6% in fiscal 2008, as compared to 60.2% in fiscal 2007. The percentage increase can be mainly attributed to increases in our product and freight costs offset by a shift in our product mix to higher margin items.
Gross profit
Gross profit increased by $9,648,000, or 14.9%, to $74,214,000 for the fiscal year ended March 31, 2008, from $64,566,000 for the fiscal year ended March 31, 2007. Gross profit as a percentage of sales for fiscal 2008 and 2007 was 39.4% and 39.8%, respectively. The gross profit percentage decrease can be mainly attributed to increases in our product and freight costs offset by a shift in our product mix to higher margin items.
General and administrative expenses
General and administrative expenses increased by $3,074,000, or 17.8%, to $20,367,000 for the fiscal year ended March 31, 2008 from $17,293,000 for the fiscal year ended March 31, 2007. General and administrative expenses as a percentage of sales was 10.8% compared to 10.6%$30.1 million for the fiscal years ended March 31, 20082012 and 2007, respectively. The increase in general and administrative expenses for the fiscal year ended March 31, 2008 was primarily due to the following: a $1,981,000 increase in payroll expenses, with $584,000 of the increase due to the recognition of additional stock based compensation expense during the fiscal year relating to the issuance of restricted stock and stock options, with $295,000 of the increase due to withholding tax expense relating to restricted stock issuances in fiscal 2007 and 2008, and the remaining amount attributed to the addition of new employees in the customer care and pharmacy departments enabling the Company to sustain its growth; a $692,000 increase in credit card and bank service fees which is directly attributable to increased sales in the fiscal year; a $386,000 one-time charge due to the fact that nexus was established in another state, relating to state/county sales tax which was not collected on behalf of our customers in fiscal 2007; a $175,000 increase in office expenses which can be directly attributed to increased sales; and a $97,000 increase in property expenses which can be directly attributed to increased sales; with a $78,000 decrease in license fees; a $65,000 decrease in professional fees; a $55,000 decrease in telephone expense; a $41,000 decrease in insurance expense; and a $18,000 decrease in other expenses, including travel and bad debt expenses, offsetting the increase.
Advertising expenses
Advertising expenses increased by approximately $18,000, or approximately 0.1%, to approximately $25,261,000 for the fiscal year ended March 31, 2008 from approximately $25,243,000 for the fiscal year ended March 31, 2007. The slight increase in advertising expenses for the fiscal year ended March 31, 2008 was due to the Company’s plan to commit certain amounts specifically designated towards television, direct mail/print, and online advertising to stimulate sales, create brand awareness, and acquire new customers.
The advertising cost of acquiring a new customer, defined as total advertising cost divided by new customers acquired, for the fiscal year ended March 31, 2008 was $36, compared to $37 for the same period the prior year. Advertising cost of acquiring a new customer can be impacted by the advertising environment, the effectiveness of our advertising creative, increased advertising spending, and price competition from veterinarians and other retailers of pet medications. Historically, the advertising environment fluctuates due to supply and demand. A less favorable advertising environment may negatively impact future new order sales. As a percentage of sales, advertising expense was 13.4% in fiscal 2008, as compared to 15.6% in fiscal 2007. The decrease in advertising expense as a percentage of total sales for fiscal 2008 can be attributed to increased sales with a slight improvement in ne w customer acquisition costs during the year. The Company currently anticipates advertising as a percentage of sales to range from approximately 13.0% to 14.0% in fiscal 2009. However, the advertising percentage will fluctuate quarter to quarter due to seasonality and advertising availability. For the fiscal year ended March 31, 2008, quarterly advertising expenses as a percentage of sales ranged between 11% and 16%.
Depreciation and amortization
Depreciation and amortization increased by approximately $60,000, or 11.2%, to approximately $590,000 for the fiscal year ended March 31, 2008 from approximately $530,000 for the fiscal year ended March 31, 2007. This increase to depreciation and amortization expense for fiscal 2008 can be attributed to an increase in new property and equipment additions in fiscal 2008.
Other income
Other income increased by approximately $715,000, or 42.0%, to approximately $2,416,000 for the fiscal year ended March 31, 2008, from approximately $1,701,000 for the fiscal year ended March 31, 2007. The increase to other income can be primarily attributed to increased interest income due to increases in the Company’s cash balance, which is swept into an interest-bearing overnight account, and a tax-free investment account. The increase can also be attributed to additional advertising revenue generated from our website. Interest income may decrease in the future due to a reduction in interest rates and also as the Company utilizes its cash balances on its $20,000,000 share repurchase plan, with approximately $8,399,000 remaining, or on its operating activities.
Provision for income taxes
For the fiscal years ended March 31, 2008 and 2007, the Company recorded an income tax provision for approximately $10,389,000 and $8,757,000, respectively. The income tax provision for fiscal 2008 includes a tax benefit of approximately $308,000 which relates to an income tax over-accrual for the fiscal year ended March 31, 2007. During the first quarter of fiscal 2008, it was determined that the Company was no longer a full tax payer in the state of Florida, due to the fact that it established nexus in another state. This event triggered a lower effective tax rate in fiscal 2008. The Company also recognized a $155,000 income tax benefit due to the disqualifying disposition of certain incentive stock option exercises during fiscal 2008. These events resulted in an effective tax rate of 34.2% for the year ended March 31, 2008, compared to an effective tax rate of 37.7% for the year ended March 31, 2007. The Company estimates its effective tax rate to be approximately 36.0% in fiscal 2009.
Net income
Net income increased by approximately $5,578,000, or 38.6%, to approximately $20,022,000 for the fiscal year ended March 31, 2008 from approximately $14,444,000 for the fiscal year ended March 31, 2007. The increase was mainly attributable to the Company’s sales growth and our success in leveraging our operating expenses.
Liquidity and Capital Resources
The Company’s working capital at March 31, 2009 and 2008 was approximately $54,630,000 and approximately $38,804,000, respectively. The $15,826,000 increase in working capital was primarily attributable to redemptions of long term investments, cash flow generated from operations, interest income earned on investments, and the exercise of stock options, offset by the repurchase of shares pursuant to the Company’s stock repurchase plan. Net cash provided by operating activities was $14,966,000 and $19,380,000 for the fiscal years ended March 31, 2009 and 2008, respectively. Net cash provided by investing activities was $11,179,000 and $9,102,000 for the fiscal years ended March 31, 2009 and 2008,2011, respectively. This change can be attributed to an increased amountincrease in the Company’s inventory balance due to buying opportunities during fiscal 2012, compared to a more significant decrease in the Company’s inventory balance for fiscal 2011, along with a reduction in net income for fiscal 2012. Net cash provided by investing activities was $11.6 million for the year ended March 31, 2012, compared to net cash used in investing activities of property and equipment purchases$10.8 million for our warehouse, pharmacy and customer care departments, the redemption of short and lo ngyear ended March 31, 2011. This change can be attributed to a decrease in the Company’s long term investments and the acquisition of a $485,000 intangible asset induring fiscal 2009.2012. Net cash used in financing activities was $16,287,000$34.9 million and $8,531,000$22.8 million for fiscal 2009the years ended March 31, 2012 and 2008,2011, respectively. This change was primarily due to the Company repurchasing 1,347,000approximately 2.1 million shares of its common stock for approximately $18,448,000 during$23.7 million for fiscal 2009,2012, compared to the Company repurchasing 952,000791,000 shares of its common stock for approximately $11,601,000 during fiscal 2008, offset by the exercise of approximately 225,000 shares of stock options for approximately $1,893,000$12.2 million in fiscal 2009, compared to2011. For the years ended March 31, 2012 and 2011 the Company paid approximately 292,000 shares of stock options exercised for approximately $2,785,000$10.9 million and $10.7 million in the prior fiscal year.dividends. As of March 31, 20092012 the Company had approximately $9,952,000$14.0 million remaining under the Company’s share repurchase plan. BasedSubsequent to March 31, 2012, the Company’s Board of Directors declared a $0.15 per share dividend on May 4, 2012. The Board established a May 14, 2012 record date and a May 25, 2012 payment date. Depending on future market conditions the Company may utilize its cash and cash equivalents on the remaining balance of its current share repurchase plan.
plan, on quarterly dividends, or on its operating activities.
The Company had
$14,650,000 (par) invested in auction rate securitiesliquidated its entire Auction Rate Security (“ARS”)
balance, which
werewas classified as long term investments in our financial statements, as of March 31,
2009. Our ARS investments are not mortgage-backed2012. In fiscal 2012, the Company recorded an unrealized recovery of $110,000 within accumulated other comprehensive gain (loss), based
but are municipal-based andupon receiving full par value for these ARS. In fiscal 2011, the
securities underlying the ARS are currently rated AAA, the highest rating available by a rating agency. Our ARS consist of closed-end fund preferred ARS, whose interest rates are reset, typically every seven to twenty-eight days. The fair value of
ARS investments
was determined based on quoted market prices at the reporting date for those instruments in fiscal 2008, and in fiscal 2009 the fair value was based upon a valuation assessment by an outside third
party. As of March 31, 2009, the Company held $14,650,000 (par)party, conducted in
ARS, which were classified as long term investments and theApril 2011. The Company recorded an unrealized impairment loss of
$219,750, i n the fourth quarter of$110,000, in fiscal
2009,2011, within accumulated other comprehensive
incomegain (loss), based upon an assessment of the fair value of these ARS. The
$219,750$110,000 impairment was recorded as temporary due to the fact that the Company
hashad both the ability and intent to hold these securities until anticipated recovery or maturity.
However, it could take until the final maturity or issuer refinancing of the underlying debt for us to realize the recorded value of our investments in these securities. If the issuers of our ARS are unable to successfully close future auctions or redeem or refinance the securities and their credit ratings deteriorate, we may in the future be required to record an additional impairment charge on these investments, or may need to sell these securities on a secondary market. Although we believe we will be able to liquidate our investments in these securities without any significant loss, the timing and financial impact of such an outcome is uncertain. Based o n our expected cash expenditures, our cash and cash equivalents balance, and other potential sources of cash, we do not anticipate that the potential lack of liquidity of these investments in the near term will adversely affect our ability to execute our current business plan.
As of
both March 31,
20092012 and
20082011 the Company had no outstanding lease commitments except for the lease for its 65,300 square foot
executive offices, warehouse facility, and customer service and pharmacy contact centers.facility. We are not currently bound by any long or short term agreements for the purchase or lease of capital expenditures. Any amounts expended for capital expenditures would be the result of an increase in the capacity needed to adequately provide for any increase in our business. To date we have paid for any needed additions to our capital equipment infrastructure from working capital funds and anticipate this being the case in the future. Presently, we have approximately
$750,000$500,000 forecasted for capital expenditures
to further support and maintain the Company’s growth duringin fiscal
2010,2013 which will be funded through cash from operations. The Company’s
primary source of working capital
includesis cash from
operations and the exercise of stock options.operations. The Company presently has no need for
other alternative sources of working capital, and has no commitments or plans to obtain additional capital.
For the fiscal year ended March 31, 2009, the Company did not engage in any off-balance sheet transactions.
Contractual Obligations and Commitments
| | | | | | | | | | | | | | |
| Total | | Less than
1 year | | 1-2 years | | 3-5 Years | | More than
5 years |
| | | | | | | | | |
Property lease | $ | 2,295,000 | | $ | 702,000 | | $ | 723,000 | | $ | 870,000 | | $ | - |
Executive employment contract | $ | 450,000 | | $ | 450,000 | | $ | - | | $ | - | | $ | - |
| | | | | | | | | | | | | | |
Total obligations | $ | 2,745,000 | | $ | 1,152,000 | | $ | 723,000 | | $ | 870,000 | | $ | - |
Off-Balance Sheet Arrangements
The Company had no off-balance sheet arrangements as of March 31,
2009.
2012.
Contractual Obligations and Commitments (In thousands)
| | | | | | | Less than | | | | | | | | | More than | |
| | | | Total | | | 1 year | | | 1-2 years | | | 3-5 Years | | | 5 years | |
| | | | | | | | | | | | | | | | | |
| | Property lease | | $ | 2,478 | | | $ | 767 | | | $ | 784 | | | $ | 927 | | | $ | - | |
| | Executive employment contract | | $ | 550 | | | $ | 550 | | | $ | - | | | $ | - | | | $ | - | |
| | | | | | | | | | | | | | | | | | | | | | |
| | Total obligations | | $ | 3,028 | | | $ | 1,317 | | | $ | 784 | | | $ | 927 | | | $ | - | |
Recent Accounting Pronouncements
In September 2006, the FASB issued Statement of Financial Accounting Standards (“SFAS”) No. 157, “Fair Value Measurements,” which defines fair value, establishes a framework for measuring fair value under GAAP, and expands disclosures about fair value measurements. SFAS No. 157 applies to other accounting pronouncements that require or permit fair value measurement. In February 2008, the FASB issued Staff Position (“FSP”) SFAS 157-2 which delays the effective date of SFAS No. 157 for non- financial assets and non-financial liabilities, except items that are recognized or disclosed at fair value in the financial statements on a recurring basis. The FSP defers the effective date of Statement 157 for non-financial items to fiscal years beginning after November 15, 2008 (our fiscal 2010), and for interim periods within those fiscal years. In October ;2008, the FASB issued FSP 157-3, “Determining the Fair Value of a Financial Asset When the Market for That Asset Is Not Active” (“FSP 157-3”). FSP 157-3 clarifies the application of SFAS No. 157 in a market that is not active and addresses application issues such as the use of internal assumptions when relevant observable data does not exist, the use of observable market information when the market is not active, and the use of market quotes when assessing the relevance of observable and unobservable data. FSP 157-3 is effective for all periods presented in accordance with SFAS No. 157. The adoption of FSP 157-3 did not have a significant impact on the Company’s consolidated financial statements or the fair values of its financial assets and liabilities. In April 2009, the FASB issued FSP SFAS 157-4,Determining the Fair Value When the Volume and Level of Activity for the Asset or Liability Have Significantly Decreased and Identifying Transactions That Are Not Orderly (“FSP 157-4”), which emphasizes that even if there has been a significant decrease in the volume and level of activity for an asset or liability, the objective of the fair value measurement remains the same.It is effective for interim and annual reporting periods ending after June 15, 2009 (our fiscal 2010), and is to be applied prospectively. We are currently assessing the impact of FSP 157-4, if any, on our consolidated financial statements. We have not completed our evaluation of the potential impact, if any, of the adoption of SFAS No. 157 on our consolidated financial position, results of operations, and cash flows.
In April 2008, the FASB issued FSP No. 142-3, Determination of the Useful Life of Intangible Assets. FSP 142-3 amends the factors that should be considered in developing assumptions about renewal or extension used in estimating the useful life of a recognized intangible asset under SFAS No. 142, Goodwill and Other Intangible Assets. This standard is intended to improve the consistency between the useful life of a recognized intangible asset under SFAS No. 142 and the period of expected cash flows used to measure the fair value of the asset under SFAS No. 141R, Business Combinations, and other Generally Accepted Accounting Principles (GAAP).
FSP No.142-3 is effective for financial statements issued for fiscal years beginning after December 15, 2008. The Company does not anticipate that the adoption of this statement will have a material impact on its financial position, results of operations, or cash flows.
In November 2008, the FASB issued EITF Issue No. 08-7, “Accounting for Defensive Intangible Assets” (EITF 08-7). EITF 08-7 addresses the accounting for assets acquired in a business combination or asset acquisition that an entity does not intend to actively use, otherwise referred to as a ‘defensive asset.’ EITF 08-7 requires defensive intangible assets to be initially accounted for as a separate unit of accounting and not included as part of the cost of the acquirer’s existing intangible asset(s) because it is separately identifiable. EITF 08-7 also requires that defensive intangible assets be assigned a useful life in accordance with paragraph 11 of SFAS 142 and is effective for financial statements issued for fiscal years beginning after December 15, 2008. The Company does not anticipate that the adoption of this statement will have a material impact on its financial position, results of operations, or cash flows.
In April 2009, the FASB issued FSP FAS 115-2 and FAS 124-2,Recognition and Presentation of Other-than-Temporary Impairments. FSP FAS 115-2 and FAS 124-2 amends the other-than-temporary impairment guidance in U.S. GAAP for debt securities, changes existing guidance for determining whether an impairment is other than temporary to debt securities, replaces the existing requirement that the entity’s management assert it has both the intent and ability to hold an impaired security until recovery, requires that an entity recognize noncredit losses on held-to-maturity debt securities in other comprehensive income and amortize that amount over the remaining life of the security in a prospective manner, requires an entity to present the total other-than-temporary impairment in the statement of income with an offset for the amount recognized in other comprehensive income, and when adopting FSP FAS 115-2 and FAS 12 4-2, an entity is required to record a cumulative-effect adjustment as of the beginning of the period of adoption. This FSP does not amend existing recognition and measurement guidance related to other-than-temporary impairments of equity securities. FSP FAS 115-2 and 124-2 is effective for interim and annual reporting periods ending after June 15, 2009. We are currently evaluating the impact FSP FAS 115-2 and 124-2 will have on our Consolidated Financial Statements.
In April 2009, the FASB issued FSP FAS 107-1 and APB 28-1,Interim Disclosures about Fair Value of Financial Instruments. FSP FAS 107-1 and APB 28-1 amends FASB Statement No. 107,Disclosures about Fair Value of Financial Instruments, and requires disclosures about the fair value of financial instruments for interim reporting periods of publicly traded companies as well as in annual financial statements. This FSP also amends APB No. 28,Interim Financial Reporting, to require those disclosures in summarized financial information at interim reporting periods. FSP FAS 107-1 and APB 28-1 are effective for interim reporting periods ending after June 15, 2009 (our fiscal 2010). We are currently evaluating the impact FSP FAS 107-1 and ABP 28-1 will have on our Consolidated Financial Statements.
The Company does not believe that any other recently issued, but not yet effective, accounting standards, if currently adopted, will have a material effect on the Company’s consolidated financial position, results of operations, or cash flows.
ITEM 7A. QUANTITATIVE AND QUALITATIVE DISCLOSURES ABOUT MARKET RISK
Market risk generally represents the risk that losses may occur in the value of financial instruments as a result of movements in interest rates, foreign currency exchange rates, and commodity prices. Our financial instruments include cash and cash equivalents, short
and long term investments, accounts receivable, and accounts payable. The book values of cash equivalents, short
and long term investments, accounts receivable, and accounts payable are considered to be representative of fair value because of the short maturity of these instruments. Interest rates affect our return on excess cash and investments. As of March 31,
2009,2012, we had
$30,126,000$46.8 million in cash and cash equivalents and
$14,430,000$10.3 million in
longshort term investments. A majority of our cash and cash equivalents and investments generate interest income based on prevailing interest rates.
A significant change in interest rates would impact the amount of interest income generated from our excess cash and investments. It would also impact the market value of our investments. Our investments are subject to market risk, primarily interest rate and credit risk. Our investments are managed by a limited number of outside professional managers within investment guidelines set by our Board of Directors. Such guidelines include security type, credit quality, and maturity, and are intended to limit market risk by restricting our investments to high-quality debt instruments with both short and long term maturities. We do not hold any derivative financial instruments that could expose us to significant market risk. At March 31,
2009,2012, we had no debt obligations.
ITEM 8. FINANCIAL STATEMENTS AND SUPPLEMENTARY DATA
PETMED EXPRESS, INC. AND SUBSIDIARIES
INDEX TO CONSOLIDATED FINANCIAL STATEMENTS
| | Page |
| Page
| |
| |
ReportsReport of Independent Registered Public Accounting Firms
Firm | 26
| 25 |
| | |
Consolidated Balance Sheets as of March 31, 20092012 and March 31, 2008 2011 | 28
| 26 |
| | |
Consolidated Statements of Income for each of the three years in the period
ended March 31, 2009 2012 | 29
| 27 |
| | |
Consolidated Statements of Changes in Shareholders’ Equity for each of the
three years in the period ended March 31, 20092012 | 30
| 28 |
| | |
Consolidated Statements of Cash Flows for each of the three years in the
period ended March 31, 2009 2012 | 31
| 29 |
| | |
Notes to Consolidated Financial Statements | 32
| 30 |
| | |
Report of Management on Internal Control Over Financial Reporting | 46
| 42 |
| | |
Report of Independent Registered Public Accounting Firm on Internal Control
Over Financial Reporting | 47
| 43 |
| | |
REPORT OF INDEPENDENT REGISTERED PUBLIC ACCOUNTING FIRM
To the Board of Directors and Shareholders
PetMed Express, Inc. and
Subsidiaries
subsidiaries
We have audited the accompanying consolidated balance sheets of PetMed Express, Inc. and
Subsidiariessubsidiaries as of March 31,
20092012 and
2008,2011, and the related consolidated statements of income,
changes in shareholders’ equity and cash flows for each of the
twothree years in the period ended March 31,
2009.2012. These financial statements are the responsibility of the
Company'sCompany’s management. Our responsibility is to express an opinion on these financial statements based on our audits.
We conducted our audits in accordance with the standards of the Public Company Accounting Oversight Board (United States). Those standards require that we plan and perform the
auditaudits to obtain reasonable assurance about whether the financial statements are free of material misstatement. An audit includes examining, on a test basis, evidence supporting the amounts and disclosures in the financial statements. An audit also includes assessing the accounting principles used and significant estimates made by management, as well as evaluating the overall financial statement presentation. We believe that our audits provide a reasonable basis for our opinion.
In our opinion, the consolidated financial statements referred to above present fairly, in all material respects, the financial position of PetMed Express, Inc. and
Subsidiariessubsidiaries as of March 31,
20092012 and
2008,2011, and the results of their operations and their cash flows for each of the
twothree years in the period ended March 31,
2009,2012, in conformity with U.S. generally accepted accounting principles.
We also have audited, in accordance with the standards of the Public Company Accounting Oversight Board (United States), PetMed Express, Inc. and
Subsidiaries'subsidiaries’ internal control over financial reporting as of March 31,
2009,2012, based on criteria established in Internal Control—Integrated Framework issued by the Committee of Sponsoring Organizations of the Treadway Commission and our report dated May 29,
20092012 expressed an unqualified opinion on the effectiveness of PetMed Express, Inc. and Subsidiaries’ internal control over financial reporting.
/s/ McGladrey & Pullen, LLP
McGladrey & Pullen, LLP
New York, New York
May 29, 2009
/s/ McGladrey LLP | |
| McGladrey LLP |
|
| Fort Lauderdale, Florida |
| May 29, 2012 |
25
REPORT OF INDEPENDENT REGISTERED PUBLIC ACCOUNTING FIRM
To the Board of Directors and Shareholders
PetMed Express, Inc. and Subsidiaries
We have audited the accompanying consolidated statements of income, changes in shareholders’ equity and cash flows of PetMed Express, Inc. and Subsidiaries (the "Company") for the year ended March 31, 2007. These financial statements are the responsibility of the Company’s management. Our responsibility is to express an opinion on these financial statements based on our audit.
We conducted our audit in accordance with the standards of the Public Company Accounting Oversight Board (United States). Those standards require that we plan and perform the audit to obtain reasonable assurance about whether the financial statements are free of material misstatement. An audit includes examining, on a test basis, evidence supporting the amounts and disclosures in the financial statements. An audit also includes assessing the accounting principles used and significant estimates made by management, as well as evaluating the overall financial statement presentation. We believe that our audit provides a reasonable basis for our opinion.
In our opinion, the consolidated financial statements referred to above present fairly, in all material respects, the results of the operations and the cash flows of PetMed Express, Inc. and Subsidiaries for the year ended March 31, 2007, in conformity with accounting principles generally accepted in the United States of America.
As discussed in Note 1 to the consolidated financial statements, the Company changed the manner in which it accounts for share-based compensation, effective April 1, 2006.
/s/ Goldstein Golub Kessler LLP
Goldstein Golub Kessler LLP
New York, New York
May 31, 2007
PETMED EXPRESS, INC. AND SUBSIDIARIES
CONSOLIDATED BALANCE SHEETS
| | | | |
| | March 31, |
| | 2009 | | 2008 |
ASSETS | | | | |
| | | | |
Current assets: | | | | |
Cash and cash equivalents | $ | 30,126,041 | $ | 20,267,829 |
Temporary investments | | - | | 4,780,000 |
Accounts receivable, less allowance for doubtful | | | | |
accounts of $58,525 and $32,040, respectively | | 2,881,085 | | 1,575,263 |
Inventories - finished goods | | 26,778,096 | | 17,909,549 |
Prepaid expenses and other current assets | | 753,602 | | 691,859 |
Deferred income taxes | | 724,561 | | - |
Prepaid income taxes | | 361,743 | | - |
Total current assets | | 61,625,128 | | 45,224,500 |
| | | | |
Long term investments | | 14,430,250 | | 24,740,000 |
Property and equipment, net | | 5,057,561 | | 1,903,294 |
Deferred income taxes | | - | | 1,221,853 |
Intangible assets | | 850,000 | | 365,000 |
| | | | |
Total assets | $ | 81,962,939 | $ | 73,454,647 |
| | | | |
LIABILITIES AND SHAREHOLDERS' EQUITY | | | | |
| | | | |
Current liabilities: | | | | |
Accounts payable | $ | 4,817,097 | $ | 4,358,774 |
Accrued expenses and other current liabilities | | 2,177,838 | | 1,876,655 |
Income taxes payable | | - | | 185,243 |
| | | | |
Total liabilities | | 6,994,935 | | 6,420,672 |
| | | | |
Commitments and contingencies | | | | |
| | | | |
Shareholders' equity: | | | | |
Preferred stock, $.001 par value, 5,000,000 shares authorized; | | | | |
2,500 convertible shares issued and outstanding with a | | | | |
liquidation preference of $4 per share | | 8,898 | | 8,898 |
Common stock, $.001 par value, 40,000,000 shares authorized; | | | | |
22,686,836 and 23,734,067 shares issued, respectively | | 22,687 | | 23,734 |
Additional paid-in capital | | - | | 8,396,277 |
Retained earnings | | 75,156,169 | | 58,639,343 |
Less treasury stock, at cost; 0 and 3,100 shares, respectively | | - | | (34,277) |
Accumulated other comprehensive loss | | (219,750) | | - |
| | | | |
Total shareholders' equity | | 74,968,004 | | 67,033,975 |
| | | | |
Total liabilities and shareholders' equity | $ | 81,962,939 | $ | 73,454,647 |
| | | | |
See accompanying notes to consolidated financial statements. | | | | |
(In thousands)
| | | March 31, | | | March 31, | |
| | | 2012 | | | 2011 | |
| | | | | | | |
| ASSETS | | | | | | |
| | | | | | | |
| Current assets: | | | | | | |
| Cash and cash equivalents | | $ | 46,801 | | | $ | 49,660 | |
| Short term investments - available for sale | | | 10,347 | | | | 10,116 | |
Accounts receivable, less allowance for doubtful accounts of $5 and $6, respectively | | | 1,572 | | | | 1,985 | |
| Inventories - finished goods | | | 26,217 | | | | 25,140 | |
| Prepaid expenses and other current assets | | | 1,241 | | | | 1,036 | |
| Deferred tax assets | | | 1,230 | | | | 1,003 | |
| Prepaid income taxes | | | 199 | | | | 664 | |
| Total current assets | | | 87,607 | | | | 89,604 | |
| | | | | | | | | |
| Long term investments | | | - | | | | 12,390 | |
| Property and equipment, net | | | 2,597 | | | | 3,433 | |
| Intangible asset | | | 860 | | | | 860 | |
| | | | | | | | | |
| Total assets | | $ | 91,064 | | | $ | 106,287 | |
| | | | | | | | | |
| LIABILITIES AND SHAREHOLDERS’ EQUITY | | | | | | | | |
| | | | | | | | | |
| Current liabilities: | | | | | | | | |
| Accounts payable | | $ | 6,619 | | | $ | 6,452 | |
| Accrued expenses and other current liabilities | | | 2,772 | | | | 2,509 | |
| Total current liabilities | | | 9,391 | | | | 8,961 | |
| | | | | | | | | |
| Deferred tax liabilities | | | 492 | | | | 321 | |
| | | | | | | | | |
| Total liabilities: | | | 9,883 | | | | 9,282 | |
| | | | | | | | | |
| Commitments and contingencies | | | | | | | | |
| | | | | | | | | |
| Shareholders’ equity: | | | | | | | | |
Preferred stock, $.001 par value, 5,000 shares authorized; 3 convertible shares issued and outstanding with a liquidation preference of $4 per share | | | 9 | | | | 9 | |
Common stock, $.001 par value, 40,000 shares authorized; 20,338 and 22,331 shares issued and outstanding, respectively | | | 20 | | | | 22 | |
| Retained earnings | | | 81,108 | | | | 97,115 | |
| Accumulated other comprehensive gain (loss) | | | 44 | | | | (141 | ) |
| | | | | | | | | |
| Total shareholders’ equity | | | 81,181 | | | | 97,005 | |
| | | | | | | | | |
| Total liabilities and shareholders’ equity | | $ | 91,064 | | | $ | 106,287 | |
See accompanying notes to consolidated financial statements.
PETMED EXPRESS, INC. AND SUBSIDIARIES
CONSOLIDATED STATEMENTS OF INCOME
| | | | | | |
| | Year Ended March 31, |
| | 2009 | | 2008 | | 2007 |
| | | | | | |
Sales | $ | 219,412,247 | $ | 188,336,469 | $ | 162,246,407 |
Cost of sales | | 134,084,680 | | 114,122,433 | | 97,680,238 |
| | | | | | |
Gross profit | | 85,327,567 | | 74,214,036 | | 64,566,169 |
| | | | | | |
Operating expenses: | | | | | | |
General and administrative | | 21,604,654 | | 20,367,392 | | 17,292,675 |
Advertising | | 28,707,386 | | 25,261,042 | | 25,243,029 |
Depreciation and amortization | | 814,542 | | 589,990 | | 530,440 |
Total operating expenses | | 51,126,582 | | 46,218,424 | | 43,066,144 |
| | | | | | |
Income from operations | | 34,200,985 | | 27,995,612 | | 21,500,025 |
| | | | | | |
Other income: | | | | | | |
Interest income, net | | 1,056,077 | | 1,771,653 | | 1,266,150 |
Other, net | | 408,149 | | 643,880 | | 435,824 |
Loss on disposal of property and equipment | | (8,565) | | - | | (1,250) |
Total other income | | 1,455,661 | | 2,415,533 | | 1,700,724 |
| | | | | | |
Income before provision for income taxes | | 35,656,646 | | 30,411,145 | | 23,200,749 |
| | | | | | |
Provision for income taxes | | 12,680,235 | | 10,388,914 | | 8,757,247 |
| | | | | | |
Net income | $ | 22,976,411 | $ | 20,022,231 | $ | 14,443,502 |
| | | | | | |
Net income per common share: | | | | | | |
Basic | $ | 0.99 | $ | 0.83 | $ | 0.60 |
Diluted | $ | 0.98 | $ | 0.82 | $ | 0.60 |
| | | | | | |
Weighted average number of common shares outstanding: | | | | | |
Basic | | 23,305,726 | | 24,088,258 | | 24,109,035 |
Diluted | | 23,482,177 | | 24,299,364 | | 24,270,879 |
| | | | | | |
See accompanying notes to consolidated financial statements. | | | | | | |
(In thousands, except for per share amounts)| | | Year Ended March 31, | |
| | | 2012 | | | 2011 | | | 2010 | |
| | | | | | | | | | |
| Sales | | $ | 238,250 | | | $ | 231,642 | | | $ | 238,266 | |
| Cost of sales | | | 158,085 | | | | 147,686 | | | | 146,405 | |
| | | | | | | | | | | | | |
| Gross profit | | | 80,165 | | | | 83,956 | | | | 91,861 | |
| | | | | | | | | | | | | |
| Operating expenses: | | | | | | | | | | | | |
| General and administrative | | | 22,363 | | | | 22,200 | | | | 22,341 | |
| Advertising | | | 30,369 | | | | 27,357 | | | | 27,657 | |
| Depreciation | | | 1,411 | | | | 1,375 | | | | 1,321 | |
| Total operating expenses | | | 54,143 | | | | 50,932 | | | | 51,319 | |
| | | | | | | | | | | | | |
| Income from operations | | | 26,022 | | | | 33,024 | | | | 40,542 | |
| | | | | | | | | | | | | |
| Other income (expense): | | | | | | | | | | | | |
| Interest income, net | | | 288 | | | | 381 | | | | 196 | |
| Other, net | | | 61 | | | | (128 | ) | | | 4 | |
| Total other income | | | 349 | | | | 253 | | | | 200 | |
| | | | | | | | | | | | | |
| Income before provision for income taxes | | | 26,371 | | | | 33,277 | | | | 40,742 | |
| | | | | | | | | | | | | |
| Provision for income taxes | | | 9,712 | | | | 12,406 | | | | 14,740 | |
| | | | | | | | | | | | | |
| Net income | | $ | 16,659 | | | $ | 20,871 | | | $ | 26,002 | |
| | | | | | | | | | | | | |
| Net income per common share: | | | | | | | | | | | | |
| Basic | | $ | 0.81 | | | $ | 0.93 | | | $ | 1.15 | |
| Diluted | | $ | 0.80 | | | $ | 0.92 | | | $ | 1.14 | |
| | | | | | | | | | | | | |
| Weighted average number of common shares outstanding: | | | | | | | | | | | | |
| Basic | | | 20,613 | | | | 22,514 | | | | 22,617 | |
| Diluted | | | 20,708 | | | | 22,643 | | | | 22,746 | |
| | | | | | | | | | | | | |
| Cash dividends declared per common share | | $ | 0.525 | | | $ | 0.475 | | | $ | 0.300 | |
See accompanying notes to consolidated financial statements.
| PETMED EXPRESS, INC. AND SUBSIDIARIES |
CONSOLIDATED STATEMENTS OF CHANGES IN SHAREHOLDERS’ EQUITY |
| Fiscal years ended March 31, 2010, March 31, 2011, and March 31, 2012 |
| (In thousands) |
| | | Convertible | | | Common | | | Additional | | | | | | | | | Other | | | | |
| | | Preferred Stock | | | Stock | | | Paid-In | | | Retained | | | Treasury | | | Comprehensive | | | | |
| | | Shares | | | Amounts | | | Shares | | | Amounts | | | Capital | | | Earnings | | | Stock | | | Gain (Loss) | | | Total | |
| | | | | | | | | | | | | | | | | | | | | | | | | | | | |
| Balance, March 31, 2009 | | | 3 | | | $ | 9 | | | | 22,687 | | | $ | 23 | | | $ | - | | | $ | 75,156 | | | $ | - | | | $ | (220 | ) | | $ | 74,968 | |
| | | | | | | | | | | | | | | | | | | | | | | | | | | | | | | | | | | | | |
| Issuance of common stock from exercise of stock options | | | - | | | | - | | | | 102 | | | | - | | | | 735 | | | | - | | | | - | | | | - | | | | 735 | |
| | | | | | | | | | | | | | | | | | | | | | | | | | | | | | | | | | | | | |
| Issuance of restricted stock | | | - | | | | - | | | | 201 | | | | - | | | | - | | | | - | | | | - | | | | - | | | | - | |
| | | | | | | | | | | | | | | | | | | | | | | | | | | | | | | | | | | | | |
| Share based compensation | | | - | | | | - | | | | - | | | | - | | | | 1,594 | | | | - | | | | - | | | | - | | | | 1,594 | |
| | | | | | | | | | | | | | | | | | | | | | | | | | | | | | | | | | | | | |
| Tax benefit related to stock options exercised | | | - | | | | - | | | | - | | | | - | | | | 299 | | | | - | | | | - | | | | - | | | | 299 | |
| | | | | | | | | | | | | | | | | | | | | | | | | | | | | | | | | | | | | |
| Dividends declared | | | - | | | | - | | | | - | | | | - | | | | - | | | | (6,853 | ) | | | - | | | | - | | | | (6,853 | ) |
| | | | | | | | | | | | | | | | | | | | | | | | | | | | | | | | | | | | | |
| Net income | | | - | | | | - | | | | - | | | | - | | | | - | | | | 26,002 | | | | - | | | | 26,002 | | | | 26,002 | |
| | | | | | | | | | | | | | | | | | | | | | | | | | | | | | | | | | | | | |
| Other comprehensive loss: | | | | | | | | | | | | | | | | | | | | | | | | | | | | | | | | | | | | |
| Net Change in unrealized gain on long term investments | | | | | | | | | | | | | | | | | | | | | | | | | | | | | | | 112 | | | | 112 | |
| | | | | | | | | | | | | | | | | | | | | | | | | | | | | | | | | | | | | |
| Total comprehensive income | | | | | | | | | | | | | | | | | | | | | | | | | | | | | | $ | 26,114 | | | | - | |
| | | | | | | | | | | | | | | | | | | | | | | | | | | | | | | | | | | | | |
| Balance, March 31, 2010 | | | 3 | | | | 9 | | | | 22,990 | | | | 23 | | | | 2,628 | | | | 94,305 | | | | - | | | | (108 | ) | | | 96,857 | |
| | | | | | | | | | | | | | | | | | | | | | | | | | | | | | | | | | | | | |
| Issuance of common stock from exercise of stock options | | | - | | | | - | | | | 46 | | | | - | | | | 340 | | | | - | | | | - | | | | - | | | | 340 | |
| | | | | | | | | | | | | | | | | | | | | | | | | | | | | | | | | | | | | |
| Issuance of restricted stock, net | | | - | | | | - | | | | 86 | | | | - | | | | - | | | | - | | | | - | | | | - | | | | - | |
| | | | | | | | | | | | | | | | | | | | | | | | | | | | | | | | | | | | | |
| Share based compensation | | | - | | | | - | | | | - | | | | - | | | | 2,171 | | | | - | | | | - | | �� | | - | | | | 2,171 | |
| | | | | | | | | | | | | | | | | | | | | | | | | | | | | | | | | | | | | |
| Dividends declared | | | - | | | | - | | | | - | | | | - | | | | - | | | | (10,822 | ) | | | - | | | | - | | | | (10,822 | ) |
| | | | | | | | | | | | | | | | | | | | | | | | | | | | | | | | | | | | | |
| Repurchased and retired shares | | | - | | | | - | | | | (791 | ) | | | (1 | ) | | | (12,246 | ) | | | - | | | | - | | | | - | | | | (12,247 | ) |
| | | | | | | | | | | | | | | | | | | | | | | | | | | | | | | | | | | | | |
| Deferred tax adjustment related to resticted stock and stock options | | | - | | | | - | | | | - | | | | - | | | | (132 | ) | | | - | | | | - | | | | - | | | | (132 | ) |
| | | | | | | | | | | | | | | | | | | | | | | | | | | | | | | | | | | | | |
| Allocation of retirement of repurchased shares of additional paid in capital and retained earnings | | | - | | | | - | | | | - | | | | - | | | | 7,239 | | | | (7,239 | ) | | | - | | | | - | | | | - | |
| | | | | | | | | | | | | | | | | | | | | | | | | | | | | | | | | | | | | |
| Net income | | | - | | | | - | | | | - | | | | - | | | | - | | | | 20,871 | | | | - | | | | 20,871 | | | | 20,871 | |
| | | | | | | | | | | | | | | | | | | | | | | | | | | | | | | | | | | | | |
| Other comprehensive loss: | | | | | | | | | | | | | | | | | | | | | | | | | | | | | | | | | | | | |
| Net Change in unrealized loss on short term investments | | | | | | | | | | | | | | | | | | | | | | | | | | | | | | | (31 | ) | | | (31 | ) |
| Net Change in unrealized loss on long term investments | | | | | | | | | | | | | | | | | | | | | | | | | | | | | | | (2 | ) | | | (2 | ) |
| | | | | | | | | | | | | | | | | | | | | | | | | | | | | | | | | | | | | |
| Total comprehensive income | | | | | | | | | | | | | | | | | | | | | | | | | | | | | | $ | 20,838 | | | | - | |
| | | | | | | | | | | | | | | | | | | | | | | | | | | | | | | | | | | | | |
| Balance, March 31, 2011 | | | 3 | | | | 9 | | | | 22,331 | | | | 22 | | | | - | | | | 97,115 | | | | - | | | | (141 | ) | | | 97,005 | |
| | | | | | | | | | | | | | | | | | | | | | | | | | | | | | | | | | | | | |
| Issuance of restricted stock, net | | | - | | | | - | | | | 91 | | | | - | | | | - | | | | - | | | | - | | | | - | | | | - | |
| | | | | | | | | | | | | | | | | | | | | | | | | | | | | | | | | | | | | |
| Share based compensation | | | - | | | | - | | | | - | | | | - | | | | 2,246 | | | | - | | | | - | | | | - | | | | 2,246 | |
| | | | | | | | | | | | | | | | | | | | | | | | | | | | | | | | | | | | | |
| Dividends declared | | | - | | | | - | | | | - | | | | - | | | | - | | | | (10,989 | ) | | | - | | | | - | | | | (10,989 | ) |
| | | | | | | | | | | | | | | | | | | | | | | | | | | | | | | | | | | | | |
| Repurchased and retired shares | | | - | | | | - | | | | (2,084 | ) | | | (2 | ) | | | (23,683 | ) | | | - | | | | - | | | | - | | | | (23,685 | ) |
| | | | | | | | | | | | | | | | | | | | | | | | | | | | | | | | | | | | | |
| Deferred tax adjustment related to resticted stock | | | - | | | | - | | | | - | | | | - | | | | (240 | ) | | | - | | | | - | | | | - | | | | (240 | ) |
| | | | | | | | | | | | | | | | | | | | | | | | | | | | | | | | | | | | | |
| Allocation of retirement of repurchased shares of additional paid in capital and retained earnings | | | - | | | | - | | | | - | | | | - | | | | 21,677 | | | | (21,677 | ) | | | - | | | | - | | | | - | |
| | | | | | | | | | | | | | | | | | | | | | | | | | | | | | | | | | | | | |
| Net income | | | - | | | | - | | | | - | | | | - | | | | - | | | | 16,659 | | | | - | | | | 16,659 | | | | 16,659 | |
| | | | | | | | | | | | | | | | | | | | | | | | | | | | | | | | | | | | | |
| Other comprehensive gain: | | | | | | | | | | | | | | | | | | | | | | | | | | | | | | | | | | | | |
| Net Change in unrealized gain on short term investments | | | | | | | | | | | | | | | | | | | | | | | | | | | | | | | 75 | | | | 75 | |
| Net Change in unrealized gain on long term investments | | | | | | | | | | | | | | | | | | | | | | | | | | | | | | | 110 | | | | 110 | |
| | | | | | | | | | | | | | | | | | | | | | | | | | | | | | | | | | | | | |
| Total comprehensive income | | | | | | | | | | | | | | | | | | | | | | | | | | | | | | $ | 16,844 | | | | - | |
| | | | | | | | | | | | | | | | | | | | | | | | | | | | | | | | | | | | | |
| Balance, March 31, 2012 | | | 3 | | | $ | 9 | | | | 20,338 | | | $ | 20 | | | $ | - | | | $ | 81,108 | | | $ | - | | | $ | 44 | | | $ | 81,181 | |
See accompanying notes to consolidated financial statements.
PETMED EXPRESS, INC. AND SUBSIDIARIESCONSOLIDATED STATEMENTS OF CHANGES IN SHAREHOLDERS' EQUITY
Fiscal years ended March 31, 2007, March 31, 2008, and March 31, 2009
| | | | | | | | | | | | | | | | | |
| | | | | | | | | | | | | | | Accumulated | | |
| Convertible | | Common | | Additional | | | | | | Other | | |
| Preferred Stock | | Stock | | Paid-In | | Retained | | Treasury | | Comprehensive | | |
| Shares | | Amounts | | Shares | | Amounts | | Capital | | Earnings | | Stock | | Loss | | Total |
| | | | | | | | | | | | | | | | | |
Balance, March 31, 2006 | 2,500 | $ | 8,898 | | 23,967,390 | $ | 23,967 | $ | 13,433,054 | $ | 24,173,610 | $ | - | $ | - | $ | 37,639,529 |
| | | | | | | | | | | | | | | | | |
Issuance of common stock from | | | | | | | | | | | | | | | | | |
exercise of stock options | - | | - | | 185,402 | | 185 | | 441,899 | | - | | - | | - | | 442,084 |
| | | | | | | | | | | | | | | | | |
Issuance of restricted stock | - | | - | | 156,625 | | 157 | | (157) | | - | | - | | - | | - |
| | | | | | | | | | | | | | | | | |
Share based compensation | - | | - | | - | | - | | 1,095,740 | | - | | - | | - | | 1,095,740 |
| | | | | | | | | | | | | | | | | |
Tax benefit related to stock | | | | | | | | | | | | | | | | | |
options exercised | - | | - | | - | | - | | 242,718 | | - | | - | | - | | 242,718 |
| | | | | | | | | | | | | | | | | |
Net income | - | | - | | - | | - | | - | | 14,443,502 | | - | | - | | 14,443,502 |
| | | | | | | | | | | | | | | | | |
Balance, March 31, 2007 | 2,500 | $ | 8,898 | | 24,309,417 | $ | 24,309 | $ | 15,213,254 | $ | 38,617,112 | $ | - | $ | - | $ | 53,863,573 |
| | | | | | | | | | | | | | | | | |
Issuance of common stock from | | | | | | | | | | | | | | | | | |
exercise of stock options | - | | - | | 292,274 | | 292 | | 2,784,695 | | - | | - | | - | | 2,784,987 |
| | | | | | | | | | | | | | | | | |
Issuance of restricted stock | - | | - | | 81,317 | | 81 | | (81) | | - | | - | | - | | - |
| | | | | | | | | | | | | | | | | |
Share based compensation | | | | | | | | | 1,679,600 | | | | - | | - | | 1,679,600 |
| | | | | | | | | | | | | | | | | |
Tax benefit related to stock | | | | | | | | | | | | | | | | | |
options exercised | - | | - | | - | | - | | 284,305 | | - | | - | | - | | 284,305 |
| | | | | | | | | | | | | | | | | |
Repurchased shares | - | | - | | (948,941) | | (948) | | (11,565,496) | | - | | (34,277) | | - | | (11,600,721) |
| | | | | | | | | | | | | | | | | |
Net income | - | | - | | - | | - | | - | | 20,022,231 | | - | | - | | 20,022,231 |
| | | | | | | | | | | | | | | | | |
Balance, March 31, 2008 | 2,500 | $ | 8,898 | | 23,734,067 | $ | 23,734 | $ | 8,396,277 | $ | 58,639,343 | $ | (34,277) | $ | - | $ | 67,033,975 |
| | | | | | | | | | | | | | | | | |
Issuance of common stock from | | | | | | | | | | | | | | | | | |
exercise of stock options | - | | - | | 224,746 | | 225 | | 1,892,622 | | - | | - | | - | | 1,892,847 |
| | | | | | | | | | | | | | | | | |
Issuance of restricted stock | - | | - | | 77,667 | | 78 | | (78) | | - | | - | | - | | - |
| | | | | | | | | | | | | | | | | |
Share based compensation | - | | - | | - | | - | | 1,464,225 | | - | | - | | - | | 1,464,225 |
| | | | | | | | | | | | | | | | | |
Tax benefit related to stock | | | | | | | | | | | | | | | | | |
options exercised | - | | - | | - | | - | | 267,835 | | - | | - | | - | | 267,835 |
| | | | | | | | | | | | | | | | | |
Repurchased and retired shares | - | | - | | (1,349,644) | | (1,350) | | (18,480,466) | | - | | 34,277 | | - | | (18,447,539) |
| | | | | | | | | | | | | | | | | |
Allocation of retirement of | | | | | | | | | | | | | | | | | |
repurchased shares to | | | | | | | | | | | | | | | | | |
additional paid in capital | | | | | | | | | | | | | | | | | |
from retained earnings | - | | - | | - | | - | | 6,459,585 | | (6,459,585) | | - | | - | | - |
| | | | | | | | | | | | | | | | | |
Net income | - | | - | | - | | - | | - | | 22,976,411 | | - | | 22,976,411 | | 22,976,411 |
| | | | | | | | | | | | | | | | | |
Other comprehensive loss: | | | | | | | | | | | | | | | | | |
Unrealized loss on long term | | | | | | | | | | | | | | | | | |
investments | - | | - | | - | | - | | - | | - | | - | | (219,750) | | (219,750) |
| | | | | | | | | | | | | | | | | |
Total comprehensive income | - | | - | | - | | - | | - | | | | - | | 22,756,661 | | |
| | | | | | | | | | | | | | | | | |
Balance, March 31, 2009 | 2,500 | $ | 8,898 | | 22,686,836 | $ | 22,687 | $ | - | $ | 75,156,169 | $ | - | $ | (219,750) | $ | 74,968,004 |
| | | | | | | | | | | | | | | | | |
See accompanying notes to consolidated financial statements | | | | | | | | | | |
.
PETMED EXPRESS, INC. AND SUBSIDIARIES
CONSOLIDATED STATEMENTS OF CASH FLOWS
| | | | | | |
| | Year Ended March 31, |
| | 2009 | | 2008 | | 2007 |
Cash flows from operating activities: | | | | | | |
Net income | $ | 22,976,411 | $ | 20,022,231 | $ | 14,443,502 |
Adjustments to reconcile net income to net cash | | | | | | |
provided by operating activities: | | | | | | |
Depreciation and amortization | | 814,542 | | 589,990 | | 530,440 |
Share based compensation | | 1,464,225 | | 1,679,600 | | 1,095,740 |
Deferred income taxes | | 497,292 | | (327,313) | | (100,538) |
Loss on disposal of property and equipment | | 8,565 | | - | | 1,250 |
Bad debt expense | | 73,981 | | 40,823 | | 29,554 |
(Increase) decrease in operating assets | | | | | | |
and increase (decrease) in liabilities: | | | | | | |
Accounts receivable | | (1,379,803) | | (246,565) | | (243,294) |
Inventories - finished goods | | (8,868,547) | | (1,823,342) | | (1,088,532) |
Prepaid income taxes | | (361,743) | | - | | - |
Prepaid expenses and other current assets | | (61,743) | | 379,312 | | (488,133) |
Other assets | | - | | - | | 14,167 |
Accounts payable | | (313,436) | | (1,500,982) | | 2,806,803 |
Income taxes payable | | (185,243) | | (44,078) | | (728,997) |
Accrued expenses and other current liabilities | | 301,183 | | 610,818 | | 292,478 |
Net cash provided by operating activities | | 14,965,684 | | 19,380,494 | | 16,564,440 |
| | | | | | |
Cash flows from investing activities: | | | | | | |
Net change in investments | | 14,870,000 | | 9,605,000 | | (16,275,000) |
Purchases of property and equipment | | (3,207,615) | | (502,706) | | (1,025,079) |
Purchase of intangible asset | | (485,000) | | - | | - |
Net proceeds from the sale of property and equipment | | 2,000 | | - | | 400 |
Net cash provided by (used in) investing activities | | 11,179,385 | | 9,102,294 | | (17,299,679) |
| | | | | | |
Cash flows from financing activities: | | | | | | |
Purchases of treasury stock | | (18,447,539) | | (11,600,721) | | - |
Proceeds from the exercise of stock options | | 1,892,847 | | 2,784,987 | | 442,084 |
Tax benefit related to stock options exercised | | 267,835 | | 284,305 | | 242,718 |
Net cash (used in) provided by financing activities | | (16,286,857) | | (8,531,429) | | 684,802 |
| | | | | | |
Net increase (decrease) in cash and cash equivalents | | 9,858,212 | | 19,951,359 | | (50,437) |
Cash and cash equivalents, at beginning of year | | 20,267,829 | | 316,470 | | 366,907 |
| | | | | | |
Cash and cash equivalents, at end of year | $ | 30,126,041 | $ | 20,267,829 | $ | 316,470 |
| | | | | | |
Supplemental disclosure of cash flow information: | | | | | | |
| | | | | | |
Cash paid for income taxes | $ | 16,462,095 | $ | 10,331,000 | $ | 9,344,063 |
| | | | | | |
Retirement of treasury stock | $ | 18,481,816 | $ | 11,566,444 | $ | - |
| | | | | | |
Property and equipment purchases in accounts payable | $ | 771,759 | $ | - | $ | - |
| | | | | | |
See accompanying notes to consolidated financial statements. | | | | | | |
(In thousands) | | | | | | Year Ended | | | | |
| | | | | | March 31, | | | | |
| | | 2012 | | | 2011 | | | 2010 | |
| Cash flows from operating activities: | | | | | | | | | |
| Net income | | $ | 16,659 | | | $ | 20,871 | | | $ | 26,002 | |
| Adjustments to reconcile net income to net cash provided by operating activities: | | | | | | | | | | | | |
| Depreciation | | | 1,411 | | | | 1,375 | | | | 1,321 | |
| Share based compensation | | | 2,246 | | | | 2,171 | | | | 1,594 | |
| Deferred income taxes | | | (56 | ) | | | 348 | | | | (305 | ) |
| Bad debt expense | | | 47 | | | | 48 | | | | 18 | |
| (Increase) decrease in operating assets and increase (decrease) in liabilities: | | | | | | | | | | | | |
| Accounts receivable | | | 366 | | | | 64 | | | | 766 | |
| Inventories - finished goods | | | (1,077 | ) | | | 3,924 | | | | (2,286 | ) |
| Prepaid income taxes | | | 465 | | | | (335 | ) | | | 32 | |
| Prepaid expenses and other current assets | | | (205 | ) | | | (426 | ) | | | 144 | |
| Accounts payable | | | 297 | | | | 1,964 | | | | 313 | |
| Accrued expenses and other current liabilities | | | 238 | | | | 102 | | | | 86 | |
| Net cash provided by operating activities | | | 20,391 | | | | 30,106 | | | | 27,685 | |
| | | | | | | | | | | | | |
| Cash flows from investing activities: | | | | | | | | | | | | |
| Net change in investments | | | 12,344 | | | | (10,146 | ) | | | 2,150 | |
| Purchases of property and equipment | | | (705 | ) | | | (667 | ) | | | (1,047 | ) |
| Purchases of intangible asset | | | - | | | | (10 | ) | | | - | |
| Net cash provided by (used in) investing activities | | | 11,639 | | | | (10,823 | ) | | | 1,103 | |
| | | | | | | | | | | | | |
| Cash flows from financing activities: | | | | | | | | | | | | |
| Dividends paid | | | (10,964 | ) | | | (10,727 | ) | | | (6,805 | ) |
| Purchases of treasury stock | | | (23,685 | ) | | | (12,247 | ) | | | - | |
| Proceeds from the exercise of stock options | | | - | | | | 340 | | | | 735 | |
| Tax benefit related to stock options exercised | | | - | | | | - | | | | 299 | |
| Tax adjustment related to stock compensation | | | (240 | ) | | | (132 | ) | | | - | |
| Net cash used in financing activities | | | (34,889 | ) | | | (22,766 | ) | | | (5,771 | ) |
| | | | | | | | | | | | | |
| Net (decrease) increase in cash and cash equivalents | | | (2,859 | ) | | | (3,483 | ) | | | 23,017 | |
| Cash and cash equivalents, at beginning of year | | | 49,660 | | | | 53,143 | | | | 30,126 | |
| | | | | | | | | | | | | |
| Cash and cash equivalents, at end of year | | $ | 46,801 | | | $ | 49,660 | | | $ | 53,143 | |
| | | | | | | | | | | | | |
| Supplemental disclosure of cash flow information: | | | | | | | | | | | | |
| | | | | | | | | | | | | |
| Cash paid for income taxes | | $ | 9,543 | | | $ | 12,578 | | | $ | 14,719 | |
| | | | | | | | | | | | | |
| Retirement of treasury stock | | $ | 23,685 | | | $ | 12,247 | | | $ | - | |
| | | | | | | | | | | | | |
| Property and equipment purchases in accounts payable | | $ | - | | | $ | 130 | | | $ | 418 | |
| | | | | | | | | | | | | |
| Dividends payable in accrued expenses | | $ | 168 | | | $ | 143 | | | $ | 48 | |
See accompanying notes to consolidated financial statements.
NOTES TO CONSOLIDATED FINANCIAL STATEMENTS
(1)
Summary of Significant Accounting Policies
PetMed Express, Inc. and subsidiaries, d/b/a 1-800-PetMeds (the “Company”), is a leading nationwide pet pharmacy. The Company markets and sells prescription and non-prescription pet medications, and other health products, and supplies for dogs cats, and horsescats, direct to the consumer. The Company markets its products through national television, online, and direct mail/print advertising campaigns, which aim to increase the recognition of the “1-800-PetMeds” brand name and “PetMeds” family of trademarks, increase traffic on its website atwww.1800petmeds.com, acquire new customers, and maximize repeat purchases. The majority of all of the Company'sCompany’s sales are to residents in the United States. The Company’s executive offices are located in Pompano Beach, Florida. The Company'sCompany’s fiscal year end is March 31, and references herein to fiscal 2009, 2008,2012, 2011, or 20072010 refer to the Company'sCompany’s fiscal years ended March 31, 2009, 2008,2012, 2011, and 2007,2010, respectively.
Principles of Consolidation
The consolidated financial statements include the accounts of the Company and its
three wholly owned subsidiaries. All significant intercompany transactions have been eliminated in consolidation.
The Company generates revenue by selling pet medication products
primarilyand pet supplies mainly to retail
consumers and minimally to wholesale customers.consumers. The Company’s policy is to recognize revenue from product sales upon shipment, when the rights of ownership and risk of loss have passed to the customer. Outbound shipping and handling fees are included in sales and are billed upon shipment. Shipping expenses are included in cost of sales.
The majority of the Company’s sales are paid by credit cards and the Company usually receives the cash settlement in two to three banking days. Credit card sales minimize the accounts receivable balances relative to sales. The Company maintains an allowance for doubtful accounts for losses that the Company estimates will arise from the customers’ inability to make required payments, arising from either credit card charge-backs or insufficient funds checks. The Company determines its estimates of the uncollectibility of accounts receivable by analyzing historical bad debts and current economic trends. At March 31, 20092012 and 2008,2011, the allowance for doubtful accounts was approximately $59,000$5,000 and $32,000,$6,000, respectively.
Cash and Cash Equivalents
The Company considers all highly liquid investments with maturity of three months or less when purchased to be cash equivalents. Cash and cash equivalents at March 31,
20092012 and
20082011 consisted of the Company’s cash accounts
overnight repurchase agreements, and money market accounts with a maturity of three months or less. The carrying amount of cash equivalents approximates fair value. The Company maintains its cash in bank deposit accounts which, at times, may exceed federally insured limits. The Company has not experienced any losses in such accounts.
Temporary
Short and Long Term Investments
The Company’s short term investment portfolio includesbalance consists of short term bond mutual funds. The Company’s long term investment balance consisted of auction rate securities (“ARS”), which are investments with contractual maturities generally between 20 to 30 years, in the form of municipal bonds and preferred stock, whose interest rates are reset, typically every seven to twenty-eight days, through an auction process. At the end of each reset period, investors can sell or continue to hold the securities at par. Beginning in February 2008, auctions failed for the ARS held because sell orders exceeded buy orders. These failures arewere not believed to be a credit issue, but rather are caused by a lack of liquidity. The funds associated with these failed auctions maywere not be accessible until the issuer calls the security, a successful auction occurs, a buyer is found outside of the auction process, or the security matures. These
NOTES TO CONSOLIDATED FINANCIAL STATEMENTS
| (1) | Summary of Significant Accounting Policies (Continued) |
As a result, these securities with failed auctions have been reclassifiedclassified as long-term assets in the Consolidated Balance Sheet due to the fact that they were not currently trading at such date, and conditions in the general markets created uncertainty as to when successful auctions would be reestablished.
NOTES TO CONSOLIDATED FINANCIAL STATEMENTS
(1)
Summary of Significant Accounting Policies (Continued)
These ARS are recorded at estimated fair value and have variable interest rates that are recorded as interest income. In accordance with the Statement of Financial Accounting StandardsASC Topic 320 (“SFAS”) No. 115,Accounting for Certain Investments in Debt and Equity SecuritiesSecurities”), temporaryshort term investments are accounted for as trading securities. Trading securities are securities that are bought and held principally for the purpose of selling in the near term. In fiscal 2008, the Company reclassified the majority of its ARS from temporary investments to long term investments due to the widespread auction failures occurring in February 2008, as it is unknown if the Company will be able to liquidate these securities within one year. Long term investments are classif iedclassified as available-for-sale, with any changes in fair value to be reflected in other comprehensive income. The Company evaluates its long term investments for impairment and whether impairment is other-than-temporary, and, if other-than-temporary, then the measurement of anthe impairment loss asis a charge to net income. Unrealized gains and losses are deemed temporary and are included in accumulated other comprehensive income. The Company recognized a temporary impairment on its ARS investments during fiscal 2009.2011. The Company doesdid not believe that the underlying credit quality of the assets hashad been impacted; however the temporary impairment is mainly due to the lack of liquidity. The Company liquidated its entire ARS balance in fiscal 2012.
The preparation of consolidated financial statements in conformity with accounting principles generally accepted in the United States of America requires management to make estimates and assumptions that affect the reported amounts of assets and liabilities and disclosure of contingent assets and liabilities at the date of the consolidated financial statements and the reported amounts of revenues and expenses during the reporting period. Actual results could differ from those estimates.
Inventories consist of prescription and non-prescription pet medications and pet supplies that are available for sale and are priced at the lower of cost or market value using a weighted average cost method. The Company writes down its inventory for estimated obsolescence. The inventory reserve was approximately
$202,000$66,000 and
$135,000$63,000 at March 31,
20092012 and
2008,2011, respectively.
Property and equipment are stated at cost and depreciated using the straight-line method over the estimated useful lives of the assets. The furniture, fixtures, equipment, and computer software are depreciated over periods ranging from three to seven years. Leasehold improvements and assets under capital lease agreements are amortized over the shorter of the underlying lease agreement or the useful life of the asset.
Long-lived assets are reviewed for impairment whenever events or changes in circumstances indicate that the carrying amount may not be recoverable. Recoverability of assets is measured by a comparison of the carrying amount of the asset to
net futurethe undiscounted cash flows expected to be generated from the asset.
The intangible asset consists of a toll-free telephone number and an internet domain name. In October 2008, the Company paid $485,000 for expenses related to acquiring the internet domain name,www.petmed.com. In accordance with the SFAS No. 142,ASC Topic 350 (“Goodwill and Other Intangible Assets,Assets”) the intangible assets are not being amortized, and are subject to an annual review for impairment.
Advertising
Fair Value of Financial Instruments
The Company'scarrying amounts of the Company’s cash and cash equivalents, accounts receivable, and accounts payable approximate fair value due to the short-term nature of these instruments.
NOTES TO CONSOLIDATED FINANCIAL STATEMENTS
(1) Summary of Significant Accounting Policies (Continued)
Advertising
The Company’s advertising expenses consist primarily of television advertising,
Internetonline marketing, and direct mail/print advertising. Television advertising costs are expensed as the advertisements are televised. Internet costs are expensed in the month incurred and direct mail/print costs are expensed when the related catalogs, brochures, and postcards are produced, distributed, or superseded.
NOTES TO CONSOLIDATED FINANCIAL STATEMENTS
(1)
Summary of Significant Accounting Policies (Continued)
Fair Value of Financial Instruments
The carrying amounts of the Company's cash and cash equivalents, temporary investments, accounts receivable, and accounts payable approximate fair value due to the short-term nature of these instruments. The Company believes that the carrying amount of its long term investments approximate fair value.
The Company applies SFAS No. 130,ASC Topic 220 (“Reporting Comprehensive Income,Income”) which requires that all items that are recognized under accounting standards as components of comprehensive income be reported in a financial statement that is displayed with the same prominence as other financial statements. The items of other comprehensive income that are typically required to be displayed are foreign currency items, minimum pension liability adjustments, and unrealized gains and losses on certain investments in debt and equity securities. The Company evaluates its long term investments for impairment and whether impairment is other-than-temporary, and measurement of an impairment loss as a charge to net income. Unrealized gains and losses are deemed temporary and are included in accumulated other comprehensive income.
TheAt March 31, 2012 the Company recorded an unrealized recovery of $110,000, within accumulated other comprehensive income, based upon receiving full par value of these ARS. At March 31, 2011 the Company recognized a temporary impairment on its ARS investments,
during fiscal 2009, and
thi sthis unrealized loss was included in accumulated other comprehensive income.
The following is a summary of our comprehensive income (in thousands):
| | | March 31, | |
| | | 2012 | | | 2011 | | | 2010 | |
| | | | | | | | | | |
| Net income | | $ | 16,659 | | | $ | 20,871 | | | $ | 26,002 | |
Net change in unrealized loss on short term investments | | | 75 | | | | (31 | ) | | | - | |
Net change in unrealized gain (loss) and redemptions on long term investments | | | 110 | | | | (2 | ) | | | 112 | |
| Comprehensive income | | $ | 16,844 | | | $ | 20,838 | | | $ | 26,114 | |
The Company accounts for income taxes under the provisions of SFAS No. 109,ASC Topic 740 (“Accounting for Income Taxes,”) which generally requires the recognition of deferred tax assets and liabilities for the expected future tax benefits or consequences of events that have been included in the consolidated financial statements or tax returns. Under this method, deferred tax assets and liabilities are determined based on differences between the financial reporting carrying values and the tax bases of assets and liabilities, and are measured by applying enacted tax rates and laws for the taxable years in which those differences are expected to reverse.
The Company adopted the provisions of the Financial Accounting Standards Board (“FASB”) Interpretation No. 48,ASC Topic 740 ( “Accounting for Uncertainty in Income Taxes - an interpretation of FASB Statement No. 109” (“FIN 48”)Taxes”, in the first quarter of fiscal 2008. Previously, the Company had accounted for tax contingencies in accordance with SFAS No. 5,Accounting for Contingencies. As required by FIN 48,“Accounting for Uncertainty in Income Taxes” guidance, which clarifies SFAS No. 109,Accounting for Income Taxes,ASC Topic 740, the Company recognizes the financial statement benefit of a tax position only after determining that the relevant tax authority would more likely than not sustain the position following an audit. For tax positions meeting the more-likely-than-not threshold, the amount recognized in the Consolidated Financial Statements is the largest benefit that has a greater than 50 percent likelihood of being realized upon ultimate settlement with the relevant tax authority. At the adoption date, the Company applied FIN 48“Accounting for Uncertainty in Income Taxes” guidance to all tax positions for which the statute of limitations remained open. The Company files tax returns in the U.S. federal jurisdiction and Florida and Georgia. With few exceptions, the Company is no longer subject to U.S. federal, state or local income tax examinations by tax authorities for years ending March 31, 2008.
NOTES TO CONSOLIDATED FINANCIAL STATEMENTS
| (1) | Summary of Significant Accounting Policies (Continued) |
Upon implementing
FIN 48,“Accounting for Uncertainty in Income Taxes” guidance, the Company did not recognize any additional liabilities for unrecognized tax positions.
In fiscal 2008 it was determined that nexus was established in another state, resulting in a reduction to the Company’s effective tax rate, and the recognition of a $386,000 one time charge related to uncollected state/county sales tax. The adoption of
FIN 48“Accounting for Uncertainty in Income Taxes” guidance had no
other material impact on the Company’s consolidated financial position, results of operations, or cash flows in fiscal
2009.2012. Any interest and penalties related to income taxes will be recorded to other income (expenses).
The Company purchases its products from a variety of sources, including certain manufacturers, domestic distributors, and wholesalers. We have multiple suppliers for each of our products to obtain the lowest cost. There
are currently threewere four suppliers from whom we purchased approximately 50% of all products in fiscal
2009, and two2012, compared to seven suppliers
from whom we purchased approximately
39%50% of all products in fiscal
2008.
NOTES TO CONSOLIDATED FINANCIAL STATEMENTS
(1)
Summary of Significant Accounting Policies (Continued)
2011.
Accounting for Share Based Compensation
Stock Options
The Company records compensation expense associated with stock options and restricted stock in accordance with SFAS No. 123R,ASC Topic 718 (“Share Based Payment,” which is a revision of SFAS No. 123.Payment”). The Company adopted the modified prospective transition method provided under
SFAS No. 123R. Under this transition method, compensation expense associated with stock options recognized in the first quarter of fiscal 2007, and in subsequent quarters, includes expense related to the remaining unvested portion of all stock option awards granted prior to April 1, 2006, and the estimated fair value of each option award granted was determined on the date of grant using the Black-Scholes option valuation model, based on the grant date fair value estimated in accordance with the original provisions of SFAS No. 123.ASC Topic 718. The compensation expense related to all of the Company’s stock-based compensation arrangements is recorded as a component of general and administrative expenses.
As a result of the adoption of SFAS No. 123R, the Company’s net income for the fiscal years ended March 31, 2009 and 2008 includes approximately $243,000 and $790,000 of stock option compensation expense, respectively. As of March 31, 2009 and 2008, there was approximately $24,000 and $267,000, respectively, of unrecognized compensation expense related to vested stock option awards, which are expected to be recognized over a 1-year period.
Restricted Stock
The Company had 247,609 restricted common shares issued under the Employee Plan and 68,000 restricted common shares issued under the Director Plan at March 31, 2009, the fair value of which is being amortized over a three-year period. The compensation expense related to all of the Company’s stock-based compensation arrangements is recorded as a component of general and administrative expenses.
Recent Accounting Pronouncements
In September 2006, the FASB issued Statement of Financial Accounting Standards (“SFAS”) No. 157, “Fair Value Measurements,” which defines fair value, establishes a framework for measuring fair value under GAAP, and expands disclosures about fair value measurements. SFAS No. 157 applies to other accounting pronouncements that require or permit fair value measurement. In February 2008, the FASB issued Staff Position (“FSP”) SFAS 157-2 which delays the effective date of SFAS No. 157 for non- financial assets and non-financial liabilities, except items that are recognized or disclosed at fair value in the financial statements on a recurring basis. The FSP defers the effective date of Statement 157 for non-financial items to fiscal years beginning after November 15, 2008 (our Fiscal 2010), and for interim periods within those fiscal years. In October&nbs p;2008, the FASB issued FSP 157-3, “Determining the Fair Value of a Financial Asset When the Market for That Asset Is Not Active” (“FSP 157-3”). FSP 157-3 clarifies the application of SFAS No. 157 in a market that is not active and addresses application issues such as the use of internal assumptions when relevant observable data does not exist, the use of observable market information when the market is not active, and the use of market quotes when assessing the relevance of observable and unobservable data. FSP 157-3 is effective for all periods presented in accordance with SFAS No. 157. The adoption of FSP 157-3 did not have a significant impact on the Company’s consolidated financial statements or the fair values of its financial assets and liabilities. In April 2009, the FASB issued FSP SFAS 157-4,Determining the Fair Value When the Volume and Level of Activity for the Asset or Liability Have Significantly Decreased and Identifying Transactions Tha t Are Not Orderly (“FSP 157-4”), which emphasizes that even if there has been a significant decrease in the volume and level of activity for an asset or liability, the objective of the fair value measurement remains the same.It is effective for interim and annual reporting periods ending after June 15, 2009 (our fiscal 2010), and is to be applied prospectively. We are currently assessing the impact of FSP 157-4, if any, on our consolidated financial statements. We have not completed our evaluation of the potential impact, if any, of the adoption of SFAS No. 157 on our consolidated financial position, results of operations, and cash flows.
NOTES TO CONSOLIDATED FINANCIAL STATEMENTS
(1)
Summary of Significant Accounting Policies (Continued)
In April 2008, the FASB issued FSP No. 142-3, Determination of the Useful Life of Intangible Assets. FSP 142-3 amends the factors that should be considered in developing assumptions about renewal or extension used in estimating the useful life of a recognized intangible asset under SFAS No. 142, Goodwill and Other Intangible Assets. This standard is intended to improve the consistency between the useful life of a recognized intangible asset under SFAS No. 142 and the period of expected cash flows used to measure the fair value of the asset under SFAS No. 141R, Business Combinations, and other Generally Accepted Accounting Principles (GAAP). FSP No.142-3 is effective for financial statements issued for fiscal years beginning after December 15, 2008. The Company does not anticipate that the adoption of this statement will have a material impact on its financial position, r esults of operations, or cash flows.
In November 2008, the FASB issued EITF Issue No. 08-7, “Accounting for Defensive Intangible Assets” (EITF 08-7). EITF 08-7 addresses the accounting for assets acquired in a business combination or asset acquisition that an entity does not intend to actively use, otherwise referred to as a ‘defensive asset.’ EITF 08-7 requires defensive intangible assets to be initially accounted for as a separate unit of accounting and not included as part of the cost of the acquirer’s existing intangible asset(s) because it is separately identifiable. EITF 08-7 also requires that defensive intangible assets be assigned a useful life in accordance with paragraph 11 of SFAS 142 and is effective for financial statements issued for fiscal years beginning after December 15, 2008. The Company does not anticipate that the adoption of this statement will have a materia l impact on its financial position, results of operations, or cash flows.
In April 2009, the FASB issued FSP FAS 115-2 and FAS 124-2,Recognition and Presentation of Other-than-Temporary Impairments. FSP FAS 115-2 and FAS 124-2 amends the other-than-temporary impairment guidance in U.S. GAAP for debt securities, changes existing guidance for determining whether an impairment is other than temporary to debt securities, replaces the existing requirement that the entity’s management assert it has both the intent and ability to hold an impaired security until recovery, requires that an entity recognize noncredit losses on held-to-maturity debt securities in other comprehensive income and amortize that amount over the remaining life of the security in a prospective manner, requires an entity to present the total other-than-temporary impairment in the statement of income with an offset for the amount recognized in other comprehensive income, and when adopting FSP FAS 115-2 and FAS 1 24-2, an entity is required to record a cumulative-effect adjustment as of the beginning of the period of adoption. This FSP does not amend existing recognition and measurement guidance related to other-than-temporary impairments of equity securities. FSP FAS 115-2 and 124-2 is effective for interim and annual reporting periods ending after June 15, 2009. We are currently evaluating the impact FSP FAS 115-2 and 124-2 will have on our Consolidated Financial Statements.
In April 2009, the FASB issued FSP FAS 107-1 and APB 28-1,Interim Disclosures about Fair Value of Financial Instruments. FSP FAS 107-1 and APB 28-1 amends FASB Statement No. 107,Disclosures about Fair Value of Financial Instruments, and requires disclosures about the fair value of financial instruments for interim reporting periods of publicly traded companies as well as in annual financial statements. This FSP also amends APB No. 28,Interim Financial Reporting, to require those disclosures in summarized financial information at interim reporting periods. FSP FAS 107-1 and APB 28-1 are effective for interim reporting periods ending after June 15, 2009 (our fiscal 2010). We are currently evaluating the impact FSP FAS 107-1 and ABP 28-1 will have on our Consolidated Financial Statements.
The Company does not believe that any
other recently issued, but not yet effective, accounting standards, if currently adopted, will have a material effect on the Company’s consolidated financial position, results of operations, or cash flows.
NOTES TO CONSOLIDATED FINANCIAL STATEMENTS
(2)
Temporary and Long Term Investments
The
following is a summary of our investments: | | | | |
| | March 31, |
| | 2009 | | 2008 |
Temporary investments | $ | - | $ | 4,780,000 |
| | | | |
Long term investments | | 14,430,250 | | 24,740,000 |
| | | | |
Total investments | $ | 14,430,250 | $ | 29,520,000 |
The short and long term investment balances consistconsisted of ARS investments. Our ARS consistconsisted of closed-end fund preferred ARS, securities, whosewith interest rates arethat reset, typically every seven to twenty-eight days. These ARS are currentlywere rated AAA, the highest rating available by a rating agency. The fair value of our ARS investments is determined based on quoted market prices atwas assessed by management with the reporting date for those instruments in fiscal 2008, and in fiscal 2009 the fair value was based upon an assessment byassistance of an outside third party.party appraisal firm, during fiscal 2011. At March 31, 2012, the Company had liquidated its entire Auction Rate Security (“ARS”) balance, and recorded an unrealized recovery of $110,000 within accumulated other comprehensive gain (loss) account, based upon receiving full par value for these ARS. As of March 31, 2009,2011, the Company held $14,650,000 (par)$12.5 million in ARS, at par, which were classified as long term investments and the Company recorded an unrealized impairment loss of $219,750, inapproximately $2,000 for the fourth quarteryear then ended. As of fiscal 2009,March 31, 2011, cumulative losses of $110,000 were recognized within the accumulated other comprehensive income (loss) based upon an assessment of the fair value of these ARS.loss account. The $219,750$110,000 impairment was recorded as temporary due to the fact that the Company has bothhad the abilityintent and intentthe ability to hold these securities until anticipated recovery or maturity.
maturity, and did expect to fully recover the cost basis of the investment.
(3)
Fair Value
Measurements
Effective April 1, 2008, the Company adopted
SFAS 157,ASC Topic 820 (“Fair Value Measurements”), except as it applies to
nonfinancialnon-financial assets and
nonfinancialnon-financial liabilities subject to
FSP SFAS 157-2. SFAS 157ASC Topic 320. ASC Topic 320 clarifies that fair value is an exit price, representing the amount that would be received to sell an asset or paid to transfer a liability in an orderly transaction between market participants. As such, fair value is a market-based measurement that should be determined based on assumptions that market participants would use in pricing an asset or a liability.
SFAS 157 ASC Topic 820 establishes a three-tier fair value hierarchy, which prioritizes the inputs used in the valuation methodologies in measuring fair value:
Level 1 - Observable inputs that reflect quoted prices (unadjusted) for identical assets or liabilities in active markets.
Level 2 - Include other inputs that are directly or indirectly observable in the marketplace.
Level 3 - Unobservable inputs which are supported by little or no market activity.
NOTES TO CONSOLIDATED FINANCIAL STATEMENTS
(3) Fair Value Measurements (Continued)
The fair value hierarchy also requires an entity to maximize the use of observable inputs and minimize the use of unobservable inputs when measuring fair value. The Company’s cash equivalents and marketable securities are classified within Level 1, with the exception of the investments in auction rate securities.ARS. The Company’s investments in auction rate securitiesARS are classified within Level 3 because they are valued using a discounted cash flow model. Some of the inputs to this model are unobservable in the market and are significant.
Assets and liabilities measured at fair value are summarized
below:
| | | | | | | | |
| | | | Fair Value Measurement at March 31, 2009 Using |
| | | | Quoted Prices | | Significant | | |
| | | | in Active | | Other | | Significant |
| | | | Markets for | | Observable | | Unobservable |
| | March 31, | | Identical Assets | | Inputs | | Inputs |
| | 2009 | | (Level 1) | | (Level 2) | | (Level 3) |
Assets: | | | | | | | | |
Overnight Repurchase | $ | 1,563,160 | $ | 1,563,160 | $ | - | $ | - |
Money market funds | | 28,562,881 | | 28,562,881 | | - | | - |
Auction rate securities | | 14,430,250 | | - | | - | | 14,430,250 |
| | | | | | | | |
| $ | 44,556,291 | $ | 30,126,041 | $ | - | $ | 14,430,250 |
NOTES TO CONSOLIDATED FINANCIAL STATEMENTS
(3)
Fair Value (Continued)
below (in thousands):
| | | | | | Fair Value Measurement at March 31, 2012 Using | |
| | | | | | Quoted Prices | | | Significant | | | | |
| | | | | | in Active | | | Other | | | Significant | |
| | | | | | Markets for | | | Observable | | | Unobservable | |
| | | March 31, | | | Identical Assets | | | Inputs | | | Inputs | |
| | | 2012 | | | (Level 1) | | | (Level 2) | | | (Level 3) | |
| Assets: | | | | | | | | | | | | |
| Cash and Cash equivalents - money markets funds | | $ | 46,801 | | | $ | 46,801 | | | $ | - | | | $ | - | |
| Short term investments - bond mutual funds | | | 10,347 | | | | 10,347 | | | | - | | | | - | |
| | | | | | | | | | | | | | | | | |
| | | $ | 57,148 | | | $ | 57,148 | | | $ | - | | | $ | - | |
The following table is a reconciliation of financial assets measured at fair value using unobservable inputs (Level 3) during the year ended March 31,
2009:
| | |
| | Auction Rate
|
| | Securities
|
| | Year Ended
|
| | March 31,2009
|
| | |
Balance, beginning of year
| $
| -
|
Transfer into Level 3
| | 14,650,000
|
Total unrealized loss included in other comprehensive income
| (219,750)
|
Balance, end of year
| $
| 14,430,250
|
Marketable securities2012 (in thousands):
| | | Auction Rate Securities | |
| | | Ended March 31, | |
| | | 2012 | | | 2011 | |
| | | | | | | |
| Balance, beginning of year | | $ | 12,390 | | | $ | 12,392 | |
| Redemption of securities | | | (12,500 | ) | | | - | |
| Recovery of valuation | | | 110 | | | | - | |
| Total unrealized loss included in other comprehensive income | | | - | | | | (2 | ) |
| Balance, end of year | | $ | - | | | $ | 12,390 | |
Long term investments measured at fair value using Level 3 inputs are comprised of auction rate securities.ARS. Although ARS would typically be measured using Level 2 inputs, the recent failure of auctions and the lack of market activity and liquidity required that these securities be measured using Level 3 inputs. The Company’s ARS consisted of closed-end fund preferred ARS, with interest rates that reset, typically every seven to twenty-eight days. The fair value of our ARS investments was assessed by management with the assistance of an outside third party appraisal firm, which was conducted during fiscal 2011. The fair value was calculated using a discounted cash flow valuation model. The three inputs used in determining the fair values of the ARS were:
(1) Forecasted interest payments cash flows - In failed ARS auctions interest rates are set by the terms of the prospectus. For almost all of the securities the terms are a combination of two components: the determination of a base rate which is based on the maximum of two indexes, or a single index as defined in the prospectus. Base rates are adjusted through either a multiplication factor or an addition of a spread factor as defined in the prospectus which is dependent on the credit rating of the security. Our ARS were rated AAA, the highest rating available by a rating agency.
NOTES TO CONSOLIDATED FINANCIAL STATEMENTS
(3) Fair Value Measurements (Continued)
(2) Discount rate calculation - The discount rates that were appliedcalculated from the applicable forward curve plus a credit risk/liquidity spread. The credit risk spread was estimated via the credit spreads for 1-3 year term, AAA rated, debt over US Treasury notes and bonds which were determined to be 50 basis points (0.50%). To address the continued illiquidity of the Company’s ARS portfolio, an additional spread of 0.30% was added to the pricing model werecredit risk spread. This spread is based on market conditionsthe required yield attributable to liquidity for AAA rated debt, as determined by empirical studies. Specifically, research on municipal bond yields indicate that for AAA rated securities, the liquidity component represents approximately 7-10% of the required yield. In total, a credit risk/liquidity spread of 0.80% was utilized.
(3) A present value calculation was performed utilizing the cash flow of the forecasted interest payments combined with the discount rate determined above.
At March 31, 2012, the Company had liquidated its entire ARS balance, and
ratesrecorded an unrealized recovery of $110,000 within accumulated other comprehensive gain (loss) account, based upon receiving full par value for
comparablethese ARS. As of March 31, 2011, the Company held $12.5 million in ARS, at par, which were classified as long term investments and the Company recorded an unrealized impairment loss of approximately $2,000 for the year then ended. As of March 31, 2011, cumulative losses of $110,000 were recognized within the accumulated other comprehensive loss account, based upon an assessment by the outside third party appraisal firm. The $110,000 impairment was recorded as temporary due to the fact that the Company had the intent and the ability to hold these securities until anticipated recovery or
similar term asset-backed securities as well as other fixed income securities.
maturity, and did expect to fully recover the cost basis of the investment.
(4)
Property and Equipment
Major classifications of property and equipment consist of the
following:
| | | | |
| | March 31, |
| | 2009 | | 2008 |
| | | | |
Leasehold improvements | $ | 1,059,370 | $ | 453,771 |
Computer software | | 2,162,629 | | 1,329,690 |
Furniture, fixtures and equipment | | 5,509,100 | | 3,035,830 |
| | 8,731,099 | | 4,819,291 |
Less: accumulated depreciation and amortization | | (3,673,538) | | (2,915,997) |
| | | | |
Property and equipment, net | $ | 5,057,561 | $ | 1,903,294 |
following (in thousands):
| | | March 31, | |
| | | 2012 | | | 2011 | |
| | | | | | | |
| Leasehold improvements | | $ | 1,092 | | | $ | 1,063 | |
| Computer software | | | 2,406 | | | | 2,236 | |
| Furniture, fixtures and equipment | | | 5,475 | | | | 5,194 | |
| | | | 8,973 | | | | 8,493 | |
| Less: accumulated depreciation | | | (6,376 | ) | | | (5,060 | ) |
| | | | | | | | | |
| Property and equipment, net | | $ | 2,597 | | | $ | 3,433 | |
(5)
Accrued Expenses and Other Current Liabilities
Major classifications of accrued expenses and other current liabilities consist of the
following:
| | | | |
| | March 31, |
| | 2009 | | 2008 |
| | | | |
Accrued sales tax | $ | 515,583 | $ | 512,151 |
Accrued credit card fees | | 386,306 | | 320,083 |
Accrued salaries and benefits | | 275,777 | | 224,258 |
Accrued professional expenses | | 204,241 | | 210,657 |
Other accrued liabilities | | 795,931 | | 609,506 |
| | | | |
Accrued expenses and other current liabilities | $ | 2,177,838 | $ | 1,876,655 |
following (in thousands):| | | March 31, | |
| | | 2012 | | | 2011 | |
| | | | | | | |
| Accrued sales tax | | $ | 499 | | | $ | 505 | |
| Accrued credit card fees | | | 323 | | | | 421 | |
| Accrued salaries and benefits | | | 569 | | | | 475 | |
| Accrued professional expenses | | | 319 | | | | 185 | |
| Accrued advertising expenses | | | 230 | | | | 196 | |
| Accrued sales return allowance | | | 167 | | | | 155 | |
| Accrued dividends payable | | | 168 | | | | 143 | |
| Other accrued liabilities | | | 497 | | | | 429 | |
| | | | | | | | | |
| Accrued expenses and other current liabilities | | $ | 2,772 | | | $ | 2,509 | |
NOTES TO CONSOLIDATED FINANCIAL STATEMENTS
Deferred income taxes reflect the net tax effects of temporary differences between the carrying amount of assets and liabilities for financial reporting purposes and the amounts used for income tax purposes. The tax effects of temporary differences that give rise to significant portions of deferred tax assets and deferred tax liabilities are as
follows:
| | | | |
| | March 31, |
| | 2009 | | 2008 |
Deferred tax assets: | | | | |
Bad debt and inventory reserves | $ | 96,921 | $ | 62,285 |
Accrued expenses | | 584,519 | | 457,915 |
Deferred stock compensation | | 432,148 | | 313,779 |
Net operating loss carryforward | | 827,878 | | 928,347 |
| | | | |
Deferred tax assets | | 1,941,466 | | 1,762,326 |
Less: valuation allowance | | (333,080) | | (432,744) |
| | | | |
Total deferred tax assets | | 1,608,386 | | 1,329,582 |
| | | | |
Deferred tax liabilities: | | | | |
Depreciation | | (883,825) | | (107,729) |
| | | | |
Total net deferred taxes | $ | 724,561 | $ | 1,221,853 |
Thefollows (in thousands):
| | | March 31, | |
| | | 2012 | | | 2011 | |
| Deferred tax assets: | | | | | | |
| Bad debt and inventory reserves | | $ | 26 | | | $ | 25 | |
| Accrued expenses | | | 535 | | | | 543 | |
| Deferred stock compensation | | | 331 | | | | 336 | |
| Net operating loss carryforward | | | 250 | | | | 349 | |
| | | | | | | | | |
| Deferred tax assets | | | 1,142 | | | | 1,253 | |
| Less: valuation allowance | | | - | | | | - | |
| | | | | | | | | |
| Total deferred tax assets | | | 1,142 | | | | 1,253 | |
| | | | | | | | | |
| Deferred tax liabilities: | | | | | | | | |
| Property and equipment | | | (404 | ) | | | (571 | ) |
| | | | | | | | | |
| Total net deferred taxes | | $ | 738 | | | $ | 682 | |
There was no change in the valuation allowance
which was $0 for
both the
fiscal years ended March 31,
20092012 and
2008 was approximately $100,000 and $119,000, respectively.2011. At March 31,
2009,2012, the Company had federal net operating loss carryforwards of approximately
$2,228,000.$675,000. The federal net operating loss carryforwards expire in the years
2013 through 2020.2020 and 2021. The use of such net operating loss carryforwards is limited to approximately $266,000 annually due to a change of control on November 22, 2000.
The components of the income tax provision consist of the following:
| | | | | | |
| | Year Ended March 31, |
| | 2009 | | 2008 | | 2007 |
| | | | | | |
Current taxes | | | | | | |
Federal | $ | 11,097,347 | $ | 9,736,070 | $ | 7,594,848 |
State | | 1,085,596 | | 980,157 | | 1,262,937 |
Total current taxes | | 12,182,943 | | 10,716,227 | | 8,857,785 |
| | | | | | |
Deferred taxes | | | | | | |
Federal | | 452,980 | | (297,375) | | (86,204) |
State | | 44,312 | | (29,938) | | (14,334) |
Total deferred taxes | | 497,292 | | (327,313) | | (100,538) |
| | | | | | |
Total provision for income taxes | $ | 12,680,235 | $ | 10,388,914 | $ | 8,757,247 |
NOTES TO CONSOLIDATED FINANCIAL STATEMENTS
(6)
Income Taxes (Continued)
following (in thousands):
| | | Year Ended March 31, | |
| | | 2012 | | | 2011 | | | 2010 | |
| | | | | | | | | | |
| Current taxes | | | | | | | | | |
| Federal | | $ | 9,138 | | | $ | 11,007 | | | $ | 13,738 | |
| State | | | 870 | | | | 1,052 | | | | 1,307 | |
| Total current taxes | | | 10,008 | | | | 12,059 | | | | 15,045 | |
| | | | | | | | | | | | | |
| Deferred taxes | | | | | | | | | | | | |
| Federal | | | (270 | ) | | | 317 | | | | (279 | ) |
| State | | | (26 | ) | | | 30 | | | | (26 | ) |
| Total deferred taxes | | | (296 | ) | | | 347 | | | | (305 | ) |
| | | | | | | | | | | | | |
| Total provision for income taxes | | $ | 9,712 | | | $ | 12,406 | | | $ | 14,740 | |
The reconciliation of income tax provision computed at the U.S. federal statutory tax rates to income tax expense is as
follows:
| | | | | | |
| | Year Ended March 31, |
| | 2009 | | 2008 | | 2007 |
| | | | | | |
Income taxes at U.S. statutory rates | $ | 12,479,826 | $ | 10,643,901 | $ | 8,120,262 |
State income taxes, net of federal tax benefit | | 749,950 | | 607,164 | | 829,427 |
Permanent differences | | (476,714) | | (551,503) | | (226,620) |
Other | | 26,837 | | (192,052) | | 120,904 |
Change in valuation allowance | | (99,664) | | (118,596) | | (86,726) |
| | | | | | |
Total provision for income taxes | $ | 12,680,235 | $ | 10,388,914 | $ | 8,757,247 |
follows (in thousands):
| | | Year Ended March 31, | |
| | | 2012 | | | 2011 | | | 2010 | |
| | | | | | | | | | |
| Income taxes at U.S. statutory rates | | $ | 9,230 | | | $ | 11,647 | | | $ | 14,260 | |
| State income taxes, net of federal tax benefit | | | 540 | | | | 714 | | | | 823 | |
| Permanent differences | | | (68 | ) | | | (64 | ) | | | (123 | ) |
| Other | | | 10 | | | | 109 | | | | 113 | |
| Change in valuation allowance | | | - | | | | - | | | | (333 | ) |
| | | | | | | | | | | | | |
| Total provision for income taxes | | $ | 9,712 | | | $ | 12,406 | | | $ | 14,740 | |
NOTES TO CONSOLIDATED FINANCIAL STATEMENTS
In April 1998, the Company issued 250,000 shares of its $.001 par value preferred stock at a price of $4.00 per share, less issuance costs of $112,187. Each share of the preferred stock is convertible into approximately 4.05 shares of common stock at the election of the shareholder. The shares have a liquidation value of $4.00 per share and may pay dividends at the sole discretion of the Company. The Company does not anticipate paying dividends to the preferred shareholders in the foreseeable future. Each share of preferred stock is entitled to one vote on all matters submitted to a vote of shareholders of the Company. As of March 31,
20092012 and
2008,2011, 2,500 shares of the convertible preferred stock remained unconverted and outstanding.
On November 8, 2006, the
Company'sCompany’s Board of Directors approved a share repurchase plan of up to
$20,000,000.$20.0 million. On October 31, 2008,
November 1, 2010, and August 1, 2011, the Company’s Board of Directors approved a second,
third, and fourth share repurchase plan,
respectively, each for an additional
$20,000,000.$20.0 million. The repurchase plan is intended to be implemented through purchases made from time to time in either the open market or through private transactions at the
Company'sCompany’s discretion, subject to market conditions and other factors, in accordance with Securities and Exchange Commission requirements. There can be no assurances as to the precise number of shares that will be repurchased under the share repurchase plan, and the Company may discontinue the share repurchase plan at any time subject to compliance with applicable regulatory requirements. Shares purchased pursuant to the share repurchase plan will either be cancelled or held in the
Company'sCompany’s treasury.
&nbs p;During fiscal
20092012 the Company repurchased approximately
1,347,0002.1 million shares of the Company’s outstanding common stock for approximately
$18,448,000,$23.7 million, averaging approximately
$13.70$11.36 per share. During fiscal
20082011 the Company repurchased approximately
952,000791,000 shares of the Company’s outstanding common stock for approximately
$11,601,000,$12.2 million, averaging approximately
$12.19$15.47 per share. As of March 31,
20092012 the Company had approximately
$9,952,000$14.0 million remaining under the Company’s share repurchase plan.
Dividends
On August 3, 2009, the Company’s Board of Directors declared its first quarterly dividend of $0.10 per share on its common stock. On August 2, 2010, the Company’s Board of Directors increased the quarterly dividend to $0.125 per share, and then on January 27, 2012, the Company’s Board of Directors increased the quarterly dividend to $0.15 per share. The Company intends to continue to pay regular quarterly dividends; however the declaration and payment of future dividends is discretionary and will be subject to a determination by the Board of Directors each quarter following its review of the Company’s financial performance.
During fiscal 2012, our Board of Directors declared the following dividends:
| Declaration Date | | Per Share
Dividend | | Record Date | | Total Amount
(In thousands) | | Payment Date |
| | | | | | | | | |
| May 6, 2011 | | $ | 0.125 | | May 16, 2011 | | $ | 2,782 | | May 27, 2011 |
| July 29, 2011 | | $ | 0.125 | | August 12, 2011 | | $ | 2,626 | | August 26, 2011 |
| October 28, 2011 | | $ | 0.125 | | November 11, 2011 | | $ | 2,542 | | November 25, 2011 |
| January 27, 2012 | | $ | 0.150 | | February 10, 2012 | | $ | 3,051 | | February 24, 2012 |
NOTES TO CONSOLIDATED FINANCIAL STATEMENTS
(8)
Stock Options and Restricted Stock
Stock Options
The PetMed Express, Inc. 1998 Stock Option Plan (the “Plan”)
, which expired on July 31, 2008, provided for the issuance of qualified options to officers and key employees, and nonqualified options to directors, consultants, and other service providers, to purchase the Company’s common stock. The Company had reserved
5,000,0005.0 million shares of common stock for issuance under the Plan. The exercise prices of options issued under the Plan must be equal to or greater than the market price of the
Company'sCompany’s common stock as of the date of issuance.
The Company had 147,914 and 372,660 options outstanding under the Plan at March 31, 2009 and 2008, respectively. Options generally vest ratably over a three-year period commencing on the first anniversary of the grant with respect to options granted to employees/directors under the Plan.
The Company had no options outstanding at March 31, 2012 and 2011. No options have been issued since May 2005.
The 1998 Plan expired on July 3 1, 2008.A summary of the status of the Company’s stock option plan as of March 31, 2009 is as follows:
| | | | | | | |
| Number of
Shares | | Weighted
Average
Exercise
Price per
Share | | Weighted
Average
Remaining
Contractural
Term (years) | | Aggregate
Intrinsic
Value |
Options outstanding at March 31, 2008 | 372,660 | $ | 7.96 | | | | |
| | | | | | | |
Options granted | - | | - | | | | |
| | | | | | | |
Options exercised | (224,746) | | 8.42 | | | | |
| | | | | | | |
Options forfeited or expired | - | | - | | | | |
| | | | | | | |
Options outstanding at March 31, 2009 | 147,914 | $ | 7.27 | | 1.27 | $ | 1,075,091 |
| | | | | | | |
Options vested and exercisable at March 31, 2009 | 147,914 | $ | 7.27 | | 1.27 | $ | 1,075,091 |
Cash received from stock options exercised for the fiscal years ended March 31, 2009, 2008,2012, 2011, and 20072010 was approximately $1,893,000, $2,785,000,$0, $340,000 and $442,000,$735,000, respectively. The income tax benefits from stock options exercised totaled approximately $268,000, $284,000,$0, $0, and $243,000$299,000, for the fiscal years ended March 31, 2009, 2008,2012, 2011, and 2007,2010, respectively. At March 31, 20092012 and 2008, the number of options2011, there were no exercisable was 147,914 and 306,662, respectively, and the weighted-average exercise price of those options was $7.27 and $8.26, respectively. Adjustments were made for options forfeited prior to vesting.
A summary of the status of the Company’s non-vested stock options asoptions. As of March 31, 2009 is presented below:
| | | | | | |
| | Number of
Shares | | Weighted
Average
Exercise
Price per
Share | | Weighted
Average
Remaining
Contractural
Term (years) |
Non-vested options at March 31, 2008 | | 65,998 | $ | 6.60 | | |
| | | | | | |
Options granted | | - | | - | | |
| | | | | | |
Options vested | | (65,998) | | 6.60 | | |
| | | | | | |
Options forfeited or expired | | - | | - | | |
| | | | | | |
Non-vested options at March 31, 2009 | | - | $ | - | | - |
NOTES TO CONSOLIDATED FINANCIAL STATEMENTS
(8)
Stock Options2012 and Restricted Stock (Continued)
Restricted Stock
2011 the Company had no non-vested stock options. As of March 31, 2012 and 2011, there was no unrecognized compensation expense, aggregate intrinsic value, or weighted average remaining term, related to vested stock option awards.
On July 28, 2006, the Company received shareholder approval for the adoption of the 2006 Employee Equity Compensation Restricted Stock Plan (the “Employee Plan”) and the 2006 Outside Director Equity Compensation Restricted Stock Plan (the “Director Plan”). The purpose of the plans is to promote the interests of the Company by securing and retaining both employees and outside directors. The Company has reserved 1,000,0001.0 million shares of common stock for issuance under the Employee Plan, and 200,000 shares of common stock for issuance under the Director Plan. The value of the restricted stock is determined based on the market value of the stock at the issuance date. The restriction period or forfeiture period is determined by the Company’s Board and is to be no less than 1 year and no more than ten years. The Company had 247,609542,377 restricted common sha resshares issued under the Employee Plan and 68,000152,000 restricted common shares issued under the Director Plan at March 31, 2009,2012, all shares of which were issued subject to a restriction or forfeiture period which willlapsewill lapse ratably on the first, second, and third anniversaries of the date of grant, and the fair value of which is being amortized over the three-year restriction period. During the fiscal years ended March 31, 2009 and 2008, the Company issued, netFor each of forfeitures, 77,667 and 81,317 restricted shares, respectively. For the years ended March 31, 20092012 and 2008,2011, the Company recognized $1,221,000 and $890,000, respectively,$2.2 million of compensation expense related to the Employee and Director Plans.
A summary of the Company’s non-vested restricted stock as of March 31, 2012 is as follows:
| | | Employee
Plan
Number of Shares (In
thousands) | | | Director
Plan
Number of
Shares (In
thousands) | | | Total Plans
Number of
Shares (In
thousands) | |
| | | | | | | | | | |
| Non-vested restricted stock outstanding at March 31, 2011 | | | 196 | | | | 54 | | | | 250 | |
| | | | | | | | | | | | | |
| Restricted stock granted | | | 61 | | | | 30 | | | | 91 | |
| | | | | | | | | | | | | |
| Restricted stock vested | | | (96 | ) | | | (26 | ) | | | (122 | ) |
| | | | | | | | | | | | | |
| Restricted stock forfeited or expired | | | - | | | | - | | | | - | |
| | | | | | | | | | | | | |
| Non-vested Restricted stock outstanding at March 31, 2012 | | | 161 | | | | 58 | | | | 219 | |
At March 31,
20092012 and
2008,2011, there
was $1,777,000were 218,757 and
$1,879,000249,755 non-vested restricted stock shares outstanding, respectively. During the fiscal years ended March 31, 2012 and 2011, the Company issued, net of forfeitures, 91,150 and 86,584 restricted shares, respectively. At March 31, 2012 and 2011, there were $2.5 million and $3.7 million of unrecognized compensation cost related to the non-vested restricted stock awards, respectively, which is expected to be recognized over the remaining weighted average
vestin gvesting period of
2.31.6 years for both fiscal 2012 and
2.4 years, respectively.
2011.
NOTES TO CONSOLIDATED FINANCIAL STATEMENTS
In accordance with the provisions of SFAS No. 128, “ASC Topic 260 (“Earnings Per Share,”) basic net income per share is computed by dividing net income available to common shareholders by the weighted average number of common shares outstanding during the period. Diluted net income per common share includes the dilutive effect of potential restricted stock and stock options exercised and the effects of the potential conversion of preferred shares, calculated using the treasury stock method. Outstanding stock options, restricted stock, and convertible preferred shares issued by the Company represent the only dilutive effect reflected in diluted weighted average shares outstanding.
The following is a reconciliation of the numerators and denominators of the basic and diluted net income per share computations for the periods
presented: | | | | | | |
| | Year Ended March 31, |
| | 2009 | | 2008 | | 2007 |
Net income (numerator): | | | | | | |
| | | | | | |
Net income | $ | 22,976,411 | $ | 20,022,231 | $ | 14,443,502 |
| | | | | | |
Shares (denominator) | | | | | | |
| | | | | | |
Weighted average number of common shares | | | | | |
outstanding used in basic computation | | 23,305,726 | | 24,088,258 | | 24,109,035 |
Common shares issuable upon exercise | | | | | | |
of stock options and restricted stock | | 166,326 | | 200,981 | | 151,719 |
Common shares issuable upon conversion | | | | | | |
of preferred shares | | 10,125 | | 10,125 | | 10,125 |
Shares used in diluted computation | | 23,482,177 | | 24,299,364 | | 24,270,879 |
| | | | | | |
Net income per common share: | | | | | | |
| | | | | | |
Basic | $ | 0.99 | $ | 0.83 | $ | 0.60 |
Diluted | $ | 0.98 | $ | 0.82 | $ | 0.60 |
presented (in thousands, except for per share amounts):
| | | Year Ended March 31, | |
| | | 2012 | | | 2011 | | | 2010 | |
| | | | | | | | | | |
| Net income (numerator): | | | | | | | | | |
| | | | | | | | | | |
| Net income | | $ | 16,659 | | | $ | 20,871 | | | $ | 26,002 | |
| | | | | | | | | | | | | |
| Shares (denominator) | | | | | | | | | | | | |
| | | | | | | | | | | | | |
| Weighted average number of common shares outstanding used in basic computation | | | 20,613 | | | | 22,514 | | | | 22,617 | |
| Common shares issuable upon exercise of stock options and vesting of restricted stock | | | 85 | | | | 119 | | | | 119 | |
| Common shares issuable upon conversion of preferred shares | | | 10 | | | | 10 | | | | 10 | |
| Shares used in diluted computation | | | 20,708 | | | | 22,643 | | | | 22,746 | |
| | | | | | | | | | | | | |
| Net income per common share: | | | | | | | | | | | | |
| | | | | | | | | | | | | |
| Basic | | $ | 0.81 | | | $ | 0.93 | | | $ | 1.15 | |
| Diluted | | $ | 0.80 | | | $ | 0.92 | | | $ | 1.14 | |
At March 31,
20092012 and
2008,2011, all common stock options and restricted stock were included in the diluted net income per common share computation as their exercise prices were less than the average market price of the common shares for the period.
NOTES TO CONSOLIDATED FINANCIAL STATEMENTS
(10)
Valuation and Qualifying Accounts
Activity in the Company'sCompany’s valuation and qualifying accounts consists of the following:
| | | | | | |
| | Year Ended
March 31, |
| | 2009 | | 2008 | | 2007 |
| | | | | | |
Allowance for doubtful accounts: | | | | | | |
Balance at beginning of period | $ | 32,040 | $ | 27,727 | $ | 23,426 |
Provision for doubtful accounts | | 73,981 | | 40,823 | | 29,554 |
Write-off of uncollectible accounts receivable | | (47,496) | | (36,510) | | (25,253) |
| | | | | | |
Balance at end of period | $ | 58,525 | $ | 32,040 | $ | 27,727 |
| | | | | | |
Valuation allowance for deferred tax assets: | | | | | | |
Balance at beginning of period | $ | 432,744 | $ | 551,340 | $ | 638,066 |
Reductions | | (99,664) | | (118,596) | | (86,726) |
| | | | | | |
Balance at end of period | $ | 333,080 | $ | 432,744 | $ | 551,340 |
following (in thousands):
| | | Year Ended March 31, | |
| | | 2012 | | | 2011 | | | 2010 | |
| | | | | | | | | | |
| Allowance for doubtful accounts: | | | | | | | | | |
| Balance at beginning of period | | $ | 6 | | | $ | 5 | | | $ | 59 | |
| Provision for doubtful accounts | | | 47 | | | | 48 | | | | 17 | |
| Write-off of uncollectible accounts receivable | | | (48 | ) | | | (47 | ) | | | (71 | ) |
| | | | | | | | | | | | | |
| Balance at end of year | | $ | 5 | | | $ | 6 | | | $ | 5 | |
| | | | | | | | | | | | | |
| Valuation allowance for deferred tax assets: | | | | | | | | | | | | |
| Balance at beginning of period | | $ | - | | | $ | - | | | $ | 333 | |
| Reductions | | | - | | | | - | | | | (333 | ) |
| | | | | | | | | | | | | |
| Balance at end of year | | $ | - | | | $ | - | | | $ | - | |
NOTES TO CONSOLIDATED FINANCIAL STATEMENTS
(11)
Commitments and Contingencies
Legal Matters and Routine Proceedings
In October 2009, the Company was notified that it was named as a defendant in a multi-defendant lawsuit, filed in the United States District Court for the Eastern District of Texas, Marshall Division, seeking declaratory, injunctive, and monetary relief styled Charles E. Hill & Associates, Inc. v. ABT Electronics, Inc., et al, Cause No. 2:09-CV-313. The lawsuit alleges that the Company is infringing on patents related to electronic catalog systems. From the outset, the vendor that provides the Company with the Internet software had been defending and indemnifying the Company. However, effective February 15, 2011, the company that acquired this vendor declined to provide any further indemnification of the Company. On October 5, 2011, the parties engaged in court-ordered mediation, which was unsuccessful. Without admitting any liability or wrongdoing, and with no finding or admission as to the merit or lack of merit of any claim or defense asserted in connection with the litigation, in May 2012, the Company entered into a licensing agreement, for a confidential amount, and a Stipulation of Dismissal was filed with the Court, dismissing the lawsuit against the Company.
The Company has settled complaints that had been filed with various states’ pharmacy boards in the past. There can be no assurances made that other states will not attempt to take similar actions against the Company in the future. The Company initiates litigation to protect its trade or service marks. There can be no assurance that the Company will be successful in protecting its trade or service marks. Legal costs related to the above matters are expensed as incurred.
Employment Agreements
On March 16, 2001, the Company entered into an Executive Employment Agreement with its Chief Executive Officer (“CEO”) and President, Menderes Akdag (“Mr. Akdag”). Under the terms of this three-year agreement the Company paid the CEO an annual salary of $150,000 for the first six months of the agreement, and thereafter his annual salary was increased to $200,000. The Company also granted the CEO options to purchase 750,000 shares of its common stock under the Company’s 1998 Stock Option Plan at an exercise price of $.32 per share, which vested at the rate of 187,500 options on each of March 16, 2001, 2002, 2003 and 2004.
On March 16, 2004, the Company amended the CEO’s existing Executive Employment Agreement. The amendments were as follows: the term of the agreement was for three years, commencing on March 16, 2004; Mr. Akdag’s salary was increased to $250,000 per year throughout the term of the agreement, and Mr. Akdag was granted 250,000 incentive stock options under the Company’s 1998 Stock Option Plan at an exercise price of $10.64 per share, which vested at the rate of 83,333 options on each of March 16, 2005 and 2006, and 83,334 options on March 16, 2007.
On February 27, 2007,8, 2010, the Company amended the CEO’s existing Executive Employment Agreement and entered into Amendment No. 23 to the Executive Employment Agreement (“Agreement”) with Mr. Akdag. The Agreement amended certain provisions of the Executive Employment Agreement as follows: the term of the Agreement wasis for three years, commencing on March 16, 2007;2010; Mr. Akdag’s salary was increased to $450,000$550,000 per year throughout the term of the Agreement, and Mr. Akdag was granted 90,000120,000 shares of restricted stock. The restricted stock was granted on February 27, 2007,March 16, 2010, in accordance with the Company’s 2006 Employee Equity CompensationRestricted Stock Plan and the restrictions shall lapse ratably over a three-year period.
NOTES TO CONSOLIDATED FINANCIAL STATEMENTS
(11)
Commitmentsperiod, and Contingencies (Continued)
as of March 31, 2012, there were 40,000 unvested shares of restricted stock.
The Company leases its 65,300 square foot executive offices, warehouse facility, and customer service and pharmacy contact centers under a non-cancelable operating
lease. On January 29, 2010, the Company signed a sixth addendum to its existing lease
throughextending the terms of the lease until May 31,
2012.2015. The Company is responsible for certain maintenance costs, taxes, and insurance under this lease. The future minimum annual lease payments are as follows:
| | |
Years Ending March 31, | | |
| | |
2010 | | 702,000 |
2011 | | 723,000 |
2012 | | 745,000 |
2013 | | 125,000 |
| | |
Total lease payments | $ | 2,295,000 |
| Years Ending March 31, (in thousands) | | | | |
| | | | | |
| 2013 | | | 767 | | |
| 2014 | | | 784 | | |
| 2015 | | | 794 | | |
| 2016 | | | 133 | | |
| | | | | | |
| Total lease payments | | $ | 2,478 | | |
Rent expense was
$641,000, $500,000,$745,000, $724,000, and
$481,000$703,000 for the years ended March 31,
2009, 20082012, 2011 and
2007,2010, respectively.
NOTES TO CONSOLIDATED FINANCIAL STATEMENTS
The following table provides a breakdown of the percentage of total sales by each category during the indicated periods:
| | | | | |
| Year Ended March 31, |
| 2009 | | 2008 | | 2007 |
| | | | | |
Non-prescription medications | 68% | | 69% | | 70% |
Prescription medications | 31% | | 30% | | 29% |
Shipping and handling charges and other | 1% | | 1% | | 1% |
Total | 100% | | 100% | | 100% |
| | | Year Ended March 31, | |
| | | 2012 | | | 2011 | | | 2010 | |
| | | | | | | | | | |
| Non-prescription medications and supplies | | | 59 | % | | | 61 | % | | | 64 | % |
| Prescription medications | | | 40 | % | | | 38 | % | | | 35 | % |
| Shipping and handling charges and other | | | 1 | % | | | 1 | % | | | 1 | % |
| Total | | | 100 | % | | | 100 | % | | | 100 | % |
(13)Employee Benefit Plan
The Company maintains a 401(k) Savings Plan for eligible employees. The plan is a defined contribution plan that is administered by the Company. All regular, full-time employees are eligible for voluntary participation upon completing one year of service and having attained the age of 21. The plan provides for growth in savings through contributions and income from investments. It is subject to the provisions of the Employee Retirement Income Security Act of 1974, as amended. Plan participants are allowed to contribute a specified percentage of their base salary. In 2006, the Company adopted a matching plan which is funded subsequent to the calendar year. During the years ended March 31,
20092012 and
2008,2011, the Company charged
$149,000$165,000 and
$125,000,$168,000, respectively, of 401(k) matching contribution and administration expense to general and
administ rativeadministrative expenses.
NOTES TO CONSOLIDATED FINANCIAL STATEMENTS
(14)
Quarterly Financial Data (Unaudited)
| (14) | Quarterly Financial Data (Unaudited) |
Summarized unaudited quarterly financial data for fiscal
20092012 and
20082011 is as
follows:
| | | | | | | | | | | | |
Quarter Ended: | June 30, 2008 | | September 30, 2008 | | December 31, 2008 | | March 31, 2009 |
| | | | | | | |
Sales | $ | 68,366,683 | | $ | 59,569,141 | | $ | 43,405,846 | | $ | 48,070,577 |
Gross Profit | $ | 25,790,302 | | $ | 22,858,291 | | $ | 17,317,274 | | $ | 19,361,700 |
Income from operations | $ | 9,762,413 | | $ | 8,419,595 | | $ | 7,212,549 | | $ | 8,806,428 |
Net income | $ | 6,621,209 | | $ | 5,821,097 | | $ | 4,884,768 | | $ | 5,649,337 |
Diluted net income per common share | $ | 0.28 | | $ | 0.25 | | $ | 0.21 | | $ | 0.25 |
| | | | | | | |
Quarter Ended: | June 30, 2007 | | September 30, 2007 | | December 31, 2007 | | March 31, 2008 |
| | | | | | | |
Sales | $ | 59,027,235 | | $ | 51,537,197 | | $ | 37,348,867 | | $ | 40,423,170 |
Gross Profit | $ | 22,695,384 | | $ | 19,654,260 | | $ | 15,173,020 | | $ | 16,691,372 |
Income from operations | $ | 8,469,203 | | $ | 6,086,098 | | $ | 6,305,000 | | $ | 7,135,311 |
Net income | $ | 6,183,084 | | $ | 4,525,726 | | $ | 4,409,982 | | $ | 4,903,439 |
Diluted net income per common share | $ | 0.25 | | $ | 0.18 | | $ | 0.18 | | $ | 0.20 |
follows (in thousands, except for per share amounts):| Quarter Ended: | | June 30, 2011 | | | September 30, 2011 | | | December 31, 2011 | | | March 31, 2012 | |
| | | | | | | | | | | | | |
| Sales | | $ | 73,578 | | | $ | 58,225 | | | $ | 50,523 | | | $ | 55,924 | |
| Gross Profit | | $ | 24,110 | | | $ | 19,934 | | | $ | 17,154 | | | $ | 18,967 | |
| Income from operations | | $ | 7,565 | | | $ | 6,080 | | | $ | 6,102 | | | $ | 6,275 | |
| Net income | | $ | 4,837 | | | $ | 3,930 | | | $ | 3,898 | | | $ | 3,993 | |
| Diluted net income per common share | | $ | 0.22 | | | $ | 0.19 | | | $ | 0.19 | | | $ | 0.20 | |
| | | | | | | | | | | | | | | | | |
| Quarter Ended: | | June 30, 2010 | | | September 30, 2010 | | | December 31, 2010 | | | March 31, 2011 | |
| | | | | | | | | | | | | | | | | |
| Sales | | $ | 74,369 | | | $ | 61,245 | | | $ | 45,118 | | | $ | 50,910 | |
| Gross Profit | | $ | 27,226 | | | $ | 22,330 | | | $ | 16,925 | | | $ | 17,475 | |
| Income from operations | | $ | 11,827 | | | $ | 7,727 | | | $ | 7,027 | | | $ | 6,443 | |
| Net income | | $ | 7,225 | | | $ | 4,977 | | | $ | 4,522 | | | $ | 4,147 | |
| Diluted net income per common share | | $ | 0.32 | | | $ | 0.22 | | | $ | 0.20 | | | $ | 0.19 | |
On May 4, 2012, the Company’s Board of Directors declared a quarterly dividend of $0.15 per share on its common stock. The $3.1 million dividend was paid on May 25, 2012, to shareholders of record at the close of business on May 14, 2012.
REPORT OF MANAGEMENT ON INTERNAL CONTROL OVER FINANCIAL REPORTING
Management of the Company is responsible for the preparation and integrity of the Consolidated Financial Statements appearing in our Annual Report on Form 10-K. The financial statements were prepared in conformity with generally accepted accounting principles appropriate in the circumstances and, accordingly, include certain amounts based on our best judgments and estimates. Financial information in the Annual Report on Form 10-K is consistent with that in the financial statements.
Management of the Company is responsible for establishing and maintaining adequate internal control over financial reporting, as such term is defined in Rules 13a-15(f) under the Securities Exchange Act of 1934 (“Exchange Act”). The Company’s internal control over financial reporting is designed to provide reasonable assurance regarding the reliability of financial reporting and the preparation of the Consolidated Financial Statements. Our internal control over financial reporting is supported by a team of consultants and appropriate reviews by management, written policies and guidelines, careful selection and training of qualified personnel, and a written Corporate Code of Business Conduct and Ethics adopted by our Company’s Board of Directors, applicable to all Company Directors and all officers and employees of our Company and subsidiaries.
Because of its inherent limitations, internal control over financial reporting may not prevent or detect misstatements and even when determined to be effective, can only provide reasonable assurance with respect to financial statement preparation and presentation. Also, projections of any evaluation of effectiveness to future periods are subject to the risk that controls may become inadequate because of changes in conditions, or that the degree of compliance with the policies or procedures may deteriorate.
The Audit Committee (“Committee”) of our Company’s Board of Directors, comprised solely of Directors who are independent in accordance with the requirements of The NASDAQ Stock Market LLC listing standards, the Exchange Act and the Company’s Corporate Governance Guidelines, meets with the independent auditors and management periodically to discuss internal control over financial reporting, and auditing and financial reporting matters. The Committee reviews with the independent auditors the scope and results of the audit effort. The Committee also meets periodically with the independent auditors without management present to ensure that the independent auditors have free access to the Committee. Our Audit Committee’s Report can be found in the Company’s
20092012 Proxy Statement.
Management assessed the effectiveness of the Company’s internal control over financial reporting as of March 31, 2009.2012. In making this assessment, management used the criteria set forth by the Committee of Sponsoring Organizations of the Treadway Commission (COSO) inInternal Control – Integrated Framework. Based on our assessment, management believes that the Company maintained effective internal control over financial reporting as of March 31,
2009.
2012.
The Company’s independent auditors, McGladrey
& Pullen, LLP, a registered public accounting firm, are appointed by the Audit Committee of the Company’s Board of Directors, subject to ratification by our Company’s shareholders. McGladrey
& Pullen, LLP have audited and reported on the Consolidated Financial Statements of PetMed Express, Inc. and subsidiaries, and issued a report on the Company’s internal control over financial reporting. The reports of the independent auditors are contained in our Annual Report on Form 10-K.
/s/ Menderes Akdag
Menderes Akdag
Chief Executive Officer, President, Director
May 29, 2009
/s/ Bruce S. Rosenbloom
Bruce S. Rosenbloom
Chief Financial Officer
May 29, 2009
| /s/ Menderes Akdag | |
| Menderes Akdag |
| Chief Executive Officer, President, Director |
|
| May 29, 2012 |
| /s/ Bruce S. Rosenbloom | |
| Bruce S. Rosenbloom |
| Chief Financial Officer |
|
| May 29, 2012 |
REPORT OF INDEPENDENT REGISTERED PUBLIC ACCOUNTING FIRM
ON INTERNAL CONTROL OVER FINANCIAL REPORTING
The Board of Directors and Stockholders
PetMed Express,
Inc:
Inc and subsidiaries:
We have audited PetMed Express, Inc. and Subsidiaries’ (hereafter referred to as “PetMed”)subsidiaries’ internal control over financial reporting as of March 31, 2009,2012, based on criteria established in Internal Control—Integrated Framework issued by the Committee of Sponsoring Organizations of the Treadway Commission (COSO). PetMed’sPetMed Express, Inc. and subsidiaries management is responsible for maintaining effective internal control over financial reporting and for its assessment of the effectiveness of internal control over financial reporting included in the accompanying Management’s Report of Management on Internal Control over Financial Reporting. Our responsibility is to express an opinion on the company'scompany’s internal control over financial reporting based on our audit.
We conducted our audit in accordance with the standards of the Public Company Accounting Oversight Board (United States). Those standards require that we plan and perform the audit to obtain reasonable assurance about whether effective internal control over financial reporting was maintained in all material respects. Our audit included obtaining an understanding of internal control over financial reporting, assessing the risk that a material weakness exists, and testing and evaluating the design and operating effectiveness of internal control based on the assessed risk. Our audit also included performing such other procedures as we considered necessary in the circumstances. We believe that our audit provides a reasonable basis for our opinion.
A
company'scompany’s internal control over financial reporting is a process designed to provide reasonable assurance regarding the reliability of financial reporting and the preparation of financial statements for external purposes in accordance with generally accepted accounting principles. A
company'scompany’s internal control over financial reporting includes those policies and procedures that
(1)(a) pertain to the maintenance of records that, in reasonable detail, accurately and fairly reflect the transactions and dispositions of the assets of the company;
(2)(b) provide reasonable assurance that transactions are recorded as necessary to permit preparation of financial statements in accordance with generally accepted accounting principles, and that receipts and expenditures of the company are being made only in accordance with authorizations of management and directors of the company; and
(3)(c) provide reasonable assurance regarding prevention or
tim elytimely detection of unauthorized acquisition, use, or disposition of the
company'scompany’s assets that could have a material effect on the financial statements.
Because of its inherent limitations, internal control over financial reporting may not prevent or detect misstatements. Also, projections of any evaluation of effectiveness to future periods are subject to the risk that controls may become inadequate because of changes in conditions, or that the degree of compliance with the policies or procedures may deteriorate.
In our opinion, PetMed Express, Inc. and subsidiaries maintained, in all material respects, effective internal control over financial reporting as of March 31, 2009,2012, based on criteria established in Internal Control—Integrated Framework issued by the Committee of Sponsoring Organizations of the Treadway Commission (COSO).
Commission.
We have also audited, in accordance with the standards of the Public Company Accounting Oversight Board (United States), the consolidated financial statements of PetMed Express,
Inc.Inc and subsidiaries. and our report dated May 29,
20092012 expressed an unqualified opinion.
/s/ McGladrey & Pullen, LLP
McGladrey & Pullen, LLP
New York, New York
May 29, 2009
| /s/ McGladrey LLP | |
| McGladrey LLP |
|
| Fort Lauderdale, Florida |
| May 29, 2012 |
ITEM 9. CHANGES IN AND DISAGREEMENTS WITH ACCOUNTANTS ON ACCOUNTING AND FINANCIAL DISCLOSURE
None.
ITEM 9A. CONTROLS AND PROCEDURES
Evaluation of Disclosure Controls and Procedures
The Company’s management, including our Chief Executive Officer and Chief Financial Officer, has conducted an evaluation of the effectiveness of the design and operation of our disclosure controls and procedures (as defined in Rule 13a-15(e) and 15d-15(e) promulgated under the Securities Exchange Act of 1934, as amended) as of March 31,
2009,2012, the end of the period covered by this report (the
"Evaluation Date"“Evaluation Date”). Based upon that evaluation, our Chief Executive Officer and Chief Financial Officer concluded as of the Evaluation Date, that our disclosure controls and procedures were effective such that the information relating to PetMed Express, Inc., including our consolidated subsidiaries, required to be disclosed in our Securities and Exchange Commission
(“SEC”) reports (i) is recorded, processed, summarized, and reported within the time periods specified in SEC rules and forms and (ii) is accumulated and communicated to our management including our Chief Executive Officer and Chief Financial Officer, as appropriate, to allow timely decisions regarding required disclosure.
Management’s Report on Internal Control over Financial Reporting
Our management is responsible for establishing and maintaining adequate internal control over financial reporting, as such term is defined in Exchange Act Rule 13a-15(f). Under the supervision and with the participation of our management, including our Chief Executive Officer and Chief Financial Officer, we conducted an evaluation of the effectiveness of our internal control over financial reporting as of March 31, 20092012 based on the framework inInternal Control — Integrated Frameworkissued by the Committee of Sponsoring Organizations of the Treadway Commission. Based on our evaluation under the framework in
Internal Control — Integrated Framework,our management concluded that the Company maintained effective internal control over financial reporting as of March 31,
2009,2012, as stated in our report which is included herein. Our internal control over financial reporting as of
Marc hMarch 31,
20092012 has been audited by McGladrey
& Pullen LLP, an independent registered public accounting firm, as stated in their report which is included herein.
Changes in Internal Controls over Financial Reporting
There have been no changes in our internal controls over financial reporting during our last fiscal quarter that have materially affected, or are reasonably likely to materially affect, our internal control over financial reporting.
ITEM 9B. OTHER INFORMATION
PART III
ITEM 10. DIRECTORS, EXECUTIVE OFFICERS, AND CORPORATE GOVERNANCE
The information required by this item will be set forth in our Proxy Statement, to be filed with the SEC within 120 days after the end of the fiscal year ended March 31, 2009,2012, relating to our 20092012 Annual Meeting of Stockholders to be held on July 31, 2009,27, 2012, and is incorporated herein by reference.
We adopted a Code of Business Conduct and Ethics applicable to all officers, directors, and employees. The Company’s Code of Business Conduct and Ethics may be found in our 2004 Proxy which was filed on June 30, 2004. You may also obtain a copy of our Code of Business Conduct and Ethics free of charge by contacting Investor Relations at 1-800-738-6337.
ITEM 11. EXECUTIVE COMPENSATION
The information required by this item will be set forth in our Proxy Statement, to be filed with the SEC within 120 days after the end of the fiscal year ended March 31, 2009,2012, relating to our 20092012 Annual Meeting of Stockholders to be held on July 31, 2009,27, 2012, and is incorporated herein by reference.
ITEM 12. SECURITY OWNERSHIP OF CERTAIN BENEFICIAL OWNERS AND MANAGEMENT AND RELATED STOCKHOLDER MATTERS
The information required by this item (other than information required by Item 201(d) of Regulation S-K with respect to equity compensation plans, which is set forth under Item 5. in this Annual Report on Form 10-K) will be set forth in our Proxy Statement, to be filed with the SEC within 120 days after the end of the fiscal year ended March 31, 2009,2012, relating to our 20092012 Annual Meeting of Stockholders to be held on July 31, 2009,27, 2012, and is incorporated herein by reference.
ITEM 13. CERTAIN RELATIONSHIPS AND RELATED TRANSACTIONS, AND DIRECTOR INDEPENDENCE
The information required by this item will be set forth in our Proxy Statement, to be filed with the SEC within 120 days after the end of the fiscal year ended March 31, 2009,2012, relating to our 20092012 Annual Meeting of Stockholders to be held on July 31, 2009,27, 2012, and is incorporated herein by reference.
ITEM 14. PRINCIPAL ACCOUNTANT FEES AND SERVICES
The information required by this item will be set forth in our Proxy Statement, to be filed with the SEC within 120 days after the end of the fiscal year ended March 31,
2009,2012, relating to our
20092012 Annual Meeting of Stockholders to be held on July
31, 2009,27, 2012, and is incorporated herein by reference.
PART IV
ITEM 15. EXHIBITS, FINANCIAL STATEMENT SCHEDULES
(a)
The following documents are filed as part of this report on Form 10-K.
(1)Consolidated Financial Statements
The following exhibits are filed as part of this report on Form 10-K. (3)Articles of Incorporation and By-Laws
3.1
Amended and Restated Articles of Incorporation (incorporated by reference to Exhibit 3.1 to the Registration Statement on Form 10-SB, File No. 000-28827, filed January 10, 2000).
3.2
By-Laws of the Corporation incorporated by reference to Exhibit 3.2 to the Registration Statement on Form 10-SB, File No. 000-28827, filed January 10, 2000).
(4)
Instruments Defining the Rights of Security Holders
4.1
Specimen common stock certificate incorporated by reference to Exhibit 4.2 to the Registration Statement on Form 10-SB, File No. 000-28827, filed January 10, 2000).
| 3.1 | Amended and Restated Articles of Incorporation (incorporated by reference to Exhibit 3.1 to the Registration Statement on Form 10-SB, File No. 000-28827, filed January 10, 2000). |
| 3.2 | By-Laws of the Corporation (incorporated by reference to Exhibit 3.2 to the Registration Statement on Form 10-SB, File No. 000-28827, filed January 10, 2000). |
| (4) Instruments Defining the Rights of Security Holders |
| 4.1 | Specimen common stock certificate (incorporated by reference to Exhibit 4.2 to the Registration Statement on Form 10-SB, File No. 000-28827, filed January 10, 2000). |
(10)Material Contracts
10.1
1998 Stock Option Plan incorporated by reference to Exhibit 10.1 to the Registration Statement on Form 10-SB, File No. 000-28827, filed January 10, 2000).
10.2
Employment Agreement with Menderes Akdag (incorporated by reference to Exhibit 10 of the Registrant’s Form 8-K on March 16, 2001).
10.3
Agreement for the Sale and Leaseback of the Land and Building (incorporated by reference to Exhibit 99.1 of the Registrant’s Form 8-K on June 14, 2001).
10.4
Amendment Number 1 to Executive Employment Agreement with Menderes Akdag (incorporated by reference to Exhibit 99.1 of the Registrant’s Form 8-K on March 16, 2004).
10.5
Amendment Number 2 to Executive Employment Agreement with Menderes Akdag (incorporated by reference to Exhibit 99.1 of the Registrant’s Form 8-K on March 16, 2007).
10.6
2006 Employee Equity Compensation Restricted Stock Plan (incorporated by reference to our definitive Proxy Statement for our 2006 Annual Meeting of Stockholders held on July 28, 2006).
10.7
2006 Outside Director Equity Compensation Restricted Stock Plan (incorporated by reference to our definitive Proxy Statement for our 2006 Annual Meeting of Stockholders held on July 28, 2006).
10.8
Employment Letter with Bruce Rosenbloom dated May 30, 2001 (incorporated by reference to Exhibit 10 of the Registrant’s Form 8-K on April 7, 2009).
| 10.1 | 1998 Stock Option Plan incorporated by reference to Exhibit 10.1 to the Registration Statement on Form 10-SB, File No. 000-28827, filed January 10, 2000). |
| 10.2 | Employment Agreement with Menderes Akdag (incorporated by reference to Exhibit 10 of the Registrant’s Form 8-K filed March 30, 2001). |
| 10.3 | Agreement for the Sale and Leaseback of the Land and Building (incorporated by reference to Exhibit 99.1 of the Registrant’s Form 8-K filed June 14, 2001). |
| 10.4 | Amendment Number 1 to Executive Employment Agreement with Menderes Akdag (incorporated by reference to Exhibit 99.1 of the Registrant’s Form 8-K filed March 18, 2004). |
| 10.5 | Amendment Number 2 to Executive Employment Agreement with Menderes Akdag (incorporated by reference to Exhibit 10.1 of the Registrant’s Form 8-K filed February 28, 2007). |
| 10.6 | 2006 Employee Equity Compensation Restricted Stock Plan (incorporated by reference to our definitive Proxy Statement for our 2006 Annual Meeting of Stockholders filed June 22, 2006). |
| 10.7 | 2006 Outside Director Equity Compensation Restricted Stock Plan (incorporated by reference to our definitive Proxy Statement for our 2006 Annual Meeting of Stockholders filed June 22, 2006). |
| 10.8 | Employment Letter with Bruce Rosenbloom dated May 30, 2001 (incorporated by reference to Exhibit 10.9 of the Registrant’s Form 8-K filed April 7, 2009). |
| 10.9 | Amendment Number 3 to Executive Employment Agreement with Menderes Akdag (incorporated by reference to Exhibit 10.1 of the Registrant’s Form 8-K filed February 8, 2010). |
(14)
Corporate Code of Ethics
14.1
Corporate Code of Ethics (incorporated by reference to our definitive Proxy Statement for our 2004 Annual Meeting of Stockholders held on August 6, 2004).
| 14.1 | Corporate Code of Ethics (incorporated by reference to our definitive Proxy Statement for our 2004 Annual Meeting of Stockholders filed June 30, 2004). |
(21)
Subsidiaries of Registrant
21.1
Subsidiaries of Registrant*
| 21.1 | Subsidiaries of Registrant* |
(31)Certifications
31.1
Certification of Chief Executive Officer pursuant to Rule 13a-14(a)/15d-14(a).*
31.2
Certification of Chief Financial Officer pursuant to Rule 13a-14(a)/15d-14(a).*
(32)
Certifications
32.1
Certification of Principal Executive Officer and Principal Financial Officer pursuant to Section 1350.**
____________
| 31.1 | Certification of Chief Executive Officer pursuant to Rule 13a-14(a)/15d-14(a).* |
| 31.2 | Certification of Chief Financial Officer pursuant to Rule 13a-14(a)/15d-14(a).* |
| 32.1 | Certification of Principal Executive Officer and Principal Financial Officer pursuant to Section 1350.** |
Pursuant to the requirements of Section 13 or 15(d) of the Securities Exchange Act of 1934, as amended, the registrant has duly caused this report to be signed on its behalf by the undersigned, thereunto duly authorized.
Dated:
June 1, 2009
May 29, 2012 |
By: /s/ Menderes Akdag | |
| Chief Executive Officer and President (principal executive officer) |
Pursuant to the requirements of the Securities Exchange Act of 1934, this report has been signed below by the following persons on behalf of the registrant and in the capacities on June 1, 2009.May 29, 2012.
| SIGNATURE | | TITLE |
SIGNATURE
| | TITLE
|
/s/ Menderes Akdag | | Chief Executive Officer and President (principal executive officer) |
Menderes Akdag | | Officer and Director |
| | |
| /s/ Robert C. Schweitzer | | Chairman of the Board |
Robert C. Schweitzer | | Director |
| | |
| /s/ Bruce S. Rosenbloom | | Chief Financial Officer and Treasurer (principal financial and accounting officer) |
Bruce S. Rosenbloom | | Officer |
| | |
| /s/ Ronald J. Korn | | Director |
Ronald J. Korn | | |
| | |
| /s/ Gian M. Fulgoni | | Director |
Gian M. Fulgoni | | |
| | |
| /s/ Frank J. Formica | | Director |
Frank J. Formica | | |
47