PART I
ITEM 1. BUSINESS
In this document, please note the following:
references to “we”, “our”, “us”, the “Company” or “Mercer” mean Mercer International Inc. and its subsidiaries, unless the context clearly suggests otherwise, and references to “Mercer Inc.” mean Mercer International Inc. excluding its subsidiaries;
references to “ADMTs” mean air-dried metric tonnes;
| | |
| • | references to “we”, “our”, “us”, the “Company” or “Mercer” mean Mercer International Inc. and its subsidiaries, unless the context clearly suggests otherwise, and references to “Mercer Inc.” mean Mercer International Inc. excluding its subsidiaries; |
|
| • | references to “ADMTs” mean air-dried metric tonnes; |
|
| • | information is provided as of December 31, 2008, unless otherwise stated or the context clearly suggests otherwise; |
|
| • | all references to monetary amounts are to “Euros”, the lawful currency adopted by most members of the European Union, unless otherwise stated; and |
|
| • | ‘‘€” refers to Euros; “$” refers to U.S. dollars; and “C$” refers to Canadian dollars. |
references to “MW” mean megawatts and “MWh” mean megawatt hours;
information is provided as of December 31, 2011, unless otherwise stated or the context clearly suggests otherwise;
all references to monetary amounts are to “Euros”, the lawful currency adopted by most members of the European Union, unless otherwise stated; and
“€” refers to Euros; “$” refers to U.S. dollars; and “C$” refers to Canadian dollars.
The Company
Mercer Inc. is a Washington corporation and our shares of common stock are quoted and listed for trading on the NASDAQ Global Market (MERC) and the Toronto Stock Exchange (MRI.U).
We operate in the pulp business and are the second largest publicly traded producer of market northern bleached softwood kraft, or “NBSK”, pulp in the world. We are the sole kraft pulpNBSK producer, and the only significant producer of pulp for resale, known as “market pulp”, in Germany, which is the largest pulp import market in Europe. Our operations are located in Eastern Germany and Western Canada. We currently employ approximately 1,0941,039 people at our German operations, 403439 people at our Celgar mill in Western Canada and 1817 people at our office in Vancouver, British Columbia, Canada. We operate three NBSK pulp mills with a consolidated annual production capacity of approximately 1.5 million ADMTs:
| | |
| | • | | Rosenthal mill.mill. Our wholly-owned subsidiary, Rosenthal, owns and operates a modern, efficient ISO 90029001 and 14001 certified NBSK pulp mill that has a current annual pulp production capacity of approximately 325,000345,000 ADMTs. Additionally, the Rosenthal mill is a significant producer of “green” energy and exported 161,286 MWh of electricity in 2011, resulting in approximately €14.9 million in annual revenues. The Rosenthal mill is located near the town of Blankenstein, Germany. |
|
| • | Stendal mill. Our 70.6% owned subsidiary, Stendal, owns and operates astate-of-the-art, single-line NBSK pulp mill that has an annual production capacity of approximately 635,000 ADMTs. The Stendal mill is situated near the town of Stendal, Germany approximately 300 kilometers northsouth of the Rosenthal mill.Berlin. |
|
| | • | | Celgar mill.mill. Our wholly ownedwholly-owned subsidiary, Celgar, owns and operates the Celgar mill, a modern, efficient ISO 9001 and 14001 certified NBSK pulp mill with an annual pulp production capacity of approximately 495,000520,000 ADMTs. The Celgar mill also produces “green” energy and exported 140,069 MWh of electricity in 2011, resulting in approximately C$14.5 million in annual revenues. The Celgar mill is located near the city of Castlegar, British Columbia, Canada, approximately 600 kilometers east of the port city of Vancouver, British Columbia, Canada. |
| • | | Stendal mill. Our 74.9% owned subsidiary, Stendal, owns and operates a state-of-the-art, single-line, ISO 9001 and 14001 certified NBSK pulp mill that has an annual pulp production capacity of approximately 645,000 ADMTs. The Stendal mill is also a significant producer of “green” energy and exported 350,758 MWh of electricity in 2011, resulting in approximately €32.5 million in annual revenues. The Stendal mill is located near the town of Stendal, Germany, approximately 130 kilometers west of Berlin. |
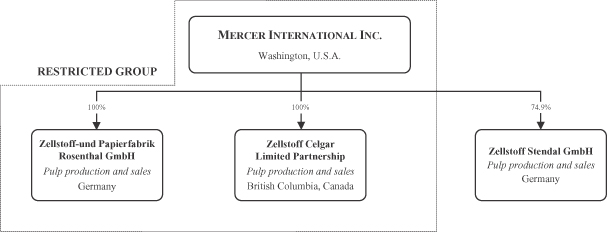
Organizational Chart
The following chart sets out our directly and indirectly owned principal operating subsidiaries, their jurisdictions of organization and their principal activities:
History and Development of Business
We originally invested in various real estate assets with the intention of becoming a real estate investment trust, but in 1985 changed our operational direction to acquiring controlling interests in operating companies. We acquired our initial pulp and paper operations in 1993.
1994, with the acquisition of our Rosenthal mill. In late 1999, we completed a major capital project which, among other things, converted the Rosenthal millit to the production of kraft pulp from sulphite pulp, increased its annual production capacity, reduced costs and improved efficiencies. The aggregate cost of this project was approximately €361.0 million, of which approximately €102.0 million was financed through government grants. Subsequent minor capital investments and
5
efficiency improvements have reduced emissions and energy costs and increased the Rosenthal mill’s annual production capacity to approximately 325,000345,000 ADMTs.
In September 2004, we completed construction of the Stendal mill at an aggregate cost of approximately €1.0 billion. The Stendal mill is one of the largest NBSK pulp mills in Europe. The Stendal mill was financed through a combination of government grants totaling approximately €275.0 million, low-cost, long-term project debt which is largely severally guaranteed by the federal government and a state government in Germany, and equity contributions.
We initially had a 63.6% ownership interest in Stendal and, in October 2006,over time, increased our interest to 70.6% by acquiring a 7% minority interest therein for €8.1 million.
The Stendal mill was constructed under a €716.0 million fixed-price turn-key engineering, procurement and construction, or “EPC”, contract between Stendal and the EPC contractor. Pursuant to the EPC contract, construction of the Stendal mill was completed substantially on its planned schedule and budget in September 2004. The mill then underwent extensive testing and evaluation to determine whether certain performance requirements had been met. Although the tests were generally successful, in the first quarter of 2005, the EPC contractor implemented remedial measures at the mill, including the installation of two additional digesters and related equipment, improvements to the non-condensable gas, or “NCG”, boiler and water treatment plant. These digesters enhanced the reliability and overall operating performance of the Stendal mill and, along with other measures, increased its annual production capacity to approximately 635,000 ADMTs.
Subsequently, each department of the mill was tested on a stand-alone basis for compliance with its design specifications and, in September 2007, Stendal settled substantially all outstanding matters with its contractors under the EPC contract in consideration of, among other things, a payment of approximately €11.0 million.
74.9%.We, Stendal and its minoritynoncontrolling shareholder are parties to a shareholders’ agreement dated August 26, 2002, as amended, to govern our respective interests in Stendal. The agreement contains terms and conditions customary for these types of agreements, including restrictions on transfers of share capital and shareholder loans other than to affiliates, rights of first refusal on share and shareholder loan transfers, pre-emptive rights and piggyback rights on dispositions of our interest. The shareholders are not obligated to fund any further equity capital contributions to the project. The shareholders’ agreement provides that Stendal’s managing directors are appointed by holders of a simple majority of its share capital. Further, shareholder decisions, other than those mandated by law or for the provision of financial assistance to a shareholder, are determined by a simple majority of Stendal’s share capital.
A significant portion of the capital investments at our German mills, including the construction of the Stendal mill, were financed through government grants. Since 1999, our German mills have benefited from an aggregate €383.1€384.9 million in government grants. These grants are not reported in our income. These grants reduce the cost basis of the assets purchased when the grants are received. See “— Capital Expenditures”.
received and are not reported in our income.In February 2005, we acquired the Celgar mill for $210.0 million, of which $170.0 million was paid in cash and $40.0 million was paid in our shares, plus $16.0 million for the defined working capital atof the mill on closing.mill. The Celgar mill was completely rebuilt in the early 1990s through a C$850.0 million modernization and expansion project, which transformed it into a modern and competitive producer.
In 2007, we completed a C$28.0 million capital project commenced in 2005 which improved efficiencies and reliability and, with other measures, increased the Celgar mill’s annual production capacity to 495,000500,000 ADMTs. In 2008,September 2010, we commencedcompleted a new “green” energycapital project, at our Celgar millreferred to as the “Celgar Energy Project”, to increase the Celgar mill’s production of “green” energy and optimize its power generation capacity. For more information, seecapacity, at an aggregate cost of approximately C$64.9 million, of which approximately C$48.0 million was financed by grants from the Canadian federal government. See “—Capital Expenditures”.
In 2006, we divested two paper mills in Germany which were non-core operations and account for this business as discontinued operations. As a result, certain previously reported amounts and We have also increased the financial statements and related notes herein have been reclassifiedCelgar mill’s overall annual pulp production capacity to conform to the current presentation. In 2006, we also divested our equity interest in a non-consolidated Swiss specialty paper mill. These divestitures were effected so that we could focus on our core pulp business.
6
Organizational Chart
The following chart sets out our directly and indirectly owned principal operating subsidiaries, their jurisdictions of organization and their principal activities:
Our Competitive Strengths
Our competitive strengths include the following:
| | |
| | • | | Modern and Competitive Mills.We operate three large, modern, competitive NBSK pulp mills that produce high quality NBSK pulp, which is a premium grade of kraft pulp. TheWe believe the relative age, and production capacity and operating features of our NBSK pulp mills provide us with certain manufacturing cost and other advantages over many of our competitors including lower maintenance capital expenditures. |
|
| | • | | Leading Market Position. Mercer is the largest publicly traded NBSK pulp producer in the world which provides us increased presence and better industry information in the markets in which we operate, and provides for close customer relationships with many large pulp consumers. |
| • | | Renewable Surplus Energy. Our modern mills generate electricity and steam in their boilers and are generally energy self-sufficient. Such energy is primarily produced from wood residuals which are a renewable carbon neutral source. All of our mills also generate surplus energy which we sell to third parties. Our Rosenthal and Stendal mills benefit from special tariffs under Germany’sRenewable Energy Resources Act, referred to as the “Renewable Energy Act”, which provides for premium pricing and has materially increased their revenues from sales of surplus power. Additionally, our Celgar mill completed the Celgar Energy Project at the end of September 2010 and is party to an electricity purchase agreement, referred to as the “Electricity Purchase Agreement” with the British Columbia Hydro and Power Authority, or “B.C. Hydro”, British Columbia’s primary public utility provider, for the sale of surplus power for ten years. The Celgar Energy Project increased our annual sales of surplus power at our Celgar mill to approximately 140,000 MWh. In total, our mills produced approximately 652,000 MWh of surplus renewable energy in 2011. We believe our generation and sale of surplus renewable “green” energy provides us with a competitive energy advantage over less efficient mills. |
| • | | Strategic Locations and Customer Proximity and Service.We are the only significant producer of market pulp in Germany, which is the largest pulp import market in Europe. Due to the proximity of our German mills to most of our European customers, we benefit from lower transportation costs relative to our major competitors. Our Celgar mill, located in Western Canada, is well situated to serve Asian and North American customers. We primarily work directly with customers to capitalize on our geographic diversity, coordinate sales and enhance customer relationships. We believe our ability to deliver high quality pulp on a timely basis and our customer service makes us a preferred supplier for many customers. |
|
| | • | Renewable and Surplus Energy. Our modern mills generate electricity and steam in their boilers and are generally energy self-sufficient. Such energy is primarily produced from wood residuals which are a renewable carbon neutral source. This has permitted our German mills to benefit from the sales of emission allowances. All of our mills also generate surplus energy which we sell to third parties. Our Rosenthal and Stendal mills now benefit from recent amendments to Germany’s Renewable Energy Resources Act which have raised the tariff for the sale of biomass energy. Additionally, our Celgar mill has signed a contract for the sale of power from its new “green” energy project. We believe our generation of surplus renewable “green” energy and high energy prices provide us with a competitive energy advantage. |
|
| | • | Advantageous Capital Investments and Financing.Our German mills are eligible to receive government grants in respect of qualifying capital investments. Over the last ninetwelve years, our German mills have benefited from approximately €383.1€384.9 million of such government grants. In addition, in October 2009, our Celgar mill qualified to receive C$57.7 million of credits under the Canadian government’s Pulp and Paper Green Transformation Program, referred to as the “GTP”. These grants are not reported in our income but |
| reduce the cost basis of the assets purchased when the grants are received. Duringreceived and are not reported in our income. Additionally, during the last nineten years, capital investments at our German mills have reduced the amount of overall wastewater fees that would otherwise be payable by over €43€52.8 million. Further, our Stendal mill benefits from German governmental guarantees of its project financing which permitted it to obtain better credit terms and lower interest costs than would otherwise behave been available. The project debt of Stendal which matures in 2017, currently bears interest at a substantially fixed rate of 5.28% per annum plus an applicable margin and is non-recourse to our other operations and Mercer Inc. |
7
| | |
| | • | | CompetitiveProximity of Abundant Fiber Supply.Although fiber is cyclical in both price and supply, there is a significant amount of high-quality fiber within a close radius of each of our mills. This fiber supply, combined with our purchasing power and our current ability to meaningfully switch between whole logs chipped at our mills and sawmill residual chips, enables us to enter into contracts and arrangements which have generally provided us with a competitive fiber supply.
|
| • | | Experienced Management Team.Our directors and senior managers have extensive experience in the pulp and forestry industries. In particular, our Chief Executive Officer has over 17 years’ experience in the pulp industry and has guided the Company’s operations and development over that time. Our Chief Operating Officer and Chief Financial Officer each has over 31 years of industry experience. We also have experienced managers at all of our mills. Our management has a proven track record of implementing new initiatives and programs in order to reduce costs throughout our operations as well as identifying and harnessing new revenue opportunities. |
Corporate Strategy
Our corporate strategy is to create shareholder value by focusing on the expansion of our asset and earnings base. Key features of our strategy include:
| | |
| | • | | FocusingFocus on NBSK Market Pulp.We focus on NBSK pulp because it is a premium grade kraft pulp and generally obtains the highest price relative to other kraft pulps. Although demand is cyclical, between 19972000 and 2007,2010, worldwide demand for softwood kraft market pulp grew at an average of approximately 3.3%1.6% per annum. Since 2007, demand for softwood pulp has grownWe focus on servicing customers that produce high quality printing and writing paper grades and tissue producers. This allows us to benefit from our stable relationships with paper and tissue manufacturers in emergingEurope and Asia as well as participate in strong growth markets such as Asia, in particular China and Eastern Europe.where we also have strong customer relationships.
|
|
| | • | | Maximizing Renewable Energy Realizations. We focus on the generation and sales of surplus renewable energy because there are minimal incremental costs associated with our energy production and thus our surplus electricity sales are highly profitable. In 2008,2011, our mills generated 456,059 megawatt hours, or “MWh”,a record 652,113 MWh of surplus energy, primarily from a renewable carbon-neutral source.electricity resulting in revenues of approximately €58.0 million, compared to 520,005 MWh and approximately €44.2 million in revenues in 2010. We are pursuing severaldeveloping other initiatives to increase our overall energy generation and the amount of and price for our surplus power sales. SuchIn early 2012, we announced a project, referred to as “Project Blue Mill”, to increase production and efficiency through debottlenecking initiatives include targetedand the installation of a 40 MW steam turbine at our Stendal mill. The new turbine is expected to initially produce an additional 109,000 MWh of surplus energy. Based upon the current production levels of our mills, we expect to sell approximately 700,000 MWh of surplus renewable energy in 2012. We expect energy generation and sales to continue to be a key focus for our mills for the foreseeable future. |
| • | | Enhancing Long-Term Sustainability/Growth. We continually focus on cost reduction and efficiency initiatives while strategically evaluating and pursuing internal, high return capital projects and growth opportunities in order to increase generationenhance cash flows and connectivity to the electric grid including the installation of a 48 megawatt, or “MW”, condensing turbine at our Celgar mill to substantially increase the mill’s generating capacity.maximize shareholder value. |
|
| | • | Enhancing Sustainability/Growth. With the recent global economic slowdown and well reported crisis in financial and credit markets, our short-term focus is on maintaining and enhancing the sustainability of our business. To this end, we are working to reduce costs, cut discretionary spending, including capital expenditures, reduce our working capital consumption and otherwise enhance our liquidity. When economies and markets recover and access to capital improves, we intend to grow our operations and earning capacity both through organic growth and targeted strategic acquisitions. |
|
| | • | Operating and Maximizing Returns from our Modern, World-Class Mills.In order to keep our operating costs as low as possible, with a goal of generating positive cash flow in all market conditions, we operate large, modern NBSK pulp mills. We believe suchthese production facilities provide us with the best platform to be an efficient and competitive producer of high-quality NBSK pulp without the need for significant sustaining capital. Our modern mills are also generally net exporters of renewable energy. We are constantly reviewing opportunities to enhance and maximize the usage of the strengths of our mills, including through increased energy generation, production of premium grades of pulp and other improvements, to capture the highest returns available. |
The Pulp Industry
Pulp is used in the production of paper, tissues and paper relatedpaper-related products. Pulp is generally classified according to fiber type, the process used in its production and the degree to which it is bleached. Kraft pulp is produced through a sulphate chemical process in which lignin, the component of wood which binds individual fibers, is dissolved in a chemical reaction. Chemically prepared pulp allows the wood’s fiber to retain its length and flexibility, resulting in stronger paper products. Kraft pulp can be bleached to increase its brightness. Kraft pulp is noted for its strength, brightness and absorption properties and is used to produce a variety of products, including lightweight publication grades of paper, tissues and paper relatedpaper-related products.
NBSK pulp, which is a bleached kraft pulp manufactured using species of northern softwood, is considered a premium grade because of its strength. It generally obtains the highest price relative to other kraft pulps. Southern bleached softwood kraft pulp is kraft pulp manufactured using southern softwood species and does not possess the strength found in NBSK pulp. NBSK pulp is the sole product of our mills.
The selling price of kraft pulp depends in part on the fiber used in the production process. There are two primary species of wood used as fiber: softwood and hardwood. Softwood species generally have long, flexible fibers which add strength to paper while fibers from species of hardwood contain shorter fibers which lend bulk and opacity. Generally, prices for softwood pulp are higher than for hardwood pulp. Currently, the kraft pulp market is roughly evenly split between softwood and hardwood grades. Most uses of market kraft pulp, including fine printing papers, coated and uncoated magazine papers and various tissue products, utilize a mix of softwood and hardwood grades to optimize production and product qualities. In recent years, production of hardwood pulp, based on fast growing plantation fiber primarily from Asia and South America, has increased much more rapidly than that of softwood grades that have longer growth cycles. As a result of the growth in supply and lower costs, kraft pulp customers have substituted some of the pulp content in their products to hardwood pulp. Counteracting customers’
8
increased proportionate usage of hardwood pulp has been the requirement for strength characteristics in finished goods. Paper and tissue makers focus on higher machine speeds and lower basis weights for publishing papers which also require the strength characteristics of softwood pulp. We believe that the ability of kraft pulp users to continue to further substitute hardwood for softwood pulp is limited by such requirements.
NBSK pulp, which is a bleached kraft pulp manufactured using species of northern softwood, is considered a premium grade because of its strength. It generally obtains the highest price relative to other kraft pulps. Southern bleached softwood kraft pulp is kraft pulp manufactured using southern softwood species and does not possess the strength found in NBSK pulp. NBSK pulp is the sole product of our mills.
Kraft pulp can be made in different grades, with varying technical specifications, for different end uses. High-quality kraft pulp is valued for its reinforcing role in mechanical printing papers, while other grades of kraft pulp are used to produce lower priced grades of paper, including tissues and paper relatedpaper-related products.
We believe that over 125 million ADMTs of kraft pulp are converted annually into printing and writing papers, tissues, cartonboardscarton boards and other white grades of paper and paperboard around the world. Approximately 70%We also believe that approximately one third of this pulp is sold on the open market as market pulp, while the remainder is produced for internal purposes by integrated paper and paperboard manufacturers and approximately 30% is market pulp produced for sale on the open market.
manufacturers.Demand for our productkraft pulp is cyclical in nature and demand for kraft pulp is generally related to global and regional levels of economic activity. In 2008, overall global demand for all kraft pulp types, including softwood, was negatively impacted by the weak global economic conditions and global financial and credit turmoil the world began to experience in the second half of thethat year and which has continued into the first half of 2009.
Significant producer shutdowns and curtailments, along with strong demand from China, resulted in an improved supply-demand balance and improved prices in the second half of 2009 through 2010. Although global pulp markets continued to strengthen in the first half of 2011, economic uncertainty in Europe and credit tightening in China resulted in a decrease in demand and weaker pulp prices in the fourth quarter of 2011.Between 19972000 and 20072010 worldwide demand for softwood market pulp grew at an average rate of approximately 3.3%1.6% annually. Demand for softwood market pulp was negatively impacted by weak global economic conditions in 2009. However, the supply/demand balance for softwood market pulp improved in 2010, primarily due to strong demand in China, the residual effects of the Chilean earthquake that affected mills in that region and the net closure of approximately 3.4 million tonnes of production capacity globally since 2006. Since 2007, demand for softwood market pulp has grown in the emerging markets of Asia, Eastern Europe and Latin America. China in particular has experienced substantial growth and its demand for softwood market pulp grew by approximately 12.2%15.9% per annum between 20022000 and 2008.2010. China now accounts for approximately 16%20% of global softwood market pulp demand compared to only 9.0%5% in 2002.2000. Western Europe currently accounts for approximately 30% of global softwood market pulp demand. Within Europe, Eastern Europe has experienced significant demand growth with the region’s demand for softwood market pulp increasing by approximately 12% between 2007 and 2008.
A measure of demand for kraft pulp is the ratio obtained by dividing the worldwide demand of kraft pulp by the worldwide capacity for the production of kraft pulp, or the “demand/capacity ratio”. An increase in this ratio generally occurs when there is an increase in global and regional levels of economic activity. An increase in this ratio generally indicates greater demand as consumption increases, which often results in rising kraft pulp prices, and a reduction of inventories by producers and buyers. As prices continue to rise, producers continue to run at higher operating rates. However, an adverse change in global and regional levels of economic activity generally negatively affects demand for kraft pulp, often leading buyers to reduce their purchases and relying on existing pulp inventories. As a result, producers run at lower operating rates by taking downtime to limit thebuild-up of their own inventories. The demand/capacity ratio for softwood kraft pulp was approximately 90%92% in 2008,2011, approximately 95%93% in 20072010 and approximately 96%91% in 2006.
2009.A significant factor affecting our market is the amount of closures of old, high-cost capacity. In the four-year period from 2006 to 2009, we estimate approximately 5.3 million tonnes of predominantly NBSK capacity was indefinitely closed. Such closures have been partially offset by approximately 1.9 million tonnes restarted in late 2009 and 2010. The net effect of these closures and restarts is an estimated 3.4 million tonnes of capacity removed from the market. We do not believe there are any significant newaware of only one planned NBSK pulp production capacity increases coming onlineplant expansion worldwide in the next several yearsfew years. We believe that the absence of other plant expansions is due in part to fiber supply constraints and high capital costs.
Pulp markets are large and highly competitive. Producers ranging from small independent manufacturers to large integrated companies produce pulp worldwide. Our pulp and customer services compete with similar products manufactured and distributed by others. While many factors influence our competitive position, particularly in slowingweak economic times, a key factor is price. Other factors include service, quality and convenience of location. Some of our competitors are larger than we are in certain markets and have substantially greater financial resources. These resources may afford those competitors more purchasing power, increased financial flexibility, more capital
9
resources for expansion and improvement and enable them to compete more effectively. Our key NBSK pulp competitors are principally located in Northern Europe and Canada.
Pulp prices are highly cyclical. Global economic conditions, changes in production capacity, inventory levels, and currency exchange rates are the primary factors affecting NBSK pulp list prices. The average annual European list prices for NBSK pulp since 2000 have ranged from a low of approximately $447 per ADMT in 2002 to a high of approximately $900$1,030 per ADMT in 2008.
ADMT.Starting in 2006, pulp prices increased steadily from approximately $600 per ADMT in Europe to $870 per ADMT at the end of 2007. These price increases resulted from the closure of several pulp mills, particularly in North America, which reduced NBSK capacity by approximately 1.3 million ADMTs and better demand anddemand.
In the general weaknesssecond half of the U.S. dollar against the Euro and the Canadian dollar.
In 2008, list prices for NBSK pulp in Europe continued to improve in the first half of the year but decreased markedly in the second half due to weak global economic conditions. As a result, list prices for NBSK pulp in Europe decreased from $900 per ADMT in mid-2008 to $635 per ADMT at the end of the year. Such price weakness has continued into early 2009.
2009 as list prices in Europe fell to approximately $575 per ADMT. Commencing in mid-2009, pulp markets began to strengthen which led to improved prices. Strong demand from China, capacity closures and historically low global inventories for bleached softwood kraft pulp helped support upward price momentum. During the second half of 2009, several price increases raised European list prices by a total of $170 per ADMT to $800 per ADMT by year end. Such price increases were partially offset by the continued weakening of the U.S. dollar versus the Euro and Canadian dollar during the period. In December 2009, list prices for pulp were approximately $800 per ADMT in Europe, $830 per ADMT in North America and $700 per ADMT in China. In 2010, several increases lifted prices to record levels in the middle of the year and at the end of 2010 list prices were near historic highs of $950, $960 and $840 per ADMT in Europe, North America and China, respectively. Although pulp prices remained strong in 2011, reaching record levels of $1,030 per ADMT in Europe and $1,035 and $920 per ADMT in North America and China, respectively, uncertainty concerning the economic situation in Europe, along with credit tightening in China, caused pulp prices to drop to $825 per ADMT in Europe and $890 and $670 per ADMT in North America and China, respectively, by the end of the year. As pulp prices are highly cyclical, there can be no assurance that prices will not decline in the future.A producer’s net sales realizations will reflectare list prices, net of customer discounts, commissions and other selling concessions. While there are differences between NBSK list prices in Europe, North America and Asia, European prices are generally regarded as the global benchmark and pricing in other regions tends to follow European trends. The nature of the pricing structure in Asia is different in that, while quoted list prices tend to be lower than Europe, customer discounts and commissions tend to be lower resulting in net sales realizations that are generally similar to other markets.
The majority of market NBSK pulp is produced and sold by North AmericanCanadian and Scandinavian or “Norscan”, producers, while the price of NBSK pulp is generally quoted in U.S. dollars. As a result, NBSK pricing is affected by fluctuations in the currency exchange rates for the U.S. dollar versus the Canadian dollar, the Euro and the Euro.local currencies. NBSK pulp price increases during 2006, 2007 and the first half of 2008 were in large part offset by the weakening of the U.S. dollar. Similarly, the strengthening of the U.S. dollar against the Canadian dollar and the Euro towards the end of 2008 helped slightlypartially offset pulp price decreases caused by the deterioration in global economic conditions.
The overall strengthening of the U.S. dollar against the Euro in 2010, and in particular in the first half of 2010, improved the operating margins of our German mills. Although the U.S. dollar weakened against the Euro for most of 2011, it began to strengthen again at the end of the year.The following chart sets out the changes in list prices for NBSK pulp in Europe, as stated in U.S. dollars, Canadian dollars and Euros for the periods indicated.
10

Source: Pulp & Paper Week and BloombergThe Manufacturing Process
The following diagram provides a simplified description of the kraft pulp manufacturing process at our pulp mills:

In order to transform wood chips into kraft pulp, wood chips undergo a multi-step process involving the following principal stages: chip screening, digesting, pulp washing, screening, bleaching and drying.
In the initial processing stage, wood chips are screened to remove oversized chips and sawdust and are conveyed to a pressurized digester where they are heated and cooked with chemicals. This occurs in a continuous process at the Celgar and Rosenthal mills and in a batch process at the Stendal mill. This process softens and eventually dissolves the phenolic material called lignin that binds the fibers to each other in the wood.
Cooked pulp flows out of the digester and is washed and screened to remove most of the residual spent chemicals called black liquor, and partially cooked wood chips. The pulp then undergoes a series of bleaching stages where the brightness of the pulp is gradually increased. Finally, the bleached pulp is sent to the pulp machine where it is dried to achieve a dryness level of more than 90%. The pulp is then ready to be baled for shipment to customers.
A significant feature of kraft pulping technology is the recovery system, whereby chemicals used in the cooking process are captured and extracted for re-use, which reduces chemical costs and improves environmental performance. During the cooking stage, dissolved organic wood materials and used chemicals, collectively known as black liquor, are extracted from the digester. After undergoing an evaporation process, black liquor is burned in a recovery boiler. The chemical compounds of the black liquor are collected from the recovery boiler and are reconstituted into cooking chemicals used in the digesting stage through additional processing in the recausticizing plant.
The heat produced by the recovery boiler is used to generate high-pressure steam. Additional steam is generated by a power boiler through the combustion of biomass consisting of bark and other wood residuesresiduals from sawmills and our woodrooms and residue generated by the effluent treatment system. Additionally, during times of
11
upset, we may use natural gas to generate steam. The steam produced by the recovery and power boilers is used to power a turbogeneratorturbine generator to generate electricity, as well as to provide heat for the digesting and pulp drying processes.
Our Product
We manufacture and sell NBSK pulp produced from wood chips and pulp logs.
The kraft pulp produced at the Rosenthal mill is a long-fibered softwood pulp produced by a sulphate cooking process and manufactured primarily from wood chips and pulp logs. A number of factors beyond economic supply and demand have an impact on the market for chemical pulp, including requirements for pulp bleached without any chlorine compounds or without the use of chlorine gas. The Rosenthal mill has the capability of producing both “totally chlorine free” and “elemental chlorine free” pulp. Totally chlorine free pulp is bleached to a high brightness using oxygen, ozone and hydrogen peroxide as bleaching agents, whereas elemental chlorine free pulp is produced by substituting chlorine dioxide for chlorine gas in the bleaching process. This substitution virtually eliminates complex chloro-organic compounds from mill effluent.
Kraft pulp is valued for its reinforcing role in mechanical printing papers and is sought after by producers of paper for the publishing industry, primarily for magazines and advertising materials. Kraft pulp is also an important ingredient for tissue manufacturing, and tissue demand tends to increase with living standards in developing countries. Kraft pulp produced for reinforcement fibers is considered the highest grade of kraft pulp and generally obtains the highest price. The Rosenthal mill produces pulp for reinforcement fibers to the specifications of certain of our customers. We believe that a number of our customers consider us their supplier of choice. For more information about the facilities at the Rosenthal mill, see “Item 2 — Properties”.
The kraft pulp produced at the Stendal mill is of a slightly different grade than the pulp produced at the Rosenthal mill as the mix of softwood fiber used is slightly different. This results in a complementary product more suitable for different end uses. The Stendal mill is capable of producing both totally chlorine free and elemental chlorine free pulp. For more information about the facilities at the Stendal mill, see “Item 2 — Properties”.
The Celgar mill produces high-quality kraft pulp that is made from a unique blend of slow growing/long-fiber Western Canadian tree species. It is used in the manufacture of high-quality paper and tissue products. We believe the Celgar mill’s pulp is known for its excellent product characteristics, including tensile strength, wet strength and brightness. The Celgar mill is a long-established supplier to paper producers in Asia. For more information about the facilities
Generation and Sales of “Green” Energy at the Celgar mill, see “Item 2 — Properties”.
Energy and Recent Energy Initiativesour Mills
Climate change concerns have caused a proliferation inof renewable or “green” energy legislation, incentives and commercialization in both Europe and, increasingly, also in North America. This has generated an increase in demand and legislated requirements for “carbon neutral” sources of energy supply. Our pulp mills are large scale bio-refineries that produce both pulp and surplus “carbon neutral” or “green” energy. As part of the pulp production process our mills generate “green” energy using carbon-neutral biofuels such as black liquor and wood waste.
Through the incineration of
black liquorbiofuels in
the recovery
and power boilers, our mills produce sufficient steam to cover all of our steam requirements and
generallyallows us to produce
excesssurplus energy which we sell to third party utilities.
Our surplus energy sales provide our mills with a new stable revenue source unrelated to pulp prices. We believe that this revenue source from power sales gives our mills a competitive advantage over other older mills which do not have the equipment or capacity to produce and/or sell surplus power in a meaningful amount.
In 2008,2011 and 2010, we sold 456,059652,113 MWh and 520,005 MWh of excesssurplus energy, respectively, and recorded revenues of €31.0€58.0 million and €44.2 million, respectively, from such energy sales. We no longer consider the sale of surplus electricity to beSince our energy production is a by-product of our pulp production process, there are minimal incremental costs and commencing in 2008, report revenue from the sale ofour surplus energy as “Energy revenue” insales are highly profitable. The following table sets out our electricity generation and surplus energy sales for the Consolidated Statement of Operations. In previous years, these revenues were reported within “Operating costs”.
last three years: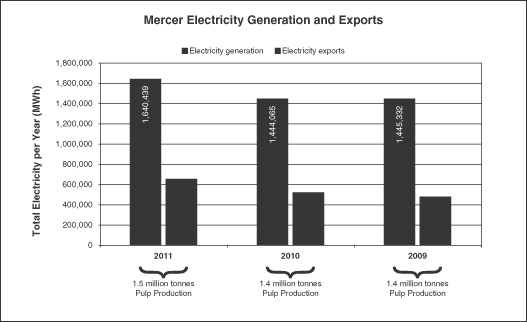
German Mills
BeginningSince January 2009, our Rosenthal and Stendal mills now participatehave participated in a program established pursuant to Germany’sthe Renewable Energy Resources Act, or “Renewable Energy Act”.Act. The Renewable Energy Act, in existence since 2000, requires that public electric utilities give priority to electricity produced from renewable energy resources by independent power producers and pay a fixed tariff for a period of 20 years. Previously, this legislation was only applicable to installmentsinstallations with a capacity of 20MW or less, effectively excluding our Rosenthal and Stendal mills. RecentSubsequent amendments to the Renewable Energy Act have removed this restriction. Under the program, our German mills now sell their surplus energy to the local electricity grid at the rates stipulated by the Renewable Energy Act for biomass energy.
12
Since 2005, our German mills have also benefited from the sale of emission allowances under the European Union carbon emissions trading scheme,Carbon Emissions Trading Scheme, referred to as “EU ETS”. As a result ofHowever, our participationeligibility for special tariffs under the Renewable Energy Act has reduced the amount of emissions allowances granted to our German mills under the EU ETS may be reduced.
Celgar
ETS.In April 2008January 2012, we commencedannounced Project Blue Mill which is designed to increase the Stendal mill’s annual pulp production by 30,000 ADMTs and initially produce an additional 109,000 MW of surplus renewable energy. Project Blue Mill is eligible for €12.0 million of non-refundable government grants and the Stendal mill has secured a new “green” energy project at our €17.0 million five-year amortizing secured term debt facility, of which 80% will be government guaranteed. The balance of Project Blue Mill will be funded through operating cash flow of the Stendal mill and up to an aggregate of €6.5 million in pro rata shareholder loans from Mercer Inc. and its noncontrolling shareholder.
Celgar mill, referred to asMill
In September 2010, we completed the Celgar Energy Project at the Celgar mill, to increase the mill’s production of “green” energy and optimize its power generation capacity. The project includesincluded the installation of a 48 MW condensing turbine, which is expected to bringbrought the mill’s installed generating capacity up to 100 MW, as well asand upgrades to the mill’s bark boiler and steam consuming facilities. Completion of the Celgar Energy Project is currently estimated for early 2010.
In January 2009 theThe Celgar mill finalizedhas an electricity purchase agreementElectricity Purchase Agreement with British Columbia’s primary public utility provider,B.C. Hydro for the sale of power generated from the Celgar Energy Project.such project. Under the agreement,Electricity Purchase Agreement, the Celgar mill willagreed to supply a minimum of approximately 238,000 MWh of surplus electrical energy annually to the utility over a ten-year term, with deliveries to commence in the first quarter of 2010.
In February 2009term.We financed the Celgar mill signedEnergy Project largely with funding from the GTP. In early October 2009, we received notification from Natural Resources Canada, or “NRCan”, of the Celgar mill’s original allocation of approximately C$57.7 million in credits under the GTP. In November 2009, we entered into a non-repayable contribution agreement, referred to as the “Contribution Agreement”, with the Canadian federal government pursuant to Canada’secoEnergy for Renewable Power Program. The program’s purpose is to increase Canada’s supply of clean electricity from renewable sources, such as biomass, by providing funding for renewable energy projects such asNRCan whereby NRCan provided us with approximately C$40.0 million in grants (of our allocated C$57.7 million) towards certain costs associated with the Celgar Energy Project. UnderSubsequently, NRCan provided an additional C$8.0 million pursuant to the terms of the Contribution Agreement,Agreement. In 2011, NRCan agreed to allocate approximately C$1.6 million under its Transformative Technologies Program and we entered into additional contribution agreements bringing the total received from NRCan to C$56.1 million.
In 2011, we produced and sold roughly 140,069 MWh of surplus renewable electricity at our Celgar mill is eligible to receive incentive payments of up to a maximum ofwhich generated approximately C$29.914.5 million over a period of ten years based on the delivery of a certain level of energy production by the Celgar Energy Project. The incentive payments are payable quarterly and are formula based. Receipt of the incentive payments is also subject to the Celgar Energy Project meeting certain environmental requirements.
The following table sets out our electricity generation and surplus energy sales for the last three years:
in annual revenues.Operating Costs
Our major costs of production are labor, fiber, energy and chemicals. Fiber comprised of wood chips and pulp logs is our most significant operating expense. Given the significance of fiber to our total operating expenses and our limited ability to control its costs, compared with our other operating costs, volatility in fiber costs can materially affect our margins and results of operations.
13
Labor
Labor
Our labor costs tend to be generally steady, with small overall increases due to inflation in wages and health care costs. Over the last three years, we have been able to generally offset such increases by increasing our efficiencies and production and streamlining operations.
Our mills are situated in regions which generally provide a relatively stable supply of fiber. The fiber consumed by our mills consists of wood chips produced by sawmills as a by-product of the sawmilling process and pulp logs. Wood chips are small pieces of wood used to make pulp and are a by-product of either wood residuals from sawmillsthe sawmilling process or logs or pulp logs chipped especially for this purpose. Pulp logs consist of lower quality logs not used in the production of lumber. Wood chips and pulp logs are cyclical in both price and supply.
Generally, the cost of wood chips and pulp logs are primarily affected by the supply and demand for lumber. Additionally, regional factors such as harvesting levels and weather conditions can also have a material effect on both the supply, demand and price for fiber.
In Germany, since 2006, the price and supply of wood chips has been affected by increasing demand from alternative or renewable energy producers changes in supply resulting from weather conditions and government initiatives and a move to increase harvesting levels. Highfor carbon neutral energy. Declining energy prices along withand weakening economies in the first half of 2009 tempered the increased demand for wood chips that resulted from initiatives by European governments to promote the use of wood as a carbon neutral energy, generally increased demand for wood usage for energy production and for wood fiber. Declining energy prices and weakening economies in the latter part of 2008 tempered such demand.energy. Over the long-term, we expect this non-traditional demand for fiber is expectedto continue to increase.
In 2008, prolonged and wide-spread production curtailments in the European board industry caused by weak market conditions resulted in decreased fiber demand and moderated prices. In the early part of 2008, weather patterns also affected short-term fiber supply and pricing as wood from damaged forests caused by storms in Germany and Austria increased availability of fiber.
In April 2008, the Russian government raised tariffs on the export of sawmill and pulp wood to 25% from the 20% effective since July 2007.. A further increase to 80%, was initially scheduled to become effective onfor January 1, 2009 has beenbut was officially deferred until late 2009. Iftwice and when implemented,Russia’s export tariff remained unchanged at 25% in 2011. In early 2012, Russia agreed to enter the additional tariff increaseWorld Trade Organization, or “WTO”. It is currently expected that Russia will formally enter the WTO in June 2012 and will lower its export tariffs to reducebetween 13% and 15% which we believe will have a positive impact on the export of Russian wood to Europe, in particular to Scandinavian producers who import a significant amount of their wood from Russia. This may put upward pressure on pricing as such producers try to replace these volumes from other regions.
European fiber supply.Offsetting some of the increases in demand for wood fiber have been initiatives in which we and other producers are participating to increase harvest levels in Germany, particularly from small private forest owners. We believe that Germany has the highest availability of softwood forests in Europe suitable for harvesting and manufacturing. PrivateWe believe private ownership of such forests is approximately 50%. Many of these forest ownership stakes are very small and have been harvested at rates much lower than their rate of growth. In the latter part of 2008,early 2009, in response to slowing economies in Germany and elsewhere and the related weaker demand for pulp logs, forest owners reduced their harvesting rates slightly. At the same time, the price of pulp logs has continued to decrease. It is expected thatWhile prices for pulp logs in Germany will remainremained relatively low in the first half of 2009, but that further reductions in harvesting rates could leadled to an undersupply and upward pressure onwhich resulted in increased fiber prices later that year. Fiber prices continued to increase through most of 2010 and 2011, driven by lower levels of harvesting in central Germany, combined with increased demand for wood from the year.
energy sector for heating and other bio-energy purposes.We believe we are the largest consumer of wood chips and pulp logs in Germany and often provide the best, long-term economic outlet for the sale of wood chips in Eastern Germany. We coordinate the wood procurement activities for our German mills to reduce overall personnel and administrative costs, provide greater purchasing power and coordinate buying and trading activities. This coordination and integration of fiber flows also allows us to optimize transportation costs, and the species and fiber mix for both mills.
In 2008,2011, the Rosenthal mill consumed approximately 1.8 million cubic meters of fiber. Approximately 65%70% of such consumption was in the form of sawmill wood chips and approximately 35%30% was in the form of pulp logs. The wood chips for the Rosenthal mill are sourced from approximately 2131 sawmills located primarily in the states of Bavaria, Baden-Württemberg and Thüringia and are within a 150300 kilometer radius of the Rosenthal mill.
Within this radius, the Rosenthal mill is the largest consumer of wood chips. Given its location and size, the Rosenthal mill is
14
often the best economic outlet for the sale of wood chips in the area. Approximately 91%73% of the fiber consumed by the Rosenthal mill is spruce and the remainder is pine. While fiber costs and supply are subject to cyclical changes largely in the sawmill industry, we expect that we will be able to continue to obtain an adequate supply of fiber on reasonably satisfactory terms for the Rosenthal mill due to its location and our long-term relationships with suppliers. We have not historically experienced any significant fiber supply interruptions at the Rosenthal mill.
Wood chips for the Rosenthal mill are normally sourced from sawmills under one year or quarterly supply contracts with fixed volumes, which provide for price adjustments. More than 99%Substantially all of our chip supply is sourced from suppliers with which we have a long-standing relationship. We generally enter into annual contracts with such suppliers. Pulp logs are sourced from the state forest agencies in Thüringia, Saxony and Bavaria on a contract basis and partly from private holders on the same basis as wood chips. Like the wood chip supply arrangements, these contracts tend to be of less than one-year terms with quarterly adjustments for market pricing. We organize the harvesting of pulp logs sourced from the state agencies in Thüringia, Saxony and Bavaria after discussions with the agencies regarding the quantities of pulp logs that we require.
In 2008,2011, the Stendal mill consumed approximately 3.03.2 million cubic meters of fiber. Approximately 34%25% of such fiber was in the form of sawmill wood chips and approximately 66%75% in the form of pulp logs. The core wood supply region for the Stendal mill includes most of the Northern part of Germany within an approximate 300 kilometer radius of the mill. We also purchase wood chips from Southwestern and Southern Germany. The fiber base in the wood supply area for the Stendal mill consisted of approximately 41%68% pine and 59%32% spruce and other species in 2008.2011. The Stendal mill has sufficient chipping capacity to fully operate solely using pulp logs, if required. We source wood chips from sawmills within an approximate 300 kilometer radius of the Stendal mill. We source pulp logs partly from private forest holders and partly from state forest agencies in Thüringia, Saxony-Anhalt, Mecklenburg-Western Pomerania, Saxony, Lower Saxony, North Rhine-Westphalia, Hesse and Brandenburg.
Stendal has its own wood procurement division to handle its fiber requirements. This division focuses on three principal activities, being wood procurement and sales, harvesting and transportation. The procurement and sales main activity is to procure the required wood chip and pulp log assortments for the mill’s annual production. In conjunction with this activity, it may also procure higher quality sawlogs, either through harvesting or through purchases that it can sell or trade with others for wood chips in order to optimize the mill’s fiber mix.
In British Columbia, in 2008, the supply of wood fiber was materially affected by the severe continued weakness in the U.S. housing and construction markets. This has resulted in a significant reduction in lumber production, reduced availability and higher prices for fiber. As a result, our Celgar mill is currently working with the provincial government and forest tenure licensees to develop alternate supplies of fiber. The weak lumber market has highlighted weaknesses in the provincial government’s regulations with respect to pulp manufacturers’ access to pulp logs. The Celgar mill has focused on enabling the supply of low-cost and low-grade logs. These are often destroyed by the Mountain Pine Beetle infestation and left to decay in the forest. Discussions with the provincial government are ongoing to find solutions to extract value from a source of fiber that may otherwise be wasted. On the fiber demand side, although not nearly as advanced as Europe, there is growing interest in British Columbia for renewable or “green” energy. Such initiatives are expected to create additional competition for fiber.
In 2008,2011, the Celgar mill consumed approximately 2.72.6 million cubic meters of fiber. Approximately 69%61% of such fiber was in the form of sawmill wood chips and the remaining 31%39% came from pulp logs processed through its woodroom or chipped by a third party. The source of fiber at the mill is characterized by a mixture of species (whitewoods and cedar) and the mill sources fiber from a number of Canadian and U.S. suppliers.
As a result of the cyclical decline in sawmill chip availability resulting from lower lumber production in British Columbia, the Celgar mill has increased its U.S. purchases of fiber, diversified its suppliers and, where possible, increased chip production through third party field chipping contracts and existing sawmill suppliers. Additionally, in the early part of 2009, the Celgar mill completed a project to upgrade its woodroom which, along with subsequent improvements during the year, increased its capacity to be able to process up to 50% of the mill’s fiber needs compared to only approximately 10% previously. The woodroom upgrades also increased the mill’s ability to process small diameter logs and facilitate an efficient flow of fiber. This has increased the overall volume of fiber being processed and helped mitigate increases in the price of fiber.
The Celgar mill has long and short-term chip supply agreements withaccess to over 3035 different suppliers from Canada and the U.S., representing approximately 90%75% of its total annual fiber requirements. The Celgar mill’s woodroom suppliessupplied the remaining chips to meet25% of the Celgar mill’s fiber requirements.requirements in 2011. Chips are purchased in Canada and the U.S. in accordance with chip purchase agreements. Generally, pricing is reviewed and adjusted periodically to reflect market prices. The majority of the agreements are for periods ranging between two and five years. Several of the longer-term contracts are so-called “evergreen” agreements, where the contract remains in effect until one of the parties elects to terminate. Termination requires a minimum of two, and in some cases, five years’ written notice. Certain non-evergreen long-term agreements provide for renewal negotiations prior to expiry.
15
As a result of the cyclical decline in sawmill chip availability resulting from lower lumber production in British Columbia and the weakness in the U.S. dollar throughout most of 2008, the Celgar mill has increased its U.S. purchases of fiber, diversified its suppliers and, where possible, increased chip production through third party field chipping contracts and existing sawmill suppliers. In 2008, the Celgar mill also increased its production of chips from pulp logs processed through its woodroom by 20% compared to 2007. Additionally, in the fourth quarter of 2008, the Celgar mill began a project to upgrade its woodroom and enable it to process up to 36% of the mill’s fiber needs. Previously, the woodroom’s configuration permitted for the processing of approximately only 10% of the mill’s needs. The woodroom upgrades are designed to increase the ability to process small diameter logs and facilitate the efficient flow of fiber, thereby increasing the overall volume of fiber being processed and ultimately reducing fiber costs. The project is complete and the woodroom is expected to ramp up operations in the first half of 2009. As a result of the upgrade, we expect to significantly increase the amount of pulp log chipping at our Celgar mill in 2009.
To secure the volume of pulp logs required by theits woodroom, the Celgar mill has entered into annual pulp log supply agreements with a number of different suppliers, many of whom are also contract chip suppliers to the mill. All of the pulp log agreements can be terminated by either party for any reason, upon seven days’ written notice.
In 2008,On the fiber demand side, increased competition for fiber from the growing renewable or “green” energy sector in British Columbia in the second half of 2011 led to moderately higher fiber costs. Although not nearly as part of a creditor protection settlement agreement, a regional forest products company sold the two sawmills with which our Celgar mill had contracts for the supply of approximately 20% of its annual fiber requirements. Subsequent to the sale, these sawmills were curtailed. In late 2008, one of the sawmills was restarted and we have negotiated a new chip contract with the mill. The other sawmill has remained curtailed andadvanced as Europe, British Columbia’s growing green energy sector is not expected to start up in the foreseeable future. If it does restart the Celgar mill intendscontinue to negotiate a newcreate additional competition for fiber agreement. There is no guarantee that the Celgar mill will be able to negotiate a fiber contract on acceptable terms or at all. However, given the proximity of the Celgar mill to this sawmill, there is a logistical advantage to the sawmill in supplying its chips to the Celgar mill.
Our energy is primarily generated from renewable carbon neutral sources, such as black liquor and wood waste. Our mills produce all of our steam requirements and generally generate excess energy which we sell to third party utilities. In 2008,2011, we generated 1,456,6301,640,439 MWh and we sold 456,059652,113 MWh of surplus energy. See also “—Generation and Sales of ‘Green’ Energy and Recent Energy Initiatives”at our Mills”. We utilize fossil fuels, such as natural gas, in limited circumstances includingprimarily in our kilnlime kilns and we use a limited amount forstart-up and shutdown operations. Additionally, from time to time, mill process disruptions occur and we consume small quantities of purchased electricity and fossil fuels to maintain operations. As a result, all of our mills are subject to fluctuations in the prices for fossil fuels.
Our mills use certain chemicals which are generally available from several suppliers and sourcing is primarily based upon pricing and location. Although chemical prices have risen slightly over the last three years, we have been able to reduce our costs through improved efficiencies and capital expenditures. However, the current global economic slowdown may reduce the supply of certain chemicals which are manufactured as a by-product of other manufacturing processes and as a result place upward pressure on pricing for such chemicals. We are working with our suppliers to minimize these price pressures.
16
Cash Production Costs
CashConsolidated cash production costs per tonneADMT for our pulp mills are set out in the following table for the periods indicated:
| | | | | | | | | | | | | |
| | | Years Ended December 31, | |
Cash Production Costs | | 2008 | | | 2007 | | | 2006 | |
| | | (per ADMT) | |
| |
| Fiber | | € | 247 | | | € | 247 | | | € | 192 | |
| Labor | | | 36 | | | | 43 | | | | 46 | |
| Chemicals | | | 44 | | | | 39 | | | | 42 | |
| Energy | | | 21 | | | | 18 | | | | 23 | |
| Other | | | 43 | | | | 46 | | | | 41 | |
| | | | | | | | | | | | | |
| Total cash production costs(1) | | € | 391 | | | € | 393 | | | € | 344 | |
| | | | | | | | | | | | | |
| | | | | | | | | | | | |
| | | Years Ended December 31, | |
| | | 2011 | | | 2010 | | | 2009 | |
| | | (per ADMT) | |
Cash Production Costs | | | | |
Fiber | | € | 275 | | | € | 256 | | | € | 207 | |
Labor | | | 43 | | | | 42 | | | | 37 | |
Chemicals | | | 46 | | | | 41 | | | | 43 | |
Energy | | | 13 | | | | 17 | | | | 13 | |
Other | | | 56 | | | | 54 | | | | 42 | |
| | | | | | | | | | | | |
Total cash production costs(1) | | € | 433 | | | € | 410 | | | € | 342 | |
| | | | | | | | | | | | |
| | |
| (1) | | Cost of production per ADMT produced excluding depreciation. |
Sales, Marketing and Distribution
The distribution of our pulp sales revenues by geographic area are set out in the following table for the periods indicated:
| | | | | | | | | | | | | | | | | |
| | | Years Ended December 31, | |
| | | 2008 | | | 2007 | | | 2006 | |
| | | (in thousands) | |
| |
Revenues by Geographic Area | | | | | | | | | | | | | | | | |
| Germany | | € | 198,340 | | | € | 198,575 | | | € | 154,388 | | | | | |
| China | | | 131,412 | | | | 159,553 | | | | 141,296 | | | | | |
| Italy | | | 56,487 | | | | 50,177 | | | | 60,057 | | | | | |
| Other European Union countries(1) | | | 133,621 | | | | 136,434 | | | | 117,016 | | | | | |
| Other Asia | | | 65,192 | | | | 58,242 | | | | 75,522 | | | | | |
| North America | | | 78,718 | | | | 66,229 | | | | 39,761 | | | | | |
| Other countries | | | 17,146 | | | | 26,639 | | | | 28,586 | | | | | |
| | | | | | | | | | | | | | | | | |
| Total(2) | | € | 680,916 | | | € | 695,849 | | | € | 616,626 | | | | | |
| | | | | | | | | | | | | | | | | |
| | | | | | | | | | | | |
| | | Years Ended December 31, | |
| | | 2011 | | | 2010 | | | 2009 | |
| | | (in thousands) | |
Revenues by Geographic Area | | | | |
Germany | | € | 256,563 | | | € | 278,348 | | | € | 154,323 | |
China | | | 234,654 | | | | 196,022 | | | | 146,613 | |
Italy | | | 51,509 | | | | 56,301 | | | | 44,616 | |
Other European Union countries(1) | | | 175,937 | | | | 182,246 | | | | 107,276 | |
Other Asia | | | 30,872 | | | | 37,561 | | | | 38,946 | |
North America | | | 69,345 | | | | 92,628 | | | | 68,213 | |
Other countries | | | 823 | | | | 1,503 | | | | 8,312 | |
| | | | | | | | | | | | |
Total(2) | | € | 819,703 | | | € | 844,609 | | | € | 568,299 | |
| | | | | | | | | | | | |
| | |
| (1) | | Not including Germany or Italy; includes new entrant countries to the European Union from their time of admission. |
| (2) | | Excluding intercompany sales volumes of nil, nil and 13,234 tonnes of pulp and intercompany net sales revenues of €nil, €nil and €6.4 million in 2008, 2007 and 2006, respectively.third party transportation revenues. |
The following charts illustrate the geographic distribution of our pulp revenues for the periods indicated:
| | | | |
Year Ended
| | Year Ended
| | Year Ended
|
December 31, 2008 | | December 31, 2007 | | December 31, 2006 |
|
 | |  | |  |
| | |
(1)Year Ended December 31, 2011 | | Year Ended December 31, 2010 | | Year Ended December 31, 2009 |
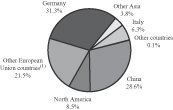
| | 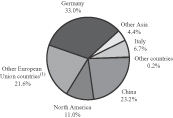 | |  |
| (1) | Includes new entrant countries to the European Union from their time of admission. |
17
Our global sales and marketing group is responsible for conducting all sales and marketing of the pulp produced at our mills and currently has approximately 1719 employees engaged full time in such activities. The global sales and marketing group handles sales to over 230180 customers. We coordinate and integrate the sales and marketing activities of our German mills to realize on a number of synergies between them. These include reduced overall administrative and personnel costs and coordinated selling, marketing and transportation activities. We also coordinate sales from the Celgar mill with our German mills on a global basis, thereby providing our larger customers with seamless service across all major geographies. In marketing our pulp, we seek to establish long-term relationships by providing a competitively priced, high-quality, consistent product and excellent service. In accordance with customary practice, we maintain long-standing relationships with our customers pursuant to which we periodically reach agreements on specific volumes and prices.
Our pulp sales are on customary industry terms. At December 31, 2008,2011, we had no material payment delinquencies. In 2008, 2007 and 2006,2011, no single customer accounted for more than 10% of our pulp sales. OurIn 2010, one customer which purchased for several of its mills accounted for 11% of pulp sales and, in 2009, no single customer accounted for more than 10% of our pulp sales. We don’t believe our pulp sales are not dependent upon the activities of any single customer.
Our German mills are currently the only market kraft pulp producers in Germany, which is the largest import market for kraft pulp in Europe. We therefore have a competitive transportation cost advantage compared to NorscanCanadian and Scandinavian pulp producers when shipping to customers in Europe. Due to the location of our German mills, we are able to deliver pulp to many of our customers primarily by truck. Most trucks that deliver goods into Eastern Germany generally do not also haul goods out ofhave significant backhaul opportunities as the region as Eastern Germany is primarily an importer of goods. We are therefore frequently able to obtain relatively low back haulbackhaul freight rates for the delivery of our products to many of our customers. Since many of our customers are located within a 500 kilometer radius of our German mills, we can generally supply pulp to customers of these mills faster than our competitors because of the short distances between the mills and our customers.
The Celgar mill’s pulp is transported to customers by rail, truck and ocean carrier using strategically located third party warehouses to ensure timely delivery. The majority of Celgar’s pulp for overseas markets is initially delivered primarily by rail to the Port of Vancouver for shipment overseas by ocean carrier. Based in Western Canada, the Celgar mill is well positioned to service Asian customers. The majority of the Celgar mill’s pulp for domestic markets is shipped by rail to third party warehouses in the U.S. or directly to the customer.
For the year ended December 31, 2008, approximately 47%Approximately 58%, 55% and 51% of our consolidated sales were to tissue and specialty paper product manufacturers for the years ended December 31, 2011, 2010 and approximately 53%2009, respectively. The balance of our sales for such periods was to other paper product manufacturers. In 2007 and 2006 salesSales to tissue and specialty paper product manufacturers were approximately 44% and 38%, respectively, and sales to other paper product manufacturers represented approximately 56% and 62% of consolidated sales, respectively. Tissue and specialty paper product manufacturersare a key focus for us, as they generally are not as sensitive to cyclical declines in demand caused by downturns in economic activity.
Capital Expenditures
In 2008,2011, we continued with our capital investment programs designed to increase pulp and green energy production capacity and improve efficiency and reduce effluent discharges and emissionsenvironmental performance at our manufacturing facilities.mills. The improvements made at our mills over the past fiveeight years have reduced operating costs and increased the competitive position of our facilities.
Total capital expenditures at the Rosenthal mill in 2008, 20072011, 2010 and 20062009 were €8.7€13.7 million, €5.2€4.0 million and €13.4€9.1 million, respectively. Capital investments at the Rosenthal mill in 20082011, primarily related to the installation of a new chipper and upgrades to the recovery process, while in 2010 and 2009 capital expenditures related mainly to the renewalupgrade of a bleaching line. In addition, we initiatedline and a washer project, at a total cost of approximately €2.5 million which will helphelped offset three years of wastewater fees that would otherwise be payable.
Our Stendal mill’s total capital expenditures in 2008, 20072011, 2010 and 20062009 were €4.9€8.3 million, €4.9€3.6 million and €2.5€2.0 million, respectively. Capital investments at the Stendal mill in 20082011 and 2010 related mainly to fiber handling optimizationrelatively small projects designed to improve safety and equipmentenvironmental performance as well as improve the overall efficiency of the mill.
In January 2012, Mercer announced Project Blue Mill which is intended to increase production and efficiency at the efficiencyStendal mill through debottlenecking initiatives including the installation of an additional 40 MW steam turbine. Project Blue Mill is estimated to require approximately €40.0 million in capital expenditures over about 21 months, which will be primarily funded through €12.0 million of non-refundable German government grants and capacitya new €17.0 million five-year amortizing secured term facility, of which 80% will be government guaranteed. The balance of Project Blue Mill will be funded through operating cash flow of the mill’s black liquor production.
Stendal mill and up to an aggregate of €6.5 million in pro rata shareholder loans from Mercer Inc. and Stendal’s noncontrolling shareholder. Project Blue Mill is currently designed to be completed and start to generate power resources in or about September 2013.Certain of our capital investment programs in Germany were partially financed through government grants made available by German federal and state governments. Under legislation adopted by the federal and certain
state governments of Germany, government grants are provided to qualifying businesses operating in Eastern Germany to finance capital investments. The grants are made to encourage investment and job creation. Currently, grants are
18
available for up to 15% of the cost of qualified investments. Previously, government grants were available for up to 35% of the cost of qualified investments, such as for the construction of our Stendal mill. These grants at the 35% of cost level required that at least one permanent job be created for each €500,000€0.5 million of capital investment eligible for such grants and that such jobs be maintained for a period of five years from the completion of the capital investment project. Generally, government grants are not repayable by a recipient unless it fails to complete the proposed capital investment or, if applicable, fails to create or maintain the requisite amount of jobs. In the case of such failure, the government is entitled to revoke the grants and seek repayment unless such failure resulted from material unforeseen market developments beyond the control of the recipient, wherein the government may refrain from reclaiming previous grants. Pursuant to such legislation in effect at the time, the Stendal mill received approximately €275.0€278.0 million of government grants. We believe that we are in compliance in all material respects with all of the terms and conditions governing the government grants we have received in Germany.
The following table sets out for the periods indicated the effect of these government grants on the recorded value of such assets in our consolidated balance sheets:
| | | | | | | | | | | | | |
| | | As at December 31, | |
| | | 2008 | | | 2007 | | | 2006 | |
| | | (in thousands) | |
| |
| Properties, net (as shown on consolidated balance sheets) | | € | 881,704 | | | € | 933,258 | | | € | 972,143 | |
| Add back: government grants less amortization, deducted from properties | | | 290,187 | | | | 304,366 | | | | 341,710 | |
| | | | | | | | | | | | | |
| Properties, gross amount including government grants less amortization | | € | 1,171,891 | | | € | 1,237,624 | | | € | 1,313,853 | |
| | | | | | | | | | | | | |
| | | | | | | | | | | | |
| | | As at December 31, | |
| | | 2011 | | | 2010 | | | 2009 | |
| | | (in thousands) | |
Property, plant and equipment, gross amount less amortization | | € | 1,112,639 | | | € | 1,144,759 | | | € | 1,152,288 | |
Less: government grants less amortization | | | 291,665 | | | | 297,992 | | | | 283,730 | |
| | | | | | | | | | | | |
Property, plant and equipment, net (as shown on the Consolidated Balance Sheets) | | € | 820,974 | | | € | 846,767 | | | € | 868,558 | |
| | | | | | | | | | | | |
Qualifying capital investments at industrial facilities in Germany that reduce effluent discharges offset wastewater fees that would otherwise be required to be paid. For more information about our environmental capital expenditures, see “—Environmental”.
Total capital expenditures at the Celgar mill in 2008, 20072011, 2010 and 20062009 were €12.1€15.7 million, €7.9€30.6 million and €16.0€17.8 million, respectively. In 2008,2011, capital expenditures related primarily to a project to improve the Celgar mill’s fiber line and oxygen delignification process, referred to as the “Oxygen Delignification Project”, and a project to recover/recycle chemicals from the mill’s effluent, referred to as the “GAP Project”.
We completed the Celgar Energy Project and upgrades to the mill’s woodroom. We commenced the Celgar Energy Projectin 2010 as part of our continued focus on energy production and sales and to increase the mill’s production of “green” energy and optimize its power generation capacity. The project iswas designed to beas a high return capital project with an estimatedat a cost of approximately €35.0 million.C$64.7 million (€49.0 million). It includesincluded the installation of a second turboturbine generator with a design capacity of 48 MW.
In October 2009, as part of the GTP, the Canadian government through NRCan agreed to provide approximately C$57.7 million in credits towards the capital costs associated with the Celgar mill, including the Celgar Energy Project. Such credits reduced the cost basis of the assets purchased and were not recorded in our income. The project is expectedmajority of the remaining credits not used for the Celgar Energy Project are available for use by the Celgar mill on other qualifying projects until March 31, 2012. To be eligible for GTP credits, projects must meet certain energy efficiency or environmental improvement requirements. Specifically, we applied to bringNRCan to utilize approximately C$10.9 million of our allocated GTP funding towards the Oxygen Delignification Project and several small projects at our Celgar mill. As at December 31, 2011, we had spent approximately C$8.6 million to complete the Oxygen Delignification Project. In 2011, as part of the NRCan Transformative Technologies Program, we received C$1.6 million from NRCan which was utilized towards the GAP Project. As at December 31, 2011, we had spent approximately C$2.7 million on the GAP Project and expect to spend approximately C$0.7 million in 2012.
The Celgar Energy Project increased the mill’s installed generating capacity up to 100 MW, and upgradeupgraded the mill’s bark boiler and steam facilities. In January 2009, the Celgar mill finalized an electricity purchase agreementthe Electricity Purchase Agreement under which it will sell electrical energy generated by the Celgar Energy Project to the principal provincial power authority. See ‘‘— Energy and Recent Energy Initiatives”.
In 2009, we intend to reduce discretionaryB.C. Hydro.Excluding costs for projects financed through government grants, capital expenditures atfor all of our mills to help conserve our cash resources in response to the current economic environment. Overall, capital expenditures in 20092012 are expected to be approximately €42.0€40.8 million, comprised of Project Blue Mill at our Stendal mill and primarily relate to the Celgar Energy Project.
Environmental
Our operations are subject to a wide range of environmental laws and regulations, dealing primarily with water, air and land pollution control. We devote significant management and financial resources to comply with all applicable environmental laws and regulations. Our total capital expenditures on environmental projects at our mills were approximately €4.9€7.1 million in 2008 (2007 — €0.2 million). In 2009, we expect environmental project related capital expenditures to be approximately €8.82011 (€2.5 million in 2009, primarily relating2010). The Oxygen Delignification Project is intended to a washer projectgenerate environmental improvements by reducing the organic and chemical loading on the effluent treatment system at the Rosenthalour Celgar mill.
We believe we have obtained all required environmental permits, authorizations and approvals for our operations. We believe our operations are currently in substantial compliance with the requirements of all applicable environmental laws and regulations and our respective operating permits.
19
Under German state environmental rules relating to effluent discharges, industrial users are required to pay wastewater fees based upon the amount of their effluent discharge. These rules also provide that an industrial user which undertakes environmental capital expenditures and lowers certain effluent discharges to prescribed levels may offset the amount of these expenditures against the wastewater fees that they would otherwise be required to pay. We estimate that the aggregate wastewater fees we saved in 20082011 as a result of environmental capital expenditures and initiatives to reduce allowable emissions and discharges at our Stendal and Rosenthal mills weremill was approximately €6.4€4.2 million. In 2007, we saved approximately €4.1 million and, in 2006, the Stendal and Rosenthal mills saved aggregateThe estimated amount of accrued wastewater fees ofwe expect to recover at our Rosenthal mill is approximately €7.7€2.2 million. We expect that capital investment programs and other environmental initiatives at our German mills will mostly offset the wastewater fees that may be payable for 20092012 and 2010 andwe believe they will ensure that our operations continue in substantial compliance with prescribed standards.
Environmental compliance is a priority for our operations. To ensure compliance with environmental laws and regulations, we regularly monitor emissions at our mills and periodically perform environmental audits of operational sites and procedures both with our internal personnel and outside consultants. These audits identify opportunities for improvement and allow us to take proactive measures at the mills as considered appropriate.
The Rosenthal mill has a relatively modern biological wastewater treatment and oxygen bleaching facility. We have significantly reduced our levels of adsorbableabsorbable organic halogen discharge at the Rosenthal mill and we believe the Rosenthal mill’s adsorbableabsorbable organic halogen and chemical oxygen demand discharges are in compliance with the standards currently mandated by the German government.
The Stendal mill, which commenced operations in September 2004, has been in substantial compliance with applicable environmental laws, regulations and permits. Management believes that, as the Stendal mill is astate-of-the-art facility, it will be able to continue to operate in compliance with the applicable environmental requirements.
The Celgar mill has been in substantial compliance with applicable environmental laws, regulations and permits. In 2008 dredging of the mill’s spill pond was completed to remove a stockpile of solids responsible for generating the odor which has at times caused compliance issues with the mill’s air permit.
In November 2008, the Celgar mill suffered a spill of diluted weak black liquor into the nearby Columbia River. The spill was promptly reported by the mill to authorities and remediated. An environmental impact report prepared by independent consultants engaged by the mill concluded that the environmental impact of the spill was minimal. The spill was also investigated by federal and provincial environmental authorities and, in January 2009, the Celgar mill received a reportgovernment directive requiring it to take a number of measures relating to the retention capacity of spill ponds. These measures were completed to the satisfaction of the matter is expected some timeoverseeing environmental authorities. However, in 2009. Although we cannot predict what action, if any,September 2009, the authorities may take, we do not currently expectCelgar mill received a summons in connection with this spill for charges under the spillCanadianFisheries Act and the British ColumbiaEnvironmental Management Act, primarily relating to result in any material charges.
alleged effluent exceedances under the Celgar mill’s discharge permit. See “Legal Proceedings”.The Celgar mill operates two landfills, a newly commissioned site and an older site. The Celgar mill intends to decommission the oldolder landfill and is developing a closure plan and reviewing such plan with the British Columbia Ministry of Environment, or “MOE”. However, the MOE, in conjunction with the provincial pulp and paper industry, is in the process of developingSince a standard for landfill closures. In addition, the portion of the older landfill owned by an adjacent sawmill continues to be active. Accordingly,active, the mill has not been able to move forward with the closure. We currently believe we mayexpect to receive provincial regulatory approval for suchour closure plan for our older landfill in 20092012 and intend to commence closure activities thereafter. We currently estimatebased on a timetable agreed to by both Celgar and the MOE. The cost of closing the landfill atis expected to be approximately €1.6 million but since the closure program for the old landfill has not been finalized or approved, there can be no assurance that the decommissioning of the old landfill will not exceed such cost estimate.
€2.1 million.Future regulations or permits may place lower limits on allowable types of emissions, including air, water, waste and hazardous materials, and may increase the financial consequences of maintaining compliance with environmental laws and regulations or conducting remediation. Our ongoing monitoring and policies have enabled us to develop and implement effective measures to maintain emissions in substantial compliance with environmental laws and regulations to date in a cost-effective manner. However, there can be no assurances that this will be the case in the future.
Climate Change
There are numerous differing scientific studies and opinions relating to the severity, extent and speed at which climate change is or may be occurring. As a result, we are currently unable to identify and predict all of the specific consequences of climate change on our business and operations.
To date, the potential and/or perceived effects of climate change and social and governmental responses to it have created both business opportunities and the potential for negative consequences for our business.
The focus on climate change has generated a substantial increase in demand and in legislative requirements for “carbon neutral” or “green” energy in both Europe and, increasingly, in North America. Pulp mills consume wood residue, being wood chips and pulp logs, as the base raw material for their production process. Wood chips are residue left over from lumber production and pulp logs are generally lower quality logs left over from logging that are unsuitable for the production of lumber.
As part of their production process, our mills take wood residue and process it through a digester where cellulose is separated from the wood to be used in pulp production and the remaining residue, called “black liquor”, is used for green energy production. As a result of their use of wood residue and because our mills generate combined heat and power, they are efficient producers of energy. This energy is carbon neutral and produced from a renewable source. Our relatively modern mills generate a substantial amount of energy that is surplus to their requirements.
These factors, along with governmental initiatives in respect of renewable or green energy legislation, have provided business opportunities for us to enhance our generation and sales of green energy and to participate in the sale of emission allowances under the EU ETS. In January 2012, we announced a project at our Stendal mill to install a new 40 MW steam turbine which we expect will initially produce an additional 109,000 MWh of surplus renewable energy at the mill.
Currently, we are exploring other initiatives to enhance our generation and sales of surplus green energy. Other potential opportunities that may result from climate change include:
the expansion of softwood forests and increased growth rates for such forests;
20
more intensive forestry practices and timber salvaging versus harvesting standing timber;
greater demand for sustainable energy and cellulosic biomass fuels; and
additional governmental incentives and/or legislative requirements to enhance biomass energy production.
At this time, we cannot predict which, if any, of these potential opportunities will be available to or realized by us or their economic effect on our business.
While all of the specific consequences to our business from climate change are not yet predictable, the most visible negative consequence is that the focus on renewable energy will continue to create greater demand for the wood residuals or fiber that is consumed by our mills as part of their production process.In Germany since 2006, the price and supply of wood residuals have been affected by an increasing demand from alternative or renewable energy producers and governmental initiatives for carbon neutral energy. Over the long term, this non-traditional demand for fiber is expected to increase in Europe. Additionally, the growing interest and focus in British Columbia for renewable green energy is also expected to create additional competition for such fiber in that region over time. Such additional demand for wood residuals may increase the competition and prices for wood residuals over time. See “—Operating Costs—Fiber”.Governmental action or legislation may also have an important effect on the demand and prices for wood residuals. As governments pursue green energy initiatives, they risk creating incentives and demand for wood residuals from renewable energy producers that “cannibalizes” or adversely affects existing traditional users, such as lumber and pulp and paper producers. We are continually engaged in dialogue with government to educate and try to ensure potential initiatives recognize the traditional and continuing role of our mills in the overall usage of forestry resources and the economies of local communities.
Other potential negative consequences from climate change over time that may affect our business include:
a greater susceptibility of northern softwood forest to disease, fire and insect infestation;
the disruption of transportation systems and power supply lines due to more severe storms;
the loss of water transportation for logs and our finished goods inventories due to lower water levels;
decreases in quantity and quality of processed water for our mill operations;
the loss of northern softwood boreal forests in areas in sufficient proximity to our mills to competitively acquire fiber; and
lower harvest levels decreasing the supply of harvestable timber and, as a consequence, wood residuals.
Human Resources
We currently employ approximately 1,5151,495 people. We have approximately 1,0941,039 employees working in our German operations, including our transportation and sales subsidiaries. In addition, there are approximately 1817 people working at the office we maintain in Vancouver, British Columbia, Canada. Celgar currently employs approximately 403439 people in its operations, the vast majority of which are unionized.
Rosenthal, which employs approximately 444 people, is bound by collective agreements negotiated with Industriegewerkschaft Bergbau, Chemie, Energie, or “IGBCE”, a national union that represents pulp and paper
workers. We are currently negotiatingIn December 2011, we successfully negotiated a new agreement with IGBCE to replacesubstantially upon the labor contract which expired at the end of 2008. We expect that this agreement will be concluded on similarsame terms as the priorprevious labor contract. The new collective agreement and will provideprovided for a one-time payment of €200 per employee, an approximately 3.0% wage increase in 2009. Although we consider our relationship with our Rosenthal employees to be good, we can provide no assurance that2012 and a newfurther 1.6% wage increase in 2013. This collective agreement will be settled for the Rosenthal mill without significant work stoppages or disruptions.
has an 18-month term and is scheduled to expire in May 2013.Stendal and its subsidiaries employ approximately 632589 people. Pursuant to the government grants and financing arranged in connection with theIn 2011, Stendal mill, we have agreed with German state authorities to maintain this number of jobs until September 2010. Stendal has not yet entered into anya seven-year collective agreementsagreement with IGBCE although it may do soeffective July 2011. Since, prior to entering into this collective agreement, Stendal’s employees had relatively lower wages compared to their peers at other German pulp mills, this agreement provides for an approximately 5.5% wage increase in the future.
2012. The collective agreement provides for a further 2.5% minimum annual wage increase from 2013 to 2015. The collective agreement is scheduled to expire in 2018.We consider the relationships with our employees to be good. We have implemented profit sharing plans, training programs and early retirement schemes for the benefit of our German employees. Although no assurances can be provided, we have not had any significant work stoppages at any of our German operations and we would therefore expect to enter into labor agreements with our pulp workers in Germany without any significant work stoppages at our German mills.
We have negotiated a new four-year collective agreement, effective May 1, 2008, with our hourly workers at the Celgar mill to replace the collective agreement which expired on April 30, 2008. The agreement providesprovided for a retroactive wage increase of 2.0% for 2008, a wage increase of 2.5% in each of 2009 and 2010 and a wage increase of 3.0% in 2011.
We consider the relationships with our employees at our Celgar mill to be good. Although no assurances can be provided, we have not had any significant work stoppages at our Celgar mill and we would therefore expect to enter into further labor agreements with our Celgar mill’s employees without any significant work stoppages.
Description of Certain Indebtedness
The following summaries of certain material provisions of: (i) our senior notes;Senior Notes; (ii) our convertible notes; (iii) the Stendal Loan Facility, including the recent amendment thereto;Facility; (iii) our new €17.0 million amortizing term facility at our Stendal mill; (iv) the working capital facilities and investment loan associated with our Rosenthal Loan Facility;mill; and (v) the Celgar Working Capital Facility, (asas such terms are referred to below),below, are not complete and these provisions, including definitions of certain terms, are qualified by reference to the applicable documents and the applicable amendments to such documents on file with the U.S. Securities and Exchange Commission, orreferred to as the “SEC”.
In conjunction with the acquisition of the Celgar mill and the repayment of Rosenthal’s then project loan facility, in February 2005,November 2010, we issued $310.0$300.0 million in aggregate principal amount of senior notes,9.5% Senior Notes due 2017, referred to as the “Senior Notes” to principally refinance our 9.25% Senior Notes due 2013, referred to as the “2013 Senior Notes”. The Senior Notes bear interest at thea rate of 9.25%9.5% per annum, payable semi-annually in arrears on February 15December 1 and August 15 of each year the notes are outstanding.June 1, commencing June 1, 2011. The Senior Notes mature on February 15, 2013.December 1, 2017. The Senior Notes are our senior unsecured obligations and, accordingly, will rank junior in right of payment to all existing and future secured indebtedness and all indebtedness and liabilities of our subsidiaries, equal in right of payment with all of our existing and future unsecured senior indebtedness and senior in right of payment to the 8.5% convertible senior subordinated notes due 2010 and any future subordinated indebtedness. We may redeem theThe Senior Notes on or after February 15, 2009, in whole or in part, at the applicable redemption prices plus accrued and unpaid interest, if any, to the redemption date. In certain circumstances, we may also redeem up to 35% of the aggregate principal amount of the notes at a redemption price of 109.35% of the principal amount, plus accrued and unpaid interest, if any, to the redemption date with the net cash proceeds of certain equity offerings. The notes were issued under an indenture which, among other things, restricts our ability and the ability of our restricted subsidiaries under the indenture to: (i) incur additional indebtedness or issue preferred stock; (ii) pay dividends or make other distributions to our stockholders; (iii) purchase or redeem capital stock or subordinated indebtedness (unless there is no default and such purchase or redemption involves our convertible notes and the daily closing sale price per share of our common
21
stock on the NASDAQ Global Market for a period of at least ten consecutive trading days exceeds 120% of the then applicable conversion price of such convertible notes);indebtedness; (iv) make investments; (v) create liens and enter into sale and lease back transactions; (vi) incur restrictions on the ability of our restricted subsidiaries to pay dividends or make other payments to us; (vii) sell assets; (viii) consolidate or merge with or into other companies or transfer all or substantially all of our assets; and (ix) engage in transactions with affiliates. These limitations are subject to other important qualifications and exceptions.
In order to take into account the nature of the non-recourse “project financing” of the loan facility for our Stendal mill and to enhance our financing flexibility, the indenture governing our senior notesSenior Notes provides for a “restricted group”“Restricted Group” and an “unrestricted group”. The terms of the indenture are applicable to the restricted groupRestricted Group and are generally not applicable to the unrestricted group. Currently, the restricted groupRestricted Group is comprised of Mercer Inc., the Rosenthal and Celgar mills and certain holding subsidiaries. The restricted groupRestricted Group excludes our Stendal mill. The working capital facilities at our Rosenthal and Celgar mills and our Convertible Notes and Senior Notes are obligations of the restricted group.Restricted Group. The Stendal Loan Facility is an obligation of our unrestricted group.
Convertible Notes
In October 2003,the third quarter of 2011, we issued $82.5purchased and cancelled approximately $13.6 million in aggregate principal amount of 8.5% convertible senior subordinated notes due 2010, referred to as the “Convertible Notes”. Inour Senior Notes in connection with our share and debt repurchase program. As at December 2006, we purchased and cancelled an31, 2011, approximately $286.4 million in aggregate of approximately $15.2 million principal amount of such notes in exchange for approximately 2.2 million shares of our common stock.
We pay interest semi-annually on the Convertible Notes on April 15 and October 15 of each year, beginning on April 15, 2004. The Convertible Notes mature on October 15, 2010. The Convertible Notes are redeemable on and after October 15, 2008, at any time in whole or in part, at our option on not less than 20 and not more than 60 days’ prior notice at a redemption price equal to 100% of the principal amount thereof plus accrued and unpaid interest, if any, to, but not including, the date of redemption, subject to the restrictions in the indenture governing the notes.
The Convertible Notes are convertible, at the option of the holder, unless previously redeemed, at any time on or prior to maturity into our common shares at a conversion price of $7.75 per share, which is equal to a conversion rate of approximately 129 shares per $1,000 principal amount of Convertible Notes, subject to adjustment.
Holders of the Convertible Notes have the right to require us to purchase all or any part of the Convertible Notes 30 business days after the occurrence of a change of control with respect to us at a purchase price equal to the principal amount thereof plus accrued and unpaid interest, if any, to the date of purchase.
The Convertible Notes are unsecured obligations of Mercer Inc. and are subordinated in right of payment to existing and future senior indebtedness (including our Senior Notes described above) and are effectively subordinated to all of the indebtedness and liabilities of our subsidiaries. The indenture governing the Convertible Notes limits the incurrence by us, but not our subsidiaries, of senior indebtedness.
remained outstanding.Stendal Loan Facility
In August 2002, Stendal entered into a senior €828.0 million project finance facility, referred to as the “Stendal Loan Facility”. The Stendal Loan Facility is divided intowas comprised of several tranches which cover,covered, among other things, project construction and development costs, financing andstart-up costs and working capital, as well as the financing of athe debt service reserve account, or “DSRA”, approved cost overruns and a revolving loan facility that covered time lags for receipt of grant funding and value-added tax refunds, in the amount of €160.0 million, which has been repaid. The DSRA is an account maintained to hold and, if needed, pay up to one year’s principal and interest due under the facility as partial security for the lenders. Other than the revolving working capital tranche, no further advances are currently available under the Stendal Loan Facility.
Pursuant to the Stendal Loan Facility, interest was to accrueaccrues at variable rates between Euribor plus 0.60%0.90% and Euribor plus 1.55%1.69% per year. The facility provides for Stendal to manage its risk exposure to interest rate risk, currency risk and pulp price risk by way of interest rate swaps, Euro and U.S. dollar swaps and pulp hedging transactions, subject to certain controls, including certain maximum notional and at-risk amounts. Pursuant to the terms of the facility, in 2002 Stendal entered into interest rate swap agreements in respect of borrowings to fix most
22
of the interest costs under the Stendal Loan Facility at a rate of 5.28% commencing May 2004, plus an applicable margin, until final payment in October 2017. For more information, see “Item 7A — Quantitative and Qualitative Disclosures about Market Risk”.
Pursuant to the terms of the Stendal Loan Facility, Stendal reduced the aggregate advances outstanding to €531.1 million at the end of 2008 from a maximum original amount of €638.0 million. The tranches are generally repayable in installments and mature between the fifth and 15th anniversary of the first advance under the Stendal Loan Facility for project construction.
Facility.In February 2009, we completed an agreement with Stendal’s lending syndicate to amend the Stendal Loan Facility, referred to as the “Amendment”. The Amendment is subject to customary conditions precedent, which are expected to be completed on or before March 15, 2009. Pursuant to the Amendment, Stendal’s obligation to repay €164.0 million of scheduled principal payments, referred to as the “Deferred Amount”, is deferred until maturity of the facility in September 2017. Until the Deferred Amount is repaid in full, Stendal may not make distributions, in the form of interest and capital payments on shareholder debt or dividends on equity invested, to its shareholders, including us. The Amendment also provides for a 100% cash sweep, referred to as the “Cash Sweep”, of any excess cash of Stendal which will be used first to fund the DSRA to a level sufficient to service the amounts due and payable under the Project FinanceStendal Loan AgreementFacility during the then following 12 months, or “Fully Funded”, and second to prepay the Deferred Amount. Not included in the Cash Sweep is an amount of €15.0 million which Stendal is permitted to retain for working capital purposes.
The DSRA balance as at December 31, 2011 was approximately €31.8 million.The Amendment implementsimplemented a permitted leverage ratio of total debt under the Stendal Loan Facility to EBITDA, or “Senior Debt/EBITDA Cover Ratio”, which isto be effective from December 31, 2009 and is set to decline over time from 13.0x on its effective date to 4.5x on June 30, 2017. Subsequently, Stendal’s lending syndicate waived compliance with the permitted leverage ratio for the year ended December 31, 2009. The Amendment also
revises the Stendal Loan Facility’s annual debt service cover ratio, or “Annual Debt Ratio”, requirement to be at least 1.1x for the period from December 31, 2011 to December 31, 2013 and 1.2x from January 1, 2014 until Maturity.
The Amendment includes the following as events of default:
| | |
| | • | | if scheduled debt service for two consecutive half-year periods is partially or wholly financed by drawings from the DSRA and as a result the DSRA is less than 331/3% Fully Funded; |
|
| • | if the DSRA is fully drawn and Stendal exercises its current6-month principal payment deferral right in respect of the next repayment date; and |
|
| • | failure to meet the Senior Debt/EBITDA Cover Ratio or Annual Debt Ratio as set out above. |
if the DSRA is fully drawn and Stendal exercises its current 6-month principal payment deferral right in respect of the next repayment date; and
failure to meet the Senior Debt/EBITDA Cover Ratio or Annual Debt Ratio as set out above.
The Amendment provides that Stendal and its shareholders may, once per fiscal year, cure a deficiency in eithereach of the Annual Debt Ratio or the Senior Debt/EBITDA Cover Ratio by way of a capital contribution or fully subordinated shareholder loan to Stendal in the amount necessary to cure such deficiency and thereby prevent the occurrence of an event of default.
Our ability to fund this cure is substantially limited by the terms of the Senior Notes.Under the terms of the Amendment, if, from December 31, 2011 until the date when all of the loans pursuant to the Stendal Loan Facility are repaid in full, we raise aggregate actual net proceeds of €20.0 million or more from an equity financing (subject to certain exceptions) and the DSRA is not Fully Funded, it will constitute an event of default will occur if we do notfail to contribute 50% of the net proceeds raised by such a sale or issuance to Stendal’s capital (up to an aggregate limit of €10.0 million to the capital of Stendal.
million).The tranches under the Stendal Loan Facility are severally guaranteed by German federal and state governments in respect of an aggregate of 80% of the principal amount of these tranches. Under the guarantees, the German federal and state governments that provide the guarantees are responsible for the performance of our payment obligations for the guaranteed amounts. Such governmental guarantees permit the Stendal Loan Facility to benefit from lower interest costs and other credit terms than would otherwise be available.
unavailable. The Stendal Loan Facility is secured by substantially all of the assets of Stendal.
As at December 31, 2011, the principal amount outstanding under the Stendal Loan Facility was €477.5 million. In order to permit Stendal to enter into the Blue Mill Facility (as described below), the Stendal Loan Facility was amended. In particular, the funds in the DSRA may now be used to bridge any deficiency in funding for Project Blue Mill, payments to Stendal’s capital reserves are no longer an equity cure measure under the Stendal Loan Facility and the Stendal Loan Facility now has a cross-default provision with the Blue Mill Facility.
In connection with the Stendal Loan Facility, we entered into a shareholders’ undertaking agreement, referred to as the “Undertaking”, dated August 26, 2002, as amended, with Stendal’s then minority shareholders and the lenders in order to finance the shareholders’ contribution to the Stendal mill. Under the terms of the Undertaking,
23
we have agreed, for as long as Stendal has any liability under the Stendal Loan Facility, to HVB, to retain control over at least 51% of the voting shares of Stendal.
Project Blue Mill Facility
In January 2012, our Stendal mill entered into a new €17.0 million amortizing term facility, referred to as the “Blue Mill Facility”, to finance Project Blue Mill. The Blue Mill Facility, 80% of which is guaranteed by the State of Saxony-Anhalt, bears interest at a rate of Euribor plus 3.5% per annum and is scheduled to mature in September 2017. The Blue Mill Facility’s annual debt service cover ratio and permitted ratio of total debt to EBITDA are identical to the Annual Debt Ratio and the Senior Debt/EBITDA Cover Ratio in the Stendal Loan Facility (including cure provisions). The Blue Mill Facility will be repaid in nine half-yearly installments, together with accrued interest commencing September 30, 2013 and will be non-recourse to Mercer Inc.
Rosenthal Loan FacilityFacilities
In February 2005,August 2009, Rosenthal established arefinanced its then current revolving working capital facility with a new €25.0 million facility, referred to as the “Rosenthal Loan Facility”, to replace its prior project financing facility.. The €40.0 million revolving working capital facility for the Rosenthal millLoan Facility consists of a revolving credit facility which may be utilized by way of cash advances or advances by way of letter of credit or bank guarantees. The facility matures in February 2010.December 2012. The interest payable on cash advances is LIBOR or EURIBOREuribor plus 1.55%3.5%, plus certain other costs incurred by the lenders in connection with the facility. Each cash advance is to be repaid on the last day of the respective interest period and in full on the termination date and each advance by way of a letter of credit or bank guarantee shall be repaid on the applicable expiry date of such letter of credit or bank guarantee. An interest period for cash advances shall be one, three six or 12six months or any other period as Rosenthal and the lenders may determine. There is also a 0.35%1.1% per annum commitment fee on the unused and uncancelled amount of the revolving facility which is payable quarterlysemi-annually in arrears. This facility is secured by a first fixed chargeranking security interest on the inventories, receivables and accounts of Rosenthal. It also provides Rosenthal with a hedging facility relating to the hedging of the interest, currency and pulp prices as they affect Rosenthal pursuant to a strategy agreed to by Rosenthal and the lender from time to time.
In August 2009, we also finalized a €4.4 million investment loan agreement, referred to as the “Investment Loan Agreement”, with a lender, relating to the new wash press at our Rosenthal mill. The four-year amortizing investment loan bears interest at the rate of Euribor plus 2.75%. Borrowings under this agreement are secured by the new wash press equipment.
In the first quarter of 2010, we entered into an additional €3.5 million revolving credit facility for our Rosenthal mill which bears interest at the rate of Euribor plus 3.5%. As of December 31, 2011, the total amount of funds available under the working capital facilities associated with the Rosenthal mill was €26.3 million and we owed €2.7 million under the Investment Loan Agreement.
Celgar Working Capital Facility
In May 2006,November 2009, Celgar established aamended and restated its C$40.0 million revolving working capital credit facility, referred to as the “Celgar Working Capital Facility”,. The Celgar Working Capital Facility matures in May 2013 and is available by way of: (i) Canadian and U.S. denominated advances which bear interest at a designated prime rate plus 2.0% for Canadian advances and at a designated base rate plus 2.0% per annum for U.S. advances; (ii) banker’s acceptance equivalent loans which bear interest at the applicable Canadian dollar bankers’ acceptance rate plus 3.75% per annum; and/or (iii) LIBOR advances which bear interest at the applicable LIBOR plus 3.75% per annum. The Celgar Working Capital Facility also incorporates a C$3.0 million letter of credit sub line. Celgar is also required to replace an existingpay a 0.5% per annum standby fee monthly in arrears on any unutilized portion of the revolving facility. In January 2009, we extended the maturity date of this facility from May 2009 to May 2010. Availability of drawdowns under the facility is subject to a borrowing base limit that is based upon the Celgar mill’s eligible accounts receivable and inventory levels from time to time. The revolving facility is available by way of: (i) Canadian and U.S. denominated advances which bear interest at a designated prime rate plus 0.50% for Canadian advances and at a designated base rate plus 0.50% per annum for U.S. advances; (ii) banker’s acceptance equivalent loans which bear interest at the applicable Canadian dollar bankers’ acceptance rate plus 2.25% per annum;and/or (iii) LIBOR advances which bear interest at the applicable LIBOR plus 2.25% per annum. The facility incorporates two sub lines, a $2.0 million letter of credit sub line and a $3.0 million foreign exchange contract sub line. Under these sub lines the lender will provide letters of credit guarantees and foreign exchange contract guarantees up to a maximum of $2.0 million and $3.0 million, respectively, subject, in each case, to the facility limit and payment of applicable fees. Celgar is also required to pay a 0.25% per annum standby fee monthly in arrears on any unutilized portion of the revolving facility. The Celgar Working Capital Facility is secured by, among other things, a first fixed charge on the current assets of Celgar.
As at December 31, 2011, C$38.3 million of funds were available under the Celgar Working Capital Facility.
Discontinued Operations
In August 2006, we divested our equity interest in the Heidenau paper mill and Landqart AG for cash proceeds of €5.0 million and a secured note of €5.0 million. In November 2006, we sold substantially all of the assets comprising the Fährbrücke paper mill. We recorded an aggregate net loss of €6.0 million on the disposal of these assets which included an accrual of €1.9 million for net costs expected in connection with funding and other commitments related to the Fährbrücke sale.
Additional Information
We make available free of charge on or through our website atwww.mercerint.com annual reports onForm 10-K, quarterly reports onForm 10-Q and current reports onForm 8-K, and all amendments to these reports, as soon as reasonably practicable after we file these materials with the SEC. The public may read and copy any material we file with the SEC at the SEC’s Public Reference Room at 100 F Street, NE, Washington, DC 20549. The public may also obtain information on the operation of the Public Reference Room by calling the SEC at1-800-SEC-0330. The SEC maintains an internet site at www.sec.gov that also contains our current and periodic reports, including our proxy and information statements.
24
The statements in this “Risk Factors” section describe material risks to our business and should be considered carefully. You should review carefully the risk factors listed below, as well as those factors listed in other documents we file with the SEC. In addition, these statements constitute our cautionary statements under thePrivate Securities Litigation Reform Act of 1995. Our disclosure and analysis in this annual report onForm 10-K and in our annual report to shareholders contain some forward-looking statements that set forth anticipated results based on management’s current plans and assumptions.
There are a number of important factors, many of which are beyond our control that could cause actual conditions, events or results to differ significantly from those described in the forward-looking statements. These factors include, statements regarding:but are not limited to, the following:
the highly cyclical nature of our business;
our level of indebtedness could negatively impact our financial condition and results of operations;
| | |
| • | our markets; |
|
| • | demand and prices for our products; |
|
| • | raw material costs and supply; |
|
| • | energy prices, sales and our initiatives to enhance sales of surplus energy; |
|
| • | capital expenditures; |
|
| • | the economy; |
|
| • | foreign exchange rates — particularly the U.S. dollar and Canadian dollar; |
|
| • | our level of indebtedness; and |
|
| • | derivatives. |
a weak global economy could adversely affect our business and financial results and have a material adverse effect on our liquidity and capital resources;
cyclical fluctuations in the price and supply of our raw materials could adversely affect our business;
we operate in highly competitive markets;
we are exposed to currency exchange rate and interest rate fluctuations;
increases in our capital expenditures or maintenance costs could have a material adverse effect on our cash flow and our ability to satisfy our debt obligations;
we use derivatives to manage certain risks which has caused significant fluctuations in our operating results;
we are subject to extensive environmental regulation and we could have environmental liabilities at our facilities;
our business is subject to risks associated with climate change and social government responses thereto;
Project Blue Mill might not generate the results we expect;
we are subject to risks related to our employees;
we rely on German federal and state government grants and guarantees;
risks relating to our participation in the EU ETS, and the application of Germany’s Renewable Energy Act;
we are dependent on key personnel;
we may experience material disruptions to our production;
we may incur losses as a result of unforeseen or catastrophic events, including the emergence of a pandemic, terrorist attacks or natural disasters;
our insurance coverage may not be adequate; and
we rely on third parties for transportation services.
From time to time, we also provide forward-looking statements in other materials we release as well as oral forward-looking statements. Such statements give our current expectations or forecasts of future events; they do not relate strictly to historical or current facts.
Statements in the future tense, and all statements accompanied by terms such as “may”, “will”, “believe”, “project”, “expect”, “estimate”, “assume”, “intend”, “anticipate”, “plan”, and variations thereof and similar terms are intended to be forward-looking statements as defined by federal securities law. You can find examples of these statements throughout this annual report onForm 10-K, including in the description of business in “Item 1. Business” and “Item 7. Management’s Discussion and Analysis of Financial Condition and Results of Operations”. While these forward-looking statements reflect our best estimates when made, the following risk factors could cause actual results to differ materially from estimates or projections.
We intend that all forward-looking statements we make will be subject to safe harbor protection of the federal securities laws pursuant to Section 27A of theSecurities Act of 1933, as amended (the “Securities Act”) and Section 21E of theSecurities Exchange Act of 1934, as amended (the “Exchange Act”).
You should consider the limitations on, and risks associated with, forward-looking statements and not unduly rely on the accuracy of predictions contained in such forward-looking statements. As noted above, these forward-looking statements speak only as of the date when they are made. We do not undertake any obligation to update forward-looking statements to reflect events, circumstances, changes in expectations, or the occurrence of unanticipated events after the date of those statements. Moreover, in the future, we may make forward-looking statements that involve the risk factors and other matters described in this document as well as other risk factors subsequently identified.
Our business is highly cyclical in nature.
The pulp business is highly cyclical in nature and markets for our principal products are characterized by periods of supply and demand imbalance, which in turn affects product prices. Pulp markets are highly competitive and are sensitive to cyclical changes in the global economy, industry capacity and foreign exchange rates, all of which can have a significant influence on selling prices and our operating results. The length and magnitude of industry cycles have varied over time but generally reflect changes in macro economicmacro-economic conditions and levels of industry capacity.
25
Industry capacity can fluctuate as changing industry conditions can influence producers to idle production capacity or permanently close machines or entire mills. In addition, to avoid substantial cash costs in idling or closing a mill, some producers will choose to operate at a loss, sometimes even a cash loss, which can prolong weak pricing environments due to oversupply. Oversupply of our products can also result from producers introducing new capacity in response to favorable pricing trends.
Demand for pulp has historically been determined primarily by the level of economic growth and has been closely tied to overall business activity. From 2006 to mid-2008, pulp prices steadily improved. However, the global economic crisis in the latter half of 2008 the current global economic crisis has resulted in a sharp decline of pulp prices from a high of €900 per ADMT to €635 per ADMT at the end of 2008. There may be further price deteriorationPulp prices began to increase in the future.second half of 2009 and continued to increase to record levels through June of 2010, before declining slightly in the fourth quarter of 2010. Pulp prices again rebounded to record levels in the first half of 2011 but declined sharply in the latter part of the year, primarily due to economic uncertainty in Europe and credit tightening in China. We cannot predict the length or severityimpact of the currentsustained economic downturn and its continuing impactweakness on lowerthe demand and prices for our product.
products.Prices for pulp are driven by many factors outside our control, and we have little influence over the timing and extent of price changes, which are often volatile. Because market conditions beyond our control determine the price for pulp, such pulpprices may fall below our cash production costs, requiring us to either incur short-term losses on product sales or cease production at one or more of our manufacturing facilities.mills. Therefore, our profitability depends on managing our cost structure, particularly raw materials which represent a significant component of our operating costs and can fluctuate based upon factors beyond our control. If the prices of our products decline, or if prices for our raw materials increase, or both, our results of operations and cash flows could be materially adversely affected.
Our level of indebtedness could negatively impact our financial condition and results of operations.
As of December 31, 2008,2011, we had approximately €820.3€734.1 million of indebtedness outstanding, of which €531.1€477.5 million relates to the Stendal Loan Facility. We may also incur additional indebtedness in the future. Our high debt levels may have important consequences for us, including, but not limited to the following:
our ability to obtain additional financing for working capital, capital expenditures, general corporate and other purposes or to fund future operations may not be available on terms favorable to us or at all;
a significant amount of our operating cash flow is dedicated to the payment of interest and principal on our indebtedness, thereby diminishing funds that would otherwise be available for our operations and for other purposes;
| | |
| • | our ability to obtain additional financing for working capital, capital expenditures, general corporate and other purposes or to fund future operations may not be available on terms favorable to us or at all; |
|
| • | a significant amount of our operating cash flow is dedicated to the payment of interest and principal on our indebtedness, thereby diminishing funds that would otherwise be available for our operations and for other purposes; |
|
| • | increasing our vulnerability to current and future adverse economic and industry conditions; |
|
| • | a substantial decrease in net operating cash flows or increase in our expenses could make it more difficult for us to meet our debt service requirements, which could force us to modify our operations; |
|
| • | our leveraged capital structure may place us at a competitive disadvantage by hindering our ability to adjust rapidly to changing market conditions or by making us vulnerable to a downturn in our business or the economy in general; |
|
| • | causing us to offer debt or equity securities on terms that may not be favorable to us or our shareholders; |
|
| • | limiting our flexibility in planning for, or reacting to, changes and opportunities in our business and our industry; and |
|
| • | our level of indebtedness increases the possibility that we may be unable to generate cash sufficient to pay the principal or interest due in respect of our indebtedness. |
increasing our vulnerability to current and future adverse economic and industry conditions;
a substantial decrease in net operating cash flows or increase in our expenses could make it more difficult for us to meet our debt service requirements, which could force us to modify our operations;
our leveraged capital structure may place us at a competitive disadvantage by hindering our ability to adjust rapidly to changing market conditions or by making us vulnerable to a downturn in our business or the economy in general;
causing us to offer debt or equity securities on terms that may not be favorable to us or our shareholders;
limiting our flexibility in planning for, or reacting to, changes and opportunities in our business and our industry; and
our level of indebtedness increases the possibility that we may be unable to generate cash sufficient to pay the principal or interest due in respect of our indebtedness.
The indenture relating togoverning our Senior Notes and our bank credit facilities contain restrictive covenants which impose operating and other restrictions on us and our subsidiaries. These restrictions will affect, and in many respects will limit or prohibit, our ability to, among other things, incur or guarantee additional indebtedness or enter into sale/leaseback transactions, pay dividends or make distributions on capital stock or redeem or repurchase capital stock, make investments or acquisitions, create liens and enter into mergers, consolidations or transactions with affiliates. The terms of our indebtedness also restrict our ability to sell certain assets, apply the proceeds of such sales and reinvest in our business.
26
Failure to comply with the covenants in the indenture relating to our Senior Notes or in our bank credit facilities could result in events of default and could have a material adverse effect on our liquidity, results of operations and financial condition.
Our ability to repay or refinance our indebtedness will depend on our future financial and operating performance. Our performance, in turn, will be subject to prevailing economic and competitive conditions, as well as financial, business, legislative, regulatory, industry and other factors, many of which are beyond our control. Our ability to meet our future debt service and other obligations, in particular the Stendal project debt,Loan Facility, may depend in significant part on the extent to which we can implement successfully our business strategy. We cannot assure you that we will be able to implement our strategy fully or that the anticipated results of our strategy will be realized.
TheA weakening of the global economic crisiseconomy could adversely affect our business and financial results and have a material adverse effect on our liquidity and capital resources.
As widely reported,Global financial markets in the United States, Europe and Asia experienced extreme and unprecedented disruption in the second half of 2008, including, among other things, extreme volatility in security prices, severely diminished liquidity and credit
availability, rating downgrades of certain investments and declining valuations of others. Such crisis has now broadenedAlthough financial markets have stabilized and is impacting other sectorsthe modest global economic recovery which emerged in the second half of 2009 largely continued through 2011, the overall state of the global economy resulting in an extremely difficult market environment for many businesses, including our own. As a result,remains generally weak and we areremain subject to a number of risks associated with these adverse economic conditions.
Price appreciation in 2010 and the first half of 2011 has been due in significant part to demand from China and other Asian countries, and any reduction in demand in these locations could exacerbate the impact of economic weakness elsewhere.Principally, as pulp demand has historically been determined by the level of economic growth and business activity, and the recent financial market disruptions have led to slowdowns in world economies, demand and prices for our product have historically decreased substantially and may continue to decrease further.during economic slowdowns. Additionally, restricted credit availability restrains our customers’ ability or willingness to purchase our products resulting in lower revenues. Restricted credit availability also can restrict us in the way we operate our business, our level of inventories and the amount of capital expenditures we may undertake. Depending on their severity and duration, the effects and consequences of the financial market turmoil and widera global economic downturn could have a material adverse effect on our liquidity and capital resources, including our ability to raise capital, if needed, the ability of banks to honor draws on our credit facilities, orand otherwise negatively impact our business and financial results.
The timing and nature of any recovery in the financial markets or in the general global economic situation remains uncertain, and there can be no assurance that market conditions will improve in the near future. We are unable to predict the likely duration and severity of the current disruption in financial markets and adverse economic conditions on world economies and pulp markets.
Prolonged depressed pulp prices may cause us to take production downtime at our mills.
If prolonged depressed pulp prices render operations at any one of our mills uneconomical we may be forced to take production downtime. During such temporary shutdowns we would be required to continue to expend capital to maintain the mill and equipment. In addition, we could incur significant labor costs if we are required to give employees notice prior to any layoff.
If one of our mills is shut down, it may experience prolonged startup periods, ranging from several days to several weeks. The shutdown of any one of our mills for a substantial period of time could have a material adverse effect on our financial condition and results of operations.
In the current economic conditions and weak pulp price and demand environment, there can be no assurance that we will be able to generate sufficient cash flows to service, repay or refinance debt.
In light of the current state of the world economy and tight credit markets, challenging operating environment and current weakness in pulp demand and prices, there can be no assurance that we will be able to generate sufficient cash flows to service, repay or refinance our outstanding indebtedness when it matures. In particular, if we are forced to take production downtime at any of our mills as a result of the weak pulp pricing environment, this could have a material adverse effect on cash flows and impair our ability to service and repay debt.
27
Our shares may be delisted from the NASDAQ Global Market if the closing price for our shares is not maintained at $1.00 per share or higher.
NASDAQ imposes, among other requirements, listing maintenance standards as well as minimum bid and public float requirements. The price of our shares must trade at or above $1.00 to comply with NASDAQ’s minimum bid requirement for continued listing on the NASDAQ Global Market. In recent months, our shares have traded at below $1.00 per share at closing for an extended period of time.
In response to current market conditions, NASDAQ has suspended its enforcement of the rules regarding a minimum closing bid price until April 20, 2009. If the closing bid price of our shares continues to fail to meet NASDAQ’s minimum bid price requirement for 30 consecutive business days on or after April 20, 2009, or such later date to which NASDAQ may extend its suspension of this requirement, of if we otherwise fail to meet all other applicable requirements of the NASDAQ Global Market, NASDAQ may make a determination to delist our common shares. Any such delisting could adversely affect the market liquidity of our shares and the market price of our shares could decrease and could also adversely affect our ability to obtain financing or refinancing for the continuation of our operationsand/or result in the loss of confidence by stakeholders.
If our shares were threatened with delisting from The NASDAQ Global Market, we may, depending on the circumstances, seek to extend the period for regaining compliance with NASDAQ listing requirements by moving our shares to The NASDAQ Capital Market, or we may pursue other strategic alternatives to meet the continuing listing standards. In addition, we may maintain our listing on the Toronto Stock Exchange.
Cyclical fluctuations in the price and supply of our raw materials could adversely affect our business.
Our main raw material is fiber in the form of wood chips and pulp logs. Such fiber is cyclical in terms of both price and supply. The cost of wood chips and pulp logs is primarily affected by the supply and demand for lumber. Demand for these raw materials is generally determined by the volume of pulp and paper products produced globally and regionally. Since 2006, highgenerally higher energy prices, a focus on, and governmental initiatives related to, “green” or renewable energy have led to an increase in renewable energy projects in Europe, including Germany. Demand for wood residuals from such energy producers, combined with lower harvesting rates, has generally put upward pressure on prices for wood residuals such as wood chips in Germany and its neighboring countries. This has resulted in higher fiber costs for our German mills and such trend could continue to put further upward pressure on wood chip prices although declining energy pricesprices.
Similarly, North American sawmill activity declined significantly during the recession, reducing the supply of chips and weakening economies in the latter partavailability of 2008 have tempered such demand. Similarly,pulp logs to our Celgar mill. Additionally, North American energy producers are exploring the viability of renewable energy initiatives and governmental initiatives in this field are increasing, all of which could lead to higher demand for sawmill residual fiber, including chips. The cyclical nature of pricing for these raw materials represents a potential risk to our profit margins if pulp producers are unable to pass along price increases to their customers.
customers or we cannot offset such costs through higher prices for our surplus energy.We do not own any timberlands or have any long-term governmental timber concessions nor doand we currently have anyfew long-term fiber contracts at our German operations. Raw materials are available from a number of suppliers and we have not historically experienced material supply interruptions or substantial sustained price increases, however our requirements have increased and may continue to increase as we increase capacity through capital projects or other efficiency measures at our mills. As a result, we may not be able to purchase sufficient quantities of these raw materials to meet our production requirements at prices acceptable to us during times of tight supply. In addition, the quantity, quality and price of fiber we receive could be reducedaffected as a result of industrial disputes, material curtailments or shut-down of operations by suppliers, government orders and legislation (including new taxes or tariffs), weather conditions, acts of god and other events beyond our control. An insufficient supply of fiber or reduction in the quality of fiber we receive would materially adversely affect our business, financial condition, results of operations and cash flow. In addition to the supply of wood fiber, we are dependent on the supply of certain chemicals and other inputs used in our production facilities. Any disruption in the supply of these chemicals or other inputs could affect our ability to meet customer demand in a timely manner and could harm our reputation. Any material increase in the cost of these chemicals or other inputs could have a material adverse effect on our business, results of operations, financial condition and cash flows.
28
We operate in highly competitive markets.
We sell our pulp globally, with a large percentage sold in Europe, North America and Asia. The markets for pulp are highly competitive. A number of other global companies compete in each of these markets and no company holds a dominant position. Our pulp is considered a commodity because many companies produce similar and largely standardized products. As a result, the primary basis for competition in our markets has been price. Many of our competitors have greater resources and lower leverage than we do and may be able to adapt more quickly to industry or market changes or devote greater resources to the sale of products than we can. There can be no assurance that we will continue to be competitive in the future. The global pulp market has historically been characterized by considerable swings in prices which have and will result in variability in our earnings. Prices are typically denominated in U.S. dollars.
We are exposed to currency exchange rate and interest rate fluctuations.
In 2008, theThe majority of our sales wereare in products quoted in U.S. dollars while most of our operating costs and expenses, other than those of the Celgar mill, wereare incurred in Euros. In addition, all of the products sold by the Celgar mill are quoted in U.S. dollars and the Celgar mill costs are primarily incurred in Canadian dollars. Our results of operations and financial condition are reported in Euros. As a result, our revenues are adversely affected by a decrease in the value of the U.S. dollar relative to the Euro and to the Canadian dollar. Such shifts in currencies relative to the Euro and the Canadian dollar reduce our operating margins and the cash flow available to fund our operations and to service our debt. This could have a material adverse effect on our business, financial condition, results of operations and cash flows.
In 2002, Stendal entered intovariable-to-fixed interest rate swaps to fix interest payments under the Stendal mill financing facility, which has kept Stendal from benefiting from the general decline in interest rates that ensued. These derivatives are marked to market at the end of each reporting period and all unrealized gains and losses are recognized inas earnings or losses for the relevant reporting periods.
Increases in our capital expenditures or maintenance costs could have a material adverse effect on our cash flow and our ability to satisfy our debt obligations.
Our business is capital intensive and requires that we regularly incur capital expenditures to maintain our equipment, improve efficiencies and comply with environmental laws. Our annual capital expenditures may vary due to fluctuations in requirements for maintenance, business capital, expansion and as a result of changes to environmental regulations that require capital expenditures to bring our operations into compliance with such regulations. In addition, our senior management and board of directors may approve projects in the future that will require significant capital expenditures. Increased capital expenditures could have a material adverse effect on our cash flow and our ability to satisfy our debt obligations. Further, while we regularly perform maintenance on our manufacturing equipment, key pieces of equipment in our various production processes may still need to be repaired or replaced. If we do not have sufficient funds or such repairs or replacements are delayed, the costs of repairing or replacing such equipment and the associated downtime of the affected production line could have a material adverse effect on our business, financial condition, results of operations and cash flows.
We use derivatives to manage certain risk which has caused significant fluctuations in our operating results.
We use derivative instruments to limit our exposure to interest rate fluctuations. Concurrently with entering into the Stendal financing, Stendal entered intovariable-to-fixed rate interest swaps for the full term of theour Stendal Loan Facility to manage its interest rate risk exposure with respect to the full principal amount of this facility.
Because we effectively fixed the rate on our Stendal Loan Facility, the value of our derivative position moves inversely to interest rates.We record unrealized gains or losses on our derivative instruments when they are marked to market at the end of each reporting period and realized gains or losses on them when they are settled. These unrealized and
realized gains and losses can materially impact our operating results for any reporting period. For example, our operating results for 20082011 included an unrealized net lossesloss of €25.2€1.4 million on our interest rate derivative.derivative, while our operating results for 2010 included an unrealized net gain of €1.9 million. For 2007,2009, our operating results included realized andan unrealized net gainsloss of €20.4€5.8 million on our currency and interest rate
29
derivatives. Our operating results for 2006 included realized and unrealized net gains of €105.8 million on currency and interest rate derivatives.
derivative.If any of the variety of instruments and strategies we utilize are not effective, we may incur losses which may have a materially adverse effect on our business, financial condition, results of operations and cash flow. Further, we may in the future use derivative instruments to manage pulp price risks. The purpose of our derivative activity may also be considered speculative in nature; we do not use these instruments with respect to any pre-set percentage of revenues or other formula, but either to augment our potential gains or reduce our potential losses depending on our perception of future economic events and developments.
We are subject to extensive environmental regulation and we could have environmental liabilities at our facilities.
Our operations are subject to numerous environmental laws as well as permits, guidelines and policies. These laws, permits, guidelines and policies govern, among other things:
unlawful discharges to land, air, water and sewers;
waste collection, storage, transportation and disposal;
| | |
| • | unlawful discharges to land, air, water and sewers; |
|
| • | waste collection, storage, transportation and disposal; |
|
| • | hazardous waste; |
|
| • | dangerous goods and hazardous materials and the collection, storage, transportation and disposal of such substances; |
|
| • | theclean-up of unlawful discharges; |
|
| • | land use planning; |
|
| • | municipal zoning; and |
|
| • | employee health and safety. |
dangerous goods and hazardous materials and the collection, storage, transportation and disposal of such substances;
the clean-up of unlawful discharges;
employee health and safety.
In addition, as a result of our operations, we may be subject to remediation, clean up or other administrative orders or amendments to our operating permits, and we may be involved from time to time in administrative and judicial proceedings or inquiries. Future orders, proceedings or inquiries could have a material adverse effect on our business, financial condition and results of operations. Environmental laws and land use laws and regulations are constantly changing. New regulations or the increased enforcement of existing laws could have a material adverse effect on our business and financial condition. In addition, compliance with regulatory requirements is expensive, at times requiring the replacement, enhancement or modification of equipment, facilities or operations. There can be no assurance that we will be able to maintain our profitability by offsetting any increased costs of complying with future regulatory requirements.
We are subject to liability for environmental damage at the facilities that we own or operate, including damage to neighboring landowners, residents or employees, particularly as a result of the contamination of soil, groundwater or surface water and especially drinking water. The costs of such liabilities can be substantial. Our potential liability may include damages resulting from conditions existing before we purchased or operated these facilities. We may also be subject to liability for any offsite environmental contamination caused by pollutants or hazardous substances that we or our predecessors arranged to transport, treat or dispose of at other locations. In addition, we may be held legally responsible for liabilities as a successor owner of businesses that we acquire or have acquired. Except for Stendal, our facilities have been operating for decades and we have not done invasive testing to determine whether or to what extent environmental contamination exists. As a result, these businesses may have liabilities for conditions that we discover or that become apparent, including liabilities arising from
non-compliance with environmental laws by prior owners. Because of the limited availability of insurance coverage for environmental liability, any substantial liability for environmental damage could materially adversely affect our results of operations and financial condition.
30
Enactment of new environmental laws or regulations or changes in existing laws or regulations might require significant capital expenditures. We may be unable to generate sufficient funds or access other sources of capital to fund unforeseen environmental liabilities or expenditures.
Our business is subject to risks associated with climate change and social and government responses thereto.
Currently, there are differing scientific studies and opinions relating to the severity, extent and speed at which climate change is or may be occurring around the world. As a result, we are currently unable to identify and predict all of the specific consequences of climate change on our business and operations.
To date, the potential and/or perceived effects of climate change and social and government responses to it have created both opportunities, such as enhanced sales of surplus “green” energy, and risks for our business.
While all of the specific consequences from climate change are not yet predictable, we are subject to risks that government and social focus on and demand for “carbon neutral” or “green” energy will create greater demand for the wood residuals or fiber that is consumed by our pulp mills as part of their production process. In addition, governmental initiatives or legislation may also increase both the demand and prices for wood residuals. As governments pursue green energy initiatives, they may implement financial, tax, pricing or other legislated incentives for renewable energy producers that “cannibalize” or materially adversely affect fiber supplies for existing traditional users, such as lumber and pulp and paper producers.
Such additional demand for wood residuals and/or governmental initiatives may materially increase the competition and prices for wood residuals over time. This could increase our fiber costs and/or restrict our ability to acquire fiber at competitive prices or at all during times of shortages. If our fiber costs increase and we cannot pass on these costs to our customers or offset them through higher prices for our sales of surplus energy, it will negatively affect our operating margins, results of operations and financial position. If we cannot obtain the fiber required to operate our mills, we may have to curtail and/or shut down production. This could have a material adverse effect on operations, financial results and financial position.
Other potential risks to our business from climate change include:
a greater susceptibility of northern softwood forest to disease, fire and insect infestation, which could diminish fiber availability;
the disruption of transportation systems and power supply lines due to more severe storms;
the loss of water transportation for logs and our finished goods inventories due to lower water levels;
decreases in quantity and quality of processed water for our mill operations;
the loss of northern softwood boreal forests in areas in sufficient proximity to our mills to competitively acquire fiber; and
lower harvest levels decreasing the supply of harvestable timber and, as a consequence, wood residuals.
The occurrence of some or all of these events could have a material adverse effect on our operations and/or financial results.
Project Blue Mill may not generate the results or benefits we expect.
Project Blue Mill is subject to customary risks and uncertainties inherent for large capital projects which could result in the project not completing on schedule or as budgeted. The Stendal mill could experience
operating difficulties or delays during the start-up period when the new 40 MW turbine is being ramped up. Project Blue Mill may not increase the Stendal mill’s pulp production and energy generating capacity to the levels we had planned. Cost overruns, equipment breakdowns or failures to perform to design specifications could have a material adverse effect on our Stendal mill’s results of operations and financial performance.
We are subject to risks related to our employees.
The majority of our employees are unionized. In the futureunionized and we may enter into ahave collective agreementagreements in place with our pulp workersemployees at the Stendal mill. The collective agreements relating to hourly workers at bothall of our Rosenthal and Celgar mills expired in 2008. We are currently negotiating a new agreement with our Rosenthal employees and havemills. In September 2008, we negotiated a new four-year collective agreement, effective May 1, 2008, with the hourly workers at our Celgar mill and, in December 2010, we entered into our current collective agreement with our Rosenthal employees. In July 2011, we entered into a collective agreement with our pulp workers at the Stendal mill. Although we have not experienced any work stoppages in the past, there can be no assurance that we will be able to negotiate acceptable collective agreements or other satisfactory arrangements with our employees upon the expiration of our collective agreements or in conjunction with the establishment of a new agreement or arrangement with our pulp workers at the Stendal mill.agreements. This could result in a strike or work stoppage by the affected workers. The registration or renewal of the collective agreements or the outcome of our wage negotiations could result in higher wages or benefits paid to union members. Accordingly, we could experience a significant disruption of our operations or higher on-going labor costs, which could have a material adverse effect on our business, financial condition, results of operations and cash flow.
The Celgar Energy Project may not generate the results or benefits we expect.
The Celgar Energy Project is subject to customary risks and uncertainties inherent for large capital projects which could result in the project not completing on schedule or as budgeted. Delays to Celgar receiving any operating permits or any required amendments to such permits could result in construction delays, operational deficiencies or funding shortfalls. Furthermore, the Celgar mill could experience operating difficulties or delays during thestart-up period when production of “green” energy is being ramped up. The Celgar Energy Project may not achieve our planned power generation or the level required under the electricity purchase agreement concluded with British Columbia’s principal power authority.
We rely on German federal and state government grants and guarantees.guarantees and participate in European statutory programs.
We currently benefit from a subsidized capital expenditure program and lower cost of financing as a result of German federal and state government grants and guarantees at our Stendal mill. Should either the German federal or state governments be prohibited from honoring legislative grants and guarantees at Stendal, or should we be required to repay any such legislative grants, this may have a material adverse effect on our business, financial condition, results of operations and cash flow.
The EU ETS and Germany’s Renewable Energy Act.
Since 2005, our German mills have benefitted from sales of emission allowances under the EU ETS.Emissions Trading Scheme. As a result of our Rosenthal and Stendal mills’ recently commenced participation ineligibility for special tariffs under the Renewable Energy Act, the amount of emissions allowances granted to our German mills under the EU ETS may be reduced or ourhas been reduced. Additionally, all such German mills may cease to be eligible at all for participation under the EU ETS.
Additionally, the Renewable Energy Actlegislation is subject to governmental amendmentsamendment or change which could adversely affect the eligibility of our Rosenthal and Stendal mills to participate in this statutory programand/or the tariffs paid thereunder. As a result we cannot predict with any certainty the amount of future sales of surplus energy we may be able to generate.
We are dependent on key personnel.
Our future success depends, to a large extent, on the efforts and abilities of our executive and senior mill operating officers. Such officers are industry professionals many of whom have operated through multiple business cycles. Our officers play an integral role in, among other things:
31
reducing operating costs;identifying capital projects which provide a high rate of return; and
prioritizing expenditures and maintaining employee relations.
| | |
| • | reducing operating costs; |
|
| • | identifying capital projects which provide a high rate of return; and |
|
| • | prioritizing expenditures and maintaining employee relations. |
The loss of one or more of our officers could make us less competitive in these areas which could materially adversely affect our business, financial condition, results of operations and cash flows. We do not maintain any key person life insurance for any of our executive or senior mill operating officers.
We may experience material disruptions to our production.
A material disruption at one of our manufacturing facilities could prevent us from meeting customer demand, reduce our pulp and energy salesand/or negatively impact our results of operations. Any of our mills could cease operations unexpectedly due to a number of events, including:
unscheduled maintenance outages;
prolonged power failures;
| | |
| • | unscheduled maintenance outages; |
|
| • | prolonged power failures; |
|
| • | equipment failure; |
|
| • | design error or operator error; |
|
| • | chemical spill or release; |
|
| • | explosion of a boiler; |
|
| • | disruptions in the transportation infrastructure, including roads, bridges, railway tracks and tunnels; |
|
| • | fires, floods, earthquakes or other natural catastrophes; |
|
| • | labor difficulties; and |
|
| • | other operational problems. |
design error or employee or contractor error;
chemical spill or release;
disruptions in the transportation infrastructure, including roads, bridges, railway tracks, tunnels, canals and ports;
fires, floods, earthquakes or other natural catastrophes;
prolonged supply disruption of major inputs;
other operational problems.
Any such downtime or facility damage could prevent us from meeting customer demand for our productsand/or require us to make unplanned capital expenditures. If any of our facilities were to incur significant downtime, our ability to meet our production capacity targets and satisfy customer requirements would be impaired and could have a material adverse effect on our business, financial condition, results of operations and cash flows.
We may incur losses as a result of unforeseen or catastrophic events, including the emergence of a pandemic, terrorist attacks or natural disasters.
The occurrence of unforeseen or catastrophic events, including the emergence of a pandemic or other widespread health emergency (or concerns over the possibility of such an emergency), terrorist attacks or natural disasters, could create economic and financial disruptions, could lead to operational difficulties (including travel limitations) that could impair our ability to manage or operate our business and adversely affect our results of operations.
Our insurance coverage may not be adequate.
We have obtained insurance coverage that we believe would ordinarily be maintained by an operator of facilities similar to our mills. Our insurance is subject to various limits and exclusions. Damage or destruction to our facilities could result in claims that are excluded by, or exceed the limits of, our insurance coverage. Additionally, the currentweak global and financial crisis is affecting the availability of insurance coverage and, in particular,markets have also reduced the availability and extent of credit insurance and there can be no assurance thatfor our customers. If we will be able to maintaincannot obtain adequate credit insurance for our customers, we may be forced to amend or curtail our planned operations on commercially acceptable terms or at all.
32
We rely on third parties for transportation services.
Our business primarily relies upon third parties for the transportation of pulp to our customers, as well as for the delivery of our raw materials to our mills. Our pulp and raw materials are principally transported by truck,
barge, rail and sea-going vessels, all of which are highly regulated. Increases in transportation rates can also materially adversely affect our results of operations.
Further, if our transportation providers fail to deliver our pulp in a timely manner, it could negatively impact our customer relationships and we may be unable to sell it at full value. If our transportation providers fail to deliver our raw materials in a timely fashion, we may be unable to manufacture pulp in response to customer orders. Also, if any of our transportation providers were to cease operations, we may be unable to replace them at a reasonable cost. The occurrence of any of the foregoing events could materially adversely affect our results of operations.
Washington State law and our Articles of Incorporation may have anti-takeover effects which will make an acquisition of our Company by another company more difficult.
We are subject to the provisions of the Revised Code of Washington, Chapter 23B.19, which prohibits a Washington corporation, including our Company, from engaging in any business combination with an “acquiring person” for a period of five years after the date of the transaction in which the person became an acquiring person, unless the business combination is approved in a prescribed manner. A business combination includes mergers, asset sales as well as certain transactions resulting in a financial benefit to the acquiring person. Subject to certain exceptions, an “acquiring person” is a person who, together with affiliates and associates, owns, or within five years did own, 10% or more of the corporation’s voting stock. We may in the future adopt certain measures that may have the effect of delaying, deferring or preventing a change in control of our Company. Under Washington State law, we have the ability to adopt certain of these measures, including, without limitation, a shareholder rights plan, without any further vote or action by the holders of our shares. These measures may have anti-takeover effects, which may delay, defer or prevent a takeover attempt that a holder of our shares might consider in its best interest.
ITEM 1B. UNRESOLVED STAFF COMMENTS.
| ITEM 1B. | UNRESOLVED STAFF COMMENTS. |
None.
ITEM 2. PROPERTIES
We lease offices in Vancouver, British Columbia, Seattle, Washington, and in Berlin, Germany. We own the Rosenthal and Celgar mills and the underlying property. The Stendal mill is situated on property owned by Stendal, our 70.6%74.9% owned subsidiary.
The Rosenthal mill is situated on a 220 acre site near the town of Blankenstein in the state of Thüringia, approximately 300 kilometers south of the Stendal mill.Berlin. The Saale river flows through the site of the mill. In late 1999, we completed a major capital project which converted the Rosenthal mill to the production of kraft pulp. It is a single line mill with a current annual production capacity of approximately 325,000345,000 ADMTs of kraft pulp. The mill is self-sufficient in steam and electrical power. Some excess electrical power which is constantly generated is sold to the regional power grid. The facilities at the mill include:
| | |
| • | an approximately 315,000 square feet fiber storage area; |
|
| • | barking and chipping facilities for pulp logs; |
|
| • | an approximately 300,000 square feet roundwood yard; |
|
| • | a fiber line, which includes a Kamyr continuous digester and bleaching facilities; |
|
| • | a pulp machine, which includes a dryer, a cutter and a bailing line; |
|
| • | an approximately 63,000 square feet finished goods storage area; |
|
| • | a chemical recovery system, which includes a recovery boiler, evaporation plant and recausticizing plant; |
|
| • | a fresh water plant; |
33
barking and chipping facilities for pulp logs;an approximately 300,000 square feet roundwood yard;
a fiber line, which includes a Kamyr continuous digester and bleaching facilities;
a pulp machine, which includes a dryer, a cutter and a baling line;
| | |
| • | a wastewater treatment plant; and |
|
| • | a power station with a turbine capable of producing 45 MW of electric power from steam produced by the recovery boiler. |
an approximately 63,000 square feet finished goods storage area;
a chemical recovery system, which includes a recovery boiler, evaporation plant and recausticizing plant;
a wastewater treatment plant; and
a power station with a turbine capable of producing 57 MW of electric power from steam produced by the recovery boiler and the power boiler.
The Stendal mill is situated on a 200 acre site owned by Stendal that is part of a larger 1,250 acre industrial park near the town of Stendal in the state of Saxony-Anhalt, approximately 300 kilometers north of the Rosenthal mill and 130 kilometers from the citywest of Berlin. The mill is adjacent to the Elbe river and has access to harbor facilities for water transportation. The mill is a single line mill with a current annual design production capacity of approximately 635,000645,000 ADMTs of kraft pulp. The Stendal mill is self-sufficient in steam and electrical power. Some excess electrical power which is constantly being generated is sold to the regional power grid. The facilities at the mill include:
an approximately 920,000 square feet fiber storage area;
debarking and chipping facilities for pulp logs;
| | |
| • | an approximately 920,000 square feet fiber storage area; |
|
| • | barking and chipping facilities for pulp logs; |
|
| • | a fiber line, which includes ten Superbatch digester and bleaching facilities; |
|
| • | a pulp machine, which includes a dryer, a cutter and a bailing line; |
|
| • | an approximately 108,000 square feet finished goods storage area; |
|
| • | a recovery line, which includes a recovery boiler, evaporation plant, recausticizing plant and lime kiln; |
|
| • | a fresh water plant; |
|
| • | a wastewater treatment plant; and |
|
| • | a power station with a turbine capable of producing approximately 100 MW of electric power from steam produced by the recovery boiler and a power boiler. |
a fiber line, which includes ten Superbatch digesters and bleaching facilities;
a pulp machine, which includes a dryer, a cutter and a baling line;
an approximately 108,000 square feet finished goods storage area;
a recovery line, which includes a recovery boiler, evaporation plant, recausticizing plant and lime kiln;
a wastewater treatment plant; and
a power station with a turbine capable of producing approximately 100 MW of electric power from steam produced by the recovery boiler and a power boiler.
The Celgar mill is situated on a 400 acre site near the city of Castlegar, British Columbia. The mill is located on the south bank of the Columbia River, approximately 600 kilometers east of the port city of Vancouver, British Columbia, and approximately 32 kilometers north of the Canada-U.S. border. The city of Seattle, Washington is approximately 650 kilometers southwest of Castlegar. It is a single line mill with a current annual production capacity of approximately 495,000520,000 ADMTs of kraft pulp. Internal power generating capacity could, with certain capital improvements, enableresulting from the completion of the Celgar Energy Project in 2010 enables the Celgar mill to be self-sufficient in electrical power and at times to sell surplus electricity. The facilities at the Celgar mill include:
chip storage facilities consisting of four vertical silos and an asphalt surfaced yard with a capacity of 200,000 cubic meters of chips;
a woodroom containing debarking and chipping equipment for pulp logs;
| | |
| • | chip storage facilities consisting of four vertical silos and an asphalt surfaced yard with a capacity of 200,000 cubic meters of chips; |
|
| • | a woodroom containing debarking and chipping equipment for pulp logs; |
|
| • | a fiber line, which includes a dual vessel hydraulic digester, pressure knotting and screening, single stage oxygen delignification and a four stage bleach plant; |
|
| • | two pulp machines, which each include a dryer, a cutter and a bailing line; |
|
| • | a chemical recovery system, which includes a recovery boiler, evaporation plant, recausticizing area and effluent treatment system; and |
|
| • | a turbine and generator capable of producing approximately 52 MW of electric power from steam produced by a recovery boiler and power boiler fueled by natural gas. |
a fiber line, which includes a dual vessel hydraulic digester, pressure knotting and screening, single stage oxygen delignification and a four stage bleach plant;
two pulp machines, which each include a dryer, a cutter and a baling line;
a chemical recovery system, which includes a recovery boiler, evaporation plant, recausticizing area and effluent treatment system; and
two turbines and generators capable of producing approximately 48 MW and 52 MW, respectively, of electric power from steam produced by a recovery boiler and power boiler.
At the end of 2008,2011, substantially all of the assets relating to the Stendal mill were pledged to secure the Stendal Loan Facility. The working capital loan facilities established for the Rosenthal and Celgar mills are secured by first charges against the inventories and receivables at the respective mills.
15d-15(e) under the Exchange Act), as of the end of the period covered by this annual report onForm 10-K. Disclosure controls and procedures include, without limitation, controls and procedures designed to ensure that information required to be disclosed in the reports we file or submit under the Exchange Act is accumulated and communicated to management, including our principal executive officer and principal financial officer, as appropriate, to allow timely decisions regarding required disclosure. Based on such evaluation, our principal executive officer and principal financial officer have concluded that, as of the end of the period covered by this report, our disclosure controls and procedures are effective in recording, processing, summarizing and reporting, on a timely basis, information required to be disclosed by us in the reports that we file or submit under the Exchange Act.
It should be noted that any system of controls is based in part upon certain assumptions designed to obtain reasonable (and not absolute) assurance as to its effectiveness, and there can be no assurance that any design will succeed in achieving its stated goals.
Management’s Report on Internal Control Over Financial Reporting
Our management is responsible for establishing and maintaining adequate internal control over financial reporting. Mercer Inc.’s internal control over financial reporting is designed to provide reasonable assurance regarding the reliability of financial reporting and the preparation of financial statements for external purposes in accordance with generally accepted accounting principles.
Our internal control over financial reporting includes those policies and procedures that:
Pertain to the maintenance of records that, in reasonable detail, accurately and fairly reflect the transactions and dispositions of the assets of Mercer;
Provide reasonable assurance that transactions are recorded as necessary to permit preparation of financial statements in accordance with generally accepted accounting principles, and that receipts and expenditures are being made only in accordance with authorizations of management and directors; and
| | |
| • | Pertain to the maintenance of records that, in reasonable detail, accurately and fairly reflect the transactions and dispositions of the assets of Mercer; |
|
| • | Provide reasonable assurance that transactions are recorded as necessary to permit preparation of financial statements in accordance with generally accepted accounting principles, and that receipts and expenditures are being made only in accordance with authorizations of management and directors; and |
|
| • | Provide reasonable assurance regarding prevention or timely detection of unauthorized acquisition, use or disposition of assets that could have a material effect on the financial statements. |
Provide reasonable assurance regarding prevention or timely detection of unauthorized acquisition, use or disposition of assets that could have a material effect on the financial statements.
Because of its inherent limitations, internal control over financial reporting may not prevent or detect misstatements. Also, projections of any evaluation of effectiveness to future periods are subject to the risk that controls may become inadequate because of changes in conditions, or that the degree or compliance with the policies or procedures may deteriorate.
Management assessed the effectiveness of Mercer Inc.’s internal control over financial reporting as of December 31, 2008.2011. In making this assessment, management used the criteria set forth inInternal Control-IntegratedControl—Integrated Framework, as issued by the Committee of Sponsoring Organizations of the Treadway Commission. Based on our assessment and those criteria, management believes that Mercer Inc. maintained effective internal control over financial reporting as of December 31, 2008.
2011.Mercer Inc.’s independent registered chartered accountants have audited and issued theiran audit report on management’s assessment of Mercer Inc.’s internal control over financial reporting, which appears below.
Changes in Internal Controls
There have been no changes in our internal control over financial reporting (as defined inRules 13a-15(f) and 15d-15(f) under the Exchange Act) during the year ended December 31, 20082011 that have materially affected, or are reasonably likely to materially affect, our internal control over financial reporting.
ITEM 9B. OTHER INFORMATION
| ITEM 9B. | OTHER INFORMATION |
Not applicable.
61
PART III
ITEM 10. DIRECTORS, EXECUTIVE OFFICERS AND CORPORATE GOVERNANCE
Subsequent to our Conversion to a corporate form, we| ITEM 10. | DIRECTORS, EXECUTIVE OFFICERS AND CORPORATE GOVERNANCE |
We are governed by a board of directors, referred to as the “Board”, each member of which is elected annually, beginning with our annual meeting held in 2007. Prior to the conversion, as a business trust, we were managed by trustees, who have comparable duties and responsibilities as directors of corporations. Each of our issued and outstanding shares of common stock is entitled to one vote at such meetings.annually. The following sets forth information relating to our directors and executive officers.
Jimmy S.H. Lee, age 51,54, has been a director since May 1985 and President and Chief Executive Officer since 1992. Previously, during the period that MFC Bancorp Ltd. was our affiliate, he served as a director from 1986 and President from 1988 to December 1996 when it was spun out. During Mr. Lee’s tenure with Mercer, we acquired the Rosenthal mill and converted it to the production of kraft pulp, constructed and commenced operations at the Stendal mill and acquired the Celgar mill.
Kenneth A. Shields, age 60, has been a director since August 2003. Mr. Shields is the Chairman and Chief Executive Officer of Conifex Inc., a private Canadian company pursuing acquisition opportunities in the forestry and sawmilling sector. Mr. Shields currently serves as a member of the board of directors of Raymond James Financial, Inc. and serves as the Chairman and a member of the board of directors of its Canadian subsidiary, Raymond James Ltd., since his retirement as Chief Executive Officer of Raymond James Ltd. in February 2006. Mr. Shields has served as past Chairman of the Investment Dealers Association of Canada and Pacifica Papers Inc., and is a former director of each of Slocan Forest Products Ltd., TimberWest Forest Corp. and the Investment Dealers Association of Canada.
William D. McCartney, age 53,56, has been a director since January 2003. Mr. McCartney has been President and Chief Executive Officer of Pemcorp Management Inc., a management services company, since 1990. Mr. McCartney has also served as a director of Exeter Resource Corporation since September 2005. Mr. McCartney is also a member of the Institute of Chartered Accountants in Canada.
Guy W. Adams, age 57,60, has been a director since August 2003. Mr. Adams is the managing member of GWA Advisors, LLC, GWA Investments, LLC and GWA Capital Partners, LLC, where he has served since 2002. GWA Investments is an investment fund investing in publicly traded securities managed by GWA Capital Partners, LLC, a registered investment advisor. Prior to 2002, Mr. Adams was the President of GWA Capital, which he founded in 1996 to invest his own capital in public and private equity transactions, and a business consultant to entities seeking refinancing or recapitalization. Mr. Adams has been a director of Vitesse Semiconductor Corp. since October 2007.
Eric Lauritzen, age 70,73, has been a director since June 2004. Mr. Lauritzen was President and Chief Executive Officer of Harmac Pacific, Inc., a North American producer of softwood kraft pulp previously listed on the Toronto Stock Exchange and acquired by Pope & Talbot Inc. in 1998, from May 1994 to July 1998, when he retired. Mr. Lauritzen was Vice President, Pulp and Paper Marketing of MacMillan Bloedel Limited, a North American pulp and paper company previously listed on the Toronto Stock Exchange and acquired by Weyerhaeuser Company Limited in 1999, from July 1981 to April 1994.
Graeme A. Witts, age 70,73, has been a director since January 2003. Mr. Witts organized Sanne Trust Company Limited, a trust company located in the Channel Islands, in 1988 and was managing director from 1988 to 2000, when he retired. He is now managing director of Azure Property Group, SA, a European hotel group. Mr. Witts is also a fellow of the Institute of Chartered Accountants of England and Wales and has previous executive experience with the ProctorProcter & Gamble Company and Clarks Shoes, as well as government auditing.
George Malpass,Bernard Picchi, age 69,62, has been a director since November 2006.June 2011. Mr. MalpassPicchi has been the Managing Director of Private Wealth Management for Palisade Capital Management, LLC since July 2009. Prior to 2009, Mr. Picchi has been an analyst and consultant for several mid-sized broker/dealers and investment advisory firms. In particular, from 1980 to 1999, Mr. Picchi was formerlyan All Star rated energy analyst at Solomon Brothers, Kidder Peabody and Lehman Brothers, where he also served as Director of U.S. Stock Research. Mr. Picchi has also been the sole manager of the 5-Star rated $1.5 billion Capital Appreciation Fund of Federated Investors, where he served as U.S. Director of Research from January 2000 to June 2002. Mr. Picchi is also a Chartered Financial Analyst.
James Shepherd, age 59, has been a director since June 2011. Mr. Shepherd was President and Chief Executive Officer of Canfor Corporation from 2004 to 2007 and Slocan Forest Products Ltd. from 1999 to 2004. Mr. Shepherd is also the former President of Crestbrook Forest Industries Ltd. and Finlay Forest Industries Limited and is the former Chairman of the Forest Products Association of Canada. Mr. Shepherd has been a director with Canfor Corporation, which is listed on the Toronto Stock Exchange, from 2004 to 2007 and has been a director of Primex Forest Products Ltd. andCanfor Pulp Income Fund from 2006 to 2007. Mr. Shepherd is also currently a former director of bothConifex Timber Inc., which is listed on the TSX Venture Exchange, and Buckman Laboratories International Forest Products Ltd. and Riverside Forest Products Ltd.
Inc.David M. Gandossi, age 51,54, has been Secretary, Executive Vice-President and Chief Financial Officer since August 15, 2003. Mr. Gandossi was formerly the Chief Financial Officer and Executive Vice-President of Formation Forest Products (a closely held corporation) from June 2002 to August 2003. Mr. Gandossi previously
62
served as Chief Financial Officer, Vice-President, Finance and Secretary of Pacifica Papers Inc., a North American specialty pulp and paper manufacturing company previously listed on the Toronto Stock Exchange, from December 1999 to August 2001 and Controller and Treasurer from June 1998 to December 1999. From June 1998 to August 31, 1998, he also served as Secretary to Pacifica Papers Inc. From March 1998 to June 1998, Mr. Gandossi served as Controller, Treasurer and Secretary of MB Paper Ltd. From April 1994 to March 1998, Mr. Gandossi held the position of Controller and Treasurer with Harmac Pacific Inc., a Canadian pulp manufacturing company previously listed on the Toronto Stock Exchange. Mr. Gandossi isparticipated in the Pulp and Paper Advisory Committee of the British Columbia Competition Council and was a member of the British Columbia government’s Working Roundtable on Forestry. From February 2007 to present, he has chaired the B.C. Pulp and Paper Task Force, a government industry and labor effort that is mandated to identify measures to improve the competitiveness of the British Columbia pulp and paper industry. Mr. Gandossi is a member of the Institute of Chartered Accountants in Canada.
Claes-Inge Isacson, age 63,66, has been our Chief Operating Officer since November 2006 and is based in our Berlin office. Mr. Isacson brings over 24 years of senior level pulp and paper management to our senior management team, with a focus on kraft pulp. Mr. Isacson held the positions of President Norske Skog Europe, and then Senior Vice President Production for Norske Skogindustrier ASA between 1989 and 2004. His most recent position was President, AF Process, a consulting and engineering company working worldwide. He holds a Masters of Science, Mechanical Engineering.
David K. Ure,Richard Short, age 41,44, has been our Vice President, Controller since October 16, 2006.December 2010, prior to which he was our Director, Corporate Finance, since joining Mercer in 2007. Prior to joining Mercer, Mr. UreShort was formerly the Controller, ofFinancial Reporting from 2006 to 2007 and Director, Corporate Finance from 2004 to 2006 with Catalyst Paper Corporation from 2001 to 2006 and Controller of Pacifica Papers Inc. from 2000 to 2001. He also served as U.S. Controller of Crown Packaging Ltd. in 1999 and the Chief Financial Officer and Secretary of Finlay Forest Industries Inc. from 1997 to 1998. He is on the Board of Trustees of the Pulp and Paper Industry Pension Plan and has over fifteen years experience in the forest products industry.Corp. Mr. UreShort is a member of the Certified General Accountants’ AssociationInstitute of Chartered Accountants in Canada.
Leonhard Nossol, age 51,54, has been our Group Controller for Europe since August 2005. He has also been a managing director of Rosenthal since 1997 and the sole managing director of Rosenthal since September 2005. Mr. Nossol had a significant involvement in the conversion of the Rosenthal mill to the production of kraft pulp in 1999 and increases in the mill’s annual production capacity to 325,000345,000 ADMTs, as well as the reduction in production costs at the mill.
David M. Cooper, age 55,58, has been Vice President of Sales and Marketing for Europe since June 2005. Mr. Cooper previously held a variety of senior positions around the world in Sappi Ltd., a large global forest products group, from 1982 to 2005, including the sales and marketing of various pulp and paper grades and the management of a manufacturing facility. He has more than 25 years of diversified experience in the international pulp and paper industry.
Eric X. Heine, age 45,48, has been Vice President of Sales and Marketing for North America and Asia since June 2005. Mr. Heine was previously Vice President Pulp and International Paper Sales and Marketing for Domtar Inc., a global pulp and paper corporation, from 1999 to 2005. He has over 18 years of experience in the pulp and paper industry, including developing strategic sales channels and market partners to build corporate brands.
Wolfram Ridder, age 47,50, was appointed Vice President of Business Development in August 2005, prior to which he was a managing director of Stendal. Mr. Ridder was the principal assistant to our Chief Executive Officer from November 1995 until September 2002.
Genevieve Stannus, age 38,41, has been our Treasurer since July 2005, prior to which she was a Senior Financial Analyst with Mercer from August 2003. Prior to joining Mercer, Ms. Stannus held Senior Treasury
Analyst positions with Catalyst Paper Corporation and Pacifica Papers Inc. She has over ten yearsyears’ experience in the forest products industry. Ms. Stannus is a member of the Certified General Accountants’ Association of Canada.
Niklaus Gruenenfelder, age 51,54, became the Managing Director of Stendal in January 2009. Previously, from 1989 until 2006, Mr. Gruenenfelder held a variety of positions in Switzerland, China, Germany and Pakistan with Swiss chemicals manufacturer Ciba Specialty Chemicals Holding Inc. (formerly Ciba-Geigy AG). In 2006, Huntsman Corporation, a global chemical and chemical products company, acquired the textile effects business from Ciba and Mr. Gruenenfelder was the
63
Managing Director and Head of Technical Operations at Huntsman’s Langweid am LeichLech plant in Germany from 2006 until he joined Mercer earlier this year.Mercer. Mr. Gruenenfelder holds a Ph.D. in Technical Science.
Science and an MBA.Brian Merwin, age 38, has been our Vice President of Strategic Initiatives since February 2009, prior to which he was our Director of Strategic and Business Initiatives since August 2007 and Business Analyst since May 2005. Mr. Merwin has an MBA from the Richard Ivey School of Business at the University of Western Ontario.
We also have experienced mill managers at all of our mills who have operated through multiple business cycles in the pulp industry.
The Board met 11eight times during 20082011 and each current member of the Board attended 75% or more of the total number of such meetings and meetings of the committees of the Board on which they serve during their term. In addition, our independent directors regularly meet in separate executive sessions without any member of our management present. The Lead Director presides over these meetings. Although we do not have a formal policy with respect to attendance of directors at our annual meetings, all directors are encouraged and expected to attend such meetings if possible. All of our directors attended our 20082011 annual meeting.
The Board has developed corporate governance guidelines in respect of: (i) the duties and responsibilities of the Board, its committees and officers; and (ii) practices with respect to the holding of regular quarterly and strategic meetings of the Board including separate meetings of non-management directors. The Board has established four standing committees, the Audit Committee, the Compensation and Human Resource Committee, the Governance and Nominating Committee and the Environmental, Health and Safety Committee.
The Audit Committee functions pursuant to a charter adopted by the directors. A copy of the current charter is incorporated by reference in the exhibits to thisForm 10-K and is available on our website atwww.mercerint.com under the “Governance” link. The function of the Audit Committee generally is to meet with and review the results of the audit of our financial statements performed by the independent public accountants and to recommend the selection of independent public accountants. The members of the Audit Committee are Mr. McCartney, Mr. WittsAdams and Mr. Lauritzen,Shepherd, each of whom is independent under applicable laws and regulations and the listing requirements of the NASDAQ Global Market. Both Mr. McCartney and Mr. Witts are Chartered Accountants and Mr. McCartney is a Chartered Accountant and a “financial expert” within the meaning of such term under theSarbanes-Oxley Act of 2002. The Audit Committee met 5four times during 2008.
2011.The Audit Committee has established procedures for: (i) the receipt, retention and treatment of complaints received by us regarding accounting, internal accounting controls or auditing matters; and (ii) the confidential and anonymous submission by our employees and others of concerns regarding questionable accounting or auditing matters. A person wishing to notify us of such a complaint or concern should send a written notice thereof, marked “Private & Confidential”, to the Chairman of the Audit Committee, Mercer International Inc., c/o Suite 2840, P.O. Box 11576, 6501120, 700 West GeorgiaPender Street, Vancouver, B.C.,V6B 4N8 Canada.
British Columbia, Canada V6C 1G8.Compensation and Human Resource Committee
The Board has established a Compensation and Human Resource Committee. The Compensation and Human Resource Committee is responsible for reviewing and approving the strategy and design of our compensation, equity-based and benefits programs. The Compensation and Human Resource Committee functions pursuant to a charter adopted by the directors, a copy of which is incorporated by reference in the exhibits to thisForm 10-K and is available on our website atwww.mercerint.com in the Corporate Governance Guidelines under the “Governance” link. The Compensation and Human Resource Committee is also responsible for approving all compensation actions relating to executive officers. The members of the Compensation and Human Resource Committee are Mr. Malpass,Witts, Mr. Lauritzen and Mr. Adams,Picchi, each of whom is independent under applicable laws and regulations and the listing requirements of the NASDAQ Global Market. The Compensation and Human Resource Committee met 4ten times during 2008.
2011.Governance and Nominating Committee
The Board has established a Governance and Nominating Committee comprised of Mr. Shields,Lauritzen, Mr. McCartney and Mr. Witts, each of whom is independent under applicable laws and regulations and the listing requirements of the NASDAQ Global Market. The Governance and Nominating Committee functions pursuant to a charter adopted by the directors, a copy of which is incorporated by reference in the exhibits to thisForm 10-K and is available on our website atwww.mercerint.com in the Corporate Governance Guidelines under the “Governance” link. The purpose of the committee is to: (i) manage the corporate governance system of the Board; (ii) assist the
64
Board in fulfilling its duties to meet applicable legal and regulatory and self-regulatory business principles and codes of best practice; (iii) assist in the creation of a corporate culture and environment of integrity and accountability; (iv) in conjunction with the Lead Director, monitor the quality of the relationship between the Board and management; (v) review management succession plans; (vi) recommend to the Board nominees for appointment to the Board; (vii) lead the Board’s annual review of the Chief Executive Officer’s performance; and (viii) set the Board’s forward meeting agenda. The Governance and Nominating Committee met 4seven times in 2008.
2011.Environmental, Health and Safety Committee
The Board established an Environmental, Health and Safety Committee in 2006, currently comprised of Mr. Lauritzen,Shepherd, Mr. MalpassLauritzen and Mr. Lee, to review on behalf of the Board the policies and processes implemented by management, and the resulting impact and assessments of all our environmental, health and safety related activities. The Environmental, Health and Safety Committee functions pursuant to a charter adopted by the directors, a copy of which is incorporated by reference in the exhibits to thisForm 10-K and is available on our website atwww.mercerint.com in the Corporate Governance Guidelines under the “Governance” link. More specifically, the Environmental, Health and Safety Committee is to: (i) review and approve, and if necessary revise, our environmental, health and safety policies and environmental compliance programs; (ii) monitor our environmental, health and safety management systems including internal and external audit results and reporting; and (iii) provide direction to management on the frequency and focus of external independent environmental, health and safety audits. The Environmental, Health and Safety Committee met 4four times in 2008.
2011.Lead Director/Deputy Chairman
The Board appointed Mr. ShieldsLauritzen as its interim Lead Director in September 2003 andJanuary 2012 to replace Kenneth Shields who resigned from the Board in 2006 as Deputy Chairman of the Board.2012. The role of the Lead Director is to provide leadership to the non-management directors on the Board and to ensure that the Board can operate independently of management and that directors have an independent leadership contact. The duties of the Lead Director include, among other things: (i) ensuring that the Board has adequate resources to support its decision-making process and ensuring that the Board is appropriately approving strategy and supervising management’s progress against that strategy; (ii) ensuring that the independent directors have adequate opportunity to meet to discuss issues without management being present; (iii) chairing meetings of directors in the absence of the Chairman and Chief
Executive Officer; (iv) ensuring that delegated committee functions are carried out and reported to the Board; and (v) communicating to management, as appropriate, the results of private discussions among outside directors and acting as a liaison between the Board and the Chief Executive Officer.
Code of Business Conduct and Ethics
The Board has adopted a Code of Business Conduct and Ethics that applies to our directors, employees and executive officers. The code is incorporated by reference in the exhibits to thisForm 10-K and is available on our website atwww.mercerint.com under the “Governance” link. A copy of the code may also be obtained without charge upon request to Investor Relations, Mercer International Inc., Suite 2840, P.O. Box 11576, 6501120, 700 West GeorgiaPender Street, Vancouver, British Columbia, Canada V6B 4N8V6C 1G8 (Telephone:(604) 684-1099) or Investor Relations, Mercer International Inc., 14900 Interurban Avenue South, Suite 282, Seattle WA, U.S.A. 98168 (Telephone:(206) 674-4639).
Section 16(a) Beneficial Ownership Reporting Compliance
SectionThe information required under “Section 16(a) ofBeneficial Ownership Reporting Compliance” is incorporated by reference from the Exchange Act requires thatproxy statement relating to our officers and directors and persons who own more than 10% of our shares file reports of ownership and changesannual meeting to be held in ownership2012, which will be filed with the SEC and furnish us with copies of all such reports that they file. Based solely upon a review of the copies of these reports received by us, and upon written representations by our directors and officers regarding their compliance with the applicable reporting requirements under Section 16(a) of the Exchange Act, we believe that allwithin 120 days of our directors and officers filed all required reports under Section 16(a) in a timely manner for the year ended December 31, 2008.
65
ITEM 11. EXECUTIVE COMPENSATION
| ITEM 11. | EXECUTIVE COMPENSATION |
The information required by this Item 11 is incorporated by reference from the proxy statement relating to our annual meeting to be held in 2009,2012, which will be filed with the SEC within 120 days of our most recently completed fiscal year.
| |
| ITEM 12. | SECURITY OWNERSHIP OF CERTAIN BENEFICIAL OWNERS AND MANAGEMENT AND RELATED STOCKHOLDER MATTERS |
The information required by this Item 12 is incorporated by reference from the proxy statement relating to our annual meeting to be held in 2009,2012, which will be filed with the SEC within 120 days of our most recently completed fiscal year.
| |
| ITEM 13. | CERTAIN RELATIONSHIPS AND RELATED TRANSACTIONS, AND DIRECTOR INDEPENDENCE |
Review, Approval or Ratification of Transactions with Related Persons
Pursuant to the terms of the Audit Committee Charter, the Audit Committee is responsible for reviewing and approving the terms and conditions of all proposed transactions between us, any of our officers, directors or directors,shareholders who beneficially own more than 5% of our outstanding shares of common stock, or relatives or affiliates of any such officers, directors or directors,shareholders, to ensure that such related party transactions are fair and are in our overall best interest and that of our shareholders. In the case of transactions with employees, a portion of the review authority is delegated to supervising employees pursuant to the terms of our written Code of Business Conduct and Ethics.
The Audit Committee has not adopted any specific procedures for conduct of reviews and considers each transaction in light of the facts and circumstances. In the course of its review and approval of a transaction, the Audit Committee considers, among other factors it deems appropriate:
Whether the transaction is fair and reasonable to us;
The business reasons for the transaction;
| | |
| • | Whether the transaction is fair and reasonable to us; |
|
| • | The business reasons for the transaction; |
|
| • | Whether the transaction would impair the independence of one of our non-employee directors; and |
|
| • | Whether the transaction is material, taking into account the significance of the transaction. |
Whether the transaction would impair the independence of one of our non-employee directors; and
Whether the transaction is material, taking into account the significance of the transaction.
Any member of the Audit Committee who is a related person with respect to a transaction under review may not participate in the deliberations or vote respecting approval or ratification of the transaction, provided, however, that such director may be counted in determining the presence of a quorum at a meeting of the committee that considers the transaction.
The information called for by ItemItems 404(a) and 407(a) ofRegulation S-K required to be included under this Item 13 is incorporated by reference from the proxy statement relating to our annual meeting to be held in 2009,2012, which will be filed with the SEC within 120 days of our most recently completed fiscal year.
ITEM 14. PRINCIPAL ACCOUNTANT FEES AND SERVICES
| ITEM 14. | PRINCIPAL ACCOUNTANT FEES AND SERVICES |
The information required by this Item 14 is incorporated by reference from the proxy statement relating to our annual meeting to be held in 2009,2012, which will be filed with the SEC within 120 days of our most recently completed fiscal year.
66
PART IV
ITEM 15. EXHIBITS, FINANCIAL STATEMENT SCHEDULES
(a) (1) Financial Statements
| ITEM 15. | EXHIBITS, FINANCIAL STATEMENT SCHEDULES |
| (a) (1) | Financial Statements |
| | |
1.1 | | Underwriting Agreement dated February 8, 2005 between Mercer International Inc. and RBC Capital Markets Corporation, on behalf of itself and CIBC World Markets Corp., Raymond James & Associates, Inc. and D.A. Davidson & Co. Incorporated by reference fromForm 8-K dated February 10, 2005. |
1.2 | | Underwriting Agreement dated February 8, 2005 among Mercer International Inc. and RBC Capital Markets Corporation and Credit Suisse First Boston LLC, on behalf of themselves and CIBC World Markets Corp. Incorporated by reference fromForm 8-K dated February 10, 2005. |
| 2.1 | | Agreement and Plan of Merger among Mercer International Inc., Mercer International Regco Inc. and Mercer Delaware Inc. dated December 14, 2005. Incorporated by reference to the Proxy Statement/Prospectus filed on December 15, 2005. |
| |
| 2.2 | | Support Agreement dated February 9, 2012 among Mercer International Inc. and Fibrek Inc. |
| |
| 3.1 | | Articles of Incorporation of the Company, as amended. Incorporated by reference fromForm 8-A dated March 1, 2006. |
| |
| 3.2 | | Bylaws of the Company. Incorporated by reference fromForm 8-A dated March 1, 2006. |
4.1* | |
| 4.1 | | First Supplemental Indenture dated March 1, 2006 to Indenture dated as of October 10, 2003November 17, 2010 between Mercer International Inc. and Wells Fargo Bank, N.A. |
4.2 | | Indenture dated as of December 10, 2004 between Mercer International Inc. and Wells Fargo Bank, N.A.National Association. Incorporated by reference fromForm S-3 filed December 10, 2004.8-K dated November 19, 2010. |
4.3 | | First Supplemental Indenture dated February 14, 2005 to Indenture dated December 10, 2004 between Mercer International Inc. and Wells Fargo Bank, N.A. Incorporated by reference fromForm 8-K dated February 17, 2005. |
| 10.1 | | Project Financing Facility Agreement dated August 26, 2002 between Zellstoff Stendal GmbH and Bayerische Hypo-und Vereinsbank AG, as amended by Amendment, Restatement and Undertaking Agreement dated February 3, 2009.January 31, 2009 and the Amendment Agreement dated January 20, 2012. |
| |
| 10.2 | | Project Blue Mill Financing Facility Agreement dated January 20, 2012 between Zellstoff Stendal GmbH and Unicredit Bank AG and IKB Deutsche Industriebank AG. |
| |
| 10.3 | | Shareholders’ Undertaking Agreement dated August 26, 2002 among Mercer International Inc., Stendal Pulp Holdings GmbH, RWE Industrie-Lösungen GmbH, AIG Altmark Industrie AG and FAHR Beteiligungen AG and Zellstoff Stendal GmbH and Bayerische Hypo-und Vereinsbank AG. IncorporatedAs amended by reference fromForm 8-Kthe Amendment Restatement and Undertaking Agreement dated September 10, 2002.January 20, 2012. |
10.3* | |
| 10.4 | | Shareholders’ Agreement dated August 26, 2002 among Zellstoff Stendal GmbH, Stendal Pulp Holdings GmbH, RWE Industrie-Lösungen GmbH and FAHR Beteiligungen AG. |
67
| | As amended by the Amendment Agreement dated January 20, 2012. |
10.4* | |
| 10.5* | | Contract for the Engineering, Design, Procurement, Construction, Erection andStart-Up of a Kraft Pulp Mill between Zellstoff Stendal GmbH and RWE Industrie-Lösungen GmbH dated August 26, 2002. Certain non-public information has been omitted from the appendices to Exhibit 10.1610.4 pursuant to a request for confidential treatment filed with the SEC. Such non-public information was filed with the SEC on a confidential basis. The SEC approved the request for confidential treatment in January 2004. |
10.5* | |
| 10.6* | | Form of Trustee’s Indemnity Agreement between Mercer International Inc. and its Trustees. |
10.6 | |
| 10.7 | | Employment Agreement dated for reference August 7, 2003 between Mercer International Inc. and David Gandossi. Incorporated by reference fromForm 8-K dated August 11, 2003. |
10.7 | | |
| |
| 10.8 | | Employment Agreement effective as of April 28, 2004 between Mercer International Inc. and Jimmy S.H. Lee. Incorporated by reference fromForm 8-K dated April 28, 2004. |
10.8 | |
| 10.9 | | 2004 Stock Incentive Plan. Incorporated by reference fromForm S-8 dated June 15, 2004. |
10.9 | |
| 10.10 | | Asset Purchase Agreement by and among Mercer International Inc., 0706906 B.C. Ltd. and KPMG Inc., as receiver of all of the assets and undertakings of Stone Venepal (Celgar) Pulp Inc. dated November 22, 2004.2010 Stock Incentive Plan. Incorporated by reference fromForm 8-KS-8 dated November 23, 2004.June 11, 2010. |
10.10 | |
| 10.11 | | Employment Agreement dated October 2, 2006 between Stendal Pulp Holding GmbH and Wolfram Ridder. Incorporated by reference from Form 8-K dated October 2, 2006. |
| |
| 10.12* | | Employment Agreement effective September 25, 2006 between Mercer International Inc. and Claes-Inge Isacson dated December 5, 2008. |
| |
| 10.13 | | Employment Agreement effective September 1, 2005 between Mercer International Inc. and Leonhard Nossol dated August 18, 2005. Incorporated by reference from Form 10-Q dated May 6, 2008. |
| |
| 10.14* | | Electricity Purchase Agreement effective January 27, 2009 between Zellstoff Celgar Limited Partnership and British Columbia Hydro and Power Authority. Certain non-public information has been omitted from the appendices to Exhibit 10.13 pursuant to a request for confidential treatment filed with the SEC. Such non-public information was filed with the SEC on a confidential basis. The SEC approved the request for confidential treatment in March 2009. |
| |
| 10.15* | | Revolving Credit Facility Agreement dated February 9, 2005August 19, 2009 among D&Z Holding GmbH, Zellstoff-und Papierfabrik Rosenthal GmbH, & Co. KG,D&Z Beteiligungs GmbH and ZPR BeteiligungsLogistik GmbH and Bayerische Hypo-und Vereinsbank AG. Incorporated by reference fromForm 8-K dated February 17, 2005.August 24, 2009. |
10.11 | |
| 10.16 | | Shareholders’ UndertakingLoan Agreement dated February 9, 2005 relating to Revolving Credit Facility Agreement.August 19, 2009 among Zellstoff-und Papierfabrik Rosenthal GmbH, as borrower, and Bayerische Hypo-und Vereinsbank Aktiengesellschaft, as lender. Incorporated by reference fromForm 8-K dated February 17, 2005.August 24, 2009. |
10.12 | |
| 10.17 | | Revolving TermAmended and Restated Credit FacilityAgreement dated for reference May 19, 2006as of November 27, 2009 among Zellstoff Celgar Limited Partnership, as borrower, and the lenders from time to time parties thereto, as lenders, and CIT Business Credit Canada Inc., as agent. Incorporated by reference fromForm 8-K dated MayNovember 30, 2006.2009. |
10.13 | |
| 10.18 | | EmploymentSpecial Warrant Agreement dated October 2, 2006 between Stendal Pulp Holding GmbH and Wolfram Ridder. Incorporated by reference fromForm 8-K dated October 2, 2006. |
10.14 | | Employment Agreement effective October 16, 2006 betweenas of February 9, 2012 among Mercer International Inc. and David Ure dated September 22, 2006. Incorporated by reference fromForm 8-K dated October 13, 2006.Fibrek Inc. |
10.15 | | Employment Agreement effective September 25, 2006 between Mercer International Inc. and Claes-Inge Isacson dated December 5, 2008. |
10.16 | | Employment Agreement effective September 1, 2005 between Mercer International Inc. and Leonhard Nossol dated August 18, 2005. Incorporated by reference fromForm 10-Q dated May 6, 2008. |
10.17*** | | Electricity Purchase Agreement effective January 27, 2009 between Zellstoff Celgar Limited Partnership and British Columbia Hydro and Power Authority. |
| 14 | | Code of Business Conduct and Ethics. Incorporated by reference from the definitive proxy statement on Schedule 14A dated August 11, 2003. |
99.1 | | Exchange Agreement dated December 4, 2006 between Mercer International Inc. and Nisswa Master Fund Ltd. Incorporated by reference fromForm 8-K dated December 5, 2006. |
99.2 | | Exchange Agreement dated December 4, 2006 between Mercer International Inc. and CC Arbitrage Ltd. Incorporated by reference fromForm 8-K dated December 5, 2006. |
99.399.1 | | Audit Committee Charter. Incorporated by reference from the definitive proxy statement on Schedule 14A dated April 28, 2005. |
99.4 | |
| 99.2 | | Governance and Nominating Committee Charter. Incorporated by reference from the definitive proxy statement on Schedule 14A dated April 28, 2004. |
| |
| 99.3 | | Exchange Agreement dated November 25, 2009 between Mercer International Inc. and IAT Reinsurance Co. Ltd. Incorporated by reference from Form 8-K filed November 27, 2009. |
| |
| 99.4 | | Exchange Agreement dated November 25, 2009 between Mercer International Inc. and Alden Global Distressed Opportunities Fund L.P. Incorporated by reference from Form 8-K filed November 27, 2009. |
| |
| 99.5 | | Exchange Agreement dated November 25, 2009 between Mercer International Inc. and Greenlight Capital Qualified LP, Greenlight Capital LP and Greenlight Capital Offshore Partners. Incorporated by reference from Form 8-K filed November 27, 2009. |
| |
| 21 | | List of Subsidiaries of Registrant. |
| | |
| |
| 23.1 | | Consent of Independent Registered Chartered Accountants — Accountants—PricewaterhouseCoopers LLP. |
23.2 | | Consent of Independent Registered Chartered Accountants — Deloitte & Touche LLP. |
| 31.1 | | Section 302 Certificate of Chief Executive Officer. |
| |
| 31.2 | | Section 302 Certificate of Chief Financial Officer. |
68
| | |
| 32.1** | | Section 906 Certificate of Chief Executive Officer. |
| |
| 32.2** | | Section 906 Certificate of Chief Financial Officer. |
| * | | |
* | | Filed inForm 10-K for prior years. |
|
| ** | | In accordance with Release33-8212 of the Commission, these Certifications: (i) are “furnished” to the Commission and are not “filed” for the purposes of liability under theSecurities Exchange Act of 1934, as amended, or the “Exchange Act”;Act; and (ii) are not to be subject to automatic incorporation by reference into any of our Company’s registration statements filed under the Securities Act as amended for the purposes of liability thereunder or any offering memorandum, unless our Company specifically incorporates them by reference therein. |
| | |
*** | | Pursuant to 17 CFR 240.24b-2, confidential information has been omitted and filed separately with the Commission pursuant to a confidential treatment application filed with the Commission. |
69
Report of Independent Registered Public Accounting Firm
INDEPENDENT AUDITORS’ REPORT
To the Shareholders and Board of Directors and Shareholders of
Mercer International Inc.
We have completed integrated audits of Mercer International Inc.’s 2008 and 2007 consolidated financial statements and of its internal control over financial reporting as at December 31, 2008. Our opinions, based on our audits, are presented below.
Consolidated financial statements
We have audited the accompanying consolidated balance sheets of Mercer International Inc. (the “company”) as atof December 31, 20082011 and December 31, 2007,2010 and the related consolidated statementstatements of operations, comprehensive income (loss), changes in shareholders’ equity and cash flows for each of the years in the two yearthree-year period ended December 31, 2008. These financial statements are the responsibility of the Company’s management. Our responsibility is to express an opinion on these financial statements based on our audits.
2011. We conducted our audits of the Company’s financial statements in accordance with the standards of the Public Company Accounting Oversight Board (United States). Those standards require that we plan and perform an audit to obtain reasonable assurance about whether the financial statements are free of material misstatement. An audit of financial statements includes examining, on a test basis, evidence supporting the amounts and disclosures in the financial statements. A financial statement audit also includes assessing the accounting principles used and significant estimates made by management, and evaluating the overall financial statement presentation. We believe that our audits provide a reasonable basis for our opinion.
In our opinion, the consolidated financial statements referred to above present fairly, in all material respects, the financial position of the Company as at December 31, 2008 and December 31, 2007, and the results of its operations and its cash flows for each of the years then ended in accordance with accounting principles generally accepted in the United States.
The financial statements of the Company as at December 31, 2006 and for the year then ended were audited by other auditors whose report dated February 28, 2007 expressed an unqualified opinion on those financial statements.
Internal control over financial reporting
We have also audited Mercer International Inc.’s internal control over financial reporting as atof December 31, 2008,2011, based on criteria established inInternal Control — Control—Integrated Framework issued by the Committee of Sponsoring Organizations of the Treadway Commission (COSO). The Company’s managementManagement is responsible for these financial statements, for maintaining effective internal control over financial reporting, and for its assessment of the effectiveness of internal control over financial reporting, included in the accompanying Management’s Report on Internal Control over Financial Reporting.financial reporting. Our responsibility is to express an opinion on these consolidated financial statements and the Company’scompany’s internal control over financial reporting based on our audit.
audits.We conducted our audit of internal control over financial reportingaudits in accordance with the standards of the Public Company Accounting Oversight Board (United States). Those standards require that we plan and perform the auditaudits to obtain reasonable assurance about whether the consolidated financial statements are free of material misstatement and whether effective internal control over financial reporting was maintained in all material respects. AnOur audits of the consolidated financial statements included examining, on a test basis, evidence supporting the amounts and disclosures in the financial statements, assessing the accounting principles used and significant estimates made by management, and evaluating the overall financial statement presentation. Our audit of internal control over financial reporting includesincluded obtaining an understanding of internal control over financial reporting, assessing the risk that a material weakness exists, and testing and evaluating the design and operating effectiveness of internal control based on the assessed risk, andrisk. Our audits also included performing such other procedures as we considerconsidered necessary in the circumstances. We believe that our audit providesaudits provide a reasonable basis for our opinion.
opinions.A company’s internal control over financial reporting is a process designed to provide reasonable assurance regarding the reliability of financial reporting and the preparation of financial statements for external purposes in accordance with generally accepted accounting principles. A company’s internal control over financial reporting includes those policies and procedures that (i) pertain to the maintenance of records that, in reasonable detail,
70
accurately and fairly reflect the transactions and dispositions of the assets of the company; (ii) provide reasonable assurance that transactions are recorded as necessary to permit preparation of consolidated financial statements in accordance with generally accepted accounting principles, and that receipts and expenditures of the company are being made only in accordance with authorizations of management and directors of the company; and (iii) provide reasonable assurance regarding prevention or timely detection of unauthorized acquisition, use, or disposition of the company’s assets that could have a material effect on the financial statements.
Because of its inherent limitations, internal control over financial reporting may not prevent or detect misstatements. Also, projections of any evaluation of effectiveness to future periods are subject to the risk that controls may become inadequate because of changes in conditions, or that the degree of compliance with the policies or procedures may deteriorate.
In our opinion, the Companyconsolidated financial statements referred to above present fairly, in all material respects, the financial position of Mercer International Inc. as of December 31, 2011 and December 31, 2010, and the results of its operations and its cash flows for each of the years in the three-year period ended December 31, 2011 in conformity with accounting principles generally accepted in the United States of America. Also in our opinion, Mercer International Inc. maintained, in all material respects, effective internal control over financial reporting as atof December 31, 20082011, based on criteria established in Internal Control — Control—Integrated Framework issued by the COSO.
/s/ PricewaterhouseCoopers LLP
March 2, 2009
71
February 14, 2012REPORT OF INDEPENDENT REGISTERED CHARTERED ACCOUNTANTS
To the Board of Directors and Shareholders of
Mercer International Inc.
We have audited the accompanying consolidated statements of operations, comprehensive income (loss), changes in shareholders’ equity, and cash flows of Mercer International Inc. and subsidiaries (the “Company”) for the year ended December 31, 2006. These financial statements are the responsibility of the Company’s management. Our responsibility is to express an opinion on these financial statements based on our audit.
We conducted our audit in accordance with the standards of the Public Company Accounting Oversight Board (United States). Those standards require that we plan and perform the audit to obtain reasonable assurance about whether the financial statements are free of material misstatement. An audit includes examining, on a test basis, evidence supporting the amounts and disclosures in the financial statements. An audit also includes assessing the accounting principles used and significant estimates made by management, as well as evaluating the overall financial statement presentation. We believe that our audit provides a reasonable basis for our opinion.
In our opinion, such consolidated financial statements present fairly, in all material respects, the results of operations and cash flows of Mercer International Inc. and subsidiaries for the year ended December 31, 2006, in conformity with accounting principles generally accepted in the United States of America.
As discussed in Note 1 to the consolidated financial statements, the Company adopted Statement of Financial Accounting Standards No. 123(R),Share-Based Payment, effective January 1, 2006. In addition, the Company adopted the recognition and disclosure provisions of Statement of Financial Accounting Standards No. 158,Employer’s Accounting for Defined Benefit Pension and Other Postretirement Plans — an Amendment of FASB Statements No. 87, 88, 106 and 132(R), effective December 31, 2006.
/s/ Deloitte & Touche LLP
Independent Registered Chartered Accountants
Vancouver, Canada
February 28, 2007
72
MERCER INTERNATIONAL INC.
CONSOLIDATED BALANCE SHEETS
(In thousands of Euros, except per share data)Euros)
| | | | | | | | | |
| | | December 31, | |
| | | 2008 | | | 2007 | |
| |
ASSETS | | | | | | | | |
| Current assets | | | | | | | | |
| Cash and cash equivalents (Note 2) | | € | 42,452 | | | € | 84,848 | |
| Cash, restricted (Note 2) | | | 13,000 | | | | — | |
| Receivables (Note 3) | | | 100,158 | | | | 89,890 | |
| Note receivable, current portion | | | 642 | | | | 5,896 | |
| Inventories (Note 4) | | | 98,457 | | | | 103,610 | |
| Prepaid expenses and other | | | 4,192 | | | | 6,015 | |
| | | | | | | | | |
| Total current assets | | | 258,901 | | | | 290,259 | |
| | | | | | | | | |
| Long-term assets | | | | | | | | |
| Cash, restricted (Note 2) | | | — | | | | 33,000 | |
| Property, plant and equipment (Note 5) | | | 881,704 | | | | 933,258 | |
| Investments | | | 419 | | | | 96 | |
| Deferred note issuance and other costs | | | 4,011 | | | | 5,303 | |
| Deferred income tax (Note 9) | | | 31,666 | | | | 17,624 | |
| Note receivable, less current portion | | | 3,529 | | | | 3,977 | |
| | | | | | | | | |
| | | | 921,329 | | | | 993,258 | |
| | | | | | | | | |
| Total assets | | € | 1,180,230 | | | € | 1,283,517 | |
| | | | | | | | | |
| | | | | | | | | |
LIABILITIES | | | | | | | | |
| Current liabilities | | | | | | | | |
| Accounts payable and accrued expenses (Note 6) | | € | 87,517 | | | € | 87,000 | |
| Pension and other post-retirement benefit obligations, current portion (Note 8) | | | 510 | | | | 493 | |
| Debt, current portion (Note 7) | | | 16,500 | | | | 34,023 | |
| | | | | | | | | |
| Total current liabilities | | | 104,527 | | | | 121,516 | |
| | | | | | | | | |
| Long-term liabilities | | | | | | | | |
| Debt, less current portion (Note 7) | | | 803,796 | | | | 815,832 | |
| Unrealized interest rate derivative losses (Note 14) | | | 47,112 | | | | 21,885 | |
| Pension and other post-retirement benefit obligations (Note 8) | | | 12,846 | | | | 19,983 | |
| Capital leases and other (Note 15) | | | 11,267 | | | | 8,999 | |
| Deferred income tax (Note 9) | | | 34,457 | | | | 18,640 | |
| | | | | | | | | |
| | | | 909,478 | | | | 885,339 | |
| | | | | | | | | |
| Total liabilities | | | 1,014,005 | | | | 1,006,855 | |
| | | | | | | | | |
| | | | | | | | | |
SHAREHOLDERS’ EQUITY | | | | | | | | |
| Share capital (Note 10) | | | 202,844 | | | | 202,844 | |
| Paid-in capital | | | 299 | | | | 134 | |
| Retained earnings (deficit) | | | (35,046 | ) | | | 37,419 | |
| Accumulated other comprehensive income | | | (1,872 | ) | | | 36,265 | |
| | | | | | | | | |
| Total shareholders’ equity | | | 166,225 | | | | 276,662 | |
| | | | | | | | | |
| Total liabilities and shareholders’ equity | | € | 1,180,230 | | | € | 1,283,517 | |
| | | | | | | | | |
| Commitments and contingencies (Note 16) | | | | | | | | |
| Subsequent events (Note 19) | | | | | | | | |
| | | | | | | | |
| | | December 31, | |
| | | 2011 | | | 2010 | |
ASSETS | | | | | | | | |
Current assets | | | | | | | | |
Cash and cash equivalents (Note 2) | | € | 105,072 | | | € | 99,022 | |
Marketable securities (Note 3) | | | 12,216 | | | | — | |
Receivables (Note 4) | | | 120,487 | | | | 121,709 | |
Inventories (Note 5) | | | 120,539 | | | | 102,219 | |
Prepaid expenses and other | | | 8,162 | | | | 11,360 | |
Deferred income tax (Note 10) | | | 6,750 | | | | 22,570 | |
| | | | | | | | |
Total current assets | | | 373,226 | | | | 356,880 | |
| | | | | | | | |
Long-term assets | | | | | | | | |
Property, plant and equipment (Note 6) | | | 820,974 | | | | 846,767 | |
Deferred note issuance and other | | | 10,763 | | | | 11,082 | |
Deferred income tax (Note 10) | | | 12,287 | | | | — | |
Note receivable | | | — | | | | 1,346 | |
| | | | | | | | |
| | | 844,024 | | | | 859,195 | |
| | | | | | | | |
Total assets | | € | 1,217,250 | | | € | 1,216,075 | |
| | | | | | | | |
LIABILITIES | | | | | | | | |
Current liabilities | | | | | | | | |
Accounts payable and other (Note 7) | | € | 99,640 | | | € | 84,873 | |
Pension and other post-retirement benefit obligations (Note 9) | | | 756 | | | | 728 | |
Debt (Note 8) | | | 25,671 | | | | 39,596 | |
| | | | | | | | |
Total current liabilities | | | 126,067 | | | | 125,197 | |
| | | | | | | | |
Long-term liabilities | | | | | | | | |
Debt (Note 8) | | | 708,415 | | | | 782,328 | |
Unrealized interest rate derivative losses (Note 15) | | | 52,391 | | | | 50,973 | |
Pension and other post-retirement benefit obligations (Note 9) | | | 31,197 | | | | 24,236 | |
Capital leases and other (Note 16) | | | 13,053 | | | | 12,010 | |
Deferred income tax (Note 10) | | | 2,585 | | | | 7,768 | |
| | | | | | | | |
| | | 807,641 | | | | 877,315 | |
| | | | | | | | |
Total liabilities | | € | 933,708 | | | € | 1,002,512 | |
| | | | | | | | |
EQUITY | | | | | | | | |
Shareholders’ equity | | | | | | | | |
Share capital (Note 11) | | | 247,642 | | | | 219,211 | |
Paid-in capital | | | (4,857 | ) | | | (3,899 | ) |
Retained earnings (deficit) | | | 37,985 | | | | (10,956 | ) |
Accumulated other comprehensive income | | | 21,346 | | | | 31,712 | |
| | | | | | | | |
Total shareholders’ equity | | | 302,116 | | | | 236,068 | |
| | | | | | | | |
Noncontrolling deficit | | | (18,574 | ) | | | (22,505 | ) |
| | | | | | | | |
Total equity | | | 283,542 | | | | 213,563 | |
| | | | | | | | |
Total liabilities and equity | | € | 1,217,250 | | | € | 1,216,075 | |
| | | | | | | | |
Commitments and contingencies (Note 17)
Subsequent event (Note 18)
The accompanying notes are an integral part of these financial statements.
73
MERCER INTERNATIONAL INC.
CONSOLIDATED STATEMENTS OF OPERATIONS
(In thousands of Euros, except per share data)
| | | | | | | | | | | | | |
| | | For the Years Ended December 31, | |
| | | 2008 | | | 2007 | | | 2006 | |
| |
| Revenues: | | | | | | | | | | | | |
| Pulp revenue | | € | 689,320 | | | € | 704,391 | | | € | 623,977 | |
| Energy revenue | | | 30,971 | | | | 22,904 | | | | 20,922 | |
| | | | | | | | | | | | | |
| | | | 720,291 | | | | 727,295 | | | | 644,899 | |
| Costs and expenses: | | | | | | | | | | | | |
| Operating costs | | | 626,933 | | | | 575,238 | | | | 477,526 | |
| Operating depreciation and amortization | | | 55,484 | | | | 56,400 | | | | 55,834 | |
| | | | | | | | | | | | | |
| | | | 37,874 | | | | 95,657 | | | | 111,539 | |
| Selling, general and administrative expenses | | | 30,158 | | | | 30,714 | | | | 34,644 | |
| (Sale) purchase of emission allowances | | | (5,613 | ) | | | (4,643 | ) | | | (15,609 | ) |
| | | | | | | | | | | | | |
| Operating income from continuing operations | | | 13,329 | | | | 69,586 | | | | 92,504 | |
| | | | | | | | | | | | | |
| Other income (expense) | | | | | | | | | | | | |
| Interest expense | | | (65,756 | ) | | | (71,400 | ) | | | (91,931 | ) |
| Investment income (loss) | | | (1,174 | ) | | | 4,453 | | | | 6,090 | |
| Foreign exchange gain (loss) on debt | | | (4,234 | ) | | | 10,958 | | | | 15,245 | |
| Realized gain (loss) on derivative instruments (Note 14) | | | — | | | | 6,820 | | | | (3,510 | ) |
| Unrealized gain (loss) on derivative instruments (Note 14) | | | (25,228 | ) | | | 13,537 | | | | 109,358 | |
| | | | | | | | | | | | | |
| Total other income (expense) | | | (96,392 | ) | | | (35,632 | ) | | | 35,252 | |
| | | | | | | | | | | | | |
| Income (loss) before income taxes and minority interest from continuing operations | | | (83,063 | ) | | | 33,954 | | | | 127,756 | |
| Income tax benefit (provision) (Note 9) | | | | | | | | | | | | |
| Current | | | (501 | ) | | | (2,170 | ) | | | (584 | ) |
| Deferred | | | (1,976 | ) | | | (8,144 | ) | | | (56,859 | ) |
| | | | | | | | | | | | | |
| Income (loss) before minority interest from continuing operations | | | (85,540 | ) | | | 23,640 | | | | 70,313 | |
| Minority interest | | | 13,075 | | | | (1,251 | ) | | | (1,071 | ) |
| | | | | | | | | | | | | |
| Net income (loss) from continuing operations | | | (72,465 | ) | | | 22,389 | | | | 69,242 | |
| Net loss from discontinued operations | | | — | | | | (210 | ) | | | (6,032 | ) |
| | | | | | | | | | | | | |
| Net income (loss) | | € | (72,465 | ) | | € | 22,179 | | | € | 63,210 | |
| | | | | | | | | | | | | |
| Net income (loss) per share from continuing operations (Note 12) | | | | | | | | | | | | |
| Basic | | € | (2.00 | ) | | € | 0.62 | | | € | 2.08 | |
| | | | | | | | | | | | | |
| Diluted | | € | (2.00 | ) | | € | 0.58 | | | € | 1.72 | |
| | | | | | | | | | | | | |
| Net income (loss) per share (Note 12) | | | | | | | | | | | | |
| Basic | | € | (2.00 | ) | | € | 0.61 | | | € | 1.90 | |
| | | | | | | | | | | | | |
| Diluted | | € | (2.00 | ) | | € | 0.58 | | | € | 1.58 | |
| | | | | | | | | | | | | |
| | | | | | | | | | | | |
| | | For the Years Ended December 31, | |
| | | 2011 | | | 2010 | | | 2009 | |
Revenues | | | | | | | | | | | | |
Pulp | | € | 831,396 | | | € | 856,311 | | | € | 577,298 | |
Energy | | | 57,972 | | | | 44,225 | | | | 42,501 | |
| | | | | | | | | | | | |
| | | 889,368 | | | | 900,536 | | | | 619,799 | |
Costs and expenses | | | | | | | | | | | | |
Operating costs | | | 683,718 | | | | 643,529 | | | | 551,781 | |
Operating depreciation and amortization | | | 55,760 | | | | 55,932 | | | | 53,919 | |
| | | | | | | | | | | | |
| | | 149,890 | | | | 201,075 | | | | 14,099 | |
Selling, general and administrative expenses | | | 38,771 | | | | 33,332 | | | | 26,898 | |
| | | | | | | | | | | | |
Operating income (loss) | | | 111,119 | | | | 167,743 | | | | (12,799 | ) |
| | | | | | | | | | | | |
Other income (expense) | | | | | | | | | | | | |
Interest expense | | | (58,995 | ) | | | (67,621 | ) | | | (64,770 | ) |
Investment income (loss) | | | 1,501 | | | | 468 | | | | (1,804 | ) |
Foreign exchange gain (loss) on debt | | | 1,175 | | | | (6,126 | ) | | | 2,692 | |
Gain (loss) on extinguishment of debt (Note 8) | | | (71 | ) | | | (7,494 | ) | | | 4,447 | |
Gain (loss) on derivative instruments (Note 15) | | | (1,418 | ) | | | 1,899 | | | | (5,760 | ) |
| | | | | | | | | | | | |
Total other income (expense) | | | (57,808 | ) | | | (78,874 | ) | | | (65,195 | ) |
| | | | | | | | | | | | |
Income (loss) before income taxes | | | 53,311 | | | | 88,869 | | | | (77,994 | ) |
Income tax benefit (provision) (Note 10) | | | | | | | | | | | | |
Current | | | (1,682 | ) | | | (3,881 | ) | | | (134 | ) |
Deferred | | | 2,377 | | | | 9,760 | | | | 6,003 | |
| | | | | | | | | | | | |
Net income (loss) | | | 54,006 | | | | 94,748 | | | | (72,125 | ) |
Less: net loss (income) attributable to noncontrolling interest | | | (3,931 | ) | | | (8,469 | ) | | | 9,936 | |
| | | | | | | | | | | | |
Net income (loss) attributable to common shareholders | | € | 50,075 | | | € | 86,279 | | | € | (62,189 | ) |
| | | | | | | | | | | | |
Net income (loss) per share attributable to common shareholders (Note 13) | | | | | | | | | | | | |
Basic | | € | 1.00 | | | € | 2.24 | | | € | (1.71 | ) |
| | | | | | | | | | | | |
Diluted | | € | 0.89 | | | € | 1.56 | | | € | (1.71 | ) |
| | | | | | | | | | | | |
The accompanying notes are an integral part of these financial statements.
74
MERCER INTERNATIONAL INC.
CONSOLIDATED STATEMENTS OF COMPREHENSIVE INCOME (LOSS)
(In thousands of Euros)
| | | | | | | | | | | | |
| | | For the Years Ended December 31, | |
| | | 2011 | | | 2010 | | | 2009 | |
Net income (loss) | | € | 54,006 | | | € | 94,748 | | | € | (72,125 | ) |
Other comprehensive income (loss), net of taxes | | | | | | | | | | | | |
Foreign currency translation adjustment, net of tax of €683 (2010—nil, 2009—nil) | | | (2,305 | ) | | | 11,333 | | | | 28,316 | |
Pension income (expense) (Note 9) | | | (8,049 | ) | | | (3,314 | ) | | | (3,128 | ) |
Unrealized gains (losses) on securities arising during the year | | | (12 | ) | | | (2 | ) | | | 379 | |
| | | | | | | | | | | | |
Other comprehensive income (loss), net of taxes | | | (10,366 | ) | | | 8,017 | | | | 25,567 | |
| | | | | | | | | | | | |
Total comprehensive income (loss) | | | 43,640 | | | | 102,765 | | | | (46,558 | ) |
Comprehensive loss (income) attributable to noncontrolling interest | | | (3,931 | ) | | | (8,469 | ) | | | 9,936 | |
| | | | | | | | | | | | |
Comprehensive income (loss) attributable to common shareholders | | € | 39,709 | | | € | 94,296 | | | € | (36,622 | ) |
| | | | | | | | | | | | |
The accompanying notes are an integral part of these consolidated financial statements.
MERCER INTERNATIONAL INC.
CONSOLIDATED STATEMENTS OF CHANGES IN SHAREHOLDERS’ EQUITY
| | | | | | | | | | | | | |
| | | For the Years Ended December 31, | |
| | | 2008 | | | 2007 | | | 2006 | |
| |
| Net income (loss) | | € | (72,465 | ) | | € | 22,179 | | | € | 63,210 | |
| | | | | | | | | | | | | |
| Other comprehensive income (loss) | | | | | | | | | | | | |
| Foreign currency translation adjustment | | | (41,876 | ) | | | 29,214 | | | | (3,730 | ) |
| FASB 158 pension income (expense) | | | 4,079 | | | | (809 | ) | | | — | |
| Unrealized gains (losses) on securities arising during the year | | | (340 | ) | | | 95 | | | | 171 | |
| | | | | | | | | | | | | |
| Other comprehensive income (loss) | | | (38,137 | ) | | | 28,500 | | | | (3,559 | ) |
| | | | | | | | | | | | | |
| Comprehensive income (loss) | | € | (110,602 | ) | | € | 50,679 | | | € | 59,651 | |
| | | | | | | | | | | | | |
(In thousands of Euros)
| | | | | | | | | | | | | | | | | | | | | | | | | | | | | | | | | | | | | | | | |
| | | Common Shares | | | | | | | | | Accumulated Other
Comprehensive Income (Loss) | | | | |
| | | Number
of Shares | | | Par
Value | | | Amount
Paid in
Excess of
Par Value | | | Paid-in
Capital | | | Retained
Earnings
(Deficit) | | | Foreign
Currency
Translation
Adjustments | | | Defined
Benefit
Pension
Plans | | | Unrealized
Gains
(Losses) on
Securities | | | Total | | | Shareholders’
Equity | |
Balance at December 31, 2008 | | | 36,422,487 | | | € | 27,576 | | | € | 175,268 | | | € | 299 | | | € | (35,046 | ) | | € | (777 | ) | | € | (850 | ) | | € | (245 | ) | | € | (1,872 | ) | | € | 166,225 | |
Capital contribution to acquire additional 4.32% of Stendal Mill | | | — | | | | — | | | | — | | | | (6,809 | ) | | | — | | | | — | | | | — | | | | — | | | | — | | | | (6,809 | ) |
Shares issued on grants of restricted shares | | | 21,000 | | | | — | | | | — | | | | 52 | | | | — | | | | — | | | | — | | | | — | | | | — | | | | 52 | |
Stock compensation expense | | | — | | | | — | | | | — | | | | 376 | | | | — | | | | — | | | | — | | | | — | | | | — | | | | 376 | |
Net loss | | | — | | | | — | | | | — | | | | — | | | | (62,189 | ) | | | — | | | | — | | | | — | | | | — | | | | (62,189 | ) |
Other comprehensive income (loss) | | | — | | | | — | | | | — | | | | — | | | | — | | | | 28,316 | | | | (3,128 | ) | | | 379 | | | | 25,567 | | | | 25,567 | |
| | | | | | | | | | | | | | | | | | | | | | | | | | | | | | | | | | | | | | | | |
Balance at December 31, 2009 | | | 36,443,487 | | | € | 27,576 | | | € | 175,268 | | | € | (6,082 | ) | | € | (97,235 | ) | | € | 27,539 | | | € | (3,978 | ) | | € | 134 | | | € | 23,695 | | | € | 123,222 | |
Shares issued on grants of restricted shares | | | 56,000 | | | | — | | | | — | | | | 153 | | | | — | | | | — | | | | — | | | | — | | | | — | | | | 153 | |
Shares issued on conversion of convertible notes | | | 6,500,171 | | | | 4,961 | | | | 11,406 | | | | — | | | | — | | | | — | | | | — | | | | — | | | | — | | | | 16,367 | |
Stock compensation expense | | | — | | | | — | | | | — | | | | 2,030 | | | | — | | | | — | | | | — | | | | — | | | | — | | | | 2,030 | |
Net income | | | — | | | | — | | | | — | | | | — | | | | 86,279 | | | | — | | | | — | | | | — | | | | — | | | | 86,279 | |
Other comprehensive income (loss) | | | — | | | | — | | | | — | | | | — | | | | — | | | | 11,333 | | | | (3,314 | ) | | | (2 | ) | | | 8,017 | | | | 8,017 | |
| | | | | | | | | | | | | | | | | | | | | | | | | | | | | | | | | | | | | | | | |
Balance at December 31, 2010 | | | 42,999,658 | | | € | 32,537 | | | € | 186,674 | | | € | (3,899 | ) | | € | (10,956 | ) | | € | 38,872 | | | € | (7,292 | ) | | € | 132 | | | € | 31,712 | | | € | 236,068 | |
Shares issued on grants of restricted shares | | | 238,000 | | | | 74 | | | | 296 | | | | (370 | ) | | | — | | | | — | | | | — | | | | — | | | | — | | | | — | |
Shares issued on grants of performance shares | | | 358,268 | | | | 243 | | | | 3,585 | | | | (3,828 | ) | | | — | | | | — | | | | — | | | | — | | | | — | | | | — | |
Shares issued on conversion of convertible notes | | | 13,446,679 | | | | 9,499 | | | | 21,076 | | | | — | | | | — | | | | — | | | | — | | | | — | | | | — | | | | 30,575 | |
Treasury shares retired | | | (1,263,401 | ) | | | (971 | ) | | | (5,371 | ) | | | — | | | | (1,134 | ) | | | — | | | | — | | | | — | | | | — | | | | (7,476 | ) |
Stock compensation expense | | | — | | | | — | | | | — | | | | 3,240 | | | | — | | | | — | | | | — | | | | — | | | | — | | | | 3,240 | |
Net income | | | — | | | | — | | | | — | | | | — | | | | 50,075 | | | | — | | | | — | | | | — | | | | — | | | | 50,075 | |
Other comprehensive income (loss) | | | — | | | | — | | | | — | | | | — | | | | — | | | | (2,305 | ) | | | (8,049 | ) | | | (12 | ) | | | (10,366 | ) | | | (10,366 | ) |
| | | | | | | | | | | | | | | | | | | | | | | | | | | | | | | | | | | | | | | | |
Balance at December 31, 2011 | | | 55,779,204 | | | € | 41,382 | | | € | 206,260 | | | € | (4,857 | ) | | € | 37,985 | | | € | 36,567 | | | € | (15,341 | ) | | € | 120 | | | € | 21,346 | | | € | 302,116 | |
| | | | | | | | | | | | | | | | | | | | | | | | | | | | | | | | | | | | | | | | |
The accompanying notes are an integral part of these financial statements.
75
MERCER INTERNATIONAL INC.
CONSOLIDATED STATEMENTS OF CHANGES IN SHAREHOLDERS’ EQUITY
CASH FLOWS
| | | | | | | | | | | | | | | | | | | | | | | | | | | | | | | | | | | | | | | | | |
| | | | | | | | | | | | | | | | | | Accumulated Other
| | | | |
| | | Common Shares | | | | | | | | | Comprehensive Income (Loss) | | | | |
| | | | | | | | | Amount
| | | | | | | | | Foreign
| | | Defined
| | | Unrealized
| | | | | | | |
| | | | | | | | | Paid in
| | | | | | Retained
| | | Currency
| | | Benefit
| | | Gains
| | | | | | | |
| | | Number
| | | | | | Excess of
| | | Paid-in
| | | Earnings
| | | Translation
| | | Pension
| | | (Losses) on
| | | | | | Shareholders’
| |
| | | of Shares | | | Par Value | | | Par Value | | | Capital | | | (Deficit) | | | Adjustments | | | Plans | | | Securities | | | Total | | | Equity | |
| |
| Balance at December 31, 2005 | | | 33,169,140 | | | € | 25,448 | | | € | 156,138 | | | € | 14 | | | € | (47,970 | ) | | € | 15,615 | | | € | (331 | ) | | € | (171 | ) | | € | 15,113 | | | € | 148,743 | |
| Shares issued on exercise of stock options | | | 60,000 | | | | 41 | | | | 251 | | | | — | | | | — | | | | — | | | | — | | | | — | | | | — | | | | 292 | |
| Shares issued on grants of restricted stock | | | 45,000 | | | | 32 | | | | 297 | | | | — | | | | — | | | | — | | | | — | | | | — | | | | — | | | | 329 | |
| Shares of restricted stock cancelled | | | (9,999 | ) | | | (7 | ) | | | (57 | ) | | | — | | | | — | | | | — | | | | — | | | | — | | | | — | | | | (64 | ) |
| Shares issued on repurchase of notes | | | 2,201,035 | | | | 1,447 | | | | 12,052 | | | | — | | | | — | | | | — | | | | — | | | | — | | | | — | | | | 13,499 | |
| Stock compensation expense | | | — | | | | — | | | | — | | | | 140 | | | | — | | | | — | | | | — | | | | — | | | �� | — | | | | 140 | |
| Adjustment to initially apply FASB Statement No. 158, net of tax | | | — | | | | — | | | | — | | | | — | | | | — | | | | — | | | | (3,789 | ) | | | — | | | | (3,789 | ) | | | (3,789 | ) |
| Net income | | | — | | | | — | | | | — | | | | — | | | | 63,210 | | | | — | | | | — | | | | — | | | | — | | | | 63,210 | |
| Other comprehensive income (loss) | | | — | | | | — | | | | — | | | | — | | | | — | | | | (3,730 | ) | | | — | | | | 171 | | | | (3,559 | ) | | | (3,559 | ) |
| | | | | | | | | | | | | | | | | | | | | | | | | | | | | | | | | | | | | | | | | |
| Balance at December 31, 2006 | | | 35,465,176 | | | € | 26,961 | | | € | 168,681 | | | € | 154 | | | € | 15,240 | | | € | 11,885 | | | € | (4,120 | ) | | € | - | | | € | 7,765 | | | € | 218,801 | |
| Shares issued on exercise of stock options | | | 56,666 | | | | 43 | | | | 261 | | | | — | | | | — | | | | — | | | | — | | | | — | | | | — | | | | 304 | |
| Shares issued on grants of restricted stock | | | 21,000 | | | | 15 | | | | 145 | | | | — | | | | — | | | | — | | | | — | | | | — | | | | — | | | | 160 | |
| Shares issued on repurchase of notes | | | 742,185 | | | | 557 | | | | 6,181 | | | | — | | | | — | | | | — | | | | — | | | | — | | | | — | | | | 6,738 | |
| Stock compensation expense | | | — | | | | — | | | | — | | | | (20 | ) | | | — | | | | — | | | | — | | | | — | | | | — | | | | (20 | ) |
| Net income | | | — | | | | — | | | | — | | | | — | | | | 22,179 | | | | — | | | | — | | | | — | | | | — | | | | 22,179 | |
| Other comprehensive income (loss) | | | — | | | | — | | | | — | | | | — | | | | — | | | | 29,214 | | | | (809 | ) | | | 95 | | | | 28,500 | | | | 28,500 | |
| | | | | | | | | | | | | | | | | | | | | | | | | | | | | | | | | | | | | | | | | |
| Balance at December 31, 2007 | | | 36,285,027 | | | € | 27,576 | | | € | 175,268 | | | € | 134 | | | € | 37,419 | | | € | 41,099 | | | € | (4,929 | ) | | € | 95 | | | € | 36,265 | | | € | 276,662 | |
| Shares issued on grants of restricted stock | | | 21,000 | | | | — | | | | — | | | | 61 | | | | — | | | | — | | | | — | | | | — | | | | — | | | | 61 | |
| Shares issued on grants of performance stock | | | 116,460 | | | | — | | | | — | | | | 29 | | | | — | | | | — | | | | — | | | | — | | | | — | | | | 29 | |
| Stock compensation expense | | | — | | | | — | | | | — | | | | 75 | | | | — | | | | — | | | | — | | | | — | | | | — | | | | 75 | |
| Net loss | | | — | | | | — | | | | — | | | | — | | | | (72,465 | ) | | | — | | | | — | | | | — | | | | — | | | | (72,465 | ) |
| Other comprehensive income (loss) | | | — | | | | — | | | | — | | | | — | | | | — | | | | (41,876 | ) | | | 4,079 | | | | (340 | ) | | | (38,137 | ) | | | (38,137 | ) |
| | | | | | | | | | | | | | | | | | | | | | | | | | | | | | | | | | | | | | | | | |
| Balance at December 31, 2008 | | | 36,422,487 | | | € | 27,576 | | | € | 175,268 | | | € | 299 | | | € | (35,046 | ) | | € | (777 | ) | | € | (850 | ) | | € | (245 | ) | | € | (1,872 | ) | | € | 166,225 | |
| | | | | | | | | | | | | | | | | | | | | | | | | | | | | | | | | | | | | | | | | |
| | | | | | | | | | | | |
| | | For the Years Ended December 31, | |
| | | 2011 | | | 2010 | | | 2009 | |
Cash flows from (used in) operating activities | | | | | | | | | | | | |
Net income (loss) attributable to common shareholders | | € | 50,075 | | | € | 86,279 | | | € | (62,189 | ) |
Adjustments to reconcile net income (loss) attributable to common shareholders to cash flows from operating activities | | | | | | | | | | | | |
Loss (gain) on derivative instruments | | | 1,418 | | | | (1,899 | ) | | | 5,760 | |
Foreign exchange loss (gain) on debt | | | (1,175 | ) | | | 6,126 | | | | (2,692 | ) |
Loss (gain) on extinguishment of debt | | | 71 | | | | 7,494 | | | | (4,447 | ) |
Depreciation and amortization | | | 56,005 | | | | 56,231 | | | | 54,170 | |
Accretion expense | | | 597 | | | | 2,492 | | | | 181 | |
Noncontrolling interest | | | 3,931 | | | | 8,469 | | | | (9,936 | ) |
Deferred income taxes | | | (2,377 | ) | | | (9,760 | ) | | | (6,003 | ) |
Stock compensation expense | | | 3,310 | | | | 2,394 | | | | 455 | |
Pension and other post-retirement expense, net of funding | | | (269 | ) | | | 418 | | | | 282 | |
Other | | | 1,308 | | | | 5,190 | | | | 2,482 | |
Changes in current assets and liabilities | | | | | | | | | | | | |
Receivables | | | (1,604 | ) | | | (40,038 | ) | | | 31,907 | |
Inventories | | | (17,713 | ) | | | (24,462 | ) | | | 32,158 | |
Accounts payable and accrued expenses | | | 14,252 | | | | (3,089 | ) | | | (2,950 | ) |
Other | | | 3,226 | | | | (4,566 | ) | | | (1,859 | ) |
| | | | | | | | | | | | |
Net cash from operating activities | | | 111,055 | | | | 91,279 | | | | 37,319 | |
Cash flows from (used in) investing activities | | | | | | | | | | | | |
Purchase of property, plant and equipment | | | (37,809 | ) | | | (38,300 | ) | | | (28,828 | ) |
Proceeds on sale of property, plant and equipment | | | 813 | | | | 1,138 | | | | 436 | |
Cash, restricted | | | — | | | | — | | | | 13,000 | |
Note receivable | | | 2,865 | | | | 1,113 | | | | 152 | |
Purchase of marketable securities | | | (12,187 | ) | | | — | | | | — | |
| | | | | | | | | | | | |
Net cash used in investing activities | | | (46,318 | ) | | | (36,049 | ) | | | (15,240 | ) |
Cash flows from (used in) financing activities | | | | | | | | | | | | |
Repayment of notes payable and debt | | | (49,193 | ) | | | (234,582 | ) | | | (26,499 | ) |
Repayment of capital lease obligations | | | (2,942 | ) | | | (2,920 | ) | | | (3,178 | ) |
Proceeds from borrowings of notes payable and debt | | | — | | | | 222,177 | | | | 13,511 | |
Repayment of credit facilities, net | | | (14,652 | ) | | | (2,660 | ) | | | (4,272 | ) |
Proceeds from government grants | | | 14,199 | | | | 17,952 | | | | 9,058 | |
Payment of note issuance costs | | | — | | | | (6,095 | ) | | | (1,969 | ) |
Purchase of treasury shares | | | (7,476 | ) | | | — | | | | — | |
| | | | | | | | | | | | |
Net cash used in financing activities | | | (60,064 | ) | | | (6,128 | ) | | | (13,349 | ) |
Effect of exchange rate changes on cash and cash equivalents | | | 1,377 | | | | (1,371 | ) | | | 109 | |
| | | | | | | | | | | | |
Net increase in cash and cash equivalents | | | 6,050 | | | | 47,731 | | | | 8,839 | |
Cash and cash equivalents, beginning of year | | | 99,022 | | | | 51,291 | | | | 42,452 | |
| | | | | | | | | | | | |
Cash and cash equivalents, end of year | | € | 105,072 | | | € | 99,022 | | | € | 51,291 | |
| | | | | | | | | | | | |
Supplemental disclosure of cash flow information | | | | | | | | | | | | |
Cash paid during the year for | | | | | | | | | | | | |
Interest | | € | 57,725 | | | € | 65,167 | | | € | 62,022 | |
Income taxes | | | 3,197 | | | | 461 | | | | 377 | |
Supplemental schedule of non-cash investing and financing activities | | | | | | | | | | | | |
Acquisition of production and other equipment under capital lease obligations | | € | 2,782 | | | € | 2,087 | | | € | 625 | |
Decrease (increase) in accounts payable relating to investing activities | | | 324 | | | | 352 | | | | (1,471 | ) |
Increase (decrease) in accounts receivable and other current assets relating to investing activities | | | 7,903 | | | | (8,914 | ) | | | — | |
The accompanying notes are an integral part of these financial statements.
76
MERCER INTERNATIONAL INC.
CONSOLIDATED STATEMENTS OF CASH FLOWS
(In thousands of Euros)
| | | | | | | | | | | | | |
| | | For the Years Ended December 31, | |
| | | 2008 | | | 2007 | | | 2006 | |
| |
| Cash flows from (used in) operating activities | | | | | | | | | | | | |
| Net income (loss) | | € | (72,465 | ) | | € | 22,179 | | | € | 63,210 | |
| Adjustments to reconcile net income (loss) to cash flows from operating activities | | | | | | | | | | | | |
| Unrealized (gain) loss on derivatives | | | 25,228 | | | | (13,537 | ) | | | (109,358 | ) |
| Unrealized foreign exchange (gain) loss on debt | | | 4,234 | | | | (10,958 | ) | | | (15,245 | ) |
| Operating depreciation and amortization | | | 55,484 | | | | 56,400 | | | | 56,085 | |
| Non-operating amortization | | | 278 | | | | 258 | | | | 269 | |
| Loss (gain) on sale of assets | | | (765 | ) | | | 179 | | | | 5,957 | |
| Minority interest | | | (13,075 | ) | | | 1,251 | | | | 1,071 | |
| Income from equity investee | | | — | | | | — | | | | (1,206 | ) |
| Deferred income taxes | | | 1,976 | | | | 8,144 | | | | 56,859 | |
| Stock compensation expense | | | 264 | | | | 243 | | | | 541 | |
| Pension and other post-retirement expense | | | 1,981 | | | | 1,806 | | | | 1,638 | |
| Pension and other post-retirement benefit funding | | | (2,739 | ) | | | (2,021 | ) | | | (1,941 | ) |
| Inventory provisions | | | 11,272 | | | | — | | | | — | |
| Other | | | (123 | ) | | | 2,048 | | | | 1,438 | |
| Changes in current assets and liabilities | | | | | | | | | | | | |
| Receivables | | | (14,811 | ) | | | (11,890 | ) | | | (7,381 | ) |
| Inventories | | | (13,331 | ) | | | (38,703 | ) | | | 7,364 | |
| Accounts payable and accrued expenses | | | 1,240 | | | | 3,303 | | | | (9,305 | ) |
| Other | | | 3,486 | | | | 447 | | | | (773 | ) |
| | | | | | | | | | | | | |
| Net cash from (used in) operating activities | | | (11,866 | ) | | | 19,149 | | | | 49,223 | |
| Cash flows from (used in) investing activities | | | | | | | | | | | | |
| Cash, restricted | | | 20,000 | | | | 24,000 | | | | (25,388 | ) |
| Purchase of property, plant and equipment(3) | | | (25,704 | ) | | | (4,864 | ) | | | (32,937 | ) |
| Proceeds on sale of property, plant and equipment | | | 2,000 | | | | 881 | | | | 1,765 | |
| Note receivable | | | 5,708 | | | | 4,954 | | | | (6,870 | ) |
Proceeds fromavailable-for-sale securities | | | — | | | | — | | | | 1,184 | |
| | | | | | | | | | | | | |
| Net cash from (used in) investing activities | | | 2,004 | | | | 24,971 | | | | (62,246 | ) |
| Cash flows from (used in) financing activities | | | | | | | | | | | | |
| Repayment of notes payable and debt | | | (34,023 | ) | | | (26,719 | ) | | | (87,911 | ) |
| Repayment of capital lease obligations | | | (3,312 | ) | | | (5,562 | ) | | | (4,091 | ) |
| Proceeds from investment grants | | | 266 | | | | 1,236 | | | | 9,101 | |
| Issuance of common shares | | | — | | | | 305 | | | | 556 | |
| Proceeds from borrowings of notes payable and debt | | | 5,837 | | | | — | | | | 78,100 | |
| Proceeds from minority shareholders | | | — | | | | — | | | | 5,463 | |
| Decrease in construction costs payable | | | — | | | | — | | | | (240 | ) |
| | | | | | | | | | | | | |
| Net cash from (used in) financing activities | | | (31,232 | ) | | | (30,740 | ) | | | 978 | |
| Effect of exchange rate changes on cash and cash equivalents | | | (1,302 | ) | | | 1,664 | | | | (1,698 | ) |
| | | | | | | | | | | | | |
| Net increase (decrease) in cash and cash equivalents | | | (42,396 | ) | | | 15,044 | | | | (13,743 | ) |
| Cash and cash equivalents, beginning of year (1) | | | 84,848 | | | | 69,804 | | | | 83,547 | |
| | | | | | | | | | | | | |
| Cash and cash equivalents, end of year (2) | | € | 42,452 | | | € | 84,848 | | | € | 69,804 | |
| | | | | | | | | | | | | |
| Supplemental disclosure of cash flow information: | | | | | | | | | | | | |
| Cash paid during the period for: | | | | | | | | | | | | |
| Interest | | € | 60,652 | | | € | 73,318 | | | € | 84,382 | |
| Income taxes | | | 1,100 | | | | 452 | | | | 1,304 | |
| Supplemental schedule of non-cash investing and financing activities: | | | | | | | | | | | | |
| Acquisition of production and other equipment under capital lease obligations | | € | 5,318 | | | € | 2,110 | | | € | 3,301 | |
| Property, plant and equipment on acquisition of 7% interest in Stendal | | | — | | | | — | | | | 8,067 | |
| Acquisition of notes receivable on sale of paper assets | | | — | | | | — | | | | 11,321 | |
| Increase (decrease) in accounts payable relating to investing activities | | | 2,627 | | | | — | | | | — | |
| | |
(1) | | Includes amounts related to discontinued operations of: 2008 — €nil, 2007 — €437, 2006 — €772 |
(2) | | Includes amounts related to discontinued operations of: 2008 — €nil, 2007 — €nil, 2006 — €437 |
(3) | | During 2007, purchases of property, plant, and equipment include amounts received and recorded as a reduction of property, plant and equipment (approximately €9,100) upon the settlement of the Stendal engineering, procurement and construction (EPC) contract. |
The accompanying notes are an integral part of these financial statements.
77
MERCER INTERNATIONAL INC.
NOTES TO THE CONSOLIDATED FINANCIAL STATEMENTS
(In thousands of Euros, except per share data)
| |
Note 1. The Company and Summary of Significant Accounting Policies Background Note 1.
| The Company and Summary of Significant Accounting Policies |
Background
Mercer International Inc. (“Mercer Inc.” or the “Company”) is a Washington corporation and the Company’s shares of common stock are quoted and listed for trading on the NASDAQ Global Market and the Toronto Stock Exchange, respectively. The Company converted its corporate form from a Washington business trust to a corporation effective March1,2006 without effecting any changes to its business, management, accounting practices, assets or liabilities.
Mercer Inc. operates three pulp manufacturing facilities, one in Canada and two in Germany, and is one of the second largest producerproducers of market northern bleached softwood kraft or “NBSK”,(“NBSK”) pulp in the world.
In these consolidated financial statements, unless otherwise indicated, all amounts are expressed in Euros (“€”). The term “U.S. dollars” and the symbol “$” refer to United States dollars. The symbol “C$” refers to Canadian dollars.
These consolidated financial statements contained herein include the accounts of the Company and its wholly-owned and majority-owned subsidiaries (collectively, the “Company”). All significant inter-company balances and transactions have been eliminated upon consolidation.
The preparationPreparation of financial statements and related disclosures in conformity with accounting principles generally accepted in the United States of America (“GAAP”) requires management to make estimates and assumptions that affect the amounts reported in the financial statements and accompanying notes. Significant management judgementjudgment is required in determining the accounting for, among other things, the accounting for doubtful accounts and reserves, depreciation and amortization, future cash flows associated with impairment testing for long-lived assets, derivative financial instruments, environmental conservation and legal liabilities, asset retirement obligations, pensions and post-retirement benefit obligations, income taxes, contingencies, and inventory obsolescence and provisions. Actual results could differ materially from these estimates, and changes in these estimates are recorded when known.
Cash and Cash Equivalents
Cash and cash equivalents include cash held in bank accounts and highly liquid money market investments with original maturities of three months or less.
Trading securities, consisting of marketable securities, are classified as current investments and are reported at fair values with realized gains or losses and unrealized holding gains or losses included in the results of operations.
Investments in entities where the Company hasdebt securities and equity investments in publicly traded companies in which it has less than 20% of the voting interest and in which itCompany does not exercise significant influence are classified asavailable-for-sale securities. These securities are reported as long-term investments at fair values; based upon quoted market prices, with the unrealized gains or losses included in accumulated“Accumulated other comprehensive incomeincome” as a separate component of shareholders’Shareholders’ equity, until realized. If a loss in value inavailable-for-sale securities is considered to be other than temporary, the loss is recognized in the determination of net income. The cost of all securities sold is based on the specific identification method to determine realized gains or losses.
78
MERCER INTERNATIONAL INC.
NOTES TO THE CONSOLIDATED FINANCIAL STATEMENTS
(In thousands of Euros, except per share data)
| |
Note 1. | The Company and Summary of Significant Accounting Policies — (Continued) |
Note 1. The Company and Summary of Significant Accounting Policies (continued)
Inventories
Inventories of pulpraw materials, finished goods and logs and wood chipswork in progress are valued at the lower of cost, using the weighted-average cost method, or net realizable value. Other materials and supplies are valued at the lower of cost and replacement cost. Cost includes labor, materials and production overhead and is determined by using the weighted average cost method. InventoriesRaw materials inventories include both roundwood (logs) and wood chips. These inventories are located both at the pulp millmills and at various offsite locations. In accordance with industry practice, physical inventory counts utilize standardized techniques to estimate quantities of roundwood and wood chip inventory volumes. These techniques historically have provided reasonable estimates of such inventories.
Property, Plant and Equipment
Property, plant and equipment is stated at cost less accumulated depreciation. Depreciation of buildings and production equipment is based on the estimated useful lives of the assets and is computed using the straight-line method. Buildings are depreciated over 10 to 50 years and production and other equipment primarily over 25 years.
The Company reviews its long-lived assets for impairment whenever events or changes in circumstances indicate that the carrying value of such assets may not be recoverable. To determine recoverability, the Company compares the carrying value of the assets to the estimated future undiscounted cash flows. Measurement of an impairment loss for long-lived assets held for use is based on the fair value of the asset. As a result of current market conditions, the Company undertook a long-lived asset impairment review and concluded that no impairment losses were incurred in 2008.
The costs of major rebuilds, replacements and those expenditures that substantially increase the useful lives of existing property, plant, and equipment are capitalized, as well as interest costs associated with major capital projects until ready for their intended use. The cost of repairs and maintenance as well as planned shutdown maintenance performed on manufacturing facilities, composed of labor, materials and other incremental costs, is charged to operations as incurred.
Leases which transfer to the Company substantially all the risks and benefits incidental to ownership of the leased item are capitalized at the present value of the minimum lease payments. Capital leases are depreciated over the lease term. Operating lease payments are recognized as an expense in the Consolidated Statement of Operations on a straight linestraight-line basis over the lease term.
The Company provides for asset retirement obligations when there areis a legislated or contractual basesbasis for those obligations. Obligations are recorded as a liability at fair value, with a corresponding increase to property, plant, and equipment, and are amortized over the remaining useful life of the related assets. The liability is accreted using a risk free interest rate. As at December 31, 2008, the Company recorded €2,182 of asset retirement obligations.
The Company’s obligations for the proper removal and disposal of asbestos products from the Company’s mills meets the definition of a conditional asset retirement obligation as found in the Financial Accounting Standards Board Statement Interpretation No. 47,Accounting for Conditional Asset Retirement Obligations (“FIN 47”). Generally asbestos is found on steam and condensate piping systems as well as certain cladding on buildings and in building insulation throughout its older facilities. As a result of the longevity of the Company’s mills, due in part to the maintenance procedures and the fact that the Company does not have plans for major changes that require the removal of asbestos, the timing of the asbestos removal is indeterminate. As a result, the Company is currently unable to estimate the fair value of its asbestos removal and disposal obligation.
Government Grants
The Company records investment grants from federal and state governments when theythe conditions of their receipt are complied with and there is reasonable assurance that the grants will be received. Grants related to assets are government grants whose primary condition is that the company qualifying for them should
79
MERCER INTERNATIONAL INC.
NOTES TO THE CONSOLIDATED FINANCIAL STATEMENTS
(In thousands of Euros, except per share data)
| |
Note 1. | The Company and Summary of Significant Accounting Policies — (Continued) |
purchase, construct or otherwise acquire long-term assets. Secondary conditions may also be attached,
including restricting the type or location of the assets
and/or other conditions
that must be met. Grants related to assets
when received, are deducted from the asset
costs. costs in the Consolidated Balance Sheet.MERCER INTERNATIONAL INC.
NOTES TO THE CONSOLIDATED FINANCIAL STATEMENTS
(In thousands of Euros, except per share data)
Note 1. The Company and Summary of Significant Accounting Policies (continued)
Grants related to income are government grants which are either unconditional, related to reduced environmental emissions or related to the Company’s normal business operations, and are reported as a reduction of related expenses in the Consolidated Statement of Operations when received.
The Company is required to pay certain fees based on water consumption levels at its German mills. Unpaid fees can be reduced by wastewater grants upon the mills’ demonstration of reduced environmental emissions. The fees are expensed as incurred and the grants are recognized once the German regulators have evaluated and accepted the measurement of the wastewater emission reduction. There may be a significant period of time between recognition of the wastewater expense and recognition of the wastewater grant.
To the extent that government grants have been received and not applied, these grants are recorded in cash with a corresponding adjustment to “Accounts payable and other” in the Consolidated Balance Sheet due to the short-term nature of the related payments.
Deferred Note Issuance Costs
Note issuance costs are deferred and amortized as a component of expenses“Interest expense” in the Consolidated Statement of Operations over the term of the related debt instrument.
The Company maintains a defined benefit pension plan for its salaried employees at its Celgar mill which is funded and non-contributory. The cost of the benefits earned by the salaried employees is determined using the projected benefit method pro ratedprorated on services. The pension expense reflects the current service cost, the interest on the unfunded liability and the amortization over the estimated average remaining service life of the employees of (i) the unfunded liability, and (ii) experience gains or losses.
In accordance with the provisions of Statement ofguidance as outlined in the Financial Accounting Standards Board (“FASB”) Accounting Standards Codification No. 158,715,Employer’s Accounting for Defined Benefit Pension and Other Postretirement Plans — an amendment of FASB Statement No. 87, 88, 106 and 132RCompensation-Retirement Benefits (“FAS 158”ASC 715”), the Company recognizes the net funded status of the plan.
Effective December31,2008, the defined benefit pension plan will bewas closed to new members and the defined benefit service accrual will cease.ceased. Members will beginbegan to accrue benefits under a new defined contribution plan effective January1,2009. The contributions to the new plan will beare charged against earnings in the Consolidated Statement of Operations.
In addition, hourly-paid employees at the Celgar mill are covered by a multi-employer defined contributionmultiemployer pension plan for which contributions are charged against earnings in the Consolidated Statement of Operations.
Foreign Operations and Currency Translation
The Company translates foreign assets and liabilities of its subsidiaries, other than those denominated in Euros, at the rate of exchange at the balance sheet date. Revenues and expenses are translated at the average rate of exchange throughout the year. Transaction gains and losses related to net assets primarily located in Canada are recognized as unrealized foreign currency translation adjustments within “Accumulated other comprehensive income (loss)
MERCER INTERNATIONAL INC.
NOTES TO THE CONSOLIDATED FINANCIAL STATEMENTS
(In thousands of Euros, except per share data)
Note 1. The Company and Summary of Significant Accounting Policies (continued)
income” in shareholders’Shareholders’ equity, until all of the investment in the subsidiaries is sold or liquidated. The translation adjustments do not recognize the effect of income tax becausewhen the Company expects earnings of the foreign subsidiary to reinvestbe indefinitely reinvested. The income tax effect on currency translation adjustments related to foreign subsidiaries that are not considered indefinitely reinvested is recorded as a component of deferred taxes in the amounts indefinitely in operations.Consolidated Balance Sheet with an offset to other comprehensive income. Gains and losses resulting from foreign currency transactions (transactions denominated in a currency other than the entity’s functional currency) are included in “Costs and expenses” in the Consolidated Statement of Operations, which amounted to €4,597, €(7,452) and €(1,059) forOperations. Where inter-company loans are of a long-term investment nature, the years ended December 31, 2008, 2007 and 2006, respectively.
after-tax effect of exchange rate changes are included as an unrealized foreign currency translation adjustment within “Accumulated other comprehensive income” in Shareholders’ equity.Revenue and Related Cost Recognition
The Company recognizes revenue from product, sales, transportation and other sales when persuasive evidence of an arrangement exists, the sales price is fixed or determinable, title of ownership and risk of loss have passed to the customer and collectability is reasonably assured. Sales are reported net of discounts and allowances.
80
MERCER INTERNATIONAL INC.
NOTES TO THE CONSOLIDATED FINANCIAL STATEMENTS
(In thousands of Euros, except per share data)
| |
Note 1. | The Company and Summary of Significant Accounting Policies — (Continued) |
Amounts charged to customers for shipping and handling are recognized as revenue.revenue in the Consolidated Statement of Operations. Shipping and handling costs incurred by the Company are included in “Operating costs”.
During 2008, in the
Consolidated Statement of Operations.The Company has increased its focus on the production and sale of surplus electricity. Accordingly, management no longer considers this activity to be a by-product and, commencing in 2008, the Company began reportingreports revenue from sales of surplus electricity as “Energy revenue” in the Consolidated Statement of Operations. In previous years, these revenues were being reported within “Operating costs”. Consequently, the presentation in the Consolidated Statement of Operations has been revised for the Company’s energy sales. Energy revenues are recognized as the customers are invoiced at agreed upon rates and when collection is reasonably assured. These revenues include an estimate of the value of electricity consumed by customers in the year but billed subsequent to year end.year-end. Customer bills are based on meter readings that indicate electricity consumption. This activity does not meet the tests to be considered an operating segment, as defined in Statement of FinancialFASB’s Accounting Standards Codification No. 131,280,Disclosures about Segments of an Enterprise and Related InformationSegment Reporting (“FAS 131”ASC 280”).
Environmental Conservation
Liabilities for environmental conservation are recorded when it is probable that obligations have been incurred and their fair value can be reasonably estimated. Any potential recoveries of such liabilities are recorded when there is an agreement with the reimbursing entity and recovery is assessed as likely to occur.
The Company adopted Statement of FinancialUnder FASB’s Accounting Standards Codification No. 123(R),718,Share-Based Payment,Compensation-Stock Compensation (“FAS 123(R)”ASC 718”) on January 1, 2006. This statement requires the Company to recognize the cost of employee services received in exchange for the Company’s equity instruments. Under FAS 123(R), the Company is required to recordrecognizes stock-based compensation expense over an award’s vesting period based on the award’s fair value. The Company elected to adopt FAS 123(R) on a modified prospective basis; accordingly, the financial statements for periods prior to January 1, 2006 do not include compensation cost calculated under the fair value method. Stock based compensation expense has been recorded in “Selling, general, and administrative expenses” onwithin the Consolidated Statement of Operations.
The fair value of performance stockshare awards is re-measured at each balance sheet date. The cumulative effect of the change in fair value is recognized in the period of the change as an adjustment to compensation cost. The Company estimates forfeitures of performance stock awardsshares based on management’s expectations and recognizes compensation cost only for those awards expected to vest. Estimated forfeitures are adjusted to actual experience as needed.
at each balance sheet date.MERCER INTERNATIONAL INC.
NOTES TO THE CONSOLIDATED FINANCIAL STATEMENTS
(In thousands of Euros, except per share data)
Note 1. The Company and Summary of Significant Accounting Policies (continued)
The fair value of restricted stockshare awards areis determined by multiplying the market price of a share of Mercer Inc. common shares on the grant date by the number of units.
units granted.Income Taxes
Taxes on Income
Income taxes are reported under FASthe guidance of FASB’s Accounting Standards Codification No. 109,740,Accounting for Income Taxes (“FAS 109”ASC 740”), and accordingly, deferred income taxes are recognized using the asset and liability method, whereby deferred tax assets and liabilities are recognized for the future tax consequences attributable to differences between the financial statement carrying amounts of existing assets and liabilities and their respective tax bases, and operating loss and tax credit carryforwards. Valuation allowances are provided if, after considering available evidence, both positive and negative available evidence, it is more likely than not that some or all of the net deferred tax assets will not be realized.
81
Deferred income taxes are determined separately for each tax-paying component of the Company. For each tax-paying component, all current deferred tax liabilities and assets shall be offset and presented as a single net amount and all noncurrent deferred tax liabilities and assets shall be offset and presented as a single net amount.MERCER INTERNATIONAL INC.
NOTES TO THE CONSOLIDATED FINANCIAL STATEMENTS
(In thousands of Euros, except per share data)
| |
Note 1. | The Company and Summary of Significant Accounting Policies — (Continued) |
Derivative Financial Instruments
The Company occasionally enters into derivative financial instruments, including foreign currency forward contracts, and swaps, electricity forward contracts, and interest rate swaps caps and forward rate agreements, to limit exposures to changes in foreign currency exchange rates, energy prices, and interest rates. These derivative instruments are not designated as hedging instruments under Statementthe guidance of FinancialFASB’s Accounting Standards Codification No. 133,815,Accounting for Derivative InstrumentsDerivatives and Hedging Activities (“FAS 133”ASC 815”) and, accordingly, any. The change in themarked-to-marketfair value of electricity derivative contracts is recognized as either a gain or loss on derivative financial instrumentsincluded in “Operating costs” in the Consolidated Statement of Operations and any changes in the fair value of foreign currency and interest derivative contracts are recognized in “Gain (loss) on derivative instruments” in the Consolidated Statement of Operations.
Periodically, the Company enters into derivative contracts for its own use and as such are exempt from mark to market accounting.Net Income (Loss) Per Share
Basic net income (loss) per share (“EPS”) is computed by dividing net income (loss) available to common shareholders by the weighted average number of common shares outstanding in the period. Diluted income (loss) per share is calculated to give effect to all potentially dilutive common shares outstanding (computed under basic EPS)by applying the “Treasury Stock” method.and “If Converted” methods. Outstanding stock options, restricted stock, awards such as restricted stock awards withshares, performance conditions (known as “performance stock”),shares, and convertible notes represent the only potentially dilutive effects on the Company’s weighted average shares. See
Note 12-NetReclassifications Income (Loss) Per Share.
Reclassifications
Certain prior year amounts in the consolidated financial statements have been reclassified to conform to the current year presentation.
Recently ImplementedNew Accounting Standards
Fair Value Measurements
On January 1, 2008, the Company adopted Statement of FinancialIn September 2011, FASB issued Accounting Standards Update No. 157,2011-09Fair Value Measurements, Compensation-Retirement Benefits-Multiemployer Plan. (“FAS 157”ASU 2011-09”), which provides a consistent definition of fair value that focuses on exit price and prioritizes, within a measurement of fair value,is intended to enhance the use of market-based inputs over company-specific inputs, and expands disclosures regarding fair value measurements. It is applicable whenever another standard requires or permits assets or liabilities to be measured at fair value, but it does not expand the use of fair value to any new circumstances. FAS 157 is effectivedisclosure requirements for financial assets and financial liabilities and for non-financial assets and non-financial liabilities that are remeasured at least annually for fiscal years beginning after November 15, 2007 and interim periods within those fiscal years. The effect of the adoption of FAS 157 on January 1, 2008 was not material and no adjustment to accumulated deficit was required. Refer to Note 14 for more information. On February 12, 2008, the Financial Accounting Standards Board (“FASB”) Staff issued FASB Staff PositionFAS 157-2,Effective Date of FASB Statement No. 157 (“FSP157-2”), which defers the effective date of FAS 157 for all non-financial assets and liabilities, except those that are recognized or disclosed at fair value in the financial statements on a recurring basis. FSP157-2 defers the effective date of FAS 157 to fiscal years beginning after November 15, 2008, for items within the scope of FSP157-2. The provisions of FAS 157 have not been applied to non-financial assets and liabilities, such as asset retirement obligations.
Determining the Fair Value of a Financial Asset when the market for that Asset is not active
In October 2008, the FASB issued FSP157-3,Determining the Fair Value of a Financial Asset When the Market for That Asset is Not Active (“FSP157-3”), which clarifies the application of FAS 157 in a market that is not active and provides an example to illustrate key considerations in determining the fair value of a financial asset
82
MERCER INTERNATIONAL INC.
NOTES TO THE CONSOLIDATED FINANCIAL STATEMENTS
(In thousands of Euros, except per share data)
| |
Note 1. | The Company and Summary of Significant Accounting Policies (continued) employers participating in multiemployer pension plans to improve transparency and increase awareness of Significant Accounting Policies — (Continued) |
when the
marketcommitments and risks involved with participation in multiemployer plans. The new accounting guidance requires employers participating in multiemployer plans to provide additional quantitative and qualitative disclosures to provide users with more detailed information regarding an employer’s involvement in multiemployer plans. The new standard is effective for
that financial assetfiscal years ending after December 15, 2011. The Company participates in a multiemployer plan for its hourly-paid employees at the Celgar mill. The additional disclosure required by this standard is
included in Note 9 – Pension and Other Post-Retirement Benefit Obligations.In May 2011, FASB issued Accounting Standards Update 2011-04,Fair Value Measurements (“ASU 2011-04”), which expands the existing disclosure requirements for fair value measurements (particularly for Level 3 inputs) defined under FASB’s Accounting Standards Codification No. 820,Fair Value Measurement(“ASC 820”), and makes other amendments. Many of the amendments to ASC 820 are being made to eliminate wording differences between GAAP and International Financial Reporting Standards and are not active. FSP157-3 was effective immediately upon issuance, including prior periods for which financial statements have not been issued. Theintended to result in a change in the application of FSP157-3 had no impact on the Company’s financial statements or disclosures.
The Fair Value Option for Financial Assets and Financial Liabilities
In February 2007,requirements of ASC 820. However, some of the FASB issued Statementamendments clarify the application of Financial Accounting Standards No. 159,The Fair Value Option for Financial Assets and Financial Liabilities (“FAS 159”). FAS 159 permits entities to choose to measure many financial instruments and certain other items atexisting fair value withmeasurement requirements and others change certain requirements for measuring fair value and could change how the objectivefair value measurement guidance in ASC 820 is applied. The measurement and disclosure requirements of improving financial reporting by mitigating volatility in reported earnings caused by measuring related assets and liabilities differently without having to apply complex hedge accounting provisions. The Company adopted FAS 159 effective January 1, 2008, the impact of which was not material.
Accounting for Uncertainty in Income Taxes
On January 1, 2007, the Company adopted FASB Interpretation No. 48,Accounting for Uncertainty in Income Taxes — An Interpretation of FASB Statement No. 109 (“FIN 48”). FIN 48 clarifies the accounting for uncertainty in income taxes recognized in an entity’s financial statements in accordance with FAS 109, and prescribes a recognition threshold and measurement attributes for financial statement disclosure of tax positions taken or expected to be taken on a tax return. Under FIN 48, the impact of an uncertain income tax position on the income tax return must be recognized at the largest amount that is more likely than not to be sustained upon audit by the relevant taxing authority. An uncertain income tax position will not be recognized if it has less than a 50% likelihood of being sustained. Additionally, FIN 48 provides guidance on derecognition, classification, interest and penalties, accounting in interim periods, disclosure and transition. SeeNote 9-Income Taxes.
New Accounting Standards
In December 2007, the FASB issued Statement of Financial Accounting Standards No. 160,Noncontrolling Interests in Consolidated Financial Statements (“FAS 160”). FAS 160 establishes accounting and reporting standards for entities that have equity investments that are not attributable directly to the parent, called noncontrolling interests or minority interests. Specifically, FAS 160 states where and how to report noncontrolling interests in the consolidated statements of financial position and operations, how to account for changes in noncontrolling interests and provides disclosure requirements. The provisions of FAS 160ASU 2011-04 are effective for the Company’s yearreporting periods beginning on or after December15, 2008, early adoption is prohibited.2011 and are to be applied prospectively. The Company is currently evaluating the impactdoes not expect that the adoption of this statementnew guidance will have a material impact on the Company’s consolidated financial position, results of operations andstatements or related note disclosures.
In December 2007, theJune 2011, FASB issued Statement of Financial Accounting Standards No. 141(R),Update 2011-05,Business CombinationsPresentation of Comprehensive Income (“FAS 141(R)”ASU 2011-05”). FAS 141(R) establishes how an entity accounts for identifiable assets acquired, liabilities assumed,, which revises the manner in which entities present comprehensive income in their financial statements. The new guidance amends FASB’s Accounting Standards Codification No. 220,Comprehensive Income(“ASC 220”), and any noncontrolling interests acquired, howgives reporting entities the option to account for goodwill acquiredpresent the total of comprehensive income, the components of net income, and determines what disclosures are required as partthe components of other comprehensive income in either a business combination. FAS 141(R) applies prospectively to business combinations forcontinuous statement of comprehensive income or two separate but consecutive statements. Under the two-statement approach, which the acquisition date is on or after the beginning ofCompany currently uses, the first annualstatement includes components of net income, and the second statement includes components of other comprehensive income. ASU 2011-05 does not change the items that must be reported in other comprehensive income. This new guidance is effective for reporting periodperiods beginning on or after December 15, 2008, early adoption2011 and is prohibited.to be applied retrospectively. The Company is currently evaluating FAS 141(R)does not expect the adoption of this guidance to determinehave an impact on the impact it will have, if any, on any future acquisitions.
In March 2008, the FASB issued Statement of Financial Accounting Standards No. 161,Disclosures about Derivative Instrumentsconsolidated financial statements or related note disclosures.Note 2. Cash and Hedging Activities (“FAS 161”). FAS 161 requires enhanced disclosures about howCash Equivalents
| | | | | | | | |
| | | December 31, | |
| | | 2011 | | | 2010 | |
Cash and cash equivalents | | € | 105,072 | | | € | 99,022 | |
| | | | | | | | |
Cash and why companies use derivatives, how derivative instruments and related hedged items are accountedcash equivalents includes cash allocated for and how derivative instruments and related hedged items affectdebt service reserves as required under a company’s financial position, financial performance and
83
MERCER INTERNATIONAL INC.
NOTES TO THE CONSOLIDATED FINANCIAL STATEMENTS
(In thousands of Euros, except per share data)
| |
Note 1. | The Company and Summary of Significant Accounting Policies — (Continued) |
cash flows. Note 3. Marketable Securities
The provisions of FAS 161Company’s marketable securities at December 31, 2011 and 2010 are effective for financial statements issued for fiscal years and interim periods beginning after November 15, 2008, with early adoption encouraged. Consequently, FAS 161 will be effective forsummarized as follows:
| | | | | | | | | | | | | | | | |
| December 31, 2011 | | Amortized
Cost | | | Gross
Unrealized
Gains | | | Gross
Unrealized
Losses | | | Fair
Value | |
Current | | | | | | | | | | | | | | | | |
0.5% German federal government bonds due June 2012 | | € | 2,008 | | | € | 3 | | | € | — | | | € | 2,011 | |
0.75% German federal government bonds due September 2012 | | | 7,036 | | | | 19 | | | | — | | | | 7,055 | |
5.00% German federal government bonds due July 2012 | | | 3,143 | | | | 7 | | | | — | | | | 3,150 | |
| | | | | | | | | | | | | | | | |
| | € | 12,187 | | | € | 29 | | | € | — | | | € | 12,216 | |
| | | | | | | | | | | | | | | | |
Long-term | | | | | | | | | | | | | | | | |
Equity securities | | € | 65 | | | € | 132 | | | € | (41 | ) | | € | 156 | |
| | | | | | | | | | | | | | | | |
| | | | | | | | | | | | | | | | |
| December 31, 2010 | | Amortized
Cost | | | Gross
Unrealized
Gains | | | Gross
Unrealized
Losses | | | Fair
Value | |
Long-term | | | | | | | | | | | | | | | | |
Equity securities | | € | 63 | | | € | 213 | | | € | (1 | ) | | € | 275 | |
| | | | | | | | | | | | | | | | |
In order to maintain the Company’s quarter ended March liquidity requirements and manage risk, the Company invests in low risk and highly liquid marketable debt securities that are classified as available-for-sale investments and accordingly are carried at fair value. As at December31, 2009. 2011, the Company had invested in German federal government bonds. The bonds are classified as current assets as they have contractual maturities of less than one year.
The Company ishas also invested nominal amounts in equity securities. The equity securities are classified as available-for-sale investments and accordingly are carried at fair value.
The Company recognizes any gross unrealized gains or losses through the “Accumulated other comprehensive income” line, and records investments in long-term marketable securities in the process of determiningConsolidated Balance Sheet within the impact, if any, the adoption of FAS 161 will have on its financial statement disclosures.
In April 2008, the FASB issued FASB Staff PositionNo. 142-3,Determination of the Useful Life of Intangible Assets (“FSP142-3”). FSP142-3 amends the factors that should be considered in developing renewal or extension assumptions used to determine the useful life of a recognized intangible asset under FASB Statement No. 142,Goodwill“Deferred note issuance and Other Intangible Assets (“FAS 142”). FSP142-3 is effective for financial statements issued for fiscal years beginning after December 15, 2008, and interim periods within those fiscal years. Early adoption is prohibited. other” line.The Company is reviewing FSP142-3reviews for other-than-temporary losses on a regular basis and is unable to estimatehas concluded that the impact on its financial position, results of operations or cash flows.
In May 2008, the FASB issued Statement of Financial Accounting Standards No. 162,The Hierarchy of Generally Accepted Accounting Principles (“FAS 162”). FAS 162 defines the sources of accounting principles and the framework for selecting the principles usedgross unrealized losses indicated above are temporary in the preparation of financial statements that are presented in conformity with generally accepted accounting principles in the United States. The provisions of FAS 162 are effective 60 days following the SEC’s approval of the Public Company Accounting Oversight Board amendment to AU Section 411,The Meaning of Present Fairly in Conformity With Generally Accepted Accounting Principles. The Company is in the process of determining the impact, if any, the adoption of FAS 162 will have on its financial statements and disclosures.
In May 2008, the FASB issued FASB Staff Position APB14-1Accounting for Convertible Debt Instruments that may be Settled in Cash upon Conversion (Including Partial Settlement) (“FSP14-1”). FSP14-1 states that convertible debt instruments that are within its scope are required to be separated into both a debt component and an equity component. In addition, any debt discount is to be accreted to interest expense over the expected life of the debt. The provisions of FSP14-1 are effective for financial statements issued for fiscal years beginning after December 15, 2008, and implementation is generally required to be retrospective. Early adoption is not permitted. The Company is in the process of determining the impact, if any, the adoption of FSP14-1 will have on its financial statements and disclosures.
| |
Note 2. | Cash, Cash Equivalents and Restricted Cash |
Cash, cash equivalents and restricted cash includes restricted cash for debt service reserves as required under debt agreements (Note 7(a)). The Company maintains cash balances in foreign financial institutions in excess of insured limits.
| | | | | | | | | |
| | | December 31, | |
| | | 2008 | | | 2007 | |
| |
| Cash and cash equivalents | | € | 42,452 | | | € | 84,848 | |
| | | | | | | | | |
| Cash, restricted | | € | 13,000 | | | € | 33,000 | |
| | | | | | | | | |
84
MERCER INTERNATIONAL INC.
NOTES TO THE CONSOLIDATED FINANCIAL STATEMENTS
(In thousands of Euros, except per share data)
| |
Note 2. | Cash, Cash Equivalents and Restricted Cash — (Continued) |
| | | | | | | | | |
| | | December 31, | |
| | | 2008 | | | 2007 | |
| |
| Sale of pulp (net of allowance of €614 and €626, respectively) | | € | 85,120 | | | € | 81,913 | |
| Value added tax | | | 3,433 | | | | 2,673 | |
| Other | | | 11,605 | | | | 5,304 | |
| | | | | | | | | |
| | | € | 100,158 | | | € | 89,890 | |
| | | | | | | | | |
Note 4. Receivables
| | | | | | | | |
| | | December 31, | |
| | | 2011 | | | 2010 | |
Sale of pulp and energy (net of allowance of €105 and €1,005, respectively) | | € | 108,094 | | | € | 108,567 | |
Value added tax | | | 7,411 | | | | 3,669 | |
Other | | | 4,982 | | | | 9,473 | |
| | | | | | | | |
| | € | 120,487 | | | € | 121,709 | |
| | | | | | | | |
The Company reviews the collectability of receivables on a periodic basis. The Company maintains an allowance for doubtful accounts at an amount estimated to cover the potential losses on anycertain uninsured receivables. Any amounts that are determined to be uncollectible and uninsured are offset against the allowance. The allowance is based on the Company’s evaluation of numerous factors, including the payment history and financial position of the debtors. TheFor certain customers the Company does not generally require collateralreceives a letter of credit prior to shipping its product.
As at December31,2011, pursuant to a contribution agreement under the Pulp and Paper Green Transformation Program (“GTP”), the Company recorded €634 (C$0.9 million) within other receivables in relation to the Oxygen Delignification Project and €1,858 (C$2.4 million) for any of its receivables.
our various remaining GTP projects. As at December 31, 2010 €7,700 (C$10.2 million) was recorded within other receivables in relation to the Green Energy Project.Other than the above mentioned items, other receivables relates to non-trade receivables that are individually not material.
��
| | | | | | | | | |
| | | December 31, | |
| | | 2008 | | | 2007 | |
| |
| Raw materials | | € | 38,225 | | | € | 38,045 | |
| Finished goods | | | 37,881 | | | | 43,127 | |
| Work in process and other | | | 22,351 | | | | 22,438 | |
| | | | | | | | | |
| | | € | 98,457 | | | € | 103,610 | |
| | | | | | | | | |
As at December 31, 2008, the Company recorded provisions totaling approximately €4,200 (2006 and 2007 — nil) against finished goods inventories. In addition, the Company recorded provisions totaling approximately €7,100 (2007 and 2006 — nil) against raw material inventories. The provisions were primarily the result of the decline in the US dollar price of NBSK pulp. The provisions against finished goods and raw material inventories are included in “Operating costs”.
Note 5. Inventories
| | | | | | | | |
| | | December 31, | |
| | | 2011 | | | 2010 | |
Raw materials | | € | 48,063 | | | € | 47,179 | |
Finished goods | | | 41,392 | | | | 27,127 | |
Spare parts, work in process and other | | | 31,084 | | | | 27,913 | |
| | | | | | | | |
| | € | 120,539 | | | € | 102,219 | |
| | | | | | | | |
| |
Note 5. | Property, Plant and Equipment |
| | | | | | | | | |
| | | December 31, | |
| | | 2008 | | | 2007 | |
| |
| Land | | € | 24,661 | | | € | 24,538 | |
| Buildings | | | 125,046 | | | | 125,369 | |
| Production equipment and other | | | 1,061,991 | | | | 1,070,202 | |
| | | | | | | | | |
| | | | 1,211,698 | | | | 1,220,109 | |
| Less: Accumulated depreciation | | | (329,994 | ) | | | (286,851 | ) |
| | | | | | | | | |
| | | € | 881,704 | | | € | 933,258 | |
| | | | | | | | | |
IncludedNote 6. Property, Plant and Equipment
| | | | | | | | |
| | | December 31, | |
| | | 2011 | | | 2010 | |
Land | | € | 25,156 | | | € | 25,137 | |
Buildings | | | 133,316 | | | | 131,546 | |
Production equipment and other | | | 1,125,953 | | | | 1,130,294 | |
| | | | | | | | |
| | | 1,284,425 | | | | 1,286,977 | |
Less: accumulated depreciation | | | (463,451 | ) | | | (440,210 | ) |
| | | | | | | | |
| | € | 820,974 | | | € | 846,767 | |
| | | | | | | | |
MERCER INTERNATIONAL INC.
NOTES TO THE CONSOLIDATED FINANCIAL STATEMENTS
(In thousands of Euros, except per share data)
Note 6. Property, Plant and Equipment (continued)
As at December 31, 2011 property, plant and equipment was net of €291,655 of unamortized government investment grants (2010 – €297,992).
As at December31,2011, included in production equipment and other is equipment under capital leases which had gross amounts of €17,682 and €17,765,€17,036 (2010 – €17,468), and accumulated depreciation of €6,837 and €9,005, respectively, as at December 31, 2008 and 2007.€9,096 (2010 – €9,585). During the years 2008, 2007 and 2006,year production equipment and other totaling €5,318, €3,286 and €3,301, respectively,totalling €2,782 was acquired under capital lease obligations.
85
The Company maintains industrial landfills on its premises for the disposal of waste, primarily from the mill’s pulp processing activities. The mills have obligations under their landfill permits to decommission these disposal facilities pursuant to the requirements of its local regulations. As at December31,2011, the Company had recorded €4,170 (2010 – €4,180) of asset retirement obligations in the “Capital leases and other” line in the Consolidated Balance Sheet.Note 7. Accounts Payable and Other | | | | | | | | |
| | | December 31, | |
| | | 2011 | | | 2010 | |
Trade payables | | € | 45,751 | | | € | 36,680 | |
Accrued expenses | | | 28,422 | | | | 27,452 | |
Accrued interest | | | 10,054 | | | | 13,640 | |
Capital leases, current portion (Note 16) | | | 2,505 | | | | 3,240 | |
Other | | | 12,908 | | | | 3,861 | |
| | | | | | | | |
| | € | 99,640 | | | € | 84,873 | |
| | | | | | | | |
On January 28, 2011, the Company received approximately €10,000, which was intended to compensate the Company for remediation work that is required at the Stendal mill. The €10,000 was recognized as an increase in cash, and a corresponding increase in other accounts payable. As at December 31, 2011, the Company had €9,150 remaining in other accounts payable (see Note 17(c)—Commitments and Contingencies).
MERCER INTERNATIONAL INC.
NOTES TO THE CONSOLIDATED FINANCIAL STATEMENTS
(In thousands of Euros, except per share data)
| |
Note 5. | Property, Plant and Equipment — (Continued) |
CertainNote 8. Debt
Debt consists of the assets atfollowing:
| | | | | | | | |
| | | December 31, | |
| | | 2011 | | | 2010 | |
Note payable to bank, included in a total loan credit facility of €827,950 to finance the construction related to the Stendal mill (a) | | € | 477,490 | | | € | 500,657 | |
Senior notes due February 2013, interest at 9.25% accrued and payable semi-annually, unsecured (b) | | | — | | | | 15,341 | |
Senior notes due December 2017, interest at 9.50% accrued and payable semi-annually, unsecured (c) | | | 220,753 | | | | 224,031 | |
Subordinated convertible notes due January 2012, interest at 8.50% accrued and payable semi-annually (d) | | | — | | | | 31,707 | |
Credit agreement with a lender with respect to a revolving credit facility of C$40 million (e) | | | — | | | | 15,016 | |
Loan payable to the noncontrolling shareholder of the Stendal mill (f) | | | 33,124 | | | | 31,365 | |
Credit agreement with a bank with respect to a revolving credit facility of €25,000 (g) | | | — | | | | — | |
Investment loan agreement with a lender with respect to the wash press project at the Rosenthal mill of €4,351 (h) | | | 2,719 | | | | 3,807 | |
Credit agreement with a bank with respect to a revolving credit facility of €3,500 (i) | | | — | | | | — | |
| | | | | | | | |
| | | 734,086 | | | | 821,924 | |
Less: current portion | | | (25,671 | ) | | | (39,596 | ) |
| | | | | | | | |
Debt, less current portion | | € | 708,415 | | | € | 782,328 | |
| | | | | | | | |
The Company made principal repayments under these facilities of €63,845 in 2011, and expects the Celgar millprincipal repayments to be €25,671 in 2012. As of December 31, 2011, the principal maturities of debt are subject to a lien registered for the benefit of a government revenue agency. The lien was registered pursuant to a property transfer tax dispute that is currently before the courts. SeeNote 16-Commitments and Contingencies.
| |
Note 6. | Accounts Payable and Accrued Expenses |
| | | | | | | | | |
| | | December 31, | |
| | | 2008 | | | 2007 | |
| |
| Trade payables | | € | 31,140 | | | € | 37,245 | |
| Accounts payable and other | | | 4,559 | | | | 3,097 | |
| Accrued expenses | | | 31,181 | | | | 25,752 | |
| Accrued interest | | | 17,202 | | | | 17,437 | |
| Capital leases, current portion | | | 3,435 | | | | 3,469 | |
| | | | | | | | | |
| | | € | 87,517 | | | € | 87,000 | |
| | | | | | | | | |
as follows: | | | | |
Matures | | Amount | |
2012 | | € | 25,671 | |
2013 | | | 41,088 | |
2014 | | | 40,543 | |
2015 | | | 44,000 | |
Thereafter | | | 582,784 | |
| | | | |
| | € | 734,086 | |
| | | | |
Certain of the Company’s debt agreementsinstruments were issued under an indenture which, among other things, restricts its ability and the ability of its restricted subsidiaries to make certain payments. These limitations are subject to other important qualifications and exceptions. As at December 31, 2008,2011, the Company was in compliance with the terms of the indenture.
Debt consists of the following:
| | | | | | | | | |
| | | December 31, | |
| | | 2008 | | | 2007 | |
| |
| Note payable to bank, included in a total credit facility of €827,950 to finance the construction related to the Stendal pulp mill (a) | | € | 531,073 | | | € | 565,096 | |
| Senior notes due February 2013, interest at 9.25% accrued and payable semi-annually, unsecured (b) (Note 11) | | | 222,718 | | | | 212,285 | |
| Subordinated convertible notes due October 2010, interest at 8.5% accrued and payable semi-annually (c) (Note 11) | | | 48,319 | | | | 46,056 | |
| Credit agreement with a syndicate of banks with respect to a revolving credit facility of C$40 million (d) | | | 18,186 | | | | 15,248 | |
| Loans payable to minority shareholders of Stendal pulp mill (e) | | | — | | | | 11,170 | |
| Credit agreement with bank with respect to a revolving credit facility of €40 million (f) | | | — | | | | — | |
| | | | | | | | | |
| | | | 820,296 | | | | 849,855 | |
| Less: current portion | | | (16,500 | ) | | | (34,023 | ) |
| | | | | | | | | |
| Debt, less current portion | | € | 803,796 | | | € | 815,832 | |
| | | | | | | | | |
86
MERCER INTERNATIONAL INC.
NOTES TO THE CONSOLIDATED FINANCIAL STATEMENTS
(In thousands of Euros, except per share data)
| (a) | |
Note 7. | Debt — (Continued) |
The Company made scheduled principal repayments under these facilities of €34,023 in 2008, and expects the principle repayments to be €16,500 in 2009 pursuant to an amendment to the Stendal credit facility as noted in Note 19 - Subsequent Events. As of December 31, 2008, the principal maturities of debt are as follows:
| | | | | |
Matures | | Amount | |
| |
| 2009 | | € | 16,500 | |
| 2010 | | | 80,421 | |
| 2011 | | | 23,167 | |
| 2012 | | | 24,583 | |
| 2013 | | | 262,718 | |
| Thereafter | | | 412,907 | |
| | | | | |
| | | € | 820,296 | |
| | | | | |
| |
(a) | Note payable to bank, included in a total creditloan facility of €827,950 to finance the construction related to the Stendal pulp mill (“Stendal Loan Facility”), interest at rates varying from Euribor plus 0.90% to Euribor plus 1.85%1.69% (rates on amounts of borrowing at December 31, 20082011 range from 6.19%2.65% to 6.42%3.55%), principal due in required installments beginning September 30, 2006 until September 30, 2017, collateralized by the assets of the Stendal pulp mill, and at December 31, 2008, restricted cash amounting to €13,000, with 48% and 32% guaranteed by the Federal Republic of Germany and the State of |
MERCER INTERNATIONAL INC.
NOTES TO THE CONSOLIDATED FINANCIAL STATEMENTS
(In thousands of Euros, except per share data)
Note 8. Debt (continued)
| Saxony-Anhalt, respectively, of up to €516,073€417,490 of outstanding principal, balance, subject to a debt service reserve account (“DSRA”) required to pay amounts due in the following twelve months under the terms of credit facility;the Stendal Loan Facility; payment of dividends is only permitted if certain cash flow requirements are met. See Note 19 Subsequent Events.15—Financial Instruments for a discussion of the Company’s variable-to-fixed interest rate swap that was put in place to effectively fix the interest rate on the Stendal Loan Facility. |
|
On March 13, 2009, the Company finalized an agreement with its lenders to amend its Stendal Loan Facility. The amendment deferred approximately €164,000 of scheduled principal payments until the maturity date, September 30, 2017. The amendment also provided for a 100% cash sweep, referred to as the “Cash Sweep”, of any cash in excess of a €15,000 working capital reserve and the Guarantee Amount, as discussed in Note 17—Commitments and Contingencies, held by Stendal which will be used first to fund the DSRA to a level sufficient to service the amounts due and payable under the Stendal Loan Facility during the then following 12 months, which means the DSRA is “Fully Funded”, and second to prepay the deferred principal amounts. As at December 31, 2011, the DSRA balance was approximately €31,800 and was not Fully Funded.
| (b) | In February 2005, the Company issued $310 million of senior notes due February 2013 (“2013 Notes”), which bore interest at 9.25% accrued, and payable semi-annually, and were unsecured. |
On November17,2010, the Company used the proceeds from a private offering of $300 million in aggregate principal amount of senior notes due 2017, described in Note 8(c) below, and cash on hand to complete a tender offer to repurchase approximately $289 million aggregate principal amount of its 2013 Notes. Pursuant to FASB’s Accounting Standards Codification No. 405,Liabilities—Extinguishment of Liabilities (“ASC 405”), the Company concluded that the tendering of the 2013 Notes met the definition of debt extinguishment. In connection with this tender offer and pursuant to FASB’s Accounting Standards Codification No. 470,Debt-Modifications and Extinguishments (“ASC 470”), the Company recorded a loss of approximately €7,500 to the “Gain (loss) on extinguishment of debt” line in the Consolidated Statement of Operations which included the tender premium paid and the write-off of unamortized debt issuance costs.
On February15,2011, the Company redeemed for cash all of its outstanding 2013 Notes, for a price equal to 100% of the principal amount of $20.5 million, plus accrued and unpaid interest to, but not including February15,2011. In total, the Company paid approximately $21.5 million (€15,900) in connection with the redemption of the 2013 Notes.
| (c) | On or after February 15, November17,2010, the Company completed a private offering of $300 million in aggregate principal amount of senior notes due 2017 (“2017 Notes”). The proceeds from this offering were used to finance the tender offer and consent solicitation for approximately $289 million of the Company’s 2013 Notes, see Note 8(b). The 2017 Notes were issued at a price of 100% of their principal amount. The 2017 Notes will mature on December1,2017 and bear interest at 9.50% which is accrued and payable semi-annually. |
In August 2011, the Company’s Board of Directors authorized the purchase of up to $25.0 million in aggregate principal amount of the Company’s 2017 Notes from time to time, over a period ending August 2012. During the twelve months ended December 31, 2011, the Company purchased $13.6 million of its outstanding 2017 Notes, which in aggregate, were purchased at a nominal discount to the principal amount thereof, plus accrued and unpaid interest to, but not including the repurchase date. Pursuant to ASC 470, the Company recognized a loss of €71 on the extinguishment of these notes, in the “Gain (loss) on extinguishment of debt” line in the Consolidated Statement of Operations, mainly relating to the write-off of unamortized debt issuance costs.
MERCER INTERNATIONAL INC.
NOTES TO THE CONSOLIDATED FINANCIAL STATEMENTS
(In thousands of Euros, except per share data)
Note 8. Debt (continued)
The 2017 Notes are general unsecured senior obligations of the Company. The 2017 Notes rank equal in right of payment with all existing and future senior unsecured indebtedness of the Company and senior in right of payment to any current or future subordinated indebtedness of the Company. The 2017 Notes are effectively junior in right of payment to all borrowings of the Company’s restricted subsidiaries, including borrowings under the Company’s credit agreements which are secured by certain assets of its restricted subsidiaries.
The Company may redeem all or a part of the 2017 Notes, upon not less than 30 days or more than 60 days’ notice, at the redemption prices (expressed as percentages of principal amount) equal to 104.75% for the twelve-month period beginning on December1,2014, 102.38% for the twelve-month period beginning on December1,2015, and 100.00% beginning on December1,2016, and at any time thereafter, plus accrued and unpaid interest.
| (d) | In December2009, the Company may redeem all or a part of the notes at redemption prices (expressed as a percentage of principal amount) equal to 104.63% for the twelve month period beginning on February 15, 2009, 102.31% for the twelve month period beginning on February 15, 2010, and 100.00% beginning on February 15, 2011 and at any time thereafter, plus accrued and unpaid interest. |
|
(c) | As at December 31, 2008, the subordinated convertible notes hadexchanged approximately $67.3$43.3 million of principal outstanding. The subordinated convertible notes areSubordinated Convertible Notes due October2010 bear interest at 8.5% accrued and payable semi-annually, are convertible at any time by(the “2010 Notes”) through two private exchange agreements with the holder into common sharesholders thereof for approximately $43.8 million of Subordinated Convertible Notes due January 2012 (the “2012 Notes”). On January 22, 2010, through an exchange offer with the Company at $7.75 per share and are unsecured. The Company may redeem for cash all or a portion of these notes at any time on or after October 15, 2008 at 100% of the principal amount of the notes plus accrued and unpaid interest up to the redemption date. Theremaining holders of the convertible notes will have the option to require2010 Notes, the Company to purchaseexchanged a further $21.7 million of 2010 Notes for cash all or a portionapproximately $22.0 million of the notes not previously redeemed upon a specified change of control at a price equal to 100%Company’s 2012 Notes. The Company recognized both exchange transactions of the principal.Subordinated Convertible Notes as extinguishments of debt in accordance with ASC 470, because the fair value of the embedded conversion option changed by more than 10% in both transactions. During 2010, the Company recognized a loss of €929 as a result of the January22,2010 exchange. The loss was determined using the fair market value prevailing at the time of the transaction, and yielded an effective interest rate of approximately 3% on the January 22, 2010 exchange. |
The 2012 Notes bore interest at 8.50%, accrued and payable semi-annually, were convertible at any time by the holder into common shares of the Company at $3.30 per share and were unsecured. The Company could redeem for cash all or a portion of the 2012 Notes on or after July 15, 2011 at 100% of the principal amount of the notes plus accrued interest up to the redemption date. During the twelve months ended December31,2011, $44.4 million of 2012 Notes were converted into 13,446,679 common shares and the Company paid $1.5 million of accrued and unpaid interest. Pursuant to the 2012 Notes indenture, on July15,2011, the nominal amount of remaining 2012 Notes were redeemed by the Company on July15,2011 at par plus accrued and unpaid interest to, but not including, July15,2011. In accordance with FASB’s Accounting Standards Codification No. 470Debt—Debt with Conversions and Other Options(“ASC 470”), the Company recorded the carrying amount of the converted 2012 Notes, which included approximately €800 of unamortized discount, as an increase to share capital.
|
(d) (e) | Credit agreement with respect to a revolving credit facility of C$4040.0 million on a three year term.for the Celgar mill. The credit agreement matures May 2013. Borrowings under the credit agreement are securedcollateralized by pulp millthe mill’s inventory and receivables and are restricted by a borrowing base calculated on the mill’s inventory and receivables. Canadian dollar denominated amounts bear interest at bankers acceptance plus 2.25%3.75% or Canadian prime plus 0.50%2.00%. U.S. dollar denominated amounts bear interest at LIBOR plus 2.25%3.75% or U.S. base plus 0.50%2.00%. The Company fully repaid this facility on March30,2011. As at December31, 2008,2011, C$1.7 million of this facility was drawn bysupporting letters of credit, leaving C$3138.3 million and was accruing interest at a rate of approximately 3.90%. The credit agreement matures May 19, 2009, but is subject to a one-year extension at the Company’s request. On January 23, 2009, the Company was granted a one-year extension pursuant to the terms of the credit agreement. The extension carries the same general terms and matures May 19, 2010.available. |
87
MERCER INTERNATIONAL INC.
NOTES TO THE CONSOLIDATED FINANCIAL STATEMENTS
(In thousands of Euros, except per share data)
Note 8. Debt (continued)
| (f) | |
Note 7. | Debt — (Continued) |
| |
(e) | LoansA loan payable by the Stendal mill to the minorityits noncontrolling shareholder of Stendal pulp mill bearbears interest at 7%7.00%, and is accrued semi-annually. The loan payable in September 2006 then payable semi-annually beginning March 2007,is unsecured, subordinated to all liabilities of the Stendal pulp mill, non-recourse to the Company and its restricted subsidiaries, and is due in 2017. The amounts outstanding on these loans were €34,122balance includes principal and €32,216 asaccrued interest. During the first quarter of 2010, the noncontrolling shareholder converted €6,275 of accrued interest into a capital contribution. |
| (g) | A €25,000 working capital facility at the Rosenthal mill that matures in December 31, 2008 and 2007, respectively. Cumulative net losses of Stendal in the amounts of €34,122 and €21,305 were applied to these loans in 2008 and 2007, respectively. The net obligation of €nil and €11,170 is reflected for 2008 and 2007, respectively. |
|
(f) | Credit agreement with respect to a revolving credit facility of €40,000.2012. Borrowings under the credit agreementfacility are securedcollateralized by pulp millthe mill’s inventory and receivables. Borrowings under the credit agreementreceivables and bear interest at Euribor plus 1.55%3.50%. As at December 31, 2008,2011, approximately €2,200 of this facility was undrawn.supporting bank guarantees leaving approximately €22,800 available. |
| (h) | A four-year amortizing investment loan agreement with a lender relating to the new wash press at the Rosenthal mill with a total facility of €4,351 bearing interest at the rate of Euribor plus 2.75% that matures August 2013. Borrowings under this agreement are secured by the new wash press equipment. As at December31,2011, the balance outstanding was €2,719 and was accruing interest at a rate of 4.57%. |
| (i) | On February8,2010, the Rosenthal mill finalized a credit agreement with a lender for a €3,500 facility maturing in December2012. Borrowings under this facility bear interest at the rate of the three-month Euribor plus 3.50% and are secured by certain land at the Rosenthal mill. As at December31,2011, this facility was undrawn. |
| |
Note 8. | Pension and Other Post-Retirement Benefit Obligations |
Note 9. Pension and Other Post-Retirement Benefit Obligations
Included in pension and other post-retirement benefit obligations are amounts related to the Company’s Celgar and German pulpRosenthal mills.
The largest component of this obligation is with respect to the Celgar mill which maintains
a defined benefit pension
plans and post-retirement
benefitsbenefit plans for certain employees (“Celgar Plans”).
Pension benefits are based on employee’s earnings and years of service. The Celgar Plans are funded by contributions from the Company based on actuarial estimates and statutory requirements.
Pension contributions for the twelve-month period ended December31,2011 totaled €2,039 (2010 – €1,053).Effective December 31,2008, the defined benefit plan will bewas closed to new members. In addition, the defined benefit service accrual will ceaseceased on December 31,2008, and members will beginbegan to accruereceive pension benefits, at a fixed contractual rate, under a new defined contribution plan effective January 1,2009.
During the year the Company made contributions of €524 (2010 – €490) to this plan.MERCER INTERNATIONAL INC.
NOTES TO THE CONSOLIDATED FINANCIAL STATEMENTS
(In thousands of Euros, except per share data)
Note 9. Pension and Other Post-Retirement Benefit Obligations (continued)
Information about the Celgar Plans, in aggregate for the year ended December 31, 20082011 is as follows:
| | | | | | | | | | | | | |
| | | 2008 | |
| | | | | | Other
| | | | |
| | | | | | Post-Retirement
| | | | |
| | | | | | Benefit
| | | | |
| | | Pension | | | Obligations | | | Total | |
| |
| Change in benefit obligation | | | | | | | | | | | | |
| Benefit obligation, December 31, 2007 | | € | 27,832 | | | € | 16,137 | | | € | 43,969 | |
| Service cost | | | 789 | | | | 501 | | | | 1,290 | |
| Interest cost | | | 1,356 | | | | 800 | | | | 2,156 | |
| Benefit payments | | | (1,417 | ) | | | (381 | ) | | | (1,798 | ) |
| Past service cost (credit) | | | 973 | | | | (1,152 | ) | | | (179 | ) |
| Actuarial (gains) losses | | | (5,557 | ) | | | (3,442 | ) | | | (8,999 | ) |
| Foreign currency exchange rate changes | | | (3,948 | ) | | | (2,166 | ) | | | (6,114 | ) |
| | | | | | | | | | | | | |
| Benefit obligation, December 31, 2008 | | | 20,028 | | | | 10,297 | | | | 30,325 | |
| | | | | | | | | | | | | |
| Reconciliation of fair value of plan assets | | | | | | | | | | | | |
| Fair value of plan assets, December 31, 2007 | | | 23,903 | | | | — | | | | 23,903 | |
| Actual returns | | | (4,084 | ) | | | — | | | | (4,084 | ) |
| Contributions | | | 2,077 | | | | 381 | | | | 2,458 | |
| Benefit payments | | | (1,417 | ) | | | (381 | ) | | | (1,798 | ) |
| Foreign currency exchange rate changes | | | (3,381 | ) | | | — | | | | (3,381 | ) |
| | | | | | | | | | | | | |
| Fair value of plan assets, December 31, 2008 | | | 17,098 | | | | — | | | | 17,098 | |
| | | | | | | | | | | | | |
| Funded status, December 31, 2008 | | € | (2,930 | ) | | € | (10,297 | ) | | € | (13,227 | )(1) |
| | | | | | | | | | | | | |
88
| | | | | | | | | | | | |
| | | 2011 | |
| | | | | | Other | | | | |
| | | Post-Retirement | |
| | | | | | Benefit | | | | |
| | | Pension | | | Obligations | | | Total | |
Change in benefit obligation | | | | | | | | | | | | |
Benefit obligation, December 31, 2010 | | € | 32,068 | | | € | 16,643 | | | € | 48,711 | |
Service cost | | | 87 | | | | 469 | | | | 556 | |
Interest cost | | | 1,511 | | | | 815 | | | | 2,326 | |
Benefit payments | | | (1,716 | ) | | | (461 | ) | | | (2,177 | ) |
Past service cost (credit) | | | — | | | | — | | | | — | |
Actuarial losses | | | 3,382 | | | | 2,049 | | | | 5,431 | |
Foreign currency exchange rate changes | | | 446 | | | | 282 | | | | 728 | |
| | | | | | | | | | | | |
Benefit obligation, December 31, 2011 | | | 35,778 | | | | 19,797 | | | | 55,575 | |
| | | | | | | | | | | | |
Reconciliation of fair value of plan assets | | | | | | | | | | | | |
Fair value of plan assets, December 31, 2010 | | | 23,863 | | | | — | | | | 23,863 | |
Actual returns | | | (204 | ) | | | — | | | | (204 | ) |
Contributions | | | 1,578 | | | | 461 | | | | 2,039 | |
Benefit payments | | | (1,716 | ) | | | (461 | ) | | | (2,177 | ) |
Foreign currency exchange rate changes | | | 213 | | | | — | | | | 213 | |
| | | | | | | | | | | | |
Fair value of plan assets, December 31, 2011 | | | 23,734 | | | | — | | | | 23,734 | |
| | | | | | | | | | | | |
Funded status, December 31, 2011(1) | | € | (12,044 | ) | | € | (19,797 | ) | | € | (31,841 | ) |
| | | | | | | | | | | | |
Components of the net benefit cost recognized | | | | | | | | | | | | |
Service cost | | € | 87 | | | € | 469 | | | € | 556 | |
Interest cost | | | 1,511 | | | | 815 | | | | 2,326 | |
Expected return on plan assets | | | (1,549 | ) | | | — | | | | (1,549 | ) |
Amortization of recognized items | | | 511 | | | | (69 | ) | | | 442 | |
| | | | | | | | | | | | |
Net benefit costs | | € | 560 | | | € | 1,215 | | | € | 1,775 | |
| | | | | | | | | | | | |
| (1) | The total of €31,953 on the Consolidated Balance Sheet also includes the pension liabilities of €112 relating to employees at the Company’s Rosenthal operation. |
MERCER INTERNATIONAL INC.
NOTES TO THE CONSOLIDATED FINANCIAL STATEMENTS
(In thousands of Euros, except per share data)
| |
Note 8. | Pension and Other Post-Retirement Benefit Obligations — (Continued) |
| | | | | | | | | | | | | |
| | | 2008 | |
| | | | | | Other
| | | | |
| | | | | | Post-Retirement
| | | | |
| | | | | | Benefit
| | | | |
| | | Pension | | | Obligations | | | Total | |
| |
| Components of the net benefit cost recognized | | | | | | | | | | | | |
| Service cost | | € | 789 | | | € | 501 | | | € | 1,290 | |
| Interest cost | | | 1,356 | | | | 800 | | | | 2,156 | |
| Expected return on plan assets | | | (1,542 | ) | | | — | | | | (1,542 | ) |
| Amortization of recognized items | | | (6 | ) | | | 83 | | | | 77 | |
| | | | | | | | | | | | | |
| Net benefit costs | | € | 597 | | | € | 1,384 | | | € | 1,981 | |
| | | | | | | | | | | | | |
| | |
(1) | | The total of €13,356 on the consolidated balance sheets also includes the pension liabilities of €129 relating to employees at the Company’s German operations. |
Note 9. Pension and Other Post-Retirement Benefit Obligations (continued)
Information about the Celgar Plans, in aggregate for the year ended December 31, 20072010 is as follows:
| | | | | | | | | | | | | |
| | | 2007 | |
| | | | | | Other
| | | | |
| | | | | | Post-Retirement
| | | | |
| | | | | | Benefit
| | | | |
| | | Pension | | | Obligations | | | Total | |
| |
| Change in benefit obligation | | | | | | | | | | | | |
| Benefit obligation, December 31, 2006 | | € | 25,990 | | | € | 13,867 | | | € | 39,857 | |
| Service cost | | | 840 | | | | 473 | | | | 1,313 | |
| Interest cost | | | 1,363 | | | | 741 | | | | 2,104 | |
| Benefit payments | | | (1,593 | ) | | | (323 | ) | | | (1,916 | ) |
| Actuarial (gains) losses | | | (481 | ) | | | 442 | | | | (39 | ) |
| Foreign currency exchange rate changes | | | 1,713 | | | | 937 | | | | 2,650 | |
| | | | | | | | | | | | | |
| Benefit obligation, December 31, 2007 | | | 27,832 | | | | 16,137 | | | | 43,969 | |
| | | | | | | | | | | | | |
| Reconciliation of fair value of plan assets | | | | | | | | | | | | |
| Fair value of plan assets, December 31, 2006 | | | 21,993 | | | | — | | | | 21,993 | |
| Actual returns | | | 351 | | | | — | | | | 351 | |
| Contributions | | | 1,698 | | | | 323 | | | | 2,021 | |
| Benefit payments | | | (1,593 | ) | | | (323 | ) | | | (1,916 | ) |
| Foreign currency exchange rate changes | | | 1,454 | | | | — | | | | 1,454 | |
| | | | | | | | | | | | | |
| Fair value of plan assets, December 31, 2007 | | | 23,903 | | | | — | | | | 23,903 | |
| | | | | | | | | | | | | |
| Funded status, December 31, 2007 | | € | (3,929 | ) | | € | (16,137 | ) | | € | (20,066 | )(1) |
| | | | | | | | | | | | | |
| Components of the net benefit cost recognized | | | | | | | | | | | | |
| Service cost | | € | 840 | | | € | 473 | | | € | 1,313 | |
| Interest cost | | | 1,363 | | | | 741 | | | | 2,104 | |
| Expected return on plan assets | | | (1,673 | ) | | | — | | | | (1,673 | ) |
| Amortization of recognized items | | | — | | | | 62 | | | | 62 | |
| | | | | | | | | | | | | |
| Net benefit costs | | € | 530 | | | € | 1,276 | | | € | 1,806 | |
| | | | | | | | | | | | | |
| | | | | | | | | | | | |
| | | 2010 | |
| | | Pension | | | Other
Post-Retirement
Benefit
Obligations | | | Total | |
Change in benefit obligation | | | | | | | | | | | | |
Benefit obligation, December 31, 2009 | | € | 27,219 | | | € | 12,073 | | | € | 39,292 | |
Service cost | | | 81 | | | | 391 | | | | 472 | |
Interest cost | | | 1,672 | | | | 771 | | | | 2,443 | |
Benefit payments | | | (2,494 | ) | | | (483 | ) | | | (2,977 | ) |
Past service cost (credit) | | | — | | | | — | | | | — | |
Actuarial losses | | | 2,118 | | | | 2,289 | | | | 4,407 | |
Foreign currency exchange rate changes | | | 3,472 | | | | 1,602 | | | | 5,074 | |
| | | | | | | | | | | | |
Benefit obligation, December 31, 2010 | | | 32,068 | | | | 16,643 | | | | 48,711 | |
| | | | | | | | | | | | |
Reconciliation of fair value of plan assets | | | | | | | | | | | | |
Fair value of plan assets, December 31, 2009 | | | 20,947 | | | | — | | | | 20,947 | |
Actual returns | | | 2,189 | | | | — | | | | 2,189 | |
Contributions | | | 570 | | | | 483 | | | | 1,053 | |
Benefit payments | | | (2,494 | ) | | | (483 | ) | | | (2,977 | ) |
Foreign currency exchange rate changes | | | 2,651 | | | | — | | | | 2,651 | |
| | | | | | | | | | | | |
Fair value of plan assets, December 31, 2010 | | | 23,863 | | | | — | | | | 23,863 | |
| | | | | | | | | | | | |
Funded status, December 31, 2010(1) | | € | (8,205 | ) | | € | (16,643 | ) | | € | (24,848 | ) |
| | | | | | | | | | | | |
Components of the net benefit cost recognized | | | | | | | | | | | | |
Service cost | | € | 81 | | | € | 391 | | | € | 472 | |
Interest cost | | | 1,672 | | | | 771 | | | | 2,443 | |
Expected return on plan assets | | | (1,563 | ) | | | — | | | | (1,563 | ) |
Amortization of recognized items | | | 438 | | | | (310 | ) | | | 128 | |
| | | | | | | | | | | | |
Net benefit costs | | € | 628 | | | € | 852 | | | € | 1,480 | |
| | | | | | | | | | | | |
| | |
| (1) | | The total of €20,476€24,964 on the consolidated balance sheetsConsolidated Balance Sheet also includes the pension liabilities of €410€116 relating to employees at the Company’s German operations.Rosenthal operation. |
89
MERCER INTERNATIONAL INC.
NOTES TO THE CONSOLIDATED FINANCIAL STATEMENTS
(In thousands of Euros, except per share data)
| |
Note 8. | Pension and Other Post-Retirement Benefit Obligations — (Continued) |
The Company anticipates that it will make contributions to the pension planCelgar Plans of approximately €841€1,501 in 2009.2012. Estimated future benefit payments under the Celgar Plans are as follows:
| | | | | |
| | | Amount | |
| |
| 2009 | | € | 1,765 | |
| 2010 | | | 1,871 | |
| 2011 | | | 1,963 | |
| 2012 | | | 2,073 | |
| 2013 | | | 2,197 | |
| 2014 — 2018 | | | 13,108 | |
| | | | |
| | | Amount | |
2012 | | € | 2,475 | |
2013 | | | 2,612 | |
2014 | | | 2,754 | |
2015 | | | 2,890 | |
2016 | | | 3,033 | |
2017 – 2021 | | | 16,938 | |
MERCER INTERNATIONAL INC.
NOTES TO THE CONSOLIDATED FINANCIAL STATEMENTS
(In thousands of Euros, except per share data)
Note 9. Pension and Other Post-Retirement Benefit Obligations (continued)
During the year ended December 31, 2008,2011, the Company recognized €4,079a loss, net of tax of €8,049 in other comprehensive income (2007 —(2010 – loss of €809, 2006 —€3,314; 2009 – loss of €3,789)€3,128). As at December 31, 2008,2011, the pension related accumulated other comprehensive income balance of €850 (2007 — €4,929)€15,341 (2010 – €7,292) is a result of net actuarial losses. These amounts have been stated net of tax. The Celgar Plans do not have any net transition asset or obligation recognized as a reclassification adjustment of other comprehensive income. The amount included in other comprehensive income which is expected to be recognized in 20092012 is approximately €89€1,106 of net actuarial gains.losses. There are no plan assets that are expected to be returned to the Company in 2008.
2012.Summary of key assumptions:
| | | | | | | | |
| | | December 31, | |
| | | 2011 | | | 2010 | |
Benefit obligations | | | | | | | | |
Discount rate | | | 4.25 | % | | | 5.00 | % |
Rate of compensation increase | | | 2.75 | % | | | 2.75 | % |
Net benefit cost for year ended | | | | | | | | |
Discount rate | | | 5.00 | % | | | 5.75 | % |
Rate of compensation increase | | | 2.75 | % | | | 2.75 | % |
Expected rate of return on plan assets | | | 6.75 | % | | | 7.00 | % |
Assumed health care cost trend rate at | | | | | | | | |
Initial health care cost trend rate | | | 9.00 | % | | | 10.00 | % |
Annual rate of decline in trend rate | | | 0.50 | % | | | 1.00 | % |
Ultimate health care cost trend rate | | | 4.50 | % | | | 4.50 | % |
Medical services plan premiums trend rate | | | 6.00 | % | | | 6.00 | % |
The expected rate of return on plan assets is a management estimate based on, among other factors, historical long-term returns, expected asset mix and active management premium.
The discount rate assumption is adjusted annually to reflect the rates available on high-quality debt instruments, with a duration that is expected to match the timing of expected pension and other post-retirement benefit obligations. High-quality debt instruments are corporate bonds with a rating of “AA” or better.
A one-percentage point change in assumed health care cost trend rate would have the following effect on the post-retirement benefit obligations:
| | | | | | | | | | | | | | | | |
| | | December 31, 2011 | | | December 31, 2010 | |
| | | 1% increase | | | 1% decrease | | | 1% increase | | | 1% decrease | |
Effect on total service and interest rate components | | € | 39 | | | € | (40 | ) | | € | 38 | | | € | (39 | ) |
Effect on post-retirement benefit obligation | | € | 621 | | | € | (600 | ) | | € | 572 | | | € | (551 | ) |
MERCER INTERNATIONAL INC.
NOTES TO THE CONSOLIDATED FINANCIAL STATEMENTS
(In thousands of Euros, except per share data)
Note 9. Pension and Other Post-Retirement Benefit Obligations (continued)
Asset allocation of funded plans:
| | | | | | | | | | | | |
| | | Target | | | 2011 | | | 2010 | |
Equity securities | | | 60 | % | | | 56% | | | | 63% | |
Debt securities | | | 40 | % | | | 44% | | | | 34% | |
Cash and cash equivalents | | | 0 | % | | | 0% | | | | 3% | |
| | | | | | | | | | | | |
| | | | | | | 100% | | | | 100% | |
| | | | | | | | | | | | |
Investment Objective:
The investment objective for the Celgar Plans is to sufficiently diversify invested plan assets to maintain a reasonable level of risk without imprudently sacrificing the return on the invested funds.funds, and ultimately to achieve a long-term total rate of return, net of fees and expenses, at least equal to the long-term interest rate assumptions used for funding actuarial valuations. To achieve this objective, assetthe Company’s overall investment strategy is to maintain an investment allocation mix of long-term growth investments (equities) and fixed income investments (debt securities). Investment allocation targets have been established by asset class as summarized below.above. The asset allocation targets are set after considering the nature of the liabilities, long-term return expectations, the risks associated with key asset classes, inflation and interest rates and related management fees and expenses. In addition, the Celgar Plans’ investment strategy seeks to minimize risk beyond legislated requirements by constraining the investment managers’ investment options. There are a number of specific constraints based on investment type, but they all have the general purpose of ensuring that the investments are fully diversified and that risk is appropriately managed. For example, no more than 10% of the book value of the assets can be invested in any one entity or group, investments in any one entity cannot exceed 30% of the voting shares and all equity holdings must be listed on a public exchange. Reviews of the investment objectives, key assumptions and the independent investment managementmanagers are performed periodically.
SummaryCelgar Plans’ asset fair value measurements at December 31, 2011:
| | | | | | | | | | | | | | | | |
Asset category | | Quoted
prices in
active
markets for
identical
assets | | | Significant
other
observable
inputs | | | Significant
unobservable
inputs | | | Total | |
Leith Wheeler Diversified Funds | | € | 13,340 | | | € | — | | | € | ��� | | | € | 13,340 | |
Phillips, Hagar and North Bond Fund | | | 10,394 | | | | — | | | | — | | | | 10,394 | |
| | | | | | | | | | | | | | | | |
Total assets | | € | 23,734 | | | € | — | | | € | — | | | € | 23,734 | |
| | | | | | | | | | | | | | | | |
Concentrations of key assumptions:
| | | | | | | | | |
| | | December 31, | |
| | | 2008 | | | 2007 | |
| |
| Benefit obligations | | | | | | | | |
| Discount rate | | | 7.25 | % | | | 5.25 | % |
| Rate of compensation increase | | | 2.75 | % | | | 3.00 | % |
| Net benefit cost for year ended | | | | | | | | |
| Discount rate | | | 5.25 | % | | | 5.00 | % |
| Rate of compensation increase | | | 3.00 | % | | | 3.00 | % |
| Expected rate of return on plan assets | | | 7.00 | % | | | 7.25 | % |
| Assumed health care cost trend rate at | | | | | | | | |
| Initial health care cost trend rate | | | 12.00 | % | | | 12.00 | % |
| Annual rate of decline in trend rate | | | 1.00 | % | | | 1.00 | % |
| Ultimate health care cost trend rate | | | 4.50 | % | | | 5.00 | % |
| Medical services plan premiums trend rate | | | 2.50 | % | | | 2.50 | % |
Risk in the Celgar Plans’ Assets:The expected rate of return on plan assets is a management estimateCompany has reviewed the Celgar Plans’ investments and determined that they are allocated based on among other factors, historical long-term returns, expected asset mixthe specific investment manager’s stated investment strategy with only slight over- or under-weightings within any specific category, and active management premium.
90
MERCER INTERNATIONAL INC.
NOTES TO THE CONSOLIDATED FINANCIAL STATEMENTS
(In thousands of Euros, except per share data)
| |
Note 8. | Pension and Other Post-Retirement Benefit Obligations — (Continued) |
A one-percentage point changeNote 9. Pension and Other Post-Retirement Benefit Obligations (continued)
Multiemployer Plan:
The Company participates in assumed health care cost trend rate would havea multiemployer plan for the hourly-paid employees at the Celgar mill. The contributions to the plan are determined based on an amount per hour worked pursuant to a collective bargaining agreement. The Company has no current or future contribution obligations in excess of the contractual contributions. Plan details are included in the following effect on the post-retirement benefit obligations:
| | | | | | | | | | | | | | | | | |
| | | December 31, 2008 | | | December 31, 2007 | |
| | | 1% increase | | | 1% decrease | | | 1% increase | | | 1% decrease | |
| |
| Effect on total service and interest rate components | | € | 235 | | | € | (178 | ) | | € | 212 | | | € | (160 | ) |
| Effect on post-retirement benefit obligation | | € | 1,598 | | | € | (1,251 | ) | | € | 2,252 | | | € | (1,762 | ) |
Asset allocation of funded plans:
| | | | | | | | | | | | | |
| | | Target | | | 2008 | | | 2007 | |
| |
| Equity securities | | | 50-70 | % | | | 61 | % | | | 59 | % |
| Debt securities | | | 30-45 | % | | | 36 | % | | | 34 | % |
| Cash and cash equivalents | | | 0-10 | % | | | 3 | % | | | 7 | % |
| | | | | | | | | | | | | |
| | | | | | | | 100 | % | | | 100 | % |
| | | | | | | | | | | | | |
table: | | | | | | | | | | | | | | | | | | | | | | | | |
Legal name | | Provincially
registered plan
number | | | Expiration date of
collective
bargaining
agreement | | | Company
Contributions | | | Are the Company’s contributions
greater than 5% of total
contributions | |
| | | | 2011 | | | 2010 | | | 2011 | | | 2010 | |
The Pulp and Paper Industry Pension Plan | | | P085324 | | | | April 30, 2012 | | | € | 1,760 | | | € | 1,774 | | | | Yes | | | | Yes | |
Note 10. Income Taxes
The Company adoptedaccounts for income taxes in accordance with ASC 740. The Company’s effective income tax rate can be affected by many factors, including but not limited to, changes in the provisionsmix of FIN 48 on January 1, 2007. As aearnings in tax jurisdictions with differing statutory rates, changes in corporate structure, changes in the valuation of deferred tax assets and liabilities, the result of audit examinations of previously filed tax returns and changes in tax laws. The asset and liability approach is used to recognize deferred tax assets and liabilities for the implementationexpected future tax consequences of FIN 48,temporary differences between the carrying amounts and the tax bases of assets and liabilities.
The Company recognized no adjustmentand/or one or more of its subsidiaries file income tax returns in the liability for unrecognized tax benefits.
As at the adoption date of January 1, 2007, the Company had approximately €18,600 of total gross unrecognized tax benefits, at December 31, 2008, that balance is €3,400, substantially all of which would affect the Company’s effective tax rate if recognized.United States, Germany and Canada. Currently, the Company does not
believeanticipate that
anythe expiration of
its unrecognized tax benefits will change significantlythe statue of limitations or the completion of audits in the next fiscal
year.year will result in liabilities for uncertain income tax positions that are materially different than the amounts accrued as of December 31, 2011. However, this belief could change as tax years are examined by taxing authorities, the timing of those examinations, if any, are uncertain at this time.
A reconciliationDuring 2010, the German tax authorities completed examinations of the
beginning2005, 2006, and
ending amount2007 tax years. The 2008, 2009, and 2010 tax years will be examined by German tax authorities in 2012. We believe that we have adequately provided for any reasonable foreseeable outcomes related to our tax audits and that any settlement will not have a material adverse effect on our consolidated results. However, there can be no assurances as to the possible outcomes. The Company is generally not subject to U.S., German or Canadian income tax examinations for tax years before 2008, 2008 and 2006, respectively.As at December 31, 2011, the Company had approximately €1,100 of total gross unrecognized tax benefits, is as follows:
| | | | | | | | | |
| | | 2008 | | | 2007 | |
| |
| Balance at January 1 | | € | 4,000 | | | € | 4,400 | |
| Additions — current year tax positions | | | — | | | | 200 | |
| Reductions — prior year tax positions | | | (3,200 | ) | | | (300 | ) |
| Lapse of statute of limitations | | | — | | | | (300 | ) |
| Settlements | | | — | | | | — | |
| | | | | | | | | |
| Balance at December 31 | | € | 800 | | | € | 4,000 | |
| | | | | | | | | |
substantially all of which would affect the Company’s effective tax rate if recognized. The Company recorded unrecognized tax benefits of approximately €200 at December 31, 2011 (2010 – €200).The Company recognizes interest and penalties related to unrecognized tax benefits in income tax expense. During the year ended December 31, 2008,2011, the Company recognized approximately €200nil in penalties and interest.interest (2010 – €nil). The Company had €200 for the payment€nil payments of interest and penalties accrued at December 31, 2008.
The Companyand/or one or more of its subsidiaries files income tax returns in the United States, Germany and Canada. The Company is generally not subject to U.S., German or Canadian income tax examinations for tax years before 2004, 2005 and 2004, respectively.
2011.The provision for current income taxes consists entirelyprimarily ofnon-U.S. taxes for the years ended December 31, 2008, 20072011, 2010 and 2006,2009, respectively.
91
MERCER INTERNATIONAL INC.
NOTES TO THE CONSOLIDATED FINANCIAL STATEMENTS
(In thousands of Euros, except per share data)
| |
Note 9. | Income Taxes — (Continued) |
Note 10. Income Taxes (continued)
Differences between the U.S. Federal Statutory and the Company’s effective rates are as follows:
| | | | | | | | | | | | | |
| | | Year Ended December 31, | |
| | | 2008 | | | 2007 | | | 2006 | |
| |
| U.S. Federal statutory rates | | | 34 | % | | | 34 | % | | | 34 | % |
| U.S. Federal statutory rates on (income) loss from continuing operations before income tax and minority interest | | € | 28,241 | | | € | (11,544 | ) | | € | (43,437 | ) |
| Tax differential on foreign income (loss) | | | (2,966 | ) | | | 2,902 | | | | (4,070 | ) |
| Effect of foreign earnings | | | (17,800 | ) | | | — | | | | — | |
| Valuation allowance | | | (5,530 | ) | | | 15,021 | | | | (16,145 | ) |
| Other | | | (4,422 | ) | | | (16,693 | ) | | | 6,209 | |
| | | | | | | | | | | | | |
| | | € | (2,477 | ) | | € | (10,314 | ) | | € | (57,443 | ) |
| | | | | | | | | | | | | |
| Comprised of: | | | | | | | | | | | | |
| Current | | € | (501 | ) | | € | (2,170 | ) | | € | (584 | ) |
| Deferred | | | (1,976 | ) | | | (8,144 | ) | | | (56,859 | ) |
| | | | | | | | | | | | | |
| | | € | (2,477 | ) | | € | (10,314 | ) | | € | (57,443 | ) |
| | | | | | | | | | | | | |
| | | | | | | | | | | | |
| | | Years Ended December 31, | |
| | | 2011 | | | 2010 | | | 2009 | |
U.S. Federal statutory rate | | | 35 | % | | | 34 | % | | | 34 | % |
U.S. Federal statutory rate on (income) loss from continuing operations before income tax and noncontrolling interest | | € | (18,659 | ) | | € | (30,206 | ) | | € | 26,526 | |
Tax differential on foreign income (loss) | | | 5,670 | | | | 8,754 | | | | (3,412 | ) |
Effect of foreign earnings | | | (9,906 | ) | | | (6,721 | ) | | | — | |
Valuation allowance | | | 7,069 | | | | 13,326 | | | | (20,806 | ) |
Tax benefit of partnership structure | | | 5,234 | | | | 5,076 | | | | 5,796 | |
Pension adjustment | | | 1,864 | | | | 937 | | | | (904 | ) |
Non-taxable foreign subsidiaries | | | 4,024 | | | | — | | | | — | |
Change in undistributed earnings | | | — | | | | 15,186 | | | | — | |
Other | | | 5,399 | | | | (473 | ) | | | (1,331 | ) |
| | | | | | | | | | | | |
| | € | 695 | | | € | 5,879 | | | € | 5,869 | |
| | | | | | | | | | | | |
Comprised of: | | | | | | | | | | | | |
Current | | € | (1,682 | ) | | € | (3,881 | ) | | € | (134 | ) |
Deferred | | | 2,377 | | | | 9,760 | | | | 6,003 | |
| | | | | | | | | | | | |
| | € | 695 | | | € | 5,879 | | | € | 5,869 | |
| | | | | | | | | | | | |
MERCER INTERNATIONAL INC.
NOTES TO THE CONSOLIDATED FINANCIAL STATEMENTS
(In thousands of Euros, except per share data)
Note 10. Income Taxes (continued)
Deferred income tax assets and liabilities are composed of the following:
| | | | | | | | | |
| | | December 31, | |
| | | 2008 | | | 2007 | |
| |
| German tax loss carryforwards | | € | 67,930 | | | € | 50,725 | |
| U.S. tax loss carryforwards | | | 5,909 | | | | 19,934 | |
| Canadian tax loss carryforwards | | | 4,924 | | | | 2,497 | |
| Basis difference between income tax and financial reporting with respect to operating pulp mills | | | (17,118 | ) | | | (6,354 | ) |
| Derivative financial instruments | | | 13,227 | | | | 6,144 | |
| Long-term debt | | | (1,726 | ) | | | (2,736 | ) |
| Payables and accrued expenses | | | (780 | ) | | | 148 | |
| Reserve for deferred pension liability | | | 2,079 | | | | 18 | |
| Capital leases | | | 531 | | | | 652 | |
| Other | | | 956 | | | | 1,149 | |
| | | | | | | | | |
| | | | 75,932 | | | | 72,177 | |
| Valuation allowance | | | (78,723 | ) | | | (73,193 | ) |
| | | | | | | | | |
| Net deferred tax (liability) asset | | € | (2,791 | ) | | € | (1,016 | ) |
| | | | | | | | | |
| Comprised of: | | | | | | | | |
| Deferred income tax asset | | € | 31,666 | | | € | 17,624 | |
| Deferred income tax liability | | | (34,457 | ) | | | (18,640 | ) |
| | | | | | | | | |
| | | € | (2,791 | ) | | € | (1,016 | ) |
| | | | | | | | | |
| | | | | | | | |
| | | December 31, | |
| | | 2011 | | | 2010 | |
German tax loss carryforwards | | € | 87,023 | | | € | 86,087 | |
U.S. tax loss carryforwards | | | 27,914 | | | | 28,310 | |
Canadian tax loss carryforwards | | | 33,891 | | | | 34,516 | |
Basis difference between income tax and financial reporting with respect to operating pulp mills | | | (77,440 | ) | | | (65,237 | ) |
Derivative financial instruments | | | 14,709 | | | | 14,311 | |
Long-term debt | | | 1,367 | | | | (477 | ) |
Payable and accrued expenses | | | (89 | ) | | | (1,412 | ) |
Deferred pension liability | | | 7,381 | | | | 5,102 | |
Capital leases | | | 1,941 | | | | 1,734 | |
Other | | | 1,623 | | | | 805 | |
| | | | | | | | |
| | | 98,320 | | | | 103,739 | |
Valuation allowance | | | (81,868 | ) | | | (88,937 | ) |
| | | | | | | | |
Net deferred tax (liability) asset | | € | 16,452 | | | € | 14,802 | |
| | | | | | | | |
Comprised of: | | | | | | | | |
Deferred income tax asset—current | | € | 6,750 | | | € | 22,570 | |
Deferred income tax asset—non-current | | | 12,287 | | | | — | |
Deferred income tax liability—non-current | | | (2,585 | ) | | | (7,768 | ) |
| | | | | | | | |
| | € | 16,452 | | | € | 14,802 | |
| | | | | | | | |
The Company is subject to income tax audits on a continuing basis which may result in changes to the amounts in the above table. Due to this and other uncertainties regarding future amounts of taxable income in Germany, Canada and the United States, the Company has provided a valuation allowance for the majorityagainst a portion of its deferred tax assets, relating towhich primarily consist of tax losses carried forwardforward. However, during the year, based on forecasted taxable income for the entities in each tax jurisdiction, income tax purposes.
92
MERCER INTERNATIONAL INC.
NOTES TO THE CONSOLIDATED FINANCIAL STATEMENTS
(In thousands of Euros, except per share data)
| |
Note 9. | Income Taxes — (Continued) |
Note 10. Income Taxes (continued)
The Company’s German tax loss carryforward amount includes corporate and trade tax losses totalingtotalling approximately €405,900€421,100 at December 31, 2008.2011 which have no expiration date. The Company’s U.S. loss carryforwards amount is approximately €52,800€79,700 at December 31, 2008,2011, of which approximately €7,400 and €72,300, if not used, will expire in the tax years ending 2012 to 2020 and 2021 to 2030, respectively. The Company has implemented certain tax planning strategies in 2011 through 2028, if not used.to minimize the risk that US tax losses otherwise expiring in 2011 and 2012 will go unused. The Company’s Canadian tax loss carryforward amount is approximately €16,400€135,600 at December 31, 20082011 which will begin to expire in the tax year ending 2026, if not used. Management is generally unable to concludehas concluded that these losses areit is more likely than not tothat a portion of the above noted losses will be utilized, under current circumstances, and accordingly has fully reserved any resulting potential tax benefit that is not expected to be realized in 2009 or 2010.
Income (loss) fromthe near future.The Company’s policy is to indefinitely reinvest undistributed earnings of Mercer’s foreign source continuing operations amountedsubsidiaries. Accordingly, no provision for U.S. income taxes has been made for such undistributed earnings. It is not practical to €(42,788), €(4,030) and €115,305 forestimate the years ended December 31, 2008, 2007 and 2006, respectively. These amounts are intended to be indefinitely reinvested in operations.
| |
Note 10. | Shareholders’ Equity |
In December 2006, the Company purchased and cancelled an aggregate of approximately $15.25 million principal amount of the Company’s subordinated convertible notes in exchange for 2,201,035 common shares of the Company.
In March 2007, the Company converted a noteU.S. income taxes that would be payable to a third party to 742,185 common shares. The conversion was based on the 20-trading day average closing price of the Company’s common shares at March 30, 2007.
if such undistributed foreign earnings were repatriated.Note 11. Share Capital
Common shares
The Company has authorized 200,000,000 common shares (2007 —(2010 – 200,000,000) with a par value of $1 per share.
During the twelve months ended December 31, 2011, 13,446,679 common shares were issued as a result of certain holders of the 2012 Notes exercising their conversion option (2010 – 6,500,171) (see Note 8(d)—Debt). In addition, 474,728 shares were issued to employees of the Company as part of the share based performance plan and 116,460 performance shares, which were issued in 2008, were cancelled. 238,000 restricted shares were issued to directors and the Chief Executive Officer of the Company. The Company also repurchased and retired 1,263,401 common shares. These retired shares are now included in the Company’s pool of authorized but unissued common shares.
As at December 31, 2008,2011, the Company had 36,422,487 (2007 — 36,285,027)55,779,204 common shares (2010 – 42,999,658) issued and outstanding.
Share Repurchase Program
In August 2011, the Company’s Board of Directors authorized a share repurchase program (the “Program”) to repurchase up to $25.0 million worth of the Company’s outstanding common shares from time to time over a period ending August 2012. During the year ended December 31, 2011, the Company repurchased 1,263,401 of its common shares at an aggregate cost of $10.6 million. The Company recorded these as treasury shares, and accounted for the repurchase using the Cost Method as outlined in FASB’s Accounting Standards Codification No. 505,Equity—Treasury Stock (“ASC 505”).
The Company retired all outstanding treasury shares prior to December 31, 2011. The retired treasury shares had a carrying value of approximately €6,342. Upon the formal retirement of treasury shares and in accordance with ASC 505, the Company reduced its share capital based on the estimated average cost of the common shares and reduced the treasury share account based on the repurchase price. The difference between the repurchase price and the original issue value was recorded as a reduction to retained earnings.
MERCER INTERNATIONAL INC.
NOTES TO THE CONSOLIDATED FINANCIAL STATEMENTS
(In thousands of Euros, except per share data)
Note 11. Share Capital (continued)
The Company may make additional repurchases of common shares under its Program, depending on prevailing market conditions, alternate uses of capital, and other factors. Whether and when to initiate a purchase of common shares and the amount of common shares purchased is at the Company’s discretion. As at December 31, 2011, the Company had an authorized amount of $14.4 million left to repurchase its common shares.
Preferred shares
The Company has authorized 50,000,000 preferred shares (2007 —(2010 – 50,000,000) with U.S. $1 par value issuable in series, of which 2,000,000 shares have been designated as Series A. The preferred shares may be issued in one or more series and with such designations and preferences for each series as shall be stated in the resolutions providing for the designation and issue of each such series adopted by the Board of Directors of the Company. The Board of Directors is authorized by the Company’s articles of incorporation to determine the voting, dividend, redemption and liquidation preferences pertaining to each such series. As at December 31, 2008,2011, no preferred shares had been issued by the Company.
| |
Note 11. | Stock-Based Compensation |
TheNote 12. Stock-Based Compensation
In June 2010, the Company hadadopted a non-qualified stock option plan which provided for options to be granted to officers and employees to acquire a maximum of 3,600,000 common shares including options for 130,000 shares to directors who are not officers or employees. This plan expired in 2008 but unexercised options that were previously granted under this plan remain outstanding. The Company also has anew stock incentive plan (the “2010 Plan”) which provides for options, restricted stock rights, restricted shares, performance shares, performance share units (“PSUs”) and stock appreciation rights and restricted stock to be awarded to employees, consultants and outside directorsnon-employee directors. As at December 31, 2011, after factoring in all allocated shares, there remains approximately 1.2 million common shares available for grant pursuant to a maximum of 1,000,000the 2010 Plan.
Performance Shares and PSUs
Performance shares are common shares. During 2008,shares granted to an employee which have restrictive conditions, such as the ability to sell the shares, until the Company implemented a new form of stock-based compensation calledand the grantee achieve certain performance stock under its existing stock incentive plan.
93
MERCER INTERNATIONAL INC.
NOTES TO THE CONSOLIDATED FINANCIAL STATEMENTS
(In thousands of Euros, except per share data)
| |
Note 11. | Stock-Based Compensation — (Continued) |
Performance Stock
Grants of performance stockobjectives. PSUs comprise rights to receive
stockcommon shares at a future date that are contingent on the Company and the grantee achieving certain performance objectives.
Expense recognized for the year for the performance shares and PSUs was €916 (2010 – €2,255; 2009 – €397). The fair value of the performance shares and PSUs is recorded as compensation expense over the vesting period. The fair value is determined based upon the targeted number of shares awarded and the quoted price of the Company’s shares at the reporting date. The target number of shares is determined using management’s best estimate. The final determination of the number of shares to be granted or unrestricted will be made by the Board of Directors.
Between February and March 2011, the Company granted and issued a total of 474,728 common shares for its PSUs which were originally awarded in 2008 and vested on December 31, 2010. Pursuant to ASC718, the Company adjusted the number of common shares awarded to employees to the number granted by the Board of Directors, and accordingly adjusted compensation cost based on the fair value of Mercer’s common shares at the grant date. As a result, the Company recognized €1,420 of stock compensation expense associated with the final determination of these PSUs in the three months ended March 31, 2011.
MERCER INTERNATIONAL INC.
NOTES TO THE CONSOLIDATED FINANCIAL STATEMENTS
(In thousands of Euros, except per share data)
Note 12. Stock-Based Compensation (continued)
On February 11, 2011, the Company granted a total of 812,575 PSUs to employees of the Company, the majority of which vest using a partial vesting schedule between 2014 and 2016; 50% are scheduled to vest on January 1, 2014, 25% are scheduled to vest on January 1, 2015, and the remaining 25% are scheduled to vest on January 1, 2016.
During the year ended December 31, 2008, potential stock based2011, the Company cancelled 116,460 performance awards totaled 570,614 shares which cliff vest onthat were issued in 2008. As at December 31, 2010. Expense recognized for2011, there are no remaining performance shares outstanding.
Following is a summary of the year was €96(2007 — nil).
outstanding PSUs: | | | | | | | | | | | | |
| | | Number of PSUs | |
| | | 2011 | | | 2010 | | | 2009 | |
Outstanding at January 1 | | | 534,783 | | | | 565,165 | | | | 570,614 | |
Granted | | | 812,575 | | | | 13,000 | | | | 34,542 | |
Vested and issued | | | (474,728 | ) | | | — | | | | — | |
Cancelled | | | (60,055 | ) | | | — | | | | — | |
Forfeited | | | (17,263 | ) | | | (43,382 | ) | | | (39,991 | ) |
| | | | | | | | | | | | |
Outstanding at December 31 | | | 795,312 | | | | 534,783 | | | | 565,165 | |
| | | | | | | | | | | | |
Restricted Shares
The fair value of performance stockrestricted shares is determined based upon the number of shares granted and the quoted price of the Company’s stock. Performance stock generally cliff vest three years from the grant date. As at December 31, 2008, no performance stock had vested. There were no performance stock awards cancelled during the year.
As at December 31, 2008, the total remaining unrecognized compensation cost associated with the performance stock totaled approximately €340 which will be amortized over their remaining vesting period.
Restricted Stock
The fair value of restricted stock is determined based upon the number of shares
granted and the quoted price of the Company’s stock on the date of grant. Restricted
stockshares generally
vestsvest over
two years.one year, except as noted below. Expense is recognized on a straight-line basis over the vesting period.
During the year ended December 31, 2011, 38,000 restricted share awards were granted to directors of the Company (2010 – 56,000; 2009 – 21,000), which vest over one year, and 200,000 restricted shares were granted to the Chief Executive Officer of the Company (2010 – nil; 2009 – nil), which vest in equal amounts over a five year period commencing in 2012.
Expense recognized for the yearsyear ended December 31, 2008, 2007 and 20062011 was €168, €312 and €401, respectively.
€998 (2010 – €139; 2009 – €58). As at December 31, 2008,2011, the total remaining unrecognized compensation cost related to restricted stockshares amounted to €45,€1,381 (2010 – €93), which will be amortized over their remaining vesting period.
During the year ended December 31, 2008, there were restricted stock awards of 21,000 shares (2007 — 21,000; 2006 — 45,000) granted to independent directors and officersperiods.Following is a summary of the Company and nooutstanding restricted stock was cancelled during the year (2007 — nil; 2006 — 9,999).
As at December 31, 2008, the total number of restricted stock outstanding was 232,685 (2007 — 211,685; 2006 — 190,686), of which 21,000 had not vested.
Stock Options
The following table summarizes the status of the Company’s stock options during 2008, 2007 and 2006:
| | | | | | | | | |
| | | Number
| | | Weighted Average
| |
| | | of Options | | | Exercise Price | |
| | | | | | (In U.S. Dollars) | |
| |
| Outstanding at December 31, 2005 | | | 1,185,000 | | | $ | 6.71 | |
| Exercised | | | (60,000 | ) | | | 6.38 | |
| | | | | | | | | |
| Outstanding at December 31, 2006 | | | 1,125,000 | | | | 6.69 | |
| | | | | | | | | |
| Exercised | | | (56,666 | ) | | | 7.10 | |
| Cancelled | | | (5,000 | ) | | | 7.92 | |
| Expired | | | (135,000 | ) | | | 8.50 | |
| | | | | | | | | |
| Outstanding at December 31, 2007 and 2008 | | | 928,334 | | | $ | 6.44 | |
| | | | | | | | | |
94
| | | | | | | | | | | | |
| | | Number of restricted shares | |
| | | 2011 | | | 2010 | | | 2009 | |
Outstanding at January 1 | | | 56,000 | | | | 21,000 | | | | 21,000 | |
Awarded | | | 238,000 | | | | 56,000 | | | | 21,000 | |
Vested | | | (56,000 | ) | | | (21,000 | ) | | | (21,000 | ) |
| | | | | | | | | | | | |
Outstanding at December 31 | | | 238,000 | | | | 56,000 | | | | 21,000 | |
| | | | | | | | | | | | |
MERCER INTERNATIONAL INC.
NOTES TO THE CONSOLIDATED FINANCIAL STATEMENTS
(In thousands of Euros, except per share data)
| |
Note 11. | Stock-Based Compensation — (Continued) |
Note 12. Stock-Based Compensation (continued)
Stock Options
Following is a summary of the status of options outstanding at December 31, 2008:
| | | | | | | | | | | | | | | | | | | | | |
| Outstanding Options | | | | |
| | | | | Weighted
| | | | Exercisable Options |
Exercise
| | | | Average
| | Weighted
| | | | Weighted
|
Price
| | | | Remaining
| | Average
| | | | Average
|
| Range | | Number | | Contractual Life | | Exercise Price | | Number | | Exercise Price |
| | | | | | | | | | | (In U.S. Dollars) |
| (In U.S. Dollars) | | | | (Years) | | | | | | |
| |
| $5.65 - $6.375 | | | 830,000 | | | | 1.50 | | | | $6.29 | | | | 830,000 | | | | $6.29 | |
| 7.30 | | | 30,000 | | | | 6.50 | | | | 7.30 | | | | 30,000 | | | | 7.30 | |
| 7.92 | | | 68,334 | | | | 6.75 | | | | 7.92 | | | | 68,334 | | | | 7.92 | |
2011: | | | | | | | | | | |
Outstanding Options | | Exercisable Options |
Exercise Price Range | | Number | | Weighted Average Remaining
Contractual Life | | Weighted Average
Exercise Price | | Number | | Weighted Average Exercise Price |
| (In U.S. Dollars) | | | | (Years) | | | | | | (In U.S. Dollars) |
$5.65 | | 100,000 | | 1.70 | | $5.65 | | 100,000 | | $5.65 |
$7.30 | | 30,000 | | 3.57 | | $7.30 | | 30,000 | | $7.30 |
$7.92 | | 45,000 | | 3.69 | | $7.92 | | 45,000 | | $7.92 |
During the yearyears ended December 31, 2008,2011 and 2010, no options were granted, exercised or cancelled orand 15,000 (2010 – 738,334) options expired. The aggregate intrinsic value of options outstanding and currently exercisableis calculated as the difference between the quoted market price for the Company’s common stock at December 31, 20082011 and those options where the exercise price is $nil per option.
Duringbelow the year endedquoted market price. As at December 31, 2007, 30,0002011, the Company had 100,000 options were exercised atwith an exercise price of $6.375 and 26,666 options were exercised atbelow the quoted market price resulting in an exercise price of $7.92 for cash proceeds of $402,445. 5,000 options were cancelled during the period, and 135,000 options expired during the period. The average intrinsic value of the options exercised was $4.58 per option. The aggregate intrinsic value of options outstanding and exercisable as at December 31, 2007 was $1.39 per option.
€32 (2010 – €170). The fair valueCompany issues new shares upon the exercise of each option granted is estimated on the grant date using the Black-Scholes Model. There were no options granted in either 2008 or 2007. The assumptions used in calculating fair value as at December 31, 2006 were as follows:
| | | | |
| | 2006 | |
|
Risk-free interest rate | | | 4.1% | |
Expected life of the options | | | 0.5 years | |
Expected volatility(1) | | | 34.1% | |
Expected dividend yield | | | 0.0% | |
Weighted average fair value per option granted (in U.S. dollars) | | | $2.94 | |
| | |
(1) | | The expected volatility was based on the Company’s three year historical stock prices. |
stock options.Stock compensation expense recognized for the year ended December 31, 20082011 was €nil (2007 - €65)(2010 – €nil; 2009 – €nil). As at December 31, 2008,2011, all stock options had fully vested.
95
MERCER INTERNATIONAL INC.
NOTES TO THE CONSOLIDATED FINANCIAL STATEMENTS
(In thousands of Euros, except per share data)
Note 13. Net Income (Loss) Per Share Attributable to Common Shareholders
| | | | | | | | | | | | |
| | | Years Ended December 31, | |
| | | 2011 | | | 2010 | | | 2009 | |
Net income (loss) attributable to common shareholders—basic | | € | 50,075 | | | € | 86,279 | | | € | (62,189 | ) |
Interest on convertible notes, net of tax | | € | 797 | | | | 2,439 | | | | — | |
| | | | | | | | | | | | |
Net income (loss) attributable to common shareholders—diluted | | € | 50,872 | | | € | 88,718 | | | € | (62,189 | ) |
| | | | | | | | | | | | |
Net income (loss) per share attributable to common shareholders | | | | | | | | | | | | |
Basic | | € | 1.00 | | | € | 2.24 | | | € | (1.71 | ) |
| | | | | | | | | | | | |
Diluted | | € | 0.89 | | | € | 1.56 | | | € | (1.71 | ) |
| | | | | | | | | | | | |
Weighted average number of common shares outstanding: | | | | | | | | | | | | |
Basic(1) | | | 50,116,982 | | | | 38,590,797 | | | | 36,296,649 | |
Effect of dilutive shares: | | | | | | | | | | | | |
Performance shares | | | 544,853 | | | | 442,844 | | | | — | |
Restricted shares | | | 87,923 | | | | 26,683 | | | | — | |
Stock options and awards | | | 57,483 | | | | — | | | | — | |
Convertible notes | | | 6,178,778 | | | | 17,902,638 | | | | — | |
| | | | | | | | | | | | |
Diluted | | | 56,986,019 | | | | 56,962,962 | | | | 36,296,649 | |
| | | | | | | | | | | | |
| |
Note 11. | Stock-Based Compensation — (Continued) |
| |
Note 12. | Net Income (Loss) Per Share |
| | | | | | | | | | | | | |
| | | Year Ended December 31, | |
| | | 2008 | | | 2007 | | | 2006 | |
| |
| Net income (loss) from continuing operations — basic | | € | (72,465 | ) | | € | 22,389 | | | € | 69,242 | |
| Interest on convertible notes, net of tax | | | — | | | | 3,930 | | | | 4,912 | |
| | | | | | | | | | | | | |
| Net income (loss) from continuing operations — diluted | | € | (72,465 | ) | | € | 26,319 | | | € | 74,154 | |
| | | | | | | | | | | | | |
| Net income (loss) from continuing operations per share: | | | | | | | | | | | | |
| Basic | | € | (2.00 | ) | | € | 0.62 | | | € | 2.08 | |
| | | | | | | | | | | | | |
| Diluted | | € | (2.00 | ) | | € | 0.58 | | | € | 1.72 | |
| | | | | | | | | | | | | |
| Net income (loss) from continuing operations | | € | (72,465 | ) | | € | 22,389 | | | € | 69,242 | |
| Net loss from discontinued operations | | | — | | | | (210 | ) | | | (6,032 | ) |
| | | | | | | | | | | | | |
| Net income (loss) — basic | | | (72,465 | ) | | | 22,179 | | | | 63,210 | |
| Interest on convertible notes, net of tax | | | — | | | | 3,930 | | | | 4,912 | |
| | | | | | | | | | | | | |
| Net income (loss) — diluted | | € | (72,465 | ) | | € | 26,109 | | | € | 68,122 | |
| | | | | | | | | | | | | |
| Net income (loss) per share: | | | | | | | | | | | | |
| Basic | | € | (2.00 | ) | | € | 0.61 | | | € | 1.90 | |
| | | | | | | | | | | | | |
| Diluted | | € | (2.00 | ) | | € | 0.58 | | | € | 1.58 | |
| | | | | | | | | | | | | |
| Weighted average number of common shares outstanding: | | | | | | | | | | | | |
| Basic(1) | | | 36,285,027 | | | | 36,080,931 | | | | 33,336,348 | |
| Effect of dilutive shares: | | | | | | | | | | | | |
| Stock options and awards | | | 2,394 | | | | 362,774 | | | | 319,793 | |
| Convertible notes | | | — | | | | 8,859,036 | | | | 9,428,022 | |
| | | | | | | | | | | | | |
| Diluted | | | 36,287,421 | | | | 45,302,741 | | | | 43,084,163 | |
| | | | | | | | | | | | | |
| | |
| (1) | | The basic weighted average number of shares excludes performance andexcluded 238,000 restricted stockshares which have been issued, but have not vested as at December 31, 2008.2011. |
The calculation of diluted net income (loss) per share attributable to common shareholders does not assume the exercise of stock options and awards or the conversion of convertible notesany instruments that would have an anti-dilutive effect on earnings per share.
Stock options and awards excluded from the calculation of diluted income (loss) per share attributable to common shareholders because they are anti-dilutive represented 928,334, nil and nil190,000 for the yearsyear ended December 31, 2008, 2007 and 2006, respectively. Convertible2010 (2009 – 928,334).
Restricted shares excluded from the calculation of diluted income (loss) per share attributable to common shareholders because they are anti-dilutive represented 21,000 for the year ended December 31, 2009.
Shares associated with the convertible notes excluded from the calculation of diluted income (loss) per share attributable to common shareholders because they are anti-dilutive represented 8,678,065, nil and nil9,141,910 for the yearsyear ended December 31, 2008, 2007 and 2006, respectively. 2009.
Performance and restricted stockshares excluded from the calculation of diluted net income (loss) per share attributable to common shareholders because they are anti-dilutive represented 393,642 shares (2007 — nil).
MERCER INTERNATIONAL INC.
NOTES TO THE CONSOLIDATED FINANCIAL STATEMENTS
(In thousands of Euros, except per share data)
| |
Note 13. | Business Segment Information |
Note 14. Business Segment Information
The Company has three operating segments, the individual pulp mills that are aggregated into one reportable business segment, market pulp. Accordingly, the results presented are those of the one reportable business segment.
The pulp business is cyclical in nature and its market is affected by fluctuations in supply and demand in each cycle. These fluctuations have significant effect on the cost of materials and the eventual sales prices of products.
96
MERCER INTERNATIONAL INC.
NOTES TO THE CONSOLIDATED FINANCIAL STATEMENTS
(In thousands of Euros, except per share data)
| |
Note 13. | Business Segment Information — (Continued) |
The following table presents net sales from continuing operations to external customers by geographic area based on location of the customer.
| | | | | | | | | | | | | |
| | | 2008 | | | 2007 | | | 2006 | |
| |
| Germany | | € | 198,340 | | | € | 198,575 | | | € | 154,388 | |
| China | | | 131,412 | | | | 159,553 | | | | 141,296 | |
| Italy | | | 56,487 | | | | 50,177 | | | | 60,057 | |
| Other European Union countries(1) | | | 133,621 | | | | 136,434 | | | | 117,016 | |
| Other Asia | | | 65,192 | | | | 58,242 | | | | 75,522 | |
| North America | | | 78,718 | | | | 66,229 | | | | 39,761 | |
| Other countries | | | 17,146 | | | | 26,639 | | | | 28,586 | |
| | | | | | | | | | | | | |
| | | | 680,916 | | | | 695,849 | | | | 616,626 | |
| Energy revenues | | | 30,971 | | | | 22,904 | | | | 20,922 | |
| Third party transportation revenues | | | 8,404 | | | | 8,542 | | | | 7,351 | |
| | | | | | | | | | | | | |
| | | € | 720,291 | | | € | 727,295 | | | € | 644,899 | |
| | | | | | | | | | | | | |
| | | | | | | | | | | | |
| | | 2011 | | | 2010 | | | 2009 | |
Germany | | € | 256,563 | | | € | 278,348 | | | € | 154,323 | |
China | | | 234,654 | | | | 196,022 | | | | 146,613 | |
Italy | | | 51,509 | | | | 56,301 | | | | 44,616 | |
Other European Union countries(1) | | | 175,937 | | | | 182,246 | | | | 107,276 | |
Other Asia | | | 30,872 | | | | 37,561 | | | | 38,946 | |
North America | | | 69,345 | | | | 92,628 | | | | 68,213 | |
Other countries | | | 823 | | | | 1,503 | | | | 8,312 | |
| | | | | | | | | | | | |
| | | 819,703 | | | | 844,609 | | | | 568,299 | |
Energy revenues | | | 57,972 | | | | 44,225 | | | | 42,501 | |
Third party transportation revenues | | | 11,693 | | | | 11,702 | | | | 8,999 | |
| | | | | | | | | | | | |
| | € | 889,368 | | | € | 900,536 | | | € | 619,799 | |
| | | | | | | | | | | | |
| | |
| (1) | | Not including Germany or Italy; includes new entrant countries to the European Union from their time of admission. |
The following table presents total long-lived assets from continuing operations by geographic area based on location of the asset.
| | | | | | | | | |
| | | 2008 | | | 2007 | |
| |
| Germany | | € | 732,766 | | | € | 776,839 | |
| Canada | | | 161,850 | | | | 189,277 | |
| Other | | | 4,036 | | | | 4,215 | |
| | | | | | | | | |
| | | € | 898,652 | | | € | 970,331 | |
| | | | | | | | | |
| | | | | | | | |
| | | 2011 | | | 2010 | |
Germany | | € | 638,467 | | | € | 656,089 | |
Canada | | | 182,438 | | | | 190,648 | |
Other | | | 69 | | | | 30 | |
| | | | | | | | |
| | € | 820,974 | | | € | 846,767 | |
| | | | | | | | |
In 2008,2011, no single customer accounted for 10% or more of the Company’s total pulp sales to the Company’s largest(2010 one customer amounted to 9% (2007 — 7%– 11%; 2006 — 9%)2009 no single customer).
MERCER INTERNATIONAL INC.
NOTES TO THE CONSOLIDATED FINANCIAL STATEMENTS
(In thousands of total pulp sales.
| |
Note 14. | Financial Instruments |
Note 15. Financial Instruments
The fair value of financial instruments at December 31 is summarized as follows:
| | | | | | | | | | | | | | | | | |
| | | 2008 | | | 2007 | |
| | | Carrying
| | | | | | Carrying
| | | | |
| | | Amount | | | Fair Value | | | Amount | | | Fair Value | |
| |
| Cash and cash equivalents | | € | 42,452 | | | € | 42,452 | | | € | 84,848 | | | € | 84,848 | |
| Cash, restricted | | | 13,000 | | | | 13,000 | | | | 33,000 | | | | 33,000 | |
| Receivables | | | 100,158 | | | | 100,158 | | | | 89,890 | | | | 89,890 | |
| Notes receivable | | | 4,171 | | | | 4,171 | | | | 9,873 | | | | 9,873 | |
| Accounts payable and accrued expenses | | | 87,517 | | | | 87,517 | | | | 87,000 | | | | 87,000 | |
| Debt | | | 820,296 | | | | 704,901 | | | | 849,855 | | | | 845,026 | |
| Interest rate derivative contracts — liability | | | 47,112 | | | | 47,112 | | | | 21,885 | | | | 21,885 | |
97
| | | | | | | | | | | | | | | | |
| | | 2011 | | | 2010 | |
| | | Carrying
Amount | | | Fair Value | | | Carrying
Amount | | | Fair Value | |
Cash and cash equivalents | | € | 105,072 | | | € | 105,072 | | | € | 99,022 | | | € | 99,022 | |
Marketable securities | | | 12,372 | | | | 12,372 | | | | 275 | | | | 275 | |
Receivables | | | 120,487 | | | | 120,487 | | | | 121,709 | | | | 121,709 | |
Note receivable | | | — | | | | — | | | | 2,978 | | | | 2,978 | |
Accounts payable and other | | | 99,640 | | | | 99,640 | | | | 84,873 | | | | 84,873 | |
Debt | | | 734,086 | | | | 717,522 | | | | 821,924 | | | | 847,875 | |
Interest rate derivative contract—liability | | | 52,391 | | | | 52,391 | | | | 50,973 | | | | 50,973 | |
MERCER INTERNATIONAL INC.
NOTES TO THE CONSOLIDATED FINANCIAL STATEMENTS
(In thousands of Euros, except per share data)
| |
Note 14. | Financial Instruments — (Continued) |
Cash and Debt Instruments
Many of the Company’s transactions are denominated in foreign currencies, primarily the U.S. dollar. As a result of these transactions the Company and its subsidiaries hashave financial risk that the value of the Company’s financial instruments will vary due to fluctuations in foreign exchange rates.
The carrying value of cash and cash equivalents, note receivable and accounts payable and accrued expensesother approximates the fair value due to the immediate or short-term maturity of these financial instruments. The carrying value of receivables approximates the fair value due to their short-term nature and historical collectability. The fair value of notes receivable was estimated using discounted cash flows at prevailing market rates. The fair value of debt reflects recent market transactions. Thetransactions and discounted cash flow estimates. See the Fair Value Measurement and Disclosures section for details on how the fair value of the interest rate derivatives is obtained from dealer quotes,derivative contracts was determined. Marketable securities are recorded at fair value based on current interest rates. These values represent the estimated amount the Company would receive or pay to terminate agreements taking into consideration current interest rates and the creditworthiness of the counterparties.
recent transactions.The Company uses interest rate derivatives to fix the rate of interest on indebtedness under the Stendal loan facilitiesLoan Facility and sometimes uses foreign exchange derivatives to convert some costs (including currency swaps relating to long-term indebtedness) from Euros to U.S. dollars. As at December 31, 2008,2011, there were only interest rate derivative instruments in place and there were no foreign exchange derivatives outstanding. The interest rate derivative contracts are with a large European bank that is the same banks which holdlargest holder of the debtStendal Loan Facility and the Company does not anticipate non-performance by the banks.
| | | | | | | | | | | | | |
| | | 2008 | | | 2007 | | | 2006 | |
| |
| Realized net gain on foreign exchange derivatives | | € | — | | | € | 6,820 | | | € | (3,510 | ) |
| | | | | | | | | | | | | |
| Unrealized net gain (loss) on interest rate derivatives | | € | (25,228 | ) | | € | 19,470 | | | € | 37,292 | |
| Unrealized net gain (loss) on foreign exchange derivatives | | | — | | | | (5,933 | ) | | | 72,066 | |
| | | | | | | | | | | | | |
| Unrealized net gain (loss) on derivative financial instruments | | € | (25,228 | ) | | € | 13,537 | | | € | 109,358 | |
| | | | | | | | | | | | | |
non-performance.Energy Derivatives
The Company is also subject to price risk for electricity used in its manufacturing operations. During the year, theThe Company enteredenters into fixed electricity forward sales contracts in connection with the Stendal and Rosenthal mills electricity generation. The Company realized gains of approximately €4,500 (2007 — nil). The Company entered into the electricity forward sales contracts becausewhen it sawsees an opportunity to sell forward electricity at opportunistic rates. No electricity forward sales contracts were entered into in 2009, 2010, and 2011. Although the Company does not currently have plans to enter into similarsuch transactions, should similar situations present themselves, the Company may enter into similar electricity derivative contracts. As at December 31, 2008, the Company had no outstanding electricity derivative contracts. Gains or losses from energy derivatives arewould be included within “Operating costs” in the Consolidated Statement of Operations.
Interest Rate Derivatives
During 2004, the Company entered into certainvariable-to-fixed interest rate swaps in connection with the Stendal mill with respect to an aggregate maximum amount of approximately €612,600 of the principal amount of the indebtedness under the Stendal loan facility. Currently, the aggregate notional amount of these contracts is €523,100 at a fixed interest rate of 5.28% and they mature October 2017 (matching the maturity of the Stendal loan facility). The Company recognized an unrealized loss of €25,228, an unrealized gain of €19,470 and an unrealized gain of €37,292 with respect to these interest rate swaps for the years ended December 31, 2008, 2007 and 2006, respectively.
98
MERCER INTERNATIONAL INC.
NOTES TO THE CONSOLIDATED FINANCIAL STATEMENTS
(In thousands of Euros, except per share data)
| |
Note 14. | Financial Instruments — (Continued) |
Note 15. Financial Instruments (continued)
of the indebtedness under the Stendal Loan Facility. Under the remaining interest rate swap, the Company pays a fixed rate and receives a floating rate with the interest payments being calculated on a notional amount. Currently, the contract has an aggregate notional amount of €404,448 at a fixed interest rate of 5.28% and it matures in October 2017 (which for the most part matches the maturity of the Stendal Loan Facility). The Company recognized an unrealized loss of €1,418, with respect to this interest rate swap for the year ended December 31, 2011 (2010 – an unrealized gain of €1,899; 2009 – an unrealized loss of €5,760) in the “Gain (loss) on derivative instruments” line in the Consolidated Statement of Operations. Derivative instruments are required to be measured at fair value. Accordingly, the fair value of the interest rate swap is presented in the “Unrealized interest rate derivative losses” line in the Consolidated Balance Sheet, which currently amounts to a cumulative unrealized loss of €52,391 (2010 – €50,973).
Foreign Exchange Derivatives
The Company did not enter into foreign exchange derivatives in 2008. During 2007,2011, 2010 and 2009.
Credit Risk
The Company’s credit risk is primarily attributable to cash held in bank accounts and accounts receivable. The Company maintains cash balances in foreign financial institutions in excess of insured limits. The Company limits its credit exposure on cash held in bank accounts by investing cash in excess of short-term operating requirements and debt obligations in low risk government bonds, or similar debt instruments. The Company’s credit risk associated with the Company had entered intosale of pulp products is managed through establishing long-term contractual relationships with its customers, the purchase of credit insurance and for certain currency swaps with an initial aggregate notional amountcustomers a letter of €556,600 and recognized a gain of €6,820. During 2006, the Company entered into and subsequently settled certain currency forward contracts with an initial aggregate notional amount of €nil and recognized a loss of €3,510.
Credit Risk
credit is received prior to shipping its product. Concentrations of credit risk on the sale of pulp products are with customers and agents based in Germany, China, Italy and the United States.
The carrying amount of cash and cash equivalents of €105,072 and receivables of €120,487 recorded in the Consolidated Balance Sheet, net of any allowances for losses, represents the Company’s maximum exposure to credit risk.
FAS 157 — Fair Value MeasurementsMeasurement and Disclosures
The Company adopted FAS 157 effective January 1, 2008. The adoption of FAS 157 resulted in no impact on the Company’s consolidated financial position or results from operations.
The fair value methodologies and, as a result, the fair value of the Company’s investments and derivative instruments are determined based on the fair value hierarchy provided in FAS 157. The fair value hierarchy per FAS 157 isASC 820, and are as follows:
Level 1 — 1—Valuations based on quoted prices in active markets foridentical assets and liabilities.
Level 2 — 2—Valuations based on observable inputs in active markets forsimilar assets and liabilities, other than Level 1 prices, such as quoted interest or currency exchange rates.
Level 3 — 3—Valuations based on significant unobservable inputs that are supported by little or no market activity, such as discounted cash flow methodologies based on internal cash flow forecasts.
The Company classified its marketable security investments within Level 1 of the valuation hierarchy wherebecause quoted prices are available in an active market.market for both the exchange-traded equities and the German federal
MERCER INTERNATIONAL INC.
NOTES TO THE CONSOLIDATED FINANCIAL STATEMENTS
(In thousands of Euros, except per share data)
Note 15. Financial Instruments (continued)
government bonds. The Company also holds highly liquidclassified the German federal government bonds as available-for-sale as it is not certain these investments within restricted cash, which are markedwill be held to market atmaturity, nor does the end of each period. Level 1 investments include exchange-traded equities.
Company intend to actively trade these investments.The Company’s derivatives are classified within Level 2 of the valuation hierarchy, as they are traded on the over-the-counter market and are valued using internal models that use as their basis readily observable market inputs, such as forward interest rates.
rates and yield curves observable at specified intervals.The valuation techniques used by Mercerthe Company in determining the fair value of the derivative instruments are based upon observable inputs. Observable inputs reflect market data obtained from independent sources. In addition, the Company considered the risk of non-performance of the obligor, which in some cases reflects the Company’s own credit risk, in determining the fair value of the derivative instruments.risk. The counterparty to the Stendalour interest rate swap derivative is a multi-national financial institution. The fair value of the interest rate swaps represents the Company’s exposure on the derivative contracts.
99
MERCER INTERNATIONAL INC.
NOTES TO THE CONSOLIDATED FINANCIAL STATEMENTS
(In thousands of Euros, except per share data)
| |
Note 14. | Financial Instruments — (Continued) |
The following table presents a summary of the Company’s outstanding financial instruments and their estimated fair values under the hierarchy defined in FAS 157:
ASC 820: | | | | | | | | | | | | | | | | |
| | | Fair value measurements at December 31, 2011 using: | |
Description | | Quoted prices in
active markets for
identical assets
(Level 1) | | | Significant other
observable inputs
(Level 2) | | | Significant
unobservable
inputs
(Level 3) | | | Total | |
Assets | | | | | | | | | | | | | | | | |
Marketable securities | | | | | | | | | | | | | | | | |
German federal government bonds | | € | 12,216 | | | € | — | | | € | — | | | € | 12,216 | |
Exchange traded equities | | | 156 | | | | — | | | | — | | | | 156 | |
| | | | | | | | | | | | | | | | |
| | € | 12,372 | | | € | — | | | € | — | | | € | 12,372 | |
| | | | | | | | | | | | | | | | |
| | | | |
Liabilities | | | | | | | | | | | | | | | | |
Derivatives | | | | | | | | | | | | | | | | |
Interest rate swap | | € | — | | | € | 52,391 | | | € | — | | | € | 52,391 | |
| | | | | | | | | | | | | | | | |
| | | | | | | | | | | | | | | | |
| | | Fair value measurements at December 31, 2010 using: | |
Description | | Quoted prices in
active markets for
identical assets
(Level 1) | | | Significant other
observable inputs
(Level 2) | | | Significant
unobservable
inputs
(Level 3) | | | Total | |
Assets | | | | | | | | | | | | | | | | |
Exchange traded equities | | € | 275 | | | € | — | | | € | — | | | € | 275 | |
| | | | | | | | | | | | | | | | |
| | | | |
Liabilities | | | | | | | | | | | | | | | | |
Derivatives | | | | | | | | | | | | | | | | |
Interest rate swap | | € | — | | | € | 50,973 | | | € | — | | | € | 50,973 | |
| | | | | | | | | | | | | | | | |
Fair value measurements at December 31, 2008 using:MERCER INTERNATIONAL INC.
| | | | | | | | | | | | | | | | | |
| | | Quoted prices
| | | Significant
| | | | | | | |
| | | in active
| | | other
| | | Significant
| | | | |
| | | markets for
| | | observable
| | | unobservable
| | | | |
| | | identical assets
| | | inputs
| | | inputs
| | | | |
Description | | (Level 1) | | | (Level 2) | | | (Level 3) | | | Total | |
| |
Assets |
| Investments held in restricted cash(a) | | € | 6,622 | | | € | — | | | € | — | | | € | 6,622 | |
| Investments(a) | | | 419 | | | | — | | | | — | | | | 419 | |
| | | | | | | | | | | | | | | | | |
| Total assets | | € | 7,041 | | | € | — | | | € | — | | | € | 7,041 | |
| | | | | | | | | | | | | | | | | |
| |
Liabilities |
| Derivatives(b) | | | | | | | | | | | | | | | | |
| — Interest rate swaps | | | — | | | | 47,112 | | | | — | | | | 47,112 | |
| | | | | | | | | | | | | | | | | |
| Total liabilities | | € | — | | | € | 47,112 | | | € | — | | | € | 47,112 | |
| | | | | | | | | | | | | | | | �� | |
| | |
(a) | | Based on observable market data. |
(b) | | Based on observable inputs for the liability (interest rates and yield curves observable at specific intervals). |
NOTES TO THE CONSOLIDATED FINANCIAL STATEMENTS
(In thousands of Euros, except per share data)
| |
Note 15. | Lease Commitments |
Note 16. Lease Commitments
Minimum lease payments, primarily for various vehicles, and plant and equipment under capital and non-cancellable operating leases and the present value of net minimum payments at December 31, 20082011 were as follows:
| | | | | | | | | |
| | | Capital
| | | Operating
| |
| | | Leases | | | Leases | |
| |
| 2009 | | € | 3,419 | | | € | 2,276 | |
| 2010 | | | 2,740 | | | | 2,005 | |
| 2011 | | | 2,994 | | | | 1,398 | |
| 2012 | | | 1,356 | | | | 953 | |
| 2013 | | | 191 | | | | 5 | |
| Thereafter | | | 1,537 | | | | — | |
| | | | | | | | | |
| Total | | € | 12,237 | | | € | 6,637 | |
| | | | | | | | | |
| Less imputed interest | | | (1,642 | ) | | | | |
| | | | | | | | | |
| Total present value of minimum capitalized payments | | | 10,595 | | | | | |
| Less current portion of capital lease obligations | | | (3,435 | ) | | | | |
| | | | | | | | | |
| Long-term capital lease obligations | | € | 7,160 | | | | | |
| | | | | | | | | |
| | | | | | | | |
| | | Capital
Leases | | | Operating
Leases | |
2012 | | € | 2,719 | | | € | 3,167 | |
2013 | | | 1,308 | | | | 2,819 | |
2014 | | | 946 | | | | 1,597 | |
2015 | | | 993 | | | | 1,565 | |
2016 | | | 490 | | | | 1,076 | |
Thereafter | | | 3,362 | | | | 2,900 | |
| | | | | | | | |
Total | | € | 9,818 | | | € | 13,124 | |
| | | | | | | | |
Less imputed interest | | | 1,782 | | | | | |
| | | | | | | | |
Total present value of minimum capitalized payments | | | 8,036 | | | | | |
Less current portion of capital lease obligations | | | 2,505 | | | | | |
| | | | | | | | |
Long-term capital lease obligations | | € | 5,531 | | | | | |
| | | | | | | | |
Rent expense under operating leases was €2,137, €1,908 and €1,453€3,313 for 2008, 2007 and 2006, respectively.2011 (2010 – €2,246; 2009 – €1,218). The current portion of the capital lease obligations is included in accounts“Accounts payable and accrued expensesother” and the long-term portion is included in capital“Capital leases and otherother” in the Consolidated Balance Sheets.
100Sheet.
MERCER INTERNATIONAL INC.
NOTES TO THE CONSOLIDATED FINANCIAL STATEMENTS
(In thousands of Euros, except per share data)
| |
Note 15. | Lease Commitments — (Continued) |
Note 17. Commitments and Contingencies
| (a) | |
Note 16. | Commitments and ContingenciesAt December 31, 2011, the Company has a liability for environmental conservation expenditures of approximately €2,449. Management believes the accrued amount recorded is sufficient. |
At December 31, 2008, the Company recorded a liability for environmental conservation expenditures of approximately €2,739. Management believes the liability amount recorded is sufficient.
The Company is required to pay certain fees based on water consumption levels at its German mills. Unpaid fees can be reduced by the mills’ demonstration of reduced environmental emissions. To the extent that the Company has not agreed with regulatory authorities for fee reductions, a liability for these water charges has been recognized.
The Company maintains industrial land fills on its premises for the disposal of waste, primarily from the mill’s pulp processing activities. The mills have obligations under their land fill permits to decommission these disposal facilities pursuant to the requirements of its local regulations. The balance of the aggregate carrying amount of the asset retirement obligation amounted to approximately €2,182 at December 31, 2008.
During the year, as part of the new Green Energy project for the Celgar mill, the Company entered into a number of contracts for the purchase of a new 48 megawatt condensing turbine-generator set, as well as other related equipment and service commitments. As at December 31, 2008, the value of the contracts committed was approximately €6,800 (C$11.6 million), a majority of which is due to be paid within the next year.
In July 2008, as part of a bleaching project line renewal at the Rosenthal mill, the Company entered into contracts for the purchase of equipment and related services. As at December 31, 2008, the value of the contracts committed was approximately €2,940, of which €2,520 is expected to be paid in 2009, and the remainder in 2010.
The Company had also entered into certain other capital commitments at the Rosenthal mill, none of which are individually material. Commitments under these contracts were approximately €400 at December 31, 2008.
The Company is involved in a property transfer tax dispute with respect to the Celgar mill and certain other legal actions and claims arising in the ordinary course of business. While the outcome of these legal actions and claims cannot be predicted with certainty, it is the opinion of management that the outcome of any such claim which is pending or threatened, either individually or on a combined basis, will not have a material adverse effect on the consolidated financial condition, results of operations or liquidity of the Company.
The Company entered into certain minimum or fixed purchase commitments primarily related to the purchase of raw materials, none of which are individually material, that extend beyond 2009. Commitments under these contracts are approximately €2,800 in 2009. Between 2010 and 2011, commitments total approximately €2,300 and between 2012 and 2013 commitments total approximately €2,100. Total commitments beyond 2013 are approximately €5,800.
| (b) | |
Note 17. The Company is subject to regulations that require the handling and disposal of asbestos in a prescribed manner if a property undergoes a major renovation or demolition. Otherwise, the Company is not required to remove the asbestos from its facilities. Generally asbestos is found on steam and condensate piping systems as well as certain cladding on buildings and in building insulation throughout older facilities. The Company’s obligations for the proper removal and disposal of asbestos products from the Company’s mills meets the definition of a conditional asset retirement obligation as found in FASB’s Accounting Standards Codification No. 410,Asset Retirement and Environment (“ASC 410”). As a result of the longevity of the Company’s mills, due in part to the maintenance procedures and the fact that the Company does not have plans for major changes that require the removal of asbestos, the timing of the asbestos removal is indeterminate. As a result, the Company is currently unable to reasonably estimate the fair value of its asbestos removal and disposal obligation. The Company will recognize a liability in the period in which sufficient information is available to reasonably estimate its fair value. | Discontinued Operations |
In August 2006, the Company reorganized and divested its equity interests in certain paper production assets for aggregate consideration of approximately €5,000 of indebtedness, in the form of a secured note, and €5,000 in cash. Only the cash portion of the consideration appears on the consolidated condensed statements of cash flows.
On November 16, 2006, the Company divested its last remaining paper production assets to focus exclusively on the manufacture and sale of pulp.
Accordingly, the information related to the paper production assets is presented as discontinued operations in the Company’s consolidated financial statements.
101
| (c) | Pursuant to an arbitration proceeding with the general construction contractor of the Stendal mill regarding certain warranty claims, the Company acted upon a bank guarantee for defect liability on civil works that was about to expire as provided in the engineering, procurement, and construction contract. On January 28, 2011, the Company received approximately €10,000 (the “Guarantee Amount”), which is intended to |
MERCER INTERNATIONAL INC.
NOTES TO THE CONSOLIDATED FINANCIAL STATEMENTS
(In thousands of Euros, except per share data)
Note 17. Commitments and Contingencies (continued)
| |
Note 17. | Discontinued Operations — (Continued)compensate the Company for remediation work that is required at the Stendal mill, but it is less than the amount claimed by the Company under the arbitration. Consequently, the arbitration proceeding is ongoing, and there is no certainty that the Company will be successful with its claims. |
Condensed earnings from discontinued operations for the year ended December 31 are as follows:
| | | | | | | | | | | | | |
| | | 2008 | | | 2007 | | | 2006 | |
| |
| Revenues | | € | — | | | € | 128 | | | € | 46,351 | |
| Operating (loss) income from discontinued operations | | € | — | | | € | (142 | ) | | € | 394 | |
| Total other expenses | | | — | | | | (68 | ) | | | (469 | ) |
| Loss on disposal of business | | | — | | | | — | | | | (5,957 | ) |
| | | | | | | | | | | | | |
| Net loss from discontinued operations | | € | — | | | € | (210 | ) | | € | (6,032 | ) |
| | | | | | | | | | | | | |
| Loss per common share from discontinued operations | | | | | | | | | | | | |
| — basic | | € | — | | | € | (0.01 | ) | | € | (0.18 | ) |
| — diluted | | € | — | | | € | (0.01 | ) | | € | (0.18 | ) |
Condensed cash flows from discontinued operations for the year ended December 31 are as follows:
| | | | | | | | | | | | | |
| | | 2008 | | | 2007 | | | 2006 | |
| |
| Cash flows used in operating activities | | € | — | | | € | (1,519 | ) | | € | (2,121 | ) |
| Cash flows from (used in) investing activities | | | — | | | | 1,260 | | | | 5,944 | |
| Cash flows used in financing activities | | | — | | | | — | | | | (4,158 | ) |
| | | | | | | | | | | | | |
| Cash flows used in discontinued operations | | € | — | | | € | (259 | ) | | € | (335 | ) |
| | | | | | | | | | | | | |
| (d) | |
Note 18. | Minority Share PurchaseThe Company is involved in a property transfer tax dispute with respect to the Celgar mill and certain other legal actions and claims arising in the ordinary course of business. While the outcome of these legal actions and claims cannot be predicted with certainty, it is the opinion of management that the outcome of any such claim which is pending or threatened, either individually or on a combined basis, will not have a material adverse effect on the consolidated financial condition, results of operations or liquidity of the Company. |
In October 2006, the Company increased its interest in the Stendal mill to 70.6% by acquiring a 7% minority interest therein for approximately €8,100, of which approximately €6,700 was paid by a note. The purchase price of approximately €8,100 was allocated to property, plant and equipment.
| (e) | The Company had also entered into certain other capital commitments at the Rosenthal mill, none of which is individually material. |
| (f) | The Company entered into certain minimum or fixed purchase commitments primarily related to the purchase of raw materials, none of which are individually material, that extend beyond 2012. Commitments under these contracts are approximately €1,000 in 2012, approximately €500 in 2013 and approximately €200 in 2014. |
| |
Note 19. | Subsequent Events |
OnNote 18. Subsequent Event
In January 23, 2009,2012, the Company’s majority owned subsidiary secured a new €17,000 five year amortizing secured term debt facility, of which 80% is guaranteed by the State of Saxony-Anhalt. The facility is non-recourse to Mercer. The facility will be used to finance a project, referred to as “Project Blue Mill”, to increase the Stendal mill’s annual pulp production capacity by 30,000 air-dried metric tonnes and includes the installation of an additional 40 megawatt steam turbine. The balance of the costs will be funded through operating cash flow of the Stendal mill, government grants and up to an aggregate of €6,500 in shareholder loans split pro-rata between Mercer and Stendal’s noncontrolling shareholder.
As part of Project Blue Mill, subsequent to year end, the Company was granted a one-year extension pursuant to the termsentered into approximately €12,800 of the credit agreement with respect to the revolving credit facility at the Celgar mill. The extension carries the same general terms and matures May 10, 2009.
On February 4, 2009, the Company announced that it had reached an agreement with certain lenders to amend its Stendal credit facility (Note 7(a)). The amendment defers approximately €164,000 of scheduled principal payments until the maturity date, September 30, 2017, including approximately €20,000, €26,000 and €21,000 of scheduled principal payments in 2009, 2010 and 2011, respectively. Additionally, the Company is required to make a €10,000fixed purchase commitments for capital contribution to Stendal, and pay amendment fees totaling approximately €3,600. The amendment is subject to customary conditions precedent which are expected to be completed on or before March 15, 2009.
On January 30, 2009, the Celgar mill finalized an electricity purchase agreement with BC Hydro and Power Authority, or “BC Hydro”, British Columbia’s primary public utilities provider, for the sale of electricity from the Celgar Energy Project. Under the agreement, the Celgar mill will supply a minimum of approximately 238,000 Megawatt hours of electrical energy annually to BC Hydro over a 10 year term with deliveries estimated to commence in the first quarter of 2010.
equipment. | |
Note 20. | Restricted Group Supplemental Disclosure |
Note 19. Restricted Group Supplemental Disclosure
The terms of the indentureindentures governing our 9.25%9.50% senior unsecuredsecured notes requiresrequire that we provide the results of operations and financial condition of Mercer International Inc. and our restricted subsidiaries under the indenture,
102
MERCER INTERNATIONAL INC.
NOTES TO THE CONSOLIDATED FINANCIAL STATEMENTS
(In thousands of Euros, except per share data)
| |
Note 20. | Restricted Group Supplemental Disclosure — (Continued) |
collectively referred to as the “Restricted Group”. As at and during the years ended December 31, 20082011 and 2007,2010, the Restricted Group was comprised of Mercer International Inc., certain holding subsidiaries and our Rosenthal and Celgar mills. The Restricted Group excludes the Stendal mill and, up to December 31, 2006, the discontinued paper business.
Combined Condensed Balance Sheet — December 31, 2008
| | | | | | | | | | | | | | | | | |
| | | Restricted
| | | Unrestricted
| | | | | | Consolidated
| |
| | | Group | | | Subsidiaries | | | Eliminations | | | Group | |
| |
ASSETS | | | | | | | | | | | | | | | | |
| Current | | | | | | | | | | | | | | | | |
| Cash and cash equivalents | | € | 26,176 | | | € | 16,276 | | | € | — | | | € | 42,452 | |
| Cash, restricted | | | — | | | | 13,000 | | | | — | | | | 13,000 | |
| Receivables | | | 57,258 | | | | 42,900 | | | | — | | | | 100,158 | |
| Note receivable, current portion | | | 642 | | | | — | | | | — | | | | 642 | |
| Inventories | | | 59,801 | | | | 38,656 | | | | — | | | | 98,457 | |
| Prepaid expenses and other | | | 2,573 | | | | 1,619 | | | | — | | | | 4,192 | |
| | | | | | | | | | | | | | | | | |
| Total current assets | | | 146,450 | | | | 112,451 | | | | — | | | | 258,901 | |
| Property, plant and equipment | | | 351,009 | | | | 530,695 | | | | — | | | | 881,704 | |
| Other | | | 4,425 | | | | 5 | | | | — | | | | 4,430 | |
| Deferred income tax | | | 18,439 | | | | 13,227 | | | | — | | | | 31,666 | |
| Due from unrestricted group | | | 55,925 | | | | — | | | | (55,925 | ) | | | — | |
| Note receivable, less current portion | | | 3,529 | | | | — | | | | — | | | | 3,529 | |
| | | | | | | | | | | | | | | | | |
| Total assets | | € | 579,777 | | | € | 656,378 | | | € | (55,925 | ) | | € | 1,180,230 | |
| | | | | | | | | | | | | | | | | |
LIABILITIES | | | | | | | | | | | | | | | | |
| Current | | | | | | | | | | | | | | | | |
| Accounts payable and accrued expenses | | € | 44,450 | | | € | 43,067 | | | € | — | | | € | 87,517 | |
| Pension and other post-retirement benefit obligations, current portion | | | 510 | | | | — | | | | — | | | | 510 | |
| Debt, current portion | | | — | | | | 16,500 | | | | — | | | | 16,500 | |
| | | | | | | | | | | | | | | | | |
| Total current liabilities | | | 44,960 | | | | 59,567 | | | | — | | | | 104,527 | |
| Debt, less current portion | | | 289,222 | | | | 514,574 | | | | — | | | | 803,796 | |
| Due to restricted group | | | — | | | | 55,925 | | | | (55,925 | ) | | | — | |
| Unrealized derivative loss | | | — | | | | 47,112 | | | | — | | | | 47,112 | |
Pension and other post-retirement benefit
obligations | | | 12,846 | | | | — | | | | — | | | | 12,846 | |
| Capital leases and other | | | 7,167 | | | | 4,100 | | | | — | | | | 11,267 | |
| Deferred income tax | | | 15,403 | | | | 19,054 | | | | — | | | | 34,457 | |
| | | | | | | | | | | | | | | | | |
| Total liabilities | | | 369,598 | | | | 700,332 | | | | (55,925 | ) | | | 1,014,005 | |
| | | | | | | | | | | | | | | | | |
SHAREHOLDERS’ EQUITY | | | | | | | | | | | | | | | | |
| Total shareholders’ equity (deficit) | | | 210,179 | | | | (43,954 | ) | | | — | | | | 166,225 | |
| | | | | | | | | | | | | | | | | |
| Total liabilities and shareholders’ equity | | € | 579,777 | | | € | 656,378 | | | € | (55,925 | ) | | € | 1,180,230 | |
| | | | | | | | | | | | | | | | | |
103
MERCER INTERNATIONAL INC.
NOTES TO THE CONSOLIDATED FINANCIAL STATEMENTS
(In thousands of Euros, except per share data)
| |
Note 20. | Restricted Group Supplemental Disclosure — (Continued) |
Note 19. Restricted Group Supplemental Disclosure (continued)
Combined Condensed Balance Sheet — December 31, 2007
| | | | | | | | | | | | | | | | | |
| | | Restricted
| | | Unrestricted
| | | | | | Consolidated
| |
| | | Group | | | Subsidiaries | | | Eliminations | | | Group | |
| |
ASSETS | | | | | | | | | | | | | | | | |
| Current | | | | | | | | | | | | | | | | |
| Cash and cash equivalents | | € | 59,371 | | | € | 25,477 | | | € | — | | | € | 84,848 | |
| Receivables | | | 37,482 | | | | 52,408 | | | | — | | | | 89,890 | |
| Note receivable, current portion | | | 589 | | | | 5,307 | | | | — | | | | 5,896 | |
| Inventories | | | 63,444 | | | | 40,166 | | | | — | | | | 103,610 | |
| Prepaid expenses and other | | | 3,714 | | | | 2,301 | | | | — | | | | 6,015 | |
| | | | | | | | | | | | | | | | | |
| Total current assets | | | 164,600 | | | | 125,659 | | | | — | | | | 290,259 | |
| Cash, restricted | | | — | | | | 33,000 | | | | — | | | | 33,000 | |
| Property, plant and equipment | | | 385,569 | | | | 547,689 | | | | — | | | | 933,258 | |
| Other | | | 5,399 | | | | — | | | | — | | | | 5,399 | |
| Deferred income tax | | | 10,852 | | | | 6,772 | | | | — | | | | 17,624 | |
| Due from unrestricted group | | | 57,457 | | | | — | | | | (57,457 | ) | | | — | |
| Note receivable, less current portion | | | 3,977 | | | | — | | | | — | | | | 3,977 | |
| | | | | | | | | | | | | | | | | |
| Total assets | | € | 627,854 | | | € | 713,120 | | | € | (57,457 | ) | | € | 1,283,517 | |
| | | | | | | | | | | | | | | | | |
LIABILITIES | | | | | | | | | | | | | | | | |
| Current | | | | | | | | | | | | | | | | |
| Accounts payable and accrued expenses | | € | 43,621 | | | € | 43,379 | | | € | — | | | € | 87,000 | |
| Pension and other post-retirement benefit obligations, current portion | | | 493 | | | | — | | | | — | | | | 493 | |
| Debt, current portion | | | — | | | | 34,023 | | | | — | | | | 34,023 | |
| | | | | | | | | | | | | | | | | |
| Total current liabilities | | | 44,114 | | | | 77,402 | | | | — | | | | 121,516 | |
| Debt, less current portion | | | 273,589 | | | | 542,243 | | | | — | | | | 815,832 | |
| Due to restricted group | | | — | | | | 57,457 | | | | (57,457 | ) | | | — | |
| Unrealized derivative loss | | | — | | | | 21,885 | | | | — | | | | 21,885 | |
| Pension & other post-retirement benefit obligations | | | 19,983 | | | | — | | | | — | | | | 19,983 | |
| Capital leases and other | | | 7,033 | | | | 1,966 | | | | — | | | | 8,999 | |
| Deferred income tax | | | 4,553 | | | | 14,087 | | | | — | | | | 18,640 | |
| | | | | | | | | | | | | | | | | |
| Total liabilities | | | 349,272 | | | | 715,040 | | | | (57,457 | ) | | | 1,006,855 | |
| | | | | | | | | | | | | | | | | |
SHAREHOLDERS’ EQUITY | | | | | | | | | | | | | | | | |
| Total shareholders’ equity (deficit) | | | 278,582 | | | | (1,920 | ) | | | — | | | | 276,662 | |
| | | | | | | | | | | | | | | | | |
| Total liabilities and shareholders’ equity | | € | 627,854 | | | € | 713,120 | | | € | (57,457 | ) | | € | 1,283,517 | |
| | | | | | | | | | | | | | | | | |
104
| | | | | | | | | | | | | | | | |
| | | December 31, 2011 | |
| | | Restricted
Group | | | Unrestricted
Subsidiaries | | | Eliminations | | | Consolidated
Group | |
ASSETS | | | | | | | | | | | | | | | | |
Current assets | | | | | | | | | | | | | | | | |
Cash and cash equivalents | | € | 44,829 | | | € | 60,243 | | | € | — | | | € | 105,072 | |
Marketable securities | | | 12,216 | | | | — | | | | — | | | | 12,216 | |
Receivables | | | 62,697 | | | | 57,790 | | | | — | | | | 120,487 | |
Inventories | | | 71,692 | | | | 48,847 | | | | — | | | | 120,539 | |
Prepaid expenses and other | | | 5,019 | | | | 3,143 | | | | — | | | | 8,162 | |
Deferred income tax | | | 5,179 | | | | 1,571 | | | | — | | | | 6,750 | |
| | | | | | | | | | | | | | | | |
Total current assets | | | 201,632 | | | | 171,594 | | | | — | | | | 373,226 | |
Long-term assets | | | | | | | | | | | | | | | | |
Property, plant and equipment | | | 353,925 | | | | 467,049 | | | | — | | | | 820,974 | |
Deferred note issuance and other | | | 5,971 | | | | 4,792 | | | | — | | | | 10,763 | |
Deferred income tax | | | 8,492 | | | | 3,795 | | | | — | | | | 12,287 | |
Due from unrestricted group | | | 88,824 | | | | — | | | | (88,824 | ) | | | — | |
| | | | | | | | | | | | | | | | |
Total assets | | € | 658,844 | | | € | 647,230 | | | € | (88,824 | ) | | € | 1,217,250 | |
| | | | | | | | | | | | | | | | |
LIABILITIES | | | | | | | | | | | | | | | | |
Current liabilities | | | | | | | | | | | | | | | | |
Accounts payable and other | | € | 49,815 | | | € | 49,825 | | | € | — | | | € | 99,640 | |
Pension and other post-retirement benefit obligations | | | 756 | | | | — | | | | — | | | | 756 | |
Debt | | | 1,088 | | | | 24,583 | | | | — | | | | 25,671 | |
| | | | | | | | | | | | | | | | |
Total current liabilities | | | 51,659 | | | | 74,408 | | | | — | | | | 126,067 | |
Long-term liabilities | | | | | | | | | | | | | | | | |
Debt | | | 222,384 | | | | 486,031 | | | | — | | | | 708,415 | |
Due to restricted group | | | — | | | | 88,824 | | | | (88,824 | ) | | | — | |
Unrealized interest rate derivative losses | | | — | | | | 52,391 | | | | — | | | | 52,391 | |
Pension and other post-retirement benefit obligations | | | 31,197 | | | | — | | | | — | | | | 31,197 | |
Capital leases and other | | | 6,604 | | | | 6,449 | | | | — | | | | 13,053 | |
Deferred income tax | | | 2,585 | | | | — | | | | — | | | | 2,585 | |
| | | | | | | | | | | | | | | | |
Total liabilities | | | 314,429 | | | | 708,103 | | | | (88,824 | ) | | | 933,708 | |
| | | | | | | | | | | | | | | | |
EQUITY | | | | | | | | | | | | | | | | |
Total shareholders’ equity (deficit) | | | 344,415 | | | | (42,299 | ) | | | — | | | | 302,116 | |
Noncontrolling interest (deficit) | | | — | | | | (18,574 | ) | | | — | | | | (18,574 | ) |
| | | | | | | | | | | | | | | | |
Total liabilities and equity | | € | 658,844 | | | € | 647,230 | | | € | (88,824 | ) | | € | 1,217,250 | |
| | | | | | | | | | | | | | | | |
MERCER INTERNATIONAL INC.
NOTES TO THE CONSOLIDATED FINANCIAL STATEMENTS
(In thousands of Euros, except per share data)
| |
Note 20. | Restricted Group Supplemental Disclosure — (Continued) |
Note 19. Restricted Group Supplemental Disclosure (continued)
Combined Condensed Statement of Operations — December 31, 2008
| | | | | | | | | | | | | | | | | |
| | | Restricted
| | | Unrestricted
| | | | | | Consolidated
| |
| | | Group | | | Subsidiaries | | | Eliminations | | | Group | |
| |
| Revenues | | € | 413,088 | | | € | 307,203 | | | € | — | | | € | 720,291 | |
| | | | | | | | | | | | | | | | | |
| Operating costs | | | 369,923 | | | | 257,010 | | | | — | | | | 626,933 | |
| Operating depreciation and amortization | | | 28,589 | | | | 26,895 | | | | — | | | | 55,484 | |
| Selling, general and administrative expenses | | | 17,406 | | | | 12,752 | | | | — | | | | 30,158 | |
| (Sale) purchase of emission allowances | | | (433 | ) | | | (5,180 | ) | | | — | | | | (5,613 | ) |
| | | | | | | | | | | | | | | | | |
| Operating income from continuing operations | | | (2,397 | ) | | | 15,726 | | | | — | | | | 13,329 | |
| | | | | | | | | | | | | | | | | |
| Other income (expense) | | | | | | | | | | | | | | | | |
| Interest expense | | | (27,027 | ) | | | (43,117 | ) | | | 4,388 | | | | (65,756 | ) |
| Investment income (loss) | | | 6,834 | | | | (3,620 | ) | | | (4,388 | ) | | | (1,174 | ) |
| Derivative financial instruments, net | | | — | | | | (25,228 | ) | | | — | | | | (25,228 | ) |
| Foreign exchange gain on debt | | | (4,114 | ) | | | (120 | ) | | | — | | | | (4,234 | ) |
| | | | | | | | | | | | | | | | | |
| Total other income (expense) | | | (24,307 | ) | | | (72,085 | ) | | | — | | | | (96,392 | ) |
| | | | | | | | | | | | | | | | | |
| Income (loss) before income taxes and minority interest from continuing operations | | | (26,704 | ) | | | (56,359 | ) | | | — | | | | (83,063 | ) |
| Income tax benefit (provision) | | | | | | | | | | | | | | | | |
| Current | | | (264 | ) | | | (237 | ) | | | — | | | | (501 | ) |
| Deferred | | | (3,464 | ) | | | 1,488 | | | | — | | | | (1,976 | ) |
| | | | | | | | | | | | | | | | | |
| Income (loss) before minority interest from continuing operations | | | (30,432 | ) | | | (55,108 | ) | | | — | | | | (85,540 | ) |
| Minority interest | | | — | | | | 13,075 | | | | — | | | | 13,075 | |
| | | | | | | | | | | | | | | | | |
| Net income (loss) from continuing operations | | | (30,432 | ) | | | (42,033 | ) | | | — | | | | (72,465 | ) |
| | | | | | | | | | | | | | | | | |
| Net income (loss) | | € | (30,432 | ) | | € | (42,033 | ) | | € | — | | | € | (72,465 | ) |
| | | | | | | | | | | | | | | | | |
105
| | | | | | | | | | | | | | | | |
| | | December 31, 2010 | |
| | | Restricted
Group | | | Unrestricted
Subsidiaries | | | Eliminations | | | Consolidated
Group | |
ASSETS | | | | | | | | | | | | | | | | |
Current assets | | | | | | | | | | | | | | | | |
Cash and cash equivalents | | € | 50,654 | | | € | 48,368 | | | € | — | | | € | 99,022 | |
Receivables | | | 70,865 | | | | 50,844 | | | | — | | | | 121,709 | |
Inventories | | | 60,910 | | | | 41,309 | | | | — | | | | 102,219 | |
Prepaid expenses and other | | | 6,840 | | | | 4,520 | | | | — | | | | 11,360 | |
Deferred income tax | | | 22,570 | | | | — | | | | — | | | | 22,570 | |
| | | | | | | | | | | | | | | | |
Total current assets | | | 211,839 | | | | 145,041 | | | | — | | | | 356,880 | |
Long-term assets | | | | | | | | | | | | | | | | |
Property, plant and equipment | | | 362,274 | | | | 484,493 | | | | — | | | | 846,767 | |
Deferred note issuance and other | | | 6,903 | | | | 4,179 | | | | — | | | | 11,082 | |
Due from unrestricted group | | | 80,582 | | | | — | | | | (80,582 | ) | | | — | |
Note receivable | | | 1,346 | | | | — | | | | — | | | | 1,346 | |
| | | | | | | | | | | | | | | | |
Total assets | | € | 662,944 | | | € | 633,713 | | | € | (80,582 | ) | | € | 1,216,075 | |
| | | | | | | | | | | | | | | | |
LIABILITIES | | | | | | | | | | | | | | | | |
Current liabilities | | | | | | | | | | | | | | | | |
Accounts payable and other | | € | 44,015 | | | € | 40,858 | | | € | — | | | € | 84,873 | |
Pension and other post-retirement benefit obligations | | | 728 | | | | — | | | | — | | | | 728 | |
Debt | | | 16,429 | | | | 23,167 | | | | — | | | | 39,596 | |
| | | | | | | | | | | | | | | | |
Total current liabilities | | | 61,172 | | | | 64,025 | | | | — | | | | 125,197 | |
Long-term liabilities | | | | | | | | | | | | | | | | |
Debt | | | 273,473 | | | | 508,855 | | | | — | | | | 782,328 | |
Due to restricted group | | | — | | | | 80,582 | | | | (80,582 | ) | | | — | |
Unrealized interest rate derivative losses | | | — | | | | 50,973 | | | | — | | | | 50,973 | |
Pension and other post-retirement benefit obligations | | | 24,236 | | | | — | | | | — | | | | 24,236 | |
Capital leases and other | | | 7,154 | | | | 4,856 | | | | — | | | | 12,010 | |
Deferred income tax | | | 7,768 | | | | — | | | | — | | | | 7,768 | |
| | | | | | | | | | | | | | | | |
Total liabilities | | | 373,803 | | | | 709,291 | | | | (80,582 | ) | | | 1,002,512 | |
| | | | | | | | | | | | | | | | |
EQUITY | | | | | | | | | | | | | | | | |
Total shareholders’ equity (deficit) | | | 289,141 | | | | (53,073 | ) | | | — | | | | 236,068 | |
Noncontrolling interest (deficit) | | | — | | | | (22,505 | ) | | | — | | | | (22,505 | ) |
| | | | | | | | | | | | | | | | |
Total liabilities and equity | | € | 662,944 | | | € | 633,713 | | | € | (80,582 | ) | | € | 1,216,075 | |
| | | | | | | | | | | | | | | | |
MERCER INTERNATIONAL INC.
NOTES TO THE CONSOLIDATED FINANCIAL STATEMENTS
(In thousands of Euros, except per share data)
| |
Note 20. | Restricted Group Supplemental Disclosure — (Continued) |
Note 19. Restricted Group Supplemental Disclosure (continued)
Combined Condensed StatementStatements of Operations — December 31, 2007
| | | | | | | | | | | | | | | | | |
| | | Restricted
| | | Unrestricted
| | | | | | Consolidated
| |
| | | Group | | | Subsidiaries | | | Eliminations | | | Group | |
| |
| Revenues | | € | 410,369 | | | € | 316,926 | | | € | — | | | € | 727,295 | |
| | | | | | | | | | | | | | | | | |
| Operating costs | | | 328,954 | | | | 246,284 | | | | — | | | | 575,238 | |
| Operating depreciation and amortization | | | 28,661 | | | | 27,739 | | | | — | | | | 56,400 | |
| Selling, general and administrative expenses | | | 17,650 | | | | 13,064 | | | | — | | | | 30,714 | |
| (Sale) purchase of emission allowances | | | (1,566 | ) | | | (3,077 | ) | | | — | | | | (4,643 | ) |
| | | | | | | | | | | | | | | | | |
| Operating income from continuing operations | | | 36,670 | | | | 32,916 | | | | — | | | | 69,586 | |
| | | | | | | | | | | | | | | | | |
| Other income (expense) | | | | | | | | | | | | | | | | |
| Interest income (expense) | | | (28,472 | ) | | | (46,653 | ) | | | 3,725 | | | | (71,400 | ) |
| Investment income | | | 5,303 | | | | 2,875 | | | | (3,725 | ) | | | 4,453 | |
| Derivative financial instruments, net | | | — | | | | 20,357 | | | | — | | | | 20,357 | |
| Foreign exchange gain on debt | | | 10,629 | | | | 329 | | | | — | | | | 10,958 | |
| | | | | | | | | | | | | | | | | |
| Total other income (expense) | | | (12,540 | ) | | | (23,092 | ) | | | — | | | | (35,632 | ) |
| | | | | | | | | | | | | | | | | |
| Income (loss) before income taxes and minority interest from continuing operations | | | 24,130 | | | | 9,824 | | | | — | | | | 33,954 | |
| Income tax benefit (provision) | | | | | | | | | | | | | | | | |
| Current | | | (1,394 | ) | | | (776 | ) | | | — | | | | (2,170 | ) |
| Deferred | | | (5,034 | ) | | | (3,110 | ) | | | — | | | | (8,144 | ) |
| | | | | | | | | | | | | | | | | |
| Income (loss) before minority interest from continuing operations | | | 17,702 | | | | 5,938 | | | | — | | | | 23,640 | |
| Minority interest | | | — | | | | (1,251 | ) | | | — | | | | (1,251 | ) |
| | | | | | | | | | | | | | | | | |
| Net income (loss) from continuing operations | | | 17,702 | | | | 4,687 | | | | — | | | | 22,389 | |
| Net income (loss) from discontinued operations | | | (210 | ) | | | — | | | | — | | | | (210 | ) |
| | | | | | | | | | | | | | | | | |
| Net income (loss) | | € | 17,492 | | | € | 4,687 | | | € | — | | | € | 22,179 | |
| | | | | | | | | | | | | | | | | |
106
| | | | | | | | | | | | | | | | |
| | | Year Ended December 31, 2011 | |
| | | Restricted
Group | | | Unrestricted
Subsidiaries | | | Eliminations | | | Consolidated
Group | |
Revenues | | | | | | | | | | | | | | | | |
Pulp | | € | 473,992 | | | € | 357,404 | | | € | — | | | € | 831,396 | |
Energy | | | 25,473 | | | | 32,499 | | | | — | | | | 57,972 | |
| | | | | | | | | | | | | | | | |
| | | 499,465 | | | | 389,903 | | | | — | | | | 889,368 | |
| | | | | | | | | | | | | | | | |
Operating costs | | | 382,555 | | | | 301,163 | | | | — | | | | 683,718 | |
Operating depreciation and amortization | | | 29,841 | | | | 25,919 | | | | — | | | | 55,760 | |
Selling, general and administrative expenses | | | 24,126 | | | | 14,645 | | | | — | | | | 38,771 | |
| | | | | | | | | | | | | | | | |
| | | 436,522 | | | | 341,727 | | | | — | | | | 778,249 | |
| | | | | | | | | | | | | | | | |
Operating income | | | 62,943 | | | | 48,176 | | | | — | | | | 111,119 | |
| | | | | | | | | | | | | | | | |
Other income (expense) | | | | | | | | | | | | | | | | |
Interest expense | | | (24,886 | ) | | | (39,074 | ) | | | 4,965 | | | | (58,995 | ) |
Investment income (loss) | | | 5,262 | | | | 1,204 | | | | (4,965 | ) | | | 1,501 | |
Foreign exchange gain on debt | | | 1,175 | | | | — | | | | — | | | | 1,175 | |
Loss on extinguishment of debt | | | (71 | ) | | | — | | | | — | | | | (71 | ) |
Loss on derivative instruments | | | — | | | | (1,418 | ) | | | — | | | | (1,418 | ) |
| | | | | | | | | | | | | | | | |
Total other income (expense) | | | (18,520 | ) | | | (39,288 | ) | | | — | | | | (57,808 | ) |
| | | | | | | | | | | | | | | | |
Income before income taxes | | | 44,423 | | | | 8,888 | | | | — | | | | 53,311 | |
Income tax benefit (provision) | | | (4,614 | ) | | | 5,309 | | | | — | | | | 695 | |
| | | | | | | | | | | | | | | | |
Net income | | | 39,809 | | | | 14,197 | | | | — | | | | 54,006 | |
Less: net income attributable to noncontrolling interest | | | — | | | | (3,931 | ) | | | — | | | | (3,931 | ) |
| | | | | | | | | | | | | | | | |
Net income attributable to common shareholders | | € | 39,809 | | | € | 10,266 | | | € | — | | | € | 50,075 | |
| | | | | | | | | | | | | | | | |
MERCER INTERNATIONAL INC.
NOTES TO THE CONSOLIDATED FINANCIAL STATEMENTS
(In thousands of Euros, except per share data)
| |
Note 20. | Restricted Group Supplemental Disclosure — (Continued) |
Combined Condensed Statement of Operations — December 31, 2006
| | | | | | | | | | | | | | | | | |
| | | Restricted
| | | Unrestricted
| | | | | | Consolidated
| |
| | | Group | | | Subsidiaries | | | Eliminations | | | Group | |
| |
| Revenues | | € | 368,016 | | | € | 276,883 | | | € | — | | | € | 644,899 | |
| | | | | | | | | | | | | | | | | |
| Operating costs | | | 287,867 | | | | 189,659 | | | | — | | | | 477,526 | |
| Operating depreciation and amortization | | | 27,819 | | | | 28,015 | | | | — | | | | 55,834 | |
| Selling, general and administrative expenses | | | 22,861 | | | | 11,783 | | | | — | | | | 34,644 | |
| (Sale) purchase of emission allowances | | | (4,933 | ) | | | (10,676 | ) | | | — | | | | (15,609 | ) |
| | | | | | | | | | | | | | | | | |
| Operating income from continuing operations | | | 34,402 | | | | 58,102 | | | | — | | | | 92,504 | |
| | | | | | | | | | | | | | | | | |
| Other income (expense) | | | | | | | | | | | | | | | | |
| Interest income (expense) | | | (34,354 | ) | | | (61,137 | ) | | | 3,560 | | | | (91,931 | ) |
| Investment income | | | 5,316 | | | | 4,334 | | | | (3,560 | ) | | | 6,090 | |
| Derivative financial instruments, net | | | — | | | | 105,848 | | | | — | | | | 105,848 | |
| Foreign exchange gain on debt | | | 15,245 | | | | — | | | | — | | | | 15,245 | |
| | | | | | | | | | | | | | | | | |
| Total other income (expense) | | | (13,793 | ) | | | 49,045 | | | | — | | | | 35,252 | |
| | | | | | | | | | | | | | | | | |
| Income (loss) before income taxes and minority interest from continuing operations | | | 20,609 | | | | 107,147 | | | | — | | | | 127,756 | |
| Income tax benefit (provision) | | | | | | | | | | | | | | | | |
| Current | | | (290 | ) | | | (294 | ) | | | — | | | | (584 | ) |
| Deferred | | | (10,968 | ) | | | (45,891 | ) | | | — | | | | (56,859 | ) |
| | | | | | | | | | | | | | | | | |
| Income (loss)before minority interest from continuing operations | | | 9,351 | | | | 60,962 | | | | — | | | | 70,313 | |
| Minority interest | | | — | | | | (1,071 | ) | | | — | | | | (1,071 | ) |
| | | | | | | | | | | | | | | | | |
| Net income (loss) from continuing operations | | | 9,351 | | | | 59,891 | | | | — | | | | 69,242 | |
| Net income (loss) from discontinued operations | | | — | | | | (6,032 | ) | | | — | | | | (6,032 | ) |
| | | | | | | | | | | | | | | | | |
| Net income (loss) | | € | 9,351 | | | € | 53,859 | | | € | — | | | € | 63,210 | |
| | | | | | | | | | | | | | | | | |
107
Note 20.19. Restricted Group Supplemental Disclosure — (Continued)
(continued)SUPPLEMENTARYCombined Condensed Statements of Operations
| | | | | | | | | | | | | | | | |
| | | Year Ended December 31, 2010 | |
| | | Restricted
Group | | | Unrestricted
Subsidiaries | | | Eliminations | | | Consolidated
Group | |
Revenues | | | | | | | | | | | | | | | | |
Pulp | | € | 490,020 | | | € | 366,291 | | | € | — | | | € | 856,311 | |
Energy | | | 15,145 | | | | 29,080 | | | | — | | | | 44,225 | |
| | | | | | | | | | | | | | | | |
| | | 505,165 | | | | 395,371 | | | | — | | | | 900,536 | |
| | | | | | | | | | | | | | | | |
Operating costs | | | 361,272 | | | | 282,257 | | | | — | | | | 643,529 | |
Operating depreciation and amortization | | | 29,971 | | | | 25,961 | | | | — | | | | 55,932 | |
Selling, general and administrative expenses | | | 20,231 | | | | 13,101 | | | | — | | | | 33,332 | |
| | | | | | | | | | | | | | | | |
| | | 411,474 | | | | 321,319 | | | | — | | | | 732,793 | |
| | | | | | | | | | | | | | | | |
Operating income | | | 93,691 | | | | 74,052 | | | | — | | | | 167,743 | |
| | | | | | | | | | | | | | | | |
Other income (expense) | | | | | | | | | | | | | | | | |
Interest expense | | | (31,498 | ) | | | (40,852 | ) | | | 4,729 | | | | (67,621 | ) |
Investment income (loss) | | | 5,103 | | | | 94 | | | | (4,729 | ) | | | 468 | |
Foreign exchange loss on debt | | | (6,126 | ) | | | — | | | | — | | | | (6,126 | ) |
Loss on extinguishment of debt | | | (7,494 | ) | | | — | | | | — | | | | (7,494 | ) |
Gain on derivative instruments | | | — | | | | 1,899 | | | | — | | | | 1,899 | |
| | | | | | | | | | | | | | | | |
Total other income (expense) | | | (40,015 | ) | | | (38,859 | ) | | | — | | | | (78,874 | ) |
| | | | | | | | | | | | | | | | |
Income before income taxes | | | 53,676 | | | | 35,193 | | | | — | | | | 88,869 | |
Income tax benefit (provision) | | | 8,651 | | | | (2,772 | ) | | | — | | | | 5,879 | |
| | | | | | | | | | | | | | | | |
Net income | | | 62,327 | | | | 32,421 | | | | — | | | | 94,748 | |
Less: net income attributable to noncontrolling interest | | | — | | | | (8,469 | ) | | | — | | | | (8,469 | ) |
| | | | | | | | | | | | | | | | |
Net income attributable to common shareholders | | € | 62,327 | | | € | 23,952 | | | € | — | | | € | 86,279 | |
| | | | | | | | | | | | | | | | |
MERCER INTERNATIONAL INC.
NOTES TO THE CONSOLIDATED FINANCIAL INFORMATION (UNAUDITED)
Quarterly Financial Data
STATEMENTS
(In thousands of Euros, except per share amounts)data)
| | | | | | | | | | | | | | | | | |
| | | Quarter Ended | |
| | | March 31 | | | June 30 | | | September 30 | | | December 31 | |
| |
2008 | | | | | | | | | | | | | | | | |
| Revenues | | € | 186,816 | | | € | 176,651 | | | € | 184,828 | | | € | 171,996 | |
| Gross profit | | | 18,643 | | | | 6,216 | | | | 9,854 | | | | (21,384 | ) |
| Income (loss) before extraordinary items and cumulative effect of a change in accounting from continuing operations | | | 2,869 | | | | 871 | | | | (17,173 | ) | | | (59,032 | ) |
| Income (loss) before extraordinary items and cumulative effect of a change in accounting from continuing operations, per share* | | | 0.08 | | | | 0.02 | | | | (0.47 | ) | | | (1.63 | ) |
| Net income (loss) from discontinued operations | | | — | | | | — | | | | — | | | | — | |
| Net income (loss) | | | 2,869 | | | | 871 | | | | (17,173 | ) | | | (59,032 | ) |
| Net income (loss) per share* | | | 0.08 | | | | 0.02 | | | | (0.47 | ) | | | (1.63 | ) |
| | | | | | | | | | | | | | | | | |
2007 | | | | | | | | | | | | | | | | |
| Revenues | | € | 175,773 | | | € | 182,401 | | | € | 195,734 | | | € | 173,387 | |
| Gross profit | | | 14,477 | | | | 10,943 | | | | 21,457 | | | | 22,709 | |
| Income before extraordinary items and cumulative effect of a change in accounting from continuing operations | | | 1,093 | | | | 3,340 | | | | 10,706 | | | | 7,250 | |
| Income before extraordinary items and cumulative effect of a change in accounting from continuing operations, per share* | | | 0.03 | | | | 0.09 | | | | 0.26 | | | | 0.18 | |
| Net income (loss) from discontinued operations | | | (7 | ) | | | (181 | ) | | | (10 | ) | | | (12 | ) |
| Net income (loss) | | | 1,086 | | | | 3,159 | | | | 10,696 | | | | 7,238 | |
| Net income (loss) per share* | | | 0.03 | | | | 0.09 | | | | 0.26 | | | | 0.18 | |
Note 19. Restricted Group Supplemental Disclosure (continued)
Combined Condensed Statements of Operations
| | | | | | | | | | | | | | | | |
| | | Year Ended December 31, 2009 | |
| | | Restricted
Group | | | Unrestricted
Subsidiaries | | | Eliminations | | | Consolidated
Group | |
Revenues | | | | | | | | | | | | | | | | |
Pulp | | € | 318,448 | | | € | 258,850 | | | € | — | | | € | 577,298 | |
Energy | | | 15,183 | | | | 27,318 | | | | — | | | | 42,501 | |
| | | | | | | | | | | | | | | | |
| | | 333,631 | | | | 286,168 | | | | — | | | | 619,799 | |
| | | | | | | | | | | | | | | | |
Operating costs | | | 312,029 | | | | 239,752 | | | | — | | | | 551,781 | |
Operating depreciation and amortization | | | 27,453 | | | | 26,466 | | | | — | | | | 53,919 | |
Selling, general and administrative expenses | | | 15,049 | | | | 11,849 | | | | — | | | | 26,898 | |
| | | | | | | | | | | | | | | | |
| | | 354,531 | | | | 278,067 | | | | — | | | | 632,598 | |
| | | | | | | | | | | | | | | | |
Operating income (loss) | | | (20,900 | ) | | | 8,101 | | | | — | | | | (12,799 | ) |
| | | | | | | | | | | | | | | | |
Other income (expense) | | | | | | | | | | | | | | | | |
Interest expense | | | (27,351 | ) | | | (41,932 | ) | | | 4,513 | | | | (64,770 | ) |
Investment income (loss) | | | 5,002 | | | | (2,293 | ) | | | (4,513 | ) | | | (1,804 | ) |
Foreign exchange gain on debt | | | 2,692 | | | | — | | | | — | | | | 2,692 | |
Gain on extinguishment of debt | | | 4,447 | | | | — | | | | — | | | | 4,447 | |
Loss on derivative instruments | | | — | | | | (5,760 | ) | | | — | | | | (5,760 | ) |
| | | | | | | | | | | | | | | | |
Total other income (expense) | | | (15,210 | ) | | | (49,985 | ) | | | — | | | | (65,195 | ) |
| | | | | | | | | | | | | | | | |
Loss before income taxes | | | (36,110 | ) | | | (41,884 | ) | | | — | | | | (77,994 | ) |
Income tax benefit | | | 183 | | | | 5,686 | | | | — | | | | 5,869 | |
| | | | | | | | | | | | | | | | |
Net loss | | | (35,927 | ) | | | (36,198 | ) | | | — | | | | (72,125 | ) |
Less: net loss attributable to noncontrolling interest | | | — | | | | 9,936 | | | | — | | | | 9,936 | |
| | | | | | | | | | | | | | | | |
Net loss attributable to common shareholders | | € | (35,927 | ) | | € | (26,262 | ) | | € | — | | | € | (62,189 | ) |
| | | | | | | | | | | | | | | | |
MERCER INTERNATIONAL INC.
NOTES TO THE CONSOLIDATED FINANCIAL STATEMENTS
(In thousands of Euros, except per share data)
Note 19. Restricted Group Supplemental Disclosure (continued)
Combined Condensed Statements of Cash Flows
| | | | | | | | | | | | |
| | | Year Ended December 31, 2011 | |
| | | Restricted
Group | | | Unrestricted
Group | | | Consolidated
Group | |
Cash flows from (used in) operating activities | | | | | | | | | | | | |
Net income attributable to common shareholders | | € | 39,809 | | | € | 10,266 | | | € | 50,075 | |
Adjustments to reconcile net income attributable to common shareholders to cash flows from operating activities | | | | | | | | | | | | |
Loss on derivative instruments | | | — | | | | 1,418 | | | | 1,418 | |
Foreign exchange gain on debt | | | (1,175 | ) | | | — | | | | (1,175 | ) |
Loss on extinguishment of debt | | | 71 | | | | — | | | | 71 | |
Depreciation and amortization | | | 30,086 | | | | 25,919 | | | | 56,005 | |
Accretion expense | | | 597 | | | | — | | | | 597 | |
Noncontrolling interest | | | — | | | | 3,931 | | | | 3,931 | |
Deferred income taxes | | | 2,989 | | | | (5,366 | ) | | | (2,377 | ) |
Stock compensation expense | | | 3,310 | | | | — | | | | 3,310 | |
Pension and other post-retirement expense, net of funding | | | (269 | ) | | | — | | | | (269 | ) |
Other | | | 816 | | | | 492 | | | | 1,308 | |
Changes in current assets and liabilities | | | | | | | | | | | | |
Receivables | | | 3,255 | | | | (4,859 | ) | | | (1,604 | ) |
Inventories | | | (10,175 | ) | | | (7,538 | ) | | | (17,713 | ) |
Accounts payable and accrued expenses | | | 5,868 | | | | 8,384 | | | | 14,252 | |
Other(1) | | | (8,503 | ) | | | 11,729 | | | | 3,226 | |
| | | | | | | | | | | | |
Net cash from operating activities | | | 66,679 | | | | 44,376 | | | | 111,055 | |
Cash flows from (used in) investing activities | | | | | | | | | | | | |
Purchase of property, plant and equipment | | | (29,513 | ) | | | (8,296 | ) | | | (37,809 | ) |
Proceeds on sale of property, plant and equipment | | | 327 | | | | 486 | | | | 813 | |
Note receivable | | | 2,865 | | | | — | | | | 2,865 | |
Purchase of marketable securities | | | (12,187 | ) | | | — | | | | (12,187 | ) |
| | | | | | | | | | | | |
Net cash used in investing activities | | | (38,508 | ) | | | (7,810 | ) | | | (46,318 | ) |
Cash flows from (used in) financing activities | | | | | | | | | | | | |
Repayment of notes payable and debt | | | (26,026 | ) | | | (23,167 | ) | | | (49,193 | ) |
Repayment of capital lease obligations | | | (1,310 | ) | | | (1,632 | ) | | | (2,942 | ) |
Proceeds from (repayment of) credit facilities, net | | | (14,652 | ) | | | — | | | | (14,652 | ) |
Proceeds from government grants | | | 14,091 | | | | 108 | | | | 14,199 | |
Purchase of treasury shares | | | (7,476 | ) | | | — | | | | (7,476 | ) |
| | | | | | | | | | | | |
Net cash used in financing activities | | | (35,373 | ) | | | (24,691 | ) | | | (60,064 | ) |
Effect of exchange rate changes on cash and cash equivalents | | | 1,377 | | | | — | | | | 1,377 | |
| | | | | | | | | | | | |
Net increase (decrease) in cash and cash equivalents | | | (5,825 | ) | | | 11,875 | | | | 6,050 | |
Cash and cash equivalents, beginning of year | | | 50,654 | | | | 48,368 | | | | 99,022 | |
| | | | | | | | | | | | |
Cash and cash equivalents, end of year | | € | 44,829 | | | € | 60,243 | | | € | 105,072 | |
| | | | | | | | | | | | |
| (1) | Includes intercompany working capital related transactions. |
MERCER INTERNATIONAL INC.
NOTES TO THE CONSOLIDATED FINANCIAL STATEMENTS
(In thousands of Euros, except per share data)
Note 19. Restricted Group Supplemental Disclosure (continued)
Combined Condensed Statements of Cash Flows
| | | | | | | | | | | | |
| | | Year Ended December 31, 2010 | |
| | | Restricted
Group | | | Unrestricted
Group | | | Consolidated
Group | |
Cash flows from (used in) operating activities | | | | | | | | | | | | |
Net income attributable to common shareholders | | € | 62,327 | | | € | 23,952 | | | € | 86,279 | |
Adjustments to reconcile net income attributable to common shareholders to cash flows from operating activities | | | | | | | | | | | | |
Gain on derivative instruments | | | — | | | | (1,899 | ) | | | (1,899 | ) |
Foreign exchange loss on debt | | | 6,126 | | | | — | | | | 6,126 | |
Loss on extinguishment of debt | | | 7,494 | | | | — | | | | 7,494 | |
Depreciation and amortization | | | 30,270 | | | | 25,961 | | | | 56,231 | |
Accretion expense | | | 2,492 | | | | — | | | | 2,492 | |
Noncontrolling interest | | | — | | | | 8,469 | | | | 8,469 | |
Deferred income taxes | | | (9,760 | ) | | | — | | | | (9,760 | ) |
Stock compensation expense | | | 2,394 | | | | — | | | | 2,394 | |
Pension and other post-retirement expense, net of funding | | | 418 | | | | — | | | | 418 | |
Other | | | 2,519 | | | | 2,671 | | | | 5,190 | |
Changes in current assets and liabilities | | | | | | | | | | | | |
Receivables | | | (25,913 | ) | | | (14,125 | ) | | | (40,038 | ) |
Inventories | | | (2,885 | ) | | | (21,577 | ) | | | (24,462 | ) |
Accounts payable and accrued expenses | | | (10,304 | ) | | | 7,215 | | | | (3,089 | ) |
Other(1) | | | (10,597 | ) | | | 6,031 | | | | (4,566 | ) |
| | | | | | | | | | | | |
Net cash from operating activities | | | 54,581 | | | | 36,698 | | | | 91,279 | |
Cash flows from (used in) investing activities | | | | | | | | | | | | |
Purchase of property, plant and equipment | | | (34,675 | ) | | | (3,625 | ) | | | (38,300 | ) |
Proceeds on sale of property, plant and equipment | | | 251 | | | | 887 | | | | 1,138 | |
Note receivable | | | 1,113 | | | | — | | | | 1,113 | |
| | | | | | | | | | | | |
Net cash used in investing activities | | | (33,311 | ) | | | (2,738 | ) | | | (36,049 | ) |
Cash flows from (used in) financing activities | | | | | | | | | | | | |
Repayment of notes payable and debt | | | (220,665 | ) | | | (13,917 | ) | | | (234,582 | ) |
Repayment of capital lease obligations | | | (589 | ) | | | (2,331 | ) | | | (2,920 | ) |
Proceeds from borrowings of notes payable and debt | | | 222,177 | | | | — | | | | 222,177 | |
Proceeds from (repayment of) credit facilities, net | | | (2,660 | ) | | | — | | | | (2,660 | ) |
Proceeds from government grants | | | 17,952 | | | | — | | | | 17,952 | |
Payment of note issuance costs | | | (6,095 | ) | | | — | | | | (6,095 | ) |
| | | | | | | | | | | | |
Net cash from (used in) financing activities | | | 10,120 | | | | (16,248 | ) | | | (6,128 | ) |
Effect of exchange rate changes on cash and cash equivalents | | | (1,371 | ) | | | — | | | | (1,371 | ) |
| | | | | | | | | | | | |
Net increase in cash and cash equivalents | | | 30,019 | | | | 17,712 | | | | 47,731 | |
Cash and cash equivalents, beginning of year | | | 20,635 | | | | 30,656 | | | | 51,291 | |
| | | | | | | | | | | | |
Cash and cash equivalents, end of year | | € | 50,654 | | | € | 48,368 | | | € | 99,022 | |
| | | | | | | | | | | | |
| (1) | Includes intercompany working capital related transactions. |
MERCER INTERNATIONAL INC.
NOTES TO THE CONSOLIDATED FINANCIAL STATEMENTS
(In thousands of Euros, except per share data)
Note 19. Restricted Group Supplemental Disclosure (continued)
Combined Condensed Statements of Cash Flows
| | | | | | | | | | | | |
| | | Year Ended December 31, 2009 | |
| | | Restricted
Group | | | Unrestricted
Group | | | Consolidated
Group | |
Cash flows from (used in) operating activities | | | | | | | | | | | | |
Net loss attributable to common shareholders | | € | (35,927 | ) | | € | (26,262 | ) | | € | (62,189 | ) |
Adjustments to reconcile net loss attributable to common shareholders to cash flows from operating activities | | | | | | | | | | | | |
Loss on derivative instruments | | | — | | | | 5,760 | | | | 5,760 | |
Foreign exchange gain on debt | | | (2,692 | ) | | | — | | | | (2,692 | ) |
Gain on extinguishment of debt | | | (4,447 | ) | | | — | | | | (4,447 | ) |
Depreciation and amortization | | | 27,704 | | | | 26,466 | | | | 54,170 | |
Accretion expense | | | 181 | | | | — | | | | 181 | |
Noncontrolling interest | | | — | | | | (9,936 | ) | | | (9,936 | ) |
Deferred income taxes | | | (176 | ) | | | (5,827 | ) | | | (6,003 | ) |
Stock compensation expense | | | 455 | | | | — | | | | 455 | |
Pension and other post-retirement expense, net of funding | | | 282 | | | | — | | | | 282 | |
Other | | | 934 | | | | 1,548 | | | | 2,482 | |
Changes in current assets and liabilities | | | | | | | | | | | | |
Receivables | | | 26,140 | | | | 5,767 | | | | 31,907 | |
Inventories | | | 13,234 | | | | 18,924 | | | | 32,158 | |
Accounts payable and accrued expenses | | | 5,839 | | | | (8,789 | ) | | | (2,950 | ) |
Other(1) | | | (18,265 | ) | | | 16,406 | | | | (1,859 | ) |
| | | | | | | | | | | | |
Net cash from operating activities | | | 13,262 | | | | 24,057 | | | | 37,319 | |
Cash flows from (used in) investing activities | | | | | | | | | | | | |
Purchase of property, plant and equipment | | | (26,839 | ) | | | (1,989 | ) | | | (28,828 | ) |
Proceeds on sale of property, plant and equipment | | | 158 | | | | 278 | | | | 436 | |
Cash, restricted | | | — | | | | 13,000 | | | | 13,000 | |
Note receivable | | | 152 | | | | — | | | | 152 | |
| | | | | | | | | | | | |
Net cash from (used in) investing activities | | | (26,529 | ) | | | 11,289 | | | | (15,240 | ) |
Cash flows from (used in) financing activities | | | | | | | | | | | | |
Repayment of notes payable and debt | | | (10,000 | ) | | | (16,499 | ) | | | (26,499 | ) |
Repayment of capital lease obligations | | | (680 | ) | | | (2,498 | ) | | | (3,178 | ) |
Proceeds from borrowings of notes payable and debt | | | 13,511 | | | | — | | | | 13,511 | |
Proceeds from (repayment of) credit facilities, net | | | (4,272 | ) | | | — | | | | (4,272 | ) |
Proceeds from government investment grants | | | 9,058 | | | | — | | | | 9,058 | |
Payment of note issuance costs | | | — | | | | (1,969 | ) | | | (1,969 | ) |
| | | | | | | | | | | | |
Net cash from (used in) financing activities | | | 7,617 | | | | (20,966 | ) | | | (13,349 | ) |
Effect of exchange rate changes on cash and cash equivalents | | | 109 | | | | — | | | | 109 | |
| | | | | | | | | | | | |
Net increase (decrease) in cash and cash equivalents | | | (5,541 | ) | | | 14,380 | | | | 8,839 | |
Cash and cash equivalents, beginning of year | | | 26,176 | | | | 16,276 | | | | 42,452 | |
| | | | | | | | | | | | |
Cash and cash equivalents, end of year | | € | 20,635 | | | € | 30,656 | | | € | 51,291 | |
| | | | | | | | | | | | |
| (1) | Includes intercompany working capital related transactions. |
SUPPLEMENTARY FINANCIAL INFORMATION (UNAUDITED)
Quarterly Financial Data
(Thousands of Euros, except per share amounts)
| | | | | | | | | | | | | | | | |
| | | Quarters Ended | |
| | | March 31 | | | June 30 | | | September 30 | | | December 31 | |
2011 | | | | | | | | | | | | | | | | |
Revenues | | € | 224,135 | | | € | 231,215 | | | € | 204,778 | | | € | 229,240 | |
Gross profit | | | 36,644 | | | | 36,211 | | | | 35,307 | | | | 2,957 | |
Net income (loss) attributable to common shareholders | | | 29,053 | | | | 14,383 | | | | 8,440 | | | | (1,801 | ) |
Net income (loss) per share attributable to common shareholders* | | | 0.52 | | | | 0.26 | | | | 0.15 | | | | (0.03 | ) |
2010 | | | | | | | | | | | | | | | | |
Revenues | | € | 180,252 | | | € | 240,224 | | | € | 234,418 | | | € | 245,642 | |
Gross profit | | | 18,024 | | | | 47,888 | | | | 51,411 | | | | 50,420 | |
Net income (loss) attributable to common shareholders | | | (7,546 | ) | | | 12,401 | | | | 46,135 | | | | 35,289 | |
Net income (loss) per share attributable to common shareholders* | | | (0.21 | ) | | | 0.23 | | | | 0.82 | | | | 0.63 | |
108
SIGNATURES
SIGNATURES
Pursuant to the requirements of Section 13 or 15(d) of theSecurities Exchange Act of 1934, the Registrant has duly caused this report to be signed on its behalf by the undersigned, thereunto duly authorized.
| | | | | | | | |
| | |
| | Mercer International Inc.MERCER INTERNATIONAL INC. |
| | | |
Dated: March 2, 2009February 21, 2012 | | | | By: | | /s/ JIMMY S.H. LEE |
| | | | | | | | Jimmy S.H. Lee Jimmy S.H. Lee
|
| | | | | | | | Chairman |
Pursuant to the requirements of theSecurities Exchange Act of 1934, this report has been signed below by the following persons on behalf of the Registrant and in the capacities and on the dates indicated.
| | |
| | |
/s/ Jimmy S.H. Lee
Jimmy S.H. Lee
Chairman, Chief Executive Officer and
Director
| | Date: March 2, 2009 |
| | |
/s/ David M. Gandossi
David M. Gandossi
Secretary, Executive Vice President,
Chief Financial Officer and
Principal Accounting Officer
| | Date: March 2, 2009 |
| | |
/s/ Kenneth A. Shields
Kenneth A. Shields
Director
| | Date: March 2, 2009 |
| | |
/s/ Eric Lauritzen
Eric Lauritzen
Director
| | Date: March 2, 2009 |
| | |
/s/ William D. McCartney
William D. McCartney
Director
| | Date: March 2, 2009 |
| | |
/s/ Graeme A. Witts
Graeme A. Witts
Director
| | Date: March 2, 2009 |
| | |
/s/ Guy W. Adams
Guy W. Adams
Director
| | Date: March 2, 2009 |
| | |
/s/ George Malpass
George Malpass
Director
| | Date: March 2, 2009 |
109
EXHIBIT INDEX
| | | | | |
Exhibit
| | |
No. | | Description of Exhibit |
| |
| | 1 | .1 | | Underwriting Agreement dated February 8, 2005 between Mercer International Inc. and RBC Capital Markets Corporation, on behalf of itself and CIBC World Markets Corp., Raymond James & Associates, Inc. and D.A. Davidson & Co. Incorporated by reference fromForm 8-K dated February 10, 2005 |
| | 1 | .2 | | Underwriting Agreement dated February 8, 2005 among Mercer International Inc. and RBC Capital Markets Corporation and Credit Suisse First Boston LLC, on behalf of themselves and CIBC World Markets Corp. Incorporated by reference fromForm 8-K dated February 10, 2005 |
| | 2 | .1 | | Agreement and Plan of Merger among Mercer International Inc., Mercer International Regco Inc. and Mercer Delaware Inc. dated December 14, 2005. Incorporated by reference to the Proxy Statement/Prospectus filed on December 15, 2005 |
| | 3 | .1 | | Articles of Incorporation of the Company, as amended. Incorporated by reference fromForm 8-A dated March 1, 2006 |
| | 3 | .2 | | Bylaws of the Company. Incorporated by reference fromForm 8-A dated March 1, 2006 |
| | 4 | .1 | | Indenture dated as of October 10, 2003 between Mercer International Inc. and Wells Fargo Bank Minnesota, N.A. Incorporated by reference fromForm 8-K dated October 15, 2003 |
| | 4 | .2 | | Indenture dated as of December 10, 2004 between Mercer International Inc. and Wells Fargo Bank, N.A. Incorporated by reference fromForm S-3 filed December 10, 2004 |
| | 4 | .3 | | First Supplemental Indenture dated February 14, 2005 to Indenture dated December 10, 2004 between Mercer International Inc. and Wells Fargo Bank, N.A. Incorporated by reference fromForm 8-K dated February 17, 2005 |
| | 10 | .1 | | Project Financing Facility Agreement dated August 26, 2002 between Zellstoff Stendal GmbH and Bayerische Hypo-und Vereinsbank AG, as amended by Amendment, Restatement and Undertaking Agreement dated February 3, 2009. |
| | 10 | .2 | | Shareholders’ Undertaking Agreement dated August 26, 2002 among Mercer International Inc., Stendal Pulp Holdings GmbH, RWE Industrie-Lösungen GmbH, AIG Altmark Industrie AG and FAHR Beteiligungen AG and Zellstoff Stendal GmbH and Bayerische Hypo-und Vereinsbank AG. Incorporated by reference fromForm 8-K dated September 10, 2002 |
| | 10 | .3* | | Shareholders’ Agreement dated August 26, 2002 among Zellstoff Stendal GmbH, Stendal Pulp Holdings GmbH, RWE Industrie-Lösungen GmbH and FAHR Beteiligungen AG |
| | 10 | .4* | | Contract for the Engineering, Design, Procurement, Construction, Erection andStart-Up of a Kraft Pulp Mill between Zellstoff Stendal GmbH and RWE Industrie-Lösungen GmbH dated August 26, 2002. Certain non-public information has been omitted from the appendices to Exhibit 10.16 pursuant to a request for confidential treatment filed with the SEC. Such non-public information was filed with the SEC on a confidential basis. The SEC approved the request for confidential treatment in January 2004 |
| | 10 | .5* | | Form of Trustee’s Indemnity Agreement between Mercer International Inc. and its Trustees |
| | 10 | .6 | | Employment Agreement dated for reference August 7, 2003 between Mercer International Inc. and David Gandossi. Incorporated by reference fromForm 8-K dated August 11, 2003 |
| | 10 | .7 | | Employment Agreement effective as of April 28, 2004 between Mercer International Inc. and Jimmy S.H. Lee. Incorporated by reference fromForm 8-K dated April 28, 2004 |
| | 10 | .8 | | 2004 Stock Incentive Plan. Incorporated by reference fromForm S-8 dated June 15, 2004 |
| | 10 | .9 | | Asset Purchase Agreement by and among Mercer International Inc., 0706906 B.C. Ltd. and KPMG Inc., as receiver of all of the assets and undertakings of Stone Venepal (Celgar) Pulp Inc. dated November 22, 2004. Incorporated by reference fromForm 8-K dated November 23, 2004 |
| | 10 | .10 | | Revolving Credit Facility Agreement dated February 9, 2005 among D&Z Holding GmbH, Zellstoff-und Papierfabrik Rosenthal GmbH & Co. KG, ZPR Beteiligungs GmbH and Bayerische Hypo-und Vereinsbank AG. Incorporated by reference fromForm 8-K dated February 17, 2005 |
110
| | | | | |
Exhibit
| | |
No. | | Description of Exhibit |
| |
| | 10 | .11 | | Shareholders’ Undertaking Agreement dated February 9, 2005 relating to Revolving Credit Facility Agreement. Incorporated by reference fromForm 8-K dated February 17, 2005 |
| | 10 | .12 | | Revolving Term Credit Facility dated for reference May 19, 2006 among Zellstoff Celgar Limited Partnership, as borrower, and the lenders from time to time parties thereto, as lenders and CIT Business Credit Canada Inc., as agent. Incorporated by reference fromForm 8-K dated May 30, 2006 |
| | 10 | .13 | | Employment Agreement dated October 2, 2006 between Stendal Pulp Holding GmbH and Wolfram Ridder. Incorporated by reference fromForm 8-K dated October 2, 2006 |
| | 10 | .14 | | Employment Agreement effective October 16, 2006 between Mercer International Inc. and David Ure dated September 22, 2006. Incorporated by reference fromForm 8-K dated October 13, 2006 |
| | 10 | .15 | | Employment Agreement effective September 25, 2006 between Mercer International Inc. and Claes-Inge Isacson dated December 5, 2008 |
| | 10 | .16 | | Employment Agreement effective September 1, 2005 between Mercer International Inc. and Leonhard Nossol dated August 18, 2005. Incorporated by reference fromForm 10-Q dated May 6, 2008 |
| | 10 | .17*** | | Electricity Purchase Agreement effective January 27, 2009 between Zellstoff Celgar Limited Partnership and British Columbia Hydro and Power Authority |
| | 14 | | | Code of Business Conduct and Ethics. Incorporated by reference from the definitive proxy statement on Schedule 14A dated August 11, 2003 |
| | 99 | .1 | | Exchange Agreement dated December 4, 2006 between Mercer International Inc. and Nisswa Master Fund Ltd. Incorporated by reference fromForm 8-K dated December 5, 2006 |
| | 99 | .2 | | Exchange Agreement dated December 4, 2006 between Mercer International Inc. and CC Arbitrage Ltd. Incorporated by reference fromForm 8-K dated December 5, 2006 |
| | 99 | .3 | | Audit Committee Charter. Incorporated by reference from the definitive proxy statement on Schedule 14A dated April 28, 2005 |
| | 99 | .4 | | Governance and Nominating Committee Charter. Incorporated by reference from the definitive proxy statement on Schedule 14A dated April 28, 2004 |
| | 21 | | | List of Subsidiaries of Registrant |
| | 23 | .1 | | Consent of Independent Registered Chartered Accountants — PricewaterhouseCoopers LLP |
| | 23 | .2 | | Consent of Independent Registered Chartered Accountants — Deloitte & Touche LLP |
| | 31 | .1 | | Section 302 Certificate of Chief Executive Officer |
| | 31 | .2 | | Section 302 Certificate of Chief Financial Officer |
| | 32 | .1** | | Section 906 Certificate of Chief Executive Officer |
| | 32 | .2** | | Section 906 Certificate of Chief Financial Officer |
| | |
*/s/ JIMMY S.H. LEE Jimmy S.H. Lee Chairman, Chief Executive Officer and Director | | Date: February 21, 2012 |
| |
/s/ DAVID M. GANDOSSI David M. Gandossi Secretary, Executive Vice President, Chief Financial Officer and Principal Accounting Officer | | Date: February 21, 2012 |
| |
/s/ ERIC LAURITZEN Eric Lauritzen Director | | Date: February 21, 2012 |
| |
/s/ WILLIAM D. MCCARTNEY William D. McCartney Director | | Date: February 21, 2012 |
| |
/s/ GRAEME A. WITTS Graeme A. Witts Director | | Date: February 21, 2012 |
| |
/s/ GUY W. ADAMS Guy W. Adams Director | | Date: February 21, 2012 |
| |
/s/ BERNARD PICCHI Bernard Picchi Director | | Date: February 21, 2012 |
| |
/s/ JAMES SHEPHERD James Shepherd Director | | Date: February 21, 2012 |
EXHIBIT INDEX
| | |
Exhibit No. | | Description of Exhibit |
| |
| 2.1 | | Agreement and Plan of Merger among Mercer International Inc., Mercer International Regco Inc. and Mercer Delaware Inc. dated December 14, 2005. Incorporated by reference to the Proxy Statement/Prospectus filed on December 15, 2005. |
| |
| 2.2 | | Support Agreement dated February 9, 2012 among Mercer International Inc. and Fibrek Inc. |
| |
| 3.1 | | Articles of Incorporation of the Company, as amended. Incorporated by reference from Form 8-A dated March 1, 2006. |
| |
| 3.2 | | Bylaws of the Company. Incorporated by reference from Form 8-A dated March 1, 2006. |
| |
| 4.1 | | Indenture dated as of November 17, 2010 between Mercer International Inc. and Wells Fargo Bank, National Association. Incorporated by reference from Form 8-K dated November 19, 2010. |
| |
| 10.1 | | Project Financing Facility Agreement dated August 26, 2002 between Zellstoff Stendal GmbH and Bayerische Hypo-und Vereinsbank AG, as amended by Amendment, Restatement and Undertaking Agreement dated January 31, 2009 and the Amendment Agreement dated January 20, 2011. |
| |
| 10.2 | | Project Blue Mill Financing Facility Agreement dated January 20, 2012 between Zellstoff Stendal GmbH and Unicredit Bank AG and IKB Deutsche Industriebank AG. |
| |
| 10.3 | | Shareholders’ Undertaking Agreement dated August 26, 2002 among Mercer International Inc., Stendal Pulp Holdings GmbH, RWE Industrie-Lösungen GmbH, AIG Altmark Industrie AG and FAHR Beteiligungen AG and Zellstoff Stendal GmbH and Bayerische Hypo-und Vereinsbank AG. As amended by the Amendment Restatement and Undertaking Agreement. |
| |
| 10.4 | | Shareholders’ Agreement dated August 26, 2002 among Zellstoff Stendal GmbH, Stendal Pulp Holdings GmbH, RWE Industrie-Lösungen GmbH and FAHR Beteiligungen AG. As amended by the Amendment Agreement dated January 20, 2012. |
| |
| 10.5* | | Contract for the Engineering, Design, Procurement, Construction, Erection and Start-Up of a Kraft Pulp Mill between Zellstoff Stendal GmbH and RWE Industrie-Lösungen GmbH dated August 26, 2002. Certain non-public information has been omitted from the appendices to Exhibit 10.4 pursuant to a request for confidential treatment filed with the SEC. Such non-public information was filed with the SEC on a confidential basis. The SEC approved the request for confidential treatment in January 2004. |
| |
| 10.6* | | Form of Trustee’s Indemnity Agreement between Mercer International Inc. and its Trustees. |
| |
| 10.7 | | Employment Agreement dated for reference August 7, 2003 between Mercer International Inc. and David Gandossi. Incorporated by reference from Form 8-K dated August 11, 2003. |
| |
| 10.8 | | Employment Agreement effective as of April 28, 2004 between Mercer International Inc. and Jimmy S.H. Lee. Incorporated by reference from Form 8-K dated April 28, 2004. |
| |
| 10.9 | | 2004 Stock Incentive Plan. Incorporated by reference from Form S-8 dated June 15, 2004. |
| |
| 10.10 | | 2010 Stock Incentive Plan. Incorporated by reference from Form S-8 dated June 11, 2010. |
| |
| 10.11 | | Employment Agreement dated October 2, 2006 between Stendal Pulp Holding GmbH and Wolfram Ridder. Incorporated by reference from Form 8-K dated October 2, 2006. |
| |
| 10.12* | | Employment Agreement effective September 25, 2006 between Mercer International Inc. and Claes-Inge Isacson dated December 5, 2008. |
| |
| 10.13 | | Employment Agreement effective September 1, 2005 between Mercer International Inc. and Leonhard Nossol dated August 18, 2005. Incorporated by reference from Form 10-Q dated May 6, 2008. |
| |
| 10.14* | | Electricity Purchase Agreement effective January 27, 2009 between Zellstoff Celgar Limited Partnership and British Columbia Hydro and Power Authority. Certain non-public information has been omitted from the appendices to Exhibit 10.13 pursuant to a request for confidential treatment filed with the SEC. Such non-public information was filed with the SEC on a confidential basis. The SEC approved the request for confidential treatment in March 2009. |
| | |
| |
| 10.15 | | Revolving Credit Facility Agreement dated August 19, 2009 among D&Z Holding GmbH, Zellstoff-und Papierfabrik Rosenthal GmbH, D&Z Beteiligungs GmbH and ZPR Logistik GmbH and Bayerische Hypo-und Vereinsbank AG. Incorporated by reference from Form 8-K dated August 24, 2009. |
| |
| 10.16 | | Loan Agreement dated August 19, 2009 among Zellstoff-und Papierfabrik Rosenthal GmbH, as borrower, and Bayerische Hypo-und Vereinsbank Aktiengesellschaft, as lender. Incorporated by reference from Form 8-K dated August 24, 2009. |
| |
| 10.17 | | Amended and Restated Credit Agreement dated as of November 27, 2009 among Zellstoff Celgar Limited Partnership, as borrower, and the lenders from time to time parties thereto, as lenders, and CIT Business Credit Canada Inc., as agent. Incorporated by reference from Form 8-K dated November 30, 2009. |
| |
| 10.18 | | Special Warrant Agreement dated as of February 9, 2012 among Mercer International Inc. and Fibrek Inc. |
| |
| 14 | | Code of Business Conduct and Ethics. Incorporated by reference from the definitive proxy statement on Schedule 14A dated August 11, 2003. |
| |
| 99.1 | | Audit Committee Charter. Incorporated by reference from the definitive proxy statement on Schedule 14A dated April 28, 2005. |
| |
| 99.2 | | Governance and Nominating Committee Charter. Incorporated by reference from the definitive proxy statement on Schedule 14A dated April 28, 2004. |
| |
| 99.3 | | Exchange Agreement dated November 25, 2009 between Mercer International Inc. and IAT Reinsurance Co. Ltd. Incorporated by reference from Form 8-K filed November 27, 2009. |
| |
| 99.4 | | Exchange Agreement dated November 25, 2009 between Mercer International Inc. and Alden Global Distressed Opportunities Fund L.P. Incorporated by reference from Form 8-K filed November 27, 2009. |
| |
| 99.5 | | Exchange Agreement dated November 25, 2009 between Mercer International Inc. and Greenlight Capital Qualified LP, Greenlight Capital LP and Greenlight Capital Offshore Partners. Incorporated by reference from Form 8-K filed November 27, 2009. |
| |
| 21 | | List of Subsidiaries of Registrant. |
| |
| 23.1 | | Consent of Independent Registered Chartered Accountants – PricewaterhouseCoopers LLP. |
| |
| 31.1 | | Section 302 Certificate of Chief Executive Officer. |
| |
| 31.2 | | Section 302 Certificate of Chief Financial Officer. |
| |
| 32.1** | | Section 906 Certificate of Chief Executive Officer. |
| |
| 32.2** | | Section 906 Certificate of Chief Financial Officer. |
| * | Filed inForm 10-K for prior years. |
|
| ** | | In accordance with Release33-8212 of the Commission,SEC, these Certifications: (i) are “furnished” to the CommissionSEC and are not “filed” for the purposes of liability under the Securities Exchange Act of 1934, as amended;Act; and (ii) are not to be subject to automatic incorporation by reference into any of the Company’s registration statements filed under the Securities Act of 1933, as amended for the purposes of liability thereunder or any offering memorandum, unless the Company specifically incorporates them by reference therein. |
|
*** | | Pursuant to 17 CFR 240.24b-2, Confidential Information has been omitted and filed separately with the Commission pursuant to a confidential treatment application filed with the Commission. |
111