UNITED STATES
SECURITIES AND EXCHANGE COMMISSION
WASHINGTON,Washington, D.C. 20549
FORM 10-K
(Mark One) | | | | | |
| ☒ | |
x | ANNUAL REPORT PURSUANT TO SECTION 13 OR 15(d) OF THE SECURITIES EXCHANGE ACT OF 1934 |
For the fiscal year ended December 31, 20172023
or
| | | | | |
| ☐ | |
o | TRANSITION REPORT PURSUANT TO SECTION 13 OR 15(d) OF THE SECURITIES EXCHANGE ACT OF 1934 |
For the transition period from to
Commission File Number: 0-26640
POOL CORPORATION
(Exact name of registrant as specified in its charter)
| | | | | | | | | | | |
| POOL CORPORATION |
| (Exact name of registrant as specified in its charter) |
| | | |
| Delaware | | 36-3943363 |
(State or other jurisdiction of | | (I.R.S. Employer |
| incorporation or organization) | | (I.R.S. Employer
Identification No.) |
| | | |
109 Northpark Boulevard, Covington, Louisiana | | |
| Covington, | Louisiana | | 70433-5001 |
| (Address of principal executive offices) | | (Zip Code) |
985-892-5521(985) 892-5521
(Registrant’s telephone number, including area code)
Securities registered pursuant to Section 12(b) of the Act:
| | | | | | | | |
| |
| Title of each class | Trading Symbol(s) | Name of each exchange on which registered |
| Common Stock, par value $0.001 per share | NASDAQPOOL | Nasdaq Global Select Market |
Securities registered pursuant to Section 12(g) of the Act: None
Indicate by check mark if the registrant is a well-known seasoned issuer, as defined in Rule 405 of the Securities Act. YES x NO ¨
Yes x No ¨
Indicate by check mark if the registrant is not required to file reports pursuant to Section 13 or 15(d) of the Act. YES ¨ NO x
Yes ¨ No x
Indicate by check mark whether the registrant (1) has filed all reports required to be filed by Section 13 or 15(d) of the Securities Exchange Act of 1934 during the preceding 12 months (or for such shorter period that the registrant was required to file such reports), and (2) has been subject to such filing requirements for the past 90 days. YES x NO ¨
Yes x No ¨
Indicate by check mark whether the registrant has submitted electronically and posted on its corporate Web site, if any, every Interactive Data File required to be submitted and posted pursuant to Rule 405 of RegulationsRegulation S-T (§232.405 of this chapter) during the preceding 12 months (or for such shorter period that the registrant was required to submit and post such files). YES x NO ¨
Indicate by check mark if disclosure of delinquent filers pursuant to Item 405 of Regulation S-K (§229.405 of this chapter) is not contained herein, and will not be contained, to the best of the registrant’s knowledge, in definitive proxy or information statements incorporated by reference in Part III of this Form 10-K or any amendment to this Form 10-K. Yes x No ¨
Indicate by check mark whether the registrant is a large accelerated filer, an accelerated filer, a non-accelerated filer, a smaller reporting company, or an emerging growth company. See the definitions of “large accelerated filer,” “accelerated filer,” “smaller reporting company,” and “emerging growth company” in Rule 12b-2 of the Exchange Act.
| | | | | | | | | | | | | | |
| |
Large accelerated filerx | x | | Accelerated filer¨ | ☐ |
| | | | |
Non-accelerated filer¨ (Do not check if a smaller reporting company) | o | | Smaller reporting company¨ | ☐ |
| | | | |
| | |
Emerging growth company¨ | ☐ |
If an emerging growth company, indicate by check mark if the registrant has elected not to use the extended transition period for complying with any new or revised financial accounting standards provided pursuant to Section 13(a) of the Exchange Act. ¨
Indicate by check mark whether the registrant has filed a report on and attestation to its management’s assessment of the effectiveness of its internal control over financial reporting under Section 404(b) of the Sarbanes-Oxley Act (15 U.S.C. 7262(b)) by the registered public accounting firm that prepared or issued its audit report. ☒
If securities are registered pursuant to Section 12(b) of the Act, indicate by check mark whether the financial statements of the registrant included in the filing reflect the correction of an error to previously issued financial statements. ☐
Indicate by check mark whether any of those error corrections are restatements that required a recovery analysis of incentive-based compensation received by any of the registrant’s executive officers during the relevant recovery period pursuant to §240.10D-1(b). ☐
Indicate by check mark whether the registrant is a shell company (as defined in Rule 12b-2 of the Act). YES ¨ NO Yes ☐ No x
The aggregate market value of voting and non-voting common equity held by non-affiliates of the registrant based on the closing sales price of the registrant’s common stock as of June 30, 20172023 was $4,704,253,988.$14,212,954,827.
As of February 21, 2018,20, 2024, there were 40,396,15538,376,151 shares of common stock outstanding.
Documents Incorporated by Reference
Portions of the registrant’s Proxy Statement to be mailed to stockholders on or about March 29, 2018 for the
2024 Annual Meeting to be held on May 2, 2018,of Stockholders are incorporated by reference ininto Part III of this Form 10-K.
POOL CORPORATION
TABLE OF CONTENTS
| | | | | | | | |
| POOL CORPORATION | |
| | |
| TABLE OF CONTENTS | |
| | |
| | Page |
| PART I. | | |
| | Page |
PART I. | |
| | |
| Item 1. | | |
| Item 1A. | | |
| Item 1B. | | |
Item 2.1C. | | |
| Item 2. | | |
| Item 3. | | |
| Item 4. | | |
| |
| PART II. | |
| | |
| Item 5. | | |
| Item 6. | | |
| Item 7. | | |
| Item 7A. | | |
| Item 8. | | |
| Item 9. | | |
| Item 9A. | | |
| Item 9B. | | |
| Item 9C. | | |
PART III. | |
| PART III. | | |
| | |
| Item 10. | | |
| Item 11. | | |
| Item 12. | | |
| Item 13. | | |
| Item 14. | | |
| |
| PART IV. | |
| | |
| Item 15. | | |
| Item 16. | | |
| | |
| |
| | |
PART I.
Item 1. Business
General
Pool Corporation (the Company, which may also be referred to as we, us or our), a member of the S&P 500 Index, is the world’s largest wholesale distributor of swimming pool supplies, equipment and related leisure products and is one of the top threeleading distributors of irrigation and relatedlandscape maintenance products in the United States. The Company was incorporated in the State of Delaware in 1993 and has grown from a regional distributor to a multi-national, multi-network distribution company.
Our industry is highly fragmented, and as such, we believe we add considerable value to the industry by purchasing products from a large number of manufacturers and then efficiently distributing the products to our customer base on conditions that are more favorable than our customers could obtain on their own.
As of December 31, 2017,2023, we operated 351439 sales centers in North America, Europe South America and Australia through our fourfive distribution networks:
•SCP Distributors (SCP);
•Superior Pool Products (Superior);
•Horizon Distributors (Horizon); and
•National Pool Tile (NPT).; and
•Sun Wholesale Supply (Sun Wholesale).
Our Industry
We believe that the swimming pool industry is relatively young,will continue to grow with room for continued growth from the increased penetration of new pools. Significantpools into households with the discretionary income and physical capacity to install a swimming pool. We believe significant growth opportunities also reside with pool remodel and pool equipment replacement activities due to the aging of the installed base of swimming pools, technological advancements and the development of environmentally sustainable, energy-efficient and more aesthetically attractive products. Additionally, theThe desire for consumers to enhance their outdoor living spaces with hardscapes, lighting and other outdoor kitchens also promotesliving-related products provides us with additional future growth opportunities in this market area.
The irrigation industry shares many characteristics withOver the pool industry, and we believe that it will realize long‑term growth rates similar to the pool industry. As irrigation system installations and landscaping often occur in tandem with new single-family home construction, we believe the continued trend in increased housing starts also offers significant growth opportunities for the irrigation industry.
Favorablepast several years, favorable demographic and socioeconomic trends have positively impacted our industry, and we believe these trends will continue to do so inover the long term. These favorable trends include the following:
•long-term growth in housing units in warmer climate markets due to the population migration toward the southern United States, which contributes towhere use of the growing installed base of pools that homeowners must maintain;outdoor home environment is more prevalent and extends longer throughout the year;
•increased homeowner spending on outdoor living spaces for relaxation and entertainment;
•consumers bundling the purchase of a swimming pool and other products, with new irrigation systems, landscaping and improvements to outdoor living spaces often being key components to both pool installations and remodels; and
•consumers using more automation and control products, higher quality materials and other pool features that add to our sales opportunities over time.time;
•consumers increasing focus on environmentally sustainable, energy-efficient products; and
Almost•remote and hybrid work trends as homeowners seek to create attractive areas in their backyards as an extension of their home space.
We estimate about 60% of consumer spending in the pool industry is for maintenance and minor repair of existing swimming pools. Maintaining proper chemical balancea safe and consistent water chemistry and the related upkeep and repair of swimming pool equipment, such as pumps, heaters, filters and safety equipment, creates a non-discretionary demand for pool chemicals, equipment and other related parts and supplies. We also believe cosmetic considerations such as a pool’s appearance and the overall look of backyard environments create an ongoing demand for other maintenance-related goods and certain discretionary products.products that we supply.
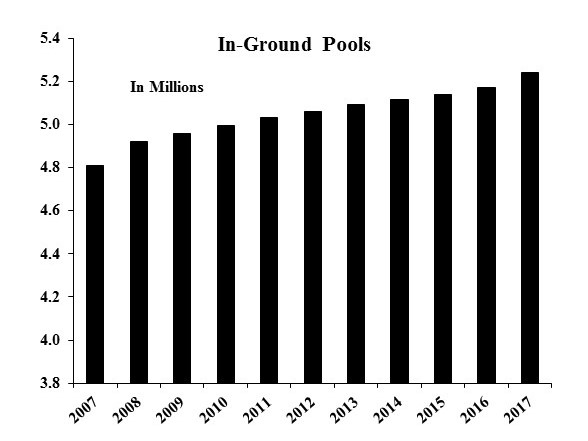
We believe thatConsistent growth of the installed base of in-ground swimming pools and the recurring nature of the maintenance and repair market has historically helped maintain a relatively consistent rate of industry growth. This characteristic along with relatively consistent annual inflationary price increases of 1% to 2% on average passed on by manufacturers and distributors, has helped cushion the negative impact on revenues in periods when unfavorable economic conditions and softness in the housing market adversely impacted consumer discretionary spending, including pool construction and major replacement and refurbishmentrenovation activities.
The following table reflects growth in the domestic installed base of in-ground swimming pools over the past 11 years (based on Company estimates and information from 20162022 P.K. Data, Inc. reports):

The replacementswimming pool remodel, renovation and refurbishmentupgrade market currently accounts for closean estimated 21% to 25%23% of consumer spending in the pool industry. The activity in this market, which includes major swimming pool remodeling and upgrading, is driven by the aging of the installed base of pools. Thepools and availability of enhanced feature products such as swimming pool automated controls, variable speed pumps, robotic cleaners and LED pool and hot tub lighting. Many new homeowners with existing pools transform older pools into a modern backyard oasis through upgraded features, finishes and equipment. Among other factors such as the southern population migration and housing shortage trends, the timing of these types of expenditures is more sensitive to economic factors including home values, single-family home sales and consumer confidence that impact consumer spending compared to the maintenance and minor repair market.
NewWe estimate that new swimming pool construction comprises just over 15%approximately 17% to 18% of consumer spending in the pool industry. The demand for new pools is driven by the perceived benefits of pool ownership including enhanced property value, relaxation, entertainment, family activity, exercise and convenience. The industry competes for new pool sales against other discretionary consumer purchases such as kitchen and bathroom remodeling, boats, motorcycles, recreational vehicles and vacations. The industry is also affected by other factors including, but not limited to, consumer preferences or attitudes toward pool and related outdoor living and irrigation products for aesthetic, environmental, safety or other reasons.
The irrigation and landscape maintenance industry shares many characteristics with the pool industry, and we believe that it exhibits similar long-term growth rates. Irrigation system installations often occur in tandem with new single-family home construction making them more susceptible to economic variables that drive new home sales. However, the landscape industry offers similar maintenance-related growth opportunities as the swimming pool industry. Product offerings such as chemicals and fertilizers, power equipment and related repair and maintenance services offer recurring revenue streams in an industry otherwise closely tied to the new housing market. The irrigation and landscape maintenance products distribution business is split betweenserves both residential and commercial markets, with the majority of sales related to the residential market. Irrigation activitiesWithin the United States market, we believe that residential and commercial irrigation products account for approximately 50%30% to 35% of total spending in the irrigation industry, with the remaining 50%65% to 70% of spending related to landscape maintenance products, power equipment, landscapehardscapes and specialty outdoor products and accessories. As such, our irrigation business is more heavily weighted toward new home construction activities compared to our pool business. Over the last five years, our irrigation business has benefited from the continued slow recovery of single-family home construction as irrigation system installations and landscape projects typically correlate with, but lag, new home construction.
Economic Environment
Certain trends in the housing market, the availability of consumer credit and general economic conditions (as commonly measured by Gross Domestic Product or GDP) affect our industry, particularly new pool and irrigation system starts as well as the timing and extent of pool refurbishmentsremodels, equipment replacements, landscaping projects and equipment replacement. outdoor living space renovations. Consumers typically spend more on new pools, new irrigation systems, renovations and replacement when general economic conditions are strong.
We believe that over the long term, single-family housing turnover and home value appreciation mayand single-family housing turnover correlate with demand for new pool construction, with higher rates of home turnoverappreciation and appreciationturnover having a positive impact on new pool startsinstallations over time. While most new swimming pools are installed in existing homes, there has also been a correlation of new pool construction activity to new home construction activities over time. We also believe that homeowners’ access todiscretionary spending capacity, availability of consumer credit is aand favorable borrowing rates are critical factorfactors enabling the purchase of new swimming pools and irrigation systems. Similar to other discretionary purchases, replacement and refurbishmentrenovation activities are more heavily impacted by economic factors such as consumer confidence, GDP and employment.employment levels. Contractor labor availability has also become an issue in recent years, limiting our customers’ ability to fully meet consumer construction and renovation demand. While existing home turnover slowed in 2023 driven by higher interest rates and homeowners taking advantage of their existing lower rate mortgages, new home construction grew versus a decline in new pool construction, creating more available backyards for swimming pools when economic conditions stabilize.
WhileOver the past decade, consumers’ investments in their homes, including backyard renovations, have flourished. In recent years, steady increases in home values, lack of affordable new homes and increased mortgage rates have prompted homeowners to stay in their homes longer and upgrade their home environments, including their backyards. Many families have spent more time at home and sought opportunities to create or expand home-based outdoor living and entertainment spaces. These outdoor investment trends, which were particularly heightened during 2020 through 2022, resulted in an increase in new pool construction and greater expenditures for maintenance and remodeling products. In 2023, we estimate that new in-ground pool construction has increasedunits decreased 23% to approximately 75,000 newunits from 98,000 units in 2017 from2022 as new construction activities declined following significant growth in 2021 and 2020. Our estimate of the historically low levels experienced duringnew in-ground pool units added in 2023 is consistent with the economic downturn, construction levels are still down approximately 65% compared to peak historical levels and down approximately 50% to 55% from what we consider normal levels.
We believe there is potential for continued market recovery over the next several years. The economic downturn, which spanned from late 2006 to early 2010 and reached its low point78,000 pools added in 2009 (also referred to as the Great Recession), created a build up of deferred replacement and remodeling activity, which we have largely fulfilled over the past seven years.2019. We expect that new pool and irrigation construction levelsconsumers will continue to grow incrementally, but we believe that consumer investmentsinvest in outdoor living spaces beyond the swimming pool will generate greater growth over the next four to seven years. Additionally, we believe favorable demographics fromas they consider backyards an aging population and southern migration are ideal for increased residential outdoor living investment.extension of their home space. We expect that market conditions in the United States will continue to improve, enabling further replacement, remodeling and new construction activity and that the industry will realize an annual growth rate of approximately 4% to 7% over this time period. As economic trends indicate that consumer spending has largely recovered and that residential construction activities will likely continue to improve, we believe that we are well positioned to take advantage of both the market expansion andbenefit from the inherent long-term growth opportunities in our industry.industry fueled by favorable population migration trends, strong housing demand dynamics and product developments and technological advancements as consumers focus on more environmentally sustainable and energy-efficient products.
Over the last five years, we estimate the poolHistorically, annual price inflation averaged 1% to 2% in our industry. We generally pass industry grewprice increases through our supply chain and may make strategic volume inventory purchases ahead of vendor price increases in order to obtain favorable pricing. During 2021 and 2022, supply chain interruptions, production shutdowns and weather-related events resulted in increased inflation as higher costs to produce and transport finished products were passed through to consumers. Our results in 2022 benefited from extraordinary inflationary product cost increases of approximately 10% following a benefit of 7% to 8% in 2021. In 2023, inflationary product cost increases moderated and benefited our sales by approximately 3% to 4%. We believe that results in 2024 will be impacted by inflationary product cost increases of approximately 2% to 4% per year, with favorable weather accelerating growth in any given year and unfavorable weather impeding growth. Our industry is seasonal and weather is one of the principal external factors that affects our business. Peak industry activity occurs during the warmest months of the year, typically April through September. Unseasonable warming or cooling trends can accelerate or delay the start or end of the pool and landscape season, impacting our maintenance and repair sales. These impacts at the shoulders of the season are generally more pronounced in northern markets in the United States and Canada. Weather also impacts our sales of construction and installation products to the extent that above average precipitation, late spring thaws in northern markets and other extreme weather conditions delay, interrupt or cancel current or planned construction and installation activities.3%.
In 2017 specifically, our industry experienced modestly favorable weather overall, despite the severe storms that impacted our industry in Texas and Florida in September and October. Due to the repairs required following major storms, sales mostly recovered by the end of the year. In 2016, an earlier start to the pool season due to warmer than usual temperatures and overall favorable weather throughout the rest of the year benefited the industry as a whole. In 2015, excessive precipitation impacted our industry in the second quarter; however a mild fall and delayed winter alleviated any contraction in industry growth rates.
Business Strategy and Growth Strategy
Our mission is to provide exceptional value to our customers and suppliers, creating exceptional return to our shareholders, while providing exceptional opportunities to our employees. Our three core strategies are as follows:
•to promote the growth of our industry;
•to promote the growth of our customers’ businesses; and
•to continuously strive to operate more effectively.
We promote the growth of our industry through various advertising and promotional programs intended to raise consumer awareness of the benefits and affordability of pool ownership, the ease of pool maintenance and the many ways in which a pool and the surrounding spaces may be enjoyed beyond swimming. These programs include digital and media advertising, industry-oriented website development such as www.swimmingpool.com®www.swimmingpool.com®, public relations campaignswww.hottubs.com® and www.nptpool.com®, social media platforms and other onlinedigital marketing initiatives, including social media.our NPT® Backyard mobile app. We use these programs as tools to educate consumers and lead prospective pool owners to our customers. We also promote the growth of our industry by offering a growing selection of energy-efficient and environmentally preferred products, which support sustainability and can help pool owners save energy, water, time and money. Our environmentally friendly technology products include variable speed pumps, LED pool and hot tub lights and high-efficiency heat pumps. Our Horizon sales centers offer organic fertilizers, organic pesticides, and irrigation and drainage products that reduce water usage and soil erosion, allowing our customers and homeowners to have less of an impact on freshwater reserves.
We promote the growth of our customers’ businesses by offering the broadest product assortment through the largest number of conveniently located market-based sales centers and through comprehensive support programs that include promotional tools and marketing support to help our customers generate increased sales. OurWe provide in depth product training that allows our customers to expand the scope of their product offerings. We also provide uniquely tailored advertising programs that include such features as digital marketing, customer lead generation, personalized websites, brochures, direct mail, marketing campaigns and business development training. As a customer service, we also provide certain retail store customers assistance with all aspects of their business, including site selection, store layout and design, product merchandising, business management system implementation, comprehensive product offering selections and efficient ordering and inventory management processes. In addition to these programs, we feature consumer showrooms in over 80100 of our sales centers and host our annual Retail Summit to educate our customers about product offerings and the overall industry. We also actfunction as a day-to-day resource by offering product and market expertise to serve our customers’ unique needs.
In addition to our efforts aimed at promoting industry and customer growth, we strive to operate more effectively by continuously focusing on improvements in our operations, suchwhich we define as capacity creation. We create capacity with business to business development tools and execution aimed at ensuring best-in-class service and value creation for our customers and suppliers. In particular, our Pool360 and Horizon 24/7 internet and mobile platforms help our customers be more productive by allowing them to digitally receive pricing and product sourcing, procurementavailability information, and logistics initiatives, adoption of enhancedenter orders, while leveraging our customer service staff resources, particularly during peak business practicesperiods. These tools offer real-time integration into our enterprise resource planning system, creating efficiencies in our business processes and improved working capital management. Other key internal growth initiatives include the continued expansion of bothalso provide our product offerings (as describedcustomers graphical catalog presentation in the “Customers and Products” section below) andsame platform. Our BlueStreak mobile ordering platform enables our distribution networks.
Withsales associates to process orders faster, often eliminating the need for customers to get out of their vehicles. We are focused on efficiency at our 2008 acquisition of National Pool Tile Group, Inc., we added a market leading brand of pool tile and composite pool finish products, and gained a position in a wider market. To increase operating efficiency and improve market reach, we have consolidated and repositioned NPT standalone sales centers and established NPT showrooms within certain existingwarehouses through order processing speed at the counter, intentional showroom layouts, sales centers. In additioncenter merchandising, bin replenishment and velocity slotting. Velocity slotting uses technology to identify fast moving, high velocity items, which are then color-coded and placed in an easily accessible location to create efficiencies for both our employees and customers.
We believe that ongoing investments in digital transformation and technology help us provide best-in-class service to our 16 standalone NPT sales centers, we currently have over 80 SCPcustomers by improving the customer experience, enhancing our existing customer relationships and Superior sales centersexpanding our customer base. To that feature consumer showrooms where landscapeend, a part of our growth strategy includes investing in technology that allows us to better serve our customers and swimming pool contractors, as well as homeowners, can view and select pool components including pool tile, decking materials and interior pool finishes in various styles and grades, and serve as stocking locationsusing this information to make better data-driven decisions for our NPT branded products.
business. We feelrecently launched Pool360 WaterTest and are in the growth opportunities for the NPT network closely alignprocess of rolling out Pool360 PoolService under our Pool360 platform of technologies. Pool360 WaterTest is a professional water testing software available to our retail customers that works with thoseour complete line of proprietary brand pool and hot tub chemicals. Our Pool360 PoolService app is a mobile tool that allows pool professionals to better manage their service business and improve their customers’ experience. We believe these tools allow us to support and grow our other networks, asretail and service customer base. Going forward, we see continued opportunityplan to expand under the NPT brand. We also expect potential expansion of the network by broadening our product range and sourcing capabilities. As more consumers create and enhance outdoor living areas and continue to invest in their outdoor environment, we believe we can focusgrow our suite of Pool360 technologies with additional resources to address such demand, while leveragingfor our existing pool and irrigation customer base. We feel the development of our NPT network is a natural extension of our distribution model. While we are currently enjoying an expanding economy and improving housing market, which help fuel demand for these products, this business is more sensitive to these external market factors compared to our business overall.customers.
We have grown our distribution networks through new sales center openings, acquisitions and the expansion of existing sales centers. Given the external environment, we have increasedcenters depending on our focus onmarket presence and capacity. For additional information regarding our new sales center openings, complemented by strategic acquisitions and closures/consolidations, depending on our market presence. Since the beginningsee Item 7, “Management’s Discussion and Analysis of 2015, we have opened 11 new sales centers, including 1 new sales centerFinancial Condition and Results of Operations,” and Item 8, Note 2 of “Notes to Consolidated Financial Statements,” included in 2017. We expect to open between 4 and 6 new sales centers in 2018. Since the beginning of 2015, we have completed 9 acquisitions consisting of 24 sales centers (net of sales center consolidations within one year of acquisition). this Form 10-K.
We plan to continue to make strategic acquisitions and open new sales centers to further penetrate existing markets and expand into both new geographic markets and new product categories. For additional discussion of our recent acquisitions, see Note 2 of “Notes to Consolidated Financial Statements,” included in Item 8 of this Form 10-K.
We believe that our high customer service levels and expanded product offerings have enabled us to gain market share historically. Going forward, we expect to continue to realize sales growth higher than the industry average due to further increases inthrough market share gains and continued expansion of our product offerings.offerings with a focus on our proprietary and exclusive brand products.
We estimate that price inflation has averaged 1% to 2% annually in our industry over the past 10 years. We generally pass industry price increases through the supply chain and make strategic volume inventory purchases ahead of vendor price increases. We estimate that annual price inflation between 2015 and 2017 was consistent with the ten-year average. We anticipate price inflation will vary some by product lines, but will approximate the ten-year average overall in 2018.
Customers and Products
We serve roughly 120,000125,000 customers. In 2017, sales to our largest 100 customers collectivelyNo single customer accounted for just under 10% or more of our total sales. We estimate that sales to our largest 1,000 customers represented approximately 25% of our total sales in 2017. Notably, 98%2023. Most of our customers are small, family-owned businesses with relatively limited capital resources and generated a large majority of our sales in 2017.resources. Most of these businesses provide labor and technical services to the end consumer and operate as independent contractors and specialty retailers employing no more than ten employees (in many cases, working alone or with a limited crew). These customers also buy products from other distributors, mass merchants, home stores and certain specialty and internet retailers.
We provide extended payment terms to qualified customers for sales under pre-season early buy programs, which typically occur during the fourth and first quarters. The extended terms usually require payments in equal installments during the second quarter of each year. See Item 7. “Management’s Discussion and Analysis of Financial Condition and Results of Operations - Critical Accounting Estimates - Allowance for Doubtful Accounts” for additional information.
We sell our products primarily to the following types of customers:
•swimming pool remodelers and builders;
•specialty retailers that sell swimming pool supplies;supplies, including independently owned and operated Pinch A Penny franchise stores;
•swimming pool repair and service businesses;
•irrigation construction and landscape maintenance contractors; and
other •commercial customers.pool operators and pool contractors who build, remodel or service large commercial installations such as hotels, universities and community recreational facilities.
We conduct our operations through 351439 sales centers in North America, Europe Australia and South America.Australia. Our primary markets, with the highest concentration of swimming pools, are California, Texas, Florida and Arizona, collectively representing approximately 52%54% of our 20172023 net sales. In 2017,2023, we generated approximately 94%95% of our sales in North America 5%(including Canada and Mexico), 4% in Europe and 1% in South America and Australia combined.Australia. While we continue to expand both domestically and internationally, we expect this geographic mix to be similar over the next few years. References to product line and product category data throughout this Form 10-K generally reflect data related to the North American swimming pool market, as it is more readily available for analysis and represents the largest component of our operations.
Our goal is to be a trusted resource for both industry professionals, retailers and consumers in the outdoor living industry. We use a combination of local and international sales and marketing personnel to promote the growth of our business and develop and strengthen our customers’ businesses. Our sales and marketing personnel focus on developing customer training programs and promotional activities, creating and enhancing sales management tools and providing product and market expertise. Our local sales personnel work from our sales centers as trusted resources for our customers and are charged with understanding and meeting our customers’ specific needs. Our sales center personnel help educate our customers on a variety of topics including the newest, most innovative products and solutions that can elevate their businesses.
We offer our customers more than 180,000200,000 manufacturer and Pool Corporation brandedproprietary and exclusive brand products. We believe that our selection of pool equipment, supplies, chemicals, replacement parts, irrigation and related products and other pool construction and recreational products is the most comprehensive in the industry. We sell the following types of products:
•maintenance products, such as chemicals, supplies and pool accessories;
•repair and replacement parts for pool equipment, such as cleaners, filters, heaters, pumps and lights;
packaged pool kits including walls, liners, braces and coping for in-ground and above-ground pools;
pool equipment and components for new pool construction and the remodeling of existing pools;
irrigation and related products, including irrigation system components and professional lawn care equipment and supplies;
•building materials, such as concrete, plumbing and electrical components, both functional and decorative pool surfaces, decking materials, tile, hardscapes and natural stone, used for pool installations and remodeling;
commercial•pool equipment and components for new pool construction and the remodeling and replacement of existing pools;
•irrigation and related products, including ASMEirrigation system components and professional turf care equipment and supplies;
•commercial pool products, including American Society of Material Engineers heaters, safety equipment, commercial decking equipment and commercial pumps and filters;
•fiberglass pools and hot tubs and packaged pool kits including walls, liners, braces and coping for in-ground and above-ground pools; and
•other pool construction and recreational products, which consist of a number of product categories and include discretionary recreational and related outdoor lifestyleliving products, that enhance consumers’ use and enjoyment of outdoor living spaces, such as spas, grills and components for outdoor kitchens.
We currently have over 500650 product lines and overapproximately 50 product categories. Based on our 20172023 product classifications, sales for our pool and spahot tub chemicals product category represented approximately 12%14% of total net sales for 20172023, 13% of total net sales in 2022 and 13%9% of total net sales in 2021. The increase in pool and hot tub chemicals as a percentage of our total net sales in 2016from 2021 to 2022 was driven primarily by our December 2021 acquisition of Porpoise Pool & Patio and 2015.its chemical re-packaging plant, combined with inflation and improved supply over the prior year. No other product categorycategories accounted for 10% or more of total net sales in any of the last three fiscal years.
Our maintenance, repair and replacement products are generally described as follows:
maintenance and minor repair (non-discretionary); and
major refurbishment and replacement (partially discretionary).
In 2017, the sale of maintenance and minor repair products accounted for almost 60% of our sales and gross profits while just over 40% of our sales and gross profits were derived from the refurbishment, replacement, construction and installation (equipment, materials, plumbing, electrical, etc.) of swimming pools. During the Great Recession, sales of maintenance and minor repair products had increased to approximately 70% of our sales and gross profits due to the significant declines in new pool construction and deferred remodeling and replacement activity. The current trend reflects a shift back toward a greater percentage of our sales coming from major refurbishment and replacement products due to an ongoing recovery of these activities since levels reached their historic low point in 2009.
Discretionary demand for products related to pool construction and remodeling has been an important factor in our historical base business sales growth. We have realized sales growth over the past five years due to our ongoing expansion of these product offerings and the steady improvement in new construction, remodeling and economic trends. However, new pool construction remains approximately 65% below peak historic levels and approximately 50% to 55% below what we believe to be normal levels. We continue to identify new related product categories, and we typically introduce new categories each year in select markets. Then weWe then evaluate the performance in these markets and focus on those product categories that we believe exhibit the best long-term growth potential. We expect to realize continued sales growth for these types of product offerings by expanding the number of locations that offer these products, increasing the number of products offered at certain locations and continuing a modest broadening of these product offerings on a company-wide basis.
New product technology provides opportunities not only for improved energy-efficiency but also expanded control and convenience in enjoying leisure activities. We offer a growing selection of energy-efficient and environmentally preferred products, which support sustainability and can help pool owners save energy, water, time and money. Major equipment manufacturers have developed and will continue to develop more retrofit kits that allow homeowners to interact with their pools or hot tubs through their smartphones. Also, robotic cleaners offer consumers a more efficient option for maintaining their swimming pools. We see each of these developments as significant growth opportunities.
Over the last several years, we have increased our product offerings and service abilities related to commercial swimming pools, including the acquisition of Lincoln Pool Products in April 2017.pools. We consider this areathe commercial market to be a key growth opportunity as we focus more attention on providing products to customers who operate and service large commercial installations such as hotels, condominiums, apartment complexes, universities and community recreational facilities. However we are leveragingWe continue to leverage our existing sales center networks and customer and vendor relationships to supply togrow this market.
GrowthIn 2023, the sale of maintenance and minor repair products (non-discretionary) accounted for approximately 62% of our sales, while approximately 24% of our sales were derived from partially discretionary products used in the replacementremodel, renovation, upgrade of pools and refurbishment market following the Great Recession led to product and customer mix changes, including a shift in consumer spending to higher value, lower margin products such as variable speed pumps, high efficiency heaters, and irrigation and related equipment, which positively contribute toapproximately 14% of our sales were derived from discretionary products used in the construction and gross profit growth but negatively impact our gross margin. We expect continued demand for these products, but believe our efforts in various pricing and sourcing initiatives, including growth in our higher margin private label and exclusive products (PLEX) and our expansioninstallation (equipment, materials, plumbing, electrical, etc.) of building materials product offerings, has helped offset these gross margin declines and will leadswimming pools. These components may vary from year to somewhat flat gross margin trends over the next few years.year.
Operating Strategy
We distribute swimming pool supplies, equipment and related leisure products domestically through our SCP and Superior sales center networks and internationally through our SCP network. We distribute irrigation and related products through our Horizon network and tile, decking materials and interior pool finish products through our NPT network. We adopted the strategy of operating two distinct distribution networks within the U.S. swimming pool market primarily for two reasons:
to offer our customers a choice of distinctive product selections, locations and service personnel;personnel. We distribute irrigation, landscape maintenance and related products through our Horizon network.
Swimming pool tile, decking materials and interior pool surfacing products are distributed through our NPT network, as well as through SCP and Superior networks. Our NPT network primarily serves the swimming pool market with our market-leading brand of pool tile and composite pool finish products but also provides some overlap with the irrigation and landscape industry as we offer NPT hardscapes and other outdoor living products. As more consumers create and enhance outdoor living areas and invest more in their outdoor environment, we believe we can focus our resources to increaseaddress such demand by leveraging our existing pool and irrigation and landscape maintenance customer base. We feel the leveldevelopment of customer service and operational efficiency provided by theour NPT network is a natural extension of our distribution model. In addition to our 21 standalone NPT sales centers, we currently have over 100 SCP and Superior sales centers that feature consumer showrooms where landscape and swimming pool contractors, as well as homeowners, can view and select pool components including pool tile, decking materials and interior pool finishes in eachvarious styles and grades, and serve as stocking locations for our NPT brand products. We also offer virtual tools for homeowners to select and design their pool and outdoor environments, collaborating with their chosen contractors to install these products. Our NPT® Backyard mobile app and www.nptpool.com® allow our customers to virtually design, customize and view a pool in their own backyard within seconds. We believe our showrooms, local stocking of products and virtual support provide us with a competitive advantage in these categories. Given the more discretionary nature of these products, this business is more sensitive to external market factors compared to our business overall.
Sun Wholesale Supply, which we acquired in December 2021, distributes swimming pool supplies, equipment and related leisure products, primarily servicing independently owned and operated Pinch A Penny, Inc. franchise locations. Since December 2021, we have expanded Pinch A Penny franchise operations through additional locations of Pinch A Penny franchised stores and expect to continue these expansion initiatives. Sun Wholesale Supply also owns and operates a specialty chemical re-packaging plant providing pool chemical products to the Pinch A Penny franchised store network by promoting healthy competition betweenand a portion of the two networks.chemical products sold through our SCP and Superior sales centers.
We evaluate our sales centers based on their performance relative to predetermined standards that include both financial and operational measures. Our corporate support groups provide our field operations with various services, such as developing and coordinating customer and vendor related programs, services from our real estate support function to find appropriate locations for our sales centers, human resources support, information systems support, support from our logistics and fleet teams, accounting and financial analysis support and expert resources to help them achieve their goals. We believe our incentive programs and feedback tools, along with the competitive nature of our internal networks,sales center network, stimulate and enhance employee performance.
Distribution
Our sales centers are located within population centers near customer concentrations, typically in industrial, commercial or mixed‑usemixed-use zones. Customers may pick up products at any sales center location, or we may deliver products to their premises or job sites via our trucks or third partythird-party carriers. For additional information on our sales centers, see Item 2, “Properties,” of this Form 10-K.
Our sales centers maintain well-stocked inventories to meet our customers’ immediate needs. We utilize warehouse management technology to optimize receiving, inventory control, picking, packing and shipping functions. For additional information regarding our inventory management, see Item 7, “Management’s Discussion and Analysis of Financial Condition and Results of Operations - Critical Accounting Estimates - Inventory Obsolescence,” of this Form 10-K.
We also operate four centralized shipping locations (CSLs) in the United States that redistribute products we purchase in bulk quantities to our sales centers or, in some cases, directly to customers. Our CSLs are regional locations that carry a wide range of traditional swimming pool, irrigation and related constructionoutdoor living products.
Purchasing and Suppliers
We believe we enjoy good relationships with our suppliers, who generally offer competitive pricing, return policies and promotional allowances. It is customary in our industry for certain manufacturers to manage their shipments by offering seasonal terms to qualifying purchasers such as Pool Corporation, which are referred to as early buy purchases. These early buy purchases typically allow us to place orders in the fall at a modest discount, take delivery of product during the off-season months and pay for these purchases in the spring or early summer. Due to vendor backlogs resulting in product availability constraints, these early buy opportunities were generally not available in 2021 or 2020. Although early buy opportunities were re-established in 2022, they were not widely utilized until 2023 due to higher stocking levels in 2022.
Our preferred vendor program encourages our distribution networks to stock and sell products from a smaller number of vendors offering the best overall terms and service to optimize profitability and shareholder return. We also work closely with our vendors to develop programs and services to better meet the needs of our customers and to concentrate our inventory investments. These practices, together with a more comprehensive service offering, have positively impacted our selling margins and our returns on inventory investments. See Item 7, “Management’s Discussion and Analysis of Financial Condition and Results of Operations - Critical Accounting Estimates - Vendor Programs,” for additional information.
We regularly evaluate supplier relationships and consider alternate sourcing to assureensure competitive cost, service and quality standards. Our largest suppliers include Pentair Water Pool and Spa, Inc.,plc, Hayward Pool Products, Inc. and Zodiac Pool Systems, Inc., which accounted for approximately 20%19%, 10% and 8%10%, respectively, of the cost of products we sold in 2017.2023.
Competition
We are the largest wholesale distributor of swimming pool and related backyard products (based on industry knowledge and available data) and one of the only truly national wholesale distributordistributors focused on the swimming pool industry in the United States. We are also one of the top threeleading distributors of irrigation and relatedlandscape maintenance products in the United States. We face intense competition from many regional and local distributors in our markets and from onethree national wholesale distributordistributors of irrigation and landscape supplies. We also face competition, both directly and indirectly, from mass market retailers (both store-based and internet) mass market retailers and large pool supply retailers who primarily buy directly from manufacturers.
Some geographic markets we serve, particularly the four largest and higher pool density markets of California, Texas, Florida and Arizona, have a greater concentration of competition than others. Barriers to entry in our industry are relatively low. We believe that the principal competitive factors in swimming pool and irrigation and landscape supply distribution are:
•the breadth and availability of products offered;
•the quality and level of customer service, including ease of ordering and speed of product delivery;
•the breadth and depth of sales and marketing programs;
•consistency and stability of business relationships with customers and suppliers;
•competitive product pricing; and
•geographic proximity to the customer.
Environmental, Social and Governance (ESG)
Environmental
We are committed to sustainable business practices, which includes offering eco-friendly products to our customers, closely monitoring our sourcing activities, and being good stewards within the communities we serve. We are taking steps to reduce our carbon footprint and to improve product choices that allow pool and homeowners to reduce their environmental impact. We are also installing more energy-efficient systems throughout our sales center network. We continually strive to ensure success in our business while protecting resources for future generations. Our sustainability goals include the reduction of greenhouse gases and other harmful air emissions, water conservation, energy conservation and carbon footprint minimization. We also endeavor to handle, distribute, transport and dispose of all products in a responsible manner, particularly the chemicals and fertilizers that we sell.
Social - Human Capital Management
We employed approximately 6,000 people at December 31, 2023 and approximately 90% of our employees were located in the U.S. Given the seasonal nature of our business, our peak employment period is the summer season and, depending on expected sales levels, we add 100 to 200 employees to our work force to meet seasonal demand. We believe that we generally compete favorablyhave good relations with respectour employees. None of our employees are currently covered under any collective bargaining agreements.
Our goal is to be an Employer of Choice by focusing on the engagement, development, retention, and health and well‑being of our employees. We believe that our success is a direct result of the contributions and commitment of our employees. We provide competitive pay and benefits, training and continuing education, and professional development and promotional opportunities to engage and reward our team. We have established a set of standard operating procedures to optimize our human capital management function, including recruitment and employee relations policies, training practices and operational instructions. We focus on the following factors in implementing and developing our human capital strategy:
•employee health, safety and wellness;
•diversity, equity and inclusion;
•employee growth and development; and
•employee compensation and benefits.
Employee Health, Safety and Wellness
Our commitment to the health, safety and wellness of our employees ranks at the top of our core operating priorities. Our ultimate goal is to send every employee home each night in the same condition in which they came to work that morning. We aim to achieve zero serious injuries through continued investment in, and focus on, our core safety programs and injury-reduction initiatives. This effort begins immediately with new employees and is reinforced each day through a focus on training, safety awareness, risk identification and other essential safety protocols. We closely monitor overall workers’ compensation and auto claims, OSHA recordable incidents, Department of Transportation compliance and other internally established safety prevention elements in an effort to make every workday safe.
Diversity, Equity and Inclusion (DEI)
We are committed to fostering a diverse, equitable and inclusive workplace that represents the communities in which we work and live. We believe that diversity drives innovation and delivers the best solutions to complex problems. Our culture is one where differences are welcomed, valued and respected.
We are committed to expanding the diversity of our workforce through the hiring, retention and advancement of underrepresented populations. To achieve this, our approach to DEI is as follows:
•Diversity: Recruit, develop and retain a diverse workforce and provide developmental opportunities for career advancement for all employees;
•Equity: Ensure that our policies, practices and procedures are fair and enable equal employment opportunity for prospective candidates and employees; and
•Inclusion: Communicate that we, as an Employer of Choice, are committed to DEI with action-oriented programs that produce results and employee engagement.
Our DEI efforts are focused on expanding content in core employee development programs and improving our ability to recruit and hire first-class diverse talent. To create connection and community, we have established a Women’s Interactive Network (WIN) and diversity mentoring program to cultivate the growth and development of our female and diverse employees. We also support our employees with training and development opportunities, which includes content aimed at creating and sustaining an inclusive environment.
Employee Growth and Development
We strive to be an Employer of Choice by investing in our employees. Our goal is to attract, develop and retain a talented team of diverse people inspired by our mission to provide exceptional value to our customers and suppliers and create exceptional return to our shareholders, while providing exceptional opportunities for our employees. Our success depends on our employees understanding how their work contributes to the company’s overall strategy.
When our employees succeed, the company succeeds. To help our employees achieve success in their roles, we emphasize continuous training and career development opportunities. These opportunities include annual performance reviews, succession planning, promotion and advancement opportunities, ongoing training in safety and security protocols, updates on new products and service offerings and deployment of technologies. We also provide a series of managerial training to our field and departmental leaders. This coursework covers topics such as leading with inclusion, recruitment best practices, effective communications, leading and empowering others and managing employee performance.
We also provide an entry level training program to prepare Manager Trainees (MITs) for sales and operations management opportunities and build our pipeline for field leadership. Our MITs are hosted at either our state-of-the-art EDGEucation Center or in a virtual classroom. They gain valuable experience during their training program through field-based interaction with customers and operating management. Our program includes interaction with subject matter experts, hands-on projects and role play to provide MITs with practical industry knowledge, leadership skills and the tools necessary to succeed within our organization.
Our employees are also involved in a multitude of volunteer efforts that positively impact our communities through support of charitable organizations. We have donated over $3 million through our partnerships with YMCAs across the country to provide free water safety lessons and lifeguard training in underserved communities. Our donations have funded safety around water swimming lessons and lifeguard training scholarships from coast to coast. Our local employees and partners have also donated their time and energy to make these factors.events a success.
Employee Compensation and Benefits
We strive to provide market-competitive compensation, benefits and services to our employees. Our performance-based compensation philosophy rewards each employee’s individual contributions regardless of gender, race or ethnicity. Our total compensation package includes cash compensation (base salary and performance-based incentive or bonus payments), company contributions toward additional benefits (such as health and disability plans), retirement plans with a company match and paid time off. We also offer the opportunity to become a shareholder through equity grants for management and our employee stock purchase plan. Our employees can take advantage of a range of benefits, including healthcare and wellness programs, tuition reimbursement for eligible employees and multi-year scholarships to their dependents, and financial wellness programs to help provide education and tools to assist in improving, maintaining and capitalizing on our employees’ financial future. We closely monitor employee turnover and conduct exit interviews to gain relevant information and adapt our engagement and retention strategy as appropriate.
Governance
Our employees, managers and officers conduct our business under the direction of our CEO and the oversight of our Board of Directors (our Board) to enhance our long-term value for our stockholders. The core responsibility of our Board is to exercise its fiduciary duty to act in the best interests of our company and our stockholders. In exercising this obligation, our Board and committees perform a number of specific functions, including risk assessment, review and oversight. While management is responsible for the day-to-day management of risk, our Board is responsible for oversight of our risk management programs, ensuring that an appropriate culture of risk management exists within the company, and assisting management in addressing specific risks, such as strategic risks, financial risks, cybersecurity risks, regulatory risks and operational risks.
Seasonality and Weather
Our business is seasonal. In general, sales and operating income are highest during the second and third quarters, which represent the peak months of swimming pool use, pool and irrigation installation and remodeling and repair activities. Sales are lower during the first and fourth quarters. In 2023, we generated approximately 60% of our net sales and 70% of our operating income in the second and third quarters of the year.
We typically experience a build-up of product inventories and accounts payable during the winter months in anticipation of the peak selling season. Excluding borrowings to finance acquisitions, dividend payments and share repurchases, our peak borrowing usually occurs during the late spring and summer, primarily because extended terms offered by certain of our suppliers are typically payable during the second quarter of each year, while our peak accounts receivable collections typically occur in June, July and August.
We expect that our quarterly results of operations will continue to fluctuate depending on the timing and amount of revenue contributed by new and acquired sales centers. Based on our peak summer selling season, we generally open new sales centers and close or consolidate sales centers, when warranted, either in the first quarter before the peak selling season begins or in the fourth quarter after the peak selling season ends.
Weather is one of the principal external factors affecting our business. The table below presents some of the possible effects resulting from various weather conditions.
| | | | | | | | |
| Weather | | Possible Effects |
| Hot and dry | • | Increased purchases of chemicals and supplies |
| | for existing swimming pools |
| • | Increased purchases of above-ground pools and |
| | irrigation and lawn care products |
| | |
| Unseasonably cool weather or extraordinary amounts | • | Fewer pool and irrigation and landscaping |
| of rain | | installations |
| • | Decreased purchases of chemicals and supplies |
| • | Decreased purchases of impulse items such as |
| | above-ground pools and accessories |
| | |
| Unseasonably early warming trends in spring/late cooling | • | A longer pool and landscape season, thus positively |
| trends in fall | | impacting our sales |
| (primarily in the northern half of the U.S. and Canada) | | |
| | |
| Unseasonably late warming trends in spring/early cooling | • | A shorter pool and landscape season, thus negatively |
| trends in fall | | impacting our sales |
| (primarily in the northern half of the U.S. and Canada) | | |
For a discussion regarding the effects seasonality and weather had on our results of operations in 2023 and 2022, see Item 7, “Management’s Discussion and Analysis of Financial Condition and Results of Operations - Seasonality and Quarterly Fluctuations,” of this Form 10-K.
Environmental, Health and Safety
Government Regulations
Our business is subject to regulationa wide variety of regulations, principally under local fire codes and international, federal, state and local environmental and health and safety requirements, including regulation by the Environmental Protection Agency, the Consumer Product Safety Commission, the Department of Transportation, the Occupational Safety and Health Administration, the National Fire Protection Agency and the International Maritime Organization. Most of these requirements govern the packaging, labeling, handling, transportation, storage and sale of chemicals and fertilizers. We store certain types of chemicals and/or fertilizers at each of our sales centers and the storage of these items is strictly regulated by local fire codes. In addition, we sell algaecides and pest control products that are regulated as pesticides under the Federal Insecticide, Fungicide and Rodenticide Act and various state pesticide laws. These laws primarily relate to labeling, annual registration and licensing.
Employees
We employed approximately 4,000 people at December 31, 2017. Given the seasonal nature of our business, our peak employment period is the summer and, depending on expected sales levels, we add 200 to 500 employees to our work force to meet seasonal demand.
Intellectual Property
We maintain both domestic and foreign registered trademarks and patents, primarily for our Pool Corporationproprietary and Pool Systems Pty. Ltd. (PSL) brandedexclusive brand products that are important to our current and future business operations. We also own rights to numerous internet domain names.
Geographic Areas
The table below presents net sales by geographic region, with international sales translated into U.S. dollars at prevailing exchange rates, for the past three fiscal years (in thousands):
| | | | | | | | | | | | | | | | | | | | |
| | | Year Ended December 31, |
| | | 2023 | | 2022 | | 2021 |
| United States | | $ | 5,126,308 | | | $ | 5,674,909 | | | $ | 4,749,459 | |
| International | | 415,287 | | | 504,818 | | | 546,125 | |
| | | $ | 5,541,595 | | | $ | 6,179,727 | | | $ | 5,295,584 | |
|
| | | | | | | | | | | | |
| | | Year Ended December 31, |
| | | 2017 | | 2016 | | 2015 |
| United States | | $ | 2,545,270 |
| | $ | 2,354,726 |
| | $ | 2,168,802 |
|
| International | | 242,918 |
| | 216,077 |
| | 194,337 |
|
| | | $ | 2,788,188 |
| | $ | 2,570,803 |
| | $ | 2,363,139 |
|
The table below presents net property and equipment by geographic region, with international property and equipment balances translated into U.S. dollars at prevailing exchange rates, for the past three fiscal yearsyear ends (in thousands):
| | | | | | | | | | | | | | | | | | | | |
| | | December 31, |
| | | 2023 | | 2022 | | 2021 |
| United States | | $ | 215,109 | | | $ | 185,117 | | | $ | 171,408 | |
| International | | 8,820 | | | 8,592 | | | 7,600 | |
| | | $ | 223,929 | | | $ | 193,709 | | | $ | 179,008 | |
|
| | | | | | | | | | | | |
| | | December 31, |
| | | 2017 | | 2016 | | 2015 |
| United States | | $ | 95,659 |
| | $ | 79,064 |
| | $ | 65,885 |
|
| International | | 5,280 |
| | 4,226 |
| | 3,969 |
|
| | | $ | 100,939 |
| | $ | 83,290 |
| | $ | 69,854 |
|
AvailableWebsite Access and Additional Information
Our website is www.poolcorp.com. Our website and other websites mentioned in this Form 10-K are for information only and the contents of such websites are not incorporated in, or otherwise to be regarded as part of, this Form 10-K.
Our periodic reports, including our annual report on Form 10-K, quarterly reports on Form 10-Q, current reports on Form 8-K and amendments to those reports filed or furnished pursuant to Section 13(a) or 15(d) of the Securities Exchange Act of 1934 are available free of charge on our website at www.poolcorp.com as soon as reasonably practicalpracticable after we electronically file such reports with, or furnish them to, the Securities and Exchange Commission (SEC).
Additionally,We regularly evaluate the possibility of acquiring additional companies, and at any given time may be engaged in discussions or negotiations regarding these transactions. We generally do not announce our acquisitions until they are completed, unless it is required by regulatory or other rules to announce when a definitive agreement is reached.
Investors should also be aware that while we may answer questions raised by securities analysts, it is against our policy to disclose any material non-public information or other confidential information. Accordingly, investors should not assume that we agree with any statement or report issued by an analyst with respect to our past or projected performance. To the extent that reports issued by securities analysts contain any projections, forecasts or opinions, such reports are not our responsibility.
Unless otherwise indicated, information contained in this report and other documents filed by us under the federal securities laws concerning our views and expectations regarding the industries in which we operate are based on estimates made by us using data from industry sources and making assumptions based on our industry knowledge and experience. We have adopted a Code of Business Conductnot independently verified data from industry or other third-party sources and Ethics (the Code) that applies to allcannot guarantee its accuracy or completeness.
In this annual report and other of our employees, officers and directors, and is availablepublic disclosures, we estimate the impact that favorable or unfavorable weather had on our website at www.poolcorp.com. Any substantive amendments tooperating results. In connection with these estimates, we make several assumptions and rely on various third-party sources. It is possible that others assessing the Code, or any waivers granted to any directors or executive officers, including our principal executive officer, principal financial officer, or principal accounting officer and controller, will be disclosed on our website and remain there for at least 12 months.same data could reach conclusions that differ from ours.
Item 1A. Risk Factors
Cautionary Statement for Purposes of the “Safe Harbor” Provisions of the Private Securities Litigation Reform Act of 1995
Our disclosure and analysis in thisThis report contains forward-looking information that involves risks and uncertainties. Our forward‑lookingforward-looking statements express our current expectations or forecasts of possible future results or events, including projections of earnings and other financial performance measures, statements of management’s expectations regarding our strategic, operational and capital allocation plans and objectives, management’s views on industry, economic, competitive, technological and industry, general economicregulatory conditions and other forecasts of trends and other matters. Forward-looking statements speak only as of the date of this filing, and we undertake no obligation to publicly update or revise such statements to reflect new circumstances or unanticipated events as they occur. You can identify these statements by the fact that they do not relate strictly to historic or current facts and often use words such as “anticipate,” “estimate,” “expect,” “intend,” “believe,” “will, likely result,” “outlook,” “project,” “may,” “can,” “plan,” “target,” “potential,” “should” and other words and expressions of similar meaning.
No assurance can be given that the expected results in any forward-looking statementsstatement will be achieved, and actual results could be affected bymay differ materially due to one or more factors, which could cause them to differ materially.including the risks described below in this Item 1A, below in Item 7 of this Form 10-K and elsewhere in this Form 10-K. For these statements, we claim the protection of the safe harbor for forward-looking statements contained in the Private Securities Litigation Reform Act.
Risk Factors
Investing in our securities involves multiple risks and uncertainties. Certain factors that may affect our business and could cause actual results to differ materially from those expressed in any forward‑looking statements includeforward-looking statement are described below. Investors should carefully consider the following:risks described below in addition to the other information set forth in this Annual Report on Form 10-K. The risks discussed below are not the only risks we face. Other risks or uncertainties not presently known to us, or that we currently believe are immaterial, may materially affect our business if they occur. Moreover, new risks emerge from time to time. Further, our business may also be affected by additional factors that generally apply to all companies operating in the U.S. and globally, which we have not included below.
Risks Relating to Macroeconomic Conditions or Events
The demand for our swimming pool, irrigation and related outdoor lifestyle products may be adversely affected by unfavorable economic conditions.conditions and changes in consumer discretionary spending.
Demand for our products is subject to fluctuations and is difficult to predict, often due to factors outside of our control. Consumer discretionary spending significantly affects our sales and is impacted by factors outsidea variety of our control,factors, including general economic conditions, the residential housing market, unemployment rates, wage levels, interest rate fluctuations, inflation, disposable income levels, consumer confidence and access to credit. In economic downturns or recessions, the demand for swimming pool, irrigation, landscape and related outdoor lifestyleliving products may decline,typically declines, often corresponding with declines in discretionary consumer spending, the growth rate of pool eligible households and swimming pool construction. MaintenanceCurrently over 86% of our net sales are derived from sales of maintenance, repair, replacement and repairrenovation products and certain replacement equipment, which are requirednecessary to maintain existing swimming pools, currently account for approximately 85% of net sales and gross profits related to our swimming pool business; howeverpools. However, the growth ofin this portion of our business depends on the expansion of the installed pool base, andwhich could also be adversely affected by decreases in construction activities, similar to the trends between late 2006 and early 2010.experienced this past year. A weak economy may also cause consumers to defer discretionary replacement and refurbishmentrenovation activity. Even in generally favorable economic conditions, severe and/or prolonged downturns in the housing market could have a material adverse impact on our financial performance. Such downturns expose us to certain additional risks, including but not limited to the risk of customer closures or bankruptcies, which could shrink our potential customer base and inhibit our ability to collect on those customers’ receivables.
We believe that homeowners’ access to consumer credit at attractive interest rates is a critical factor enabling the purchase of new pools, irrigation systems and outdoor living products. Between late 2006 and early 2010, the unfavorableUnfavorable economic conditions andor a downturn in the housing market resultedcould result in a significant tightening of credit markets, which limitedcan limit the ability of consumers to access financing for new swimming pools and irrigation systems. Although we have seen improvement since 2010, tightening
During 2022 and 2023, interest and inflation rates were higher than the three years prior to 2022, economic uncertainties increased, and consumer credit tightened, which led to a slowdown in new pool permits (signaling a decline in new construction projects). During 2023, the heightened demand for our products during the pandemic moderated as consumers applied less disposable income to pools and other home improvements. These economic events reduced our revenues in 2023 and are expected to similarly impact our revenues in 2024.
Discretionary spending is often adversely affected during times of economic, social or political uncertainty, whether caused by health threats, man-made or natural disasters, or other similar events discussed below in this item 1A. These events could prevent consumers from obtaining financing for pool, irrigationcreate uncertainties that negatively impact our business in ways that we cannot presently predict.
Changes in our customer base could also impact us. Our business could be adversely impacted if (i) consolidation of our customers leads to changes in purchasing habits, (ii) more people choose to live in urban settings or (iii) more homeowners bypass our customers by directly procuring their own supplies or undertaking their own improvement projects.
An outbreak of disease or similar public health threat, such as the recent COVID-19 pandemic, could adversely impact our business and related outdoor projects, whichresults of operations.
An outbreak of disease or similar public health threat, such as the recent COVID-19 pandemic and its negative impact on the worldwide economy, could have an adverse impact on our workforce, supply chain or operations. Although our revenues increased during the COVID-19 pandemic that began in early 2020, we cannot assure you that our revenues would increase in the event of a future public health emergency. New variants of COVID-19 could continue to cause outbreaks and uncertainties, and any future epidemics, pandemics or similar public health crises could adversely impact our business and results of operations.
Other catastrophic events or societal unrest could adversely impact our operations.
Terrorist attacks, wars, rioting, labor strife, civil disturbances, societal unrest or political instability could negatively impact us directly by interfering with our sales of construction-related products.ability to operate or indirectly by depressing macroeconomic conditions. Our customers could also encounter hardships that negatively impact their ability to make timely payments to us or to continue doing business with us.
Risks Relating to Our Business and Industry
We are susceptible to adverse weather conditions.conditions, which could intensify as a result of climate change.
WeatherGiven the nature of our business, weather is one of the principal external factors affecting our business. For example, unseasonablybusiness and the effect of seasonality has a significant impact on our results. In 2023, we generated approximately 60% of our net sales and 70% of our operating income in the second and third quarters of the year. These quarters represent the peak months of swimming pool use, pool and irrigation installation and remodeling and repair activities. Unfavorable weather during these quarters in our largest geographic regions can significantly affect our results. Unseasonably late warming trends in the spring or early cooling trends in the fall can shorten the length of the pool season. Also, unseasonably cool weather or extraordinaryexcessive rainfall during the peak season can decreasehave an adverse impact on demand due to decreased swimming pool use, installation and maintenance, as well as decreased irrigation installations and landscape maintenance. These weather conditions adversely affect sales of our products.installations. While warmer weather conditions favorablygenerally impact our sales favorably, global warming trends and other significant climate changes can create more variability in the short term or lead to other unfavorable weather conditions that could adversely impact our sales or operations. Drought conditions or water management initiatives may lead to municipal ordinances related togovernment-imposed water use restrictions. Such restrictions which could result in decreased pool and irrigation system installations andwhich could negatively impact our sales.
Certain extreme weather events and natural disasters, such as hurricanes, tornadoes, earthquakes, tropical storms, floods, drought and wildfires, may adversely impact us in several ways, including interfering with our ability to deliver our products and services, interfering with our receipt of supplies from our vendors, reducing demand for our products and services, and damaging our facilities. We have experienced short-term impacts on our sales due to closures from weather events in recent years, including Hurricane Ian in Florida in 2022. Although these events have not had any material lasting impacts on our business or resulted in any material permanent operational challenges, similar events could adversely affect our business in the future. The areas in which we operate, including California, Florida, Texas and other coastal areas, have experienced recent natural disasters or present increased risks of adverse weather or natural disasters. The physical effects of climate change may increase the frequency or severity of natural disasters and other extreme weather events in the future, which would increase our exposure to these risks.
For aadditional discussion regarding seasonality and weather, see Item 7, “Management’s Discussion and Analysis of Financial Condition and Results of Operations - Seasonality and Quarterly Fluctuations,” of this Form 10-K.
Our distribution business is highly dependent on our ability to maintain favorable and stable relationships with suppliers.
As a distribution company, maintaining favorable relationships with our suppliers is critical to our success. We believe that we add considerable value to the swimming pool and irrigation supply chains by purchasing products from a large number of manufacturers and distributing the products to a highly fragmented customer base on conditions that are more favorable than these customers could obtain on their own. We believe that we currently enjoy good relationships with our suppliers, who generally offer us competitive pricing, return policies and promotional allowances. However, any failure to maintain favorable relationships with our suppliers could have an adverse effect on our business.
Our largest suppliers are Pentair Water Pool and Spa, Inc.,plc, Hayward Pool Products, Inc. and Zodiac Pool Systems, Inc., which accounted for approximately 20%19%, 10% and 8%10%, respectively, of the costs of products we sold in 2017.2023. A decision by our largest suppliers, acting individually or in concert, to sell their products directly to retailers or other end users of their products, bypassing distribution companies like ours, would have an adverse effect on our business. Additionally, if our suppliers experience difficulties or disruptions in their operations, if there is any material interruption in our supply chain (such as the loss ofinterruptions caused by the COVID-19 pandemic and exacerbated by the war in Ukraine) or if we lose a single significant supplier due to financial failure or a decision to sell exclusively to retailers or end-use consumers, we may experience increased supply costs or delays in establishing replacement supply sources that meet our quality and control standards, which may affect our profitability.
Failure to achieve and maintain a high level of product and service quality and safety could damage our reputation, expose us to litigation and negatively impact our financial performance.
We rely on a global network of manufacturers and other suppliers to provide us with the products we distribute. To succeed, we must continue to maintain effective business relationships with qualified suppliers who can timely and efficiently supply us with high quality products. As we increase the number of our proprietary and exclusive brand products. we distribute, our exposure to potential liability claims may increase. Product and service quality issues could negatively impact customer confidence in our brands and our business. If our product and service offerings do not meet applicable safety standards or our customers’ expectations regarding safety or quality, we could experience lost sales and increased costs and be exposed to legal, financial and reputational risks, as well as governmental enforcement actions. Actual, potential or perceived product safety concerns, including health-related concerns, could damage our reputation with current or prospective customers, vendors and employees. Product quality or safety issues could also adversely affectexpose us to litigation, as well as government enforcement actions, and result in costly product recalls and other liabilities. Similar concerns impacting our business.competitors could damage the reputation of our industry and indirectly have an unfavorable impact on our operations.
We face intense competition both from within our industry and from other leisure product alternatives.
Within our industry, we directly compete against various regional and local distributors as they compete against our customers for the business of pool owners and other end-use customers. We indirectly compete against mass market retailers and large pool or irrigation supply retailers as they purchase the great majority of their needssupplies directly from manufacturers, andmanufacturers. We compete to a lesser extent with internet retailers, as they purchase the majority of their needssupplies from distributors. Outside of our industry, we compete indirectly with alternative suppliers of big ticketbig-ticket consumer discretionary products, such as boat and motor home distributors, and with other companies who rely on discretionary homeowner expenditures, such as home remodelers.
New competitors may emerge as there are low barriers to entry in our industry.industry, which has led to highly competitive markets consisting of various-sized entities, ranging from small or local operators to large regional businesses. If our customers are attracted by the alternatives afforded by any of our competitors, they may be less inclined to purchase products or services from us, impacting our results of operations. Given the density and demand for pool products, some geographic markets that we serve also tend to have a higher concentration of competitors than others, particularly California, Texas, Florida and Arizona. These states encompass our four largest markets and represented approximately52% 54% of our net sales in 2017.2023. The entry of significant new competitors into these markets could negatively impact our sales.
More aggressive competition by store- and internet-based mass merchants and large pool or irrigation supply retailers could adversely affect our sales.
Mass market retailers today carry a limited range of, and devote a limited amount of shelf space to, merchandise and products targeted to our industry. Historically, mass market retailers have generally expanded by adding new stores and product breadth, but their product offering of pool and irrigation related products has remained relatively constant. Should store‑ and internet-based mass market retailers increase their focus on the pool or irrigation industries or increase the breadth of their pool and irrigation and related product offerings, they may become a more significant competitor for our direct customers and end-use consumers, which could have an adverse impact on our business. WeAdditionally, because the internet facilitates competitive entry, price transparency and comparison shopping, increased internet sales by us or our competitors could increase the level of competition we face or reduce our margin. Further, we may face additional competitive pressures if large pool or irrigation supply retailers look to expand their customer base to compete more directly within the distribution channel.
We depend on our ability to attract, develop and retain highly qualified personnel.
We consider our employees to be the foundation for our growth and success. As such, our future success depends in large part on our ability to attract, retain and motivate qualified personnel. This includes succession planning related to our executive officers and key management personnel. Hiring and retaining such qualified individuals may be adversely impacted by several factors, including (i) uncertainties regarding general economic conditions or our industry, (ii) our failure to offer competitive compensation and (iii) increased competition for qualified individuals. If we are unable to attract and retain key personnel, our operating results could be adversely affected.
Given the seasonal nature of our business, we may hire additional employees during the summer months, including seasonal and part-time employees, who generally are not employed during the off-season. If we are unable to attract and hire additional personnel during the peak season, our operating results could be negatively impacted. Additionally, competition for qualified employees could require us to pay higher wages to attract and retain a sufficient number of employees.
The pandemic and other events over the past few years have increased employees’ expectations regarding compensation, workplace flexibility and work-home balance. These developments have made it more difficult for us to attract and retain top talent. While we do not expect these developments to have a material adverse impact on us, we can provide no assurances to this effect.
Past growth may not be indicative of future growth.
Historically, we have experienced substantial sales growth through organic market share gains, new sales center openings, expanded product offerings and acquisitions that have increased our size, scope and geographic distribution. Since the beginningOur various business strategies and initiatives, including our growth initiatives, are subject to business, economic and competitive uncertainties and contingencies, many of 2015, we have opened 11 new sales centers and we have completed 9 acquisitions consisting of 24 sales centers (net of sales center consolidations within one year of acquisition).which are beyond our control. While we contemplate continued growth through internal expansion and acquisitions, no assurance can be made as to our ability to:
•penetrate new markets;
•generate sufficient cash flows to support expansion plans and general operating activities;
•obtain financing;
•identify appropriate acquisition candidates;candidates and successfully integrate acquired businesses;
•identify appropriate locations for new sales centers and successfully integrate them into our network;
•maintain favorable supplier arrangements and relationships; and
•identify and divest assets which do not continue to create value consistent with our objectives.
If we do not successfully manage these potential difficulties or successfully execute our business strategies and initiatives, our operating results could be adversely affected.
The COVID-19 pandemic positively impacted home-centric trends in all of our markets, which led to a non-recurring surge of investment in pools and other backyard products. This surge abated in mid-2022, when spending on these products began to decrease. Although we expect our financial performance to match or exceed pre-pandemic levels, we do not expect our near-term sales to match the levels experienced at the height of the pandemic.
We are subject to inventory management risks. Insufficient inventory may result in lost sales opportunities or delayed revenue, while excess inventory may negatively impact our gross margin.
We balance the need to maintain inventory levels that are sufficient to ensure competitive lead times and mitigate potential supply chain constraints against the risk of inventory obsolescence due to changing customer or consumer requirements and fluctuating commodity prices. In order to successfully manage our inventories, we must estimate demand from our customers and purchase products that substantially correspond to consumer demand. If we overestimate demand and purchase too much of a particular product, we face a risk that the price of that product will fall, leaving us with inventory that we cannot sell at normal profit margins. In addition, we may have to write down such inventory if we are unable to sell it for its recorded value. If we underestimate demand and purchase insufficient quantities of products, inventory shortages could result in delayed revenue or loss of sales opportunities altogether as potential customers turn to competitors’ products that are readily available. If we maintain insufficient inventory levels and prices rise for these products, we could be forced to purchase products at higher prices and forego profitability in order to meet customer demand. While always present, these challenges have been heightened over the past couple of years, as the pandemic altered consumer spending trends and caused us to increase our investments in inventory. Our business, is highly seasonal.financial condition and results of operations could be negatively impacted if we are unable to accurately forecast demand for our products.
In 2017, we generated approximately 62%Risks Relating to Technology, Cybersecurity and Data Privacy
We rely on information technology systems to support our business operations. A significant disruption, breach or cybersecurity attack of our net salestechnological infrastructure could adversely affect our financial condition and 83%results of operations.
Information technology supports several aspects of our operating incomebusiness, including among others, product sourcing, pricing, customer service, transaction processing, inventory management, financial reporting, collections and cost management. Our ability to operate effectively on a day-to-day basis, communicate with our customers and accurately report our results depends on a reliable technological infrastructure, which is inherently susceptible to internal and external threats. We are vulnerable to interruption, including by fire, natural disaster, power loss, telecommunication failures, internet failures, security breaches and other catastrophic events. Exposure to various types of cyber-attacks such as malware, computer viruses, worms, ransomware, social engineering or other malicious acts, as well as human error, could also potentially disrupt our operations, result in a significant interruption in the seconddelivery of our goods and services or result in the loss of sensitive data.
We are making, and expect to continue to make, investments in technology to maintain and update our computer systems and to expand our ability to engage in e-commerce with our customers. We may experience delays in making these updates and may not implement these changes as quickly or successfully as our customers expect. In addition, implementing significant system changes increases the risk of computer system disruption. The potential problems and interruptions associated with implementing technology initiatives or conversions (including those contemplated under our multi-year digital transformation project), as well as providing training and support for those initiatives, could disrupt or reduce our operational efficiency. Advances in computer and software capabilities, encryption technology and other discoveries increase the complexity of our technological environment, including how each interact with our various software platforms. Such advances could delay or hinder our ability to process transactions or could compromise the integrity of our data, resulting in a material adverse impact on our financial condition and results of operations. We also may experience occasional system interruptions and delays that make our information systems unavailable or slow to respond, including the interaction of our information systems with those of third quartersparties or the failure of software of services provided by third parties that we do not control. A lack of sophistication or reliability of our information systems could adversely impact our operations and customer service and could require major repairs or replacements, resulting in significant costs and foregone revenue.
We devote significant resources to protect our systems and data from cyber-attacks. In recent years we have faced, and expect to continue to face, various attempted cyber-attacks of increasing sophistication. To date, we are not aware of any cybersecurity incident or threat that materially impacted or could reasonably be anticipated to materially affect our business, results of operations or financial condition. However, we cannot guarantee that we will not experience such an incident in the future. The risk of breaches is likely to continue to increase due to several factors, including the increasing sophistication of cyber-attacks, the wider accessibility of cyber-attack tools, the expanded size, use and complexity of our systems, and our increased reliance on e-commerce, open source software, cloud computer services and work-from-home staffing. Known and newly discovered software and hardware vulnerabilities are constantly evolving, which increases the difficulty of detecting and successfully defending against them. Consequently, we may not be able to implement security barriers or other preventative measures that repel all future cyber-attacks or detect such attacks in a timely manner, which may result in significant expenses from system downtime, lower sales, increases in insurance costs, fines and fees, lost business relationships, managerial distractions, litigation, increases to regulatory oversight, expenditures for additional threat prevention technologies or reputational harm, any of which could materially impact us.
Although we maintain insurance coverage that may, subject to policy terms and conditions (including self-insured deductibles, coverage restrictions and monetary coverage caps), cover certain aspects of our cyber risks, such insurance coverage may be unavailable or insufficient to cover our losses.
Failure to maintain the security of confidential information could damage our reputation and expose us to litigation. Additionally, changes in data privacy laws and our ability to comply with them could have a material adverse effect on us.
We collect and store data that is sensitive to us and our employees, customers and vendors. The failure to maintain security over and prevent unauthorized access to our data, our customers’ personal information, including credit card information, or data belonging to our suppliers, could put us at a competitive disadvantage. Such a breach could result in damage to our reputation and subject us to potential litigation, liability, fines and penalties and require us to incur significant expense to address and remediate or otherwise resolve these issues, resulting in a possible material adverse impact on our financial condition and results of operations.
A variety of state, national, foreign and international laws and regulations apply to the collection, use, retention, protection, security, disclosure, transfer and other processing of personal and other data. The European Union and other international regulators, as well as state governments, have recently enacted or enhanced data privacy regulations, such as the California Consumer Privacy Rights Act, and other governments are considering establishing similar or stronger protections. These regulations impose certain obligations for handling specified personal information in our systems and for apprising individuals of the year. These quarters representinformation we have collected about them. Many of these laws are complex and change frequently and often conflict with the peak months of both swimming pool use, installation, remodelinglaws in other jurisdictions. Despite our best efforts to comply, any noncompliance could result in incurring potential substantial penalties and repair,reputational damage.
Risks Relating to Legal, Regulatory and irrigation installations and maintenance. Our sales are substantially lower during the first and fourth quarters of the year, when we may incur net losses.Compliance Matters
The nature of our business subjects us to compliance with employment, environmental, health, transportation, safety and other governmental regulations. Our costs of doing business could increase as a result of changes in, expanded enforcement of, or adoption of new federal, state or local laws and regulations.
We are subject to regulation undernumerous federal, state, local and international laws and regulations, many of which are complex and subject to varying interpretations, including regulations related to employment, environmental, health, transportation and safety requirements, which govern such things as packaging, labeling, handling, transportation, storage and sale of chemicals and fertilizers. For example, weThese laws and regulations, and related interpretations and enforcement activity, may change as a result of a variety of factors, including political, economic or social events. Changes in, expanded enforcement of, or adoption of new federal, state, local or international laws and regulations, including those governing minimum wage or living wage requirements, the classification of exempt and non-exempt employees or other wage, labor or workplace regulations, could increase our costs of doing business and adversely impact our results of operations.
We sell algaecides and pest control products that are regulated as pesticides under the Federal Insecticide, Fungicide and Rodenticide Act and various state pesticide laws. These laws primarily relate to labeling, annual registration and licensing.
Management has processes in place to facilitate and support our compliance with these requirements. However, failure to comply with these laws and regulations may result in investigations, the assessment of administrative, civil and criminal fines, damages, seizures, disgorgements, penalties or the imposition of injunctive relief. Moreover, compliance with such laws and regulations in the future could prove to be costly. Although we presently do not expect to incur any capital or other expenditures relating to regulatory matters in amounts that may be material to us, we may be required to make such expenditures in the future. These laws and regulations have changed substantially and rapidly over the last 25 years, and we anticipate that there will be continuing changes.
The clear trend in environmental, health, transportation and safety regulations is to place more restrictions and limitations on activities that impact the environment, such as the use and handling of chemicals.chemicals and the discharge of greenhouse gases. Increasingly, strict restrictions and limitations have resulted in higher operating costs for us, and it is possible that the costs of compliance with such laws and regulations will continue to increase. We will attemptOur attempts to anticipate future regulatory requirements that might be imposed and we will plan accordinglyour plans to remain in compliance with changing regulations and to minimize the costs of such compliance.compliance may not be as effective as we anticipate.
Governmental actions designed to address climate change or the failure to meet environmental social and governance (ESG) expectations or standards or achieve our ESG goals could adversely affect our business.
Concern over climate change has led to, and may in the future lead to, new or increased legal and regulatory requirements designed to reduce or mitigate the effects of climate change, which could increase our operating or capital expenses and compliance burdens. In particular, advocates of change are continuing to explore ways to reduce greenhouse gas emissions. These changes over time could affect the availability and cost of certain consumer products, commodities and energy, which in turn may impact our ability to procure certain products or services required for the operation of our business at the quantities and levels we require. The regulation of greenhouse gas emissions could result in additional taxes or other costs to us or require us to modify our facilities or vehicle fleet. Changes in customers’ attitudes toward the environmental impact of pools’ energy consumption or pool chemical products could reduce demand for our products.
We have set certain targets aimed at reducing our impact on the environment and climate change. These initiatives reflect our current plans and aspirations, and it is possible that we may not be able to achieve such targets or our desired impact, which may cause us to suffer from legal claims, reputational damage or a loss of demand for our products. Actions we take to achieve our strategy or targets could result in increased costs to our operations. Investors or other stakeholders could react negatively to our targets or other positions we take on ESG matters, which could negatively impact our relationships with such stakeholders.
Various governmental bodies in Europe and the United States, particularly in the state of California, have adopted or proposed laws or regulations increasing the obligations of companies to disclose information about their emissions and other similar data. We expect that these initiatives will increase our operating costs and expose us to additional risk.
We store chemicals, fertilizers and other combustible materials that involve fire, safety and casualty risks.
We store chemicals and fertilizers, including certain combustibles and oxidizing compounds, at our sales centers. A fire, explosion or flood affecting one of our facilities could give rise to fire, safety and casualty losses and related liability claims. We maintain what we believe is prudent insurance protection. However, we cannot guarantee that our insurance coverage will be adequate to cover future claims that may arise or that we will be able to maintain adequate insurance in the future at rates we consider reasonable. Successful claims for which we are not fully insured may adversely affect our working capital and profitability. In addition, changes in the insurance industry have generally led to higher insurance costs and decreased availability of coverage.
We conduct business internationally, which exposes us to additional risks.
Our ability to successfully conduct operations in, and source products and materials from, international markets is affected by many of the same risks we face in our U.S. operations, as well as unique costs and difficulties of managing international operations. Our international operations, including Canada and Mexico, which accounted for 9% 7% of our total net sales in 2017,2023, expose us to certain additional risks, including:
•difficulty in staffing international subsidiary operations;
•different political, economic and regulatory conditions;
•local laws and customs;
•currency fluctuations;fluctuations (including the current strength of the U.S. dollar compared to foreign currencies), exchange controls and repatriation restrictions;
•adverse tax consequences; and
dependence on•adverse consequences for violating anti-corruption, anti-competition, economic sanctions, immigration and other economies.laws governing international commerce.
For foreign-sourced products, we may be subject to certain trade restrictions that would prevent us from obtaining products and thereproducts. There is also a greater risk that we may not be able to access products in a timely and efficient manner. Fluctuations in other factors relating to international trade, such as tariffs, transportation costs and inflation are additional risks for our international operations.
We do not have operations in Israel, Russia or Ukraine. However, the contributory effects of the wars in Israel or Ukraine and prolonged geopolitical conflict globally may result in higher inflation, labor costs, energy and commodity prices and costs of materials and services (together with shortages or inconsistent availability of materials and services), which could negatively affect our business (particularly our European operations), results of operations and financial condition.
Changes in tax laws and accounting standards related to tax matters have caused, and may in the future cause, fluctuationsimport policy or trade relations, interruptions in our effective tax rate.supply chain or increased commodity or supply chain costs could adversely affect our results of operations.
TaxationLike other companies globally, we faced supply chain disruptions across our business in 2021 and tax policy changes, tax rate changes, new tax laws, revised tax law interpretations,the early part of 2022, which led to increased costs, delays and changes in accounting standards and guidance related to tax matters, may cause fluctuations in our effective tax rate. The Tax Cuts and Jobs Act (TJCA or the Act), enacted in December 2017, significantly changes U.S. tax law. Our 2017 financial results include estimates regarding the effects of the Act, which are based on our current interpretation of this legislation and on reasonable estimates and may change assome cases lost opportunities. As a result of new guidance issued by regulators orthese supply chain disruptions, our procurement and operational business functions increased planning and strategic purchasing and sourced products internationally where needed. Because we source certain products from outside the United States, major changes in tax policy, import or export regulations or trade relations, such as the disallowance of tax deductions for imported products or the imposition of additional tariffs or duties on imported products, could adversely affect our estimates. Additionally,business, results of operations, effective income tax rate, liquidity and net income.
The variability and complexity of tariffs and duties exposes us to the risk of higher costs and inadvertent noncompliance associated with our imported products. In December 2022, we recorded $13.0 million within Cost of sales related to duties and tariffs for certain imported chemicals that we determined, prior to submission of final liquidation amounts of our import duties and tariffs, that the initial code we used to classify the product may only apply to bulk purchases. To protect against potential penalties and receive clarification on the issue, we voluntarily filed a disclosure with U.S. Customs and Border Protection in the first quarter ofDecember 2022. Changes in laws, court rulings, or differences in interpretation on product classification could lead to changes in duty and tariff rates on these or other imported products.
Excess tax benefits or deficiencies recognized from our accounting for share-based awards impact our reported earnings.
In 2017, we adopted Accounting Standards Update (ASU) 2016-09, Improvements to Employee Share-Based Payment Accounting, on a prospective basis.. Our projections of financial statement impacts related to ASU 2016-09 are subject to several assumptions which can vary significantly, including our estimated share price and the period that our employees will exercise vested stock options. Excess tax benefits or deficiencies recognized under ASU 2016-09 vary from quarter to quarter and past results may not be indicative of future results.
Risks Relating to Our Indebtedness
The cost of servicing our debt could reduce our profitability if interest rates remain at elevated levels.
Our unsecured syndicated senior credit facility, term facility and receivable facility bear interest at variable rates. We have entered into interest rate swap contracts and a forward-starting interest rate swap contract to reduce our exposure to fluctuations in variable interest rates on current and future interest payments that we owe on a portion of our variable rate borrowings. Interest rates over the past two years have been substantially higher than the three years prior to 2022, which has increased our debt expense. If interest rates remain elevated or increase, the cost of servicing our variable rate debt not covered by our interest rate swaps could materially reduce our profitability and cash flows. For additional information regarding our interest rate risk, see Item 7A, “Quantitative and Qualitative Disclosures about Market Risk” of this Form 10-K.
General Risks
Changes in tax laws and accounting standards related to tax matters have caused, and may in the future cause, fluctuations in our effective tax rate.
Taxation and tax policy changes, tax rate changes, new tax laws, revised tax law interpretations and changes in accounting standards and guidance related to tax matters may cause fluctuations in or adversely affect our effective tax rate. Our effective tax rate may also be impacted by changes in the geographic mix of our earnings.
We depend on a global network of suppliers to source our products. Product qualitycannot assure you we will continue paying dividends at the current rates, or safety concerns could negatively impact our sales and expose us to legal claims.at all.
We relycannot assure you we will continue periodic dividends on manufacturersour capital stock at the current rates, or at all. Any quarterly dividends on our common stock will be paid from funds legally available for such purpose when, and if, declared by our Board of Directors. Decisions on whether, when and in which amounts to continue making any future dividend distributions will remain at all times entirely at the discretion of our Board of Directors, which reserves the right to change or terminate our dividend practices at any time and for any reason without prior notice. Holders of our common stock should be aware they have no contractual or other supplierslegal right to receive dividends.
Similarly, holders of our common stock should be aware that repurchases of our common stock under any repurchase plan then in effect are completely discretionary and may be suspended or discontinued at any time for any reason regardless of our financial position.
Lapses in our disclosure controls and procedures or internal control over financial reporting could materially and adversely affect us.
We maintain disclosure controls and procedures designed to provide us withreasonable assurances regarding the products we sellaccuracy and distribute. As we increase the number of Pool Corporation and PSL branded products we distribute, our exposure to potential liability claims may increase. The risk of claims may also be greater with respect to products manufactured by third-party suppliers outside the United States, particularly in China. Uncertainties with respect to foreign legal systems may adversely affect us in resolving claims arising from our foreign sourced products. Even if we are successful in defending any claim relating to the products we distribute, claims of this nature could negatively impact customer confidence in our products and our company.
We rely on information technology systems to support our business operations. Any disturbance or breachcompleteness of our technological infrastructure could adversely affectSEC reports and internal control over financial reporting designed to provide reasonable assurance regarding the reliability and compliance with U.S. generally accepted accounting principles (GAAP) of our financial condition and results of operations. Additionally, failure to maintain the security of confidential information could damage our reputation and expose us to litigation.statements. We cannot assure you these measures will be effective.
Information technology supports several aspects of our business,including among others, product sourcing, pricing, customer service, transaction processing, financial reporting, collections and cost management. Our ability to operate effectively on a day‑to‑day basis and accurately report our results depends on a solid technological infrastructure, which is inherently susceptible to internal and external threats. We are vulnerable to interruption by fire, natural disaster, power loss, telecommunication failures, internet failures, security breaches and other catastrophic events. Exposure to various types of cyber-attacks such as malware, computer viruses, worms, or other malicious acts, as well as human error, could also potentially disrupt our operations or result in a significant interruption in the delivery of our goods and services. Advances in computer and software capabilities, encryption technology and other discoveries increase the complexity of our technological environment, including how each interact with our various software platforms, and may delay or hinder our ability to process transactions and compromise the integrity of our data, which could result in a material adverse impact on our financial condition and results of operations.
We have designed numerous procedures and protocols to mitigate cybersecurity risks. We continually invest in information technology security and update our business continuity plan. In the event a cybersecurity threat occurs, we have processes in place to timely notify the appropriate personnel for assessment and resolution. We also continue to expand our company-wide training programs as part of our efforts to prevent such attacks. However, the failure to maintain security over and prevent unauthorized access to our data, our customers’ personal information, including credit card information, or data belonging to our suppliers, could put us at a competitive disadvantage. Such a breach could result in damage to our reputation and subject us to potential litigation, liability, fines and penalties, resulting in a possible material adverse impact on our financial condition and results of operations.
A terrorist attack or the threat of a terrorist attack could have a material adverse effect on our business.
Discretionary spending on leisure product offerings such as ours is generally adversely affected during times of economic or political uncertainty. The potential for terrorist attacks, the national and international responses to terrorist attacks, and other acts of war or hostility could create these types of uncertainties and negatively impact our business for the short or long term in ways that cannot presently be predicted.
Item 1B. Unresolved Staff Comments
None.
Item 1C. Cybersecurity
Risk Management and Strategy
Our cybersecurity program, which is primarily documented in our business interruption and incident response policy, is designed to assess, identify and manage material risks from cybersecurity threats, and is a component of our overall enterprise risk program. We deploy multiple strategies and dedicate significant resources toward systems designed to identify, assess, manage, mitigate and respond to cybersecurity threats. We also consistently strive to improve the detection and response capabilities of our cybersecurity program. To do this, we monitor best practices across the cybersecurity space and endeavor to incorporate those in our own cybersecurity program.
Our cybersecurity policies and procedures include the controls and technology we use to identify, assess and respond to cybersecurity threats and incidents. These policies and procedures also focus on identifying vulnerabilities in our internal and external environments and remediating those vulnerabilities. To combat cybersecurity risk, we focus on proactive procedures such as patch management and quarterly cybersecurity training of our employees. In an effort to mitigate cyber risks for customer-facing software, we incorporate the protocols described above along with software specific programs such as a bug bounty system and partnerships with external experts.
We evaluate our controls and response protocols at least twice a year using external third-party assessors and consultants in both advisory and adversarial engagements. These third-party experts are familiar with our systems and could be retained in the event of a significant incident to assist us in evaluating and responding to such an incident. We incorporate the lessons learned from these engagements into our cybersecurity program. Our cybersecurity program also includes controls to manage risks associated with our use of third-party service providers; however, we cannot ensure in all circumstances that their defensive efforts will be successful.
Like most large organizations, we face constant and dynamic risks related to cybersecurity. In recent years we have faced, and expect to continue to face, various attempted cyber-attacks of increasing sophistication. To date, we are not aware of any cybersecurity incident or threat that materially impacted or could reasonably be anticipated to materially affect our business, results of operations or financial condition. However, we cannot guarantee that we will not experience such an incident in the future. For a further description of these risks, see “Risk Factors – Risks Relating to Technology, Cybersecurity and Data Privacy,” included in Item 1A of this Form 10-K, which should be read in conjunction with this Item 1C.
Governance
Our Board of Directors (Board) is responsible for oversight of our risk management programs and assisting management in addressing specific risks, including cybersecurity risks. The Audit Committee assists our Board in reviewing cybersecurity and other information technology risks, controls and procedures, including our plans to mitigate cybersecurity risks and to respond to data breaches. The Audit Committee also helps in reviewing with management any specific cybersecurity issues that could have a material impact on us. Our Chief Information Officer (CIO) provides the Board with updates on cybersecurity risks at regularly scheduled board meetings at least twice a year. These updates include the results of any third-party reviews and related remediation items.
Primary responsibility for assessing, monitoring and managing our cybersecurity risks rests with our CIO who has held that role since 2019 and has been employed by the company since 2004. With almost 20 years of experience in cybersecurity, our CIO has extensive cybersecurity expertise and in-depth knowledge and experience instrumental in developing and executing our cybersecurity strategies. Our CIO oversees our cyber governance programs, evaluates our compliance with applicable standards and remediates known risks. Our CIO also oversees our internal phishing tests, leads our employee cyber training program and seeks to promote company-wide awareness of cybersecurity risk through broad-based communications and educational initiatives.
At the day-to-day operational level, our CIO manages an information security team tasked with executing our cybersecurity program. This team includes a director of network security, technical director of enterprise architecture, system architects and network security staff. Members of our information technology (IT) management group, led by our CIO, have extensive years of combined experience in defending large, complex corporate environments. Our CIO, IT management group, architects and network security team members receive briefings and annual training on cybersecurity threats and response methods that provide real world threat scenarios to measure the effectiveness of our programs and technologies in protecting our systems. Our team of professionals also monitors our compliance with laws governing privacy rights, data protection and cybersecurity.
Our incident response policy outlines our protocols for assessing, managing and responding to cyber incidents. This policy guides the response of our global IT team, which, depending on the significance of the incident, includes activating response plans from third-party partners, escalating the issue to executive management, notifying one or more members of our Board, maintaining communication with users and notifying law enforcement and other agencies if warranted. We may also receive assistance from a third-party security operations center (SOC) and other industry-leading third-party providers.
Item 2. Properties
We lease the Pool Corporation corporate offices, which consist of approximately 59,10060,000 square feet of office space in Covington, Louisiana, from an entity in which we have a 50% ownership interest. We own twofifteen sales center facilities, which includes six sales center facilities in Florida, three in Texas, two in Texas, one in CaliforniaAlabama, and one in Georgia. each of California, Georgia, Mississippi and Tennessee.
As part of our acquisition of Porpoise Pool & Patio, Inc. in December 2021, we own the corporate headquarters, which consist of approximately 46,000 square feet, and the Sun Wholesale Supply facilities located in Florida, which consist of approximately 209,000 square feet. As part of this acquisition, we also acquired a chemical re-packaging plant in Florida, which is approximately 105,000 square feet.
We lease all of our other properties, and the majority of our leases have three to seven year terms. As of December 31, 2017,2023, we had 15twenty-two leases with remaining terms longer than seven years that expire between 20252031 and 2032.
2036. Most of our leases contain renewal options, some of which involve rent increases. In addition to minimum rental payments, which are set at competitive rates, certain leases require reimbursement for taxes, maintenance and insurance. We do not believe that any single lease is material to our operations.
Our sales centers range in size from approximately 2,000 square feet to 60,00095,000 square feet and generally consist of warehouse, counter, display and office space. Our centralized shipping locations (CSLs) range in size from approximately 103,000115,000 square feet to 185,000 square feet.
We believe that our facilities are well maintained, suitable for our business and occupy sufficient space to meet our operating needs. As part of our normal business, we regularly evaluate sales center performance and site suitability and may relocate a sales center or consolidate twomultiple locations if a sales center is redundant in a market, underperforming or otherwise deemed unsuitable. We do not believe that any single lease is material to our operations.
The table below summarizes the changes in our sales centers during the year ended December 31, 2017:2023:
| | | | | | | | | | | | | | | | | | | | | | | | | | | | | | | | |
| Network | | 12/31/22 | | New
Locations | | Closed Location | | Acquired
Location | | 12/31/23 |
SCP (1) | | 196 | | | 7 | | | — | | | 2 | | | 205 | |
| Superior | | 73 | | | 1 | | | — | | | — | | | 74 | |
| Horizon | | 88 | | | 2 | | | — | | | 2 | | | 92 | |
NPT (2) | | 19 | | | 2 | | | — | | | — | | | 21 | |
| Total Domestic | | 376 | | | 12 | | | — | | | 4 | | | 392 | |
| SCP International | | 44 | | | 2 | | | — | | | 1 | | | 47 | |
| Total | | 420 | | | 14 | | | — | | | 5 | | | 439 | |
(1)Total includes one distribution location for Sun Wholesale Supply, which we acquired in December 2021. As part of the acquisition, we also acquired non-sales center properties including a chemical re-packaging plant and three Pinch A Penny, Inc. retail stores in Florida.
(2)In addition to the stand-alone NPT sales centers, there are over 100 SCP and Superior locations that have consumer showrooms and serve as stocking locations that feature NPT brand tile and composite finish products.
|
| | | | | | | | | | | | | | | |
| Network | | 12/31/16 | | New Locations | | Consolidated Locations (2) | | Acquired Locations | | 12/31/17 |
| SCP | | 162 |
| | 1 |
| | — |
| | 4 |
| | 167 |
|
| Superior | | 65 |
| | — |
| | — |
| | 2 |
| | 67 |
|
| Horizon | | 66 |
| | — |
| | (1 | ) | | — |
| | 65 |
|
NPT (1) | | 17 |
| | — |
| | (1 | ) | | — |
| | 16 |
|
| Total Domestic | | 310 |
| | 1 |
| | (2 | ) | | 6 |
| | 315 |
|
| SCP International | | 34 |
| | — |
| | (1 | ) | | 3 |
| | 36 |
|
| Total | | 344 |
| | 1 |
| | (3 | ) | | 9 |
| | 351 |
|
| |
(1)
| In addition to the stand-alone NPT sales centers, there are over 80 SCP and Superior locations that have consumer showrooms and serve as stocking locations that feature NPT brand tile and composite finish products. |
| |
(2)
| Consolidated sales centers are those locations where we expect to transfer the majority of the existing business to our nearby sales center locations. |
The tabletables below identifiesidentify the number of sales centers in each state, territory or country by distribution network as of December 31, 2017:2023:
| | | | | | | | | | | | | | | | | | | | | | | | | | | | | | | | |
| Location | | SCP | | Superior | | Horizon | | NPT | | Total |
| United States | | | | | | | | | | |
| California | | 29 | | | 25 | | | 19 | | | 6 | | | 79 | |
| Florida | | 41 | | | 5 | | | 17 | | | 1 | | | 64 | |
| Texas | | 27 | | | 5 | | | 22 | | | 5 | | | 59 | |
| Arizona | | 8 | | | 8 | | | 11 | | | 3 | | | 30 | |
| Washington | | 3 | | | — | | | 8 | | | — | | | 11 | |
| Georgia | | 7 | | | 2 | | | — | | | 1 | | | 10 | |
| North Carolina | | 5 | | | 2 | | | 2 | | | 1 | | | 10 | |
| Tennessee | | 6 | | | 4 | | | — | | | — | | | 10 | |
| Nevada | | 2 | | | 3 | | | 3 | | | 1 | | | 9 | |
| New York | | 9 | | | — | | | — | | | — | | | 9 | |
| Alabama | | 5 | | | 2 | | | — | | | — | | | 7 | |
| New Jersey | | 5 | | | 2 | | | — | | | — | | | 7 | |
| Pennsylvania | | 5 | | | 1 | | | — | | | 1 | | | 7 | |
| Virginia | | 3 | | | 1 | | | 3 | | | — | | | 7 | |
| Louisiana | | 5 | | | — | | | — | | | 1 | | | 6 | |
| Illinois | | 4 | | | 1 | | | — | | | — | | | 5 | |
| Indiana | | 2 | | | 3 | | | — | | | — | | | 5 | |
| Oregon | | 1 | | | — | | | 4 | | | — | | | 5 | |
| South Carolina | | 4 | | | 1 | | | — | | | — | | | 5 | |
| Colorado | | 1 | | | 2 | | | 1 | | | — | | | 4 | |
| Missouri | | 3 | | | 1 | | | — | | | — | | | 4 | |
| Ohio | | 2 | | | 2 | | | — | | | — | | | 4 | |
| Oklahoma | | 2 | | | 1 | | | — | | | 1 | | | 4 | |
| Arkansas | | 3 | | | — | | | — | | | — | | | 3 | |
| Idaho | | 1 | | | — | | | 2 | | | — | | | 3 | |
| Massachusetts | | 3 | | | — | | | — | | | — | | | 3 | |
| Connecticut | | 2 | | | — | | | — | | | — | | | 2 | |
| Kansas | | 2 | | | — | | | — | | | — | | | 2 | |
| Michigan | | 2 | | | — | | | — | | | — | | | 2 | |
| Minnesota | | 1 | | | 1 | | | — | | | — | | | 2 | |
| Mississippi | | 2 | | | — | | | — | | | — | | | 2 | |
| Wisconsin | | 1 | | | 1 | | | — | | | — | | | 2 | |
| Hawaii | | 1 | | | — | | | — | | | — | | | 1 | |
| Iowa | | 1 | | | — | | | — | | | — | | | 1 | |
| Kentucky | | — | | | 1 | | | — | | | — | | | 1 | |
| Maryland | | 1 | | | — | | | — | | | — | | | 1 | |
| Nebraska | | 1 | | | — | | | — | | | — | | | 1 | |
| New Mexico | | 1 | | | — | | | — | | | — | | | 1 | |
| North Dakota | | 1 | | — | | — | | — | | 1 | |
| Puerto Rico | | 1 | | | — | | | — | | | — | | | 1 | |
| Utah | | 1 | | | — | | | — | | | — | | | 1 | |
| West Virginia | | 1 | | | — | | | — | | | — | | | 1 | |
| Total United States | | 205 | | | 74 | | | 92 | | | 21 | | | 392 | |
|
| | | | | | | | | | | | | | | |
| Location | | SCP | | Superior | | Horizon | | NPT | | Total |
| United States | | | | | | | | | | |
| California | | 29 |
| | 23 |
| | 17 |
| | 6 |
| | 75 |
|
| Texas | | 21 |
| | 5 |
| | 17 |
| | 5 |
| | 48 |
|
| Florida | | 33 |
| | 6 |
| | 4 |
| | 1 |
| | 44 |
|
| Arizona | | 6 |
| | 6 |
| | 10 |
| | 2 |
| | 24 |
|
| Georgia | | 6 |
| | 2 |
| | — |
| | 1 |
| | 9 |
|
| Nevada | | 2 |
| | 3 |
| | 3 |
| | — |
| | 8 |
|
| Tennessee | | 5 |
| | 3 |
| | — |
| | — |
| | 8 |
|
| Washington | | 1 |
| | — |
| | 6 |
| | — |
| | 7 |
|
| Alabama | | 4 |
| | 2 |
| | — |
| | — |
| | 6 |
|
| New York | | 6 |
| | — |
| | — |
| | — |
| | 6 |
|
| Louisiana | | 5 |
| | — |
| | — |
| | — |
| | 5 |
|
| New Jersey | | 3 |
| | 2 |
| | — |
| | — |
| | 5 |
|
| Pennsylvania | | 3 |
| | 1 |
| | — |
| | 1 |
| | 5 |
|
| Colorado | | 1 |
| | 1 |
| | 2 |
| | — |
| | 4 |
|
| Illinois | | 3 |
| | 1 |
| | — |
| | — |
| | 4 |
|
| Indiana | | 2 |
| | 2 |
| | — |
| | — |
| | 4 |
|
| Missouri | | 3 |
| | 1 |
| | — |
| | — |
| | 4 |
|
| North Carolina | | 3 |
| | 1 |
| | — |
| | — |
| | 4 |
|
| Ohio | | 2 |
| | 2 |
| | — |
| | — |
| | 4 |
|
| Oregon | | 1 |
| | — |
| | 3 |
| | — |
| | 4 |
|
| South Carolina | | 3 |
| | 1 |
| | — |
| | — |
| | 4 |
|
| Idaho | | 1 |
| | — |
| | 2 |
| | — |
| | 3 |
|
| Oklahoma | | 2 |
| | 1 |
| | — |
| | — |
| | 3 |
|
| Virginia | | 2 |
| | 1 |
| | — |
| | — |
| | 3 |
|
| Arkansas | | 2 |
| | — |
| | — |
| | — |
| | 2 |
|
| Connecticut | | 2 |
| | — |
| | — |
| | — |
| | 2 |
|
| Kansas | | 2 |
| | — |
| | — |
| | — |
| | 2 |
|
| Maryland | | 1 |
| | — |
| | 1 |
| | — |
| | 2 |
|
| Massachusetts | | 2 |
| | — |
| | — |
| | — |
| | 2 |
|
| Michigan | | 2 |
| | — |
| | — |
| | — |
| | 2 |
|
| Minnesota | | 1 |
| | 1 |
| | — |
| | — |
| | 2 |
|
| Mississippi | | 2 |
| | — |
| | — |
| | — |
| | 2 |
|
| Hawaii | | 1 |
| | — |
| | — |
| | — |
| | 1 |
|
| Iowa | | 1 |
| | — |
| | — |
| | — |
| | 1 |
|
| Kentucky | | — |
| | 1 |
| | — |
| | — |
| | 1 |
|
| Nebraska | | 1 |
| | — |
| | — |
| | — |
| | 1 |
|
| New Mexico | | 1 |
| | — |
| | — |
| | — |
| | 1 |
|
| Puerto Rico | | 1 |
| | — |
| | — |
| | — |
| | 1 |
|
| Utah | | 1 |
| | — |
| | — |
| | — |
| | 1 |
|
| Wisconsin | | — |
| | 1 |
| | — |
| | — |
| | 1 |
|
| Total United States | | 167 |
| | 67 |
| | 65 |
| | 16 |
| | 315 |
|
| International | | | | | | | | | | |
| Canada | | 13 |
| | — |
| | — |
| | — |
| | 13 |
|
| France | | 5 |
| | — |
| | — |
| | — |
| | 5 |
|
| Australia | | 5 |
| | — |
| | — |
| | — |
| | 5 |
|
| Mexico | | 3 |
| | — |
| | — |
| | — |
| | 3 |
|
| Portugal | | 2 |
| | — |
| | — |
| | — |
| | 2 |
|
| Spain | | 2 |
| | — |
| | — |
| | — |
| | 2 |
|
| Belgium | | 1 |
| | — |
| | — |
| | — |
| | 1 |
|
| Colombia | | 1 |
| | — |
| | — |
| | — |
| | 1 |
|
| Croatia | | 1 |
| | — |
| | — |
| | — |
| | 1 |
|
| Germany | | 1 |
| | — |
| | — |
| | — |
| | 1 |
|
| Italy | | 1 |
| | — |
| | — |
| | — |
| | 1 |
|
| United Kingdom | | 1 |
| | — |
| | — |
| | — |
| | 1 |
|
| Total International | | 36 |
| | — |
| | — |
| | — |
| | 36 |
|
| Total | | 203 |
| | 67 |
| | 65 |
| | 16 |
| | 351 |
|
| | | | | | | | | | | | | | | | | | | | | | | | | | | | | | | | |
| Location | | SCP | | Superior | | Horizon | | NPT | | Total |
| International | | | | | | | | | | |
| Canada | | 17 | | | — | | | — | | | — | | | 17 | |
| France | | 8 | | | — | | | — | | | — | | | 8 | |
| Australia | | 6 | | | — | | | — | | | — | | | 6 | |
| Mexico | | 5 | | | — | | | — | | | — | | | 5 | |
| Portugal | | 3 | | | — | | | — | | | — | | | 3 | |
| Italy | | 2 | | | — | | | — | | | — | | | 2 | |
| Spain | | 2 | | | — | | | — | | | — | | | 2 | |
| Belgium | | 1 | | | — | | | — | | | — | | | 1 | |
| Croatia | | 1 | | | — | | | — | | | — | | | 1 | |
| Germany | | 1 | | | — | | | — | | | — | | | 1 | |
| United Kingdom | | 1 | | | — | | | — | | | — | | | 1 | |
| Total International | | 47 | | | — | | | — | | | — | | | 47 | |
| Total | | 252 | | | 74 | | | 92 | | | 21 | | | 439 | |
Item 3. Legal Proceedings
From time to time, we are subject to various claims and litigation arising in the ordinary course of business, including product liability, personal injury, commercial, contract and employment matters. While the outcome of any litigation is inherently unpredictable, based on currently available facts, we do not believe that the ultimate resolution of any of these matters will have a material adverse impact on our financial condition, results of operations or cash flows.
Item 4. Mine Safety Disclosures
Not applicable.
PART II.
Item 5. Market for Registrant’s Common Equity, Related Stockholder Matters and Issuer Purchases of Equity Securities
Common Stock
Our common stock is traded on the NASDAQNasdaq Global Select Market under the trading symbol “POOL.” On February 21, 2018,20, 2024, there were approximately 64,696782 holders of record of our common stock. The table below sets forth the high stock and low closing sales pricesa significantly larger number of beneficial holders of our common stock as well as dividends declared per common share for each quarter during the last two fiscal years.stock.
|
| | | | | | | | | | | | |
| | | High | | Low | | Dividends Declared |
| Fiscal 2017 | | | | | | |
| First Quarter | | $ | 120.95 |
| | $ | 103.93 |
| | $ | 0.31 |
|
| Second Quarter | | 123.76 |
| | 116.43 |
| | 0.37 |
|
| Third Quarter | | 121.07 |
| | 97.30 |
| | 0.37 |
|
| Fourth Quarter | | 131.17 |
| | 110.26 |
| | 0.37 |
|
| | | | | | | |
| Fiscal 2016 | | | | | | |
| First Quarter | | $ | 87.96 |
| | $ | 74.37 |
| | $ | 0.26 |
|
| Second Quarter | | 94.03 |
| | 86.68 |
| | 0.31 |
|
| Third Quarter | | 102.51 |
| | 93.02 |
| | 0.31 |
|
| Fourth Quarter | | 107.49 |
| | 90.59 |
| | 0.31 |
|
We initiated quarterly dividend payments to our shareholders in the second quarter of 2004 and we have continued payments in each subsequent quarter. Our Board of Directors (our Board) has increased the dividend amount twelveeighteen times, including in the fourth quarter of 2004, annually in the second quarters of 2005 through 2008 and in the second quarters of 2011 through 2017. Future dividend payments will be2023. Our Board may declare future dividends at theits discretion, of our Board, after considering various factors, including our earnings, capital requirements, financial position, contractual restrictions and other relevant business considerations. For a description of restrictions on dividends in our Credit Facility, Term Facility and Receivables Facility, see Note 5 of “Notes to Consolidated Financial Statements,” included in Item 8 of this Form 10-K. We cannot assure shareholders or potential investors that dividends will be declared or paid any time in the future if our Board determines that there is a better use of our funds.future.
Stock Performance Graph
The information included under the caption “Stock Performance Graph” in this Item 5 of this Annual Report on Form 10-K is not deemed to be “soliciting material” or to be “filed” with the SEC or subject to Regulation 14A or 14C under the Securities Exchange Act of 1934 (the 1934 Act) or to the liabilities of Section 18 of the 1934 Act, and will not be deemed to be incorporated by reference into any filing under the Securities Act of 1933 or the 1934 Act, except to the extent we specifically incorporate it by reference into such a filing.
The following graph compares the cumulative total stockholdershareholder return on our common stock for the last five fiscal years with the total return on the S&P MidCap 400500 Index (of which we have been a member since 2020) and the NASDAQNasdaq Index for the same period, in each case assuming the investment of $100$100 on December 31, 20122018 and the reinvestment of all dividends. We believe the S&P MidCap 400500 Index includesis comprised of similar-sized public companies with market capitalizations comparable to ours.that represent the most likely alternative investments for investors. Additionally, we chose the S&P MidCap 400500 Index for comparison, as opposed to an industry index, because we do not believe that we can reasonably identify a peer group or a published industry or line-of-business index that contains a sufficient number of companies in a similar line of business.


| | | | | Base Period | | Indexed Returns Years Ending |
| | Base
Period | | | | Base
Period | | Indexed Returns
Years Ending |
| Company / Index | | 12/31/12 | | 12/31/13 | | 12/31/14 | | 12/31/15 | | 12/31/16 | | 12/31/17 | Company / Index | | 12/31/18 | | 12/31/19 | | 12/31/20 | | 12/31/21 | | 12/31/22 | | 12/31/23 |
| Pool Corporation | | $ | 100.00 |
| | $ | 139.32 |
| | $ | 154.24 |
| | $ | 199.16 |
| | $ | 260.48 |
| | $ | 327.68 |
|
| S&P MidCap 400 Index | | 100.00 |
| | 133.50 |
| | 146.54 |
| | 143.35 |
| | 173.08 |
| | 201.20 |
|
| NASDAQ Index | | 100.00 |
| | 140.12 |
| | 160.78 |
| | 171.97 |
| | 187.22 |
| | 242.71 |
|
| S&P 500 Index | |
| | Nasdaq Index | |
| Nasdaq Index | |
| Nasdaq Index | |
Issuer Purchases of Equity Securities
The table below summarizes the repurchases of our common stock in the fourth quarter of 2017:2023:
| | | | | | | | | | | | | | | | | | | | | | | | | | |
| Period | | Total Number of Shares Purchased (1) | | Average
Price
Paid per
Share | | Total Number of Shares Purchased as Part of Publicly Announced Plan (2) | | Maximum Approximate Dollar Value of Shares That May Yet be Purchased Under the Plan (2) |
| October 1 – October 31, 2023 | | 25,549 | | | $ | 314.68 | | | 25,420 | | | $ | 455,321,054 | |
| November 1 – November 30, 2023 | | 91,355 | | | $ | 326.90 | | | 91,355 | | | $ | 425,457,224 | |
| December 1 – December 31, 2023 | | 216,354 | | | $ | 375.99 | | | 216,354 | | | $ | 344,111,238 | |
| Total | | 333,258 | | | $ | 357.83 | | | 333,129 | | | |
|
| | | | | | | | | | | | | | |
| Period | | Total Number of Shares Purchased (1) | | Average Price Paid per Share | | Total Number of Shares Purchased as Part of Publicly Announced Plan (2) | | Maximum Approximate Dollar Value of Shares That May Yet be Purchased Under the Plan (3) |
| October 1 – October 31, 2017 | | 40,888 |
| | $ | 108.20 |
| | 40,888 |
| | $ | 53,361,113 |
|
| November 1 – November 30, 2017 | | — |
| | $ | — |
| | — |
| | $ | 53,361,113 |
|
| December 1 – December 31, 2017 | | — |
| | $ | — |
| | — |
| | $ | 53,361,113 |
|
| Total | | 40,888 |
| | $ | 108.20 |
| | 40,888 |
| | |
|
| |
(1)
| These shares may include shares of our common stock surrendered to us by employees in order to satisfy minimum tax withholding obligations in connection with certain exercises of employee stock options or lapses upon vesting of restrictions on previously restricted share awards, and/or to cover the exercise price of such options granted under our share-based compensation plans. There were no shares surrendered for this purpose in the fourth quarter of 2017. |
| |
(2)
| In May 2017, our Board authorized an additional $150.0 million under our share repurchase program for the repurchase of shares of our common stock in the open market at prevailing market prices or in privately negotiated transactions. |
| |
(3)
| As of February 21, 2018, our total authorization remaining was $53.4 million. |
(2)In May 2023, our Board authorized an additional $413.6 million under our share repurchase program for the repurchase of shares of our common stock in the open market at prevailing market prices bringing the total authorization available under the program to $600.0 million. As of February 20, 2024, $344.1 million of the authorized amount remained available for use under our current share repurchase program.
Unregistered Sales of Equity Securities
There were no unregistered sales of equity securities during the three months ended December 31, 2023.
Item 6. Selected Financial Data[RESERVED]
The table below sets forth selected financial data from the Consolidated Financial Statements. You should read this information in conjunction with the discussions in Item 7 of this Form 10-K and with the Consolidated Financial Statements and accompanying Notes in Item 8 of this Form 10-K.Not applicable.
|
| | | | | | | | | | | | | | | | | | | | |
| (in thousands, except per share data) | | Year Ended December 31, |
| | | 2017 (1) | | 2016 | | 2015 | | 2014 | | 2013 |
| Statement of Income Data | | | | | | | | | | |
| Net sales | | $ | 2,788,188 |
| | $ | 2,570,803 |
| | $ | 2,363,139 |
| | $ | 2,246,562 |
| | $ | 2,079,700 |
|
| Operating income | | 284,371 |
| | 255,859 |
| | 216,222 |
| | 188,870 |
| | 165,486 |
|
| Net income | | 191,339 |
| | 148,603 |
| | 128,224 |
| | 111,030 |
| | 97,330 |
|
| Net income attributable to Pool Corporation | | 191,633 |
| | 148,955 |
| | 128,275 |
| | 110,692 |
| | 97,330 |
|
| Earnings per share: | | | | | | |
| | |
| | |
|
| Basic | | $ | 4.69 |
| | $ | 3.56 |
| | $ | 2.98 |
| | $ | 2.50 |
| | $ | 2.10 |
|
| Diluted | | $ | 4.51 |
| | $ | 3.47 |
| | $ | 2.90 |
| | $ | 2.44 |
| | $ | 2.05 |
|
| Cash dividends declared per common share | | $ | 1.42 |
| | $ | 1.19 |
| | $ | 1.00 |
| | $ | 0.85 |
| | $ | 0.73 |
|
| | | | | | | | | | | |
| Balance Sheet Data | | | | |
| | |
| | |
| | |
|
| Working capital | | $ | 460,682 |
| | $ | 399,337 |
| | $ | 356,899 |
| | $ | 345,305 |
| | $ | 313,843 |
|
Total assets (3) | | 1,101,062 |
| | 994,095 |
| | 934,361 |
| | 890,971 |
| | 821,647 |
|
Total debt (3) | | 519,650 |
| | 438,042 |
| | 328,045 |
| | 318,872 |
| | 244,304 |
|
| Stockholders’ equity | | 223,146 |
| | 205,210 |
| | 255,743 |
| | 244,352 |
| | 286,182 |
|
| | | | | | | | | | | |
| Other | | | | | | |
| | |
| | |
|
Base business sales growth (2) | | 7 | % | | 7 | % | | 5 | % | | 7 | % | | 6 | % |
| Number of sales centers | | 351 |
| | 344 |
| | 336 |
| | 328 | | 321 |
|
| |
(1)
| Our Net income and Net income attributable to Pool Corporation in 2017 was impacted by both U.S. tax reform and Accounting Standards Update (ASU) 2016-09, Improvements to Employee Share-Based Payment Accounting. In the first quarter of 2017, we adopted ASU 2016-09, which requires us to recognize all excess tax benefits or deficiencies related to share-based compensation as a component of our income tax provision on our Consolidated Statements of Income, rather than a component of stockholders’ equity on our Consolidated Balance Sheets. This adoption benefited our Net income and Net income attributable to Pool Corporation $12.6 million in 2017. As a result of U.S. tax reform, we recorded a provisional tax benefit of $12.0 million in the fourth quarter of 2017, which primarily reflects re‑measurement of our net deferred tax liability. No such tax benefits were applicable in prior years.
|
| |
(2)
| For a discussion regarding our calculation of base business sales, see Item 7, “Management’s Discussion and Analysis of Financial Condition and Results of Operations - RESULTS OF OPERATIONS,” of this Form 10-K. |
| |
(3)
| Upon adoption of Accounting Standards Update 2015-03, Interest - Imputation of Interest (Subtopic 835-30) - Simplifying the Presentation of Debt Issuance Costs, we now include financing costs, net of accumulated amortization as a component of long-term debt. For comparability across all periods presented on our Consolidated Balance Sheets, we reclassified certain amounts from Other assets, net in prior periods to Long-term debt, net to conform to our 2017 and 2016 presentation.
|
Item 7. Management’s Discussion and Analysis of Financial Condition and Results of Operations
For a discussion of our base business calculations, see the RESULTS OF OPERATIONS section below.
20172023 FINANCIAL OVERVIEW
Financial Results
We generated strongFollowing a period of significant growth over the prior three years, net sales decreased 10% to $5.5 billion in 2023 compared to $6.2 billion in 2022, resulting in a compound annual growth rate (CAGR) of 15% from 2019 to 2023. Base business results approximated consolidated results for 2023. Our net sales benefited approximately 3% to 4% from inflationary product cost increases in 2017, on top2023 versus a benefit of excellent performance10% in 2022. Unfavorable weather conditions in certain markets throughout the first half of the year resulted in a slow start to the swimming pool season and favorable weather last year. We producedslower maintenance activity than anticipated, limiting sales growthin the first and second quarters. Our results were also impacted by lower volumes of 8% in 2017 on top of sales growth of 9% in 2016 and converted this into solid earnings growth, primarilydiscretionary pool products sold due to executing our strategies in pursuit of our mission every day.reduced pool construction activity and discretionary replacement activity.
Net sales increased 8% for the year ended December 31, 2017 compared to 2016. Pool remodeling, equipment replacement and the expansion of building materials and commercial products were the major contributors to base business sales growth of 7% for the year. Gross profit was $1.7 billion in 2023, a 14% decrease from gross profit of $1.9 billion in 2022. Our gross profit increased 9% for the year ended December 31, 2017 comparedat a 16% CAGR from 2019 to 2016.2023. Gross profit as a percentage of net sales (gross margin) grew 10margin declined 130 basis points to 28.9% for 201730.0% in 2023 compared to 28.8%31.3% in 2016.2022. Our 2023 gross margin is in line with our longer-term annual gross margin outlook, while our prior year gross margin benefited from higher levels of inflation and price increases.
Selling and administrative expenses (operating expenses) increased 7% compared0.6%, or $5.8 million, to 2016, with base business operating expenses up 5% over last year. The increase$913.5 million in base business operating expenses was primarily due to higher growth-driven labor and freight expenses, as well as greater employee benefit costs, equity-based compensation, and technology spending.2023. As a percentage of net sales, operating expenses declined 20increased 180 basis points.points to 16.5% in 2023 compared to 14.7% in 2022. During 2023, volume-driven expenses were managed in line with lower sales, and our largest expense growth drivers related to inflationary wage increases, rent and facility costs and insurance and healthcare-related costs.
Operating income for the year decreased 27% to $746.6 million, down from $1.0 billion in 2022. Our operating income increased 11%at a 22% CAGR from 2019 to $284.4 million, up from $255.9 million2023. Operating margin decreased 310 basis points to 13.5% in 2016. Operating income as a percentage of net sales (operating margin) increased to 10.2% in 20172023 compared to 10.0%16.6% in 2016.2022.
Our provisionInterest and other non-operating expenses, net for income taxes for 2017 was impacted by both U.S.the year increased $17.5 million compared to 2022, as higher average interest rates more than offset a decrease in average debt.
We recorded a $6.7 million, or $0.17 per diluted share, tax reform andbenefit from Accounting Standards Update (ASU) 2016-09, Improvements to Employee Share-Based Payment Accounting,. As a result of the recently enacted tax legislation, we recorded a provisional tax benefit of $12.0 million in the fourth quarter of 2017, which primarily reflects the re-measurement of our net deferred tax liability. In addition to the impact from tax reform, we recorded a $12.6 million benefit in our provision for income taxes for the year ended December 31, 2017 related2023 compared to ASU 2016-09, which positively impacted our net income and earnings per share, but was partially offset by an increase of approximately 550,000 diluted weighted average shares outstanding. The combination of botha tax reform and ASU 2016-09 resulted in a total net benefit of $0.52 to our$10.8 million, or $0.27 per diluted earnings per share, realized in 2017.2022.
Net income attributabledeclined 30% to Pool Corporation increased 29%$523.2 million in 2023 compared to 2016, while earnings$748.5 million in 2022. Earnings per share was up 30%decreased 29% to $4.51 per diluted share. Excluding the $0.28$13.35 per diluted share impactcompared to a record of tax reform and the $0.24$18.70 per diluted share in 2022. Without the impact offrom ASU 2016-09 dilutedin both periods, earnings per diluted share decreased 28% to $13.18 per diluted share compared to $18.43 per diluted share in 2022. From 2019 to 2023, our earnings per diluted share increased 15% over last year.by a 20% CAGR and a 23% CAGR without the impact from ASU 2016-19. See RESULTS OF OPERATIONS below for definitions of our non-GAAP measures and reconciliations of our non-GAAP measures to GAAP measures.
Financial Position and Liquidity
Cash provided by operations was $175.3$888.2 million in 2017. Combined with $82.1 million in net proceeds from borrowings, cash from operating activities helped fund2023, which funded the following initiatives:
•a $333.5 million debt reduction
•share repurchases, intotaling $306.4 million for the open market of $143.2 million;year;
•quarterly cash dividend payments to shareholders, totaling $58.0$167.5 million for the year; and
growth in net working capital of $49.9 million;
•net capital expenditures and acquisitions of $39.4 million; and$71.6 million.
payments of $12.8 million for acquisitions.
Total net receivables, including pledged receivables, increased 18%decreased 2% compared to December 31, 2016, reflective of fourth quarter2022, primarily due to lower sales growth and acquisitions.in 2023. Our allowance for doubtful accounts was $3.9$11.7 million at December 31, 20172023 and $4.1$9.5 million at December 31, 2016.2022. Our days sales outstanding ratio, as calculated on a trailing four quarters basis, was 26.8 days at December 31, 2023 and 26.9 days at December 31, 2022.
Inventory levels grew 10%decreased 14% to $536.5 million$1.4 billion, compared to $1.6 billion at December 31, 2017 compared to $486.1 million at December 31, 2016.2022, consistent with our inventory reduction goals and partially offset by increases from early buy vendor deals that we took advantage of in the last quarter of the year. Our reserve for inventory obsolescence was $6.3$23.5 million at December 31, 20172023 compared to $6.5$21.2 million at December 31, 2016.2022. Our inventory turns, as calculated on a trailing four quarters basis, were 3.52.7 times at December 31, 20172023 and 3.62.6 times at December 31, 2016.2022.
Total debt outstanding of $519.7 million$1.1 billion at December 31, 2017 increased $81.62023 decreased $333.5 million or 19% compared to December 31, 2016 primarily2022 as we have used operating cash flows to fund share repurchases and working capital growth.reduce our debt.
Current Trends and Outlook
Over the last fivepast decade, consumers’ investments in their homes, including backyard renovations, have flourished. In recent years, we estimate the pool industry grew from 2%steady increases in home values, lack of affordable new homes and increased mortgage rates have prompted homeowners to 4% per year duestay in their homes longer and upgrade their home environments, including their backyards. Many families have spent more time at home and sought opportunities to growthcreate or expand home-based outdoor living and entertainment spaces. These outdoor investment trends, which were particularly heightened during 2020 through 2022, resulted in the installed base of pools, which helped drive pool maintenance growth, improvementan increase in remodeling and replacement activity and annual growth in thenew pool construction market. Improvements in general external market factors in the United States including consumer confidence, employment, housing, consumer financing and economic expansion, largely support our base business growth. We feel these positive external trends have promoted increased consumer spending on higher value products that enhance swimming poolsgreater expenditures for maintenance and outdoor living spaces. Our consistent base business sales growth reflects industry growth plus market share gains from existing customers expanding their businesses and our success in newer market initiatives such as hardscapes and commercial pools.
Whileremodeling products. In 2023, we estimate that new in-ground pool construction increasedunits decreased 23% to approximately 75,000 newunits from 98,000 units in 20172022 as new construction activities declined following significant growth in 2021 and 2020. Our estimate of the new in-ground pool units added in 2023 is consistent with the 78,000 pools added in 2019. We expect that consumers will continue to invest in outdoor living spaces as they consider backyards an extension of their home space. We believe that we are well positioned to benefit from the historically low levels experienced during the economic downturn, construction levels are still down approximately 65% compared to peak historical levels and down approximately 50% to 55% from what we consider normal levels. Favorable weather plays a roleinherent long-term growth opportunities in industry growth by accelerating growth in any given year, while unfavorable weather impedes growth. In 2017 specifically, our industry experienced modestlyfueled by favorable weatherpopulation migration trends, strong housing demand dynamics and product developments and technological advancements as consumers focus on more environmentally sustainable and energy-efficient products.
Market conditions in 2023 were challenged by overall despite the severe storms thataffordability concerns, including higher interest rates and product cost and labor inflation, which led to consumer hesitancy and some cyclical suppression of demand. While these market conditions impacted new pool construction and remodeling projects, our industrynon-discretionary maintenance product sales in Texas and Florida in September and October. Due to the repairs required following major storms, sales mostly recovered by the end2023 were not significantly impacted.
In view of the year. In 2016, an earlier start to the pool season due to warmer than usual temperatures and overall favorable weather throughout the rest of the year benefited the industry as a whole. In 2015, excessive precipitation impacted our industry in the second quarter; however a mild fall and delayed winter alleviated any contraction in industry growth rates. In establishingcurrent trends, we established our outlook each year, wefor 2024 based on reasonable expectations for industry demand, pricing and inflationary conditions, focused expense management, increased investment in our digital transformation initiatives and ongoing leverage of existing investments in our business and continuous process improvements. We also plan to broaden our geographic presence by opening about 10 or more new sales centers in 2024 and by making selective acquisitions when appropriate opportunities arise.
We base our growth assumptions on normal weather conditions and do not incorporate alternative weather predictions into our guidance. Favorable weather positively impacts industry activity by accelerating growth in any given year, expanding the number of available construction days, extending the pool season and pool usage and positively impacting demand for discretionary products. Conversely, unfavorable weather typically impedes growth.
We believe there is potential for continued market recovery over the next several years. The Great Recession created a build-up of deferred replacement and remodeling activity, which we have largely fulfilled over the past seven years. We expect that new pool and irrigation construction levels will continue to grow incrementally, but we believe that consumer investments in outdoor living spaces beyond the swimming pool will generate greater growth over the next four to seven years. Additionally, we believe favorable demographics from an aging population and southern migration are ideal for increased residential outdoor living investment. We expect that market conditions in the United States will continue to improve, enabling further replacement, remodeling and new construction activity and that the industry will realize an annual growth rate of approximately 4% to 7% over this time period. As economic trends indicate that consumer spending has largely recovered and that residential construction activities will likely continue to improve, we believe that we are well positioned to take advantage of both the market expansion and the inherent long‑term growth opportunities in our industry.
We established our initial outlook for 2018 based on reasonable expectations of organic market share growth, ongoing leverage of infrastructure and continuous process improvements. For 2018, we expect the macroeconomic environment in the United States will be quite similar to 2017. We expect to continue to gain market share through our comprehensive service and product offerings, which we continually diversify through internal sourcing initiatives and expansion into new markets. We also plan to broaden our geographic presence by opening 4 to 6 new sales centers in 2018 and by making selective acquisitions when appropriate opportunities arise.
The following section summarizes our outlook for 2018:2024:
•We expect sales growth of 6% to 7%,be flat to a low single digit increase compared to 2023, impacted by the following factors and assumptions:
| |
◦ | assumed normal weather patterns for 2018; |
| |
◦ | anticipated continued growth from replacement, remodeling and construction activity and market expansion through newer product offerings like hardscapes and commercial pools; |
| |
◦ | estimated 1% growth from acquisitions completed throughout 2017; |
| |
◦ | inflationary product cost increases of approximately 1% to 2%; and |
| |
◦ | one additional selling day for the full year for 2018 compared to 2017 due to an extra selling day in the fourth quarter (neutral selling days for all other quarters). |
◦normal weather patterns for 2024;
◦sustained demand for pool maintenance products;
◦volumes of discretionary products used for swimming pool construction to be flat to down 10%;
◦volumes of products used in the remodeling, renovation and upgrading of swimming pools to be flat to down 10%;
◦inflationary product cost increases, which generally pass through to customers of approximately 2% to 3%; and
◦a 1% benefit from expansion of the installed base of in-ground swimming pools.
•We project relatively neutral gross margin trends for the full year as we believe our sales growth will continueof 2024 to be weighted toward sales of loweraround 30.0%, with our highest margin discretionary products. Adverse margin impacts should be offset by benefits from our efforts in supply chain management and internal pricing initiatives.
We expect operating expenses will grow at approximately 60%the second quarter of the rateyear. Our actual gross margin will depend on amounts and timing of our gross profit growth, reflecting inflationary price increases, sales and incremental costs to support our sales growth expectations. The main challenges in achieving this metric include managing people and facility costs in tight labor and real estate markets. However, we continue to see significant opportunityproduct mix.
•We expect to leverage our existing infrastructure and manage discretionary spending to maintain expenses in line with sales expectations to achieve this goal.operating margin of approximately 13.0%.
Our provision for income taxes for 2017 was impacted by both U.S. tax reform and ASU 2016-09. As a result of the recently enacted tax legislation, we recorded a provisional tax benefit of $12.0 million in the fourth quarter of 2017, which primarily reflects the re-measurement of our net deferred tax liability. In 2018,2024, we expect our effective tax rate to approximate 25.5%, which is a reduction from our historical rate ofwill be approximately 38.5%, both of which exclude25.3% without the impact of ASU 2016-09. As discussed further in Critical Accounting Estimates below, we have not finalized our accounting for the tax effects of tax reform; however, our net benefit is based on reasonable estimates for those tax effects.
Our effective tax rate is dependent upon our results of operations and may change if actual results are different from our current expectations, particularly any significant changes in our geographic mix.expectations. Due to ASU 2016-09 requirements, we expect our effective tax rate will fluctuate from quarter to quarter, particularly in periods when employees elect to exercise their vested stock options or when restrictions on share-based awards lapse. Based on our December 31, 2017 stock price, weWe estimate that we have approximately $5.4$3.8 million in unrealized excess tax benefits related to stock options that will expire and restricted awards that vest in the first quarter of 2018 and restricted awards that will vest in 2018. Additional2024. We may recognize additional tax benefits could be recognized related to stock option exercises in 20182024 from grants that expire in years after 2018,2024, for which we have not included any expected benefits in our guidance. The estimated impact related to ASU 2016-09 is subject to several assumptions which can vary significantly, including our estimated share price and the period that our employees will exercise vested stock options. We recorded a $12.6$6.7 million benefit in our provision for income taxes for the year ended December 31, 20172023 related to ASU 2016-09.
We project that 20182024 earnings will be in the range of $5.36$13.10 to $5.61$14.10 per diluted share, including an estimated $0.13 favorable impact$0.10 benefit from ASU 2016-09. This range also reflects our expected 2018 income tax rate, including2016-09 during the impact from tax reform legislation enacted in December 2017.first quarter of 2024. We expect to continue to use cash provided by operations will approximate net income for fiscal 2018,the payment of cash dividends as and subject to additional authorizationwhen declared by our Board of Directors, we anticipate that we will use $100.0 millionand to $150.0 million in cash forfund opportunistic share repurchases.repurchases over the next year.
The forward-looking statements in this Current Trends and Outlook section and elsewhere in this document are subject to significant risks and uncertainties, including changes in the economy and the housing market, the sensitivity of our business to weather conditions,conditions; changes in the economy, consumer discretionary spending, the housing market, interest or inflation rates; our ability to maintain favorable relationships with suppliers and manufacturers,manufacturers; the extent to which home-centric trends experienced during the height of the pandemic will moderate or reverse; competition from other leisure product alternatives andor mass merchants,merchants; our ability to continue to execute our growth strategies; changes in the regulatory environment; new or additional taxes, duties or tariffs; excess tax benefits or deficiencies recognized under ASU 2016-09 and other risks detailed in Item 1A of this Form 10-K. Also see “Cautionary Statement for Purposes of the Safe Harbor Provisions of the Private Securities Litigation Reform Act of 1995” prior to the heading “Risk Factors” in Item 1A.
COVID-19 Pandemic and Other Economic Trends
Beginning in the second quarter of 2020 during the COVID-19 pandemic, we experienced unprecedented demand as families spent more time at home and sought opportunities to create or expand home-based outdoor living and entertainment spaces. This trend had a positive impact on our financial performance during 2020 through 2022. In the latter half of 2022 and throughout 2023, these trends moderated resulting in a lower number of permits issued for new pools and lagging new pool construction activities. We expect these trends to continue in 2024.
Our industry also experienced substantial supply chain constraints beginning in 2021. In response, we proactively made significant investments in inventory in the last half of 2021 and early 2022 that enabled us to continue to meet strong customer demand and position ourselves to provide exceptional customer service. While we continued to be challenged by supply chain constraints through early 2022, supply chain dynamics improved beginning in the second quarter of 2022. In 2023, our inventory balances normalized with seasonal trends resulting in a 14% decrease compared to 2022.
CRITICAL ACCOUNTING ESTIMATES
We prepare our Consolidated Financial StatementsCritical accounting estimates are those estimates made in accordance with U.S. generally accepted accounting principles (GAAP), which requires managementthat involve a significant level of estimation uncertainty and have had, or are reasonably likely to make estimates and assumptions that affect reported amounts and related disclosures. Management identifies critical accounting estimates as:
those that require the use of assumptions about matters that are inherently and highly uncertain at the time the estimates are made; and
those for which changes in the estimate or assumptions, or the use of different estimates and assumptions, could have, a material impact on our consolidatedfinancial condition or results of operations or financial condition.operations.
Management has discussed the development, selection and disclosure of our critical accounting estimates with the Audit Committee of our Board. We believe the followingOur critical accounting estimates require usare discussed below, including, to make the most difficult, subjectiveextent material and reasonably available, the impact such estimates have had, or complex judgments.are reasonably likely to have, on our financial condition or results of operations.
Allowance for Doubtful Accounts
We maintain an allowance for doubtful accounts based on an estimate of the losses we will incur if our customers do not make required payments. We perform periodic credit evaluations of our customers and typically do not require collateral. Consistent with industry practices, we generally require payment from our North American customers within 30 days, except for sales under early buy programs for which we provide extended payment terms to qualified customers. The extended terms usually require payments in equal installments in April, May and June or May and June, depending on geographic location. Credit losses have generally been within or better than our expectations.
Similar to our business, our customers’ businesses are seasonal. Sales are lowest in the winter months and our past due accounts receivable balance as a percentage of total receivables generally increases during this time. We provide reserves for uncollectible accounts based on our accounts receivable aging. These reserves range from 0.05% for amounts currently due to up to 100% for specific accounts more than 60 days past due.
At the end of each quarter, we perform a reserve analysis of all accounts with balances greater than $20,000 and more than 60 days past due. Additionally, we perform a separate reserve analysis on the balance of our accounts receivables with emphasis on past due accounts. As weWe estimate future losses based upon historical bad debts, customer receivable balances, age of customer receivable balances, customers’ financial conditions and current and forecasted economic trends, including certain trends in the housing market, the availability of consumer credit and general economic conditions (as commonly measured by Gross Domestic Product or GDP). We monitor housing market trends through review these past due accounts, we evaluate collectability based on a combination of factors including:the House Price Index as published by the Federal Housing Finance Agency, which measures the movement of single-family home prices.
aging statistics and trends;
customer payment history;
independent credit reports; and
discussions with customers.
During the year, we write off account balances when we have exhausted reasonable collection efforts and determined that the likelihood of collection is remote. These write-offs are charged against our allowance for doubtful accounts. In the past five years, write-offs have averaged approximately 0.07%0.09% of net sales annually. Write-offs as a percentage of net sales approximated 0.05%0.12% in 2017, 0.07%2023, 0.08% in 20162022 and 0.05%0.06% in 2015.2021. We expect that write-offs will range from 0.05% to 0.10% of net sales in 2018.2024.
At the end of each fiscal year, we prepare a hindsight analysis by comparing the prior year-end allowance for doubtful accounts balance to (i) current year write-offs and (ii) any significantly aged outstanding receivable balances. Based on our most recent hindsight analysis, we concluded that the prior year allowance was within a range of acceptable estimates but conservative overall as 2017 write-offs came in at the low end of the expected range based on historical trends. While we slightly loweredand that our general reserve percentage to account for declining write-offs in recent years, our overall reserveestimation methodology and process for estimating specific reserves remains unchanged.is appropriate.
If the balance of the accounts receivable reserve increased or decreased by 20% at December 31, 2017,2023, pretax income would change by approximately $0.8$2.3 million and earnings per share would change by approximately $0.01$0.04 per diluted share (based on the number of weighted average diluted shares outstanding for the year ended December 31, 2017)2023).
Inventory Obsolescence
Product inventories represent the largest asset on our balance sheet. Our goal is to manage our inventory such that we minimize stock-outs to provide the highest level of service to our customers. To do this, we maintain at each sales center an adequate inventory of stock keeping units (SKUs) with the highest sales volumes. At the same time, we continuously strive to better manage our slower moving classes of inventory, which are not as critical to our customers and thus, inherently turn at slower rates.
We classify products into 13 classes at the sales center level based on sales at each location over the expected sellable period, which is the previous 12 months for most products. All inventory is included in these classes,products, except for special order non-stock items that lack a SKU in our system and products with less than 12 months of usage. The table below presentsBelow is a description of these inventory classes:classifications:
•new products with less than 12 months usage; |
| |
Class 0 | new products with less than 12 months usage |
| |
Classes 1-4 | highest sales value items, which represent approximately 80% of net sales at the sales center |
| |
Classes 5-12 | lower sales value items, which we keep in stock to provide a high level of customer service |
| |
Class 13 | products with no sales for the past 12 months at the local sales center level, excluding special order products not yet delivered to the customer |
| |
Null class | non-stock special order items |
•highest sales velocity items, which represent approximately 80% of net sales at the sales center;
•lower sales velocity items, which we keep in stock to provide a high level of customer service;
•products with no sales for the past 12 months at the local sales center level, excluding special order products not yet delivered to the customer; and
•non-stock special order items.
There is little risk of obsolescence for products in classes 1-4our highest sales velocity items because products in these classesproducts generally turn quickly. We establish our reserve for inventory obsolescence based on inventory classes 5-13,with lower sales velocity and inventory with no sales for the past 12 months, which we believe represent some exposure to inventory obsolescence, with particular emphasis on SKUs with the least sales over the previous 12 months. The reserve is intended to reflect the value of inventory at net realizable value. We provideevaluate a potential reserve offor 5% for inventory in classes 5-13with lower sales velocity, inventory with no sales for the past 12 months and non-stock inventory as determined at the sales center level. We also provideconsider an additional 5% reserve for excess lower sales velocity inventory in classes 5-12 and an additional 45% reserve for excess inventory in class 13.with no sales for the past 12 months. We determine excess inventory, which is defined as the amount of inventory on hand in excess of the previous 12 months’ usage, on a company-wide basis. We also evaluate whether the calculated reserve provides sufficient coverage of total inventory with no sales for the total class 13 inventory.past 12 months. We record reserves as necessary based on our evaluations. We have not changed our methodology from prior years.
In evaluating the adequacy of our reserve for inventory obsolescence, we consider a combination of factors, including:
•the level of inventory in relation to historical sales by product, including inventory usage by class based on product sales at both the sales center level and on a company-wide basis;
•changes in customer preferences or regulatory requirements;
•seasonal fluctuations in inventory levels;
•geographic location; and
•superseded products and new product offerings.
We periodically adjust our reserve for inventory obsolescence as changes occur in the above-identified factors. At the end of each fiscal year, we prepare a hindsight analysis by comparing the prior year-end obsolescence reserve balance to (i) current year inventory write-offs and (ii) the value of products with no sales for the past 12 months that remain in inventory. Based on our most recent hindsight analysis, we concluded that our prior year reserve was within a range of acceptable estimates and that our reserveestimation methodology is appropriate.
If the balance of our inventory reserve increased or decreased by 20% at December 31, 2017,2023, pretax income would change by approximately $1.3$4.7 million and earnings per share would change by approximately $0.02$0.09 per diluted share (based on the number of weighted average diluted shares outstanding for the year ended December 31, 2017)2023).
Vendor Programs
Many of our vendor arrangements provide for us to receive specified amounts of consideration when we achieve any of a number of measures. These measures generally relate to the volume level of purchases from our vendors, or our net cost of products sold, and may include negotiated pricing arrangements. We account for vendor programs as a reduction of the prices of the vendor’s products and therefore a reduction of inventory until we sell the product, at which time we recognize such consideration as a reduction of cost of sales in our income statement.
Throughout the year, we estimate the amount earned based on our estimateexpectation of total purchases for the fiscal year relative to the purchase levels that mark our progress toward the attainment of various levels within certain vendor programs. We accrue vendor program benefits on a monthly basis using these estimates provided that we determine they are probable and reasonably estimable. Our estimates for annual purchases, future inventory levels and sales of qualifying products are driven by our sales projections, which can be significantly impacted by a number of external factors including weather and changes in economic conditions.conditions and weather. Changes in our purchasing mix also impact our estimates, as certain program rates can vary depending on our volume of purchases from specific vendors.
We continually revise these estimates throughout the year to reflect actual purchase levels and identifiable trends. As a result, our estimated quarterly vendor program benefits accrual may include cumulative catch-up adjustments to reflect any changes in our estimates between reporting periods. These adjustments tend to have a greater impact on gross margin in the fourth quarter since it is our seasonally slowest quarter and because the majority of our vendor arrangements are based on calendar year periods. We update our estimates for these arrangements at year end to reflect actual annual purchase or sales levels. In the first quarter of the subsequent year, we prepare a hindsight analysis by comparing actual vendor credits received to the prior year vendor receivable balances. Based on our most recent hindsight analysis, we concluded that our vendor program estimates were within a range of acceptable estimates and that our estimation methodology is appropriate.
If market conditions were to change, vendors may change the terms of some or all of these programs. Although such changes would not affect the amounts we have recorded related to products already purchased, they may lower or raise our cost for products purchased and sold in future periods.
Income Taxes
We record deferred tax assets and liabilities based on differences between the financial reporting and tax basis of assets and liabilities using currently enacted rates and laws that will be in effect when we expect the differences to reverse. Due to changing tax laws and state income tax rates, significant judgment is required to estimate the effective tax rate expected to apply to tax differences that are expected to reverse in the future.
In December 2017, the Tax Cuts and Jobs Act (TJCA or the Act) was enacted, which significantly changes U.S. tax law. In accordance with Accounting Standards Codification Topic (ASC) 740, Income Taxes, we are required to account for the new requirements in the period that includes the date of enactment. The Act reduces the overall corporate income tax rate to 21%, creates a territorial tax system (with a one-time mandatory transition tax on previously deferred foreign earnings), broadens the tax base and allows for the immediate capital expensing of certain qualified property. Due to the complexities presented by the Act, particularly for companies with multi-national operations, the Securities and Exchange Commission issued Staff Accounting Bulletin 118 (SAB 118) to provide guidance to companies who are not able to complete their accounting in the period of enactment prior to the reporting deadlines. Under the guidance in SAB 118, companies that have not completed their accounting for certain elements of the Act, but can determine a reasonable estimate of those effects, should include a provisional amount based on their reasonable estimate in their financial statements. This guidance resulted in us recording a provisional net benefit to our income tax provision during the period ended December 31, 2017. As of December 31, 2017, we have not completed our accounting for the tax effects of the Act but will complete our accounting before the end of the one year period allowed by SAB 118. Any revisions to our provisional amounts will be recorded in the period when the accounting is complete and will be recorded as a discrete item in our income tax provision in that period. For the
We record Global Intangible Low Tax Income (GILTI) provisions of the Act, we have elected an accounting policy to record GILTIon foreign earnings as period costs if and when incurred.incurred, although we have not realized any impacts since the December 2017 enactment of U.S. tax reform.
As of December 31, 2017, United States2023, U.S. income taxes were not provided on the earnings or cash balances of our foreign subsidiaries, outside of the provisions of the transition tax from U.S. tax reform. As we have historically invested or expect to invest the undistributed earnings indefinitely to fund current cash flow needs in the countries where held, additional income tax provisions may be required. Determining the amount of unrecognized deferred tax liability on these undistributed earnings and cash balances is not practicable due to the complexity of tax laws and regulations and the varying circumstances, tax treatments and timing of any future repatriation. We are also still evaluating whether to change our indefinite reinvestment assertion in light of U.S. tax reform.
We have operationsoperate in 3941 states, 1 United States territory and 1211 foreign countries. We are subject to regular audits by federal, state and foreign tax authorities, and the amount of income taxes we pay is subject to adjustment by the applicable tax authorities. We recognize a benefit from an uncertain tax position only after determining it is more likely than not that the tax position will withstand examination by the applicable taxing authority. Our estimate for the potential outcome of any uncertain tax issue is highly judgmental. We regularly evaluate our tax positions and incorporate these expectations into our reserve estimates. We believe we have adequately provided for any reasonably foreseeable outcome related to these matters. However, our future results may include favorable or unfavorable adjustments to our estimated tax liabilities in the period the assessments are made or resolved, or when statutes of limitation on potential assessments expire. These adjustments may include changes in valuation allowances that we have established. As a result of these uncertainties, our total income tax provision may fluctuate on a quarterly basis.
Each year, we prepare a return to provision analysis upon filing our income tax returns. Based on thisour most recent hindsight analysis, we concluded that our prior year income tax provision was within a range of acceptable estimates and that our provision calculation methodology is appropriate. Differences between our effective income tax rate and federal and state statutory tax rates are primarily due to valuation allowances recorded for certainexcess tax benefits associated with the exercise of our international subsidiaries with tax losses.deductible nonqualified stock options and the lapse of restrictions on deductible restricted stock awards.
Performance-Based Compensation Accrual
The Compensation Committee of our Board (Compensation Committee) annually reviewsand our management have designed compensation programs intended to create a performance culture. The primary objectives of our compensation structureprograms are to oversee management’s implementation of maintaining a program that attracts, retains, developsattract, motivate, reward and motivatesretain our employees without leading to unnecessary risk taking. Our compensation packages include bonus plans that are specific to each groupgroups of eligible participants and their levels and areas of responsibility. The majority of our bonus plans haveconsist of annual cash payments that are based primarily on objective performance criteria. We calculate bonuses based on the achievement of certain key measurable financial and operational results, including operating income and diluted earnings per share (EPS).income.
We use an annual cash performance award (annual bonus) to focus corporate behavior on short-term goals for growth, financial performance and other specific financial and business improvement metrics. Management sets the Company’scompany’s annual bonus objectives at the beginning of the bonus plan year using both historical information and forecasted results of operations for the current plan year. Management also establishes specific business improvement objectives for both our operating units and corporate employees. The Compensation Committee approves objectives for annual bonus plans involving executive management.
We have also utilizeutilized our medium-term (three-year) Strategic Plan Incentive Program (SPIP) to provide senior management with an additional cash-based, pay-for-performance award based uponon the achievement of specified earnings growth objectives. Payouts through the SPIP are based on three-year compoundedcompound annual growth rates (CAGRs) of our diluted EPS. Beginning in 2023, our Compensation Committee did not grant any awards under the SPIP. Outstanding awards will pay out in 2024 and 2025 if the applicable three-year performance conditions are achieved.
We record annual performance-based compensation accruals based on operating income achieved in a quarter as a percentage of total expected operating income for the year. We estimate total expected operating income for the current plan year using management’s estimate of the total overall incentives earned per the stated bonus plan objectives. Starting in June, and continuing each quarter through our fiscal year end, we adjust our estimated performance-based compensation accrual based on our detailed analysis of each bonus plan, the participants’ progress toward achievement of their specific objectives and management’s estimates related to the discretionary components of the bonus plans, if any.
We record SPIP accruals based on our total expected EPS for the current fiscal year and CAGRearnings growth estimates for the succeeding two years. We base our current fiscal year estimates on the same assumptions used for our annual bonus calculation and our CAGR estimates on historical growth rates and projections for the remainder of the three-year performance periods.calculation.
Our quarterly performance-based compensation expense and accrual balances may vary relative to actual annual bonus expense and payouts due to the following:
following differences between estimated and actual performance;
our projections related to achievement of multiple-year performance objectives for our SPIP; and
the discretionary components of the bonus plans.
We generally make bonus payments at the end of February following the most recently completed fiscal year. Each year, we compare the actual bonus payouts to amounts accrued at the previous yearyear’s end to determine the accuracy of our performance‑basedperformance-based compensation estimates. Based on our most recent hindsight analysis, we concluded that our performance-based compensation accrual balances were within a reasonable range of acceptable estimates and that our estimation methodologies are appropriate.
Impairment of Goodwill and Other Indefinite-Lived Intangible Assets
Goodwill is our largest intangible asset. At December 31, 2017,2023, our goodwill balance was $189.4$700.1 million,, representing approximately 17%20% of total assets. Goodwill represents the excess of the amount we paid to acquire a company over the estimated fair value of tangible assets and identifiable intangible assets acquired, less liabilities assumed.
We perform oura goodwill impairment test in the fourth quarter of each year or on a more frequent basis if events or changes in circumstances occur that indicate potential impairment. If the estimatedThe fair value estimates used in our impairment test is determined using discounted cash flow models, which require the use of anysignificant unobservable inputs, representative of our reporting units falls below its carrying value, we compare the estimateda Level 3 fair value of the reporting unit’s goodwill to its carrying value. If the carrying value of a reporting unit’s goodwill exceeds its estimated fair value, we recognize the difference as an impairment loss in operating income.
Since we define an operating segment as an individual sales center and we do not have operations below the sales center level, our reporting unit is an individual sales center. As of October 1, 2017, we had 221 reporting units with allocated goodwill balances. The most significant goodwill balance for a reporting unit was $5.7 million and the average goodwill balance was $0.8 million. In October 2017, 2016 and 2015, we performed our annual goodwill impairment test and did not identify any goodwill impairment at the reporting unit level. In the third quarter of 2016, we recorded a $0.6 million goodwill impairment charge related to an at-risk reporting unit in Quebec, Canada. We continue to monitor this location’s results, which came in above expectations at the end of the 2017 pool season. As of December 31, 2017, the remaining goodwill balance for this reporting unit was $1.8 million.
Wemeasurement. To estimate the fair value of our reporting units, based on an income approach that incorporates our assumptions for determining the present value of future cash flows. Wewe project company-wide future cash flows using management’s assumptions for sales growth rates, operating margins, discount rates and earnings multiples. The earnings multiples are then used to estimate the fair value of each reporting unit. These estimates can significantly affect the outcome of our impairment test. We also review for potential impairment indicators at the reporting unit level based on an evaluation of recent historical operating trends, current and projected local market conditions and other relevant factors as appropriate. To the extent the carrying value of a reporting unit is greater than its estimated fair value, we perform a discounted cash flow analysis at the reporting unit level to further evaluate our initial fair value estimate. If the carrying value of the reporting unit exceeds the fair value, we record a goodwill impairment charge for the difference, up to the carrying value of the goodwill. Since we define an operating segment as an individual sales center and we do not have operations below the sales center level, we define a reporting unit as an individual sales center.
To test the reasonableness of our fair value estimates, we compared our aggregate estimated fair values to our market capitalization as of the date of our annual impairment test. We expect that a reasonable fair value estimate would reflect a moderate acquisition premium. OurIn 2023, our aggregate estimated fair values fellwere in line with our market capitalization, which we consider to be reasonable for the purpose of our goodwill impairment test.capitalization. To facilitate a sensitivity analysis, we reduced our consolidated fair value estimate by 5% to reflect more conservative discounted cash flow assumptions. This reduction addressesassumptions, the sensitivity of a 50150 basis point increase in our estimated weighted average cost of capital or a 50 basis point decrease in the estimated perpetuity growth rate. Our sensitivity analysis generatedresulted in a fair value estimate significantly belowmodestly lower than our market capitalization and resulteddid not result in the identification of no goodwill impairments and no additional at-risk locations.
Based on the magnitude of their goodwill balances and their heightened sensitivity to weather, we consider our reporting units in Quebec, Canada, as most at risk for goodwill impairment. Results in Quebec began to fall below expectations in 2013, largely due to an extended winter and certain execution challenges. We cannot be assured of favorable weather conditions in any given year, which strongly impact results for our Quebec reporting units. As of December 31, 2017, we have three reporting units in Quebec, with a total goodwill balance of $2.8 million.
If our assumptions or estimates in our fair value calculations change or if operating results are less than forecasted, we could incur additional impairment charges in future periods, especially related to the reporting units discussed above.periods. Impairment charges would decrease operating income, negatively impact diluted EPS and result in lower asset values on our balance sheet.
In September 2023, we recorded goodwill impairment of $0.6 million, primarily related to one of our Horizon reporting units in Texas that we previously identified as being most at risk of goodwill impairment. We had been monitoring this location’s results, which came in below expectations at the end of the 2023 season. We performed an interim goodwill impairment analysis, which included a discounted cash flow analysis, and determined that the estimated fair value of the reporting unit no longer exceeded its carrying value.
In October 2023, we performed our annual goodwill impairment test and did not record any additional goodwill impairment at the reporting unit level. As of October 1, 2023, we had 250 reporting units with allocated goodwill balances. Our most significant goodwill balance of $403.5 million was related to our Porpoise Pool & Patio reporting unit and the next largest goodwill balance for a reporting unit was $12.1 million. The average goodwill balance per reporting unit was $2.8 million.
In October 2022, we performed our annual goodwill impairment test and recorded goodwill impairment of $0.6 million related to the closure of a Horizon reporting unit in that period. In October 2021, we performed our annual goodwill impairment test and did not recognize any goodwill impairment at the reporting unit level.
Recent Accounting Pronouncements
In May 2014, theSee Note 1 of “Notes to Consolidated Financial Accounting Standards Board (FASB) issued ASU 2014-09, Revenue from Contracts with Customers. The FASB also issued subsequent amendments to ASU 2014-09 to provide clarification on the guidance. ASU 2014-09 will be effectiveStatements,” included in Item 8 of this Form 10-K for annual periods beginning after December 15, 2017, which for us will be in the period beginning January 1, 2018. We are substantially complete with our detailed evaluation, using the five‑step model specified in the guidance, to determine the impact of the new standard.details.
Under the new standard, revenue will be recognized when we satisfy our performance obligation by transferring promised products or services to our customer. The standard allows for application of the guidance to a portfolio of contracts or performance obligations with similar characteristics. Since our individual sales transactions are very similar in nature, we will apply the guidance to all transactions as a portfolio. We have determined that the effects of applying this guidance to the portfolio is not materially different from applying the guidance to individual performance obligations within that portfolio.
Our revenue recognition is achieved upon delivery of products as there are no other promised services as part of our contracts with customers that are material in the context of the contract. Because our shipping and handling activities are performed before the customer obtains control of the goods, we do not consider these activities to be a promised service to the customer. Rather shipping and handling are activities to fulfill our promise to transfer the goods. Product warranties do not constitute a performance obligation for us, as products are warrantied directly by the manufacturer or the third party carrier.
To determine the amount of consideration to which we expect to be entitled in exchange for transferring promised goods, we have considered if variable consideration exists. We have reviewed our standard terms and conditions and our customary business practices to determine the transaction price. We have reviewed our pricing policies including marketing programs, coupons and free products for the purpose of determining whether we have any variable or non-cash consideration. We do not issue future-dated coupons or free product rebates. When we process manufacturer coupons, we record the customer sales price as revenue and receive reimbursement of the coupon value from the manufacturer. In addition, we reviewed our current accounting policies related to returns and price concessions for which no material changes in policy were noted. Volume rebates is a sales incentive program where we make a cash payment or apply credit to a customer account on a quarterly or annual basis, if the customer reaches a specified level of purchases. The volume rebates are accounted for as a reduction of the transaction price, and a liability is recorded until the related payment to the customer is made. We do not offer any volume discounts. We will continue our accounting policy election to exclude from revenue all amounts we collect and remit to governmental authorities.
The majority of our sales transactions do not require any additional performance obligation after delivery; therefore we do not have multiple performance obligations for which we will have to allocate the transaction price. We do not offer customer loyalty programs.
We expect to recognize revenue when control of the product has been transferred to the customer upon delivery to the customer or the freight carrier, if delivered by a third party, as we believe our performance obligation is satisfied at such point in time.
As allowed for under ASU 2014-09, we will apply the guidance using the modified retrospective transition method, whereby we will recognize the cumulative effect of initially applying the new standard as an adjustment to our opening balance of retained earnings (deficit). Based on our analysis, the adoption of ASU 2014-09 will not have a material impact on our financial position or results of operations. Our adoption will result in balance sheet reclassifications for recording our estimate for customer returns. Historically, our deferred revenue liability for customer returns has not been material. ASU 2014-09 requires the recognition of a current liability for the gross amount of the estimated returns, and a current asset for the cost of the related products (each less than $1.0 million at December 31, 2017).
We have determined that the adoption will not require material or significant changes to our internal controls over financial reporting.
The following table summarizes the remaining recent accounting pronouncements that we plan to adopt in future periods:
|
| | | |
Standard | Description | Effective Date | Effect on Financial Statements and Other Significant Matters |
ASU 2016-02, Leases
| Requires lessees to record most leases on their balance sheets but recognize expenses in a manner similar to current guidance. The guidance is required to be applied using a modified retrospective approach. | Annual periods beginning after December 15, 2018 | We are currently evaluating the effect this will have on our financial position, results of operations and related disclosures. We are primarily focused on evaluating our internal controls over financial reporting, including information technology requirements, related to the adoption of this new accounting pronouncement. The adoption of ASU 2016-02 will have a significant impact on our Consolidated Balance Sheets as we will be recording a right-of-use asset and corresponding liability for our current operating leases. |
ASU 2016-13, Financial Instruments - Credit Losses - Measurement of Credit Losses on Financial Instruments
| Changes the way companies evaluate credit losses for most financial assets and certain other instruments. For trade and other receivables, held-to-maturity debt securities, loans and other instruments, entities will be required to use a new forward-looking “expected loss” model to evaluate impairment, potentially resulting in earlier recognition of allowances for losses. The new standard also requires enhanced disclosures, including the requirement to disclose the information used to track credit quality by year of origination for most financing receivables. The guidance must be applied using a cumulative-effect transition method. | Annual periods beginning after December 15, 2019 | We are currently evaluating the effect this will have on our financial position, results of operations and related disclosures. |
|
| | | |
Standard | Description | Effective Date | Effect on Financial Statements and Other Significant Matters |
ASU 2016-15, Statement of Cash Flows (Topic 230), Classification of Certain Cash Receipts and Cash Payments
| May change the classification of certain cash receipts and cash payments on an entity’s statement of cash flows. The new guidance specifies how cash flows should be classified for debt prepayment or extinguishment costs, settlement of zero-coupon debt instruments, contingent consideration payments made after a business combination, proceeds for the settlement of insurance claims, proceeds from the settlement of corporate-owned life insurance, distributions from equity method investees and beneficial interests in securitization transactions. The guidance must be applied retrospectively. | Annual periods beginning after December 15, 2017 | We do not expect the adoption of this guidance will have a material impact on our cash flow statement. |
ASU 2017-04, Intangibles - Goodwill and Other (Topic 350), Simplifying the Test for Goodwill Impairment
| Eliminates the requirement to calculate the implied fair value of goodwill to measure a goodwill impairment charge (commonly referred to as Step 2 under the current guidance). Rather, the measurement of a goodwill impairment charge will be based on the excess of a reporting unit’s carrying value over its fair value (Step 1 under the current guidance). This guidance should be applied prospectively. | Annual and interim impairment tests performed in periods beginning after December 15, 2019 | We are currently evaluating the effect this will have on our financial position, results of operations and related disclosures. |
ASU 2017-12, Derivatives and Hedging (Topic 815), Targeted Improvements to Accounting for Hedging Activities
| Eliminates the requirement to separately measure and report hedge ineffectiveness. For qualifying cash flow and net investment hedges, the change in the fair value of the hedging instrument will be recorded in Other Comprehensive Income (OCI), and amounts deferred in OCI will be reclassified to earnings in the same income statement line item that is used to present the earnings effect of the hedged item. | Annual periods beginning after December 15, 2018 | We are currently evaluating the effect this will have on our financial position, results of operations and related disclosures.
|
RESULTS OF OPERATIONS
The table below summarizes information derived from our Consolidated Statements of Income expressed as a percentage of net sales for the past three fiscal years:
|
| | | | | | | | | |
| | | Year Ended December 31, |
| | | 2017 | | 2016 | | 2015 |
| Net sales | | 100.0 | % | | 100.0 | % | | 100.0 | % |
| Cost of sales | | 71.1 |
| | 71.2 |
| | 71.4 |
|
| Gross profit | | 28.9 |
| | 28.8 |
| | 28.6 |
|
| Operating expenses | | 18.7 |
| | 18.9 |
| | 19.4 |
|
| Operating income | | 10.2 |
| | 10.0 |
| | 9.1 |
|
| Interest and other non-operating expenses, net | | 0.5 |
| | 0.6 |
| | 0.3 |
|
| Income before income taxes and equity earnings | | 9.7 | % | | 9.4 | % | | 8.8 | % |
| | | | | | | | | | | | | | | | | | | | |
| | Year Ended December 31, |
| | 2023 | | 2022 | | 2021 |
| Net sales | | 100.0 | % | | 100.0 | % | | 100.0 | % |
| Cost of sales | | 70.0 | | | 68.7 | | | 69.5 | |
| Gross profit | | 30.0 | | | 31.3 | | | 30.5 | |
| Operating expenses | | 16.5 | | | 14.7 | | | 14.8 | |
| | | | | | |
| Operating income | | 13.5 | | | 16.6 | | | 15.7 | |
| Interest and other non-operating expenses, net | | 1.1 | | | 0.7 | | | 0.2 | |
| Income before income taxes and equity in earnings | | 12.4 | % | | 15.9 | % | | 15.6 | % |
| | |
|
| Note: Due to rounding, percentages may not add to operating income or income before income taxes and equity in earnings. |
Our discussion of consolidated operating results includes the operating results from acquisitions in 2017, 20162023, 2022 and 2015.2021. We have included the results of operations in our consolidated results since the respective acquisition dates.
Fiscal Year 20172023 compared to Fiscal Year 20162022
The following table breaks out our consolidated results into the base business component and the excluded components (sales centers excluded from base business):
|
| | | | | | | | | | | | | | | | | | | | | | | | |
| (Unaudited) | | Base Business | | Excluded | | Total |
| (in thousands) | | Year Ended | | Year Ended | | Year Ended |
| | | December 31, | | December 31, | | December 31, |
| | | 2017 | | 2016 | | 2017 | | 2016 | | 2017 | | 2016 |
| Net sales | | $ | 2,749,672 |
| | $ | 2,558,368 |
| | $ | 38,516 |
| | $ | 12,435 |
| | $ | 2,788,188 |
| | $ | 2,570,803 |
|
| | | | | | | | | | | | | |
| Gross profit | | 793,866 |
| | 737,335 |
| | 11,423 |
| | 3,752 |
| | 805,289 |
| | 741,087 |
|
| Gross margin | | 28.9 | % | | 28.8 | % | | 29.7 | % | | 30.2 | % | | 28.9 | % | | 28.8 | % |
| | | | | | | | | | | | | |
| Operating expenses | | 508,273 |
| | 481,924 |
| | 12,645 |
| | 3,304 |
| | 520,918 |
| | 485,228 |
|
| Expenses as a % of net sales | | 18.5 | % | | 18.8 | % | | 32.8 | % | | 26.6 | % | | 18.7 | % | | 18.9 | % |
| | | | | | | | | | | | | |
| Operating income (loss) | | 285,593 |
| | 255,411 |
| | (1,222 | ) | | 448 |
| | 284,371 |
| | 255,859 |
|
| Operating margin | | 10.4 | % | | 10.0 | % | | (3.2 | )% | | 3.6 | % | | 10.2 | % | | 10.0 | % |
Base Business
We have excluded the following acquisitions from base business for the periods identified:
|
| | | | | | |
Acquired
| |
Acquisition
Date
| | Net
Sales Centers
Acquired
| |
Periods
Excluded
|
Chem Quip, Inc. (1) (2)
| | December 2017 | | 5 | | December 2017 |
Intermark | | December 2017 | | 1 | | December 2017 |
E-Grupa | | October 2017 | | 1 | | October - December 2017 |
New Star Holdings Pty. Ltd. | | July 2017 | | 1 | | July - December 2017 |
Lincoln Aquatics (1)
| | April 2017 | | 1 | | May - December 2017 |
Metro Irrigation Supply Company Ltd. (1)
| | April 2016 | | 8 | | January - June 2017 and April - June 2016 |
The Melton Corporation (1)
| | November 2015 | | 2 | | January 2017 and
January 2016
|
Seaboard Industries, Inc. (1)
| | October 2015 | | 3 | | January 2017 and
January 2016
|
| |
(1)
| We acquired certain distribution assets of each of these companies. |
| |
(2)
| We completed this acquisition on December 29, 2017. Thus we reported no results of operations in fiscal 2017 for this acquisition due to the acquisition date; however the related sales centers are included in the sales center count below. |
When calculating ourcalculate base business results we exclude sales centers that are acquired, closed or opened in new marketsby excluding, for a period of 15 months.months, sales centers that we acquire, open in new markets or close. We also exclude consolidated sales centers when we do not expect to maintain the majority of the existing business and existing sales centers that are consolidatedwe consolidate with acquired sales centers.
We generally allocate corporate overhead expenses to excluded sales centers on the basis of their net sales as a percentage of total net sales. After 15 months, of operations, we include acquired, consolidated and new market sales centers in the base business calculation including the comparative prior year period.
We have not provided separate base business income statements within this Form 10-K as base business results approximated consolidated results, and acquisitions and sales centers excluded from base business contributed less than 1% to the change in net sales.
The table below summarizes the changes in our sales centers during 2017:2023:
| | | | | |
| | |
December 31, 20162022 | 344420 | |
Acquired locationslocation | 95 | |
| New locations | 114 | |
| Consolidated locations | (3) |
December 31, 20172023 | 351439 | |
For information about our recent acquisitions, see Note 2 of “Notes to Consolidated Financial Statements,” included in Item 8 of this Form 10-K.
Net Sales
| | | | | | | | | | | | | | | | | | | | | | | | | | |
| (in millions) | | Year Ended December 31, | | |
| | 2023 | | 2022 | | Change |
| Net sales | | $ | 5,541.6 | | | $ | 6,179.7 | | | $ | (638.1) | | | (10)% |
|
| | | | | | | | | | | | | | |
| (in millions) | | Year Ended December 31, | | |
| | | 2017 | | 2016 | | Change |
| Net sales | | $ | 2,788.2 |
| | $ | 2,570.8 |
| | $ | 217.4 |
| | 8% |
NetFollowing sales increased 8%growth of 17% in 2022, 35% in 2021 and 23% in 2020 (all compared to 2016, despite one less selling day.the prior year periods), our net sales in 2023 declined 10% compared to 2022. Our 7% increase in base business sales generated muchresults approximated our consolidated results for the year. At the core of this growth. We experienced modestly favorableour business, maintenance activities remained stable throughout the year, indicating steady demand for non-discretionary products. Unfavorable weather duringconditions in certain markets throughout the first half of the year led to a slow start to the swimming pool season, which ended with severe stormslimited sales in Septemberthe first and October in both Texassecond quarters. Our results also reflected lower sales volumes from reduced pool construction activity and Florida. By the end of the fourth quarter, we mostly recovered sales lost over these time periods.discretionary replacement activity as tough macroeconomic conditions strained major project consumer spending.
The following factors benefitedalso impacted our sales growth (listedduring the year and are listed in order of estimated magnitude):magnitude.
continued improvement•Net sales benefited approximately 3% to 4% from inflationary product cost increases (compared to a 10% benefit in consumer discretionary expenditures,2022), net of price deflation for some products including continued growth in remodelingchemical sanitizers, PVC pipe and replacement activity (see discussion below);rebar.
market share growth, particularly in building materials and commercial product categories;
increased pool and spa chemical sales, our largest product category at 12% of total net sales for 2017, up 4% compared to 2016, excluding the recent Lincoln Aquatics acquisition;
inflation driven (estimated at close to 1%) product selling price increases; and,
acquisitions, particularly•We estimate that unfavorable weather conditions, primarily in the commercial market (Lincoln Aquatics) and Australia (Newline Pool Products)first half of the year, negatively impacted sales by approximately 2%.
•Sales were negatively impacted 1% from lower customer early buy activity in 2023 versus 2022.
We believe that
Related to our product sales, following a period of significant growth rates for certain product offerings, such as building materials and equipment, evidence increased spendingover the past three years, we observed a decline in traditionallyvolumes of discretionary areas includingproducts sold, largely due to lagging new pool construction pool remodeling, as well asactivities. In 2023, sales of equipment, upgrades. In 2017, sales for equipment such aswhich includes swimming pool heaters, pumps, lights, filters and lights increased 10%,automation, decreased approximately 9% compared to 2022 and collectively represented approximately 23%29% of net sales. This increase reflects both the growth of replacement activity and continued demand for higher‑priced, more energy-efficient products. Sales of building materials which includes tile, grew 13%fell 9% compared to 20162022 and represented approximately 10%13% of net sales in 2017.2023.
Sales to specialty retailers that sell swimming pool supplies and customers who service large commercial installations such as hotels, universities and community recreational facilities are included in the appropriate existing product categories, and growth in this areathese areas is reflected in the numbersdiscussion above. TheseIn 2023, sales increasedto retail customers decreased 10% compared to 20162022 and represented 5%approximately 14% of our consolidated net sales. Unfavorable weather and supply normalization affected our sales to independent retail customers in the first half of 2023. Encouragingly, we saw sales trends improve through the last half of the year. As consumers take advantage of travel opportunities, sales to commercial customers increased 9% compared to 2022 and represented approximately 4% of our consolidated net sales for 2017, excludingin 2023.
2023 Quarterly Sales Performance Compared to 2022 Quarterly Sales Performance
| | | | | | | | | | | | | | |
| Quarter |
| 2023 |
| First | Second | Third | Fourth |
| Net Sales Decline | (15)% | (10)% | (9)% | (8)% |
| | | | |
•In the recent acquisitionfirst quarter of Lincoln Aquatics.
In terms of quarterly performance, base business2023, unfavorable weather in our western markets, offset generally favorable weather in our southern markets. On an aggregate basis, we estimate that unfavorable weather conditions in the first quarter negatively impacted sales increasedby approximately 5%. Sales were also negatively impacted 2% from lower customer early buy activity in the first quarter of 2017, despite a 2% decline2023 and 1% from continued softness in sales relatedour European markets.
•A slow start to customer early buy purchases. Base business sales then increased 7%the swimming pool season combined with cautious consumer sentiment led to slower maintenance activity than anticipated, reduced outdoor living construction activity and deferred discretionary replacement activity in the second quarter of 2017 under overall neutral2023. Sales were also negatively impacted 1% from both unfavorable weather conditions for mostand lower customer early buy activity in the second quarter of 2023.
•During the quarter. Despite the severe weather eventsthird quarter of 2023, maintenance activities remained stable, while pool construction-related activities remained weaker as challenging macroeconomic conditions continued to weigh heavily on major project consumer spending. Our results were also negatively impacted 1% from one less selling day in the third quarter of 2017, and one less selling day compared to the same period in 2016, base business sales increased 6% in2023 versus the third quarter. Forquarter of 2022.
•In the fourth quarter of 2023, maintenance activities and demand for non-discretionary products were stable. Lower sales during our seasonally slowest fourth quarter, base businesstime of year were largely attributable to softer spending trends for discretionary products due to reduced pool construction activity and discretionary replacement activity.
In addition to the sales increased 13% in 2017 reflecting strong consumer demand, excellent execution by our team, the recovery following Hurricane Irma and overall favorable weather conditions. See discussion above, see further details of significant weather impacts under the subheading Seasonality and Quarterly Fluctuations below.
Gross Profit
| | | | | | | | | | | | | | | | | | | | | | | | | | |
| (in millions) | | Year Ended December 31, | | |
| | 2023 | | 2022 | | Change |
| Gross profit | | $ | 1,660.0 | | | $ | 1,933.4 | | | $ | (273.4) | | | (14)% |
| Gross margin | | 30.0 | % | | 31.3 | % | | | | |
|
| | | | | | | | | | | | | | |
| (in millions) | | Year Ended December 31, | | |
| | | 2017 | | 2016 | | Change |
| Gross profit | | $ | 805.3 |
| | $ | 741.1 |
| | $ | 64.2 |
| | 9% |
| Gross margin | | 28.9 | % | | 28.8 | % | | | | |
Gross margin for 2017 increased 10decreased 130 basis points to 30.0% in 2023 compared to 2016 mostly reflecting31.3% in 2022. Our prior year gross margin benefited from our strategic inventory buys when we purchased product ahead of vendor price increases. As our sales benefited from higher inflation, we were able to sell those products at a lower average cost to our sales price. Our gross margin in 2023 was in line with our long-term expectations. Throughout the year, our gross margin was impacted by a variety of factors, including a less advantageous product and customer mix coupled with benefits from sourcing initiatives.and a more competitive pricing environment as a result of slower activity within the outdoor living industry.
Operating Expenses
| | | | | | | | | | | | | | | | | | | | | | | | | | |
| (in millions) | | Year Ended December 31, | | |
| | 2023 | | 2022 | | Change |
| Selling and administrative expenses | | $ | 913.5 | | | $ | 907.6 | | | $ | 5.9 | | | 0.6% |
| | | | | | | | |
| Operating expenses as a percentage of net sales | | 16.5 | % | | 14.7 | % | | | | |
|
| | | | | | | | | | | | | | |
| (in millions) | | Year Ended December 31, | | |
| | | 2017 | | 2016 | | Change |
| Operating expenses | | $ | 520.9 |
| | $ | 485.2 |
| | $ | 35.7 |
| | 7% |
| Operating expenses as a percentage of net sales | | 18.7 | % | | 18.9 | % | | | | |
Operating expenses increased 7%0.6%, or $5.8 million, to $913.5 million in 2023, up from $907.6 million in 2022. During 2023, volume-driven expenses were managed in line with lower sales resulting in a decline in variable and discretionary expenses (including performance-based compensation, temporary and overtime labor) and reduced delivery and vehicle operating costs compared to 2016, with base business operating expenses up 5%. The increaselast year. Our largest expense growth drivers related to inflationary wage increases, rent and facility costs and insurance and healthcare-related costs, the return of in-person customer-facing retail events and investments in base business operating expenses was primarily due to higher growth-driven labornew locations and freight expenses, as well as greater facility-related expenditures, equity-based compensation, and technology spending as we continue to invest in our business. Base business operating expenses as a percentage of net sales improved 30 basis points over 2016, as we continued to leverage our existing infrastructure.customer-focused projects.
Interest and Other Non-operating Expenses, net
Interest and other non-operating expenses, net increased $0.7$17.5 million compared to 2016. Average outstanding debt was $504.0 million for 2017 versus $424.6 million for 2016. Our 20172022, as higher average outstanding debt balance reflects greater borrowings, primarily to fund working capital growth.interest rates more than offset a decrease in average debt. Our weighted average effective interest rate increased to 2.7% for 2017 compared to 2.2% for 2016.5.2% in 2023 from 2.8% in 2022 on average outstanding debt of $1.1 billion in 2023 versus $1.4 billion in 2022.
Income Taxes
Our effective income tax rate was 29.0%24.0% at December 31, 20172023 and 38.5% at December 31, 2016. Our provision for income taxes for 2017 was positively impacted by both U.S. tax reform and ASU 2016-09. As a result of the recently enacted tax legislation, we2022. We recorded a provisional tax$6.7 million, or $0.17 per diluted share, benefit of $12.0 million in the fourth quarter of 2017, which primarily reflects the re-measurement of our net deferred tax liability. In addition to the impact from tax reform, we recorded a $12.6 million benefit in our provision for income taxesASU 2016-09 for the year ended December 31, 2017 related2023 compared to a benefit of $10.8 million, or $0.27 per diluted share, realized in 2022. Without the benefits from ASU 2016-09, our adoption of ASU 2016-09.effective tax rate was 25.0% for the year ended 2023 and 25.1% for the year ended 2022.
Net Income and Earnings Per Share
Net income attributabledecreased 30% to Pool Corporation increased 29% to $191.6$523.2 million in 20172023 compared to $149.0$748.5 million in 2016.2022. Earnings per share increased 30%decreased 29% to $4.51$13.35 per diluted share compared to $3.47$18.70 per diluted share in 2016. Excluding2022.
Reconciliation of Non-GAAP Financial Measures
The non-GAAP measures described below should be considered in the $0.28 percontext of all of our other disclosures in this Form 10-K.
Adjusted Diluted EPS
We have included adjusted diluted shareEPS, a non-GAAP financial measure, as a supplemental disclosure, because we believe this measure is useful to management, investors and others in assessing our year-over-year operating performance.
Adjusted diluted EPS is a key measure used by management to demonstrate the impact of tax reform and the $0.24 per diluted share impact ofbenefits from ASU 2016-09 on our diluted earnings per share increased 15% over last year.EPS and to provide investors and others with additional information about our potential future operating performance to supplement GAAP measures.
We believe this measure should be considered in addition to, not as a substitute for, diluted EPS presented in accordance with GAAP, and in the context of our other disclosures. Other companies may calculate this non-GAAP financial measure differently than we do, which may limit their usefulness as a comparative measure.
The table below presents a reconciliation of diluted EPS to adjusted diluted EPS.
| | | | | | | | | | | |
| (Unaudited) | Year Ended |
| December 31, |
| 2023 | | 2022 |
| Diluted EPS | $ | 13.35 | | | $ | 18.70 | |
| Less: ASU 2016-09 tax benefit | 0.17 | | | 0.27 | |
| Adjusted diluted EPS | $ | 13.18 | | | $ | 18.43 | |
| | | |
| | | |
| | | |
| | | |
| | | |
| | | |
Fiscal Year 20162022 compared to Fiscal Year 20152021
The following table breaks out our consolidated results into the base business component and the excluded components (sales centers excluded from base business):
|
| | | | | | | | | | | | | | | | | | | | | | | | |
| (Unaudited) | | Base Business | | Excluded | | Total |
| (in thousands) | | Year Ended | | Year Ended | | Year Ended |
| | | December 31, | | December 31, | | December 31, |
| | | 2016 | | 2015 | | 2016 | | 2015 | | 2016 | | 2015 |
| Net sales | | $ | 2,525,164 |
| | $ | 2,361,134 |
| | $ | 45,639 |
| | $ | 2,005 |
| | $ | 2,570,803 |
| | $ | 2,363,139 |
|
| | | | | | | | | | | | | |
| Gross profit | | 727,469 |
| | 675,262 |
| | 13,618 |
| | 382 |
| | 741,087 |
| | 675,644 |
|
| Gross margin | | 28.8 | % | | 28.6 | % | | 29.8 | % | | 19.1 | % | | 28.8 | % | | 28.6 | % |
| | | | | | | | | | | | | |
| Operating expenses | | 475,048 |
| | 458,599 |
| | 10,180 |
| | 823 |
| | 485,228 |
| | 459,422 |
|
| Expenses as a % of net sales | | 18.8 | % | | 19.4 | % | | 22.3 | % | | 41.0 | % | | 18.9 | % | | 19.4 | % |
| | | | | | | | | | | | | |
| Operating income (loss) | | 252,421 |
| | 216,663 |
| | 3,438 |
| | (441 | ) | | 255,859 |
| | 216,222 |
|
| Operating margin | | 10.0 | % | | 9.2 | % | | 7.5 | % | | (22.0 | )% | | 10.0 | % | | 9.1 | % |
For an explanation of how we calculate base business, please refer to thea detailed discussion of base business under the heading “FiscalResults of Operations in Fiscal Year 20172022 compared to Fiscal Year 2016.”
For purposes2021, see the Results of comparing operating results for the year ended December 31, 2016 to the year ended December 31, 2015, we excluded acquired sales centers from base business for the periods identified in the table below.
|
| | | | | | |
Acquired (1)
| |
Acquisition
Date
| | Net
Sales Centers
Acquired
| |
Periods
Excluded
|
Metro Irrigation Supply Company Ltd. | | April 2016 | | 8 | | April - December 2016 |
The Melton Corporation | | November 2015 | | 2 | | January - December 2016 and November - December 2015 |
Seaboard Industries, Inc. | | October 2015 | | 3 | | January - December 2016 and November - December 2015 |
Poolwerx Development LLC | | April 2015 | | 1 | | January - June 2016 and
April - June 2015
|
St. Louis Hardscape Material & Supply, LLC | | December 2014 | | 1 | | January - March 2016 and January - March 2015 |
| |
(1)
| We acquired certain distribution assets of each of these companies. |
The table below summarizes the changes in our sales centers during 2016:
|
| | |
December 31, 2015 | 336 |
|
Acquired locations | 8 |
|
New locations | 6 |
|
Consolidated locations | (6 | ) |
December 31, 2016 | 344 |
|
For information about our recent acquisitions, see Note 2Operations section of “Notes to Consolidated Financial Statements,”Management’s Discussion and Analysis included in Part II, Item 87 of thisour 2022 Annual Report on Form 10-K.
Net Sales
|
| | | | | | | | | | | | | | |
| (in millions) | | Year Ended December 31, | | |
| | | 2016 | | 2015 | | Change |
| Net sales | | $ | 2,570.8 |
| | $ | 2,363.1 |
| | $ | 207.7 |
| | 9% |
Net sales increased 9% compared to 2015, with the 7% improvement in base business sales contributing much of this increase. Strong execution, combined with overall favorable weather conditions and generally favorable economic and industry conditions supported our sales growth.
The following factors benefited our sales growth (listed in order of estimated magnitude):
very favorable weather conditions, including the second warmest year on record in the continental United States;
continued consumer investments in enhancing outdoor living spaces, as evidenced by improvements in sales growth rates for product offerings such as building materials and equipment (see discussion below);
pool and spa chemical sales, our largest product category at 13% of total net sales, increased 6% over last year; and
inflationary (estimated at 1% to 2%) product cost increases.
We believe that sales growth rates for certain product offerings, such as building materials and equipment, support our assertion that there continues to be increased spending in traditionally discretionary areas including pool construction, pool remodeling, as well as equipment upgrades. Sales of equipment such as swimming pool heaters, pumps, and lights, which represented 8%, 7%, and 7% of our total net sales, respectively, increased collectively by 9% compared to 2015. This increase reflects both the gradual recovery of replacement activity and increased demand for higher-priced, more energy-efficient products. Sales of building materials, which includes tile, represent just over 9% of net sales for 2016 and grew by 14% compared to 2015.
Sales to customers who service large commercial installations such as hotels, universities and community recreational facilities are included in the appropriate existing product categories and growth in this area is reflected in the numbers above. These sales represented 4% of our consolidated net sales for 2016 and increased 16% compared to 2015 due primarily to our increased focus on the commercial market, as well as greater resources assigned to this area, including designated warehouse space, increased staffing and additional vendor relationships.
In terms of quarterly performance, base business sales increased 13% in the first quarter of 2016, as warmer than normal weather across our seasonal markets kicked off 2016, allowing for accelerated pool openings and increased ability for customers to perform remodel, replacement and new construction activity earlier in the year. As we have disclosed in recent years, 2016 customer early buy shipments again caused some second quarter sales to shift into the first quarter and accounted for approximately 3% of our first quarter 2016 sales growth. Neutral weather conditions in the second and third quarters coupled with strong execution contributed to our 6% and 5% base business sales growth in the second and third quarter of 2016, respectively. For our seasonally slow fourth quarter, base business sales increased 5% in 2016 over very strong fourth quarter 2015 results, as our sales benefited from warmer than average temperatures during this time period. See discussion of significant weather impacts under the subheading Seasonality and Quarterly Fluctuations below.
Gross Profit
|
| | | | | | | | | | | | | | |
| (in millions) | | Year Ended December 31, | | |
| | | 2016 | | 2015 | | Change |
| Gross profit | | $ | 741.1 |
| | $ | 675.6 |
| | $ | 65.5 |
| | 10% |
| Gross margin | | 28.8 | % | | 28.6 | % | | | | |
Gross margin for 2016 increased approximately 20 basis points over 2015, and benefited from improvements in supply chain management and internal initiatives, as well as favorable product mix from pool openings earlier in the year. These favorable impacts were partially offset by an increase in customer early buy deliveries as these sales include applicable discounts. Quarterly gross margin comparisons varied throughout the year, with an increase of 10 basis points in the first quarter, which reflects the impact of customer early buy shipments. Gross margin increased 40 basis points in both the second and third quarters and increased 20 basis points in the seasonally slower fourth quarter.
Operating Expenses
|
| | | | | | | | | | | | | | |
| (in millions) | | Year Ended December 31, | | |
| | | 2016 | | 2015 | | Change |
| Operating expenses | | $ | 485.2 |
| | $ | 459.4 |
| | $ | 25.8 |
| | 6% |
| Operating expenses as a percentage of net sales | | 18.9 | % | | 19.4 | % | | | | |
Operating expenses increased 6% compared to 2015, with base business operating expenses up 4%. While the increase in total operating expenses includes expenses from our more recent acquisitions, the increase in base business operating expenses was due primarily to higher growth-driven labor, building rent and freight expenses. Focusing on efficiencies and leveraging existing infrastructure enabled us to reduce operating expenses as a percentage of sales.
Interest and Other Non-operating Expenses, net
Interest and other non-operating expenses, net increased $6.4 million compared to 2015. This increase includes $3.5 million related to a non-operating note receivable. The remaining component is primarily interest expense on debt, which increased $3.2 million over last year. Average outstanding debt was $424.6 million for 2016 versus $379.2 million for 2015. Our 2016 average outstanding debt balance reflects greater share repurchases than in 2015. Our weighted average effective interest rate increased to 2.2% for 2016 compared to 1.9% for 2015.
Income Taxes
Our effective income tax rate was 38.5% at both December 31, 2016 and December 31, 2015.
Net Income and Earnings Per Share
Net income attributable to Pool Corporation increased 16% to $149.0 million in 2016 compared to $128.3 million in 2015, while earnings per share increased 20% to $3.47 per diluted share compared to $2.90 per diluted share in 2015.
Seasonality and Quarterly Fluctuations
OurFor discussion regarding the effects seasonality and weather have on our business, is highly seasonal. In general, sales and operating income are highest during the second and third quarters, which represent the peak monthssee Item 1, “Business,” of both swimming pool use and installation and irrigation installations and maintenance. Sales are substantially lower during the first and fourth quarters, when we may incur net losses. In 2017, we generated approximately 62% of our net sales and 83% of our operating income in the second and third quarters of the year.this Form 10-K.
We typically experience a build-up of product inventories and accounts payable during the winter months in anticipation of the peak selling season. Excluding borrowings to finance acquisitions and share repurchases, our peak borrowing usually occurs during the second quarter, primarily because extended payment terms offered by our suppliers typically are payable in April, May and June, while our peak accounts receivable collections typically occur in June, July and August.
The following table presents certain unaudited quarterly data for 20172023 and 2016.2022. We have included income statement and balance sheet data for the most recent eight quarters to allow for a meaningful comparison of the seasonal fluctuations in these amounts. In our opinion, this information reflects all normal and recurring adjustments considered necessary for a fair presentation of this data. Due to the seasonal nature of our industry, the results of any one or more quarters are not necessarily a good indication of results for an entire fiscal year or of continuing trends.
| | | | | | | | | | | | | | | | | | | | | | | | | | | | | | | | | | | | | | | | | | | | | | | | | | |
| (Unaudited) | | QUARTER |
| (in thousands) | | 2023 | | 2022 |
| | | First | | Second | | Third | | Fourth | | First | | Second | | Third | | Fourth |
| Statement of Income Data | | | | | | | | | | | | | | | | |
| Net sales | | $ | 1,206,774 | | | $ | 1,857,363 | | | $ | 1,474,407 | | | $ | 1,003,050 | | | $ | 1,412,650 | | | $ | 2,055,818 | | | $ | 1,615,339 | | | $ | 1,095,920 | |
| Gross profit | | 369,755 | | | 567,783 | | | 428,731 | | | 293,775 | | | 447,189 | | | 666,804 | | | 503,687 | | | 315,731 | |
| Operating income | | 145,771 | | | 327,009 | | | 194,443 | | | 79,344 | | | 235,723 | | | 418,888 | | | 263,877 | | | 107,295 | |
| Net income | | 101,699 | | | 232,250 | | | 137,843 | | | 51,437 | | | 179,261 | | | 307,283 | | | 190,055 | | | 71,863 | |
| | | | | | | | | | | | | | | | |
| Net sales as a % of annual net sales | | 22 | % | | 34 | % | | 27 | % | | 18 | % | | 23 | % | | 33 | % | | 26 | % | | 18 | % |
| Gross profit as a % of annual gross profit | | 22 | % | | 34 | % | | 26 | % | | 18 | % | | 23 | % | | 34 | % | | 26 | % | | 16 | % |
| Operating income as a % of annual operating income | | 20 | % | | 44 | % | | 26 | % | | 11 | % | | 23 | % | | 41 | % | | 26 | % | | 10 | % |
| | | | | | | | | | | | | | | | |
| Balance Sheet Data | | | | | | | | | | | | | | | | |
| Total receivables, net | | $ | 564,171 | | | $ | 630,950 | | | $ | 461,582 | | | $ | 342,910 | | | $ | 679,927 | | | $ | 756,585 | | | $ | 549,796 | | | $ | 351,448 | |
| Product inventories, net | | 1,686,683 | | | 1,392,886 | | | 1,259,308 | | | 1,365,466 | | | 1,641,155 | | | 1,579,101 | | | 1,539,572 | | | 1,591,060 | |
| Accounts payable | | 739,749 | | | 485,099 | | | 429,436 | | | 508,672 | | | 685,946 | | | 604,225 | | | 442,226 | | | 406,667 | |
| Total debt | | 1,365,750 | | | 1,184,586 | | | 1,033,897 | | | 1,053,320 | | | 1,505,073 | | | 1,595,398 | | | 1,512,545 | | | 1,386,803 | |
|
| | | | | | | | | | | | | | | | | | | | | | | | | | | | | | | | |
| (Unaudited) | | QUARTER |
| (in thousands) | | 2017 | | 2016 |
| | | First | | Second | | Third | | Fourth | | First | | Second | | Third | | Fourth |
| Statement of Income Data | | | | | | | | | | | | | | | | |
| Net sales | | $ | 546,441 |
| | $ | 988,163 |
| | $ | 743,401 |
| | $ | 510,183 |
| | $ | 515,250 |
| | $ | 918,889 |
| | $ | 691,429 |
| | $ | 445,235 |
|
| Gross profit | | 153,621 |
| | 289,664 |
| | 216,606 |
| | 145,398 |
| | 143,023 |
| | 270,736 |
| | 199,551 |
| | 127,777 |
|
| Operating income | | 30,998 |
| | 154,186 |
| | 81,928 |
| | 17,259 |
| | 29,530 |
| | 142,420 |
| | 74,166 |
| | 9,743 |
|
| Net income | | 22,270 |
| | 94,620 |
| | 48,783 |
| | 25,665 |
| | 16,363 |
| | 85,247 |
| | 44,421 |
| | 2,572 |
|
| | | | | | | | | | | | | | | | | |
| Net sales as a % of annual net sales | | 20 | % | | 35 | % | | 27 | % | | 18 | % | | 20 | % | | 36 | % | | 27 | % | | 17 | % |
| Gross profit as a % of annual gross profit | | 19 | % | | 36 | % | | 27 | % | | 18 | % | | 19 | % | | 37 | % | | 27 | % | | 17 | % |
| Operating income as a % of annual operating income | | 11 | % | | 54 | % | | 29 | % | | 6 | % | | 12 | % | | 56 | % | | 29 | % | | 4 | % |
| | | | | | | | | | | | | | | | | |
| Balance Sheet Data | | | | | | | | | | | | | | | | |
| Total receivables, net | | $ | 290,019 |
| | $ | 370,285 |
| | $ | 262,796 |
| | $ | 196,265 |
| | $ | 283,758 |
| | $ | 351,012 |
| | $ | 233,405 |
| | $ | 166,151 |
|
| Product inventories, net | | 647,884 |
| | 542,805 |
| | 484,287 |
| | 536,474 |
| | 595,393 |
| | 493,254 |
| | 455,156 |
| | 486,116 |
|
| Accounts payable | | 465,928 |
| | 273,309 |
| | 209,092 |
| | 245,249 |
| | 438,705 |
| | 265,349 |
| | 199,922 |
| | 230,728 |
|
| Total debt | | 490,217 |
| | 553,480 |
| | 564,573 |
| | 519,650 |
| | 450,457 |
| | 500,606 |
| | 390,189 |
| | 438,042 |
|
| | | | | |
| |
| Note: Due to rounding, the sum of quarterly percentage amounts may not equal 100%. |
We expect that our quarterly results of operations will continue to fluctuate depending on the timing and amount of revenue contributed by new and acquired sales centers. Based on our peak summer selling season, we generally open new sales centers and close or consolidate sales centers, when warranted, either in the first quarter before the peak selling season begins or in the fourth quarter after the peak selling season ends.
Weather is one of the principal external factors affecting our business. The table below presents some of the possible effects resulting from various weather conditions.
|
| | |
Weather | | Possible Effects |
Hot and dry | • | Increased purchases of chemicals and supplies |
| | for existing swimming pools |
| • | Increased purchases of above-ground pools and |
| | irrigation products |
| | |
Unseasonably cool weather or | • | Fewer pool and irrigation installations |
extraordinary amounts of rain | • | Decreased purchases of chemicals and supplies |
| • | Decreased purchases of impulse items such as |
| | above-ground pools and accessories |
| | |
Unseasonably early warming trends in spring/late cooling trends in fall | • | A longer pool and landscape season, thus positively impacting our sales |
(primarily in the northern half of the U.S. and Canada) | | |
| | |
Unseasonably late warming trends in spring/early cooling trends in fall | • | A shorter pool and landscape season, thus negatively impacting our sales |
(primarily in the northern half of the U.S. and Canada) | | |
Weather Impacts on Fiscal Year 20172023 to Fiscal Year 20162022 Comparisons
Unseasonably mild weather benefited sales inWeather conditions varied across the contiguous United States throughout the first quarter of 2017. However, while2023. Conditions were generally favorable in our southern markets, where sales benefited from warmer weather trends early in the year normally have a seasonally larger impact, the comparison to the first quarter of 2016 was especially tough given the benefit of the warmer-than-normal weather across nearly all markets in the United States in the first quarter of 2016. For the first quarter of 2017, Texas and surrounding markets experienced record warm temperatures, which when coupled with below-average precipitation for that area, spurred higher sales growth.precipitation. In two of the more seasonal regions where we operate, below-average temperatures in the Northcontrast, results were unfavorably impacted by unusually wet and above-average precipitation in the West negatively impacted our first quarter 2017 sales growth.
Cold and wet weather throughout the Mid-South and North impacted those seasonal markets in the middle of the second quarter of 2017, while the weather impact overall for the quarter was fairly neutral. Temperatures and precipitation throughout most areas other than those described above, were normal, with only Texas benefiting from driercold weather in the second quarterwestern U.S., particularly in California and Arizona, which are two of 2017 compared to the above-average rainfall experienced in the same period of 2016.
Severe storms in the third quarter of 2017, particularly Hurricanes Irma and Harvey, hindered our sales growth in Florida and Texas, although Texas largely recovered by the end of September. In the Central and Midwest, temperatures were normal for the third quarter, contrasting with the above-average temperatures in the third quarter of 2016. The West experienced record heat and normal rainfall in the third quarter of 2017, similar to the above-average heat in the same period of 2016.largest markets. Overall, the United States experienced favorable weather in most of the fourth quarter of 2017, particularly Florida, which allowed for sales recovery following Hurricane Irma.
Weather Impacts on Fiscal Year 2016 to Fiscal Year 2015 Comparisons
Warmer-than-normal weather across nearly all markets in the United States benefited our first quarter of 2016 sales growth. Warmer weather early in the season accelerates pool openings and allows for increased purchases of chemicals and maintenance supplies for existing pools. By comparison, our year-round markets experienced similar favorablewe estimate that unfavorable weather conditions in the first quarter of 2015, while our seasonal markets, particularly in the northeast United States and eastern Canada, experienced cooler-than‑normal temperatures. The unusually early warm weather2023 negatively impacted first quarter sales by approximately 5%. Comparatively, in the first quarter of 2016 in our seasonal markets2022, overall weather conditions were generally favorable, and sales benefited our first quarter sales. Growth in our California markets infrom above-average temperatures along much of the first quarter of 2016 waswest and the east coast, although Texas experienced cooler-than-normal temperatures.
Overall, weather conditions unfavorably impacted sales by unfavorable weather comparisons to the same period of 2015 due to higher winter precipitation and average temperatures in 2016 versus record warm temperatures in 2015.
In the second quarter of 2016, the Midwest and Northeast experienced more favorable conditions compared to 2015, with above‑average temperatures and much drier weather in June 2016 compared to June 2015. Although the extreme rainfall experienced in Texas and adjacent states was not as prevalentan estimated $30.0 million in the second quarter of 2016 as2023, particularly at the beginning of the second quarter. The first week of April through Easter weekend was much cooler across the West versus both average temperatures and prior year temperatures. The last week of April was also significantly cooler than normal from Texas through the mid-Atlantic region, excluding the coastal Southeast. While the Northeast had warmer than average weather the first few weeks of April, temperatures cooled dramatically through the first week of May and smoke from wildfires in Canada unfavorably impacted sales in early June. Weather in Florida was more normal and consistent with prior year, while favorable weather conditions compared to 2015, Texas experienced above‑average precipitation again in 2016. Floridathe second quarter of 2022 were limited to the Pacific Northwest and the Southeast experienced cooler temperatures compared to above-average and record heat in certain areas in 2015. California and the Northwest experienced warm temperatures and normal levels of precipitationEurope. Similarly, sales growth in the second quarter of 20162022 was challenged by unfavorable weather conditions in our seasonal markets and 2015.Europe; however, our southern markets benefited from above-average temperatures, particularly in Texas.
Weather conditions in the third quarter of 2016 varied throughout2023 were fairly neutral as hot temperatures across the southern United States creating a neutral overall impact on our results. The eastern half of the country experienced above-average temperatures, including record high temperatureswere offset by rainy conditions in the Northeast and parts of the Midwest. The western half of the United States experienced mostly normal temperatures, while Texas experienced above-average precipitation. The conditions in TexasNortheast. Comparatively, sales in the third quarter of 20162022 were in direct contrast to the weather in the same period of 2015 when Texas was drying out from heavy precipitation, lifting third quarter 2015 sales. California and the Northwest logged drier-than-normal conditions in the third quarter of 2016 compared to average precipitation in 2015. Mostgenerally aided by above-average temperatures throughout much of the contiguous United States, experiencedalthough Florida saw a decline in sales due to closures resulting from Hurricane Ian towards the end of the quarter.
Overall, weather conditions were warm temperatures duringin the fourth quarter of 2016, allowing projects to continue through2023 and did not have a major impact on sales. The month of December marked the remainderwarmest temperatures recorded in 129 years, while the months of October and November saw below average rainfall across most of the yearUnited States. Conversely, fourth quarter of 2022 had less favorable conditions. In December, an Arctic front brought freezing temperatures and contributingabove-average temperatures across the United States and Canada.
Weather Impacts on Fiscal Year 2022 to Fiscal Year 2021 Comparisons
For a detailed discussion of Weather Impacts on Fiscal Year 2022 compared to Fiscal Year 2021, see the Seasonality and Quarterly Fluctuations section of Management’s Discussion and Analysis included in Part II, Item 7 of our 2022 Annual Report on Form 10-K.
Geographic Areas
Since all of our sales growth over the same periodcenters have similar operations and share similar economic characteristics, we aggregate our sales centers into a single reportable segment. For additional details, see Note 1 of our “Notes to Consolidated Financial Statements,” included in 2015.Item 8 of this Form 10-K.
For a breakdown of net sales and property, plant and equipment between our United States and international operations, see Item 1, “Business,” of this Form 10-K.
LIQUIDITY AND CAPITAL RESOURCES
Liquidity is defined as the ability to generate adequate amounts of cash to meet short-term and long-term cash needs. We assess our liquidity in terms of our ability to generate cash to fund our operating activities, taking into consideration the seasonal nature of our business. Significant factors which could affect our liquidity include the following:
•cash flows generated from operating activities;
•the adequacy of available bank lines of credit;
•the quality of our receivables;
•acquisitions;
•dividend payments;
•capital expenditures;
•changes in income tax laws and regulations;
•the timing and extent of share repurchases; and
•the ability to attract long-term capital with satisfactory terms.
Our primary capital needs are seasonal working capital obligations, debt repayment obligations and other general corporate initiatives, including acquisitions, opening new sales centers, dividend payments and share repurchases. Our primary working capital obligations are for the purchase of inventory, payroll, rent, other facility costs and selling and administrative expenses. Our working capital obligations fluctuate during the year, driven primarily by seasonality and the timing of inventory purchases. Our primary sources of working capital are cash from operations supplemented by bank borrowings, which have historically been sufficient to support our growth and finance acquisitions. The same principle applies to funds used forWe have funded our capital expenditures and share repurchases.repurchases in substantially the same manner.
We prioritize our use of cash based on investing in our business, maintaining a prudent capital structure, including a modest amount of debt, and returning cash to our shareholders through dividends and share repurchases. Our specific priorities for the use of cash are as follows:
•capital expenditures primarily for maintenance and growth of our sales center structure,network, technology-related investments and fleet vehicles;
•inventory and other operating expenses;
•strategic acquisitions executed opportunistically;
•payment of cash dividends as and when declared by our Board of Directors (Board);Board;
•repayment of debt to maintain an average total target leverage ratio (as defined below) between 1.5 and 2.0; and
•discretionary repurchases of our common stock under our Board authorized share repurchase program.
Capital expenditures were 1.4%Our capital spending primarily relates to leasehold improvements, delivery and service vehicles and information technology. We focus our capital expenditure plans based on the needs of netour sales centers. In recent years, we have increased our investment in 2017 as we expanded facilitiestechnology and purchased delivery vehiclesautomation enabling us to address growth opportunities. Capital expenditures were 1.4% of net sales in 2016operate more efficiently and 1.0% of net sales in 2015. Over the last 5 years,better serve our customers.
Historically, our capital expenditures have averaged roughly 1.0% of net sales. Going forward,Capital expenditures were 1.1% of net sales in 2023 and 0.7% of net sales in 2022 and 2021. In 2022 and 2021, our capital expenditures as a percentage of net sales were lower than our historical average due to our significant sales growth in those years. Based on management’s current plans, we project capital expenditures for 2024 will approximate this average.average 1% to 1.5% of net sales.
We believe we have adequate availability of capital to fund present operations and the current capacity to finance any working capital needs that may arise. We continually evaluate potential acquisitions and hold discussions with acquisition candidates. If suitable acquisition opportunities arise that would require financing, we believe that we have the ability to finance any such transactions.
As of February 20, 2024, $344.1 million of the current Board authorized amount under our authorized share repurchase plan remained available. We expect to repurchase additional shares in the open market from time to time depending on market conditions. We plan to fund these repurchases with cash provided by operations and borrowings under our credit and receivables facilities.
Sources and Uses of Cash
The following table summarizes our cash flows (in thousands):
| | | | | | | | | | | | | | | | |
| | | Year Ended December 31, |
| | | 2023 | | 2022 | | |
| Operating activities | | $ | 888,229 | | | $ | 484,854 | | | |
| Investing activities | | (71,597) | | | (50,870) | | | |
| Financing activities | | (798,132) | | | (411,658) | | | |
|
| | | | | | | | | | | | |
| | | Year Ended December 31, |
| | | 2017 | | 2016 | | 2015 |
| Operating activities | | $ | 175,311 |
| | $ | 165,378 |
| | $ | 146,050 |
|
| Investing activities | | (52,220 | ) | | (55,643 | ) | | (37,793 | ) |
| Financing activities | | (114,449 | ) | | (99,672 | ) | | (107,804 | ) |
Cash provided by operations of $175.3$888.2 million for 20172023 increased $403.4 million compared to 20162022, primarily due to the increasedriven by positive changes in net income,working capital, particularly as we sold through our prior year strategic inventory purchases, partially offset by changes in working capital. Excluding thelower net income benefit from tax changes, cash provided by operations approximates net income for 2017. The timing of our early buy inventory purchases can create fluctuations in inventory and accounts payable balances from year to year. A change in the timing of one of our inventory early buy programs in 2017 compared to 2016 resulted in higher inventory but lower accounts payable balances at year end, resulting in a negative impact to our 2017 operating cash flows.income.
In 2016, cash provided by operations improved compared to 2015 primarily due to our net income growth.
Cash used in investing activities decreasedincreased $20.7 million to $71.6 million in 2017 due to2023, reflecting a decrease$16.5 million increase in net capital expenditures between years and an increase of $6.9$2.3 million in payments for acquisitions compared to 2016. This was offset by an additional $5.0 million of net capital expenditures in 2017 compared to 2016 to fund our continued investment in new vehicles, equipment and technology. Related to the increase from 2015 to 2016, our 2016 cash used in investing activities reflects $19.7 million in net payments to fund acquisitions compared to $4.5 million in net payments to fund acquisitions in 2015.2022.
Cash used in financing activities increased to $798.1 million in 2017, primarily due to lower net borrowings on our debt arrangements. We had $82.1 million of net proceeds from our debt arrangements in 20172023 compared to $109.4$411.7 million in 2016,2022. The change in financing activities primarily asreflects a result$537.0 million increase in net debt payments and a $16.8 million increase in dividends paid, partially offset by a decrease in share repurchases of lower share repurchases. We repurchased $143.2 million$164.9 million.
For a discussion of sharesour sources and uses of cash in 2021, see the open marketLiquidity and Capital Resources – Sources and Uses of Cash section of Management’s Discussion and Analysis included in 2017 compared to $175.6 million in 2016. In 2015, we had net proceeds fromPart II, Item 7 of our debt arrangements of $8.9 million, while we repurchased $92.4 million of shares in the open market.2022 Annual Report on Form 10-K.
Future Sources and Uses of Cash
To supplement cash from operations as our primary source of working capital, we will continue to utilize our twothree major credit facilities, which are the Amended and Restated Revolving Credit Facility (the Credit Facility), the Term Facility (the Term Facility) and the Receivables Securitization Facility (the Receivables Facility). For additional details regarding these facilities, see the summary descriptions below and more complete descriptions in Note 5 of our “Notes to Consolidated Financial Statements,” included in Item 8 of this Form 10-K.
Revolving Credit Facility
On September 29, 2017, we amended and restated our revolving credit facility. TheOur Credit Facility provides for $750.0 million$1.25 billion in borrowing capacity underconsisting of a $750.0 million five-year unsecured revolving credit facility and a $500.0 million term loan facility. The Credit Facility also includes sublimits for the issuance of swingline loans and standby letters of credit. PursuantWe pay interest on revolving and term loan borrowings under the Credit Facility at a variable rate based on one-month Term SOFR, plus an applicable margin. The term loan requires quarterly amortization payments during the third, fourth and fifth years of the loan, beginning in September 2023 aggregating to an accordion feature,20% of the aggregate maximumoriginal principal amount of the commitments underloan, with all remaining principal due on the Credit Facility may be increased at our request and with agreement by the lenders by upmaturity date of September 25, 2026. We intend to $75.0 million, to a total of $825.0 million. The Credit Facility matures on September 29, 2022. We intendcontinue to use the Credit Facility for general corporate purposes, for future share repurchases and to fund future growth initiatives.
At December 31, 2017,2023, there was $410.4$740.0 million outstanding, including a $4.2$487.5 million term loan, with a $16.0 million standby letter of credit outstanding and $335.4$481.5 million available for borrowing under the Credit Facility. We utilize interest rate swap contracts and forward-starting interest rate swap contracts to reduce our exposure to fluctuations in variable interest rates for future interest payments on the Credit Facility. As of December 31, 2017, we have three interest rate swap contracts in place that became effective on October 19, 2016. These swap contracts were previously forward-starting and were amended in October 2015 to bring the fixed rates per our forward-starting contracts in line with current market rates and extend the hedged period for future interest payments on our Credit Facility. Now effective, these amended swap contracts convert the Credit Facility’s variable interest rate to fixed rates of 2.273% on a notional amount of $75.0 million and 2.111% on two separate notional amounts, one $25.0 million and the other $50.0 million, totaling $75.0 million. Interest expense related to the notional amounts under these swap contracts is based on the fixed rates plus the applicable margin on the Credit Facility. These interest rate swap contracts will terminate on November 20, 2019.
In July 2016, we entered into a forward-starting interest rate swap contract to extend the hedged period for future interest payments on our Credit Facility to its maturity date at that time. This swap contract will convert the Credit Facility’s variable interest rate to a fixed rate of 1.1425% on a notional amount of $150.0 million. The contract becomes effective on November 20, 2019 and terminates on November 20, 2020.
The weighted average effective interest rate for the Credit Facility as of December 31, 20172023 was approximately 2.9%4.7%, excluding commitment fees and including the impact of our interest rate swaps.
Term Facility
Our Term Facility provides for $185.0 million in borrowing capacity and matures on December 30, 2026. Proceeds from the Term Facility were used to pay down the Credit Facility in December 2019, adding borrowing capacity for future share repurchases, acquisitions and growth-oriented working capital expansion. We pay interest on borrowings under the Term Facility at a variable rate based on one month Term SOFR, plus an applicable margin. The Term Facility is repaid in quarterly installments of 1.250% of the Term Facility on the last business day of each quarter beginning in the first quarter of 2020. We may prepay amounts outstanding under the Term Facility without penalty other than interest breakage costs. In June 2023, we made a prepayment on the Term Facility of $45.0 million with $32.4 million applied against the remaining quarterly installments and the remainder applied against the amount due at maturity.
At December 31, 2023, the Term Facility had an outstanding balance of $109.9 million at a weighted average effective interest rate of 6.6%.
Receivables Securitization Facility
Our two-year accounts receivable securitization facility (the Receivables Facility) offers us a lower-cost form of financing. Under this facility, we can borrow up to $350.0 million between April through August and from $210.0 million to $340.0 million during the remaining months of the year. We pay interest on borrowings under the Receivables Facility at a variable rate based on one month Term SOFR, plus an applicable margin. The Receivables Facility matures on November 1, 2024.
The Receivables Facility provides for the sale of certain of our receivables to a wholly owned subsidiary (the Securitization Subsidiary). The Securitization Subsidiary transfers variable undivided percentage interests in the receivables and related rights to certain third-party financial institutions in exchange for cash proceeds, limited to the applicable funding capacities. Upon payment of the receivables by customers, rather than remitting to the financial institutions the amounts collected, we retain such collections as proceeds for the sale of new receivables until payments become due.
At December 31, 2023, there was $191.7 million outstanding under the Receivables Facility at a weighted average effective interest rate of 6.2%, excluding commitment fees.
Financial Covenants
Financial covenants onof the Credit Facility, Term Facility and Receivables Facility include maintenance of a maximum average total leverage ratio and a minimum fixed charge coverage ratio, which are our most restrictive financial covenants. As of December 31, 2017,2023, the calculations of these two covenants are detailed below:
•Maximum Average Total Leverage Ratio. On the last day of each fiscal quarter, our average total leverage ratio must be less than 3.25 to 1.00. Average Total Leverage Ratio is the ratio of the sum of (i) Total Non-Revolving Funded Indebtedness as of such date, (ii) the trailing twelve months (TTM) Average Total Revolving Funded Indebtedness plusand (iii) the TTM Average Accounts Securitization Proceeds divided by the TTM EBITDA (as those terms are defined in the Credit Facility). As of December 31, 2017,2023, our average total leverage ratio equaled 1.631.39 (compared to 1.561.37 as of December 31, 2016)2022) and the TTM average total debtindebtedness amount used in this calculation was $524.3 million.
$1.1 billion.
•Minimum Fixed Charge Coverage Ratio. On the last day of each fiscal quarter, our fixed charge ratio must be greater than or equal to 2.25 to 1.00. Fixed Charge Ratio is the ratio of the TTM EBITDAR divided by TTM Interest Expense paid or payable in cash plus TTM Rental Expense (as those terms are defined in the Credit Facility). As of December 31, 2017,2023, our fixed charge ratio equaled 5.535.94 (compared to 5.419.57 as of December 31, 2016)2022) and TTM Rental Expense was $54.3$92.0 million.
The Credit Facility also limitsand Term Facility limit the declaration and payment of dividends on our common stock to no more than 50% of the preceding year’s Net Income (as defined in the Credit Facility),a manner consistent with past practice, provided no default or event of default has occurred and is continuing, or would result from the payment of dividends. Additionally, weWe may declare and pay quarterly dividends notwithstanding that the aggregate amount of dividends paid would be in excess of the 50% limit described above so long as (i) the amount per share of such dividends doesis not exceed the amount per share paid duringgreater than the most recent fiscal year in which we were in compliance with the 50% limitrecently publicly announced dividends per share and (ii) our Average Total Leverage Ratio is less than 3.003.25 to 1.00 both immediately before and after giving pro forma effect to such dividends. Further, dividends must be declared and paid in a manner consistent with our past practice.
Under the Credit Facility and Term Facility, we may repurchase shares of our common stock provided no default or event of default has occurred and is continuing, or would result from the repurchase of shares, and our maximum average total leverage ratio (determined on a pro forma basis) is less than 2.503.25 to 1.00.
Other covenants include restrictions on our ability to grant liens, incur indebtedness, make investments, merge or consolidate, and sell or transfer assets. Failure to comply with any of our financial covenants or any other terms of the Credit Facility and the Term Facility could result in higher interest rates on our borrowings or the acceleration of the maturities of our outstanding debt.
Receivables Securitization FacilityInterest Rate Swaps
As amendedWe utilize interest rate swap contracts and forward-starting interest rate swap contracts to reduce our exposure to fluctuations in variable interest rates for future interest payments on November 28, 2017, our two-year Receivables Facility offers us a lower cost form of financing, with a peak funding capacity of up to $255.0 million between May 1 and June 30, which includes an additional seasonal funding capacity that is available between March 1 and July 31. Other funding capacities range from $80.0 million to $220.0 million throughout the remaining months of the year.
The Receivables Facility provides for the sale of certain of our receivables to a wholly owned subsidiary (the Securitization Subsidiary). The Securitization Subsidiary transfers variable undivided percentage interests in the receivables andrate borrowings. Interest expense related rights to certain third party financial institutions in exchange for cash proceeds, limited to the notional amounts under all swap contracts is based on applicable funding capacities. Upon payment offixed rates plus the receivables by customers, rather than remitting toapplicable margin on the financial institutions the amounts collected, we retain such collections as proceeds for the sale of new receivables until payments become due.respective borrowings.
The Receivables Facility contains terms and conditions (including representations, covenants and conditions precedent) customary for transactions of this type. Additionally, an amortization event will occur if we fail to maintain a maximum average total leverage ratio (average total funded debt/EBITDA) of 3.25 to 1.00 and a minimum fixed charge coverage ratio (EBITDAR/cash interest expense plus rental expense) of 2.25 to 1.00.
At December 31, 2017, there was $100.0 million outstanding under the Receivables Facility at a weighted average effective interest rate of 2.3%, excluding commitment fees.
As of December 31, 2017,2023, we had two interest rate swap contracts in place and one forward-starting interest rate swap contract, each of which has the effect of converting our exposure to variable interest rates on a portion of our variable rate borrowings to fixed interest rates. For more information, see Note 5 of “Notes to Consolidated Financial Statements” included in Item 8 of this Form 10-K.
Compliance and Future Availability
As of December 31, 2023, we were in compliance with all covenants and financial ratio requirements under our Credit Facility, our Term Facility and our Receivables Facility. We believe we will remain in compliance with all covenants and financial ratio requirements throughout 2018.2024. For additional information regarding our debt arrangements, see Note 5 of “Notes to Consolidated Financial Statements,” included in Item 8 of this Form 10-K.
Future Obligations
We have certain fixed contractual obligations and commitments that include future estimated payments for general operating purposes. Changes in our business needs, fluctuating interest rates and other factors may result in actual payments differing from our estimates. We cannot provide certainty regarding the timing and amounts of these payments. The following table summarizes our obligations as of December 31, 2023 that are expected to impact liquidity and cash flow in future periods. We believe we have adequate availability of capitalwill be able to fund presentthese obligations through our existing cash, cash expected to be generated from operations and borrowings on our facilities.
| | | | | | | | | | | | | | | | | | | | | | | | | | | | | | | | |
| | | | | Payments Due by Period |
| | Total | | Less than
1 year | | 1-3 years | | 3-5 years | | More than
5 years |
| Long-term debt | | $ | 1,054,841 | | | $ | 229,903 | | | $ | 824,938 | | | $ | — | | | $ | — | |
| Operating leases | | 348,430 | | | 89,568 | | | 147,250 | | | 78,520 | | | 33,092 | |
| Purchase obligations | | 7,417 | | | 4,764 | | | 2,653 | | | — | | | — | |
| | | $ | 1,410,688 | | | $ | 324,235 | | | $ | 974,841 | | | $ | 78,520 | | | $ | 33,092 | |
The significant assumptions used in our determination of amounts presented in the current capacityabove table are as follows:
•Long-term debt amounts represent the future principal payments on our debt as of December 31, 2023. Our Receivables Facility matures November 1, 2024 and is included in the table above according to finance any working capital needs that may arise. We continually evaluate potential acquisitionsits stated maturity date. On our Consolidated Balance Sheets, we classify the entire outstanding balance of the Receivables Facility as Long-term debt as we intend and hold discussions with acquisition candidates. If suitable acquisition opportunities arise that would require financing, we believe that we have the ability to finance any such transactions.
As of February 21, 2018, $53.4 million ofrefinance the current Board authorized amount under our authorized share repurchase plan remained available. We expect to repurchase additional shares in the open market from time to time dependingobligations on market conditions. We plan to fund these repurchases with cash provided by operations and borrowings under the credit and receivables facilities.
Contractual Obligations
At December 31, 2017, our contractual obligations fora long-term debt and operating leases were as follows (in thousands):
|
| | | | | | | | | | | | | | | | | | | | |
| | | | | Payments Due by Period |
| | | Total | | Less than 1 year | | 1-3 years | | 3-5 years | | More than 5 years |
| Long-term debt | | $ | 519,337 |
| | $ | 8,898 |
| | $ | 100,000 |
| | $ | 410,439 |
| | $ | — |
|
| Operating leases | | 221,729 |
| | 55,874 |
| | 92,064 |
| | 52,368 |
| | 21,423 |
|
| | | $ | 741,066 |
| | $ | 64,772 |
| | $ | 192,064 |
| | $ | 462,807 |
| | $ | 21,423 |
|
basis. For additional discussion related toinformation regarding our debt arrangements, see Note 5 of our “Notes to Consolidated Financial Statements,” included in Item 8 of this Form 10-K.
•Operating lease amounts include future rental payments for our operating leases. The table below contains estimated interest payments (in thousands) relatedamounts presented are consistent with contractual terms and are not expected to differ significantly from actual results under our long-term debtexisting leases. For additional information regarding our operating leases, see Note 9 of our “Notes to Consolidated Financial Statements,” included in Item 8 of this Form 10-K.
•Purchase obligations listedinclude all legally binding contracts such as firm minimum commitments for inventory purchases and software commitments. We issue inventory purchase orders in the table above. Our estimatesnormal course of future interest paymentsbusiness, which represent authorizations to purchase that are calculated based on the December 31, 2017 outstanding debt balances, using the fixed rates undercancellable by their terms. We do not consider our interest rate swap agreements for the applicable notional amounts and the weighted average effective interest rates as of December 31, 2017 for the remaining outstanding balances not covered by our swap contracts. To project the estimated interest expensecancellable purchase orders to coincide with the time periods used inbe firm inventory commitments; therefore, they are excluded from the table above, we have projected the estimated debt balances for future years based on the scheduled maturity dates of the Credit Facility and the Receivables Facility. above.
For certain of our contractualfuture obligations, such as unrecognized tax benefits, uncertainties exist regarding the timing of future payments and the amount by which these potential obligations will increase or decrease over time. As such, we have excluded unrecognized tax benefits from our contractual obligations table.the table above. See Note 7 of “Notes to Consolidated Financial Statements,” included in Item 8 of this Form 10-K for more informationadditional discussion related to our unrecognized tax benefits. The table also excludes various other liabilities that are not contractual in nature, including contingent liabilities, litigation accruals and contract termination fees.
The table below contains estimated interest payments (in thousands) related to our long-term debt obligations presented in the table above. We calculated estimates of future interest payments based on the December 31, 2023 outstanding debt balances, using the fixed rates under our interest rate swap agreements for the applicable notional amounts and the weighted average effective interest rates as of December 31, 2023 for the remaining outstanding balances not covered by our swap contracts. To project the estimated interest expense to coincide with the time periods used in the table above, we projected the estimated debt balances for future years based on the scheduled maturity dates of the Credit Facility, the Term Facility and the Receivables Facility. Our actual interest payments could vary substantially from the amounts projected.
| | | | | | | | | | | | | | | | | | | | | | | | | | | | | | | | |
| | | | | Estimated Interest Payments Due by Period |
| | Total | | Less than
1 year | | 1-3 years | | 3-5 years | | More than
5 years |
| Interest | | $ | 126,056 | | | $ | 50,615 | | | $ | 74,508 | | | $ | 933 | | | $ | — | |
|
| | | | | | | | | | | | | | | | | | | | |
| | | | | Estimated Payments Due by Period |
| | | Total | | Less than 1 year | | 1-3 years | | 3-5 years | | More than 5 years |
| Interest | | $ | 60,405 |
| | $ | 14,076 |
| | $ | 25,684 |
| | $ | 20,645 |
| | $ | — |
|
Item 7A. Quantitative and Qualitative Disclosures about Market Risk
We are exposed to market risks, including interest rate risk and foreign currency risk. The adverse effects of potential changes in these market risks are discussed below. The following discussion does not consider the effects of the reduced level of overall economic activity that could exist following such changes. Further, in the event of changes of such magnitude, we would likely take actions to mitigate our exposure to such changes.
Interest Rate Risk
Our earnings are exposed to changes in short-term interest rates because of the variable interest rates on our debt. However, we have entered into interest rate swap contracts to reduce our exposure to market fluctuations. For information about our debt arrangements and interest rate swaps, see Note 5 of “Notes to Consolidated Financial Statements,” included in Item 8 of this Form 10‑K.
In 2017,2023, there was no interest rate risk related to the notional amounts under our interest rate swap contracts for the Credit Facility.contracts. The portions of our outstanding balances under the Credit Facility, Term Facility and the Receivables Facility that were not covered by our interest rate swap contracts were both subject to variable interest rates. To calculate the potential impact in 20172023 related to interest rate risk, we performed a sensitivity analysis assuming that we borrowed the monthly maximum available amount under the Credit Facility, excluding the accordion feature, and the off-season maximum amount available under the Receivables Facility and the amount outstanding under our Term Facility. In this analysis, we assumed that the variable interest rates for the Credit Facility and the Receivables Facility increased by 1.0%. Based on this calculation, our pretax income would have decreased by approximately $7.5$13.8 million and earnings per share would have decreased by approximately $0.13$0.26 per diluted share (based on the number of weighted average diluted shares outstanding for the year ended December 31, 2017)2023). The maximum amount available under the Credit Facility is $750.0 million, excluding the $75.0 million accordion feature$1.25 billion and the maximum amount available under the Receivables Facility is $215.0 million, excluding the $40.0 million seasonal increase in capacity available from March 1 to July 31.$350.0 million.
Failure of our swap counterparties would result in the loss of any potential benefit to us under our swap agreements. In this case, we would still be obligated to pay the variable interest payments underlying our debt agreements. Additionally, failure of our swap counterparties would not eliminate our obligation to continue to make payments under our existing swap agreements if we continue to be in a net pay position.
Currency Risk
We have subsidiariesChanges in Canada, the United Kingdom, Belgium, Croatia, France, Germany, Italy, Portugal, Spain, Mexico, Colombia and Australia. Based onexchange rates for the functional currencies for theseof our international subsidiaries, as shown in the table below, changes in exchange rates for these currencies may positively or negatively impact our sales, operating expenses and earnings. Historically, we have not hedged our currency exposure and fluctuations in exchange rates have not materially affected our operating results. While our international operations, including Canada and Mexico, accounted for only 9%7% of total net sales in 2017,2023, our exposure to currency rate fluctuations could be material in 20182024 and future years to the extent that either currency rate changes are significant or that our international operations comprise a larger percentage of our consolidated results.
| | | | | |
| Functional Currencies |
| Canada | Canadian Dollar |
Functional CurrenciesUnited Kingdom | British Pound |
CanadaBelgium | Canadian DollarEuro |
United KingdomCroatia | British PoundEuro |
BelgiumFrance | Euro |
CroatiaGermany | KunaEuro |
FranceItaly | Euro |
GermanyPortugal | Euro |
ItalySpain | Euro |
PortugalMexico | EuroMexican Peso |
SpainAustralia | Euro |
Mexico | Mexican Peso |
Colombia | Colombian Peso |
Australia | Australian Dollar |
Item 8. Financial Statements and Supplementary Data
INDEX TO CONSOLIDATED FINANCIAL STATEMENTS
Report of Independent Registered Public Accounting Firm
TheTo the Stockholders and the Board of Directors and Stockholders
of Pool Corporation
Opinion on the Financial Statements
We have audited the accompanying consolidated balance sheets of Pool Corporation (the Company) as of December 31, 20172023 and 2016,2022, the related consolidated statements of income, comprehensive income, changes in stockholders’ equity, and cash flows for each of the three years in the period ended December 31, 2017,2023, and the related notes (collectively referred to as the “consolidated financial statements”). In our opinion, the consolidated financial statements present fairly, in all material respects, the financial position of the Company as ofat December 31, 20172023 and 2016,2022, and the results of its operations and its cash flows for each of the three years in the period ended December 31, 2017,2023, in conformity with U.S. generally accepted accounting principles.
We also have also audited, in accordance with the standards of the Public Company Accounting Oversight Board (United States) (PCAOB), the Company’s internal control over financial reporting as of December 31, 2017,2023, based on criteria established in Internal Control-Integrated Framework issued by the Committee of Sponsoring Organizations of the Treadway Commission (2013 framework), and our report dated February 28, 201827, 2024 expressed an unqualified opinion thereon.
Basis for Opinion
These financial statements are the responsibility of the Company’s management. Our responsibility is to express an opinion on the Company’s financial statements based on our audits. We are a public accounting firm registered with the PCAOB and are required to be independent with respect to the Company in accordance with the U.S. federal securities laws and the applicable rules and regulations of the Securities and Exchange Commission and the PCAOB.
We conducted our audits in accordance with the standards of the PCAOB. Those standards require that we plan and perform the audit to obtain reasonable assurance about whether the financial statements are free of material misstatement, whether due to error or fraud. Our audits included performing procedures to assess the risks of material misstatement of the financial statements, whether due to error or fraud, and performing procedures that respond to those risks. Such procedures includeincluded examining, on a test basis, evidence regarding the amounts and disclosures in the financial statements. Our audits also included evaluating the accounting principles used and significant estimates made by management, as well as evaluating the overall presentation of the financial statements. We believe that our audits provide a reasonable basis for our opinion.
Critical Audit Matter

| | | | | | | | | | | |
| | Valuation of Goodwill |
| Description of the Matter | | At December 31, 2023, the Company’s goodwill was $700.1 million, including $403.5 million of goodwill relating to one reporting unit. As discussed in Note 3 of the consolidated financial statements, goodwill is tested for impairment at least annually at the reporting unit level. The Company’s goodwill is assigned to reporting units as of the acquisition date.
Auditing management’s annual goodwill impairment test for this reporting unit was complex and highly judgmental due to the estimation required to determine the fair value of the reporting unit. In particular, the fair value estimate is sensitive to certain assumptions, such as changes in the weighted average cost of capital, revenue growth rate, operating margin, and terminal growth rate which are affected by expectations about future market or economic conditions. |
| | | | | | | | | | | |
| How We Addressed the Matter in Our Audit | | We obtained an understanding, evaluated the design, and tested the operating effectiveness of controls over the Company’s goodwill impairment review process, including controls over management’s review of the significant assumptions described above.
To test the estimated fair value of the Company’s largest reporting unit, we performed audit procedures that included, among others, assessing methodologies and testing the significant assumptions discussed above and the underlying data used by the Company in its analysis. We compared the significant assumptions used by management to current industry and economic trends and other relevant factors, such as historical results. We assessed the historical accuracy of management’s estimates and performed sensitivity analyses of significant assumptions to evaluate the changes in the fair value of the reporting unit that would result from changes in the assumptions. We also involved a specialist to assist in our evaluation of the valuation methodology applied by the Company and certain significant assumptions used in estimating the fair value of the reporting unit. In addition, we reviewed the comparison of the Company’s fair value of its largest reporting unit and the fair value of all other reporting units to the Company’s market capitalization. |
/s/ Ernst & Young LLP
We have served as the Company’s auditor since 1994.
New Orleans, Louisiana
February 28, 201827, 2024
POOL CORPORATION
Consolidated Statements of Income
(In thousands, except per share data)
| | | | | | | | | | | | | | | | | |
| | Year Ended December 31, |
| | 2023 | | 2022 | | 2021 |
| Net sales | $ | 5,541,595 | | | $ | 6,179,727 | | | $ | 5,295,584 | |
| Cost of sales | 3,881,551 | | | 4,246,315 | | | 3,678,492 | |
| Gross profit | 1,660,044 | | | 1,933,412 | | | 1,617,092 | |
| Selling and administrative expenses | 913,477 | | | 907,629 | | | 784,308 | |
| | | | | |
| Operating income | 746,567 | | | 1,025,783 | | | 832,784 | |
| Interest and other non-operating expenses, net | 58,431 | | | 40,911 | | | 8,639 | |
| Income before income taxes and equity in earnings | 688,136 | | | 984,872 | | | 824,145 | |
| Provision for income taxes | 165,084 | | | 236,763 | | | 173,812 | |
| Equity in earnings of unconsolidated investments, net | 177 | | | 353 | | | 291 | |
| Net income | $ | 523,229 | | | $ | 748,462 | | | $ | 650,624 | |
| | | | | |
| | | | | |
| | | | | |
| Earnings per share attributable to common stockholders: | | | | | |
| Basic | $ | 13.45 | | | $ | 18.89 | | | $ | 16.21 | |
| Diluted | $ | 13.35 | | | $ | 18.70 | | | $ | 15.97 | |
| Weighted average common shares outstanding: | | | | | |
| Basic | 38,704 | | | 39,409 | | | 39,876 | |
| Diluted | 38,997 | | | 39,806 | | | 40,480 | |
| | | | | |
| Cash dividends declared per common share | $ | 4.30 | | | $ | 3.80 | | | $ | 2.98 | |
|
| | | | | | | | | | | |
| | Year Ended December 31, |
| | 2017 | | 2016 | | 2015 |
| Net sales | $ | 2,788,188 |
| | $ | 2,570,803 |
| | $ | 2,363,139 |
|
| Cost of sales | 1,982,899 |
| | 1,829,716 |
| | 1,687,495 |
|
| Gross profit | 805,289 |
| | 741,087 |
| | 675,644 |
|
| Selling and administrative expenses | 520,918 |
| | 485,228 |
| | 459,422 |
|
| Operating income | 284,371 |
| | 255,859 |
| | 216,222 |
|
| Interest and other non-operating expenses, net | 15,189 |
| | 14,481 |
| | 8,072 |
|
| Income before income taxes and equity earnings | 269,182 |
| | 241,378 |
| | 208,150 |
|
| Provision for income taxes | 77,982 |
| | 92,931 |
| | 80,137 |
|
| Equity earnings in unconsolidated investments, net | 139 |
| | 156 |
| | 211 |
|
| Net income | 191,339 |
| | 148,603 |
| | 128,224 |
|
| Net loss attributable to noncontrolling interest | 294 |
| | 352 |
| | 51 |
|
| Net income attributable to Pool Corporation | $ | 191,633 |
| | $ | 148,955 |
| | $ | 128,275 |
|
| | | | | | |
| Earnings per share: | | | | | |
| Basic | $ | 4.69 |
| | $ | 3.56 |
| | $ | 2.98 |
|
| Diluted | $ | 4.51 |
| | $ | 3.47 |
| | $ | 2.90 |
|
| Weighted average shares outstanding: | | | | | |
| Basic | 40,838 |
| | 41,872 |
| | 43,105 |
|
| Diluted | 42,449 |
| | 42,984 |
| | 44,254 |
|
| | | | | | |
| Cash dividends declared per common share | $ | 1.42 |
| | $ | 1.19 |
| | $ | 1.00 |
|
The accompanying Notes are an integral part of these Consolidated Financial Statements.
POOL CORPORATION
Consolidated Statements of Comprehensive Income
(In thousands)
| | | | | | | | | | | | | | | | | |
| | Year Ended December 31, |
| | 2023 | | 2022 | | 2021 |
| Net income | $ | 523,229 | | | $ | 748,462 | | | $ | 650,624 | |
| Other comprehensive income (loss): | | | | | |
| Foreign currency translation adjustments | 6,909 | | | (10,028) | | | (4,663) | |
Unrealized (losses) gains on interest rate swaps, net of the change in taxes of $2,074, $(7,802) and $(3,733) | (6,222) | | | 23,407 | | | 11,198 | |
| Total other comprehensive income | 687 | | | 13,379 | | | 6,535 | |
| Comprehensive income | $ | 523,916 | | | $ | 761,841 | | | $ | 657,159 | |
| | | | | |
| | | | | |
|
| | | | | | | | | | | |
| | Year Ended December 31, |
| | 2017 | | 2016 | | 2015 |
| Net income | $ | 191,339 |
| | $ | 148,603 |
| | $ | 128,224 |
|
| Other comprehensive income (loss): | | | | | |
| Foreign currency translation adjustments | 5,545 |
| | (1,661 | ) | | (9,046 | ) |
Change in unrealized gains and losses on interest rate swaps, net of the change in taxes of $(769), $(839) and $653 | 1,205 |
| | 1,312 |
| | (1,021 | ) |
| Total other comprehensive income (loss) | 6,750 |
| | (349 | ) | | (10,067 | ) |
| Comprehensive income | 198,089 |
| | 148,254 |
| | 118,157 |
|
| Comprehensive loss attributable to noncontrolling interest | 74 |
| | 378 |
| | 448 |
|
| Comprehensive income attributable to Pool Corporation | $ | 198,163 |
| | $ | 148,632 |
| | $ | 118,605 |
|
The accompanying Notes are an integral part of the Consolidated Financial Statements.
POOL CORPORATION
Consolidated Balance Sheets
(In thousands, except share data)
| | | | | | | | | | | |
| | December 31, |
| | 2023 | | 2022 |
| Assets | | | |
| Current assets: | | | |
| Cash and cash equivalents | $ | 66,540 | | | $ | 45,591 | |
| Receivables, net | 145,723 | | | 128,247 | |
| Receivables pledged under receivables facility | 197,187 | | | 223,201 | |
| Product inventories, net | 1,365,466 | | | 1,591,060 | |
| Prepaid expenses and other current assets | 40,444 | | | 30,892 | |
| | | |
| Total current assets | 1,815,360 | | | 2,018,991 | |
| | | |
| Property and equipment, net | 223,929 | | | 193,709 | |
| Goodwill | 700,078 | | | 691,993 | |
| Other intangible assets, net | 298,282 | | | 305,450 | |
| Equity interest investments | 1,305 | | | 1,248 | |
| Operating lease assets | 305,688 | | | 269,608 | |
| Other assets | 83,426 | | | 84,438 | |
| Total assets | $ | 3,428,068 | | | $ | 3,565,437 | |
| | | |
| Liabilities and stockholders’ equity | | | |
| Current liabilities: | | | |
| Accounts payable | $ | 508,672 | | | $ | 406,667 | |
| Accrued expenses and other current liabilities | 134,676 | | | 168,521 | |
| Short-term borrowings and current portion of long-term debt | 38,203 | | | 25,042 | |
| Current operating lease liabilities | 89,215 | | | 75,484 | |
| Total current liabilities | 770,766 | | | 675,714 | |
| | | |
| Deferred income taxes | 67,421 | | | 58,759 | |
| Long-term debt, net | 1,015,117 | | | 1,361,761 | |
| Other long-term liabilities | 40,028 | | | 35,471 | |
| Non-current operating lease liabilities | 221,949 | | | 198,538 | |
| Total liabilities | 2,115,281 | | | 2,330,243 | |
| | | |
| Stockholders’ equity: | | | |
Common stock, $0.001 par value; 100,000,000 shares authorized; 38,354,829 shares issued and outstanding at December 31, 2023 and 39,069,419 shares issued and outstanding at December 31, 2022 | 38 | | | 39 | |
| Additional paid-in capital | 606,177 | | | 575,776 | |
| Retained earnings | 699,990 | | | 653,484 | |
| Accumulated other comprehensive income | 6,582 | | | 5,895 | |
| Total stockholders’ equity | 1,312,787 | | | 1,235,194 | |
| Total liabilities and stockholders’ equity | $ | 3,428,068 | | | $ | 3,565,437 | |
|
| | | | | | | |
| | December 31, |
| | 2017 | | 2016 |
| Assets | | | |
| Current assets: | | | |
| Cash and cash equivalents | $ | 29,940 |
| | $ | 21,956 |
|
| Receivables, net | 76,597 |
| | 61,437 |
|
| Receivables pledged under receivables facility | 119,668 |
| | 104,714 |
|
| Product inventories, net | 536,474 |
| | 486,116 |
|
| Prepaid expenses and other current assets | 19,569 |
| | 15,318 |
|
| Deferred income taxes | — |
| | 6,016 |
|
| Total current assets | 782,248 |
| | 695,557 |
|
| | | | |
| Property and equipment, net | 100,939 |
| | 83,290 |
|
| Goodwill | 189,435 |
| | 184,795 |
|
| Other intangible assets, net | 13,223 |
| | 13,326 |
|
| Equity interest investments | 1,127 |
| | 1,172 |
|
| Other assets | 14,090 |
| | 15,955 |
|
| Total assets | $ | 1,101,062 |
| | $ | 994,095 |
|
| | | | |
| Liabilities, redeemable noncontrolling interest and stockholders’ equity | | | |
|
| Current liabilities: | | | |
|
| Accounts payable | $ | 245,249 |
| | $ | 230,728 |
|
| Accrued expenses and other current liabilities | 65,482 |
| | 64,387 |
|
| Short-term borrowings and current portion of long-term debt | 10,835 |
| | 1,105 |
|
| Total current liabilities | 321,566 |
| | 296,220 |
|
| | | | |
| Deferred income taxes | 24,585 |
| | 34,475 |
|
| Long-term debt, net | 508,815 |
| | 436,937 |
|
| Other long-term liabilities | 22,950 |
| | 18,966 |
|
| Total liabilities | 877,916 |
| | 786,598 |
|
| | | | |
| Redeemable noncontrolling interest | — |
| | 2,287 |
|
| | | | |
| Stockholders’ equity: | | | |
|
Common stock, $.001 par value; 100,000,000 shares authorized; 40,212,477 shares issued and outstanding at December 31, 2017 and 41,089,720 shares issued and outstanding at December 31, 2016 | 40 |
| | 41 |
|
| Additional paid-in capital | 426,750 |
| | 403,162 |
|
| Retained deficit | (196,316 | ) | | (183,915 | ) |
| Accumulated other comprehensive loss | (7,328 | ) | | (14,078 | ) |
| Total stockholders’ equity | 223,146 |
| | 205,210 |
|
| Total liabilities, redeemable noncontrolling interest and stockholders’ equity | $ | 1,101,062 |
| | $ | 994,095 |
|
The accompanying Notes are an integral part of these Consolidated Financial Statements.
POOL CORPORATION
Consolidated Statements of Cash Flows
(In thousands) | | | | | | | | | | | | | | | | | |
| | Year Ended December 31, |
| | 2023 | | 2022 | | 2021 |
| Operating activities | | | | | |
| Net income | $ | 523,229 | | | $ | 748,462 | | | $ | 650,624 | |
| Adjustments to reconcile net income to net cash provided by operating activities: | | | | | |
| Depreciation | 31,585 | | | 30,381 | | | 28,287 | |
| Amortization | 8,555 | | | 8,644 | | | 1,739 | |
| Share-based compensation | 19,582 | | | 14,879 | | | 15,187 | |
| | | | | |
| Provision for doubtful accounts receivable, net of write-offs | 2,197 | | | 3,580 | | | 1,134 | |
| Provision for inventory obsolescence, net of write-offs | 1,930 | | | 5,869 | | | 3,798 | |
| Provision for deferred income taxes | 10,359 | | | 15,169 | | | 4,650 | |
| Gains on sales of property and equipment | (317) | | | (527) | | | (93) | |
| Equity in earnings of unconsolidated investments, net | (177) | | | (353) | | | (291) | |
| Net (gains) losses on foreign currency transactions | (813) | | | 48 | | | 325 | |
| Goodwill impairment | 550 | | | 605 | | | — | |
| Other | 200 | | | 472 | | | 473 | |
| Changes in operating assets and liabilities, net of effects of acquisitions: | | | | | |
| Receivables | 10,108 | | | 19,685 | | | (79,940) | |
| Product inventories | 231,240 | | | (263,567) | | | (525,207) | |
| Prepaid expenses and other assets | 57,840 | | | (52,815) | | | (51,199) | |
| Accounts payable | 96,128 | | | 7,597 | | | 114,893 | |
| Accrued expenses and other liabilities | (103,967) | | | (53,275) | | | 149,110 | |
| Net cash provided by operating activities | 888,229 | | | 484,854 | | | 313,490 | |
| | | | | |
| Investing activities | | | | | |
| Acquisition of businesses, net of cash acquired | (11,533) | | | (9,264) | | | (811,956) | |
| Purchases of property and equipment, net of sale proceeds | (60,096) | | | (43,619) | | | (37,658) | |
| | | | | |
| | | | | |
| Other investments, net | 32 | | | 2,013 | | | — | |
| Net cash used in investing activities | (71,597) | | | (50,870) | | | (849,614) | |
| | | | | |
| Financing activities | | | | | |
| Proceeds from revolving line of credit | 1,548,618 | | | 1,917,173 | | | 1,438,408 | |
| Payments on revolving line of credit | (1,815,829) | | | (1,970,388) | | | (974,506) | |
| Proceeds from term loan under credit facility | — | | | 250,000 | | | 250,000 | |
| Payments on term loan under credit facility | (12,500) | | | — | | | — | |
| Proceeds from asset-backed financing | 552,500 | | | 220,000 | | | 495,000 | |
| Payments on asset-backed financing | (560,300) | | | (205,500) | | | (430,000) | |
| | | | | |
| Payments on term facility | (47,313) | | | (9,250) | | | (9,250) | |
| Proceeds from short-term borrowings and current portion of long-term debt | 19,998 | | | 28,445 | | | 9,279 | |
| Payments on short-term borrowings and current portion of long-term debt | (19,338) | | | (27,675) | | | (9,377) | |
| Payments of deferred financing costs | (52) | | | (170) | | | (2,638) | |
| Payments of deferred and contingent acquisition consideration | (551) | | | (1,374) | | | (362) | |
| | | | | |
| | | | | |
| Proceeds from stock issued under share-based compensation plans | 10,455 | | | 8,934 | | | 17,197 | |
| Payments of cash dividends | (167,461) | | | (150,624) | | | (119,581) | |
| Repurchases of common stock | (306,359) | | | (471,229) | | | (138,039) | |
| Net cash used in financing activities | (798,132) | | | (411,658) | | | 526,131 | |
| Effect of exchange rate changes on cash and cash equivalents | 2,449 | | | (1,056) | | | 186 | |
| Change in cash and cash equivalents | 20,949 | | | 21,270 | | | (9,807) | |
| Cash and cash equivalents at beginning of year | 45,591 | | | 24,321 | | | 34,128 | |
| Cash and cash equivalents at end of year | $ | 66,540 | | | $ | 45,591 | | | $ | 24,321 | |
|
| | | | | | | | | | | |
| | Year Ended December 31, |
| | 2017 | | 2016 | | 2015 |
| Operating activities | | | | | |
| Net income | $ | 191,339 |
| | $ | 148,603 |
| | $ | 128,224 |
|
| Adjustments to reconcile net income to net cash provided by operating activities: | | | | | |
|
| Depreciation | 24,157 |
| | 20,338 |
| | 16,373 |
|
| Amortization | 1,568 |
| | 1,639 |
| | 1,015 |
|
| Share-based compensation | 12,482 |
| | 9,902 |
| | 9,543 |
|
| Excess tax benefits from share-based compensation | — |
| | (7,370 | ) | | (7,706 | ) |
| Provision for doubtful accounts receivable, net of write-offs | (154 | ) | | (155 | ) | | 197 |
|
| Provision for inventory obsolescence, net of write-offs | (267 | ) | | (448 | ) | | 576 |
|
| Provision (benefit) for deferred income taxes | (4,636 | ) | | 3,749 |
| | 4,198 |
|
| (Gains) losses on sales of property and equipment | (285 | ) | | (320 | ) | | 230 |
|
| Equity earnings in unconsolidated investments, net | (139 | ) | | (156 | ) | | (211 | ) |
| Net (gains) losses on foreign currency transactions | (171 | ) | | 679 |
| | 774 |
|
| Impairments of goodwill and other non-operating assets | 1,200 |
| | 4,113 |
| | 500 |
|
| Other | 166 |
| | 923 |
| | (869 | ) |
| Changes in operating assets and liabilities, net of effects of acquisitions: | | | | | |
|
| Receivables | (21,903 | ) | | (5,666 | ) | | (16,656 | ) |
| Product inventories | (35,783 | ) | | (8,050 | ) | | (10,848 | ) |
| Prepaid expenses and other assets | (4,096 | ) | | (3,077 | ) | | (434 | ) |
| Accounts payable | 5,077 |
| | (17,896 | ) | | 9,956 |
|
| Accrued expenses and other current liabilities | 6,756 |
| | 18,570 |
| | 11,188 |
|
| Net cash provided by operating activities | 175,311 |
| | 165,378 |
| | 146,050 |
|
| | | | | | |
| Investing activities | | | |
| | |
|
| Acquisition of businesses, net of cash acquired | (12,834 | ) | | (19,730 | ) | | (4,483 | ) |
| Purchases of property and equipment, net of sale proceeds | (39,390 | ) | | (34,352 | ) | | (29,095 | ) |
| Payments to fund credit agreement | — |
| | (5,322 | ) | | (8,860 | ) |
| Collections from credit agreement | — |
| | 3,737 |
| | 4,557 |
|
| Other investments, net | 4 |
| | 24 |
| | 88 |
|
| Net cash used in investing activities | (52,220 | ) | | (55,643 | ) | | (37,793 | ) |
| | | | | | |
| Financing activities | | | | | |
|
| Proceeds from revolving line of credit | 1,067,868 |
| | 1,154,090 |
| | 911,712 |
|
| Payments on revolving line of credit | (1,011,977 | ) | | (1,072,557 | ) | | (890,406 | ) |
| Proceeds from asset-backed financing | 161,600 |
| | 155,000 |
| | 143,400 |
|
| Payments on asset-backed financing | (145,100 | ) | | (126,500 | ) | | (156,000 | ) |
| Proceeds from short-term borrowings and current portion of long-term debt | 27,333 |
| | 18,442 |
| | 8,119 |
|
| Payments on short-term borrowings and current portion of long-term debt | (17,603 | ) | | (19,037 | ) | | (7,948 | ) |
| Payments on deferred and contingent acquisition consideration | (324 | ) | | — |
| | — |
|
| Purchase of redeemable non-controlling interest | (2,573 | ) | | — |
| | — |
|
| Payments of deferred financing costs | (1,104 | ) | | (69 | ) | | (320 | ) |
| Excess tax benefits from share-based compensation | — |
| | 7,370 |
| | 7,706 |
|
| Proceeds from stock issued under share-based compensation plans | 11,466 |
| | 11,752 |
| | 18,269 |
|
| Payments of cash dividends | (58,029 | ) | | (49,749 | ) | | (43,117 | ) |
| Purchases of treasury stock | (146,006 | ) | | (178,414 | ) | | (99,219 | ) |
| Net cash used in financing activities | (114,449 | ) | | (99,672 | ) | | (107,804 | ) |
| Effect of exchange rate changes on cash and cash equivalents | (658 | ) | | (1,344 | ) | | (2,046 | ) |
| Change in cash and cash equivalents | 7,984 |
| | 8,719 |
| | (1,593 | ) |
| Cash and cash equivalents at beginning of year | 21,956 |
| | 13,237 |
| | 14,830 |
|
| Cash and cash equivalents at end of year | $ | 29,940 |
| | $ | 21,956 |
| | $ | 13,237 |
|
The accompanying Notes are an integral part of these Consolidated Financial Statements.
POOL CORPORATION
Consolidated Statements of Changes in Stockholders’ Equity
(In thousands)
| | | | | | | | | | | | | | | | | | | | | | | | | | | | | | | | | | | | | | | | |
| | Common Stock | | | | Additional
Paid-In | | Retained | | Accumulated
Other
Comprehensive | | |
| | | Shares | | Amount | | | | Capital | | Earnings | | (Loss) Income | | Total |
| Balance at December 31, 2020 | | 40,232 | | | 40 | | | | | 519,579 | | | 133,870 | | | (14,019) | | | 639,470 | |
| Net income | | — | | | — | | | | | — | | | 650,624 | | | — | | | 650,624 | |
| Foreign currency translation | | — | | | — | | | | | — | | | — | | | (4,663) | | | (4,663) | |
| Interest rate swaps, net of the change in taxes of $(3,733) | | — | | | — | | | | | — | | | — | | | 11,198 | | | 11,198 | |
| Repurchases of common stock, net of retirements | | (360) | | | — | | | | | — | | | (138,039) | | | — | | | (138,039) | |
| Share-based compensation | | — | | | — | | | | | 15,187 | | | — | | | — | | | 15,187 | |
| Issuance of stock under share-based compensation plans | | 321 | | | — | | | | | 17,197 | | | — | | | — | | | 17,197 | |
| Declaration of cash dividends | | — | | | — | | | | | — | | | (119,581) | | | — | | | (119,581) | |
| Balance at December 31, 2021 | | 40,193 | | | 40 | | | | | 551,963 | | | 526,874 | | | (7,484) | | | 1,071,393 | |
| Net income | | — | | | — | | | | | — | | | 748,462 | | | — | | | 748,462 | |
| Foreign currency translation | | — | | | — | | | | | — | | | — | | | (10,028) | | | (10,028) | |
| Interest rate swaps, net of the change in taxes of $(7,802) | | — | | | — | | | | | — | | | — | | | 23,407 | | | 23,407 | |
| Repurchases of common stock, net of retirements | | (1,234) | | | (1) | | | | | — | | | (471,228) | | | — | | | (471,229) | |
| Share-based compensation | | — | | | — | | | | | 14,879 | | | — | | | — | | | 14,879 | |
| Issuance of stock under share-based compensation plans | | 110 | | | — | | | | | 8,934 | | | — | | | — | | | 8,934 | |
| Declaration of cash dividends | | — | | | — | | | | | — | | | (150,624) | | | — | | | (150,624) | |
| Balance at December 31, 2022 | | 39,069 | | | 39 | | | | | 575,776 | | | 653,484 | | | 5,895 | | | 1,235,194 | |
| Net income | | — | | | — | | | | | — | | | 523,229 | | | — | | | 523,229 | |
| Foreign currency translation | | — | | | — | | | | | — | | | — | | | 6,909 | | | 6,909 | |
| Interest rate swaps, net of the change in taxes of $2,074 | | — | | | — | | | | | — | | | — | | | (6,222) | | | (6,222) | |
| Repurchases of common stock, net of retirements | | (862) | | | (1) | | | | | — | | | (309,262) | | | — | | | (309,263) | |
| Share-based compensation | | — | | | — | | | | | 19,582 | | | — | | | — | | | 19,582 | |
| Issuance of stock under share-based compensation plans | | 148 | | | — | | | | | 10,819 | | | — | | | — | | | 10,819 | |
| Declaration of cash dividends | | — | | | — | | | | | — | | | (167,461) | | | — | | | (167,461) | |
| Balance at December 31, 2023 | | 38,355 | | | $ | 38 | | | | | $ | 606,177 | | | $ | 699,990 | | | $ | 6,582 | | | $ | 1,312,787 | |
|
| | | | | | | | | | | | | | | | | | | | | | | |
| | | Common Stock | | Additional Paid-In | | Retained | | Accumulated Other Comprehensive | | |
| | | Shares | | Amount | | Capital | | Deficit | | Loss | | Total |
| Balance at December 31, 2014 | | 43,511 |
| | $ | 44 |
| | $ | 338,620 |
| | $ | (90,650 | ) | | $ | (3,662 | ) | | $ | 244,352 |
|
| Net income attributable to Pool Corporation | | — |
| | — |
| | — |
| | 128,275 |
| | — |
| | 128,275 |
|
| Foreign currency translation | | — |
| | — |
| | — |
| | — |
| | (9,046 | ) | | (9,046 | ) |
| Interest rate swaps, net of the change in taxes of $653 | | — |
| | — |
| | — |
| | — |
| | (1,021 | ) | | (1,021 | ) |
| Repurchases of common stock, net of retirements | | (1,448 | ) | | (2 | ) | | — |
| | (99,217 | ) | | — |
| | (99,219 | ) |
| Share-based compensation | | — |
| | — |
| | 9,543 |
| | — |
| | — |
| | 9,543 |
|
| Issuance of shares under incentive stock plans, including tax benefit of $7,706 | | 648 |
| | 1 |
| | 25,975 |
| | — |
| | — |
| | 25,976 |
|
| Declaration of cash dividends | | — |
| | — |
| | — |
| | (43,117 | ) | | — |
| | (43,117 | ) |
| Balance at December 31, 2015 | | 42,711 |
| | 43 |
| | 374,138 |
| | (104,709 | ) | | (13,729 | ) | | 255,743 |
|
| Net income attributable to Pool Corporation | | — |
| | — |
| | — |
| | 148,955 |
| | — |
| | 148,955 |
|
| Foreign currency translation | | — |
| | — |
| | — |
| | — |
| | (1,661 | ) | | (1,661 | ) |
| Interest rate swaps, net of the change in taxes of $(839) | | — |
| | — |
| | — |
| | — |
| | 1,312 |
| | 1,312 |
|
| Repurchases of common stock, net of retirements | | (2,064 | ) | | (2 | ) | | — |
| | (178,412 | ) | | — |
| | (178,414 | ) |
| Share-based compensation | | — |
| | — |
| | 9,902 |
| | — |
| | — |
| | 9,902 |
|
| Issuance of shares under incentive stock plans, including tax benefit of $7,370 | | 443 |
| | — |
| | 19,122 |
| | — |
| | — |
| | 19,122 |
|
| Declaration of cash dividends | | — |
| | — |
| | — |
| | (49,749 | ) | | — |
| | (49,749 | ) |
| Balance at December 31, 2016 | | 41,090 |
| | 41 |
| | 403,162 |
| | (183,915 | ) | | (14,078 | ) | | 205,210 |
|
| Net income attributable to Pool Corporation | | — |
| | — |
| | — |
| | 191,633 |
| | — |
| | 191,633 |
|
| Foreign currency translation | | — |
| | — |
| | — |
| | — |
| | 5,545 |
| | 5,545 |
|
| Interest rate swaps, net of the change in taxes of $(769) | | — |
| | — |
| | — |
| | — |
| | 1,205 |
| | 1,205 |
|
| Repurchases of common stock, net of retirements | | (1,353 | ) | | (1 | ) | | — |
| | (146,005 | ) | | — |
| | (146,006 | ) |
| Share-based compensation | | — |
| | — |
| | 12,482 |
| | — |
| | — |
| | 12,482 |
|
| Issuance of shares under incentive stock plans (see Note 1 for tax benefit accounting change) | | 475 |
| | — |
| | 11,466 |
| | — |
| | — |
| | 11,466 |
|
| Declaration of cash dividends | | — |
| | — |
| | — |
| | (58,029 | ) | | — |
| | (58,029 | ) |
| Redemption value adjustment of redeemable non-controlling interest | | — |
| | — |
| | (360 | ) | | — |
| | — |
| | (360 | ) |
| Balance at December 31, 2017 | | 40,212 |
| | $ | 40 |
| | $ | 426,750 |
| | $ | (196,316 | ) | | $ | (7,328 | ) | | $ | 223,146 |
|
The accompanying Notes are an integral part of these Consolidated Financial Statements.
POOL CORPORATION
Notes to Consolidated Financial Statements
Note 1 - Organization and Summary of Significant Accounting Policies
Description of Business
As of December 31, 2017,2023, Pool Corporation and our subsidiaries (the Company, which may also be referred to as we, us or our), operated 351439 sales centers in North America, Europe South America and Australia from which we sell swimming pool supplies, equipment parts and supplies,related leisure products, irrigation and relatedlandscape maintenance products and hardscape, tile and stone products to pool builders, retail stores, service companies, landscape contractors and golf courses.others. We distribute products through fourfive networks: SCP Distributors (SCP), Superior Pool Products (Superior), Horizon Distributors (Horizon) and, National Pool Tile (NPT) and Sun Wholesale Supply (Sun Wholesale).
Basis of Presentation and Principles of Consolidation
We prepared the Consolidated Financial Statements following U.S. generally accepted accounting principles (GAAP) and the requirements of the Securities and Exchange Commission (SEC). The financial statements include all normal and recurring adjustments that are necessary for a fair presentation of our financial position and operating results. The Consolidated Financial Statements include the accounts of Pool Corporation and our subsidiaries. All of our subsidiaries are wholly owned. All significant intercompany accounts and intercompany transactions have been eliminated.
All of our subsidiaries are wholly owned. From July 31, 2014 to June 29, 2017, we owned a 60% interest in Pool Systems Pty. Ltd. (PSL), an Australian company. Our ownership percentage constituted a controlling interest in the acquired company, which required us to consolidate PSL’s financial position and results of operations from the date of acquisition. On June 29, 2017, we purchased the remaining 40% interest in PSL. Thus, we will continue to consolidate PSL, but there will no longer be a separate noncontrolling interest reported on our Consolidated Statements of Income, nor Redeemable noncontrolling interest reported on our Consolidated Balance Sheets.
Variable Interest Entity
In February 2015, we entered into a five-year credit agreement with a swimming pool retailer. Under this agreement and the related revolving note, we were the primary lender of operating funds for this entity. The total lending commitment under the credit agreement was $8.5 million. In December 2017, we ended our lending arrangement with this entity and exercised our rights to the collateral that secured this agreement. The collateral was sufficient to satisfy the net balance previously recorded within Other assets on our Consolidated Balance Sheets.
Use of Estimates
To prepare financial statements that conform to GAAP, we make estimates and assumptions that affect the amounts reported in our financial statements and accompanying notes. Our most significant estimates relate to the allowance for doubtful accounts, inventory obsolescence reserves, vendor incentives,programs, income taxes, incentiveperformance-based compensation accruals and goodwill impairment evaluations. We continually review our estimates and make adjustments as necessary, but actual results could be significantly different from what we expected when we made these estimates.
Newly Adopted Accounting Pronouncements
Effective January 1, 2017,On June 30, 2023, we adopted Accounting Standards Update (ASU) 2016-09, Improvements to Employee Share-Based Payment Accounting2020-04, Reference Rate Reform (Topic 848), on a prospective basis and as such, our prior year presentation has not changed. The provisions of this update simplify many key aspectsFacilitation of the Effects of Reference Rate Reform on Financial Reporting, and all related amendments, which are codified into Accounting Standards Codification (ASC) 848. This standard provides optional expedients and exceptions for applying GAAP to transactions affected by reference rate reform if certain criteria are met. These transactions include contract modifications, hedging relationships and sale or transfer of debt securities classified as held-to-maturity. Prior to our debt amendments in June 2023, discussed further in Note 5, we adopted the hedge accounting for and cash flow presentationexpedient related to the probability of employee share-based compensationforecasted transactions including accounting for income taxes, forfeitures, and statutory withholding requirements. In accordance with the new guidance, we now record all excess tax benefits or tax deficiencies as a component of our Provision for income taxes on our Consolidated Statements of Income. As a resultto assert probability of the adoption, we recognized $12.6 millionhedged interest regardless of excess tax benefits in 2017, which reduced our Provision for income taxes and positively impacted our Net income. Historically, these amounts were recorded as Additional paid in capital in stockholders’ equity on our Consolidated Balance Sheets. Additionally, we now present excess tax benefits or deficiencies as operating cash flows versus reclassifying the amount out of operating cash flows and presenting it in financing activities on the Consolidated Statements of Cash Flows.
Additional amendments from this guidanceany expected modification related to forfeitures and minimum statutory withholding tax requirements had no impact to our financial position, results of operations or cash flows. As permitted, we continue to estimate forfeitures to determine the amount of compensation cost to be recognized each period rather than electing to account for forfeitures as they occur, and we continue to present the value of shares withheld for minimum statutory tax withholding requirements on the Consolidated Statements of Cash Flows as a financing activity. Another impact of the adoption is that the calculation of the effect of dilutive securities now excludes any derived excess tax benefits or deficiencies from assumed future proceeds, resulting in an increase in diluted weighted average shares outstanding of approximately 550,000 shares for the year ended December 31, 2017.
On January 1, 2017, we adopted ASU 2015-17, Balance Sheet Classification of Deferred Taxes, which requires we classify all deferred tax assets and liabilities as noncurrent on the balance sheet rather than separately presenting net deferred tax assets or liabilities as current or noncurrent. Additionally, we no longer allocate valuation allowances between current and noncurrent deferred tax assets because those allowances are also now classified as noncurrent. As permitted, we elected to adopt this guidance on a prospective basis and as such, our prior year presentation has not changed.reference rate reform. The adoption of ASU 2015-17this standard did not have a material impact on our consolidated financial position, results of operationsstatements or related disclosures, and related disclosures.
On January 1, 2017, we adopted ASU 2015-11, Inventory (Topic 330): Simplifying the Measurement of Inventory, which requires that we measure inventory at the lower of cost or net realizable value rather than at the lower of cost or market. Net realizable value is the estimated selling price in the ordinary course of business less reasonably predictable costs of completion, disposal and transportation. The adoption of ASU 2015-11 diddo not haveexpect a material impact on our financial position, results of operations and related disclosures.in future periods.
On January 1, 2017, we adopted ASU 2015-16, Simplifying the Accounting for Measurement-Period Adjustments, which eliminates the requirement that an acquirer in a business combination account for measurement-period adjustments retrospectively. Instead, an acquirer will recognize a measurement-period adjustment during the period in which it determines the amount of the adjustment. The adoption of ASU 2015-16 did not have a material impact on our financial position, results of operations and related disclosures.
As required, we adopted ASU 2014-15, Presentation of Financial Statements - Going Concern, as of December 31, 2016. Based on management’s evaluation, which included forecasting results covering the one-year period following our 2017 Form 10-K filing date, we did not identify any conditions or events that raise substantial doubt about our ability to continue as a going concern.
Segment Reporting
Since all of our sales centers have similar operations and share similar economic characteristics, we aggregate our sales centers into a single reportable segment. These similarities include (i) the nature of our products and services, (ii) the types of customers we sell to and (iii) the distribution methods we use. Our chief operating decision maker (CODM) evaluates each sales center based on individual performance that includes both financial and operational measures. These measures include operating income growth and accounts receivable and inventory management criteria. Each sales center manager and eligible field employee earns performance-based incentive compensation based on these measures developed at the sales center level.
A bottom-up approach is used to develop the operating budget for each individual sales center. The CODM approves the budget and routinely monitors budget to actual results for each sales center. Additionally, our CODM makes resource allocation decisions about how to allocate resources primarily on a sales center-by-sales center basis. No single sales center meets any of the quantitative thresholds (10% of revenues, profit or assets) for separately reporting information about an operating segment. We do not track sales by product lines and product categories on a consolidated basis. We lack readily available financial information due to the number of our product lines and product categories and the fact that we make ongoing changes as to how products are classifiedproduct classifications within these groups, thus making it impracticable to report our sales by product category.
Seasonality and Weather
Our business is highly seasonal, and weather is one of the principal external factors affecting our business. In general, sales and net income are highest during the second and third quarters, which represent the peak months of both swimming pool use, pool and irrigation installation and irrigation installationsremodeling and maintenance.repair activities. Sales are substantially lower during the first and fourth quarters, when we may incur net losses.quarters.
Revenue Recognition
We recognize revenuea sale when four basic criteria are met:
1. persuasive evidencea customer obtains control of an arrangement exists;
2. delivery has occurred or services have been rendered;
3. our pricethe product, and we record the amount that reflects the consideration we expect to the buyer is fixed or determinable; and
4. collectability is reasonably assured.
Customers may take delivery of productsreceive in exchange for such product. We recognize a variety of ways. Customers may picksale when a customer picks up productsproduct at any sales center, location, orwhen we may deliver productsproduct to their premises or job sites via our trucks; in these instances, we record revenue upon delivery to the customers. We also deliver products through third party carriers, and we record revenuetrucks or when we present the product to a third-party carrier. For bill and hold sales, we determine when the third party carriers. Products shipped via third party carrierscustomer obtains control of the product on a case-by-case basis to determine the amount of revenue to recognize each period.
We consider our distribution of products to represent one reportable revenue stream. Our products are considered delivered based onsimilar in nature, and our revenue recognition policy is the shipping terms, which are generally FOB shipping point.same across our distribution networks. Our customers share similar characteristics and purchase products across all categories. We recognize revenue when our customers take control of our products. We include shipping and handling fees billed to customers as freight out income within net sales.
We measure revenue as the amount of consideration we expect to receive in exchange for transferring our products. Consideration may vary due to volume incentives and expected customer returns. We offer volume incentives to some of our customers and we account for these incentives as an adjustment toa reduction of sales. We estimate the amount of volume incentives earned based on our estimate of cumulative sales for the fiscal year relative to our customers’ progress toward achieving minimum purchase requirements. We record customer returns, including those associated with customer early buy programs, as an adjustment toa reduction of sales. Based on available information related to our customers’ returns, we record an allowance for estimated returns, which historically has not been material. We regularly review our marketing programs, coupons and customary business practices to determine if any variable consideration exists. Other items that we record as adjustmentsreductions to sales include cash discounts, pricing adjustments and credit card fees related to customer payments.
The majority of our sales transactions do not contain additional performance obligations after delivery; therefore, we do not have multiple performance obligations for which to allocate the transaction price. We recognize shipping and handling costs associated with outbound freight in selling and administrative expenses.
We also report sales net of tax amounts that we collect from our customers and remit to governmental authorities. These tax amounts may include, but are not limited to, sales, use, value addedvalue-added and some excise taxes.
Effective January 1, 2018, we will adopt ASU 2014-09, Revenue from Contracts with Customers, and subsequent amendments. Under the new standard, revenue will be recognized when we satisfy our performance obligation by transferring promised products to our customer. We expect to recognize revenue when control of the product has been transferred to the customer upon delivery to the customer or the freight carrier, if delivered by a third party, as we believe our performance obligation is satisfied at such point in time. This treatment is consistent with our current revenue recognition policies. We evaluated our bill and hold sales under the new guidance and determined that revenue may be recognized earlier under ASU 2014-09. However, at December 31, 2017, a cumulative catch-up adjustment related to bill and hold transactions would not be material due to the seasonal nature of our business.
We reviewed our terms and conditions, marketing programs, coupons and customary business practices to determine if any variable consideration exists in our revenue transactions. We did not identify any arrangements that would cause different accounting treatment under the new guidance. The majority of our sales transactions do not require any additional performance obligation after delivery; therefore, we do not have multiple performance obligations for which we will have to allocate the transaction price. We will continue our accounting policy election to exclude from revenue all amounts we collect and remit to governmental authorities.
As allowed under ASU 2014-09, we will apply the guidance using the modified retrospective transition method, whereby we will recognize the cumulative effect of initially applying the new standard as an adjustment to our opening balance of retained earnings (deficit). Based on our analysis, the adoption of ASU 2014-09 will not have a material impact on our financial position or results of operations. Our adoption will result in balance sheet reclassifications for recording our estimate for customer returns. Historically, our deferred revenue liability for customer returns has not been material. ASU 2014-09 requires the recognition of a current liability for the gross amount of the estimated returns and a current asset for the cost of the related products (each less than $1.0 million at December 31, 2017). We will also provide enhanced disclosures regarding our revenue recognition policies.
Vendor Programs
Many of our arrangements with our vendors provide for us to receive specified amounts of consideration when we achieve any of a number of measures. These measures are generally related to the volume level of purchases from our vendors, or our net cost of products sold, and may include negotiated pricing arrangements. We account for vendor programs as a reduction of the prices of the vendors’ products and as a reduction of inventory until we sell the products, at which time such considerations are recognized as a reduction of Cost of sales on our Consolidated Statements of Income.
Throughout the year, we estimate the amount earned based on our estimateexpectation of total purchases for the fiscal year relative to the purchase levels that mark our progress toward earning each program. We accrue vendor benefits on a monthly basis using these estimates, provided that we determine they are probable and reasonably estimable. We continually revise these estimates to reflect actual credits earned based on actual purchase levels and trends related to sales and purchasing mix. When we make adjustments to our estimates, we determine whether any portion of the adjustment impacts the amount of vendor credits that are deferred in inventory. We recognize changes in our estimates as a cumulative catch-up adjustment to the amounts recognized to date in our Consolidated Financial Statements.
Shipping and Handling Costs
We record shipping and handling costs associated with inbound freight as cost of sales. The table below presents shipping and handling costs associated with outbound freight, which we include in selling and administrative expenses (in thousands):
| | | | | | | | | | | | | | |
| 2023 | | 2022 | | 2021 |
| $ | 84,932 | | | $ | 89,002 | | | $ | 75,411 | |
|
| | | | | | | | | | |
| 2017 | | 2016 | | 2015 |
| $ | 45,247 |
| | $ | 39,879 |
| | $ | 36,783 |
|
Share-Based Compensation
We record share-based compensation for stock options and other share-based awards based on the estimated fair value as measured on the grant date. For stock option awards, we use a Black-Scholes model for estimating the grant date fair value. For additional discussion of share-based compensation, see Note 6.
Advertising Costs
We expense advertising costs when incurred. The table below presents advertising expense for the past three years (in thousands):
| | | | | | | | | | | | | | |
| 2023 | | 2022 | | 2021 |
| $ | 28,532 | | | $ | 28,778 | | | $ | 9,409 | |
|
| | | | | | | | | | |
| 2017 | | 2016 | | 2015 |
| $ | 7,477 |
| | $ | 7,011 |
| | $ | 7,127 |
|
The increase in advertising costs from 2021 to 2022 is driven by our December 2021 acquisition of Porpoise Pool & Patio, Inc., and primarily relates to an advertising fund based on a percentage of Pinch A Penny franchisee sales.
Income Taxes
We reduce federal and state income taxes payable by the tax benefits associated with the exercise of nonqualified stock options and the lapse of restrictions on restricted stock awards. To the extent realized tax deductions exceed the amount of previously recognized deferred tax benefits related to share-based compensation, we record an excess tax benefit. We record all excess tax benefits as a component of income tax benefit or expense in the income statement in the period in which stock options are exercised or restrictions on stock awards lapse.
We record deferred tax assetsGlobal Intangible Low Tax Income (GILTI) on foreign earnings as period costs if and liabilities based on differences between the financial reporting and tax basis of assets and liabilities using currently enacted rates and laws that will be in effect when we expect the differences to reverse. Due to changing tax laws and state income tax rates, significant judgment is required to estimate the effective tax rate expected to apply to tax differences that are expected to reverse in the future.
In December 2017, the Tax Cuts and Jobs Act (TJCA or the Act) was enacted, which significantly changes U.S. tax law. In accordance with Accounting Standards Codification Topic (ASC) 740, Income Taxes, we are required to account for the new requirements in the period that includes the date of enactment. The Act reduces the overall corporate income tax rate to 21%, creates a territorial tax system (with a one-time mandatory transition tax on previously deferred foreign earnings), broadens the tax base and allows for the immediate capital expensing of certain qualified property. Due to the complexities presented by the Act, particularly for those companies with multi-national operations, the Securities and Exchange Commission issued Staff Accounting Bulletin 118 (SAB 118) to provide guidance to companies who are not able to complete their accounting in the period of enactment prior to the reporting deadlines. Under the guidance in SAB 118, companies that have not completed their accounting for certain elements of the Act, but can determine a reasonable estimate of those effects, should include a provisional amount based on their reasonable estimate in their financial statements. This guidance resulted in us recording a provisional net benefit to the income tax provision during the period ended December 31, 2017. As of December 31, 2017,incurred, although we have not completed our accounting forrealized any impacts since the tax effects of the Act. U.S. first imposed taxes on GILTI in December 2017.
For additional discussion of the effects of the Act and our current estimates, see Note 7.
We record a valuation allowance to reduce the carrying amounts of net deferred tax assets if there is uncertaintyinformation regarding their future realization. We consider many factors when assessing the likelihood of future realization including our recent cumulative earnings experience by taxing jurisdiction, expectations of future taxable income, the carryforward periods available to us for tax reporting purposes and other relevant factors. For additional discussion of income taxes, see Note 7.
Equity Method Investments
We account for our 50% investment in Northpark Corporate Center, LLC (NCC) using the equity method of accounting. Accordingly, we report our share of income or loss based on our ownership interest in this investment.
Earnings Per Share
We calculate basic and diluted earnings per share (EPS) by dividing Netusing the two-class method. Earnings per share under the two-class method is calculated using net income or loss attributable to Pool Corporationcommon stockholders, which is net income reduced by the weighted average number ofearnings allocated to participating securities. Our participating securities include share-based payment awards that contain a non-forfeitable right to receive dividends and are considered to participate in undistributed earnings with common shares outstanding. We include outstanding unvested restricted stock awards of our common stock in the basic weighted average share calculation. shareholders.
Diluted EPS reflects the dilutive effects of potentially dilutive securities, which include in-the-money outstanding stock options and shares to be purchased under our employee stock purchase plan. Using the treasury stock method, the effect of dilutive securities includes these additional shares of common stock that would have been outstanding based on the assumption that these potentially dilutive securities had been issued. As discussed above, as a result of the adoption of ASU 2016-09, the calculation of the effect of dilutive securities now excludes any derived excess tax benefits or deficiencies from assumed future proceeds, resulting in an increase in diluted weighted average shares outstanding. For additional discussion of earnings per share, see Note 8.
Foreign Currency
The functional currency of each of our foreign subsidiaries is its applicable local currency. We translate our foreign subsidiary financial statements into U.S. dollars based on published exchange rates. We include these translation adjustments as a component of Accumulated other comprehensive income (loss) on the Consolidated Balance Sheets. We include realized transaction gains and losses that arise from exchange rate fluctuations in Interest and other non-operating expenses, net on the Consolidated Statements of Income. We realized a net foreign currency transaction gainsgain of $0.2$0.8 million in 20172023 and losses of $0.7$0.1 million in 20162022 and $0.8$0.3 million in 2015.2021.
Fair Value Measurements
Recurring Fair Value Measurements
Our assets and liabilities that are measured at fair value on a recurring basis include the unrealized gains or losses on our interest rate swap contracts, our deferred compensation plan asset and liability and contingent consideration related to recent acquisitions. The three levels of the fair value hierarchy under the accounting guidance are described below:
| |
Level 1 | Inputs to the valuation methodology are unadjusted quoted prices for identical assets or liabilities in active markets. |
Level 1 Inputs to the valuation methodology are unadjusted quoted prices for identical assets or liabilities in active markets.
| |
Level 2 | Inputs to the valuation methodology include: |
Level 2 Inputs to the valuation methodology include:
•quoted prices for similar assets or liabilities in active markets;
•quoted prices for identical or similar assets or liabilities in inactive markets;
•inputs other than quoted prices that are observable for the asset or liability; or
•inputs that are derived principally from or corroborated by observable market data by correlation or other means.
| |
Level 3 | Inputs to the valuation methodology are unobservable and significant to the fair value measurement. |
Level 3 Inputs to the valuation methodology are unobservable and significant to the fair value measurement.
The table below presents the estimatedour assets and liabilities measured and recorded at fair values of our interest rate swap contracts, our forward-starting interest rate swap contract and our contingent consideration liabilitiesvalue on a recurring basis (in thousands):
| | | | | | | | | | | | | | | | | | | | | | | |
| | | | | | Fair Value at December 31, |
| Input Level | | Classification | | 2023 | | 2022 |
| Assets | | | | | | | |
| Unrealized gains on interest rate swaps | Level 2 | | Other assets | | $ | 25,752 | | | $ | 34,049 | |
| Deferred compensation plan asset | Level 1 | | Other assets | | 15,347 | | | 13,148 | |
| Liabilities | | | | | | | |
| Contingent consideration liabilities | Level 3 | | Accrued expenses and other current liabilities | | $ | — | | | $ | 554 | |
| | | | | | | |
| Deferred compensation plan liability | Level 1 | | Other long-term liabilities | | 15,347 | | | 13,148 | |
|
| | | | | | | | |
| | | Fair Value at December 31, |
| | | 2017 | | 2016 |
| Level 2 | | | | |
| Unrealized gains on interest rate swaps | | $ | 1,585 |
| | $ | 1,521 |
|
| Unrealized losses on interest rate swaps | | 703 |
| | 3,138 |
|
| | | | | |
| Level 3 | | | | |
| Contingent consideration liabilities | | $ | 1,824 |
| | $ | 1,611 |
|
We include unrealized gains in Prepaid expenses and other current assets and unrealized losses in Accrued expenses and other current liabilities on the Consolidated Balance Sheets. For determining the fair value of our interest rate swap and forward-starting interest rate swap contracts, we use significant other observable market data or assumptions (Level 2 inputs as definedinputs) in determining the accounting guidance)fair value of our interest rate swaps and forward-starting interest rate swap contracts that we believe market participants would use in pricing similar assets or liabilities, including assumptions about counterparty risk. Our fair value estimates reflect an income approach based on the terms of the interest rate swap contracts and inputs corroborated by observable market data including interest rate curves.
As of December 31, 2017, our Consolidated Balance Sheets reflect $0.7 millionOur deferred compensation plan asset represents investments in Accrued expenses and other current liabilities and $1.2 millionsecurities (primarily mutual funds) traded in Other long-term liabilities for contingent consideration related to future payouts for our acquisitions of The Melton Corporation, which we acquired in November 2015, Metro Irrigation Supply Company Ltd. and Newline Pool Products. In determining our original estimates for contingent consideration, which are based on a percentage of gross profit for certain products for The Melton Corporation and a multiple of gross profit for Metro Irrigation Supply Company Ltd., we applied a linear model using our best estimate of gross profit projections for fiscal years 2016 to 2020. The payout for Newline Pool Products is based on a multiple of earningsan active market (Level 1 inputs) held for the first fiscal yearbenefit of the acquisition.certain employees as part our deferred compensation plan. We basedrecord an equal and offsetting deferred compensation plan liability, which represents our estimate for the Newline payout on projected operating results for that year. All of our estimates of contingent consideration use Level 3 inputs as definedobligation to participating employees. Changes in the accounting guidance. The maximum total payouts for Metro Irrigation Supply Company Ltd. and Newline Pool Products over the related time periods are $1.0 million and AU$0.5 million, respectively.
In 2017, we paid approximately $0.2 million in contingent consideration to The Melton Corporation based on 2016 results. Since the acquisition dates, we have recorded minimal adjustments to our original estimates based on the calculated 2017 payouts related to the fiscal year ended December 31, 2016 and the calculated 2018 and future payouts considering results for the fiscal year ended December 31, 2017. Adjustments to the fair value of contingent considerationthe plan asset and liability are recognizedreflected in earningsSelling and administrative expenses in the period in which we determine that the fair value changed. AsConsolidated Statements of December 31, 2017, we have determined that the contingent consideration liability was in a rangeIncome. For additional discussion of acceptable estimates for all applicable fiscal periods.our nonqualified deferred compensation plan, see Note 11.
The carrying values of cash, receivables, accounts payable and accrued liabilities approximate fair value due to the short maturity of those instruments (Level 1 inputs). For the note receivable settled with our former variable interest entity in 2017, our determination of the estimated fair value reflected a discounted cash flow model using our estimates, including assumptions related to collectability. In 2017, we recorded $1.2 million of fair value adjustments to reduce the note receivable to the estimated realizable amount based on the results of our discounted cash flow model for expected payments under the note receivable.instruments. The carrying value of long-term debt approximates fair value (Level 3 inputs).value. Our determination of the estimated fair value reflects a discounted cash flow model using our estimates, including assumptions related to borrowing rates (Level 3 inputs).
Nonrecurring Fair Value Measurements
In addition to our assets and liabilities that we measure at fair value on a recurring basis, our assets and liabilities are also subject to nonrecurring fair value measurements. Generally, our assets are recorded at fair value on a nonrecurring basis as a result of impairment charges or business combinations. For additional discussion of goodwill and intangible assets and impairment, see Note 3.
Derivatives and Hedging Activities
We designatedAt inception, we formally designate and document our interest rate swap and forward-starting interest rate swap contracts that qualify for hedge accounting as cash flow hedges of interest payments on variable rate borrowings. We formally assess, both at inception and we assess hedge effectiveness on aat least quarterly, basis.whether the financial instruments used in hedging transactions are effective at offsetting changes in cash flows of the related underlying exposure. To the extent our derivatives are effective in offsetting the variability of the hedged cash flows, we record the changes in the estimated fair value of the swapsour interest rate swap contracts to Accumulated other comprehensive income (loss) on the Consolidated Balance Sheets. To the extent our interest rate swaps are determined to be ineffective, we recognize the changes in the estimated fair value in Interest and other non-operating expenses, net on our Consolidated Statements of Income. We recognize any differences between the variable interest rate payments and the fixed interest rate settlements from our swap counterparties as an adjustment to interest expense over the life of the swaps.
Our interest rate swap contracts and forward-starting interest rate swap contracts are subject to master netting arrangements. According to our accounting policy, we do not offset the fair values of assets with the fair values of liabilities related to these contracts.
We recognize any differences between the variable interest rate in effect and the fixed interest rate per our swap contracts as an adjustment to interest expense over the life of the swaps.
For our interest rate swap contracts currently in effect, a portion of the change in the estimated fair value between periods relates to future interest expense. Recognition of the change in fair value between periods attributable to accrued interest is reclassified from Accumulated other comprehensive income (loss) to Interest and other non-operating expenses, net on the Consolidated Statements of Income. These amounts were not material in 2017, 2016 or 2015. In October 2016, we began reclassifying the fair values related to our original forward-starting swaps from Accumulated other comprehensive income (loss) to Interest and other non-operating expenses, net. These unrealized losses are being amortized over the effectiveany period of the original forward-starting interest rate swap contracts from October 2016 to September 2018.presented. For additional discussion of our interest rate swaps, see Note 5.
Cash Equivalents
We consider all highly liquid investments with an original maturity of three months or less when purchased to be cash equivalents.
Credit Risk and Allowance for Doubtful Accounts
We record trade receivables at the invoiced amounts less an allowance for doubtful accounts for estimated losses we may incur if customers do not pay. We perform periodic credit evaluations of our customers and we typically do not require collateral. Consistent with industry practices, we generally require payment from our North American customers within 30 days, except for sales under early buy programs for which we provide extended payment terms to qualified customers.
Management estimates future losses based on historical bad debts, customer receivable balances, age of customer receivable balances, customers’ financial conditions and current and forecasted economic trends, including certain trends in the housing market, the availability of consumer credit and general economic conditions (as commonly measured by Gross Domestic Product or GDP). We monitor housing market trends through review of the House Price Index as published by the Federal Housing Finance Agency, which measures the movement of single-family house prices. At the end of each quarter, we perform a reserve analysis of all accounts with balances greater than $20,000 andthat are more than 60 days past due. Additionally, we perform a separate reserve analysis on the balance of our accounts receivables with emphasis on the remainder of the past due portion of the aging. During the year, we write off account balances when we have exhausted reasonable collection efforts and determined that the likelihood of collection is remote. These write-offs are charged against our allowance for doubtful accounts.
The following table summarizes the changes in our allowance for doubtful accounts for the past three years (in thousands):
| | | | | | | | | | | | | | | | | | | | |
| | | 2023 | | 2022 | | 2021 |
| Balance at beginning of year | | $ | 9,522 | | | $ | 5,942 | | | $ | 4,808 | |
| Bad debt expense | | 7,526 | | | 7,449 | | | 3,377 | |
| Write-offs, net of recoveries | | (5,330) | | | (3,869) | | | (2,243) | |
| Balance at end of year | | $ | 11,718 | | | $ | 9,522 | | | $ | 5,942 | |
|
| | | | | | | | | | | | |
| | | 2017 | | 2016 | | 2015 |
| Balance at beginning of year | | $ | 4,050 |
| | $ | 4,205 |
| | $ | 4,008 |
|
| Bad debt expense | | 916 |
| | 1,199 |
| | 1,110 |
|
| Write-offs, net of recoveries | | (1,069 | ) | | (1,354 | ) | | (913 | ) |
| Balance at end of year | | $ | 3,897 |
| | $ | 4,050 |
| | $ | 4,205 |
|
Product Inventories and Reserve for Inventory Obsolescence
Product inventories consist primarily of goods we purchase from manufacturers to sell to our customers. We record inventory at the lower of cost, using the moving average cost method, or net realizable value. We establish our reserve for inventory obsolescence based on inventory turns by class with particular emphasis on stock keeping units with the weakest sales over the expected sellable period, which is the previous 12 months for most products. The reserve is intended to reflect the net realizable value of inventory that we may not be able to sell at a profit.
In evaluating the adequacy of our reserve for inventory obsolescence, we consider a combination of factors including:
•the level of inventory in relation to historical sales by product, including inventory usage by classclassification based on product sales at both the sales center and on a company-wide basis;
•changes in customer preferences or regulatory requirements;
•seasonal fluctuations in inventory levels;
•geographic location; and
•superseded products and new product offerings.
We periodically adjust our reserve for inventory obsolescence as changes occur in the above-identified factors.
The following table summarizes the changes in our reserve for inventory obsolescence for the past three years (in thousands):
| | | | | | | | | | | | | | | | | | | | |
| | | 2023 | | 2022 | | 2021 |
| Balance at beginning of year | | $ | 21,208 | | | $ | 15,196 | | | $ | 11,398 | |
| Provision for inventory write-downs | | 8,483 | | | 11,989 | | | 7,781 | |
| Deduction for inventory write-offs | | (6,227) | | | (5,977) | | | (3,983) | |
| Balance at end of year | | $ | 23,464 | | | $ | 21,208 | | | $ | 15,196 | |
|
| | | | | | | | | | | | |
| | | 2017 | | 2016 | | 2015 |
| Balance at beginning of year | | $ | 6,531 |
| | $ | 6,979 |
| | $ | 6,403 |
|
| Provision for inventory write-downs | | 2,660 |
| | 2,036 |
| | 3,043 |
|
| Deduction for inventory write-offs | | (2,927 | ) | | (2,484 | ) | | (2,467 | ) |
| Balance at end of year | | $ | 6,264 |
| | $ | 6,531 |
| | $ | 6,979 |
|
Property and Equipment
Property and equipment are stated at cost. We depreciate property and equipment on a straight-line basis over the following estimated useful lives:
| | | | | |
| Buildings | |
Buildings | 40 years |
Leasehold improvements (1) | 1 - 10 years |
| Autos and trucks | 3 - 6 years |
| Machinery and equipment | 3 - 15 years |
| Computer equipment | 3 - 7 years |
| Furniture and fixtures | 5 - 10 years |
| |
(1)
| For substantial improvements made near the end of a lease term where we are reasonably certain the lease will be renewed, we amortize the leasehold improvement over the remaining life of the lease including the expected renewal period. |
(1)For substantial improvements made near the end of a lease term where we are reasonably certain the lease will be renewed, we amortize the leasehold improvement over the remaining life of the lease including the expected renewal period.
The table below presents depreciation expense for the past three years (in thousands):
| | | | | | | | | | | | | | |
| 2023 | | 2022 | | 2021 |
| $ | 31,585 | | | $ | 30,381 | | | $ | 28,287 | |
|
| | | | | | | | | | |
| 2017 |
| 2016 | | 2015 |
| $ | 24,157 |
| | $ | 20,338 |
| | $ | 16,373 |
|
Acquisitions
We use the acquisition method of accounting and recognize assets acquired and liabilities assumed at fair value as of the acquisition date. Any contingent assets acquired and contingent liabilities assumed are also recognized at fair value if we can reasonably estimate fair value during the measurement period (which cannot exceed one year from the acquisition date). We re-measure any contingent liabilities at fair value in each subsequent reporting period. We expense all acquisition-related costs as incurred, including any restructuring costs associated with a business combination.
Any excess of the purchase price over the estimated fair values of the identifiable net assets acquired is recorded as goodwill. Significant judgment is often required in estimating the fair value of assets acquired, particularly intangible assets. Our fair value estimates are based on available historical information and on expectations and assumptions about the future, considering the perspective of market participants. Unanticipated market or macroeconomic events and circumstances may occur, which could affect the underlying estimates and assumptions.
If our initial acquisition accounting is incomplete by the end of the reporting period in which a business combination occurs, we report provisional amounts for incomplete items. Once we obtain information required to finalize the accounting for incomplete items, we adjust the provisional amounts recognized. We make adjustments to these provisional amounts during the measurement period.
For all acquisitions, we include the results of operations in our Consolidated Financial Statements as of the acquisition date. For additional discussion of acquisitions, see Note 2.
Goodwill and Other Intangible Assets
Goodwill represents the excess of the amount we paid to acquire a company over the estimated fair value of tangible assets and identifiable intangible assets acquired, less liabilities assumed. We test goodwill and other indefinite-lived intangible assets for impairment annually as of October 1st and at any other time when impairment indicators exist.
WeTo estimate the fair value based on an income approach that incorporatesof our assumptions for determining the present value of future cash flows. Wereporting units, we project company-wide future cash flows using management’s assumptions for sales growth rates, operating margins, discount rates and earnings multiples. The earnings multiples are then used to estimate the fair value of each reporting unit. These assumptions are considered unobservable inputs (Level 3 inputs as defined in the accounting guidance). IfTo the estimated fair value of any of our reporting units falls below its carrying value, we compare the estimated fair value of the reporting unit’s goodwill to its carrying value. Ifextent the carrying value of a reporting unit’s goodwill exceedsunit is greater than its estimated fair value, we recognizeperform a discounted cash flow analysis at the reporting unit level to further evaluate our initial fair value estimate. If the carrying value of the reporting unit exceeds the fair value, we record a goodwill impairment charge for the difference, as anup to the carrying value of the goodwill. We recognize any impairment loss in operating income. Since we define an operating segment as an individual sales center and we do not have operations below the sales center level, our reporting unit is an individual sales center. For additional discussion of goodwill and other intangible assets, see Note 3.
Receivables Securitization Facility
Our accounts receivable securitization facility (the Receivables Facility) provides for the sale of certain of our receivables to a wholly owned subsidiary (the Securitization Subsidiary). The Securitization Subsidiary transfers variable undivided percentage interests in the receivables and related rights to certain third partythird-party financial institutions in exchange for cash proceeds, limited to the applicable funding capacities.
We account for the sale of the receivable interests as a secured borrowing on our Consolidated Balance Sheets. The receivables subject to the agreement collateralize the cash proceeds received from the third partythird-party financial institutions. We classify the entire outstanding balance as Long-term debt on our Consolidated Balance Sheets as we intend and have the ability to refinance the obligations on a long‑termlong-term basis. We present the receivables that collateralize the cash proceeds separately as Receivables pledged under receivables facility on our Consolidated Balance Sheets. For additional discussion of the Receivables Facility, see Note 5.
Self-Insurance
We are self-insured for employee health benefits, workers’ compensation coverage, property and casualty, and automobile insurance. To limit our exposure, we also maintain excess and aggregate liability coverage. We establish self‑insuranceself-insurance reserves based on estimates of claims incurred but not reported and information that we obtain from third-party service providers regarding known claims. Our management reviews these reserves based on consideration of various factors, including but not limited to the age of existing claims, estimated settlement amounts and other historical claims data.
Redeemable Noncontrolling Interest
In July 2014, we purchased a controlling interest in PSL. Included in the transaction documents was a put/call option deed that granted us an option to purchase the shares held by the noncontrolling interest and granted the holder of the noncontrolling interest an option to require us to purchase its shares in one or two transactions. The put/call option deed in this transaction was considered an equity contract and therefore a financial instrument under the accounting guidance. In applying the guidance for this transaction, we determined that the financial instrument was embedded in the noncontrolling interest. As a public company, we are required to classify the noncontrolling interest and the embedded financial instrument as redeemable noncontrolling interest in a separate section of our Consolidated Balance Sheets, between liabilities and equity.
On June 29, 2017, we purchased the remaining 40% interest in PSL. The actual redemption value exceeded the carrying amount, and we recorded an adjustment to Additional paid in capital as there were no retained earnings attributable to the noncontrolling interest.
The table below presents the changes in Redeemable noncontrolling interest (in thousands):
|
| | | | | | | | | | | |
| | 2017 | | 2016 | | 2015 |
| Redeemable noncontrolling interest, beginning of period | $ | 2,287 |
| | $ | 2,665 |
| | $ | 3,113 |
|
| Redemption value adjustment of noncontrolling interest | 360 |
| | — |
| | — |
|
| Net loss attributable to noncontrolling interest | (294 | ) | | (352 | ) | | (51 | ) |
| Other comprehensive income (loss) attributable to noncontrolling interest | 220 |
| | (26 | ) | | (397 | ) |
| Less: purchase of redeemable noncontrolling interest | 2,573 |
| | — |
| | $ | — |
|
| Redeemable noncontrolling interest, end of period | $ | — |
| | $ | 2,287 |
| | $ | 2,665 |
|
Accumulated Other Comprehensive LossIncome
The table below presents the components of our Accumulated other comprehensive lossincome balance (in thousands):
| | | | | | | | | | | |
| December 31, |
| 2023 | | 2022 |
| Foreign currency translation adjustments | $ | (12,699) | | | $ | (19,608) | |
| Unrealized gains on interest rate swaps, net of tax | 19,281 | | | 25,503 | |
| Accumulated other comprehensive income | $ | 6,582 | | | $ | 5,895 | |
|
| | | | | | | |
| | December 31, |
| | 2017 | | 2016 |
| Foreign currency translation adjustments | $ | (7,478 | ) | | $ | (13,024 | ) |
Unrealized gains (losses) on interest rate swaps, net of tax (1) | 150 |
| | (1,054 | ) |
| Accumulated other comprehensive loss | $ | (7,328 | ) | | $ | (14,078 | ) |
| |
(1)
| In February 2018, the Financial Accounting Standards Board (FASB) issued guidance that allows entities the option to reclassify the tax effects related to items in accumulated other comprehensive income (loss) to retained earnings (deficit) if deemed to be stranded in accumulated other comprehensive income (loss) due to U.S. tax reform. Because the change in the tax effects of our unrealized gains on interest rate swaps was not material, we elected not to reclassify such amounts. We reclassify the income tax effects of amounts in accumulated other comprehensive loss in the period in which the respective gross amount is released. |
Retained DeficitEarnings
We account for the retirement of treasury share repurchases as an increase ofa decrease to our Retained deficitearnings on our Consolidated Balance Sheets. As of December 31, 2017,2023, the retained deficitearnings reflects cumulative net income, the cumulative impact of adjustments for changes in accounting pronouncements, treasury share retirements since the inception of our share repurchase programs of $1,239.3 million$2.4 billion and cumulative dividends of $425.8 million.$1.1 billion.
Supplemental Cash Flow Information
The following table presents supplemental disclosures to the accompanying Consolidated Statements of Cash Flows (in thousands):
| | | | | | | | | | | | | | | | | |
| | Year Ended December 31, |
| | 2023 | | 2022 | | 2021 |
| Cash paid during the year for: | | | | | |
| Interest | $ | 58,131 | | | $ | 39,759 | | | $ | 10,023 | |
| Income taxes, net of refunds | 153,157 | | | 314,714 | | | 83,953 | |
|
| | | | | | | | | | | |
| | Year Ended December 31, |
| | 2017 | | 2016 | | 2015 |
| Cash paid during the year for: | | | | | |
| Interest | $ | 12,957 |
| | $ | 8,052 |
| | $ | 6,316 |
|
| Income taxes, net of refunds | 84,251 |
| | 80,378 |
| | 65,668 |
|
Recent Accounting Pronouncements Pending Adoption
The following table summarizes the remaining recent accounting pronouncements that we plan to adopt in future periods:
| | | | | | | | | | | |
| Standard | Description | Effective Date | Effect on Financial Statements and Other Significant Matters |
ASU 2023-09, Income Taxes (Topic 740): Improvements to Income Tax Disclosures
| In December 2023, the FASB issued ASU 2023-09, Income Taxes- Improvements to Income Tax Disclosures, which will require enhancements and further transparency for decision usefulness to various income tax disclosures, most notably the tax rate reconciliation and income taxes paid. | Annual periods beginning after December 15, 2024 on a prospective basis and retrospective application is permitted. Early adoption is also permitted. | We are currently evaluating the effect this standard will have on our disclosures. |
ASU 2023-07, Segment Reporting (Topic 280), Improvements to Reportable Segment Disclosures
| In November 2023, the FASB issued ASU 2023-07, Improvements to Reportable Segment Disclosures, whichintends to improve reportable segment disclosures through requirement of enhanced disclosures about significant segment expenses, enhanced interim disclosure requirements, refines situations in which an entity can disclose multiple segment measures of profit or loss, provides advanced segment disclosure requirements for entities with a single reportable segment, as well as other disclosure requirements. | Annual periods beginning after December 15, 2023 on a retrospective basis. Early adoption is permitted. | We are currently evaluating the effect this standard will have on our disclosures. |
ASU 2023-06, Disclosure Improvements: Codification Amendments in Response to the SEC’s Disclosure Update and Simplification Initiative
| In October 2023, the FASB issued ASU 2023-06, Disclosure Agreements - Codification Amendments in Response to the SEC’s Disclosure Update and Simplification Initiative, which will impact various disclosure areas, including the statement of cash flows, accounting changes and error corrections, earnings per share, debt, equity, derivatives, and transfers of financial assets. | The amendments in ASU 2023-06 will be effective on the date the related disclosures are removed from Regulation S-X or Regulation S-K by the SEC and will no longer be effective if the SEC has not removed the applicable disclosure requirement by June 30, 2027. Early adoption is prohibited. | We are currently evaluating the effect this standard will have on our disclosures. |
Note 2 - Acquisitions
20172023 Acquisitions
In April 2017,December 2023, we acquired the distribution assets of Lincoln Equipment, Inc. (Lincoln Aquatics), a national distributor of equipment and supplies to commercial and institutional swimming pool customers, with one location in California.
In July 2017, we acquired New Star Holdings Pty. Ltd. (doing business as Newline Pool Products), a swimming pool equipment and supplies distributor with one distribution center in Brisbane, Australia.
In October 2017, we acquired E-Grupa, a national swimming pool equipment and supplies distributor, with one location in Croatia.
In December 2017, we acquired Kripsol Intermark Malaga S.L. (Intermark), a swimming pool equipment and supplies distributor, with one location in southern Spain.
In December 2017, we acquired Chem Quip, Inc. (Chem Quip)A.C. Solucoes para Piscinas, Lda., a wholesale distributor of residential and commercial swimming pool equipment, chemicals and supplies, with fiveadding one location in Braga, Portugal.
In June 2023, we acquired the distribution assets of Pioneer Pool Products, Inc., a wholesale distributor of swimming pool equipment, chemicals and supplies, adding one location in Alabama.
In May 2023, we acquired the distribution assets of Recreation Supply Company, a wholesale distributor of commercial swimming pool products, adding one location in North Dakota.
In March 2023, we acquired the distribution assets of Pro-Water Irrigation & Landscape Supply, Inc., a wholesale distributor of irrigation and landscape supply products, adding two locations in centralArizona.
2022 Acquisitions
In April 2022, we acquired the distribution assets of Tri-State Pool Distributors, a wholesale distributor of swimming pool equipment, chemicals and northern California.supplies, adding one location in West Virginia.
2021 Acquisitions
We acquired Porpoise Pool & Patio, Inc. (Porpoise) on December 16, 2021 for $788.7 million, net of cash acquired. We recognized goodwill of $403.5 million, other intangible assets of $301.0 million and tangible assets of $84.2 million, which included $57.4 million of acquired land and buildings. The acquisition was funded with borrowings on our Credit Facility.
Porpoise’s primary operations consist of Sun Wholesale Supply, a wholesale distributor of swimming pool and outdoor-living products, adding one distribution location in Florida. It also services Pinch A Penny, Inc., a franchisor of independently owned and operated pool and outdoor living-related specialty retail stores.
In December 2021, we acquired the distribution assets of Wingate Supply, Inc., a wholesale distributor of irrigation and landscape maintenance products, adding one location in Florida.
In June 2021, we acquired the distribution assets of Vak Pak Builders Supply, Inc., a wholesale distributor of swimming pool equipment, chemicals and supplies, adding one location in Florida.
In April 2021, we acquired Pool Source, LLC, a wholesale distributor of swimming pool equipment, chemicals and supplies, adding one location in Tennessee.
We have completed our acquisition accounting for theseall acquisitions discussed above, subject to adjustments for standard holdback provisions per the terms of the purchase agreements, which are not material. These acquisitions did not have a material impact on our financial position or results of operations, either individually or in the aggregate.
2016 Acquisitions
In April 2016, we acquired the distribution assets of Metro Irrigation Supply Company Ltd., an irrigation and landscape supply company with eight locations in Texas.
We have completed our acquisition accounting for this acquisition. This acquisition did not have a material impact on our financial position or results of operations.
2015 Acquisitions
In April 2015, we acquired certain distribution assets from Poolwerx Development LLC and opened a satellite sales center location serving South Mesa, Arizona. In October 2015, we acquired the distribution assets of Seaboard Industries, Inc., a swimming pool supply wholesale distributor with one sales center location in Connecticut and two sales center locations in New Jersey. In November 2015, we acquired the distribution assets of The Melton Corporation, a masonry materials and supplies distributor with one sales center location in California and one sales center location in Arizona.
We have completed our acquisition accounting for each of these acquisitions. These acquisitions did not have a material impact on our financial position or results of operations, either individually or in the aggregate.
Note 3 - Goodwill and Other Intangible Assets
The table below presents changes in the carrying amount of goodwill and our accumulated impairment losses (in thousands):
| | | | | |
| Goodwill (gross) at December 31, 2021 | $ | 701,753 | |
| Acquired goodwill | 5,500 | |
| Foreign currency translation and other adjustments | (1,266) | |
| Goodwill (gross) at December 31, 2022 | 705,987 | |
| |
| Accumulated impairment losses at December 31, 2021 | (13,389) | |
| Goodwill impairment | (605) | |
| Accumulated impairment losses at December 31, 2022 | (13,994) | |
| |
| Goodwill (net) at December 31, 2022 | $ | 691,993 | |
| |
| Goodwill (gross) at December 31, 2022 | $ | 705,987 | |
| Acquired goodwill | 8,137 | |
| Foreign currency translation and other adjustments | 498 | |
| Goodwill (gross) at December 31, 2023 | 714,622 | |
| |
| Accumulated impairment losses at December 31, 2022 | (13,994) | |
| Goodwill impairment | (550) | |
| Accumulated impairment losses at December 31, 2023 | (14,544) | |
| |
| Goodwill (net) at December 31, 2023 | $ | 700,078 | |
The determination of our reporting units’ goodwill and intangibles fair values includes numerous assumptions that are subject to various risks and uncertainties. The principal assumptions, all of which are considered Level 3 inputs, used in our cash flow analyses consisted of changes in market conditions, forecasted future operating results (including sales growth rates and operating margins) and discount rates (including our weighted-average cost of capital).
|
| | | |
| Goodwill (gross) at December 31, 2015 | $ | 182,027 |
|
| Acquired goodwill | 12,696 |
|
| Foreign currency translation adjustments | (49 | ) |
| Goodwill (gross) at December 31, 2016 | 194,674 |
|
| | |
| Accumulated impairment losses at December 31, 2015 | (9,266 | ) |
| Goodwill impairment | (613 | ) |
| Accumulated impairment losses at December 31, 2016 | (9,879 | ) |
| | |
| Goodwill (net) at December 31, 2016 | $ | 184,795 |
|
| | |
| Goodwill (gross) at December 31, 2016 | $ | 194,674 |
|
| Acquired goodwill | 3,068 |
|
| Foreign currency translation adjustments | 1,572 |
|
| Goodwill (gross) at December 31, 2017 | 199,314 |
|
| | |
| Accumulated impairment losses at December 31, 2016 | (9,879 | ) |
| Goodwill impairment | — |
|
| Accumulated impairment losses at December 31, 2017 | (9,879 | ) |
| | |
| Goodwill (net) at December 31, 2017 | $ | 189,435 |
|
In October 2017 and October 2016,September 2023, we performed our annualrecorded goodwill impairment test and did not identify any goodwill impairment at the reporting unit level. As of October 1, 2017, we had 221$0.6 million, primarily related to one of our Horizon reporting units with allocatedin Texas that we previously identified as being most at risk of goodwill balances. The most significant goodwill balance for a reporting unit was $5.7 million and the average goodwill balance was $0.8 million.
In the third quarter of 2016, we performed an interim goodwill impairment analysis for an at-risk reporting unit in Quebec, Canada.impairment. We had been monitoring this location’s results, which came in below expectations at the end of the 2016 pool2023 season. Due to this impairment indicator, weWe performed an interim goodwill impairment analysis. Weanalysis, which included a discounted cash flow analysis, and determined that the estimated the fair value of thisthe reporting unit based on an income approach that incorporates our assumptions for determining the present value of future cash flows. We projected future cash flows using management’s assumptions for sales growth rates, operating margins, discount rates and multiples. Because the carrying value of this reporting unit’s goodwillno longer exceeded its estimated fair value,carrying value.
In October 2023, we recorded a non-cashperformed our annual goodwill impairment chargetest and did not record any additional goodwill impairment at the reporting unit level. As of October 1, 2023, we had 250 reporting units with allocated goodwill balances. Our most significant goodwill balance of $403.5 million was related to our Porpoise Pool & Patio reporting unit and the next largest goodwill balance for a reporting unit was $12.1 million. The average goodwill balance per reporting unit was $2.8 million.
In October 2022, we performed our annual goodwill impairment test and recorded goodwill impairment of $0.6 million related to the closure of a Horizon reporting unit in that period.
We record goodwill and intangibles impairment in Selling and administrative expenses on theour Consolidated Statements of Income in 2016.Income.
Other intangible assets consisted of the following (in thousands):
| | | | | | | | | | | | | | | | | | | | | | | | | | | | | | | | | | | | | | | | | |
| | December 31, | | Weighted Average Useful Life |
| | 2023 | | 2022 | |
| Intangibles Gross | | Accumulated Amortization | | Intangibles Net | | Intangibles Gross | | Accumulated Amortization | | Intangibles Net | |
| Horizon tradename | $ | 8,400 | | | $ | — | | | $ | 8,400 | | | $ | 8,400 | | | $ | — | | | $ | 8,400 | | | Indefinite |
| Pinch A Penny brand name | 169,000 | | | — | | | 169,000 | | | 169,000 | | | — | | | 169,000 | | | Indefinite |
| National Pool Tile (NPT) tradename | 1,500 | | | (1,187) | | | 313 | | | 1,500 | | | (1,112) | | | 388 | | | 20 |
| Non-compete agreements | 6,206 | | | (3,258) | | | 2,948 | | | 6,022 | | | (2,533) | | | 3,489 | | | 4.64 |
| Customer relationships | 109,000 | | | (11,125) | | | 97,875 | | | 109,000 | | | (5,677) | | | 103,323 | | | 20 |
| Franchise agreements | 22,000 | | | (2,254) | | | 19,746 | | | 22,000 | | | (1,150) | | | 20,850 | | | 20 |
| Total other intangibles | $ | 316,106 | | | $ | (17,824) | | | $ | 298,282 | | | $ | 315,922 | | | $ | (10,472) | | | $ | 305,450 | | | |
|
| | | | | | | |
| | December 31, |
| | 2017 | | 2016 |
| Horizon tradename (indefinite life) | $ | 8,400 |
| | $ | 8,400 |
|
| Pool Systems tradename and trademarks (indefinite lives) | 1,109 |
| | 1,023 |
|
| National Pool Tile (NPT) tradename (20 year life) | 1,500 |
| | 1,500 |
|
| Non-compete agreements (5 year weighted average useful life) | 5,078 |
| | 4,396 |
|
| Patents (5 year weighted average useful life) | 523 |
| | 483 |
|
| Other intangible assets | 16,610 |
| | 15,802 |
|
| Less: Accumulated amortization | (3,387 | ) | | (2,476 | ) |
| Other intangible assets, net | $ | 13,223 |
| | $ | 13,326 |
|
The Horizon tradename and Pool Systems tradenames and trademarksPinch A Penny brand name each have an indefinite useful liveslife and are not subject to amortization. However, weWe evaluate the useful liveslife of these intangible assets and test for impairment annually. The NPT tradename, our non-compete agreements, customer relationships and our patentsfranchise agreements have finite useful lives, and we amortize the estimated fair value of these agreements using the straight-line method over their respective useful lives. We have not identified any indicators of impairment related to these assets. The useful lives for our non-compete agreements are based on their contractual terms, and the useful lives for our patents are based on expected future cash flows. We recognize expenses related to patent renewal costs as incurred.terms.
Other intangible amortization expense was $1.0$7.8 million in 2017, $1.02023, $7.8 million in 20162022 and $0.4$1.3 million in 2015.2021.
The table below presents estimated amortization expense for other intangible assets for the next five years (in thousands):
| | | | | | | | |
| 2024 | | $ | 7,794 | |
| 2025 | | 7,676 | |
| 2026 | | 7,143 | |
| 2027 | | 6,790 | |
| 2028 | | 6,619 | |
|
| | | | |
| 2018 | | $ | 1,080 |
|
| 2019 | | 905 |
|
| 2020 | | 833 |
|
| 2021 | | 353 |
|
| 2022 | | 163 |
|
Note 4 - Details of Certain Balance Sheet Accounts
The table below presents additional information regarding certain balance sheet accounts (in thousands):
| | | | | | | | | | | | | | |
| | | December 31, |
| | | 2023 | | 2022 |
| Receivables, net: | | | | |
| Trade accounts | | $ | 60,966 | | | $ | 32,793 | |
| Vendor programs | | 92,072 | | | 101,554 | |
| Other, net | | 4,403 | | | 3,422 | |
| Total receivables | | 157,441 | | | 137,769 | |
| Less: Allowance for doubtful accounts | | (11,718) | | | (9,522) | |
| Receivables, net | | $ | 145,723 | | | $ | 128,247 | |
| | | | |
| Prepaid expenses and other current assets: | | | | |
| Prepaid expenses | | $ | 31,175 | | | $ | 24,394 | |
| Other current assets | | 9,269 | | | 6,498 | |
| Prepaid expenses and other current assets | | $ | 40,444 | | | $ | 30,892 | |
| | | | |
| Property and equipment, net: | | | | |
| Land | | $ | 24,077 | | | $ | 19,865 | |
| Buildings | | 56,181 | | | 55,911 | |
| Leasehold improvements | | 81,114 | | | 70,945 | |
| Autos and trucks | | 127,381 | | | 112,091 | |
| Machinery and equipment | | 109,532 | | | 93,491 | |
| Computer equipment | | 34,192 | | | 32,380 | |
| Furniture and fixtures | | 9,935 | | | 9,670 | |
| Fixed assets in progress | | 14,653 | | | 10,869 | |
| Total property and equipment | | 457,065 | | | 405,222 | |
| Less: Accumulated depreciation | | (233,136) | | | (211,513) | |
| Property and equipment, net | | $ | 223,929 | | | $ | 193,709 | |
| | | | |
| Accrued expenses and other current liabilities: | | | | |
| Salaries and payroll deductions | | $ | 23,378 | | | $ | 22,318 | |
| Performance-based compensation | | 30,346 | | | 70,609 | |
| Taxes payable | | 21,209 | | | 16,479 | |
| | | | |
| Other current liabilities | | 59,743 | | | 59,115 | |
| Accrued expenses and other current liabilities | | $ | 134,676 | | | $ | 168,521 | |
|
| | | | | | | | |
| | | December 31, |
| | | 2017 | | 2016 |
| Receivables, net: | | | | |
| Trade accounts | | $ | 26,681 |
| | $ | 18,533 |
|
| Vendor programs | | 50,302 |
| | 44,842 |
|
| Other, net | | 3,511 |
| | 2,112 |
|
| Total receivables | | 80,494 |
| | 65,487 |
|
| Less: Allowance for doubtful accounts | | (3,897 | ) | | (4,050 | ) |
| Receivables, net | | $ | 76,597 |
| | $ | 61,437 |
|
| | | | | |
| Prepaid expenses and other current assets: | | | | |
| Prepaid expenses | | $ | 14,700 |
| | $ | 13,584 |
|
| Other current assets | | 4,869 |
| | 1,734 |
|
| Prepaid expenses and other current assets | | $ | 19,569 |
| | $ | 15,318 |
|
| | | | | |
| Property and equipment, net: | | | | |
|
| Land | | $ | 3,003 |
| | $ | 1,685 |
|
| Buildings | | 4,255 |
| | 2,465 |
|
| Leasehold improvements | | 41,908 |
| | 38,348 |
|
| Autos and trucks | | 70,570 |
| | 53,371 |
|
| Machinery and equipment | | 55,128 |
| | 45,535 |
|
| Computer equipment | | 38,194 |
| | 39,251 |
|
| Furniture and fixtures | | 9,670 |
| | 9,951 |
|
| Fixed assets in progress | | 1,072 |
| | 2,065 |
|
| Total property and equipment | | 223,800 |
| | 192,671 |
|
| Less: Accumulated depreciation | | (122,861 | ) | | (109,381 | ) |
| Property and equipment, net | | $ | 100,939 |
| | $ | 83,290 |
|
| | | | | |
| Accrued expenses and other current liabilities: | | | | |
|
| Salaries and payroll deductions | | $ | 9,987 |
| | $ | 8,878 |
|
| Performance-based compensation | | 31,807 |
| | 32,226 |
|
| Taxes payable | | 7,970 |
| | 8,424 |
|
| Other current liabilities | | 15,718 |
| | 14,859 |
|
| Accrued expenses and other current liabilities | | $ | 65,482 |
| | $ | 64,387 |
|
Note 5 - Debt
The table below presents the components of our debt (in thousands):
| | | | | | | | | | | | | | |
| | | December 31, |
| | | 2023 | | 2022 |
| Variable rate debt | | | | |
| | | | |
| Current portion of long-term debt: | | | | |
| Australian credit facility | | $ | 13,203 | | | $ | 12,542 | |
| Current portion of term loans under credit facility | | 25,000 | | | 12,500 | |
| Short-term borrowings and current portion of long-term debt | | 38,203 | | | 25,042 | |
| | | | |
| Long-term portion: | | | | |
| Revolving credit facility | | 252,500 | | | 519,711 | |
| Term loans under credit facility | | 462,500 | | | 487,500 | |
| Term facility | | 109,937 | | | 157,250 | |
| Receivables securitization facility | | 191,700 | | | 199,500 | |
| Less: financing costs, net | | 1,520 | | | 2,200 | |
| Long-term debt, net | | 1,015,117 | | | 1,361,761 | |
| Total debt | | $ | 1,053,320 | | | $ | 1,386,803 | |
|
| | | | | | | | |
| | | December 31, |
| | | 2017 | | 2016 |
| Variable rate debt | | | | |
| Short-term borrowings | | $ | 1,937 |
| | $ | — |
|
| Current portion of long-term debt: | | | | |
| Australian credit facility | | 8,898 |
| | 1,105 |
|
| Short-term borrowings and current portion of long-term debt | | 10,835 |
| | 1,105 |
|
| | | | | |
| Long-term portion: | | | | |
| Revolving credit facility | | 410,439 |
| | 354,549 |
|
| Receivables securitization facility | | 100,000 |
| | 83,500 |
|
| Less: financing costs, net | | 1,624 |
| | 1,112 |
|
| Long-term debt, net | | $ | 508,815 |
| | $ | 436,937 |
|
| Total debt | | $ | 519,650 |
| | $ | 438,042 |
|
Revolving Credit Facility
On September 29, 2017, we, along with our wholly owned subsidiaries, SCP Distributors Canada Inc., as the Canadian Borrower, and SCP Pool B.V., as the Dutch Borrower,Our Credit Facility, most recently amended and restated our unsecured syndicated senioron June 30, 2023, provides for $1.25 billion in borrowing capacity, consisting of a $750.0 million revolving credit facility (the Credit Facility).and a $500.0 million term loan facility. The Credit Facility borrowing capacity increased to $750.0 million from $465.0 million under a five-year revolving credit facility. We also extended the maturity date of the agreement to September 29, 2022.
The Credit Facility includes sublimits for the issuance of swingline loans and standby letters of credit. Pursuantcredit and matures on September 25, 2026.
On June 30, 2023, we entered into the Second Amendment to an accordion feature, the aggregateSecond Amended and Restated Credit Agreement (the Credit Agreement) among us as U.S. Borrower, SCP Distributors Canada Inc. as Canadian Borrower, SCP International, Inc. as Euro Borrower, the Subsidiary Guarantors party thereto, Wells Fargo Bank, National Association, as Administrative Agent, and certain other lenders party thereto. The amendment updated the index used for the Base Rate (as further defined within the Credit Facility Amendment) from LIBOR to Term SOFR. The amendment also increased the maximum amount for the Accounts Securitization (as further defined within the Credit Agreement) from $350.0 million to $500.0 million and increased the Canadian Dollar Commitment, Euro Commitment and Swingline Commitment (all as further defined within the Credit Facility Agreement) to $50.0 million each.
Our term loans under the credit facility require quarterly amortization payments beginning in September 2023 aggregating to 20% of the original principal amount of the commitmentsloan during the third, fourth and fifth years of the loan, with all remaining principal due on September 25, 2026. All other terms of any such term loans would be substantially similar to those governing revolving credit loans under the Credit Facility may be increased at our request and with agreement by the lenders by up to $75.0 million, to a total of $825.0 million. Agreement.
OurAll obligations under the Credit FacilityAgreement are guaranteed on an unsecured basis by substantially all of our existing and future direct and indirect domestic subsidiaries. The Credit FacilityAgreement also contains termsvarious customary affirmative and provisions (including representations,negative covenants and conditions) and events of default. The occurrence of any of these events of default customary for transactionswould permit the lenders to, among other things, require immediate payment of this type. If we defaultall amounts outstanding under the Credit Facility, the lenders may terminate their commitments under the Credit Facility and may require us to repay all amounts.Agreement.
At December 31, 2017,2023, there was $410.4$740.0 million outstanding, including a $4.2$487.5 million term loan, a $16.0 million standby letter of credit outstanding and $335.4$481.5 million available for borrowing under the Credit Facility. The weighted average effective interest rate for the Credit Facility as of December 31, 20172023 was approximately 2.9%4.7%, excluding commitment fees.fees and including the impact of our interest rate swaps.
Revolving and term borrowings under the Credit Facility bear interest, at our option, at either of the following and, in each case, plus an applicable margin:
| |
a. | a base rate, which is the highest of (i) the Wells Fargo Bank, National Association prime rate, (ii) the Federal Funds Rate plus 0.500% and (iii) the London Interbank Offered Rate (LIBOR) Market Index Rate plus 1.000%; or |
a.a base rate, which is the highest of (i) the Agent’s prime rate, (ii) the Federal Funds Rate plus 0.500% and (iii) Adjusted Term SOFR (defined below) for a one-month tenor in effect on such day plus 1.000%; or
b.Adjusted Term SOFR, the rate per annum equal to Term SOFR for such calculation plus the Term SOFR adjustment of 0.10%.
Borrowings by the Canadian Borrower bear interest, at the Canadian Borrower’s option, at either of the following and, in each case, plus an applicable margin:
| |
a. | a base rate, which is the greatest of (i) the Canadian Reference Bank prime rate and (ii) the annual rate of interest equal to the sum of the Canadian Dealer Offered Rate (CDOR) plus 1.000%; or |
a.a base rate, which is the greatest of (i) the Canadian Reference Bank prime rate and (ii) the Canadian Dealer Offered Rate (CDOR) plus 1.000%; or
b.CDOR.
Borrowings by the DutchEuro Borrower bear interest at LIBORthe Adjusted Eurocurrency rate plus an applicable margin.
Borrowings under any swingline loans under the Credit Facility bear interest, at our option, at either of the following and, in each case, plus an applicable margin:
a.the Term SOFR Swingline Rate, the greater of (i) Adjusted Term SOFR for a period equal to one month (commencing on the date of determination of such interest rate) and (ii) a floor rate specified in the Credit Agreement; or
b.a base rate, which is the highest of (i) the Agent’s prime rate, (ii) the Federal Funds Rate plus 0.500% and (iii) Adjusted Term SOFR for a one-month tenor in effect on such day plus 1.000%.
The interest rate margins on the borrowings and letters of credit issued under the Credit Agreement are based on our leverage ratio and will range from 1.025% to 1.425% on CDOR, LIBOR and swingline loans, and from 0.025%0.000% to 0.425% on Base Rate, and Canadian Base Rate loans. Borrowings under theand Base Rate swingline loans are basedand from 0.910% to 1.425% on CDOR, Adjusted Term SOFR, Adjusted Eurocurrency rate and Term SOFR Swingline Rate loans (with all such rates being calculated in accordance with the LIBOR Market Index Rate (LMIR) plus any applicable margin.terms and by reference to the definitions specified in the Credit Agreement). We are also required to pay an annual facility fee ranging from 0.100%with respect to 0.200%, dependingthe lenders’ aggregate revolving credit agreement, the amount of which is based on our leverage ratio.
Term Facility
On December 30, 2019, we along with certain of our subsidiaries entered into a $185.0 million term facility (the “Term Facility”) with Bank of America, N.A. pursuant to a credit agreement subsequently amended on October 12, 2021, among us, as Borrower and Bank of America, N.A., as the Lender. On June 30, 2023, we entered into the Second Amendment to Credit Agreement (the “Term Facility Agreement”) among us, as Borrower, the Guarantors party thereto and Bank of America, N.A. as Lender. The amendment updated the index used for the Base Rate (as further defined within the Term Facility Agreement) from LIBOR to Term SOFR. The Term Facility matures on December 30, 2026.
Under the Term Facility, we are required to make quarterly amortization payments in installments of 1.250% of the Term Facility on the last business day of each quarter. We may prepay amounts outstanding under the Term Facility without penalty other than interest breakage costs. In June 2023, we made a prepayment on the Term Facility of $45.0 million with $32.4 million applied against the remaining quarterly installments and the remainder applied against the amount due at maturity.
Our obligations under the Term Facility are guaranteed on an unsecured basis by substantially all of our existing and future domestic subsidiaries. The Term Facility Agreement contains various customary affirmative and negative covenants and events of default. The occurrence of any of these events of default would permit the lenders to, among other things, require immediate payment of all amounts outstanding under the Term Facility Agreement.
At December 31, 2023, the Term Facility had an outstanding balance of $109.9 million at a weighted average effective interest rate of 6.6%.
Borrowings under the Term Facility bear interest, at our option, at either of the following and, in each case, plus an applicable margin:
a.a base rate, which is the greatest of (i) the rate per annum equal to the weighted average of the rates on overnight federal funds transactions with members of the Federal Reserve System, as published by the Federal Reserve Bank of New York on the business day next succeeding such day plus 0.50%, (ii) Bank of America’s “prime rate,” or (iii) the Term SOFR Rate (defined below) plus 1.00%; or
b.the Term SOFR Rate, which is the greater of (i) the rate per annum equal to the Term SOFR Screen Rate administered by CME Group Benchmark Administration Limited or any successor administrator plus the SOFR adjustment of 0.10% or (ii) a floor rate specified in the Term Facility Agreement.
The interest rate margins on the borrowings under the Term Facility are based on our leverage ratio and will range from 0.000% to 0.625% on Base Rate borrowings and 1.000% to 1.625% on Adjusted Term SOFR Rate borrowings (with all such rates being calculated in accordance with the terms and by reference to the definitions specified in the Term Facility Agreement).
Receivables Securitization Facility
On November 28, 2017,1, 2022, we and certain of our subsidiaries entered into an amendment ofagreement (the “Amended Receivables Purchase Agreement”) amending our two-year accounts receivable securitization facility (the Receivables Facility).facility. As amended, the Receivables Facility has a peak seasonal funding capacitymaximum facility limit of up to $255.0$350.0 million between May 1in the months of April through August and June 30, which includes an additional seasonala funding capacity that is available between March 1 and July 31. Other funding capacities rangeranges from $80.0$210.0 million to $220.0$340.0 million throughoutduring the remaining months of the year. The maturity date of the Receivables Facility is November 1, 2024. Amounts outstanding under the Receivables Facility bear interest at Term SOFR plus an applicable margin of 0.75%.
The Receivables Facility provides for the sale of certain of our receivables to a wholly owned subsidiary (the Securitization Subsidiary)“Securitization Subsidiary”). The Securitization Subsidiary transfers variable undivided percentage interests in the receivables and related rights to certain third partythird-party financial institutions in exchange for cash proceeds, limited to the applicable funding capacities. Upon payment of the receivables by customers, rather than remitting to the financial institutions the amounts collected, we retain such collections as proceeds for the sale of new receivables until payments become due to the financial institutions.
The Receivables Facility is subject to terms and conditions (including representations, covenants and conditions precedent) customary for transactions of this type. FailureAdditionally, an amortization event will occur if we fail to maintain certain ratios or meet certain covenants, including maintaining a maximum average total leverage ratio (average total funded debt/EBITDA) of these covenants could trigger an amortization event.3.25 to 1.00 and a minimum fixed charge coverage ratio (EBITDAR/cash interest expense plus rental expense) of 2.25 to 1.00.
At December 31, 2017,2023, there was $100.0$191.7 million outstanding under the Receivables Facility at a weighted average effective interest rate of 2.3%6.2%, excluding commitment fees.
Depending on the funding source used by the financial institutions to purchase the receivables, amounts outstanding under the Receivables Facility bear interest at one of the following and, in each case, plus an applicable margin of 0.75%:
| |
a. | for financial institutions using the commercial paper market, commercial paper rates based on the applicable variable rates in the commercial paper market at the time of issuance; or |
| |
b. | for financial institutions not using the commercial paper market, LMIR. |
We also pay an unused fee of 0.35% on the excess of the facility limit over the average daily capital outstanding. The unused fee is 0.25% if utilization is less than 50% or 0.35% otherwise. We pay this fee monthly in arrears.
Australian Seasonal Credit Facility
In the second quarter of 2017, PSLPool Systems Pty. Ltd. (PSL) entered into a new credit facility to fund expansion and supplement working capital needs. The new credit facility provides a borrowing capacity of AU$20.0 million, and the balance as of December 31, 2017 includes borrowings to fund the Newline Pool Products acquisition and the purchase of the noncontrolling interest. The previous credit facility, used to supplement working capital needs during peak season, provided a borrowing capacity of AU$3.0 million.
Cash Pooling Arrangement
Certain of our foreign subsidiaries entered into a cash pooling arrangement with a financial institution for cash management purposes. This arrangement allows the participating subsidiaries to withdraw cash from the financial institution to the extent that aggregate cash deposits held by these subsidiaries are available at the financial institution. To the extent the participating subsidiaries are in an overdraft position, such overdrafts are recorded as short-term borrowings under a committed cash overdraft facility. These borrowings bear interest at a variable rate based on 3-month Euro Interbank Offered Rate (EURIBOR), plus a fixed margin. We also pay a commitment fee on the average outstanding balance. This fee is paid annually in advance. Our borrowing capacity is €12.0€14.0 million.
Maturities of Long-Term Debt
The table below presents maturities of long-term debt, excluding unamortized deferred financing costs, for the next five years (in thousands):
| | | | | | | | |
| 2024 | | $ | 229,903 | |
| 2025 | | 37,500 | |
| 2026 | | 787,438 | |
| 2027 | | — | |
| 2028 | | — | |
Our Receivables Facility matures November 1, 2024 and is included in the table above according to its stated maturity date. On our Consolidated Balance Sheets, we classify the entire outstanding balance of the Receivables Facility as Long-term debt as we intend and have the ability to refinance the obligations on a long-term basis.
Interest Rate Swaps
Our interest rate swaps in effect during the year were previously forward-starting and converted the variable interest rate to a fixed interest rate on a portion of our variable rate borrowings. Interest expense related to the notional amounts under our swap contracts was based on the fixed rates plus the applicable margin on our variable rate borrowings. Changes in the estimated fair value of these interest rate swap contracts were recorded to Accumulated other comprehensive loss on the Consolidated Balance Sheets.
We currently have threetwo interest rate swap contracts in place, which became effective on October 19, 2016. These swaps were previously forward-starting contracts that were amended in October 2015 to bring the fixed rates per our forward-starting contracts in line with current market rates and extend the hedged period for future interest payments on our Credit Facility. As amended, these swap contracts terminate on November 20, 2019. We recognized a benefit of $2.4 million in 2017, expense of $0.1 million in 2016 and a benefit of $0.6 million in 2015 as a result of our determination of ineffectiveness for the period. These amounts were recorded in Interest and other non-operating expenses, net on our Consolidated Statements of Income.
place. The following table provides additional details related to each of these amended swap contracts:
| | | | | | | | | | | | | | | | | | | | | | | | | | | | | | | | |
| Derivative | | Inception Date | | Effective Date | | Termination Date | | Notional
Amount
(in millions) | | Fixed
Interest
Rate |
| Interest rate swap 1 | | February 5, 2020 | | February 26, 2021 | | February 28, 2025 | | $150.0 | | 1.3260% |
| Interest rate swap 2 | | March 9, 2020 | | September 29, 2022 | | February 26, 2027 | | $150.0 | | 0.6690% |
|
| | | | | | | | | |
| Derivative | | Amendment Date | | Notional Amount (in millions) | | Fixed Interest Rate |
| Interest rate swap 6 | | October 1, 2015 | | $ | 75.0 |
| | 2.273 | % |
| Interest rate swap 7 | | October 1, 2015 | | 25.0 |
| | 2.111 | % |
| Interest rate swap 8 | | October 1, 2015 | | 50.0 |
| | 2.111 | % |
Upon amendment of the original hedge agreements, we were required to freeze the amounts related to the changes in the fair values of these swaps, which are recorded in Accumulated other comprehensive loss. At December 31, 2017, the remaining balance of the unrealized losses was $1.4 million and is being amortized over the effective period of the original forward-starting interest rate swap contracts from October 2016 to September 2018. We recorded expense of $1.9 million in 2017 and $0.4 million in 2016 as amortization of the unrealized loss in Interest and other non-operating expenses, net.
In July 2016, wehave entered into a newan additional forward-starting interest rate swap contract to extend the hedged period for future interest payments on a portion of our Credit Facilityvariable rate borrowings. The following table provides details related to its maturity date. This swap contract will convert the variableour forward-starting interest rate to a fixedswap contract:
| | | | | | | | | | | | | | | | | | | | | | | | | | | | | | | | |
| Derivative | | Inception Date | | Effective Date | | Termination Date | | Notional
Amount
(in millions) | | Fixed
Interest
Rate |
| Forward-starting interest rate swap | | March 9, 2020 | | February 28, 2025 | | February 26, 2027 | | $150.0 | | 0.7630% |
Two of our interest rate swap contracts terminated on borrowings under the Credit Facility. This contract becomes effective on November 20, 2019 and terminates on November 20, 2020.September 29, 2022. The following table provides additional details related to thisthese former swap contract:contracts:
| | | | | | | | | | | | | | | | | | | | | | | | | | | | | | | | |
| Derivative | | Inception Date | | Effective Date | | Termination Date | | Notional
Amount
(in millions) | | Fixed
Interest
Rate |
| Former interest rate swap 1 | | May 7, 2019 | | November 20, 2020 | | September 29, 2022 | | $75.0 | | 2.0925% |
| Former interest rate swap 2 | | July 25, 2019 | | November 20, 2020 | | September 29, 2022 | | $75.0 | | 1.5500% |
|
| | | | | | | | | |
| Derivative | | Inception Date | | Notional
Amount
(in millions) | | Fixed
Interest
Rate |
| Forward-starting interest rate swap | | July 6, 2016 | | $ | 150.0 |
| | 1.1425 | % |
The net difference between interest paid and interest received related to our swap agreements resulted in incrementalan interest benefit of $12.2 million in 2023 and $0.8 million in 2022 and expense of $1.7$4.3 million in 2017, $1.3 million in 2016 and $1.4 million in 2015. 2021.
In 2016 and 2015, we had five interest rate swap contracts in place to reduce our exposure to fluctuations in interest rates on the Credit Facility. Each of these swap contracts terminated on October 19, 2016. These swaps converted the variable interest rates to fixed interest rates on borrowings under the Credit Facility. For these interest rate swaps, we recognized no gains or losses through income, nor was there any effect on income from hedge ineffectiveness over the term of these swap contracts. The following table provides additional details related to each of these swap contracts:
|
| | | | | | | | | |
| Derivative | | Effective Date | | Notional Amount (in millions) | | Fixed Interest Rate |
| Interest rate swap 1 | | November 21, 2011 | | $ | 25.0 |
| | 1.185 | % |
| Interest rate swap 2 | | November 21, 2011 | | 25.0 |
| | 1.185 | % |
| Interest rate swap 3 | | December 21, 2011 | | 50.0 |
| | 1.100 | % |
| Interest rate swap 4 | | January 17, 2012 | | 25.0 |
| | 1.050 | % |
| Interest rate swap 5 | | January 19, 2012 | | 25.0 |
| | 0.990 | % |
Failure of our swap counterparties would result in the loss of any potential benefit to us under our swap agreements. In this case, we would still be obligated to pay the variable interest payments underlying our debt agreements. Additionally, failure of our swap counterparties would not eliminate our obligation to continue to make payments under our existing swap agreements if we continue to be in a net pay position.
Financial and Other Covenants
Financial covenants on theThe Credit Facility and ReceivablesTerm Facility are closely aligned and include a minimum fixed charge coverage ratio and maintenance of a maximum average total leverage ratio, which are our most restrictive covenants. The Credit Facility also limitslimit the declaration and payment of dividends on our common stock to no more than 50% of the preceding year’s Net Income (as defined in the Credit Facility),a manner consistent with past practice, provided no default or event of default has occurred and is continuing, or would result from the payment of dividends. Additionally, weWe may declare and pay quarterly dividends notwithstanding that the aggregate amount of dividends paid would be in excess of the 50% limit described above so long as (i) the amount per share of such dividends doesis not exceed the amount per share paid duringgreater than the most recent fiscal year in which we were in compliance with the 50% limitrecently publicly announced dividends per share and (ii) our Average Total Leverage Ratio is less than 3.003.25 to 1.00 both immediately before and after giving pro forma effect to such dividends. Further, dividends must be declared and paid in a manner consistent with our past practice.
Under the Credit Facility and Term Facility, we may repurchase shares of our common stock provided no default or event of default has occurred and is continuing, or would result from the repurchase of shares, and our maximum average total leverage ratio (determined on a pro forma basis) is less than 2.503.25 to 1.00.
Other covenants include restrictions on our ability to grant liens, incur indebtedness, make investments, merge or consolidate, and sell or transfer assets. Failure to comply with any of our financial covenants or any other terms of the Credit Facility and the Term Facility could result in penalty payments, higher interest rates on our borrowings or the acceleration of the maturities of our outstanding debt.
As of December 31, 2017,2023, we were in compliance with all covenants and financial ratio requirements related to the Credit Facility, the Term Facility and the Receivables Facility.
Deferred Financing Costs
We capitalize financing costs we incur related to implementing and amending our debt arrangements. We record these costs as a reduction of Long-term debt, net on our Consolidated Balance Sheets and amortize them over the contractual life of the related debt arrangements. The table below summarizes changes in deferred financing costs for the past two years (in thousands):
| | | | | | | | | | | | | | |
| | December 31, |
| | | 2023 | | 2022 |
| Deferred financing costs: | | | | |
| Balance at beginning of year | | $ | 4,212 | | | $ | 4,042 | |
| Financing costs deferred | | 52 | | | 170 | |
| | | | |
| Balance at end of year | | 4,264 | | | 4,212 | |
| Less: Accumulated amortization | | (2,744) | | | (2,012) | |
| Deferred financing costs, net of accumulated amortization | | $ | 1,520 | | | $ | 2,200 | |
|
| | | | | | | | |
| | | December 31, |
| | | 2017 | | 2016 |
| Deferred financing costs: | | | | |
| Balance at beginning of year | | $ | 4,883 |
| | $ | 4,814 |
|
| Financing costs deferred | | 1,104 |
| | 69 |
|
| Write-off of fully amortized deferred financing costs | | (1,381 | ) | | — |
|
| Balance at end of year | | 4,606 |
| | 4,883 |
|
| Less: Accumulated amortization | | (2,982 | ) | | (3,771 | ) |
| Deferred financing costs, net of accumulated amortization | | $ | 1,624 |
| | $ | 1,112 |
|
Note 6 - Share-Based Compensation
Share-Based Plans
Current Plan
In May 2007, our stockholdersshareholders approved the 2007 Long-Term Incentive Plan (the 2007 LTIP), which authorizes the Compensation Committee of our Board of Directors (the Board) to grant non-qualified stock options and restricted stock awards to employees, directors, consultants or advisors. In May 2016, our stockholdersshareholders approved an amendment and restatement of the 2007 Long‑TermLong-Term Incentive Plan (the Amended 2007 LTIP) and increased the number of shares that may be issued to a total of 9,315,000 shares. As of December 31, 2017,2023, we had 4,615,1483,947,708 shares available for future issuance including 1,186,521853,337 shares that may be issued as restricted stock.
Stock options granted under the Amended 2007 LTIP have an exercise price equal to our stock’s closing market price on the grant date and expire ten years from the grant date. Restricted stock awards granted under the Amended 2007 LTIP are issued at no cost to the grantee. Both stock options and restricted stock awards vest over time depending on an employee’s length of service with the Company.company. Share-based awards to our employees generally vest either five years from the grant date or on a three/three/five year split vest schedule, where half of the awards vest three years from the grant date and the remainder of the awards vest five years from the grant date. Share‑basedShare-based awards to our non-employee directors vest one year from the grant date.
Beginning with 2016 grants, certain restrictedRestricted stock awards to our employees contain performance-based criteria in addition to the service-based vesting criteria discusseddescribed above. The awards provide for a three-year performance period for the metric to be achieved. If the performance metric fails to be met, it may be extended by one or two years; however, if it is not met by the end of the extended performance period, then all shares of performance-based restricted stock will be immediately forfeited and canceled. SinceFor each grant date,of the performance-based grants from 2016 through 2021, we achieved the performance condition in the initial three-year performance period. For the performance-based grants in 2022 and 2023, we have concluded attainment of thesethat the performance conditions to becondition is probable to be achievedattained in the firstinitial three-year performance period for the 2017 and 2016 performance-based grants.period.
Stock Option Awards
The following table summarizes stock option activity under our share-based plans for the year ended December 31, 2017:2023:
| | | | | | | | | | | | | | | | | | | | | | | | | | |
| | | Shares | | Weighted Average
Exercise Price | | Weighted Average
Remaining
Contractual Term
(Years) | | Aggregate
Intrinsic Value |
| Balance at December 31, 2022 | | 642,925 | | | $ | 154.57 | | | | | |
| Granted | | 33,408 | | | 357.52 | | | | | |
| Less: Exercised | | 90,439 | | | 92.52 | | | | | |
| Forfeited | | 15,172 | | | 293.44 | | | | | |
| Balance at December 31, 2023 | | 570,722 | | | $ | 173.13 | | | 4.22 | | $ | 129,309,839 | |
| | | | | | | | |
| Exercisable at December 31, 2023 | | 371,551 | | | $ | 102.10 | | | 2.48 | | $ | 110,210,899 | |
|
| | | | | | | | | | | | | |
| | | Shares | | Weighted Average Exercise Price | | Weighted Average Remaining Contractual Term (Years) | | Aggregate Intrinsic Value |
| Balance at December 31, 2016 | | 2,550,883 |
| | $ | 34.70 |
| | | | |
| Granted | | 108,275 |
| | 116.99 |
| | | | |
|
| Less: Exercised | | 364,984 |
| | 26.88 |
| | | | |
|
| Forfeited | | 6,775 |
| | 94.20 |
| | | | |
|
| Balance at December 31, 2017 | | 2,287,399 |
| | $ | 39.67 |
| | 3.85 | | $ | 205,820,051 |
|
| | | | | | | | | |
| Exercisable at December 31, 2017 | | 1,650,386 |
| | $ | 26.33 |
| | 2.55 | | $ | 170,526,117 |
|
The following table presents information about stock options outstanding and exercisable at December 31, 2017:2023:
| | | | | | | | | | | | | | | | | | | | | | | | | | | | | | | | |
| | | Outstanding
Stock Options | | Exercisable
Stock Options |
| Range of Exercise Prices | | Shares | | Weighted Average
Remaining
Contractual Term
(Years) | | Weighted Average Exercise Price | | Shares | | Weighted Average Exercise Price |
| $58.26 to $80.78 | | 214,410 | | | 1.26 | | $ | 70.78 | | | 214,410 | | | $ | 70.78 | |
| $80.79 to $220.01 | | 216,574 | | | 4.53 | | 155.78 | | | 155,415 | | | 142.35 | |
| $220.02 to $515.41 | | 139,738 | | | 8.26 | | 357.05 | | | 1,726 | | | 370.02 | |
| | | 570,722 | | | 4.22 | | $ | 173.13 | | | 371,551 | | | $ | 102.10 | |
|
| | | | | | | | | | | | | | | | |
| | | Outstanding Stock Options | | Exercisable Stock Options |
| Range of Exercise Prices | | Shares | | Weighted Average Remaining Contractual Term (Years) | | Weighted Average Exercise Price | | Shares | | Weighted Average Exercise Price |
| $ 18.00 to $ 20.34 | | 885,493 |
| | 1.36 | | $ | 19.54 |
| | 885,493 |
| | $ | 19.54 |
|
| $ 20.35 to $ 45.61 | | 811,756 |
| | 3.91 | | 33.75 |
| | 695,031 |
| | 31.76 |
|
| $ 45.62 to $ 117.04 | | 590,150 |
| | 7.51 | | 78.02 |
| | 69,862 |
| | 58.30 |
|
| | | 2,287,399 |
| | 3.85 | | $ | 39.67 |
| | 1,650,386 |
| | $ | 26.33 |
|
The following table summarizes the cash proceeds and tax benefits realized from the exercise of stock options:
| | | | | | | | | | | | | | | | | | | | |
| | | Year Ended December 31, |
| (in thousands, except share amounts) | | 2023 | | 2022 | | 2021 |
| Options exercised | | 90,439 | | | 71,737 | | | 274,253 | |
| Cash proceeds | | $ | 8,368 | | | $ | 6,247 | | | $ | 14,435 | |
| Intrinsic value of options exercised | | $ | 23,356 | | | $ | 21,976 | | | $ | 118,305 | |
| Tax benefits realized | | $ | 5,839 | | | $ | 5,494 | | | $ | 29,576 | |
|
| | | | | | | | | | | | |
| | | Year Ended December 31, |
| (in thousands, except share amounts) | | 2017 | | 2016 | | 2015 |
| Options exercised | | 364,984 |
| | 343,237 |
| | 543,028 |
|
| Cash proceeds | | $ | 9,809 |
| | $ | 10,340 |
| | $ | 17,137 |
|
| Intrinsic value of options exercised | | $ | 33,302 |
| | $ | 21,094 |
| | $ | 22,676 |
|
| Tax benefits realized | | $ | 12,809 |
| | $ | 7,891 |
| | $ | 8,326 |
|
We estimated the fair value of employee stock option awards at the grant date based on the assumptions summarized in the following table:
| | | | | | | | | | | | | | | | | | | | | | | | | | | | | |
| | | Year Ended December 31, |
| (Weighted average) | | 2023 | | 2022 | | 2021 |
| Expected volatility | | 31.0 | % | | | 28.9 | % | | | 27.0 | % | |
| Expected term | | 7.4 | years | | 7.1 | years | | 6.9 | years |
| Risk-free interest rate | | 4.01 | % | | | 2.92 | % | | | 1.00 | % | |
| Expected dividend yield | | 1.15 | % | | | 1.15 | % | | | 1.15 | % | |
| Grant date fair value | | $ | 130.74 | | | | $ | 116.56 | | | | $ | 83.05 | | |
|
| | | | | | | | | | | | | | | |
| | | Year Ended December 31, |
| (Weighted average) | | 2017 | | 2016 | | 2015 |
| Expected volatility | | 26.6 | % | | | 29.7 | % | | | 33.8 | % | |
| Expected term | | 7.3 |
| years | | 7.1 |
| years | | 7.2 |
| years |
| Risk-free interest rate | | 2.44 | % | | | 1.75 | % | | | 1.95 | % | |
| Expected dividend yield | | 1.5 | % | | | 1.5 | % | | | 1.5 | % | |
| Grant date fair value | | $ | 32.00 |
| | | $ | 22.86 |
| | | $ | 22.57 |
| |
We calculated expected volatility over the expected term of the awards based on the historical volatility of our common stock. We use weekly price observations for our historical volatility calculation because we believe that they providethis provides the most appropriate measurement of volatility given the trading patterns of our common stock. We estimated the expected term based on the vesting period of the awards and our historical exercise activity for awards with similar characteristics. The weighted average expected term is impacted by a higher expected term estimate for stock option awards granted to our named executive officers. The risk-free interest rate is based on the U.S. Treasury zero-coupon issues with a remaining term approximating the expected term of the option. We determined the expected dividend yield based on the anticipated dividends we anticipate paying over the expected term.
For purposes of recognizing share-based compensation expense, we ratably expense the estimated fair value of employee stock options over the options’ requisite service period. The requisite service period for our share-based awards is either the vesting period, or if shorter, the period from the grant date to the date that employees meet the retirement provisions ofemployee becomes eligible to retire under our share-based award agreements. We recognize compensation cost for awards with graded vesting using the graded vesting recognition method. We estimate a forfeiture rate to calculate our share-based compensation expense for our share-based awards based on an analysis of actual forfeitures. We continue to evaluate the appropriateness of the forfeiture rate based on actual forfeiture experience, analysis of employee turnover and other factors.
The following table presents the total share-based compensation expense for stock option awards and the related recognized tax benefits for the past three years (in thousands):
| | | | | | | | | | | | | | | | | | | | |
| | | 2023 | | 2022 | | 2021 |
| Option grants share-based compensation expense | | $ | 4,618 | | | $ | 3,413 | | | $ | 2,846 | |
| Option grants share-based compensation tax benefits | | 1,154 | | | 853 | | | 712 | |
|
| | | | | | | | | | | | |
| | | 2017 | | 2016 | | 2015 |
| Option grant share-based compensation expense | | $ | 3,553 |
| | $ | 3,735 |
| | $ | 3,688 |
|
| Option grant recognized tax benefits | | 888 |
| | 1,409 |
| | 1,331 |
|
At December 31, 2017,2023, the unamortized compensation expense related to stock option awards totaled $3.5 million.$8.1 million. We anticipate thatrecognizing this expense will be recognized over a weighted average period of 1.7 years.of 2.8 years.
Restricted Stock Awards
The table below presents restricted stock awardsaward activity under our share-based plans for the year ended December 31, 2017:2023:
| | | | | | | | | | | | | | |
| | | Shares | | Weighted Average
Grant Date Fair Value |
| Balance unvested at December 31, 2022 | | 212,717 | | | $ | 256.97 | |
Granted (at market price) (1) | | 55,196 | | | 357.96 | |
| Less: Vested | | 58,705 | | | 172.24 | |
| Forfeited | | 5,571 | | | 326.45 | |
| Balance unvested at December 31, 2023 | | 203,637 | | | $ | 306.79 | |
|
| | | | | | | |
| | | Shares | | Weighted Average Grant Date Fair Value |
| Balance unvested at December 31, 2016 | | 285,019 |
| | $ | 64.33 |
|
Granted (at market price) (1) | | 95,479 |
| | 115.38 |
|
| Less: Vested | | 79,224 |
| | 52.73 |
|
| Forfeited | | 3,750 |
| | 80.69 |
|
| Balance unvested at December 31, 2017 | | 297,524 |
| | $ | 83.36 |
|
(1)The majority of these shares contain performance-based vesting conditions.
At December 31, 2017,2023, the unamortized compensation expense related to the restricted stock awards totaled $6.2 million.$23.0 million. We anticipate thatrecognizing this expense will be recognized over a weighted average period of 2.82.4 years.
The table below presents the total number of restricted stock awards that vested for the past three years and the related fair value of those awards (in thousands, except share amounts):
| | | | | | | | | | | | | | | | | | | | |
| | | 2023 | | 2022 | | 2021 |
| Restricted stock awards - shares vested | | 58,705 | | | 78,931 | | | 69,069 | |
| Fair value of restricted stock awards vested | | $ | 20,906 | | | $ | 37,258 | | | $ | 24,005 | |
|
| | | | | | | | | | | | |
| | | 2017 | | 2016 | | 2015 |
| Restricted stock awards - shares vested | | 79,224 |
| | 95,420 |
| | 147,619 |
|
| Fair value of restricted stock awards vested | | $ | 9,260 |
| | $ | 7,960 |
| | $ | 10,182 |
|
The following table presents the total share-based compensation expense for restricted stock awards for the past three years (in thousands):
| | | | | | | | | | | | | | | | | | | | |
| | | 2023 | | 2022 | | 2021 |
| Restricted stock awards share-based compensation expense | | $ | 14,487 | | | $ | 11,024 | | | $ | 11,543 | |
|
| | | | | | | | | | | | |
| | | 2017 | | 2016 | | 2015 |
| Restricted stock awards share-based compensation expense | | $ | 8,547 |
| | $ | 5,993 |
| | $ | 5,513 |
|
Employee Stock Purchase Plan
In March 1998,We maintain the Board adopted the SCP Pool Corporation Amended and Restated Employee Stock Purchase Plan (the ESPP)., which was last approved by the Board and our stockholders in 2016. Under the ESPP, employees who meet minimum age and length of service requirements may purchase stock at 85% of the lower of:
| |
a. | as amended in May 2016, the closing price of our common stock at the end of a six month plan period ending either July 31 or January 31 (prior to the amendment, the six month plan period ended on June 30 or December 31); or |
| |
b. | the average of the beginning and ending closing prices of our common stock for such six month period. |
a.the closing price of our common stock at the end of a six month plan period ending either July 31 or January 31; or
b.the average of the beginning and ending closing prices of our common stock for such six month period.
No more than 956,250 shares of our common stock may be issued under the ESPP. For the two six month offering periods in 2017,each of the one six month offering period in 2016, and the two six month offering periods in 2015,last three years, our employees purchased the following aggregate number of shares:
| | | | | | | | | | | | | | |
| 2023 | | 2022 | | 2021 |
| 7,640 | | | 7,658 | | | 8,649 | |
|
| | | | | | | |
| 2017 | | 2016 | | 2015 |
| 16,610 |
| | 8,649 |
| | 22,555 |
|
The grant date fair value for the most recent ESPP purchase period ended July 31, 20172023 was $17.30 $57.71 per share. Share-based compensation expense related to our ESPP was $0.4$0.5 million in 2023, $0.5 million in 2017, $0.22022 and $0.8 million in 2016 and $0.3 million in 2015.2021.
Note 7 - Income Taxes
OurIncome before income taxes and equity in earnings is attributable to the following jurisdictions (in thousands):
| | | | | | | | | | | | | | | | | | | | |
| | | Year Ended December 31, |
| | | 2023 | | 2022 | | 2021 |
| United States | | $ | 662,138 | | | $ | 919,461 | | | $ | 752,957 | |
| Foreign | | 25,998 | | | 65,411 | | | 71,188 | |
| Total | | $ | 688,136 | | | $ | 984,872 | | | $ | 824,145 | |
The provision for income taxes for 2017 was impacted by the Tax Cuts and Jobs Act (TCJA or the Act) enactment in December 2017 and our adoption of Accounting Standards Update (ASU) 2016-09, Improvements to Share-Based Payment Accounting, on January 1, 2017.
As of December 31, 2017, we have not completed our accounting for the tax effectsconsisted of the Act. In accordance with SAB 118 we have recorded provisional amounts related to the transition tax, impactsfollowing (in thousands):
| | | | | | | | | | | | | | | | | | | | |
| | | Year Ended December 31, |
| | | 2023 | | 2022 | | 2021 |
| Current: | | | | | | |
| Federal | | $ | 120,122 | | | $ | 164,135 | | | $ | 124,379 | |
| State and other | | 34,603 | | | 57,459 | | | 44,783 | |
| Total current provision for income taxes | | 154,725 | | | 221,594 | | | 169,162 | |
| | | | | | |
| Deferred: | | | | | | |
| Federal | | 9,929 | | | 13,592 | | | 2,970 | |
| State and other | | 430 | | | 1,577 | | | 1,680 | |
| Total deferred provision for income taxes | | 10,359 | | | 15,169 | | | 4,650 | |
| Provision for income taxes | | $ | 165,084 | | | $ | 236,763 | | | $ | 173,812 | |
A reconciliation of the ActU.S. federal statutory tax rate to our effective tax rate on state taxes, provisions of the Act related to deferred tax balances, and foreign tax implications. Our accounting for the tax effects of the Act will be completedIncome before the measurement period, which is one year from the Act’s enactment date. As a result of the Act, we recorded a provisional tax benefit of $12.0 million in the fourth quarter of 2017, which primarily reflects the re-measurement of our net deferred tax liability. We believe our net benefit is based on reasonable estimates for those tax effects of the Act. Changes to these estimates or new guidance issued by regulators may materially impact our provision for income taxes and effective tax rateequity in the period in which the adjustments are made.earnings is as follows:
| | | | | | | | | | | | | | | | | | | | |
| | | Year Ended December 31, |
| | | 2023 | | 2022 | | 2021 |
| Federal statutory rate | | 21.00 | % | | 21.00 | % | | 21.00 | % |
| Change in valuation allowance | | 0.05 | | | (0.02) | | | (0.11) | |
| Stock-based compensation | | (0.97) | | | (1.09) | | | (3.67) | |
| | | | | | |
| Other, primarily state income tax rate | | 3.91 | | | 4.15 | | | 3.87 | |
| Total effective tax rate | | 23.99 | % | | 24.04 | % | | 21.09 | % |
We reduce federal and state income taxes payable by the tax benefits associated with the exercise of deductible nonqualified stock options and the lapse of restrictions on deductible restricted stock awards. To the extent realized tax deductions exceed the amount of previously recognized deferred tax benefits related to share-based compensation, we record an excess tax benefit. Upon adoption of ASU 2016-09, we were required toWe record all excess tax benefits or deficiencies as income tax benefit or expense in the income statement. We recorded excess tax benefits of $12.6$6.7 million to our income tax provision in 2017. Prior to the adoption of this guidance, we were required to record excess tax benefits in stockholders’ equity, of which we recorded $7.42023, $10.8 million in 2016. For additional discussion of our adoption of this accounting guidance, see Note 1.2022 and $30.0 million in 2021.
Income before income taxes and equity earnings is attributable to the following jurisdictions (in thousands):
|
| | | | | | | | | | | | |
| | | Year Ended December 31, |
| | | 2017 | | 2016 | | 2015 |
| United States | | $ | 259,436 |
| | $ | 234,646 |
| | $ | 203,269 |
|
| Foreign | | 9,746 |
| | 6,732 |
| | 4,881 |
|
| Total | | $ | 269,182 |
| | $ | 241,378 |
| | $ | 208,150 |
|
The provision for income taxes consisted of the following (in thousands):
|
| | | | | | | | | | | | |
| | | Year Ended December 31, |
| | | 2017 | | 2016 | | 2015 |
| Current: | | | | | | |
| Federal | | $ | 71,329 |
| | $ | 77,000 |
| | $ | 65,676 |
|
| State and other | | 11,289 |
| | 12,182 |
| | 10,263 |
|
| Total current provision for income taxes | | 82,618 |
| | 89,182 |
| | 75,939 |
|
| | | | | | | |
| Deferred: | | | | | | |
| Federal | | (6,643 | ) | | 4,079 |
| | 4,568 |
|
| State and other | | 2,007 |
| | (330 | ) | | (370 | ) |
| Total deferred provision for income taxes | | (4,636 | ) | | 3,749 |
| | 4,198 |
|
| Provision for income taxes | | $ | 77,982 |
| | $ | 92,931 |
| | $ | 80,137 |
|
A reconciliation of the U.S. federal statutory tax rate to our effective tax rate on Income before income taxes and equity earnings is as follows:
|
| | | | | | | | | |
| | | Year Ended December 31, |
| | | 2017 | | 2016 | | 2015 |
| Federal statutory rate | | 35.00 | % | | 35.00 | % | | 35.00 | % |
| Change in valuation allowance | | (0.06 | ) | | 0.10 |
| | 0.20 |
|
| Stock-based compensation | | (4.67 | ) | | — |
| | — |
|
| Re-measurement of net deferred tax liability | | (4.46 | ) | | — |
| | — |
|
| Other, primarily state income tax rate | | 3.16 |
| | 3.40 |
| | 3.30 |
|
| Total effective tax rate | | 28.97 | % | | 38.50 | % | | 38.50 | % |
Upon our adoption of ASU 2015-17, Balance Sheet Classification of Deferred Taxes, effective January 1, 2017, we classified all deferred tax assets and liabilities as noncurrent on the balance sheet rather than separately presenting net deferred tax assets or liabilities as current or noncurrent. Also, we no longer allocate valuation allowances between current and noncurrent deferred tax assets because those allowances are also be required to be classified as noncurrent. We adopted this guidance on a prospective basis, and as such, our prior year balances or classifications have not changed.
The table below presents the components of our deferred tax assets and liabilities (in thousands):
| | | | | | | | | | | | | | |
| | | December 31, |
| | | 2023 | | 2022 |
| Deferred tax assets: | | | | |
| | | | |
| | | | |
| | | | |
| | | | |
| | | | |
| | | | |
| | | | |
| | | | |
| Product inventories | | $ | 11,764 | | | $ | 10,932 | |
| Accrued expenses | | 4,724 | | | 2,028 | |
| | | | |
| Leases | | 73,874 | | | 65,852 | |
| Share-based compensation | | 9,977 | | | 8,636 | |
| Uncertain tax positions | | 3,753 | | | 3,253 | |
| Net operating losses | | 1,447 | | | 987 | |
| | | | |
| | | | |
| Other | | 4,716 | | | 4,139 | |
| Total non-current | | 110,255 | | | 95,827 | |
| Less: Valuation allowance | | (1,133) | | | (815) | |
| Component reclassified for net presentation | | (107,733) | | | (94,034) | |
| Total non-current, net | | 1,389 | | | 978 | |
| | | | |
| Total deferred tax assets | | 1,389 | | | 978 | |
| | | | |
| Deferred tax liabilities: | | | | |
| | | | |
| | | | |
| | | | |
| | | | |
| | | | |
| | | | |
| Trade discounts on purchases | | 2,112 | | | 3,995 | |
| Prepaid expenses | | 6,610 | | | 4,903 | |
| Leases | | 73,092 | | | 64,549 | |
| Intangible assets, primarily goodwill | | 60,902 | | | 48,836 | |
| Depreciation | | 26,000 | | | 21,998 | |
| Interest rate swaps | | 6,438 | | | 8,512 | |
| Total non-current | | 175,154 | | | 152,793 | |
| Component reclassified for net presentation | | (107,733) | | | (94,034) | |
| Total non-current, net | | 67,421 | | | 58,759 | |
| | | | |
| Total deferred tax liabilities | | 67,421 | | | 58,759 | |
| | | | |
| Net deferred tax liability | | $ | 66,032 | | | $ | 57,781 | |
|
| | | | | | | | |
| | | December 31, |
| | | 2017 | | 2016 |
| Deferred tax assets: | | | | |
| Product inventories | | $ | — |
| | $ | 7,010 |
|
| Accrued expenses | | — |
| | 3,978 |
|
| Allowance for doubtful accounts | | — |
| | 396 |
|
| Total current | | — |
| | 11,384 |
|
| Component reclassified for net presentation | | — |
| | (5,368 | ) |
| Total current, net | | — |
| | 6,016 |
|
| | | | | |
| Product inventories | | 4,287 |
| | — |
|
| Accrued expenses | | 1,804 |
| | — |
|
| Allowance for doubtful accounts | | 154 |
| | — |
|
| Leases | | 1,188 |
| | 1,920 |
|
| Share-based compensation | | 8,884 |
| | 13,778 |
|
| Uncertain tax positions | | 2,087 |
| | 2,746 |
|
| Net operating losses | | 5,441 |
| | 5,735 |
|
| Interest rate swaps | | — |
| | 674 |
|
| Other | | 1,475 |
| | 2,465 |
|
| Total non-current | | 25,320 |
| | 27,318 |
|
| Less: Valuation allowance | | (5,440 | ) | | (5,735 | ) |
| Component reclassified for net presentation | | (19,071 | ) | | (20,781 | ) |
| Total non-current, net | | 809 |
| | 802 |
|
| | | | | |
| Total deferred tax assets | | 809 |
| | 6,818 |
|
| | | | | |
| Deferred tax liabilities: | |
|
| |
|
|
| Trade discounts on purchases | | — |
| | 2,698 |
|
| Prepaid expenses | | — |
| | 2,670 |
|
| Total current | | — |
| | 5,368 |
|
| Component reclassified for net presentation | | — |
| | (5,368 | ) |
| Total current, net | | — |
| | — |
|
| | | | | |
| Trade discounts on purchases | | 1,520 |
| | — |
|
| Prepaid expenses | | 1,857 |
| | — |
|
| Intangible assets, primarily goodwill | | 29,348 |
| | 42,930 |
|
| Depreciation | | 10,870 |
| | 12,326 |
|
| Interest rate swaps | | 61 |
| | — |
|
| Total non-current | | 43,656 |
| | 55,256 |
|
| Component reclassified for net presentation | | (19,071 | ) | | (20,781 | ) |
| Total non-current, net | | 24,585 |
| | 34,475 |
|
| | | | | |
| Total deferred tax liabilities | | 24,585 |
| | 34,475 |
|
| | | | | |
| Net deferred tax liability | | $ | 23,776 |
| | $ | 27,657 |
|
At December 31, 2017,2023, certain of our international subsidiaries had tax loss carryforwards totaling approximately $21.3$5.0 million,, which expire in various years after 2018.2024. Deferred tax assets related to the tax loss carryforwards of these international subsidiaries were $5.4$1.4 million as of December 31, 20172023 and $5.7$1.0 million as of December 31, 2016.2022. We have recorded a corresponding valuation allowance of $5.4$1.0 million and $5.7$0.7 million in the respective years.
As of December 31, 2017,2023, United States income taxes were not provided on earnings or cash balances of our foreign subsidiaries, outside of the provisions of the transition tax from U.S. tax reform.reform enacted in December 2017. As we have historically invested or expect to invest the undistributed earnings indefinitely to fund current cash flow needs in the countries where held, additional income tax provisions may be required. Determining the amount of unrecognized deferred tax liability on these undistributed earnings and cash balances is not practicable due to the complexity of tax laws and regulations and the varying circumstances, tax treatments and timing of any future repatriation. We are also still evaluating whether to change our indefinite reinvestment assertion in light of U.S. tax reform.
The following table summarizes the activity related to uncertain tax positions for the past three years (in thousands):
| | | | | | | | | | | | | | | | | | | | |
| | | 2023 | | 2022 | | 2021 |
| Balance at beginning of year | | $ | 15,489 | | | $ | 13,297 | | | $ | 15,553 | |
| Increases for tax positions taken during a prior period | | — | | | 275 | | | — | |
| Increases for tax positions taken during the current period | | 4,457 | | | 5,264 | | | 3,518 | |
| Decreases resulting from the expiration of the statute of limitations | | 2,075 | | | 3,347 | | | 3,185 | |
| Decreases relating to settlements | | — | | | — | | | 2,589 | |
| Balance at end of year | | $ | 17,871 | | | $ | 15,489 | | | $ | 13,297 | |
|
| | | | | | | | | | | | |
| | | 2017 | | 2016 | | 2015 |
| Balance at beginning of year | | $ | 7,846 |
| | $ | 5,978 |
| | $ | 4,690 |
|
| Increases for tax positions taken during a prior period | | 129 |
| | 10 |
| | 410 |
|
| Increases for tax positions taken during the current period | | 3,260 |
| | 2,819 |
| | 1,782 |
|
| Decreases resulting from the expiration of the statute of limitations | | 869 |
| | 961 |
| | 904 |
|
| Decreases relating to settlements | | 429 |
| | — |
| | — |
|
| Balance at end of year | | $ | 9,937 |
| | $ | 7,846 |
| | $ | 5,978 |
|
The total amount of unrecognized tax benefits that, if recognized, would decrease the effective tax rate was $7.9$14.1 million at December 31, 20172023 and $5.1$12.2 million at December 31, 2016.2022.
We record interest expense related to unrecognized tax benefits in Interest and other non-operating expenses, net, while we record related penalties in Selling and administrative expenses on our Consolidated Statements of Income. For unrecognized tax benefits, we had interest expense of $0.2$0.4 million in 2017, $0.2 million in 20162023 and interest income of $0.1 million in 2015.2022 and $0.6 million in 2021. Accrued interest related to unrecognized tax benefits was approximately $0.9$1.9 million at December 31, 20172023 and $0.7$1.6 million at December 31, 2016.2022.
We file income tax returns in the U.S. federal jurisdiction and various state and foreign jurisdictions. With few exceptions, we are no longer subject to U.S. federal, state and local, or non-U.S. income tax examinations by tax authorities for years before 2014.2020.
Note 8 - Earnings Per Share
We calculate basic and diluted earnings per share using the two-class method. Earnings per share under the two-class method is calculated using net income attributable to common stockholders, which is net income reduced by the earnings allocated to participating securities. Our participating securities include share-based payment awards that contain a non-forfeitable right to receive dividends and are considered to participate in undistributed earnings with common shareholders. Participating securities excluded from weighted average common shares outstanding were 207,000 for the year ended December 31, 2023, 221,000 for the year ended December 31, 2022 and 268,000 for the year ended December 31, 2021.
The table below presents the computation of earnings per share, including the reconciliation of basic and diluted weighted average shares outstanding (in thousands, except per share data):
| | | | | | | | | | | | | | | | | | | | |
| | | Year Ended December 31, |
| | | 2023 | | 2022 | | 2021 |
| Net income | | $ | 523,229 | | | $ | 748,462 | | | $ | 650,624 | |
| Amounts allocated to participating securities | | (2,771) | | | (4,151) | | | (4,321) | |
| Net income attributable to common stockholders | | $ | 520,458 | | | $ | 744,311 | | | $ | 646,303 | |
| | | | | | |
| Weighted average common shares outstanding: | | | | | | |
| Basic | | 38,704 | | | 39,409 | | | 39,876 | |
| Effect of dilutive securities: | | | | | | |
| Stock options and employee stock purchase plan | | 293 | | | 397 | | | 604 | |
| Diluted | | 38,997 | | | 39,806 | | | 40,480 | |
| | | | | | |
| Earnings per share attributable to common stockholders: | | | | | | |
| Basic | | $ | 13.45 | | | $ | 18.89 | | | $ | 16.21 | |
| Diluted | | $ | 13.35 | | | $ | 18.70 | | | $ | 15.97 | |
| | | | | | |
Anti-dilutive stock options excluded from diluted earnings per share computations (1) | | 64 | | | 34 | | | 1 | |
(1)Since these options have exercise prices that are higher than the average market prices of our common stock, including them in the calculation would have an anti-dilutive effect on earnings per share.
|
| | | | | | | | | | | | |
| | | Year Ended December 31, |
| | | 2017 | | 2016 | | 2015 |
| Net income | | $ | 191,339 |
| | $ | 148,603 |
| | $ | 128,224 |
|
| Net loss attributable to noncontrolling interest | | 294 |
| | 352 |
| | 51 |
|
| Net income attributable to Pool Corporation | | $ | 191,633 |
| | $ | 148,955 |
| | $ | 128,275 |
|
| Weighted average shares outstanding: | | | | |
| | |
|
| Basic | | 40,838 |
| | 41,872 |
| | 43,105 |
|
| Effect of dilutive securities: | | | | |
| | |
|
Stock options and employee stock purchase plan (1) | | 1,611 |
| | 1,112 |
| | 1,149 |
|
| Diluted | | 42,449 |
| | 42,984 |
| | 44,254 |
|
| | | | | | | |
| Earnings per share: | | | | | | |
| Basic | | $ | 4.69 |
| | $ | 3.56 |
| | $ | 2.98 |
|
| Diluted | | $ | 4.51 |
| | $ | 3.47 |
| | $ | 2.90 |
|
| | | | | | | |
Anti-dilutive stock options excluded from diluted earnings per share computations (2) | | 108 |
| | 1 |
| | — |
|
| |
(1)
| As discussed in Note 1, as a result of the adoption of ASU 2016-09, the calculation of the effect of dilutive securities for 2017 excludes any derived excess tax benefits or deficiencies from assumed future proceeds, resulting in an increase in diluted weighted average shares outstanding as compared to 2016 and 2015. |
| |
(2)
| Since these options have exercise prices that are higher than the average market prices of our common stock, including them in the calculation would have an anti-dilutive effect on earnings per share. |
Note 9 - Commitments and Contingencies
Commitments
We lease facilities for our corporate office,and administrative offices, sales centers and centralized shipping locations under operating leases that expire in various years through 2032.2036. Most of our leases contain five-year terms with renewal options somethat allow us to extend the lease term beyond the initial period, subject to terms agreed upon at lease inception. Based on our leasing practices and contract negotiations, we determined that we are not reasonably certain to exercise the renewal options and, as such, we have not included optional renewal periods in our measurement of which involve rate increases. operating lease assets, liabilities and expected lease terms. We exclude short-term leases from our Consolidated Balance Sheets and combine lease and non-lease components.
For leases with step rent provisions whereby the rental payments increase incrementally over the life of the lease, we recognize expense on a straight-line basis determined by the total minimum lease payments over the minimum lease term. To the extent we determine that future obligations related to real estate taxes, insurance and other lease components are variable, we exclude them from the measurement of our operating lease assets and liabilities.
Some of our real estate agreements include rental payments adjusted periodically for inflation. Our lease agreements do not contain any material residual value guarantees or material restrictive covenants.
The table below presents rent expense associated with facility vehicle and equipmentvehicle operating leases for the past three years (in thousands):
| | | | | | | | | | | | | | | | | | | | | | | | | | |
| | | | |
| | | | |
| Lease Cost | | Classification | | 2023 | | 2022 | | 2021 |
Operating lease cost (1) | | Selling and administrative expenses | | $ | 92,939 | | | $ | 81,750 | | | $ | 71,255 | |
| Variable lease cost | | Selling and administrative expenses | | $ | 24,535 | | | $ | 22,326 | | | $ | 18,755 | |
(1)Includes short-term lease cost, which is not material. |
| | | | | | | | | | |
| 2017 | | 2016 | | 2015 |
| $ | 66,161 |
| | $ | 63,940 |
| | $ | 60,129 |
|
TheBased on our lease portfolio as of December 31, 2023, the table below sets forth the approximate future minimum lease payments as of December 31, 2017 related to non-cancelable facility operating leases and the non-cancelable portion of certain equipment operating leases with initial terms of one year or more (in thousands):
| | | | | | | | |
| 2024 | | $ | 89,568 | |
| 2025 | | 80,068 | |
| 2026 | | 67,182 | |
| 2027 | | 50,500 | |
| 2028 | | 28,020 | |
| Thereafter | | 33,092 | |
| Total lease payments | | 348,430 | |
| Less: interest | | 37,266 | |
| Present value of lease liabilities | | $ | 311,164 | |
|
| | | | |
| 2018 | | $ | 55,874 |
|
| 2019 | | 49,540 |
|
| 2020 | | 42,524 |
|
| 2021 | | 30,756 |
|
| 2022 | | 21,612 |
|
| Thereafter | | 21,423 |
|
Upon adoptionTo calculate the present value of ASU 2016-02, Leases,our lease liabilities, we will be required to record most leasesdetermined our incremental borrowing rate based on the effective interest rate on our balance sheets and recognize expenses inCredit Facility adjusted for a mannercollateral feature similar to current guidance. We will also be required to provide enhanced disclosures related tothat of our lease agreements. ASU 2016-02 will be effective for annual periods beginning after December 15, 2018. The guidance is required to be applied using a modified retrospective approach. The adoption of ASU 2016-02 will have a significant impact on our Consolidated Balance Sheetsleased properties, as we will be recording a right-of-use assetare unable to derive implicit rates from our existing leases.
The table below presents the weighted-average remaining lease term (years) of our operating leases and corresponding liabilitythe weighted-average discount rate used in the above calculation:
| | | | | | | | | | | | | | | | | | | | |
| | December 31, |
| Lease Term and Discount Rate for Operating Leases | | 2023 | | 2022 | | 2021 |
| Weighted-average remaining lease term (years) | | 4.81 | | 5.08 | | 5.27 |
| Weighted-average discount rate | | 4.04 | % | | 3.05 | % | | 2.57 | % |
The table below presents the amount of cash paid for our current operating leases. We are evaluatingamounts included in the effect that ASU 2016-02 will have on our resultsmeasurement of operationslease liabilities and related disclosures.lease assets obtained in exchange for lease obligations (in thousands):
| | | | | | | | | | | | | | | | | | | | |
| | Year Ended |
| | December 31, |
| | 2023 | | 2022 | | 2021 |
| Operating cash flows for lease liabilities | | $ | 84,703 | | | $ | 75,281 | | | $ | 67,197 | |
| Operating lease assets obtained in exchange for operating lease obligations | | $ | 107,869 | | | $ | 91,622 | | | $ | 94,493 | |
Contingencies
From time to time, we are subject to various claims and litigation arising in the ordinary course of business, including product liability, personal injury, commercial, contract and employment matters. Each quarter, we evaluate developments related to claims and litigation and record a liability if we deem a loss to be probable and estimable. When evaluating these matters for accrual and disclosure, we consider factors such as historical experience, specific facts and claims asserted, the likelihood we will prevail and the magnitude of any potential loss. The outcome of any litigation is inherently unpredictable. Based on currently available facts, we do not believe that the ultimate resolution of any of these claims and litigation matters will have a material adverse impact on our financial condition, results of operations or cash flows. We do not believe our exposure for any of these matters is material for disclosure, either individually or in the aggregate.
Note 10 - Related Party Transactions
Policy
Our policy for related party transactions is included in our written Audit Committee Charter. This policy requires that our Audit Committee reviewWe lease corporate and approve all related party transactions required to be disclosed in our Annual Proxy Statement or required to be approved based on NASDAQ rules.
Transactions
In May 2005,administrative offices from NCC, an entity we acquiredhave held a 50% membershipownership interest in NCC through a $1.1 million cash contribution.since 2005. NCC owns and operates an office building in Covington, Louisiana. We lease corporate and administrative offices from NCC, occupying approximately 59,10060,000 square feet of office space. In May 2005, we amended the lease agreement, which had a ten-year term. In June 2013, we exercised an option to extend the term of a portion of the lease agreement through May 2020. In March 2015, we exercised a second option to extend the term of the lease agreement through May 2025. As of December 31, 2017,space, and we pay rent of $94,872$0.1 million per month. Our lease term ends May 2025.
The table below presents rent expense associated with this lease for the past three years (in thousands):
| | | | | | | | | | | | | | | | | | | | |
| | | 2023 | | 2022 | | 2021 |
| NCC | | $ | 1,222 | | | $ | 1,222 | | | $ | 1,222 | |
| | | | | | |
| | | | | | |
|
| | | | | | | | | | | | |
| | | 2017 | | 2016 | | 2015 |
| NCC | | $ | 1,122 |
| | $ | 1,035 |
| | $ | 1,016 |
|
Note 11 - Employee Benefit Plans
We offer a 401(k) savings and retirement plan, which is a defined contribution plan andthat provides benefits for substantially all employees who meet length of service requirements. Eligible employees are able to contribute up to 75% of their compensation, subject to the federal dollar limit. For plan participants, we provide a matching contribution. We contribute a total maximum match on employee contributions of up to 4% of their compensation, with a 100% match on the first 3% of compensation deferred and a 50% match on deferrals between 3% and 5% of compensation. We also offer retirement plans for certain of our international entities. The plan funding is calculated as a percentage of the employee’s earnings and in compliance with local laws and practices. The related expense is not material and is included in the table below.
We have a nonqualified deferred compensation plan that allows certain employees who occupy key management positions to defer salary and bonus amounts. This plan also provides a matching contribution similar to that provided under our 401(k) plan to the extent that a participant’s contributions to the 401(k) plan are limited by IRS deferral and compensation limitations. The total combined company matching contribution provided to a participant under the 401(k) plan and the nonqualified deferred compensation plan for any one year may not exceed 4% of a participant’s salary and bonus. The employee and company matching contributions are invested in certain equity and fixed income securities based on individual employee elections.
The table below sets forth our contributions for the past three years (in thousands):
| | | | | | | | | | | | | | | | | | | | |
| | | 2023 | | 2022 | | 2021 |
| Defined contribution and international retirement plans | | $ | 10,973 | | | $ | 10,230 | | | $ | 9,308 | |
| Deferred compensation plan | | 218 | | | 283 | | | 239 | |
|
| | | | | | | | | | | | |
| | | 2017 | | 2016 | | 2015 |
| Defined contribution and international retirement plans | | $ | 6,946 |
| | $ | 5,817 |
| | $ | 5,583 |
|
| Deferred compensation plan | | 325 |
| | 194 |
| | 218 |
|
Note 12 - Quarterly Financial Data (Unaudited)
The table below summarizes the unaudited quarterly results of operations for the past two years (in thousands, except per share data):
| | | | | | | | | | | | | | | | | | | | | | | | | | | | | | | | | | | | | | | | | | | | | | | |
| | Quarter |
| | 2023 | | 2022 |
| | First | | Second | | Third | | Fourth | | First | | Second | | Third | | Fourth |
| Net sales | $ | 1,206,774 | | | $ | 1,857,363 | | | $ | 1,474,407 | | | $ | 1,003,050 | | | $ | 1,412,650 | | | $ | 2,055,818 | | | $ | 1,615,339 | | | $ | 1,095,920 | |
| | | | | | | | | | | | | | | |
| Gross profit | 369,755 | | | 567,783 | | | 428,731 | | | 293,775 | | | 447,189 | | | 666,804 | | | 503,687 | | | 315,731 | |
| Net income | 101,699 | | | 232,250 | | | 137,843 | | | 51,437 | | | 179,261 | | | 307,283 | | | 190,055 | | | 71,863 | |
| Earnings per share: | | | | | | | | | | | | | | | |
| Basic | $ | 2.60 | | | $ | 5.95 | | | $ | 3.54 | | | $ | 1.33 | | | $ | 4.46 | | | $ | 7.71 | | | $ | 4.82 | | | $ | 1.84 | |
| Diluted | $ | 2.58 | | | $ | 5.91 | | | $ | 3.51 | | | $ | 1.32 | | | $ | 4.41 | | | $ | 7.63 | | | $ | 4.78 | | | $ | 1.82 | |
|
| | | | | | | | | | | | | | | | | | | | | | | | | | | | | | | |
| | Quarter |
| | 2017 | | 2016 |
| | First | | Second | | Third | | Fourth | | First | | Second | | Third | | Fourth |
| Net sales | $ | 546,441 |
| | $ | 988,163 |
| | $ | 743,401 |
| | $ | 510,183 |
| | $ | 515,250 |
| | $ | 918,889 |
| | $ | 691,429 |
| | $ | 445,235 |
|
| Gross profit | 153,621 |
| | 289,664 |
| | 216,606 |
| | 145,398 |
| | 143,023 |
| | 270,736 |
| | 199,551 |
| | 127,777 |
|
Net income (1) | 22,270 |
| | 94,620 |
| | 48,783 |
| | 25,665 |
| | 16,363 |
| | 85,247 |
| | 44,421 |
| | 2,572 |
|
Net income attributable to Pool Corporation (1) | 22,281 |
| | 94,903 |
| | 48,783 |
| | 25,665 |
| | 16,371 |
| | 85,435 |
| | 44,534 |
| | 2,615 |
|
| Earnings per share: | | | | | | | | | |
| | |
| | |
| | |
|
| Basic | $ | 0.54 |
| | $ | 2.30 |
| | $ | 1.20 |
| | $ | 0.64 |
| | $ | 0.39 |
| | $ | 2.03 |
| | $ | 1.06 |
| | $ | 0.06 |
|
| Diluted | $ | 0.52 |
| | $ | 2.21 |
| | $ | 1.16 |
| | $ | 0.62 |
| | $ | 0.38 |
| | $ | 1.98 |
| | $ | 1.03 |
| | $ | 0.06 |
|
The sum of basic and diluted earnings per share for each of the quarters may not equal the total basic and diluted earnings per share for the annual periods because of rounding differences and a difference in the way that in-the-money stock options are considered from quarter to quarter.
81
| |
(1)
| Our Net income and Net income attributable to Pool Corporation reflect the adoption of ASU 2016-09 for all periods presented in 2017. For additional information related to the adoption of this accounting standard, see Note 1. Our fourth quarter 2017 Net income and Net income attributable to Pool Corporation reflects benefits recorded due to U.S. tax reform. For additional information related to the impact of U.S. tax reform on our financial statements, see Note 7. |
Item 9. Changes in and Disagreements with Accountants on Accounting and Financial Disclosure
Not applicable.
Item 9A. Controls and Procedures
The term “disclosure controls and procedures” is defined in Rules 13a-15(e) and 15d-15(e) of the Securities Exchange Act of 1934 (the Act). The rules refer to the controls and other procedures designed to ensure that information required to be disclosed in reports that we file or submit under the Act is (1) recorded, processed, summarized and reported within the time periods specified in the Commission’s rules and forms and (2) accumulated and communicated to our management, including our principal executive officer and principal financial officer, as appropriate to allow timely decisions regarding required disclosure. As of December 31, 2017,2023, management, including the CEO and CFO, performed an evaluation of the effectiveness of our disclosure controls and procedures. Based on that evaluation, management, including the CEO and CFO, concluded that as of December 31, 2017,2023, our disclosure controls and procedures were effective.
We maintain a system of internal control over financial reporting that is designed to provide reasonable assurance regarding the reliability of financial reporting and the preparation of financial statements for external purposes in accordance with U.S. generally accepted accounting principles. Based on the most recent evaluation, we have concluded that no change in our internal control over financial reporting occurred during the last fiscal quarter that has materially affected, or is reasonably likely to materially affect, our internal control over financial reporting.
Management’s Report on Internal Control Over Financial Reporting
Pool Corporation’s management is responsible for establishing and maintaining adequate internal control over financial reporting, as defined in Rules 13a-15(f) and 15d-15(f) under the Securities Exchange Act of 1934, as amended. Our internal control system was designed to provide reasonable assurance regarding the reliability of financial reporting and the preparation of published financial statements. All internal control systems, no matter how well designed, have inherent limitations. Therefore, even those systems determined to be effective can provide only reasonable assurance with respect to financial statement preparation and presentation. Any evaluation or projection of effectiveness to future periods is also subject to risk that controls may become inadequate due to changes in conditions, or that the degree of compliance with the policies or procedures may deteriorate.
Pool Corporation’s management assessed the effectiveness of our internal control over financial reporting as of December 31, 2017.2023. In making this assessment, management used the criteria set forth by the Committee of Sponsoring Organizations of the Treadway Commission (COSO) in the Internal Control-Integrated Framework (2013 Framework). Based on this assessment, management has concluded that, as of December 31, 2017,2023, Pool Corporation’s internal control over financial reporting was effective.
The independent registered public accounting firm that audited the Consolidated Financial Statements included in Item 8 of this Form 10-K has issued a report on Pool Corporation’s internal control over financial reporting. This report appears below.
Report of Independent Registered Public Accounting Firm
TheTo the Stockholders and the Board of Directors and Stockholders
of Pool Corporation
Opinion on Internal Control overOver Financial Reporting
We have audited Pool Corporation’s internal control over financial reporting as of December 31, 2017,2023, based on criteria established in Internal Control-Integrated Framework issued by the Committee of Sponsoring Organizations of the Treadway Commission (2013 Framework)framework) (the COSO criteria). In our opinion, Pool Corporation (the Company) maintained, in all material respects, effective internal control over financial reporting as of December 31, 2017,2023, based on the COSO criteria.
We also have audited, in accordance with the standards of the Public Company Accounting Oversight Board (United States) (PCAOB), the consolidated balance sheets of the Company as of December 31, 20172023 and 2016,2022, the related consolidated statements of income, comprehensive income, changes in stockholders’ equity and cash flows for each of the three years in the period ended December 31, 2017,2023, and the related notes and our report dated February 28, 201827, 2024 expressed an unqualified opinion thereon.
Basis for Opinion
The Company’s management is responsible for maintaining effective internal control over financial reporting and for its assessment of the effectiveness of internal control over financial reporting included in the accompanying Management’s Report on Internal Control Over Financial Reporting. Our responsibility is to express an opinion on the Company’s internal control over financial reporting based on our audit. We are a public accounting firm registered with the PCAOB and are required to be independent with respect to the Company in accordance with the U.S. federal securities laws and the applicable rules and regulations of the Securities and Exchange Commission and the PCAOB.
We conducted our audit in accordance with the standards of the PCAOB. Those standards require that we plan and perform the audit to obtain reasonable assurance about whether effective internal control over financial reporting was maintained in all material respects.
Our audit included obtaining an understanding of internal control over financial reporting, assessing the risk that a material weakness exists, testing and evaluating the design and operating effectiveness of internal control based on the assessed risk, and performing such other procedures as we considered necessary in the circumstances. We believe that our audit provides a reasonable basis for our opinion.
DefinitionsDefinition and Limitations of Internal Control Over Financial Reporting
A company’s internal control over financial reporting is a process designed to provide reasonable assurance regarding the reliability of financial reporting and the preparation of financial statements for external purposes in accordance with generally accepted accounting principles. A company’s internal control over financial reporting includes those policies and procedures that (1) pertain to the maintenance of records that, in reasonable detail, accurately and fairly reflect the transactions and dispositions of the assets of the company; (2) provide reasonable assurance that transactions are recorded as necessary to permit preparation of financial statements in accordance with generally accepted accounting principles, and that receipts and expenditures of the company are being made only in accordance with authorizations of management and directors of the company; and (3) provide reasonable assurance regarding prevention or timely detection of unauthorized acquisition, use, or disposition of the company’s assets that could have a material effect on the financial statements.
Because of its inherent limitations, internal control over financial reporting may not prevent or detect misstatements. Also, projections of any evaluation of effectiveness to future periods are subject to the risk that controls may become inadequate because of changes in conditions, or that the degree of compliance with the policies or procedures may deteriorate.
/s/ Ernst & Young LLP
New Orleans, Louisiana
February 28, 201827, 2024
Item 9B. Other Information
During the quarter ended December 31, 2023, none of our directors or officers (as defined in Rule 16a-1(f) under the Exchange Act) adopted or terminated any Rule 10b5-1 trading arrangement or non-Rule 10b5-1 trading arrangement (as such terms are defined in Item 408(a) of Regulation SK).
Item 9C. Disclosure Regarding Foreign Jurisdictions that Prevent Inspections
Not applicable.
PART III.
Item 10. Directors, Executive Officers and Corporate Governance
IncorporatedThe information required by this item is incorporated by reference to Pool Corporation’s 20182024 Proxy Statement to be filed with the SEC.
We have a Code of Business Conduct and Ethics (the Code) that applies to all of our employees, officers and directors, and is available on our website at www.poolcorp.com. Any substantive amendments to the Code, or any waivers granted to any directors or executive officers, including our principal executive officer, principal financial officer or principal accounting officer and controller, will be disclosed on our website and remain there for at least 12 months.
Item 11. Executive Compensation
IncorporatedThe information required by this item is incorporated by reference to Pool Corporation’s 20182024 Proxy Statement to be filed with the SEC.
Item 12. Security Ownership of Certain Beneficial Owners and Management and Related Stockholder Matters
IncorporatedThe information required by this item is incorporated by reference to Pool Corporation’s 20182024 Proxy Statement to be filed with the SEC.
Item 13. Certain Relationships and Related Transactions, and Director Independence
IncorporatedThe information required by this item is incorporated by reference to Pool Corporation’s 20182024 Proxy Statement to be filed with the SEC.
Item 14. Principal Accountant Fees and Services
IncorporatedThe information required by this item is incorporated by reference to Pool Corporation’s 20182024 Proxy Statement to be filed with the SEC.
PART IV.
Item 15. Exhibits, Financial Statement Schedules
| |
(a) | The following documents are filed as part of this report: |
(a)The following documents are filed as part of this report: | | | | | | | | |
| (1) | | |
(1) | Consolidated Financial Statements: |
| | Page |
| | |
| | |
| | |
| | |
| | |
| | |
| | |
| |
| (2) | Financial Statement Schedules. |
| |
| All schedules are omitted because they are not applicable or are not required or because the required information is provided in our Consolidated Financial Statements or accompanying Notes included in Item 8 of this Form 10-K. |
| |
| (3) | The exhibits listed in the Index to Exhibits. |
Item 16. Form 10-K Summary
NoneNone.
INDEX TO EXHIBITS
| | | | | | | | | | | | | | | | | | | | | | | | | | | | | | | | |
| | | | | | | | | | |
| | | | | | Incorporated by Reference |
| No. | | Description | | Filed
Filed/
Furnished
with this
Form 10-K
| | Form | | File No. | | Date Filed |
| | | | | | | | | | |
| 3.1 | | | | | | 10-Q | | 000-26640 | | 08/09/2006 |
| 3.2 | | | | | | 8-K | | 000-26640 | | 12/20/201210/25/2023 |
| 4.1 | | | | | | 8-K | | 000-26640 | | 05/19/2006 |
10.14.2 | | | | X | | 10-K | | 000-26640 | | 02/27/2024 |
| 10.1 | * | | | | | 8-K | | 000-26640 | | 05/06/2016 |
| 10.2 | * | | | | | 8-K | 8-K | 000-26640 | 000-26640 | | 05/06/2016 |
| 10.3 | * | | | | | 10-K | 10-K | 000-26640 | 000-26640 | | 02/26/201525/2022 |
| 10.4 | * | | | | | 10-K | | 000-26640 | | 10-K | | 000-26640 | | 02/26/201625/2022 |
| 10.5 | * | | | | | 8-K | | 000-26640 | | 05/06/2009 |
| 10.6 | * | | | | | 8-K | | 000-26640 | | 05/06/2009 |
| 10.7 | * | | | X | | 10-K | | 000-26640 | | 03/18/200302/27/2024 |
| 10.8 | * | | | | | 10-K | | 000-26640 | | 03/31/1999 |
10.9 | * | | | | | 10-K | | 000-26640 | | 03/01/2005 |
10.10 | * | | | | | 10-K | 10-K | 000-26640 | 000-26640 | | 02/24/2017 |
10.1110.9 | * | | | | | 10-K | | 000-26640 | | 03/01/2010 |
10.12 | * | | | | | 10-Q | | 000-26640 | | 04/29/2005 |
10.1310.10 | * | | | | | 10-Q | | 000-26640 | | 04/29/2005 |
10.1410.11 | | | | | | 10-Q | | 000-26640 | | 04/29/2005 |
10.1510.12 | * | | | | | 10-K | | 000-26640 | | 8-K | | 000-26640 | | 05/06/2016 |
| 02/27/2019 |
| 10.13 | * | | | | | 10-K | | 000-26640 | | | | | | 02/25/2022 |
| 10.14 | | | | | | Incorporated by Reference |
No. | | Description | | Filed
with this
Form 10-K
| | Form | | File No. | | Date Filed |
10.16 | | Second Amended and Restated Credit Agreement dated as of October 19, 2011,September 27, 2021, by and among Pool Corporation, as USU.S. Borrower, SCP Distributors Canada Inc., as Canadian Borrower, SCP Pool B.V.International, Inc., as DutchEuro Borrower, the Lenders, Wells Fargo Bank, National Association, as Administrative Agent, Swingline Lender and Issuing Lender, JPMorgan Chase Bank, N.A., as Syndication Agent, Wells Fargo Securities, LLC and J.P. Morgan Securities, LLC, as joint Lead Arrangers and joint Bookrunners, Bank of America, N.A., Regions Bank and Capital One, N.A., as Documentation Agents, and Branch Banking and Trust Company, Comerica Bank and Union Bank, N.A.certain other lenders party thereto. | | | | 8-K | | 000-26640 | | 10-Q | | 000-26640 | | 10/31/20119/29/2021 |
10.1710.15 | | | | | | 10-Q | | 000-26640 | | 07/31/2013 |
10.18 | | | | | | 10-Q | | 000-26640 | | 07/31/2013 |
10.19 | | | | | | 8-K | | 000-26640 | | 09/24/2013 |
10.20 | | | | | | 10-Q | | 000-26640 | | 10/30/2014 |
10.21 | | | | | | 8-K | | 000-26640 | | 11/25/2014 |
10.22 | | | | | | 8-K | | 000-26640 | | 11/20/2015 |
10.23 | | | | | | 10-K | | 000-26640 | | 02/25/2022 |
| | | | | | | | | | | | | | | | | | | | | | | | | | | | | | | | |
| | | | | | Incorporated by and among Pool Corporation, as US Borrower, SCP Distributors Canada Inc., as Canadian Borrower, SCP Pool B.V., as Dutch Borrower, Wells Fargo Bank, National Association, as Joint Lead Arranger, Administrative Agent, Swingline Lender and an Issuing Lender, Bank of America, N.A., MUFG Union Bank, N.A., Capital One, N.A., Regions Bank, and BB&T Capital Markets, each as Joint Lead Arranger and Syndication Agent, and Fifth Third Bank, JP Morgan Chase Bank, N.A., Industrial and Commercial Bank of China Ltd., New York Branch, and the Bank of East Asia Ltd., New York Branch. | | | | 8-K | | 000-26640 | | 10/02/2017Reference |
10.24No. | * | Description | | Filed/
Furnished
with this
Form 10-K | | 8-KForm | | 000-26640File No. | | 05/06/2016Date Filed |
| 10.25 | | | | | | | | | |
| 10.16 | | | | | | 8-K | | 000-26640 | | 07/05/2023 |
| 10.17 | | | | | | 8-K | | 000-26640 | | 8-K | | 000-26640 | | 10/17/2013 |
10.2610.18 | | Receivables Purchase Agreement, dated as of October 11, 2013, among Superior Commerce LLC as Seller, SCP Distributors LLC, as the Servicer, the Purchasers from time to time thereto, The Bank of Tokyo‑Mitsubishi UFJ, Ltd., New York Branch, as the Victory Group Co-Agent and Wells Fargo Bank, National Association, as the Wells Group Co-Agent and as Administrative Agent. | | | | 8-K | | 000-26640 | | 8-K | | 000-26640 | | 10/17/2013 |
10.2710.19 | | | | | | 10-Q | | 000-26640 | | 10-Q | | 000-26640 | | 07/30/2014 |
|
| 10.20 | | | | | | | | | | |
| | | | | | Incorporated by Reference |
No. | | Description | | Filed
with this
Form 10-K
| | Form | | File No. | | Date Filed |
10.28 | | | | | | 8-K | | 000-26640 | | 8-K | | 000-26640 | | 10/28/2014 |
10.2910.21 | | | | | | 8-K | | 000-26640 | | 8-K | | 000-26640 | | 10/20/2015 |
10.3010.22 | | | | | | 8-K | | 000-26640 | | 8-K | | 000-26640 | | 10/20/2015 |
10.3110.23 | | | | | | 8-K | | 000-26640 | | 8-K | | 000-26640 | | 10/31/2016 |
10.3210.24 | | | | | | 8-K | | 000-26640 | | 8-K | | 000-26640 | | 09/01/2017 |
10.3310.25 | | | | | | 8-K | | 000-26640 | | 8-K | | 000-26640 | | 11/29/2017 |
10.3410.26 | | | | | | 8-K | | 000-26640 | | 11/02/2018 |
| 10.27 | | | | | | 8-K | | 000-26640 | | 11/04/2019 |
| 10.28 | | Omnibus Amendment No. 1, dated November 1, 2021, among Superior Commerce LLC, as Seller, SCP Distributors LLC, as the Servicer, Pool Corporation as the Performance Guarantor, the Purchasers from time to time party thereto and Wells Fargo Bank, National Association, as Administrative Agent. | | | | 8-K | | 000-26640 | | 11/04/2021 |
| 10.29 | | | | | | 8-K | | 000-26640 | | 11/04/2022 |
| 10.30 | | | | | | 8-K | | 000-26640 | | 8-K | | 000-26640 | | 10/17/2013 |
| 10.31 | | | | | | 8-K | | 000-26640 | | 01/02/2020 |
| 10.32 | | | | | | 10-Q | | 000-26640 | | 10/28/2021 |
| 10.33 | | | | | | 8-K | | 000-26640 | | 07/05/2023 |
| | Pool Corporation Insider Trading Policy. | | X | | | | | | |
| | Subsidiaries of the registrant. | | X | | | | | | |
| | Consent of Ernst & Young LLP. | | X | | | | | | |
| | | | | | | | | | | | | | | | | | | | | | | | | | | | | | | | |
| | | | | | Incorporated by Reference |
| No. | | Description | | Filed/
Furnished
with this
Form 10-K | | Form | | File No. | | Date Filed |
| | | | | | | | | | |
| | Certification by Mark W. JoslinChief Financial Officer pursuant to Rule 13a-14(a) and 15d-14(a), as adopted pursuant to Section 302 of the Sarbanes-Oxley Act of 2002. | | X | | | | | | |
| | Certification by Manuel J. Perez de la MesaChief Executive Officer pursuant to Rule 13a-14(a) and 15d-14(a), as adopted pursuant to Section 302 of the Sarbanes-Oxley Act of 2002. | | X | | | | | | |
| | Certification by Manuel J. Perez de la MesaChief Executive Officer and Mark W. JoslinChief Financial Officer pursuant to 18 U.S.C. Section 1350, as adopted pursuant to Section 906 of the Sarbanes-Oxley Act of 2002. | | X | | | | | | |
101.INS | | +Pool Corporation Clawback Policy. | | X | | | | | | |
| 101.INS | + | Inline XBRL Instance Document - the instance document does not appear in the Interactive Data File because its XBRL tags are embedded within the Inline XBRL document | | X | | | | | | |
| 101.SCH | + | Inline XBRL Taxonomy Extension Schema Document | | X | | | | | | |
| 101.CAL | + | Inline XBRL Taxonomy Extension Calculation Linkbase Document | | X | | | | | | |
| 101.DEF | + | Inline XBRL Taxonomy Extension Definition Linkbase Document | | X | | | | | | |
| 101.LAB | + | Inline XBRL Taxonomy Extension Label Linkbase Document | | X | | | | | | |
| 101.PRE | + | Inline XBRL Taxonomy Extension Presentation Linkbase Document | | X | | | | | | |
| 104 | + | Cover Page Interactive Data File (formatted in Inline XBRL and contained in Exhibit 101) | | X | | | | | | |
| |
* | Indicates a management contract or compensatory plan or arrangement |
| |
+ | Attached as Exhibit 101 to this report are the following items formatted in XBRL (Extensible Business Reporting Language): |
| |
1. | Consolidated Statements of Income for the years ended December 31, 2017, December 31, 2016 and December 31, 2015;
|
| |
2. | Consolidated Statements of Comprehensive Income for the years ended December 31, 2017, December 31, 2016 and December 31, 2015;
|
| |
3. | Consolidated Balance Sheets at December 31, 2017 and December 31, 2016;
|
| |
4. | Consolidated Statements of Cash Flows for the years ended December 31, 2017, December 31, 2016 and December 31, 2015;
|
| |
5. | Consolidated Statements of Changes in Stockholders’ Equity for the years ended December 31, 2017, December 31, 2016 and December 31, 2015; and
|
| |
6. | Notes to Consolidated Financial Statements. |
* Indicates a management contract or compensatory plan or arrangement
+ Attached as Exhibit 101 to this report are the following items formatted in iXBRL (Inline Extensible Business Reporting Language):
1.Consolidated Statements of Income for the years ended December 31, 2023, December 31, 2022 and December 31, 2021;
2.Consolidated Statements of Comprehensive Income for the years ended December 31, 2023, December 31, 2022 and December 31, 2021;
3.Consolidated Balance Sheets at December 31, 2023 and December 31, 2022;
4.Consolidated Statements of Cash Flows for the years ended December 31, 2023, December 31, 2022 and December 31, 2021;
5.Consolidated Statements of Changes in Stockholders’ Equity for the years ended December 31, 2023, December 31, 2022 and December 31, 2021; and
6.Notes to Consolidated Financial Statements.
SIGNATURES
Pursuant to the requirements of Section 13 or 15(d) of the Securities Exchange Act of 1934, the registrant has duly caused this report to be signed on its behalf by the undersigned, thereunto duly authorized on February 28, 2018.
| | | | | |
| POOL CORPORATION |
| |
| By: | POOL CORPORATION |
| |
| |
| |
By: | /s/ JOHN E. STOKELY |
| John E. Stokely, Chairman of the Board |
| and Lead Independent Director |
Pursuant to the requirements of the Securities Exchange Act of 1934, this report has been signed below by the following persons on behalf of the registrant in the capacities indicated on February 28, 2018.27, 2024.
| | | | | |
| Signature: | Title: |
| |
Signature: | Title: |
| |
| /s/ JOHN E. STOKELY | |
| John E. Stokely | Chairman of the Board and Lead Independent Director |
| |
| /s/ PETER D. ARVAN | |
| Peter D. Arvan | President, Chief Executive Officer and Director (principal executive officer) |
| |
| /s/ MELANIE M. HOUSEY HART | |
| Melanie M. Housey Hart | Vice President and Chief Financial Officer (principal financial officer) |
| |
| /s/ WALKER F. SAIK | |
| Walker F. Saik | Chief Accounting Officer and Corporate Controller (principal accounting officer) |
| |
| /s/ MARTHA S. GERVASI | |
| Martha S. Gervasi | Director |
| |
| /s/ JAMES D. HOPE | |
| James D. Hope | Director |
| |
| /s/ DEBRA S. OLER | |
| Debra S. Oler | Director |
| |
| /s/ MANUEL J. PEREZ DE LA MESA | |
| Manuel J. Perez de la Mesa | President, Chief Executive Officer and Director |
| |
| /s/ CARLOS A. SABATER | |
| Carlos A. Sabater | Director |
| /s/ MARK W. JOSLIN |
Mark W. Joslin | Senior Vice President and Chief Financial Officer |
| |
/s/ MELANIE M. HOUSEY HART | |
Melanie M. Housey Hart | Corporate Controller and Chief Accounting Officer |
| |
/s/ ANDREW W. CODE | |
Andrew W. Code | Director |
| |
/s/ TIMOTHY M. GRAVEN | |
Timothy M. Graven | Director |
| |
/s/ HARLAN F. SEYMOUR | |
Harlan F. Seymour | Director |
| |
| /s/ ROBERT C. SLEDD | |
| Robert C. Sledd | Director |
| |
| /s/ DAVID G. WHALEN | |
| David G. Whalen | Director |
| |
| |
| |
