| • | Tangible net worth must be more than $90| · | Tangible net worth must initially be more than $170 million. |
| | | | •| · | Total funded indebtedness divided by earnings before interest expense, income taxes, depreciation and amortization shall not be greater than 2.25 to 1. |
| | | · | Total liabilities divided by tangible net worth shall not be more than 2.0 to 1. | | • | Total liabilities divided by tangible net worth shall |
We were in compliance with the financial covenants described above at September 27, 2008. We self-insure, up to loss limits, certain insurable risks such as worker’s compensation and automobile liability claims. Accruals for claims under our self-insurance program are recorded on a claims-incurred basis. Under this program, the estimated liability for claims incurred but unpaid in fiscal years 2008 and 2007 was $1,600,000 and $1,900,000, respectively. In connection with certain self-insurance agreements, we customarily enter into letters of credit arrangements with our insurers. At September 27, 2008 and September 29, 2007, we had outstanding letters of credit totaling $9,475,000 and $9,595,000, respectively. The following table presents our contractual cash flow commitments on long-term debt, operating leases and purchase commitments for raw materials and packaging. See Notes to the consolidated financial statements for additional information on our long-term debt and operating leases. | | | Payments Due by Period (in thousands) | | | | | Total | | | Less Than 1 Year | | | | | | 4-5 Years | | | After 5 Years | | | Long-term debt, including current maturities | | $ | — | | | $ | — | | | $ | — | | | $ | — | | | $ | — | | | Capitalized lease obligations | | | 474 | | | | 93 | | | | 194 | | | | 187 | | | | — | | | Purchase commitments | | | 44,316 | | | | 44,316 | | | | — | | | | — | | | | — | | | Operating leases | | | 37,872 | | | | 9,716 | | | | 14,126 | | | | 6,568 | | | | 7,462 | | | Total | | $ | 82,662 | | | $ | 54,125 | | | $ | 14,320 | | | $ | 6,755 | | | $ | 7,462 | |
The amounts shown above exclude uncertain tax benefits of $1,735,000 as determined under FIN 48 as we cannot predict if or when such amounts, if any, will be paid or be payable to the taxing authorities. The purchase commitments do not be more than 2.0 to 1. |
We were in compliance with the restrictive covenants described above at September 24, 2005.
exceed our projected requirements over the related terms and are in the normal course of business.We self-insure, up to loss limits, certain insurable risks such as worker’s compensation and automobile liability claims. Accruals for claims under our self-insurance program are recorded on a claims-incurred basis. Under this program, the estimated liability for claims incurred but unpaid in fiscal year 2005 and 2004 was $2,700,000 and $2,400,000, respectively. In connection with certain self-insurance agreements, we customarily enter into letters of credit arrangements with our insurers. At September 24, 2005 and September 25, 2004, we had outstanding letters of credit totaling approximately $7,700,000 and $6,900,000, respectively.
Back to Contents
The following table presents our contractual cash flow commitments on long-term debt and operating leases. See Notes to the consolidated financial statements for additional information on our long-term debt and operating leases.
| | | Payments Due by Period (in thousands) | | | | | | | Less | | | | | | | | | | | | | | | | Than | | 1-3 | | 4-5 | | After | | | | | Total | | 1 Year | | Years | | Years | | 5 Years | | | | |
|
| |
|
| |
|
| |
|
| |
|
| | | Long-term debt, including current maturities | | $ | — | | $ | — | | $ | — | | $ | — | | $ | — | | | Purchase commitments | | | 16,000 | | | 16,000 | | | | | | | | | | | | Operating leases | | | 40,968 | | | 9,526 | | | 14,809 | | | 7,742 | | | 8,891 | | | | |
|
| |
|
| |
|
| |
|
| |
|
| | | Total | | $ | 56,968 | | $ | 25,526 | | $ | 14,809 | | $ | 7,742 | | $ | 8,891 | |
The purchase commitments do not exceed our projected requirements over the related terms and are in the normal course of business.
Fiscal 20052008 Compared to Fiscal 20042007 |
Cash and cash equivalents and marketable securities available for sale increased $13,920,000, or 25%, to $70,020,000 from a year ago primarily because net cash provided by operating activities of $52,644,000 exceeded cash used for purchases of property, plant and equipment and for purchase of companies by $14,924,000.
Cash and cash equivalents, marketable securities held to maturity and auction market preferred stock increased $24,916,000, or 44%, to $81,935,000 from a year ago primarily because net cash provided by operating activities of $54,897,000 was more than cash used for purchases of property, plant and equipment by $32,116,000, which was partially offset by cash used in financing activities of $7,600,000. Trade receivables increased $4,404,000, or 8%, to $61,176,000 in 2008 due primarily to higher net sales. Inventories increased $2,496,000 or 5% to $49,095,000 in 2008 due primarily to higher unit costs of inventories. Net property, plant and equipment was essentially unchanged at $93,064,000 because purchases of fixed assets were essentially offset by depreciation of fixed assets. Other intangible assets, less accumulated amortization decreased $4,700,000 to $53,633,000 due completely to amortization. Goodwill was unchanged at $60,314,000 from September 29, 2007 to September 27, 2008. Accounts payable and accrued liabilities increased $550,000, or 1% from 2007 to 2008 primarily because of higher costs of raw materials and packaging. Deferred income tax liabilities increased by $3,876,000 to $23,056,000 which related primarily to amortization of goodwill and other intangible assets and depreciation of property, plant and equipment. Other long-term liabilities at September 27, 2008 include $1,735,000 of gross unrecognized tax benefits. Common stock increased $1,135,000 to $48,415,000 in 2008 because increases from the exercise of incentive and nonqualified stock options, stock issued under our stock purchase plan for employees and share-based compensation expense exceeded the repurchase of common stock of $3,539,000 by $1,135,000. Net cash provided by operating activities decreased $2,946,000 to $54,897,000 in 2008 primarily because of the decrease to net earnings of $4,204,000. Net cash used in investing activities decreased $38,980,000 to $18,854,000 in 2008 from $57,834,000 in 2007 primarily because we did not make any acquisitions in 2008. Net cash used in financing activities of $7,600,000 in 2008 compared to net cash used by financing activities of $1,769,000 in 2007. The increase was caused by $3,539,000 of payments to repurchase common stock along with a decrease in proceeds from the issuance of common stock upon the exercise of stock options. In 2008, the major variables in determining our net increase in cash and cash equivalents and marketable securities were our net earnings, depreciation and amortization of fixed assets and purchases of property, plant and equipment. Additionally, in 2008, due to the failure of the auction market, we reclassified a portion of our investment securities to long-term assets (see Note C to these financial statements). Other variables which in the past have had a significant impact on our change in cash and cash equivalents are payments for the repurchase of common stock, proceeds from borrowings and payments of long-term debt. As discussed in results of operations, our net earnings may be influenced by many factors. Depreciation and amortization of fixed assets is primarily determined by past purchases of property, plant and equipment although it could be impacted by a significant acquisition. Purchases of property, plant and equipment are primarily determined by our ongoing normal manufacturing and marketing requirements but could be increased significantly for manufacturing expansion requirements or large frozen beverage customer needs. From time to time, we have repurchased common stock and we anticipate that we will do so again in the future. We are actively seeking acquisitions that could be a significant use of cash. Although the balance of our long-term debt is $0 at September 27, 2008, we may borrow in the future depending on our needs. Trade receivables decreased $1,492,000 or 3% to $46,261,000 in 2005 due to more efficient collections. Inventories increased $4,097,000 or 14% to $33,684,000 in 2005. The increases were due primarily to increased levels of business and higher unit costs of inventories. Parts inventory increased in our frozen beverages business in response to higher levels of managed service business.
Net property, plant and equipment decreased $429,000 to $89,045,000 because depreciation of fixed assets exceeded purchases of fixed assets and assets acquired in acquisitions.
Other intangible assets, less accumulated amortization increased $5,239,000 to $7,043,000 because of the purchase of intangible assets of $6,080,000 in the Snackworks acquisition.
Goodwill increased $7,145,000 to $53,622,000 as a result of the purchase of Snackworks, LLC.
Accounts payable and accrued liabilities increased $5,256,000, or 11% from 2004 to 2005 primarily because of increased levels of business, higher accruals for our insurance reserves and higher income taxes payable.
Deferred income tax liabilities increased by $1,166,000 to $17,987,000 which related primarily to depreciation of property, plant and equipment.
Common stock increased $3,022,000 to $36,091,000 in 2005 because of the exercise of incentive and non qualified stock options and stock issued under our stock purchase plan for employees.
Net cash provided by operating activities increased $5,500,000 to $52,644,000 in 2005 primarily because of an increase to net earnings of $3,333,000 and a reduction in working capital of $2,363,000 in 2005 compared to an increase in working capital of $1,995,000 in 2004 which was partially offset by a reduction in deferred income taxes of $174,000 in 2005 compared to an increase in deferred taxes of $2,394,000 in 2004.
Net cash used in investing activities decreased $13,511,000 to $55,433,000 in 2005 from $68,944,000 in 2004 primarily because purchases of marketable securities, net of proceeds from marketable securities, were $18,775,000 higher in 2004 than in 2005 which was partially offset by $3,420,000 of higher payments in 2005 for purchases of companies.
Net cash used in financing activities of $1,159,000 in 2005 compared to net cash provided by financing activities of $3,810,000 in 2004. The change was primarily caused by the payment of cash dividends of $3,400,000 in 2005, the first year in which we paid cash dividends.
Back to Contents
In 2005, the major variables in determining our net increase in cash and cash equivalents and marketable securities available for sale were our net earnings, depreciation and amortization of fixed assets, purchases of property, plant and equipment and payments for the purchase of companies. Other variables which in the past have had a significant impact on our change in cash and cash equivalents are payments for the repurchase of common stock, proceeds from borrowings and payments of long-term debt. As discussed in results of operations, our net earnings may be influenced by many factors. Depreciation and amortization of fixed assets is primarily determined by past purchases of property, plant and equipment although it could be impacted by a significant acquisition in the current year. Purchases of property, plant and equipment are primarily determined by our ongoing normal manufacturing and marketing requirements but could be increased significantly for manufacturing expansion requirements or large frozen beverage customer needs. From time to time, we have repurchased common stock and we anticipate that we will do so again in the future. We are actively seeking acquisitions that could be a significant use of cash. Although the balance of our long-term debt is $0 at September 24, 2005, we may borrow in the future depending on our needs.
Fiscal 20042007 Compared to Fiscal 20032006 |
Cash and cash equivalents and marketable securities available for sale increased $18,406,000, or 49%, to $56,100,000 from a year ago because net cash provided by operating activities of $47,144,000 and provided by financing activities of $3,810,000 exceeded the amounts of net cash used in investing activities.
Cash and cash equivalents and marketable securities available for sale decreased $19,602,000, or 26%, to $57,019,000 from a year ago primarily because net cash provided by operating activities of $57,843,000 was less than cash used for purchases of property, plant and equipment and for purchase of companies by $17,669,000. Trade receivables increased $3,739,000, or 7%, to $56,772,000 in 2007 due primarily to an increased level of business resulting from acquisitions and internal growth. Inventories increased $8,809,000 or 23% to $46,599,000 in 2007. The increases were due primarily to increased levels of business and higher unit costs of inventories. Net property, plant and equipment increased $7,775,000 to $93,222,000 because purchases of fixed assets and fixed assets acquired in acquisitions exceeded depreciation of existing assets. Other intangible assets, less accumulated amortization increased $35,664,000 to $58,333,000 primarily because of the purchase of intangible assets of $23,771,000, $12,799,000, $2,731,000 and $413,000 in the Hom/Ade Foods, DADDY RAY’S, WHOLE FRUIT and FRUIT-A-FREEZE and Kansas ICEE acquisitions, respectively. Goodwill increased $2,366,000 to $60,314,000 as a result of the purchases of the aforementioned acquisitions. Accounts payable and accrued liabilities increased $5,033,000, or 10% from 2006 to 2007 primarily because of increased levels of business, higher costs of raw materials and packaging and higher income taxes payable. Deferred income tax liabilities increased by $969,000 to $19,180,000 which related primarily to amortization of goodwill and other intangible assets. Common stock increased $6,182,000 to $47,280,000 in 2007 because of the exercise of incentive and nonqualified stock options, stock issued under our stock purchase plan for employees and share-based compensation expense. Net cash provided by operating activities increased $2,878,000 to $57,843,000 in 2007 primarily because of an increase to net earnings of $2,662,000 and higher amortization of intangibles and deferred costs of $2,797,000 compared to 2006. Net cash used in investing activities increased $7,205,000 to $57,834,000 in 2007 from $50,629,000 in 2006 primarily because purchases of property, plant and equipment and payments for purchases of companies, net of cash acquired were higher by $29,509,000, which was offset by the net difference between proceeds from sales of marketable securities and purchases of marketable securities of $22,782,000 this year compared to last year. Net cash used in financing activities of $1,769,000 in 2007 compared to net cash used by financing activities of $2,464,000 in 2006. The decrease was caused by increased proceeds from the issuance of common stock. In 2007, the major variables in determining our net increase in cash and cash equivalents and marketable securities available for sale were our net earnings, depreciation and amortization of fixed assets, purchases of property, plant and equipment and payments for the purchase of companies. Other variables which in the past have had a significant impact on our change in cash and cash equivalents are payments for the repurchase of common stock, proceeds from borrowings and payments of long-term debt. As discussed in results of operations, our net earnings may be influenced by many factors. Depreciation and amortization of fixed assets is primarily determined by past purchases of property, plant and equipment although it could be impacted by a significant acquisition in the current year. Purchases of property, plant and equipment are primarily determined by our ongoing normal manufacturing and marketing requirements but could be increased significantly for manufacturing expansion requirements or large frozen beverage customer needs. From time to time, we have repurchased common stock and we anticipate that we will do so again in the future. We are actively seeking acquisitions that could be a significant use of cash. Although the balance of our long-term debt is $0 at September 29, 2007, we may borrow in the future depending on our needs. Trade receivables increased $10,108,000 or 27% to $47,753,000 and inventories increased $6,385,000 or 28% to $29,587,000 in 2004. The increases were due primarily to increased levels of business and higher unit costs of inventories. Including Country Home Bakers, sales for the last month of the year were approximately 21% higher than a year ago. Additionally, the amount of some finished goods inventory was intentionally increased to allow for improved manufacturing efficiencies and distribution savings. Parts inventory increased in our frozen beverages business in response to higher levels of managed service business.
Property, plant and equipment increased $2,359,000 to $89,474,000 primarily because of the acquisition of $5,240,000 of property, plant and equipment in the Country Home Bakers acquisition, which was offset somewhat by higher depreciation than purchases in our existing business.
Other intangible assets, less accumulated amortization increased $573,000 to $1,804,000 because of the acquisition of intangible assets of $1,016,000 in the Country Home Bakers acquisition, net of amortization of $443,000.
Accounts payable and accrued liabilities increased $7,588,000, or 19% from 2003 to 2004 primarily because of increased levels of business during our fourth quarter and especially September.
Deferred income tax liabilities increased by $2,984,000 to $19,153,000 which related primarily to depreciation of property, plant and equipment.
Common stock increased $4,926,000 to $33,069,000 in 2004 because of the exercise of incentive stock options and stock issued under our stock purchase plan for employees.
Net cash provided by operating activities increased $779,000 to $47,144,000 in 2004 primarily because of an increase to net earnings of $2,808,000 which was partially offset by a reduction in depreciation and amortization of fixed assets of $1,064,000 and an increase in working capital of $1,316,000. The decrease in depreciation and amortization expense related primarily to frozen carbonated beverage dispensers acquired in an acquisition in 1998, which became fully depreciated in the first quarter of 2003.
Net cash used in investing activities increased $52,607,000 to $68,944,000 in 2004 from $16,337,000 in 2003 primarily because of the acquisition of Country Home Bakers and higher spending of $3,191,000 for purchases of dispensing and other equipment in our frozen beverage business and because purchases of marketable securities, net of proceeds from sales of marketable securities, were $36,500,000 in 2004 compared to none in 2003.
Net cash provided by financing activities of $3,810,000 in 2004 compared to a use of $6,327,000 in 2003. The change of $10,137,000 was because in 2003 we spent $8,565,000 to repurchase common stock and did not repurchase any common stock in 2004.
Back to Contents
In 2004, the major variables in determining our net increase in cash and cash equivalents and marketable securities available for sale were our net earnings, depreciation and amortization of fixed assets, purchases of property, plant and equipment and payments for the purchase of companies. Other variables which in the past have had a significant impact on our change in cash and cash equivalents are payments for the repurchase of common stock, proceeds from borrowings and payments of long-term debt. As discussed in results of operations, our net earnings may be influenced by many factors. Depreciation and amortization of fixed assets is primarily determined by past purchases of property, plant and equipment although it could be impacted by a significant acquisition in the current year. Purchases of property, plant and equipment is primarily determined by our ongoing normal manufacturing and marketing requirements but could be increased significantly for manufacturing expansion requirements or large frozen beverage customer needs. From time to time, we have repurchased common stock and we anticipate that we will again in the future. We are actively seeking acquisitions that could be a significant use of cash. Although the balance of our long-term debt is $0 at September 25, 2004, we may borrow in the future depending on our needs.
Item 7a.7A. Quantitative And Qualitative Disclosures About Market Risk |
The following is the Company’s quantitative and qualitative analysis of its financial market risk: The following is the Company’s quantitative and qualitative analysis of its financial market risk:
Interest Rate Sensitivity |
The Company has in the past entered into interest rate swaps to limit its exposure to interest rate risk and may do so in the future if the Board of Directors feels that such non-trading purpose is in the best interest of the Company and its shareholders. As of September 27, 2008, the Company had no interest rate swap contracts. The Company has in the past entered into interest rate swaps to limit its exposure to interest rate risk and may do so in the future if the Board of Directors feels that such non-trading purpose is in the best interest of the Company and its shareholders. As of September 24, 2005, the Company had no interest rate swap contracts.
At September 24, 2005, the Company had no long-term debt obligations.
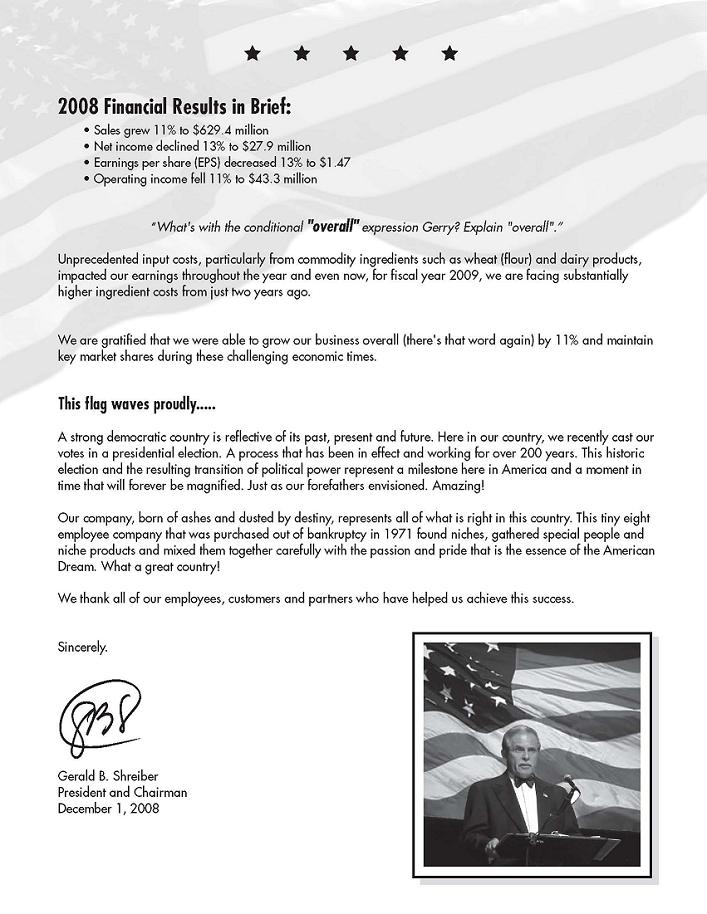
At September 27, 2008, the Company had no long-term debt obligations. Purchasing Risk The Company’s most significant raw material requirements include flour, shortening, corn syrup, sugar, juice, cheese, chocolate, and a variety of nuts. The Company attempts to minimize the effect of future price fluctuations related to the purchase of raw materials primarily through forward purchasing to cover future manufacturing requirements, generally for periods from 1 to 12 months. Futures contracts are not used in combination with forward purchasing of these raw materials. The Company’s procurement practices are intended to reduce the risk of future price increases, but also may potentially limit the ability to benefit from possible price decreases. The Company’s most significant raw material requirements include flour, shortening, corn syrup, chocolate, and macadamia nuts. The Company attempts to minimize the effect of future price fluctuations related to the purchase of raw materials primarily through forward purchasing to cover future manufacturing requirements, generally for periods from 1 to 24 months. Futures contracts are not used in combination with forward purchasing of these raw materials. The Company’s procurement practices are intended to reduce the risk of future price increases, but also may potentially limit the ability to benefit from possible price decreases.
Foreign Exchange Rate Risk |
The Company has not entered into any forward exchange contracts to hedge its foreign currency rate risk as of September 24, 2005 because it does not believe its foreign exchange exposure is significant.
The Company has not entered into any forward exchange contracts to hedge its foreign currency rate risk as of September 27, 2008 because it does not believe its foreign exchange exposure is significant. Item 8.Financial Statements And Supplementary Data |
The financial statements of the Company are filed under this Item 8, beginning on page F-1 of this report.
The financial statements of the Company are filed under this Item 8, beginning on page F-1 of this report. Item 9.Changes In And Disagreements With Accountants On Accounting And Financial Disclosure |
None.
None. Item 9A. Controls And Procedures
Disclosure Controls and Procedures We carried out an evaluation under the supervision and with the participation of our management, including our chief executive officer and chief financial officer, of the effectiveness of the design and operation of our disclosure controls and procedures, as such term is defined under Rule 13a-15(e) promulgated under the Securities Exchange Act of 1934 (the “Exchange Act”), as amended for financial
Back to Contents
reporting, as of September 24, 2005.27, 2008. Based on that evaluation, our chief executive officer and chief financial officer concluded that these controls and procedures are effective to ensure that information required to be disclosed by the Company in reports that it files or submits under the Exchange Act is recorded, processed, summarized, and reported as specified in Securities and Exchange Commission rules and forms. There were no changes in these controls or procedures identified in connection with the evaluation of such controls or procedures that occurred during our last fiscal quarter, or in other factors that have materially affected, or are reasonably likely to materially affect these controls or procedures. There were no changes in the Company’s internal controls over financial reporting that occurred during our last fiscal quarter. Our disclosure controls and procedures are designed to ensureprovide reasonable assurance that information required to be disclosed by us in the reports that we file or submit under the Exchange Act is recorded, processed, summarized, and reported, within the time periods specified in the rules and forms of the Securities and Exchange Commission. These disclosure controls and procedures include, among other things, controls and procedures designed to ensureprovide reasonable assurance that information required to be disclosed by us in the reports that we file under the Exchange Act is accumulated and communicated to our management, including our chief executive officer and chief financial officer, as appropriate to allow timely decisions regarding required disclosure. Management’s Report on Internal Control over Financial Reporting Our management is responsible for establishing and maintaining adequate internal control over financial reporting. Internal control over financial reporting is defined in Rule 13a-15(f) and 15d-15(f) under the Exchange Act as a process designed by, or under the supervision of, the chief executive officer and chief financial officer and effected by the board of directors and management to provide reasonable assurance regarding the reliability of financial reporting and the preparation of financial statements for external purposes in accordance with generally accepted accounting principles and includes those policies and procedures that: Pertain to the maintenance of records that in reasonable detail accurately and fairly reflect the transactions and dispositions of our assets;
| · | | Pertain to the maintenance of records that in reasonable detail accurately and fairly reflect the transactions and dispositions of our assets; |
| •· | Provide reasonable assurance that transactions are recorded as necessary to permit preparation of financial statements in accordance with generally accepted accounting principles, and that receipts and expenditures of the company are being made only in accordance with authorizations of our management and board of directors; |
| | | | •· | Provide reasonable assurance regarding prevention or timely detection of unauthorized acquisition, use or disposition of our assets that could have a material effect on the financial statements. |
Because of its inherent limitations, internal control over financial reporting may not prevent or detect misstatements. Projections of any evaluation of effectiveness to future periods are subject to the risks that controls may become inadequate because of changes in conditions, or that the degree of compliance with the policies or procedures may deteriorate. Our management assessed the effectiveness of our internal control over financial reporting as of September 24, 2005.27, 2008. In making this assessment, our management used the criteria set forth by the Committee of Sponsoring Organizations of the Treadway Commission (COSO) in Internal Control-Integrated Framework. Based on our assessment, our management believes that, as of September 24, 2005,27, 2008, our internal control over financial reporting is effective. Additionally, Grant Thornton LLP Our independent registered public accounting firm has issued an attestationa report on the effectiveness of our assessment of internal controls.
control over financial reporting. That report appears in this Annual Report on Form 10-K on page F-2.Item 9b.9B. Other Information |
There was no information required on Form 8-K during the quarter that was not reported.
There was no information required on Form 8-K during the quarter that was not reported. PART III 19
Back to Contents
PART III
Item 10.Directors, Executive Officers and Corporate Governance Portions of the information concerning directors and executive officers, appearing under the captions “Information Concerning Nominees For Election To Board” and “Information Concerning Continuing Directors And Executive Officers Of Officers” and information concerning Section 16(a) Compliance appearing under the caption “Compliance with Section 16(a) of the Securities Exchange Act of 1934” in the Company’s Proxy Statement filed with the Securities and Exchange Commission in connection with the Annual Meeting of Shareholders to be held on February 12, 2009 (“2008 Proxy Statement”) is incorporated herein by reference. Portions of the information concerning the Audit Committee, the requirement for an Audit Committee Financial Expert and the Nominating Committee in the Company’s 2008 Proxy Statement filed with the Securities and Exchange Commission in connection with the Annual Meeting of Shareholders to be held on February 12, 2009, is incorporated herein by reference. The RegistrantCompany has adopted a Code of Ethics pursuant to Section 406 of the Sarbanes-Oxley Act of 2002, which applies to the Company’s principal executive officer and senior financial officer. The Company has also adopted a Code of Business Conduct and Ethics which applies to all employees. The Company will furnish any person, without charge, a copy of the Code of Ethics upon written request to J & J Snack Foods Corp., 6000 Central Highway, Pennsauken, New Jersey 08109, Attn: Dennis Moore. A copy of the Code of Ethics can also be found on our website at www.jjsnack.com. Any waiver of any provision of the Code of Ethics granted to the principal executive officer or senior financial officer may only be granted by a majority of the Company’s disinterested directors. If a waiver is granted, information concerning the waiver will be posted on our website www.jjsnack.com for a period of 12 months. |
Portions of the information concerning directors, appearing under the captions “Information Concerning Nominees For Election To Board” and “Information Concerning Continuing Directors And Executive Officers” in the Company’s Proxy Statement filed with the Securities and Exchange Commission in connection with the Annual Meeting of Shareholders to be held on February 7, 2006, is incorporated herein by reference.
Portions of the information concerning the Audit Committee, the requirement for an Audit Committee Financial Expert and the Nominating Committee in the Company’s Proxy Statement filed with the Securities and Exchange Commission in connection with the Annual Meeting of Shareholders to be held on February 7, 2006, is incorporated herein by reference.
The Company has adopted a Code of Ethics pursuant to Section 406 of the Sarbanes-Oxley Act of 2002, which applies to the Company’s principal executive officer and senior financial officer. The Company has also adopted a Code of Business Conduct and Ethics which applies to all employees.
Item 11.Executive Compensation Information concerning executive compensation appearing in the Company’s 2008 Proxy Statement under the caption “Management Remuneration” is incorporated herein by reference. The following is a list of the executive officers of the Company and their principal past occupations or employment. All such persons serve at the pleasure of the Board of Directors and have been elected to serve until the Annual Meeting of Shareholders on February 12, 2009 or until their successors are duly elected. Information concerning executive compensation appearing in the Company’s Proxy Statement under the caption “Management Remuneraton” is incorporated herein by reference.
The following is a list of the executive officers of the Company and their principal past occupations or employment. All such persons serve at the pleasure of the Board of Directors and have been elected to serve until the Annual Meeting of Shareholders on February 7, 2006 or until their successors are duly elected.
| Name
| | | Gerald B. Shreiber | 67 | Chairman of the Board, President, Chief Executive Officer and Director | | Age | | Position |
| |
| | |
| Gerald B. Shreiber | | 64 | | | | | Dennis G. Moore | 53 | Senior Vice President, Chief Financial Officer, Secretary, Treasurer and Director | | | | | Robert M. Radano | 59 | Senior Vice President, Sales and Chief Operating Officer | | | | | Dan Fachner | 48 | President of The ICEE Company Subsidiary | | | | | Vincent Melchiorre | 48 | Executive Vice President and Chief Marketing Officer |
Gerald B. Shreiber is the founder of the Company and has served as its Chairman of the Board, President, and Chief Executive Officer and Director | | since its inception in 1971. His term as a director expires in 2010. Dennis G. Moore | | 50 | | | Senior Vice President, joined the Company in 1984. He served in various controllership functions prior to becoming the Chief Financial Officer Secretary, Treasurer
and Director | | in June 1992. His term as a director expires in 2012. Robert M. Radano | | 56 | | | joined the Company in 1972 and in May 1996 was named Chief Operating Officer of the Company. Prior to becoming Chief Operating Officer, he was Senior Vice President, Sales and Chief Operating Officer | | responsible for national food service sales of J & J. Dan Fachner | | 45 | | | has been an employee of ICEE-USA Corp., which was acquired by the Company in May 1987, since 1979. He was named Senior Vice President of The ICEE Company Subsidiary | Michael Karaban | | 59 | | | Senior Vicein April 1994 and became President Marketing | |
Gerald B. Shreiber is the founder of the Company and has served as its Chairman of the Board, President, and Chief Executive Officer since its inception in 1971. His term as a director expires in 2005.
in May 1997.Vincent Melchiorre joined the Company in June 2007. Prior to joining the Company, he had been employed in management positions with Weston Foods, USA for one year, The Tasty Baking Company for three years and The Campbell Soup Company for over twenty years. Dennis G. Moore joined the Company in 1984. He served in various controllership functions prior to becoming the Chief Financial Officer in June 1992. His term as a director expires in 2007.
Robert M. Radano joined the Company in 1972 and in May 1996 was named Chief Operating Officer of the Company. Prior to becoming Chief Operating Officer, he was Senior Vice President, Sales responsible for national food service sales of J & J.
Dan Fachner has been an employee of ICEE-USA Corp., which was acquired by the Company in May 1987, since 1979. He was named Senior Vice President of The ICEE Company in April 1994 and became President in May 1997.
Michael Karaban has been an employee of the Company in charge of its marketing department since 1990 and in February 2002 was elected Senior Vice President, Marketing.
Item 12.Security Ownership Of Certain Beneficial Owners And Management And Related Stockholder Matters |
Information concerning the security ownership of certain beneficial owners and management appearing in the Company’s Proxy Statement under the caption “Principal Shareholders” is incorporated herein by reference.
Information concerning the security ownership of certain beneficial owners and management appearing in the Company’s 2008 Proxy Statement under the caption “Security Ownership of Certain Beneficial Owners and Management” is incorporated herein by reference. The following table details information regarding the Company’s existing equity compensation plans as of September 27, 2008. | | | (a) | | | (b) | | | (c) | | | Plan Category | | Number of securities to be issued upon exercise of outstanding options, warrants and rights | | | Weighted-average exercise price of outstanding options, warrants and rights | | | Number of securities remaining available for future issuance under equity compensation plans (excluding securities reflected in column (a)) | | | Equity compensation plans approved by security holders | | | 1,027,000 | | | $ | 21.84 | | | | 1,311,000 | | | Equity compensation plans not approved by security holders | | | — | | | | — | | | | — | | | Total | | | 1,027,000 | | | $ | 21.84 | | | | 1,311,000 | |
Back to Contents
The following table details information regarding the Company’s existing equity compensation plans as of September 24, 2005.
| | | (a) | | (b) | | (c) | | Plan Category | | Number of securities to be issued upon exercise of outstanding options, warrants and rights | | Weighted-average exercise price of outstanding options, warrants and rights | | Number of securities remaining available for future issuance under equity compensation plans (excluding securities reflected in column (a)) | |
| |
|
| |
|
| |
|
| | | Equity compensation plans approved by security holders | | | 640,000 | | $ | 26.45 | | | 564,000 | | | Equity compensation plans not approved by security holders | | | — | | | — | | | — | | | | |
|
| |
|
| |
|
| | | Total | | | 640,000 | | $ | 26.45 | | | 564,000 | | | | |
|
| |
|
| |
|
| |
| Item 13.Certain Relationships And Related Transactions, and Director Independence |
None to report.
None to report. Item 14.Principal Accounting Fees And Services |
Information concerning the Principal Accounting Fees and Services in the Company’s Proxy Statement for the 2005 Annual Meeting of Stockholders is incorporated herein by reference.
Information concerning the Principal Accountant Fees and Services in the Company’s 2009 Proxy Statement is incorporated herein by reference. PART IV 21
Back to Contents
PART IV
Item 15.Exhibits, Financial Statement Schedules | (a) | The following documents are filed as part of this Report: |
(a) The following documents are filed as part of this Report:
| | | | | | | The financial statements filed as part of this report are listed on the Index to Consolidated Financial Statements and Financial Statements Schedule on page F-1. |
| | | | | | | (2) Financial Statement Schedules — Page S-1 | | | | | | Schedule II — Valuation and Qualifying Accounts |
All other schedules are omitted either because they are not applicable or because the information required is contained in the financial statements or notes thereto. | (b) | Exhibits | | | | | | | Schedule II — Valuation and Qualifying Accounts |
All other schedules are omitted either because they are not applicable or because the information required is contained in the financial statements or notes thereto.
| | 3.1 | | Amended and Restated Certificate of Incorporation filed February 28, 1990. (Incorporated by reference from the Company’s Form 10-Q dated May 4, 1990.) |
| | | | | 3.2 | | Amended and Restated Bylaws adopted May 15, 1990. (Incorporated by reference from the Company’s Form 10-Q dated August 3, 1990. | | | | | 3.2 | Revised Bylaws adopted May 17, 2006. (Incorporated by reference from the Company’s Form 10-K dated December 6, 2006.) |
| | | | | 4.3 | | Loan Agreement dated as of December 4, 2001 by and among J & J Snack Foods Corp. and Certain of its Subsidiaries and Citizens Bank of Pennsylvania, as Agent. (Incorporated by reference from the Company’s Form 10-K dated December 21, 2001.) |
| | | | | 4.4 | | Second Amendment to Loan Agreement dated as of December 4, 2001 by and among J & J Snack Foods Corp. and Certain of its Subsidiaries and Citizens Bank of Pennsylvania, as Agent. (Incorporated by reference from the Company’s Form 10-K dated December 8, 2004.) |
| | 4.3 | Amended and Restated Loan Agreement dated December 1, 2006 by and among J & J Snack Foods Corp. and Certain of its Subsidiaries and Citizens Bank of Pennsylvania, as Agent. (Incorporated by reference from the Company’s Form 10-K dated December 6, 2006.) | | | | | | | 10.1 | | Proprietary Exclusive Manufacturing Agreement dated July 17, 1984 between J & J Snack Foods Corp. and Wisco Industries, Inc. (Incorporated by reference from the Company’s Form S-1 dated February 4, 1986, file no. 33-2296). |
| | | | | | 10.2* | | J & J Snack Foods Corp. Stock Option Plan. (Incorporated by reference from the Company’s Definitive Proxy Statement dated December 19, 2002.) |
| | | | | 10.3* | | J & J Snack Foods Corp. 401(k) Profit Sharing Plan, As Amended, Effective January 1, 1989. | | | | | 10.3* | Adoption Agreement for MFS Retirement Services, Inc. Non-Standardized 401(K) Profit Sharing Plan and Trust, effective September 1, 2004. (Incorporated by reference from the Company’s Form 10-K dated December 6, 2006.) | | | | | 10.4* | J & J Snack Foods Corp. Directors’ and Consultants’ Deferred Compensation Plan adopted November 21, 2005. (Incorporated by reference from the Company’s Form 10-K dated December 6, 2006.) | | | | | 10.6 | Lease dated September 24, 1991 between J & J Snack Foods Corp. of New Jersey and A & H Bloom Construction Co. for the 101,200 square foot building next to the Company’s manufacturing facility in Pennsauken, New Jersey. (Incorporated by reference from the Company’s 10-K dated December 18, 1992.) |
| | | | | 10.4* | | First, Second and Third Amendments to the J & J Snack Foods Corp. 401(k) Profit Sharing Plan. (Incorporated by reference from the Company’s 10-K dated December 19, 1996.) |
| | | | | 10.6 | | Lease dated September 24, 1991 between J & J Snack Foods Corp. of New Jersey and A & H Bloom Construction Co. for the 101,200 square foot building next to the Company’s manufacturing facility in Pennsauken, New Jersey. (Incorporated by reference form the Company’s Form 10-K dated December 17, 1991.) |
| | | | | | 10.7 | | Lease dated August 29, 1995 between J & J Snack Foods Corp. and 5353 Downey Associated Ltd. for the lease of the Vernon, CA facility. (Incorporated by reference from the Company’s Form 10-K dated December 21, 1995.) |
| | | | | 10.8* | | J & J Snack Foods Corp. Employee Stock Purchase plan | | | | | 10.8* | J & J Snack Foods Corp. Employee Stock Purchase Plan (Incorporated by reference from the Company’s Form S-8 dated May 16, 1996). |
| | | | | | 10.11 | | Amendment No. 1 to Lease dated August 29, 1995 10.12 between J & J Snack Foods Corp. and 5353 Downey Associated Ltd. for the lease of the Vernon, CA facility. (Incorporated by reference from the Company’s Form 10-K dated December 18, 2002). |
Back to Contents
| | 10.12* | | Fourth and Fifth Amendments to the J & J Snack Foods Corp. 401(k) Profit Sharing Plan. (Incorporated by reference from the Company’s Form 10-K dated December 18, 2002). | | | | | | 14.0 | | | | 10.12 | Employment agreement between Vincent A. Melchiorre and J & J Snack Foods Corp. (Incorporated by reference from the Company’s 8-K dated June 5, 2007). | | | | | 14.1 | Code of Ethics Pursuant to Section 406 of the Sarbanes-Oxley Act of 2002. (Incorporated by reference from the Company’s 10-Q dated July 20, 2004). | | | | | | | 21.1** | | Subsidiaries of J & J Snack Foods Corp. |
| | | | | | 23.1** | | Consent of Independent Registered Public Accounting Firm. |
| | | | | | 31.1** | | Certification Pursuant to Section 302 of the Sarbanes-Oxley Act of 2002. |
| | | | | | 31.2** | | Certification Pursuant to Section 302 of the Sarbanes-Oxley Act of 2002. |
| | | | | | 32.1** | | | | 32.1** | Certification Pursuant to 18 U.S.C. Section 1350, As Adopted Pursuant To Section 906 Of The Sarbanes-Oxley Act of 2002. | | | | | 32.2** | Certification Pursuant to 18 U.S.C. Section 1350, As Adopted Pursuant To Section 906 Of The Sarbanes-Oxley Act of 2002. | | | | |
Herewith.SIGNATURES
Back to Contents
SIGNATURES
Pursuant to the requirements of Section 13(a) or 15(d) of the Securities Exchange Act of 1934, the Registrant has duly caused report to be signed on its behalf by the undersigned, thereunto duly authorized. | | J & J SNACK FOODS CORP. | | | | | December 6, 2005 | | By | /s/ Gerald B. Shreiber | | | |
| | | | Gerald B. Shreiber, | | | | Chairman of the Board,Securities Exchange Act of 1934, the Registrant has duly caused report to be signed on its behalf by the undersigned, thereunto duly authorized. | J & J SNACK FOODS CORP. | | | | President, Chief Executive Officer | | | | and Director |
Pursuant to the requirements of the Securities Exchange Act of 1934, this report has been signed below by the following persons on behalf of the Registrant and in the capacities and on the dates indicated.
December 6, 2005 | | By | /s/ Dennis G. Moore | | | |
| | | | Dennis G. Moore | | | | Senior Vice President, | | | | Chief Financial Officer | | | | and Director | | | | | December 6, 2005 | | By | /s/ Sidney R. Brown | | | |
| | | | Sidney R. Brown, Director | | | | | December 6, 2005 | | By | /s/ Peter G. Stanley | | | |
| | | | Peter G. Stanley, Director | | | | | December 6, 2005 | | By | /s/ Leonard M. Lodish | | | |
| | | | Leonard M. Lodish, Director |
24
Back to Contents
J & J SNACK FOODS CORP.
INDEX TO CONSOLIDATED FINANCIAL STATEMENTS
AND FINANCIAL STATEMENT SCHEDULE
Financial Statements:
| | | | | | | | | | | December 8, 2008 | By | /s/ Gerald B. Shreiber | | | Gerald B. Shreiber, Chairman of the Board, President, Chief Executive Officer and Director (Principal Executive Officer) | | | | | Pursuant to the requirements of the Securities Exchange Act of 1934, this report has been signed below by the following persons on behalf of the Registrant and in the capacities and on the dates indicated. | | | | | December 8, 2008 | | /s/ Gerald B. Shreiber | | | Gerald B. Shreiber, Chairman of the Board, President, Chief Executive Officer and Director (Principal Executive Officer) | | | | | December 8, 2008 | | /s/ Dennis G. Moore | | | Dennis G. Moore, Senior Vice President, Chief Financial Officer and Director (Principal Financial Officer) (Principal Accounting Officer) | | | | | December 8, 2008 | | /s/ Sidney R. Brown | | | Sidney R. Brown, Director | | | | | December 8, 2008 | | /s/ Peter G. Stanley | | | Peter G. Stanley, Director | | | | | December 8, 2008 | | /s/ Leonard M. Lodish | | | Leonard M. Lodish, Director | | | |
J & J SNACK FOODS CORP. INDEX TO CONSOLIDATED FINANCIAL STATEMENTS AND FINANCIAL STATEMENT SCHEDULE | Financial Statements: | | | | | Report of Independent Registered Public Accounting Firm | F-2 | | | | Consolidated Balance Sheets as of September 27, 2008 and September 29, 2007 | F-3 | | | | Consolidated Statements of Earnings for fiscal years ended September 27, 2008, September 29, 2007 and September 30, 2006 | F-4 | | | | Consolidated Statement of Changes in Stockholders’ Equity for the fiscal years ended September 27, 2008, September 29, 2007 and September 30, 2006 | F-5 | | | | Consolidated Statements of Cash Flows for fiscal years ended September 27, 2008, September 29, 2007 and September 30, 2006 | F-6 | | | | Notes to Consolidated Financial Statements | F-7 | | | | Financial Statement Schedule: | | | | | Schedule II — Valuation and Qualifying Accounts | S-1 |
Report of Independent Registered Public Accounting Firm | | | F-2 | | | | | | | Consolidated Balance SheetsShareholders and Board of Directors J&J Snack Foods Corp. and Subsidiaries We have audited the accompanying consolidated balance sheets of J&J Snack Foods Corp. and Subsidiaries as of September 24, 200527, 2008 and September 25, 2004 | | | F-4 | 29, 2007, and the related consolidated statements of earnings, changes in stockholders’ equity, and cash flows for each of the fiscal years in the three-year period ended September 27, 2008 (52 weeks, 52 weeks, and 53 weeks, respectively). Our audits of the basic financial statements included the financial statement schedule, Valuation and Qualifying Accounts, listed in the index to the consolidated financial statements. We have also audited J&J Snack Foods Corp and Subsidiaries’ internal control over financial reporting as of September 27, 2008, based on criteria established in Internal Control-Integrated Framework issued by the Committee of Sponsoring Organizations of the Treadway Commission (COSO). J&J Snack Foods Corp. and Subsidiaries’ management is responsible for these financial statements and financial statement schedule, for maintaining effective internal control over financial reporting, and for its assessment of the effectiveness of internal control over financial reporting which is included in the accompanying Management’s Report on Internal Control over Financial Reporting. Our responsibility is to express an opinion on these financial statements and financial statement schedule and an opinion on J&J Snack Foods Corp. and Subsidiaries’ internal control over financial reporting based on our audits. We conducted our audits in accordance with the standards of the Public Company Accounting Oversight Board (United States). Those standards require that we plan and perform the audits to obtain reasonable assurance about whether the financial statements are free of material misstatement and whether effective internal control over financial reporting was maintained in all material respects. Our audits of the financial statements included examining, on a test basis, evidence supporting the amounts and disclosures in the financial statements, assessing the accounting principles used and significant estimates made by management, and evaluating the overall financial statement presentation. Our audit of internal control over financial reporting included obtaining an understanding of internal control over financial reporting, assessing the risk that a material weakness exists, and testing and evaluating the design and operating effectiveness of internal control based on the assessed risk. Our audits also included performing such other procedures as we considered necessary in the circumstances. We believe that our audits provide a reasonable basis for our opinions. A company’s internal control over financial reporting is a process designed to provide reasonable assurance regarding the reliability of financial reporting and the preparation of financial statements for external purposes in accordance with generally accepted accounting principles. A company’s internal control over financial reporting includes those policies and procedures that (1) pertain to the maintenance of records that, in reasonable detail, accurately and fairly reflect the transactions and dispositions of the assets of the company; (2) provide reasonable assurance that transactions are recorded as necessary to permit preparation of financial statements in accordance with generally accepted accounting principles, and that receipts and expenditures of the company are being made only in accordance with authorizations of management and directors of the company; and (3) provide reasonable assurance regarding prevention or timely detection of unauthorized acquisition, use, or disposition of the company’s assets that could have a material effect on the financial statements. Because of its inherent limitations, internal control over financial reporting may not prevent or detect misstatements. Also, projections of any evaluation of effectiveness to future periods are subject to the risk that controls may become inadequate because of changes in conditions, or that the degree of compliance with the policies or procedures may deteriorate. In our opinion, the financial statements referred to above present fairly, in all material respects, the consolidated financial position of J&J Snack Foods Corp. and Subsidiaries as of September 27, 2008 and September 29, 2007, and the consolidated results of their operations and their consolidated cash flows for each of the fiscal years in the three-year period ended September 27, 2008 (52 weeks, 52 weeks and 53 weeks) in conformity with accounting principles generally accepted in the United States of America. Also, in our opinion, the related financial statement schedule, when considered in relation to the basic financial statements taken as a whole, presents fairly, in all material respects, the information set forth therein. Also in our opinion, J&J Snack Foods Corp. and Subsidiaries maintained, in all material respects, effective internal control over financial reporting as of September 27, 2008, based on criteria established in Internal Control-Integrated Framework issued by COSO. As discussed in Note A to the consolidated financial statements, the Company has adopted Financial Accounting Standards Board Interpretation No. 48, Accounting for Uncertainty in Income Taxes, an interpretation of FASB Statement No. 109, in 2008. /s/ Grant Thornton LLP Philadelphia, Pennsylvania November 26, 2008 J & J SNACK FOODS CORP. AND SUBSIDIARIES CONSOLIDATED BALANCE SHEETS | | | September 27, | | | September 29, | | | | | 2008 | | | 2007 | | | | | (in thousands, except share amounts) | | | | | | | | | | | Assets | | | | | | | | Current Assets | | | | | | | | Cash and cash equivalents | | $ | 44,265 | | | $ | 15,819 | | | Marketable securities held to maturity | | | 2,470 | | | | — | | | Auction market preferred stock | | | 14,000 | | | | 41,200 | | | Receivables | | | | | | | | | | Trade, less allowances of $926 and $1,052, respectively | | | 61,176 | | | | 56,772 | | | Other | | | 677 | | | | 424 | | | Inventories | | | 49,095 | | | | 46,599 | | | Prepaid expenses and other | | | 1,962 | | | | 1,425 | | | Deferred income taxes | | | 3,555 | | | | 3,125 | | | Total current assets | | | 177,200 | | | | 165,364 | | | | | | | | | | | | | Property, Plant and Equipment, at cost | | | 364,164 | | | | 352,829 | | | Less accumulated depreciation and amortization | | | 271,100 | | | | 259,607 | | | | | | 93,064 | | | | 93,222 | | | | | | | | | | | | | Other Assets | | | | | | | | | | Goodwill | | | 60,314 | | | | 60,314 | | | Other intangible assets, net | | | 53,633 | | | | 58,333 | | | Auction market preferred stock | | | 21,200 | | | | — | | | Other | | | 2,997 | | | | 3,055 | | | | | | 138,144 | | | | 121,702 | | | | | $ | 408,408 | | | $ | 380,288 | | | | | | | | | | | | | Liabilities and Stockholders’ Equity | | | | | | | | | | Current Liabilities | | | | | | | | | | Current obligations under capital leases | | $ | 93 | | | $ | 91 | | | Accounts payable | | | 48,580 | | | | 45,278 | | | Accrued liabilities | | | 5,557 | | | | 8,309 | | | Accrued compensation expense | | | 10,232 | | | | 9,335 | | | Dividends payable | | | 1,732 | | | | 1,588 | | | Total current liabilities | | | 66,194 | | | | 64,601 | | | | | | | | | | | | | Long-term obligations under capital leases | | | 381 | | | | 474 | | | Deferred income taxes | | | 23,056 | | | | 19,180 | | | Other long-term liabilities | | | 1,999 | | | | 451 | | | | | | | | | | | | | Stockholders’ Equity | | | | | | | | | | Preferred stock, $1 par value; authorized, | | | | | | | | | | 10,000,000 shares; none issued | | | — | | | | — | | | Common stock, no par value; authorized, 50,000,000 shares; | | | | | | | | | | issued and outstanding 18,748,000 and 18,702,000 respectively | | | 48,415 | | | | 47,280 | | | Accumulated other comprehensive loss | | | (2,003 | ) | | | (2,006 | ) | | Retained earnings | | | 270,366 | | | | 250,308 | | | | | | 316,778 | | | | 295,582 | | | | | $ | 408,408 | | | $ | 380,288 | |
The accompanying notes are an integral part of these statements. J & J SNACK FOODS CORP. AND SUBSIDIARIES CONSOLIDATED STATEMENTS OF EARNINGS (in thousands, except per share information) | | | Fiscal year ended | | | | | September 27, | | | September 29, | | | September 30, | | | | | 2008 | | | 2007 | | | 2006 | | | | | (52 weeks) | | | (52 weeks) | | | (53 weeks) | | | Net Sales | | $ | 629,359 | | | $ | 568,901 | | | $ | 514,831 | | | Cost of goods sold(1) | | | 442,452 | | | | 382,374 | | | | 342,412 | | | Gross profit | | | 186,907 | | | | 186,527 | | | | 172,419 | | | | | | | | | | | | | | | | | Operating expenses | | | | | | | | | | | | | | Marketing(2) | | | 69,792 | | | | 70,248 | | | | 61,601 | | | Distribution(3) | | | 52,609 | | | | 48,945 | | | | 45,331 | | | Administrative(4) | | | 21,545 | | | | 20,142 | | | | 19,306 | | | Impairment charge | | | — | | | | — | | | | 1,193 | | | Other general income | | | (375 | ) | | | (1,388 | ) | | | (76 | ) | | | | | 143,571 | | | | 137,947 | | | | 127,355 | | | Operating income | | | 43,336 | | | | 48,580 | | | | 45,064 | | | | | | | | | | | | | | | | | Other income (expenses) | | | | | | | | | | | | | | Investment income | | | 2,665 | | | | 2,720 | | | | 3,137 | | | Interest expense and other | | | (116 | ) | | | (142 | ) | | | (129 | ) | | | | | 2,549 | | | | 2,578 | | | | 3,008 | | | Earnings before income taxes | | | 45,885 | | | | 51,158 | | | | 48,072 | | | | | | | | | | | | | | | | | Income taxes | | | 17,977 | | | | 19,046 | | | | 18,622 | | | | | | | | | | | | | | | | | NET EARNINGS | | $ | 27,908 | | | $ | 32,112 | | | $ | 29,450 | | | | | | | | | | | | | | | | | Earnings per diluted share | | $ | 1.47 | | | $ | 1.69 | | | $ | 1.57 | | | | | | | | | | | | | | | | | Weighted average number of diluted shares | | | 19,008 | | | | 19,005 | | | | 18,807 | | | | | | | | | | | | | | | | | Earnings per basic share | | $ | 1.49 | | | $ | 1.72 | | | $ | 1.60 | | | | | | | | | | | | | | | | | Weighted average number of basic shares | | | 18,770 | | | | 18,635 | | | | 18,421 | |
| (1) | Includes share-based compensation expense of $229 for the year ended September 27, 2008, $227 for the year ended September 29, 2007 and $297 for the year ended September 30, 2006. | | (2) | Includes share-based compensation expense of $799 for the year ended September 27, 2008, $716 for the year ended September 29, 2007 and $576 for the year ended September 30, 2006. | | (3) | Includes share-based compensation expense of $23 for the year ended September 27, 2008, $50 for the year ended September 29, 2007 and $26 for the year ended September 30, 2006. | | (4) | Includes share-based compensation expense of $800 for the year ended September 27, 2008, $747 for the year ended September 29, 2007 and $687 for the year ended September 30, 2006. |
All share amounts reflect the 2-for-1 stock split effective January 5, 2006. The accompanying notes are an integral part of these statements. J & J SNACK FOODS CORP. AND SUBSIDIARIES CONSOLIDATED STATEMENT OF CHANGES IN STOCKHOLDERS’ EQUITY (in thousands) | | | | | | | | | Accumulated Other | | | | | | | | | | | | | | Common Stock | | | Comprehensive | | | Retained | | | | | | Comprehensive | | | | | Shares | | | Amount | | | Loss | | | Earnings | | | Total | | | Income | | | Balance at September 25, 2005 | | | 18,272 | | | $ | 36,593 | | | $ | (1,918 | ) | | $ | 200,589 | | | $ | 235,264 | | | | | Issuance of common stock upon exercise of stock options | | | 164 | | | | 2,253 | | | | — | | | | — | | | | 2,253 | | | | | Issuance of common stock for employee stock purchase plan | | | 23 | | | | 556 | | | | — | | | | — | | | | 556 | | | | | Foreign currency translation adjustment | | | — | | | | — | | | | (46 | ) | | | — | | | | (46 | ) | | $ | (46 | ) | Issuance of common stock under deferred stock plan | | | 9 | | | | 392 | | | | — | | | | — | | | | 392 | | | | | | | Dividends declared | | | — | | | | — | | | | — | | | | (5,517 | ) | | | (5,517 | ) | | | | | | Share-based compensation | | | — | | | | 1,304 | | | | — | | | | — | | | | 1,304 | | | | | | | Net earnings | | | — | | | | — | | | | — | | | | 29,450 | | | | 29,450 | | | | 29,450 | | | Comprehensive income | | | — | | | | — | | | | — | | | | — | | | | — | | | $ | 29,404 | | | Balance at September 30, 2006 | | | 18,468 | | | $ | 41,098 | | | $ | (1,964 | ) | | $ | 224,522 | | | $ | 263,656 | | | | | | Issuance of common stock upon exercise of stock options | | | 211 | | | | 3,669 | | | | — | | | | — | | | | 3,669 | | | | | | Issuance of common stock for employee stock purchase plan | | | 23 | | | | 700 | | | | — | | | | — | | | | 700 | | | | | | Foreign currency translation adjustment | | | — | | | | — | | | | (42 | ) | | | — | | | | (42 | ) | | $ | (42 | ) | Issuance of common stock under deferred stock plan | | | — | | | | 275 | | | | — | | | | — | | | | 275 | | | | | | | Dividends declared | | | — | | | | — | | | | — | | | | (6,326 | ) | | | (6,326 | ) | | | | | | Share-based compensation | | | — | | | | 1,538 | | | | — | | | | — | | | | 1,538 | | | | | | | Net earnings | | | — | | | | — | | | | — | | | | 32,112 | | | | 32,112 | | | | 32,112 | | | Comprehensive income | | | — | | | | — | | | | — | | | | — | | | | — | | | $ | 32,070 | | | Balance at September 29, 2007 | | | 18,702 | | | $ | 47,280 | | | $ | (2,006 | ) | | $ | 250,308 | | | $ | 295,582 | | | | | | Cumulative effective of change in accounting for income taxes | | | — | | | | — | | | | — | | | | (925 | ) | | | (925 | ) | | | | | Issuance of common stock upon exercise of stock options | | | 150 | | | | 2,029 | | | | — | | | | — | | | | 2,029 | | | | | | Issuance of common stock for employee stock purchase plan | | | 31 | | | | 782 | | | | — | | | | — | | | | 782 | | | | | | Foreign currency translation adjustment | | | — | | | | — | | | | 3 | | | | — | | | | 3 | | | $ | 3 | | Issuance of common stock under deferred stock plan | | | — | | | | 388 | | | | — | | | | — | | | | 388 | | | | | | | Dividends declared | | | — | | | | — | | | | — | | | | (6,925) | | | | (6,925 | ) | | | | | | Share-based compensation | | | — | | | | 1,475 | | | | — | | | | — | | | | 1,475 | | | | | | | Repurchase of common stock | | | (135 | ) | | | (3,539 | ) | | | — | | | | — | | | | (3,539) | | | | | | | Net earnings | | | — | | | | — | | | | — | | | | 27,908 | | | | 27,908 | | | | 27,908 | | | Comprehensive income | | | — | | | | — | | | | — | | | | — | | | | — | | | $ | 27,911 | | | Balance at September 27, 2008 | | | 18,748 | | | $ | 48,415 | | | $ | (2,003 | ) | | $ | 270,366 | | | $ | 316,778 | | | | | |
All share amounts reflect the 2-for-1 stock split effective January 5, 2006. The accompanying notes are an integral part of these statements. J & J SNACK FOODS CORP. AND SUBSIDIARIES CONSOLIDATED STATEMENTS OF CASH FLOWS (in thousands) | | | Fiscal year ended | | | | | September 27, | | | September 29, | | | September 30, | | | | | 2008 | | | 2007 | | | 2006 | | | | | (52 weeks) | | | (52 weeks) | | | (53 weeks) | | | Operating activities: | | | | | | | | | | | | | | Net earnings | | $ | 27,908 | | | $ | 32,112 | | | $ | 29,450 | | Adjustments to reconcile net earnings to net cash provided by operating activities: | | | | | | | | | | | | | | Depreciation and amortization of fixed assets | | | 22,181 | | | | 22,451 | | | | 22,848 | | | Amortization of intangibles and deferred costs | | | 5,289 | | | | 4,557 | | | | 1,760 | | (Gains) losses from disposals and impairment of property & equipment | | | (174 | ) | | | (49 | ) | | | 1,062 | | | Other | | | — | | | | (150 | ) | | | — | | | Share-based compensation | | | 1,851 | | | | 1,740 | | | | 1,586 | | | Deferred income taxes | | | 3,446 | | | | 557 | | | | (96 | ) | Changes in assets and liabilities, net of effects from purchase of companies: | | | | | | | | | | | | | | Increase in accounts receivable | | | (4,701 | ) | | | (569 | ) | | | (4,223 | ) | | Increase in inventories | | | (2,448 | ) | | | (5,722 | ) | | | (2,160 | ) | | Increase in prepaid expenses and other | | | (537 | ) | | | (65 | ) | | | (167 | ) | Increase in accounts payable and accrued liabilities | | | 2,082 | | | | 2,981 | | | | 4,905 | | | Net cash provided by operating activities | | | 54,897 | | | | 57,843 | | | | 54,965 | | | | | | | | | | | | | | | | | Investing activities: | | | | | | | | | | | | | | Purchases of property, plant and equipment | | | (22,781 | ) | | | (22,765 | ) | | | (19,739 | ) | Payments for purchases of companies, net of cash acquired | | | — | | | | (52,747 | ) | | | (26,264 | ) | | Purchase of marketable securities | | | (12,970 | ) | | | (60,875 | ) | | | (40,825 | ) | | Proceeds from sales of marketable securities | | | 6,500 | | | | 78,882 | | | | 36,050 | | Proceeds from redemption of auction market preferred stock | | | 10,000 | | | | — | | | | — | | | Proceeds from disposal of property and equipment | | | 932 | | | | 592 | | | | 1,046 | | | Other | | | (535 | ) | | | (921 | ) | | | (897 | ) | | Net cash used in investing activities | | | (18,854 | ) | | | (57,834 | ) | | | (50,629 | ) | | | | | | | | | | | | | | | | Financing activities: | | | | | | | | | | | | | | Payments to repurchase common stock | | | (3,539 | ) | | | — | | | | — | | | Proceeds from issuance of common stock | | | 2,811 | | | | 4,369 | | | | 2,809 | | | Payments of cash dividend | | | (6,781 | ) | | | (6,123 | ) | | | (5,273 | ) | | Payments on capitalized lease obligations | | | (91 | ) | | | (15 | ) | | | — | | | Net cash used in financing activities | | | (7,600 | ) | | | (1,769 | ) | | | (2,464 | ) | Effect of exchange rate on cash and cash equivalents | | | 3 | | | | (42 | ) | | | (46 | ) | Net increase (decrease) in cash and cash equivalents | | | 28,446 | | | | (1,802 | ) | | | 1,826 | | | Cash and cash equivalents at beginning of year | | | 15,819 | | | | 17,621 | | | | 15,795 | | | Cash and cash equivalents at end of year | | $ | 44,265 | | | $ | 15,819 | | | $ | 17,621 | |
The accompanying notes are an integral part of these statements. J & J SNACK FOODS CORP. AND SUBSIDIARIES NOTES TO CONSOLIDATED FINANCIAL STATEMENTS
NOTE A — SUMMARY OF SIGNIFICANT ACCOUNTING POLICIES J & J Snack Foods Corp. and Subsidiaries (the Company) manufactures, markets and distributes a variety of nutritional snack foods and beverages to the food service and retail supermarket industries. A summary of the significant accounting policies consistently applied in the preparation of the accompanying consolidated financial statements follows. 1. Principles of Consolidation The consolidated financial statements include the accounts of J & J Snack Foods Corp. and its wholly-owned subsidiaries. Intercompany balances and transactions have been eliminated in the consolidated financial statements. 2. Revenue Recognition We recognize revenue from Food Service, Retail Supermarkets, The Restaurant Group and Frozen Beverage products at the time the products are shipped to third parties. When we perform services under service contracts for frozen beverage dispenser machines, revenue is recognized upon the completion of the services on specified machines. We provide an allowance for doubtful receivables after taking into consideration historical experience and other factors. We follow EITF Issue 00-10, “Accounting for Shipping and Handling Fees and Costs” (Issue 00-10). Issue 00-10 requires that all amounts billed to customers related to shipping and handling should be classified as revenues. Our product costs include amounts for shipping and handling, therefore, we charge our customers shipping and handling fees at the time the products are shipped or when services are performed. The cost of shipping products to the customer is recognized at the time the products are shipped to the customer and our policy is to classify them as Distribution expenses. The cost of shipping products to the customer classified as Distribution expenses was $52,609,000, $48,945,000 and $45,331,000 for the fiscal years ended 2008, 2007 and 2006, respectively. Staff Accounting Bulletin No. 101, Revenue Recognition in Financial Statements (SAB 101) and Staff Accounting Bulletin No. 104, Revenue Recognition, corrected copy (SAB 104) address certain criteria for revenue recognition. SAB 101 and SAB 104 outline the criteria that must be met to recognize revenue and provides guidance for disclosures related to revenue recognition policies. Our revenue recognition policies comply with the guidance contained in SABs 101 and 104. We also sell service contracts covering frozen beverage machines sold. The terms of coverage range between 1 and 60 months. We record deferred income on service contracts which is amortized by the straight-line method over the term of the contracts. During the years ended September 27, 2008, September 29, 2007 and September 30, 2006, we sold $11,881,000, $9,000,000 and $6,000,000, respectively, of service contracts related to our frozen beverage machines. At September 27, 2008 and September 29, 2007, deferred income on service contracts was $1,130,000 and $1,160,000, respectively, of which $144,000 and $126,000 is included in other long-term liabilities as of September 27, 2008 and September 29, 2007, respectively and the balance is reflected as short-term and included in accrued liabilities on the consolidated balance sheet. Service contract income of $11,911,000, $9,612,000 and $5,883,000 was recognized for the fiscal years ended 2008, 2007 and 2006, respectively. 3. Foreign Currency Assets and liabilities in foreign currencies are translated into U.S. dollars at the rate of exchange prevailing at the balance sheet date. Revenues and expenses are translated at the average rate of exchange for the period. The cumulative translation adjustment is recorded as a separate component of stockholders’ equity and changes to such are included in comprehensive income. J & J SNACK FOODS CORP. AND SUBSIDIARIES NOTES TO CONSOLIDATED FINANCIAL STATEMENTS (Continued) NOTE A — SUMMARY OF SIGNIFICANT ACCOUNTING POLICIES (Continued) 4. Use of Estimates In preparing financial statements in conformity with accounting principles generally accepted in the United States of America, management is required to make estimates and assumptions that affect the reported amounts of assets and liabilities, the disclosure of contingent assets and liabilities at the date of the financial statements, and the reported amounts of revenues and expenses during the reporting period. Actual results could differ from those estimates. 5. Cash Equivalents Cash equivalents are short-term, highly liquid investments with original maturities of three months or less. 6. Concentrations of Credit Risk and Accounts Receivable We maintain cash balances at financial institutions located in various states. Accounts at each institution are insured by the Federal Deposit Insurance Corporation up to $250,000. We customarily maintain cash balances in excess of these insurance limits. Other financial instruments that could potentially subject us to concentrations of credit risk are trade accounts receivable; however, such risks are limited due to the large number of customers comprising our customer base and their dispersion across geographic regions. We usually have 2 to 3 customers with accounts receivable balances of between $1,500,000 to $6,000,000. We have several large customers that account for a significant portion of our sales. Our top ten customers accounted for 42%, 42% and 45% of our sales during fiscal years 2008, 2007 and 2006, respectively, with our largest customer accounting for 9% of our sales in 2008 and 8% in 2007 and 2006. Three of the ten customers are food distributors who sell our product to many end users. The majority of our accounts receivable are due from trade customers. Credit is extended based on evaluation of our customers’ financial condition and collateral is not required. Accounts receivable payment terms vary and are stated in the financial statements at amounts due from customers net of an allowance for doubtful accounts. Accounts outstanding longer than the payment terms are considered past due. We determine our allowance by considering a number of factors, including the length of time trade accounts receivable are past due, our previous loss history, customers’ current ability to pay their obligations to us, and the condition of the general economy and the industry as a whole. We write off accounts receivable when they become uncollectible, and payments subsequently received on such receivables are credited to the allowance for doubtful accounts. 7. Inventories Inventories are valued at the lower of cost (determined by the first-in, first-out method) or market. We follow FASB Statement 151, “Inventory Costs, an amendment of Accounting Research Bulletin (ARB) No. 43, Chapter 4,” (Statement 151). Statement 151 retains the general principle of ARB 43, Chapter 4, “Inventory Pricing”, that inventories are presumed to be stated at cost; however, it amends ARB 43 to clarify that | | ● | abnormal amounts of idle facilities, freight, handling costs, and spoilage should be recognized as charges of the current period | | | | | | ● | allocation of fixed production overheads to inventories should be based on the normal capacity of the production facilities. | Consolidated Statements |
Statement 151 defines normal capacity as the production expected to be achieved over a number of periods or seasons under normal circumstances, taking into account the loss of capacity resulting from planned maintenance. The Board concluded that normal capacity refers to a range of production levels that will vary based on J & J SNACK FOODS CORP. AND SUBSIDIARIES NOTES TO CONSOLIDATED FINANCIAL STATEMENTS (Continued) NOTE A — SUMMARY OF SIGNIFICANT ACCOUNTING POLICIES (Continued) business- and industry-specific factors. Accordingly, an entity will have to use judgment to determine when production is outside the range of expected variation in production (either abnormally low or abnormally high). In periods of abnormally low production (for example, periods in which there is significantly lower demand, labor and material shortages exist, or there is unplanned equipment downtime) the amount of fixed overhead allocated to each unit of production should not be increased. However, in periods of abnormally high production the amount of fixed overhead allocated to each unit of production is decreased to assure inventories are not measured above cost. We review for slow moving and obsolete inventory and a reserve is established for the value of inventory that we estimate will not be used. At September 27, 2008 and September 29, 2007, our reserve for inventory was $3,817,000 and $2,864,000, respectively. 8. Investment Securities We account for our investment securities in accordance with SFAS No. 115, “Accounting for Certain Investments in Debt and Equity Securities,” (SFAS No. 115). This standard requires investments in securities to be classified in one of three categories: held to maturity, trading, or available for sale; however, we have classified our auction market preferred stock separately on our balance sheet because of the failure of the auction market beginning in February 2008. The balance of our investment portfolio consists solely of investments classified as held to maturity and is accounted for as such in accordance with SFAS No. 115. See Note C for further information on our holdings of auction market preferred stock. 9. Depreciation and Amortization Depreciation of equipment and buildings is provided for by the straight-line method over the assets’ estimated useful lives. Amortization of improvements is provided for by the straight-line method over the term of the lease or the assets’ estimated useful lives, whichever is shorter. Licenses and rights arising from acquisitions are amortized by the straight-line method over periods ranging from 4 to 20 years. We follow SFAS No. 144, “Accounting for the Impairment or Disposal of Long-Lived Assets,” (SFAS No. 144) and SFAS No. 142, “Goodwill and Other Intangible Assets,” (SFAS No. 142). We review our equipment and buildings to ensure that they provide economic benefit. We recorded an impairment charge of $1,193,000 in 2006 in the food service segment for the writedown of robotic packaging equipment based on a determination made during the year that we would not be able to make the equipment work as intended. We use market value tests and discounted cash flow models to test goodwill and other intangible assets for impairment. These assets are reviewed for impairment annually or more frequently as a triggering event, such as the loss of a major customer, might occur. 10. Fair Value of Financial Instruments The carrying value of our short-term financial instruments, such as accounts receivables and accounts payable, approximate their fair values, based on the short-term maturities of these instruments. 11. Income Taxes We account for our income taxes under the liability method. Under the liability method, deferred tax assets and liabilities are determined based on the difference between the financial statement and tax bases of assets and liabilities as measured by the enacted tax rates that will be in effect when these differences reverse. Deferred tax expense is the result of changes in deferred tax assets and liabilities. In June 2006, the FASB issued Interpretation No. 48 (FIN 48), Accounting for Uncertainty in Income Taxes, an Interpretation of FASB Statement No. 109 (SFAS 109). J & J SNACK FOODS CORP. AND SUBSIDIARIES NOTES TO CONSOLIDATED FINANCIAL STATEMENTS (Continued) NOTE A — SUMMARY OF SIGNIFICANT ACCOUNTING POLICIES (Continued) FIN 48 clarifies the accounting for uncertainty in income taxes recognized in an entity’s financial statements in accordance with SFAS 109. FIN 48 prescribes a recognition threshold and measurement attribute for the financial statement recognition and measurement of a tax position taken or expected to be taken in a tax return. FIN 48 also provides guidance on derecognition, classification, interest and penalties, accounting in interim periods, disclosure and transition. FIN 48 also provides guidance on financial reporting and classification of differences between tax positions taken in a tax return and amounts recognized in the financial statements. We adopted FIN 48 on September 30, 2007, the first day of the 2008 fiscal year, and, as a result, recognized a $925,000 decrease to opening retained earnings from the cumulative effect of adoption. As of September 27, 2008, the total amount of gross unrecognized tax benefits is $1,735,000, all of which would impact our effective tax rate over time, if recognized. We recognize interest and penalties related to income tax matters as a part of the provision for income taxes. As of September 27, 2008, the Company had $588,000 of accrued interest and penalties. During the year ended September 27, 2008, we recognized $6,000 of penalties and interest. A reconciliation of the beginning and ending amount of unrecognized tax benefits is as follows: | | | (in thousands) | | | Balance at September 30, 2007 | | $ | 1,925 | | | Additions based on tax positions related to the current year | | | — | | | Additions for tax positions of prior years | | | 190 | | | Reductions for tax positions of prior years | | | (338 | ) | | Settlements | | | (42 | ) | | Balance at September 27, 2008 | | $ | 1,735 | |
In addition to our federal tax return and tax returns for Mexico and Canada, we file tax returns in all states that have a corporate income tax with virtually all open for examination for three to four years. 12. Earnings Per Common Share We follow SFAS No. 128, “Earnings Per Share” (EPS). Basic EPS excludes dilution and is computed by dividing income available to common shareholders by the weighted average common shares outstanding during the period. Diluted EPS takes into consideration the potential dilution that could occur if securities (stock options) or other contracts to issue common stock were exercised and converted into common stock. Our calculation of EPS is as follows (all share amounts reflect the 2-for-1 stock split effective January 5, 2006): | | | Fiscal Year Ended September 27, 2008 | | | | | Income | | | Shares | | | Per Share | | | | | (Numerator) | | | (Denominator) | | | Amount | | | | | (in thousands, except per share amounts) | | | Earnings Per Basic Share | | | | | | | | | | | Net Income available to common stockholders | | $ | 27,908 | | | | 18,770 | | | $ | 1.49 | | | | | | | | | | | | | | | | | Effect of Dilutive Securities | | | | | | | | | | | | | | Options | | | — | | | | 238 | | | | (.02 | ) | | | | | | | | | | | | | | | | Earnings Per Diluted Share | | | | | | | | | | | | | | Net Income available to common stockholders plus assumed conversions | | $ | 27,908 | | | | 19,008 | | | $ | 1.47 | |
273,471 anti-dilutive shares have been excluded in the computation of 2008 diluted EPS because the options’ exercise price is greater than the average market price of the common stock. J & J SNACK FOODS CORP. AND SUBSIDIARIES NOTES TO CONSOLIDATED FINANCIAL STATEMENTS (Continued) NOTE A — SUMMARY OF SIGNIFICANT ACCOUNTING POLICIES (Continued) | | | Fiscal Year Ended September 29, 2007 | | | | | Income | | | Shares | | | Per Share | | | | | (Numerator) | | | (Denominator) | | | Amount | | | | | (in thousands, except per share amounts) | | | Earnings Per Basic Share | | | | | | | | | | | Net Income available to common stockholders | | $ | 32,112 | | | | 18,635 | | | $ | 1.72 | | | | | | | | | | | | | | | | | Effect of Dilutive Securities | | | | | | | | | | | | | | Options | | | — | | | | 370 | | | | (.03 | ) | | | | | | | | | | | | | | | | Earnings Per Diluted Share | | | | | | | | | | | | | | Net Income available to common stockholders plus assumed conversions | | $ | 32,112 | | | | 19,005 | | | $ | 1.69 | |
128,200 anti-dilutive shares have been excluded in the computation of 2007 diluted EPS because the options’ exercise price is greater than the average market price of the common stock. | | | Fiscal Year Ended September 30, 2006 | | | | | Income | | | Shares | | | Per Share | | | | | (Numerator) | | | (Denominator) | | | Amount | | | | | (in thousands, except per share amounts) | | | Earnings Per Basic Share | | | | | | | | | | | Net Income available to common stockholders | | $ | 29,450 | | | | 18,421 | | | $ | 1.60 | | | | | | | | | | | | | | | | | Effect of Dilutive Securities | | | | | | | | | | | | | | Options | | | — | | | | 386 | | | | (.03 | ) | | | | | | | | | | | | | | | | Earnings Per Diluted Share | | | | | | | | | | | | | | Net Income available to common stockholders plus assumed conversions | | $ | 29,450 | | | | 18,807 | | | $ | 1.57 | |
500 anti-dilutive shares have been excluded in the computation of 2006 diluted EPS because the options’ exercise price is greater than the average market price of the common stock. 13. Accounting for Stock-Based Compensation The Company follows FASB Statement No. 123(R), “Share-Based Payment”. Statement 123(R) requires that the compensation cost relating to share-based payment transactions be recognized in financial statements. That cost is measured based on the fair value of the equity or liability instruments issued. Statement 123(R) covers a wide range of share-based compensation arrangements including share options, restricted share plans, performance-based awards, share appreciation rights, and employee share purchase plans. In addition to the accounting standard that sets forth the financial reporting objectives and related accounting principles, Statement 123(R) includes an appendix of implementation guidance that provides expanded guidance on measuring the fair value of share-based payment awards. At September 27, 2008, the Company has three stock-based employee compensation plans. Share-based compensation was recognized as follows: | | | Fiscal Year Ended | | | | | September 27, | | | September 29, | | | September 30, | | | | | | | | | | | 2006 | | | | | (in thousands, except per share amounts) | | | Stock Options | | $ | 1,019 | | | $ | 833 | | | $ | 823 | | | Stock purchase plan | | | 137 | | | | 146 | | | | 165 | | | Deferred stock issued to outside directors | | | 138 | | | | 138 | | | | 173 | | | Restricted stock issued to an employee | | | 100 | | | | 31 | | | | — | | | | | $ | 1,394 | | | $ | 1,148 | | | $ | 1,161 | | | Per diluted share | | $ | .07 | | | $ | .06 | | | $ | .06 | | | The above compensation is net of tax benefits | | $ | 457 | | | $ | 592 | | | $ | 425 | |
J & J SNACK FOODS CORP. AND SUBSIDIARIES NOTES TO CONSOLIDATED FINANCIAL STATEMENTS (Continued) NOTE A — SUMMARY OF SIGNIFICANT ACCOUNTING POLICIES (Continued) At September 27, 2008, the Company has unrecognized compensation expense of approximately $1.6 million to be recognized over the next three fiscal years. The fair value of each option grant is estimated on the date of grant using the Black-Scholes options-pricing model with the following weighted average assumptions used for grants in fiscal 2008, 2007 and 2006: expected volatility of 25.2% for fiscal year 2008, 27.4% for year 2007 and 34.2% for year 2006; weighted average risk-free interest rates of 3.60%, 4.57% and 4.41%; dividend rate of 1.1%, .9% and 1% and expected lives ranging between 5 and 10 years for all years. Expected forfeiture rates of 15%, 15% and 18% were used for fiscal years ended September 24, 2005, September 25, 20042008, 2007 and 2006, respectively. Expected volatility is based on the historical volatility of the price of our common shares over the past 50 to 53 months for 5 year options and 10 years for 10 year options. We use historical information to estimate expected life and forfeitures within the valuation model. The expected term of awards represents the period of time that options granted are expected to be outstanding. The risk-free rate for periods within the expected life of the option is based on the U.S. Treasury yield curve in effect at the time of grant. Compensation cost is recognized using a straight-line method over the vesting or service period and is net of estimated forfeitures. 14. Advertising Costs Advertising costs are expensed as incurred. Total advertising expense was $1,666,000, $4,084,000, and $1,589,000 for the fiscal years 2008, 2007 and 2006, respectively. 15. Commodity Price Risk Management Our most significant raw material requirements include flour, shortening, corn syrup, sugar, juice, cheese, chocolate, and a variety of nuts. We attempt to minimize the effect of future price fluctuations related to the purchase of raw materials primarily through forward purchasing to cover future manufacturing requirements, generally for periods from 1 to 12 months. As of September 27, 2003 | | | F-5 | | | | | | | | 2008, we have approximately $44,000,000 of such commitments. Futures contracts are not used in combination with forward purchasing of these raw materials. Our procurement practices are intended to reduce the risk of future price increases, but also may potentially limit the ability to benefit from possible price decreases. Our policy is to recognize estimated losses on purchase commitments when they occur. At each of the last three fiscal year ends, we did not have any material losses on our purchase commitments. 16. Research and Development Costs Research and development costs are expensed as incurred. Total research and development expense was $571,000, $529,000 and $558,000 for the fiscal years 2008, 2007 and 2006, respectively. 17. Recent Accounting Pronouncements In September 2006, the SEC staff issued Staff Accounting Bulletin No. 108, “Considering the Effects of Prior Year Misstatements when Quantifying Misstatements in Current Year Financial Statements.” SAB 108 was issued to provide consistency between how registrants quantify financial statement misstatements. We did not record any adjustment upon adoption in 2007 due to immateriality. In September 2006, the FASB issued Statement No. 157, “Fair Value Measurements” (FAS 157). FAS 157 establishes a common definition for how companies should measure fair value when they are required to use a fair value measure for recognition or disclosure purposes under generally accepted accounting principles. The statement is effective for our 2009 fiscal year. We are currently evaluating the provisions of FAS 157 to determine its impact on our financial statements. J & J SNACK FOODS CORP. AND SUBSIDIARIES NOTES TO CONSOLIDATED FINANCIAL STATEMENTS (Continued) NOTE A — SUMMARY OF SIGNIFICANT ACCOUNTING POLICIES (Continued) On February 15, 2007, the FASB issued Statement No. 159, “The Fair Value Option for Financial Assets and Financial Liabilities,” (SFAS 159). The Fair value option established by SFAS 159 permits, but does not require, all entities to choose to measure eligible items at fair value at specified election dates. An entity would report unrealized gains and losses on items for which the fair value option has been elected in earnings at each subsequent reporting date. SFAS 159 is effective for our 2009 fiscal year. We are currently assessing what the impact of the adoption of this standard would be on the Company’s financial position and/or results of operations. In December 2007, the FASB issued Statement 141 (revised 2007), “Business Combinations” (Statement 141R). When effective, Statement 141R will replace existing Statement 141 in its entirety. Statement 141R is effective for our 2010 fiscal year. Both early adoption and retrospective application are prohibited. In December 2007, The FASB issued Statement 160, “Noncontrolling Interests in Consolidated Financial Statements: an amendment of ARB No. 51.” Statement 160 replaces the existing minority-interest provisions of ChangesAccounting Research Bulletin (ARB) 51, “Consolidated Financial Statements,” by defining a new term—noncontrolling interests—to replace what were previously called minority interests. Statement 160 establishes noncontrolling interests as a component of the equity of a consolidated entity. The underlying principle of the new standard is that both the controlling interest and the noncontrolling interests are part of the equity of a single economic entity: the consolidated reporting entity. Statement 160 is effective for our 2010 fiscal year. Early adoption is prohibited. A parent company is prohibited from changing the amounts recognized for acquisitions or dispositions of noncontrolling interests or for a loss of control of a subsidiary in Stockholders’ Equityprevious periods. However, the parent must apply the disclosure and presentation provisions of Statement 160 retrospectively for all periods presented. In August 2008, the FASB issued FASB Staff Position (FSP) FAS 142-3, “Determination of the Useful Life of Intangible Assets.” The FSP revises the factors that a company should consider to develop renewal or extension assumptions used in estimating the useful life of a recognized intangible asset. The new guidance will apply to all intangible assets acquired after the FSP’s effective date. The FSP also requires new disclosures for all intangible assets recognized as of, and subsequent to, the FSP’s effective date. The underlying purpose of the FSP is to improve the consistency between the period of expected cash flows used to measure the fair value of a recognized intangible asset and the useful life of an intangible asset as determined under FASB Statement 142, “Goodwill and Other Intangible Assets.” FSP FAS 142-3 is effective for our 2010 fiscal year. Early adoption is prohibited. 18. Reclassifications Certain prior year financial statement amounts have been reclassified to be consistent with the presentation for the current year. NOTE B — ACQUISITIONS In January 2004, we acquired the assets of Country Home Bakers, Inc. Country Home Bakers, Inc., with its manufacturing facility in Atlanta, Georgia, manufactures and distributes bakery products to the food service and supermarket industries. Its product line includes cookies, biscuits, and frozen doughs sold under the names READI-BAKE, COUNTRY HOME and private labels sold through supermarket in-store bakeries. J & J SNACK FOODS CORP. AND SUBSIDIARIES NOTES TO CONSOLIDATED FINANCIAL STATEMENTS (Continued) NOTE B — ACQUISITIONS (Continued) On March 17, 2005, we acquired all of the assets of Snackworks LLC, d/b/a Bavarian Brothers, a manufacturer of soft pretzels headquartered in Rancho Cucamonga, California for $14.8 million plus approximately $600,000 for inventory. Snackworks operated production facilities in California and Chambersburg, Pennsylvania and markets its products under the brand names SERIOUSLY TWISTED!, BAVARIAN BROTHERS and CINNAPRETZEL. Snackworks sells throughout the continental United States primarily to mass merchandisers and theatres. On January 31, 2006, we acquired the stock of ICEE of Hawaii. ICEE of Hawaii, headquartered in Waipahu, Hawaii, distributes ICEE frozen beverages and related products throughout the Hawaiian islands. Annual sales are approximately $2.3 million. On May 26, 2006, The ICEE Company, our frozen carbonated beverage distribution company, acquired the SLUSH PUPPIE branded business from Dr. Pepper/Seven Up, Inc., a Cadbury Schweppes Americas Beverages Company for $18.1 million plus approximately $4.3 million in working capital. SLUSH PUPPIE, North America’s leading brand for frozen non-carbonated beverages, is sold through an existing established distributor network to over 20,000 locations in the United States and Canada as well as to certain international markets. The allocation of the purchase price is as follows: | | | (in thousands) | | | Working Capital | | $ | 4,264 | | | Property, plant and equipment | | | 25 | | | Prepaid license | | | 1,400 | | | Trade names | | | 7,460 | | | Customer relationships | | | 6,180 | | | Covenant not to compete | | | 148 | | | Goodwill | | | 2,987 | | | | | $ | 22,464 | |
On January 9, 2007 we acquired the assets of Hom/Ade Foods, Inc., a manufacturer and distributor of biscuits and dumplings sold under the MARY B’S and private label store brands to the supermarket industry. Hom/Ade is headquartered in Pensacola, Florida. On January 31, 2007 we acquired the assets of Radar Inc., a manufacturer and seller of fig and fruit bars selling its products under the brand DADDY RAY’S. Headquartered and with its manufacturing facility in Moscow Mills, Missouri (outside of St. Louis), Radar, Inc. had annual sales of approximately $23 million dollars selling to the retail grocery segment and mass merchandisers, both branded and private label. On April 2, 2007, we acquired the WHOLE FRUIT Sorbet and FRUIT-A-FREEZE Fruit Bar brands, along with related assets including a manufacturing facility located in Norwalk, California which sells primarily to the supermarket industry. On June 25, 2007, we acquired the assets of an ICEE distributor in Kansas with annual sales of less than $1 million. The allocation of the purchase prices for the Hom/Ade and Radar acquisitions and other acquisitions which were made during the 2007 fiscal year is as follows: | | | Hom/Ade | | | Radar | | | Other | | | | | | | | (in thousands) | | | | | | Working Capital | | $ | 1,410 | | | $ | 1,284 | | | $ | 989 | | | Property, plant & equipment | | | 233 | | | | 5,750 | | | | 1,442 | | | Trade Names | | | 6,220 | | | | 1,960 | | | | 3,086 | | | Customer Relationships | | | 17,250 | | | | 10,730 | | | | 58 | | | Covenant not to Compete | | | 301 | | | | 109 | | | | — | | | Goodwill | | | 476 | | | | 1,287 | | | | 603 | | | | | $ | 25,890 | | | $ | 21,120 | | | $ | 6,178 | |
J & J SNACK FOODS CORP. AND SUBSIDIARIES NOTES TO CONSOLIDATED FINANCIAL STATEMENTS (Continued) NOTE B — ACQUISITIONS (Continued) Included in the purchase price for Hom/Ade is a pre-acquisition contingency which was settled in the first quarter of fiscal year 2008 for approximately $1.9 million. The following pro forma information discloses net sales, net earnings and earnings per share for the three fiscal years ended September 24, 2005 | | | F-6 | | | | | | | Consolidated Statements27, 2008 including the sales and net earnings of Cash FlowsHom/Ade, Radar and Slush Puppie for all periods.The impact of the other acquisitions made during the periods on net sales, net earnings and earnings per share was not significant. | | | Pro Forma Fiscal year ended | | | | | September 27, | | | September 29, | | | September 30, | | | | | 2008 | | | 2007 | | | 2006 | | | | | (52 weeks) | | | (52 weeks) | | | (53 weeks) | | | | | (in thousands except per share information) | | | Net Sales | | $ | 629,359 | | | $ | 581,024 | | | $ | 566,297 | | | Net Earnings | | $ | 27,908 | | | $ | 33,235 | | | $ | 33,819 | | | Earnings per diluted share | | $ | 1.47 | | | $ | 1.75 | | | $ | 1.80 | | | Earnings per basic share | | $ | 1.49 | | | $ | 1.78 | | | $ | 1.84 | |
These acquisitions were accounted for under the purchase method of accounting, and their operations are included in the accompanying consolidated financial statements from their acquisition dates. NOTE C — INVESTMENT SECURITIES We have classified our investment securities as marketable securities held to maturity and auction market preferred stock (“AMPS”). The amortized cost, unrealized gains and losses, and fair market values of our marketable securities held to maturity at September 27, 2008 are summarized as follows: | | | Amortized Cost | | | Gross Unrealized Gains | | | Gross Unrealized Losses | | | Fair Market Value | | | | | (in thousands) | | | Certificates of Deposit | | $ | 2,470 | | | $ | — | | | $ | 6 | | | $ | 2,464 | | | | | $ | 2,470 | | | $ | — | | | $ | 6 | | | $ | 2,464 | |
All of the certificates of deposit are within the FDIC limits for insurance coverage. The amortized cost, unrealized gains and losses, and fair market values of our auction market preferred stock at September 27, 2008 are summarized as follows: | | | Amortized Cost | | | Gross Unrealized Gains | | | Gross Unrealized Losses | | | Fair Market Value | | | | | (in thousands) | | | Auction Market Preferred Stock Equity Securities | | $ | 35,200 | | | $ | — | | | $ | — | | | $ | 35,200 | | | | | $ | 35,200 | | | $ | — | | | $ | — | | | $ | 35,200 | |
J & J SNACK FOODS CORP. AND SUBSIDIARIES NOTES TO CONSOLIDATED FINANCIAL STATEMENTS (Continued) NOTE C — INVESTMENT SECURITIES (Continued) The amortized cost, unrealized gains and losses, and fair market values of our auction market preferred stock at September 29, 2007 are summarized as follows: | | | Amortized Cost | | | Gross Unrealized Gains | | | Gross Unrealized Losses | | | Fair Market Value | | | | | (in thousands) | | | Auction Market Preferred Stock Equity Securities | | $ | 41,200 | | | $ | — | | | $ | — | | | $ | 41,200 | | | | | $ | 41,200 | | | $ | — | | | $ | — | | | $ | 41,200 | |
At September 27, 2008, we held $35.2 million of AMPS which are valued at par, our cost; $14.0 million are classified as current assets and $21.2 million are classified as long-term assets on our balance sheet. On September 27, 2007, we held $41.2 million of AMPS which were also valued at par but which were all classified as current assets. The AMPS we own are senior equity securities of closed-end funds and have priority over the fund’s common shares as to distribution of assets and dividends, as described in each fund’s prospectus. Under normal auction market conditions, dividends on the AMPS for each dividend period (generally 7 to 49 days) are set at a rate determined through an auction process that brings together bidders who seek to buy AMPS and holders of AMPS who seek to sell. Investors and potential investors typically had purchased the AMPS in an auction by submitting orders to a broker-dealer, typically, an investment bank. However, beginning in mid February 2008, the auction process has not been supported by broker-dealers and auctions have failed and continue to fail. In the case of a failed auction, the dividends continue to be paid at the applicable “failure” rate for each security until an auction can establish a market clearing rate. For most of the funds we own, the specified “failure” rate is the current applicable LIBOR rate plus 125 basis points or 125% of the rate, whichever is greater. Other of the funds we own have different formulas which produce comparable dividend rates. The assets of closed-end funds, which are valued on a daily basis, serve as the collateral for issuance of the AMPS. The AMPS must meet certain specified asset coverage tests, which include a requirement set forth under the Investment Company Act of 1940 that closed-end funds maintain asset coverage of at least 200% with respect to the AMPS and any other outstanding senior securities; i.e. closed-end funds must have at least $2 of collateral for every $1 of AMPS issued. If the funds don’t meet the asset coverage tests, then the fund must redeem them. All the $35.2 million of securities held by J & J is AAA rated. The collateral held by the funds are generally municipal securities or common and preferred stock of public corporations. Presently, we are unable to sell the AMPS and we do not believe the auction process for AMPS will be reestablished in the near term, if ever. However, on August 21, 2008, Merrill Lynch announced a plan to purchase, at par, AMPS held by J & J and other of its clients. Under this plan, we can sell our AMPS to Merrill Lynch at anytime between January 2, 2009 and January 15, 2010. Additionally, issuers of many of the closed-end funds who have issued AMPS have made public announcements of their intent to work toward redeeming the securities and a portion of the type of security we own have been redeemed by the issuers since the auction process failed. Considering this, the Merrill Lynch plan, and that the AMPS are collateralized and continue to pay dividends, we have not recorded an impairment. We will continue to assess the need to record an impairment on a quarterly basis. Redemption of our AMPS subsequent to the failure of the auction process was $10,000,000, our carrying value, in the year ended September 27, 2008. Subsequent to September 27, 2008 and prior to the filing of this Form 10-K, approximately $14,000,000 of our AMPS have been redeemed at our carrying value and are therefore classified as current assets on our September 27, 2008 balance sheet. Proceeds from the sale and redemption of AMPS were $16,500,000 and $78,882,000 in the periods ended September 27, 2008, and September 29, 2007, respectively, with no gain or loss recorded. We use the specific identification method to determine the cost of securities sold. J & J SNACK FOODS CORP. AND SUBSIDIARIES NOTES TO CONSOLIDATED FINANCIAL STATEMENTS (Continued)
NOTE D — INVENTORIES
Inventories consist of the following: | | | September 27, | | | September 29, | | | | | 2008 | | | 2007 | | | | | (in thousands) | | | Finished goods | | $ | 23,512 | | | $ | 23,207 | | | Raw materials | | | 7,658 | | | | 6,703 | | | Packaging materials | | | 5,405 | | | | 4,833 | | | Equipment parts and other | | | 12,520 | | | | 11,856 | | | | | $ | 49,095 | | | $ | 46,599 | |
Inventory is presented net of an allowance for obsolescence of $3,817,000 and $2,864,000 as of fiscal year ends 2008 and 2007, respectively. NOTE E — PROPERTY, PLANT AND EQUIPMENT Property, plant and equipment consist of the following: | | | September 27, | | | September 29, | | | Estimated | | | | | 2008 | | | 2007 | | | Useful Lives | | | | | (in thousands) | | | Land | | $ | 1,416 | | | $ | 1,316 | | | | — | | | Buildings | | | 8,672 | | | | 7,751 | | | 15-39.5 years | | | Plant machinery and equipment | | | 124,591 | | | | 117,468 | | | 5-20 years | | | Marketing equipment | | | 195,878 | | | | 191,778 | | | 5-7 years | | | Transportation equipment | | | 2,878 | | | | 2,810 | | | 5 years | | | Office equipment | | | 10,820 | | | | 10,020 | | | 3-5 years | | | Improvements | | | 17,694 | | | | 17,556 | | | 5-20 years | | | Construction in progress | | | 2,215 | | | | 4,130 | | | | — | | | | | $ | 364,164 | | | $ | 352,829 | | | | | |
J & J SNACK FOODS CORP. AND SUBSIDIARIES NOTES TO CONSOLIDATED FINANCIAL STATEMENTS (Continued) NOTE F — GOODWILL AND INTANGIBLE ASSETS Our four reporting units, which are also reportable segments, are Food Service, Retail Supermarket, The Restaurant Group and Frozen Beverages. The carrying amount of acquired intangible assets for the reportable segments are as follows: | | | September 27, 2008 | | | September 29, 2007 | | | | | Gross Carrying Amount | | | Accumulated Amortization | | | Gross Carrying Amount | | | Accumulated Amortization | | | | | (in thousands) | | | Food Service | | | | | | | | | | | | | | Indefinite lived intangible assets | | | | | | | | | | | | | | Trade Names | | $ | 8,180 | | | $ | — | | | $ | 8,180 | | | $ | — | | | | | | | | | | | | | | | | | | | | | Amortized intangible assets | | | | | | | | | | | | | | | | | | Non compete agreements | | | 435 | | | | 215 | | | | 435 | | | | 133 | | | Customer relationships | | | 33,287 | | | | 8,087 | | | | 33,287 | | | | 4,472 | | | Licenses and rights | | | 3,606 | | | | 1,835 | | | | 3,606 | | | | 1,609 | | | | | $ | 45,508 | | | $ | 10,137 | | | $ | 45,508 | | | $ | 6,214 | | | Retail Supermarket | | | | | | | | | | | | | | | | | | Indefinite lived intangible assets | | | | | | | | | | | | | | | | | | Trade Names | | $ | 2,731 | | | $ | — | | | $ | 2,731 | | | $ | — | | | | | | | | | | | | | | | | | | | | | The Restaurant Group | | | | | | | | | | | | | | | | | | | | | | | | | | | | | | | | | | | | Amortized intangible assets | | | | | | | | | | | | | | | | | | Licenses and rights | | $ | — | | | $ | — | | | $ | — | | | $ | — | | | | | | | | | | | | | | | | | | | | | Frozen Beverages | | | | | | | | | | | | | | | | | | Indefinite lived intangible assets | | | | | | | | | | | | | | | | | | Trade Names | | $ | 9,315 | | | $ | — | | | $ | 9,315 | | | $ | — | | | | | | | | | | | | | | | | | | | | | Amortized intangible assets | | | | | | | | | | | | | | | | | | Non compete agreements | | | 148 | | | | 99 | | | | 148 | | | | 56 | | | Customer relationships | | | 6,478 | | | | 1,548 | | | | 6,478 | | | | 884 | | | Licenses and rights | | | 1,601 | | | | 364 | | | | 1,601 | | | | 294 | | | | | $ | 17,542 | | | $ | 2,011 | | | $ | 17,542 | | | $ | 1,234 | |
The gross carrying amount of intangible assets is determined by applying a discounted cash flow model to the future sales and earnings associated with each intangible asset or is set by contract cost. The amortization period used for definite lived intangible assets is set by contract period or by the period over which the bulk of the discounted cash flow is expected to be generated. We currently believe that we will receive the benefit from the use of the trade names classified as indefinite lived intangible assets indefinitely and they are therefore not amortized. Licenses and rights are being amortized by the straight-line method over periods ranging from 3 to 20 years and amortization expense is reflected throughout operating expenses. In January 2006, intangible assets of $1,746,000 were acquired in the ICEE of Hawaii acquisition and a product license agreement for $100,000 was entered into by the food service segment. In May 2006, intangible assets of $15,188,000 were acquired in the SLUSH PUPPIE acquisition. J & J SNACK FOODS CORP. AND SUBSIDIARIES NOTES TO CONSOLIDATED FINANCIAL STATEMENTS (Continued) NOTE F — GOODWILL AND INTANGIBLE ASSETS (Continued) In January 2007, intangible assets of $23,771,000 and $12,799,000 were acquired in the Hom/Ade Foods and DADDY RAY’S acquisitions, respectively. In April 2007, intangible assets of $2,731,000 were acquired in the WHOLE FRUIT and FRUIT-A-FREEZE acquisitions and $413,000 was acquired in the Kansas ICEE acquisition in June 2007. Aggregate amortization expense of intangible assets for the fiscal years 2008, 2007 and 2006 was $4,700,000, $3,974,000 and $1,408,000. Estimated amortization expense for the next five fiscal years is approximately $4,500,000 in 2009 and 2010, $4,100,000 in 2011, $3,800,000 in 2012 and $3,700,000 in 2013. The weighted average amortization period of the intangible assets is 10.3 years. Goodwill The carrying amounts of goodwill for the reportable segments are as follows: | | | Food Service | | | Retail Supermarkets | | | Restaurant Group | | | Frozen Beverages | | | Total | | | | | (in thousands) | | | Balance at September 27, 2008 | | $ | 23,988 | | | $ | — | | | $ | 386 | | | $ | 35,940 | | | $ | 60,314 | | | Balance at September 29, 2007 | | $ | 23,988 | | | $ | — | | | $ | 386 | | | $ | 35,940 | | | $ | 60,314 | |
Goodwill of $839,000 in the food service segment was acquired in an August 2006 acquisition. Goodwill of $500,000 in the frozen beverages segment was acquired in the January 2006 acquisition of ICEE of Hawaii. Goodwill of $2,987,000 in the frozen beverages segment was acquired in the May 2006 acquisition of the SLUSH PUPPIE branded business. Goodwill of $1,763,000 was acquired in the January 2007 acquisitions of Hom/Ade Foods and DADDY RAY’S and $603,000 was acquired in the June 2007 Kansas ICEE acquisition. The carrying value of goodwill is determined based on the excess of the purchase price of acquisitions over the estimated fair value of tangible and intangible net assets. Goodwill is not amortized but is evaluated annually by management for impairment. There were no impairment charges in 2008, 2007 or 2006. NOTE G — LONG-TERM DEBT In December 2006, we entered into an amended and restated loan agreement with our existing banks which provides for up to a $50,000,000 revolving credit facility repayable in December 2011, with the availability of repayments without penalty. The agreement contains restrictive covenants and requires commitment fees in accordance with standard banking practice. As of September 27, 2008 and September 29, 2007, there were no outstanding balances under the facility. NOTE H — OBLIGATIONS UNDER CAPITAL LEASES Obligations under capital leases consist of the following: | | | September 27, | | | September 29, | | | | | 2008 | | | 2007 | | | | | (in thousands) | | | Capital lease obligations, with interest at 2.6%, payable in monthly installments of $8,700, through August 2013 | | $ | 474 | | | $ | 565 | | | Less current portion | | | 93 | | | | 91 | | | | | $ | 381 | | | $ | 474 | |
J & J SNACK FOODS CORP. AND SUBSIDIARIES NOTES TO CONSOLIDATED FINANCIAL STATEMENTS (Continued) NOTE I — INCOME TAXES Income tax expense (benefit) is as follows: | | | Fiscal year ended | | | | | September 27, | | | September 29, | | | September 30, | | | | | 2008 | | | 2007 | | | 2006 | | | | | (in thousands) | | | Current | | | | | | | | | | | U.S. Federal | | $ | 11,417 | | | $ | 15,485 | | | $ | 15,982 | | | Foreign | | | 844 | | | | 423 | | | | 233 | | | State | | | 2,270 | | | | 2,581 | | | | 2,503 | | | | | | 14,531 | | | | 18,489 | | | | 18,718 | | | | | | | | | | | | | | | | | Deferred | | | | | | | | | | | | | | U.S. Federal | | | 2,983 | | | | 474 | | | | (82 | ) | | Foreign | | | (168 | ) | | | — | | | | — | | | State | | | 631 | | | | 83 | | | | (14 | ) | | | | | 3,446 | | | | 557 | | | | (96 | ) | | | | $ | 17,977 | | | $ | 19,046 | | | $ | 18,622 | |
The provisions for income taxes differ from the amounts computed by applying the statutory federal income tax rate of approximately 35% to earnings before income taxes for the following reasons: | | | Fiscal year ended | | | | | September 27, | | | September 29, | | | September 30, | | | | | 2008 | | | 2007 | | | 2006 | | | | | (in thousands) | | | Income taxes at statutory rates | | $ | 16,059 | | | $ | 17,905 | | | $ | 16,825 | | | Increase (decrease) in taxes resulting from: | | | | | | | | | | | | | | State income taxes, net of federal income tax benefit | | | 1,918 | | | | 1,819 | | | | 1,663 | | | Other, net | | | — | | | | (678 | ) | | | 134 | | | | | $ | 17,977 | | | $ | 19,046 | | | $ | 18,622 | |
Deferred tax assets and liabilities consist of the following: | | | September 27, | | | September 29, | | | September 30, | | | | | 2008 | | | 2007 | | | 2006 | | | | | (in thousands) | | | Deferred tax assets | | | | | | | | | | | | | | Vacation accrual | | $ | 1,117 | | | $ | 975 | | | $ | 908 | | | Insurance accrual | | | 2,634 | | | | 2,795 | | | | 2,883 | | | Deferred income | | | 105 | | | | 103 | | | | 138 | | | Allowances | | | 1,865 | | | | 1,573 | | | | 1,326 | | | Inventory capitalization | | | 519 | | | | 459 | | | | 479 | | | Share-based compensation | | | 896 | | | | 597 | | | | 71 | | | Other, net | | | 104 | | | | 177 | | | | 371 | | | | | | 7,240 | | | | 6,679 | | | | 6,176 | | | | | | | | | | | | | | | | | Deferred tax liabilities | | | | | | | | | | | | | | Amortization of goodwill and other intangible assets | | | 11,899 | | | | 10,087 | | | | 8,758 | | | Depreciation of property and equipment | | | 14,818 | | | | 12,614 | | | | 12,874 | | | Other, net | | | 24 | | | | 33 | | | | 42 | | | | | | 26,741 | | | | 22,734 | | | | 21,674 | | | | | $ | 19,501 | | | $ | 16,055 | | | $ | 15,498 | |
J & J SNACK FOODS CORP. AND SUBSIDIARIES NOTES TO CONSOLIDATED FINANCIAL STATEMENTS (Continued) NOTE J — COMMITMENTS 1. Lease Commitments The following is a summary of approximate future minimum rental commitments for non-cancelable operating leases with terms of more than one year as of September 27, 2008: | | | Plants and Offices | | | Equipment | | | Total | | | | | (in thousands) | | | 2009 | | $ | 5,216 | | | $ | 4,500 | | | $ | 9,716 | | | 2010 | | | 4,517 | | | | 3,331 | | | | 7,848 | | | 2011 | | | 3,590 | | | | 2,688 | | | | 6,278 | | | 2012 | | | 2,871 | | | | 1,272 | | | | 4,143 | | | 2013 | | | 2,375 | | | | 50 | | | | 2,425 | | | 2014 and thereafter | | | 7,462 | | | | — | | | | 7,462 | | | | | $ | 26,031 | | | $ | 11,841 | | | $ | 37,872 | |
Total rent expense was $12,907,000, $13,803,000 and $13,418,000 for fiscal years 2008, 2007 and 2006, respectively. 2. Other Commitments We are a party to litigation which has arisen in the normal course of business which management currently believes will not have a material adverse effect on our financial condition or results of operations. We self-insure, up to loss limits, certain insurable risks such as worker’s compensation and automobile liability claims. Accruals for claims under our self-insurance program are recorded on a claims incurred basis. Our total recorded liability for all years’ claims incurred but not yet paid was $6,400,000 and $6,800,000 at September 27, 2008 and September 29, 2007, respectively In connection with the self-insurance agreements, we customarily enter into letters of credit arrangements with our insurers. At September 27, 2008 and September 29, 2007, we had outstanding letters of credit totaling $9,475,000 and $9,595,000, respectively. NOTE K — CAPITAL STOCK In our 2008 fiscal year ended September 27, 2008, we purchased and retired 135,124 shares of our common stock at a cost of $3,539,000 under a million share buyback authorization approved by the Company’s Board of Directors in February 2008. The Company did not repurchase any of its common stock in fiscal years 2007 and 2006. Subsequent to September 27, 2008 and prior to the filing of this Form 10-K, we purchased and retired 400,000 shares of our comon stock at a purchase price of $27.90 per share from Gerald B. Shreiber, Chairman of the Board, President, Chief Executive Officer and Director of the Company. NOTE L — STOCK OPTIONS We have a Stock Option Plan (the “Plan”). Pursuant to the Plan, stock options may be granted to officers and our key employees which qualify as incentive stock options as well as stock options which are nonqualified. The exercise price of incentive stock options is at least the fair market value of the common stock on the date of grant. The exercise price for nonqualified options is determined by a committee of the Board of Directors. The options are generally exercisable after three years and expire no later than ten years from date of grant. There were 1,400,000 shares reserved under the Plan; options for 667,000 shares remain unissued as of September 27, 2008. There are options that were issued under an option plan that has since expired that are still outstanding. We have an Employee Stock Purchase Plan (“ESPP”) whereby employees purchase stock by making contributions through payroll deductions for six month periods. The purchase price of the stock is 85% of the lower of the market price of the stock at the beginning of the six-month period or the end of the six-month period. In fiscal years 2008, 2007 and 2006 employees purchased 31,366, 23,140 and 23,205 shares at average purchase prices of $24.93, $30.22 and $23.95, respectively. ESPP expense of $137,000, $146,000 and $165,000 was recognized for fiscal years 2008, 2007 and 2006, respectively. J & J SNACK FOODS CORP. AND SUBSIDIARIES NOTES TO CONSOLIDATED FINANCIAL STATEMENTS (Continued) NOTE L — STOCK OPTIONS (Continued) A summary of the status of our stock option plans as of fiscal years 2008, 2007 and 2006 and the changes during the years ended on those dates is represented below: | | | Incentive Stock Options | | | Nonqualified Stock Options | | | | | Stock Options Outstanding | | | Weighted- Average Exercise Price | | | Stock Options Outstanding | | | Weighted- Average Exercise Price | | | Balance, September 25, 2005 | | | 749,488 | | | | 15.28 | | | | 520,354 | | | | 11.04 | | | Granted | | | 135,671 | | | | 29.73 | | | | 40,000 | | | | 30.44 | | | Exercised | | | (111,224 | ) | | | 13.75 | | | | (68,000 | ) | | | 6.13 | | | Cancelled | | | (44,000 | ) | | | 19.70 | | | | — | | | | | | | | | | | | | | | | | | | | | | | | | Balance, September 30, 2006 | | | 729,935 | | | | 17.93 | | | | 492,354 | | | | 13.30 | | | Granted | | | 114,700 | | | | 41.45 | | | | 35,000 | | | | 36.49 | | | Exercised | | | (151,130 | ) | | | 17.45 | | | | (68,000 | ) | | | 6.19 | | | Cancelled | | | (20,100 | ) | | | 23.70 | | | | — | | | | | | | | | | | | | | | | | | | | | | | | | Balance, September 29, 2007 | | | 673,405 | | | | 21.87 | | | | 459,354 | | | | 16.12 | | | Granted | | | 96,345 | | | | 33.22 | | | | 20,000 | | | | 34.17 | | | Exercised | | | (111,768 | ) | | | 16.57 | | | | (77,000 | ) | | | 9.66 | | | Cancelled | | | (44,150 | ) | | | 26.36 | | | | (5,000 | ) | | | 38.54 | | | | | | | | | | | | | | | | | | | | | Balance, September 27, 2008 | | | 613,832 | | | $ | 24.29 | | | | 397,354 | | | $ | 18.00 | | | Exercisable Options, September 27, 2008 | | | 303,366 | | | | | | | | 307,354 | | | | | |
The weighted-average fair value of incentive options granted during fiscal years ended September 24, 2005,27, 2008, September 25, 200429, 2007 and September 30, 2006 was $7.99, $11.98 and $9.48, respectively. The weighted-average fair value of nonqualified stock options granted during the fiscal years ended September 27, 2003 | | | F-7 | | | | | | | Notes2008, September 29, 2007 and September 30, 2006 was $15.21, $14.29 and $14.79, respectively. The total instrinsic value of stock options exercised was $3.2 million, $5.4 million and $3.8 million in fiscal years 2008, 2007 and 2006, respectively.The following table summarizes information about incentive stock options outstanding at September 27, 2008: | | | Options Outstanding | | | Options Exercisable | | | Range of Exercise Prices | | Number Outstanding at September 27, 2008 | | Weighted- Average Remaining Contractual Life | | Weighted- Average Exercise Price | | | Number Exercisable at September 27, 2008 | | | Weighted- Average Exercise Price | | | $6.38 – $7.94 | | | 69,000 | | 2.0 years | | $ | 6.51 | | | | 69,000 | | | $ | 6.51 | | | $10.60 – $10.60 | | | 112,632 | | 2.8 years | | $ | 10.60 | | | | 112,632 | | | $ | 10.60 | | | $19.39 – $27.45 | | | 122,234 | | 1.0 years | | $ | 20.68 | | | | 121,734 | | | $ | 20.65 | | | $29.28 – $41.60 | | | 309,966 | | 3.2 years | | $ | 34.65 | | | | — | | | $ | — | | | | | | 613,832 | | | | | | | | | 303,366 | | | | | |
The following table summarizes information about nonqualified stock options outstanding at September 27, 2008: | | | Options Outstanding | | | Options Exercisable | | | Range of Exercise Prices | | Number Outstanding at September 27, 2008 | | Weighted- Average Remaining Contractual Life | | Weighted- Average Exercise Price | | | Number Exercisable at September 27, 2008 | | | Weighted- Average Exercise Price | | | $7.97 – $10.88 | | | 195,000 | | 1.6 years | | $ | 9.71 | | | | 195,000 | | | $ | 9.71 | | | $19.77 – $27.42 | | | 112,354 | | 3.4 years | | $ | 20.22 | | | | 112,354 | | | $ | 20.22 | | | | | 90,000 | | 8.0 years | | $ | 33.17 | | | | — | | | $ | — | | | | | | 397,354 | | | | | | | | | 307,354 | | | | | |
NOTE M — 401(k) PROFIT-SHARING PLAN We maintain a 401(k) profit-sharing plan for our employees. Under this plan, we may make discretionary profit-sharing and matching 401(k) contributions. Contributions of $1,411,000, $1,333,000 and $1,219,000 were made in fiscal years 2008, 2007 and 2006, respectively. NOTE N — CASH FLOW INFORMATION The following is supplemental cash flow information: | | | Fiscal year ended | | | | | September 27, | | | September 29, | | | September 30, | | | | | 2008 | | | 2007 | | | 2006 | | | | | (in thousands) | | | Cash paid for: | | | | | | | | | | | | | | | $ | 21 | | | $ | 6 | | | $ | 4 | | | Income taxes | | | 13,896 | | | | 17,753 | | | | 17,465 | | | | | | | | | | | | | | | | | Non cash items: | | | | | | | | | | | | | | Capital leases | | $ | — | | | $ | 580 | | | $ | — | |
NOTE O — SEGMENT REPORTING We principally sell our products to Consolidated Financial Statements | | | F-8 | | | | | | | Financial Statement Schedule:
| | | | | | | | | | Reportthe food service and retail supermarket industries. We also distribute our products directly to the consumer through our chain of Independent Registered Public Accounting Firm | | | S-1 | | | | | | | Schedule II — Valuationretail stores referred to as The Restaurant Group. Sales and Qualifying Accounts | | | S-2 | |
Back to Contents
REPORT OF INDEPENDENT REGISTERED PUBLIC ACCOUNTING FIRM
Shareholders and
Board of Directors
J&J Snack Foods Corporation and Subsidiaries
We have audited the accompanying consolidated balance sheets of J&J Snack Foods Corp. and Subsidiaries as of September 24, 2005 and September 25, 2004, and the related consolidated statements of earnings, stockholders’ equity, and cash flows for each of the fiscal years in the three-year period ended September 24, 2005 (52 weeks, 52 weeks, and 52 weeks, respectively). We have also audited management’s assessment, included in the accompanying Form 10-K, that J&J Snack Foods Corp. and Subsidiaries maintained effective internal control over financial reporting as of September 24, 2005, based on criteria established in Internal Control—Integrated Framework issued by the Committee of Sponsoring Organizations of the Treadway Commission (COSO). J & J Snack Foods Corp. and Subsidiaries’s management is responsible for these financial statements, for maintaining effective internal control over financial reporting, and for its assessment of the effectiveness of internal control over financial reporting. Our responsibility is to express an opinion on these financial statements, an opinion on management’s assessment, and an opinion on the effectiveness of the company’s internal control over financial reporting based on our audits.
results of our frozen beverages business are monitored separately from the balance of our food service business and restaurant group because of different distribution and capital requirements. We maintain separate and discrete financial information for the four operating segments mentioned above which is available to our Chief Operating Decision Makers. We have applied no aggregate criteria to any of these operating segments in order to determine reportable segments.We conducted our audits in accordance with the standards of the Public Company Accounting Oversight Board (United States). Those standards require that we plan and perform the audits to obtain reasonable assurance about whether the financial statements are free of material misstatement and whether effective internal control over financial reporting was maintained in all material respects. Our audit of the financial statements included examining, on a test basis, evidence supporting the amounts and disclosures in the financial statements, assessing the accounting principles used and significant estimates made by management, and evaluating the overall financial statement presentation.
Our audit of internal control included obtaining an understanding of internal control over financial reporting, evaluating management’s assessment, testing and evaluating the design and operating effectiveness of internal control, and performing such other procedures as we considered necessary in the circumstances. We believe that our audits provide a reasonable basis for our opinions.
A company’s internal control over financial reporting is a process designed to provide reasonable assurance regarding the reliability of financial reporting and the preparation of financial statements for external purposes in accordance with generally accepted accounting principles. A company’s internal control over financial reporting includes those policies and procedures that (1) pertain to the maintenance of records that, in reasonable detail, accurately and fairly reflect the transactions and dispositions of the assets of the company; (2) provide reasonable assurance that transactions are recorded as necessary to permit preparation of financial statements in accordance with generally accepted accounting principles, and that receipts and expenditures of the company are being made only in accordance with authorizations of management and directors of the company; and (3) provide reasonable assurance regarding prevention or timely detection of unauthorized acquisition, use, or disposition of the company’s assets that could have a material effect on the financial statements.
Because of its inherent limitations, internal control over financial reporting may not prevent or detect misstatements. Also, projections of any evaluation of effectiveness to future periods are subject to the risk that controls may become inadequate because of changes in conditions, or that the degree of compliance with the policies or procedures may deteriorate.
In our opinion, the financial statements referred to above present fairly, in all material respects, the consolidated financial position of J & J Snack Foods Corp. and Subsidiaries as of September 24, 2005 and September 25, 2004, and the consolidated results of its operations and its consolidated cash flows for each of the fiscal years in the three-year period ended September 24, 2005 (52 weeks, 52 weeks and 52 weeks) in conformity with accounting principles generally accepted in the United States of America. Also in our opinion, management’s assessment that J & J Snack Foods Corp. and Subsidiaries maintained effective internal control over financial reporting as of September 24, 2005, is fairly stated, in all material respects, based on criteria established in Internal Control—Integrated Framework issued by the Committee of
Back to Contents
Sponsoring Organizations of the Treadway Commission (COSO). Furthermore, in our opinion, J&J Snack Foods Corporation and Subsidiaries maintained, in all material respects, effective internal control over financial reporting as of September 24, 2005, based on criteria established in Internal Control—Integrated Framework issued by the Committee of Sponsoring Organizations of the Treadway Commission (COSO).
/s/ GRANT THORNTON LLP
Philadelphia, Pennsylvania
November 9, 2005
(except for Note Q, to
which the date is
November 21, 2005)
Back to Contents
J & J SNACK FOODS CORP. AND SUBSIDIARIES
CONSOLIDATED BALANCE SHEETS
| | | September 24, | | September 25, | | | | | 2005 | | 2004 | | | | |
|
| |
|
| | | | | (in thousands, except share amounts) | | Assets | | | | | | | | | Current Assets | | | | | | | | | Cash and cash equivalents | | $ | 15,795 | | $ | 19,600 | | | Marketable securities available for sale | | | 54,225 | | | 36,500 | | | Receivables | | | | | | | | | Trade, less allowances of $1,054 and $1,104, respectively | | | 46,261 | | | 47,753 | | | Other | | | 660 | | | 233 | | | Inventories | | | 33,684 | | | 29,587 | | | Prepaid expenses and other | | | 1,215 | | | 1,354 | | | Deferred Income Taxes | | | 2,393 | | | 3,385 | | | | |
|
| |
|
| | | Total current assets | | | 154,233 | | | 138,412 | | | | | | | | | | | | Property, Plant and Equipment, at cost | | | 326,143 | | | 314,880 | | | Less accumulated depreciation and amortization | | | 237,098 | | | 225,406 | | | | |
|
| |
|
| | | | | | 89,045 | | | 89,474 | | Other Assets | | | | | | | | | Goodwill | | | 53,622 | | | 46,477 | | | Other intangible assets, net | | | 7,043 | | | 1,804 | | | Other | | | 1,981 | | | 1,257 | | | | |
|
| |
|
| | | | | | 62,646 | | | 49,538 | | | | |
|
| |
|
| | | | | $ | 305,924 | | $ | 277,424 | | | | |
|
| |
|
| | Liabilities and Stockholders’ Equity | | | | | | | | | Current Liabilities | | | | | | | | | Accounts payable | | $ | 37,029 | | $ | 34,497 | | | Accrued liabilities | | | 14,731 | | | 13,149 | | | Dividends payable | | | 1,142 | | | — | | | | |
|
| |
|
| | | Total current liabilities | | | 52,902 | | | 47,646 | | | | | | | | | | | | Deferred Income Taxes | | | 17,987 | | | 19,153 | | | Other long-term liabilities | | | 273 | | | 529 | | | | | | | | | | | Stockholders’ Equity | | | | | | | | | Preferred stock, $1 par value; authorized, 5,000,000 shares; none issued | | | — | | | — | | | Common stock, no par value; authorized, 25,000,000 shares; issued and outstanding, 9,136,000 and 9,006,000 respectively | | | 36,091 | | | 33,069 | | | Accumulated other comprehensive loss | | | (1,918 | ) | | (2,061 | ) | | Retained earnings | | | 200,589 | | | 179,088 | | | | |
|
| |
|
| | | | | | 234,762 | | | 210,096 | | | | |
|
| |
|
| | | | | $ | 305,924 | | $ | 277,424 | | | | |
|
| |
|
| |
The accompanying notes are an integral part of these statements.
Back to Contents
J & J SNACK FOODS CORP. AND SUBSIDIARIES
CONSOLIDATED STATEMENTS OF EARNINGS
| | | Fiscal year ended | | | | |
| | | | | | | | September 24, | | September 25, | | September 27, | | | | | 2005 | | 2004 | | 2003 | | | | | (52 weeks) | | (52 weeks) | | (52 weeks) | | | | |
|
| |
|
| |
|
| | | | | (in thousands, except per share information) | | | | | | | | | | | | | | | Net Sales | | $ | 457,112 | | $ | 416,588 | | $ | 364,567 | | | Cost of goods sold | | | 302,065 | | | 276,379 | | | 239,722 | | | | |
|
| |
|
| |
|
| | | Gross profit | | | 155,047 | | | 140,209 | | | 124,845 | | | | |
|
| |
|
| |
|
| | | Operating expenses | | | | | | | | | | | | Marketing | | | 57,197 | | | 54,585 | | | 51,492 | | | Distribution | | | 39,589 | | | 33,574 | | | 27,705 | | | Administrative | | | 17,582 | | | 16,829 | | | 15,185 | | | Other general expense (income) | | | 430 | | | 29 | | | (384 | ) | | | |
|
| |
|
| |
|
| | | | | | 114,798 | | | 105,017 | | | 93,998 | | | | |
|
| |
|
| |
|
| | | Operating income | | | 40,249 | | | 35,192 | | | 30,847 | | | | |
|
| |
|
| |
|
| | | Other income (expenses) | | | | | | | | | | | | Investment income | | | 1,689 | | | 566 | | | 362 | | | Interest expense and other | | | (136 | ) | | (113 | ) | | (113 | ) | | | |
|
| |
|
| |
|
| | | | | | 1,553 | | | 453 | | | 249 | | | | |
|
| |
|
| |
|
| | | Earnings before income taxes | | | 41,802 | | | 35,645 | | | 31,096 | | | Income taxes | | | 15,759 | | | 12,935 | | | 11,194 | | | | |
|
| |
|
| |
|
| | | NET EARNINGS | | $ | 26,043 | | $ | 22,710 | | $ | 19,902 | | | | |
|
| |
|
| |
|
| | | Earnings per diluted share | | $ | 2.80 | | $ | 2.48 | | $ | 2.20 | | | | |
|
| |
|
| |
|
| | | Weighted average number of diluted shares | | | 9,300 | | | 9,143 | | | 9,051 | | | | |
|
| |
|
| |
|
| | | Earnings per basic share | | $ | 2.86 | | $ | 2.55 | | $ | 2.26 | | | | |
|
| |
|
| |
|
| | | Weighted average number of basic shares | | | 9,097 | | | 8,909 | | | 8,800 | | | | |
|
| |
|
| |
|
| |
The accompanying notes are an integral part of these statements.
Back to Contents
J & J SNACK FOODS CORP. AND SUBSIDIARIES
CONSOLIDATED STATEMENT OF CHANGES IN STOCKHOLDERS’ EQUITY
(in thousands)
| | | Common Stock
| | Accumulated
Other
Comprehensive | | Retained | | | | Comprehensive | | | | | Shares | | Amount | | Loss | | Earnings | | Total | | Income | | | | |
|
| |
|
| |
|
| |
|
| |
|
| |
|
| | | Balance at September 29, 2002 | | | 8,903 | | $ | 34,025 | | $ | (1,792 | ) | $ | 136,476 | | $ | 168,709 | | | | | | Issuance of common stock upon exercise of stock options | | | 139 | | | 2,342 | | | — | | | — | | | 2,342 | | | | | | Issuance of common stock for employee stock purchase plan | | | 12 | | | 341 | | | — | | | — | | | 341 | | | | | | Foreign currency translation adjustment | | | — | | | — | | | (165 | ) | | — | | | (165 | ) | $ | (165 | ) | | Repurchase of common stock | | | (297 | ) | | (8,565 | ) | | — | | | — | | | (8,565 | ) | | | | | Net earnings | | | — | | | — | | | — | | | 19,902 | | | 19,902 | | | 19,902 | | | | | | | | | | | | | | | | | | | |
| | | Comprehensive income | | | — | | | — | | | — | | | — | | | — | | $ | 19,737 | | | | |
| |
| |
| |
| |
| |
| | | Balance at September 27, 2003 | | | 8,757 | | $ | 28,143 | | $ | (1,957 | ) | $ | 156,378 | | $ | 182,564 | | | | | | Issuance of common stock upon exercise of stock options | | | 236 | | | 4,553 | | | — | | | — | | | 4,553 | | | | | | Issuance of common stock for employee stock purchase plan | | | 13 | | | 373 | | | — | | | — | | | 373 | | | | | | Foreign currency translation adjustment | | | — | | | — | | | (104 | ) | | — | | | (104 | ) | $ | (104 | ) | | Net earnings | | | — | | | — | | | — | | | 22,710 | | | 22,710 | | | 22,710 | | | | | | | | | | | | | | | | | | | |
| | | Comprehensive income | | | — | | | — | | | — | | | — | | | — | | $ | 22,606 | | | | |
| |
| |
| |
| |
| |
| | | Balance at September 25, 2004 | | | 9,006 | | $ | 33,069 | | $ | (2,061 | ) | $ | 179,088 | | $ | 210,096 | | | | | | Issuance of common stock upon exercise of stock options | | | 118 | | | 2,577 | | | — | | | — | | | 2,577 | | | | | | Issuance of common stock for employee stock purchase plan | | | 12 | | | 445 | | | — | | | — | | | 445 | | | | | | Foreign currency translation adjustment | | | — | | | — | | | 143 | | | — | | | 143 | | $ | 143 | | | Dividends declared | | | — | | | — | | | — | | | (4,542 | ) | | (4,542 | ) | | | | | Net earnings | | | — | | | — | | | — | | | 26,043 | | | 26,043 | | | 26,043 | | | | | | | | | | | | | | | | | | | |
| | | Comprehensive income | | | — | | | — | | | — | | | — | | | — | | $ | 26,186 | | | | |
| |
| |
| |
| |
| |
| | | Balance at September 24, 2005 | | | 9,136 | | $ | 36,091 | | $ | (1,918 | ) | $ | 200,589 | | $ | 234,762 | | | | | | | |
| |
| |
| |
| |
| | | | |
The accompanying notes are an integral part of these statements.
Back to Contents
J & J SNACK FOODS CORP. AND SUBSIDIARIES
CONSOLIDATED STATEMENTS OF CASH FLOWS
(in thousands)
| | | Fiscal year ended | | | | |
| | | | | | | | September 24, | | September 25, | | September 27, | | | | | 2005 | | 2004 | | 2003 | | | | | (52 weeks) | | (52 weeks) | | (52 weeks) | | | | |
|
| |
|
| |
|
| | Operating activities: | | | | | | | | | | | | Net earnings | | $ | 26,043 | | $ | 22,710 | | $ | 19,902 | | | Adjustments to reconcile net earnings to net cash provided by operating activities: | | | | | | | | | | | | Depreciation and amortization of fixed assets | | | 23,215 | | | 23,170 | | | 24,234 | | | Amortization of intangibles and deferred costs | | | 1,047 | | | 898 | | | 729 | | | Losses (gains) from disposals and write-downs of property & equipment | | | 150 | | | (33 | ) | | (389 | ) | | Deferred income taxes | | | (174 | ) | | 2,394 | | | 2,568 | | | Changes in assets and liabilities, net of effects from purchase of companies: | | | | | | | | | | | | Decrease (increase) in accounts receivable | | | 1,048 | | | (6,887 | ) | | (285 | ) | | Increase in inventories | | | (3,465 | ) | | (2,423 | ) | | (829 | ) | | Decrease (increase) in prepaid expenses and other | | | 139 | | | 83 | | | (276 | ) | | Increase in accounts payable and accrued liabilities | | | 4,641 | | | 7,232 | | | 711 | | | | |
|
| |
|
| |
|
| | | Net cash provided by operating activities | | | 52,644 | | | 47,144 | | | 46,365 | | | | |
|
| |
|
| |
|
| | Investing activities: | | | | | | | | | | | | Purchases of property, plant and equipment | | | (21,632 | ) | | (21,644 | ) | | (19,127 | ) | | Payments for purchase of companies | | | (16,088 | ) | | (12,668 | ) | | — | | | Proceeds from investments held to maturity | | | — | | | 275 | | | 400 | | | Purchase of marketable securities | | | (31,725 | ) | | (45,500 | ) | | — | | | Proceeds from sales of marketable securities | | | 14,000 | | | 9,000 | | | — | | | Proceeds from disposal of property and equipment | | | 819 | | | 1,628 | | | 2,534 | | | Other | | | (807 | ) | | (35 | ) | | (144 | ) | | | |
|
| |
|
| |
|
| | | Net cash used in investing activities | | | (55,433 | ) | | (68,944 | ) | | (16,337 | ) | | | |
|
| |
|
| |
|
| | Financing activities: | | | | | | | | | | | | Proceeds from issuance of common stock | | | 2,241 | | | 3,810 | | | 2,238 | | | Payments to repurchase common stock | | | — | | | — | | | (8,565 | ) | | Payments of cash dividend | | | (3,400 | ) | | — | | | — | | | | |
|
| |
|
| |
|
| | | Net cash (used in) provided by financing activities | | | (1,159 | ) | | 3,810 | | | (6,327 | ) | | | |
|
| |
|
| |
|
| | | Effect of exchange rate on cash and cash equivalents | | | 143 | | | (104 | ) | | (165 | ) | | | |
|
| |
|
| |
|
| | | Net (decrease) increase in cash and cash equivalents | | | (3,805 | ) | | (18,094 | ) | | 23,536 | | | Cash and cash equivalents at beginning of year | | | 19,600 | | | 37,694 | | | 14,158 | | | | |
|
| |
|
| |
|
| | | Cash and cash equivalents at end of year | | $ | 15,795 | | $ | 19,600 | | $ | 37,694 | | | | |
|
| |
|
| |
|
| |
The accompanying notes are an integral part of these statements.
F-7
Back to Contents
J & J SNACK FOODS CORP. AND SUBSIDIARIES
NOTES TO CONSOLIDATED FINANCIAL STATEMENTS
NOTE A — SUMMARY OF SIGNIFICANT ACCOUNTING POLICIES
J & J Snack Foods Corp. and Subsidiaries (the Company) manufactures, markets and distributes a variety of nutritional snack foods and beverages to the food service and retail supermarket industries. A summary of the significant accounting policies consistently applied in the preparation of the accompanying consolidated financial statements follows.
1. | Principles of Consolidation
|
The consolidated financial statements include the accounts of J & J Snack Foods Corp. and its wholly-owned subsidiaries. Intercompany balances and transactions have been eliminated in the consolidated financial statements.
We recognize revenue from Food Service, Retail Supermarkets, The Restaurant Group and Frozen Beverage products at the time the products are shipped to third parties. When we perform services under service contracts for frozen beverage dispenser machines, revenue is recognized upon the completion of the services on specified machines. We provide an allowance for doubtful receivables after taking into consideration historical experience and other factors.
We follow EITF Issue 00-10, “Accounting for Shipping and Handling Fees and Costs” (Issue 00-10). Issue 00-10 requires that all amounts billed to customers related to shipping and handling should be classified as revenues. Our product costs include amounts for shipping and handling, therefore, we charge our customers shipping and handling fees at the time the products are shipped or when services are performed. The cost of shipping products to the customer is recognized at the time the products are shipped to the customer and our policy is to classify them as Distribution expenses. The cost of shipping products to the customer classified as Distribution expenses was $39,589,000, $33,574,000 and $27,705,000 for the fiscal years ended 2005, 2004 and 2003, respectively.
Staff Accounting Bulletin No. 101, Revenue Recognition in Financial Statements (SAB 101) and Staff Accounting Bulletin No. 104, Revenue Recognition, corrected copy (SAB 104) address certain criteria for revenue recognition. SAB 101 and SAB 104 outline the criteria that must be met to recognize revenue and provides guidance for disclosures related to revenue recognition policies. Our revenue recognition policies comply with the guidance contained in SAB’s 101 and 104.
We also sell service contracts covering frozen beverage machines sold. The terms of coverage range between 12 and 60 months. We record deferred income on service contracts which is amortized by the straight-line method over the term of the contracts.
During the years ended September 24, 2005, September 25, 2004 and September 27, 2003, we sold $5,506,000, $3,225,000 and $2,561,000, respectively, of service contracts related to our frozen beverage machines. At September 24, 2005 and September 25, 2004, deferred income on service contracts was $1,631,000 and $1,853,000, respectively, of which $273,000 and $529,000 is included in other long-term liabilities as of September 24, 2005 and September 25, 2004, respectively and the balance is reflected as short-term and included in accrued liabilities on the consolidated balance sheet. Service contract income of $5,728,000, $3,156,000 and $2,122,000 was recognized for the fiscal years ended 2005, 2004 and 2003, respectively.
Assets and liabilities in foreign currencies are translated into U.S. dollars at the rate of exchange prevailing at the balance sheet date. Revenues and expenses are translated at the average rate of exchange for the period. The cumulative translation adjustment is recorded as a separate component of stockholders’ equity and changes to such are included in comprehensive income.
Back to Contents
J & J SNACK FOODS CORP. AND SUBSIDIARIES
NOTES TO CONSOLIDATED FINANCIAL STATEMENTS — (Continued)
NOTE A — SUMMARY OF SIGNIFICANT ACCOUNTING POLICIES — (Continued)
In preparing financial statements in conformity with accounting principles generally accepted in the United States of America, management is required to make estimates and assumptions that affect the reported amounts of assets and liabilities, the disclosure of contingent assets and liabilities at the date of the financial statements, and the reported amounts of revenues and expenses during the reporting period. Actual results could differ from those estimates.
Cash equivalents are short-term, highly liquid investments with original maturities of three months or less.
6. | Concentrations of Credit Risk and Accounts Receivable
|
We maintain cash balances at financial institutions located in various states. Accounts at each institution are insured by the Federal Deposit Insurance Corporation up to $100,000. We periodically maintain cash balances in excess of these insurance limits.
Other financial instruments that could potentially subject us to concentrations of credit risk are trade accounts receivable; however, such risks are limited due to the large number of customers comprising our customer base and their dispersion across geographic regions. We usually have 2 to 3 customers with accounts receivable balances of between $1,500,000 to $4,000,000.
The majority of our accounts receivable are due from trade customers. Credit is extended based on evaluation of our customers’ financial condition and collateral is not required. Accounts receivable payment terms vary and are stated in the financial statements at amounts due from customers net of an allowance for doubtful accounts. Accounts outstanding longer than the payment terms are considered past due. We determine our allowance by considering a number of factors, including the length of time trade accounts receivable are past due, our previous loss history, customers’ current ability to pay their obligations to us, and the condition of the general economy and the industry as a whole. We write off accounts receivable when they become uncollectible, and payments subsequently received on such receivables are credited to the allowance for doubtful accounts.
Inventories are valued at the lower of cost (determined by the first-in, first-out method) or market.
In December 2004, the FASB issued Statement 151, “Inventory Costs, an amendment of ARB No. 43, Chapter 4”.
Statement 151 retains the general principle of ARB 43, Chapter 4, “Inventory Pricing (AC Section I78)”, that inventories are presumed to be stated at cost; however, it amends ARB 43 to clarify that
abnormal amounts of idle facilities, freight, handling costs, and spoilage should be recognized as charges of the current period
| | | | • | allocation of fixed production overheads to inventories should be based on the normal capacity of the production facilities. |
Statement 151 defines normal capacity as the production expected to be achieved over a number of periods or seasons under normal circumstances, taking into account the loss of capacity resulting from planned maintenance. The Board concluded that normal capacity refers to a range of production levels that will vary based on business- and industry-specific factors. Accordingly, an entity will have to use judgment to determine when production is outside the range of expected variation in production (either abnormally low or abnormally high). In periods of abnormally low production (for example, periods in which there is
Back to Contents
J & J SNACK FOODS CORP. AND SUBSIDIARIES
NOTES TO CONSOLIDATED FINANCIAL STATEMENTS — (Continued)
NOTE A — SUMMARY OF SIGNIFICANT ACCOUNTING POLICIES — (Continued)
significantly lower demand, labor and material shortages exist, or there is unplanned equipment downtime) the amount of fixed overhead allocated to each unit of production should not be increased. However, in periods of abnormally high production the amount of fixed overhead allocated to each unit of production is decreased to assure inventories are not measured above cost.
The guidance in Statement 151 is effective for inventory costs during fiscal years beginning after June 15, 2005 and should be applied prospectively. Since we essentially follow the guidelines of Statement 151, we do not anticipate the adoption to have a material impact on our financial statements.
We account for our investment securities in accordance with SFAS No. 115, “Accounting for Certain Investments in Debt and Equity Securities.” This standard requires investments in securities to be classified in one of three categories: held-to-maturity, trading, or available-for-sale. Our investment portfolio consists solely of investments classified as available for sale and are accounted for as such in accordance with SFAS No. 115.
9. | Depreciation and Amortization
|
Depreciation of equipment and buildings is provided for by the straight-line method over the assets’ estimated useful lives. Amortization of improvements is provided for by the straight- line method over the term of the lease or the assets’ estimated useful lives, whichever is shorter. Licenses and rights arising from acquisitions are amortized by the straight-line method over periods ranging from 4 to 20 years.
We follow SFAS No. 144, “Accounting for the Impairment or Disposal of Long-Lived Assets,” (SFAS No. 144). SFAS No. 144 supersedes SFAS No. 121, “Accounting for the Impairment of Long-Lived Assets and for Long-Lived Assets to be Disposed of,” but it retains many of the fundamental provisions of that Statement. No such material asset impairment issues existed in 2005 or 2004.
10. | Fair Value of Financial Instruments
|
The carrying value of our short-term financial instruments, such as accounts receivables and accounts payable, approximate their fair values, based on the short-term maturities of these instruments.
We account for our income taxes under the liability method. Under the liability method, deferred tax assets and liabilities are determined based on the difference between the financial statement and tax bases of assets and liabilities as measured by the enacted tax rates that will be in effect when these differences reverse. Deferred tax expense is the result of changes in deferred tax assets and liabilities.
12. | Earnings Per Common Share
|
We follow SFAS No. 128, “Earnings Per Share” (EPS). Basic EPS excludes dilution and is computed by dividing income available to common shareholders by the weighted average common shares outstanding during the period. Diluted EPS takes into consideration the potential dilution that could occur if securities (stock options) or other contracts to issue common stock were exercised and converted into common stock.
Back to Contents
J & J SNACK FOODS CORP. AND SUBSIDIARIES
NOTES TO CONSOLIDATED FINANCIAL STATEMENTS — (Continued)
NOTE A — SUMMARY OF SIGNIFICANT ACCOUNTING POLICIES — (Continued)
The Company’s calculation of EPS is as follows:
| | | Fiscal Year Ended September 24, 2005 | | | | |
| | | | | Income | | Shares | | Per Share | | | | | (Numerator) | | (Denominator) | | Amount | | | | |
|
| |
|
| |
|
| | | | | (in thousands, except per share amounts) | | Earnings Per Basic Share | | | | | | | | | | | | Net Income available to common stockholders | | $ | 26,043 | | | 9,097 | | $ | 2.86 | | | | | | | | | | | | | | Effect of Dilutive Securities | | | | | | | | | | | | Options | | | — | | | 203 | | | (.06 | ) | | | |
|
| |
|
| |
|
| | | | | | | | | | | | | | Earnings Per Diluted Share | | | | | | | | | | | | Net Income available to common stockholders plus assumed conversions | | $ | 26,043 | | | 9,300 | | $ | 2.80 | | | | |
|
| |
|
| |
|
| |
| | | Fiscal Year Ended September 25, 2004 | | | | |
| | | | | Income | | Shares | | Per Share | | | | | (Numerator) | | (Denominator) | | Amount | | | | |
|
| |
|
| |
|
| | | | | (in thousands, except per share amounts) | | Earnings Per Basic Share | | | | | | | | | | | | Net Income available to common stockholders | | $ | 22,710 | | | 8,909 | | $ | 2.55 | | | | | | | | | | | | | | Effect of Dilutive Securities | | | | | | | | | | | | Options | | | — | | | 234 | | | (.07 | ) | | | |
|
| |
|
| |
|
| | | | | | | | | | | | | | Earnings Per Diluted Share | | | | | | | | | | | | Net Income available to common stockholders plus assumed conversions | | $ | 22,710 | | | 9,143 | | $ | 2.48 | | | | |
|
| |
|
| |
|
| |
1,700 anti-dilutive shares have been excluded in the computation of 2004 diluted EPS because the options’ exercise price is greater than the average market price of the common stock.
| | | Fiscal Year Ended September 27, 2003 | | | | |
| | | | | Income | | Shares | | Per Share | | | | | (Numerator) | | (Denominator) | | Amount | | | | |
|
| |
|
| |
|
| | | | | (in thousands, except per share amounts) | | Earnings Per Basic Share | | | | | | | | | | | | Net Income available to common stockholders | | $ | 19,902 | | | 8,800 | | $ | 2.26 | | | | | | | | | | | | | | Effect of Dilutive Securities | | | | | | | | | | | | Options | | | — | | | 251 | | | (.06 | ) | | | |
|
| |
|
| |
|
| | | | | | | | | | | | | | Earnings Per Diluted Share | | | | | | | | | | | | Net Income available to common stockholders plus assumed conversions | | $ | 19,902 | | | 9,051 | | $ | 2.20 | | | | |
|
| |
|
| |
|
| |
168,394 anti-dilutive shares have been excluded in the computation of 2003 diluted EPS because the options’ exercise price is greater than the average market price of the common stock.
Shares in the EPS calculations have not been adjusted for the 2-for-1 stock split described in Note Q, which will become effective on December 15, 2005.
Back to Contents
J & J SNACK FOODS CORP. AND SUBSIDIARIES
NOTES TO CONSOLIDATED FINANCIAL STATEMENTS — (Continued)
NOTE A — SUMMARY OF SIGNIFICANT ACCOUNTING POLICIES — (Continued)
13. | Accounting for Stock-Based Compensation
|
In December 2004, the FASB issued Statement No. 123 (revised 2004), Share-Based Payment. Statement 123(R) requires that the compensation cost relating to share-based payment transactions be recognized in financial statements. That cost will be measured based on the fair value of the equity or liability instruments issued.
This statement is effective as of the first annual reporting period that begins after June 15, 2005. As a result, we will be required to adopt Statement 123(R) on September 25, 2005. Statement 123(R) covers a wide range of share-based compensation arrangements including share options, restricted share plans, performance-based awards, share appreciation rights, and employee share purchase plans.
In addition to the accounting standard that sets forth the financial reporting objectives and related accounting principles, Statement 123(R) includes an appendix of implementation guidance that provides expanded guidance on measuring the fair value of share-based payment awards.
Statement 123(R) replaces FASB Statement No. 123, Accounting for Stock-Based Compensation, and supersedes APB Opinion No. 25, Accounting for Stock Issued to Employees. Statement 123, as originally issued in 1995, established as preferable a fair-value-based method of accounting for share-based payment transactions with employees. However, that Statement permitted entities the option of continuing to apply the guidance in Opinion 25, as long as the footnotes to financial statements disclosed what net income would have been had the preferable fair-value-based method been used. We will implement this new standard in the first quarter of our fiscal year 2006. If we had adopted the fair value provisions of FASB Statement No. 123, the effect on the net earnings of our fiscal years ended in September 2005, 2004 and 2003 would have been as follows:
| | | Fiscal year ended | | | | |
| | | | | September 24 | | September 25, | | September 27, | | | | | 2005 | | 2004 | | 2003 | | | | | (52 weeks) | | (52 weeks) | | (52 weeks) | | | | |
|
| |
|
| |
|
| | | Net income, as reported | | $ | 26,043 | | $ | 22,710 | | $ | 19,902 | | | | | | | | | | | | | | | Less: stock-based compensation costs determined under fair value based method for all awards, net of tax | | | 1,127 | | | 1,135 | | | 1,189 | | | | |
|
| |
|
| |
|
| | | Net income, pro forma | | $ | 24,916 | | $ | 21,575 | | $ | 18,713 | | | | |
|
| |
|
| |
|
| | | Earnings per share of common stock — basic: | | | | | | | | | | | | As reported | | $ | 2.86 | | $ | 2.55 | | $ | 2.26 | | | Pro forma | | $ | 2.74 | | $ | 2.42 | | $ | 2.13 | | | | | | | | | | | | | | | Earnings per share of common stock — diluted: | | | | | | | | | | | | As reported | | $ | 2.80 | | $ | 2.48 | | $ | 2.20 | | | Pro forma | | $ | 2.68 | | $ | 2.36 | | $ | 2.07 | |
The fair value of these options is estimated on the date of grant using the Black-Scholes option pricing model with the following weighted-average assumptions for grants in fiscal 2005, 2004 and 2003, respectively; expected volatility of 27.9% for fiscal year 2005, 30.7% for year 2004 and 43% for year 2003; weighted average risk-free interest rates of 3.82%, 3.27% and 3.07%; and expected lives ranging between 5 and 10 years for all years. Although we declared cash dividends in fiscal year 2005, including such in the calculation of the value of the options is not material.
Back to Contents
J & J SNACK FOODS CORP. AND SUBSIDIARIES
NOTES TO CONSOLIDATED FINANCIAL STATEMENTS — (Continued)
NOTE A — SUMMARY OF SIGNIFICANT ACCOUNTING POLICIES — (Continued)
Advertising costs are expensed as incurred. Total advertising expense was $1,617,000, $1,772,000, and $2,119,000 for the fiscal years 2005, 2004 and 2003, respectively.
15. | Commodity Price Risk Management
|
Our most significant raw material requirements include flour, shortening, corn syrup, chocolate, and macadamia nuts. We attempt to minimize the effect of future price fluctuations related to the purchase of raw materials primarily through forward purchasing to cover future manufacturing requirements, generally for periods from 1 to 24 months. As of September 24, 2005, we have approximately $16,000,000 of such commitments. Futures contracts are not used in combination with forward purchasing of these raw materials. Our procurement practices are intended to reduce the risk of future price increases, but also may potentially limit the ability to benefit from possible price decreases.
16. | Research and Development Costs
|
Research and development costs are expensed as incurred. Total research and development expense was $574,000, $365,000 and $289,000 for the fiscal years 2005, 2004 and 2003, respectively.
Certain prior year financial statement amounts have been reclassified to be consistent with the presentation for the current year.
NOTE B — ACQUISITIONS
In January 2004, we acquired the assets of Country Home Bakers, Inc. Country Home Bakers, Inc., with its manufacturing facility in Atlanta, Georgia, manufactures and distributes bakery products to the food service and supermarket industries. Its product line includes cookies, biscuits, and frozen doughs sold under the names READI-BAKE, COUNTRY HOME and private labels sold through supermarket in-store bakeries.
On March 17, 2005, we acquired all of the assets of Snackworks LLC, d/b/a Bavarian Brothers, a manufacturer of soft pretzels headquartered in Rancho Cucamonga, California for $14.7 million plus approximately $600,000 for inventory. Snackworks operates production facilities in California and Chambersburg, Pennsylvania and markets its products under the brand names SERIOUSLY TWISTED!, BAVARIAN BROTHERS and CINNAPRETZEL. Snackworks sells throughout the continental United States primarily to mass merchandisers and theatres. Annual sales are approximately $11 million. The breakout of the purchase price is as follows:
| | | | (in thousands) | | | | | | | | | Property, plant and equipment | | $ | 1,600 | | | Inventory | | | 604 | | | Trade names | | | 1,690 | | | Customer relationships | | | 4,290 | | | Covenant not to compete | | | 100 | | | Goodwill | | | 7,145 | | | | |
|
| | | | | $ | 15,429 | | | | |
|
| |
We acquired the assets of other entities during 2005, the impact of which is immaterial.
Back to Contents
J & J SNACK FOODS CORP. AND SUBSIDIARIES
NOTES TO CONSOLIDATED FINANCIAL STATEMENTS — (Continued)
NOTE B — ACQUISITIONS — (Continued)
These acquisitions were accounted for under the purchase method of accounting, and its operations are included in the consolidated financial statement from the acquisition date.
NOTE C — INVESTMENT SECURITIES
The amortized cost, unrealized gains and losses, and fair market values of our investment securities available for sale at September 24, 2005 are summarized as follows:
| | | | | Gross | | Gross | | Fair | | | | | Amortized | | Unrealized | | Unrealized | | Market | | | | | Cost | | Gains | | Losses | | Value | | | | |
|
| |
|
| |
|
| |
|
| | | | | (in thousands) | | | Available for Sale Securities | | | | | | | | | | | | | | | Equity Securities | | $ | 49,225 | | $ | — | | $ | — | | $ | 49,225 | | | Municipal Government Securities | | | 5,000 | | | — | | | — | | | 5,000 | | | | |
|
| |
|
| |
|
| |
|
| | | | | $ | 54,225 | | $ | — | | $ | — | | $ | 54,225 | | | | |
|
| |
|
| |
|
| |
|
| |
The amortized cost, unrealized gains and losses, and fair market values of the Company’s investment securities available for sale at September 25, 2004 are summarized as follows:
| | | | | Gross | | Gross | | Fair | | | | | Amortized | | Unrealized | | Unrealized | | Market | | | | | Cost | | Gains | | Losses | | Value | | | | |
|
| |
|
| |
|
| |
|
| | | | | (in thousands) | | | Available for Sale Securities | | | | | | | | | | | | | | | Equity Securities | | $ | 36,500 | | $ | — | | $ | — | | | $36,500 | | | | |
|
| |
|
| |
|
| |
|
| |
Because of the short term nature of our investment securities held at September 24, 2005 and September 25, 2004, they do not fluctuate from par.
Proceeds from the sale of marketable securities were $14,000,000 and $9,000,000 in the periods ended September 24, 2005, and September 25, 2004, respectively, with no gain or loss recorded. We use the specific identification method to determine the cost of securities sold.
NOTE D — INVENTORIES
Inventories consist of the following:
| | | September 24, | | September 25, | | | | | 2005 | | 2004 | | | | |
|
| |
|
| | | | | (in thousands) | | | Finished goods | | $ | 16,016 | | $ | 13,691 | | | Raw materials | | | 4,935 | | | 4,556 | | | Packaging materials | | | 3,485 | | | 2,984 | | | Equipment parts and other | | | 9,248 | | | 8,356 | | | | |
|
| |
|
| | | | | $ | 33,684 | | $ | 29,587 | | | | |
|
| |
|
| |
Inventory is presented net of an allowance for obsolescence of $1,922,000 and $1,131,000 as of fiscal year ends 2005 and 2004, respectively.
Back to Contents
J & J SNACK FOODS CORP. AND SUBSIDIARIES
NOTES TO CONSOLIDATED FINANCIAL STATEMENTS — (Continued)
NOTE E — PROPERTY, PLANT AND EQUIPMENT
Property, plant and equipment consist of the following:
| | | September 24, | | September 25, | | Estimated | | | | | 2005 | | 2004 | | Useful Lives | | | | |
|
| |
|
| |
|
| | | | | (in thousands) | | | Land | | $ | 556 | | $ | 556 | | | — | | | Buildings | | | 4,497 | | | 4,497 | | | 15-39.5 years | | | Plant machinery and equipment | | | 105,815 | | | 100,442 | | | 5-10 years | | | Marketing equipment | | | 188,601 | | | 182,136 | | | 5 years | | | Transportation equipment | | | 1,271 | | | 1,037 | | | 5 years | | | Office equipment | | | 8,966 | | | 8,411 | | | 3-5 years | | | Improvements | | | 15,083 | | | 15,070 | | | 5-20 years | | | Construction in progress | | | 1,354 | | | 2,731 | | | — | | | | |
| |
| | | | | | | | $ | 326,143 | | $ | 314,880 | | | | | | | |
| |
| | | | |
NOTE F — GOODWILL AND INTANGIBLE ASSETS
Our four reporting units, which are also reportable segments, are Food Service, Retail Supermarket, The Restaurant Group and Frozen Beverages.
The carrying amount of acquired intangible assets for the reportable segments are as follows:
| | | September 24, 2005 | | September 25, 2004 | | | | |
| |
| | | | | Gross | | | | Gross | | | | | | | | Carrying | | Accumulated | | Carrying | | Accumulated | | | | | Amount | | Amortization | | Amount | | Amortization | | | | |
|
| |
|
| |
|
| |
|
| | | | | (in thousands) | | | Food Service | | | | | | | | | | | | | | | | | | | | | | | | | | | | | | Amortized intangible assets Licenses and rights | | $ | 8,913 | | $ | 1,906 | | $ | 3,082 | | $ | 1,333 | | | | |
|
| |
|
| |
|
| |
|
| | | Retail Supermarket | | | | | | | | | | | | | | | | | | | | | | | | | | | | | | Amortized intangible assets Licenses and rights | | $ | — | | $ | — | | $ | — | | $ | — | | | | |
|
| |
|
| |
|
| |
|
| | | The Restaurant Group | | | | | | | | | | | | | | | | | | | | | | | | | | | | | | Amortized intangible assets Licenses and rights | | $ | — | | $ | — | | $ | — | | $ | — | | | | |
|
| |
|
| |
|
| |
|
| | | Frozen Beverages | | | | | | | | | | | | | | | | | | | | | | | | | | | | | | Amortized intangible assets Licenses and rights | | $ | 201 | | $ | 165 | | $ | 201 | | $ | 146 | | | | |
|
| |
|
| |
|
| |
|
| |
Licenses and rights are being amortized by the straight-line method over periods ranging from 4 to 20 years and amortization expense is reflected throughout operating expenses. In fiscal year 2004, intangible assets of $1,016,000 were acquired in the Country Home Bakers acquisition. In fiscal year 2005, intangible assets of $6,080,000 were acquired in the Snackworks acquisition. Aggregate amortization expense of intangible assets for the fiscal years 2005, 2004 and 2003 was $822,000, $443,000 and $308,000.
Estimated amortization expense for the next five fiscal years is approximately $1,200,000 in 2006 and 2007, $1,100,000 in 2008, and $900,000 in 2009 and 2010. The weighted average amortization period of the intangible assets is 10.5 years.
Back to Contents
J & J SNACK FOODS CORP. AND SUBSIDIARIES
NOTES TO CONSOLIDATED FINANCIAL STATEMENTS — (Continued)
NOTE F — GOODWILL AND INTANGIBLE ASSETS — (Continued)
Goodwill
The carrying amounts of goodwill for the reportable segments are as follows:
| | | Food | | Retail | | Restaurant | | Frozen | | | �� | | | | | Service | | Supermarkets | | Group | | Beverages | | Total | | | | |
|
| |
|
| |
|
| |
|
| |
|
| | | | | (in thousands) | | | Balance at September 24, 2005 | | $ | 21,386 | | $ | — | | $ | 386 | | $ | 31,850 | | $ | 53,622 | | | | |
|
| |
|
| |
|
| |
|
| |
|
| | | Balance at September 25, 2004 | | $ | 14,241 | | $ | — | | $ | 386 | | $ | 31,850 | | $ | 46,477 | | | | |
|
| |
|
| |
|
| |
|
| |
|
| |
Goodwill of $7,145,000 in the food service segment was acquired in the March 2005 acquisition of Snackworks, LLC.
NOTE G — ACCRUED LIABILITIES
Included in accrued liabilities is accrued compensation of $7,636,000 and $6,934,000 as of September 24, 2005 and September 25, 2004, respectively.
NOTE H — LONG-TERM DEBT
Our general-purpose bank credit line agreement provides for a $50,000,000 revolving credit facility repayable in December 2006, with the availability of repayments without penalty. The agreement contains restrictive covenants and requires commitment fees in accordance with standard banking practice. As of September 24, 2005 and September 25, 2004, there were no outstanding balances under this facility.
We self-insure, up to loss limits, certain insurable risks such as worker’s compensation and automobile liability claims. Accruals for claims under our self-insurance program are recorded on a claims-incurred basis. Under this program, the estimated liability for claims incurred but unpaid in fiscal years 2005 and 2004 was $2,700,000 and $2,400,000, respectively. In connection with certain self-insurance agreements, we customarily enter into letters of credit arrangements with our insurers. At September 24, 2005 and September 25, 2004, we had outstanding letters of credit totaling approximately $7,700,000 and $6,900,000, respectively.
NOTE I — INCOME TAXES
Income tax expense is as follows:
| | | Fiscal year ended | | | | |
| | | | | September 24, | | September 25, | | September 27, | | | | | 2005 | | 2004 | | 2003 | | | | |
|
| |
|
| |
|
| | | | | (in thousands) | | | Current | | | | | | | | | | | | U.S. Federal | | $ | 13,932 | | $ | 9,441 | | $ | 7,790 | | | Foreign | | | 210 | | | 140 | | | 66 | | | State | | | 1,791 | | | 960 | | | 770 | | | | |
|
| |
|
| |
|
| | | | | | 15,933 | | | 10,541 | | | 8,626 | | | | |
|
| |
|
| |
|
| | | Deferred | | | | | | | | | | | | U.S. Federal | | | (153 | ) | | 2,200 | | | 2,360 | | | State | | | (21 | ) | | 194 | | | 208 | | | | |
|
| |
|
| |
|
| | | | | | (174 | ) | | 2,394 | | | 2,568 | | | | |
|
| |
|
| |
|
| | | | | $ | 15,759 | | $ | 12,935 | | $ | 11,194 | | | | |
|
| |
|
| |
|
| |
Back to Contents
J & J SNACK FOODS CORP. AND SUBSIDIARIES
NOTES TO CONSOLIDATED FINANCIAL STATEMENTS — (Continued)
NOTE I — INCOME TAXES — (Continued)
The provisions for income taxes differ from the amounts computed by applying the statutory federal income tax rate of approximately 35% to earnings before income taxes for the following reasons:
| | | Fiscal year ended | | | | |
| | | | | September 24, | | September 25, | | September 27, | | | | | 2005 | | 2004 | | 2003 | | | | |
|
| |
|
| |
|
| | | | | (in thousands) | | | Income taxes at statutory rates | | $ | 14,631 | | $ | 12,283 | | $ | 10,649 | | | Increase (decrease) in taxes resulting from: | | | | | | | | | | | | State income taxes, net of federal income tax benefit | | | 1,170 | | | 725 | | | 636 | | | Other, net | | | (42 | ) | | (73 | ) | | (91 | ) | | | |
|
| |
|
| |
|
| | | | | $ | 15,759 | | $ | 12,935 | | $ | 11,194 | | | | |
|
| |
|
| |
|
| |
Deferred tax assets and liabilities consist of the following:
| | | September 24, | | September 25, | | | | | 2005 | | 2004 | | | | |
|
| |
|
| | | | | (in thousands) | | | Deferred tax assets | | | | | | | | | Vacation accrual | | $ | 831 | | $ | 651 | | | Insurance accrual | | | 2,624 | | | 1,254 | | | Deferred income | | | 225 | | | 349 | | | Allowances | | | 1,181 | | | 801 | | | Other, net | | | 666 | | | 574 | | | | |
|
| |
|
| | | | | | 5,527 | | | 3,629 | | | | |
|
| |
|
| | | Deferred tax liabilities | | | | | | | | | Depreciation of property and equipment | | | 21,071 | | | 19,340 | | | Other, net | | | 50 | | | 57 | | | | |
|
| |
|
| | | | | | 21,121 | | | 19,397 | | | | |
|
| |
|
| | | | | $ | 15,594 | | $ | 15,768 | | | | |
|
| |
|
| |
NOTE J — COMMITMENTS
The following is a summary of approximate future minimum rental commitments for non-cancelable operating leases with terms of more than one year as of September 24, 2005:
| | | Plants and | | | | | | | | | | | Offices | | Equipment | | Total | | | | |
|
| |
|
| |
|
| | | | | (in thousands) | | | 2006 | | $ | 4,880 | | $ | 4,646 | | $ | 9,526 | | | 2007 | | | 4,269 | | | 3,975 | | | 8,244 | | | 2008 | | | 3,670 | | | 2,895 | | | 6,565 | | | 2009 | | | 3,301 | | | 1,575 | | | 4,876 | | | 2010 and thereafter | | | 11,520 | | | 237 | | | 11,757 | | | | |
|
| |
|
| |
|
| | | | | $ | 27,640 | | $ | 13,328 | | $ | 40,968 | | | | |
|
| |
|
| |
|
| |
Total rent expense was $11,516,000, $11,220,000 and $9,991,000 for fiscal years 2005, 2004 and 2003, respectively.
Back to Contents
J & J SNACK FOODS CORP. AND SUBSIDIARIES
NOTES TO CONSOLIDATED FINANCIAL STATEMENTS — (Continued)
NOTE J — COMMITMENTS — (Continued)
We are a party to litigation which management currently believes will not have a material adverse effect on our financial condition or results of operations.
We self-insure, up to loss limits, certain insurable risks such as worker’s compensation and automobile liability claims. Accruals for claims under our self-insurance program are recorded on a claim-incurred basis. Under this program, the estimated liability for claims incurred but unpaid in fiscal years 2005 and 2004 was $2,700,000 and $2,400,000, respectively. In connection with certain self-insurance agreements, we customarily enter into letters of credit arrangements with our insurers. At September 24, 2005 and September 25, 2004, we had outstanding letters of credit totaling approximately $7,700,000 and $6,900,000, respectively.
NOTE K — CAPITAL STOCK
In fiscal year 2003, we purchased and retired 297,000 shares of our common stock at a cost of $8,565,000.
NOTE L — STOCK OPTIONS
We have a Stock Option Plan (the “Plan”). Pursuant to the Plan, stock options may be granted to officers and our key employees which qualify as incentive stock options as well as stock options which are nonqualified. The exercise price of incentive stock options is at least the fair market value of the common stock on the date of grant. The exercise price for nonqualified options is determined by a committee of the Board of Directors. The options are generally exercisable after three years and expire no later than ten years from date of grant. There were 400,000 shares reserved under the Plan; options for 197,000 shares remain unissued as of September 24, 2005. There are options that were issued under an option plan that has since expired that are still outstanding.
We have an Employee Stock Purchase Plan (“ESPP”) whereby employees purchase stock by making contributions through payroll deductions for six month periods. The purchase price of the stock is 85% of the lower of the market price of the stock at the beginning of the six month period or the end of the six month period. In fiscal years 2005, 2004 and 2003 employees purchased 11,998, 12,718 and 12,092 shares at average purchase prices of $37.06, $29.32 and $28.32, respectively.
Back to Contents
J & J SNACK FOODS CORP. AND SUBSIDIARIES
NOTES TO CONSOLIDATED FINANCIAL STATEMENTS — (Continued)
NOTE L — STOCK OPTIONS — (Continued)
A summary of the status of our stock option plans as of fiscal years 2005, 2004 and 2003 and the changes during the years ended on those dates is represented below:
| | | Incentive Stock Options | | Nonqualified Stock Options | | | | |
| |
| | | | | | | Weighted- | | | | Weighted- | | | | | Stock | | Average | | Stock | | Average | | | | | Options | | Exercise | | Options | | Exercise | | | | | Outstanding | | Price | | Outstanding | | Price | | | | |
|
| |
|
| |
|
| |
|
| | | Balance, September 29, 2002 | | | 697,191 | | $ | 20.40 | | | 356,000 | | $ | 17.55 | | | Granted | | | 80,000 | | | 33.83 | | | — | | | — | | | Exercised | | | (118,456 | ) | | 16.86 | | | (37,000 | ) | | 13.63 | | | Cancelled | | | (53,106 | ) | | 24.05 | | | — | | | — | | | | |
| | | | |
| | | | | | Balance, September 27, 2003 | | | 605,629 | | | 22.55 | | | 319,000 | | | 18.00 | | | Granted | | | 103,700 | | | 40.08 | | | 10,000 | | | 40.85 | | | Exercised | | | (218,527 | ) | | 18.37 | | | (37,000 | ) | | 11.00 | | | Cancelled | | | (20,249 | ) | | 24.47 | | | — | | | — | | | | |
| | | | |
| | | | | | Balance, September 25, 2004 | | | 470,553 | | | 28.12 | | | 292,000 | | | 19.67 | | | Granted | | | 6,323 | | | 47.30 | | | 12,177 | | | 42.69 | | | Exercised | | | (88,526 | ) | | 18.85 | | | (44,000 | ) | | 11.78 | | | Cancelled | | | (13,606 | ) | | 30.28 | | | — | | | — | | | | |
| | | | |
| | | | | | Balance, September 24, 2005 | | | 374,744 | | $ | 30.55 | | | 260,177 | | $ | 22.08 | | | Exercisable Options, September 24, 2005 | | | 139,182 | | | | | | 238,000 | | | | |
The weighted-average fair value of incentive options granted during fiscal years ended September 24, 2005, September 25, 2004 and September 27, 2003 was $15.89, $14.15 and $15.39, respectively. The weighted-average fair value of nonqualified stock options granted during the fiscal years ended September 24, 2005 and September 25, 2004 were $17.59 and $19.48, respectively.
The following table summarizes information about incentive stock options outstanding at September 24, 2005:
| | | Options Outstanding | | Options Exercisable | | | | |
| |
| | | | | Number | | Weighted- | | | | Number | | | | | | | | Outstanding | | Average | | Weighted- | | Exercisable | | Weighted- | | | | | at | | Remaining | | Average | | at | | Average | | Range of | | September | | Contractual | | Exercise | | September | | Exercise | | Exercise Prices | | 24, 2005 | | Life | | Price | | 24, 2005 | | Price | |
| |
|
| |
|
| |
|
| |
|
| |
|
| | | $12.75 – $15.88 | | | 52,000 | | | 5.0 years | | $ | 12.93 | | | 52,000 | | $ | 12.93 | | | $21.20 – $30.40 | | | 89,182 | | | 5.8 years | | $ | 21.41 | | | 87,182 | | $ | 21.41 | | | $33.25 – $49.88 | | | 231,739 | | | 3.1 years | | $ | 37.84 | | | — | | $ | — | | | $54.84 – $54.84 | | | 1,823 | | | 4.9 years | | $ | 54.84 | | | — | | $ | — | | | | |
| | | | | | | |
| | | | | | | | | 374,744 | | | | | | | | | 139,182 | | | | | | | |
| | | | | | | |
| | | | |
Back to Contents
J & J SNACK FOODS CORP. AND SUBSIDIARIES
NOTES TO CONSOLIDATED FINANCIAL STATEMENTS — (Continued)
NOTE L — STOCK OPTIONS — (Continued)
The following table summarizes information about nonqualified stock options outstanding at September 24, 2005:
| | | Options Outstanding | | Options Exercisable | | | | |
| |
| | | | | Number | | Weighted- | | | | Number | | | | | | | | Outstanding | | Average | | Weighted- | | Exercisable | | Weighted- | | | | | at | | Remaining | | Average | | at | | Average | | Range of | | September | | Contractual | | Exercise | | September | | Exercise | | Exercise Prices | | 24, 2005 | | Life | | Price | | 24, 2005 | | Price | |
| |
|
| |
|
| |
|
| |
|
| |
|
| | | $12.25 – $15.94 | | | 102,000 | | | 2.3 years | | $ | 13.52 | | | 102,000 | | $ | 13.52 | | | $19.25 – $21.75 | | | 102,000 | | | 3.9 years | | $ | 20.53 | | | 102,000 | | $ | 20.53 | | | $39.53 – $54.84 | | | 56,177 | | | 6.4 years | | $ | 40.45 | | | 34,000 | | $ | 39.53 | | | | |
| | | | | | | |
| | | | | | | | | 260,177 | | | | | | | | | 238,000 | | | | | | | |
| | | | | | | |
| | | | |
NOTE M — 401(k) PROFIT-SHARING PLAN
We maintain a 401(k) profit-sharing plan for our employees. Under this plan, we may make discretionary profit-sharing and matching 401(k) contributions. Contributions of $1,243,000, $1,141,000 and $1,071,000 were made in fiscal years 2005, 2004 and 2003, respectively.
NOTE N — CASH FLOW INFORMATION
The following is supplemental cash flow information:
| | | Fiscal Year Ended | | | | |
| | | | | September 24, | | September 25, | | September 27, | | | | | 2005 | | 2004 | | 2003 | | | | |
|
| |
|
| |
|
| | | | | (in thousands) | | | Cash paid for: | | | | | | | | | | | | Interest | | $ | 26 | | $ | — | | $ | 24 | | | Income taxes | | | 14,734 | | | 11,350 | | | 7,321 | |
NOTE O — SEGMENT REPORTING
We principally sell our products to the food service and retail supermarket industries. We also distribute our products directly to the consumer through our chain of retail stores referred to as The Restaurant Group. Sales and results of our frozen beverages business are monitored separately from the balance of our food service business and restaurant group because of different distribution and capital requirements. We maintain separate and discrete financial information for the four operating segments mentioned above which is available to our Chief Operating Decision Makers. We have applied no aggregate criteria to any of these operating segments in order to determine reportable segments. Our four reportable segments are Food Service, Retail Supermarkets, The Restaurant Group and Frozen Beverages. All inter-segment net sales and expenses have been eliminated in computing net sales and operating income (loss). These segments are described below.
The primary products sold to the food service group are soft pretzels, frozen juice treats and desserts, churros and baked goods. Our customers in the food service industry include snack bars and food stands in chain, department and discount stores; malls and shopping centers; fast food outlets; stadiums and sports arenas; leisure and theme parks; convenience stores; movie theatres; warehouse club stores; schools, colleges and other institutions. Within the food service industry, our products are purchased by the consumer primarily for consumption at the point-of-sale.
Back to Contents
J & J SNACK FOODS CORP. AND SUBSIDIARIES
NOTES TO CONSOLIDATED FINANCIAL STATEMENTS — (Continued)
NOTE O — SEGMENT REPORTING — (Continued)
The primary products sold to the retail supermarket industry are soft pretzel products – including SUPERPRETZEL, frozen juice treats and desserts including LUIGI’S Real Italian Ice, MINUTE MAID Juice Bars and Soft Frozen Lemonade, BARQ’S FLOATZ and ICEE Squeeze Up Tubes and TIO PEPE’S Churros. Within the retail supermarket industry, our frozen and prepackaged products are purchased by the consumer for consumption at home.
The Restaurant Group and Frozen Beverages. All inter-segment net sales and expenses have been eliminated in computing net sales and operating income (loss). These segments are described below. |
Food Service The primary products sold by the food service segment are soft pretzels, frozen juice treats and desserts, churros and baked goods. Our customers in the food service segment include snack bars and food stands in chain, department and discount stores; malls and shopping centers; fast food outlets; stadiums and sports arenas; leisure and theme parks; convenience stores; movie theatres; warehouse club stores; schools, colleges and other institutions. Within the food service industry, our products are purchased by the consumer primarily for consumption at the point-of-sale. J & J SNACK FOODS CORP. AND SUBSIDIARIES NOTES TO CONSOLIDATED FINANCIAL STATEMENTS (Continued) NOTE O — SEGMENT REPORTING (Continued) Retail Supermarkets The primary products sold to the retail supermarket industry are soft pretzel products — including SUPERPRETZEL, frozen juice treats and desserts including LUIGI’S Real Italian Ice, MINUTE MAID Juice Bars and Soft Frozen Lemonade, FRUIT-A-FREEZE frozen fruit bars, WHOLE FRUIT Sorbet, BARQ’S FLOATZ and ICEE Squeeze-Up Tubes and TIO PEPE’S Churros. Within the retail supermarket industry, our frozen and prepackaged products are purchased by the consumer for consumption at home. The Restaurant Group We sell direct to the consumer through our Restaurant Group, which operates BAVARIAN PRETZEL BAKERY and PRETZEL GOURMET, our chain of specialty snack food retail outlets. We sell direct to the consumer through our Restaurant Group, which operates BAVARIAN PRETZEL BAKERY and PRETZEL GOURMET, our chain of specialty snack food retail outlets.
We sell frozen beverages to the food service industry, including our restaurant group, primarily under the names ICEE and ARCTIC BLAST in the United States, Mexico and Canada.
We sell frozen beverages to the food service industry, including our restaurant group, primarily under the names ICEE, SLUSH PUPPIE and ARCTIC BLAST in the United States, Mexico and Canada. The Chief Operating Decision Maker for Food Service, Retail Supermarkets and The Restaurant Group and the Chief Operating Decision Maker for Frozen Beverages monthly review and evaluate operating income and sales in order to assess performance and allocate resources to each individual segment. In addition, the Chief Operating Decision Makers review and evaluate depreciation, capital spending and assets of each segment on a quarterly basis to monitor cash flow and asset needs of each segment. Information regarding the operations in these four reportable segments is as follows: | | | Fiscal year ended | | | | | September 27, | | | September 29, | | | September 30, | | | | | 2008 | | | 2007 | | | 2006 | | | | | (in thousands) | | | Sales to external customers: | | | | | | | | | | | | | | Food Service | | $ | 400,194 | | | $ | 355,764 | | | $ | 320,167 | | | Retail Supermarket | | | 57,112 | | | | 52,131 | | | | 46,948 | | | The Restaurant Group | | | 1,635 | | | | 2,766 | | | | 3,897 | | | Frozen Beverages | | | 170,418 | | | | 158,240 | | | | 143,819 | | | | | $ | 629,359 | | | $ | 568,901 | | | $ | 514,831 | | | | | | | | | | | | | | | | | Depreciation and Amortization: | | | | | | | | | | | | | | Food Service | | $ | 16,655 | | | $ | 16,176 | | | $ | 13,992 | | | Retail Supermarket | | | — | | | | — | | | | — | | | The Restaurant Group | | | 54 | | | | 60 | | | | 102 | | | Frozen Beverages | | | 10,761 | | | | 10,772 | | | | 10,514 | | | | | $ | 27,470 | | | $ | 27,008 | | | $ | 24,608 | | | | | | | | | | | | | | | | | Operating Income (Loss): | | | | | | | | | | | | | | Food Service | | $ | 24,784 | | | $ | 33,417 | | | $ | 32,083 | | | Retail Supermarket | | | 4,665 | | | | (2 | ) | | | 1,945 | | | The Restaurant Group | | | (140 | ) | | | 31 | | | | (253 | ) | | Frozen Beverages | | | 14,027 | | | | 15,134 | | | | 11,289 | | | | | $ | 43,336 | | | $ | 48,580 | | | $ | 45,064 | | | | | | | | | | | | | | | | | Capital Expenditures: | | | | | | | | | | | | | | Food Service | | $ | 11,898 | | | $ | 12,755 | | | $ | 11,111 | | | Retail Supermarket | | | — | | | | — | | | | — | | | The Restaurant Group | | | — | | | | 102 | | | | 3 | | | Frozen Beverages | | | 10,883 | | | | 9,908 | | | | 8,625 | | | | | $ | 22,781 | | | $ | 22,765 | | | $ | 19,739 | | | | | | | | | | | | | | | | | Assets: | | | | | | | | | | | | | | Food Service | | $ | 277,481 | | | $ | 252,843 | | | $ | 218,834 | | | Retail Supermarket | | | — | | | | — | | | | — | | | The Restaurant Group | | | 629 | | | | 690 | | | | 838 | | | Frozen Beverages | | | 130,298 | | | | 126,755 | | | | 121,136 | | | | | $ | 408,408 | | | $ | 380,288 | | | $ | 340,808 | |
F-24
Back to Contents
J & J SNACK FOODS CORP. AND SUBSIDIARIES
NOTES TO CONSOLIDATED FINANCIAL STATEMENTS — (Continued)
NOTE O — SEGMENT REPORTING — (Continued)
The Chief Operating Decision Maker for Food Service, Retail Supermarkets and The Restaurant Group and the Chief Operating Decision Maker for Frozen Beverages monthly review and evaluate operating income and sales in order to assess performance and allocate resources to each individual segment. In addition, the Chief Operating Decision Makers review and evaluate depreciation, capital spending and assets of each segment on a quarterly basis to monitor cash flow and asset needs of each segment. Information regarding the operations in these four reportable segments is as follows:
| | | Fiscal year ended | | | | |
| | | | | September 24, | | September 25, | | September 27, | | | | | 2005 | | 2004 | | 2003 | | | | |
|
| |
|
| |
|
| | | | | (in thousands) | | | Sales to external customers: | | | | | | | | | | | | Food Service | | $ | 280,123 | | $ | 250,523 | | $ | 200,528 | | | Retail Supermarket | | | 42,347 | | | 38,843 | | | 39,702 | | | The Restaurant Group | | | 5,409 | | | 7,623 | | | 9,755 | | | Frozen Beverages | | | 129,233 | | | 119,599 | | | 114,582 | | | | |
|
| |
|
| |
|
| | | | | $ | 457,112 | | $ | 416,588 | | $ | 364,567 | | | | |
|
| |
|
| |
|
| | | Depreciation and Amortization: | | | | | | | | | | | | Food Service | | $ | 13,715 | | $ | 13,504 | | $ | 13,098 | | | Retail Supermarket | | | — | | | — | | | — | | | The Restaurant Group | | | 209 | | | 422 | | | 558 | | | Frozen Beverages | | | 10,338 | | | 10,142 | | | 11,307 | | | | |
|
| |
|
| |
|
| | | | | $ | 24,262 | | $ | 24,068 | | $ | 24,963 | | | | |
|
| |
|
| |
|
| | | Operating Income (Loss): | | | | | | | | | | | | Food Service | | $ | 26,401 | | $ | 21,266 | | $ | 17,804 | | | Retail Supermarket | | | 2,918 | | | 2,701 | | | 2,144 | | | The Restaurant Group | | | (314 | ) | | (988 | ) | | (975 | ) | | Frozen Beverages | | | 11,244 | | | 12,213 | | | 11,874 | | | | |
|
| |
|
| |
|
| | | | | $ | 40,249 | | $ | 35,192 | | $ | 30,847 | | | | |
|
| |
|
| |
|
| | | Capital Expenditures: | | | | | | | | | | | | Food Service | | $ | 9,832 | | $ | 9,294 | | $ | 9,929 | | | Retail Supermarket | | | — | | | — | | | — | | | The Restaurant Group | | | 45 | | | 22 | | | 61 | | | Frozen Beverages | | | 11,755 | | | 12,328 | | | 9,137 | | | | |
|
| |
|
| |
|
| | | | | $ | 21,632 | | $ | 21,644 | | $ | 19,127 | | | | |
|
| |
|
| |
|
| | | Assets: | | | | | | | | | | | | Food Service | | $ | 209,734 | | $ | 183,740 | | $ | 153,795 | | | Retail Supermarket | | | — | | | — | | | — | | | The Restaurant Group | | | 1,010 | | | 1,461 | | | 2,192 | | | Frozen Beverages | | | 95,180 | | | 92,223 | | | 83,491 | | | | |
|
| |
|
| |
|
| | | | | $ | 305,924 | | $ | 277,424 | | $ | 239,478 | | | | |
|
| |
|
| |
|
| |
Back to Contents
J & J SNACK FOODS CORP. AND SUBSIDIARIES
NOTES TO CONSOLIDATED FINANCIAL STATEMENTS — (Continued)
NOTE P — QUARTERLY FINANCIAL DATA (UNAUDITED)
| | | Fiscal Year Ended September 24, 2005 | | | | |
| | | | | | | | | | | Net Earnings
Per
Diluted
Share(1) | | | | | | | | | | | | | | | | | Gross
Profit | | Net
Earnings | | | | | | Net Sales | | | | | | | |
|
| |
|
| |
|
| |
|
| | | | | (in thousands, except per share information) | | | 1st Quarter | | $ | 98,521 | | $ | 29,996 | | $ | 2,482 | | $ | .27 | | | 2nd Quarter | | | 99,350 | | | 32,196 | | | 3,790 | | | .41 | | | 3rd Quarter | | | 129,452 | | | 46,275 | | | 9,879 | | | 1.06 | | | 4th Quarter | | | 129,789 | | | 46,580 | | | 9,892 | | | 1.06 | | | | |
|
| |
|
| |
|
| |
|
| | | Total | | $ | 457,112 | | $ | 155,047 | | $ | 26,043 | | $ | 2.80 | | | | |
|
| |
|
| |
|
| |
|
| | | | | | | | | | | | | | | | |
| | | Fiscal Year Ended September 25, 2004 | | | | |
| | | | | | | | | | | Net Earnings | | | | | | | | | | | Per | | | | | | | Gross | | Net | | Diluted | | | | | Net Sales | | Profit | | Earnings | | Share(1) | | | | |
|
| |
|
| |
|
| |
|
| | | | | (in thousands, except per share information) | | | 1st Quarter | | $ | 79,945 | | $ | 24,638 | | $ | 1,825 | | $ | .20 | | | 2nd Quarter | | | 95,214 | | | 30,746 | | | 3,342 | | | .36 | | | 3rd Quarter | | | 118,952 | | | 42,250 | | | 8,705 | | | .95 | | | 4th Quarter | | | 122,477 | | | 42,575 | | | 8,838 | | | .96 | | | | |
|
| |
|
| |
|
| |
|
| | | Total | | $ | 416,588 | | $ | 140,209 | | $ | 22,710 | | $ | 2.47 | | | | |
|
| |
|
| |
|
| |
|
| |
J & J SNACK FOODS CORP. AND SUBSIDIARIES NOTES TO CONSOLIDATED FINANCIAL STATEMENTS (Continued) NOTE P — QUARTERLY FINANCIAL DATA (UNAUDITED) | | | Fiscal Year Ended September 27, 2008 | | | | | Net Sales | | | Gross Profit | | | Net Earnings | | | Net Earnings Per Diluted Share(1) | | | | | (in thousands, except per share information) | | | 1st Quarter | | $ | 130,898 | | | $ | 35,387 | | | $ | 1,897 | | | $ | .10 | | | 2nd Quarter | | | 144,229 | | | | 40,400 | | | | 3,998 | | | | .21 | | | 3rd Quarter | | | 176,839 | | | | 55,752 | | | | 10,820 | | | | .57 | | | 4th Quarter | | | 177,393 | | | | 55,368 | | | | 11,193 | | | | .59 | | | Total | | $ | 629,359 | | | $ | 186,907 | | | $ | 27,908 | | | $ | 1.47 | |
| | | Fiscal Year Ended September 29, 2007 | | | | | Net Sales | | | Gross Profit | | | Net Earnings | | | Net Earnings Per Diluted Share(1) | | | | | (in thousands, except per share information) | | | 1st Quarter | | $ | 114,142 | | | $ | 35,248 | | | $ | 3,805 | | | $ | .20 | | | 2nd Quarter | | | 130,040 | | | | 42,407 | | | | 5,333 | | | | .28 | | | 3rd Quarter | | | 162,510 | | | | 55,658 | | | | 12,497 | | | | .66 | | | 4th Quarter | | | 162,209 | | | | 53,214 | | | | 10,477 | | | | .55 | | | Total | | $ | 568,901 | | | $ | 186,527 | | | $ | 32,112 | | | $ | 1.69 | |
All share amounts reflect the 2-for-1 stock split effective January 5, 2006.
(1) | Total of quarterly amounts do not necessarily agree to the annual report amounts due to separate quarterly calculations of weighted average shares outstanding |
NOTE Q — SUBSEQUENT EVENT
NOTE Q — SUBSEQUENT EVENT Subsequent to September 27, 2008 and prior to the filing of this Form 10-K, we purchased and retired 400,000 shares of our common stock at a purchase price of $27.90 per share from Gerald B. Shreiber, Chairman of the Board, President, Chief Executive Officer and Director of the Company. SCHEDULE II — VALUATION AND QUALIFYING ACCOUNTS | Year | | Description | | Opening Balance | | | Charged to Expense | | | Closing Deductions | | | Balance | | | 2008 | | Allowance for doubtful accounts | | $ | 1,052,000 | | | $ | 502,000 | | | $ | 628,000 | (1) | | $ | 926,000 | | | 2007 | | Allowance for doubtful accounts | | $ | 963,000 | | | $ | 189,000 | | | $ | 100,000 | (1) | | $ | 1,052,000 | | | 2006 | | Allowance for doubtful accounts | | $ | 1,054,000 | | | $ | 300,000 | | | $ | 391,000 | (1) | | $ | 963,000 | | | 2008 | | Inventory Reserve | | $ | 2,864,000 | | | $ | 3,149,000 | | | $ | 2,196,000 | (2) | | $ | 3,817,000 | | | 2007 | | Inventory Reserve | | $ | 2,330,000 | | | $ | 1,911,000 | | | $ | 1,377,000 | (2) | | $ | 2,864,000 | | | 2006 | | Inventory Reserve | | $ | 1,922,000 | | | $ | 1,679,000 | | | $ | 1,271,000 | (2) | | $ | 2,330,000 | |
On November 21, 2005, the Company’s Board of Directors approved a 2-for-1 stock split of the Company’s common stock payable on January 5, 2006 to shareholders of record on December 15, 2005.
F-23
Back to Contents
REPORT OF INDEPENDENT REGISTERED PUBLIC ACCOUNTING FIRM
Shareholders and Board of Directors
J & J Snack Foods Corp. and Subsidiaries
In connection with our audit of the consolidated financial statements of J & J Snack Foods Corp. and Subsidiaries referred to in our report dated November 9, 2005 (except for Note Q, to which the date is November 21, 2005) which is included in the Annual Report to Shareholders and incorporated by reference in Part II of this form, we have also audited Schedule II for each of the three fiscal years in the period ended September 24, 2005 (52 weeks, 52 weeks and 52 weeks, respectively). In our opinion, this schedule presents fairly, in all material respects, the information required to be set forth therein.
Philadelphia, Pennsylvania
November 9, 2005
Back to Contents
SCHEDULE II— VALUATION AND QUALIFYING ACCOUNTS
| | | | | Opening | | Charged to | | | | Closing | | | | Description | | Balance | | expense | | Deductions | | Balance | |
| |
|
| |
|
| |
|
| |
|
| |
|
| | | 2005 | | | Allowance for doubtful accounts | | $ | 1,104,000 | | $ | 112,000 | | $ | 162,000 | (1) | $ | 1,054,000 | | | 2004 | | | Allowance for doubtful accounts | | | 991,000 | | | 245,000 | | | 132,000 | (1) | | 1,104,000 | | | 2003 | | | Allowance for doubtful accounts | | | 1,839,000 | | | 556,000 | | | 1,404,000 | (1) | | 991,000 | | | 2005 | | | Inventory Reserve | | | 1,131,000 | | | 791,000 | | | — | | | 1,922,000 | | | 2004 | | | Inventory Reserve | | | 617,000 | | | 514,000 | | | — | | | 1,131,000 | | | 2003 | | | Inventory Reserve | | | 935,000 | | | — | | | 318,000 | | | 617,000 | | | | | | | | | | | | | | | | | | | |
| (1) Write-off of uncollectible accounts receivable. |
S-2


(2) Disposals of obsolete inventory. |
|
|