John J. Goggins, Senior Vice President and General Counsel | Mr. Goggins has served as the Company’s Senior Vice President and General Counsel since October 1, 2000. Mr. Goggins joined Moody’s Investors Service, Inc. | ||
8
Linda S. Huber, 48 Executive Vice President and Chief Financial Officer | Ms. Huber has served as the Company’s Executive Vice President and Chief Financial Officer since May 2005. Prior thereto, she served as Executive Vice President and Chief Financial Officer at U.S. Trust Company, a subsidiary of Charles Schwab & Company, Inc., from 2003 to 2005. Prior to U.S. Trust, she was Managing Director at Freeman & Co. from 1998 through 2002. She served PepsiCo as Vice President of Corporate Strategy and Development from 1997 until 1998 and as Vice President and Assistant Treasurer from 1994 until 1997. She served as Vice President in the Energy Investment Banking Group at Bankers Trust Company from 1991 until 1994 and as an Associate in the Energy Group at First Boston Corporation from 1986 through 1990. She also held the rank of Captain in the U.S. Army where she served from 1980 to 1984. | ||
Joseph (Jay) McCabe, 56 Senior Vice President—Corporate Controller | Mr. McCabe has served as the Company’s Senior Vice President — Corporate Controller since December 2005. Mr. McCabe joined Moody’s in July 2004 as Vice President and Corporate Controller. Prior thereto, he served as | ||
Raymond W. McDaniel, Jr., Chairman and Chief | Mr. McDaniel has served as the Company’s Chairman and Chief Executive Officer since April 2005. Mr. McDaniel served as the Company’s President | ||
Perry Rotella, 43 Senior Vice President | Mr. | ||
9
| ITEM 1A. | RISK FACTORS |
The following risk factors and other information included in this annual report on Form 10-K should be carefully considered. The risks and uncertainties described below are not the only ones the Company faces. Additional risks and uncertainties not presently known to the Company or that the Company’s management currently deems minor or insignificant also may impair its business operations. If any of the following risks occur, Moody’s business, financial condition, operating results and cash flows could be materially adversely affected.
Changes in the Volume of Debt Securities Issued in Domestic and/or Global Capital Markets and Changes in Interest Rates and Other Volatility in the Financial Markets
Approximately 80% of Moody’s revenue in 2006 was derived from ratings, a significant portion of which was related to the issuance of credit-sensitive securities in the global capital markets. The Company anticipates that a substantial part of its business will continue to be dependent on the number and dollar volume of debt securities issued in the capital markets. Therefore, the Company’s results could be adversely affected by a reduction in the level of debt issuance.
Unfavorable financial or economic conditions that either reduce investor demand for debt securities or reduce issuers’ willingness or ability to issue such securities could reduce the number and dollar volume of debt issuance for which Moody’s provides ratings services. In addition, increases in interest rates or credit spreads, volatility in financial markets or the interest rate environment, significant regulatory, political or economic events, defaults of significant issuers and other market and economic factors may negatively impact the general level of debt issuance, the debt issuance plans of certain categories of borrowers, and/or the types of credit-sensitive products being offered. A sustained period of market decline or weakness could also have a material adverse effect on Moody’s business and financial results.
Possible Loss of Market Share or Revenue Through Competition or Regulation
The markets for credit ratings, research and credit risk management services are increasingly competitive. Moody’s competes on the basis of a number of factors, including quality of ratings, customer service, research, reputation, regulatory qualification, price, geographic scope, range of products and technological innovation. For example, a large investment grade default could impact the Company’s reputation and potentially lead to greater regulatory oversight. Moody’s faces competition from, among others, S&P, Fitch, DBRS, local rating agencies in a number of international jurisdictions and niche companies that provide ratings for particular types of financial products or issuers (such as A.M. Best Company, Inc., with respect to the insurance industry). Since Moody’s believes that some of its most significant challenges and opportunities will arise outside the U.S., it will have to compete with rating agencies that may have a stronger local presence or a longer operating history in those markets. These local providers or comparable competitors that may emerge in the future may receive support from local governments or other institutions that Moody’s does not receive.
Currently, Moody’s, S&P, Fitch, DBRS and A.M. Best Company, Inc. are designated as NRSROs by the SEC. In September 2006, the United States Congress passed into law the Credit Rating Agency Reform Act of 2006. As a direct result, the SEC is mandated to complete a rule-making process which implements the legislation (see “Regulation”, above, for further information) by June 2007. At present, Moody’s is unable to assess the impact of any regulatory changes that may result from the SEC’s rule-making process.
Introduction of Competing Products or Technologies by Other Companies
The markets for credit ratings, research and credit risk management services are competitive. The ability to provide innovative products and technologies that anticipate customers’ changing requirements and to utilize emerging technological trends is a key factor in maintaining market share. Competitors may develop quantitative methodologies or related services for assessing credit risk that customers and market participants may deem preferable, more cost-effective or more valuable than the credit risk assessment methods currently employed by Moody’s. Moody’s growth prospects could also be adversely affected by limitations of its information technologies that fail to provide adequate capacity and capabilities to meet increased demands of producing quality ratings and research products.
Increased Pricing Pressure from Competitors and/or Customers
In the credit rating, research and credit risk management markets, competition for customers and market share has spurred more aggressive tactics by some competitors in areas such as pricing and service. While Moody’s seeks to compete primarily on the basis of the quality of its products and service, if its pricing and services are not sufficiently competitive with its current and future competitors, Moody’s may lose market share.
10
Possible Loss of Key Employees to Investment or Commercial Banks or Elsewhere and Related Compensation Cost Pressures
Moody’s success depends in part upon recruiting and retaining highly skilled, experienced financial analysts and other professionals. Competition for qualified staff in the financial services industry is intense, and Moody’s ability to attract staff could be impaired if it is unable to offer competitive compensation and other incentives. Investment banks and other competitors for analyst talent may be able to offer higher compensation than Moody’s. Moody’s also may not be able to identify and hire employees in some markets outside the U.S. with the required experience or skills to perform sophisticated credit analysis. Moody’s may lose key employees due to other factors, such as catastrophes, that could lead to disruption of business operations. Moody’s ability to compete effectively will continue to depend, among other things, on its ability to attract new employees and to retain and motivate existing employees.
Exposure to Litigation Related to Moody’s Rating Opinions
Moody’s faces litigation from time to time from parties claiming damages relating to ratings actions. In addition, as Moody’s international business expands, these types of claims may increase because foreign jurisdictions may not have legal protections or liability standards comparable to those in the U.S. (such as protections for the expression of credit opinions as is provided by the First Amendment). These risks often may be difficult to assess or quantify and their existence and magnitude often remains unknown for substantial periods of time.
Potential Emergence of Government-Sponsored Credit Rating Agencies
When governments adopt regulations that require debt securities to be rated, establish criteria for credit ratings or authorize only certain entities to provide credit ratings, the competitive balance among rating agencies and the level of demand for ratings may be positively or negatively affected. Government-mandated ratings criteria may also have the effect of displacing objective assessments of creditworthiness. In these circumstances, debt issuers may be less likely to base their choice of rating agencies on criteria such as independence and credibility, and more likely to base their choice on their assumption as to which credit rating agency might provide a higher rating, which may negatively affect the Company.
Potential for New U.S., Foreign, State and Local Legislation and Regulations, Including Those Relating to Nationally Recognized Statistical Rating Organizations
In the United States and other countries, the laws and regulations applicable to credit ratings and rating agencies continue to evolve and are presently subject to review by a number of legislative or regulatory bodies, including the SEC in the United States and the CESR on behalf of the European Union. It is possible that such reviews could lead to greater oversight or regulation concerning the issuance of credit ratings or the activities of credit rating agencies. Such additional regulations could, potentially, increase the costs associated with the operation of a credit rating agency, alter the rating agencies’ communications with the issuers as part of the rating assignment process, increase the legal risk associated with the issuance of credit ratings, change the regulatory framework to which credit rating agencies are subject and/or affect the competitive environment in which credit rating agencies operate. A description of certain of the more recent regulatory initiatives in the United States and other countries is described above under the section entitled “Regulation” in Item 1. “Business”, of this Form 10-K. At present, Moody’s is unable to predict the regulatory changes that may result from ongoing reviews by the SEC or other regulatory bodies or the effect that any such changes may have on its business.
Exposure to Increased Risk from Multinational Operations
Moody’s maintains offices outside the U.S. and derives a significant portion of its revenue from sources outside the U.S. Operations in different countries expose Moody’s to a number of legal, economic and regulatory risks such as:
changes in legal and regulatory requirements affecting either Moody’s operations or its customers’ use of ratings
possible nationalization, expropriation, price controls and other restrictive governmental actions
restrictions on the ability to convert local currency into U.S. dollars
currency fluctuations
export and import restrictions, tariffs and other trade barriers
difficulty in staffing and managing offices as a result of, among other things, distance, travel, cultural differences and intense competition for trained personnel
longer payment cycles and problems in collecting receivables
11
political and economic instability
potentially adverse tax consequences
Any of these factors could have a material adverse effect on the business, financial condition and results of operations of the Company in the future.
| ITEM 1B. | UNRESOLVED STAFF COMMENTS |
None.
| ITEM 2. | PROPERTIES |
ITEM 2. PROPERTIES
The executive offices of Moody’s arecorporate headquarters is located at 99 Church Street, New York, New York, with approximately 441,000 square-feet. During the fourth quarter of 2006, the Company completed the sale of its corporate headquarters and is leasing back the building until the headquarters relocation is completed. On October 20, 2006, the Company entered into an operating lease agreement with 7 World Trade Center, LLC for 589,945 square-feet of an office building located at 7 World Trade Center at 250 Greenwich Street, New York, New York, which will serve as Moody’s new headquarters beginning in a 297,000-square-foot property owned by Moody’s.mid- to late 2007. As of December 31, 2006, Moody’s operations are alsowere conducted from 9 other15 U.S. offices and 2132 non-U.S. office locations, all of which are leased. These other properties are geographically distributed to meet operating and sales requirements worldwide. These properties are generally considered to be both suitable and adequate to meet current operating requirements and virtually all space is being utilized.
ITEM 3. LEGAL PROCEEDINGS
| ITEM 3. | LEGAL PROCEEDINGS |
From time to time, Moody’s is involved in legal and tax proceedings, claims and litigation that are incidental to the Company’s business, including claims based on ratings assigned by Moody’s. Moody’s is also subject to ongoing tax audits in the normal course of business. Management periodically assesses the Company’s liabilities and contingencies in connection with these matters based upon the latest information available. Moody’s discloses material pending legal proceedings, other than routine litigation incidental to Moody’s business, material proceedings known to be contemplated by governmental authorities, and other pending matters that it may determine to be appropriate. For those matters where it is both probable that a liability has been incurred and the probable amount of loss can be reasonably estimated, the Company believes it has recorded appropriate reserves in the consolidated financial statements and periodically adjusts these reserves as appropriate. In other instances, because of the uncertainties related to both the probable outcome andand/or the amount or range of loss, management is unable to make a reasonable estimate ofdoes not record a liability but discloses the contingency if any.significant. As additional information becomes available, the Company adjusts its assessments and estimates of such liabilities accordingly.
The discussion of the litigationlegal matters under the heading “Legacy Contingencies” underPart II, Item 7. “Management’s Discussion and Analysis of Financial Condition and Results of Operations”Operations—Contingencies”, commencing aton page 3428 of this annual report on Form 10-K, is incorporated into this Item 3 by reference.
Based on its review of the latest information available, in the opinion of management, the ultimate liability of the Company in connection with pending legal and tax proceedings, claims and litigation will not have a material adverse effect on Moody’s financial position, results of operations or cash flows, subject to the contingencies described in Part II, Item 7. “Management’s Discussion and Analysis of Financial Condition and Results of Operations — Operations—Contingencies”.
ITEM 4. SUBMISSION OF MATTERS TO A VOTE OF SECURITY HOLDERS
| ITEM 4. | SUBMISSION OF MATTERS TO A VOTE OF SECURITY HOLDERS |
During the fourth quarter of the fiscal year covered by this annual report on Form 10-K, no matter was submitted to a vote of security holders.
12
PART II
ITEM 5. MARKET FOR THE REGISTRANT’S COMMON EQUITY, RELATED SHAREHOLDER MATTERS AND ISSUER PURCHASES OF EQUITY SECURITIES.
| ITEM 5. | MARKET FOR THE REGISTRANT’S COMMON EQUITY, RELATED SHAREHOLDER MATTERS AND ISSUER PURCHASES OF EQUITY SECURITIES. |
Information in response to this Item is set forth under the captions “Common Stock Information” and “Dividends” in Item 7 of this annual report on Form 10-K.10-K, and under the caption “Equity Compensation Plan Information” in the Company’s definitive proxy statement for use in connection with its annual meeting of stockholders scheduled to be held on April 24, 2007, and is incorporated herein by reference.
MOODY’S PURCHASES OF EQUITY SECURITIES
For the Three Months Ended December 31, Period Total Number of Shares Purchased Average Price Paid per Share Total Number of Shares Purchased as Part of Publicly Announced Program Approximate Dollar Value of Shares That May yet be Purchased Under the Program (2) October 1 – 31 November 1 – 30 December 1 – 31 Total2004 971,702 (1) $ 63.44 971,479 $ 1,850.3 million 722,982 (1) 67.23 722,016 1,801.8 million 562,500 69.99 562,500 1,762.4 million 2,257,184 2,255,995 Total Number of SharesApproximate Dollar Value ofPurchased as Part ofShares that May Yet BeTotal Number ofAverage PricePublicly AnnouncedPurchased Under thePeriodShares PurchasedPaid per ShareProgramProgram (1)Includes the surrender to the Company of 223 and 966 shares in October 1 - 31———$547.7 millionand November, 1 - 30———$547.7 millionDecember 1 - 31———$547.7 millionTotal———respectively, of common stock to satisfy tax withholding obligations in connection with the vesting of restricted stock issued to employees.
| (2) | As of the last day of each of the months. On June 5, 2006, the Board of Directors authorized a $2 billion share repurchase program. There is no established expiration date for this authorization. During August 2006, the Company had completed its previous $1 billion share repurchase program, which had been authorized by the Board of Directors in October 2005. |
Since becoming a public company in October 2000 and through the end of 2004,December 31, 2006, Moody’s has repurchased 26.484.4 million shares at a total cost of $1.1$2.9 billion, including 13.038.6 million shares to offset issuances under employee stock-based compensation plans.
PERFORMANCE GRAPH
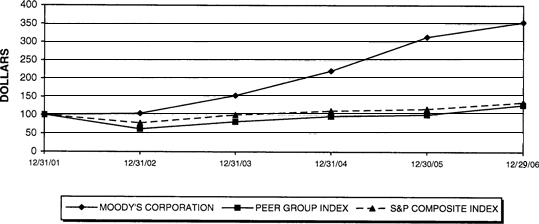
The following graph compares the total cumulative shareholder return of the Company to the performance of Standard & Poor’s Stock 500 Index (the “S&P 500”) and an index of performance peer group companies (the “Performance Peer Group”).
The Company does not believe there are any publicly traded companies that represent strict peers. However, each of the companies in the Performance Peer Group offers business information products in one or more segments of its business. The Performance Peer Group consists of Dow Jones & Company, Inc., The McGraw-Hill Companies, Pearson PLC, Reuters Group PLC, Thomson Corporation and Wolters Kluwer nv.
The comparison assumes that $100.00 was invested in the Company’s common stock plans.
(the “Common Stock”) and in each of the foregoing indices on December 31, 2001. The comparison also assumes the reinvestment of dividends, if any. The total return for the Common Stock was 254% during the performance period as compared with a total return during the same period of 35% for the S&P 500 and 27% for the Performance Peer Group.
COMPARISON OF CUMULATIVE TOTAL RETURN
SINCE DECEMBER 31, 2001
MOODY’S CORPORATION, S&P COMPOSITE INDEX AND PEER GROUP INDEX
| PERIOD ENDING | ||||||||||||
| 12/31/2001 | 12/31/2002 | 12/31/2003 | 12/31/2004 | 12/30/2005 | 12/29/2006 | |||||||
Moody's Corporation | 100.00 | 104.01 | 153.07 | 220.51 | 313.63 | 354.23 | ||||||
Peer Group Index | 100.00 | 61.80 | 81.57 | 96.18 | 100.97 | 127.43 | ||||||
S&P Composite Index | 100.00 | 77.90 | 100.25 | 111.15 | 116.61 | 135.03 | ||||||
The comparisons in the graph above are provided in response to disclosure requirements of the SEC and are not intended to forecast or be indicative of future performance of the Common Stock.
13
ITEM 6. SELECTED FINANCIAL DATA
| ITEM 6. | SELECTED FINANCIAL DATA |
The Company’s selected consolidated financial data should be read in conjunction with Item 7. “Management’s Discussion and Analysis of Financial Condition and Results of Operations” and the Moody’s Corporation consolidated financial statements and notes thereto.
| Year Ended December 31, | ||||||||||||||||||||
| amounts in millions, except per share data | 2004 | 2003 | 2002 | 2001 | 2000 (4) | |||||||||||||||
Results of operations (1) | ||||||||||||||||||||
| Revenue | $ | 1,438.3 | $ | 1,246.6 | $ | 1,023.3 | $ | 796.7 | $ | 602.3 | ||||||||||
| Expenses | 651.9 | 583.5 | 485.2 | 398.2 | 313.8 | |||||||||||||||
| Operating income | 786.4 | 663.1 | 538.1 | 398.5 | 288.5 | |||||||||||||||
| Non-operating expense, net (2) | (15.1 | ) | (6.7 | ) | (20.7 | ) | (16.6 | ) | (4.5 | ) | ||||||||||
| Income before provision for income taxes | 771.3 | 656.4 | 517.4 | 381.9 | 284.0 | |||||||||||||||
| Provision for income taxes | 346.2 | 292.5 | 228.5 | 169.7 | 125.5 | |||||||||||||||
| Net income | $ | 425.1 | $ | 363.9 | $ | 288.9 | $ | 212.2 | $ | 158.5 | ||||||||||
Earnings per share | ||||||||||||||||||||
| Basic | $ | 2.86 | $ | 2.44 | $ | 1.88 | $ | 1.35 | $ | 0.98 | ||||||||||
| Diluted | $ | 2.79 | $ | 2.39 | $ | 1.83 | $ | 1.32 | $ | 0.97 | ||||||||||
Weighted average shares outstanding | ||||||||||||||||||||
| Basic | 148.5 | 148.9 | 153.9 | 157.6 | 161.7 | |||||||||||||||
| Diluted | 152.3 | 152.3 | 157.5 | 160.2 | 163.0 | |||||||||||||||
Dividends declared per share | $ | 0.30 | $ | 0.18 | $ | 0.18 | $ | 0.18 | $ | 0.045 | ||||||||||
| As of December 31, | ||||||||||||||||||||
| 2004 | 2003 | 2002 | 2001 | 2000 (4) | ||||||||||||||||
Balance sheet data | ||||||||||||||||||||
| Total assets | $ | 1,376.0 | $ | 952.3 | $ | 630.8 | $ | 505.4 | $ | 398.3 | ||||||||||
| Long-term debt (3) | $ | — | $ | 300.0 | $ | 300.0 | $ | 300.0 | $ | 300.0 | ||||||||||
| Shareholders’ equity (deficit) | $ | 317.5 | $ | (32.1 | ) | $ | (327.0 | ) | $ | (304.1 | ) | $ | (282.5 | ) | ||||||
| Year Ended December 31, | ||||||||||||||||||||
amounts in millions, except per share data | 2006 | 2005 | 2004 | 2003 | 2002 (1) | |||||||||||||||
Results of operations | ||||||||||||||||||||
Revenue | $ | 2,037.1 | $ | 1,731.6 | $ | 1,438.3 | $ | 1,246.6 | $ | 1,023.3 | ||||||||||
Expenses, excluding gain on sale of building | 938.2 | 792.0 | 651.9 | 583.5 | 485.2 | |||||||||||||||
Gain on sale of building (2) | (160.6 | ) | — | — | — | — | ||||||||||||||
Operating income | 1,259.5 | 939.6 | 786.4 | 663.1 | 538.1 | |||||||||||||||
Non-operating income (expense), net (3) | 1.0 | (4.9 | ) | (15.1 | ) | (6.7 | ) | (20.7 | ) | |||||||||||
Income before provision for income taxes | 1,260.5 | 934.7 | 771.3 | 656.4 | 517.4 | |||||||||||||||
Provision for income taxes | 506.6 | 373.9 | 346.2 | 292.5 | 228.5 | |||||||||||||||
Net income | $ | 753.9 | $ | 560.8 | $ | 425.1 | $ | 363.9 | $ | 288.9 | ||||||||||
Earnings per share (4) | ||||||||||||||||||||
Basic | $ | 2.65 | $ | 1.88 | $ | 1.43 | $ | 1.22 | $ | 0.94 | ||||||||||
Diluted | $ | 2.58 | $ | 1.84 | $ | 1.40 | $ | 1.19 | $ | 0.92 | ||||||||||
Weighted average shares outstanding (4) | ||||||||||||||||||||
Basic | 284.2 | 297.7 | 297.0 | 297.8 | 307.8 | |||||||||||||||
Diluted | 291.9 | 305.6 | 304.7 | 304.6 | 315.0 | |||||||||||||||
Dividends declared per share | $ | 0.29 | $ | 0.24 | $ | 0.15 | $ | 0.11 | $ | 0.09 | ||||||||||
| Year Ended December 31, | ||||||||||||||||||||
| 2006 | 2005 | 2004 | 2003 | 2002 | ||||||||||||||||
Balance sheet data | ||||||||||||||||||||
Total assets | $ | 1,497.7 | $ | 1,457.2 | $ | 1,389.3 | $ | 959.9 | $ | 633.7 | ||||||||||
Long-term debt (5) | $ | 300.0 | $ | 300.0 | $ | — | $ | 300.0 | $ | 300.0 | ||||||||||
Shareholders’ equity (deficit) | $ | 167.4 | $ | 309.4 | $ | 317.5 | $ | (32.1 | ) | $ | (327.0 | ) | ||||||||
| (1) | The 2002 results of operations include revenue of $42.1 million, expenses of $42.8 million and an operating loss of $0.7 million related to KMV, which was acquired in April 2002. | |
| (2) | During the fourth quarter of 2006, the Company completed the sale of its corporate headquarters located at 99 Church Street, New York, New York. The sale resulted in a gain of $160.6 million. |
| (3) |
| (4) | Prior period earnings per share and weighted average shares outstanding have been adjusted to reflect the May 2005 2-for-1 stock split. |
14
ITEM 7. MANAGEMENT’S DISCUSSION AND ANALYSIS OF FINANCIAL CONDITION AND RESULTS OF OPERATIONS
| ITEM 7. | MANAGEMENT’S DISCUSSION AND ANALYSIS OF FINANCIAL CONDITION AND RESULTS OF OPERATIONS |
This discussion and analysis of financial condition and results of operations should be read in conjunction with the Moody’s Corporation consolidated financial statements and notes thereto included elsewhere in this annual report on Form 10-K.
This Management’s Discussion and Analysis of Financial Condition and Results of Operations contains Forward-Looking Statements. See “Forward-Looking Statements” commencing on page 4131 and “Additional Factors That May Affect Future Results”Item 1A. “Risk Factors” commencing on page 3010 for a discussion of uncertainties, risks and other factors associated with these statements.
The Company
Except where otherwise indicated, the terms “Moody’s” and the “Company” refer to Moody’s Corporation and its subsidiaries. Moody’s is a provider of (i) credit ratings, research and analysis covering fixed-income securities, other debt instruments and securitiesthe entities that issue such instruments in the global capital markets, and a provider of quantitative credit assessment services, credit training services, and (ii) quantitative credit processrisk assessment products and services and credit processing software tofor banks, corporations and other financial institutions.investors in credit-sensitive assets. Moody’s operates in two reportable segments: Moody’s Investors Service and Moody’s KMV.
Moody’s Investors Service publishes rating opinions on a broad range of credit obligors and credit obligations issued in domestic and international markets, including various corporate and governmental obligations, structured finance securities and commercial paper programs. It also publishes investor-oriented credit information, research and economic commentary, including in-depth research on major debt issuers, industry studies, special comments and credit opinion handbooks.
The Moody’s KMV business consists of the combined businesses of KMV LLC and KMV Corporation (“KMV”), acquired in April 2002, and Moody’s Risk Management Services. Moody’s KMV develops and distributes quantitative credit risk assessment products and services and credit processing software for banks, corporations and investors in credit-sensitive assets, credit training services and credit process software.assets.
The Company operated as part of The Dun & Bradstreet Corporation (“Old D&B”) until September 30, 2000 (the “Distribution Date”), when Old D&B separated into two publicly traded companies — Moody’s Corporation and The New D&B Corporation (“New D&B”). At that time, Old D&B distributed to its shareholders shares of New D&B stock. New D&B comprised the business of Old D&B’s Dun & Bradstreet operating company (the “D&B Business”). The remaining business of Old D&B consisted solely of the business of providing ratings and related research and credit risk management services (the “Moody’s Business”) and was renamed “Moody’s Corporation”. The method by which Old D&B distributed to its shareholders its shares of New D&B stock is hereinafter referred to as the “2000 Distribution”.
Critical Accounting Estimates
Moody’s discussion and analysis of its financial condition and results of operations are based on the Company’s consolidated financial statements, which have been prepared in accordance with accounting principles generally accepted in the United States. The preparation of these financial statements requires Moody’s to make estimates and judgments that affect reported amounts of assets and liabilities and related disclosures of contingent assets and liabilities at the dates of the financial statements and revenue and expenses during the reporting periods. These estimates are based on historical experience and on other assumptions that are believed to be reasonable under the circumstances. On an ongoing basis, Moody’s evaluates its estimates, including those related to revenue recognition, accounts receivable allowances, contingencies, goodwill and intangible assets, pension and other post-retirement benefits and stock-based compensation. Actual results may differ from these estimates under different assumptions or conditions. The following accounting estimates are considered critical because they are particularly dependent on management’s judgment about matters that are uncertain at the time the accounting estimates are made and changes to those estimates could have a material impact on the Company’s consolidated results of operations or financial condition.
15
Revenue Recognition
In recognizing revenue related to ratings, Moody’s uses judgments to allocate billed revenue between ratings and the future monitoring of ratings in cases where the Company does not charge ongoing monitoring fees for a particular issuer. These judgments are not dependent on the outcome of future uncertainties, but rather relate to allocating revenue across accounting periods. In such cases, the Company defers portions of rating fees that it estimates will be attributed to future monitoring activities and recognizes the deferred revenue ratably over the estimated monitoring periods.
The portion of the revenue to be deferred is determined based on annualupon a number of factors, including the estimated fair market value of the monitoring feesservices charged for similar securities or issuers and the level of monitoring effort required for a type of security or issuer.issuers. The estimated monitoring period over which the deferred revenue will be recognized is determined based on factors such as the frequency of issuance by the issuers and theestimated lives of the rated securities. Currently, the estimated monitoring periods range from threeone year to ten years. At December 31, 20042006, 2005 and 2003,2004, deferred revenue included approximately $30$47 million, $36 million and $26$30 million, respectively, related to such deferred monitoring fees.
15
Additionally, in the case of commercial mortgage-backed securities, issuers can elect to pay the monitoring fees upfront. These fees are deferred and recognized over the future monitoring period which is determined based on the lives of the rated securities. Currently, the monitoring periods range from five to 46 years. At December 31, 2006, 2005 and 2004, deferred revenue related to commercial mortgage-backed securities was approximately $62 million, $50 million and $37 million, respectively.
Moody’s estimates revenue for ratings of commercial paper for which, in addition to a fixed annual monitoring fee, issuers are billed quarterly based on amounts outstanding. Related revenue is accrued each quarter based on estimated amounts outstanding and is billed subsequently when actual data is available. The estimate is determined based on the issuers’ most recent reported quarterly data. At December 31, 20042006, 2005 and 2003,2004, accounts receivable included approximately $29$34 million, $31 million and $26$29 million, respectively, related to accrued commercial paper revenue. Historically, the Company has not had material differences between the estimated revenue and the actual billings.
Accounts Receivable Allowance
Moody’s records as reductions of revenue provisions for estimated future adjustments to customer billings based on historical experience and current conditions. Such provisions are reflected as additions to the accounts receivable allowance. Adjustments to and write-offs of accounts receivable are charged against the allowance. Moody’s evaluates its accounts receivable by reviewing and assessing historical collection and adjustment experience and the current status of customer accounts. Moody’s also considers the economic environment of the customers, both from an industry and geographic perspective, in evaluating the need for allowances. Based on its reviews, Moody’s establishes or adjusts allowances, for specific customers and the accounts receivable balance as a whole, as considered appropriate. This process involves a high degree of judgment and estimation and frequently involvescould involve significant dollar amounts. Accordingly, Moody’s results of operations can be affected by adjustments to the allowance. Management believes that the allowance for uncollectible accounts is adequate to cover anticipated adjustments and write-offs under current conditions. However, significant changes in any of the above-noted factors, or actual write-offs or adjustments that differ from the estimated amounts could result in allowancesrevenue adjustments that are greater or less than Moody’s estimates. In each of 20042006, 2005 and 2003,2004, the Company reducedadjusted its provision rates and its allowances to reflect its current estimate of the appropriate level of accounts receivable allowance.
Contingencies
Accounting for contingencies, including those matters described in the “Contingencies” section of this Management’s“Management’s Discussion and Analysis,Analysis”, commencing on page 28 is highly subjective and requires the use of judgments and estimates in assessing their magnitude and likely outcome. In many cases, the outcomes of such matters will be determined by third parties, including governmental or judicial bodies. The provisions made in the consolidated financial statements, as well as the related disclosures, represent management’s best estimates of the then current status of such matters and their potential outcome based on a review of the facts and in consultation with outside legal counsel where deemed appropriate.The Company regularly reviews contingencies and as additional information becomes available may, in the future, adjust the provisions made in respect thereof. Since the potential exposure on many of these matters is material, and it is possible that these matters could be resolved in amounts that are greater than the Company has reserved, their resolution could have a material adverse effect on Moody’s future reported results and financial position. In addition, potential cash outlays related to the resolution of these exposures could be material.
16
For the years ended December 31, 20042006, 2005 and 2003,2004, the provision for income taxes reflected credits of $2.4 million, $8.8 million and charges of $30.0 million and $16.2$30 million, respectively, due to increasechanges in the Company’s reserves for legacy income tax exposures that were assumed by Moody’s in connection with its separation from The Dun & Bradstreet CorporationOld D&B in October 2000. These tax matters are discussed under “Legacy Tax Matters” below.
Goodwill and Other Intangible Assets
Moody’s evaluates its goodwill for impairment annually or more frequently if impairment indicators arise in accordance with Statement of Financial Accounting Standards (“SFAS”) No. 142, “Goodwill and Other Intangible Assets”. Moody’s goodwill balance is material ($131.7 million at December 31, 2004), and theThe evaluation of the carrying value of goodwill requires that the Company make important assumptions and judgments about future operating results and cash flows as well as terminal values and discount rates. In estimating future operating results and cash flows, Moody’s considers internal budgets and strategic plans, expected long-term growth rates, and the effects of external factors and market conditions. If actual future operating results and cash flows or external conditions differ from the Company’s judgments, or if changes in assumed terminal values or discount rates are made, an impairment charge may be necessary to reduce the carrying value of goodwill, which charge could be material to the Company’s financial position and results of operations. Amortizable intangible assets are reviewed for recoverability whenever events or changes in circumstances indicate that the carrying amount may not be recoverable.
16
Pension and Other Post-Retirement Benefits
The expenses, assets, liabilities and obligations that Moody’s reports for pension and other post-retirement benefits are dependent on many assumptions concerning the outcome of future events and circumstances. These assumptions include the following:
•
future compensation increases, based on the Company’s long-term actual experience and future outlook
• discount rates, based on current yields on high grade corporate long-term bonds
• long-term return on pension plan assets, based on historical portfolio results and the expected future average annual return for each major asset class within the plan’s portfolio (which is principally comprised of equity and fixed-income investments)
future healthcare cost trends, based on historical market data, near-term outlooks and assessments of likely long-term trends
discount rates, based on current yields on high-grade corporate long-term bonds
The discount rate selected to measure the present value of the Company’s benefit obligations as of December 31, 2006 was derived using a cash flow matching method whereby the Company compares the plans’ projected payment obligations by year with the corresponding yield on the Citibank Pension Discount Curve. The cash flows are then discounted to their present value and an overall discount rate is determined.
Moody’s major assumptions vary by plan and assumptions used are set forth in Note 10 to the consolidated financial statements. In determining suchthese assumptions, the Company consults with outside actuaries and other advisors whereas deemed appropriate. In accordance with relevant accounting standards, if actual results differ from the Company’s assumptions, such differences are deferred and amortized over the estimated future working life of the plan participants. While the Company believes that the assumptions used in its calculations are reasonable, differences in actual experience or changes in assumptions could have a significant effect on the expenses, assets and liabilities related to the Company’s pension and other post-retirement benefits.
When actual plan experience differs from the assumptions used, actuarial gains or losses arise. To the extent the total outstanding gain or loss exceeds a corridor threshold as defined in SFAS No. 87, “Employers’ Accounting for Pensions” (“SFAS No. 87”), the excess is subject to amortization in annual expense over the estimated average future working lifetime of active plan participants. For Moody’s pension and other post-retirement benefit plans, the total losses as of December 31, 2006 which have not been recognized in annual expense are $ 41.0 million and Moody’s expects to recognize $2.2 million of actuarial losses in 2007 annual net periodic benefit expense.
For Moody’s funded pension plan, the differences between the expected long-term rate of return assumption and actual experience could also affect the net periodic pension expense. As permitted under SFAS No. 87, the Company spreads the impact of asset experience over a five-year period for purposes of calculating the market related value of assets which is used in determining the expected return on assets component of annual expense and in calculating the total unrecognized gain or loss subject to amortization. As of December 31, 2006, the Company has an unrecognized asset gain of $7.8 million, of which $3.3 million will be recognized in the market related value of assets which is used to calculate the expected return on assets component in 2008 expense.
The table below shows the estimated effect that a one percentage pointpercentage-point decrease in each of these assumptions will have on Moody’s 20052007 operating income (dollars in millions). These effects have been calculated using the Company’s current projections of 20052007 assets, liabilities, obligations and expenses related to pension and other post-retirement plans, which could change as updated data becomes available.
| Estimated Impact on | ||||||||
| Assumption Used for | 2005 Operating Income | |||||||
| 2005 | (Decrease)/Increase | |||||||
| Discount Rate | 5.90 | % | $ | (3.9 | ) | |||
| Weighted Average Assumed Compensation Growth Rate | 4.00 | % | $ | 1.2 | ||||
| Assumed Long-Term Rate of Return on Pension Assets | 8.35 | % | $ | (1.0 | ) | |||
17
Assumption Used for 2007 | Estimated Impact on 2007 Operating Income (Decrease)/Increase | |||||
Discount Rate* | 5.90% / 5.80% | $ | (5.3 | ) | ||
Weighted Average Assumed Compensation Growth Rate | 4.00% | $ | 1.8 | |||
Assumed Long-Term Rate of Return on Pension Assets | 8.35% | $ | (1.1 | ) | ||
| * | Discount rates of 5.90% and 5.80% are used for pension plans and other post-retirement plans, respectively. |
A one percentage-point increase in assumed healthcare cost trend rates will not affect 2007 projected expenses. Based on our current projections, the Company estimates that expenses related to pension and post-retirement plans will be approximately $13
17
$14.4 million in 20052007 compared with $8$14.9 million in 2004.2006. The expected expense increasedecrease in 20052007 reflects the effects of higher discount rates, higher plan asset gains and lower amortization of actuarial losses, which are partially offset by normal growth in plan liabilities, as well as amortization of actuarial losses due to differences between past actuarial assumptions and actual plan experience, and assumption changes adopted as of December 31, 2004.liabilities.
Stock-Based Compensation
On January 1, 2006, the Company adopted, under the modified prospective application method, the fair value method of accounting for stock-based compensation under Statement of Financial Accounting Standards (“SFAS”) No. 123 (Revised 2004) “Share-Based Payment” (“SFAS No. 123R”). Under this pronouncement, companies are required to record compensation expense for all share-based payment award transactions granted to employees based on the fair value of the equity instrument at the time of grant. This includes shares issued under employee stock purchase plans, stock options, restricted stock and stock appreciation rights. Previously, on January 1, 2003, the Company adopted, on a prospective basis, the fair value method of accounting for stock-based compensation under the provisions of SFAS No. 123, “Accounting for Stock-Based Compensation”, as amended by SFAS No. 148, “Accounting for Stock-Based Compensation - Transition and Disclosure — an Amendment of FASB Statement No. 123”. Therefore, employee stock options granted on and after January 1, 2003 are being expensed by the Company over the option vesting period, based on the estimatedThe fair value of theeach option award is estimated on the date of grant. The estimated fair value is calculated based on agrant using the Black-Scholes option pricing model usingthat uses assumptions and estimates that the Company believes are reasonable. Some of the assumptions and estimates, such as share price volatility and expected option holding period, are based in part on Moody’s experience during the period since becoming a public company, which is limited. The use of different assumptions and estimates in the Black-Scholes option pricing model could produce materially different estimated fair values for option awards and related expense to be recognized over the option vesting period.expense.
An increase in the following assumptions would have had the following estimated effect on operating income in 20042006 (dollars in millions):
| Estimated Impact on | ||||||||||
| Amount of Increase in | Operating Income in 2004 | |||||||||
| Assumption Used | Assumption | (Decrease)/Increase | ||||||||
| Expected Dividend Yield | 2003 grants | 0.41% | 0.10% | $0.2 | ||||||
| 2004 grants | 0.46% | |||||||||
| Expected Share Price Volatility | 2003 and 2004 grants | 30% | 5% | ($2.5) | ||||||
| Expected Option Holding Period | 2003 and 2004 grants | 5.0 years | 1.0 year | ($2.3) | ||||||
| Assumption Used | Increase in Assumption | Estimated Impact on Operating Income in 2006 Increase/(Decrease) | ||||||||
Average Expected Dividend Yield | 2002 -2006 grants | 0.41% -0.52% | 0.10% | $ | 0.6 | |||||
Average Expected Share Price Volatility | 2002 -2006 grants | 23% -30% | 5% | $ | (4.9 | ) | ||||
Expected Option Holding Period | 2002 -2006 grants | 4.5 –6.0 years | 1.0 year | $ | (4.2 | ) | ||||
Other Estimates
In addition, there are other accounting estimates within Moody’s consolidated financial statements, including recoverability of deferred tax assets, anticipated dividend distributions from non-U.S. subsidiaries realizability of long-lived and intangible assets and valuation of investments in affiliates. Management believes the current assumptions and other considerations used to estimate amounts reflected in Moody’s consolidated financial statements are appropriate. However, if actual experience differs from the assumptions and other considerations used in estimating amounts reflected in Moody’s consolidated financial statements, the resulting changes could have a material adverse effect on Moody’s consolidated results of operations or financial condition.
See Note 2 to the consolidated financial statements for further information on key accounting policies that impact Moody’s.
Operating Segments
Prior to 2002, the Company operated in one reportable business segment – Ratings, which accounted for approximately 90% of the Company’s total revenue. With the April 2002 acquisition of KMV and its combination with Moody’s Risk Management Services to form Moody’s KMV, Moody’s now operates in two reportable business segments: Moody’s Investors Service and Moody’s KMV. Accordingly, in the second quarter of 2002, the
18
Company restated its segment information for prior periods to conform to the current presentation. In order to provide additional information relating to Moody’s operating results, the discussion below includes information analyzing operating results as if the acquisition of KMV had been consummated as of January 1, 2002. This information is presented in a manner consistent with SFAS No. 141, “Business Combinations”, and is described in more detail in Note 5 to the consolidated financial statements.
The Moody’s Investors Service business consists of four rating groups — structured finance, corporate finance, financial institutions and sovereign risk, and public finance — that generate revenue principally from the assignment of (i) credit ratings on issuers and issues of fixed-income obligors and instrumentsobligations in the debt markets, and (ii) research, which primarily generates revenue from the sale of investor-oriented credit information, and research, principally produced by the rating groups.groups, and economic commentary. For presentation purposes, Europe represents Europe, the Middle East and Africa and public finance represents U.S. public finance. Given the dominance of Moody’s Investors Service to Moody’s overall results, the Company does not separately measure or report corporate expenses, nor are theysuch expenses allocated tobetween the Company’s business segments. Accordingly, all corporate expenses are included in operating income of the Moody’s Investors Service segment and none have been allocated to the Moody’s KMV segment.
The Moody’s KMV business develops and distributes quantitative credit risk assessment products and services and credit processing software for banks, corporations and investors in credit-sensitive assets, credit training servicesassets.
In February 2005, Moody’s Board of Directors declared a two-for-one stock split to be effected as a special stock distribution of one share of common stock for each share of the Company’s common stock outstanding, subject to stockholder approval of a charter amendment to increase the Company’s authorized common shares from 400 million shares to 1 billion shares. At the Company’s Annual Meeting on April 26, 2005, Moody’s stockholders approved the charter amendment. As a result,
18
stockholders of record as of the close of business on May 4, 2005 received one additional share of common stock for each share of the Company’s common stock held on that date (the “Stock Split”). Such additional shares were distributed on May 18, 2005. All prior period share and credit process software.per share information has been restated to reflect the Stock Split.
Certain prior year amounts have been reclassified to conform to the current presentation.
Results of Operations
Year Ended December 31, 20042006 Compared With Year Ended December 31, 20032005
Total Company Results
Moody’s revenue for 2004in 2006 was $1,438.3$2,037.1 million, an increase of $191.7$305.5 million or 15.4%17.6% from $1,246.6$1,731.6 million for 2003.the same period of 2005. Moody’s achieved strong revenue growth above the rate of the overall corporation in a number of business sectors. U.S.global structured finance, was the largest contributor to year over year growth, primarily due to residential mortgage backed and home equity loan securities. Research experienced robust growth in all geographies. U.S. corporate finance growth was primarily due to revenue related toand research, and below the ratings of bank credit facilities and high yield issues. Globalcorporate rate in financial institutions contributed to growth as well, most notablyand MKMV, with a decline in the U.S. insurance and real estate sectors and the U.S. and European banking sectors.revenue from public finance.
Revenue in the United States was $911.2$1,277.8 million for 2004,in 2006, an increase of $115.9$192.4 million or 14.6%17.7% from $795.3$1,085.4 million for 2003.in 2005. Approximately $52 million80% of this increasethe U.S. growth was due to growth in structured finance. The U.S. residential mortgage backed and home equity sector was the largest contributor, driven by the favorable interest rate environmentstructured finance and a strong housing market. In addition, over $26 million of Moody’s U.S. revenue growth was contributed by corporate finance, primarily reflecting strong activity in the ratings ofissuance across most structured asset classes as well as corporate bonds and bank credit facilities and high yield bonds. The U.S. research business contributed about $20 million of growth. Theloans. Research, financial institutions and MKMV businesses contributed approximately $15 million and $8 million, respectively, to Moody’s United Statesyear-over-year growth . Public finance revenue in the U.S. declined by approximately $5 million year-to-year, mainly due to a 6% decline in dollar issuance in the municipal bond market.as well.
Moody’s international revenue was $527.1$759.3 million in 2004,2006, an increase of $75.8$113.1 million or 16.8%17.5% from $451.3$646.2 million in 2003. Foreign currency translation accounted for approximately $21 million of reported international revenue growth. Reported2005. International ratings revenue grew approximately $45$91 million versus the prior year, with about $27 million of that growth coming from structured finance. Europe contributed approximately 80%84% of the growth in international structured finance. Financial institutions andEurope where credit derivatives, corporate finance, commercial mortgage-backed and residential mortgage-backed sectors were primary drivers of growth. European research and MKMV contributed approximately $13 million and $6 million, respectively, to revenue growth. Researchgrowth as well. Foreign currency translation positively impacted international revenue growth ofby approximately $23 million was primarily in Europe. MKMV contributed approximately $8 million of revenue growth outside the U.S.$1 million.
Moody’s operating, selling, general and administrative expenses of $617.8$898.7 million in 20042006 were $66.9$141.9 million or 12.1% greater18.8% more than $550.9$756.8 million in 2003.2005. Compensation and benefits continue to be Moody’s largest expense, accounting for approximately two-thirds$103 million in growth from prior year. Moody’s average global staffing of
19
total expenses in 2004 and 2003. Moody’s increased its overall staffing by over 175 people, or 8%, more than 3,100 employees during 2004the year ended December 31, 2006 was approximately 15% higher than during the same prior year period. This increase includes hiring to support continuedbusiness growth mainly in the business.U.S. and European ratings businesses. The table below shows Moody’s staffing at year-end 20042006 compared with year-end 2003.
| December 31, 2004 | December 31, 2003 | |||||||||||||||||||||||
| United States | International | Total | United States | International | Total | |||||||||||||||||||
| Moody’s Investors Service | 1,350 | 709 | 2,059 | 1,258 | 655 | 1,913 | ||||||||||||||||||
| Moody’s KMV | 343 | 75 | 418 | 318 | 69 | 387 | ||||||||||||||||||
| Total | 1,693 | 784 | 2,477 | 1,576 | 724 | 2,300 | ||||||||||||||||||
| December 31, 2006 | December 31, 2005 | |||||||||||
| United States | International | Total | United States | International | Total | |||||||
Moody’s Investors Service | 1,843 | 1,106 | 2,949 | 1,600 | 919 | 2,519 | ||||||
Moody’s KMV | 304 | 97 | 401 | 303 | 74 | 377 | ||||||
Total | 2,147 | 1,203 | 3,350 | 1,903 | 993 | 2,896 | ||||||
Operating expenses were $ 375.4$539.4 million in 2004,2006, an increase of $28.1$86.5 million or 8%19.1% from $347.3$452.9 million in 2003.2005. The largest contributor to this increase was growth in compensation and benefits expense of $25$76 million, reflecting compensation increases, increased staffing and higher stock-based compensation expense. Moody’s global staffing reflected hiring primarily in the specialist teams that support Moody’s Enhanced Analysis Initiative, in several of Moody’s U.S. and internationalEuropean ratings businesses and at Moody’s KMV.to support business growth. Stock-based compensation expense increased $12.3$16.3 million year-over-year due, in part, to the final year of phasing in of expense over the current four-year equity plan vesting period and the effects of a higher share price on the value of the 2006 equity grants versus 2005, offset by additional expense recorded in the first quarter of 2005 related to the accelerated expensing of equity grants for employees at or near retirement eligibility. Expenses for 2005 included $3.2 million for the settlement of certain pension obligations.
Selling, general and administrative expenses were $359.3 million in 2006, an increase of $55.4 million or 18.2% from $303.9 million in 2005. Year-over-year expense increases included growth in compensation and benefits of $27 million, reflecting compensation increases, increased staffing in technology support and finance functions and $6.0 million related to stock-based compensation as discussed above. Additional 2006 expenses included increased rent and occupancy costs of approximately $12 million to support business expansion and costs associated with Moody’s new corporate headquarters. Expenses for 2005 included a charge of $9.4 million for the settlement of sales tax matters related to Moody’s operations in Japan from 2000 through June 30, 2005, which was a result of a tax audit by Japanese taxing authorities that was completed in the second quarter of 2005.
19
Operating income of $1,259.5 million in 2006, which included a 160.6 million gain on the sale of Moody’s corporate headquarters building in the fourth quarter of 2006, rose $319.9 million or 34.0% from $939.6 million in 2005. Excluding the gain on sale, operating income increased 17%. The effects of foreign currency translation reduced year-over-year growth in operating income by approximately $3 million. Moody’s operating margin for 2006 was 61.8% compared to 54.3% in 2005. The gain on the sale of the building increased the 2006 margin by approximately 790 basis points.
Moody’s reported $1.0 million of interest and other non-operating income (expense), net in 2006 compared with ($4.9) million in 2005. Interest expense was $15.2 million in 2006 and $21.0 million in 2005. The amounts included $14.9 million and $20.9 million of interest expense on Moody’s $300 million of notes payable for 2006 and 2005, respectively. Interest income was $18.2 million in 2006 compared to $26.0 million in 2005. The decrease was attributed to the liquidation of investment portfolios to finance share repurchases. Foreign exchange losses were immaterial in 2006 compared to $8.2 million in 2005. The year-over-year change was primarily due to the British pound and euro appreciating to the U.S. dollar.
Moody’s effective tax rate was 40.2% in 2006 compared to 40.0% in 2005. The 2006 and 2005 effective tax rates were reduced by benefits of $2.4 million and $8.8 million, respectively, related to legacy income tax matters, see “Contingencies – Legacy Tax Matters” below for further information. Additionally, Moody’s recognized a tax benefit of approximately $3 million related to additional foreign tax credits in the fourth quarter of 2006 and a tax benefit of $3.6 million in 2005 related to the repatriation of foreign earnings under the American Jobs Creation Act of 2004. The 2006 rate was also favorably impacted by approximately 30 basis points due to the settlement of state tax audits.
Net income was $753.9 million in 2006, an increase of $193.1 million or 34.4% from $560.8 million in 2005. Basic and diluted earnings per share for 2006 were $2.65 and $2.58, respectively, compared to basic and diluted earnings per share of $1.88 and $1.84, respectively, for 2005. Excluding the gain on sale, 2006 net income was $659.8 million, an increase of $99.0 million or 17.7%. Additionally, the gain contributed $0.33 and $0.32 relating to full year basic and diluted earnings per share, respectively.
Segment Results
Moody’s Investors Service
Revenue at Moody’s Investors Service in 2006 was $1,894.3 million, up $294.0 million or 18.4% from $1,600.3 million in 2005. Ratings revenue accounted for $250.6 million of growth with increased revenue in global structured finance, corporate finance and financial institutions and sovereign risk offsetting a decline in public finance. Double-digit growth in research also contributed to the increase in revenue. Foreign currency translation positively impacted revenue growth by approximately $1 million. Price increases also contributed to year-over-year growth in revenue.
Structured finance revenue was $886.7 million in 2006, an increase of $171.3 million or 23.9% from $715.4 million in the same period of 2005. Approximately $109 million of the increase was in the U.S., with the collateralized debt and commercial mortgage-backed sectors contributing about 96% of the U.S. increase. Year-over-year issuance of collateralized loan obligations and cash flow resecuritizations grew, in part, to the increased “repackaging” of securitized assets such as consumer asset-backed and mortgage-backed securities, as well as bank loans in collateralized debt obligations. Strong growth in commercial real estate collateralized debt obligation issuance was a key driver of overall commercial mortgage-backed issuance. International structured finance revenue grew approximately $62 million year-over-year, with Europe contributing about $58 million, where credit derivatives, commercial mortgage-backed and residential mortgage-backed sectors totaled 92% of the European growth. Foreign currency translation for structured finance positively impacted international revenue growth by approximately $2 million.
Corporate finance revenue was $396.2 million in 2006, up $73.0 million or 22.6% from $323.2 million in 2005. Revenue in the U.S. increased approximately 22% principally due to issuance related growth in bank loan and corporate bond ratings revenue. Investment grade bond issuance increased approximately 17% and high yield bond issuance increased approximately 43%, primarily due to significant mergers and acquisitions, leveraged buyouts and second lien loan activity. International corporate finance revenue increased approximately $28 million or about 24% due largely to increased corporate bond issuance and non-issuance related ratings fees in Europe. Price increases also contributed to year-over-year growth in global corporate finance revenue.
Revenue in the financial institutions and sovereign risk group was $266.8 million in 2006, an increase of $12.2 million or 4.8% from $254.6 million in 2005. In the U.S., revenue grew approximately $11 million, principally due to strength in insurance and real estate sectors. Internationally, revenue increased $1.5 million compared to the prior year period.
Public finance revenue was $85.9 million in 2006, a decrease of $5.9 million or 6.4% from $91.8 million in 2005. Dollar volume issuance in the municipal bond market declined compared to 2005, primarily due to lower refinancing activity.
20
Research revenue of $258.7 million in 2006 was $43.4 million or 20.2% higher than $215.3 million in 2005. Revenue grew by approximately $28 million in the U.S. and about $15 million internationally, with Europe accounting for approximately 41% of international growth. Research and analytics services accounted for approximately $17 million of global revenue growth primarily from credit research on the corporate finance, financial institutions and the structured finance related businesses. Revenue from the licensing of Moody’s information to financial customers for internal use and redistribution was approximately $57 million in 2006, an increase of approximately $8 million, or about 17% higher than the prior year.
Moody’s Investors Service operating, selling, general and administrative expenses, including corporate expenses, were $789.1 million in 2006, an increase of $143.7 million or 22.3% from $645.4 million in 2005. The largest contributor to 2006 expenses was growth in compensation and benefits of approximately $110 million reflecting compensation increases, increased staffing primarily in the U.S. and European ratings businesses and higher stock-based compensation expense of $21.4 million. Furthermore, expenses in 2006 included increased rent and occupancy costs of approximately $11 million to support business expansion and costs associated with Moody’s new corporate headquarters. Additional increases were due to increased information technology investment spending of approximately $8 million offset by a decrease of approximately $6 million in legal fees. Expenses for 2005 included a charge of $9.4 million for the settlement of sales tax matters related to Moody’s operations in Japan from 2000 through June 30, 2005, which was a result of a tax audit by Japanese taxing authorities that was completed in the second quarter of 2005. Additionally, expenses in 2005 included $3.2 million for the settlement of certain pension obligations. Foreign currency translation contributed approximately $4 million to year-to-year growth in reported expenses.
Moody’s Investors Service operating income of $1,242.9 million in 2006 was up $306.6 million or 32.7% from $936.3 million in 2005, which included a $160.6 million gain on the sale of Moody’s corporate headquarters building in the fourth quarter of 2006. Excluding the gain, operating income increased 15.6%. The effects of foreign currency translation reduced year-to-year growth in operating income by approximately $3 million.
Moody’s KMV
MKMV revenue of $142.8 million in 2006 was $11.5 million or 8.8% more than the same period in 2005. MKMV’s revenue growth reflected increased demand for credit decision-making software and software related maintenance services, which grew approximately 10% or $2.7 million compared to 2005. Growth in subscriptions revenue related to credit risk assessment products grew approximately 5% or $4.9 million compared to prior year and risk services revenue increased approximately $4 million or about 36% compared to prior year. In 2006, international MKMV revenue accounted for 56% of its global revenue.
MKMV’s operating, selling, general and administrative expenses were $109.6 million in 2006, a decrease of $1.8 million or 1.6% from $111.4 million in 2005. The 2006 expenses include a total of $3.5 million due to training and recruitment, sales and marketing expenses. Additionally, 2006 expenses include a $2.2 million charge recorded in connection with a non-income tax matter. The 2005 expenses included approximately $7 million related to severance costs, the write-off of capitalized software development and a liability for unpaid overtime due to certain employees. MKMV operating income was $16.6 million for 2006 compared with $3.3 million in 2005. Currency translation did not have a significant year-to-year impact on MKMV results.
Year Ended December 31, 2005 Compared With Year Ended December 31, 2004
Total Company Results
Moody’s revenue for 2005 was $1,731.6 million, an increase of $293.3 million or 20.4% from $1,438.3 million during 2004. Moody’s achieved strong revenue growth in several business sectors, including global structured finance, financial institutions and research, international corporate finance and U.S. public finance.
Revenue in the United States was $1,085.4 million for 2005, an increase of $174.2 million or 19.1% from $911.2 million in 2004. Approximately 85% of the U.S. growth was driven by structured finance and research, reflecting strong issuance across all structured asset classes and continued demand for core research products. U.S. financial institutions, public finance and corporate finance contributed to year-to-year growth as well.
Moody’s international revenue was $646.2 million in 2005, an increase of $119.1 million or 22.6% from $527.1 million in 2004. International ratings revenue grew approximately $86 million versus the prior year, with approximately 77% of the growth related to Europe of which financial institutions contributed approximately $31 million of revenue growth primarily due to increased issuance and new ratings relationships. European structured finance, research and corporate finance contributed to growth as well. Favorable foreign currency translation accounted for approximately $7 million of reported international revenue growth.
21
Moody’s operating, selling, general and administrative expenses of $756.8 million in 2005 were $139.0 million or 22.5% greater than $617.8 million in 2004. Compensation and benefits continue to be Moody’s largest expense, accounting for more than 70% of total expenses in 2005 and 2004. Moody’s average global staffing of approximately 2,700 employees during the year ended December 31, 2005 was approximately 12% higher than during the same prior year period. This increase includes approximately 100 people due to the acquisition of Economy.com in November 2005 and hiring to support business growth mainly in the U.S. and European ratings businesses. The table below shows Moody’s staffing at year-end 2005 compared with year-end 2004.
| December 31, 2005 | December 31, 2004 | |||||||||||
| United States | International | Total | United States | International | Total | |||||||
Moody’s Investors Service | 1,600 | 919 | 2,519 | 1,358 | 761 | 2,119 | ||||||
Moody’s KMV | 303 | 74 | 377 | 329 | 68 | 397 | ||||||
Total | 1,903 | 993 | 2,896 | 1,687 | 829 | 2,516 | ||||||
Operating expenses were $452.9 million in 2005, an increase of $77.5 million or 20.6% from $375.4 million in 2004. The largest contributor to this increase was growth in compensation and benefits expense of $62.7 million, reflecting compensation increases, increased staffing, higher stock-based compensation expense and $3.2 million for the settlement of certain pension obligations. Moody’s global staffing reflected the acquisition of Economy.com in November 2005 and hiring primarily in the U.S. and European ratings businesses to support business growth. Stock-based compensation expense increased $18.7 million year-to-year. As more fully discussed in NoteNotes 2 and 11 to the consolidated financial statements, the Company adopted the fair value method provisions of SFAS No. 123 prospectively beginning on January 1, 2003. The year-to-year increase in expense principally reflects the phasing in of expense over the current four-year equity plan vesting period as annual equity grants are made, as well as the effecteffects of a higher share price on the value of the 2005 equity grants versus 2004, and additional expense recorded in the first quarter of 2005 related to the accelerated expensing of equity grants.grants for employees at or near retirement eligibility. Outside service fees increased by approximately $7 million of which approximately $6 million relates to information technology investment spending.
Selling, general and administrative (“SG&A”) expenses were $303.9 million in 2005, an increase of $61.5 million or 25.4% from $242.4 million in 2004, an increase of $38.8 million or 19% from $203.6 million in 2003.2004. Year-to-year expense increases included growth in compensation and benefits of $24$29.4 million, reflecting compensation increases, increased staffing in finance and $4.7technology support functions and $8.3 million related to stock-based compensation as discussed above. Additional increases were due to higher rent and occupancy costsAdditionally, as a result of approximately $4a tax audit by Japanese taxing authorities that was completed in the second quarter of 2005, expenses for 2005 included a charge of $9.4 million to support business expansion, and higher professional services costs, including spendingfor the settlement of approximately $5 millionsales tax matters related to Sarbanes-Oxley compliance.Moody’s operations in Japan from 2000 through June 30, 2005. Outside service fees increased by approximately $6 million of which approximately $3 million relates to information technology investment spending and about $2 million relates to legal fees.
Operating income of $939.6 million in 2005 rose $153.2 million, or 19.5% from $786.4 million in 2004 rose $123.3 million or 18.6% from $663.1 million in 2003. Foreign2004. Favorable foreign currency translation contributed approximately $6 million to operating income growth. Moody’s operating margin for 20042005 was 54.7%54.3% compared to 53.2%54.7% in 2003. The increase in margin principally reflected better-than-expected revenue growth.2004.
Moody’s reported $15.1$4.9 million of interest and other non-operating expense, net in 20042005 compared with $6.7$15.1 million in 2003. The 2003 amount included a gain of $13.6 million on an insurance recovery related to the September 11th tragedy, as discussed in Note 18 to the consolidated financial statements.2004. Interest expense was $21.0 million in 2005 and $23.0 million in 2004 and $23.5 million in 2003.2004. The amounts in both periods included $20.9 million and $22.8 million of interest expense on Moody’s $300 million of private placement debt.notes payable for 2005 and 2004, respectively. Interest income was $26.0 million in 2005 compared to $6.8 million in 2004 compared to $1.7 million in 2003.2004. The increase was due to a higher average investment balance as well as an increase in the weighted average yield. Foreign exchange (losses)/gains were ($8.2) million and $1.9 million in 2005 and $2.2 million in 2004, respectively. The year-over-year change was primarily due to the appreciation of the U.S. dollar versus the British pound and 2003, respectively.the euro.
Moody’s effective tax rate was 40.0% in 2005 compared to 44.9% in 2004 compared to 44.6% in 2003.2004. The 2004 and 2003 effective tax rates included charges aggregating approximately$8.8 million in credits and $30.0 million and $16.2 million, respectively, for increasesin charges due to changes in reserves in 2005 and 2004, respectively, related to legacy income tax exposures that were assumed by Moody’s in connection with its separation from The Dun & Bradstreet CorporationOld D&B in October 2000 (see Contingencies“Contingencies – Legacy Tax Matters,Matters”, below). Additionally, Moody’s recognized a tax benefit of $3.6 million in 2005 related to the repatriation of foreign earnings under the American Jobs Creation Act of 2004.
Net income was $560.8 million in 2005, an increase of $135.7 million or 31.9% from $425.1 million in 2004, an increase of $61.2 million or 16.8% from $363.9 million in 2003.2004. Basic and diluted earnings per share for 20042005 were $2.86$1.88 and $2.79,$1.84, respectively, compared to basic and diluted earnings per share of $2.44$1.43 and $2.39,$1.40, respectively, for 2003.2004.
20
22
Segment Results
Moody’s Investors Service
Revenue at Moody’s Investors Service revenue for 20042005 was $1,310.7$1,600.3 million, up $176.0$282.8 million or 15.5%21.5% from $1,134.7$1,317.5 million in 2003.2004. Ratings revenue accounted for $241.2 million of growth with approximately 80% of that growth coming from global structured finance and European financial institutions. Good growth was achieved in a number of ratings sectors as well as in research. Foreign currency translation contributed approximately $21 million to reported revenue growth, reflecting the depreciation of the U.S. dollar, mainly versus the Euro. Price increases also contributed to year-to-year growth in reported revenue.
Structured finance revenue was $538.6 million for 2004, an increase of $78.0 million or 16.9% from $460.6 million in the same period of 2003. Approximately $51 million of this increase was in the United States, with the residential mortgage and home equity sector contributing nearly $34 million of this amount. In this sector, growth was driven by increases in mortgage lending and home equity loans due to low interest rates, a strong housing market, and gains in market coverage. Good growth was also achieved in U.S. revenue from ratings of collateralized debt obligations (where the count of issues was up approximately 27% versus the prior year) and ratings of commercial mortgage backed securities (driven by record market issuance). International structured finance revenue grew approximately $27 million; about 80% of the growth was attributable to Europe, with growth in all asset classes. Foreign currency translation contributed approximately $9 million to year-to-year growth in global structured finance revenue. Price increases also contributed to year-to-year growth.
Corporate finance revenue was $311.5 million in 2004, up $32.7 million or 11.7% from $278.8 million in 2003. Revenue grew by approximately $26 million in the United States, reflecting strong growth in ratings of speculative-grade bonds as well as syndicated bank loans and other areas not related to public debt issuance. Price increases also contributed to revenue growth in this sector. These positive impacts were partially offset by the effects of a year-to-year decline in issuance of investment grade securities in the U.S. markets. International corporate finance revenue grew approximately $6 million, with roughly one-half of the growth attributed to foreign currency translation. Underlying revenue growth primarily reflected higher issuance volumes in Asia outside of Japan and Australia. Issuance in Europe was weak compared to 2003. Speculative grade issuance was strong, but investment grade issuance declined year-to-year as improved corporate profitability reduced borrowing needs and mergers and acquisitions remained weak.
Revenue in the financial institutions and sovereign risk group was $208.9 million for 2004, an increase of $27.7 million or 15.3% from $181.2 million in 2003. In the U.S., revenue grew $15 million year-to-year, principally reflecting refinancings in the real estate sector, new relationships in the insurance sector, and strong banking issuance as interest rate spreads tightened. Revenue from outside the U.S. grew approximately $13 million over the prior year, primarily in Europe. European growth reflected modest increases in issuance volumes, primarily in the banking sector, and good growth from new rating relationships. Foreign currency translation contributed approximately $3 million to revenue growth.
Public finance revenue was $82.2 million for 2004, a decrease of $5.0 million or 5.7% from $87.2 million in 2003. Dollar issuance in the municipal bond market declined 6% versus the same period in 2003, reflecting higher borrowing costs, a reduced pool of debt that was refunded and reduced borrowing needs due to strengthened tax receipts.
Research revenue of $169.5 million for 2004 was $42.6 million or 33.6% higher than the $126.9 million reported in 2003. Revenue grew by approximately $20 million in the U.S. and $16 million in Europe. The strong performance reflected growth in licensing of Moody’s information to financial customers for internal use and redistribution, sales of new products to existing clients and new clients. Foreign currency translation also contributed approximately $6 million to year-to-year growth in reported revenue.
Moody’s Investors Service operating, selling, general and administrative expenses, including corporate expenses, were $513.7 million in 2004, an increase of $51.5 million or 11.1% from $462.2 million in 2003. Compensation and benefits expense accounted for $37 million of the expense growth. This increase included $15.0 million related to stock-based compensation, as discussed above. The growth also reflected compensation increases and staffing
21
growth in many areas, including the specialist teams that support Moody’s Enhanced Analysis Initiative. Additionally, rent and occupancy costs increased approximately $5 million due to business expansion. Year-to-year expense growth also includes higher professional services costs. Foreign currency translation contributed approximately $14 million to year-to-year growth in reported expenses. Depreciation and amortization expense was $16.9 million in 2004 versus $15.4 million in 2003.
Moody’s Investors Service operating income of $780.1 million in 2004 was up $123.0 million or 18.7% from $657.1 million in 2003. Foreign currency translation contributed approximately $7 million to the year-to-year growth in operating income.
Moody’s KMV
Moody’s KMV revenue of $127.6 million for 2004 was up $15.7 million or 14.0% from $111.9 million in 2003. Revenue grew by approximately $8 million in the U.S. and approximately $4 million in Europe. About $14 million of MKMV’s global revenue growth was related to subscriptions for its credit risk assessment products, including CreditEdge™, RiskCalc™ and Portfolio Manager™, representing high teens percent revenue growth. Sales of MKMV’s credit processing software and training products accounted for approximately $2 million of revenue growth.
MKMV’s operating, selling, general and administrative expenses were $104.1 million for 2004, an increase of $15.4 million or 17.4% from $88.7 million for 2003. The year-to-year increase primarily reflected growth of $11 million in compensation and related expenses. This reflected higher staffing to support the continued growth of the business as well as a $2.0 million increase related to stock-based compensation, as discussed above. Depreciation and amortization expense was $17.2 million in both 2004 and 2003. MKMV operating income was $6.3 million for 2004 compared with $6.0 million for 2003. The effects of foreign currency translation reduced MKMV reported year-to-year growth in operating income by approximately $2 million.
Year Ended December 31, 2003 Compared With Year Ended December 31, 2002
Total Company Results
Moody’s revenue for 2003 was $1,246.6 million, an increase of $223.3 million or 21.8% from $1,023.3 million in the prior year. Assuming that Moody’s had acquired KMV on January 1, 2002, Moody’s pro forma 2002 revenue would have been $1,038.4 million and year-to-year pro forma growth in 2003 would have been 20.1%. The Company benefited from strong growth in a number of U.S. ratings sectors, including residential mortgage-backed securities, home equity loan securitizations and the high yield segment of the corporate bond market, and from strong corporate issuance in Europe in the second half of the year. Moody’s research business produced very strong results and Moody’s KMV also generated good growth. In addition, foreign currency translation accounted for approximately $22 million of reported revenue growth.
Revenue in the United States was $795.3 million for 2003, an increase of $114.5 million or 16.8% from $680.8 million in 2002. Assuming that Moody’s had acquired KMV on January 1, 2002, pro forma United States revenue for 2002 would have been $688.4 million and year-to-year pro forma growth would have been 15.5%. Strong growth was achieved within Moody’s Investors Service, led by structured finance, corporate finance and research.
Moody’s international revenue was $451.3 million in 2003, an increase of $108.8 million or 31.8% over $342.5 million in 2002. Assuming that Moody’s had acquired KMV on January 1, 2002, pro forma international revenue for 2002 would have been $350.0 million and year-to-year pro forma growth would have been 28.9%. Growth was driven by strong performance in Europe and several other regions, with foreign currency translation accounting for approximately 650 basis points of reported revenue growth. International revenue accounted for 36% of Moody’s total revenue in 2003, compared with 33% in the prior year.
22
Overall, Moody’s expenses of $550.9 million in 2003 were $90.3 million or 19.6% greater than $460.6 million in 2002. Compensation and benefits continues to be Moody’s largest expense, accounting for approximately two-thirds of total expenses in 2003 and 2002. Moody’s increased its overall staffing by almost 200 people, or 9%, during 2003 to support continued growth in the business. The table below shows Moody’s staffing at year-end 2003 compared with year-end 2002.
| December 31, 2003 | December 31, 2002 | |||||||||||||||||||||||
| United States | International | Total | United States | International | Total | |||||||||||||||||||
| Moody’s Investors Service | 1,258 | 655 | 1,913 | 1,171 | 606 | 1,777 | ||||||||||||||||||
| Moody’s KMV | 318 | 69 | 387 | 276 | 57 | 333 | ||||||||||||||||||
| Total | 1,576 | 724 | 2,300 | 1,447 | 663 | 2,110 | ||||||||||||||||||
Operating expenses were $347.3 million in 2003, an increase of $62.0 million or 21.7% from $285.3 million in 2002. Assuming that Moody’s had owned KMV for all of 2002, pro forma operating expenses would have been $290.1 million in 2002, and year-to-year growth would have been $57.2 million or 19.7%. The largest contributor to this increase was growth in compensation and benefits expense of $48 million. This reflected compensation increases as well as increased staffing in Europe, the global structured finance business, the specialist teams that support Moody’s Enhanced Analysis Initiative, and MKMV. The year-to-year operating expense increase also reflected $8.0 million related to the Company’s change in accounting for stock-based compensation, mainly for stock options granted in February 2003.
Selling, general and administrative (“SG&A”) expenses were $203.6 million in 2003, an increase of $28.3 million or 16.1% from $175.3 million in 2002. Assuming that Moody’s had owned KMV for all of 2002, pro forma SG&A expenses would have been $183.1 million in 2002, and year-to-year growth would have been $20.5 million or 11.2%. Year-to-year expense increases included higher professional fees of $4 million, mainly for legal costs, increased compensation and benefits of approximately $4 million, higher rent and occupancy costs to support business expansion, and $2.8 million related to the Company’s change in accounting for stock-based compensation, mainly for stock options granted in February 2003.
Depreciation and amortization expense increased to $32.6 million in 2003 from $24.6 million in 2002. Amortization of acquired software and intangible assets related to the KMV acquisition was $8.8 million in 2003 compared with $6.3 million in 2002. If the acquisition of KMV had been completed as of January 1, 2002, pro forma depreciation and amortization would have been $27.7 million in 2002 and the pro forma year-to-year increase would have been $4.9 million. This increase was principally related to computer hardware and software placed into service during 2003.
Operating income of $663.1 million in 2003 rose $125.0 million or 23.2% from $538.1 million in 2002. This increase was primarily the result of the revenue growth mentioned above. The strength of foreign currencies, especially the Euro, relative to the U.S. dollar accounted for approximately $8 million of reported operating income growth. Moody’s operating margin for 2003 was 53.2% compared to 52.6% in 2002. The increase reflected the strong growth in revenue in the Moody’s Investors Service business without a proportional increase in expenses. Partially offsetting this impact were: (1) growth in Moody’s KMV revenue at a lower incremental margin than the Moody’s Investors Service business; and (2) 2003 expense of $10.8 million related to stock-based compensation with no counterpart in 2002.
Interest and other non-operating expense, net was $6.7 million in 2003 compared with $20.7 million in 2002. The 2003 amount included a gain of $13.6 million on an insurance recovery related to the September 11th tragedy, as discussed in Note 18 to the consolidated financial statements. Interest expense was $23.5 million in 2003 and 2002. The amounts in both periods included $22.8 million of interest expense on Moody’s $300 million of private placement debt. Interest income was $1.7 million in 2003, down from $2.3 million in 2002 despite higher invested cash, due to lower U.S. interest rates in 2003 compared to 2002. Foreign exchange gains were $2.2 million in 2003 and $0.3 million in 2002.
23
Moody’s effective tax rate was 44.6% in 2003 compared to 44.2% in 2002. The 2003 effective tax rate included the impact of a $16.2 million increase in reserves related to legacy income tax exposures that were assumed by Moody’s in connection with its separation from The Dun & Bradstreet Corporation in October, 2000 (see Contingencies – Legacy Tax Matters, below). This charge accounted for a 250 basis point increase in the effective rate in 2003. This increase was partially offset by the favorable impacts of continued operating growth in jurisdictions with lower tax rates than New York and tax benefits from the establishment of a New York captive insurance company during 2002.
Net income was $363.9 million in 2003, an increase of $75.0 million or 26.0% from $288.9 million in 2002. Earnings per share were $2.44 basic and $2.39 diluted in 2003, compared with $1.88 basic and $1.83 diluted in 2002.
Segment Results
Moody’s Investors Service
Revenue at Moody’s Investors Service for 2003 was $1,134.7 million, up $192.9 million or 20.5% from $941.8 million in 2002. Good growth was achieved in a number of ratings sectors as well as in research. Foreign currency translation accounted for approximately $22$7 million of reported revenue growth. Price increases also contributed to year-to-year growth in reported revenue.
Structured finance revenue was $460.6$715.4 million for 2003,2005, an increase of $76.3$162.3 million or 19.9%29.3% from $384.3$553.1 million in 2002.2004. Approximately $48$129 million of thisthe increase was in United States revenue, which grew in the mid-teens percent range, and $28 million was in international, which grew in the low twenty percent range. In the United States,U.S., with the residential mortgage, collateralized debt and commercial mortgage sectors, contributing approximately 88% of this amount. Attractive mortgage products, such as low-adjustable-rate mortgages, as well as rising home equity loan sector contributed $15 million of revenue growth, as low interest rates drove strong refinancing activity. Good growth was also achievedprices and continued strength in revenue from ratings of asset backed securities, reflecting year-to-year growth of about 10%the new housing market were key drivers in issuance volumes, particularly student loans, and higher average prices due to more complex transactions. Revenue from ratings of credit derivatives also grew year-to-year. Outside the United States, European structured finance was the main growth driver, contributing $24 million of year-to-year revenue growth. This principally reflected growth inproviding assets for residential mortgage securitizations. Demand for collateralized debt obligations increased as an ample supply of collateralized loan obligations and residential mortgage backed securities. Foreign currency translation and price increases also contributed to year-to-yearcash flow resecuritizations drove issuance higher. Global commercial mortgage-backed revenue was approximately $119 million, about 47% more than prior year, as record issuance drove revenue growth in globalduring the year. International structured finance revenue.revenue grew approximately $33 million year-to-year, with Europe contributing about $23 million.
Corporate finance revenue was $278.8$323.2 million for 2005, up $23.6 million or 7.9% from $299.6 million in 2003, up $51.1 million or 22.4% from $227.7 million in 2002.2004. Revenue grew by $27 millionincreased modestly in the United States, where the number of speculative grade issues rose significantly year-to-year due to refinancings and new issuers. In addition, the number of investment grade issuance transactions increased nearly 10% year-to-year, although dollar issuance declined. U.S., as declines in high yield revenue growth was also derivedlargely offset higher revenue from areas not related to public debt issuance such as syndicated bank loan ratings and relationship-based fees. In Europe, revenue grew by $19 million year-to-year. The dollar volume of issuance was up nearly 40% primarily due to refinancing activity (as spreads tightened)issuance related growth, an increase in first time rated issuers and price increases related in part to Moody’s Enhanced Analysis Initiative. High yield bond issuance declined approximately 31% as many issuers shifted to the leveraged loan markets for financing needs. Conversely, investment grade corporate debt issuance increased about 5% compared to 2004, as numerous large deals came to market in the transportation, energy and technology sectors. International corporate finance revenue increased approximately $18 million or about 19% due to new issuers accessing the market.ratings mandates in Europe and Asia and increased investment grade corporate bond issuance. Price increases also contributed to year-to-year growth in global corporate finance revenue.
Revenue in the financial institutions and sovereign risk group was $181.2$254.6 million for 2003,2005, an increase of $26.2$45.7 million or 16.9%21.9% from $155.0$208.9 million for 2002. The year-to-year growth was almost wholly due to Europe, where revenue growth exceeded 40%. This reflected a substantial year-to-year increase in issuance and the addition of new issuers.2004. In the U.S., revenue was flat versus stronggrew approximately $11 million, principally due to strength in issuance volume in insurance and a number of new rating assignments in the insurance, finance and securities sectors. Internationally, revenue grew approximately $35 million compared to the prior year comparisons.period, primarily due to increased issuance and new ratings mandates in Europe. European issuance was particularly strong in the banking and insurance sectors. Price increases, in part, related to Moody’s Enhanced Analysis Initiative, which also contributed to year-to-year growth in global financial institutions revenue growth over the prior year.revenue.
Public finance revenue of $87.2was $91.8 million for 2003 was up $6.02005, an increase of $9.6 million or 7.4%11.7% from $81.2$82.2 million for the same period in 2002.2004. Dollar issuance in the municipal bond market grew 5% versus 2002, but issuancewas approximately $409 billion or about 14% more than the same period in 2004, as issuers took advantage of low longer-term interest rates and narrow spreads between long and short-term notes declined year-to-year.rates, which favored advance refinancings. Refinancings represented approximately 34%45% of total dollar issuance in 2003 versus 33% in 2002.2005 as compared to approximately 36% during 2004.
Research revenue increased $33.3of $215.3 million for 2005 was $41.6 million or 35.6% to $126.923.9% higher than the $173.7 million for 2003, compared with $93.6 million for 2002.reported in 2004. Revenue grew by $18approximately $19 million in the U.S. and $13about $22 million in Europe. The strong performance was driven by
24
internationally with Europe accounting for approximately 76% of international growth. Research and analytics services accounted for approximately $26 million of global revenue growth inprimarily from credit research on corporate and financial institutions and the structured finance related business. Revenue growth from the licensing of Moody’s information to financialinstitutional customers for internal use and redistribution saleswas approximately $48 million, an increase of new products to existing clients and new clients.about $13 million, or approximately 37% from the prior year. Research revenue includes the results of Economy.com from November 17, 2005, the acquisition date. Foreign currency translation also contributed about $4 million to year-to-year growth in reportedinternational research revenue.
Moody’s Investors Service operating, selling, general and administrative expenses, including corporate expenses, were $462.2$645.4 million in 2003,2005, an increase of $76.5$127.4 million or 19.8%24.6% from $385.7$518.0 million in 2002. Compensation2004. The largest contributor to this increase was growth in compensation and benefits of $86.8 million reflecting compensation increases, increased staffing primarily in the U.S. and European ratings businesses, higher stock-based compensation expense accountedof $25.7 million and $3.2 million for $52the settlement of certain pension obligations. As a result of a tax audit by Japanese taxing authorities that was completed in the second quarter of 2005, expenses for 2005 included a charge of $9.4 million for the settlement of sales tax matters related to Moody’s operations in Japan from 2000 through June 30, 2005. Outside service fees increased by approximately $13 million of the total expense growth. This reflected compensation increaseswhich approximately $9 million relates to information technology investment spending and staffing growth in Europe and the global structured finance business as well as the specialist teams that support Moody’s Enhanced Analysis Initiative. Despite the increase in staffing, incentive compensation decreased slightly year-to-year dueabout $2 million relates to lower growth in the Company’s operating results in 2003 compared with 2002. Other year-to-year expense increases included: $9.6 million related to the Company’s change in accounting for stock-based compensation (mainly related to stock options granted in February 2003); $7 million for increased professional fees, mainly for legal fees and technology consulting costs; and $4 million related to rent, occupancy and travel related costs in connection with business expansion.fees. Foreign currency translation also contributed approximately $1 million to year-to-year growth in reported expenses. Depreciation and amortization expense was $15.4 million in 2003 versus $12.7 million in 2002. The year-to-year increase of $2.7 million principally related to computer hardware and software placed into service during 2003.
23
Moody’s Investors Service operating income of $657.1$936.3 million in 20032005 was up $113.7$154.1 million or 20.9%19.7% from $543.4$782.2 million in 2002.2004. Foreign currency translation contributed approximately $6 million to the year-to-year growth in operating income.
Moody’s KMV
Moody’s KMV
The following table shows Moody’s KMV reported results revenue of $131.3 million for 2003 compared with2005 was $10.5 million or 8.7% more than the reported results for 2002 (the “reported comparisons”),same period in 2004. MKMV’s revenue growth reflected increasing demand from risk products and compared with 2002 on a pro forma basis presented as if Moody’s had acquired KMV on January 1, 2002 (the “pro forma comparisons”),credit decisioning software and software related consulting. Growth in a manner consistent with SFAS No. 141 and as further described in Note 5subscriptions revenue related to the consolidated financial statements. The discussion of MKMV results of operations that follows is based on the pro forma comparisons.
| Reported Comparisons | Pro Forma Comparisons | |||||||||||||||||||||||||||
| 2003 Variance to 2002 | 2003 Variance to 2002 | |||||||||||||||||||||||||||
| (dollars in millions) | 2003 | 2002 | $ | % | 2002 | $ | % | |||||||||||||||||||||
| Revenue | $ | 111.9 | $ | 81.5 | $ | 30.4 | 37.3 | % | $ | 96.6 | $ | 15.3 | 15.8 | % | ||||||||||||||
| Operating expenses | 88.7 | 74.9 | 13.8 | 18.4 | % | 87.5 | 1.2 | 1.4 | % | |||||||||||||||||||
| Depreciation and amortization | 17.2 | 11.9 | 5.3 | 44.5 | % | 15.0 | 2.2 | 14.7 | % | |||||||||||||||||||
| Operating income (loss) | $ | 6.0 | ($5.3 | ) | $ | 11.3 | ($5.9 | ) | $ | 11.9 | ||||||||||||||||||
MKMV’s pro forma year-to-year revenue increase in 2003 principally reflected $12 million of growth in subscription revenue from credit risk assessment products including Credit EdgeTM, RiskCalcTM, and Portfolio ManagerTM. Revenue from license fees and maintenance relatedgrew approximately $6 million or about 6% compared to credit processing software grew $2 million year-to-year.prior year, but was adversely affected by higher cancellation rates, due in part to bank consolidations. In 2005, international revenue accounted for approximately 56% of global revenue.
Operating,MKMV’s operating, selling, general and administrative expenses in 2003 increased slightly compared to pro forma 2002 expenses. Compensation and benefits expense was flat year-to-year. The impactswere $111.4 million for 2005, an increase of compensation increases and higher staffing to support the continued growth of the business were offset by lower expenses$11.6 million or 11.6% from $99.8 million for incentive compensation due to below target operating performance in 2003, whereas performance was above target in 2002. Commission expense for third party distributors declined due to lower sales from this source in 2003. Expenses in 20032004. This increase included $1.2$1.3 million related to the Company’s change in accounting for stock-based compensation, mainly for options granted in February 2003. Pro forma depreciation and amortizationas discussed above. The 2005 expense reflected $8.8also included approximately $7 million of amortization of acquired KMV software and intangible assets in each period. The pro forma year-to-year increase in depreciation and amortization expense was primarily duerelated to increased amortizationseverance costs, the write-off of capitalized software development costs.and a liability for unpaid overtime due to certain employees. MKMV operating income was $3.3 million for 2005 compared with $4.2 million for 2004. Currency translation did not have a significant year-to-year impact on MKMV results.
25
Market Risk
Moody’s maintains operations in 1921 countries outside the United States. Approximately 25%29% of the Company’s revenue was billed in currencies other than the U.S. dollar in 2004,2006, principally the Euro.British pound and the euro. Approximately 30%36% of the Company’s expenses were incurred in currencies other than the U.S. dollar in 2004,2006, principally the EuroBritish pound and the British Pound.euro. As such, the Company is exposed to market risk from changes in foreign exchange rates.
As of December 31, 2004,2006, approximately 18%30% of Moody’s assets were located outside the U.S. Of Moody’s aggregate cash and cash equivalents of $606.1$408.1 million at December 31, 2004,2006, approximately $102$232 million was located outside the United States (with $83$121 million in the U.K.), making the Company susceptible to fluctuations in foreign exchange rates. Additionally, of Moody’s aggregate short-term investments of $75.4 million, approximately $14 million were located outside the United States. The effects of changes in the value of foreign currencies relative to the U.S. dollar on assets and liabilities of non-U.S. operations with non-U.S. functional currencies are charged or credited to the cumulative translation adjustment in shareholders’ equity.
Moody’s cash equivalents consist of investments in high quality short-terminvestment grade securities within and outside the United States. By policy, theThe Company limits the amount it can invest with any one issuer and allocatesmanages its credit risk exposure by allocating its cash equivalents among various money market mutual funds short-term certificates of deposit orand issuers of high-grade commercial paper.
Short-term investments primarily consist of high quality investment grade auction rate securities within the United States. The Company has not engaged in foreign currency hedging transactions nor doesmanages its credit risk exposure on cash equivalents and short-term investments by limiting the Company haveamount it can invest with any derivative financial instruments. However, thesingle issuer.
The Company continues to assess the need to enter into hedging transactions to limit its risk due to fluctuations in exchange rates andrates. In 2006, the Company entered into two insignificant hedging transactions using purchased put options designated as cash flow hedges to protect against foreign currency exchange rate risks from forecasted billings denominated in euros. Under the Company’s current foreign exchange hedging program, the Company hedges currency risk exclusively for the purpose of reducing volatility in the Company’s cash flows. Such hedging activities may be ineffective or may not offset more than a portion of the adverse financial impact resulting from currency variations. Gains or losses associated with hedging activities also may impact revenue. The Company continues to assess the need to enter into suchfuture hedging transactions inand the future.Company does not have any material derivative financial instruments outstanding as of December 31, 2006.
Liquidity and Capital Resources
Cash Flow
The Company is currently financing its operations, and capital expenditures and share repurchases through cash flow from operations. Net cash provided by operating activities was $519.7$752.5 million, $468.4$707.9 million and $334.8$526.2 million for the years ended December 31, 2004, 20032006, 2005 and 2002.2004.
Moody’s net cash provided by operating activities in 20042006 increased by $51.3$44.6 million compared with 2003.2005. Growth in net income contributed $193.1 million to cash provided by operating activities. The 2006 cash flows include a decrease
24
relating to excess tax benefits from stock-based compensation plans of $103.2 million that are now classified as a cash flow from financing activities as required under SFAS No. 123R. Prior to the adoption of SFAS No. 123R in the first quarter of 2006, excess tax benefits relating to stock-based compensation was presented in the consolidated statements of cash flows as an operating cash flow, along with other tax cash flows. The operating cash flow includes a decrease of $160.6 million from the gain on sale of the Company’s headquarters building. The cash proceeds are reported as an investing activity in the statement of cash flows. The change in accounts receivable is attributable to increases in revenue offset by improved collection. Additionally, Moody’s deposited approximately $40 million with the IRS in the first quarter of 2006 relating to Amortization Expense Deductions, as discussed in Note 16 to the consolidated financial statements. This deposit was recorded in other assets. Tax payments increased by $53 million in 2006 versus 2005 offset by increases in income taxes payable due to growth in pre-tax net income. An increase in deferred revenue increased cash flow from operations by $28 million which is due to increased volume in annual and initial fees in both the ratings and research businesses.
Moody’s net cash provided by operating activities in 2005 increased by $181.7 million compared with 2004. Contributing to this growth was the increase in net income of $61.2$135.7 million, which included increases inhigher non-cash expenses of $17.0 million related to stock-based compensation expense of $27.0 million and $13.8 million related to legacy tax provisions for which cash payments have not yet been made. In addition, cashhigher tax benefits from the exercise of stock options of $14.3 million. Improved collection of accounts receivable also benefited cash flow from operations by approximately $40 million. In addition, timing of quarterly federal, state and international income tax payments and growth in the tax provision for 2005 compared with 2004 exceeded the prior yearcontributed $56.7 million to year-to-year growth in cash provided by $22.6 million.operating activities. Partially offsetting these sourcesbenefits were the payment of cash in 2004 were negative effects due to timing of income tax payments. In 2004, the Company made approximately $47 million of income tax payments related to 2003 tax liabilities. This includes approximately $11$46.8 million related to the changesettlement of legacy tax matters as well as a $38.8 million reduction in treatment ofyear-over-year non-cash legacy income tax benefits for stock options outstanding prior to the Company’s separation from Dun & Bradstreet,expense, as discussed below in Note 2 to the consolidated financial statements.“Contingencies — Legacy Tax Matters”.
Moody’s netNet cash provided by operating activities in 2003 increased by $133.6 million compared with 2002. The two largest factors affecting the year-to-year increase were growth in net income of $75.0 million, and a year-over-year decrease of $16.0 million in income tax payments despite an increase of $64.0 million in the income tax provision. Income tax payments totaled $210.6 million in 2003 compared to $226.6 million in 2002. The 2002 amount included $50 million of tax payments that were deferred from 2001 to 2002 due to the September 11th tragedy. Also, the 2003 amount was favorably affected by timing of tax payments. In addition to the two factors noted above, growth in deferred revenue accounted for $21.9 million of the year-to-year increase in net cash provided by operating activities in 2003, and higher non-cash expenses for depreciation and amortization and stock-based compensation accounted for an additional $18.8 million of favorable variance. Partially offsetting these impacts, Moody’s investment in accounts receivable increased by $75.2 million year-to-year. This increase reflected continued growth in the business, significant year-to-year growth in billings in the fourth quarter of 2003 and an increase in days billings outstanding during 2003.
26
Net cash used in(used in) investing activities was $24.8$116.1 million, $17.1($150.4) million and $223.6($31.3) million for the years ended December 31, 2006, 2005 and 2004, 2003respectively. Capital expenditures, primarily for property and 2002,equipment and internal use software, totaled $31.1 million, $31.3 million and $21.3 million in 2006, 2005 and 2004, respectively. Investing activitiesNet maturities (investments) in each year principally consistedmarketable securities totaled $22.5 million, ($88.9) million and ($6.5) million in 2006, 2005 and 2004, respectively. The 2006 spending on acquisitions was $39.2 million, which related primarily to the purchase of capital expenditures, investmentsa 49% share in affiliatesChina Cheng Xin International Credit Rating Co. Ltd and acquisitions (most notably the 2002 acquisition of KMV).Wall Street Analytics, Inc., net of cash acquired. The 2005 spending on acquisitions primarily related to the acquisition of Economy.com, net of cash acquired, and a contingent payment made in the second quarter of 2005 related to Korea Investors Service. The 2004 amount included approximately $3.5 millionprimarily related to investments in rating agencies in Russia, Korea, Egypt and India. The 2003 amount included $1.1 millionnet proceeds received from the sale of cash acquired in connection with an increasethe Company’s headquarters building at 99 Church Street, New York, New York in the Company’s ownershipfourth quarter of Argentine rating agencies, as described in Note 5 to the consolidated financial statements. Cash used for acquisitions included $205.4 million (net of cash acquired) for KMV in 2002. Spending for property and equipment and for the capitalization of development costs for MKMV’s software products totaled $21.3 million, $17.9 million and $18.1 million in 2004, 2003 and 2002, respectively.2006 were $163.9 million.
Net cash used in financing activities was $162.3$965.2 million, $227.7$666.5 million and $236.6$162.3 million for the years ended December 31, 2006, 2005 and 2004, 2003 and 2002, respectively. During 2003, the Company repaid $107.1 million of borrowings that had been outstanding under its bank revolving credit facility at December 31, 2002. Spending for share repurchases totaled $1,093.6 million in 2006, $691.7 million in 2005 and $221.3 million in 2004, $171.72004. Dividends paid were $79.5 million, $60.3 million and $44.7 million in 20032006, 2005 and $369.9 million2004, respectively. The increase in 2002.dividends reflects a quarterly dividend paid of $0.07 per share in 2006, $0.0375 in the first quarter and $0.055 in the subsequent quarters per share in 2005 versus a quarterly dividend of $0.0375 per share in 2004. These amounts were offset in part by proceeds from exercises of stock options of $105.3 million in 2006, $89.1 million in 2005 and $105.0 million in 2004, $79.02004. The 2006 amount also includes $103.2 million in 2003 and $54.0 million in 2002. Dividends paid were $44.7 million, $26.8 million and $27.8 million in 2004, 2003 and 2002, respectively. The increase in 2004 reflectsof excess tax benefits from stock-based compensation plans that are now classified as a quarterly dividend of $0.075 per share in 2004 versus $0.045 per share in 2003 and 2002.cash flow from financing activities under SFAS No. 123R
Future Cash Requirements
Moody’s currently expects to fund expenditures as well as liquidity needs created by changes in working capital from internally generated funds. The Company believes that it has the financial resources needed to meet its cash requirements for the next twelve months and expects to have positive operating cash flow for fiscal year 2005.2007. Cash requirements for periods beyond the next twelve months will depend, among other things, on the Company’s profitability and its ability to manage working capital requirements.
The Company currently intends to use a portion of its cash flow to pay a quarterly dividend, whichdividends. On December 12, 2006, the Board of Directors raised from $0.045of the Company approved the declaration of a quarterly dividend of $0.08 per share to $0.075 per share in December 2003. On February 15, 2005, the board voted to increase the quarterly dividend per share to $0.11, before giving effect to a proposed two-for-oneof Moody’s common stock, split, payable on June 15, 2005March 10, 2007 to shareholders of record asat the close of May 27, 2005. If the stock split is effected, as discussed in this Management’s Discussion and Analysis of Financial Condition and Results of Operations under “Dividends”, thenbusiness on a post-split basis, the dividend will be increased to 5.5 cents per share from the 3.75 cents per share that otherwise would have been paid absent the dividend increase.February 20, 2007. The continued payment of dividends at this rate, or at all, is subject to the discretion of the Board of Directors.
The Company also currently also intendsexpects to use the majoritya significant portion of its remaining cash flow provided by operating activities to continue its share repurchase program. However,The Company implemented a systematic share repurchase program in the third quarter of 2005 through an SEC Rule 10b5-1 program. Moody’s may also purchase opportunistically when conditions warrant. On June 5, 2006, the Board of Directors authorized a $2 billion share repurchase program. There is no established expiration date for this authorization. During
25
August 2006, the Company exercises discretion ashad completed its previous $1 billion share repurchase program, which had been authorized by the Board of Directors in October 2005. The Company’s intent is to when and at what pricereturn capital to repurchase shares. Accordingly,shareholders in a way that serves Moody’s long-term interests. As a result, Moody’s share repurchase activity may fluctuatewill continue to vary from quarter to quarter, and there mayquarter.
The Company entered into an operating lease agreement (the “Lease”) commencing on October 20, 2006 with 7 World Trade Center, LLC for 589,945 square feet of an office building located at 7 World Trade Center at 250 Greenwich Street, New York, New York, which will serve as Moody’s new headquarters. The Lease has an initial term of approximately 21 years with a total of 20 years of renewal options. The total base rent of the lease over its initial 21-year term is approximately $536 million including rent credits from the World Trade Center Rent Reduction Program promulgated by the Empire State Development Corporation. The Company will incur approximately $110 million of costs in 2007 to fit out the new headquarters. The costs will be periods in whichpaid for using the Company does not repurchase shares.proceeds from the sale of the Company’s current corporate headquarters building.
In addition, the Company will from time to time consider cash outlays for acquisitions of or investments in complementary businesses, products, services and technologies. The Company may also be required to make future cash outlays including during 2005, to pay to New D&B its share of potential liabilities related to the legacy tax and legal contingencies that are discussed in this Management’s Discussion and Analysis of Financial Condition and Results of Operations under “Contingencies”. In addition, management is currently evaluating refinancing alternatives for its $300 million of notes payable outstanding, which mature in September 2005. It is possible that the Company may not immediately refinance these notes when they mature, in which case their repayment would substantially reduce the Company’s cash balance. These potential cash outlays could be material and might affect liquidity requirements, and they could cause the Company to pursue additional financing. There can be no assurance that financing to meet cash requirements will be available in amounts or on terms acceptable to the Company, if at all.
27
Indebtedness
At December 31, 2004 and 2003,On September 30, 2005, the Company had outstandingentered into a Note Purchase Agreement and issued and sold through a private placement transaction, $300 million aggregate principal amount of notes payable. The Company also had in place a $160 million bank revolving credit facility. There were no borrowings under the revolving credit facility during 2004.
The $300 million of notes payable were secured in connection with the 2000 Distribution, as that term is defined in Note 1 to the consolidated financial statements. In connection with the 2000 Distribution, Moody’s was allocated $195.5 million of debt at September 30, 2000. Moody’s funded this debt with borrowings under a $160 million unsecured bank revolving credit facility and a bank bridge line of credit. On October 3, 2000 the Company issued $300 million of notes payable (the “Notes”) in a private placement. The cash proceeds from theits Series 2005-1 Senior Unsecured Notes were used in part to repay the outstanding balance on the revolving credit facility and to repay the bridge line of credit.(“Notes”). The Notes have a five-yearten-year term and bear interest at an annual rate of 7.61%4.98%, payable semi-annually.semi-annually on March 30 and September 30. The proceeds from the sale of the Notes were used to refinance $300 million aggregate principal amount of the Company’s outstanding 7.61% Senior Notes (“Old Notes”) which matured on September 30, 2005. In the event that Moody’s pays all or part of the Notes in advance of their maturity (the “prepaid principal”“Prepaid Principal”), such prepayment will be subject to a penalty calculated based on the excess, if any, of the discounted value of the remaining scheduled payments, as defined in the agreement, over the prepaid principal. Management is in the process of evaluating refinancing alternatives for the Notes when they mature in September 2005. At December 31, 2004, the Notes have been classified as a current liability.Prepaid Principal.
On September 1, 2004, Moody’s entered into a five-year senior, unsecured bank revolving credit facility (the “Facility”) in an aggregate principal amount of $160 million that expires in September 2009. This Facility replaced the $80 million 5-yearfive-year facility that was scheduled to expire in September 2005 and the $80 million 364-day facility that expired in September 2004. Interest on borrowings under the Facility is payable at rates that are based on the London InterBank Offered Rate plus a premium that can range from 17 basis points to 47.5 basis points depending on the Company’s ratio of total indebtedness to earnings before interest, taxes, depreciation and amortization (“Earnings Coverage Ratio”), as defined in the related agreement. At December 31, 2004,2006, such premium was 17 basis points. The Company also pays quarterly facility fees, regardless of borrowing activity under the Facility. The quarterly fees can range from 8 basis points of the Facility amount to 15 basis points, depending on the Company’s Earnings Coverage Ratio, and were 8 basis points at December 31, 2004.2006. Under the Facility, the Company also pays a utilization fee of 12.5 basis points on borrowings outstanding when the aggregate amount outstanding under the Facility exceeds 50% of the Facility.
Management may consider pursuing additional long-term financing when it is appropriate in light of cash requirements for share repurchase and other strategic opportunities, which would result in higher financing costs.
The Notes and the Facility (the “Agreements”) contain covenants that, among other things, restrict the ability of the Company and certain of its subsidiaries, without the approval of the lenders, to engage in mergers, consolidations, asset sales, transactions with affiliates and sale-leaseback transactions or to incur liens, as defined in the related agreements. The AgreementsFacility also containcontains financial covenants that, among other things, require the Company to maintain an interest coverage ratio,Interest Coverage Ratio, as defined in the related agreements,agreement, of not less than 3 to 1 for any period of four consecutive fiscal quarters, and an Earnings Coverage Ratio, as defined in the related agreements,agreement, of not more than 4 to 1 at the end of any fiscal quarter. At December 31, 2004,2006, the Company was in compliance with such covenants. Upon the occurrence of certain financial or economic events, significant corporate events or certain other events constituting an event of default under the Agreements, all loans outstanding under the Agreements (including accrued interest and fees payable thereunder) may be declared immediately due and payable and all commitments under the Agreements may be terminated. In addition, certain other events of default under the Agreements would automatically result in amounts dueoutstanding becoming immediately due and payable and all commitments being terminated.
In October 2006, Moody’s amended its Facility by increasing the limit on sale proceeds resulting from a sale-leaseback transaction of its corporate headquarters building at 99 Church Street from $150 million to $250 million. Additionally, the
26
restriction on liens to secure indebtedness related to the sale of 99 Church Street was also increased from $150 million to $250 million. The Company also increased the expansion feature of the credit facility from $80 million to $340 million, subject to obtaining commitments for the incremental capacity at the time of draw down from the existing lenders. This increase gives the Company potential borrowing capacity under the Facility of $500 million.
Off-Balance Sheet Arrangements
At December 31, 20042006 and 2003,2005, Moody’s did not have any relationships with unconsolidated entities or financial partnerships, such as entities often referred to as special purpose or variable interest entities where Moody’s is the primary beneficiary, which would have been established for the purpose of facilitating off-balance sheet arrangements or other contractually narrow or limited
28
purposes. As such, Moody’s is not exposed to any financing, liquidity, market or credit risk that could arise if it had engaged in such relationships.
Contractual Obligations
The following table presents payments due under the Company’s contractual obligations as of December 31, 2004.
| Payments Due by Period | ||||||||||||||||||||
| Less Than 1 | ||||||||||||||||||||
| (in millions) | Total | Year | 1-3 Years | 4-5 Years | Over 5 Years | |||||||||||||||
| Notes payable (1) | $ | 322.8 | $ | 322.8 | $ | — | $ | — | $ | — | ||||||||||
| Operating lease obligations | 65.0 | 15.7 | 22.1 | 15.3 | 11.9 | |||||||||||||||
| Capital lease obligations | 1.3 | 1.3 | — | — | — | |||||||||||||||
| Contingent payment related to acquisition of Korea Investors Service (2) | 3.7 | 3.7 | — | — | — | |||||||||||||||
| Purchase obligations (3) | 5.9 | 2.7 | 2.8 | 0.4 | — | |||||||||||||||
| Total | $ | 398.7 | $ | 346.2 | $ | 24.9 | $ | 15.7 | $ | 11.9 | ||||||||||
| Payments Due by Period | |||||||||||||||
(in millions) | Total | Less Than 1 Year | 1-3 Years | 3-5 Years | Over 5 Years | ||||||||||
Notes payable (1) | $ | 430.7 | $ | 14.9 | $ | 29.9 | $ | 29.9 | $ | 356.0 | |||||
Capital lease obligations | 1.0 | 0.5 | 0.5 | — | — | ||||||||||
Operating lease obligations (2) | 639.5 | 34.5 | 80.4 | 62.2 | 462.4 | ||||||||||
Purchase obligations (3) | 30.4 | 23.6 | 6.7 | 0.1 | — | ||||||||||
Total (4) | $ | 1,101.6 | $ | 73.5 | $ | 117.5 | $ | 92.2 | $ | 818.4 | |||||
| (1) | Includes | |
| (2) | ||
| (3) | Purchase obligations include contracts for |
| (4) | In early 2007, the Company entered into contractual obligations of approximately $110 million related to the buildout of its new corporate headquarters at 7 World Trade Center. These amounts are not included in the table above. |
20052007 Outlook
Moody’s outlook for the full year 20052007 is based on assumptions about many macroeconomic and capital market factors, including interest rates, corporate profitability and business investment spending, merger and acquisition activity, consumer spending, residential mortgage borrowing and refinancing activity, securitization levels and capital markets issuance. There is an important degree of uncertainty surrounding these assumptions and, if actual conditions differ from these assumptions, Moody’s results for the year may differ from the outlook presented below.current outlook.
For Moody’s overall, the Company projects low double-digit percent revenue growth for the full year 2007. This growth assumes foreign currency translation in 2007 at current exchange rates, which would result in no material full year impact from currency translation. Excluding the gain on sale of the 99 Church Street building, Moody’s expects the operating margin to decline by approximately 150 basis points in 2007, due to investments the Company is continuing to make to sustain business growth, including international expansion, improving analytical processes, pursuing ratings transparency and compliance initiatives, introducing new products, improving technology infrastructure and relocating Moody’s headquarters in New York City. Diluted earnings per share in 2007 are projected to be modestly lower compared to 2006 as a result of the after-tax gain of $94.1 million on the sale of the 99 Church Street headquarters building in the fourth quarter of 2006.
In the U.S., the Company expects mid-single-digitprojects low double-digit percent revenue growth for the Moody’s Investors Service ratings and research business for the full year 2005.2007. In the U.S. structured finance market,business, Moody’s expects thatrevenue for the year to rise
27
in the high-single to double-digit percent range, including strong double-digit year-over-year percent growth in revenue from rating residential mortgage and home equity securities will decline by approximately twenty percent or more in 2005 from the record level of 2004. The Company expects good year-over-year growth in several other sectors of U.S. structured finance, including asset-backed securities and credit derivatives,and flat to modest growth in asset-backed commercial paper and commercial mortgage-backed securities. Accordingly, for the full year Moody’s expects a modestsecurities ratings, partially offset by an expected decline in U.S. structured finance revenue. revenue from residential mortgage-backed securities ratings, including home equity securitization.
In the U.S. corporate finance business, the CompanyMoody’s expects that modestrevenue growth in investment-grade issuancethe low double-digit percent range for the year, including good growth from rated bonds, bank loans and bank loan ratings, and revenue from our Enhanced Analysis Initiative, will offset relative weaknessnew products. The Company anticipates a stronger first half of 2007 followed by a weaker second half in speculative-grade bond activity, resultingthis sector, due in high single-digit percent growthpart to an expected moderation in revenue. Flat issuance volume in the pace of leveraged buyout transactions.
In the U.S. financial institutions sector, the Company projects revenue in 2007 to grow in the U.S. is expected to be offset by revenue fromlow teens percent range for the Enhanced Analysis Initiative and new rating relationships, allowing low double-digit percent growth in this business inyear. For the U.S. in 2005.public finance sector, Moody’s expects a second consecutive year of modest year-to-year revenue decline in U.S. public finance.for 2007 to grow modestly. The Company is also forecasting continued strongforecasts growth in the U.S. research business.business to be about 20%.
Outside the U.S., Moody’s expects growth in ratings and research revenue to grow in the high-teens percent range of 20%, with double-digitmid- to high-teens percent growth in all major business lines, in almost all regions assistedled by favorable foreign currency impacts. The Company’s projection assumes improved corporate issuancefinance revenue growth in Europe after a relatively weak 2004, modest
29
issuanceand Asia, financial institutions growth in the financial institutions sectorEurope and growth in several sectors ofinternational structured finance in Europe and Japan. In addition, Moody’s expects continued strongfinance. The Company also projects about twenty percent growth in international research revenue.
Finally,For Moody’s KMV globally, the Company continues to expect global revenue to rise in the mid-teens percent range at Moody’s KMV, reflecting goodexpects growth in bothsales and revenue from credit risk assessment subscription products, and credit decision processing software products.and professional services. This should result in low double-digit percent growth in revenue with greater growth in profitability.
For Moody’s overall,Recently Issued Accounting Pronouncements
In July 2006, the Financial Accounting Standards Board (“FASB”) issued FASB Interpretation No. 48, “Accounting for Uncertainty in Income Taxes—an Interpretation of FASB Statement No. 109” (“FIN No. 48”), which clarifies the accounting for uncertainty in income taxes recognized in a company’s financial statements in accordance with SFAS No. 109, “Accounting for Income Taxes”. FIN No. 48 prescribes a recognition threshold and measurement attribute for the financial statement recognition and measurement of a tax position taken or expected to be taken in a tax return and provides guidance on recognition and derecognition of tax benefits resulting from a subsequent change of judgment, classification of liabilities, interest and penalties, accounting in interim periods and disclosure. In accordance with FIN No. 48, a company is required to first determine whether it is more-likely-than-not (defined as a likelihood of more than fifty percent) that a tax position will be sustained based on its technical merits as of the reporting date. In making this assessment, a company must assume that the taxing authority will examine the position and have full knowledge of all relevant information. A tax position that meets this more-likely-than-not threshold is then measured and recognized at the largest amount of benefit that is greater than fifty percent likely to be realized upon ultimate settlement with a taxing authority, without considering time values. FIN No. 48 is effective for fiscal years beginning after December 15, 2006 and accordingly, is required to be adopted by the Company on January 1, 2007. Upon adoption of FIN No. 48 on January 1, 2007, the Company expects high single-digit percent revenue growth fora reduction of retained earnings of between $40 million and $45 million with no impact to the full year 2005 including the positive impactstatement of currency translation. Moody’s expects the operating margin including the impact of expensing stock-based compensation to be down approximately 200 basis points in 2005 compared with 2004.operations and cash flows. This reflects slower revenue growth in 2005 than in 2004is based on a preliminary assessment and continued investments in expanding geographically, improving analytic processes, and pursuing ratings transparency and compliance initiatives in the Moody’s Investors Service business, introducing new products and improving technology. For 2005 the Company expects that year-over-year growth in diluted earnings per share will be in the mid-teens percent range. This expected growth includes the impacts of the legacy tax provisions in 2004 and the expensing of stock-based compensation in 2004 and 2005. The impact of expensing stock-based compensation is expected to be in the range of $0.18 — $0.20 per diluted share in 2005, compared to $0.11 per diluted share in 2004. The estimated 2005 impact excludes any effects of adopting Statement of Financial Accounting Standards No. 123R, “Share-Based Payment”,could change based on final analysis which will be effective ascompleted by the end of July 1, 2005, and is more fully discussed in Note 2the first quarter of 2007. After the initial adoption of FIN No. 48, the financial impacts to the consolidated financial statements.
Additional Factors That May Affect Future Results
The following risk factors and other information included in this annual report on Form 10-K should be carefully considered. The risks and uncertainties described below are not the only ones the Company faces. Additional risks and uncertainties not presently known to the Company or that the Company’s management currently deems immaterial also may impair its business operations. If anystatement of the following risks occur, Moody’s business, financial condition, operating resultsoperations and cash flows could be materially adversely affected.
Changes inis dependent upon the Volumeultimate resolution of Debt Securities Issued in Domestic and/or Global Capital Markets and Changes in Interest Rates and Other Volatility in the Financial Markets
Approximately 80% of Moody’s revenue in 2004 was derived from ratings, a significant portion of which was related to the issuance of credit-sensitive securities in the global capital markets. Moody’s revenue growth from these sources in 2004 was lower than its growth in 2001 through 2003 as strong growth in global structured finance and financial institutions issuance, and ratings of U.S. high-yield issues and bank credit facilities, was partially offset by the impacts of declines in investment grade corporate finance issuance volumes in the U.S. and Europe. The Company anticipates that a substantial part of its business will continue to be dependent on the number and dollar volume of debt securities issued in the capital markets. Therefore, the Company’s results could be adversely affected by a reduction in the level of debt issuance.
Unfavorable financial or economic conditions that either reduce investor demand for debt securities or reduce issuers’ willingness or ability to issue such securities could reduce the number and dollar volume of debt issuance for which Moody’s provides ratings services. In addition, increases in interest rates or credit spreads, volatility in financial markets or the interest rate environment, significant political or economic events, defaults of significant issuerslegacy tax matters and other market and economic factors may negatively impact the general level of debt issuance, the debt issuance plans of certain categories of borrowers, and/or the types of credit-sensitive products being offered. A sustained period of market decline or weakness could also have a material adverse effect on Moody’s business and financial results.
Possible Loss of Market Share or Revenue Through Competition or Regulation
The markets for credit ratings, research and credit risk management services are intensely competitive. Moody’s competes on the basis of a number of factors, including quality of ratings, client service, research, reputation, price,
30
geographic scope, range of products and technological innovation. Moody’s faces increasing competition from S&P, Fitch, DBRS, local rating agencies in a number of jurisdictions and niche companies that provide ratings for particular types of financial products or issuers (such as A.M. Best Company in the insurance industry). Since Moody’s believes that some of its most significant challenges and opportunities will arise outside the U.S., it will have to compete with rating agencies that may have a stronger local presence or a longer operating history in those markets. These local providers or comparable competitors that may emerge in the future may receive support from local governments or other institutions.
Currently, Moody’s, S&P, Fitch, DBRS and A.M. Best Company, Inc. are designated as NRSROs by the SEC. On June 4, 2003, the SEC issued a Concept Release regarding the credit ratings industry, wherein it posed and requested public comment on a series of questions categorized into three broad areas: 1) should credit ratings continue to be used for regulatory purposes under the federal securities laws; 2) if so, what should be the process for determining whose credit ratings to use; and, 3) if credit ratings continue to be used in federal securities laws, what is the appropriate level of oversight for the agencies whose ratings are used?
Numerous market participants, including Moody’s, responded to the call for comment. Moody’s response can be found on the Company’s website at www.moodys.com. At present, Moody’s is unable to assess the likelihood of any regulatory changes that may result from the SEC’s ongoing review. However, the elimination of the NRSRO concept, retention of the NRSRO concept with different regulatory oversight, or SEC recognition of additional NRSROs could result in loss of market share or revenue for Moody’s, or higher costs of operations.
Introduction of Competing Products or Technologies by Other Companies
The markets for credit ratings, research and credit risk management services are increasingly competitive. The ability to provide innovative products and technologies that anticipate customers’ changing requirements and utilize emerging technological trends is a key factor in maintaining market share. Competitors may develop quantitative methodologies or related services for assessing credit risk that customers and market participants may deem preferable to or more cost-effective or more valuable than the credit risk assessment methods currently employed by Moody’s.
Increased Pricing Pressure from Competitors and/or Customers
In the credit rating, research and credit risk management markets, competition for customers and market share has spurred more aggressive tactics by some competitors in areas such as pricing and service. Moody’s intends to continue providing the highest quality products and the best service to its customers and the capital markets. However, if its pricing and services are not sufficiently competitive with its current and future competitors, Moody’s may lose market share.
Possible Loss of Key Employees to Investment or Commercial Banks or Elsewhere and Related Compensation Cost Pressures
Moody’s success depends in part upon recruiting and retaining highly skilled, experienced financial analysts and other professionals. Competition for qualified staff in the financial services industry is intense, and Moody’s ability to attract staff could be impaired if it is unable to offer competitive compensation and other incentives. Investment banks and other competitors for analyst talent may be able to offer higher compensation than Moody’s. Moody’s also may not be able to identify and hire employees outside the U.S.tax matters with the required experience or skills to perform sophisticated credit analysis. Moody’s ability to effectively compete will continue to depend, among other things, on its ability to attract new employees and to retain and motivate existing employees.
Exposure to Litigation Related to Moody’s Rating Opinions
Moody’s faces litigation from time to time from parties claiming damages relating to ratings actions. In addition, as Moody’s international business expands, these types of claims may increase because foreign jurisdictions may not
31
have legal protections or liability standards comparable to those in the U.S. (such as protections for the expression of credit opinions as is provided by the First Amendment). These risks often may be difficult to assess or quantify and their existence and magnitude often remains unknown for substantial periods of time.
Potential Emergence of Government-Sponsored Credit Rating Agencies
When governments adopt regulations that require debt securities to be rated, establish criteria for credit ratings or authorize only certain entities to provide credit ratings, the competitive balance among rating agencies and the level of demand for ratings may be positively or negatively affected. Government-mandated ratings criteria may also have the effect of displacing objective assessments of creditworthiness. In these circumstances, issuers may be less likely to base their choice of rating agencies on criteria such as independence and credibility, and more likely to base their choice on their assumption as to which credit rating agency might provide a higher rating, which may negatively affect the Company.
Potential for New U.S., Foreign, State and Local Legislation and Regulations, Including Those Relating to Nationally Recognized Statistical Rating Organizations
In the United States and other countries, the laws and regulations applicable to credit ratings and rating agencies continue to evolve and are presently subject to review by a number of legislative or regulatory bodies, including the SEC in the United States and the CESR on behalf of the European Union. It is possible that such reviews could lead to greater oversight or regulation concerning the issuance of credit ratings or the activities of credit rating agencies. Such additional regulations could, potentially, increase the costs associated with the operation of a credit rating agency, alter the rating agencies’ communications with the issuers as part of the rating assignment process, increase the legal risk associated with the issuance of credit ratings, change the regulatory framework to which credit rating agencies are subject and/or affect the competitive environment in which credit rating agencies operate. A description of certain of the more recent regulatory initiatives in the United States and other countries is described above under the section entitled “Regulation” in Item 1, “Business”, of this Form 10-K. At present, Moody’staxing authorities. The Company is unable to predict the regulatory changesfinal resolution of these matters. See Note 16, “Contingencies” for further discussion of legacy tax matters.
In September 2006, the FASB issued SFAS No. 157, “Fair Value Measurements” (“SFAS No. 157”), which establishes a single authoritative definition of fair value whereby fair value is based on an exit price that maywould result from ongoing reviewsmarket participants’ behavior, as well as sets out a framework for measuring fair value and requires additional disclosures about fair-value measurements. SFAS No. 157 is expected to increase the consistency of fair value measurements and applies only to those measurements that are already required or permitted by other accounting standards except for measurements of share-based payments and measurements that are similar to, but not intended to be, fair value. SFAS No. 157 imposes no requirements for additional fair-value measures in financial statements and is effective for fair-value measures already required or permitted by other standards for financial statements issued for fiscal years beginning after November 15, 2007 and will be adopted by the SEC or other regulatory bodies orCompany as of January 1, 2008. The Company is currently assessing the effectimpacts that any such changes maythe adoption of this standard will have on its business.
32
Multinational Operations
Moody’s maintains offices outside the U.S. and derives a significant portion of its revenue from sources outside the U.S. Operations in several different countries expose Moody’s to a number of legal, economic and regulatory risks such as:
Although such factors have not historically had a material adverse effect on the business,consolidated financial conditionposition and results of operations of the Company, any of these factors could have such an effect in the future.operations.
Contingencies
From time to time, Moody’s is involved in legal and tax proceedings, claims and litigation that are incidental to the Company’s business, including claims based on ratings assigned by Moody’s. Moody’s is also subject to ongoing tax audits
28
in the normal course of business. Management periodically assesses the Company’s liabilities and contingencies in connection with these matters based upon the latest information available. Moody’s discloses material pending legal proceedings, other than routine litigation incidental to Moody’s business, material proceedings known to be contemplated by governmental authorities and other pending matters that it may determine to be appropriate. For those matters where it is both probable that a liability has been incurred and the probable amount of loss can be reasonably estimated, the Company believes it has recorded appropriate reservesliabilities in the consolidated financial statements and periodically adjusts these reserves as appropriate. In other instances, because of the uncertainties related to both the probable outcome andand/or the amount or range of loss, management is unable to make a reasonable estimate ofdoes not record a liability but discloses the contingency if any.significant. As additional information becomes available, the Company adjusts its assessments and estimates of such liabilities accordingly.
Based on its review of the latest information available, in the opinion of management, the ultimate liability of the Company in connection with pending legal and tax proceedings, claims and litigation will not have a material
33
adverse effect on Moody’s financial position, results of operations or cash flows, subject to the contingencies described below.
Legacy Contingencies
Moody’s has exposure to certain potential liabilities assumed in connection with the 2000 Distribution. These contingencies are referred to by Moody’s as “Legacy Contingencies”. The principal Legacy Contingencies presently outstanding relate to tax matters.
To understand the Company’s exposure to the potential liabilities described below, it is important to understand the relationship between Moody’s and New D&B, and the relationship among New D&B and its predecessors and other parties who, through various corporate reorganizations and related contractual commitments, have assumed varying degrees of responsibility with respect to such matters.
In November 1996, The Dun & Bradstreet Corporation through a spin-off separated into three separate public companies: The Dun & Bradstreet Corporation, ACNielsen Corporation (“ACNielsen”) and Cognizant Corporation (“Cognizant”) (the “1996 Distribution”). Under the terms of the distribution agreement relating to the 1996 Distribution (the “1996 Distribution Agreement”), each party thereto is prohibited from distributing to its stockholders any business that had been allocated to it in connection with the 1996 Distribution, unless the distributed business delivers an undertaking agreeing to be jointly and severally liable to the other parties under the 1996 Distribution Agreement for the liabilities of the distributing parent company under the 1996 Distribution Agreement.
In June 1998, The Dun & Bradstreet Corporation through a spin-off separated into two separate public companies: The Dun & Bradstreet Corporation and R.H. Donnelley Corporation (“Donnelley”) (the “1998 Distribution”).Corporation. During 1998, Cognizant through a spin-off separated into two separate public companies: IMS Health Incorporated (“IMS Health”) and Nielsen Media Research, Inc. (“NMR”). In September 2000, The Dun & Bradstreet Corporation (“Old D&B”)&B through a spin-off separated into two separate public companies: New D&B and Moody’s, as further described in Note 1 to the consolidated financial statements.
Information Resources, Inc.
The following is a description of an antitrust lawsuit filed in 1996 by Information Resources, Inc. (“IRI”). As more fully described below, VNU N.V., a publicly traded Dutch company, and its U.S. subsidiaries, VNU, Inc., ACNielsen Corporation (“ACNielsen”), AC Nielsen (US), Inc. (“ACN (US)”), and Nielsen Media Research, Inc. (“NMR”) (collectively, the “VNU Parties”), have assumed exclusive joint and several liability for any judgment or settlement of this antitrust lawsuit. As a result of the indemnity obligation, Moody’s does not have any exposure to a judgment or settlement of this lawsuit unless the VNU Parties default on their obligations. However, in the event of such a default, contractual commitments undertaken by Moody’s in connection with various corporate reorganizations since 1996 would require the Company to bear a portion of any amount not paid by the VNU Parties. Moreover, as described below, on February 1, 2005, the U.S. District Court for the Southern District of New York entered a final judgment against IRI dismissing IRI’s claims with prejudice and on the merits.
In July 1996, IRI filed a complaint, subsequently amended in 1997, in the U.S. District Court for the Southern District of New York, naming as defendants the corporation then known as The Dun & Bradstreet Corporation (now known as R.H. Donnelly), A.C. Nielsen Company (a subsidiary of ACNielsen) and IMS International, Inc. (a subsidiary of the company then known as Cognizant). At the time of the filing of the complaint, each of the other defendants was a subsidiary of the company then known as The Dun & Bradstreet Corporation.
The amended complaint alleges various violations of United States antitrust laws under Sections 1 and 2 of the Sherman Act. The amended complaint also alleges a claim of tortious interference with a contract and a claim of tortious interference with a prospective business relationship. These claims relate to the acquisition by defendants of Survey Research Group Limited (“SRG”). IRI alleged SRG violated an alleged agreement with IRI when it agreed to be acquired by defendants and that defendants induced SRG to breach that agreement.
IRI’s antitrust claims allege that defendants developed and implemented a plan to undermine IRI’s ability to compete within the United States and foreign markets in North America, Latin America, Asia, Europe and
34
Australia/New Zealand through a series of anti-competitive practices, including: unlawfully tying/bundling services in the markets in which defendants allegedly had monopoly power with services in markets in which ACNielsen competed with IRI; entering into exclusionary contracts with retailers in certain countries to deny IRI’s access to sales data necessary to provide retail tracking services or to artificially raise the cost of that data; predatory pricing; acquiring foreign market competitors with the intent of impeding IRI’s efforts to expand; disparaging IRI to financial analysts and clients; and denying IRI access to capital necessary for it to compete.
IRI is seeking in excess of $650 million, which IRI also asked to be trebled. IRI has filed with the Court the report of its expert who has opined that IRI suffered damages of between $582 million and $652 million from the defendants’ alleged practices. IRI also sought punitive damages in an unspecified amount.
On June 21, 2004, pursuant to a stipulation between IRI and defendants, the Court ordered that certain of IRI’s claims be dismissed with prejudice from the lawsuit, including the claims that defendants tortiously interfered with the SRG acquisition. The Company believes that the dismissal of the tortious interference claims also precludes any claim for punitive damages.
On December 3, 2004, the Court entered In limine Order No. 1, which bars IRI from “arguing that Nielsen’s pricing practices or discounts were illegal or anti-competitive unless it can prove they involved prices below short-run average variable cost, calculated without the inclusion of Nielsen’s ‘Fixed Operations’ costs”. On December 17, 2004, IRI issued a press release, which said in relevant part, “Without this evidence, IRI believes that little would be left of IRI’s case to take to trial”. IRI asked the Court to enter a final judgment against it, so that it could take an immediate appeal to the Court of Appeals for the Second Circuit. Defendants did not object to this request. On February 1, 2005 the Court entered a final judgment dismissing IRI’s claims with prejudice and on February 2, 2005, the Court entered IRI’s notice of appeal to the Second Circuit. The Court of Appeals for the Second Circuit has ordered that the appeal be argued no earlier than the week of June 13, 2005.
In connection with the 1996 Distribution, NMR (then known as Cognizant Corporation), ACNielsen and Donnelley (then known as The Dun & Bradstreet Corporation) entered into an Indemnity and Joint Defense Agreement (the “Original Indemnity and Joint Defense Agreement”), pursuant to which they agreed to:
In 2001, ACNielsen was acquired by VNU N.V., which assumed ACNielsen’s obligations under the Original Indemnity and Joint Defense Agreement.
Under the terms of the 1998 Distribution, Old D&B assumed all potential liabilities of Donnelley (then known as The Dun & Bradstreet Corporation) arising from the IRI action and agreed to indemnify Donnelley in connection with such potential liabilities. Under the terms of the 2000 Distribution, New D&B undertook to be jointly and severally liable with Moody’s for Old D&B’s obligations to Donnelley under the 1998 Distribution, including for any liabilities arising under the Original Indemnity and Joint Defense Agreement and arising from the IRI action itself. However, as between New D&B and Moody’s, it was agreed that under the 2000 Distribution, each of New D&B and Moody’s will be responsible for 50% of any payments required to be made to or on behalf of Donnelley with respect to the IRI action under the terms of the 1998 Distribution, including legal fees or expenses related to the IRI action.
On July 30, 2004, the VNU Parties, Donnelley, Moody’s, New D&B and IMS Health entered into an Amended and Restated Indemnity and Joint Defense Agreement (the “Amended Indemnity and Joint Defense Agreement”).
Pursuant to the Amended Indemnity and Joint Defense Agreement, any and all IRI Liabilities incurred by Donnelley, Moody’s, New D&B or IMS Health relating to a judgment (even if not final) or any settlement being entered into in the IRI action will be jointly and severally assumed, and fully discharged, exclusively by the VNU Parties. Under the Amended Indemnity and Joint Defense Agreement, the VNU Parties have agreed to, jointly
35
and severally, indemnify Donnelley, Moody’s, New D&B and IMS Health from and against all IRI Liabilities to which they become subject. As a result, the cap on ACNielsen’s liability for the IRI Liabilities, which was provided for in the Original Indemnity and Joint Defense Agreement, no longer exists and all such liabilities are the responsibility of the VNU Parties pursuant to the Amended Indemnity and Joint Defense Agreement.
In addition, the Amended Indemnity and Joint Defense Agreement provides that if it becomes necessary to post any bond pending an appeal of an adverse judgment, then the VNU Parties shall obtain the bond required for the appeal and shall pay the full cost of such bond.
In connection with entering into the Amended Indemnity and Joint Defense Agreement, Donnelley, Moody’s, New D&B and IMS Health agreed to amend certain covenants of the Original Indemnity and Joint Defense Agreement to provide operational flexibility for ACNielsen going forward. In addition, the Amended Indemnity and Joint Defense Agreement includes certain amendments to the covenants of ACNielsen (which, under the Amended Indemnity and Joint Defense Agreement, are now also applicable to ACN (US), which the Company understand holds ACNielsen’s operating assets), which are designed to preserve such parties’ claims-paying ability and protect Donnelley, Moody’s, New D&B and IMS Health. Among other covenants, ACNielsen and ACN (US) agreed that neither they nor any of their respective subsidiaries will incur any indebtedness to any affiliated person, except indebtedness which its payment will, after a payment obligation under the Amended Indemnity and Joint Defense Agreement comes due, be conditioned on, and subordinated to, the payment and performance of the obligations of such parties under the Amended Indemnity and Joint Defense Agreement. VNU N.V. has agreed to having a process agent in New York to receive on its behalf service of any process concerning the Amended Indemnity and Joint Defense Agreement.
As described above, the VNU Parties have assumed exclusive responsibility for the payment of all IRI Liabilities. However, because liability for violations of the antitrust laws is joint and several and because the rights and obligations relating to the Amended Indemnity and Joint Defense Agreement are based on contractual relationships, the failure of the VNU Parties to fulfill their obligations under the Amended Indemnity and Joint Defense Agreement could result in the other parties bearing all or a portion of the IRI Liabilities. Joint and several liability for the IRI action means that even where more than one defendant is determined to have been responsible for an alleged wrongdoing, the plaintiff can collect all or part of the judgment from just one of the defendants. This is true regardless of whatever contractual allocation of responsibility the defendants and any other indemnifying parties may have made, including the allocations described above between the VNU Parties, Donnelley, Moody’s, New D&B and IMS Health.
Accordingly, and as a result of the allocations of liability described above, in the event the VNU Parties default on their obligations under the Amended Indemnity and Joint Defense Agreement, each of Moody’s and New D&B will be responsible for the payment of 50% of the portion of any judgment or settlement ultimately paid by Donnelley (which is a defendant in the IRI action), which can be as high as all the IRI Liabilities.
The Company is unable to predict the outcome of the IRI action (including the appeal), or the financial condition of any of the VNU parties or the other defendants at the time of any such outcome and hence the Company cannot estimate their ability to pay the IRI Liabilities pursuant to the Amended Indemnity and Joint Defense Agreement or the amount of the judgment or settlement in the IRI action. However, provided that the VNU Parties fulfill their obligations under the Amended Indemnity and Joint Defense Agreement, the Company believes that the resolution of this matter, irrespective of the outcome of the IRI action, should not materially affect Moody’s financial position, results of operations and cash flows. Accordingly, no amount in respect of this matter has been accrued in the Company’s consolidated financial statements. If, however, IRI were to prevail in whole or in part in this action and if Moody’s is required to pay, notwithstanding such contractual obligations, a portion of any significant settlement or judgment, the outcome of this matter could have a material adverse effect on Moody’s financial position, results of operations, and cash flows.
36
Legacy Tax Matters
Old D&B and its predecessors entered into global tax planning initiatives in the normal course of business, including through tax-free restructurings of both their foreign and domestic operations. These initiatives are subject to normal review by tax authorities.
Pursuant to a series of agreements, as between themselves, IMS Health and NMR are jointly and severally liable to pay one-half, and New D&B and Moody’s are jointly and severally liable to pay the other half, of any payments for taxes, penalties and accrued interest resulting from unfavorable IRSInternal Revenue Service (“IRS”) rulings on certain tax matters as described in such agreements (excluding the matter described below as “Amortization Expense Deductions” for which New D&B and Moody’s are solely responsible) and certain other potential tax liabilities, also as described in such agreements, after New D&B and/or Moody’s pays the first $137 million, which amount was paid in connection with the matter described below as “Utilization of Capital Losses”.agreements.
In connection with the 2000 Distribution and pursuant to the terms of the 2000 Distribution Agreement, New D&B and Moody’s have, between themselves, agreed to each be financially responsible for 50% of any potential liabilities that may arise to the extent such potential liabilities are not directly attributable to their respective business operations.
Without limiting the generality of the foregoing, three specific tax matters are discussed below.
Royalty Expense Deductions
DuringThis matter related to the second quarter of 2003, New D&B received an Examination Report from the IRS with respect to a partnership transaction entered into in 1993. In this Report, the IRSIRS’s stated its intention to disallow certain royalty expense deductions claimed by Old D&B on its tax returns for the years 1993 through 1996 (the “Royalty Report”). Inas well as the first quarter of 2004, New D&B received a similar Examination Report (the “Second Royalty Report”) relating to the first quarter of 1997.
During the second quarter of 2003, New D&B also received an Examination Report that had been issued by the IRS to the partnership, stating the IRS’IRS’s intention to ignore the partnership structure that had been established in 1993 in connection with the above transaction, and to reallocate to Old D&B income and expense items that had been reported in thea certain partnership tax return for 1996 (the “Reallocation Report”).1996. These matters were settled with the IRS in a closing agreement executed in the third quarter of 2005 and accordingly, the Company reduced its reserve for this matter by $11.5 million. However, IMS Health and NMR disagreed with New D&B’s calculation of each party’s share of the liability. New D&B also received a similar Examination Report (the “Second Reallocation Report”) issuedmay commence arbitration proceedings against IMS Health and NMR to collect the partnership with respect to the first quarter of 1997.
In June 2004,$7.3 million that New D&B and Moody’s each were obligated to pay to the IRS conducted a mediationon their behalf. Based upon the current understanding of these issues, at which they reached a basisthe positions that New D&B and IMS Health may take, the Company believes it is likely that New D&B will prevail, but Moody’s cannot predict with certainty the outcome.
29
In the second quarter of 2006, Moody’s paid approximately $9 million for the state income tax liability connected with the terms of the October 2005 settlement with regard to the Royalty Report for 1995IRS and 1996,reversed the Reallocation Report, and certain tax refund claims made by Old D&B related to 1995 and 1996 (the “Preliminary Settlement”). The Preliminary Settlement was subject to the executionremaining reserve of a formal settlement agreement. In addition,$1.5 million.
Additionally, the IRS reasserted its position that certain tax refund claims made by Old D&B related to 1993 and 1994 may be offset by tax liabilities relating to the above mentioned partnership formed in 1993. In the fourth quarter of 2005, New D&B disagrees with the position taken by the IRS for 1993 and 1994 and plans to filefiled a protest with the IRS Appeals Office. IfOffice concerning the protest is unsuccessfulIRS’s denial of the tax refunds. In the third quarter of 2006, the IRS Appeals Office rejected New D&B’s protest. New D&B can either: (1) abandon its tax refund claims; or (2) challenge the IRS claim in U.S. District Court or the U.S. Court of Federal Claims. Moody’s estimates that its exposureis determining whether to file suit for the write-off of deferred tax assets related to these tax refund claims could be up torefund. Moody’s share is estimated at approximately $9 million.
As of June 30, 2004, Moody’s had adjusted its reserves for the Royalty Expense Deductions matter to reflect the Company’s estimates of probable exposure for the Preliminary Settlement and the other matters discussed in the preceding paragraph. In accordance with the 1996 Distribution Agreement, New D&B was required to obtain the consent of Moody’s, IMS Health and NMR as a condition to executing the formal settlement agreement, but New D&B was unable to obtain consent from IMS Health and NMR. Accordingly, New D&B and the IRS were unable to agree on the terms of a formal settlement agreement by the November 1st deadline imposed by the IRS. As a result, the IRS withdrew the Preliminary Settlement.
37
The Company believes that in accordance with the 1996 Distribution Agreement, IMS Health and NMR, by withholding their consent to the formal settlement agreement, would be contractually responsible to pay any excess amounts above the Preliminary Settlement that may ultimately be owing with respect to tax years 1995 and 1996. IMS Health has alleged various breaches of New D&B’s obligations under the 1996 Distribution Agreement related to New D&B’s management and attempted settlement of this matter. If the parties fail to resolve their dispute, Moody’s understands that New D&B anticipates commencing arbitration proceedings against IMS Health and NMR. Based on our current understanding of the positions of New D&B and IMS Health, the Company believes it is likely that New D&B should prevail, but we cannot predict with certainty the outcome.
In addition, the Second Royalty Report and the Second Reallocation Report, which were not part of New D&B’s preliminary settlement with the IRS, have not been resolved. Moody’s estimates that its share of the potential required payment to the IRS for this matter is $0.1 million (including penalties and interest, and net of tax benefits).
Moody’s has reassessed its exposure for the Royalty Expense Deductions matter taking into consideration: (1) the original Examination Reports discussed above (for which the Company’s share of the required payments to the IRS could be up to $103 million, including penalties and interest, and net of tax benefits); and (2) the potential write-off of deferred tax assets (for which the Company’s exposure could be up to $9 million as discussed above). Based on this assessment, in 2004, the Company increased its reserve for this matter by $16.4 million to reflect the current estimate of probable exposure. Moody’s believes that the positions taken by the IRS in the Royalty Reports and the Reallocation Reports discussed above are inconsistent with each other. While it is possible that the IRS could ultimately prevail in whole or in part on one of such positions noted above, Moody’s believes that it is unlikely that the IRS will prevail on both.
Amortization Expense Deductions
In April 2004, New D&B received Examination Reports (the “April Examination Reports”) from the IRS with respect to a partnership transaction. This transaction was entered into in 1997 and haswhich resulted in amortization expense deductions on the tax returns of Old D&B since 1997. These deductions could continue through 2012. In the April Examination Reports, the IRS stated its intention to disallow the amortization expense deductions related to this partnership that were claimed by Old D&B on its 1997 and 1998 tax returns. New D&B disagrees with the position taken by the IRS and can either: (1) accept and pay the IRS assessment; (2) challenge the assessment in U.S. Tax Court; or (3) challenge the assessment in U.S. District Court or the U.S. Court of Federal Claims, where in either case payment of the disputed amount would be required in connection with such challenge. IRS audits of Old D&B’s or New D&B’s tax returns for years subsequent to 1998 could result in the issuance of similar Examination Reports, in which case New D&B would also have the aforementioned three courses of action. Should any such payments be made by New D&B related to either the April Examination Reports or any potential Examination Reports for future years, including years subsequent to the separation of Moody’s from New D&B, then pursuant to the terms of the 2000 Distribution Agreement, Moody’s would have to pay to New D&B its 50% share. In addition, should New D&B discontinue claiming the amortization deductions on future tax returns, Moody’s would be required to repay to New D&B an amount equal to the discounted value of its 50% share of the related future tax benefits. New D&B had paid the discounted value of 50% of the future tax benefits from this transaction in cash to Moody’s at the Distribution Date. Moody’s estimates that the Company’s current potential exposure could be up to $95 million (including penalties and interest, and net of tax benefits). This exposure could increase by approximately $3 million to $6 million per year, depending on actions that the IRS may take and on whether New D&B continues claiming the amortization deductions on its tax returns.
In the April Examination Reports, theThe IRS also stated its intention to disallow certain royalty expense deductions claimed by Old D&B on its 1997 and 1998 tax returns with respect to the partnership transaction. In addition, the IRS stated its intention to disregard the partnership structure and to reallocate to Old D&B certain partnership income and expense items that had been reported in the partnership tax returns for 1997 and 1998. New D&B disagrees with thethese positions taken by the IRS and can take any of the three courses of action described in the preceding paragraph.IRS. IRS audits of Old D&B’s or New D&B’s tax returns for years subsequent to 1998 could resulthave resulted in the issuance of similar Examination Reports for the 1999 through 2002 tax years. Similar Examination Reports could result for tax years subsequent years. to 2002.
Should any such payments be made by New D&B related to either the April Examination Reports or any potential Examination Reports for future years, including years subsequent to the separation of Moody’s from New D&B, then pursuant to the terms of the 2000 Distribution Agreement, Moody’s would have to pay to New D&B its 50%share. In addition, should New D&B discontinue claiming the amortization expense deductions on future tax returns, Moody’s would be required, pursuant to the terms of the 2000 Distribution Agreement, to repay to New D&B an amount equal to the discounted value of its share of the related future tax benefits. New D&B’s payments&B had paid the discounted value of 50% of the future tax benefits from this transaction in cash to the IRS for the period from 1997 throughMoody’s at the Distribution Date. Moody’s
38
estimates that its share of the Company’s potential exposure to the IRS could be up to $129 millionexposures (including penalties and interest, and net of tax benefits). could be up to $120 million relating to the disallowance of amortization expense deductions and could increase by approximately $6 million to $10 million per year, depending on actions that the IRS may take and on whether New D&B continues claiming the amortization expense deductions on its tax returns. Additionally, there are potential exposures that could be up to $164 million relating to the reallocation of the partnership income and expense to Old D&B. Moody’s also could be obligated for future interest payments on its share of such liability.
New D&B had filed protestsis currently in discussion with the IRS Appeals Office regarding the April Examination Reports. In September 2004,on these issues. On March 3, 2006, New D&B and Moody’s each deposited $39.8 million with the IRS Appeals Office remandedin order to stop the caseaccrual of statutory interest on potential tax deficiencies up to or equal to that amount with respect to the IRS examination office for further development of the issues. New D&B has reopened discussion of the issues with the examination office.1997 through 2002 tax years.
Moody’s believes that the IRS’s proposed assessments of tax against Old D&B and the proposed reallocations of partnership income and expense to Old D&B are inconsistent with each other. Accordingly, while it is possible that the IRS could ultimately prevail in whole or in part on one of such positions, Moody’s believes that it is unlikely that the IRS will prevail on both.
Utilization of Capital Losses
The IRS has completed its review ofIn December 2004, New D&B executed a formal settlement agreement for all outstanding issues related to the matter concerning utilization of certain capital losses generated by Old D&B during 1989 and 1990. On June 26, 2000, the IRS, as part of its audit process, issued a formal assessment with respect to the utilization of these capital losses.
On May 12, 2000, an amended tax return was filed by Old D&B for the 1989 and 1990 tax years, which reflected $561.6 million of tax and interest due. Old D&B paid the IRS approximately $349.3 million of this amount on May 12, 2000; 50% of such payment was allocated to Moody’s and had previously been accrued by the Company. IMS Health informed Old D&B that it paid to the IRS approximately $212.3 million on May 17, 2000. The payments were made to the IRS to stop further interest from accruing, and on September��20, 2000, Old D&B filed a petition for a refund in the U.S. District Court.
In July 2004, New D&B and the IRS reached a basis for settlement of all outstanding issues related to this matter and in December 2004 executed a formal settlement agreement. New D&B received the first of three finaltwo assessments on February 15, 2005 and expects to receive the other two in the second quarter of 2005. Payment of the first assessment was made inthis matter during the first quarter of 20052005. The third and paymentfinal assessment was received in April 2006 of which Moody’s paid $0.3 million. The amounts paid by Moody’s for the first two other assessments is expected to be made in the second quarter of 2005. Moody’s estimatesincluded its share of these assessments to be approximately $15$4 million reflecting cash payments of approximately $6 millionthat Moody’s and the write-off of deferred tax assets of approximately $9 million. In addition,New D&B believe should have been paid by IMS Health and NMR, have notified New D&B that they disagreebut were not paid by them due to their disagreement with various aspects of New D&B’s calculation of their respective shares of the payments. If the parties failNew D&B was unable to resolve theirthis dispute Moody’s understands that New D&B anticipates commencingwith IMS Health and NMR, and has commenced arbitration proceedings against IMS Health and NMR.them. Moody’s believes that New D&B should prevail in its position, but wethe Company cannot predict with certainty the outcome.
In 2004,the first quarter of 2005, Moody’s had increased its reserves forliabilities by $2.7 million due to this matter by $14 million to reflect its current estimate of the probable exposure. Should IMS Health and NMR prevail in their position described in the prior paragraph, then Moody’s estimates that its exposure for this matter could increase by up to approximately $3 million.disagreement.
Summary of Moody’s Exposure to Three Legacy Tax Related Matters
The Company considers from time to time the range and probability of potential outcomes related to the threeits legacy tax matters discussed above and establishes reservesliabilities that it believes are appropriate in light of the relevant facts and circumstances. In doing so, Moody’s makes estimates and judgments as to future events and conditions and evaluates its estimates and judgments on an ongoing basis.
During
30
For the years ended December 31, 2006, 2005 and 2004, , the Company recorded charges$2.4 million and $8.8 million net reversals of approximately $30reserves and increased reserves by $30.0 million, to increase its reserves for the three legacy tax matters reflecting its current estimates of the probable exposures on these matters.respectively. The Company also has recorded approximately $3$3.5 million, $5.8 million and $3.4 million of net interest expense related to these reserves. As a result, atits legacy tax matters in the years ended December 31, 2006, 2005 and 2004, respectively. Moody’s total recorded net legacy tax reservesrelated liabilities as of December 31, 2006 were $136$93 million (consisting of $161 million of tax liabilities, partially offset by the expected utilization of $25 million of deferred tax assets). The $136 million of expected cash payments consists of $50 million of current liabilities (reflecting the estimated cash payments related to the Royalty
39
Expense Deductions and Utilization of Capital Losses matters that are expected to be made over the next twelve months) and $86 million of non-current liabilities.classified as long term.
It is possible that the legacy tax matters could be resolved in amounts that are greater than the amounts reservedliabilities recorded by the Company, which could result in additional charges that may be material to Moody’s future reported results, financial position and cash flows. Although Moody’s does not believe it is likely that the Company will ultimately be required to pay the full amounts presently being sought by the IRS, potential future outlays resulting from these matters could be as much as $354 million and could increase with time as described above. In matters where Moody’s believes the IRS has taken inconsistent positions, Moody’s may be obligated initially to pay its share of related duplicative assessments. However, Moody’s believes that ultimately it is unlikely that the IRS would retain such duplicative payments.
Dividends
During 2004,2006, the Company paid a quarterly dividend of 7.5 cents$0.07 per share in each of the quarters of Moody’s common stock, resulting in dividends paid per share of $0.28 during the year. During 2005, the Company paid a quarterly dividend of $0.0375 in the first quarter and $0.055 in each of the three subsequent quarters, per share of Moody’s common stock, resulting in dividends paid per share of 30 cents$0.2025 during the year. During 2003 and 2002,2004, the Company paid a quarterly dividenddividends of 4.5 cents$0.0375 per share of Moody’s common stock resulting in total dividends paid per share of 18 cents in each year.$0.15.
On December 14, 2004,12, 2006, the Board of Directors of the Company approved the declaration of a quarterly dividend of 7.5 cents$0.08 per share of Moody’s common stock, payable on March 10, 20052007 to shareholders of record at the close of business on February 20, 2005. On February 15, 2005, the board voted to increase the quarterly dividend per share to $0.11, before giving effect to the proposed two-for-one stock split discussed in Note 20 to the consolidated financial statements, payable on June 15, 2005 to shareholders of record as of May 27, 2005. If the stock split is effected, then on a post-split basis the dividend will be increased to 5.5 cents per share from the 3.75 cents per share that otherwise would have been paid absent the dividend increase.2007. The continued payment of dividends at the rate noted above, or at all, is subject to the discretion of the Board of Directors.
On February 15, 2005, the Board of Directors declared a two-for-one stock split to be effected as a special stock distribution of one share of common stock for each share of the Company’s common stock outstanding and treasury shares. Stockholders of record as of the close of business on May 4, 2005 will receive one additional share of common stock for each share of the Company’s common stock held on that date. Such additional shares will be distributed on May 18, 2005.
The Board of Directors’ declaration of a special stock dividend distribution is subject to stockholder approval of a charter amendment to increase the Company’s authorized common shares. Moody’s stockholders will vote on the charter amendment at the Company’s Annual Meeting, which will be held on April 26, 2005. The proposal to amend the Company’s charter to increase the number of authorized shares will be more fully described in the Company’s annual meeting proxy statement.
40
Common Stock Information
The Company’s common stock trades on the New York Stock Exchange under the symbol “MCO”. The table below indicates the high and low sales price of the Company’s common stock and the dividends paiddeclared for the periods shown. The number of registered shareholders of record at January 31, 20052007 was 4,488.
| Dividends | ||||||||||||
| Price Per Share | Paid | |||||||||||
| High | Low | Per Share | ||||||||||
2003: | ||||||||||||
| First quarter | $ | 49.70 | $ | 39.50 | $ | 0.045 | ||||||
| Second quarter | 54.85 | 45.38 | 0.045 | |||||||||
| Third quarter | 56.80 | 49.85 | 0.045 | |||||||||
| Fourth quarter | 60.85 | 54.85 | 0.045 | |||||||||
| Year ended December 31, 2003 | $ | 60.85 | $ | 39.50 | $ | 0.18 | ||||||
2004: | ||||||||||||
| First quarter | $ | 71.00 | $ | 59.69 | $ | 0.075 | ||||||
| Second quarter | 71.00 | 61.74 | 0.075 | |||||||||
| Third quarter | 74.41 | 64.60 | 0.075 | |||||||||
| Fourth quarter | 87.72 | 71.39 | 0.075 | |||||||||
| Year ended December 31, 2004 | $ | 87.72 | $ | 59.69 | $ | 0.30 | ||||||
Subject to approval by shareholders at Moody’s annual meeting of stockholders in April 2005, the Company expects to effect a two-for-one stock split effective May 18, 2005. See Note 20 to the consolidated financial statements for further discussion.
| Price Per Share | Dividends Declared Per Share | ||||||||
| High | Low | ||||||||
2005: | |||||||||
First quarter | $ | 44.53 | $ | 40.29 | $ | 0.055 | |||
Second quarter | 47.04 | 39.55 | 0.055 | ||||||
Third quarter | 51.89 | 44.05 | 0.055 | ||||||
Fourth quarter | 62.50 | 49.28 | 0.070 | ||||||
Year ended December 31, 2005 | $ | 62.50 | $ | 39.55 | $ | 0.235 | |||
2006: | |||||||||
First quarter | $ | 71.95 | $ | 61.09 | $ | 0.07 | |||
Second quarter | 73.29 | 49.77 | 0.07 | ||||||
Third quarter | 65.84 | 49.76 | 0.07 | ||||||
Fourth quarter | 71.70 | 60.60 | 0.08 | ||||||
Year ended December 31, 2006 | $ | 73.29 | $ | 49.76 | $ | 0.29 | |||
Forward-Looking Statements
Certain statements contained in this annual report on Form 10-K are forward-looking statements and are based on future expectations, plans and prospects for the Company’s business and operations that involve a number of risks and uncertainties. Such statements involve estimates, projections, goals, forecasts, assumptions and uncertainties that could cause actual results or outcomes to differ materially from those contemplated, expressed, projected, anticipated or implied in the forward-looking statements. Those statements appear at various places throughout this annual report on Form 10-K, including in the sections entitled “Outlook” and “Contingencies” under Item 7. “Management’s Discussion and Analysis of Financial Condition and Results of Operations”, commencing aton page 15 of this annual report on Form 10-K, under “Legal Proceedings” in Part I, Item 3, Part I of this Form 10-K, and elsewhere in the context of statements containing the words “believe”, “expect”, “anticipate”, “intend”, “plan”, “will”, “predict”, “potential”, “continue”, “strategy”, “aspire”, “target”, “forecast”, “project”, “estimate”, “should”
31
“should”, “could”, “may” and similar expressions or words and variations thereof relating to the Company’s views on future events, trends and contingencies. We caution youStockholders and investors are cautioned not to place undue reliance on these forward lookingforward-looking statements. The forward-looking statements and other information are made as of the date of this annual report on Form 10-K, for the year ended December 31, 2004, and the Company undertakes no obligation (nor does it intend) to publicly supplement, update or revise such statements on a going-forward basis, whether as a result of subsequent developments, changed expectations or otherwise. In connection with the “safe harbor” provisions of the Private Securities Litigation Reform Act of 1995, the Company is identifying examples of factors, risks and uncertainties that could cause actual results to differ, perhaps materially, from those indicated by these forward-looking statements. Those factors, risks and uncertainties include, but are not limited to, changes in the volume of debt and other securities issued in domestic and/or global capital markets; changes in interest rates and other volatility in the financial markets; market perceptions of the utility and integrity of independent agency ratings; possible loss of market share through competition; introduction of competing products or technologies by other companies; pricing pressures from competitors and/or customers; the potential emergence of government-sponsored credit rating agencies; proposed U.S., foreign, state and local legislation and regulations; regulations including those relating to be adopted to implement the federal legislation recently adopted to require registration of Nationally Recognized Statistical Rating Organizations; possible judicial decisions in various jurisdictions regarding the status of and potential liabilities of rating agencies; the possible loss of key employees to investment or commercial banks or elsewhere and
41
related compensation cost pressures; the outcome of any review by controlling tax authorities of the Company’s global tax planning initiatives; the outcome of those tax and legal contingencies that relate to Old D&B, its predecessors and their affiliated companies for which the Company has assumed portions of the financial responsibility; the outcome of other legal actions to which the Company, from time to time, may be named as a party; the ability of the Company to successfully integrate the KMV and MRMSacquired businesses; a decline in the demand for credit risk management tools by financial institutions. These factors, risks and uncertainties as well as other risks and uncertainties that could cause Moody’s actual results to differ materially from those contemplated, expressed, projected, anticipated or implied in the forward-looking statements are described in greater detail under “Risk Factors” in “Management’s Discussion and AnalysisPart I, Item 1A of Financial Condition and Results of Operations — Additional Factors That May Affect Future Results”,this annual report on Form 10-K, elsewhere in this Form 10-K and in other filings made by the Company from time to time with the Securities and Exchange Commission or in materials incorporated herein or therein. You should be awareStockholders and investors are cautioned that the occurrence of any of these factors, risks and uncertainties may cause the Company’s actual results to differ materially from those contemplated, expressed, projected, anticipated or implied in the forward-looking statements, which could have a material and adverse effect on the Company’s business, results of operations and financial condition. New factors may emerge from time to time, and it is not possible for the Company to predict new factors, nor can the Company assess the potential effect of any new factors on it.
ITEM 7A. QUANTITATIVE AND QUALITATIVE DISCLOSURES ABOUT MARKET RISK
| ITEM 7A. | QUANTITATIVE AND QUALITATIVE DISCLOSURES ABOUT MARKET RISK |
Information in response to this Item is set forth under the caption “Market Risk” in Part II, Item 7 of this annual report on Form 10-K.
32
ITEM 8. FINANCIAL STATEMENTS
| ITEM 8. | FINANCIAL STATEMENTS |
INDEX TO FINANCIAL STATEMENTS
| PAGE(S) | ||||
Management’s Report on Internal Control Over Financial Reporting | 34 | |||
Report of Independent Registered Public Accounting Firm | 35 | |||
Consolidated Financial Statements: | ||||
Consolidated Balance Sheets as of December 31, | 37 | |||
For the years ended December 31, | ||||
Consolidated Statements of Operations | 36 | |||
Consolidated Statements of Cash Flows | 38 | |||
Consolidated Statements of Shareholders’ Equity | 39 | |||
Notes to Consolidated Financial Statements | 40-64 |
Schedules are omitted as not required or inapplicable or because the required information is provided in the consolidated financial statements, including the notes thereto.
42
33
MANAGEMENT’S REPORT ON INTERNAL CONTROL OVER FINANCIAL REPORTING
Management of Moody’s Corporation (“Moody’s” or “the Company”) is responsible for establishing and maintaining adequate internal control over financial reporting and for the assessment of the effectiveness of internal control over financial reporting. As defined by the Securities and Exchange Commission (“SEC”) in Rules 13a-15(f) and 15d-15(f) under the Securities Exchange Act of 1934, internal control over financial reporting is a process designed by, or under the supervision of, the Company’s principal executive and principal financial officers, or persons performing similar functions, and effected by the Company’s Board of Directors, management and other personnel, to provide reasonable assurance regarding the reliability of financial reporting and the preparation of financial statements for external purposes in accordance with generally accepted accounting principles.
Moody’s internal control over financial reporting includes those policies and procedures that (1) pertain to the maintenance of records that, in reasonable detail, accurately and fairly reflect the transactions and dispositions of assets of the Company; (2) provide reasonable assurance that transactions are recorded as necessary to permit preparation of financial statements in accordance with generally accepted accounting principles, and that receipts and expenditures of the Company are being made only in accordance with authorizations of Moody’s management and directors; and (3) provide reasonable assurance regarding prevention or timely detection of unauthorized acquisition, use or disposition of the Company’s assets that could have a material effect on the financial statements.
Because of its inherent limitations, internal control over financial reporting may not prevent or detect misstatements. Also, projections of any evaluation of effectiveness to future periods are subject to the risk that controls may become inadequate because of changes in conditions, or that the degree of compliance with the policies or procedures may deteriorate.
Management of the Company has undertaken an assessment of the design and operational effectiveness of the Company’s internal control over financial reporting as of December 31, 20042006 based on criteria established in Internal Control – Integrated Framework issued by the Committee of Sponsoring Organizations of the Treadway Commission (“COSO”). The COSO framework is based upon five integrated components of control: risk assessment, control activities, control environment, information and communications and ongoing monitoring.
Based on the assessment performed, management has concluded that Moody’s maintained effective internal control over financial reporting as of December 31, 2004.2006.
Our management’s assessment of the effectiveness of the Company’s internal control over financial reporting as of December 31, 20042006 has been audited by PricewaterhouseCoopers LLP, an independent registered public accounting firm, as stated in their report which appears herein.
John Rutherfurd, Jr.
/S/ RAYMOND W. MCDANIEL, JR. |
| Raymond W. McDaniel, Jr. |
| Chairman and Chief Executive Officer |
/S/ LINDA S. HUBER |
| Linda S. Huber |
| Executive Vice President and Chief Financial Officer |
| February 27, 2007 |
Jeanne M. DeringChief Financial Officer34
March 2, 2005
43
REPORT OF INDEPENDENT REGISTERED PUBLIC ACCOUNTING FIRM
To the Shareholders and the Board of Directors of Moody’s Corporation:
We have completed an integrated auditaudits of Moody’s Corporation’s 2004 consolidated financial statements and of its internal control over financial reporting as of December 31, 2004 and audits of its 2003 and 2002 consolidated financial statements2006 in accordance with the standards of the Public Company Accounting Oversight Board (United States). Our opinions, based on our audits, are presented below.
Consolidated financial statements
In our opinion, the accompanying consolidated balance sheets and the related consolidated statements of operations, shareholders’ equity and cash flows present fairly, in all material respects, the financial position of Moody’s Corporation and its subsidiaries at December 31, 20042006 and 2003,2005, and the results of their operations and their cash flows for each of the three years in the period ended December 31, 20042006 in conformity with accounting principles generally accepted in the United States of America. These financial statements are the responsibility of the Company’s management. Our responsibility is to express an opinion on these financial statements based on our audits. We conducted our audits of these statements in accordance with the standards of the Public Company Accounting Oversight Board (United States). Those standards require that we plan and perform the audit to obtain reasonable assurance about whether the financial statements are free of material misstatement. An audit of financial statements includes examining, on a test basis, evidence supporting the amounts and disclosures in the financial statements, assessing the accounting principles used and significant estimates made by management, and evaluating the overall financial statement presentation. We believe that our audits provide a reasonable basis for our opinion.
On January 1, 2003, the Company adopted the provisions of Statement of Financial Accounting Standards No. 123, “Accounting for Stock-Based Compensation” (“SFAS No. 123”) as amended by SFAS No. 148, “Accounting for Stock-Based Compensation — Transition and Disclosure — an amendment of SFAS No. 123”. This matter isAs discussed in Note 2 to the consolidated financial statements.statements, the Company has changed the manner in which it accounts for share-based payment, as of January 1, 2006, and the manner in which it accounts for defined benefit pension and other post-retirement plans, as of December 31, 2006.
Internal control over financial reporting
Also, in our opinion, management’s assessment, included in the accompanying Management’s Report on Internal Control Over Financial Reporting, that the Company maintained effective internal control over financial reporting as of December 31, 20042006 based on criteria established inInternal Control —- Integrated Framework issued by the Committee of Sponsoring Organizations of the Treadway Commission (COSO), is fairly stated, in all material respects, based on those criteria. Furthermore, in our opinion, the Company maintained, in all material respects, effective internal control over financial reporting as of December 31, 2004,2006, based on criteria established inInternal Control —- Integrated Framework issued by the COSO. The Company’s management is responsible for maintaining effective internal control over financial reporting and for its assessment of the effectiveness of internal control over financial reporting. Our responsibility is to express opinions on management’s assessment and on the effectiveness of the Company’s internal control over financial reporting based on our audit. We conducted our audit of internal control over financial reporting in accordance with the standards of the Public Company Accounting Oversight Board (United States). Those standards require that we plan and perform the audit to obtain reasonable assurance about whether effective internal control over financial reporting was maintained in all material respects. An audit of internal control over financial reporting includes obtaining an understanding of internal control over financial reporting, evaluating management’s assessment, testing and evaluating the design and operating effectiveness of internal control, and performing such other procedures as we consider necessary in the circumstances. We believe that our audit provides a reasonable basis for our opinions.
A company’s internal control over financial reporting is a process designed to provide reasonable assurance regarding the reliability of financial reporting and the preparation of financial statements for external purposes in accordance with generally accepted accounting principles. A company’s internal control over financial reporting
44
includes those policies and procedures that (i) pertain to the maintenance of records that, in reasonable detail, accurately and fairly reflect the transactions and dispositions of the assets of the company; (ii) provide reasonable assurance that transactions are recorded as necessary to permit preparation of financial statements in accordance with generally accepted accounting principles, and that receipts and expenditures of the company are being made only in accordance with authorizations of management and directors of the company; and (iii) provide reasonable assurance regarding prevention or timely detection of unauthorized acquisition, use, or disposition of the company’s assets that could have a material effect on the financial statements.
Because of its inherent limitations, internal control over financial reporting may not prevent or detect misstatements. Also, projections of any evaluation of effectiveness to future periods are subject to the risk that controls may become inadequate because of changes in conditions, or that the degree of compliance with the policies or procedures may deteriorate.
/s/
| /S/ PRICEWATERHOUSECOOPERS LLP |
| PricewaterhouseCoopers LLP |
| New York, New York |
| February 28, 2007 |
PricewaterhouseCoopers LLPNew York, New YorkMarch 2, 200535
45
MOODY’S CORPORATION
CONSOLIDATED STATEMENTS OF OPERATIONS
(amounts in millions, except per share data) Year Ended December 31, 2004 2003 2002 $ 1,438.3 $ 1,246.6 $ 1,023.3 Operating 375.4 347.3 285.3 Selling, general and administrative 242.4 203.6 175.3 Depreciation and amortization 34.1 32.6 24.6 Total expenses 651.9 583.5 485.2 786.4 663.1 538.1 Interest expense, net (16.2 ) (21.8 ) (21.2 ) Other non-operating income, net 1.1 15.1 0.5 Non-operating expense, net (15.1 ) (6.7 ) (20.7 ) Income before provision for income taxes 771.3 656.4 517.4 Provision for income taxes 346.2 292.5 228.5 $ 425.1 $ 363.9 $ 288.9 Basic $ 2.86 $ 2.44 $ 1.88 Diluted $ 2.79 $ 2.39 $ 1.83 Basic 148.5 148.9 153.9 Diluted 152.3 152.3 157.5
| Year Ended December 31, | ||||||||||||
| 2006 | 2005 | 2004 | ||||||||||
Revenue | $ | 2,037.1 | $ | 1,731.6 | $ | 1,438.3 | ||||||
Expenses | ||||||||||||
Operating | 539.4 | 452.9 | 375.4 | |||||||||
Selling, general and administrative | 359.3 | 303.9 | 242.4 | |||||||||
Depreciation and amortization | 39.5 | 35.2 | 34.1 | |||||||||
Gain on sale of building | (160.6 | ) | — | — | ||||||||
Total expenses | 777.6 | 792.0 | 651.9 | |||||||||
Operating income | 1,259.5 | 939.6 | 786.4 | |||||||||
Interest income (expense), net | 3.0 | 5.0 | (16.2 | ) | ||||||||
Other non-operating (expense) income, net | (2.0 | ) | (9.9 | ) | 1.1 | |||||||
Non-operating income (expense), net | 1.0 | (4.9 | ) | (15.1 | ) | |||||||
Income before provision for income taxes | 1,260.5 | 934.7 | 771.3 | |||||||||
Provision for income taxes | 506.6 | 373.9 | 346.2 | |||||||||
Net income | $ | 753.9 | $ | 560.8 | $ | 425.1 | ||||||
Earnings per share | ||||||||||||
Basic | $ | 2.65 | $ | 1.88 | $ | 1.43 | ||||||
Diluted | $ | 2.58 | $ | 1.84 | $ | 1.40 | ||||||
Weighted average shares outstanding | ||||||||||||
Basic | 284.2 | 297.7 | 297.0 | |||||||||
Diluted | 291.9 | 305.6 | 304.7 | |||||||||
The accompanying notes are an integral part of the consolidated financial statements.
46
36
MOODY’S CORPORATION
CONSOLIDATED BALANCE SHEETS
(dollar amounts in millions, except share and per share data) December 31, 2004 2003 Current assets: Cash and cash equivalents $ 606.1 $ 269.1 Accounts receivable, net of allowances of $14.6 in 2004 and $15.9 in 2003 358.4 270.3 Other current assets 58.1 40.5 Total current assets 1,022.6 579.9 Property and equipment, net 45.2 46.8 Prepaid pension costs 59.7 60.2 Goodwill 131.7 126.4 Intangible assets, net 70.7 77.4 Other assets 46.1 61.6 Total assets $ 1,376.0 $ 952.3 Current liabilities: Notes payable $ 300.0 $ — Accounts payable and accrued liabilities 270.5 228.4 Deferred revenue 266.7 214.6 Total current liabilities 837.2 443.0 Non-current portion of deferred revenue 54.4 41.1 Notes payable — 300.0 Other liabilities 166.9 200.3 Total liabilities 1,058.5 984.4 Commitments and contingencies (Notes 13 and 14) Shareholders’ equity (deficit): Preferred stock, par value $.01 per share; 10,000,000 shares authorized; no shares issued and outstanding — — Series common stock, par value $.01 per share; 10,000,000 shares authorized; no shares issued and outstanding — — Common stock, par value $.01 per share; 400,000,000 shares authorized; 171,451,136 shares issued at December 31, 2004 and 2003 1.7 1.7 Capital surplus 144.0 76.4 Retained earnings 939.3 558.9 Treasury stock, at cost; 22,539,115 and 22,779,500 shares of common stock at December 31, 2004 and 2003, respectively (777.2 ) (677.2 ) Accumulated other comprehensive income 9.7 8.1 Total shareholders’ equity (deficit) 317.5 (32.1 ) Total liabilities and shareholders’ equity (deficit) $ 1,376.0 $ 952.3
| December 31, | ||||||||
| 2006 | 2005 | |||||||
Assets | ||||||||
Current assets: | ||||||||
Cash and cash equivalents | $ | 408.1 | $ | 486.0 | ||||
Short-term investments | 75.4 | 94.5 | ||||||
Accounts receivable, net of allowances of $14.5 in 2006 and $12.7 in 2005 | 475.4 | 421.8 | ||||||
Other current assets | 43.0 | 49.5 | ||||||
Total current assets | 1,001.9 | 1,051.8 | ||||||
Property and equipment, net | 62.0 | 55.4 | ||||||
Prepaid pension costs | — | 56.4 | ||||||
Goodwill | 176.1 | 152.1 | ||||||
Intangible assets, net | 65.7 | 70.8 | ||||||
Other assets | 192.0 | 70.7 | ||||||
Total assets | $ | 1,497.7 | $ | 1,457.2 | ||||
Liabilities and shareholders’ equity | ||||||||
Current liabilities: | ||||||||
Accounts payable and accrued liabilities | $ | 339.7 | $ | 279.8 | ||||
Deferred revenue | 360.3 | 299.1 | ||||||
Total current liabilities | 700.0 | 578.9 | ||||||
Non-current portion of deferred revenue | 102.1 | 75.7 | ||||||
Notes payable | 300.0 | 300.0 | ||||||
Other liabilities | 228.2 | 193.2 | ||||||
Total liabilities | 1,330.3 | 1,147.8 | ||||||
Commitments and contingencies (Notes 15 and 16) | ||||||||
Shareholders’ equity: | ||||||||
Preferred stock, par value $.01 per share; 10,000,000 shares authorized; no shares issued and outstanding | — | — | ||||||
Series common stock, par value $.01 per share; 10,000,000 shares authorized; no shares issued and outstanding | — | — | ||||||
Common stock, par value $.01 per share; 1,000,000,000 shares authorized; 342,902,272 shares issued at December 31, 2006 and 2005 | 3.4 | 3.4 | ||||||
Capital surplus | 345.7 | 240.9 | ||||||
Retained earnings | 2,091.4 | 1,419.2 | ||||||
Treasury stock, at cost; 64,296,812 and 52,604,734 shares of common stock at December 31, 2006 and 2005, respectively | (2,264.7 | ) | (1,353.2 | ) | ||||
Accumulated other comprehensive loss | (8.4 | ) | (0.9 | ) | ||||
Total shareholders’ equity | 167.4 | 309.4 | ||||||
Total liabilities and shareholders’ equity | $ | 1,497.7 | $ | 1,457.2 | ||||
The accompanying notes are an integral part of the consolidated financial statements.
47
37
MOODY’S CORPORATION
CONSOLIDATED STATEMENTS OF CASH FLOWS
(amounts in millions) Year Ended December 31, 2004 2003 2002 Net income $ 425.1 $ 363.9 $ 288.9 Reconciliation of net income to net cash provided by operating activities: Depreciation and amortization 34.1 32.6 24.6 Stock-based compensation expense 27.8 10.8 — Deferred income taxes (9.6 ) (0.4 ) (3.6 ) Tax benefits from exercise of stock options 55.9 33.3 27.5 Other 1.6 0.6 2.4 Changes in assets and liabilities: Accounts receivable (87.3 ) (91.8 ) (16.6 ) Other current assets and prepaid pension costs (16.1 ) (11.8 ) (1.8 ) Other assets 21.4 (0.6 ) (2.9 ) Accounts payable and accrued liabilities 36.5 41.5 (66.8 ) Deferred revenue 65.1 56.8 34.9 Other liabilities (34.8 ) 33.5 48.2 Net cash provided by operating activities 519.7 468.4 334.8 Capital additions (21.3 ) (17.9 ) (18.1 ) Net cash (used) acquired in connection with business acquisitions and investments in affiliates (3.5 ) 0.8 (205.7 ) Other — — 0.2 Net cash used in investing activities (24.8 ) (17.1 ) (223.6 ) Net (repayments of) proceeds from bank borrowings — (107.1 ) 107.1 Proceeds from stock plans 105.0 79.0 54.0 Cost of treasury shares repurchased (221.3 ) (171.7 ) (369.9 ) Payment of dividends (44.7 ) (26.8 ) (27.8 ) Payments under capital lease obligations (1.3 ) (1.1 ) — Net cash used in financing activities (162.3 ) (227.7 ) (236.6 ) Effect of exchange rate changes on cash and cash equivalents 4.4 5.6 2.1 Increase (decrease) in cash and cash equivalents 337.0 229.2 (123.3 ) Cash and cash equivalents, beginning of the period 269.1 39.9 163.2 Cash and cash equivalents, end of the period $ 606.1 $ 269.1 $ 39.9
| Year Ended December 31, | ||||||||||||
| 2006 | 2005 | 2004 | ||||||||||
Cash flows from operating activities | ||||||||||||
Net income | $ | 753.9 | $ | 560.8 | $ | 425.1 | ||||||
Reconciliation of net income to net cash provided by operating activities: | ||||||||||||
Depreciation and amortization | 39.5 | 35.2 | 34.1 | |||||||||
Stock-based compensation expense | 77.1 | 54.8 | 27.8 | |||||||||
Deferred income taxes | (27.2 | ) | (20.2 | ) | (9.6 | ) | ||||||
Excess tax benefits from exercise of stock options | (103.2 | ) | 70.2 | 55.9 | ||||||||
Gain on sale of building | (160.6 | ) | — | — | ||||||||
Other | 1.2 | 2.2 | 1.6 | |||||||||
Changes in assets and liabilities: | ||||||||||||
Accounts receivable | (42.4 | ) | (53.1 | ) | (93.0 | ) | ||||||
Other current assets | 8.9 | 1.0 | (11.6 | ) | ||||||||
Other assets and prepaid pension costs | (40.0 | ) | (6.7 | ) | 23.4 | |||||||
Accounts payable and accrued liabilities | 141.4 | (16.0 | ) | 42.2 | ||||||||
Deferred revenue | 80.2 | 52.2 | 65.1 | |||||||||
Other liabilities | 23.7 | 27.5 | (34.8 | ) | ||||||||
Net cash provided by operating activities | 752.5 | 707.9 | 526.2 | |||||||||
Cash flows from investing activities | ||||||||||||
Capital additions | (31.1 | ) | (31.3 | ) | (21.3 | ) | ||||||
Purchases of marketable securities | (414.0 | ) | (324.4 | ) | (22.2 | ) | ||||||
Sales and maturities of marketable securities | 436.5 | 235.5 | 15.7 | |||||||||
Net proceeds from sale of building | 163.9 | — | — | |||||||||
Cash paid for acquisitions and investment in affiliates, net of cash acquired | (39.2 | ) | (30.2 | ) | (3.5 | ) | ||||||
Net cash provided by (used in) investing activities | 116.1 | (150.4 | ) | (31.3 | ) | |||||||
Cash flows from financing activities | ||||||||||||
Repayment of notes | — | (300.0 | ) | — | ||||||||
Issuance of notes | — | 300.0 | — | |||||||||
Net proceeds from stock plans | 105.3 | 89.1 | 105.0 | |||||||||
Excess tax benefits from exercise of stock options | 103.2 | — | — | |||||||||
Cost of treasury shares repurchased | (1,093.6 | ) | (691.7 | ) | (221.3 | ) | ||||||
Payment of dividends | (79.5 | ) | (60.3 | ) | (44.7 | ) | ||||||
Payments under capital lease obligations | (0.6 | ) | (1.3 | ) | (1.3 | ) | ||||||
Debt issuance costs and related fees | — | (2.3 | ) | — | ||||||||
Net cash used in financing activities | (965.2 | ) | (666.5 | ) | (162.3 | ) | ||||||
Effect of exchange rate changes on cash and cash equivalents | 18.7 | (11.1 | ) | 4.4 | ||||||||
(Decrease) increase in cash and cash equivalents | (77.9 | ) | (120.1 | ) | 337.0 | |||||||
Cash and cash equivalents, beginning of the period | 486.0 | 606.1 | 269.1 | |||||||||
Cash and cash equivalents, end of the period | $ | 408.1 | $ | 486.0 | $ | 606.1 | ||||||
The accompanying notes are an integral part of the consolidated financial statements.
48
38
MOODY’S CORPORATION
CONSOLIDATED STATEMENTS OF SHAREHOLDERS’ EQUITY
(amounts in millions) Accumulated Total Retained Other Shareholders’ Common Stock Capital Earnings Comprehensive Treasury Stock Equity Comprehensive Shares Amount Surplus (Deficit) Income Shares Amount (Deficit) Income 171.5 $ 1.7 $ 43.7 $ (39.3 ) $ (2.7 ) (17.0 ) $ (307.5 ) $ (304.1 ) Net income 288.9 288.9 $ 288.9 Dividends paid (27.8 ) (27.8 ) Proceeds from stock plans, including tax benefits 81.5 81.5 Net treasury stock activity (79.7 ) (5.6 ) (290.2 ) (369.9 ) Currency translation adjustment 4.4 4.4 4.4 Comprehensive income $ 293.3 171.5 1.7 45.5 221.8 1.7 (22.6 ) (597.7 ) (327.0 ) Net income 363.9 363.9 $ 363.9 Dividends paid (26.8 ) (26.8 ) Proceeds from stock plans, including tax benefits 112.3 112.3 Stock-based compensation 10.8 10.8 Net treasury stock activity (92.2 ) (0.2 ) (79.5 ) (171.7 ) Currency translation adjustment 6.4 6.4 6.4 Comprehensive income $ 370.3 171.5 1.7 76.4 558.9 8.1 (22.8 ) (677.2 ) (32.1 ) Net income 425.1 425.1 $ 425.1 Dividends paid (44.7 ) (44.7 ) Proceeds from stock plans, including tax benefits 161.1 161.1 Stock-based compensation 27.8 27.8 Net treasury stock activity (121.3 ) 0.3 (100.0 ) (221.3 ) Currency translation adjustment 2.6 2.6 2.6 Additional minimum pension liability (net of tax of $0.7 million) (1.0 ) (1.0 ) (1.0 ) Comprehensive income $ 426.7 171.5 $ 1.7 $ 144.0 $ 939.3 $ 9.7 (22.5 ) $ (777.2 ) $ 317.5
| Common Stock | Capital Surplus | Retained Earnings | Treasury Stock | Accumulated Other Comprehensive Income (Loss) | Total Shareholders’ Equity (Deficit) | Comprehensive Income | ||||||||||||||||||||||||||||
| Shares | Amount | Shares | Amount | |||||||||||||||||||||||||||||||
Balance at December 31, 2003 | 342.9 | $ | 3.4 | $ | 74.7 | $ | 558.9 | (45.6 | ) | $ | (677.2 | ) | $ | 8.1 | $ | (32.1 | ) | |||||||||||||||||
Net income | 425.1 | 425.1 | $ | 425.1 | ||||||||||||||||||||||||||||||
Dividends | (44.7 | ) | (44.7 | ) | ||||||||||||||||||||||||||||||
Proceeds from stock plans, including excess tax benefits | 161.1 | 161.1 | ||||||||||||||||||||||||||||||||
Stock-based compensation | 27.8 | 27.8 | ||||||||||||||||||||||||||||||||
Net treasury stock activity | (121.3 | ) | 0.5 | (100.0 | ) | (221.3 | ) | |||||||||||||||||||||||||||
Currency translation adjustment | 2.6 | 2.6 | 2.6 | |||||||||||||||||||||||||||||||
Additional minimum pension liability (net of tax of $0.7 million) | (1.0 | ) | (1.0 | ) | (1.0 | ) | ||||||||||||||||||||||||||||
Comprehensive income | $ | 426.7 | ||||||||||||||||||||||||||||||||
Balance at December 31, 2004 | 342.9 | $ | 3.4 | $ | 142.3 | $ | 939.3 | (45.1 | ) | $ | (777.2 | ) | $ | 9.7 | $ | 317.5 | ||||||||||||||||||
Net income | 560.8 | 560.8 | $ | 560.8 | ||||||||||||||||||||||||||||||
Dividends | (80.9 | ) | (80.9 | ) | ||||||||||||||||||||||||||||||
Proceeds from stock plans, including excess tax benefits | 159.3 | 159.3 | ||||||||||||||||||||||||||||||||
Stock-based compensation | 55.0 | 55.0 | ||||||||||||||||||||||||||||||||
Net treasury stock activity | (115.7 | ) | (7.5 | ) | (576.0 | ) | (691.7 | ) | ||||||||||||||||||||||||||
Currency translation adjustment | (7.3 | ) | (7.3 | ) | (7.3 | ) | ||||||||||||||||||||||||||||
Additional minimum pension liability (net of tax of $1.8 million) | (2.5 | ) | (2.5 | ) | (2.5 | ) | ||||||||||||||||||||||||||||
Unrecognized derivative losses on cash flow hedges (net of tax of $0.5 million) | (0.8 | ) | (0.8 | ) | (0.8 | ) | ||||||||||||||||||||||||||||
Comprehensive income | $ | 550.2 | ||||||||||||||||||||||||||||||||
Balance at December 31, 2005 | 342.9 | $ | 3.4 | $ | 240.9 | $ | 1,419.2 | (52.6 | ) | $ | (1,353.2 | ) | $ | (0.9 | ) | $ | 309.4 | |||||||||||||||||
Net income | 753.9 | 753.9 | $ | 753.9 | ||||||||||||||||||||||||||||||
Dividends | (81.7 | ) | (81.7 | ) | ||||||||||||||||||||||||||||||
Proceeds from stock plans, including excess tax benefits | 209.0 | 209.0 | ||||||||||||||||||||||||||||||||
Stock-based compensation | 77.3 | 77.3 | ||||||||||||||||||||||||||||||||
Net treasury stock activity | (181.5 | ) | (11.7 | ) | (911.5 | ) | (1,093.0 | ) | ||||||||||||||||||||||||||
Currency translation adjustment | 11.4 | 11.4 | 11.4 | |||||||||||||||||||||||||||||||
Additional minimum pension liability (net of tax of $0.7 million) | 1.0 | 1.0 | 1.0 | |||||||||||||||||||||||||||||||
Amounts eliminated related to additional minimum pension liability upon the adoption of SFAS No. 158 (net of tax of $1.8 million) | 2.5 | 2.5 | ||||||||||||||||||||||||||||||||
Actuarial losses and prior service costs recognized upon the adoption of SFAS No. 158 (net of tax of $16.3 million) | (22.5 | ) | (22.5 | ) | ||||||||||||||||||||||||||||||
Unrecognized derivative losses on cash flow hedges | 0.1 | 0.1 | 0.1 | |||||||||||||||||||||||||||||||
Comprehensive income | $ | 766.4 | ||||||||||||||||||||||||||||||||
Balance at December 31, 2006 | 342.9 | $ | 3.4 | $ | 345.7 | $ | 2,091.4 | (64.3 | ) | $ | (2,264.7 | ) | $ | (8.4 | ) | $ | 167.4 | |||||||||||||||||
The accompanying notes are an integral part of the consolidated financial statements.
49
39
MOODY’S CORPORATION
NOTES TO CONSOLIDATED FINANCIAL STATEMENTS
(tabular dollar and share amounts in millions, except per share data)
Note 1 Description of Business and Basis of Presentation
Moody’s Corporation (“Moody’s” or the “Company”) is a provider of (i) credit ratings, research and analysis covering fixed-income securities, other debt instruments and securitiesthe entities that issue such instruments in the global capital markets, and a provider of quantitative credit assessment services, credit training services and (ii) quantitative credit processrisk assessment products and services and credit processing software tofor banks, corporations and other financial institutions.investors in credit-sensitive assets. Moody’s operates in two reportable segments: Moody’s Investors Service and Moody’s KMV.KMV (“MKMV”). Moody’s Investors Service publishes rating opinions on a broad range of credit obligors and credit obligations issued in domestic and international markets, including various corporate and governmental obligations, structured finance securities and commercial paper programs, as well as rating opinions on issuers of credit obligations.programs. It also publishes investor-oriented credit information, research and economic commentary, including in-depth research on major issuers, industry studies, special comments and credit opinion handbooks. The Moody’s KMV business which consists of the combined businesses of KMV LLC and KMV Corporation (“KMV”), acquired in April 2002, and Moody’s Risk Management Services, develops and distributes quantitative credit risk assessment products and services and credit processing software for banks, corporations and investors in credit-sensitive assets, credit training services and credit process software.assets.
The Company operated as part of The Dun & Bradstreet Corporation (“Old D&B”) until September 30, 2000 (the “Distribution Date”), when Old D&B separated into two publicly traded companies — Moody’s Corporation and The New D&B Corporation (“New D&B”). At that time, Old D&B distributed to its shareholders shares of New D&B stock. New D&B comprised the business of Old D&B’s Dun & Bradstreet operating company (the “D&B Business”). The remaining business of Old D&B consisted solely of the business of providing ratings and related research and credit risk management services (the “Moody’s Business”) and was renamed “Moody’s Corporation”. The method by which Old D&B distributed to its shareholders its shares of New D&B stock is hereinafter referred to as the “2000 Distribution”.
For purposes of governing certain ongoing relationships between the Company and New D&B after the 2000 Distribution and to provide for an orderly transition, the Company and New D&B entered into various agreements including a Distribution Agreement (the “2000 Distribution Agreement”), Tax Allocation Agreement, Employee Benefits Agreement, Shared Transaction Services Agreement, Insurance and Risk Management Services Agreement, Data Services Agreement and Transition Services Agreement.
In February 2005, Moody’s Board of Directors declared a two-for-one stock split to be effected as a special stock distribution of one share of common stock for each share of the Company’s common stock outstanding, subject to stockholder approval of a charter amendment to increase the Company’s authorized common shares from 400 million shares to 1 billion shares. At the Company’s Annual Meeting on April 26, 2005, Moody’s stockholders approved the charter amendment. As a result, stockholders of record as of the close of business on May 4, 2005 received one additional share of common stock for each share of the Company’s common stock held on that date (the “Stock Split”). Such additional shares were distributed on May 18, 2005. All prior period share, per share and equity award information have been restated to reflect the Stock Split.
Note 2 Summary of Significant Accounting Policies
Basis of Consolidation
The consolidated financial statements include those of Moody’s Corporation and its majority- and wholly-owned subsidiaries. The effects of all intercompany transactions have been eliminated. Investments in companies for which the Company has significant influence over operating and financial policies but not a controlling interest are carriedaccounted for on an equity basis. Investments in companies for which the Company does not have the ability to exercise significant influence are carried on the cost basis of accounting.
The Company applies the guidelines set forth in Financial Accounting Standards Board (“FASB”) Interpretation No. 46R “Consolidation of Variable Interest Entities, an Interpretation of ARB No. 51” (“FIN 46R”) in assessing its interests in variable interest entities to decide whether to consolidate that entity. The Company has reviewed the potential variable interest entities and determined that there are no consolidation requirements under FIN 46R.
Cash and Cash Equivalents
Cash equivalents principally consist of investments in money market mutual funds short-term certificates of deposit and high-grade commercial paper with maturities of three months or less when purchased. Interest income on cash and cash equivalents and short-term investments was $6.8$18.2 million, $1.7$26.0 million and $2.3$6.8 million for the years ended December 31, 2004, 2003,2006, 2005 and 2002,2004, respectively.
50
40
Property and Equipment
Property and equipment are stated at cost and are depreciated using the straight-line method over their estimated useful lives, typically three to ten years for computer equipment and office furniture and fixtures and equipment, and seven to forty years for buildings and building improvements. Leasehold improvements are amortized over the shorter of the term of the lease or the estimated useful life of the improvement. Expenditures for maintenance and repairs that do not extend the economic useful life of the related assets are charged to expense as incurred. Gains and losses on disposals of property and equipment are reflected in the consolidated statements of operations.
Computer Software
Costs for the development of computer software that will be sold, leased or otherwise marketed are capitalized when technological feasibility has been established in accordance with Statement of Financial Accounting Standards (“SFAS”) No. 86, “Accounting for the Costs of Computer Software to Be Sold, Leased, or Otherwise Marketed”. These assetscosts primarily relate to the development of MKMV credit processing software and quantitative credit risk assessment products to be licensed to customers. The capitalized costscustomers and generally consist of professional services provided by third parties and compensation costs of employees that develop the software. These costs are amortized on a straight-line basis over three years, which approximates their useful life, and are reported at the lower of unamortized cost or net realizable value.
At December 31, 2004 and 2003, these costs, included in other assets in the consolidated balance sheets, were $8.9 million and $9.0 million, respectively (net of accumulated amortization of $16.4 million and $12.1 million, respectively). Other assets at December 31, 2004 and 2003 also included $7.5 million and $10.9 million, respectively, (net of accumulated amortization of $9.6 million and $6.2 million, respectively) of acquired software resulting from the April 2002 acquisition of KMV. Amortization expense for all such software for the years ended December 31, 2006, 2005 and 2004 2003, and 2002 was $7.7$6.0 million, $7.3$8.0 million and $5.3$7.7 million, respectively.
The Company capitalizes costs related to software developed or obtained for internal use in accordance with Statement of Position 98-1, “Accounting for the Costs of Computer Software Developed or Obtained for Internal Use”. These assets, included in property and equipment in the consolidated balance sheets, relate to the Company’s accounting, product delivery and other systems. Such costs generally consist of direct costs of third partythird-party license fees, professional services provided by third parties and employee compensation, in each case incurred either during the application development stage or in connection with upgrades and enhancements that increase functionality. Such costs are depreciated over their estimated useful lives, generally three to five years. Costs incurred during the preliminary project stage of development as well as maintenance costs are expensed as incurred.
Long-Lived Assets, Including Goodwill and Other Acquired Intangible Assets
Finite-lived intangible assets and other long-lived assets are reviewed for recoverability whenever events or changes in circumstances indicate that the carrying amount may not be recoverable. If the estimated undiscounted future cash flows are lower than the carrying amount of the related asset, a loss is recognized for the difference between the carrying amount and the estimated fair value of the asset. Goodwill and indefinite-lived intangible assets are tested for impairment annually or more frequently if events or circumstances indicate the assets may be impaired. If the estimated fair value is less than its carrying amount, a loss is recognized.
Stock-Based Compensation
In 2002 and prior years,On January 1, 2006, the Company measuredadopted, under the cost of stock-based compensation using the intrinsic value approach under Accounting Principles Board (“APB”) Opinion No. 25 rather than applyingmodified prospective application method, the fair value method provisions of accounting for stock-based compensation under Statement of Financial Accounting Standards (“SFAS”) No. 123 (Revised 2004) “Share-Based Payment” (“SFAS No. 123, “Accounting for Stock-Based Compensation” as amended by SFAS No. 148, “Accounting for Stock-Based Compensation — Transition and Disclosure — an amendment of FASB Statement No.
51
123”123R”). Accordingly, the Company did not recognizeUnder this pronouncement, companies are required to record compensation expense relatedfor all share-based payment award transactions granted to grantsemployees based on the fair value of employee stock options andthe equity instrument at the time of grant. This includes shares issued to participants in itsunder employee stock purchase plan.
Onplans, stock options, restricted stock and stock appreciation rights. Previously, on January 1, 2003, the Company adopted, on a prospective basis, the fair value method of accounting for stock-based compensation under SFAS No. 123. Therefore,123, “Accounting for Stock-Based Compensation”.
In 2006, the incremental compensation expense due to the adoption of SFAS No. 123R caused operating income and income before provision for income taxes to decrease by $5.8 million, net income to decrease by $3.5 million and had a $0.02 and $0.01 impact on basic and diluted earnings per share, respectively. In addition, prior to the adoption of SFAS No. 123R, excess tax benefits relating to stock-based compensation was presented in the consolidated statements of cash flows as an operating cash flow, along with other tax cash flows, in accordance with the provisions of Emerging Issues Task Force (“EITF”) No. 00-15, “Classification in the Statement of Cash Flows of the Income Tax Benefit Received by a Company upon Exercise of a Nonqualified Employee Stock Option” (“EITF 00-15”). SFAS No. 123R supersedes EITF 00-15, amends SFAS No. 95, “Statement of Cash Flows”, and requires tax benefits relating to excess stock-based compensation deductions to be prospectively presented in the consolidated statements of cash flows as a financing cash flow. As a result of this change in presentation, $103.2 million of excess tax benefits from stock-based compensation was recorded as a cash flow from financing activities rather than a cash flow from operating activities for the year ended December 31, 2006.
41
In November 2005, the FASB issued FASB Staff Position (“FSP”) No. FAS 123(R)-3, “Transition Election Related to Accounting for Tax Effects of Share-Based Payment Awards” (“FSP 123R-3”). FSP 123R-3 provides for an alternative transition method for establishing the beginning balance of the additional paid-in capital pool (“APIC pool”) related to the tax effects of employee stock options granted on and aftershare-based compensation, which is available to absorb tax deficiencies recognized subsequent to the adoption of SFAS No. 123R. The Company has elected to adopt this alternative transition method in establishing the beginning APIC pool at January 1, 2003 are being expensed by the Company over the option vesting period, based on the estimated fair value of the award on the date of grant. In addition, shares issued to participants in the Company’s employee stock purchase plan are being expensed by the Company based on the discount from the market price received by the participants.2006.
The consolidated statements of operations include pre-tax compensation expense of $77.1 million, $54.8 million and $27.8 million infor the years ended December 31, 2006, 2005 and 2004, and $10.8 million in 2003,respectively; related to stock options grantedstock-based compensation plans. The total income tax benefit recognized in the income statement for stock-based compensation plans was $29.7 million, $21.4 million and stock issued under$11.0 million for the employee stock purchase plan since January 1, 2003,years ended December 31, 2006, 2005 and also2004, respectively. There was $0.2 million of compensation expense capitalized for both the years ended December 31, 2006 and 2005 related to restricted stock.stock-based compensation plans. There was no compensation expense related to stock-based compensation plans capitalized for the year ended December 31, 2004. The consolidated statementexpense for the year ended December 31, 2005 includes approximately $9.1 million relating to the accelerated expensing of operationsequity grants for 2002 includes no such expense. In addition,employees who were at or near retirement eligibility as defined in the 2004related Company stock plans. The 2005 and 20032004 expense is less than that which would have been recognized if the fair value method had been applied to all awards since the original effective date of SFAS No. 123 rather than being applied prospectively.prospectively as of January 1, 2003. Had the Company determined such stock-based compensation expense using the fair value method provisions of SFAS No. 123 since its original effective date, Moody’s net income and earnings per share for 2005 and 2004 would have been reduced to the pro forma amounts shown below.
| Year Ended December 31, | ||||||||||||
| 2004 | 2003 | 2002 | ||||||||||
| Net income: | ||||||||||||
| As reported | $ | 425.1 | $ | 363.9 | $ | 288.9 | ||||||
| Add: Stock-based compensation expense included in reported net income, net of tax | 16.8 | 6.6 | 0.1 | |||||||||
| Deduct: Stock-based compensation expense determined under the fair value method, net of tax | (28.2 | ) | (20.0 | ) | (14.3 | ) | ||||||
| Pro forma net income | $ | 413.7 | $ | 350.5 | $ | 274.7 | ||||||
| Basic earnings per share: | ||||||||||||
| As reported | $ | 2.86 | $ | 2.44 | $ | 1.88 | ||||||
| Pro forma | $ | 2.79 | $ | 2.35 | $ | 1.78 | ||||||
| Diluted earnings per share: | ||||||||||||
| As reported | $ | 2.79 | $ | 2.39 | $ | 1.83 | ||||||
| Pro forma | $ | 2.71 | $ | 2.30 | $ | 1.75 | ||||||
The pro forma disclosures shown above are not representative of the effects on net income and earnings per share in future years.
The fair value of stock options used to compute the pro forma net income and earnings per share disclosures is the estimated present value at grant date using the Black-Scholes option-pricing model. The following weighted average assumptions were used for options granted during 2004, 2003 and 2002:
| 2004 | 2003 | 2002 | ||||||||||
| Expected dividend yield | 0.46 | % | 0.41 | % | 0.41 | % | ||||||
| Expected stock volatility | 30 | % | 30 | % | 25 | % | ||||||
| Risk-free interest rate | 3.24 | % | 3.03 | % | 4.13 | % | ||||||
| Expected holding period | 5.0 | yrs | 5.0 | yrs | 4.5 | yrs | ||||||
The estimated weighted average fair value of Moody’s options granted in 2004, 2003, and 2002 was $20.00, $13.06, and $10.97, respectively.
The Company recorded compensation expense of $0.2 million in 2002 related to outstanding performance share grants, for which the performance period ended during 2002. There were no performance share grants outstanding and, accordingly, no related expense for the years ended December 31, 2004 and 2003.
52
At the Distribution Date, all unexercised Old D&B stock options were converted into separately exercisable options of Moody’s and New D&B. The 2000 Distribution Agreement provided that, for subsequent exercises of those options, the issuer of the stock rather than the employer would be entitled to the related tax deduction. Accordingly, since the Distribution Date and through the filing of its income tax returns for 2002, Moody’s has claimed tax deductions when employees of New D&B have exercised Moody’s stock options.
Effective with its 2003 tax returns, Moody’s has changed its tax deductions to conform to an IRS ruling which clarified that the employer should take the tax deduction for option exercises rather than the issuer. The 2000 Distribution Agreement entitles Moody’s to reimbursement from New D&B for the resulting loss of the issuer-based tax deductions. Accordingly, Moody’s has reflected a receivable from New D&B within other current assets in the consolidated balance sheet in the amount of $23.3 million at December 31, 2004, consisting of $12.4 million related to the year ended December 31, 2004 and $10.9 million related to 2003. This accounting had no impact on the results of operations.
The consolidated balance sheet and statement of cash flows as of andamounts for the year ended December 31, 2003 have been2005 include the effect of the $9.1 million pre-tax charge discussed above.
| 2005 | 2004 | |||||||
Net income: | ||||||||
As reported | $ | 560.8 | $ | 425.1 | ||||
Add: Stock-based compensation expense included in reported net income, net of tax | 33.3 | 16.8 | ||||||
Deduct: Stock-based compensation expense determined under the fair value method, net of tax | (38.6 | ) | (28.2 | ) | ||||
Pro forma net income | $ | 555.5 | $ | 413.7 | ||||
Basic earnings per share: | ||||||||
As reported | $ | 1.88 | $ | 1.43 | ||||
Pro forma | $ | 1.87 | $ | 1.39 | ||||
Diluted earnings per share: | ||||||||
As reported | $ | 1.84 | $ | 1.40 | ||||
Pro forma | $ | 1.82 | $ | 1.36 | ||||
Derivative Instruments and Hedging Activities
Based on the Company’s risk management policy, from time to time the Company may use derivative financial instruments to reduce exposure to changes in foreign exchange and interest rates. The Company does not enter into derivative financial instruments for speculative purposes. The Company accounts for derivative financial instruments and hedging activities in accordance with SFAS No. 133, “Accounting for Derivative Instruments and Certain Hedging Activities” (“SFAS No. 133”), as amended and interpreted, which requires that all derivative financial instruments be recorded on the balance sheet at their respective fair values. The changes in the value of derivatives that qualify as fair value hedges are recorded currently into earnings. Changes in the derivative’s fair value that qualify as cash flow hedges are recorded as other comprehensive income or loss, to the extent the hedge is effective, and such amounts are reclassified to reflect this treatment.earnings in the same period or periods during which the hedged transaction affects income.
Employee Benefit Plans
Moody’s maintains various noncontributory defined benefit pension plans, in which substantially all U.S. employees of the Company are eligible to participate, as well as other contributory and noncontributory retirement and post-retirement plans. The expenses, assets, expenses, liabilities and obligations that Moody’s reports for pension and other post-retirement benefits are dependent on many assumptions concerning the outcome of future events and circumstances. TheseMoody’s major assumptions include the following:
In determining such assumptions, the Company consultsdetermines these assumptions based on the Company’s long-term actual experience and future outlook as well as consultation with outside actuaries and other advisors where deemed appropriate. In accordance with relevant accounting standards, ifIf actual results differ from the Company’s assumptions, such differences are deferred and amortized over the estimated future working life of the plan participants. WhileSee Note 10 for a full description of these plans and the Company believes that the assumptions used in these calculations are reasonable, differences in actual experience or changes in assumptions could affect the assets, expenses, liabilitiesaccounting and obligations related to the Company’s pension and other post-retirement benefits.funding policies.
42
Revenue Recognition
The Company recognizes revenue in accordance with Staff Accounting Bulletin No. 104, “Revenue Recognition”. As such, revenue is recognized when an agreementarrangement exists, the services have been provided and accepted by the customer, fees are determinable and the collection of resulting receivables is considered probable.
Revenue attributed to initial ratings of issued securities is recognized when the rating is issued. Revenue attributed to monitoring of issuers or issued securities is recognized over the period in which the monitoring is performed. In most areas of the ratings business, the Company charges issuers annual monitoring fees and amortizes such fees ratably over the related one-year period. In the case of commercial mortgage-backed securities, fees that are charged
53
for future monitoring over the life of the related securities are amortized over such lives which averaged approximately 26range from five to 46 years as of December 31, 2004.2006.
In areas where the Company does not separately charge monitoring fees, the Company defers portions of the rating fees that it estimates will be attributed to future monitoring activities and recognizes such fees ratably over the applicable estimated monitoring period. The portion of the revenue to be deferred is determined based on annualupon a number of factors, including the estimated fair market value of the monitoring feesservices charged for similar securities or issuers and the level of monitoring effort required for a given type of security or issuer.issuers. The estimated monitoring period is determined based on factors such as the frequency of issuance by the issuers and the lives of the rated securities. Currently, the estimated monitoring periods range from three yearsone to ten years.
Revenue from sales of research products and from credit risk management subscription products is recognized ratably over the related subscription period, which is principally one year. Revenue from licenses of credit processing software is recognized at the time the product is shipped to customers, or at such other time as the Company’s obligations are complete. Related software maintenance revenue is recognized ratably over the annual maintenance period.
Amounts billed or received in advance of providing the related products or services are credited to deferred revenueclassified in accounts payable and accrued liabilities in the consolidated financial statements and reflected in revenue when earned. TheIn addition, the consolidated balance sheets reflect as current deferred revenue amounts that are expected to be recognized within one year of the balance sheet date, and as non-current deferred revenue amounts that are expected to be recognized over periods greater than one year. The majority of the balance in non-current deferred revenue relates to fees for future monitoring of commercial mortgage-backed securities.
Accounts Receivable Allowances
Moody’s records as reductions of revenue provisions for estimated future adjustments to customer billings, based on historical experience and current conditions. Such provisions are reflected as additions to the accounts receivable allowance. Adjustments to and write-offs of receivables are charged against the allowance. Moody’s evaluates its estimates on a regular basis and makes adjustments to its revenue provisions and the accounts receivable allowance as considered appropriate.
Operating Expenses
Operating expenses are charged to income as incurred. These expenses include costs associated with the development and production of the Company’s products and services and their delivery to customers. These expenses principally include employee compensation and benefits and travel costs that are incurred in connection with these activities.
Selling, General and Administrative Expenses
Selling, general and administrative expenses are charged to income as incurred. These expenses include such items as compensation and benefits for corporate officers and staff and compensation and other expenses related to sales of products. They also include items such as office rent, business insurance, professional fees and gains and losses from sales and disposals of assets.
Foreign Currency Translation
For all operations outside the United States where the Company has designated the local currency as the functional currency, assets and liabilities are translated into U.S. dollars using end of year exchange rates, and revenue and expenses are translated using average exchange rates for the year. For these operations, currency translation adjustments are accumulated in a separate component of shareholders’ equity. Transaction gains and losses are reflected in other non-operating income (expense), net. In 2006, net transaction gains and losses were immaterial. Transaction (losses) gains were ($8.2) million and $1.9 million $2.2 million,in 2005 and $0.3 million in 2004, 2003 and 2002, respectively.
54
43
Comprehensive Income
Comprehensive income represents the change in net assets of a business enterprise during a period due to transactions and other events and circumstances from non-owner sources including foreign currency translation impacts, net actuarial losses and net prior service costs related to pension and other post-retirement plans recorded in accordance with SFAS No. 158, as more fully discussed in Note 10 to the consolidated financial statements, changes in minimum pension liability.liability and derivative instruments. Accumulated comprehensive (loss) income is comprised of currency translation adjustments of $10.7$14.8 million and $3.4 million in 2006 and 2005, respectively, net actuarial losses and net prior service costs related to the Company’s pension and other post-retirement plans of ($22.5) million in 2006, additional minimum pension liabilities of ($1.0)3.5) million in 20042005 and $8.1derivative instruments of ($0.7) million of currency translation adjustmentsand ($0.8) million in 2003.2006 and 2005, respectively. The required disclosures have been included in the consolidated statements of shareholders’ equity.
Income Taxes
The Company accounts for income taxes under the liability method in accordance with SFAS No. 109, “Accounting for Income Taxes”. Therefore, income tax expense is based on reported income before income taxes, and deferred income taxes reflect the effect of temporary differences between the amounts of assets and liabilities that are recognized for financial reporting purposes and the amounts that are recognized for income tax purposes.
Fair Value of Financial Instruments
The Company’s financial instruments include cash, cash equivalents, trade receivables and payables, and bank borrowings, all of which are short-term in nature and, accordingly, approximate fair value. Additionally, the Company invests in short-term investments that are carried at fair value. The fair value of the Company’s notes payable, which have a fixed rate of interest, is estimated using discounted cash flow analyses based on the prevailing interest rates available to the Company for borrowings with similar maturities. The carrying amount of the Company’s notes payable was $300.0 million at December 31, 20042006 and 2003.2005. Their estimated fair value was $316.7$299.1 million and $334.6$306.3 million at December 31, 20042006 and 2003,2005, respectively.
Concentration of Credit Risk
Financial instruments that potentially subject the Company to concentration of credit risk principally consist of cash and cash equivalents, short-term investments and trade receivables.
Cash equivalents consist of investments in high quality investment grade securities within and outside the United States. By policy, the Company limits the amount it can invest with any one issuer. The Company manages its credit risk exposure by allocating its cash equivalents among various money market mutual funds short-term certificates of deposit orand issuers of high-grade commercial paper. AsShort-term investments primarily consist of December 31, 2004,high-grade auction rate securities within the United States. The Company did not maintainmanages its credit risk exposure on cash equivalents and short-term investments by limiting the amount it can invest with any derivative investments or engage in any hedging activities. However, the Company continues to assess the need to enter into hedging transactions to limit risk as needed.
Credit is extended to customers based on an evaluation of their financial condition.single issuer. No customer accounted for 10% or more of accounts receivable at December 31, 20042006 or 2003.2005.
Earnings Per Share of Common Stock
In accordance with SFAS No. 128, “Earnings per Share”, basic earnings per share is calculated based on the weighted average number of shares of common stock outstanding during the reporting period. Diluted earnings per share is calculated giving effect to all potentially dilutive common shares, assuming that such shares were outstanding during the reporting period.
Pension and Other Post-Retirement Benefits
In September 2006, the FASB issued SFAS No. 158, “Employers’ Accounting for Defined Benefit Pension and Other Postretirement Plans—an amendment of FASB Statements No. 87, 88, 106, and 132(R)” (“SFAS No. 158”). SFAS No. 158 requires an employer to recognize as an asset or liability in its statement of financial position the funded status of its defined benefit post-retirement plans and to recognize changes in that funded status in the year in which the changes occur through other comprehensive income. The Company adopted the provisions of SFAS No. 158 as of December 31, 2006 and the incremental effect of adoption was a decrease in other assets of $15.9 million, an increase in other liabilities of $18.6 million and a pre-tax increase in accumulated other comprehensive loss of $34.5 million ($20.0 million net of tax). See Note 10, “Pension and Other Post-Retirement Benefits” for further information.
Use of Estimates
The preparation of financial statements in conformity with accounting principles generally accepted in the United States of America requires management to make estimates and assumptions that affect the reported amounts of assets and liabilities,
44
the disclosure of contingent assets and liabilities at the date of the financial statements, and the
55
reported amounts of revenue and expenses during the period. Actual results could differ from those estimates. Estimates are used for, but not limited to, revenue recognition, accounts receivable allowances, income taxes, contingencies, valuation of investments in affiliates, long-lived and intangible assets and goodwill, pension and other post-retirement benefits, stock options,stock-based compensation, and depreciation and amortization rates for property and equipment and computer software.
Reclassifications
Certain reclassifications have been made to the prior year amounts to conform to the current year presentation.
Recently Issued Accounting Pronouncements
In December 2003,July 2006, the Financial Accounting Standards Board (“FASB”)FASB issued FASB Interpretation No. 46R48, “Accounting for Uncertainty in Income Taxes—an Interpretation of FASB Statement No. 109” (“FIN 46R”), “Consolidation of Variable Interest Entities—An Interpretation of ARB No. 51”, a revision to FIN 46. FIN 46 addresses how a business enterprise should evaluate whether it has a controlling financial interest in an entity through means other than voting rights and accordingly should consolidate the entity. FIN 46R clarifies some of the provisions of FIN 46 and exempts certain entities from its requirements. FIN 46R was effective at the end of the first quarterly period ending after March 15, 2004. The Company’s adoption of FIN 46R did not have an impact on its financial position, results of operations or cash flows.
In May 2004, the FASB issued FASB Staff Position (“FSP”) No. FAS 106-2, “Accounting and Disclosure Requirements Related to the Medicare Prescription Drug, Improvement and Modernization Act of 2003” (the “Act”48”), which supersedes FSP No. 106-1 of the same title and clarifies the accounting for the benefits attributable to new government subsidies for companies that provide prescription drug benefits to retirees. If the effects of the Act are not considereduncertainty in income taxes recognized in a “significant event” pursuant to SFAS No. 106, ”Employers’ Accounting for Post-retirement Benefits Other Than Pensions” the effects of the Act shall be incorporated into the next measurement of plan assets and obligations otherwise required by SFAS No. 106 following the effective date of the FSP (which was December 31, 2004 for the Company). The expected subsidy reduced the Company’s accumulated post-retirement benefit obligation at December 31, 2004 by approximately $0.4 million. The adoption of FSP 106-2 had no effect on the Company’s net periodic post-retirement expensecompany’s financial statements in 2004. In January 2005, the Centers for Medicare and Medicaid Services published final regulations implementing major provisions of the Act and employers are generally given significant flexibility in implementing options related to the Medicare Prescription Drug program. Moody’s is in the process of evaluating the impact of these regulations.
In December 2004, the FASB issued FSP No. 109-2, “Accounting and Disclosure Guidance for the Foreign Earnings Repatriation Provision within the American Jobs Creation Act of 2004”, which provides guidance underaccordance with SFAS No. 109, “Accounting for Income Taxes”,. FIN No. 48 prescribes a recognition threshold and measurement attribute for the financial statement recognition and measurement of a tax position taken or expected to be taken in a tax return and provides guidance on recognition and derecognition of tax benefits resulting from a subsequent change of judgment, classification of liabilities, interest and penalties, accounting in interim periods and disclosure. In accordance with respectFIN No. 48, a company is required to recording the potential impactfirst determine whether it is more-likely-than-not (defined as a likelihood of more than fifty percent) that a tax position will be sustained based on its technical merits as of the repatriation provisionsreporting date. In making this assessment, a company must assume that the taxing authority will examine the position and have full knowledge of all relevant information. A tax position that meets this more-likely-than-not threshold is then measured and recognized at the American Jobs Creation Actlargest amount of 2004 (the “Jobs Act”). The Jobs Act providesbenefit that is greater than fifty percent likely to be realized upon ultimate settlement with a taxing authority, without considering time values. FIN No. 48 is effective for fiscal years beginning after December 15, 2006 and accordingly, is required to be adopted by the Company on January 1, 2007. Upon adoption of FIN No. 48 on January 1, 2007, the Company expects a special one-time tax deduction relatingreduction of retained earnings of between $40 million and $45 million with no impact to a portion of certain foreign earnings that are repatriated in 2004 or 2005. The Company plans to repatriate a portion of foreign earnings in 2005 and is in the process of evaluating the effects of the Jobs Act on its financial position, resultsstatement of operations and cash flows. This is based on a preliminary assessment and could change based on final analysis which will be completed by the end of the first quarter of 2007. After the initial adoption of FIN No. 48, the financial impacts to the statement of operations and cash flows is dependent upon the ultimate resolution of legacy tax matters and other tax matters with the taxing authorities. The Company is unable to predict the final resolution of these matters. See Note 16, “Contingencies” for further discussion of legacy tax matters.
In December 2004,September 2006, the FASB issued SFAS No. 123 (Revised 2004) “Share-Based Payment”157, “Fair Value Measurements” (“SFAS No. 123R”157”). Under this pronouncement, companies are required to record compensation expense for all share-based payment award transactions granted to employees,, which establishes a single authoritative definition of fair value whereby fair value is based on thean exit price that would result from market participants’ behavior, as well as sets out a framework for measuring fair value of the equity instrument at the time of grant. This includes shares issued under employee stock purchase plans, stock options, restricted stock and stock appreciation rights.requires additional disclosures about fair-value measurements. SFAS No. 123R eliminates157 is expected to increase the abilityconsistency of fair value measurements and applies only to accountthose measurements that are already required or permitted by other accounting standards except for measurements of share-based compensation transactions using APB Opinion No. 25, “Accounting for Stock Issuedpayments and measurements that are similar to, Employees”, which had been provided inbut not intended to be, fair value. SFAS No. 123 as originally issued. SFAS No. 123R157 imposes no requirements for additional fair-value measures in financial statements and is effective for quartersfair-value measures already required or permitted by other standards for financial statements issued for fiscal years beginning after JuneNovember 15, 2005.2007 and will be adopted by the Company as of January 1, 2008. The Company is currently evaluatingassessing the impactimpacts that the adoption of this standard will have on its consolidated financial statements.position and results of operations.
56
Note 3 Reconciliation of Weighted Average Shares Outstanding
Below is a reconciliation of basic weighted average shares outstanding to diluted weighted average shares outstanding:
| Year Ended December 31, | ||||||||||||
| 2004 | 2003 | 2002 | ||||||||||
| Weighted average number of shares-Basic | 148.5 | 148.9 | 153.9 | |||||||||
| Dilutive effect of shares issuable under stock-based compensation plans | 3.8 | 3.4 | 3.6 | |||||||||
| Weighted average number of shares-Diluted | 152.3 | 152.3 | 157.5 | |||||||||
There were no antidilutive options outstanding at December 31, 2004 and 2002.
| Year Ended December 31, | ||||||
| 2006 | 2005 | 2004 | ||||
Basic | 284.2 | 297.7 | 297.0 | |||
Dilutive effect of shares issuable under stock-based compensation plans | 7.7 | 7.9 | 7.7 | |||
Diluted | 291.9 | 305.6 | 304.7 | |||
Options to purchase 2.22.9 million, 3.1 million and 3.3 million common shares at December 31, 20032006, 2005 and 2004, respectively, were outstanding but were not included in the computation of diluted weighted average shares outstanding because they were antidilutive.
The calculation of diluted earnings per share requires certain assumptions to be made related to the use of proceeds that would be received upon the exercise of stock options. These assumed proceeds include the excess tax benefit that would be
45
received upon exercise of options outstanding as of December 31, 2006, 2005 and 2004. Assumed proceeds from excess tax benefits are based on the deferred tax assets recorded with consideration of “as if” deferred tax assets calculated under the provisions of SFAS No. 123R.
Note 4 Short-Term Investments
Short-term investments are securities with maturities greater than 90 days at the time of purchase that are available for operations in the next twelve months and primarily represent auction rate certificates. The short-term investments are classified as available-for-sale and therefore are carried at fair value. The remaining contractual maturities of the short-term investments were one month to 39 years and one month to 38 years as of December 31, 2006 and 2005, respectively. Unrealized holding gains and losses on available-for-sale securities are included in accumulated other comprehensive income, net of applicable income taxes in the consolidated financial statements. During the year ended December 31, 2006, there were immaterial realized gains/losses from sales of available-for-sale securities. During the years ended December 31, 2005 and 2004 there were no realized gains or losses from sales of available-for-sale securities. As of December 31, 2006 and 2005, there were no unrealized gains or losses from available-for-sale securities.
Note 5 Derivative Instruments and Hedging Activities
On August 23, 2005, the Company entered into forward starting interest rate swap agreements (“Swaps”) with a notional amount of $300 million. These cash flow hedges effectively mitigated the interest rate risk from August 23, 2005 to September 22, 2005, the pricing date of the Company’s fixed rate ten-year $300 million Senior Unsecured Notes due 2015 (see Note 13). On September 22, 2005, the Company terminated all the Swaps resulting in a payment of $1.3 million. Under hedge accounting, this amount was deferred in other comprehensive loss and will be amortized as an adjustment to interest expense over the ten-year life of the Senior Unsecured Notes. At December 31, 2006 and 2005, the Company had no outstanding Swaps. As of December 31, 2006 and 2005, the Company has included in accumulated other comprehensive loss an unamortized Swap loss of $1.2 million ($0.7 million, net of tax) and $1.3 million ($0.8 million, net of tax), respectively, of which $0.1 million will be reclassified to interest expense in 2007.
In October 2006, the Company entered into two hedging transactions using purchased put options to protect against foreign currency exchange rate risks from forecasted revenue denominated in euros. The aggregate notional amount of the foreign currency option contracts outstanding at December 31, 2006 was $7.9 million and the fair value of these contracts, which was recorded in “other current assets” in the Company’s consolidated balance sheets, was less than $0.1 million. The amount of unrecognized foreign exchange hedge losses recorded in other comprehensive loss as of December 31, 2006 and the amount of the hedges’ ineffectiveness for 2006 recorded within revenue in the consolidated statements of operations were immaterial.
46
Note 46 Property and Equipment, Net
Property and equipment, net consisted of:
| December 31, | ||||||||
| 2004 | 2003 | |||||||
| Land, building and building improvements | $ | 25.4 | $ | 24.6 | ||||
| Office and computer equipment | 48.1 | 41.6 | ||||||
| Office furniture and fixtures | 23.0 | 21.3 | ||||||
| Internal-use computer software | 30.7 | 23.7 | ||||||
| Leasehold improvements | 35.1 | 33.6 | ||||||
| Property and equipment, at cost | 162.3 | 144.8 | ||||||
| Less: accumulated depreciation and amortization | (117.1 | ) | (98.0 | ) | ||||
| Property and equipment, net | $ | 45.2 | $ | 46.8 | ||||
| December 31, | ||||||||
| 2006 | 2005 | |||||||
Land, building and building improvements | $ | — | $ | 25.8 | ||||
Office and computer equipment | 63.6 | 53.7 | ||||||
Office furniture and fixtures | 28.8 | 25.4 | ||||||
Internal-use computer software | 54.8 | 41.4 | ||||||
Leasehold improvements | 30.9 | 44.0 | ||||||
Property and equipment, at cost | 178.1 | 190.3 | ||||||
Less: accumulated depreciation and amortization | (116.1 | ) | (134.9 | ) | ||||
Property and equipment, net | $ | 62.0 | $ | 55.4 | ||||
The consolidated statements of operations reflect depreciation and amortization expense related to the above assets of $19.5$23.6 million, $18.3$20.4 million and $14.0$19.5 million for the years ended December 31, 2004, 2003,2006, 2005 and 2002,2004, respectively.
During the fourth quarter of 2006, the Company completed the sale of its corporate headquarters located at 99 Church Street, New York, New York and recorded a gain of $160.6 million.
Note 57 Acquisitions
KMVWall Street Analytics, Inc.
On April 12, 2002, Moody’sIn December 2006, the Company acquired the businesses comprising KMV.Wall Street Analytics, Inc., a developer of structured finance analytical models and monitoring software. The acquisition expandshas broadened Moody’s capabilities in the analysis and monitoring of complex structured debt securities while increasing the firm’s analytical and product offeringsdevelopment staff dedicated to creating new software and customer base of Moody’s credit risk assessment business, which was previously operated by Moody’s Risk Management Services. The results of KMV have been included in Moody’s consolidated financial statements sinceanalytic tools for the acquisition date.
The aggregate purchase price of $212.6 million consisted of $209.3 million in cash payments to the sellers and $3.3 million in direct transaction costs, primarily professional fees.structured finance market. The purchase price was funded by using $128.3 million of Moody’snot material and the near term impact to operations and cash on hand and $81.0 million of borrowings under Moody’s existing bank credit lines. The Company repaid those borrowings in the second quarter of 2002.
The acquisition has been accounted for as a purchase. Shown belowflows is the purchase price allocation, which summarizes the fair values of the assets acquired and liabilities assumed at the date of acquisition.
57
| Current assets | $ | 21.0 | ||||||
| Property and equipment, net | 4.6 | |||||||
| Intangible assets: | ||||||||
| Customer list (12.0 year life) | $ | 50.7 | ||||||
| Trade secrets (not subject to amortization) | 25.5 | |||||||
| Other intangibles (5.2 year weighted average life) | 6.3 | |||||||
| Total intangible assets | 82.5 | |||||||
| In-process research and development | 1.1 | |||||||
| Goodwill | 118.3 | |||||||
| Other assets | 17.1 | |||||||
| Liabilities assumed | (32.0 | ) | ||||||
| Net assets acquired | $ | 212.6 | ||||||
In accordance with SFAS No. 142, goodwill, which has been assigned to the Moody’s KMV segment, will not be amortized. In accordance with FASB Interpretation No. 4, “Applicability of FASB Statement No. 2 to Business Combinations Accounted for by the Purchase Method”, the $1.1 million allocated to acquired in-process research and development was written off immediately following the acquisition and is included in selling, general and administrative expenses for the year ended December 31, 2002. Current assets shown above include acquired cash of $7.2 million. Other assets include acquired software of $16.0 million with a life of 5 years. For income tax purposes, the excess of the purchase price over the acquired net assets is expected to be amortized over 15 years.material.
The following unaudited pro forma consolidated financial information, forChina Cheng Xin International Credit Rating Co. Ltd.
In September 2006, the year ended December 31, 2002, reflectsCompany acquired a 49% share of China Cheng Xin International Credit Rating Co. Ltd. (“CCXI”) from China Cheng Xin Credit Management Co. Ltd. (“CCXCM”) and an entity affiliated with CCXCM. Terms of the acquisition of KMV as if it had been consummated as ofagreement will permit the beginning of the period, after giving effect to the following adjustments: (i) elimination of transaction related charges resulting from the acquisition; (ii) amortization of acquired intangible assets and software; (iii) Moody’s financing costs for the transaction, consisting of interest expense that would have been incurred on the $81.0 million of bank borrowings and interest income that would have been forgone on the balance of the purchase price; and (iv) related income tax effects.
| Year Ended December 31, | ||||||||||||
| Pro Forma | ||||||||||||
| 2004 | 2003 | 2002 | ||||||||||
| Revenue | $ | 1,438.3 | $ | 1,246.6 | $ | 1,038.4 | ||||||
| Net income | $ | 425.1 | $ | 363.9 | $ | 288.0 | ||||||
| Diluted earnings per share | $ | 2.79 | $ | 2.39 | $ | 1.83 | ||||||
The unaudited pro forma consolidated financial information should be read in conjunction with the Company’s Form 8-K/A filed with the Securities and Exchange Commission on June 26, 2002.
The unaudited pro forma consolidated financial information is presented for comparative purposes only and is not intended to be indicative of the actual consolidated results of operations that would have been achieved had the transaction been consummated as of the dates indicated above, nor does it purport to indicate results that may be attained in the future.
Korea Investors Service
In August 1998, the Company made a 10% cost-basis investment in Korea Investors Service (“KIS”), a Korean rating agency. In December 2001, the Company entered into a definitive agreement to increase its investment to just over 50%, at a cost of $9.6 million with a contingent payment of up to 6.9 billion Korean Won (approximately $6.8 million as of December 31, 2004) in 2005, based on KIS net income for the three-year period ended December 31, 2004. The Company currently estimates that this payment will be $3.7 million; this amount has been recorded in accrued liabilities at December 31, 2004 with a corresponding increase to goodwill. It is anticipated that this payment will be made in the first quarter of 2005.
58
In March 2004, KIS increased its ownership in an equity-basis investmentCCXI to justa majority over 50%, at a cost of 0.6 billion Korean Won, net oftime as permitted by Chinese authorities. The purchase price was not material and the near term impact to operations and cash acquired (approximately $0.6 million). As a result, starting in March 2004 this entityflows is being consolidated in Moody’s financial statements and $0.7 million of goodwill was recorded relatednot expected to this entity.be material.
Argentine Rating AgenciesEconomy.com
From 1999 through 2002, Moody’s made equity investments totaling $4.4 million in two Argentine rating agencies.
In January 2002,November 2005, the Argentine government announcedCompany acquired Economy.com, a leading independent provider of economic research and data services. The acquisition will deepen Moody’s analytical capabilities to broader areas of economic and demographic research, expand the creationrange of a dual currency system in which certain qualifying transactions would be settled at an expected fixed exchange rate of 1.4 Argentine pesosproducts and services offered to one U.S. dollar, while non-qualifying transactions would be settled using a free floating market exchange rate. In February 2002, the Argentine government announced a shiftinstitutional customers and introduce new customers to a single free floating market exchange rate. From 1991 until February 2002, the Argentine peso had been peggedMoody’s. It will provide Economy.com with access to the U.S. dollar at the rate of oneMoody’s extensive client base, deep product marketing capabilities and other resources needed to one.
As a result of the 2002 devaluation of the Argentine peso, an acquisition-relatedexpand its business. The purchase price adjustment was triggered relatingnot material and the near term impact to Moody’s equity-basis investments in the two Argentine rating agencies. The adjustment resulted in Moody’s receiving additional shares in these rating agencies, which increased Moody’s ownership positionoperations and cash flows is not expected to over 90%. As a result, starting in January 2003 the Argentine rating agencies are being consolidated in Moody’s financial statements.be material.
47
Note 68 Goodwill and Other Intangible Assets
The following table summarizes the activity in goodwill for the periods indicated:
| Year Ended December 31, 2004 | Year Ended December 31, 2003 | ||||||||||||||||||||||||
| Moody’s | Moody’s | Moody’s | Moody’s | ||||||||||||||||||||||
| Investors Service | KMV | Consolidated | Investors Service | KMV | Consolidated | ||||||||||||||||||||
| Beginning balance | $ | 2.3 | $ | 124.1 | $ | 126.4 | $ | 2.3 | $ | 124.0 | $ | 126.3 | |||||||||||||
| Additions | 4.9 | — | 4.9 | — | — | — | |||||||||||||||||||
| Other | 0.4 | — | 0.4 | — | 0.1 | 0.1 | |||||||||||||||||||
| Ending balance | $ | 7.6 | $ | 124.1 | $ | 131.7 | $ | 2.3 | $ | 124.1 | $ | 126.4 | |||||||||||||
The following table summarizes intangible
Year Ended December 31, 2006 | Year Ended December 31, 2005 | |||||||||||||||||
Moody’s Investors Service | Moody’s KMV | Consolidated | Moody’s Investors Service | Moody’s KMV | Consolidated | |||||||||||||
Beginning balance | $ | 28.0 | $ | 124.1 | $ | 152.1 | $ | 7.6 | $ | 124.1 | $ | 131.7 | ||||||
Additions | 23.2 | — | 23.2 | 20.3 | — | 20.3 | ||||||||||||
Foreign currency translation adjustments | 0.8 | — | 0.8 | 0.1 | — | 0.1 | ||||||||||||
Ending balance | $ | 52.0 | $ | 124.1 | $ | 176.1 | $ | 28.0 | $ | 124.1 | $ | 152.1 | ||||||
Intangible assets at the dates indicated:
| December 31, | ||||||||
| 2004 | 2003 | |||||||
| Customer lists (11.3 year original weighted average life) | $ | 58.0 | $ | 57.8 | ||||
| Accumulated amortization | (15.9 | ) | (10.6 | ) | ||||
| Net customer lists | 42.1 | 47.2 | ||||||
| Other amortizable intangible assets (5.6 year original weighted average life) | 8.2 | 8.2 | ||||||
| Accumulated amortization | (5.1 | ) | (3.5 | ) | ||||
| Net other amortizable intangible assets | 3.1 | 4.7 | ||||||
| Total amortizable intangible assets | 45.2 | 51.9 | ||||||
| Indefinite-lived intangible assets | 25.5 | 25.5 | ||||||
| Total intangible assets | $ | 70.7 | $ | 77.4 | ||||
59
Indefinite-lived intangibles are trade secrets acquired with the April 2002 acquisition of KMV. Current circumstances and conditions continue to support an indefinite useful life.
| December 31, | ||||||||
| 2006 | 2005 | |||||||
Customer lists (11.2 year weighted average life) | $ | 62.5 | $ | 60.2 | ||||
Accumulated amortization | (26.8 | ) | (21.2 | ) | ||||
Net customer lists | 35.7 | 39.0 | ||||||
MKMV trade secret (12.0 year weighted average life) | 25.5 | 25.5 | ||||||
Accumulated amortization | (2.3 | ) | (0.2 | ) | ||||
Net trade secret | 23.2 | 25.3 | ||||||
Other amortizable intangible assets (5.6 year weighted average life) | 15.4 | 12.9 | ||||||
Accumulated amortization | (8.6 | ) | (6.4 | ) | ||||
Net other amortizable intangible assets | 6.8 | 6.5 | ||||||
Total intangible assets, net | $ | 65.7 | $ | 70.8 | ||||
Amortization expense for intangible assets subject to amortization for the years ended December 31, 2006, 2005 and 2004 2003was $9.9 million, $6.8 million and 2002 was $6.9 million, $7.0 million, and $5.3 million, respectively. In December 2005, the Company began amortizing the MKMV trade secret over 12 years.
Estimated future annual amortization expense for intangible assets subject to amortization is as follows:
| Year Ending December 31, | ||||
| 2005 | $ | 6.5 | ||
| 2006 | 6.2 | |||
| 2007 | 5.5 | |||
| 2008 | 4.5 | |||
| 2009 | 4.2 | |||
| Thereafter | $ | 18.3 | ||
Year Ending December 31, | |||
2007 | $ | 9.6 | |
2008 | 8.4 | ||
2009 | 7.5 | ||
2010 | 7.5 | ||
2011 | 7.3 | ||
Thereafter | $ | 25.4 | |
48
Note 79 Accounts Payable and Accrued Liabilities
Accounts payable and accrued liabilities consisted of the following:
| December 31, | ||||||||
| 2004 | 2003 | |||||||
| Accounts payable | $ | 2.9 | $ | 4.4 | ||||
| Accrued income taxes (see Note 10) | 75.5 | 47.3 | ||||||
| Accrued compensation and benefits | 128.7 | 126.1 | ||||||
| Accrued professional fees | 9.7 | 6.6 | ||||||
| Accrued interest expense | 5.7 | 5.7 | ||||||
| Other | 48.0 | 38.3 | ||||||
| Total | $ | 270.5 | $ | 228.4 | ||||
| December 31, | ||||||
| 2006 | 2005 | |||||
Accounts payable | $ | 8.8 | $ | 6.8 | ||
Accrued income taxes (see Note 12) | 68.6 | 41.9 | ||||
Accrued compensation and benefits | 154.3 | 138.8 | ||||
Accrued interest expense | 3.7 | 3.7 | ||||
Advance payments | 10.9 | 10.3 | ||||
Other | 93.4 | 78.3 | ||||
Total | $ | 339.7 | $ | 279.8 | ||
Accrued compensation and benefits included accrued incentive compensation of approximately $83$104 million at December 31, 20042006 and $93$92 million at December 31, 2003.2005. Funding and related expense for Moody’s incentive compensation plans are primarily based on year-to-year growth in operating income and, to a lesser extent, earnings per share, for Moody’s senior management and annual results compared to budget for the Moody’s Investors Service professional staff and for Moody’s KMV.
Note 810 Pension and Other Post-Retirement Benefits
Moody’s maintains both funded and unfunded noncontributory defined benefit pension plans in which substantially all U.S. employees of the Company are eligible to participate. The plans provide defined benefits using a cash balance formula based on years of service and career average salary. The funded plan is referred to herein as the “Moody’s Retirement Plan”.
salary or final average pay for selected executives. The Company also provides certain healthcare and life insurance benefits for retired U.S. employees. The post-retirement healthcare plans are contributory with participants’ contributions adjusted annually; the life insurance plans are noncontributory. The accounting forIn November 2005, the Company increased its future share of the costs and as a result remeasured the healthcare plans anticipates future cost-sharing changesplan as of the date of the plan amendment, the effects of which were not material to the writtenresults of operations.
Moody’s funded and unfunded pension plans, that are consistent with the Company’s expressed intent to fix its share of costspost-retirement healthcare plans and require retirees to pay for all future increases in plan costs in excess of the amount of the per person company contribution in the year 2005.
Thepost-retirement life insurance plans described in the preceding two paragraphs are collectively referred to herein as the “Post-Retirement Plans”.
60
Effective at the Distribution Date, Moody’s assumed responsibility for pension and other post-retirement benefits relating to its active employees. New D&B has assumed responsibility for the Company’s retirees and vested terminated employees as of the Distribution Date.
As describedIn September 2006, the FASB issued SFAS No. 158. SFAS No. 158 does not change how pensions and other post-retirement benefits are accounted for and reported in Note 2,the income statement nor does it change the components of net periodic benefit expense. SFAS No. 158 does, however, require an employer to recognize as an asset or liability in its statement of financial position the overfunded or underfunded status, which is measured on a plan-by-plan basis as the difference between plan assets at fair value and the benefit obligation of a defined benefit post-retirement plan, and to recognize changes in that funded status in the year in which the changes occur through other comprehensive income. For a pension plan, the benefit obligation is the projected benefit obligation. For any other post-retirement benefit plan, such as a retiree healthcare plan, the benefit obligation is the accumulated post-retirement benefit obligation. The Company adopted the provisions of SFAS No. 158 as of December 31, 2006 and the incremental effect of adopting SFAS No. 158 was a decrease in other assets of $15.9 million, an increase in other liabilities of $18.6 million and a pre-tax increase in accumulated other comprehensive loss of $ 34.5 million ($20.0 million net of tax).
Following is a summary of net actuarial losses and net prior service costs recognized in accumulated other comprehensive income (“AOCI”) as of December 31, 2006 that have not yet been recognized as components of net periodic benefit expense:
| Pension Plans | Other Post- Retirement Plans | |||||
Net actuarial losses (net of tax benefit of $ 13.7 million for pension plans and $0.3 million for other post-retirement plans) | $ | 18.9 | $ | 0.4 | ||
Net prior service costs (net of tax benefit of $2.0 million for pension plans and $ 0.3 million for other post-retirement plans) | 2.8 | 0.4 | ||||
Net amount recognized in AOCI | $ | 21.7 | $ | 0.8 | ||
49
The amounts recognized in AOCI will subsequently be recognized as components of net periodic benefit expense over future years pursuant to the recognition and amortization provisions of SFAS No. 87 and No. 106. The Company expects to recognize in 2007, as components of net periodic benefit expense, amortization of net actuarial losses of $2.2 million for its pension plans and amortization of prior service costs of $0.6 million ($0.4 million and $0.2 million for pension plans and other post-retirement plans, respectively).
In May 2004, the Company adopted FSPFASB issued FASB Staff Position No. FAS 106-2, “Accounting and Disclosure Requirements Related to the Medicare Prescription Drug, Improvement and Modernization Act of 2003” (the “Act”). The Act provides new government subsidies for companies that provide prescription drug benefits to retirees. In January 2005, the Centers for Medicare and Medicaid Services published final regulations implementing major provisions of the Act resulting in a $0.8 million reduction to the Company’s accumulated other post-retirement benefit obligation. The adoption of FSP No. 106-2 resulted in a $0.4 million reduction inand the final regulations reduced the Company’s accumulated benefit obligation related to post-retirement healthcare plans. In addition, since the effects of the Act were not a “significant event” as defined in FAS 106, no change in net periodic post-retirement benefit expense was recordedby $0.2 million in 2004 related to the Act.2005.
Following is a summary of the activity related tochanges in benefit obligations and fair value of plan assets for the Post-Retirement Plans for the years ended December 31, 20042006 and 2003, as well as the status of the plans at December 31, 2004. The Company uses a December 31 measurement date for its Post-Retirement Plans.
| Pension | Other Post- | |||||||||||||||
| Plans | Retirement Plans | |||||||||||||||
| 2004 | 2003 | 2004 | 2003 | |||||||||||||
Change in benefit obligation | ||||||||||||||||
| Projected benefit obligation, beginning of the period | $ | (79.7 | ) | $ | (53.3 | ) | $ | (6.1 | ) | $ | (6.1 | ) | ||||
| Service cost | (8.3 | ) | (6.9 | ) | (0.5 | ) | (0.4 | ) | ||||||||
| Interest cost | (5.1 | ) | (4.1 | ) | (0.4 | ) | (0.3 | ) | ||||||||
| Benefits paid | 0.8 | 0.6 | 0.3 | 0.1 | ||||||||||||
| Plan amendments | (3.5 | ) | (0.5 | ) | — | 0.5 | ||||||||||
| Impact of Medicare Part D | — | — | 0.4 | — | ||||||||||||
| Curtailment charge | — | 0.6 | — | — | ||||||||||||
| Special termination benefit charge | — | (1.0 | ) | — | — | |||||||||||
| Actuarial gain/(loss) | (1.0 | ) | (8.4 | ) | (0.4 | ) | 0.5 | |||||||||
| Assumption changes | (13.0 | ) | (6.7 | ) | (0.7 | ) | (0.4 | ) | ||||||||
| Projected benefit obligation, end of the period | $ | (109.8 | ) | $ | (79.7 | ) | $ | (7.4 | ) | $ | (6.1 | ) | ||||
Change in plan assets | ||||||||||||||||
| Fair value of plan assets, beginning of the period | $ | 86.1 | $ | 71.5 | $ | — | $ | — | ||||||||
| Actual return on plan assets | 10.4 | 15.2 | — | — | ||||||||||||
| Benefits paid | (0.8 | ) | (0.6 | ) | (0.3 | ) | (0.1 | ) | ||||||||
| Contributions | — | — | 0.3 | 0.1 | ||||||||||||
| Fair value of plan assets, end of the period | $ | 95.7 | $ | 86.1 | $ | — | $ | — | ||||||||
Reconciliation of funded status to total amount recognized | ||||||||||||||||
| Funded status of the plans | $ | (14.1 | ) | $ | 6.4 | $ | (7.4 | ) | $ | (6.1 | ) | |||||
| Unrecognized actuarial loss | 48.6 | 38.3 | 1.1 | 0.4 | ||||||||||||
| Unrecognized prior service cost | 5.3 | 2.1 | 0.3 | 0.4 | ||||||||||||
| Net amount recognized | $ | 39.8 | $ | 46.8 | $ | (6.0 | ) | $ | (5.3 | ) | ||||||
Amounts recognized in the consolidated balance sheets | ||||||||||||||||
| Prepaid pension cost | $ | 59.7 | $ | 60.2 | $ | — | $ | — | ||||||||
| Pension and post-retirement benefits liability | (27.2 | ) | (15.2 | ) | (6.0 | ) | (5.3 | ) | ||||||||
| Intangible asset | 5.6 | 1.8 | — | — | ||||||||||||
| Accumulated other comprehensive loss | 1.7 | — | — | — | ||||||||||||
| Net amount recognized | $ | 39.8 | $ | 46.8 | $ | (6.0 | ) | $ | (5.3 | ) | ||||||
61
| Pension Plans | Other Post- Retirement Plans | |||||||||||||||
| 2006 | 2005 | 2006 | 2005 | |||||||||||||
Change in benefit obligation | ||||||||||||||||
Benefit obligation, beginning of the period | $ | (127.3 | ) | $ | (109.8 | ) | $ | (8.8 | ) | $ | (7.4 | ) | ||||
Service cost | (11.1 | ) | (10.1 | ) | (0.8 | ) | (0.6 | ) | ||||||||
Interest cost | (7.0 | ) | (6.2 | ) | (0.4 | ) | (0.4 | ) | ||||||||
Plan participants’ contributions | — | — | (0.1 | ) | (0.1 | ) | ||||||||||
Benefits paid* | 2.0 | 7.6 | 0.3 | 0.3 | ||||||||||||
Plan amendments | (0.3 | ) | — | — | (0.6 | ) | ||||||||||
Impact of Medicare Part D | — | — | — | 0.5 | ||||||||||||
Actuarial gain (loss) | 1.6 | (3.6 | ) | — | — | |||||||||||
Assumption changes | 7.5 | (5.2 | ) | 0.4 | (0.5 | ) | ||||||||||
Benefit obligation, end of the period | $ | (134.6 | ) | $ | (127.3 | ) | $ | (9.4 | ) | $ | (8.8 | ) | ||||
Change in plan assets | ||||||||||||||||
Fair value of plan assets, beginning of the period | $ | 102.1 | $ | 95.7 | $ | — | $ | — | ||||||||
Actual return on plan assets | 15.8 | 7.3 | — | — | ||||||||||||
Benefits paid* | (2.0 | ) | (7.6 | ) | (0.3 | ) | (0.3 | ) | ||||||||
Employer contributions | 0.7 | 6.7 | 0.2 | 0.2 | ||||||||||||
Plan participants’ contributions | — | — | 0.1 | 0.1 | ||||||||||||
Fair value of plan assets, end of the period | $ | 116.6 | $ | 102.1 | $ | — | $ | — | ||||||||
Funded status of the plans | $ | (18.0 | ) | $ | (25.2 | ) | $ | (9.4 | ) | $ | (8.8 | ) | ||||
Reconciliation of funded status to total amount recorded on balance sheet | ||||||||||||||||
Funded status of the plans | $ | (18.0 | ) | $ | (25.2 | ) | $ | (9.4 | ) | $ | (8.8 | ) | ||||
Unrecognized actuarial loss | — | 52.4 | — | 1.1 | ||||||||||||
Unrecognized prior service cost | — | 4.9 | — | 0.9 | ||||||||||||
Net amount recognized | $ | (18.0 | ) | $ | 32.1 | $ | (9.4 | ) | $ | (6.8 | ) | |||||
Amounts recorded on the consolidated balance sheets | ||||||||||||||||
Prepaid pension cost | $ | — | $ | 56.4 | $ | — | $ | — | ||||||||
Net post-retirement benefit asset | 36.0 | — | — | — | ||||||||||||
Pension and post-retirement benefits liability-current | (1.0 | ) | — | (0.4 | ) | — | ||||||||||
Pension and post-retirement benefits liability-noncurrent | (53.0 | ) | (35.4 | ) | (9.0 | ) | (6.8 | ) | ||||||||
Intangible asset | — | 5.1 | — | — | ||||||||||||
Additional minimum pension liability | — | 6.0 | — | — | ||||||||||||
Net amount recognized | $ | (18.0 | ) | $ | 32.1 | $ | (9.4 | ) | $ | (6.8 | ) | |||||
Accumulated benefit obligation, end of the period | $ | 104.2 | $ | 97.9 | ||||||||||||
| * | Total benefits paid in 2005 included $6.3 million of lump sum cash settlement payments. |
50
The curtailment charge and special termination benefit charge in 2003 relate to a benefit enhancement provided under the Supplemental Executive Benefit Plan maintained by the Company. Thepension plan amendment charge in 20042006 relates to the impact of the Pension Protection Act of 2006 (the “PPA 2006”) that required changes to the Company’s pension plans as well as one additional participantsparticipant admitted to the Supplemental Executive Benefit Plan. In August 2006, the PPA 2006 was enacted into law. At this time, the Company does not expect it to have any significant effect on the Company’s current funding for its U.S. pension plans. The other post-retirement plans amendment charge in 2005 relates to the increase of the Company’s future share of healthcare plan costs effective November 2005.
SFAS No. 158 requires employers with more than one post-retirement benefit plan to aggregate all overfunded plans and report one non-current net asset amount and to aggregate all unfunded plans and report one net liability amount, classified as either current or non-current based on timing of expected benefit payments. Additional minimum pension liability, intangible asset and prepaid pension cost previously required were no longer reported as of December 31, 2006. During 2004,2005, the Company recorded charges to other comprehensive loss related to additional minimum pension liability adjustments totaling $1.7$4.3 million, ($1.02.5 million net of tax). No additional, resulting in accumulated other comprehensive loss due to minimum pension liability adjustments were recorded prior to 2004.of $6.0 million at December 31, 2005 ($3.5 million net of tax).
Net amounts recognized for the Post-retirement Plans for years ended December 31:
| Pension Plans | Other Post- Retirement Plans | ||||||||||||||||||||
| 2006 | 2005 | 2004 | 2006 | 2005 | 2004 | ||||||||||||||||
Components of net periodic expense | |||||||||||||||||||||
Service cost | $ | 11.2 | $ | 10.1 | $ | 8.3 | $ | 0.8 | $ | 0.6 | $ | 0.6 | |||||||||
Interest cost | 7.0 | 6.2 | 5.1 | 0.5 | 0.4 | 0.4 | |||||||||||||||
Expected return on plan assets | (8.5 | ) | (8.2 | ) | (8.0 | ) | — | — | — | ||||||||||||
Amortization of net actuarial loss from earlier periods | 3.3 | 2.6 | 1.4 | — | — | — | |||||||||||||||
Amortization of unrecognized prior service costs | 0.4 | 0.5 | 0.2 | 0.2 | 0.1 | 0.1 | |||||||||||||||
Settlement loss | — | 3.2 | — | — | — | — | |||||||||||||||
Net periodic expense | $ | 13.4 | $ | 14.4 | $ | 7.0 | $ | 1.5 | $ | 1.1 | $ | 1.1 | |||||||||
The accumulated benefit obligation relatedsettlement loss in 2005 relates to the Post-Retirement Plans totaled $79.3 million and $53.7 million aselection of December 31, 2004 and 2003.
| Other Post- | ||||||||||||||||||||||||
| Pension Plans | Retirement Plans | |||||||||||||||||||||||
| 2004 | 2003 | 2002 | 2004 | 2003 | 2002 | |||||||||||||||||||
Components of net periodic expense (income) | ||||||||||||||||||||||||
| Service cost | $ | 8.3 | $ | 6.9 | $ | 5.1 | $ | 0.6 | $ | 0.4 | $ | 0.3 | ||||||||||||
| Interest cost | 5.1 | 4.1 | 2.9 | 0.4 | 0.3 | 0.3 | ||||||||||||||||||
| Expected return on plan assets | (8.0 | ) | (7.7 | ) | (9.0 | ) | — | — | — | |||||||||||||||
| Amortization of net actuarial loss from earlier periods | 1.4 | 1.2 | 0.1 | — | — | — | ||||||||||||||||||
| Amortization of unrecognized prior service costs | 0.2 | 0.2 | 0.2 | 0.1 | 0.2 | — | ||||||||||||||||||
| Net periodic expense (income). | $ | 7.0 | $ | 4.7 | $ | (0.7 | ) | $ | 1.1 | $ | 0.9 | $ | 0.6 | |||||||||||
The following information is for those Post-Retirement Planspension plans with an accumulated benefit obligation in excess of plan assets: December 31, 2004 2003 Projected benefit obligation 47.6 32.4 Accumulated benefit obligation 27.2 14.6 Fair value of plan assets — —
| December 31, | ||||
| 2006 | 2005 | |||
Projected benefit obligation | 54.0 | 53.3 | ||
Accumulated benefit obligation | 37.0 | 34.0 | ||
Fair value of plan assets | — | — | ||
Additional Information:
Assumptions
Weighted-average assumptions used to determine benefit obligations at December 31: Other Post- Pension Plans Retirement Plans 2004 2003 2004 2003 Discount rate 5.90 % 6.25 % 5.90 % 6.25 % Rate of compensation increase 4.00 % 3.91 % — — Cash balance accumulation/conversion rate 5.00 % 5.00 % — —
62
| Pension Plans | Other Post- Retirement Plans | |||||||||||
| 2006 | 2005 | 2006 | 2005 | |||||||||
Discount rate | 5.90 | % | 5.60 | % | 5.80 | % | 5.45 | % | ||||
Rate of compensation increase | 4.00 | % | 4.00 | % | — | — | ||||||
Cash balance accumulation/conversion rate | 4.75 | % | 4.75 | % | — | — | ||||||
51
Weighted-average assumptions used to determine net periodic benefit cost for years ended December 31: Pension Plans Other Post-Retirement Plans 2004 2003 2002 2004 2003 2002 Discount rate 6.25 % 6.75 % 7.25 % 6.25 % 6.75 % 7.25 % Expected return on plan assets 8.35 % 8.10 % 9.75 % — — — Rate of compensation increase 3.91 % 3.91 % 4.41 % — — — Cash balance accumulation/conversion rate 5.00 % 5.00 % 5.50 % — — —
For 2006, the Company continued to use an assumed return on assets of approximately 8.35% for Moody’s funded pension plan, which was determined based on explicit long-term return assumptions for each major asset class within the plan portfolio. Moody’s works with third-party consultants to determine assumptions for long-term rates of return for the asset classes that are included in the pension plan investment portfolio. These return assumptions reflect a long-term time horizon. They also reflect a combination of historical performance analysis and forward-looking views of the financial markets including consideration of inflation, current yields on long-term bonds and price-earnings ratios of the major stock market indices. | |||||||||||||||||||||||||||||||||||||||||||||||||||||||||||||||||||||||||||||||||||||||||||||||||||||||||||||||||||||||||||||||||||||
Assumed Healthcare Cost Trend Rates at December 31: 2004 2003 2002 Pre- and Pre- and Pre-age 65 Post-age 65 post- age 65 post- age 65 Healthcare cost trend rate assumed for the following year 11.0 % 13.0 % 10.0 % 11.0 % Ultimate rate to which the cost trend rate is assumed to decline (ultimate trend rate) 5.0 % 5.0 % 6.0 % 6.0 % Year that the rate reaches the ultimate trend rate 2013 2013 2008 2008
The
| 2006 | 2005 | 2004 | ||||||||||||||||
| Pre-age 65 | post-age 65 | Pre-age 65 | post-age 65 | Pre-age 65 | post-age 65 | |||||||||||||
Healthcare cost trend rate assumed for the following year | 9.0 | % | 11.0 | % | 10.0 | % | 12.0 | % | 11.0 | % | 13.0 | % | ||||||
Ultimate rate to which the cost trend rate is assumed to decline (ultimate trend rate) | 5.0 | % | 5.0 | % | 5.0 | % | 5.0 | % | 5.0 | % | 5.0 | % | ||||||
Year that the rate reaches the ultimate trend rate | 2013 | 2013 | 2013 | 2013 | 2013 | 2013 | ||||||||||||
As the Company subsidies for retiree healthcare coverage are capped at the 2005 subsidy level, for the majority of the post-retirement health plan participants, retiree contributions are assumed healthto increase at the same rate as the healthcare cost trend rate was modified in 2004 to better reflect different trend expectations for the medical and prescribed medication components of healthcare costs in proportion to the respective share of gross healthcare costs for pre- and post-age 65 retirees. Arates. As such, a one percentage-point change in assumed healthcare cost trend rates would not have affected total service and interest cost and would have increased or decreased the post-retirement benefit obligation by $0.2 million.
Plan Assets
The assets of the Moody’s Retirement Planfunded pension plan were allocated among the following categories at December 31, 20042006 and 2003:
| Percentage of | |||||||||
| Plan Assets | |||||||||
| at December 31, | |||||||||
| Asset Category | 2004 | 2003 | |||||||
| Equity securities | 73% | 71% | |||||||
| Debt securities | 18% | 21% | |||||||
| Real estate | 9% | 8% | |||||||
| Total | 100% | 100% | |||||||
63
| Percentage of Plan Assets at December 31, | ||||||
Asset Category | 2006 | 2005 | ||||
Equity securities | 77 | % | 75 | % | ||
Debt securities | 13 | % | 16 | % | ||
Real estate | 10 | % | 9 | % | ||
Total | 100 | % | 100 | % | ||
Moody’s investment objective for the Moody’s Retirement Plan assets in the funded pension plan is to earn total returns that will minimize future contribution requirements over the long run within a prudent level of risk. The Company’s current pension plan asset allocation targets are for approximately seventy percent of assets to be invested in equity securities, diversified across U.S. and non-U.S. stocks of small, medium and large capitalization, twenty percent in investment grade bonds and the remainder in real estate funds. The use of derivatives to leverage the portfolio or otherwise is not permitted. The Company’s monitoring of the plan includes ongoing reviews of investment performance, annual liability measurements, periodic asset/liability studies and investment portfolio reviews.
As of December 31, 2006, the equity investment has advanced to represent a percentage higher than its target allocation due to asset gains and the Company plans to rebalance the plan assets in 2007 to bring the portfolio back into balance with the original target asset allocation. Moody’s other Post-Retirement Plans are unfunded and therefore have no plan assets.
52
Cash Flows
Expected employerThe Company made payments of $0.9 million related to its unfunded pension plan obligations during the year ended December 31, 2006. The Company made payments of $6.7 million related to its unfunded pension plans during the year ended December 31, 2005, primarily related to a lump sum payment of pension benefits. Moody’s made no contributions to its funded pension plans during the Post-Retirement Plans in 2005 are $6.2years ended December 31, 2006 and 2005. The Company made payments of $0.2 million forto its other post-retirement plans during both the years ended December 31, 2006 and 2005. The Company presently anticipates making payments of $1.0 million to its unfunded pension plans and $0.3$0.4 million forto its other Post-Retirement Plans.post-retirement plans during 2007.
Estimated Future Benefits Payable
Estimated future benefits payments for the Post-Retirement Plans are as follows at December 31, 2004:
| Other Post- | |||||||||
| Year ending December 31, | Pension Plans | Retirement Plans | |||||||
| 2005 | $ | 7.5 | $ | 0.3 | |||||
| 2006 | 2.4 | 0.4 | |||||||
| 2007 | 2.7 | 0.4 | |||||||
| 2008 | 2.9 | 0.5 | |||||||
| 2009 | 3.2 | 0.5 | |||||||
| Next five years to December 31, 2014 | 36.6 | 3.5 | |||||||
Year ending December 31, | Pension Plans | Other Post- Retirement Plans* | ||||
2007 | $ | 3.0 | $ | 0.4 | ||
2008 | 3.4 | 0.6 | ||||
2009 | 3.8 | 0.6 | ||||
2010 | 4.6 | 0.6 | ||||
2011 | 6.2 | 0.6 | ||||
Next five years to December 31, 2016 | 41.2 | 3.9 | ||||
| * | The estimated future benefits payable for the Post-Retirement Plans are reflected net of the expected Medicare Part D subsidy for which the subsidy is insignificant on an annual basis for all the years presented. |
Profit Participation Plan
Moody’s has a profit participation plan (the “Plan”) covering substantially all U.S. employees. The Plan provides for an employee salary deferral contribution and Company contributions. Employees may contribute up to 16% of their pay, subject to the federal limit. Moody’s contributes an amount equal to 50% of employee contributions, with Moody’s contribution limited to 3% of the employee’s pay. Moody’s makes additional contributions to the Plan that are based on year-to-year growth in the Company’s earnings per share. Expense associated with this plan was $15.5 million, $15.3 million and $15.0 million $18.3 millionin 2006, 2005 and $15.1 million in 2004, 2003 and 2002, respectively.
International Plans
Certain of the Company’s international operations provide pension benefits to their employees in the form of defined contribution plans. Company contributions are primarily determined as a percentage of employees’ eligible compensation. Expense related to these plans for the years ended December 31, 2006, 2005 and 2004 2003was $3.9 million, $3.1 million and 2002$3.4 million, respectively.
In addition, the Company also maintains an unfunded defined benefit pension plan for its German employees, which was closed to new entrants in 2002. The pension liability recorded related to this plan was $3.2 million, $2.6 million and $2.4 million based on the discount rate of 4.25%, 4.15% and 5.00% at December 31, 2006, 2005 and 2004, respectively. The pension liability recorded as of December 31, 2006 represents the unfunded status of this plan and the entire balance was recognized in the statement of financial position as a non-current liability. Expense related to this plan for the years ended December 31, 2006, 2005 and 2004 was approximately $3.8$0.3 million, $2.4$0.6 million and $1.6$0.4 million, respectively. These amounts are not included in the tables above. The incremental effect of adopting SFAS No. 158 and the amount of actuarial losses recognized in AOCI as of December 31 2006 were both immaterial.
Note 911 Stock-Based Compensation Plans
The fair value of each employee stock option award is estimated on the date of grant using the Black-Scholes option-pricing model that uses the assumptions noted below. The expected dividend yield is derived from the annual dividend rate on the date of grant. The expected stock volatility is based on implied volatility from traded options as well as historical volatility. The risk-free interest rate is the rate in effect at the time of the grant based on U.S. government zero coupon bonds with maturities similar to the expected holding period. The expected holding period was determined by examining historical and projected post-vesting exercise behavior activity. The following weighted average assumptions were used for options granted during 2006, 2005 and 2004:
| 2006 | 2005 | 2004 | |||||||
Expected dividend yield | 0.44 | % | 0.52 | % | 0.46 | % | |||
Expected stock volatility | 23 | % | 23 | % | 30 | % | |||
Risk-free interest rate | 4.59 | % | 4.07 | % | 3.24 | % | |||
Expected holding period | 6.0 yrs | 6.0 yrs | 5.0 yrs |
53
Prior to the 2000 Distribution, certain employees of Moody’s received grants of Old D&B stock options under Old D&B’s 1998 Key Employees’ Stock OptionIncentive Plan (the “1998 Plan”). At the Distribution Date, all unexercised Old D&B stock options held by Moody’s employees were converted into separately exercisable options to acquire Moody’s common stock and separately exercisable options to acquire New D&B common stock, such that each option had the same ratio of the exercise price per option to the market value per share, the same aggregate
64
difference between market value and exercise price, and the same vesting provisions, option periods and other terms and conditions applicable prior to the 2000 Distribution. Old D&B stock options held by employees and retirees of Old D&B were converted in the same manner. Immediately after the 2000 Distribution, the 1998 Plan was amended and adopted by the Company.
Under the 1998 Plan, 16,500,00033,000,000 shares of the Company’s common stock werehave been reserved for issuance. The Amended and Restated 2001 Moody’s Corporation Key Employees’ Stock Incentive Plan (the “2001 Plan”), which is shareholder approved, permits the granting of up to 25,600,000 shares, of which not more than 5,000,000 shares are available for grants of awards other than stock options. Both the 1998 Plan providesand the 2001 Plan (“Stock Plans”) provide that options are exercisable not later than ten years from the grant date. The vesting period for awards under the 1998 PlanStock Plans is generally determined by the Board of Directors at the date of the grant and has principally been four years except for employees who are at or near retirement eligibility, as defined, for which vesting is between one and four years. Options may not be granted at less than the fair market value of the Company’s common stock at the date of grant. For incentive stock options granted to a shareholder of more than 10% of the Company’s outstanding stock, the exercise price per share cannot be less than 110% of the fair market value of the Company’s common stock at the date of grant. The 1998 PlanStock Plans also providesprovide for the granting of restricted stock.
The Amended and Restated 2001 Moody’s Corporation Key Employees’ Stock Incentive Plan (the “2001 Plan”) was approved by the Company’s Board of Directors in March 2004 and by the Company’s shareholders in April 2004. Under the 2001 Plan, 12,800,000 shares of common stock have been reserved for issuance. Options may not be granted at less than the fair market value of the Company’s common stock at the date of grant. The 2001 Plan provides that options are exercisable not later than ten years from the grant date. The vesting period for awards under the 2001 Plan is determined by the Board of Directors at the date of the grant and has been four years. Unlike the 1998 Plan, the 2001 Plan also provides that consultants to the Company or any of its affiliates are eligible to be granted options. The 2001 Plan also provides for the granting of restricted stock. The total number of shares available for grants of awards other than stock options is limited to 2,500,000 shares.
Under the 1998 and 2001 Plans, key employees of the Company may be granted shares of common stock based on the achievement of revenue growth goals or other operating objectives (“Performance Shares”). At the end of the performance period, Company performance at target will yield the targeted amount of shares, whereas Company performance above or below target will yield larger or smaller share awards, respectively. There were no Performance Share grants in 2004, 2003 and 2002. The Company recorded compensation expense of $0.2 million in 2002 relating to performance shares granted in 1999, for which the performance period ended in 2002. There were no performance shares outstanding in 2003 and 2004 and, accordingly no related compensation expense was recorded for the years ended December 31, 2004 and 2003.
The Company maintains a stock plan for its Board of Directors, the 1998 DirectorsMoody’s Corporation Non-Employee Directors’ Stock Incentive Plan (the “Directors“Directors’ Plan”), which permits the granting of awards in the form of non-qualified stock options, restricted stock or performance shares. The DirectorsDirectors’ Plan provides that options are exercisable not later than ten years from the grant date. The vesting period is determined by the Board of Directors at the date of the grant and is generally one year for options and three years for restricted stock. Under the DirectorsDirectors’ Plan, 400,000800,000 shares of common stock were reserved for issuance. Any director of the Company who is not an employee of the Company or any of its subsidiaries as of the date that an award is granted is eligible to participate in the DirectorsDirectors’ Plan.
In February 2005, Moody’s awarded long-term, equity-based compensation as a mix of stock options and restricted stock. The aggregate grants were approximately 1.3 million options and 0.2 million shares of restricted stock under the 2001 Plan, and approximately 0.6 million options and 0.2 million shares of restricted stock under the 1998 Plan. The options and a portion of the restricted stock vest ratably over four years. The remaining restricted stock will vest over a period of three to five years, depending on growth in the Company’s operating income.
Also in February 2005, Directors of the Company were granted approximately 9,500 shares of restricted stock under the Directors Plan.
65
Below is aA summary of restricted shares thatoption activity as of December 31, 2006 and changes during the year then ended is presented below:
Options | Shares | Weighted Average Exercise Price Per Share | Weighted Average Remaining Contractual Term | Aggregate Intrinsic Value | |||||||
Outstanding, December 31, 2005 | 23.7 | $ | 23.62 | ||||||||
Granted | 3.0 | 63.32 | |||||||||
Exercised | (5.8 | ) | 17.99 | ||||||||
Forfeited or expired | (0.8 | ) | 41.26 | ||||||||
Outstanding, December 31, 2006 | 20.1 | $ | 30.48 | 6.0 yrs | $ | 777.1 | |||||
Vested and unvested expected to vest, December 31, 2006 | 19.4 | $ | 29.77 | 6.0 yrs | $ | 760.3 | |||||
Exercisable, December 31, 2006 | 11.6 | $ | 20.44 | 4.7 yrs | $ | 561.9 | |||||
The weighted average grant date fair value per option of Moody’s options granted in 2004 and 2003:
| 2004 | 2003 | ||||||||
| Restricted shares granted | 0.4 | 0.02 | |||||||
| Weighted average fair value at grant date | $ | 65.58 | $ | 42.04 | |||||
Changes in stock options forduring the three years ended December 31, 2006, 2005 and 2004 are summarized below:
| Weighted | ||||||||
| Number | Average | |||||||
| Outstanding | Exercise Price | |||||||
| Options outstanding, December 31, 2001 | 14.7 | $ | 23.00 | |||||
| Granted | 3.8 | 40.01 | ||||||
| Exercised | (2.5 | ) | 19.31 | |||||
| Surrendered or retired | (0.7 | ) | 27.43 | |||||
| Options outstanding, December 31, 2002 | 15.3 | 27.63 | ||||||
| Granted | 3.6 | 42.73 | ||||||
| Exercised | (3.1 | ) | 23.87 | |||||
| Surrendered or retired | (0.6 | ) | 32.67 | |||||
| Options outstanding, December 31, 2003 | 15.2 | 31.78 | ||||||
| Granted | 2.3 | 65.33 | ||||||
| Exercised | (3.6 | ) | 27.47 | |||||
| Surrendered or retired | (0.7 | ) | 45.88 | |||||
| Options outstanding, December 31, 2004 | 13.2 | $ | 38.15 | |||||
Below is a summarywas $19.97, $12.62 and $10.00, respectively. The aggregate intrinsic value in the table above represents the total pre-tax intrinsic value (the difference between Moody’s closing stock price on the last trading day of the year ended December 31, 2006 and the exercise prices, multiplied by the number of in-the-money options) that would have been received by the option holders had all option holders exercised their options as of December 31, 2006. This amount changes based on the fair value of Moody’s stock. The total intrinsic value of options exercised during the years ended December 31, 2006, 2005 and 2004, was $269.6 million, $179.1 million and $151.2 million, respectively. As of December 31, 2006, there was $68.9 million of total unrecognized compensation expense related to options. The expense is expected to be recognized over a weighted average period of 1.2 years. Proceeds received from the exercise of stock options was $105.0 million, $86.2 million and $99.0 million for the years ended December 31, 2006, 2005 and 2004, respectively. The tax benefit realized from stock options exercised during the years ended December 31, 2006, 2005 and 2004 was $108.0 million, $72.1 million and $61.5 million, respectively.
54
At December 31, 2006, options outstanding of 18.9 million and 1.2 million were held by Moody’s employees and byretirees and New D&B employees and retirees, respectively.
A summary of the status of the Company’s nonvested restricted stock as of each date:
| New D&B | ||||||||
| Moody’s | Employees | |||||||
| Employees | and Retirees | |||||||
| Options outstanding at: | ||||||||
| December 31, 2002 | 11.1 | 4.2 | ||||||
| December 31, 2003 | 12.6 | 2.6 | ||||||
| December 31, 2004 | 11.6 | 1.6 | ||||||
Nonvested Restricted Stock | Shares | Weighted Average Value Per Share | ||||
Balance, December 31, 2005 | 1.3 | $ | 38.59 | |||
Granted | 0.9 | 63.31 | ||||
Vested | (0.4 | ) | 37.76 | |||
Forfeited | (0.1 | ) | 50.03 | |||
Balance, December 31, 2006 | 1.7 | $ | 52.12 | |||
The total fair value of shares vested during the years ended December 31, 2006 and 2005 was $27.8 million and $9.8 million, respectively. There were no shares vested in 2004 as this was the first year the Company granted restricted stock to its employees. As of December 31, 2006, there was $47.7 million of total unrecognized compensation expense related to nonvested restricted stock. The expense is expected to be recognized over a weighted average period of 1.1 years. The tax benefit realized from the vesting of restricted stock during the years ended December 31, 2006 and 2005 was $10.9 million and $3.9 million, respectively. There was no tax benefit realized from the vesting of restricted stock during the year ended December 31, 2004 as no shares vested during this period.
The following table summarizesCompany has a policy of issuing treasury stock to satisfy shares issued under stock-based compensation plans. The Company currently expects to use a significant portion of its cash flow to continue its share repurchase program. The Company implemented a systematic share repurchase program in the third quarter of 2005 through a SEC Rule 10b5-1 program. Moody’s may also purchase opportunistically when conditions warrant. On June 5, 2006, the Board of Directors authorized an additional information about stock options outstanding at December 31, 2004:
| Options Outstanding | ||||||||||||
| Average | ||||||||||||
| Remaining | Weighted | |||||||||||
| Number | Contractual | Average | ||||||||||
| Range of Exercise Prices | Outstanding | Life in Years | Exercise Price | |||||||||
| $16.16-$19.94 | 0.6 | 1.9 | $ | 17.11 | ||||||||
| $21.42-$23.96 | 1.8 | 4.5 | 21.80 | |||||||||
| $25.13-$28.13 | 3.1 | 4.8 | 27.47 | |||||||||
| $33.92-$39.98 | 2.5 | 7.0 | 39.87 | |||||||||
| $40.59-$43.55 | 3.1 | 8.0 | 42.46 | |||||||||
| $52.05-$87.19 | 2.1 | 9.2 | $ | 65.26 | ||||||||
| Total | 13.2 | |||||||||||
66
| Options Exercisable | ||||||||
| Weighted | ||||||||
| Number | Average | |||||||
| Range of Exercise Prices | Exercisable | Exercise Price | ||||||
| $16.16-$19.94 | 0.6 | $ | 17.11 | |||||
| $21.42-$23.96 | 1.7 | 21.82 | ||||||
| $25.13-$28.13 | 3.1 | 27.47 | ||||||
| $33.92-$39.98 | 1.0 | 39.84 | ||||||
| $40.59-$43.55 | 0.6 | $ | 42.41 | |||||
| $52.05-$87.19 | — | — | ||||||
| Total | 7.0 | |||||||
In addition, the Company also sponsors the 1999 Moody’s Corporation Employee Stock Purchase Plan (“ESPP”). Under the ESPP, 6,000,000 shares of common stock were reserved for issuance. The ESPP allows eligible employees to purchase common stock of the Company on a monthly basis at 85% of its fair market valuethe average of the high and the low trading prices on the firstNew York Stock Exchange on the last trading day of theeach month. The employee purchases are funded through after-tax payroll deductions, which plan participants can elect at from one percent to ten percent of compensation, subject to the federal limit. This results in stock-based compensation expense for the difference between the purchase price and fair market value under SFAS No. 123R as well as under SFAS No. 123.
Note 1012 Income Taxes
Components of the Company’s income tax provision are as follows:
| Year Ended December 31, | ||||||||||||
| 2004 | 2003 | 2002 | ||||||||||
| Current: | ||||||||||||
| Federal | $ | 240.7 | $ | 199.7 | $ | 150.5 | ||||||
| State and local | 70.8 | 63.6 | 54.4 | |||||||||
| Non-U.S | 44.3 | 35.3 | 26.3 | |||||||||
| Total current | 355.8 | 298.6 | 231.2 | |||||||||
| Deferred: | ||||||||||||
| Federal | (6.9 | ) | (3.8 | ) | (3.5 | ) | ||||||
| State and local | (2.3 | ) | (1.5 | ) | 1.4 | |||||||
| Non-U.S | (0.4 | ) | (0.8 | ) | (0.6 | ) | ||||||
| Total deferred | (9.6 | ) | (6.1 | ) | (2.7 | ) | ||||||
| Total provision for income taxes | $ | 346.2 | $ | 292.5 | $ | 228.5 | ||||||
| Year Ended December 31, | ||||||||||||
| 2006 | 2005 | 2004 | ||||||||||
Current: | ||||||||||||
Federal | $ | 362.2 | $ | 234.6 | $ | 240.7 | ||||||
State and local | 105.0 | 89.8 | 70.8 | |||||||||
Non-U.S | 66.6 | 69.7 | 44.3 | |||||||||
Total current | 533.8 | 394.1 | 355.8 | |||||||||
Deferred: | ||||||||||||
Federal | (20.1 | ) | (15.0 | ) | (6.9 | ) | ||||||
State and local | (5.8 | ) | (5.4 | ) | (2.3 | ) | ||||||
Non-U.S | (1.3 | ) | 0.2 | (0.4 | ) | |||||||
Total deferred | (27.2 | ) | (20.2 | ) | (9.6 | ) | ||||||
Total provision for income taxes | $ | 506.6 | $ | 373.9 | $ | 346.2 | ||||||
55
A reconciliation of the U.S. federal statutory tax rate to the Company’s effective tax rate on income before provision for income taxes is as follows:
| Year Ended December 31, | ||||||||||||
| 2004 | 2003 | 2002 | ||||||||||
| U.S. statutory tax rate | 35.0 | % | 35.0 | % | 35.0 | % | ||||||
| State and local taxes, net of federal tax benefit | 5.8 | 6.2 | 7.0 | |||||||||
| U.S. taxes on foreign income | 0.3 | 0.3 | 0.7 | |||||||||
| Legacy tax items | 4.3 | 3.0 | 3.3 | |||||||||
| Other | (0.5 | ) | 0.1 | (1.8 | ) | |||||||
| Effective tax rate | 44.9 | % | 44.6 | % | 44.2 | % | ||||||
67
| Year Ended December 31, | |||||||||
| 2006 | 2005 | 2004 | |||||||
U.S. statutory tax rate | 35.0 | % | 35.0 | % | 35.0 | % | |||
State and local taxes, net of federal tax benefit | 5.1 | 5.9 | 5.8 | ||||||
U.S. (benefit)/taxes on foreign income | (0.5 | ) | 0.3 | 0.3 | |||||
Legacy tax items | 0.1 | (0.3 | ) | 4.3 | |||||
Jobs Act repatriation benefit | — | (0.4 | ) | — | |||||
Other | 0.5 | (0.5 | ) | (0.5 | ) | ||||
Effective tax rate | 40.2 | % | 40.0 | % | 44.9 | % | |||
Income taxes paid were $408.8 million, $355.6 million and $300.1 million $210.6 millionin 2006, 2005 and $226.6 million in 2004, 2003 and 2002, respectively. Taxes paid in 2002 included approximately $50 million of 2001 income tax payments that were deferred from 2001 due to the September 11th tragedy.
The components of deferred tax assets and liabilities are as follows:
| December 31, | ||||||||
| 2004 | 2003 | |||||||
Deferred tax assets: | ||||||||
| Current: | ||||||||
| Accounts receivable allowances | $ | 6.1 | $ | 6.9 | ||||
| Accrued compensation and benefits | 4.9 | 5.1 | ||||||
| Other | 1.3 | 1.0 | ||||||
| Total current | 12.3 | 13.0 | ||||||
| Non-current: | ||||||||
| Depreciation and amortization | 8.1 | 5.3 | ||||||
| Benefit plans | 25.3 | 13.5 | ||||||
| State taxes | 1.9 | 1.8 | ||||||
| Other | 7.5 | 8.0 | ||||||
| Total non-current | 42.8 | 28.6 | ||||||
| Total deferred tax assets | 55.1 | 41.6 | ||||||
Deferred tax liabilities: | ||||||||
| Current: | ||||||||
| Prepaid expenses | (1.6 | ) | (1.4 | ) | ||||
| Total current | (1.6 | ) | (1.4 | ) | ||||
| Non-current: | ||||||||
| Prepaid pension costs | (25.3 | ) | (25.1 | ) | ||||
| Amortization of intangible assets and capitalized software | (9.7 | ) | (6.8 | ) | ||||
| Other | (4.8 | ) | (0.1 | ) | ||||
| Total non-current | (39.8 | ) | (32.0 | ) | ||||
| Total deferred tax liabilities | (41.4 | ) | (33.4 | ) | ||||
| Net deferred tax asset | $ | 13.7 | $ | 8.2 | ||||
| December 31, | ||||||||
| 2006 | 2005 | |||||||
Deferred tax assets: | ||||||||
Current: | ||||||||
Accounts receivable allowances | $ | 5.2 | $ | 4.8 | ||||
Accrued compensation and benefits | 5.5 | 4.9 | ||||||
Other | 2.6 | 2.4 | ||||||
Total current | 13.3 | 12.1 | ||||||
Non-current: | ||||||||
Accumulated depreciation and amortization | 8.8 | 8.3 | ||||||
Stock-based compensation | 46.6 | 28.5 | ||||||
Benefit plans | 33.6 | 16.6 | ||||||
State taxes | 2.0 | 2.9 | ||||||
Other | 6.4 | 9.6 | ||||||
Total non-current | 97.4 | 65.9 | ||||||
Total deferred tax assets | 110.7 | 78.0 | ||||||
Deferred tax liabilities: | ||||||||
Current: | ||||||||
Prepaid expenses | (0.2 | ) | (1.8 | ) | ||||
Total current | (0.2 | ) | (1.8 | ) | ||||
Non-current: | ||||||||
Prepaid pension costs | — | (23.8 | ) | |||||
Benefit plans | (21.5 | ) | — | |||||
Intangible assets and capitalized software | (10.7 | ) | (11.3 | ) | ||||
Other | — | (0.7 | ) | |||||
Total non-current | (32.2 | ) | (35.8 | ) | ||||
Total deferred tax liabilities | (32.4 | ) | (37.6 | ) | ||||
Net deferred tax asset | $ | 78.3 | $ | 40.4 | ||||
The current deferred tax assets, net of current deferred tax liabilities, as well as prepaid taxes of $3.5 million and $1.0 million and $0.7 million atfor December 31, 20042006 and 2003, respectively,2005 are included in other current assets in the consolidated balance sheets. Non-current tax receivables of $39.8 million and $2.6 million and $26.5 million atfor December 31, 20042006 and 2003, respectively,2005 are included in other assets. During the year ended December 31, 2006, Moody’s deposited $39.8 million with the IRS in order to stop the accrual of statutory interest on potential legacy tax deficiencies known as “Amortization Expense Deductions”, as further discussed in Note 16 to the consolidated financial statements. The net effecteffects of non-current deferred tax assets and non-current deferred tax liabilities isare included in other assets and other liabilities at December 31, 20042006 and 2003, respectively. Management2005. For the year ended December 31, 2005, a valuation allowance of $0.7 million was established against capital loss carryovers. In 2006, this valuation allowance was released when capital
56
gains permitted capital loss carryover utilization. No valuation allowances were established against any other deferred assets for December 31, 2006 and 2005, as management has determined, based on the Company’s history of prior and current levels of operating earnings, that no valuation allowance for deferred tax assetsnone should be provided as of December 31, 2004 and 2003.provided.
At December 31, 2004,2006, undistributed earnings of non-U.S. subsidiaries aggregated approximately $73$205 million. EarningsIt is assumed that earnings from the United Kingdom,subsidiaries in France, Germany, Spain, Italy, Canada and Japan are or will be remitted to the U.S. on a regular basis. As such, incremental deferred U.S. taxes related to anticipated distributions have been provided in the consolidated financial statements. For the year ended December 31, 2005, Moody’s anticipates that it mayrecognized a benefit fromof $3.6 million related to the repatriation of foreign earnings under the American JOBSJobs Creation Act of 2004 for certain non-U.S. earnings that will be remitted to the U.S. in 2005. However, since the Company has not yet determined whether it will meet the conditions for the reinvestment of the dividends in U.S. property, such benefit was not recorded as of December 31, 2004. Deferred tax liabilities have not been recognized for approximately $8$77 million of undistributed foreign earnings that management intends to permanently reinvest outside the U.S. If all such undistributed earnings were remitted to the U.S., the amount of incremental U.S. federal and foreign income taxes payable, net of foreign tax credits, would be approximately $1$6 million.
68
Note 11 Indebtedness
In connection with the 2000 Distribution, Moody’s was allocated $195.5 million of debt atOn September 30, 2000. Moody’s funded this debt with borrowings under a $160 million unsecured bank revolving credit facility and a bank bridge line of credit.
On October 3, 20002005, the Company entered into a Note Purchase Agreement and issued and sold through a private placement transaction, $300 million aggregate principal amount of notes payable (the “Notes”) in a private placement. The cash proceeds from theits Series 2005-1 Senior Unsecured Notes were used in part to repay the outstanding balance on the revolving credit facility and to repay the bridge line of credit.(“Notes”). The Notes have a five-yearten-year term and bear interest at an annual rate of 7.61%4.98%, payable semi-annually.semi-annually on March 30 and September 30. The proceeds from the sale of the Notes were used to refinance $300 million aggregate principal amount of the Company’s outstanding 7.61% Senior Notes (“Old Notes”) which matured on September 30, 2005. In the event that Moody’s pays all or part of the Notes in advance of their maturity (the “prepaid principal”“Prepaid Principal”), such prepayment will be subject to a penalty calculated based on the excess, if any, of the discounted value of the remaining scheduled payments, as defined in the agreement, over the prepaid principal. At December 31, 2004, the Notes have been classified as current liabilities since they mature in September 2005. Management is in the process of evaluating refinancing and repayment alternatives for the Notes.Prepaid Principal. Interest paid under the Notes and Old Notes was $14.9 million for the year ended December 31, 2006 and $22.8 million for each of the years ended December 31, 2004, 20032005 and 2002.2004. Total interest expense was $23.0$15.2 million, $23.5$21.0 million and $23.5$23.0 million, respectively for the years ended December 31, 2004, 20032006, 2005 and 2002.2004.
On September 1, 2004, Moody’s entered into a five-year senior, unsecured bank revolving credit facility (the “Facility”) in an aggregate principal amount of $160 million that expires in September 2009. This Facility replaced the $80 million 5-yearfive-year facility that was scheduled to expire in September 2005 and the $80 million 364-day facility that expired in September 2004. Interest on borrowings under the Facility is payable at rates that are based on the London InterBank Offered Rate plus a premium that can range from 17 basis points to 47.5 basis points depending on the Company’s ratio of total indebtedness to earnings before interest, taxes, depreciation and amortization (“Earnings Coverage Ratio”), as defined in the related agreement. At December 31, 2004,2006, such premium was 17 basis points. The Company also pays quarterly facility fees, regardless of borrowing activity under the Facility. The quarterly fees can range from 8 basis points of the Facility amount to 15 basis points, depending on the Company’s Earnings Coverage Ratio, and were 8 basis points at December 31, 2004.2006. Under the Facility, the Company also pays a utilization fee of 12.5 basis points on borrowings outstanding when the aggregate amount outstanding under the Facility exceeds 50% of the Facility.
Interest paid under Moody’s previous revolving credit facilities for the years ended December 31, 2003 and 2002 was $0.6 million and $0.3 million, respectively. No interest was paid under the Company’s facilities for the yearyears ended December 31, 20042006 and 2005 as no borrowings were outstanding during the year.those years.
The Notes and the Facility (the “Agreements”) contain covenants that, among other things, restrict the ability of the Company and certain of its subsidiaries, without the approval of the lenders, to engage in mergers, consolidations, asset sales, transactions with affiliates and sale-leaseback transactions or to incur liens, as defined in the related agreements. The AgreementsFacility also containcontains financial covenants that, among other things, require the Company to maintain an interest coverage ratio,Interest Coverage Ratio, as defined in the related agreements,agreement, of not less than 3 to 1 for any period of four consecutive fiscal quarters, and an Earnings Coverage Ratio, as defined in the related agreements,agreement, of not more than 4 to 1 at the end of any fiscal quarter. At December 31, 2004,2006, the Company was in compliance with such covenants. Upon the occurrence of certain financial or economic events, significant corporate events or certain other events constituting an event of default under the Agreements, all loans outstanding under the Agreements (including accrued interest and fees payable thereunder) may be declared immediately due and payable and all commitments under the Agreements may be terminated. In addition, certain other events of default under the Agreements would automatically result in amounts dueoutstanding becoming immediately due and payable and all commitments being terminated.
69In October 2006, Moody’s amended its Facility by increasing the limit on sale proceeds resulting from a sale-leaseback transaction of its corporate headquarters building at 99 Church Street from $150 million to $250 million. Additionally, the restriction on liens to secure indebtedness related to the sale of 99 Church Street was also increased from $150 million to $250 million. The Company also increased the expansion feature of the credit facility from $80 million to $340 million, subject to obtaining commitments for the incremental capacity at the time of draw down from the existing lenders. This increase gives the Company potential borrowing capacity under the Facility of $500 million.
57
Note 1214 Capital Stock
Authorized Capital Stock
The total number of shares of all classes of stock that the Company has authority to issue under its Restated Certificate of Incorporation is 420,000,0001,020,000,000 shares with a par value of $0.01, of which 400,000,0001,000,000,000 are shares of common stock, 10,000,000 are shares of preferred stock and 10,000,000 are shares of series common stock. The preferred stock and series common stock can be issued with varying terms, as determined by the Board of Directors. As more fully described in Note 20, on
In February 15, 2005, the Company’sMoody’s Board of Directors declared a two-for-one stock split which isto be effected as a special stock distribution of one share of common stock for each share of the Company’s common stock outstanding, subject to stockholder approval of a charter amendment to increase the Company’s authorized common shares from 400 million shares to 1 billion shares. The proposal to amend the charter will be described inAt the Company’s annual meeting proxy statement and will be voted on by stockholders at the Annual Meeting on April 26, 2005, Moody’s stockholders approved the charter amendment. As a result, stockholders of record as of the close of business on May 4, 2005 received one additional share of common stock for each share of the Company’s common stock held on that date. Such additional shares were distributed on May 18, 2005. All prior period share and per share information has been restated to reflect the Stock Split.
Rights Agreement
The Company has a Rights Agreement designed to protect its shareholders in the event of unsolicited offers to acquire the Company and coercive takeover tactics that, in the opinion of the Board of Directors, could impair its ability to represent shareholder interests. Under the Rights Agreement, each share of common stock has a right that trades with the stock until the right becomes exercisable. Pursuant to the provisions of the Rights Agreement, after giving effect to the Stock Split, the number of rights associated with each share of common stock shall be adjusted so that each share of common stock will have associated with it one-half of a right. Each right entitles the registered holder to purchase 1/1000 of a share of a seriesSeries A junior participating preferred stock,Junior Participating Preferred Stock, par value $0.01 per share, at a price of $100 per 1/1000 of a share, subject to adjustment. The rights will generally not be exercisable until a person or group (“Acquiring Person”) acquires beneficial ownership of, or commences a tender offer or exchange offer that would result in such person or group having beneficial ownership of, 15% or more of the outstanding common stock at such time.
In the event that any person or group becomes an Acquiring Person, each right will thereafter entitle its holder (other than the Acquiring Person) to receive, upon exercise and payment, shares of stock having a market value equal to two times the exercise price in the form of the Company’s common stock or, where appropriate, the Acquiring Person’s common stock. The rights are not currently exercisable, as no shareholder is currently an Acquiring Person. The Company may redeem the rights, which expire in June 2008, for $0.01 per right, under certain circumstances, including for a Board-approved acquirer either before the acquirer becomes an Acquiring Person or during the window period after the triggering event as specified in the Rights Agreement.
Share Repurchase Program
On May 24, 2004,June 5, 2006, the Company announced that its Board of Directors had authorized a new $600 million$2 billion share repurchase program, which includes both special share repurchases and systematic share repurchases to offset shares issued under Moody’s stock-based compensation plans.program. There is no established expiration date for this authorization. During June 2004,August 2006, the Company had completed its previous $1 billion share repurchase program, which had been authorized by the Board of Directors in October 2005. During November 2005, the Company completed its previous $450$600 million program, which had been authorized by the Board of Directors in October 2002.May 2004.
During 2006, Moody’s repurchased 18.0 million shares at an aggregate cost of $1,093.6 million and issued 6.5 million shares of stock under employee stock-based compensation plans. Since becoming a public company in October 2000 and through the end of 2004,December 31, 2006, Moody’s has repurchased 26.484.4 million shares at a total cost of $1.1$2.9 billion, including 13.038.6 million shares to offset issuances under employee stock plans. During 2004, Moody’s repurchased 3.5 million shares at an aggregate cost of $221.3 million and 3.7 million shares were issued under employee stockstock-based compensation plans.
Dividends
During 2004,2006, the Company paid a quarterly dividend of 7.5 cents$0.07 per share in each of the quarters of Moody’s common stock, resulting in dividends paid per share of $0.28 during the year. During 2005, the Company paid a quarterly dividend of $0.0375 in the first quarter and $0.055 in each of the three subsequent quarters, per share of Moody’s common stock, resulting in dividends paid per share of 30 cents$0.2025 during the year. During 2003 and 2002,2004, the Company paid a quarterly dividenddividends of 4.5 cents$0.0375 per share of Moody’s common stock resulting in total dividends paid per share of 18 cents in each year.$0.15.
On December 14, 2004,12, 2006, the Board of Directors of the Company approved the declaration of a quarterly dividend of 7.5 cents$0.08 per share of Moody’s common stock, payable on March 10, 20052007 to stockholdersshareholders of record at the close of business on February 20, 2005. On February 15, 2005, the board voted to increase the quarterly dividend per share to $0.11 before giving effect to the proposed two-for-one stock split as more fully described in Note 20, payable on June 15, 2005 to stockholders of record as of May 27, 2005. If the stock split is effected, then on a post-split basis,
70
the dividend will be increased to 5.5 cents per share from the 3.75 cents per share that otherwise would have been paid absent the dividend increase.2007. The continued payment of dividends at thisthe rate noted above, or at all, is subject to the discretion of the Board of Directors.
58
Note 1315 Lease Commitments
Moody’s operates its business from various leased facilities, which are under operating leases that expire over the next eleven21 years. Moody’s also leases certain computer and other equipment under operating and capital leases that expire over the next five years. Rent expense under operating leases for the years ended December 31, 2006, 2005 and 2004 2003was $27.9 million, $21.5 million and 2002 was $15.1 million, $13.3 million and $11.3 million, respectively. Rent expense for 2002 was net of sublease rental income of $0.6 million. There was no sublease rental income in 2004 and 2003.
During 2002, Moody’s acquiredThe Company has approximately $3.9$2.0 million of computer equipment subject to capital lease obligations. Accumulated amortization at December 31, 20042006 includes approximately $2.6$1.1 million related to those capital lease obligations.
The approximate minimum rent for leases that have remaining or original noncancelable lease terms in excess of one year at December 31, 20042006 is as follows:
| Capital | Operating | |||||||
| Year Ending December 31, | Leases | Leases | ||||||
| 2005 | $ | 1.3 | $ | 15.7 | ||||
| 2006 | — | 12.2 | ||||||
| 2007 | — | 9.9 | ||||||
| 2008 | — | 9.1 | ||||||
| 2009 | 6.2 | |||||||
| Thereafter | — | 11.9 | ||||||
| Total minimum lease payments | 1.3 | $ | 65.0 | |||||
| Less: amount representing interest | (0.0 | ) | ||||||
| Present value of net minimum lease payments under capital leases | $ | 1.3 | ||||||
Year Ending December 31, | Capital Leases | Operating Leases | |||||
2007 | $ | 0.5 | $ | 34.5 | |||
2008 | 0.4 | 41.5 | |||||
2009 | 0.1 | 38.9 | |||||
2010 | — | 33.2 | |||||
2011 | — | 29.0 | |||||
Thereafter | — | 462.4 | |||||
Total minimum lease payments | $ | 1.0 | $ | 639.5 | |||
Less: amount representing interest | (0.1 | ) | |||||
Present value of net minimum lease payments under capital leases | $ | 0.9 | |||||
During the fourth quarter of 2006, the Company completed the sale of its corporate headquarters located at 99 Church Street, New York, New York. As part of the sales agreement, the Company will lease back the building until the relocation to its new global headquarters at 7 World Trade Center, New York, New York (“7 WTC”), is completed in mid- to late 2007. The Company entered into an operating lease agreement for 7 WTC (the “Lease”) commencing on October 20, 2006 for 589,945 square feet of office space which will serve as Moody’s new corporate headquarters. The Lease has an initial term of approximately 21 years with renewal options of 20 years. The total base rent of the lease is approximately $536 million including rent credits from the World Trade Center Rent Reduction Program promulgated by the Empire State Development Corporation.
Note 1416 Contingencies
From time to time, Moody’s is involved in legal and tax proceedings, claims and litigation that are incidental to the Company’s business, including claims based on ratings assigned by Moody’s. Moody’s is also subject to ongoing tax audits in the normal course of business. Management periodically assesses the Company’s liabilities and contingencies in connection with these matters based upon the latest information available. Moody’s discloses material pending legal proceedings, other than routine litigation incidental to Moody’s business, material proceedings known to be contemplated by governmental authorities and other pending matters that it may determine to be appropriate. For those matters where it is both probable that a liability has been incurred and the probable amount of loss can be reasonably estimated, the Company believes it has recorded appropriate reservesliabilities in the consolidated financial statements and periodically adjusts these reserves as appropriate. In other instances, because of the uncertainties related to both the probable outcome andand/or the amount or range of loss, management is unable to make a reasonable estimate ofdoes not record a liability but discloses the contingency if any.significant. As additional information becomes available, the Company adjusts its assessments and estimates of such liabilities accordingly.
Based on its review of the latest information available, in the opinion of management, the ultimate liability of the Company in connection with pending legal and tax proceedings, claims and litigation will not have a material adverse effect on Moody’s financial position, results of operations or cash flows, subject to the contingencies described below.
Legacy Contingencies
Moody’s has exposure to certain potential liabilities assumed in connection with the 2000 Distribution. These contingencies are referred to by Moody’s as “Legacy Contingencies”. The principal Legacy Contingencies presently outstanding relate to tax matters.
To understand the Company’s exposure to the potential liabilities described below, it is important to understand the relationship between Moody’s and New D&B, and the relationship among New D&B and its predecessors and other
71
parties who, through various corporate reorganizations and related contractual commitments, have assumed varying degrees of responsibility with respect to such matters.
59
In November 1996, The Dun & Bradstreet Corporation through a spin-off separated into three separate public companies: The Dun & Bradstreet Corporation, ACNielsen Corporation (“ACNielsen”) and Cognizant Corporation (“Cognizant”) (the “1996 Distribution”). Under the terms of the distribution agreement relating to the 1996 Distribution (the “1996 Distribution Agreement”), each party thereto is prohibited from distributing to its stockholders any business that had been allocated to it in connection with the 1996 Distribution, unless the distributed business delivers an undertaking agreeing to be jointly and severally liable to the other parties under the 1996 Distribution Agreement for the liabilities of the distributing parent company under the 1996 Distribution Agreement.
In June 1998, The Dun & Bradstreet Corporation through a spin-off separated into two separate public companies: The Dun & Bradstreet Corporation and R.H. Donnelley Corporation (“Donnelley”) (the “1998 Distribution”).Corporation. During 1998, Cognizant through a spin-off separated into two separate public companies: IMS Health Incorporated (“IMS Health”) and Nielsen Media Research, Inc. (“NMR”). In September 2000, The Dun & Bradstreet Corporation (“Old D&B”)&B through a spin-off separated into two separate public companies: New D&B and Moody’s, as further described in Note 1 to the consolidated financial statements.
Information Resources, Inc.
The following is a description of an antitrust lawsuit filed in 1996 by Information Resources, Inc. (“IRI”). As more fully described below, VNU N.V., a publicly traded Dutch company, and its U.S. subsidiaries, VNU, Inc., ACNielsen Corporation (“ACNielsen”), AC Nielsen (US), Inc. (“ACN (US)”), and Nielsen Media Research, Inc. (“NMR”) (collectively, the “VNU Parties”), have assumed exclusive joint and several liability for any judgment or settlement of this antitrust lawsuit. As a result of the indemnity obligation, Moody’s does not have any exposure to a judgment or settlement of this lawsuit unless the VNU Parties default on their obligations. However, in the event of such a default, contractual commitments undertaken by Moody’s in connection with various corporate reorganizations since 1996 would require the Company to bear a portion of any amount not paid by the VNU Parties. Moreover, as described below, on February 1, 2005, the U.S. District Court for the Southern District of New York entered a final judgment against IRI dismissing IRI’s claims with prejudice and on the merits.
In July 1996, IRI filed a complaint, subsequently amended in 1997, in the U.S. District Court for the Southern District of New York, naming as defendants the corporation then known as The Dun & Bradstreet Corporation (now known as R.H. Donnelly), A.C. Nielsen Company (a subsidiary of ACNielsen) and IMS International, Inc. (a subsidiary of the company then known as Cognizant). At the time of the filing of the complaint, each of the other defendants was a subsidiary of the company then known as The Dun & Bradstreet Corporation.
The amended complaint alleges various violations of United States antitrust laws under Sections 1 and 2 of the Sherman Act. The amended complaint also alleges a claim of tortious interference with a contract and a claim of tortious interference with a prospective business relationship. These claims relate to the acquisition by defendants of Survey Research Group Limited (“SRG”). IRI alleged SRG violated an alleged agreement with IRI when it agreed to be acquired by defendants and that defendants induced SRG to breach that agreement.
IRI’s antitrust claims allege that defendants developed and implemented a plan to undermine IRI’s ability to compete within the United States and foreign markets in North America, Latin America, Asia, Europe and Australia/New Zealand through a series of anti-competitive practices, including: unlawfully tying/bundling services in the markets in which defendants allegedly had monopoly power with services in markets in which ACNielsen competed with IRI; entering into exclusionary contracts with retailers in certain countries to deny IRI’s access to sales data necessary to provide retail tracking services or to artificially raise the cost of that data; predatory pricing; acquiring foreign market competitors with the intent of impeding IRI’s efforts to expand; disparaging IRI to financial analysts and clients; and denying IRI access to capital necessary for it to compete.
72
IRI is seeking in excess of $650 million, which IRI also asked to be trebled. IRI has filed with the Court the report of its expert who has opined that IRI suffered damages of between $582 million and $652 million from the defendants’ alleged practices. IRI also sought punitive damages in an unspecified amount.
On June 21, 2004, pursuant to a stipulation between IRI and defendants, the Court ordered that certain of IRI’s claims be dismissed with prejudice from the lawsuit, including the claims that defendants tortiously interfered with the SRG acquisition. The Company believes that the dismissal of the tortious interference claims also precludes any claim for punitive damages.
On December 3, 2004, the Court entered In limine Order No. 1, which bars IRI from “arguing that Nielsen’s pricing practices or discounts were illegal or anti-competitive unless it can prove they involved prices below short-run average variable cost, calculated without the inclusion of Nielsen’s ‘Fixed Operations’ costs”. On December 17, 2004, IRI issued a press release, which said in relevant part, “Without this evidence, IRI believes that little would be left of IRI’s case to take to trial”. IRI asked the Court to enter a final judgment against it, so that it could take an immediate appeal to the Court of Appeals for the Second Circuit. Defendants did not object to this request. On February 1, 2005 the Court entered a final judgment dismissing IRI’s claims with prejudice and on February 2, 2005, the Court entered IRI’s notice of appeal to the Second Circuit. The Court of Appeals for the Second Circuit has ordered that the appeal be argued no earlier than the week of June 13, 2005.
In connection with the 1996 Distribution, NMR (then known as Cognizant Corporation), ACNielsen and Donnelley (then known as The Dun & Bradstreet Corporation) entered into an Indemnity and Joint Defense Agreement (the “Original Indemnity and Joint Defense Agreement”), pursuant to which they agreed to:
In 2001, ACNielsen was acquired by VNU N.V., which assumed ACNielsen’s obligations under the Original Indemnity and Joint Defense Agreement.
Under the terms of the 1998 Distribution, Old D&B assumed all potential liabilities of Donnelley (then known as The Dun & Bradstreet Corporation) arising from the IRI action and agreed to indemnify Donnelley in connection with such potential liabilities. Under the terms of the 2000 Distribution, New D&B undertook to be jointly and severally liable with Moody’s for Old D&B’s obligations to Donnelley under the 1998 Distribution, including for any liabilities arising under the Original Indemnity and Joint Defense Agreement and arising from the IRI action itself. However, as between New D&B and Moody’s, it was agreed that under the 2000 Distribution, each of New D&B and Moody’s will be responsible for 50% of any payments required to be made to or on behalf of Donnelley with respect to the IRI action under the terms of the 1998 Distribution, including legal fees or expenses related to the IRI action.
On July 30, 2004, the VNU Parties, Donnelley, Moody’s, New D&B and IMS Health entered into an Amended and Restated Indemnity and Joint Defense Agreement (the “Amended Indemnity and Joint Defense Agreement”).
Pursuant to the Amended Indemnity and Joint Defense Agreement, any and all IRI Liabilities incurred by Donnelley, Moody’s, New D&B or IMS Health relating to a judgment (even if not final) or any settlement being entered into in the IRI action will be jointly and severally assumed, and fully discharged, exclusively by the VNU Parties. Under the Amended Indemnity and Joint Defense Agreement, the VNU Parties have agreed to, jointly and severally, indemnify Donnelley, Moody’s, New D&B and IMS Health from and against all IRI Liabilities to which they become subject. As a result, the cap on ACNielsen’s liability for the IRI Liabilities, which was provided for in the Original Indemnity and Joint Defense Agreement, no longer exists and all such liabilities are the responsibility of the VNU Parties pursuant to the Amended Indemnity and Joint Defense Agreement.
73
In addition, the Amended Indemnity and Joint Defense Agreement provides that if it becomes necessary to post any bond pending an appeal of an adverse judgment, then the VNU Parties shall obtain the bond required for the appeal and shall pay the full cost of such bond.
In connection with entering into the Amended Indemnity and Joint Defense Agreement, Donnelley, Moody’s, New D&B and IMS Health agreed to amend certain covenants of the Original Indemnity and Joint Defense Agreement to provide operational flexibility for ACNielsen going forward. In addition, the Amended Indemnity and Joint Defense Agreement includes certain amendments to the covenants of ACNielsen (which, under the Amended Indemnity and Joint Defense Agreement, are now also applicable to ACN (US), which the Company understand holds ACNielsen’s operating assets), which are designed to preserve such parties’ claims-paying ability and protect Donnelley, Moody’s, New D&B and IMS Health. Among other covenants, ACNielsen and ACN (US) agreed that neither they nor any of their respective subsidiaries will incur any indebtedness to any affiliated person, except indebtedness which its payment will, after a payment obligation under the Amended Indemnity and Joint Defense Agreement comes due, be conditioned on, and subordinated to, the payment and performance of the obligations of such parties under the Amended Indemnity and Joint Defense Agreement. VNU N.V. has agreed to having a process agent in New York to receive on its behalf service of any process concerning the Amended Indemnity and Joint Defense Agreement.
As described above, the VNU Parties have assumed exclusive responsibility for the payment of all IRI Liabilities. However, because liability for violations of the antitrust laws is joint and several and because the rights and obligations relating to the Amended Indemnity and Joint Defense Agreement are based on contractual relationships, the failure of the VNU Parties to fulfill their obligations under the Amended Indemnity and Joint Defense Agreement could result in the other parties bearing all or a portion of the IRI Liabilities. Joint and several liability for the IRI action means that even where more than one defendant is determined to have been responsible for an alleged wrongdoing, the plaintiff can collect all or part of the judgment from just one of the defendants. This is true regardless of whatever contractual allocation of responsibility the defendants and any other indemnifying parties may have made, including the allocations described above between the VNU Parties, Donnelley, Moody’s, New D&B and IMS Health.
Accordingly, and as a result of the allocations of liability described above, in the event the VNU Parties default on their obligations under the Amended Indemnity and Joint Defense Agreement, each of Moody’s and New D&B will be responsible for the payment of 50% of the portion of any judgment or settlement ultimately paid by Donnelley (which is a defendant in the IRI action), which can be as high as all the IRI Liabilities.
The Company is unable to predict the outcome of the IRI action (including the appeal), or the financial condition of any of the VNU parties or the other defendants at the time of any such outcome and hence the Company cannot estimate their ability to pay the IRI Liabilities pursuant to the Amended Indemnity and Joint Defense Agreement or the amount of the judgment or settlement in the IRI action. However, provided that the VNU Parties fulfill their obligations under the Amended Indemnity and Joint Defense Agreement, the Company believes that the resolution of this matter, irrespective of the outcome of the IRI action, should not materially affect Moody’s financial position, results of operations and cash flows. Accordingly, no amount in respect of this matter has been accrued in the Company’s consolidated financial statements. If, however, IRI were to prevail in whole or in part in this action and if Moody’s is required to pay, notwithstanding such contractual obligations, a portion of any significant settlement or judgment, the outcome of this matter could have a material adverse effect on Moody’s financial position, results of operations, and cash flows.
Legacy Tax Matters
Old D&B and its predecessors entered into global tax planning initiatives in the normal course of business, including through tax-free restructurings of both their foreign and domestic operations. These initiatives are subject to normal review by tax authorities.
Pursuant to a series of agreements, as between themselves, IMS Health and NMR are jointly and severally liable to pay one-half, and New D&B and Moody’s are jointly and severally liable to pay the other half, of any payments for
74
taxes, penalties and accrued interest resulting from unfavorable IRSInternal Revenue Service (“IRS”) rulings on certain tax matters as described in such agreements (excluding the matter described below as “Amortization Expense Deductions” for which New D&B and Moody’s are solely responsible) and certain other potential tax liabilities, also as described in such agreements, after New D&B and/or Moody’s pays the first $137 million, which amount was paid in connection with the matter described below as “Utilization of Capital Losses”.agreements.
In connection with the 2000 Distribution and pursuant to the terms of the 2000 Distribution Agreement, New D&B and Moody’s have, between themselves, agreed to each be financially responsible for 50% of any potential liabilities that may arise to the extent such potential liabilities are not directly attributable to their respective business operations.
Without limiting the generality of the foregoing, three specific tax matters are discussed below.
Royalty Expense Deductions
DuringThis matter related to the second quarter of 2003, New D&B received an Examination Report from the IRS with respect to a partnership transaction entered into in 1993. In this Report, the IRSIRS’s stated its intention to disallow certain royalty expense deductions claimed by Old D&B on its tax returns for the years 1993 through 1996 (the “Royalty Report”). Inas well as the first quarter of 2004, New D&B received a similar Examination Report (the “Second Royalty Report”) relating to the first quarter of 1997.
During the second quarter of 2003, New D&B also received an Examination Report that had been issued by the IRS to the partnership, stating the IRS’IRS’s intention to ignore the partnership structure that had been established in 1993 in connection with the above transaction, and to reallocate to Old D&B income and expense items that had been reported in thea certain partnership tax return for 1996 (the “Reallocation Report”).1996. These matters were settled with the IRS in a closing agreement executed in the third quarter of 2005 and accordingly, the Company reduced its reserve for this matter by $11.5 million. However, IMS Health and NMR disagreed with New D&B’s calculation of each party’s share of the liability. New D&B also received a similar Examination Report (the “Second Reallocation Report”) issuedmay commence arbitration proceedings against IMS Health and NMR to collect the partnership with respect to the first quarter of 1997.
In June 2004,$7.3 million that New D&B and Moody’s each were obligated to pay to the IRS conducted a mediationon their behalf. Based upon the current understanding of these issues, at which they reached a basisthe positions that New D&B and IMS Health may take, the Company believes it is likely that New D&B will prevail, but Moody’s cannot predict with certainty the outcome.
In the second quarter of 2006, Moody’s paid approximately $9 million for the state income tax liability connected with the terms of the October 2005 settlement with regard to the Royalty Report for 1995IRS and 1996,reversed the Reallocation Report, and certain tax refund claims made by Old D&B related to 1995 and 1996 (the “Preliminary Settlement”). The Preliminary Settlement was subject to the executionremaining reserve of a formal settlement agreement. In addition,$1.5 million.
Additionally, the IRS reasserted its position that certain tax refund claims made by Old D&B related to 1993 and 1994 may be offset by tax liabilities relating to the above mentioned partnership formed in 1993. In the fourth quarter of 2005, New D&B disagrees with the position taken by the IRS for 1993 and 1994 and plans to filefiled a protest with the IRS Appeals Office. IfOffice concerning the protest is unsuccessfulIRS’s denial of the tax refunds. In the third quarter of 2006, the IRS Appeals Office rejected New D&B’s protest. New D&B can either: (1) abandon its tax refund claims; or (2) challenge the IRS claim in U.S. District Court or the U.S. Court of Federal Claims. Moody’s estimates that its exposureis determining whether to file suit for the write-off of deferred tax assets related to these tax refund claims could be up torefund. Moody’s share is estimated at approximately $9 million.
As of June 30, 2004, Moody’s had adjusted its reserves for the Royalty Expense Deductions matter to reflect the Company’s estimates of probable exposure for the Preliminary Settlement and the other matters discussed in the preceding paragraph. In accordance with the 1996 Distribution Agreement, New D&B was required to obtain the consent of Moody’s, IMS Health and NMR as a condition to executing the formal settlement agreement, but New D&B was unable to obtain consent from IMS Health and NMR. Accordingly, New D&B and the IRS were unable to agree on the terms of a formal settlement agreement by the November 1st deadline imposed by the IRS. As a result, the IRS withdrew the Preliminary Settlement.
The Company believes that in accordance with the 1996 Distribution Agreement, IMS Health and NMR, by withholding their consent to the formal settlement agreement, would be contractually responsible to pay any excess amounts above the Preliminary Settlement that may ultimately be owing with respect to tax years 1995 and 1996. IMS Health has alleged various breaches of New D&B’s obligations under the 1996 Distribution Agreement related to New D&B’s management and attempted settlement of this matter. If the parties fail to resolve their dispute, Moody’s understands that New D&B anticipates commencing arbitration proceedings against IMS Health and
75
NMR. Based on our current understanding of the positions of New D&B and IMS Health, the Company believes it is likely that New D&B should prevail, but we cannot predict with certainty the outcome.
In addition, the Second Royalty Report and the Second Reallocation Report, which were not part of New D&B’s preliminary settlement with the IRS, have not been resolved. Moody’s estimates that its share of the potential required payment to the IRS for this matter is $0.1 million (including penalties and interest, and net of tax benefits).
Moody’s has reassessed its exposure for the Royalty Expense Deductions matter taking into consideration: (1) the original Examination Reports discussed above (for which the Company’s share of the required payments to the IRS could be up to $103 million, including penalties and interest, and net of tax benefits); and (2) the potential write-off of deferred tax assets (for which the Company’s exposure could be up to $9 million as discussed above). Based on this assessment, in 2004, the Company increased its reserve for this matter by $16.4 million to reflect the current estimate of probable exposure. Moody’s believes that the positions taken by the IRS in the Royalty Reports and the Reallocation Reports discussed above are inconsistent with each other. While it is possible that the IRS could ultimately prevail in whole or in part on one of such positions noted above, Moody’s believes that it is unlikely that the IRS will prevail on both.
Amortization Expense Deductions
In April 2004, New D&B received Examination Reports (the “April Examination Reports”) from the IRS with respect to a partnership transaction. This transaction was entered into in 1997 and haswhich resulted in amortization expense deductions on the tax returns of Old D&B since 1997. These deductions could continue through 2012. In the April Examination Reports, the IRS stated its intention to disallow the amortization expense deductions related to this partnership that were claimed by Old D&B on its 1997 and 1998 tax returns. New D&B disagrees with the position taken by the IRS and can either: (1) accept and pay the IRS assessment; (2) challenge the assessment in U.S. Tax Court; or (3) challenge the assessment in U.S. District Court or the U.S. Court of Federal Claims, where in either case payment of the disputed amount would be required in connection with such challenge. IRS audits of Old D&B’s or New D&B’s tax returns for years subsequent to 1998 could result in the issuance of similar Examination Reports, in which case New D&B would also have the aforementioned three courses of action. Should any such payments be made by New D&B related to either the April Examination Reports or any potential Examination Reports for future years, including years subsequent to the separation of Moody’s from New D&B, then pursuant to the terms of the 2000 Distribution Agreement, Moody’s would have to pay to New D&B its 50% share. In addition, should New D&B discontinue claiming the amortization deductions on future tax returns, Moody’s would be required to repay to New D&B an amount equal to the discounted value of its 50% share of the related future tax benefits. New D&B had paid the discounted value of 50% of the future tax benefits from this transaction in cash to Moody’s at the Distribution Date. Moody’s estimates that the Company’s current potential exposure could be up to $95 million (including penalties and interest, and net of tax benefits). This exposure could increase by approximately $3 million to $6 million per year, depending on actions that the IRS may take and on whether New D&B continues claiming the amortization deductions on its tax returns.
In the April Examination Reports, theThe IRS also stated its intention to disallow certain royalty expense deductions claimed by Old D&B on its 1997 and 1998 tax returns with respect to the partnership transaction. In addition, the IRS stated its intention to disregard the partnership structure and to reallocate to Old D&B certain partnership income and expense items that had been reported in the partnership tax returns for 1997 and 1998. New D&B disagrees with thethese positions taken by the IRS and can take any of the three courses of action described in the preceding paragraph.IRS. IRS audits of Old D&B’s or New D&B’s tax returns for years subsequent to 1998 could resulthave resulted in the issuance of similar Examination Reports for the 1999 through 2002 tax years. Similar Examination Reports could result for tax years subsequent years. to 2002.
60
Should any such payments be made by New D&B related to either the April Examination Reports or any potential Examination Reports for future years, including years subsequent to the separation of Moody’s from New D&B, then pursuant to the terms of the 2000 Distribution Agreement, Moody’s would have to pay to New D&B its 50%share. In addition, should New D&B discontinue claiming the amortization expense deductions on future tax returns, Moody’s would be required, pursuant to the terms of the 2000 Distribution Agreement, to repay to New D&B an amount equal to the discounted value of its share of the related future tax benefits. New D&B’s payments&B had paid the discounted value of 50% of the future tax benefits from this transaction in cash to the IRS for the period from 1997 throughMoody’s at the Distribution Date. Moody’s estimates that its share of the Company’s potential exposure to the IRS could be up to $129 millionexposures (including penalties and interest, and net of tax benefits). could be up to $120 million relating to the disallowance of amortization expense deductions and could increase by approximately $6 million to $10 million per year, depending on actions that the IRS may take and on whether New D&B continues claiming the amortization expense deductions on its tax returns. Additionally, there are potential exposures that could be up to $164 million relating to the reallocation of the partnership income and expense to Old D&B. Moody’s also could be obligated for future interest payments on its share of such liability.
76
New D&B had filed protestsis currently in discussion with the IRS Appeals Office regarding the April Examination Reports. In September 2004,on these issues. On March 3, 2006, New D&B and Moody’s each deposited $39.8 million with the IRS Appeals Office remandedin order to stop the caseaccrual of statutory interest on potential tax deficiencies up to or equal to that amount with respect to the IRS examination office for further development of the issues. New D&B has reopened discussion of the issues with the examination office.1997 through 2002 tax years.
Moody’s believes that the IRS’s proposed assessments of tax against Old D&B and the proposed reallocations of partnership income and expense to Old D&B are inconsistent with each other. Accordingly, while it is possible that the IRS could ultimately prevail in whole or in part on one of such positions, Moody’s believes that it is unlikely that the IRS will prevail on both.
Utilization of Capital Losses
The IRS has completed its review ofIn December 2004, New D&B executed a formal settlement agreement for all outstanding issues related to the matter concerning utilization of certain capital losses generated by Old D&B during 1989 and 1990. On June 26, 2000, the IRS, as part of its audit process, issued a formal assessment with respect to the utilization of these capital losses.
On May 12, 2000, an amended tax return was filed by Old D&B for the 1989 and 1990 tax years, which reflected $561.6 million of tax and interest due. Old D&B paid the IRS approximately $349.3 million of this amount on May 12, 2000; 50% of such payment was allocated to Moody’s and had previously been accrued by the Company. IMS Health informed Old D&B that it paid to the IRS approximately $212.3 million on May 17, 2000. The payments were made to the IRS to stop further interest from accruing, and on September 20, 2000, Old D&B filed a petition for a refund in the U.S. District Court.
In July 2004, New D&B and the IRS reached a basis for settlement of all outstanding issues related to this matter and in December 2004 executed a formal settlement agreement. New D&B received the first of three finaltwo assessments on February 15, 2005 and expects to receive the other two in the second quarter of 2005. Payment of the first assessment was made inthis matter during the first quarter of 20052005. The third and paymentfinal assessment was received in April 2006 of which Moody’s paid $0.3 million. The amounts paid by Moody’s for the first two other assessments is expected to be made in the second quarter of 2005. Moody’s estimatesincluded its share of these assessments to be approximately $15$4 million reflecting cash payments of approximately $6 millionthat Moody’s and the write-off of deferred tax assets of approximately $9 million. In addition,New D&B believe should have been paid by IMS Health and NMR, have notified New D&B that they disagreebut were not paid by them due to their disagreement with various aspects of New D&B’s calculation of their respective shares of the payments. If the parties failNew D&B was unable to resolve theirthis dispute Moody’s understands that New D&B anticipates commencingwith IMS Health and NMR, and has commenced arbitration proceedings against IMS Health and NMR.them. Moody’s believes that New D&B should prevail in its position, but wethe Company cannot predict with certainty the outcome.
In 2004 ,the first quarter of 2005, Moody’s had increased its reserves forliabilities by $2.7 million due to this matter by $14 million to reflect its current estimate of the probable exposure. Should IMS Health and NMR prevail in their position described in the prior paragraph, then Moody’s estimates that its exposure for this matter could increase by up to approximately $3 million.disagreement.
Summary of Moody’s Exposure to Three Legacy Tax Related Matters
The Company considers from time to time the range and probability of potential outcomes related to the threeits legacy tax matters discussed above and establishes reservesliabilities that it believes are appropriate in light of the relevant facts and circumstances. In doing so, Moody’s makes estimates and judgments as to future events and conditions and evaluates its estimates and judgments on an ongoing basis.
DuringFor the years ended December 31, 2006, 2005 and 2004, , the Company recorded charges$2.4 million and $8.8 million net reversals of approximately $30reserves and increased reserves by $30.0 million, to increase its reserves for the three legacy tax matters reflecting its current estimates of the probable exposures on these matters.respectively. The Company also has recorded approximately $3$3.5 million, $5.8 million and $3.4 million of net interest expense related to these reserves. As a result, atits legacy tax matters in the years ended December 31, 2006, 2005 and 2004, respectively. Moody’s total recorded net legacy tax reservesrelated liabilities as of December 31, 2006 were $136$93 million (consisting of $161 million of tax liabilities, partially offset by the expected utilization of $25 million of deferred tax assets). The $136 million of expected cash payments consists of $50 million of current liabilities (reflecting the estimated cash payments related to the Royalty Expense Deductions and Utilization of Capital Losses matters that are expected to be made over the next twelve months) and $86 million of non-current liabilities.classified as long term.
77
It is possible that the legacy tax matters could be resolved in amounts that are greater than the amounts reservedliabilities recorded by the Company, which could result in additional charges that may be material to Moody’s future reported results, financial position and cash flows. Although Moody’s does not believe it is likely that the Company will ultimately be required to pay the full amounts presently being sought by the IRS, potential future outlays resulting from these matters could be as much as $354 million and could increase with time as described above. In matters where Moody’s believes the IRS has taken inconsistent positions, Moody’s may be obligated initially to pay its share of related duplicative assessments. However, Moody’s believes that ultimately it is unlikely that the IRS would retain such duplicative payments.
Note 1517 Segment Information
Moody’s operates in two reportable segments: Moody’s Investors Service and Moody’s KMV. The Company reports segment information in accordance with SFAS No. 131, “Disclosures about Segments of an Enterprise and Related Information”. SFAS No. 131 defines operating segments as components of an enterprise for which separate financial information is available that is evaluated regularly by the chief operating decision-maker in deciding how to allocate resources and in assessing performance.
61
Moody’s Investors Service consists of four rating groups — structured finance, corporate finance, financial institutions and sovereign risk, and public finance — that generate revenue principally from the assignment of credit ratings on issuers and issues of fixed-income instrumentsobligations in the debt markets, and research, which primarily generates revenue from the sale of investor-oriented credit research, principally produced by the rating groups.groups and economic commentary. Public finance represents U.S. public finance. Given the dominance of Moody’s Investors Service to Moody’s overall results, the Company does not separately measure or report corporate expenses, nor are theysuch expenses allocated tobetween the Company’s business segments. Accordingly, all corporate expenses are included in operating income of the Moody’s Investors Service segment and none have been allocated to the Moody’s KMV segment.
The Moody’s KMV business consists of the combined businesses of KMV, acquired in April 2002, and Moody’s Risk Management Services. Moody’s KMV develops and distributes quantitative credit risk assessment products and services and credit processing software for banks, corporations and investors in credit-sensitive assets, credit training services and credit processing software.
assets. Assets used solely by Moody’s KMV are separately disclosed within that segment. All other Company assets, including corporate assets, are reported as part of Moody’s Investors Service.
Revenue by geographic area is generally based on the location of the customer.
Intersegment Inter-segment sales are insignificant and no single customer accounted for 10% or more of total revenue.
Below areis financial information by segment, Moody’s Investors Service revenue by business unit and consolidated revenue and long-lived asset information by geographic area, for the years ended and as of December 31, 2004, 20032006, 2005 and 2002.2004. Certain prior year amounts have been reclassified to conform to the current presentation.
78
Financial Information by Segment
| Year Ended December 31, 2004 | ||||||||||||
| Moody’s | ||||||||||||
| Investors | Moody’s | |||||||||||
| Service | KMV | Consolidated | ||||||||||
| Revenue | $ | 1,310.7 | $ | 127.6 | $ | 1,438.3 | ||||||
| Operating expenses | 513.7 | 104.1 | 617.8 | |||||||||
| Depreciation and amortization | 16.9 | 17.2 | 34.1 | |||||||||
| Operating income | 780.1 | 6.3 | 786.4 | |||||||||
| Non-operating expense, net | (15.1 | ) | ||||||||||
| Income before provision for income taxes | 771.3 | |||||||||||
| Provision for income taxes | 346.2 | |||||||||||
| Net income | $ | 425.1 | ||||||||||
| Total assets at December 31 | $ | 1,110.2 | $ | 265.8 | $ | 1,376.0 | ||||||
| Year Ended December 31, 2003 | Year Ended December 31, 2002 | |||||||||||||||||||||||
| Moody’s | Moody’s | |||||||||||||||||||||||
| Investors | Moody’s | Investors | Moody’s | |||||||||||||||||||||
| Service | KMV | Consolidated | Service | KMV | Consolidated | |||||||||||||||||||
| Revenue | $ | 1,134.7 | $ | 111.9 | $ | 1,246.6 | $ | 941.8 | $ | 81.5 | $ | 1,023.3 | ||||||||||||
| Operating expenses | 462.2 | 88.7 | 550.9 | 385.7 | 74.9 | 460.6 | ||||||||||||||||||
| Depreciation and amortization | 15.4 | 17.2 | 32.6 | 12.7 | 11.9 | 24.6 | ||||||||||||||||||
| Operating income (loss) | 657.1 | 6.0 | 663.1 | 543.4 | (5.3 | ) | 538.1 | |||||||||||||||||
| Non-operating expense, net | (6.7 | ) | (20.7 | ) | ||||||||||||||||||||
| Income before provision for income taxes | 656.4 | 517.4 | ||||||||||||||||||||||
| Provision for income taxes | 292.5 | 228.5 | ||||||||||||||||||||||
| Net income | $ | 363.9 | $ | 288.9 | ||||||||||||||||||||
| Total assets at December 31 | $ | 683.9 | $ | 268.4 | $ | 952.3 | $ | 364.2 | $ | 266.6 | $ | 630.8 | ||||||||||||
| Year Ended December 31, 2006 | |||||||||||
Moody’s Investors Service | Moody’s KMV | Consolidated | |||||||||
Revenue | $ | 1,894.3 | $ | 142.8 | $ | 2,037.1 | |||||
Operating expenses | 789.1 | 109.6 | 898.7 | ||||||||
Gain on sale of building | (160.6 | ) | — | (160.6 | ) | ||||||
Depreciation and amortization | 22.9 | 16.6 | 39.5 | ||||||||
Operating income | 1,242.9 | 16.6 | 1,259.5 | ||||||||
Non-operating income, net | 1.0 | ||||||||||
Income before provision for income taxes | 1,260.5 | ||||||||||
Provision for income taxes | 506.6 | ||||||||||
Net income | $ | 753.9 | |||||||||
Total assets at December 31 | $ | 1,255.8 | $ | 241.9 | $ | 1,497.7 | |||||
| Year Ended December 31, 2005 | Year Ended December 31, 2004 | |||||||||||||||||||
Moody’s Investors Service | Moody’s KMV | Consolidated | Moody’s Investors Service | Moody’s KMV | Consolidated | |||||||||||||||
Revenue | $ | 1,600.3 | $ | 131.3 | $ | 1,731.6 | $ | 1,317.5 | $ | 120.8 | $ | 1,438.3 | ||||||||
Operating expenses | 645.4 | 111.4 | 756.8 | 518.0 | 99.8 | 617.8 | ||||||||||||||
Depreciation and amortization | 18.6 | 16.6 | 35.2 | 17.3 | 16.8 | 34.1 | ||||||||||||||
Operating income | 936.3 | 3.3 | 939.6 | 782.2 | 4.2 | 786.4 | ||||||||||||||
Non-operating expense, net | (4.9 | ) | (15.1 | ) | ||||||||||||||||
Income before provision for income taxes | 934.7 | 771.3 | ||||||||||||||||||
Provision for income taxes | 373.9 | 346.2 | ||||||||||||||||||
Net income | $ | 560.8 | $ | 425.1 | ||||||||||||||||
Total assets at December 31 | $ | 1,204.5 | $ | 252.7 | $ | 1,457.2 | $ | 1,123.5 | $ | 265.8 | $ | 1,389.3 | ||||||||
62
Moody’s Investors Service Revenue by Business Unit
| Year Ended December 31, | ||||||||||||
| 2004 | 2003 | 2002 | ||||||||||
| Ratings revenue: | ||||||||||||
| Structured finance | $ | 538.6 | $ | 460.6 | $ | 384.3 | ||||||
| Corporate finance | 311.5 | 278.8 | 227.7 | |||||||||
| Financial institutions and sovereign risk | 208.9 | 181.2 | 155.0 | |||||||||
| Public finance | 82.2 | 87.2 | 81.2 | |||||||||
| Total ratings revenue | 1,141.2 | 1,007.8 | 848.2 | |||||||||
| Research revenue | 169.5 | 126.9 | 93.6 | |||||||||
| Total Moody’s Investors Service | $ | 1,310.7 | $ | 1,134.7 | $ | 941.8 | ||||||
79
| Year Ended December 31, | |||||||||
| 2006 | 2005 | 2004 | |||||||
Ratings revenue: | |||||||||
Structured finance | $ | 886.7 | $ | 715.4 | $ | 553.1 | |||
Corporate finance | 396.2 | 323.2 | 299.6 | ||||||
Financial institutions and sovereign risk | 266.8 | 254.6 | 208.9 | ||||||
Public finance | 85.9 | 91.8 | 82.2 | ||||||
Total ratings revenue | 1,635.6 | 1,385.0 | 1,143.8 | ||||||
Research revenue | 258.7 | 215.3 | 173.7 | ||||||
Total Moody’s Investors Service | $ | 1,894.3 | $ | 1,600.3 | $ | 1,317.5 | |||
Revenue and Long-lived Asset Information by Geographic Area
| 2004 | 2003 | 2002 | ||||||||||
| Revenue: | ||||||||||||
| United States | $ | 911.2 | $ | 795.3 | $ | 680.8 | ||||||
| International | 527.1 | 451.3 | 342.5 | |||||||||
| Total | $ | 1,438.3 | $ | 1,246.6 | $ | 1,023.3 | ||||||
| Long-lived assets: | ||||||||||||
| United States | $ | 245.2 | $ | 255.9 | $ | 269.3 | ||||||
| International | 18.7 | 14.7 | 15.4 | |||||||||
| Total | $ | 263.9 | $ | 270.6 | $ | 284.7 | ||||||
| 2006 | 2005 | 2004 | |||||||
Revenue: | |||||||||
United States | $ | 1,277.8 | $ | 1,085.4 | $ | 911.2 | |||
International | 759.3 | 646.2 | 527.1 | ||||||
Total | $ | 2,037.1 | $ | 1,731.6 | $ | 1,438.3 | |||
Long-lived assets: | |||||||||
United States | $ | 283.6 | $ | 267.3 | $ | 245.2 | |||
International | 22.0 | 18.9 | 18.7 | ||||||
Total | $ | 305.6 | $ | 286.2 | $ | 263.9 | |||
Revenue in Europe was $524.8 million, $437.2 million and $360.8 million for the years ended December 31, 2006, 2005 and 2004, respectively.
Note 1618 Valuation and Qualifying Accounts
Accounts receivable allowances primarily represent adjustments to customer billings that are estimated when the related revenue is recognized. During 2003, the Company reduced its provision rates and in the fourth quarter of 2003, the Company recorded adjustments to the allowances totaling $6.0 million, of which approximately $3.0 million related to 2002 and $3.0 million related to prior quarters of 2003. In 2004, the Company further reduced its provision rates and allowance to reflect its current estimate of the appropriate level of accounts receivable allowances. Below is a summary of activity for each of the three years in the period ended December 31, 2004:
| Balance at | Additions | Write-offs | Balance | |||||||||||||
| Beginning | Charged to | and | at End of | |||||||||||||
| of the Year | Revenue | Adjustments | the Year | |||||||||||||
2004 | $ | (15.9 | ) | (18.1) | 19.4 | $ | (14.6 | ) | ||||||||
| 2003 | (16.4 | ) | (16.4) | 16.9 | (15.9 | ) | ||||||||||
| 2002 | (27.3 | ) | (20.1) | 31.0 | (16.4 | ) | ||||||||||
Balance at Beginning of the Year | Additions Charged to Revenue | Write-offs and Adjustments | Balance at End of the Year | ||||||||
2006 | (12.7 | ) | (34.9 | ) | 33.1 | (14.5 | ) | ||||
2005 | (14.6 | ) | (24.4 | ) | 26.3 | (12.7 | ) | ||||
2004 | (15.9 | ) | (18.1 | ) | 19.4 | (14.6 | ) |
Note 1719 Related Party Transactions
Moody’s Corporation made grants of $7.0$6.0 million, $6.0 million and $6.0$7.0 million to The Moody’s Foundation (the “Foundation”) in 2004, 20032006, 2005 and 2002,2004, respectively. The Foundation carries out philanthropic activities on behalf of Moody’s Corporation primarily in the areas of education and health and human services. Certain members of senior management of Moody’s Corporation are on the Board of Directors of the Foundation.
Note 18 Insurance Recovery
In February 2003, Moody’s received a $15.9 million insurance recovery related to the September 11th tragedy, for incremental costs incurred and for lost profits due to the sharp decline in debt market activity in the weeks following the disaster. Moody’s had previously received a $4.0 million advance payment in 2002, resulting in a total recovery of $19.9 million. Moody’s had incurred incremental costs of $6.3 million for property damage and temporary office facilities, and had fully accrued for the recovery of these costs in its financial statements. The remainder of the insurance recovery, $13.6 million, had not previously been accrued as its realizability was not sufficiently assured. As a result, in the first quarter of 2003 Moody’s recorded a gain of $13.6 million, included in other non-operating income, net in the consolidated statements of operations.63
80
Note 1920 Quarterly Financial Data (Unaudited)
| Three Months Ended | ||||||||||||||||||||
| March 31 | June 30 | September 30 | December 31 | |||||||||||||||||
2004 | ||||||||||||||||||||
| Revenue | $ | 331.2 | $ | 357.6 | $ | 357.9 | $ | 391.6 | ||||||||||||
| Operating income | 182.9 | 199.5 | 197.8 | 206.2 | ||||||||||||||||
| Net income | 103.5 | 103.5 | 95.5 | 122.6 | ||||||||||||||||
| Basic earnings per share | $ | 0.69 | $ | 0.70 | $ | 0.65 | $ | 0.83 | ||||||||||||
| Diluted earnings per share | $ | 0.68 | $ | 0.68 | $ | 0.63 | $ | 0.80 | ||||||||||||
2003 | ||||||||||||||||||||
| Revenue | $ | 278.2 | $ | 312.7 | $ | 305.0 | $ | 350.7 | ||||||||||||
| Operating income | 149.1 | 176.7 | 161.2 | 176.1 | ||||||||||||||||
| Net income | 91.9 | 100.9 | 85.6 | 85.5 | ||||||||||||||||
| Basic earnings per share | $ | 0.62 | $ | 0.68 | $ | 0.57 | $ | 0.57 | ||||||||||||
| Diluted earnings per share | $ | 0.61 | $ | 0.66 | $ | 0.56 | $ | 0.56 | ||||||||||||
| Three Months Ended | ||||||||||||
| March 31 | June 30 | September 30 | December 31 | |||||||||
2006 | ||||||||||||
Revenue | $ | 440.2 | $ | 511.4 | $ | 495.5 | $ | 590.0 | ||||
Operating income | 238.3 | 289.1 | 268.8 | 463.3 | ||||||||
Net income | 146.2 | 172.1 | 157.0 | 278.6 | ||||||||
Basic earnings per share | $ | 0.50 | $ | 0.60 | $ | 0.56 | $ | 1.00 | ||||
Diluted earnings per share | $ | 0.49 | $ | 0.59 | $ | 0.55 | $ | 0.97 | ||||
2005 | ||||||||||||
Revenue | $ | 390.5 | $ | 446.8 | $ | 421.1 | $ | 473.2 | ||||
Operating income | 212.5 | 252.8 | 231.9 | 242.4 | ||||||||
Net income | 118.7 | 145.4 | 146.6 | 150.1 | ||||||||
Basic earnings per share | $ | 0.40 | $ | 0.48 | $ | 0.49 | $ | 0.51 | ||||
Diluted earnings per share | $ | 0.39 | $ | 0.47 | $ | 0.48 | $ | 0.50 | ||||
Basic and diluted earnings per share are computed independently for each of the periods presented. The number of weighted average shares outstanding changes as common shares are issued pursuant to employee stock plans and for other purposes or as shares are repurchased. Therefore, the sum of basic and diluted earnings per share for each of the four quarters may not equal the full year basic and diluted earnings per share.
Note 20 Subsequent Event
On February 15, 2005,The quarterly financial data for the Boardthree months ended December 31, 2006 includes a pre-tax gain of Directors declared a two-for-one stock split$160.6 million relating to be effected as a special stock distribution of one share of common stock for each sharethe sale of the Company’s common stock outstanding and treasury shares. Stockholders of record as of the close of business on May 4, 2005 will receive one additional share of common stock for each share of the Company’s common stock held on that date. Such additional shares will be distributed on May 18, 2005.corporate headquarters building.
The Board of Directors’ declaration of the special stock dividend distribution is subject to stockholder approval of a charter amendment to increase the Company’s authorized common shares. Moody’s stockholders will vote on the charter amendment at the Company’s Annual Meeting, which will be held on April 26, 2005. The proposal to amend the Company’s charter to increase the number of authorized shares will be more fully described in the Company’s annual meeting proxy statement.
If the stock split is approved, the Company will restate its previously reported financial statements accordingly. Among other things, Moody’s number of basic and diluted shares outstanding will be double the amounts currently reported in the consolidated financial statements, and earnings per share will be fifty percent of the currently reported amounts.
Also, on February 15, 2005, the Board of Directors voted to increase the quarterly dividend per share from $0.075 to $0.11 before giving effect to the aforementioned two-for-one stock split, payable on June 15, 2005 to stockholders of record as of May 27, 2005. If the stock split is effected then on a post-split basis, the dividend will be increased to 5.5 cents per share from the 3.75 cents per share that otherwise would have been paid absent the dividend increase. The continued payment of dividends at the rate noted above, or at all, is subject to the discretion of the Board of Directors.
81
ITEM 9.
| ITEM 9. | CHANGES IN AND DISAGREEMENTS WITH ACCOUNTANTS ON ACCOUNTING AND FINANCIAL DISCLOSURE |
Not applicable.
Not applicable.
| ITEM 9A. | CONTROLS AND PROCEDURES |
ITEM 9A. CONTROLS AND PROCEDURES
Evaluation of Disclosure Controls and Procedures: Procedures
The Company carried out an evaluation, as required by Rule 13a-15(b) under the Securities Exchange Act of 1934, as amended (the “Exchange Act”), under the supervision and with the participation of the Company’s management, including the Company’s Chief Executive Officer and Chief Financial Officer, of the effectiveness of the design and operation of the Company’s disclosure controls and procedures, as defined in Rule 13a-15(e) of the Exchange Act, as of the end of the period covered by this report (the “Evaluation Date”). Based on such evaluation, such officers have concluded that, as of the Evaluation Date, the Company’s disclosure controls and procedures arewere effective in alerting them on a timely basis to materialprovide reasonable assurance that information relating to the Company (including its consolidated subsidiaries) required to be includeddisclosed by the Company in the Company’s periodic filingsreports that it files or submits under the Exchange Act.Act is recorded, processed, summarized and reported within the time periods specified in the Securities and Exchange Commission’s rules and forms and to provide reasonable assurance that such information is accumulated and communicated to the Company’s management, including the Company’s Chief Executive Officer and Chief Financial Officer, as appropriate to allow timely decisions regarding required disclosure.
Changes In Internal Control Over Financial Reporting
Information in response to this Item is set forth under the caption “Management’s Report on Internal Control Over Financial Reporting”, in Part II, Item 8 of this annual report on Form 10-K.
In addition, the Company’s management, including the Company’s Chief Executive Officer and Chief Financial Officer, has determined that there were no significant changes in the Company’s internal control over financial reporting that have materially affected, or are reasonably likely to materially affect, these internal controls over financial reporting during the period covered by this report.
ITEM 9B.
| ITEM 9B. | OTHER INFORMATION |
Not applicable.
Not applicable.
64
PART III
Except for the information relating to the executive officers of the Company set forth in Part I of this annual report on Form 10-K, the information called for by Items 10-13 is contained in the Company’s definitive proxy statement for use in connection with its annual meeting of stockholders scheduled to be held on April 26, 2005,24, 2007, and is incorporated herein by reference.
ITEM 10. DIRECTORS AND EXECUTIVE OFFICERS OF THE REGISTRANT
| ITEM 10. | DIRECTORS AND EXECUTIVE OFFICERS OF THE REGISTRANT |
ITEM 11. EXECUTIVE COMPENSATION
| ITEM 11. | EXECUTIVE COMPENSATION |
ITEM 12. SECURITY OWNERSHIP OF CERTAIN BENEFICIAL OWNERS AND MANAGEMENT AND RELATED STOCKHOLDER MATTERS
| ITEM 12. | SECURITY OWNERSHIP OF CERTAIN BENEFICIAL OWNERS AND MANAGEMENT AND RELATED STOCKHOLDER MATTERS |
ITEM 13. CERTAIN RELATIONSHIPS AND RELATED TRANSACTIONS
| ITEM 13. | CERTAIN RELATIONSHIPS AND RELATED TRANSACTIONS |
ITEM 14. PRINCIPAL ACCOUNTANT’S FEES AND SERVICES
| ITEM 14. | PRINCIPAL ACCOUNTING FEES AND SERVICES |
The Audit Committee has established a policy setting forth the requirements for the pre-approval of audit and permissible non-audit services to be provided by the Company’s independent auditors.registered public accounting firm. Under the policy, the Audit Committee pre-approves the annual audit engagement terms and fees, as well as any other audit services and specified categories of non-audit services, subject to certain pre-approved fee levels. In addition, pursuant to the policy, the Audit Committee has authorized its chair to pre-approve other audit and permissible non-audit services up to $50,000 per engagement and a maximum of $250,000 per year. The policy requires that the Audit Committee chair report any pre-approval decisions to the full Audit Committee at its next scheduled meeting. For the year
82
ended December 31, 2004,2006, the Audit Committee approved all of the services provided by the Company’s independent auditors,registered public accounting firm, which are described below.
Audit Fees
The aggregate fees for professional services rendered for the integrated audit of the Company’s annual financial statements for the years ended December 31, 20042006 and 2003,2005, for the review of the financial statements included in the Company’s Reports on Forms 10-Q and 8-K, and for statutory audits of non-U.S. subsidiaries were approximately $2.3$2.1 million (including $0.4$0.2 million not billed) in 20042006 and $1.0$2.0 million (including $0.1 million not billed) in 2003.2005. All such fees were attributable to PricewaterhouseCoopers LLP.
Audit-Related Fees
The aggregate fees billed for audit-related services rendered to the Company by PricewaterhouseCoopers LLP were approximately $0.1 million for both the years ended December 31, 20042006 and 2003 were approximately $0.7 million (including $0.1 million not billed) and $0.4 million, respectively.2005. Such services included acquisition due diligence reviews, employee benefit plan audits internal control reviews, and consultations concerning financial accounting and reporting standards.
Tax Fees
The aggregate fees billed for tax services rendered to the Company by PricewaterhouseCoopers LLP for the years ended December 31, 20042006 and 20032005 were approximately $15,000$5,000 and $75,000,$3,000, respectively. Tax services rendered by PricewaterhouseCoopers LLP principally related to expatriate tax services and tax consulting and compliance.
All Other Fees
The aggregate fees billed for all other services rendered to the Company by PricewaterhouseCoopers LLP for the years ended December 31, 20042006 and 20032005 were approximately $5,000$4,000 and $3,000,$11,000, respectively.
65
PART IV
ITEM 15. EXHIBITS AND FINANCIAL STATEMENT SCHEDULES
| ITEM 15. | EXHIBITS AND FINANCIAL STATEMENT SCHEDULES |
List of documents filed as part of this report.
| (1) | Financial Statements. | |||
See Index to Financial Statements, Item 8 of this Form 10-K.
| (2) | Financial Statement Schedules. | |||
None.
| (3) | Exhibits. | |||
See Index to Exhibits on pages 68-71 of this Form 10-K.
83
66
SIGNATURES
SIGNATURES
Pursuant to the requirements of Section 13 or 15(d) of the Securities Exchange Act of 1934, the Registrant has duly caused this report to be signed on its behalf by the undersigned, thereunto duly authorized.
MOODY’S CORPORATION | ||||||
(Registrant) | ||||||
| By: | /s/ RAYMOND W. MCDANIEL, JR. | |||||
Raymond W. McDaniel, Jr. | ||||||
Chairman and Chief Executive Officer | ||||||
Date: March 8, 2005February 28, 2007
Pursuant to the requirements of the Securities Exchange Act of 1934, this report has been signed below by the following persons on behalf of the Registrant and in the capacities and on the date indicated.
/s/ RAYMOND W. MCDANIEL, JR. | ||||
Raymond W. McDaniel, Jr., Chairman of the | ||||
Board of Directors and Chief Executive Officer | ||||
(principal executive officer) | ||||
/s/ | ||||
Linda S. Huber, Executive Vice President | ||||
and Chief Financial Officer | ||||
(principal financial officer) | ||||
/s/JOSEPH MCCABE | ||||
Joseph McCabe, Senior Vice | ||||
Controller (principal accounting officer) | ||||
/s/ BASIL L. ANDERSON | ||||
/s/ HENRY A. MCKINNELL, JR. | ||||
| Basil L. Anderson, Director | ||||
| Henry A. McKinnell, Jr. Ph.D., Director | ||||
/s/ ROBERT R. GLAUBER | /s/ NANCY S. NEWCOMB | |||
| Robert R. Glauber, Director | Nancy S. Newcomb, Director | |||
/s/ EWALD KIST | /s/ JOHN K. WULFF | |||
| Ewald Kist, Director | John K. Wulff, Director | |||
/s/ CONNIE MACK | ||||
| Connie Mack, Director | ||||
Date: March 8, 2005February 28, 2007
84
67
INDEX TO EXHIBITS
S-K | |||||||
EXHIBIT | |||||||
NUMBER | |||||||
| 3 | ARTICLES OF INCORPORATION AND BY-LAWS | ||||||
.1 | Restated Certificate of Incorporation of the Registrant dated June 15, 1998, as amended effective June 30, 1998, as amended effective October 1, 2000, and as further amended effective | ||||||
.2 | Amended and Restated By-laws of the Registrant (incorporated by reference to Exhibit 3.2 of the Registrant’s Registration Statement on Form 10, file number 1-14037, filed June 18, 1998). | ||||||
| 4 | INSTRUMENTS DEFINING THE RIGHTS OF SECURITY HOLDERS, INCLUDING INDENTURES | ||||||
.1 | Specimen Common Stock certificate (incorporated by reference to Exhibit 4.1 to the Report on Form 8-K of the Registrant, file number 1-14037, filed October 4, 2000). | ||||||
.2 | Amended and Restated Rights Agreement between the Registrant and EquiServe Trust Company, N.A., as Rights Agent, dated as of September 27, 2000 (incorporated by reference to Exhibit 4.1 to the Report on Form 8-K of the Registrant, file number 1-14037, filed September 29, 2000), as amended by Amendment No. 1 to the Rights Agreement among the Registrant, EquiServe Trust Company, N.A., as Rights Agent, and The Bank of New York, as successor Rights Agent, dated as of October 22, 2001 (incorporated by reference to Exhibit 4.2 to the Report on Form 10-K of the Registrant, file number 1-14037, filed March 22, 2002). | ||||||
.3 | Five-Year Credit Agreement, dated as of September 11, 2000, among the Registrant, certain subsidiaries of the Registrant, the lenders party thereto, The Chase Manhattan Bank, as administrative agent, Citibank, N.A., as syndication agent, and The Bank of New York, as documentation agent (incorporated by reference to Exhibit 4.2 to the Report on Form 8-K of the Registrant, file number 1-14037, filed October 4, 2000). | ||||||
.4 | Amended and Restated Credit Agreement, dated as of September 10, 2001, between Moody’s Corporation and certain subsidiaries of the Registrant, the lenders party thereto, The Chase Manhattan Bank, as administrative agent, Citibank, N.A., as syndication agent, and The Bank of New York, as documentation agent (incorporated by reference to Exhibit 10.1 to the Report on Form 10-Q of the Registrant, file number 1-14037, filed November 14, 2001). | ||||||
.5 | Amended and Restated 364-Day Credit Agreement, dated as of September 8, 2003, between Moody’s Corporation and certain subsidiaries of the Registrant, the lenders party thereto, JP Morgan Chase Bank, as administrative agent, Citibank, N.A., as syndication agent, and The Bank of New York, as documentation agent (incorporated by reference to Exhibit 10.3 to the Report on Form 10-Q of the Registrant, file number 1-14037, filed November 12, 2003). | ||||||
.6 | Five-Year Credit Agreement dated as of September 1, 2004, among Moody’s Corporation, the Borrowing Subsidiaries Party Hereto, the Lenders Party Hereto, JP Morgan Chase Bank, as Administrative Agent, Citibank, N.A., as Syndication Agent, and The Bank of New York, as Documentation Agent (incorporated by reference to Exhibit 99.1 to the Report on Form 8-K of the Registrant, file number 1-14037, filed September 8, 2004). | ||||||
.7 Note Purchase Agreement, dated September 30, 2005, by and among Moody’s Corporation and the Note Purchasers party thereto, including the form of the 4.98% Series 2005-1 Senior Unsecured Note due 2015 (incorporated by reference to Exhibit 4.1 to the Report on Form 8-K of the Registrant, file number 1-14037, filed October 5, 2005). | |||||||
68
| 10 | MATERIAL CONTRACTS | ||||||
.1 | Distribution Agreement, dated as of September 30, 2000, between the Registrant and The Dun & Bradstreet Corporation (f.k.a. The New D&B Corporation) (incorporated by reference to Exhibit | ||||||
85
| 10.1 to the Report on Form 8-K of the Registrant, file number 1-14037, filed October 4, 2000). | |||||||
.2 | Tax Allocation Agreement, dated as of September 30, 2000, between the Registrant and The Dun & Bradstreet Corporation (f.k.a. The New D&B Corporation) (incorporated by reference to Exhibit 10.2 to the Report on Form 8-K of the Registrant, file number 1-14037, filed October 4, 2000). | ||||||
.3 | Employee Benefits Agreement, dated as of September 30, 2000, between the Registrant and The Dun & Bradstreet Corporation (f.k.a. The New D&B Corporation) (incorporated by reference to Exhibit 10.3 to the Report on Form 8-K of the Registrant, file number 1-14037, filed October 4, 2000). | ||||||
.4† Supplemental Executive Benefit Plan of Moody’s Corporation, dated as of September 30, 2000 (incorporated by reference to Exhibit 10.4 to the Report on Form 10-K of the Registrant, file number 1-14037, filed March 22, 2002). | |||||||
.5 | Intellectual Property Assignments, dated as of September 1, 2000, between the Registrant and The Dun & Bradstreet Corporation (f.k.a. The New D&B Corporation) (incorporated by reference to Exhibit 10.4 to the Report on Form 8-K of the Registrant, file number 1-14037, filed October 4, 2000). | ||||||
.6† Pension Benefit Equalization Plan of Moody’s Corporation (incorporated by reference to Exhibit 10.9 to Registrant’s Quarterly Report on Form 10-Q, file number 1-14037, filed November 14, 2000). | |||||||
.7† Profit Participation Benefit Equalization Plan of Moody’s Corporation (incorporated by reference to Exhibit 10.11 to Registrant’s Quarterly Report on Form 10-Q, file number 1-14037, filed November 14, 2000). | |||||||
.8† The Moody’s Corporation Nonfunded Deferred Compensation Plan for Non-Employee Directors (incorporated by reference to Exhibit 10.12 to Registrant’s Quarterly Report on Form 10-Q, file number 1-14037, filed November 14, 2000). | |||||||
.9† 1998 Moody’s Corporation Replacement Plan for Certain Non-Employee Directors Holding Dun & Bradstreet Corporation Equity-Based Awards (incorporated by reference to Exhibit to Registrant’s Quarterly Report on Form 10-Q, file number 1- 14037, filed November 14, 2000). | |||||||
.10† 1998 Moody’s Corporation Replacement Plan for Certain Employees Holding Dun & Bradstreet Corporation Equity-Based Awards (incorporated by reference to Exhibit 10.14 to Registrant’s Quarterly Report on Form 10-Q, file number 1-14037, filed November 14, 2000). | |||||||
.11† 1998 Moody’s Corporation Non-Employee Directors’ Stock Incentive Plan (as amended on April 23, 2001) (incorporated by reference to Exhibit 10.11 to the Report on Form 10-K of the Registrant, file number 1-14037, filed March 22, 2002). | |||||||
.12† 1998 Moody’s Corporation Key Employees’ Stock Incentive Plan (incorporated by reference to Exhibit 10.16 to Registrant’s Quarterly Report on Form 10-Q, file number 1-14037, filed November 14, 2000). | |||||||
.13† Moody’s Corporation Career Transition Plan (incorporated by reference to Exhibit 10.17 to Registrant’s Annual Report on Form 10-K, file number 1-14037, filed March | |||||||
.14 | Distribution Agreement, dated as of June 30, 1998, between R.H. Donnelley Corporation (f.k.a. The Dun & Bradstreet Corporation) and the Registrant (f.k.a. The New Dun & Bradstreet Corporation) | ||||||
86
69
.15† 2001 Moody’s Corporation Key Employees Stock Incentive Plan (incorporated by reference to Exhibit 10.15 to the Report on Form 10-K of the Registrant, file number 1-14037, filed March 22, 2002). | |||||||
.16 | Tax Allocation Agreement, dated as of June 30, 1998, between R.H. Donnelley Corporation (f.k.a. The Dun & Bradstreet Corporation) and the Registrant (f.k.a. The New Dun & Bradstreet Corporation) (incorporated by reference to Exhibit 10.2 to Registrant’s Quarterly Report on Form 10-Q, filed August 14, 1998). | ||||||
.17 | Employee Benefits Agreement, dated as of June 30, 1998, between R.H. Donnelley Corporation (f.k.a. The Dun & Bradstreet Corporation) and the Registrant (f.k.a. The New Dun & Bradstreet Corporation) (incorporated by reference to Exhibit 10.3 to Registrant’s Quarterly Report on Form 10-Q, filed August 14, 1998). | ||||||
.18 | Distribution Agreement, dated as of October 28, 1996, among R.H. Donnelley Corporation (f.k.a. The Dun & Bradstreet Corporation), Cognizant Corporation and ACNielsen Corporation (incorporated by reference to Exhibit 10(x) to the Annual Report on Form 10-K of R.H. Donnelley Corporation (f.k.a. The Dun & Bradstreet Corporation) for the year ended December 31, 1996, file number 1-7155, filed March 27, 1997). | ||||||
.19 | Tax Allocation Agreement, dated as of October 28, 1996, among R.H. Donnelley Corporation (f.k.a. The Dun & Bradstreet Corporation), Cognizant Corporation and ACNielsen Corporation (incorporated by reference to Exhibit 10(y) to the Annual Report on Form 10-K of R.H. Donnelley Corporation (f.k.a. The Dun & Bradstreet Corporation) for the year ended December 31, 1996, file number 1-7155, filed March 27, 1997). | ||||||
.20 | Employee Benefits Agreement, dated as of October 28, 1996, among R.H. Donnelley Corporation (f.k.a. The Dun & Bradstreet Corporation), Cognizant Corporation and ACNielsen Corporation (incorporated by reference to Exhibit 10(z) to the Annual Report on Form 10-K of R.H. Donnelley Corporation (f.k.a. The Dun & Bradstreet Corporation) for the year ended December 31, 1996, file number 1-7155, filed March 27, 1997). | ||||||
.21 | |||||||
| Agreement and Plan of Merger and Stock Purchase Agreement, dated as of February 10, 2002, by and among Moody’s Corporation, XYZ Acquisition LLC, KMV LLC, KMV Corporation and the principal members of KMV LLC and the shareholders of KMV Corporation identified therein (incorporated by reference to Exhibit 2.1 to the Report on Form 8-K of the Registrant, file number 1-14037, filed February 22, 2002). | |||||||
87
.22 Note Purchase Agreement, dated as of October 3, 2000, among the Registrant and the purchasers named therein (incorporated by reference to Exhibit 10.25 to the Report on Form 10-K of the Registrant, file number 1-14037, filed March 21, 2003). | |||||||
.23 Form of 7.61% Senior Notes due 2005 (incorporated by reference to Exhibit 10.25 to the Report on Form 10-K of the Registrant, file number 1-14037, filed March 21, 2003). | |||||||
.24† Amended and Restated 2001 Moody’s Corporation Key Employees’ Stock Incentive Plan (incorporated by reference to Exhibit 10.1 to the Report on Form 10-Q of the Registrant, file number 1-14037, filed November 3, 2004). | |||||||
.25† Form of Employee Non-Qualified Stock Option and Restricted Stock Grant Agreement for the Amended and Restated 2001 Moody’s Corporation Key Employees’ Stock Incentive Plan (incorporated by reference to Exhibit 10.2 to the Report on Form 10-Q of the Registrant, file number 1-14037, filed November 3, 2004). | |||||||
.26† Form of Non-Employee Director Restricted Stock Grant Agreement for the 1998 Moody’s Corporation Non-Employee Directors’ Stock Incentive Plan (as amended on April 23, 2001) (incorporated by reference to Exhibit 10.3 to the Report on Form 10-Q of the Registrant, file number 1-14037, filed November 3, 2004). | |||||||
.27† 2004 Moody’s Corporation Covered Employee Cash Incentive Plan (incorporated by reference to Exhibit 10.4 to the Report on Form 10-Q of the Registrant, file number 1-14037, filed November 3, 2004). | |||||||
.28† Description of Bonus Terms under the 2004 Moody’s Corporation Covered Employee Cash Incentive Plan (incorporated by reference to Exhibit 10.5 to the Report on Form 10-Q of the Registrant, file number 1-14037, filed November 3, 2004). | |||||||
.29† Director Compensation Arrangements (incorporated by reference to Exhibit 10.1 to the Report on Form 10-Q of the Registrant, file number 1-14037, filed May 2, 2006). | |||||||
70
.30 Agreement of Lease, dated as of September 7, 2006, between the Registrant and 7 World Trade Center, LLC (incorporated by reference to Exhibit 10.1 to the Report on Form 10-Q of the Registrant, file number 1-14037, filed November 2, 2006). | |||||||
.31 Amendment No. 1 to Five-Year Credit Agreement, dated as of October 26, 2006, among the Registrant, the borrowing subsidiaries and lenders party thereto, The Bank of New York, as documentation agent, Citibank, N.A., as syndication agent, and JPMorgan Chase Bank, N.A., as administrative agent (incorporated by reference to Exhibit 10.2 to the Report on Form 10Q of the Registrant, file number 1-14037, filed November 2, 2006). | |||||||
.32 Purchase and Sale Agreement, dated as of November 20, 2006, between Moody’s Holdings, Inc. and 99 Church Investors LLC (incorporated by reference to Exhibit 99.2 to the Report on Form 8-Kof the Registrant, file number 1-14037, filed November 22, 2006). | |||||||
.33* Moody’s Corporation 1999 Employee Stock Purchase Plan (formerly, The Dun & Bradstreet Corporation 1999 Employee Stock Purchase Plan). | |||||||
| 21* | SUBSIDIARIES OF THE REGISTRANT List of Active Subsidiaries as of January 31, | ||||||
| 23* | |||||||
| 31 | CERTIFICATIONS PURSUANT TO SECTION 302 OF THE SARBANES-OXLEY ACT OF 2002 | ||||||
.1* | Chief Executive Officer Certification Pursuant to Section 302 of the Sarbanes-Oxley Act of 2002. | ||||||
.2* | Chief Financial Officer Certification Pursuant to Section 302 of the Sarbanes-Oxley Act of 2002. | ||||||
| 32 | CERTIFICATIONS PURSUANT TO SECTION 906 OF THE SARBANES-OXLEY ACT OF 2002 | ||||||
.1* Certification Pursuant to 18 U.S.C. Section 1350, as Adopted Pursuant to Section 906 of the Sarbanes-Oxley Act of 2002. (The Company has furnished this certification and does not intend for it to be considered filed under the Securities Exchange Act of 1934 or incorporated by reference into future filings under the Securities Act of 1933 or the Securities Exchange Act of 1934.) | |||||||
88
.2* | Certification Pursuant to 18 U.S.C. Section 1350, as Adopted Pursuant to Section 906 of the Sarbanes-Oxley Act of 2002. (The Company has furnished this certification and does not intend for it to be considered filed under the Securities Exchange Act of 1934 or incorporated by reference into future filings under the Securities Act of 1933 or the Securities Exchange Act of 1934.) | ||||||
| * | Filed herewith |
89
71