SECURITIES AND EXCHANGE COMMISSION
Washington, DC 20549
Form 10-K
| | | |
| þ | | ANNUAL REPORT PURSUANT TO SECTION 13 OR 15(d)
OF THE SECURITIES EXCHANGE ACT OF 1934 |
| | | FOR THE FISCAL YEAR ENDED DECEMBER 31, 2006.2007 |
| o | | TRANSITION REPORT PURSUANT TO SECTION 13 OR 15(d)
OF THE SECURITIES EXCHANGE ACT OF 1934.1934 |
Commission fileno. 1-2958
Hubbell Incorporated
(Exact name of Registrant as specified in its charter)
| | | |
| Connecticut | | 06-0397030 |
(State or other jurisdiction of
incorporation or organization) | | (I.R.S. Employer
Identification Number) |
584 Derby Milford Road
Orange, Connecticut
(Address of principal executive offices) | | 06477-4024
(Zip Code) |
(203) 799-4100
(Registrant’s telephone number, including area code)
Securities registered pursuant to Section 12(b) of the Act:
| | | |
Title of each Class | | Name of Exchange on which Registered |
| |
| Class A Common — $.01 par value (20 votes per share) | | New York Stock Exchange |
| Class B Common — $.01 par value (1 vote per share) | | New York Stock Exchange |
| Series A Junior Participating Preferred Stock Purchase Rights | | New York Stock Exchange |
| Series B Junior Participating Preferred Stock Purchase Rights | | New York Stock Exchange |
Securities registered pursuant to Section 12(g) of the Act:
None
Indicate by check mark if the registrant is a well-known seasoned issuer, as defined in Rule 405 of the Securities Act. Yes þ No o
Indicate by check mark if the registrant is not required to file reports pursuant to Section 13 or 15(d) of the Securities Exchange Act of 1934. Yeso No þ
Indicate by check mark if the registrant (1) has filed all reports required to be filed by Section 13 or 15(d) of the Securities Exchange Act of 1934 during the preceding 12 months (or for such shorter period that the registrant was required to file such report), and (2) has been subject to such filing requirements for the past 90 days. Yes þ No o
Indicate by check mark if disclosure of delinquent filers pursuant to Item 405 ofRegulation S-K is not contained herein, and will not be contained, to the best of registrant’s knowledge, in definitive proxy or information statements incorporated by reference in Part III of thisForm 10-K or any amendment to thisForm 10-K. þo
Indicate by check mark whether the registrant is a large accelerated filer, an accelerated filer, a non-accelerated filer or a non-accelerated filer.smaller reporting company. See definitionthe definitions of “accelerated filer and large“large accelerated filer”, “accelerated filer” and “smaller reporting company” inRule 12b-2 of the Exchange Act. (Check one):
Large Accelerated Filer þ Accelerated Filer o
| | | | | | |
Large Accelerated Filer þ | | Accelerated Filer o | | Non-Accelerated Filer o | | Smaller Reporting Company o |
| | | | | | |
| | (Do not check if a smaller reporting company) |
Indicate by check mark whether the registrant is a shell company (as defined inRule 12b-2 of the Exchange Act). Yes o No þ
The approximate aggregate market value of the voting stock held by non-affiliates of the registrant as of June 30, 20062007 was $2,644,628,636*$2,960,581,836*. The number of shares outstanding of the Class A Common Stock and Class B Common Stock as of February 20, 200715, 2008 was 8,098,9327,291,918 and 51,866,583,49,632,169, respectively.
Documents Incorporated by Reference
Portions of the definitive proxy statement for the annual meeting of shareholders scheduled to be held on May 7, 2007,5, 2008, to be filed with the Securities and Exchange Commission (the “SEC”), are incorporated by reference in answer to Part III of thisForm 10-K.
| | |
| * | | Calculated by excluding all shares held by Executive Officers and Directors of registrant and the Louie E. Roche Trust, the Harvey Hubbell Trust, the Harvey Hubbell Foundation and the registrant’s pension plans, without conceding that all such persons or entities are “affiliates” of registrant for purpose of the Federal Securities Laws. |
HUBBELL INCORPORATED
ANNUAL REPORT ONFORM 10-K
For the Year Ended December 31, 20062007
TABLE OF CONTENTS
1
PART I
Hubbell Incorporated (herein referred to as “Hubbell”, the “Company”, the “registrant”, “we”, “our” or “us”, which references shall include its divisions and subsidiaries as the context may require) was founded as a proprietorship in 1888, and was incorporated in Connecticut in 1905. Hubbell is primarily engaged in the design, manufacture and sale of high quality electrical and electronic products for a broad range of commercial,non-residential and residential construction, industrial telecommunications,and utility and residential applications. Products are either sourced complete, or manufactured or assembled by subsidiaries in the United States, Canada, Switzerland, Puerto Rico, Mexico, Italy, the United Kingdom, Brazil and Australia. Hubbell also participates in joint ventures in Taiwan and Hong Kong,the People’s Republic of China, and maintains sales offices in Singapore, the People’s Republic of China, Mexico, Hong Kong, South Korea, and the Middle East.
For management reporting and control, the businesses are divided into three segments: Electrical, Power and Industrial Technology, as described below. Reference is made to Note 20 — Industry Segments and Geographic Area Information underin the Notes to Consolidated Financial Statements.
The Company’s annual report onForm 10-K, quarterly reports onForm 10-Q, current reports onForm 8-K, and all amendments to those reports are made available free of charge through the Investor Relations section of the Company’s website athttp://www.hubbell.comas soon as practicable after such material is electronically filed with, or furnished to, the SEC.Securities and Exchange Commission (“SEC”).
In June 2006,October 2007, the Company acquired Strongwell Lenoir City,PCORE Electric Company, Inc. (“PCORE”) for $117.4 million in cash. Strongwell Lenoir City, Inc., renamed Hubbell Lenoir City, Inc., manufactures precast polymer concrete products to house underground equipment and also hasapproximately $50 million. PCORE is a lineleading manufacturer of surface drain products.high voltage condenser bushings. These products are sold toused in the electricalelectric utility and telecommunications industries. Hubbell Lenoir City, Inc.infrastructure. PCORE has been included in the Power segment.
In November 2006, the Company purchased all of the outstanding common stock of Austdac Pty Limited (“Austdac”) for $28.1 million, net of $2.3 million of cash acquired. Austdac is based in New South Wales, Australia and manufactures a wide range of products used in harsh and hazardous applications in a variety of industries. Austdac has been added to the Industrial Technology segment.
ELECTRICAL SEGMENT
The Electrical segment (65%, 67% and 71% of consolidated revenues in 2007, 2006 and 2005, respectively) is comprised of businesses that primarily sell through distributors, lighting showrooms, home centers and telephone and telecommunications companies, and represents stock and custom products including standard and special application wiring device products, lighting fixtures and controls, fittings, switches, and outlet boxes, enclosures, wire management products and voice and data signal processing components. The products are typically used in and around industrial, commercial and institutional facilities by electrical contractors, maintenance personnel, electricians, and telecommunications companies. Certain lighting fixtures, wiring devices and electrical products also have residential application.
Electrical Wiring Devices
Hubbell designs, manufactures and sells highly durable and reliable wiring devices which are supplied principally to industrial, commercial, institutional and residential customers.applications. These products comprising several thousand catalog items, include plugs, dimmers, receptacles (including surge suppressor units), wall outlets, connectors, adapters, floor boxes, switches, occupancy sensors (including passive infrared and ultrasonic motion sensing devices), lampholders, control switches, outlet strips, pendants, weatherproof enclosures, and wallplates.Pin-and-sleeve devices built to International Electrotechnical Commission (“IEC”) standards have incorporated improved water and dust-tight construction and impact resistance. Switch and receptacle wall plates feature proprietary thermoplastic materials offering high impact resistance and durability, and are available in a variety of colors and styles. Delivery systems, including metallic and nonmetallic surface raceway systems for power, data and communications distribution, provide efficiency and flexibility in both initial installations and remodeling applications. Hubbell also sells wiring devices for use in certain environments requiring specialized products, such as signal and control connectors and cable assemblies for the connection of sensors in materials processing, modular
2
cable protection systems, cable and devices for marine applications and portable power distribution units with ground fault protection for commercial and industrial applications. Circuit Guard® ground fault units protect the user from electrical shock by interrupting the circuit to which they are connected when a fault to ground is detected. Hubbell manufactures TVSS (transient voltage surge suppression) devices, under the Spikeshield® trademark, which are used to protect electronic equipment such as personal computers and other supersensitive electronic equipment. Hubbell also manufacturesand/or sells components designed for use in local area networks (“LANs”) and other telecommunications applications supporting high-speed data and voice signals. Primary products include work station modular jacks, faceplates, surface housings, modular furniture plates, cross connect patch panels, connectorized cable assemblies, punch down blocks, free standing racks, enclosures and other products used for installation, testing and distribution of LANs. These products support unshielded, shielded and fiber optic media types and typically service commercial, institutional and industrial applications.
Lighting Fixtures and Controls
Hubbell manufactures and sells lighting fixtures for indoor and outdoor applications with four classifications of products: Outdoor, Industrial, Commercial/Institutional, and Residential. Outdoor products include Hubbell outdoor lighting and Sterner® floodlights and poles, Devine® series fixtures, Kim Lighting® architectural fixtures which feature pedestrian zone, path, landscape, building and area lighting products and poles, Securitytm outdoor and signage fixtures, Spauldingtm area lighting fixtures and poles, Architectural Area Lighting flood and step and wall mounted lighting fixtures, sconces, bollards in period and contemporary designs, area lighting fixtures and poles and Whitewaytm canopy light fixtures, which are used to illuminate service stations, truck stops, outdoor display signs, parking lots, roadways, pedestrian areas, security areas, automobile dealerships, shopping centers, convenience stores, quick service restaurants, and similar areas, and Sportsliter® fixtures which are used to illuminate athletic and recreational fields. In addition, a line of Lightscaper® decorative outdoor fixtures is sold for use in landscaping applications such as pools, gardens and walkways. Industrial products include high and low bay fixtures used to illuminate factories, work spaces, and areas with specialty requirements such as paint rooms, clean rooms and warehouses. Commercial/Institutional products include high intensity discharge (“HID”) fixtures, Aleratm architectural and Columbia Lighting® specification grade fluorescent fixtures, Dual-Lite® emergency and exit fixtures, and Prescolite® recessed, surface mounted and track fixtures which are used for offices, schools, hospitals, airports, retail stores, and similar applications. The fixtures use high pressure sodium and metal-halide HID lamps, as well as quartz, fluorescent and incandescent lamps, all of which are purchased from other sources. Hubbell also manufactures a broad range of life safety products, emergency lighting, exit signs and inverter power systems which are used in specialized safety applications under the Dual-Lite® and Corner Stone® life safety trademarks, and a line of IEC lighting fixtures designed for hazardous, hostile and corrosive applications sold under the Chalmittm, Victortm and Killark® trademarks. The residential products, which are sold under the Progress Lighting® and Thomasville Lighting® trademarks, include chandeliers, hall and foyer sconces, track, recessed, bath and vanity, pendants, close to ceiling, under-cabinet, portable lights, fans, door chimes, dimmers, and outdoor and landscape lighting fixtures.
Outlet Boxes, Enclosures and Fittings
Hubbell manufacturesand/or sells: (a) under the Raco® trademark, steel and plastic boxes used at outlets, switch locations and junction points; (b) a broad line of metallic fittings, rigid plastic conduit fittings, EMT (thinwall) fittings and liquid tight conduit fittings; (c) Bell Outdoor® outlet boxes; (d) a variety of electrical boxes, covers, combination devices, lampholders and lever switches manufactured under the Bell® trademark, with an emphasis on weather-resistant products suitable for outdoor applications; and (e) under the Wiegmann® trademark, a full-line of fabricated steel electrical equipment enclosures such as rainproof and dust-tight panels, consoles and cabinets, wireway and electronic enclosures and a line of non-metallic electrical equipment enclosures. Wiegmann® products are designed to enclose and protect electrical conductors, terminations, instruments, power distribution and control equipment.
3
Holding Devices
Hubbell manufactures and sells a line of Kellems® and Bryant® mesh grips used to pull, support and create strain relief in elongated items such as cables, electrical cords, hoses and conduits, a line of Gotcha® cord connectors designed to prevent electrical conductors from pulling away from electrical terminals to which the conductors are attached, and wire management products including a non-metallic liquid-tight flexible conduit for OEM applications. The grips are sold under the Kellems® and Dua-Pull® trademarks and range in size and strength to accommodate differing application needs. These products, which are designed to tighten around the gripped items, are sold to industrial, commercial, utility and microwave and cell phone tower markets.
Hazardous and Hostile Location Application Products
Hubbell’s special application products, which are sold under the Killark® trademark, include weatherproof and hazardous location products suitable for standard, explosion-proof and other hostile area applications, conduit raceway fittings, Disconex® switches, enclosures, HostileLite®lighting fixtures, electrical distribution equipment, standard and custom electrical motor controls, junction boxes, plugs and receptacles. Hubbell also manufactures and sells, under the Hawketm trademark, a line of cable glands and cable connectors, enclosures and breathers for the hazardous area and industrial markets. Hazardous locations are those areas where a potential for explosion and fire exists due to the presence of flammable gasses, fibers, vapors, dust or other easily ignitable materials and include such applications as refineries, petro-chemical plants, grain elevators and material processing areas.
Telecommunications Products
Hubbell designs, manufactures and sells, under the Pulsecom® trademark, voice and data signal processing components primarily used by telephone and telecommunications companies, consisting of channel cards and banks for loop and trunk carriers, racks and cabinets. These products provide a broad range of communications access solutions for use by the telephone and telecommunications industry including: (a) digital loop carrier solutions to multiplex traffic from many users over a single link using existing copper or fiber facilities and providing easier and more cost-effective service to new users, since fewer and smaller cables are required for providing expanded service; and (b) D4 solutions to provide delivery of integrated voice and data services. Customers of these product lines include various telecommunications companies, the Regional Bell Operating Companies (“RBOCs”), independent telephone companies, competitive local exchange carriers, companies with private networks, and internet service providers.
Sales and Distribution of Electrical Segment Products
A majority of Hubbell’s Electrical segment products are stock items and are sold through electrical and industrial distributors, home centers, some retail and hardware outlets, and lighting showrooms. Special application products are sold primarily through wholesale distributors to contractors, industrial customers and original equipment manufacturers. Voice and data signal processing equipment products are represented worldwide through a direct sales organization and by selected independent telecommunications representatives, primarily sold through datacom, electrical and catalogue distribution channels. Telecommunications products are sold primarily by direct sales to customers in the United States and internationally through sales personnel and sales representatives.manufacturers (“OEMs”). Hubbell maintains a sales and marketing organization to assist potential users with the application of certain products to their specific requirements, and with architects, engineers, industrial designers, original equipment manufacturersOEMs and electrical contractors for the design of electrical systems to meet the specific requirements of industrial, institutional, commercial and residential users. Hubbell is also represented by sales agents for its lighting fixtures and controls, electrical wiring devices, boxes, enclosures, and fittings productproducts lines. The sales
Electrical Wiring Devices
Hubbell designs, manufactures and sells wiring devices which are supplied principally to industrial, commercial, institutional and residential customers. These products, comprising several thousand catalog items, include items such as:
| | | | |
• Cable/cord reels | | • Pin & sleeve devices | | • Service poles |
| • Connectors | | • Marine products | | • Surge suppression devices |
| • Floor boxes/poke throughs | | • Mesh grips | | • Switches & dimmers |
| • Ground fault devices | | • Occupancy/vacancy sensors | | • Switched enclosures |
2
These products, sold under the Hubbell®, Kellems®, Bryant®, Gotcha® Dua-Pull®, and Circuit Guard® trademarks, are sold to industrial, commercial, utility and residential markets. Hubbell also manufactures TVSS (transient voltage surge suppression) devices, under the Spikeshield® trademark, which are designed to protect electronic equipment such as personal computers and other supersensitive electronic equipment.
Hubbell also manufacturesand/or sells components designed for use in local and wide area networks and other telecommunications applications supporting high-speed data and voice signals.
Outlet Boxes, Enclosures and Fittings
Hubbell manufacturesand/or sells outlet boxes, enclosures and fittings under the following trademarks:
| | |
| • | Raco®- steel and plastic boxes, covers, metallic and nonmetallic electrical fittings and floor boxes |
|
| • | Bell®- outlet boxes, a wide variety of electrical boxes, covers, combination devices, lampholders and lever switches with an emphasis on weather-resistant types suitable for outdoor applications |
|
| • | Wiegmann®- a full-line of fabricated steel electrical equipment enclosures such as rainproof and dust-tight panels, consoles and cabinets, wireway and electronic enclosures and a line of non-metallic electrical equipment enclosures |
Lighting Fixtures and Controls
Hubbell manufactures and sells lighting fixtures and controls for indoor and outdoor applications within three categories: Commercial/Institutional and Industrial Outdoor, Commercial/Institutional and Industrial Indoor, and Residential.
Commercial/Institutional and Industrial Outdoor products are sold under a number of brand names and trademarks, including Sterner®, Devine®, Kim Lighting®, Securitytm, Spauldingtm, Whitewaytm, Sportsliter®, Architectural Area Lighting, Hubbell Outdoor Lighting and Lightscaper® and include:
| | |
• Bollards
• Canopy light fixtures
• Decorative landscaping fixtures
• Fixtures used to illuminate athletic and recreational fields
• Floodlights and poles
| | • Inverter power systems
• Pedestrian zone, path/egress, landscape, building and area lighting fixtures and poles
• Series fixtures
• Signage fixtures
• Flood/step/wall mounted lighting |
Commercial/Institutional and Industrial Indoor products are sold under the Aleratm, Columbia Lighting®, Prescolite®, Dual-Lite®, Hubbell Industrial Lighting, Chalmittm, Victortm and Killark® trademarks and include:
| | |
• Architectural and specification and commercial grade fluorescent fixtures
• Emergency lighting/exit signs
• Fluorescent high bay fixtures
• High intensity discharge high bay and low bay fixtures | | • International Electrotechnical Commission lighting fixtures designed for hazardous, hostile corrosive applications
• Inverter power systems
• Recessed, surface mounted and track fixtures
• Specification grade light-emitting diodes (“LED”) fixtures |
3
Residential products, sold under the Progress Lighting® trademark, include:
| | |
| | |
• Bath/vanity fixtures and fans
• Ceiling fans
• Chandeliers, sconces, directionals
• Close to ceiling fixtures
• Dimmers and door chimes | | • Linear fluorescent
• Outdoor and landscape fixtures
• Residential LED fixtures
• Track and recessed lighting
• Under-cabinet lighting |
Products for Harsh and Hazardous Locations
Hubbell’s special application products are intended to protect the electrical system from the environmentand/or the environment from the electrical system. Harsh and hazardous locations are those areas (as defined and classified by the National Electrical SegmentCode and other relevant standards) where a potential for fire and explosion exists due to the presence of flammable gasses, vapors, combustible dust and fibers. Such classified areas are typically found in refineries, offshore oil and gas platforms, petro-chemical plants, pipelines, dispensing facilities, grain elevators and related processing areas. These products accounted for approximately 67%are sold under a number of Hubbell’s revenue in 2006brand names and 71% in 2005trademarks, such as Killark®, Disconex®, HostileLite® and 74% in 2004.Hawketm and include:
| | |
• Cable connectors, glands and fittings
• Conduit raceway fittings
• Electrical distribution equipment
• Electrical motor controls | | • Enclosures
• Junction boxes, plugs, receptacles
• Lighting fixtures
• Switches |
Telecommunications Products
Hubbell designs, manufactures and sells products that provide a broad range of communications access solutions. These products are sold primarily to telephone and telecommunications companies, local exchange carriers, companies with private networks and internet service providers. Sold under the Pulsecom® trademark, these products include: voice and data signal processing, channel cards, telephone/data connectors, patch cords, and a variety of high speed fiber optic interconnect components.
POWER SEGMENT
The Power segment (25%, 24% and 22% of consolidated revenues in 2007, 2006 and 2005, respectively) consists of operations that design and manufacture a wide varietyvarious transmission, distribution, substation and telecommunications products used by the utility industry. In addition, certain of construction, switching and protectionthese products hot line tools, grounding equipment, cover ups, fittings and fasteners, cable accessories, insulators, arresters, cutouts, sectionalizers, connectors and compression tools for the building and maintenance of overhead
4
and underground power and telephone lines, as well as applications in the industrial, construction and pipeline industries.
Electrical Transmission and Distribution Products
Hubbell manufactures and sells, under the Ohio Brass® registered trademark, a complete line of polymer insulators and high-voltage surge arresters used in the construction of electrical transmission and distribution lines and substations. The primary focus in this product area are the Hi*Lite®, Hi*Lite®XL and Veri*Litetm polymer insulator lines and the polymer housed metal-oxide varistor surge arrester lines. Electrical transmission products and post insulators are used in the expansioncivil construction and upgrading of electrical transmission capability.
Hubbell manufactures and sells, under the Chance® trademark, products used in the electrical transmission and distribution and telecommunications industries, including overhead and underground electrical apparatus such as (a) distribution switches (to control and route the flow of power through electrical lines); (b) cutouts, sectionalizers, and fuses (to protect against faults and over-current conditions on power distribution systems); and (c) fiberglass insulation systems (pole framing and conductor insulation).
Hubbell manufactures and sells, under the Anderson® trademark, electrical connectors and associated hardware including pole line, line and tower hardware, compression crimping tools and accessories, mechanical and compression connectors, suspension clamps, terminals, supports, couplers, and tees for utility distribution and transmission systems, substations, and utility industry.
Hubbell manufactures and sells, under the Fargo® trademark, electrical power distribution and transmission products, principally for the utility industry. Distribution products include electrical connectors, automatic line splices, dead ends, hot line taps, wildlife protectors, and various associated products. Transmission products include splices, sleeves, connectors, dead ends, spacers and dampers.transportation industries. Products also consist of original equipment and resale products including substation fittings for cable, tube and bus as well as underground enclosures, wrenches, hydraulic pumps and presses, and coatings.
Hubbell manufactures and sells, under the Hubbell® trademark, cable accessories including loadbreak switching technology, deadbreak products, surge protection, cable splicing and cable termination products, as well as automation-ready overhead switches and aluminum transformer equipment mounts for transformers and equipment.
Hubbell manufactures and sells under the Quazite® brand name a complete line of polymer concrete in-ground enclosures, equipment pads, and special drain products that are sold to the electric utility, telecommunications industry, and a variety of other industries.
Construction Materials/Tools
Hubbell manufactures and sells, under the Chance® trademark, (a) line construction materials including power-installed foundation systems and earth anchors to secure overhead power and communications line poles, guyed and self-supporting towers, streetlight poles and pipelines (helical pier foundation systems are used to support homes and buildings, and earth anchors are used in a variety of farm, home and construction projects including tie-back applications) (b) pole line hardware, including galvanized steel fixtures and extruded plastic materials used in overhead and underground line construction, connectors, fasteners, pole and crossarm accessories, insulator pins, mounting brackets and related components, and other accessories for making high voltage connections and linkages; (c) construction tools and accessories for building overhead and underground power and telephone lines; and (d) hot-line tools (all types of tools mounted on insulated poles used to construct and maintain energized high voltage lines) and other safety equipment. Hubbell also manufactures and sells, under the Atlas Systems, Inc.® trademark, helical and resistance piering products used in a variety of civil engineering applications.
Sales and Distribution of Power Segment Products
Sales of Power segment products are made through a Hubbell sales and marketing organization to distributors and directly to users such as electric utilities, mining operations, industrial firms, construction and engineering and construction
5
firms. While Hubbell believes its sales in this area are not materially dependent upon any customer or group of customers, a decrease in purchases by public utilities does affect this category. The sale
4
Electrical Transmission and Distribution Products
Hubbell manufactures and sells a wide variety of Power Segmentelectrical transmission and distribution products. These products accounted for approximately 24%are sold under a number of Hubbell’s total revenue in 2006brand names and 22% in 2005trademarks, such as Ohio Brass®, Chance®, Anderson®, Fargo®, Hubbell®, Polycast®, Quazite®, and 19% in 2004.PCORE® and include:
| | |
• Aluminum transformer equipment mounts
• Arresters
• Automatic line splices
• Cable elbow terminations and accessories
• High voltage condenser bushings
• Hot line taps
• Insulators | | • Mechanical and compression electrical connectors and tools
• Pole line and tower hardware
• Polymer concrete in-ground enclosures, equipment pads and special drain products
• Specialized insulated hot line tools
• Switches, cutouts and sectionalizers |
Construction Materials
Hubbell also manufactures and sells under the Chance® trademark products that include:
| | |
| • | Line construction materials including power-installed foundation systems and earth anchors to secure overhead power and communications line poles, guyed and self-supporting towers, streetlight poles and pipelines. Additionally, helical pier foundation systems are used to support homes and buildings, and earth anchors are used in a variety of farm, home and construction projects including tie-back applications. |
|
| • | Pole line hardware, including galvanized steel fixtures and extruded plastic materials used in overhead and underground line construction, connectors, fasteners, pole and cross arm accessories, insulator pins, mounting brackets and related components, and other accessories for making high voltage connections and linkages. |
|
| • | Construction tools and accessories for building overhead and underground power and telephone lines. |
Hubbell also manufactures and sells helical and resistance piering products under the Atlas Systems, Inc® trademark.
INDUSTRIAL TECHNOLOGY SEGMENT
The Industrial Technology segment (10%, 9% and 7% of consolidated revenues in 2007, 2006 and 2005, respectively) consists of operations that design and manufacture a variety of high voltage test and measurement equipment, high voltage power supplies and variable transformers, industrial controls including motor speed controls, pendant-type push-button stations, overhead crane controls, control and pressure switches, DC devices, Gleason Reel® electric cable and hose reels, and specialized communications systems such as intra-facility communications systems, telephone systems,used in the commercial, industrial and land mobile radio peripherals. telecommunications markets. These products are primarily found in the oil and gas (onshore and offshore), mining, manufacturing and transportation industries.
Products are sold primarily through direct sales and sales representatives to steel mills,contractors, industrial complexes, oil, gascustomers and petrochemical industries, seaports, transportation authorities,OEMs throughout the security industry (mallsworld, with the exception of high voltage test and colleges), cablemeasurement equipment, which is sold primarily by direct sales to customers through its sales engineers and electronic equipment manufacturers, and mining industry.independent sales representatives throughout the world.
High Voltage Test and Measurement Equipment
Hubbell manufactures and sells, under the Hipotronics®, Haefely Testtm and Tettex® trademarks, a broad line of high voltage test and measurement systems to test materials and equipment used in the generation, transmission and distribution of electricity, and high voltage power supplies and electromagnetic compliance equipment for use in the electrical and electronic industries. Principal products include AC/DC hipot testers and megohmmeters, cable fault location systems, oil testers and DC hipots, impulse generators, digital measurement systems and tan-delta bridges, AC series resonant and corona detection systems, DC test sets and power supplies, variable transformers, voltage regulators, and motor and transformer test sets.
5
Industrial Controls and Communication Systems
Hubbell manufactures and sells a variety of heavy-duty electrical and radio control products which have broad application in the control of industrial equipment and processes. These products range from standard and specialized industrial control components to combinations of components that control industrial manufacturing processes. Standard products include motor speed controls, pendant-type push-button stations, pressure switches (used in air compressor and water pump systems), DC devices (used in locomotive and heavy industrial control systems), power and grounding resistors and overhead crane controls. Also manufactured and sold are a line of transfer switches used to direct electrical supply from alternate sources, and a line of fire pump control products used in fire control systems.
Hubbell manufactures, underUnder the Gleason Reel® trademark, Hubbell manufactures industrial-quality cable management products including a full line of electric cable and hose reels protective steel and nylon cable tracks (cableergonomic workstation solutions.
Harsh and hose carriers), cable festooning hardware, highly engineered container crane reels and festoons for the international market, slip rings, and a line of ergonomic tool support systems (workstation accessories and components such as balancers, retractors, torque reels, tool supports, boom and jib kits).Hazardous Equipment
Hubbell manufactures and sells under the GAI-Tronics® trademark, specialized communications systems designed to withstand indoorrugged, arduous, vandal-resistant, and outdoor hazardous environments. ProductsSold under the brands and trademarks GAI-Tronics®, FEMCO®, DAC® and Elemectm, products include intra-facility communicationcommunications and public address systems, telephone systems and land mobile radio peripherals. These products are sold to oil, gas and petrochemical industries, transportation authorities (for use on public highways and in trains and on train platforms), and the security industry (for use in malls and on college campuses).
Hubbell manufacturesOther products manufactured and sellssold for use primarily in the mining industry under the trademark Austdac name a line of harshtm include material handling, conveyer control and hazardous application products including communication systems, gas monitoring equipment, intrinsically safe lightinggas detection equipment, emergency warning lights and conveyer control equipment. Austdac distributes to various industries, but primarily to the coal mining industries.
Sales and Distribution of Industrial Technology Segment Products
Hubbell’s Industrial Technology segment products are sold primarily through direct sales and sales representatives to contractors, industrial customers and original equipment manufacturers, with the exception of high
6
voltage test and measurement equipment which is sold primarily by direct sales to customers in the United States and in foreign countries through its sales engineers and independent sales representatives.
The sale of products in the Industrial Technology Segment accounted for approximately 9% of Hubbell’s total revenue in 2006, and 7% in 2005 and 2004.sounders.
INFORMATION APPLICABLE TO ALL GENERAL CATEGORIES
International Operations
The Company has several operations located outside of the United States. These operations manufactureand/or market Hubbell products in the following countries and service the following segments:
Chalmit Lighting and Hawke International are located in the United Kingdom. Hubbell Limited manufacturesKingdom (“UK”). These operations manufactureand/or markets fuse switches, contactors, selected wiring devicesell products within the Electrical segment.
GAI-Tronics and premise wiring products, industrial control products usedGAI-Tronics S.r.l., located in motor control applications such as fuse switchesthe UK and contactors. Chalmit Lighting manufacturesItaly respectively, manufactureand/or markets lighting fixtures designed for hazardous, hostile and corrosive applications. Hawke Cable Glands (“Hawke”) manufacturesand/or markets a range of products used in hazardous locations including brass cable glands and cable connectors used in watertight terminations, cable transition devices, utility transformer breathers and enclosures. GAI-Tronics manufacturesand/or marketsmarket specialized communication systems designed to withstand indoorharsh and outdoor hazardous environments. These products are sold within the Industrial Technology segment.
Hubbell Canada LP and Hubbell de Mexico, S.A. de C.V. market and sell wiring devices, premise wiringa variety of products lighting fixtures and controls, grips, fittings, switches and outlet boxes, hazardous location products, electrical transmission and distribution products and earth anchoring systems. Industrial control products are sold in Canada through an independent sales agent.across most of the business segments. Hubbell Canada LP also designs and manufactures electrical outlet boxes, metallic wall plates and related accessories.
Hawke Asia Pacific, Pte. Ltd. in Singapore markets wiring devices, lighting fixtures, hazardous location products and electrical transmission and distribution products.within the Electrical segment.
Haefely Test, AG in Switzerland designs and manufactures high voltage test and instrumentation systems and GAI-Tronics S.r.l. in Italy designs and manufactures specialized communications systems.within the Industrial Technology segment.
In Brazil, Hubbell manufactures, markets and sells under the Delmar®tm trademark products used in the electric utility transmission and distribution industries, including cutouts, fuselinks, arresters and overhead and substation switches.industries. These products are manufactured at the Company’s facility in Tatui, Brazil, for salesold primarily in Latin America.America and are included in the Power segment.
Austdac Pty. Limited, based in Australia, manufactures a variety of products used in harsh and hazardous applications including material handling, conveyerconveyor control and monitoring equipment, gas detection equipment, voice communications systems and emergency warning lights and sounders. Austdac Pty Limited is based in New South Wales, Australia.distributes to various industries, but primarily to the coal mining industry. These products are sold within the Industrial Technology segment.
Hubbell also manufactures lighting products, weatherproof outlet boxes and fittings, and power products in its factories in Juarez and Tijuana, Mexico.
As a percentage of total sales, international shipments from foreign subsidiariesoperations directly to third parties were 14% in 2007, 13% in 2006 and 11% in 2005 and 10% in 2004 with the Canadian and United Kingdom markets representing
6
approximately 38%27% and 32%36%, respectively, of the 20062007 total. See also Note 20-Industry Segments and Geographic Area Information within the Notes to Consolidated Financial Statements.
Raw Materials
Raw materials used in the manufacture of Hubbell products primarily include steel, brass, copper, aluminum, bronze, plastics, phenolics, zinc, nickel, elastomers and petrochemicals. Hubbell also purchases certain electrical and electronic components, including solenoids, lighting ballasts, printed circuit boards, integrated circuit chips and cord sets, from a number of suppliers. Hubbell is not materially dependent upon any one supplier for raw materials used in the manufacture of its products and equipment, and at the present time, raw materials and components essential to its operation are in adequate supply. However, certain of these principal raw materials are sourced from a limited number of suppliers. Also see Item 7A. Quantitative and Qualitative Disclosures about Market Risk.
7
Patents
Hubbell has approximately 1,200 active United States and foreign patents covering many of its products, which expire at various times. While Hubbell deems these patents to be of value, it does not consider its business to be dependent upon patent protection. Hubbell licenses under patents owned by others, as may be needed, and grants licenses under certain of its patents.
Working Capital
Inventory, accounts receivable and accounts payable levels, payment terms and, where applicable, return policies are in accordance with the general practices of the electrical products industry and standard business procedures. See also Item 7,7. Management’s Discussion and Analysis of Financial Condition and Results of Operations.
Backlog
Backlog of orders believed to be firm at December 31, 2006 were2007 was approximately $211.3$246.4 million compared to $174.0$211.3 million at December 31, 2005.2006. The increase in the backlog in 20062007 is attributable to increased order levels in the PowerElectrical and Industrial Technology segments.segments and the backlog associated with PCORE, acquired in 2007. A majority of the backlog is expected to be shipped in the current year. Although this backlog is important, the majority of Hubbell’s revenues result from sales of inventoried products or products that have short periods of manufacture.
Competition
Hubbell experiences substantial competition in all categories of its business, but does not compete with the same companies in all of its product categories. The number and size of competitors vary considerably depending on the product line. Hubbell cannot specify with precision the number of competitors in each product category or their relative market position. However, some of its competitors are larger companies with substantial financial and other resources. Hubbell considers product performance, reliability, quality and technological innovation as important factors relevant to all areas of its business, and considers its reputation as a manufacturer of quality products to be an important factor in its business. In addition, product price, service levels and other factors can affect Hubbell’s ability to compete.
Research, Development & Engineering
Research, development and engineering expenditures represent costs incurred in the experimental or laboratory sense aimed at discoveryand/or application of new knowledge in developing a new product or process, or in bringing about a significant improvement in an existing product or process. Research, development and engineering expenses are recorded as a component of Cost of goods sold. Expenses for research, development and engineering were less than 1% of Cost of goods sold for each of the years 2004, 2005, 2006 and 2006.2007.
7
Environment
The Company is subject to various federal, state and local government requirements relating to the protection of employee health and safety and the environment. The Company believes that, as a general matter, its policies, practices and procedures are properly designed to prevent unreasonable risk of environmental damage and personal injury to its employees and its customers’ employees of our customers and that the handling, manufacture, use and disposal of hazardous or toxic substances are in accord with environmental laws and regulations.
Like other companies engaged in similar businesses, the Company has incurred or acquired through business combination remedial response and voluntary cleanup costs for site contamination and is a party to product liability and other lawsuits and claims associated with environmental matters, including past production of product containing toxic substances. Additional lawsuits, claims and costs involving environmental matters are likely to continue to arise in the future. However, considering past experience, insurance coverage and reserves, the Company does not anticipate that these matters will have a material impact on earnings, capital expenditures, or competitive position. See also Note 15 — Commitments and Contingencies in the Notes to Consolidated Financial Statements.
8
Employees
As of December 31, 2006,2007, Hubbell had approximately 12,00011,500 salaried and hourly employees of which approximately 8,0007,500 of these employees or 67%65% are located in the United States. Approximately 3,5002,900 of these U.S. employees are represented by nineteen labor unions. Hubbell considers its labor relations to be satisfactory.
Our business, operating results, financial condition, and cash flows may be impacted by a number of factors including, but not limited to those set forth below. Any one of these factors could cause our actual results to vary materially from recent results or future anticipated results. See also Item 7. Management’s Discussion and Analysis — “Executive Overview of the Business”, “Outlook”, and “Results of Operations”.
We operate in markets that are subject to competitive pressures that could affect selling prices or demand for our products.
We compete on the basis of product performance, quality, serviceand/or price. Our competitive strategy is to design and manufacture high quality products at the lowest possible cost. Our competitors include companies that have greater sales and financial resources than our Company. Competition could affect future selling prices or demand for our products.
Lower levels of economic activity in our end markets could adversely affect our operating results.
Our businesses operate in several market segments including commercial, industrial, residential, utility and telecommunications. Operating results can be negatively impacted by volatility in these markets. Future downturns in any of the markets we serve could also adversely affect our overall sales and profitability.
We source products and product materials from various suppliers located in countries throughout the world. A disruption in the availability, price, or pricequality of these products could impact our operating results.
We use a variety of raw materials in the production of our products including steel, brass, copper, aluminum, bronze, zinc, nickel and plastics. We have multiple sources of supply for these products and are not dependent on any single supplier. However, significant shortages of these materials or price increases could increase our operating costs and adversely impact the competitive positions of our products which would directly impact our results of operations.
We continue to increase the amount of product materials, components and finished goods which are sourced from low cost countries including Mexico, China, and other countries in Asia. A political disruption or significant changes related to transportation from one of these countries could affect the availability of these materials and components which would directly impact our results of operations.
8
We rely on our suppliers in low cost countries to produce high quality materials, components and finished goods according to our specifications. Although we have quality control procedures in place, there is a risk that products may not meet our specifications which could impact the ability to ship high quality products to our customers on a timely basis and this could adversely impact our results of operations.
We engage in acquisitions and strategic investments and may encounter difficulty in obtaining appropriate acquisitions and in integrating these businesses.
We have pursued and will continue to seek potential acquisitions and other strategic investments to complement and expand our existing businesses within our core markets. In 2006 we completed two acquisitions.The rate and extent to which appropriate acquisitions become available may impact our growth rate. The success of these transactions will depend on our ability to integrate these businesses into our operations. We may encounter difficulties in integrating acquisitions into our operations and in managing strategic investments. Therefore, we may not realize the degree or timing of the benefits anticipated when we first enter into a transaction.
Our operating results may be impacted by actions related to our lighting integration and rationalization program.
We continue to execute a multi-year program to integrate and rationalize our lighting businesses through facility consolidations, workforce reductions and product rationalizations. These activities consist of complex relocations of critical personnel and machinery and equipment, as well as hiring and training of new personnel and, in some cases, expansion or other modification to facilities. All of these activities are thoroughly planned and under the direction of experienced management personnel. However, the actions are occurring simultaneous with normal
9
business operations and other initiatives. Therefore, there is a risk that (1) we may not complete the activities on a timely basis and incur duplicate or higher costs, (2) we may lose essential personnel and knowledge in transition and have to reestablish processes and procedures, and (3) our normal operations could be disrupted and interfere with our ability to manufacture and ship our products to satisfy the demands of our customers.
Our operating results may be impacted by actions related to our enterprise-wide business system initiative.
We have substantially completed theOur implementation of SAP software throughout most of our domestic businesses. This activity involvedbusinesses is substantially complete. We continue to work on standardization of business processes and better utilization and understanding of the migration of multiple legacy systems and users to a common SAP information platform. Throughout this process, we changed the way we conduct business and employees’ roles in processing and utilizing information. In addition, certain interfaces with our customers and suppliers have been impacted which resulted in changes to the tools we use to take orders, procure material, schedule production, remit billings, make payments and perform other business functions.system. Based upon the complexity of this initiative,system, there is risk that (1) we will continue to incur additional costs to continue to enhance the system, and perform process reengineering and (2) the use of the new systemperform future implementations at our remaining businesses. Any future reengineering or future implementations could result in operating inefficiencies which could impact our operating results or our ability to perform necessary business transactions. All of theseThese risks could adversely impact our operating results.
A deterioration in the credit quality of our customers could have a material adverse effect on our operating results and financial condition.
We have an extensive customer base of distributors and wholesalers, electric utilities, OEMs, electrical contractors, telecommunications companies, and retail and hardware outlets. We are not dependent on a single customer, however, our top 10 customers account for approximately 30% of our total accounts receivable. A deterioration in credit quality of several major customers could adversely affect our results of operations, financial condition and cash flows.
We are subject to litigation and environmental regulations that may adversely impact our operating results.
We are, and may in the future be, a party to a number of legal proceedings and claims, including those involving product liability and environmental matters, which could be significant. Given the inherent uncertainty of litigation, we can offer no assurance that a future adverse development related to existing litigation or any future litigation will not have a material adverse impact. We are also subject to various laws and regulations relating to environmental protection and the discharge of materials into the environment, and we could incur substantial costs as a result of the noncompliance with or liability for clean up or other costs or damages under environmental laws.
| |
| Item 1B. | Unresolved Staff Comments |
None
109
Hubbell’s manufacturing and warehousing facilities, classified by segment, are located in the following areas. The Company believes its manufacturing and warehousing facilities are adequate to carry on its business activities.
| | | | | | | | | | | | | | | | | | | | | | | | | | | | | | | | | | | | | |
| | | | | | | Total Approximate Floor
| | | | | | | Total Approximate Floor
| |
| | | | | Number of Facilities | | Area in Square Feet | | | | | Number of Facilities | | Area in Square Feet | |
Segment | | Location | | Warehouses | | Manufacturing | | Owned | | Leased | | | Location | | Warehouses | | Manufacturing | | Owned | | Leased | |
| |
| Electrical segment | | Arkansas | | | 1 | | | | 1 | | | | 80,500 | | | | — | | | Arkansas | | | 1 | | | | 1 | | | | 73,100 | | | | — | |
| | | California | | | 2 | | | | 4 | | | | 96,000 | | | | 570,000 | | |
| | | Canada | | | 1 | | | | 1 | | | | 178,700 | | | | — | | | California | | | 2 | | | | 4 | | | | 96,000 | | | | 570,000 | |
| | | Connecticut | | | | | | | 1 | | | | 144,500 | | | | — | | | Canada | | | 1 | | | | 1 | | | | 178,700 | | | | — | |
| | | Georgia | | | | | | | 1 | | | | 57,100 | | | | — | | | Connecticut | | | | | | | 1 | | | | 144,500 | | | | — | |
| | | Illinois | | | 3 | | | | 2 | | | | 255,000 | | | | 366,600 | | | Georgia | | | | | | | 1 | | | | 57,100 | | | | — | |
| | | Indiana | | | | | | | 1 | | | | 314,800 | | | | — | | | Illinois | | | 3 | | | | 2 | | | | 255,000 | | | | 366,600 | |
| | | Mexico | | | 1 | | | | 2 | | | | 547,300 | (1) | | | 35,000 | | | Indiana | | | | | | | 1 | | | | 314,800 | | | | — | |
| | | Missouri | | | 1 | | | | 1 | | | | 154,500 | | | | 44,000 | | | Mexico | | | 1 | | | | 2 | | | | 542,300 | (1) | | | 43,300 | |
| | | North Carolina | | | 1 | | | | | | | | 424,800 | | | | — | | | Missouri | | | 1 | | | | 1 | | | | 150,100 | | | | 44,000 | |
| | | Ohio | | | | | | | 1 | | | | 278,200 | | | | — | | | North Carolina | | | 1 | | | | | | | | 424,800 | | | | — | |
| | | Pennsylvania | | | 1 | | | | 1 | | | | 410,000 | | | | 135,000 | | | Pennsylvania | | | 1 | | | | 1 | | | | 410,000 | | | | 135,000 | |
| | | Puerto Rico | | | | | | | 2 | | | | 162,400 | | | | 34,400 | | | Puerto Rico | | | | | | | 2 | | | | 162,400 | | | | 34,400 | |
| | | South Carolina | | | 3 | | | | | | | | 327,200 | | | | 314,500 | | | South Carolina | | | 3 | | | | | | | | 327,200 | | | | 146,000 | |
| | | Singapore | | | 1 | | | | | | | | — | | | | 6,700 | | | Singapore | | | 1 | | | | | | | | — | | | | 6,700 | |
| | | Texas | | | 2 | | | | 1 | | | | 81,200 | | | | 26,000 | | | Texas | | | 2 | | | | 1 | | | | 81,200 | | | | 26,000 | |
| | | United Kingdom | | | | | | | 2 | | | | 133,600 | | | | — | | | United Kingdom | | | | | | | 2 | | | | 133,600 | | | | — | |
| | | Virginia | | | | | | | 2 | | | | 328,000 | | | | 78,200 | | | Virginia | | | | | | | 2 | | | | 328,000 | | | | 78,200 | |
| | | Washington | | | | | | | 1 | | | | — | | | | 284,100 | | | Washington | | | | | | | 1 | | | | — | | | | 284,100 | |
| Power segment | | Alabama | | | | | | | 2 | | | | 288,000 | | | | — | | | Alabama | | | | | | | 2 | | | | 288,000 | | | | — | |
| | | Brazil | | | | | | | 1 | | | | 110,000 | | | | — | | | Brazil | | | | | | | 1 | | | | 103,000 | | | | — | |
| | | California | | | | | | | 1 | | | | 75,000 | | | | — | | | California | | | | | | | 1 | | | | 77,600 | | | | — | |
| | | Mexico | | | | | | | 1 | | | | 170,700 | (1) | | | — | | | Mexico | | | | | | | 1 | | | | 175,700 | (1) | | | — | |
| | | Missouri | | | 1 | | | | 2 | | | | 1,071,600 | | | | 46,400 | | | Missouri | | | 1 | | | | 2 | | | | 1,071,600 | | | | 46,400 | |
| | | Ohio | | | | | | | 1 | | | | 89,000 | | | | — | | | New York | | | | | | | 1 | | | | — | | | | 94,700 | |
| | | South Carolina | | | | | | | 1 | | | | 360,000 | | | | — | | | Ohio | | | | | | | 1 | | | | 89,000 | | | | — | |
| | | Tennessee | | | | | | | 2 | | | | 152,100 | | | | — | | | South Carolina | | | | | | | 1 | | | | 360,000 | | | | — | |
| | | | Tennessee | | | | | | | 2 | | | | 166,900 | | | | — | |
| Industrial Technology segment | | Australia | | | | | | | 3 | | | | — | | | | 35,100 | | | Australia | | | | | | | 3 | | | | — | | | | 34,100 | |
| | | Italy | | | | | | | 1 | | | | — | | | | 8,100 | | | Italy | | | | | | | 1 | | | | — | | | | 8,200 | |
| | | New York | | | | | | | 1 | | | | 92,200 | | | | — | | | New York | | | | | | | 1 | | | | 92,200 | | | | — | |
| | | North Carolina | | | | | | | 1 | | | | — | | | | 80,800 | | | North Carolina | | | 1 | | | | 1 | | | | — | | | | 90,500 | |
| | | Pennsylvania | | | | | | | 1 | | | | — | | | | 105,000 | | | Pennsylvania | | | | | | | 1 | | | | — | | | | 105,000 | |
| | | Switzerland | | | | | | | 1 | | | | — | | | | 73,800 | | | Switzerland | | | | | | | 1 | | | | — | | | | 73,800 | |
| | | United Kingdom | | | | | | | 1 | | | | — | | | | 40,000 | | | United Kingdom | | | | | | | 1 | | | | — | | | | 40,000 | |
| | | Wisconsin | | | | | | | 2 | | | | 74,200 | | | | 22,500 | | | Wisconsin | | | | | | | 2 | | | | 73,000 | | | | 28,900 | |
| | |
| (1) | | Shared between Electrical and Power segments. |
1110
| |
| Item 3. | Legal Proceedings |
As described in Note 15 — Commitments and Contingencies in the Notes to Consolidated Financial Statements, the Company is involved in various legal proceedings, including workers’ compensation, product liability and environmental matters, including, for each, past production of product containing toxic substances, which have arisen in the normal course of its operations and with respect to which the Company is self-insured for certain incidents at various amounts. Management believes, considering its past experience, insurance coverage and reserves, that the final outcome of such matters will not have a material adverse effect on the Company’s consolidated financial position, results of operations or cash flows.
| |
| Item 4. | Submission of Matters to a Vote of Security Holders |
No matters were submitted to a vote of security holders during the fourth quarter of 2006.2007.
Executive Officers of the Registrant
| | | | | | | | | |
Name. | | Age(1) | | Present Position | | Business Experience |
| |
| Timothy H. Powers | | | 5859 | | | Chairman of the
Board, President
and Chief
Executive Officer | | Chairman of the Board since September 15, 2004; President and Chief Executive Officer since July 1, 2001; Senior Vice President and Chief Financial Officer September 21, 1998 to June 30, 2001; previously Executive Vice President, Finance & Business Development, Americas Region, Asea Brown Boveri. |
| | | | | | | | | |
| | | | | | | | | |
| | | | | | | | | |
| David G. Nord | | | 4950 | | | Senior Vice
President and
Chief Financial
Officer | | Present position since September 19, 2005; previously Chief Financial Officer of Hamilton Sundstrand Corporation, a United Technologies company, from April 2003 to September 2005, and Vice President, Controller of United Technologies Corporation from October 2000 to March 2003. |
| | | | | | | | | |
| | | | | | | | | |
| | | | | | | | | |
| Richard W. Davies | | | 6061 | | | Vice President,
General Counsel and
and Secretary | | Present position since January 1, 1996; General Counsel since 1987; Secretary since 1982; Assistant Secretary 1980-1982; Assistant General Counsel 1974-1987.1974 - 1987. |
| | | | | | | | | |
| | | | | | | | | |
| | | | | | | | | |
| James H. Biggart, Jr | | | 5455 | | | Vice President and
Treasurer | | Present position since January 1, 1996; Treasurer since 1987; Assistant Treasurer 1986-1987;1986 - 1987; Director of Taxes 1984-1986.1984 - 1986. |
| | | | | | | | | |
| | | | | | | | | |
| | | | | | | | | |
Gregory F. CovinoDarrin S. Wegman | | | 4140 | | | Vice President,
Controller (2) | | Vice President since December 6, 2005; Interim Chief Financial Officer from November 5,and Controller of Hubbell Industrial Technology/Hubbell Electrical Products March 2004 to September 19, 2005; Corporate- February 2008; Vice President and Controller since June 6, 2002; Director, Corporate Accounting 1999-2002; previously Assistantof Hubbell Industrial Technology March 2002 - March 2004; Controller Otis Elevator Company, a subsidiary of United Technologies Corp.GAI-Tronics Corporation July 2000 - February 2002. |
1211
| | | | | | | | | |
Name. | | Age(1) | | Present Position | | Business Experience |
| |
| Jacqueline Donnelly | | | 42 | | | Corporate Assistant
Controller and Chief
Accounting Officer (3) | | Corporate Assistant Controller since July 2002. |
| | | | | | | | |
| | | | | | | | |
| | | | | | | | | |
| W. Robert Murphy | | | 58 | | | Executive Vice
President, Marketing
and Sales | | Present position since October 1, 2007; Senior Group Vice President 2001-2007; Group Vice President 2000-2001; Senior Vice President Marketing and Sales (Wiring Systems) 1985-1999; and various sales positions (Wiring Systems) 1975-1985. |
| | | | | | | | |
| | | | | | | | |
| | | | | | | | | |
| Scott H. Muse | | | 4950 | | | Group Vice President
President(Lighting) | | Present position since April 27, 2002 (elected as an officer of the Company on December 3, 2002); previously President and Chief Executive Officer of Lighting Corporation of America, Inc. (‘(“LCA”) 1998-2002,2000-2002, and President of Progress Lighting, Inc.1993-1998. 1993-2000. |
| | | | | | | | | |
| | | | | | | | | |
| | | | | | | | |
W. Robert Murphy | | | 57 | | | Senior Group Vice
President | | Present position since May 7, 2001; Group Vice President 2000-2001; Senior Vice President Marketing and Sales (Wiring Systems) 1985-1999; and various sales positions (Wiring Systems) 1975-1985. |
| | | | | | | | |
| | | | | | | | |
| | | | | | | | | |
| Thomas P. Smith | | | 4748 | | | Group Vice President
President(Power Systems) | | Present position since May 7, 2001; Vice President, Marketing and Sales (Power Systems) 1998-2001; Vice President Sales, 1991-1998 of various Company operations. |
| | | | | | | | | |
| | | | | | | | |
| | | | | | | | | |
| William T. Tolley | | | 50 | | | Group Vice President
(Wiring Systems) | | Present position since October 1, 2007; Senior Vice President of Operations and Administration (Wiring Systems) October 2005 - October 2007; Director of Special Projects April 2005 - October 2005; administrative leave November 2004 - April 2005; Senior Vice President and Chief Financial Officer February 2002 - November 2004. |
| | | | | | | | |
| | | | | | | | |
| | | | | | | | | |
| Gary N. Amato | | | 5556 | | | Group Vice President
President(Electrical Products and Industrial Technology) | | Present position since October 2006; Vice President October 1997-September 2006; Vice President and General Manager of the Company’s Industrial Controls Divisions (ICD) 1989-1997; Marketing Manager, ICD, April 1988-March 1989. |
There are no family relationships between any of the above-named executive officers.
| | |
| (1) | | As of February 20, 2007.2008. |
|
| (2) | | Appointed by the Board of Directors on February 15, 2008, effective as of March 1, 2008. |
|
| (3) | | Appointed Chief Accounting Officer by the Board of Directors on February 15, 2008, effective through February 29, 2008. |
1312
PART II
| |
| Item 5. | Market for the Registrant’s Common Equity, Related Stockholder Matters and Issuer Purchases of Equity Securities |
The Company’s Class A and Class B common stocks areCommon Stock is principally traded on the New York Stock Exchange under the symbols “HUBA” and “HUBB”. The following tables provide information on market prices, dividends declared, number of common shareholders, and repurchases by the Company of shares of its Class A and Class B common stock.Common Stock.
| | | | | | | | | | | | | | | | | | | | | | | | | | | | | | | | | |
Market Prices (Dollars Per Share)
| | Common A | | Common B | | | Common A | | Common B | |
Years Ended December 31, | | High | | Low | | High | | Low | | | High | | Low | | High | | Low | |
| | |
| 2007 — First quarter | | | | 49.19 | | | | 43.60 | | | | 50.11 | | | | 43.39 | |
| 2007 — Second quarter | | | | 56.67 | | | | 46.60 | | | | 57.10 | | | | 48.25 | |
| 2007 — Third quarter | | | | 59.76 | | | | 54.00 | | | | 58.15 | | | | 50.97 | |
| 2007 — Fourth quarter | | | | 61.15 | | | | 53.95 | | | | 58.11 | | | | 50.04 | |
| | | |
| | | | | | | | | | | | | | | | | |
| 2006 — First quarter | | | 47.30 | | | | 40.10 | | | | 51.52 | | | | 43.78 | | | | 47.30 | | | | 40.10 | | | | 51.52 | | | | 43.78 | |
| 2006 — Second quarter | | | 49.08 | | | | 41.80 | | | | 53.24 | | | | 45.50 | | | | 49.08 | | | | 41.80 | | | | 53.24 | | | | 45.50 | |
| 2006 — Third quarter | | | 45.68 | | | | 42.17 | | | | 49.50 | | | | 45.62 | | | | 45.68 | | | | 42.17 | | | | 49.50 | | | | 45.62 | |
| 2006 — Fourth quarter | | | 50.82 | | | | 43.24 | | | | 53.28 | | | | 43.88 | | | | 50.82 | | | | 43.24 | | | | 53.28 | | | | 43.88 | |
| | | |
| 2005 — First quarter | | | 49.65 | | | | 45.15 | | | | 54.00 | | | | 47.89 | | |
| 2005 — Second quarter | | | 46.54 | | | | 39.25 | | | | 50.79 | | | | 42.67 | | |
| 2005 — Third quarter | | | 44.06 | | | | 40.45 | | | | 47.90 | | | | 43.59 | | |
| 2005 — Fourth quarter | | | 45.95 | | | | 41.32 | | | | 50.00 | | | | 45.12 | | |
| | | | | | | | | | | | | | | | | | | | | | | | | |
Dividends Declared (Cents Per Share)
| | Common A | | Common B | | | Common A | | Common B | |
Years Ended December 31, | | 2006 | | 2005 | | 2006 | | 2005 | | | 2007 | | 2006 | | 2007 | | 2006 | |
| |
| First quarter | | | 33 | | | | 33 | | | | 33 | | | | 33 | | | | 33 | | | | 33 | | | | 33 | | | | 33 | |
| Second quarter | | | 33 | | | | 33 | | | | 33 | | | | 33 | | | | 33 | | | | 33 | | | | 33 | | | | 33 | |
| Third quarter | | | 33 | | | | 33 | | | | 33 | | | | 33 | | | | 33 | | | | 33 | | | | 33 | | | | 33 | |
| Fourth quarter | | | 33 | | | | 33 | | | | 33 | | | | 33 | | | | 33 | | | | 33 | | | | 33 | | | | 33 | |
| | | | | | | | | | | | | | | | | | | | | | | | | | | | | | | | | | | | | | | | | |
Number of Common Shareholders of Record
| | | | | | | | | | | | | | | | | | | | | | |
At December 31, | | 2006 | | 2005 | | 2004 | | 2003 | | 2002 | | | 2007 | | 2006 | | 2005 | | 2004 | | 2003 | |
| |
| Class A | | | 617 | | | | 665 | | | | 717 | | | | 771 | | | | 843 | | | | 571 | | | | 617 | | | | 665 | | | | 717 | | | | 771 | |
| Class B | | | 3,243 | | | | 3,319 | | | | 3,515 | | | | 3,687 | | | | 3,950 | | | | 3,068 | | | | 3,243 | | | | 3,319 | | | | 3,515 | | | | 3,687 | |
1413
Purchases of Equity Securities
In February 2006,2007, the Board of Directors approved a new stock repurchase program and authorized the repurchase of up to $100$200 million of the Company’s Class A and Class B Common Stock to be completed over a threetwo year period. The repurchaseThis program commenced in August 2006May 2007 upon completion of the previous 20052006 program. In December 2007, the Board of Directors approved a new repurchase program and authorized the repurchase of up to $200 million of Class A and Class B Common Stock to be completed over a two year period. This program will be implemented upon completion of the February 2007 program. Stock repurchases are being implemented through open market and privately negotiated transactions.
OnIn August 3, 2006,2007, in connection with the Company’s previously announced stock repurchase program, the Company established a prearranged repurchase plan (“the 10b5-1 Plan”) intended to comply with the requirements ofRule 10b5-1 andRule 10b-18 under the Securities Exchange Act of 1934, as amended (“the Exchange Act”).
The 10b5-1 Plan facilitates the ongoing repurchase of the Company’s Class A and Class B Common Stock under itscommon stock by permitting the Company to repurchase programshares during times when it otherwise might be prevented from doing so under insider trading laws or because of self-imposed trading blackout periods. Pursuant to the 10b5-1 Plan, a broker appointed by the Company has the authority to repurchase, without further direction from the Company, up to 750,000 shares of Class A Common Stock and up to 750,000 shares of Class B Common Stock during the period commencing on August 4, 20063, 2007 and expiring on August 3, 2007,2, 2008, subject to conditions specified in the 10b5-1 Plan and unless earlier terminated. All the 750,000The Company has repurchased 259,809 shares of the Class BA Common Stock have been repurchasedthrough December 31, 2007 under the 10b5-1 Plan.this plan. There is no guarantee as to the number of Class A Common Stock that will be repurchased under this plan, and the Company may terminate this plan at any time. Depending upon market conditions, the Company also expects to continue to conduct discretionary repurchases in privately negotiated transactions during its normal trading windows.
The following table summarizes the Company’s repurchase activity during the quarter ended December 31, 2006:2007:
| | | | | | | | | | | | | | | | | | | | | | | | | |
| | | | | | | | | | | | | | | Total
| | | | |
| | | | | | | | | | | | | | | Number of
| | | Approximate
| |
| | | | | | | | | | | | | | | Shares
| | | Dollar Value of
| |
| | | | | | | | | Total
| | | | | | Purchased as
| | | Shares That
| |
| | | | | | Average
| | | Number of
| | | Average
| | | Part of
| | | May Yet Be
| |
| | | Total Number of
| | | Price Paid
| | | Class B
| | | Price Paid
| | | Publicly
| | | Purchased
| |
| | | Class A Shares
| | | per
| | | Shares
| | | per
| | | Announced
| | | Under the 2006
| |
| | | Purchased
| | | Class A
| | | Purchased
| | | Class B
| | | Program
| | | Program
| |
Period | | (000’s) | | | Share | | | (000’s) | | | Share | | | (000’s) | | | (000’s) | |
| |
Balance as of September 30, 2006 | | | | | | | | | | | | | | | | | | | | | | $ | 71,400 | |
| October 2006 | | | 37 | | | $ | 46.82 | | | | 107 | | | $ | 49.12 | | | | 144 | | | | 64,400 | |
| November 2006 | | | 42 | | | | 47.31 | | | | 78 | | | | 49.91 | | | | 120 | | | | 58,500 | |
| December 2006 | | | 36 | | | | 45.16 | | | | 133 | | | | 46.14 | | | | 169 | | | | 50,700 | |
| | | | | | | | | | | | | | | | | | | | | | | | | |
Total for the quarter ended December 31, 2006 | | | 115 | | | $ | 46.48 | | | | 318 | | | $ | 48.07 | | | | 433 | | | $ | 50,700 | |
| | | | | | | | | | | | | | | | | | | | | | | | | |
| | | | | | | | | | | | | | | | | | | | | | | | | |
| | | | | | | | | | | | | | | | | | Approximate
| |
| | | | | | | | | | | | | | | Total
| | | Dollar Value of
| |
| | | | | | | | | | | | | | | Number of
| | | Shares That
| |
| | | | | | | | | | | | | | | Shares
| | | May Yet Be
| |
| | | | | | | | | Total
| | | | | | Purchased as
| | | Purchased
| |
| | | | | | Average
| | | Number of
| | | Average
| | | Part of
| | | Under the
| |
| | | Total Number of
| | | Price Paid
| | | Class B
| | | Price Paid
| | | Publicly
| | | February
| |
| | | Class A Shares
| | | per
| | | Shares
| | | per
| | | Announced
| | | 2007
| |
| | | Purchased
| | | Class A
| | | Purchased
| | | Class B
| | | Program
| | | Program
| |
Period | | (000’s) | | | Share | | | (000’s) | | | Share | | | (000’s) | | | (000’s) | |
| |
Balance as of September 30, 2007 | | | | | | | | | | | | | | | | | | | | | | $ | 77,100 | |
| October 2007 | | | 43 | | | $ | 58.97 | | | | — | | | $ | — | | | | 43 | | | | 74,600 | |
| November 2007 | | | 37 | | | | 56.84 | | | | — | | | | — | | | | 37 | | | | 72,500 | |
| December 2007 | | | 180 | | | | 60.62 | | | | 75 | | | | 55.16 | | | | 255 | | | | 57,500 | |
| | | | | | | | | | | | | | | | | | | | | | | | | |
Total for the quarter ended December 31, 2007 | | | 260 | | | $ | 59.80 | | | | 75 | | | $ | 55.16 | | | | 335 | | | $ | 57,500 | |
| | | | | | | | | | | | | | | | | | | | | | | | | |
Total for the full year ended December 31, 2007 | | | 799 | | | $ | 55.51 | | | | 2,791 | | | $ | 53.31 | | | | 3,590 | | | | | |
| | | | | | | | | | | | | | | | | | | | | | | | | |
1514
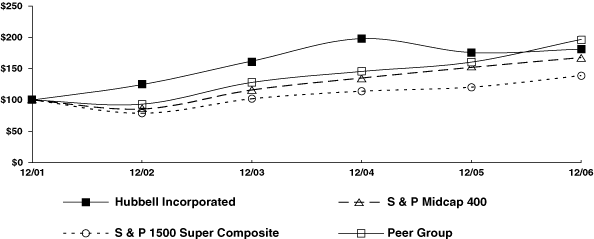
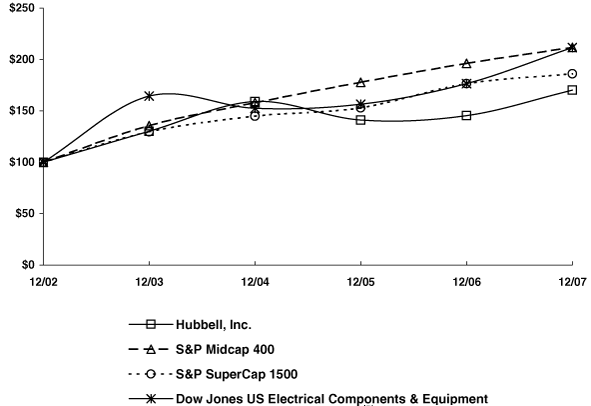
Corporate Performance Graph
The following graph compares the total return to shareholders on the Company’s Class B Common Stock during the five years ended December 31, 2006,2007, with a cumulative total return on the (i) Standard & Poor’s MidCap 400 (“S&P MidCap 400”), (ii) Hubbell Self-Constructed Peer Groupthe Dow Jones U.S. Electrical Components & Equipment Index (“Peer Group”DJUSEC”), and (iii) Standard & Poor’s Super CompositeSuperComposite 1500 (“S&P SuperCap 1500”). The Company is a member of the S&P MidCap 400, and the S&P MidCap 400 forms a part of the S&P SuperCap 1500. Beginning next year, the Company intends to compare to the S&P MidCap 400 and the DJUSEC. As of December 31, 2007, the DJUSEC reflects a group of approximately thirty-seven company stocks in the electrical components and equipment market segment, and will serve as the Company’s peer group. The comparison to the S&P SuperCap 1500 is included for comparison purposes to last year’s graph. The comparison assumes $100 was invested on December 31, 20012002 in the Company’s Class B Common Stock and in each of the foregoing indices and assumes reinvestment of dividends.
In prior years, the Company’s Corporate Performance graph compared the Company’s Class B Common Stock performance with the performance of (i) the S&P MidCap 400 and (ii) the Peer Group. Beginning next year, the Company will substitute the S&P Super Composite 1500 for the Peer Group. The S&P MidCap 400 has and will continue to be used because the Company is a member of this group. The S&P Super Composite 1500 has been chosen to replace the Peer Group as the MidCap 400 forms a part of the Super Composite 1500 and the Company is also in this group. We believe the S&P Super Composite 1500 is a more representative comparison than the Peer Group, which has become relatively narrow in recent years.
The Peer Group consists of corporations whose businesses are representative of the Company’s business segments and, therefore, served as a base for comparing total return to shareholders. The corporations that comprise the original Peer Group are (a) Cooper Industries, Inc. (b) Emerson Electric Co., (c) Thomas & Betts Corporation, (d) Acuity Brands, Inc. and (e) Woodhead Industries, Inc. (“Woodhead”). The Peer Group has been weighted in accordance with each corporation’s market capitalization (closing stock price multiplied by the number of shares outstanding) as of the beginning of each of the years covered by the performance graph. As a result of Woodhead being acquired during 2006, Woodhead has been dropped from the 2006 period. For the December 2006 data points, the Woodhead portion has been distributed among the remaining four members of the Peer Group, weighted according to their market capitalization. The weighted return for each year was calculated by assuming the products obtained by multiplying (a) the percentage that each corporation’s market capitalization represents of the total market capitalization of all corporations in the index for each such year by (b) the total shareholder return for that corporation for such year.
COMPARISON OF 5 YEAR CUMULATIVE TOTAL RETURN*
Among Hubbell, Incorporated,Inc., The S&P Midcap 400 Index,
The S&P SuperCap 1500 Super Composite Index
And A Peer GroupThe Dow Jones US Electrical Components & Equipment Index
| |
| * | $100 invested on 12/31/0102 in stock or index-including reinvestment of dividends. YearFiscal year ending December 31. |
Copyright© 2007,2008, Standard and& Poor’s, a division of The McGraw-Hill Companies, Inc. All rights reserved.www.researchdatagroup.com/S&P.htm
1615
| |
| Item 6. | Selected Financial Data |
The following summary should be read in conjunction with the consolidated financial statements and notes contained herein (dollars and shares in millions, except per share amounts).
| | | | | | | | | | | | | | | | | | | | | | | | | | | | | | | | | | | | | | | | | |
| | | 2006 | | 2005 | | 2004 | | 2003 | | 2002 | | | 2007 | | 2006 | | 2005 | | 2004 | | 2003 | |
| |
OPERATIONS, years ended December 31, | | | | | | | | | | | | | | | | | | | | | | | | | | | | | | | | | | | | | | | | |
| Net sales | | $ | 2,414.3 | | | $ | 2,104.9 | | | $ | 1,993.0 | | | $ | 1,770.7 | | | $ | 1,587.8 | | | $ | 2,533.9 | | | $ | 2,414.3 | | | $ | 2,104.9 | | | $ | 1,993.0 | | | $ | 1,770.7 | |
Gross profit(1) | | $ | 656.8 | | | $ | 595.0 | | | $ | 561.9 | | | $ | 481.5 | | | $ | 409.1 | | | $ | 735.8 | | | $ | 656.8 | (1) | | $ | 595.0 | (1) | | $ | 561.9 | (1) | | $ | 481.5 | (1) |
Special charges, net(1) | | $ | 7.3 | | | $ | 10.3 | | | $ | 15.4 | | | $ | 5.7 | | | $ | 8.3 | | | $ | — | | | $ | 7.3 | (1) | | $ | 10.3 | (1) | | $ | 15.4 | (1) | | $ | 5.7 | (1) |
| Gain on sale of business | | $ | — | | | $ | — | | | $ | — | | | $ | — | | | $ | 3.0 | | |
| Operating income | | $ | 233.9 | (3) | | $ | 226.8 | (3) | | $ | 212.6 | | | $ | 171.9 | | | $ | 138.5 | | | $ | 299.4 | (3) | | $ | 233.9 | (3) | | $ | 226.8 | (3) | | $ | 212.6 | | | $ | 171.9 | |
| Operating income as % of sales | | | 9.7 | % | | | 10.8 | % | | | 10.7 | % | | | 9.7 | % | | | 8.7 | % | |
| Cumulative effect of accounting change, net of tax | | $ | — | | | $ | — | | | $ | — | | | $ | — | | | $ | 25.4 | (6) | |
| Operating income as a % of sales | | | | 11.8 | % | | | 9.7 | % | | | 10.8 | % | | | 10.7 | % | | | 9.7 | % |
| Net income | | $ | 158.1 | | | $ | 165.1 | (4) | | $ | 154.7 | (4) | | $ | 115.1 | | | $ | 83.2 | (5)(6) | | $ | 208.3 | (4) | | $ | 158.1 | | | $ | 165.1 | (4) | | $ | 154.7 | (4) | | $ | 115.1 | |
| Net income as a % of sales | | | 6.5 | % | | | 7.8 | % | | | 7.8 | % | | | 6.5 | % | | | 5.2 | % | | | 8.2 | % | | | 6.5 | % | | | 7.8 | % | | | 7.8 | % | | | 6.5 | % |
| Net income to common shareholders’ average equity | | | 15.7 | % | | | 17.0 | % | | | 17.4 | % | | | 14.6 | % | | | 11.2 | % | | | 19.9 | % | | | 15.7 | % | | | 17.0 | % | | | 17.4 | % | | | 14.6 | % |
| Earnings per share — Diluted: | | | | | | | | | | | | | | | | | | | | | |
| Before cumulative effect of accounting change | | $ | 2.59 | | | $ | 2.67 | | | $ | 2.51 | | | $ | 1.91 | | | $ | 1.81 | | |
| After cumulative effect of accounting change | | $ | 2.59 | | | $ | 2.67 | | | $ | 2.51 | | | $ | 1.91 | | | $ | 1.38 | (6) | |
| Earnings per share — Diluted | | | $ | 3.50 | | | $ | 2.59 | | | $ | 2.67 | | | $ | 2.51 | | | $ | 1.91 | |
| Cash dividends declared per common share | | $ | 1.32 | | | $ | 1.32 | | | $ | 1.32 | | | $ | 1.32 | | | $ | 1.32 | | | $ | 1.32 | | | $ | 1.32 | | | $ | 1.32 | | | $ | 1.32 | | | $ | 1.32 | |
| Average number of common shares outstanding — diluted | | | 61.1 | | | | 61.8 | | | | 61.6 | | | | 60.1 | | | | 59.7 | | | | 59.5 | | | | 61.1 | | | | 61.8 | | | | 61.6 | | | | 60.1 | |
| Cost of acquisitions, net of cash acquired | | $ | 145.7 | | | $ | 54.3 | | | $ | — | | | $ | — | | | $ | 270.2 | | | $ | 52.9 | | | $ | 145.7 | | | $ | 54.3 | | | $ | — | | | $ | — | |
FINANCIAL POSITION, at year-end | | | | | | | | | | | | | | | | | | | | | | | | | | | | | | | | | | | | | | | | |
| Working capital | | $ | 432.1 | | | $ | 459.6 | | | $ | 483.1 | | | $ | 420.9 | | | $ | 341.6 | | | $ | 368.5 | | | $ | 432.1 | | | $ | 459.6 | | | $ | 483.1 | | | $ | 420.9 | |
| Total assets | | $ | 1,751.5 | | | $ | 1,667.0 | | | $ | 1,656.4 | | | $ | 1,514.3 | | | $ | 1,418.6 | | | $ | 1,863.4 | | | $ | 1,751.5 | | | $ | 1,667.0 | | | $ | 1,656.4 | | | $ | 1,514.3 | |
| Total debt | | $ | 220.2 | | | $ | 228.8 | | | $ | 299.0 | | | $ | 298.8 | | | $ | 298.7 | | | $ | 236.1 | | | $ | 220.2 | | | $ | 228.8 | | | $ | 299.0 | | | $ | 298.8 | |
Debt to total capitalization(7) | | | 18 | % | | | 19 | % | | | 24 | % | | | 26 | % | | | 29 | % | |
Debt to total capitalization(5) | | | | 18 | % | | | 18 | % | | | 19 | % | | | 24 | % | | | 26 | % |
| Common shareholders’ equity: | | | | | | | | | | | | | | | | | | | | | | | | | | | | | | | | | | | | | | | | |
| Total | | $ | 1,015.5 | (2) | | $ | 998.1 | | | $ | 944.3 | | | $ | 829.7 | | | $ | 744.2 | | | $ | 1,082.6 | (2) | | $ | 1,015.5 | (2) | | $ | 998.1 | | | $ | 944.3 | | | $ | 829.7 | |
| Per share | | $ | 16.62 | | | $ | 16.15 | | | $ | 15.33 | | | $ | 13.80 | | | $ | 12.47 | | | $ | 18.19 | | | $ | 16.62 | | | $ | 16.15 | | | $ | 15.33 | | | $ | 13.80 | |
NUMBER OF EMPLOYEES, at year-end | | | 12,000 | | | | 11,300 | | | | 11,400 | | | | 10,862 | | | | 11,476 | | | | 11,500 | | | | 12,000 | | | | 11,300 | | | | 11,400 | | | | 10,862 | |
| | |
| (1) | | The Company recorded pretax special charges in each of the years presented.2003 through 2006. Below is a breakdown of special charges representing the total of amounts recorded in Special charges, net, and Cost of goods sold, the latter of which impacts Gross profit. |
| | | | | | | | | | | | | | | | | | | | | |
| | | Special Charges by Program | |
| | | 2006 | | | 2005 | | | 2004 | | | 2003 | | | 2002 | |
| |
| Lighting business integration and rationalization program | | $ | 7.5 | | | $ | 10.0 | | | $ | 9.5 | | | $ | 8.1 | | | $ | 10.3 | |
| Wiring Device factory closure | | | — | | | | 0.9 | | | | 7.2 | | | | — | | | | — | |
| 1997 streamlining program | | | — | | | | — | | | | — | | | | — | | | | 3.4 | |
| | | | | | | | | | | | | | | | | | | | | |
| | | $ | 7.5 | | | $ | 10.9 | | | $ | 16.7 | | | $ | 8.1 | | | $ | 13.7 | |
| | | | | | | | | | | | | | | | | | | | | |
17
Further details with respect to special charges are included
within Management’s Discussion and Analysis and Note 2 — Special Charges within
Management’s Discussion and Analysis and Note 2 — Special Charges of the Notes to Consolidated Financial Statements.
| | | | | | | | | | | | | | | | | |
| | | Special Charges by Program | |
| | | 2006 | | | 2005 | | | 2004 | | | 2003 | |
| |
| Lighting business integration and rationalization program | | $ | 7.5 | | | $ | 10.0 | | | $ | 9.5 | | | $ | 8.1 | |
| Wiring Device factory closure | | | — | | | | 0.9 | | | | 7.2 | | | | — | |
| | | | | | | | | | | | | | | | | |
| | | $ | 7.5 | | | $ | 10.9 | | | $ | 16.7 | | | $ | 8.1 | |
| | | | | | | | | | | | | | | | | |
| | |
| (2) | | Effective December 31, 2006, the Company adopted Statement of Financial Accounting Standards (“SFAS”) No. 158, “Employers’ Accounting for Defined Benefit Pension and Other Postretirement Plans, an amendment of FASB Statements No. 87, 88, 106, and 132(R)”. The adoption of this standardRelated adjustments to Shareholders’ equity resulted in a credit of $44.9 million, net of tax in 2007 and a charge to equity of $36.8 million, net of tax.tax in 2006. |
| |
| (3) | | In 2007, 2006 and 2005, operating income includes stock-based compensation expense of $12.7 million, $11.8 million and $0.7 million, respectively. |
16
| | |
| (4) | | In 2007, 2005 and 2004, the Company recorded tax benefits of $5.3 million, $10.8 million and $10.2 million, respectively, in Provision for income taxes related to the completion of U.S. Internal Revenue Service (“IRS”) examinations for tax years through 2003.2005. |
| |
| (5) | | In 2002, the Company recorded a tax benefit of $10.8 million in connection with the settlement of a fully reserved tax issue with the IRS and a reduction of tax expense as a result of filing amended Federal income tax returns for years1995-2000 related to increased credits for research and development activities. |
|
(6) | | On January 1, 2002, the Company adopted SFAS No. 142, “Goodwill and Other Intangible Assets”. As a result of adopting SFAS No. 142, the Company recorded a goodwill impairment charge of $25.4 million, net of tax, to write-off goodwill associated with one of the reporting units in the Industrial Technology segment. The impairment charge was reported as the cumulative effect of a change in accounting principle in 2002. |
|
(7) | | Debt to total capitalization is defined as total debt as a percentage of the sum of total debt and shareholders’ equity. |
| |
| Item 7. | Management’s Discussion and Analysis of Financial Condition and Results of Operations |
EXECUTIVE OVERVIEW OF THE BUSINESS
20062007 was a year of recovery after a particularly challenging 2006. In 2007, we executed against a business strategy with three primary areas of focus. We made significant progress this year for our Company. Coming into the year, we had identified and communicated that we expected 2006 to be a peak year of key initiatives and change as we focused on multiple projects, all of which required significant investments of resources and the time and attention of our management team. The combination of working towards completion of our initiatives and adjusting to higher levels of orders and salesyear-over-year resulted in operational inefficiencies and higher costs. As a result, our operating performance was not to our level of satisfactionincreasing profitability as operating margins and cash flow declinedyear-over-year.
An update of key initiatives is as follows:
Common, enterprise-wide information system.margin improved by 2.1 percentage points. We have substantially completed a multi-year program to implement SAP software across all domestic businesses in a series of staged implementations. The implementations began inbelieve the fourth quarter of 2004 and continued throughcurrent strategy provides the fourth quarter of 2006. As of December 31, 2006, SAP has been installed at almost all of the Company’s domestic businesses. Total program spending on this business initiative approximated $75 million, pretax, from inception in late 2003 through the end of 2006 — of which approximately 61% was capitalized, and is being amortized over 5 years, and 39% was expensed as incurred. In connection with the implementation of this program, we expensed approximately $6.7 million in 2006, $8.3 million in 2005 and $10.1 million in 2004, primarily related to external consulting costs. In 2006, we capitalized approximately $10.9 million of costs (primarily recorded in “Intangible assets and other” in the Consolidated Balance Sheets) associated with the program compared with $18.6 million and $12.8 million, capitalized in 2005 and 2004, respectively. Amortization expense on the amounts capitalized totaled $8.1 million in 2006, $4.1 million in 2005 and $0.6 million in 2004. Program expenses are allocated to our three segments on the basis of each segment’s actual net sales as a percentage of consolidated net sales.
Lighting Business Integration and Rationalization Program. We have substantially completed a multi-year program to integrate and rationalize our lighting businesses following the acquisition of Lighting Corporation of America, (“LCA”) in 2002. Actions include facility consolidations, workforce reductions and product rationalizations. Integral to this initiative is increased product and component sourcing from low cost countries. Annualized savings from these actions are estimated to range from $20-$25 million, pretax, a majority of which has been
18
realized through December 31, 2006. Savings have been realized primarily in the form of increased manufacturing productivity and lower administrative costs in the affected lighting businesses. To date, these savings have been used to offset cost increases and other competitive pressures as opposed to adding directly to the profitability of the Electrical segment.
As an integral part of the program, we are nearing completion of a new lighting headquarters building located in Greenville, South Carolina. Construction of the building began in early 2005 and will be completed in the first quarter of 2007. The project is expected to cost approximately $41 million of which approximately $32 million has been capitalized through December 31, 2006.
Acquisitions. The Company spent a total of $145.5 million, net of cash acquired, on two acquisitions this year, one of which was added to the Power segment and one to the Industrial Technology segment. Both acquisitions were immediately accretive to net income of the Company. These businesses are expected to add approximately $81 million in annual sales to the Power segment and approximately $25 million to the Industrial Technology segment with operating margin in line with their respective segments. We expectmeans for us to continue to pursue potential acquisitions that would enhance our core electrical component businesses. Our ability to finance substantial growth continues to be strong.
We are currently focused on three key objectives in order to improve the operational and financial performance of our Company. We expect to make substantial progress on these objectives over the next year. We believe the action items described below will provide the means for our Company to grow profits and deliver strong returns to our shareholders. In 2008, we plan to continue to execute against this strategy with additional focus on revenue growth.
During the latter part of 2005 and into 2006,past several years, we experienced significant increases in the cost of commodity raw materials used in the production of our products including steel, copper, aluminum and zinc, as well as in certain purchased electronic components such as ballasts. As a result, multiple increases in the selling priceprices of our products were announced and implemented during this time period. While a significant portionWe believe that all or substantially all of thethese cost increases were recovered during 2006, further pricing actions have been taken or are expected to be completed in 2007 primarilyand we expect to maintain price and commodity cost parity in the Electrical2008. However, commodity costs and Power segments.in particular energy prices, remain volatile and may not be fully offset with pricing increases.
Global sourcing. We remain focused on expanding our global product and component sourcing and supplier cost reduction program. We continue to consolidate suppliers, utilize reverse auctions, and partner with vendors to shorten lead times, improve quality and delivery and reduce costs. Product and component purchases representing approximately 26%23% of total purchases are currently sourced from low cost countries and we expect to continue to increase this amount toward a 40% goal over the next several years.countries.
Freight and Logistics. Transporting our products from suppliers, to warehouses, and ultimately to our customers, is a major cost to our Company. While suchDuring 2007, we were able to reduce these costs are not uniqueand improve our service to our Company, we have identified areas of improvementcustomers. We also see opportunities to further reduce costs and increase the effectiveness of our freight and logistics processes to both lower costsincluding capacity utilization and improve our service to customers.network optimization in 2008.
During 2006, initiatives including2007, we began to realize benefits associated with the SAP system implementation, restructuringincluding standardizing best practices in inventory management, production planning and new product launches limitedscheduling to improve manufacturing throughput and reduce costs. In addition, value-engineering efforts through Kaizen events have also contributed to our ability to achieve productivity improvements. Normally, strong increases in underlying economic demand would have provided us with an opportunity to leverage additional sales volume to increase our operating margins. However, the significant incremental volume put pressure on the organization. As a result, we experienced negativepositive productivity related to manufacturing logistics, and to a lesser extent, Selling & administrative expenses (“S&A”).logistics. In addition, cash flow from operations was lowerat record levels in 2007 and more than 2005 primarily resulting from an increase in working capital.
In 2007, we expectdouble the previous year results. We plan to focuscontinue to further reduce lead times and improve service levels to our productivity improvement in the following areas:customers.
Improve Factory Efficiency. Leveraging the features and added visibility to data facilitated by our new business system, efforts are already underway to standardize best practices in inventory management and production
19
| |
| planning and scheduling to improve manufacturing throughput and reduce costs. Lead times have been reduced to historic averages following disruption caused by higher volumes and our initiatives in 2006. We are focused on systemic improvements in methods to further reduce lead times and improve service levels to our customers. |
Working Capital Efficiency. Working capital efficiency is principally measured as the percentage of trade working capital (inventory plus accounts receivable, less accounts payable) divided by annual net sales. In 2006,2007, trade working capital as a percentage of net sales was 21.9%improved to 19.8% compared to 17.7%22% in 2005.2006 due primarily to improvements in inventory management. We will continue to focus on improving our working capital efficiency with a particularcontinued emphasis on improvedin the inventory management.area.
Transformation of business processes. We will continue our long-term initiative of applying lean process improvement techniques throughout the enterprise, with particular emphasis on reducing supply chain complexity to eliminate waste and improve efficiency and reliability.
17
Organic Growth. The Company demonstrated a strong pricing discipline in the marketplace throughout 2007 in an effort to recover higher commodity costs. The pricing emphasis was critical to our margin improvement in 2007, but did result in some loss of market share. In 2008, we will maintain pricing discipline but also will look to expand market share through a greater emphasis on new product introductions and better leverage of sales and marketing efforts across the organization.
Acquisitions. We spent a total in 2007 of $52.9 million on acquisitions and related costs. All 2007 acquisitions were in the Power segment. In January of 2008, we acquired a lighting business for approximately $100 million that will be added to our Electrical segment. These businesses are expected to add approximately $72 million in annual net sales. Our ability to finance substantial growth continues to be strong and we expect to pursue potential acquisitions that would enhance our core electrical component businesses.
OUTLOOK
Our outlook for 20072008 in key areas is as follows:
Markets and Sales
We anticipate an overall economic conditionslower rate of growth in 2008 compared to remain positive throughout 2007 in most of our major end use markets,markets. The residential market is expected to continue to decline significantly in 2008 due to the effects of tighter mortgage standards, the overall disrupted housing market and an oversupply of inventory. Non-residential construction is expected to slow with the notable exception of the residential market. Industrial andlower commercial construction markets are expected to remain favorable as evidencedactivity partially offset by higher levels of architecture billings, a leading indicator of future construction spending.spending on industrial and institutional projects. Domestic utility markets are expected to growincrease in line2008 with most of the overall economy.growth coming from transmission projects while distribution spending will expand in the low single digits due to downward pressure from weaker residential markets. We also do not anticipate any significant increase in demand for our power products in 20072008 resulting from infrastructure changes in the utility industry. Residential markets are expected to decline significantly in 2007 due to rising interest rates and an oversupply of inventory. This outlook for our markets assumes no further shocks to the economy, in particular higher energy prices, which could dampen consumer spending and business investments. In addition, global demand for commodities will continue to drive volatility and upward pricing pressure on these costs. We expect to recover higher commodity and energy costs with increases in selling prices enacted in 2006 and those planned for 2007. We expect overall growth in 2007 net2008 sales versus 20062007 to be in a range of 6%-8%4%-6%, excluding any effects of fluctuations in foreign currency exchange rates. Sales increases compared to 2006 are expected to be led by our Power and Industrial Technology segments while the Electrical segment should experience more modest growth due to lower residential product sales. The full year impact of our 2006 acquisitions is expected to contribute two percentage points2%-3% of these amounts. Sales increases compared to 2007 are expected to be relatively balanced across our three segments. Within our Electrical segment, the acquisition of Kurt Versen in the first quarter of 2008 will essentially offset the continuing decline in the residential market in 2008. During 2007, we were focused on maintaining price in the market to offset commodity cost increases and in some cases gave up market share to do so. In 2008, we will continue to exercise pricing discipline but will also be focused on gaining market share through new product introductions. The carryover impact of previously implemented price increases should comprise approximately one to two percentage points1%-2% of theyear-over-year sales growth.
Operating Results
Full year 20072008 operating profit margin is expected to increase approximately one percentage point compared to 2006. Several key initiatives are expected2007. In 2008 we will continue to benefitfocus on the same objectives that resulted in an improved operating margins including expansion of global product sourcing initiatives, improved factorymargin in 2007; price, productivity and cost, as well as a focus on revenue growth. We expect the substantial completion of key initiatives and reduction of associated costs including the SAP implementation at our domestic businesses and the Lighting Business Integration and Rationalization Program. In addition, we expect selling price increasespricing actions taken in 20062007 as well as additional planned increases in 20072008 will offset higher levels of raw material commodity costs and higher energy related costs. However, commodity and energy costs, particularly oil, are expected to remain volatile and further increases in these costs in 20072008 may not be fully offset with price increases. In addition, productivity efforts including expansion of global product sourcing initiatives, improved factory productivity and lean process improvement projects are expected to benefit operating margins.
Taxation
We estimate the effective tax rate in 20072008 will be approximately 29.5%30.5% compared with 28.6%26.7% reported in 2006.2007. The 2007 effective tax rate included a favorable tax benefit of 1.9 percentage points as a result of the finalization of an IRS examination of the Company’s 2004 and 2005 tax returns. The additional increase in 2008 is primarily due to an
18
anticipated higher level of U.S. taxable income.income and the expiration of the research and development (“R&D”) tax credit in 2007.
Earnings Per Share
Overall, earnings per diluted share is expected to be in the range of $2.90-$3.70-$3.15.3.90.
20
Cash Flow
We expect to increase working capital efficiency in 20072008 primarily as a result of improvements in the procurement and managementdays supply of inventory levels.inventory. Capital spending in 20072008 is expected to be approximately $10-$60-$20 million lower than in 2006 primarily as a result of the completion of our new lighting headquarters facility and the completion of the SAP implementation at our domestic businesses.70 million. We expect spending from athe combination of share repurchasesand/ and or acquisitions in 20072008 to approximate $150-$200-$200300 million. In February 2007, the Board of Directors approved a new stock repurchase program and authorized the repurchase of up to $200 million of Class A and Class B Common Stock to be completed within the next two years. This program will be implemented upon completion of the February 2006 program. Total repurchases may vary depending upon the level of other investing activities. Free cash flow (defined as cash flow from operations less capital spending) in 20072008 is expected to be in the range of $175—$190 million.approximate net income.
Growth
Our growth strategy contemplates acquisitions in our core businesses. The rate and extent to which appropriate acquisition opportunities become available, acquired companies are integrated and anticipated cost savings are achieved can affect our future results. During 2007, weWe anticipate investing in 2008 in acquisitions belowat a higher level than 2007, as evidenced by the level$100 million dollar acquisition of a lighting business in 2006; however,January 2008. However, actual spending may vary depending upon the timing and availability of appropriate acquisition opportunities.
RESULTS OF OPERATIONS
Our operations are classified into three segments: Electrical, Power, and Industrial Technology. For a complete description of the Company’s segments, see Part I, Item 1. of this Annual Report onForm 10-K. Within these segments, Hubbell primarily serves customers in the commercial and residential construction, industrial, utility, and telecommunications industries.
The table below approximates percentages of our total 20062007 net sales generated by the market segmentsmarkets indicated.
Hubbell’s Served Market SegmentsMarkets
| | | | | | | | | | | | | | | | | | | | | | | | | | | | | | | | | | | | | | | | | | | | | | | |
| | | | | | | | | | | Telecommunication/
| | | | | | | | | | | | | Telecommunications/
| | | |
Segment | | Commercial | | Residential | | Industrial | | Utility | | Other | | Total | | | Commercial | | Residential | | Industrial | | Utility | | Other | | Total | |
| |
| Electrical | | | 52 | % | | | 23 | % | | | 19 | % | | | 1 | % | | | 5 | % | | | 100 | % | | | 53 | % | | | 16 | % | | | 21 | % | | | 1 | % | | | 9 | % | | | 100 | % |
| Power | | | 6 | % | | | 3 | % | | | 8 | % | | | 77 | % | | | 6 | % | | | 100 | % | | | 9 | % | | | 3 | % | | | 5 | % | | | 78 | % | | | 5 | % | | | 100 | % |
| Industrial Technology | | | 43 | % | | | — | | | | 38 | % | | | 17 | % | | | 2 | % | | | 100 | % | | | 37 | % | | | — | | | | 39 | % | | | 21 | % | | | 3 | % | | | 100 | % |
Hubbell Consolidated | | | 39 | % | | | 16 | % | | | 18 | % | | | 22 | % | | | 5 | % | | | 100 | % | | | 40 | % | | | 11 | % | | | 19 | % | | | 23 | % | | | 7 | % | | | 100 | % |
OurIn 2007, our served market segmentsmarkets have remained relatively consistent with 2005.the prior year, except for the contraction of the residential market. Overall, we experienced growth in sales due to the contributions of higher selling prices and acquisitions. Market conditions in the Power andsegment were mixed. Utility spending increased in 2007, however, the growth was concentrated in transmission projects. The majority of our utility products relate to distribution spending, which was flat in 2007 due in part to pressure from weaker residential markets. The Industrial Technology segments were generally favorable in 2006 due to the higher levels of utility demand andsegment benefited from a strong worldwide oil and gas market.market and increased demand for high voltage instrumentation and specialty communication products. Principal markets affecting the Electrical segment were mixed as the contraction of the residential market was partially offset by modest improvements in commercial construction and industrial markets were offset by lower levels of activity in the residential / do-it-yourself markets.
2119
Summary of Consolidated Results (in millions, except per share data)
| | | | | | | | | | | | | | | | | | | | | | | | | | | | | | | | | | | | | | | | | | | | | | | | | |
| | | For the Year Ending December 31, | | | For the Year Ending December 31, | |
| | | | | % of Net
| | | | % of Net
| | | | % of Net
| | | | | % of Net
| | | | % of Net
| | | | % of Net
| |
| | | 2006 | | Sales | | 2005 | | Sales | | 2004 | | Sales | | | 2007 | | Sales | | 2006 | | Sales | | 2005 | | Sales | |
| |
| Net sales | | $ | 2,414.3 | | | | | | | $ | 2,104.9 | | | | | | | $ | 1,993.0 | | | | | | | $ | 2,533.9 | | | | | | | $ | 2,414.3 | | | | | | | $ | 2,104.9 | | | | | |
| Cost of goods sold | | | 1,757.5 | | | | | | | | 1,509.9 | | | | | | | | 1,431.1 | | | | | | | | 1,798.1 | | | | | | | | 1,757.5 | | | | | | | | 1,509.9 | | | | | |
| | | | | | | | | | | | | | | |
| Gross profit | | | 656.8 | | | | 27.2 | % | | | 595.0 | | | | 28.3 | % | | | 561.9 | | | | 28.2 | % | | | 735.8 | | | | 29.0 | % | | | 656.8 | | | | 27.2 | % | | | 595.0 | | | | 28.3 | % |
| Selling & administrative expenses | | | 415.6 | | | | 17.2 | % | | | 357.9 | | | | 17.0 | % | | | 333.9 | | | | 16.8 | % | | | 436.4 | | | | 17.2 | % | | | 415.6 | | | | 17.2 | % | | | 357.9 | | | | 17.0 | % |
| Special charges, net | | | 7.3 | | | | 0.3 | % | | | 10.3 | | | | 0.5 | % | | | 15.4 | | | | 0.8 | % | | | — | | | | — | | | | 7.3 | | | | 0.3 | % | | | 10.3 | | | | 0.5 | % |
| | | | | | | | | | | | | | | | | | | | | | | | | | | |
| Operating income | | | 233.9 | | | | 9.7 | % | | | 226.8 | | | | 10.8 | % | | | 212.6 | | | | 10.7 | % | | | 299.4 | | | | 11.8 | % | | | 233.9 | | | | 9.7 | % | | | 226.8 | | | | 10.8 | % |
| | | | | | | | | | | | | | | |
| Earnings per share — diluted | | $ | 2.59 | | | | | | | $ | 2.67 | | | | | | | $ | 2.51 | | | | | | | $ | 3.50 | | | | | | | $ | 2.59 | | | | | | | $ | 2.67 | | | | | |
| | | | | | | �� | | | | | | | | | | |
2007 Compared to 2006
Net Sales
Consolidated net sales for the year ended December 31, 2007 were $2.5 billion, an increase of 5% over the year ended December 31, 2006. The increase was led by our Industrial Technology and Power segments where sales increased by 23% and 11%, respectively, over amounts reported in 2006.
The majority of the year-over-year increase is due to higher selling prices and several acquisitions partially offset by lower residential product sales. We estimate that selling price increases accounted for approximately four percentage points of the year-over-year increase in sales. The impact of acquisitions accounted for approximately two percentage points of the sales increase in 2007 compared to 2006. Refer to the table above under “Hubbell’s Served Markets” for further details on how the underlying market demand can impact each segment’s revenues. Also refer to “Segment Results” within this Management’s Discussion and Analysis for more detailed information on performance by segment.
Gross Profit
The consolidated gross profit margin for 2007 increased to 29.0% compared to 27.2% in 2006. The increase was primarily due to selling price increases and productivity improvements, including lower freight and logistics costs and lower product costs from strategic sourcing initiatives. The gross profit margin improvement was broad based as all three segments contributed to the increase. These improvements in 2007 compared to 2006 were partially offset by the negative impact of an unfavorable product sales mix due to lower sales of higher margin residential products.
Selling & Administrative Expenses
Selling and administrative (“S&A”) expenses increased 5% compared to 2006. The increase is primarily due to S&A expenses of acquisitions and higher selling costs associated with increased sales. As a percentage of sales, S&A expenses in 2007 of 17.2% were unchanged from the comparable period of 2006. Numerous cost containment initiatives; primarily advertising, and lower spending on the enterprise wide systems implementation of SAP were offset by expenses for certain strategic initiatives related to reorganizing operations, including office moves, severance costs associated with reductions in workforce and costs incurred to support new products sales.
Special Charges
Operating results in 2006 include pretax special charges related to our Lighting Business Integration and Rationalization Program (the “Program” or “Lighting Program”). The Lighting Program was approved following our acquisition of LCA in April 2002 and was undertaken to integrate and rationalize the combined lighting operations. This Program was substantially completed by the end of 2006. Any remaining costs in 2007 are being reflected in S&A expense or Cost of goods sold in the Consolidated Statement of Income. At the end of 2006, one of
20
the remaining actions within the Lighting Program was the completion of construction of a new lighting headquarters. The construction was completed in the early part of 2007. Cash capital expenditures of $13 million related to the headquarters are reflected in the 2007 Consolidated Statement of Cash Flow. See separate discussion of the 2006 and 2005 Special Charges under “2006 Compared to 2005” within this Management’s Discussion and Analysis.
Operating Income
Operating income increased 28% primarily due to higher sales and gross profit partially offset by increased selling and administration costs. Operating margins of 11.8% in 2007 increased compared to 9.7% in 2006 as a result of increased sales and higher gross profit margins.
Other Income/Expense
Interest expense was $17.6 million in 2007 compared to $15.4 million in 2006. The increase was due to higher average outstanding commercial paper borrowings in 2007 compared to 2006. Investment income decreased in 2007 versus 2006 due to lower average investment balances due to the funding of two acquisitions in 2006 and one in 2007 as well as a higher amount of share repurchases. Other expense, net in 2007 decreased $2.1 million versus 2006 primarily due to net foreign currency transaction gains in 2007 compared to net foreign currency losses in 2006.
Income Taxes
Our effective tax rate was 26.7% in 2007 compared to 28.6% in 2006. In 2007, a favorable tax settlement was recognized in connection with the closing of an IRS examination of the Company’s 2004 and 2005 tax returns and this benefit reduced the effective tax rate by 1.9 percentage points in 2007. Additional information related to our effective tax rate is included in Note 13 — Income Taxes in the Notes to Consolidated Financial Statements.
Net Income and Earnings Per Share
Net income and diluted earnings per share in 2007 increased 31.8% and 35.1%, respectively, versus 2006 as a result of higher sales and gross profit, a lower tax rate and fewer diluted shares outstanding.
Segment Results
Electrical Segment
| | | | | | | | | |
| | | 2007 | | | 2006 | |
| | | (In millions) | |
| |
| Net Sales | | $ | 1,639.9 | | | $ | 1,631.2 | |
| Operating Income | | $ | 151.0 | | | $ | 124.7 | |
| Operating Margin | | | 9.2 | % | | | 7.6 | % |
Net sales in the Electrical segment were essentially unchanged in 2007 versus the prior year as higher sales of electrical products and wiring systems were offset by lower sales of residential lighting fixtures. Within the segment, sales of electrical products increased by approximately 9% in 2007 versus the comparable period of 2006 due to strong demand for harsh and hazardous products and selling price increases. Sales of harsh and hazardous products increased approximately 19% in 2007 versus 2006 primarily due to higher oil and gas project shipments related to strong market conditions worldwide. Wiring systems experienced 6% higher sales in 2007 versus 2006 principally due to increased new product sales and higher selling prices. Sales of residential lighting fixture products were lower in 2007 by approximately 22% versus the prior year as a result of a decline in the U.S. residential construction market. Overall for the segment, higher selling prices increased net sales by approximately three percentage points versus 2006.
Operating income and operating margin in the segment improved in 2007 versus the prior year primarily due to selling price increases, productivity gains and lower costs, including employee benefits and SAP implementation
21
cost reductions. We estimate that selling price increases exceeded commodity cost increases by nearly two percentage points in 2007 compared to 2006. In addition, productivity improvements including lower freight and logistics costs, strategic sourcing initiatives and completed actions within our Lighting Program benefited results in 2007. These improvements were partially offset by overall lower shipments, specifically lower shipments of higher margin residential lighting fixture products and costs associated with a product quality issue within our Wiring systems business.
Power Segment
| | | | | | | | | |
| | | 2007 | | | 2006 | |
| | | (In millions) | |
| |
| Net Sales | | $ | 636.6 | | | $ | 573.7 | |
| Operating Income | | $ | 97.3 | | | $ | 75.8 | |
| Operating Margin | | | 15.3 | % | | | 13.2 | % |
Power segment net sales increased 11% in 2007 versus the prior year due to the impact of acquisitions and selling price increases. The acquisition of Hubbell Lenoir City, Inc. completed in the second quarter of 2006 as well as PCORE in the fourth quarter of 2007 accounted for approximately two-thirds of the sales increase in 2007 compared to the same period in 2006. Price increases were implemented across most product lines throughout 2006 and into 2007 where costs have risen due to increased metal and energy costs. We estimate that price increases accounted for approximately five percentage points of the year-over-year sales increase. Operating income and margins increased in 2007 versus 2006 as a result of acquisitions, selling price increases and productivity improvements including strategic sourcing, factory efficiencies and lean programs. The Hubbell Lenoir City, Inc. and PCORE acquisitions contributed approximately one-quarter of the operating income increase in 2007 versus the prior year. In addition, increased sales of higher margin new products and favorable product mix also contributed to the increase in operating margins in 2007 versus 2006.
Industrial Technology Segment
| | | | | | | | | |
| | | 2007 | | | 2006 | |
| | | (In millions) | |
| |
| Net Sales | | $ | 257.4 | | | $ | 209.4 | |
| Operating Income | | $ | 51.1 | | | $ | 33.4 | |
| Operating Margin | | | 19.9 | % | | | 16.0 | % |
Industrial Technology segment net sales increased 23% in 2007 versus 2006 primarily due to the impact of an acquisition in the fourth quarter of 2006, higher new product sales and selling price increases. The segment is benefiting from stronger industrial market activity, particularly in the high voltage instrumentation and specialty communication businesses. We acquired Austdac Pty Ltd. (“Austdac”) in November 2006 which accounted for approximately ten percentage points of the segment sales increase. We estimate that price increases accounted for approximately three percentage points of the sales increase. Favorable foreign exchange rate changes increased net sales by approximately two percentage points in 2007 versus 2006. Operating income and margins for the full year 2007 improved significantly versus 2006 primarily as a result of increased volume, selling price increases, an improved mix of higher margin new product sales and productivity improvements. In addition, the Austdac acquisition contributed approximately one-quarter of the operating income increase of 2007 versus 2006.
2006 Compared to 2005
Net Sales
Consolidated net sales for the year ended December 31, 2006 were $2.4 billion, an increase of 15% over the year ended December 31, 2005 with all segments contributing to the increase.
The majority of theyear-over-year increase iswas due to strong end user demand as a result of improved economic conditions in most of our served markets, contributions from current and prior year acquisitions and
22
higher selling prices. The impact of acquisitions accounted for approximately four percentage points of the sales increase in 2006 compared to 2005. We estimateestimated that selling price increases accounted for approximately two percentage points of theyear-over-year increase in sales. Refer to the table above under “Served Market Segments” for further details on how underlying market demand impacts each segment’s revenues. Also refer to “Segment Results” within this Management’s Discussion and Analysis for more detailed information on performance by segment.
Gross Profit
The consolidated gross profit margin for 2006 decreased to 27.2% compared to 28.3% in 2005. Production and delivery inefficiencies were experienced in certain of our Electrical and Power segment businesses compared to the prior year. Further, higheryear-over-year costs throughout each segment in the areas of commodity raw materials negatively impacted gross profit margins by approximately two and one half percentage points. These items were partially offset by increased sales volume in 2006 compared to 2005, selling price increases, lower product costs from strategic sourcing initiatives and completed actions within our lightingLighting Program.
In total, we estimateestimated that price increases of approximately 2% of net sales were realized to offset higher raw material and transportation cost increases of approximately 2.5% of sales, resulting in net unrecovered cost increases of approximately $15 million. By segment, net benefits were realized in the Industrial Technology segment, while the Electrical and Power segments experienced cost increases in excess of selling price increases. Higher costs of certain raw materials, primarily copper, aluminum, zinc and nickel, were major challenges in 2006 as they occurred across each of our businesses. These increases required us to increase selling prices which, particularly in our Electrical and Power segments, were often not fully realized or required up to90-120 days to become effective and begin to offset the higher costs, which in many cases were immediate.
Selling & Administrative Expenses
S&A expenses increased 16% in 2006 compared to 2005 primarily due to higher selling and commission expenses associated with increased sales, stock-based compensation and expenses associated with new product launches. As a percentage of sales, S&A expenses increased to 17.2% in 2006 compared to 17.0% in 2005. The increase was primarily due to higher expenses associated with stock-based compensation which increased S&A as a percentage of sales by approximately one-half of one percentage point.
22
Special Charges
Full year operating results in 2006 2005 and 20042005 include pretax special charges related to (1) programs approved following our acquisition of LCA in April 2002, which were undertaken to integrate and rationalize the combined lighting operations,Lighting Program and (2) other capacity reduction actions, all within the Electrical segment.
The following table summarizes activity by year with respect to special charges for the three years ending December 31, 2006 and 2005 (in millions):
| | | | | | | | | | | | | | | | | | | | | | | | | | | | | | | | | | | | | | | | | |
| | | CATEGORY OF COSTS | | | CATEGORY OF COSTS | |
| | | | | Facility Exit
| | | | | | | | | | | Facility Exit
| | | | | | | |
| | | Severance and
| | and
| | Asset
| | Inventory
| | | | | Severance and
| | and
| | Asset
| | Inventory
| | | |
Year/Program | | Other Benefit Costs | | Integration | | Impairments | | Write-Downs* | | Total | | | Other Benefit Costs | | Integration | | Impairments | | Write-Downs* | | Total | |
| |
| 2004 | | | | | | | | | | | | | | | | | | | | | |
| 2006 | | | | | | | | | | | | | | | | | | | | | |
| Lighting integration | | $ | 3.3 | | | $ | 2.8 | | | $ | 2.1 | | | $ | 1.3 | | | $ | 9.5 | | | $ | 2.8 | | | $ | 1.6 | | | $ | 2.9 | | | $ | 0.2 | | | $ | 7.5 | |
| Other capacity reduction | | | 2.0 | | | | 0.3 | | | | 4.9 | | | | — | | | | 7.2 | | |
| | | | | | | | | | | | | |
| | | $ | 5.3 | | | $ | 3.1 | | | $ | 7.0 | | | $ | 1.3 | | | $ | 16.7 | | |
| | | | | | | | | | | | | | | | | | | | | | | |
| 2005 | | | | | | | | | | | | | | | | | | | | | | | | | | | | | | | | | | | | | | | | |
| Lighting integration | | $ | 5.7 | | | $ | 2.7 | | | $ | 1.2 | | | $ | 0.4 | | | $ | 10.0 | | | $ | 5.7 | | | $ | 2.7 | | | $ | 1.2 | | | $ | 0.4 | | | $ | 10.0 | |
| Other capacity reduction | | | — | | | | 0.6 | | | | — | | | | 0.3 | | | | 0.9 | | | | — | | | | 0.6 | | | | — | | | | 0.3 | | | | 0.9 | |
| | | | | | | | | | | | | | | | | | | | | | | |
| | | $ | 5.7 | | | $ | 3.3 | | | $ | 1.2 | | | $ | 0.7 | | | $ | 10.9 | | | $ | 5.7 | | | $ | 3.3 | | | $ | 1.2 | | | $ | 0.7 | | | $ | 10.9 | |
| | | | | | | | | | | | | | | | | | | | | | | |
| 2006 | | | | | | | | | | | | | | | | | | | | | |
| Lighting integration | | $ | 2.8 | | | $ | 1.6 | | | $ | 2.9 | | | $ | 0.2 | | | $ | 7.5 | | |
| | | | | | | | | | | | | |
| | |
| * | | Included in Cost of goods sold |
23
The Lighting Business Integration and Rationalization Program (the “Program” or “Lighting Program”)
The integration and rationalization of our lighting operations iswas a multi-year initiative that began in 2002 and was substantially completed in 2006. Individual projects within the Program consisted of factory, office and warehouse closures, personnel realignments, and costs to streamline and combine product offerings. From the start of the Program in 2002 through December 31, 2006, amounts expensed totaled approximately $54 million and amounts capitalized have been approximately $44 million. Capital expenditures arewere primarily related to the construction of a new lighting headquarters expected to be completed in the first quarter of 2007. In addition to the amounts incurred through December 31, 2006, we anticipate an additional $10-$13 million will be incurred in 2007 for the completion of projects, including approximately $3-$5 million of expense and approximately $7-$8 million in capital.headquarters. Program costs related to severance, asset impairments, and facility closures in conjunction with exit activities arewere generally reflected as Special charges, net within the Consolidated Statement of Income. Inventory write-downs related to exit activities arewere recorded as a component of Cost of goods sold. Other costs associated with the Program arewere recorded as Cost of goods sold or S&A expenses depending on the nature of the cost. State and local incentives consisting primarily of property tax credits, job credits and site development funds arewere available in various forms, and are expected to offset portions of both the cost of construction and future operating costs of the lighting headquarters facility.
The Program iswas comprised of three phases. Program expenses by phase, including special charges and other expense costs, are as follows:
| | | | | | | | | | | | | | | | | | | | | | | | | | | | | | | | | |
| | | Phase I | | Phase II | | Phase III | | Total | | | Phase I | | Phase II | | Phase III | | Total | |
| |
| 2002 | | $ | 10.3 | | | $ | — | | | $ | — | | | $ | 10.3 | | | $ | 10.3 | | | $ | — | | | $ | — | | | $ | 10.3 | |
| 2003 | | | 8.1 | | | | — | | | | — | | | | 8.1 | | | | 8.1 | | | | — | | | | — | | | | 8.1 | |
| 2004 | | | 5.5 | | | | 6.2 | | | | — | | | | 11.7 | | | | 5.5 | | | | 6.2 | | | | — | | | | 11.7 | |
| 2005 | | | 2.2 | | | | 11.3 | | | | 1.3 | | | | 14.8 | | | | 2.2 | | | | 11.3 | | | | 1.3 | | | | 14.8 | |
| 2006 | | | 0.2 | | | | 4.0 | | | | 5.0 | | | | 9.2 | | | | 0.2 | | | | 4.0 | | | | 5.0 | | | | 9.2 | |
| | | | | | | | | | | | | | | | | | | |
| | | $ | 26.3 | | | $ | 21.5 | | | $ | 6.3 | | | $ | 54.1 | | | $ | 26.3 | | | $ | 21.5 | | | $ | 6.3 | | | $ | 54.1 | |
23
Phase I of the Program began in 2002 soon after the LCA acquisition was completed and consisted of many individually identified actions. Phase I activities were focused on integrating the acquired operations with Hubbell’s legacy lighting operations. In accordance with applicable accounting rules, amounts were expensed either as actions were approved and announced or as costs were incurred. Reorganization actions primarily consisted of factory closures, warehouse consolidations and workforce realignment. These actions were completed as of December 31, 2006.
Phase II of the Program began in 2004. Many of the actions contemplated were similar to actions completed or underway from Phase I. However, these actions were increasingly focused on rationalizing the combined businesses. In the second quarter of 2004, a commercial products plant closure was announced and charges were recorded, primarily for asset impairments. In the third quarter of 2004, we announced two actions: (1) consolidation of selling, administrative and engineering support functions within the commercial lighting businesses, and (2) the selection of Greenville, South Carolina as the site for a new lighting headquarters facility to be constructed. In addition, in the 2004 fourth quarter, a further move of commercial lighting manufacturing to Mexico was approved.
In 2005, we announced the final Phase II action consisting of the consolidation and closure of a commercial lighting leased office complex. No new Phase II actions were taken in 2006. In total, Phase II costs expensed in 2006 totaled $4.0 million consisting primarily of severance and facility integration in connection with the commercial products move to Mexico. Through December 31, 2006, $21.5 million of total expenses have been recorded for plant consolidations and the consolidation of support functions related to Phase II actions. Approximately 80% of the total amount expensed has been associated with cash outlays. The new headquarters facility representsrepresented the largest remaining capital cost forecast. Cash outlays in 2007 are expected to range from $2-$3 million, excluding capital costs of approximately $13 million, which includes $5.6 million of costs accrued and capitalized in 2006.cost.
In the fourth quarter of 2005, the first Phase III action was approved related to the consolidation and relocation of administrative and engineering functions of a commercial lighting facility to South Carolina. In connection with this approval, we recorded a non-cash pension curtailment charge of approximately $1.3 million. Approximately 85 employees were affected by this action. In 2006, $5.0 million of Phase III costs were expensed. During the fourth quarter of 2006, the closure of a commercial products factory in Cincinnati, Ohio was announced and charges of $3.0 million were recorded related to asset impairments and a portion of the severance and benefits costs expected to
24
be incurred. In addition, $2.0 million was recorded primarily related to severance costs associated with the office closure. All but $2.4 million of asset impairments are expected to result in cash outlays. In 2007, an additional $1-$2 million of Phase III program costs are expected to be expensed to complete Phase III programs. Cash expenditures should comprise a majority of this amount.
Other Capacity Reduction Actions
In addition to the Program within the lighting business, in 2004, we announced the closure of a 92,000 square foot wiring device factory in Puerto Rico. Increased productivity facilitated by lean initiatives and cost savings opportunities resulting from low cost country sourcing contributed to the decision to close this leased facility. As a result, $7.2 million in special charges were recorded in 2004 in the Electrical segment of which $4.9 million related to impairments of fixed assets, $2.0 million provided for severance costs and $0.3 million related to facility exit costs.segment. During 2005, the factory closed and substantially all employees left the Company. In the second quarter of 2005, we recorded an additional $0.9 million of special charges associated with this closure, of which $0.3 million related to inventory write-downs and $0.6 million related to additional facility exit costs. Annual pretax savings from these actions were approximately $4 million in 2006, with the entire amount benefiting Cost of goods sold in the Electrical segment. Net benefits actually realized in the segment have beenwere minimized as a result of cost increases and other competitive pressures.
Additional information with respect to special charges is included in Note 2 — Special Charges included in the Notes to Consolidated Financial Statements.
Operating Income
Operating income increased $7.1 million, or 3% in 2006 compared to 2005 as a result of higher sales levels and $3.4 million of lower pretax special charges (including amounts charged to Cost of goods sold). Operating margins
24
of 9.7% in 2006 declined compared to 10.8% in 2005 as a result of lower gross profit margins and higher S&A expenses as a percentage of sales.
Other Income/Expense
In 2006, investment income decreased $4.4 million versus 2005 due to lower average investment balances as a result of funding acquisitions in 2005 and 2006, as well as funding higher working capital. Interest expense decreased $3.9 million in 2006 compared to 2005 due to a lower level of fixed rate indebtedness in 2006 compared to 2005. In October 2005, we repaid $100 million of senior notes upon maturity. Other expense, net in 2006 was $2.1 million of expense compared to $1.3 million of expense in 2005 primarily due to higher net foreign currency transaction losses.
Income Taxes
Our effective tax rate was 28.6% in 2006 compared to 23.5% in 2005. The 2005 consolidated effective tax rate reflected the impact of tax benefits of $10.8 million recorded in connection with the closing of an IRS examination of the Company’s 2002 and 2003 tax returns. This benefit reduced the statutory tax rate by 5.1 percentage points in 2005. Adjusting for the IRS audit settlement in 2005, the effective tax rate in 2006 iswas consistent with the prior year.
Net Income and Earnings Per Share
Net income and earnings per diluted share in 2006 declined versus 2005 as a result of lower operating profit, higher income taxes and unfavorable other income/expense, partially offset by lower special charges.
Segment Results
Electrical Segment
| | | | | | | | | | | | | | | | | |
| | | 2006 | | 2005 | | | 2006 | | 2005 | |
| | | (In millions) | | | (In millions) | |
| |
| Net Sales | | $ | 1,631.2 | | | $ | 1,496.8 | | | $ | 1,631.2 | | | $ | 1,496.8 | |
| Operating Income | | $ | 132.7 | | | $ | 142.7 | | | $ | 124.7 | | | $ | 142.2 | |
| Operating Margin | | | 8.1 | % | | | 9.5 | % | | | 7.6 | % | | | 9.5 | % |
Electrical segment net sales increased 9% in 2006 versus 2005 primarily as a result of improved underlying demand in the commercial and industrial construction markets and higher selling prices. Each of the businesses
25
within the segment — wiring systems, electrical products and lighting fixtures experiencedyear-over-year increases. Higher selling prices were implemented and have been realized in most of the businesses within the segment in an effort to recover cost increases, primarily related to higher commodity raw material and freight costs.
Sales of lighting fixtures increased in line with the overall segment percentage with the majority of the growth from our commercial and industrial (“C&I”) application products and more modest growth in residential products. The C&I lighting businesses increased due to higher levels of commercial construction throughout the U.S. generating increases in lighting fixture project sales. An industry-wide price increase within C&I lighting in June 2006 resulted in a spike in order input in the second quarter of the year and, consequently, strongyear-over-year shipments in the second and third quarters. Sales of residential lighting fixture products were up modestly in 2006 versus 2005, consistent with underlying residential markets, as a majority of first half sales increasesyear-over-year were offset by second half declines.
Wiring systemsystems sales increasedyear-over-year by more than 10% due to higher demand in both industrial and commercial markets. Rough-in electrical sales increased slightly as a result of higher selling prices, partially offset by lower retail volume. Sales of harsh and hazardous products increasedyear-over-year by more than 20% primarily due to higher oil and gas project shipments related to strong market conditions worldwide and the favorable impact of an acquisition completed in the third quarter of 2005.
25
Operating margin in the segment was lower in 2006 versus 2005, despite a better than one percentage point improvement from higher sales, due to production and delivery inefficiencies in certain lighting facilities affected by restructuring actions and the SAP system implementation, which almost entirely offset the margin improvement from higher sales. In addition, higher commodity raw material and freight costs in excess of selling price increases negatively affected the segment’s operating margin by approximately 1.5 percentage points. Savings from completed actions associated with the lighting Program together with lower special charges in 2006 compared with 2005 were also more than offset by higher S&A costs, including SAP related costs, and a non-recurring $4.9 million prior year gain on sale of a building.
Power Segment
| | | | | | | | | | | | | | | | | |
| | | 2006 | | 2005 | | | 2006 | | 2005 | |
| | | (In millions) | | | (In millions) | |
| |
| Net Sales | | $ | 573.7 | | | $ | 455.6 | | | $ | 573.7 | | | $ | 455.6 | |
| Operating Income | | $ | 78.6 | | | $ | 69.0 | | | $ | 75.8 | | | $ | 68.8 | |
| Operating Margin | | | 13.7 | % | | | 15.1 | % | | | 13.2 | % | | | 15.1 | % |
Power segment net sales increased 26% in 2006 versus the prior year due to the impact of acquisitions and higher levels of utility spending facilitated by higher levels of economic activity in the U.S. and selling price increases. The acquisition of Fabrica de Pecas Electricas Delmar Ltda. (“Delmar”) in the third quarter of last year2005 as well as the Hubbell Lenoir City, Inc. acquisition completed in the second quarter of 2006 accounted for approximately one half of the sales increase in 2006 compared to 2005. Price increases were implemented across most product lines throughout 2005 and into 2006 where costs have risen due to increased metal and energy costs. We estimateestimated that price increases accounted for approximately 4 percentage points of theyear-over-year sales increase. Operating margins decreased in 2006 versus 2005, despite an approximate two percentage point improvement from higher sales, as a result of commodity cost increases in excess of selling price increases, factory inefficiencies, higher SAP related costs and increased transportation costs. The commodity cost increases, primarily steel, aluminum, copper and zinc, outpaced our actions to increase selling prices. We estimate that the negative impact in 2006 of cost increases in excess of pricing actions resulted in a reduction of operating margin of approximately two percentage points for this segment. In addition, the segment experienced factory inefficiencies due in part to the disruption caused by the system implementation.
26
Industrial Technology Segment
| | | | | | | | | | | | | | | | | |
| | | 2006 | | 2005 | | | 2006 | | 2005 | |
| | | (In millions) | | | (In millions) | |
| |
| Net Sales | | $ | 209.4 | | | $ | 152.5 | | | $ | 209.4 | | | $ | 152.5 | |
| Operating Income | | $ | 34.4 | | | $ | 20.4 | | | $ | 33.4 | | | $ | 20.4 | |
| Operating Margin | | | 16.4 | % | | | 13.4 | % | | | 16.0 | % | | | 13.4 | % |
Industrial Technology segment net sales increased 37% in 2006 versus 2005 primarily due to the improvement in industrial market activity as evidenced by higher manufacturing output and rising capacity utilization rates. All businesses within the segment reportedyear-over-year sales increases. In addition, we acquired two businesses in 2005 and one in October 2006 which accounted for approximately one third of the segment sales increase. We estimate that price increases accounted for approximately three percentage points of theyear-over-year sales increase. Operating income and margins for the full year 2006 improved significantly versus 2005 primarily as a result of increased volume, selling price increases in excess of commodity cost increases and cost savings associated with outsourcing and other productivity improvements.
26
2005 Compared to 2004
Net Sales
Consolidated net sales for the year ended December 31, 2005 were $2.1 billion, an increase of 5.6% over the year ended December 31, 2004. The increase was led by our Power and Industrial Technology segments where sales increased by 18% and 17%, respectively, over amounts reported in 2004.
The majority of the increase in net sales in 2005 versus 2004 resulted from the carryover effect of price increases implemented throughout 2004 and 2005, higher storm related shipments in the Power segment and several small acquisitions. Although underlying demand in many of our core markets improvedyear-over-year, softness in commercial construction markets, which represented our largest served market, negatively affected orders and sales particularly in the Electrical segment. We estimate that selling price increases accounted for approximately 2-3 percentage points of theyear-over-year increase in sales. Refer to the table above under “Served Market Segments” for further details on how the underlying market demand can impact each segment’s revenues. Also refer to “Segment Results” within this Management’s Discussion and Analysis for more detailed information on performance by segment.
Gross Profit
The consolidated gross profit margin for 2005 improved slightly to 28.3% compared to 28.2% in 2004. The improvement in gross profit margin was attributable to the favorable effects of higher selling prices in excess of commodity cost increases, lower product costs from strategic sourcing initiatives, productivity gains, and cost savings from our lighting integration and rationalization program. Substantially offsetting these increases versus 2004 were the negative impact of unabsorbed factory costs in certain of our manufacturing plants as a result of lower unit volumes and higheryear-over-year energy prices, which negatively impacted costs including transportation and utilities.
In total, we estimate that price increases of approximately 2%-3% of net sales were realized to offset raw material, energy and transportation cost increases of approximately 2.5%-3.5% of sales, resulting in net unrecovered cost increases of approximately $10-$15 million. By segment, net benefits were realized in the Power and Industrial Technology segments, while the Electrical segment experienced cost increases in excess of price increases. Higher costs of certain raw materials along with higher energy and transportation costs were a major challenge in 2005 as they occurred across each of our businesses. These increases required us to increase selling prices which, particularly in our Electrical segment, were often not fully realized or required up to90-120 days to become effective and begin to offset the higher costs, which in many cases were immediate.
In our lighting business, gross profit margins declined as a result of lower volume, unabsorbed factory costs and higher transportation costs partially offset by cost savings associated with our lighting integration and rationalization program. Our wiring systems business reported lower gross profit percentages in 2005 versus the prior year due to factory inefficiencies, due in part to the implementation of SAP, higher transportation and utility costs and increased costs associated with the launch of new products. Power segment gross margin improved for the year primarily due to higher volume, increased selling prices and improved factory performance. Gross profit margins in our Industrial Technology segment improved as a result of higher volume and price increases in excess of commodity cost increases.
Selling & Administrative Expenses
S&A expenses increased 7.2% compared to 2004. The increase is due to higher expenses associated with the SAP enterprise-wide information system, new product launches and an unusual item recorded in the first quarter of 2005. These increases were partially offset by a $4.9 million gain on sale of a building that was recorded in the fourth quarter of 2005. The SAP information systems initiative generated higheryear-over-year costs primarily due to higher resource needs in support of both legacy and SAP information platforms and amortization of capitalized implementation costs. The unusual item consisted of $4.6 million, pretax, of transactional expenses in support of our strategic growth initiatives.
27
Special Charges
See separate discussion under “2006 Compared to 2005” within this Management’s Discussion and Analysis.
Operating Income
Operating income increased 7% primarily due to higher sales levels and $5.8 million of lower pretax special charges (including amounts charged to Cost of goods sold). Operating margins of 10.8% in 2005 were relatively flat compared to 10.7% in 2004 as a result of higher sales, improved gross profit margins and lower special charges, partially offset by higher S&A expenses.
Other Income/Expense
In 2005, investment income increased $3.0 million versus 2004 due to higher average cash and investment balances and higher average interest rates earned on cash and investments. Interest income in 2004 also included $1.0 million related to a tax settlement in the prior year. Interest expense was $19.3 million in 2005 compared to $20.6 million in 2004. The decrease was due to a lower level of fixed rate indebtedness in 2005 compared to 2004. In October 2005, we repaid $100 million of senior notes upon maturity. Other income (expense), net, in 2005 was $1.3 million of expense compared to $1.2 million of expense in 2004.
Income Taxes
Our effective tax rate was 23.5% in 2005 compared to 21.6% in 2004. The 2005 consolidated effective tax rate reflected the impact of tax benefits of $10.8 million recorded in connection with the closing of an IRS examination of the Company’s 2002 and 2003 tax returns. The 2004 rate reflected the impact of tax benefits of $10.2 million recorded in connection with the closing of an IRS examination of our tax returns through 2001, which included refund claims for the years 1995 through 2000 related to research and development activities during these years. These benefits reduced the statutory tax rate by 5.1 percentage points and 5.3 percentage points in 2005 and 2004, respectively.
We have certain operations in Puerto Rico that were eligible for U.S. tax benefits under Section 936/30A of the Internal Revenue Code. The U.S. federal tax benefits derived from our Puerto Rico operations expired on December 31, 2005. We converted our Puerto Rico operations to two wholly-owned, controlled foreign corporations and shifted more production to low cost sources. We intend to permanently reinvest the earnings from these operations outside the U.S. As permitted in APB Opinion No. 23, “Accounting for Income Taxes,” we do not provide U.S. income taxes on a controlled foreign corporation’s undistributed earnings that are intended to be permanently reinvested outside the U.S. Therefore, our effective tax rate following expiration of these tax benefits should reflect the permanent reinvestment of these foreign earnings outside the U.S. See further information in Note 13 — Income Taxes in the Notes to Consolidated Financial Statements.
Net Income and Earnings Per Share
Net income and diluted earnings per share in 2005 improved versus 2004 as a result of higher net sales, lower special charges and favorable other income/expense, partially offset by higher S&A expenses and an increase in the effective tax rate.
Segment Results
Electrical Segment
| | | | | | | | | |
| | | 2005 | | | 2004 | |
| | | (In millions) | |
| |
| Net Sales | | $ | 1,496.8 | | | $ | 1,476.8 | |
| Operating Income | | $ | 142.7 | | | $ | 156.7 | |
| Operating Margin | | | 9.5 | % | | | 10.6 | % |
28
Electrical segment net sales increased 1% in 2005 versus 2004 primarily as a result of higher selling prices which were partially offset by lower unit volumes. Higher selling prices were implemented and had been realized in most of the businesses within the segment in an effort to recover cost increases, primarily related to higher raw material, energy and freight costs.
Lighting fixture sales represented in excess of 50% of total net sales reported in the Electrical segment in both 2005 and 2004. Sales of lighting fixtures declined modestly as lower shipments of commercial and industrial lighting fixtures were substantially offset by higher residential fixture sales. Residential products benefited from the continued favorable market conditions due in part to historically low mortgage interest rates and market share gains. The C&I lighting businesses were negatively impacted by lower levels of construction projects in the U.S. which had intensified competitiveness and made price realization difficult.
Wiring system sales were level with sales reported in the comparable prior year period as stronger industrial market demand was offset by weak commercial markets. Wiring systems sales are believed to be below the levels of improvement in the underlying markets served by this business due in part to lower order input levels and inefficiencies associated with the closure of a factory, outsourcing and the SAP business system implementation.
Rough-in electrical sales increased mainly as a result of higher selling prices, partially offset by lower volume due to weak commercial markets. Sales of harsh and hazardous products increasedyear-over-year by double digits primarily due to higher oil and gas project shipments related to strong market conditions worldwide.
Operating margin in the segment was lower in 2005 versus 2004 primarily due to unabsorbed costs in our manufacturing facilities resulting from lower unit volumes, as well as higher commodity raw material, freight and utility costs which were not fully offset by selling price increases. As part of our lighting integration and rationalization program, we were engaged in plant relocations that had temporarily added costs and lowered factory efficiencies. In addition, operating margins in our wiring systems business were negatively affectedyear-over-year versus 2004 by higher costs and training and processing inefficiencies associated with the implementation of the SAP business system as well as a factory closure. Wiring systems also incurred higher than normal costs associated with new product programs. Harsh and hazardous margins were higheryear-over-year, consistent with increases in sales, due to higher order input levels and a better mix of sales. Overall, the segment incurred higher S&A expensesyear-over-year due to new product initiatives, office consolidations and higher SAP amortization charges, partially offset by a $4.9 million pretax gain on sale of a building. Special charges in 2005 were lower by $5.8 million compared with 2004. See discussions above under “Special Charges”.
Power Segment
| | | | | | | | | |
| | | 2005 | | | 2004 | |
| | | (In millions) | |
| |
| Net Sales | | $ | 455.6 | | | $ | 386.2 | |
| Operating Income | | $ | 69.0 | | | $ | 41.2 | |
| Operating Margin | | | 15.1 | % | | | 10.7 | % |
Power segment net sales increased 18% in 2005 versus the prior year due to the carryover effect of price increases, the addition of two acquisitions and higher storm-related shipments. Price increases were implemented across most product lines throughout 2004 and into 2005 where costs had risen due to increased metal and energy costs. We estimate that price increases accounted for approximately one-third of theyear-over-year sales increase. Two acquisitions accounted for approximately 5 percentage points of theyear-over-year increase and incremental storm-related shipments comprised another 3 percentage points of the improvement.
Operating margins improved in 2005 versus 2004 as a result of the increase in volume, an improved mix of higher margin products, productivity improvements including strategic sourcing and lean programs and selling price increases realized above the comparable level of cost increases.
29
Industrial Technology Segment
| | | | | | | | | |
| | | 2005 | | | 2004 | |
| | | (In millions) | |
| |
| Net Sales | | $ | 152.5 | | | $ | 130.0 | |
| Operating Income | | $ | 20.4 | | | $ | 14.7 | |
| Operating Margin | | | 13.4 | % | | | 11.3 | % |
Industrial Technology segment net sales increased 17% in 2005 versus 2004 as many of the businesses within this segment benefited from strong oil and gas markets and improvement in industrial market activity as evidenced by rising capacity utilization rates. This segment’s technology-oriented high voltage test equipment increasedyear-over-year sales by double-digits. In addition, we acquired two businesses which accounted for approximately 5 percentage points of the segment sales increase. Operating income and margins for the full year 2005 improved versus 2004 primarily as a result of increased volume, productivity improvements and a more favorable product mix. Acquisitions had only a modest impact on theyear-over-year profitability improvement in the segment as a result of costs incurred to integrate the acquired operations into existing segment facilities.
LIQUIDITY AND CAPITAL RESOURCES
Cash Flow
| | | | | | | | | | | | | | | | | | | | | |
| | | December 31, | | | December 31, | |
| | | 2006 | | 2005 | | | 2007 | | 2006 | | 2005 | |
| | | (In millions) | | | (In millions) | |
| |
| Net cash provided by (used in): | | | | | | | | | | | | | | | | | | | | |
| Operating activities | | $ | 139.9 | | | $ | 184.1 | | | $ | 335.2 | | | $ | 139.9 | | | $ | 184.1 | |
| Investing activities | | | (66.7 | ) | | | (30.4 | ) | | | (105.7 | ) | | | (66.7 | ) | | | (30.4 | ) |
| Financing activities | | | (139.6 | ) | | | (182.1 | ) | | | (200.4 | ) | | | (139.6 | ) | | | (182.1 | ) |
| Foreign exchange effect on cash | | | 1.1 | | | | (0.9 | ) | | | 3.1 | | | | 1.1 | | | | (0.9 | ) |
| | | | | | | | | | | | | |
| Net change in cash and cash equivalents | | $ | (65.3 | ) | | $ | (29.3 | ) | | $ | 32.2 | | | $ | (65.3 | ) | | $ | (29.3 | ) |
| | | | | | | | | | | | | |
2007 Compared to 2006
Cash provided by operating activities in 2007 was $195.3 million higher than cash provided by operating activities in 2006 as a result of an increased focus in 2007 on working capital, specifically inventory and improved profitability. Inventory decreased $24.2 million in 2007 compared to a build of inventory of $86.3 million in 2006 primarily attributable to a better utilization of the SAP system, including standardizing best practices in inventory management, production planning and scheduling. Accounts receivable balances decreased by $27.8 million in 2007 compared to an increase of $30.7 million in 2006 due to improved collection efforts related in part to better utilization of the SAP system. Current liability balances in 2007 were higher than in 2006 primarily as a result of an increase in deferred revenue in 2007 due to cash received in advance primarily in the Industrial Technology segment and higher employee related compensation. However, contributions to defined benefit pension plans resulted in an increased use of cash of $20.7 million in 2007 compared to 2006.
Cash flows from investing activities used an additional $39 million of cash in 2007 compared to 2006. Purchases and maturities/sales of investments used net cash of $2.6 million in 2007 compared to $163.8 million of net cash proceeds in 2006. Investing activities include capital expenditures of $55.9 million in 2007 compared to $86.8 million in 2006. The $30.9 million decrease is primarily the result of completion of the new lighting headquarters in early 2007 and lower implementation costs associated with the enterprise-wide business system. Cash outlays to acquire new businesses decreased $92.8 million in 2007 compared to 2006.
Financing activities used $200.4 million of cash in 2007 compared to $139.6 million in 2006. During 2007, the Company repurchased approximately 3.6 million shares of its common stock for $193.1 million compared to 2.1 million shares repurchased in 2006 for $95.1 million. Net borrowings of short-term debt were $15.8 million in
27
2007 compared to net repayments of $8.9 million in 2006. Proceeds from stock options were $48.0 million in 2007 compared to $38.5 million in 2006.
2006 Compared to 2005
Cash provided by operating activities in 2006 of $139.9 million was $44.2 million or 24% lower than cash provided by operating activities in 2005 primarily as a result of higher levels of inventory and accounts receivable. Cash used to fund an increase in inventory was $86.3 million in 2006 compared with $13.2 million in 2005. Accounts receivable balances increased by $30.7 million in 2006 compared to an increase of $16.9 million in 2005. Partially offsetting these increases were the lack of a contribution to our domestic, qualified, defined benefit pension plans in 2006 compared to a $28 million payment in 2005, and higher current liability balances resulting in a source of cash of approximately $13.3 million in 2006 compared to $2 million in 2005. Inventory balances increased in 2006 primarily due to a combination of business inefficiencies associated with the system implementation and new product launches. Higher accounts receivable arewere due to a higher level of sales in the fourth quarter of 2006 compared with the same period of 2005. Current liability balances in 2006 were higher than in 2005 primarily as a result of higher customer incentives and employee related compensation. Included within cash provided by operating activities arewere income tax benefits from employee exercises of stock options of $7.8 million in 2005.
Cash flows from investing activities includeincluded capital expenditures of $86.8 million in 2006 compared to $73.4 million in 2005. The $13.4 million increase iswas attributed to higher expenditures primarily in connection with construction of the new lighting headquarters for which expenditures increased $14.2 millionyear-over-year. In addition, incremental investments in equipment were partially offset by $7.6 million of lower capital expenditures for software, principally related to the system implementation. Cash outlays to acquire new businesses totaled $145.7 million in 2006 compared to $54.3 million in 2005. Purchases and maturities/sales of investments provided net cash proceeds of $163.8 million in 2006 compared to net cash proceeds of $81.1 million in 2005. Proceeds from disposition of assets decreased to $0.6 million in 2006 compared to $14.6 million in 2005 with the prior year amount reflecting proceeds from a building sale in the Electrical segment.
30
Financing cash flows used $139.6 million of cash in 2006 compared to $182.1 million in 2005. Cash used in 2005 reflectsreflected the repayment of $100.0 million of senior notes at maturity. Net repayments of short-term debt were $8.9 million in 2006 compared to net borrowings of $28.4 million in 2005. The prior year included borrowingborrowings related to international acquisitions and dividend repatriations. Purchases of common shares increased in 2006 to $95.1 million compared to $62.7 million in 2005. Proceeds from stock options were $38.5 million in 2006 compared to $32.8 million in 2005.
Investments in the Business
We define investments in our business to include both normal expenditures required to maintain the operations of our equipment and facilities as well as expenditures in support of our strategic initiatives.
Capital expenditures were $93.7$55.9 million including non-expended cash of $6.9 million atfor the year ending December 31, 2006.2007. Additions to property, plant, and equipment were $55.1 million in 2007 compared to $79.6 million in 2006 compared to $51.7 million in 2005 as a result of increasedlower investments made in buildings and equipment.equipment due to the completion of the new lighting headquarters. We capitalized $8 million and $26 million in 2007 and $6 million in 2006, and 2005, respectively, in connection with the new lighting headquarters. In 20062007 and 2005,2006, we capitalized $14.1$0.8 million and $20.5$14.1 million of software, respectively, primarily in connection with our business information system initiative (recorded in Intangible assets and other in the Consolidated Balance Sheet).
In 2006,2007, we spent a total of $145.7$52.9 million on new acquisitions, net of cash acquired, including $0.2$0.7 million from a prior year acquisition. These 2006 acquisitions areThe 2007 acquisition of PCORE is expected to provide approximately $106$28 million of annual net sales of which approximately 24% will be added to our Industrial Technology and 76% will be added to our Power segment. TheseIn 2006, we completed two business acquisitions, one in our Power segment and the other in our Industrial Technology segment for a total of $145.7 million, net of cash acquired and including $0.2 million from a 2005 acquisition. All of these acquisitions are part of our core markets growth strategy. In 2005, we completed five small but strategic business acquisitions, two in our Power segment, two in our Industrial Technology segment and one in our Electrical segment.
In 2006,2007, we spent a total of $95.1$193.1 million on the repurchase of common shares compared to $62.7$95.1 million spent in 2005.2006. These repurchases were executed under Board of Director approved stock repurchase programs which authorized the repurchase of our Class A and Class B Common Stock up to certain dollar amounts. In
28
February 2006,2007, the Board of Directors approved a stock repurchase program and authorized the repurchase of up to $100$200 million of the Company’s Class A and Class B Common Stock which expires after three years. As of December 31, 2006, this program had approximately $50.7 million remaining to be purchased.completed over a two year period. In FebruaryDecember 2007, the Board of Directors approved a new stock repurchase program and authorized the repurchase of up to $200 million of Class A and Class B Common Stock to be completed over the nexta two years.year period. This program will be implemented upon completion of the February 20062007 program. Stock repurchases are being implemented through open market and privately negotiated transactions. The timing of such transactions depends on a variety of factors, including market conditions. Additional information with respect to share repurchases is included in Part II, Item 5 of this Annual Report onForm 10-K.
Additional information with respect to future investments in the business can be found under “Outlook” within Management’s Discussion and Analysis.
Capital Structure
Debt to Capital
Net debt as disclosed below is a non-GAAP measure that may not be comparable to definitions used by other companies. We consider Net debt to be more appropriate than Total Debt for measuring our financial leverage as it better measures our ability to meet our funding needs.
31
| | | | | | | | | | | | | | | | | |
| | | December 31, | | | December 31, | |
| | | 2006 | | 2005 | | | 2007 | | 2006 | |
| | | (In millions) | | | (In millions) | |
| |
| Total Debt | | $ | 220.2 | | | $ | 228.8 | | | $ | 236.1 | | | $ | 220.2 | |
| Total Shareholders’ Equity | | | 1,015.5 | | | | 998.1 | | | | 1,082.6 | | | | 1,015.5 | |
| | | | | | | | | | | |
| Total Capitalization | | $ | 1,235.7 | | | $ | 1,226.9 | | | $ | 1,318.7 | | | $ | 1,235.7 | |
| | | | | | | | | | | |
| Debt to Total Capital | | | 18 | % | | | 19 | % | | | 18 | % | | | 18 | % |
| | | | | | | | | | | |
| Cash and Investments | | $ | 81.5 | | | $ | 310.7 | | | $ | 116.7 | | | $ | 81.5 | |
| | | | | | | | | | | |
| Net Debt (Total debt less cash and investments) | | $ | 138.7 | | | $ | (81.9 | ) | | $ | 119.4 | | | $ | 138.7 | |
| | | | | | | | | | | |
Net debt defined as total debt less cash and investments increaseddecreased as a result of lowerhigher cash and investments in 20062007 compared to 2005 due principally to financing required for acquisitions and share repurchases.2006.
Debt Structure
| | | | | | | | | | | | | | | | | |
| | | December 31, | | | December 31, | |
| | | 2006 | | 2005 | | | 2007 | | 2006 | |
| | | (In millions) | | | (In millions) | |
| |
| Short-term debt | | $ | 20.9 | | | $ | 29.6 | | | $ | 36.7 | | | $ | 20.9 | |
| Long-term debt | | | 199.3 | | | | 199.2 | | | | 199.4 | | | | 199.3 | |
| | | | | | | | | | | |
| Total Debt | | $ | 220.2 | | | $ | 228.8 | | | $ | 236.1 | | | $ | 220.2 | |
| | | | | | | | | | | |
At December 31, 2006,2007, Short-term debt in our Consolidated Balance Sheet consisted of $36.7 million of commercial paper. Commercial paper is used to help fund working capital needs, in particular inventory purchases. At December 31, 2006, Short-term debt consisted of $15.8 million of commercial paper and $5.1 million of a money market loan. Commercial paper is used to help fund working capital needs, in particular inventory purchases. The money market loan represents a line of credit to borrow up to 5.0 million pounds sterling (U.S. $ equivalent of $9.8 million at December 31, 2006). This loan which expires on July 8, 2007 provides for an interest rate of one-half of one percentage point above the London Interbank Offered Rate (“LIBOR”). At December 31, 2005, Short-term debt consisted of a $7.5 million money market loan, $22.0 million of borrowingswas drawn down against our credit facility and $0.1 million of other borrowings. The money market loan represented a line of credit to borrow up to 5.0 million pounds sterling (U.S. $ equivalent at December 31, 20052006 was $8.8$9.8 million). Borrowings of $22.0 million were drawn against our $200 million credit facility and used along with available cash to repatriate foreign earnings from one of our foreign subsidiaries under the provisions of the American Jobs Creation Act of 2004.
At December 31, 20062007 and 2005,2006, Long-term debt in our Consolidated Balance Sheet consisted of $200 million, excluding unamortized discount, of senior notes with a maturity date of 2012. These notes are fixed rate indebtedness, are not callable and are only subject to accelerated payment prior to maturity if we fail to meet certain non-financial covenants, all of which were met at December 31, 20062007 and 2005.2006. The most restrictive of these covenants limits our ability to enter into mortgages and sale-leasebacks of property having a net book value in excess of $5 million without the approval of the Note holders. In 2002, prior to the issuance of the $200 million notes, we entered into a forward interest rate lock to hedge our exposure to fluctuations in treasury interest rates,
29
which resulted in a loss of $1.3 million in 2002. This amount was recorded in Accumulated other comprehensive income (loss) and is being amortized over the life of the notes.
At December 31, 2006,In October 2007, we hadentered into a revised five year, $250 million revolving credit facility to replace the previous $200 million of available borrowings under our $200 million committed bank credit facility. This credit facility serves as a back upwhich was scheduled to our commercial paper program and will expire in October 2009. BorrowingsThere have been no material changes from the previous facility other than the amount. The interest rate applicable to borrowings under thisthe new credit agreement generally are available with an interest rate equal tois either the prime rate or at a spreadsurcharge over LIBOR. The covenants of the new facility require that shareholders’ equity be greater than $675 million and that total debt not exceed 55% of total capitalization (defined as total debt plus total shareholders’ equity). We were in compliance with all debt covenants at December 31, 2007 and 2006. Annual commitment fee requirements to support availability of the credit facility total approximately $0.2 million.were not material. This facility is used as a backup to our commercial paper program and was unused as of December 31, 2007.
Although these facilities are not the principal source of our liquidity, we believe these facilities are capable of providing adequate financing at reasonable rates of interest. However, a significant deterioration in results of operations or cash flows,
32
leading to deterioration in financial condition, could either increase our future borrowing costs or restrict our ability to sell commercial paper in the open market. We have not entered into any other guarantees, commitments or obligations that could give rise to unexpected cash requirements.
Liquidity
We measure our liquidity on the basis of our ability to meet short-term and long-term operational funding needs, fund additional investments, including acquisitions, and make dividend payments to shareholders. Significant factors affecting the management of liquidity are the level of cash flows from operating activities, capital expenditures, access to bank lines of credit and our ability to attract long-term capital with satisfactory terms.
Normal internal cash generation from operations together with currently available cash and investments, available borrowing facilities, and an ability to access credit lines, if needed, are expected to be more than sufficient to fund operations, the current rate of dividends, capital expenditures, stock repurchases and any increase in working capital that would be required to accommodate a higher level of business activity. We actively seek to expand by acquisition as well as through the growth of our present businesses. While a significant acquisition may require additional borrowings, we believe we would be able to obtain financing based on our favorable historical earnings performance and strong financial position.
Pension Funding Status
We have a number of funded and unfunded non-contributory U.S. and foreign defined benefit pension plans. Benefits under these plans are generally provided based on either years of service and final average pay or a specified dollar amount per year of service. The funded status of our qualified, defined benefit pension plans is dependant upon many factors including future returns on invested pension assets, the level of market interest rates, employee earnings and employee demographics.
Effective December 31, 2006, the Company adopted the provisions of SFAS No. 158 which required the Company to recognize the funded status of its defined benefit pension and postretirement plans as an asset or liability in its Consolidated Balance Sheet. Gains or losses, prior service costs or credits, and transition assets or obligations that have not yet been included in net periodic benefit cost as ofIn 2007, the end of the year of adoption are recognized as components of the ending balance ofCompany recorded a total credit to equity through Accumulated other comprehensive income, net of tax, within Shareholders’ equity. As a resultrelated to pension and postretirement plans of the adoption$44.9 million, of SFAS 158,which $42.0 million is related to pensions. In 2006, the Company recorded a charge to equity through Accumulated other comprehensive income related to pensions of $36.1 million of a total charge to equity of $36.8 million, including amounts for other postretirement benefits.net of tax, of which $36.1 million is related to pension. Further details on the pretax impact of this chargethese items can be found in Note 11 — Retirement Benefits.
Changes in the value of the defined benefit plan assets and liabilities will affect the amount of pension expense ultimately recognized. Although differences between actuarial assumptions and actual results are no longer deferred for balance sheet purposes, deferral is still required for pension expense purposes. Unrecognized gains and losses in excess of an annual calculated minimum amount (the greater of 10% of the projected benefit obligation or 10% of the market value of assets) are amortized and recognized in net periodic pension cost over our average remaining service period of active employees, which approximates13-15 years. During 2006,2007, we recorded $3.8
30
$1.9 million of pension expense related to the amortization of these unrecognized losses. We expect to record $2.1$1.3 million of expense related to unrecognized losses in 2007.2008.
The actual return on our pension assets in the current year as well as the cumulative return over the past five and ten year periods has exceeded our expected return for the same periods. Offsetting these favorable returns has been a decline in long-term interest rates and a resulting increase in our pension liabilities. These declines in long-term interest rates have had a negative impact on the funded status of the plans. Consequently, we contributed $25approximately $28 million in 20042007, $8 million in 2006 and $28$32 million in 2005 to both our foreign and domestic defined benefit pension plans. No contribution was made to our domestic, defined benefit pension plans during 2006. In addition to these contributions to our U.S. plans, additional contributions have also been made to our foreign defined benefit plans of approximately $6.0 million, $3.5 million and $7.7 million for the years 2004, 2005 and 2006, respectively. These contributions along with favorable investment performance of the plan assets have improved the funded status of all of our plans. In the first quarter of 2007, we made a $15 million contribution to our domestic, qualified, defined benefit plans and we do not expect to
33
contribute any additional amounts to our domestic qualified plans for the balance of 2007. We expect to make additional contributions of between $5-$7approximately $7 million to our foreign plans later this year.during 2008 and no contributions are expected to be made to the domestic defined benefit pension plans. This level of funding is not expected to have any significant impact on our overall liquidity.
Assumptions
The following assumptions were used to determine projected pension and other benefit obligations at the measurement date and the net periodic benefit costs for the year:
| | | | | | | | | | | | | | | | | | | | | | | | | | | | | | | | | |
| | | Pension Benefits | | Other Benefits | | | Pension Benefits | | Other Benefits | |
| | | 2006 | | 2005 | | 2006 | | 2005 | | | 2007 | | 2006 | | 2007 | | 2006 | |
| |
Weighted-average assumptions used to determine benefit obligations at December 31 | | | | | | | | | | | | | | | | | | | | | | | | | | | | | | | | |
| Discount rate | | | 5.66 | % | | | 5.45 | % | | | 5.75 | % | | | 5.50 | % | | | 6.41 | % | | | 5.66 | % | | | 6.50 | % | | | 5.75 | % |
| Rate of compensation increase | | | 4.33 | % | | | 4.25 | % | | | N/A | | | | N/A | | | | 4.58 | % | | | 4.33 | % | | | N/A | | | | N/A | |
Weighted-average assumptions used to determine net periodic benefit cost for years ended December 31 | | | | | | | | | | | | | | | | | | | | | | | | | | | | | | | | |
| Discount rate | | | 5.45 | % | | | 5.75 | % | | | 5.50 | % | | | 5.75 | % | | | 5.66 | % | | | 5.45 | % | | | 5.75 | % | | | 5.50 | % |
| Expected return on plan assets | | | 8.00 | % | | | 8.00 | % | | | N/A | | | | N/A | | | | 8.00 | % | | | 8.00 | % | | | N/A | | | | N/A | |
| Rate of compensation increase | | | 4.33 | % | | | 4.25 | % | | | N/A | | | | N/A | | | | 4.58 | % | | | 4.33 | % | | | N/A | | | | N/A | |
At the end of each year, we estimate the expected long-term rate of return on pension plan assets based on the strategic asset allocation for our plans. In making this determination, we utilize expected rates of return for each asset class based upon current market conditions and expected risk premiums for each asset class. A one percentage point change in the expected long-term rate of return on pension fund assets would have an impact of approximately $5.3$6.1 million on 20072008 pretax pension expense. The expected long-term rate of return is applied to the fair market value of pension fund assets to produce the expected return on fund assets that is included in pension expense. The difference between this expected return and the actual return on plan assets was recognized at December 31, 20062007 for balance sheet purposes, but continues to be deferred for expense purposes. The net deferral of past asset gains (losses) ultimately affects future pension expense through the amortization of gains (losses) with an offsetting adjustment to Shareholders’ equity through Accumulated other comprehensive income.
At the end of each year, we determine the discount rate to be used to calculate the present value of pension plan liabilities. The discount rate is an estimate of the current interest rate at which the pension plans’ liabilities could effectively be settled. In estimating this rate, we look to rates of return on high-quality, fixed-income investments with maturities that closely match the expected funding period of our pension liability. The discount rate of 5.75%6.5% which we used to determine the projected benefit obligation for our U.S. pension plans at December 31, 20062007 was determined using the Citigroup Pension Discount Curve applied to our expected annual future pension benefit payments. An increase of one percentage point in the discount rate would lower 20072008 pretax pension expense by approximately $2.0$2.4 million. A discount rate decline of one percentage point would increase pretax pension expense by approximately $5.8$5.4 million.
Our Shareholders’ equity is impacted by a variety of factors, including those items that are not reported in earnings but are reported directly in equity. In 2003 and 2004, we recorded increases to Shareholders’ equity of $8.3 million and $2.2 million, respectively, reflecting a reduction of the pension plan additional minimum liability. In 2005, we increased the additional minimum liability by $2.2 million. In 2006, prior to the adoption of SFAS No. 158, we recorded a reduction of $2.1 million, net of tax, of the additional minimum liability. Effective with the adoption of SFAS No. 158 at December 31, 2006, the balance in the additional minimum liability account was reversed and an incremental charge related to pensions of $36.1 million, net of tax, was recorded.
Other Post Employment Benefits (“OPEB”)
We had health care and life insurance benefit plans covering eligible employees who reached retirement age while working for the Company. These benefits were discontinued in 1991 for substantially all future retirees with
31
the exception of certain operations in our Power segment which still maintain a limited retiree medical plan for their
34
union employees. These plans are not funded and, therefore, no assumed rate of return on assets is required. The discount rate of 5.75%6.5% used to determine the projected benefit obligation at December 31, 20062007 was based upon the Citigroup Pension Discount Curve as applied to our projected annual benefit payments for these plans. The impact of adoption ofIn 2007 in accordance with SFAS No. 158 on OPEB was a net chargewe recorded credits to Accumulated other comprehensive income within Shareholders’ equity, net of tax, of $0.7$2.9 million. In 2006, we recorded a charge of 0.7 million, net of tax, related to OPEB.
Off-Balance Sheet Arrangements
Off-balance sheet arrangements are defined as any transaction, agreement or other contractual arrangement to which an entity that is not included in our consolidated results is a party, under which we, whether or not a party to the arrangement, have, or in the future may have: (1) an obligation under a direct or indirect guarantee or similar arrangement, (2) a retained or contingent interest in assets or (3) an obligation or liability, including a contingent obligation or liability, to the extent that it is not fully reflected in the financial statements.
We do not have any off-balance sheet arrangements as defined above which have or are likely to have a material effect on financial condition, results of operations or cash flows.
Contractual Obligations
A summary of our contractual obligations and commitments at December 31, 20062007 is as follows (in millions):
| | | | | | | | | | | | | | | | | | | | | | | | | | | | | | | | | | | | | | | | | | | | |
| | | | | Payments due by period | | | | | | | Payments due by period | |
| | | | | Less than
| | | | | | More than
| | | | | | | Less than
| | | | | | More than
| |
Contractual Obligations | | Total | | 1 Year | | 1-3 Years | | 4-5 Years | | 5 Years | | | | | Total | | 1 Year | | 1-3 Years | | 4-5 Years | | 5 Years | |
| |
| Debt obligations | | $ | 220.9 | | | $ | 20.9 | | | $ | — | | | $ | — | | | $ | 200.0 | | | | | | | $ | 236.7 | | | $ | 36.7 | | | $ | — | | | $ | 200.0 | | | $ | — | |
| Expected interest payments | | | 68.8 | | | | 12.8 | | | | 25.6 | | | | 25.6 | | | | 4.8 | | | | | | | | 55.8 | | | | 12.8 | | | | 25.5 | | | | 17.5 | | | | — | |
| Operating lease obligations | | | 43.0 | | | | 8.6 | | | | 11.9 | | | | 6.7 | | | | 15.8 | | | | | | | | 57.9 | | | | 12.6 | | | | 18.2 | | | | 7.0 | | | | 20.1 | |
| Purchase obligations | | | 208.7 | | | | 197.2 | | | | 8.3 | | | | 3.2 | | | | — | | | | | | | | 134.2 | | | | 125.7 | | | | 7.7 | | | | 0.8 | | | | — | |
| Income tax payments | | | 2.3 | | | | 2.3 | | | | — | | | | — | | | | — | | | | | | | | 0.6 | | | | 0.6 | | | | — | | | | — | | | | — | |
| Obligations under customer incentive programs | | | 28.1 | | | | 28.1 | | | | — | | | | — | | | | — | | | | | | | | 25.2 | | | | 25.2 | | | | — | | | | — | | | | — | |
| | | | | | | | | | | | | | | | | | | | | | | |
| Total | | $ | 571.8 | | | $ | 269.9 | | | $ | 45.8 | | | $ | 35.5 | | | $ | 220.6 | | | | | | | $ | 510.4 | | | $ | 213.6 | | | $ | 51.4 | | | $ | 225.3 | | | $ | 20.1 | |
| | | | | | | | | | | | | | | | | | | | | | | |
Our purchase obligations include amounts committed under legally enforceable contracts or purchase orders for goods and services with defined terms as to price, quantity, delivery and termination liability. These obligations primarily consist of inventory purchases made in the normal course of business to meet operational requirements, contracts for the construction of the lighting headquarters, consulting arrangements and commitments for equipment purchases. Other long-term liabilities reflected in our Consolidated Balance Sheet at December 31, 20062007 have been excluded from the table above and primarily consist of costs associated with retirement benefits. See Note 11 — Retirement Benefits in the Notes to Consolidated Financial Statements for estimates of future benefit payments under our benefit plans. As of December 31, 2007, we have $8.7 million of uncertain tax positions. We are unable to make a reasonable estimate regarding settlement of these uncertain tax positions, and as a result, they have been excluded from the table. See Note 13 — Income Taxes.
Critical Accounting Estimates
Note 1 of the Notes to Consolidated Financial Statements describes the significant accounting policies used in the preparation of our financial statements.
Use of Estimates
We are required to make assumptions and estimates and apply judgments in the preparation of our financial statements that affect the reported amounts of assets and liabilities, revenues and expenses and related disclosures. We base our assumptions, estimates and judgments on historical experience, current trends and other factors
32
deemed relevant by management. We continually review these estimates and their underlying assumptions to ensure they are appropriate for the circumstances. Changes in estimates and assumptions used by us could have a
35
significant impact on our financial results. We believe that the following estimates are among our most critical in fully understanding and evaluating our reported financial results. These items utilize assumptions and estimates about the effect of future events that are inherently uncertain and are therefore based on our judgment.
Revenue Recognition
We recognize revenue in accordance with SEC Staff Accounting Bulletin No. 101, “Revenue Recognition in Financial Statements” and the SEC revisions in SEC Staff Accounting Bulletin No. 104. Revenue is recognized when title to goods and risk of loss have passed to the customer, there is persuasive evidence of a purchase arrangement, delivery has occurred or services are rendered, the price is determinable and collectibility reasonably assured. Revenue is typically recognized at the time of shipment. Further, certain of our businesses account for sales discounts and allowances based on sales volumes, specific programs and customer deductions, as is customary in electrical products markets. These items primarily relate to sales volume incentives, special pricing allowances, and returned goods. This requires us to estimate at the time of sale the amounts that should not be recorded as revenue as these amounts are not expected to be collected in cash from customers. We principally rely on historical experience, specific customer agreements, and anticipated future trends to estimate these amounts at the time of shipment. Also see Note 1 — Significant Accounting Policies of the Notes to Consolidated Financial Statements.
Inventory Valuation
We routinely evaluate the carrying value of our inventories to ensure they are carried at the lower of cost or market value. Such evaluation is based on our judgment and use of estimates, including sales forecasts, gross margins for particular product groupings, planned dispositions of product lines, technological events and trends and overall industry trends. In addition, the evaluation is based on changes in inventory management practices which may influence the timing of exiting products and method of disposing of excess inventory.
Excess inventory is generally identified by comparing future expected inventory usage to actual on-hand quantities. Reserves are provided for on-hand inventory in excess of pre-defined usage forecasts. Forecast usage is primarily determined by projecting historical (actual) sales and inventory usage levels forward to future periods. Application of this reserve methodology can have the effect of increasing reserves during periods of declining demand and, conversely, reducing reserve requirements during periods of accelerating demand. This reserve methodology is applied based upon a current stratification of inventory, whether by commodity type, product family, part number, stock keeping unit, etc. As a result of our lean process improvement initiatives, we continue to develop improved information concerning demand patterns for inventory consumption. This improved information is introduced into the excess inventory reserve calculation as it becomes available and may impact required levels of reserves.
Customer Credit and Collections
We maintain allowances for doubtful accounts receivable in order to reflect the potential uncollectibility of receivables related to purchases of products on open credit. If the financial condition of our customers were to deteriorate, resulting in their inability to make required payments, we may be required to record additional allowances for doubtful accounts.
Capitalized Computer Software Costs
We capitalize certain costs of internally developed software in accordance with Statement of Position98-1, “Accounting for the Costs of Computer Software Developed or Obtained for Internal Use”. Capitalized costs include purchased materials and services, and payroll and payroll related costs. General and administrative, overhead, maintenance and training costs, as well as the cost of software that does not add functionality to the existing system, are expensed as incurred. The cost of internally developed software is amortized on a straight-line basis over appropriate periods, generally five years. The unamortized balance of internally developed software is included in Intangible assets and other in the Consolidated Balance Sheet.
3633
Employee Benefits Costs and Funding
We sponsor domestic and foreign defined benefit pension, defined contribution and other postretirement plans. Major assumptions used in the accounting for these employee benefit plans include the discount rate, expected return on the pension fund assets, rate of increase in employee compensation levels and health care cost increase projections. These assumptions are determined based on Company data and appropriate market indicators, and are evaluated each year as of the plans’ measurement date. Further discussion on the assumptions used in 20052007 and 2006 are included above under “Pension Funding Status” and in Note 11 — Retirement Benefits in the Notes to Consolidated Financial Statements.
Taxes
We account for income taxes in accordance with SFAS No. 109, “Accounting for Income Taxes” whichand FASB Interpretation No. (“FIN”) 48, “Accounting for Uncertainty in Income Taxes — an interpretation of FASB Statement No. 109”. SFAS No. 109 requires that deferred tax assets and liabilities be recognized using enacted tax rates for the effect of temporary differences between the book and tax basis of recorded assets and liabilities. SFAS No. 109 also requires that deferred tax assets be reduced by a valuation allowance if it is more likely than not that some portion or all of the deferred tax asset will not be realized. The factors used to assess the likelihood of realization of deferred tax assets are the forecast of future taxable income and available tax planning strategies that could be implemented to realize the net deferred tax assets. Failure to achieve forecasted taxable income can affect the ultimate realization of net deferred tax assets.
In addition, weWe operate within multiple taxing jurisdictions and are subject to audit in these jurisdictions. The IRS and other tax authorities routinely review our tax returns. These audits can involve complex issues, which may require an extended period of time to resolve. In accordance with FIN 48, effective January 1, 2007, the Company records uncertain tax positions only when it has determined that it is more-likely-than-not that a tax position will be sustained upon examination by taxing authorities based on the technical merits of the position. The impactCompany uses the criteria established in FIN 48 to determine whether an item meets the definition of more-likely-than-not. The Company’s policy is to recognize these examinations on our liability for income taxes cannot be presently determined.tax benefits when the more-likely-than-not threshold is met, when the statute of limitations has expired or upon settlement. In management’s opinion, adequate provision has been made for potential adjustments arising from theseany examinations.
Contingent Liabilities
We are subject to proceedings, lawsuits, and other claims or uncertainties related to environmental, legal, product and other matters. We routinely assess the likelihood of an adverse judgment or outcome to these matters, as well as the range of potential losses. A determination of the reserves required, if any, is made after careful analysis, including consultations with outside advisors, where applicable. The required reserves may change in the future due to new developments.
Valuation of Long-Lived Assets
Our long-lived assets include land, buildings, equipment, molds and dies, software, goodwill and other intangible assets. Long-lived assets, other than goodwill and indefinite-lived intangibles, are depreciated over their estimated useful lives. We review depreciable long-lived assets for impairment to assess recoverability from future operations using undiscounted cash flows. For these assets, no impairment charges were recorded in 20062007 or 2005,2006, except for certain assets affected by the lighting integration programLighting Program as discussed under “Special Charges” within this Management’s Discussion and Analysis and in Note 2 — Special Charges of the Notes to Consolidated Financial Statements.
Goodwill and indefinite-lived intangible assets are reviewed annually for impairment unless circumstances dictate the need for more frequent assessment under the provisions of SFAS No. 142, “Goodwill and Other Intangible Assets”. The identification and measurement of impairment of goodwill involves the estimation of the fair value of reporting units. The estimates of fair value of reporting units are based on the best information available as of the date of the assessment, which primarily incorporateincorporates certain factors including our assumptions about discounted expectedoperating results, business plans, income projections, anticipated future cash flows.flows, and market data. Future cash
34
flows can be affected by changes in industry or market conditions or the rate and extent to which anticipated synergies or cost savings are realized from newly acquired entities.entities and therefore certain uncertainty. The identification and measurement of impairment of indefinite-lived intangible assets involves testing which compares carrying values of assets to the estimated fair values of assets. When appropriate, the carrying value of assets will be reduced to estimated fair values.
37
Forward-Looking Statements
Some of the information included in this Management’s Discussion and Analysis of Financial Condition and Results of Operations, and elsewhere in thisForm 10-K and in the Annual Report attached hereto, which does not constitute part of thisForm 10-K, contain “forward-looking statements” as defined by the Private Securities Litigation Reform Act of 1995. These include statements about capital resources, performance and results of operations and are based on our reasonable current expectations. In addition, all statements regarding anticipated growth or improvement in operating results, anticipated market conditions, and economic recovery are forward looking. Forward-looking statements may be identified by the use of words, such as “believe”, “expect”, “anticipate”, “intend”, “depend”, “should”, “plan”, “estimated”, “could”, “may”, “subject to”, “continues”, “growing”, “prospective”, “forecast”, “projected”, “purport”, “might”, “if”, “contemplate”, “potential”, “pending,” “target”, “goals”, “scheduled”, “will likely be”, and similar words and phrases. Discussions of strategies, plans or intentions often contain forward-looking statements. Factors, among others, that could cause our actual results and future actions to differ materially from those described in forward-looking statements include, but are not limited to:
| | |
| | • | Changes in demand for our products, market conditions, orproduct quality, product availability adversely affecting sales levels. |
| |
| | • | Changes in markets or competition adversely affecting realization of price increases. |
|
| • | The amounts of net cash expenditures, benefits, including available state and local tax incentives, the timing of actions and impact of personnel reductions in connection with the ongoing lighting business integration and rationalization program and other special charges. |
| |
| | • | Failure to achieve projected levels of efficiencies, cost savings and cost reduction measures, including those expected as a result of our lean initiative and strategic sourcing plans. |
| |
| | • | The amounts of cash expenditures,expected benefits and the timing of other actions in connection with our enterprise-wide business system implementation.system. |
| | |
| | • | Availability and costs of raw materials, purchased components, energy and freight. |
| |
| | • | Changes in expected or future levels of operating cash flow, indebtedness and uses of cash.capital spending. |
| |
| | • | General economic and business conditions in particular industries or markets. |
| |
| | • | Regulatory issues, changes in tax laws or changes in geographic profit mix affecting tax rates and availability of tax incentives. |
| |
| | • | Failure to achieve expected benefits of process improvements and other lean initiatives as a result of changes in strategy or level of investments made. |
|
| • | A major disruption in one of our manufacturing or distribution facilities or headquarters, including the impact of plant consolidations relocations and relocations. |
|
| • | Changes in our relationships with, or the constructionfinancial condition or performance of, a new lighting headquarters.key distributors and other customers, agents or business partners could adversely affect our results of operations. |
| |
| | • | Impact of productivity improvements on lead times, quality and delivery of product. |
|
| • | Future levels of indebtedness and capital spending. |
| |
| | • | Anticipated future contributions and assumptions including changes in interest rates and plan assets with respect to pensions. |
| |
| | • | Adjustments to product warranty accruals in response to claims incurred, historical experiences and known costs. |
| |
| | • | Unexpected costs or charges, certain of which might be outside of our control. |
| |
| | • | Changes in strategy, economic conditions or other conditions outside of our control affecting anticipated future global product sourcing levels. |
|
| • | Intense or new competition in the markets in which we compete. |
3835
| | |
| | • | Ability to carry out future acquisitions and strategic investments in our core businesses and costs relating to acquisitions and acquisition integration costs. |
| |
| | • | Future repurchases of common stock under our common stock repurchase programs. |
| |
| | • | Changes in customers’ credit worthiness adversely affecting the ability to continue business relationships with major customers.accounting principles, interpretations, or estimates. |
| |
| | • | The outcome of environmental, legal and tax contingencies or costs compared to amounts provided for such contingencies. |
|
| • | Changes in accounting principles, interpretations, or estimates, including the impact of adopting FASB Interpretation No. 48, “Accounting for Uncertainty in Income Taxes — an Interpretation of FASB Statement No. 109”. |
| |
| | • | Adverse changes in foreign currency exchange rates and the potential use of hedging instruments to hedge the exposure to fluctuating rates of foreign currency exchange on inventory purchases. |
| |
| | • | Other factors described in our SEC filings, including the “Business” and “Risk Factors” Section in this Annual Report onForm 10-K for the year ended December 31, 2006.2007. |
Any such forward-looking statements are not guarantees of future performance and actual results, developments and business decisions may differ from those contemplated by such forward-looking statements. The Company disclaims any duty to update any forward-looking statement, all of which are expressly qualified by the foregoing, other than as required by law.
| |
| Item 7A. | Quantitative and Qualitative Disclosures about Market Risk |
In the operation of our business, we have various exposures to areas of risk related to factors within and outside the control of management. Significant areas of risk and our strategies to manage the exposure are discussed below.
We manufacture our products in the United States, Canada, Switzerland, Puerto Rico, Mexico, Italy, United Kingdom, Brazil and Australia and sell products in those markets as well as through sales offices in Singapore, the People’s Republic of China, Mexico, Hong Kong, South Korea and the Middle East. International shipments fromnon-U.S. subsidiaries as a percentage of the Company’s total net sales were 14% in 2007, 13% in 2006 and 11% in 2005 and 10% in 2004.2005. The CanadianUnited Kingdom market represents 38%36%, United Kingdom 32%Canada 27%, Switzerland 11%, Mexico 8%, and all other areas 11%26% of total 20062007 international sales. As such, our operating results could be affected by changes in foreign currency exchange rates or weak economic conditions in the foreign markets in which we sell our products. To manage this exposure, we closely monitor the working capital requirements of our international units. In 2006,2007, we entered into a series of forward exchange contracts on behalf of our Canadian operation to purchase U.S. dollars in order to hedge parta portion of their exposure to fluctuating rates of exchange on anticipated inventory purchases. As of December 31, 20062007 we had three18 outstanding contracts for $1.0$1 million each, which expire ratably through March 2007.December 2008.
Product purchases representing approximately 14% of our net sales are sourced from unaffiliated suppliers located outside the United States, primarily in China and other Asian countries, Europe and Mexico. We are actively seeking to expand this activity, particularly related to purchases from low cost areas of the world. Foreign sourcing of products may result in unexpected fluctuations in product cost or increased risk of business interruption due to lack of product or component availability due to any one of the following:
| | |
| | • | Political or economic uncertainty in the source country.country |
| |
| | • | Fluctuations in the rate of exchange between the U.S. dollar and the currencies of the source countries.countries |
| |
| | • | Increased logistical complexity including supply chain interruption or delay, port of departure or entry disruption and overall time to market.market |
| |
| | • | Loss of proprietary information.information |
|
| • | Product quality issues outside the control of the Company |
39
We have developed plans that address many of these risks. Such actions include careful selection of products to be outsourced and the suppliers selected; ensuring multiple sources of supply; limiting concentrations of activity by port, broker, freight forwarder, etc, and;etc., processes related to quality control; and maintaining control over operations, technologies and manufacturing deemed to provide competitive advantage.
Many of our businesses have a dependency on certain basic raw materials needed to produce their products including steel, brass, copper,
36
aluminum, bronze, plastics, phenols, zinc, nickel, elastomers and petrochemicals as well as purchased electrical and electronic components. Our financial results could be affected by the availability and changes in prices of these materials and components.
Certain of these materials are sourced from a limited number of suppliers. These materials are also key source materials for many other companies in our industry and within the universe of industrial manufacturers in general. As such, in periods of rising demand for these materials, we may experience both (1) increased costs and (2) limited supply. These conditions can potentially result in our inability to acquire these key materials on a timely basis to produce our products and satisfy our incoming sales orders. Similarly, the cost of these materials can rise suddenly and result in materially higher costs of producing our products. We believe we have adequate primary and secondary sources of supply for each of our key materials and that, in periods of rising prices, we expect to recover a majority of the increased cost in the form of higher selling prices. However, recoveries typically lag the effect of cost increases due to the nature of our markets.
Our financial results are subject to interest rate fluctuations to the extent there is a difference between the amount of our interest-earning assets and the amount of interest-bearing liabilities. The principal objective of our investment management activities is to maximize net investment income while maintaining acceptable levels of interest rate and liquidity risk and facilitating our funding needs. As part of our investment management strategy, we may use derivative financial products such as interest rate hedges and interest rate swaps. Refer to further discussion under “Capital Structure” within this Management’s Discussion and Analysis.
From time to time or when required, we issue commercial paper, which exposes us to changes in interest rates. Our cash position includes amounts denominated in foreign currencies. We manage our worldwide cash requirements by considering available funds held by our subsidiaries and the cost effectiveness with which these funds can be accessed.
We continually evaluate risk retention and insurance levels for product liability, property damage and other potential exposures to risk. We devote significant effort to maintaining and improving safety and internal control programs, which are intended to reduce our exposure to certain risks. We determine the level of insurance coverage and the likelihood of a loss and believe that the current levels of risk retention are consistent with those of comparable companies in the industries in which we operate. There can be no assurance that we will not incur losses beyond the limits of our insurance. However, our liquidity, financial position and profitability are not expected to be materially affected by the levels of risk retention that we accept.
The following table presents cost information related to interest risk sensitive instruments by maturity at December 31, 20062007 (dollars in millions):
| | | | | | | | | | | | | | | | | | | | | | | | | | | | | | | | | | | | | | | | | | | | | | | | | | | | | | | | | | | | | | | |
| | | | | | | | | | | | | | | | | Fair Value
| | | | | | | | | | | | | | | | | Fair Value
| |
| | | 2007 | | 2008 | | 2009 | | 2010 | | 2011 | | Thereafter | | Total | | 12/31/06 | | | 2008 | | 2009 | | 2010 | | 2011 | | 2012 | | Thereafter | | Total | | 12/31/07 | |
| |
Assets | | | | | | | | | | | | | | | | | | | | | | | | | | | | | | | | | | | | | | | | | | | | | | | | | | | | | | | | | | | | | | | | |
| Available-for-sale investments | | | $ | — | | | $ | 11.6 | | | $ | 11.8 | | | $ | 1.8 | | | $ | 4.0 | | | $ | 3.4 | | | $ | 32.6 | | | $ | 33.0 | |
| Avg. interest rate | | | | — | | | | 5.18 | % | | | 5.55 | % | | | 5.03 | % | | | 5.00 | % | | | 4.00 | % | | | — | | | | — | |
Held-to-maturity investments | | $ | 0.1 | | | $ | 0.1 | | | $ | 0.1 | | | $ | — | | | $ | — | | | $ | — | | | $ | 0.3 | | | $ | 0.3 | | | $ | 0.1 | | | $ | 0.1 | | | $ | 0.1 | | | $ | — | | | $ | — | | | $ | — | | | $ | 0.3 | | | $ | 0.3 | |
| Avg. interest rate | | | 5.00 | % | | | 5.00 | % | | | 5.00 | % | | | — | | | | — | | | | — | | | | — | | | | — | | | | 5.00 | % | | | 5.00 | % | | | 5.00 | % | | | — | | | | — | | | | — | | | | — | | | | — | |
| | | |
Liabilities | | | | | | | | | | | | | | | | | | | | | | | | | | | | | | | | | | | | | | | | | | | | | | | | | | | | | | | | | | | | | | | | |
| Long-term debt | | $ | — | | | $ | — | | | $ | — | | | $ | — | | | $ | — | | | $ | 199.3 | | | $ | 199.3 | | | $ | 209.7 | | | $ | — | | | $ | — | | | $ | — | | | $ | — | | | $ | 199.4 | | | $ | — | | | $ | 199.4 | | | $ | 213.8 | |
| Avg. interest rate | | | — | | | | — | | | | — | | | | — | | | | — | | | | 6.38 | % | | | — | | | | — | | | | — | | | | — | | | | — | | | | — | | | | 6.38 | % | | | — | | | | — | | | | — | |
All of the assets and liabilities above are fixed rate instruments. Otheravailable-for-sale securities with a carrying value of $35.9$5.9 million are adjustable rate instruments which are not interest risk sensitive and are not included in the table above. All short-term debt is considered variable rate debt and therefore is not interest risk sensitive. We use derivative financial instruments only if they are matched with a specific asset, liability, or proposed future transaction. We do not speculate or use leverage when trading a financial derivative product.
4037
| |
| Item 8. | Financial Statements and Supplementary Data |
INDEX TO FINANCIAL STATEMENTS AND SCHEDULE
| | | | | |
| | | Form 10-K for
|
| | | 2006,2007, Page: |
| |
| | | 4239 | |
Consolidated Financial Statements | | | | |
| | | 4340 | |
| | | 4541 | |
| | | 4642 | |
| | | 4743 | |
| | | 4844 | |
| | | 4945 | |
Financial Statement Schedule | | | | |
| | | 8884 | |
All other schedules are omitted because they are not applicable or the required information is shown in the consolidated financial statements or notes thereto.
4138
REPORT OF MANAGEMENT
HUBBELL INCORPORATED AND SUBSIDIARIES
Report on Management’s Responsibility for Financial Statements
Our management is responsible for the preparation, integrity and fair presentation of its published financial statements. The financial statements have been prepared in accordance with accounting principles generally accepted in the United States of America and include amounts based on informed judgments made by management.
We believe it is critical to provide investors and other users of our financial statements with information that is relevant, objective, understandable and timely, so that they can make informed decisions. As a result, we have established and we maintain systems and practices and internal control processes designed to provide reasonable, but not, absolute assurance that transactions are properly executed and recorded and that our policies and procedures are carried out appropriately. Management strives to recruit, train and retain high quality people to ensure that controls are designed, implemented and maintained in a high-quality, reliable manner.
Our independent registered public accounting firm audited our financial statements and management’s assessment of the effectiveness of our internal control over financial reporting in accordance with Standards established by the Public Company Accounting Oversight Board (United States). Their report appears on the next two pagespage within this Annual Report onForm 10-K.
Our Board of Directors normally meets at least five times per year to provide oversight, to review corporate strategies and operations, and to assess management’s conduct of the business. The Audit Committee of our Board of Directors (which meets approximately eleven times per year) is comprised of at least three individuals all of whom must be “independent” under current New York Stock Exchange listing standards and regulations adopted by the SEC under the federal securities laws. The Audit Committee meets regularly with our internal auditors and independent registered public accounting firm, as well as management to review, among other matters, accounting, auditing, internal controls and financial reporting issues and practices. Both the internal auditors and independent registered public accounting firm have full, unlimited access to the Audit Committee.
Management’s Annual Report on Internal Control over Financial Reporting
Management is responsible for establishing and maintaining adequate systems of internal control over financial reporting as defined byRules 13a-15(f) and15d-15(f) under the Securities Exchange Act of 1934. Internal control over financial reporting is a process designed to provide reasonable assurance regarding the reliability of financial reporting and the preparation of financial statements for external reporting purposes in accordance with generally accepted accounting principles. Because of its inherent limitations, internal control over financial reporting may not prevent or detect misstatements. Management has assessed the effectiveness of our internal control over financial reporting as of December 31, 2006.2007. In making this assessment, management used the criteria established inInternal Control — Integrated Frameworkissued by the Committee of Sponsoring Organizations of the Treadway Commission. Based on this assessment, management concluded that our internal control over financial reporting was effective as of December 31, 2006.2007.
Management’s assessment of theThe effectiveness of our internal control over financial reporting as of December 31, 20062007 has been audited by PricewaterhouseCoopers LLP, our independent registered public accounting firm as stated in their report which is included on the next two pagespage within this Annual Report onForm 10-K.
| | | |
| | | |
| |  |
| | | |
| Timothy H. Powers | | David G. Nord |
| Chairman of the Board, | | Senior Vice President and |
| President & Chief Executive Officer | | Chief Financial Officer |
4239
REPORT OF INDEPENDENT REGISTERED PUBLIC ACCOUNTING FIRM
To the Board of Directors and Shareholders of Hubbell Incorporated:
We have completed integrated audits of Hubbell Incorporated’s consolidated financial statements and of its internal control over financial reporting as of December 31, 2006, in accordance with the standards of the Public Company Accounting Oversight Board (United States). Our opinions, based on our audits, are presented below.
Consolidated financial statements and financial statement schedule
In our opinion, the consolidated financial statements listed in the accompanying index present fairly, in all material respects, the financial position of Hubbell Incorporated and its subsidiaries (the “Company”) at December 31, 20062007 and 2005,2006, and the results of their operations and their cash flows for each of the three years in the period ended December 31, 20062007 in conformity with accounting principles generally accepted in the United States of America. In addition, in our opinion, the financial statement schedule listed in the accompanying index presents fairly, in all material respects, the information set forth therein when read in conjunction with the related consolidated financial statements. TheseAlso in our opinion, the Company maintained, in all material respects, effective internal control over financial statements and financial statement schedule arereporting as of December 31, 2007, based on criteria established inInternal Control — Integrated Frameworkissued by the responsibilityCommittee of Sponsoring Organizations of the Treadway Commission (COSO). The Company’s management. Our responsibilitymanagement is to express an opinion onresponsible for these financial statements and financial statement schedule, for maintaining effective internal control over financial reporting and for its assessment of the effectiveness of internal control over financial reporting, included in the accompanying Management’s Annual Report on Internal Control over Financial Reporting. Our responsibility is to express opinions on these financial statements, on the financial statement schedule, and on the Company’s internal control over financial reporting based on our integrated audits. We conducted our audits of these statements in accordance with the standards of the Public Company Accounting Oversight Board (United States). Those standards require that we plan and perform the auditaudits to obtain reasonable assurance about whether the financial statements are free of material misstatement. An auditmisstatement and whether effective internal control over financial reporting was maintained in all material respects. Our audits of the financial statements includesincluded examining, on a test basis, evidence supporting the amounts and disclosures in the financial statements, assessing the accounting principles used and significant estimates made by management, and evaluating the overall financial statement presentation. Our audit of internal control over financial reporting included obtaining an understanding of internal control over financial reporting, assessing the risk that a material weakness exists, and testing and evaluating the design and operating effectiveness of internal control based on the assessed risk. Our audits also included performing such other procedures as we considered necessary in the circumstances. We believe that our audits provide a reasonable basis for our opinion.opinions.
As discussed in Note 1 to the consolidated financial statements, the Company changed the manner in which it accounts for share-based compensation in 2006, and the manner in which it accounts for defined benefit pension and other postretirement plans effective December 31, 2006.
Internal control over financial reporting
Also, in our opinion, management’s assessment, included in Management’s Report on Internal Control over Financial Reporting appearing under Item 8, that the Company maintained effective internal control over financial reporting as of December 31, 2006 based on criteria established inInternal Control — Integrated Frameworkissued by the Committee of Sponsoring Organizations of the Treadway Commission (COSO), is fairly stated, in all material respects, based on those criteria. Furthermore, in our opinion, the Company maintained, in all material respects, effective internal control over financial reporting as of December 31, 2006, based on criteria established inInternal Control — Integrated Frameworkissued by the COSO. The Company’s management is responsible for maintaining effective internal control over financial reporting and for its assessment of the effectiveness of internal control over financial reporting. Our responsibility is to express opinions on management’s assessment and on the effectiveness of the Company’s internal control over financial reporting based on our audit. We conducted our audit of internal control over financial reporting in accordance with the standards of the Public Company Accounting Oversight Board (United States). Those standards require that we plan and perform the audit to obtain reasonable assurance about whether effective internal control over financial reporting was maintained in all material respects. An audit of internal control over financial reporting includes obtaining an understanding of internal control over financial reporting, evaluating management’s assessment, testing and evaluating the design and operating effectiveness of internal control, and performing such other procedures as we consider necessary in the circumstances. We believe that our audit provides a reasonable basis for our opinions.
A company’s internal control over financial reporting is a process designed to provide reasonable assurance regarding the reliability of financial reporting and the preparation of financial statements for external purposes in accordance with generally accepted accounting principles. A company’s internal control over financial reporting includes those policies and procedures that (i) pertain to the maintenance of records that, in reasonable detail, accurately and fairly reflect the transactions and dispositions of the assets of the company; (ii) provide reasonable
43
assurance that transactions are recorded as necessary to permit preparation of financial statements in accordance with generally accepted accounting principles, and that receipts and expenditures of the company are being made only in accordance with authorizations of management and directors of the company; and (iii) provide reasonable assurance regarding prevention or timely detection of unauthorized acquisition, use, or disposition of the company’s assets that could have a material effect on the financial statements.
Because of its inherent limitations, internal control over financial reporting may not prevent or detect misstatements. Also, projections of any evaluation of effectiveness to future periods are subject to the risk that controls may become inadequate because of changes in conditions, or that the degree of compliance with the policies or procedures may deteriorate.
Stamford, Connecticut
February 23, 200722, 2008
44
HUBBELL INCORPORATED AND SUBSIDIARIES
CONSOLIDATED STATEMENT OF INCOME
| | | | | | | | | | | | | |
| | | Year Ended December 31 | |
| | | 2006 | | | 2005 | | | 2004 | |
| | | (In millions except
| |
| | | per share amounts) | |
| |
Net sales | | $ | 2,414.3 | | | $ | 2,104.9 | | | $ | 1,993.0 | |
| Cost of goods sold | | | 1,757.5 | | | | 1,509.9 | | | | 1,431.1 | |
| | | | | | | | | | | | | |
Gross profit | | | 656.8 | | | | 595.0 | | | | 561.9 | |
| Selling & administrative expenses | | | 415.6 | | | | 357.9 | | | | 333.9 | |
| Special charges, net | | | 7.3 | | | | 10.3 | | | | 15.4 | |
| | | | | | | | | | | | | |
Operating income | | | 233.9 | | | | 226.8 | | | | 212.6 | |
| | | | | | | | | | | | | |
| Investment income | | | 5.1 | | | | 9.5 | | | | 6.5 | |
| Interest expense | | | (15.4 | ) | | | (19.3 | ) | | | (20.6 | ) |
| Other expense, net | | | (2.1 | ) | | | (1.3 | ) | | | (1.2 | ) |
| | | | | | | | | | | | | |
Total other expense | | | (12.4 | ) | | | (11.1 | ) | | | (15.3 | ) |
| | | | | | | | | | | | | |
Income before income taxes | | | 221.5 | | | | 215.7 | | | | 197.3 | |
| Provision for income taxes | | | 63.4 | | | | 50.6 | | | | 42.6 | |
| | | | | | | | | | | | | |
Net income | | $ | 158.1 | | | $ | 165.1 | | | $ | 154.7 | |
| | | | | | | | | | | | | |
Earnings per share | | | | | | | | | | | | |
| Basic | | $ | 2.62 | | | $ | 2.71 | | | $ | 2.55 | |
| | | | | | | | | | | | | |
| Diluted | | $ | 2.59 | | | $ | 2.67 | | | $ | 2.51 | |
| | | | | | | | | | | | | |
| Average number of common shares outstanding | | | | | | | | | | | | |
| Basic | | | 60.4 | | | | 61.0 | | | | 60.7 | |
| | | | | | | | | | | | | |
| Diluted | | | 61.1 | | | | 61.8 | | | | 61.6 | |
| | | | | | | | | | | | | |
| Cash dividends per common share | | $ | 1.32 | | | $ | 1.32 | | | $ | 1.32 | |
| | | | | | | | | | | | | |
See notes to consolidated financial statements.
45
HUBBELL INCORPORATED AND SUBSIDIARIES
CONSOLIDATED BALANCE SHEET
| | | | | | | | | |
| | | At December 31, | |
| | | 2006 | | | 2005 | |
| | | (Dollars in millions) | |
| |
ASSETS |
Current Assets | | | | | | | | |
| Cash and cash equivalents | | $ | 45.3 | | | $ | 110.6 | |
| Short-term investments | | | 35.9 | | | | 121.3 | |
| Accounts receivable, net | | | 354.3 | | | | 310.4 | |
| Inventories, net | | | 338.2 | | | | 237.1 | |
| Deferred taxes and other | | | 40.7 | | | | 40.7 | |
| | | | | | | | | |
| Total current assets | | | 814.4 | | | | 820.1 | |
Property, Plant, and Equipment, net | | | 318.5 | | | | 267.8 | |
Other Assets | | | | | | | | |
| Investments | | | 0.3 | | | | 78.8 | |
| Goodwill | | | 436.7 | | | | 351.5 | |
| Intangible assets and other | | | 181.6 | | | | 148.8 | |
| | | | | | | | | |
| Total Assets | | $ | 1,751.5 | | | $ | 1,667.0 | |
| | | | | | | | | |
| |
LIABILITIES AND SHAREHOLDERS’ EQUITY |
Current Liabilities | | | | | | | | |
| Short-term debt | | $ | 20.9 | | | $ | 29.6 | |
| Accounts payable | | | 163.9 | | | | 159.5 | |
| Accrued salaries, wages and employee benefits | | | 49.2 | | | | 41.4 | |
| Accrued income taxes | | | 18.5 | | | | 20.0 | |
| Dividends payable | | | 19.9 | | | | 20.2 | |
| Other accrued liabilities | | | 109.9 | | | | 89.8 | |
| | | | | | | | | |
| Total current liabilities | | | 382.3 | | | | 360.5 | |
Long-Term Debt | | | 199.3 | | | | 199.2 | |
Other Non-Current Liabilities | | | 154.4 | | | | 109.2 | |
| | | | | | | | | |
| Total Liabilities | | | 736.0 | | | | 668.9 | |
| | | | | | | | | |
Commitments and Contingencies | | | | | | | | |
Common Shareholders’ Equity | | | | | | | | |
| Common Stock, par value $.01 | | | | | | | | |
| Class A — authorized 50,000,000 shares, outstanding 8,177,234 and 9,127,960 shares | | | 0.1 | | | | 0.1 | |
| Class B — authorized 150,000,000 shares, outstanding 52,001,000 and 51,962,990 shares | | | 0.5 | | | | 0.5 | |
| Additional paid-in capital | | | 219.9 | | | | 267.2 | |
| Retained earnings | | | 827.4 | | | | 749.1 | |
| Unearned compensation | | | — | | | | (8.0 | ) |
| Accumulated other comprehensive loss | | | (32.4 | ) | | | (10.8 | ) |
| | | | | | | | | |
| Total Common Shareholders’ Equity | | | 1,015.5 | | | | 998.1 | |
| | | | | | | | | |
| Total Liabilities and Shareholders’ Equity | | $ | 1,751.5 | | | $ | 1,667.0 | |
| | | | | | | | | |
See notes to consolidated financial statements.
46
HUBBELL INCORPORATED AND SUBSIDIARIES
CONSOLIDATED STATEMENT OF CASH FLOWS
| | | | | | | | | | | | | |
| | | Years Ended December 31, | |
| | | 2006 | | | 2005 | | | 2004 | |
| | | (Dollars in millions) | |
| |
Cash Flows From Operating Activities | | | | | | | | | | | | |
| Net income | | $ | 158.1 | | | $ | 165.1 | | | $ | 154.7 | |
| Adjustments to reconcile net income to net cash provided by operating activities: | | | | | | | | | | | | |
| Loss (Gain) on sale of assets | | | 0.9 | | | | (5.4 | ) | | | (1.5 | ) |
| Depreciation and amortization | | | 55.4 | | | | 50.4 | | | | 48.9 | |
| Deferred income taxes | | | 11.4 | | | | 6.4 | | | | 17.1 | |
| Non-cash special charges | | | 3.1 | | | | 1.9 | | | | 8.3 | |
| Stock-based compensation | | | 11.8 | | | | 0.7 | | | | — | |
| Changes in assets and liabilities: | | | | | | | | | | | | |
| Increase in accounts receivable | | | (30.7 | ) | | | (16.9 | ) | | | (61.5 | ) |
| Increase in inventories | | | (86.3 | ) | | | (13.2 | ) | | | (9.1 | ) |
| Increase in current liabilities | | | 13.3 | | | | 2.0 | | | | 28.8 | |
| Changes in other assets and liabilities, net | | | 6.3 | | | | 14.1 | | | | 14.8 | |
| Tax benefit from exercise of stock options | | | (6.0 | ) | | | — | | | | — | |
| Contribution to domestic, qualified, defined benefit pension plans | | | — | | | | (28.0 | ) | | | (25.0 | ) |
| Other, net | | | 2.6 | | | | 7.0 | | | | 8.6 | |
| | | | | | | | | | | | | |
| Net cash provided by operating activities | | | 139.9 | | | | 184.1 | | | | 184.1 | |
| | | | | | | | | | | | | |
Cash Flows From Investing Activities | | | | | | | | | | | | |
| Acquisition of businesses, net of cash acquired | | | (145.7 | ) | | | (54.3 | ) | | | — | |
| Proceeds from disposition of assets | | | 0.6 | | | | 14.6 | | | | 10.7 | |
| Capital expenditures | | | (86.8 | ) | | | (73.4 | ) | | | (39.1 | ) |
Purchases ofavailable-for-sale investments | | | (153.2 | ) | | | (293.0 | ) | | | (415.0 | ) |
Proceeds from sale ofavailable-for-sale investments | | | 296.0 | | | | 356.9 | | | | 329.0 | |
Purchases ofheld-to-maturity investments | | | (0.4 | ) | | | — | | | | — | |
Proceeds from maturities/sales ofheld-to-maturity investments | | | 21.4 | | | | 17.2 | | | | — | |
| Other, net | | | 1.4 | | | | 1.6 | | | | 5.7 | |
| | | | | | | | | | | | | |
| Net cash used in investing activities | | | (66.7 | ) | | | (30.4 | ) | | | (108.7 | ) |
| | | | | | | | | | | | | |
Cash Flows From Financing Activities | | | | | | | | | | | | |
| Commercial paper borrowings, net | | | 15.8 | | | | — | | | | — | |
| Borrowings of other debt | | | 5.1 | | | | 29.6 | | | | — | |
| Payment of other debt | | | (29.8 | ) | | | (1.2 | ) | | | — | |
| Payment of senior notes | | | — | | | | (100.0 | ) | | | — | |
| Payment of dividends | | | (80.1 | ) | | | (80.6 | ) | | | (79.9 | ) |
| Acquisition of common shares | | | (95.1 | ) | | | (62.7 | ) | | | (6.2 | ) |
| Proceeds from exercise of stock options | | | 38.5 | | | | 32.8 | | | | 30.5 | |
| Tax benefit from exercise of stock options | | | 6.0 | | | | — | | | | — | |
| | | | | | | | | | | | | |
| Net cash used in financing activities | | | (139.6 | ) | | | (182.1 | ) | | | (55.6 | ) |
| | | | | | | | | | | | | |
| Effect of exchange rate changes on cash | | | 1.1 | | | | (0.9 | ) | | | 1.0 | |
| | | | | | | | | | | | | |
(Decrease) increase in cash and cash equivalents | | | (65.3 | ) | | | (29.3 | ) | | | 20.8 | |
Cash and cash equivalents | | | | | | | | | | | | |
| Beginning of year | | | 110.6 | | | | 139.9 | | | | 119.1 | |
| | | | | | | | | | | | | |
| End of year | | $ | 45.3 | | | $ | 110.6 | | | $ | 139.9 | |
| | | | | | | | | | | | | |
See notes to consolidated financial statements.
47
HUBBELL INCORPORATED AND SUBSIDIARIES
CONSOLIDATED STATEMENT OF CHANGES IN SHAREHOLDERS’ EQUITY
| | | | | | | | | | | | | | | | | | | | | | | | | | | | | |
| | | For the Three Years Ended December 31, 2006, 2005 and 2004 (in millions, except per share amounts) | |
| | | | | | | | | | | | | | | | | | Accumulated
| | | | |
| | | | | | | | | | | | | | | | | | Other
| | | | |
| | | Class A
| | | Class B
| | | Additional
| | | | | | | | | Comprehensive
| | | Total
| |
| | | Common
| | | Common
| | | Paid-In
| | | Retained
| | | Unearned
| | | Income
| | | Shareholders’
| |
| | | Stock | | | Stock | | | Capital | | | Earnings | | | Compensation | | | (Loss) | | | Equity | |
| |
Balance at December 31, 2003 | | $ | 0.1 | | | $ | 0.5 | | | $ | 249.7 | | | $ | 590.1 | | | $ | — | | | $ | (10.7 | ) | | $ | 829.7 | |
| | | | | | | | | | | | | | | | | | | | | | | | | | | | | |
| Net income | | | | | | | | | | | | | | | 154.7 | | | | | | | | | | | | 154.7 | |
| Minimum pension liability adjustment, net of related tax effect of $1.4 | | | | | | | | | | | | | | | | | | | | | | | 2.2 | | | | 2.2 | |
| Translation adjustments | | | | | | | | | | | | | | | | | | | | | | | 7.9 | | | | 7.9 | |
| Unrealized loss on investments, net of tax | | | | | | | | | | | | | | | | | | | | | | | (0.3 | ) | | | (0.3 | ) |
| Unrealized loss on cash flow hedge, net of $0.1 of amortization, net of tax | | | | | | | | | | | | | | | | | | | | | | | (0.6 | ) | | | (0.6 | ) |
| | | | | | | | | | | | | | | | | | | | | | | | | | | | | |
| Total comprehensive income | | | | | | | | | | | | | | | | | | | | | | | | | | | 163.9 | |
| Exercise of stock options, including tax benefit of $6.7 | | | | | | | | | | | 37.2 | | | | | | | | | | | | | | | | 37.2 | |
| Acquisition of common shares | | | | | | | | | | | (6.2 | ) | | | | | | | | | | | | | | | (6.2 | ) |
| Cash dividends declared ($1.32 per share) | | | | | | | | | | | | | | | (80.3 | ) | | | | | | | | | | | (80.3 | ) |
| | | | | | | | | | | | | | | | | | | | | | | | | | | | | |
Balance at December 31, 2004 | | $ | 0.1 | | | $ | 0.5 | | | $ | 280.7 | | | $ | 664.5 | | | $ | — | | | $ | (1.5 | ) | | $ | 944.3 | |
| | | | | | | | | | | | | | | | | | | | | | | | | | | | | |
| Net income | | | | | | | | | | | | | | | 165.1 | | | | | | | | | | | | 165.1 | |
| Minimum pension liability adjustment, net of related tax effect of $1.4 | | | | | | | | | | | | | | | | | | | | | | | (2.2 | ) | | | (2.2 | ) |
| Translation adjustments | | | | | | | | | | | | | | | | | | | | | | | (7.5 | ) | | | (7.5 | ) |
| Unrealized loss on investments, net of tax | | | | | | | | | | | | | | | | | | | | | | | (0.3 | ) | | | (0.3 | ) |
| Unrealized gain on cash flow hedge including $0.1 of amortization, net of tax | | | | | | | | | | | | | | | | | | | | | | | 0.7 | | | | 0.7 | |
| | | | | | | | | | | | | | | | | | | | | | | | | | | | | |
| Total comprehensive income | | | | | | | | | | | | | | | | | | | | | | | | | | | 155.8 | |
| Issuance of restricted stock | | | | | | | | | | | 8.3 | | | | | | | | (8.3 | ) | | | | | | | — | |
| Amortization of restricted stock | | | | | | | | | | | | | | | | | | | 0.3 | | | | | | | | 0.3 | |
| Issuance of common shares under compensation arrangements | | | | | | | | | | | 0.3 | | | | | | | | | | | | | | | | 0.3 | |
| Exercise of stock options, including tax benefit of $7.8 | | | | | | | | | | | 40.6 | | | | | | | | | | | | | | | | 40.6 | |
| Acquisition of common shares | | | | | | | | | | | (62.7 | ) | | | | | | | | | | | | | | | (62.7 | ) |
| Cash dividends declared ($1.32 per share) | | | | | | | | | | | | | | | (80.5 | ) | | | | | | | | | | | (80.5 | ) |
| | | | | | | | | | | | | | | | | | | | | | | | | | | | | |
Balance at December 31, 2005 | | $ | 0.1 | | | $ | 0.5 | | | $ | 267.2 | | | $ | 749.1 | | | $ | (8.0 | ) | | $ | (10.8 | ) | | $ | 998.1 | |
| | | | | | | | | | | | | | | | | | | | | | | | | | | | | |
| Net income | | | | | | | | | | | | | | | 158.1 | | | | | | | | | | | | 158.1 | |
| Minimum pension liability adjustment, net of related tax effect of $1.3 | | | | | | | | | | | | | | | | | | | | | | | 2.1 | | | | 2.1 | |
| Translation adjustments | | | | | | | | | | | | | | | | | | | | | | | 12.4 | | | | 12.4 | |
| Change in unrealized loss on investments, net of tax | | | | | | | | | | | | | | | | | | | | | | | 0.3 | | | | 0.3 | |
| Unrealized gain on cash flow hedge including $0.1 of amortization, net of tax | | | | | | | | | | | | | | | | | | | | | | | 0.4 | | | | 0.4 | |
| | | | | | | | | | | | | | | | | | | | | | | | | | | | | |
| Total comprehensive income | | | | | | | | | | | | | | | | | | | | | | | | | | | 173.3 | |
| Benefit plan adjustment to initially apply SFAS No. 158, net of tax of $19.7 | | | | | | | | | | | | | | | | | | | | | | | (36.8 | ) | | | (36.8 | ) |
| Reversal of unearned compensation upon adoption of SFAS No. 123(R) | | | | | | | | | | | (8.0 | ) | | | | | | | 8.0 | | | | | | | | — | |
| Stock-based compensation | | | | | | | | | | | 11.9 | | | | | | | | | | | | | | | | 11.9 | |
| Exercise of stock options | | | | | | | | | | | 38.5 | | | | | | | | | | | | | | | | 38.5 | |
| Tax benefits from stock plans | | | | | | | | | | | 6.0 | | | | | | | | | | | | | | | | 6.0 | |
| Acquisition/surrender of common shares | | | | | | | | | | | (95.7 | ) | | | | | | | | | | | | | | | (95.7 | ) |
| Cash dividends declared ($1.32 per share) | | | | | | | | | | | | | | | (79.8 | ) | | | | | | | | | | | (79.8 | ) |
| | | | | | | | | | | | | | | | | | | | | | | | | | | | | |
Balance at December 31, 2006 | | $ | 0.1 | | | $ | 0.5 | | | $ | 219.9 | | | $ | 827.4 | | | $ | — | | | $ | (32.4 | ) | | $ | 1,015.5 | |
| | | | | | | | | | | | | | | | | | | | | | | | | | | | | |
See notes to consolidated financial statements.
4840
HUBBELL INCORPORATED AND SUBSIDIARIES
CONSOLIDATED STATEMENT OF INCOME
| | | | | | | | | | | | | |
| | | Year Ended December 31 | |
| | | 2007 | | | 2006 | | | 2005 | |
| | | (In millions except
| |
| | | per share amounts) | |
| |
Net sales | | $ | 2,533.9 | | | $ | 2,414.3 | | | $ | 2,104.9 | |
| Cost of goods sold | | | 1,798.1 | | | | 1,757.5 | | | | 1,509.9 | |
| | | | | | | | | | | | | |
Gross profit | | | 735.8 | | | | 656.8 | | | | 595.0 | |
| Selling & administrative expenses | | | 436.4 | | | | 415.6 | | | | 357.9 | |
| Special charges, net | | | — | | | | 7.3 | | | | 10.3 | |
| | | | | | | | | | | | | |
Operating income | | | 299.4 | | | | 233.9 | | | | 226.8 | |
| | | | | | | | | | | | | |
| Investment income | | | 2.4 | | | | 5.1 | | | | 9.5 | |
| Interest expense | | | (17.6 | ) | | | (15.4 | ) | | | (19.3 | ) |
| Other expense, net | | | — | | | | (2.1 | ) | | | (1.3 | ) |
| | | | | | | | | | | | | |
Total other expense | | | (15.2 | ) | | | (12.4 | ) | | | (11.1 | ) |
| | | | | | | | | | | | | |
Income before income taxes | | | 284.2 | | | | 221.5 | | | | 215.7 | |
| Provision for income taxes | | | 75.9 | | | | 63.4 | | | | 50.6 | |
| | | | | | | | | | | | | |
Net income | | $ | 208.3 | | | $ | 158.1 | | | $ | 165.1 | |
| | | | | | | | | | | | | |
Earnings per share | | | | | | | | | | | | |
| Basic | | $ | 3.54 | | | $ | 2.62 | | | $ | 2.71 | |
| | | | | | | | | | | | | |
| Diluted | | $ | 3.50 | | | $ | 2.59 | | | $ | 2.67 | |
| | | | | | | | | | | | | |
| Average number of common shares outstanding | | | | | | | | | | | | |
| Basic | | | 58.8 | | | | 60.4 | | | | 61.0 | |
| | | | | | | | | | | | | |
| Diluted | | | 59.5 | | | | 61.1 | | | | 61.8 | |
| | | | | | | | | | | | | |
| Cash dividends per common share | | $ | 1.32 | | | $ | 1.32 | | | $ | 1.32 | |
| | | | | | | | | | | | | |
See notes to consolidated financial statements.
41
HUBBELL INCORPORATED AND SUBSIDIARIES
| | | | | | | | | |
| | | At December 31, | |
| | | 2007 | | | 2006 | |
| | | (Dollars in millions) | |
| |
ASSETS |
Current Assets | | | | | | | | |
| Cash and cash equivalents | | $ | 77.5 | | | $ | 45.3 | |
| Short-term investments | | | — | | | | 35.9 | |
| Accounts receivable, net | | | 332.4 | | | | 354.3 | |
| Inventories, net | | | 322.9 | | | | 338.2 | |
| Deferred taxes and other | | | 55.2 | | | | 40.7 | |
| | | | | | | | | |
| Total current assets | | | 788.0 | | | | 814.4 | |
Property, Plant, and Equipment, net | | | 327.1 | | | | 318.5 | |
Other Assets | | | | | | | | |
| Investments | | | 39.2 | | | | 0.3 | |
| Goodwill | | | 466.6 | | | | 436.7 | |
| Intangible assets and other | | | 242.5 | | | | 181.6 | |
| | | | | | | | | |
| Total Assets | | $ | 1,863.4 | | | $ | 1,751.5 | |
| | | | | | | | | |
| |
LIABILITIES AND SHAREHOLDERS’ EQUITY |
Current Liabilities | | | | | | | | |
| Short-term debt | | $ | 36.7 | | | $ | 20.9 | |
| Accounts payable | | | 154.0 | | | | 160.5 | |
| Accrued salaries, wages and employee benefits | | | 58.6 | | | | 49.2 | |
| Accrued insurance | | | 46.7 | | | | 42.8 | |
| Dividends payable | | | 19.2 | | | | 19.9 | |
| Other accrued liabilities | | | 104.3 | | | | 89.0 | |
| | | | | | | | | |
| Total current liabilities | | | 419.5 | | | | 382.3 | |
Long-Term Debt | | | 199.4 | | | | 199.3 | |
Other Non-Current Liabilities | | | 161.9 | | | | 154.4 | |
| | | | | | | | | |
| Total Liabilities | | | 780.8 | | | | 736.0 | |
| | | | | | | | | |
Commitments and Contingencies | | | | | | | | |
Common Shareholders’ Equity | | | | | | | | |
| Common Stock, par value $.01 | | | | | | | | |
| Class A — authorized 50,000,000 shares, outstanding 7,378,408 and 8,177,234 shares | | | 0.1 | | | | 0.1 | |
| Class B — authorized 150,000,000 shares, outstanding 50,549,566 and 52,001,000 shares | | | 0.5 | | | | 0.5 | |
| Additional paid-in capital | | | 93.3 | | | | 219.9 | |
| Retained earnings | | | 962.7 | | | | 827.4 | |
| Accumulated other comprehensive income (loss) | | | 26.0 | | | | (32.4 | ) |
| | | | | | | | | |
| Total Common Shareholders’ Equity | | | 1,082.6 | | | | 1,015.5 | |
| | | | | | | | | |
| Total Liabilities and Shareholders’ Equity | | $ | 1,863.4 | | | $ | 1,751.5 | |
| | | | | | | | | |
See notes to consolidated financial statements.
42
HUBBELL INCORPORATED AND SUBSIDIARIES
CONSOLIDATED STATEMENT OF CASH FLOWS
| | | | | | | | | | | | | |
| | | Years Ended December 31, | |
| | | 2007 | | | 2006 | | | 2005 | |
| | | (Dollars in millions) | |
| |
Cash Flows From Operating Activities | | | | | | | | | | | | |
| Net income | | $ | 208.3 | | | $ | 158.1 | | | $ | 165.1 | |
| Adjustments to reconcile net income to net cash provided by operating activities: | | | | | | | | | | | | |
| (Gain) Loss on sale of assets | | | (0.7 | ) | | | 0.9 | | | | (5.4 | ) |
| Depreciation and amortization | | | 60.2 | | | | 55.4 | | | | 50.4 | |
| Deferred income taxes | | | (3.7 | ) | | | 11.4 | | | | 6.4 | |
| Non-cash special charges | | | — | | | | 3.1 | | | | 1.9 | |
| Stock-based compensation | | | 12.7 | | | | 11.8 | | | | 0.7 | |
| Changes in assets and liabilities: | | | | | | | | | | | | |
| Decrease (increase) in accounts receivable | | | 27.8 | | | | (30.7 | ) | | | (16.9 | ) |
| Decrease (increase) in inventories | | | 24.2 | | | | (86.3 | ) | | | (13.2 | ) |
| Increase in current liabilities | | | 42.1 | | | | 13.3 | | | | 2.0 | |
| Changes in other assets and liabilities, net | | | (3.1 | ) | | | 14.0 | | | | 17.7 | |
| Tax benefit from equity-based awards | | | (6.9 | ) | | | (6.0 | ) | | | — | |
| Contributions to defined benefit pension plans | | | (28.4 | ) | | | (7.7 | ) | | | (31.6 | ) |
| Other, net | | | 2.7 | | | | 2.6 | | | | 7.0 | |
| | | | | | | | | | | | | |
| Net cash provided by operating activities | | | 335.2 | | | | 139.9 | | | | 184.1 | |
| | | | | | | | | | | | | |
Cash Flows From Investing Activities | | | | | | | | | | | | |
| Acquisition of businesses, net of cash acquired | | | (52.9 | ) | | | (145.7 | ) | | | (54.3 | ) |
| Proceeds from disposition of assets | | | 5.1 | | | | 0.6 | | | | 14.6 | |
| Capital expenditures | | | (55.9 | ) | | | (86.8 | ) | | | (73.4 | ) |
| Purchases of available-for-sale investments | | | (41.2 | ) | | | (153.2 | ) | | | (293.0 | ) |
| Proceeds from sale of available-for-sale investments | | | 38.6 | | | | 296.0 | | | | 356.9 | |
| Purchases of held-to-maturity investments | | | — | | | | (0.4 | ) | | | — | |
| Proceeds from maturities/sales of held-to-maturity investments | | | — | | | | 21.4 | | | | 17.2 | |
| Other, net | | | 0.6 | | | | 1.4 | | | | 1.6 | |
| | | | | | | | | | | | | |
| Net cash used in investing activities | | | (105.7 | ) | | | (66.7 | ) | | | (30.4 | ) |
| | | | | | | | | | | | | |
Cash Flows From Financing Activities | | | | | | | | | | | | |
| Commercial paper borrowings, net | | | 20.9 | | | | 15.8 | | | | — | |
| Borrowings of other debt | | | — | | | | 5.1 | | | | 29.6 | |
| Payment of other debt | | | (5.1 | ) | | | (29.8 | ) | | | (1.2 | ) |
| Payment of senior notes | | | — | | | | — | | | | (100.0 | ) |
| Payment of dividends | | | (78.4 | ) | | | (80.1 | ) | | | (80.6 | ) |
| Acquisition of common shares | | | (193.1 | ) | | | (95.1 | ) | | | (62.7 | ) |
| Proceeds from exercise of stock options | | | 48.0 | | | | 38.5 | | | | 32.8 | |
| Tax benefit from equity-based awards | | | 6.9 | | | | 6.0 | | | | — | |
| Other, net | | | 0.4 | | | | — | | | | — | |
| | | | | | | | | | | | | |
| Net cash used in financing activities | | | (200.4 | ) | | | (139.6 | ) | | | (182.1 | ) |
| | | | | | | | | | | | | |
| Effect of exchange rate changes on cash | | | 3.1 | | | | 1.1 | | | | (0.9 | ) |
| | | | | | | | | | | | | |
Increase (decrease) in cash and cash equivalents | | | 32.2 | | | | (65.3 | ) | | | (29.3 | ) |
Cash and cash equivalents | | | | | | | | | | | | |
| Beginning of year | | | 45.3 | | | | 110.6 | | | | 139.9 | |
| | | | | | | | | | | | | |
| End of year | | $ | 77.5 | | | $ | 45.3 | | | $ | 110.6 | |
| | | | | | | | | | | | | |
See notes to consolidated financial statements.
43
HUBBELL INCORPORATED AND SUBSIDIARIES
| | | | | | | | | | | | | | | | | | | | | | | | | | | | | |
| | | For the Three Years Ended December 31, 2007, 2006 and 2005 (in millions, except per share amounts) | |
| | | | | | | | | | | | | | | | | | Accumulated
| | | | |
| | | | | | | | | | | | | | | | | | Other
| | | | |
| | | Class A
| | | Class B
| | | Additional
| | | | | | | | | Comprehensive
| | | Total
| |
| | | Common
| | | Common
| | | Paid-In
| | | Retained
| | | Unearned
| | | Income
| | | Shareholders’
| |
| | | Stock | | | Stock | | | Capital | | | Earnings | | | Compensation | | | (Loss) | | | Equity | |
| |
Balance at December 31, 2004 | | $ | 0.1 | | | $ | 0.5 | | | $ | 280.7 | | | $ | 664.5 | | | $ | — | | | $ | (1.5 | ) | | $ | 944.3 | |
| | | | | | | | | | | | | | | | | | | | | | | | | | | | | |
| Net income | | | | | | | | | | | | | | | 165.1 | | | | | | | | | | | | 165.1 | |
| Minimum pension liability adjustment, net of related tax effect of $1.4 | | | | | | | | | | | | | | | | | | | | | | | (2.2 | ) | | | (2.2 | ) |
| Translation adjustments | | | | | | | | | | | | | | | | | | | | | | | (7.5 | ) | | | (7.5 | ) |
| Unrealized loss on investments, net of tax | | | | | | | | | | | | | | | | | | | | | | | (0.3 | ) | | | (0.3 | ) |
| Unrealized loss on cash flow hedge, net of $0.1 of amortization, net of tax | | | | | | | | | | | | | | | | | | | | | | | 0.7 | | | | 0.7 | |
| | | | | | | | | | | | | | | | | | | | | | | | | | | | | |
| Total comprehensive income | | | | | | | | | | | | | | | | | | | | | | | | | | | 155.8 | |
| Issuance of restricted stock | | | | | | | | | | | 8.3 | | | | | | | | (8.3 | ) | | | | | | | — | |
| Amortization of restricted stock | | | | | | | | | | | | | | | | | | | 0.3 | | | | | | | | 0.3 | |
| Issuance of common shares under compensation arrangements | | | | | | | | | | | 0.3 | | | | | | | | | | | | | | | | 0.3 | |
| Exercise of stock options, including tax benefit of $7.8 | | | | | | | | | | | 40.6 | | | | | | | | | | | | | | | | 40.6 | |
| Acquisition of common shares | | | | | | | | | | | (62.7 | ) | | | | | | | | | | | | | | | (62.7 | ) |
| Cash dividends declared ($1.32 per share) | | | | | | | | | | | | | | | (80.5 | ) | | | | | | | | | | | (80.5 | ) |
| | | | | | | | | | | | | | | | | | | | | | | | | | | | | |
Balance at December 31, 2005 | | $ | 0.1 | | | $ | 0.5 | | | $ | 267.2 | | | $ | 749.1 | | | $ | (8.0 | ) | | $ | (10.8 | ) | | $ | 998.1 | |
| | | | | | | | | | | | | | | | | | | | | | | | | | | | | |
| Net income | | | | | | | | | | | | | | | 158.1 | | | | | | | | | | | | 158.1 | |
| Minimum pension liability adjustment, net of related tax effect of $1.3 | | | | | | | | | | | | | | | | | | | | | | | 2.1 | | | | 2.1 | |
| Translation adjustments | | | | | | | | | | | | | | | | | | | | | | | 12.4 | | | | 12.4 | |
| Change in unrealized loss on investments, net of tax | | | | | | | | | | | | | | | | | | | | | | | 0.3 | | | | 0.3 | |
| Unrealized gain on cash flow hedge including $0.1 of amortization, net of tax | | | | | | | | | | | | | | | | | | | | | | | 0.4 | | | | 0.4 | |
| | | | | | | | | | | | | | | | | | | | | | | | | | | | | |
| Total comprehensive income | | | | | | | | | | | | | | | | | | | | | | | | | | | 173.3 | |
| Benefit plan adjustment to initially apply SFAS No. 158, net of tax of $19.7 | | | | | | | | | | | | | | | | | | | | | | | (36.8 | ) | | | (36.8 | ) |
| Reversal of unearned compensation upon adoption of SFAS No. 123(R) | | | | | | | | | | | (8.0 | ) | | | | | | | 8.0 | | | | | | | | — | |
| Stock-based compensation | | | | | | | | | | | 11.9 | | | | | | | | | | | | | | | | 11.9 | |
| Exercise of stock options | | | | | | | | | | | 38.5 | | | | | | | | | | | | | | | | 38.5 | |
| Tax benefits from stock plans | | | | | | | | | | | 6.0 | | | | | | | | | | | | | | | | 6.0 | |
| Acquisition/surrender of common shares | | | | | | | | | | | (95.7 | ) | | | | | | | | | | | | | | | (95.7 | ) |
| Cash dividends declared ($1.32 per share) | | | | | | | | | | | | | | | (79.8 | ) | | | | | | | | | | | (79.8 | ) |
| | | | | | | | | | | | | | | | | | | | | | | | | | | | | |
Balance at December 31, 2006 | | $ | 0.1 | | | $ | 0.5 | | | $ | 219.9 | | | $ | 827.4 | | | $ | — | | | $ | (32.4 | ) | | $ | 1,015.5 | |
| | | | | | | | | | | | | | | | | | | | | | | | | | | | | |
| Net income | | | | | | | | | | | | | | | 208.3 | | | | | | | | | | | | 208.3 | |
| Adjustment to pension and other benefit plans, net of tax of $27.3 | | | | | | | | | | | | | | | | | | | | | | | 44.9 | | | | 44.9 | |
| Translation adjustments | | | | | | | | | | | | | | | | | | | | | | | 14.1 | | | | 14.1 | |
| Unrealized gain on investments, net of tax | | | | | | | | | | | | | | | | | | | | | | | 0.2 | | | | 0.2 | |
| Unrealized gain on cash flow hedge including $0.1 of amortization, net of tax | | | | | | | | | | | | | | | | | | | | | | | (0.8 | ) | | | (0.8 | ) |
| | | | | | | | | | | | | | | | | | | | | | | | | | | | | |
| Total comprehensive income | | | | | | | | | | | | | | | | | | | | | | | | | | | 266.7 | |
| Adjustment to initially apply FIN 48 | | | | | | | | | | | | | | | 4.7 | | | | | | | | | | | | 4.7 | |
| Stock-based compensation | | | | | | | | | | | 12.7 | | | | | | | | | | | | | | | | 12.7 | |
| Exercise of stock options | | | | | | | | | | | 48.0 | | | | | | | | | | | | | | | | 48.0 | |
| Tax benefits from stock plans | | | | | | | | | | | 6.9 | | | | | | | | | | | | | | | | 6.9 | |
| Acquisition/surrender of common shares | | | | | | | | | | | (194.2 | ) | | | | | | | | | | | | | | | (194.2 | ) |
| Cash dividends declared ($1.32 per share) | | | | | | | | | | | | | | | (77.7 | ) | | | | | | | | | | | (77.7 | ) |
| | | | | | | | | | | | | | | | | | | | | | | | | | | | | |
Balance at December 31, 2007 | | $ | 0.1 | | | $ | 0.5 | | | $ | 93.3 | | | $ | 962.7 | | | $ | — | | | $ | 26.0 | | | $ | 1,082.6 | |
| | | | | | | | | | | | | | | | | | | | | | | | | | | | | |
See notes to consolidated financial statements.
44
HUBBELL INCORPORATED AND SUBSIDIARIES
Note 1 — Significant Accounting Policies
| |
| Note 1 — | Significant Accounting Policies |
Principles of Consolidation
The Consolidated Financial Statements include all subsidiaries; all significant intercompany balances and transactions have been eliminated. The Company has one active joint venture which is accounted for using the equity method. In 2007, the Company entered into a new joint venture, Hubbell Asia Limited, whose principal objective is to manage a wholly owned foreign manufacturing company in the People’s Republic of China beginning in 2008. The Company has contributed $2.5 million for a 50% interest in the joint venture which has been consolidated in accordance with the provisions of FIN 46, “Consolidation of Variable Interest Entities”.
Certain reclassifications have been made in prior year financial statements and notes to conform to the current year presentation.
Use of Estimates
The preparation of financial statements in conformity with accounting principles generally accepted in the United States of America requires management to make estimates and assumptions that affect the reported amounts in the Consolidated Financial Statements and accompanying Notes to Consolidated Financial Statements. Actual results could differ from the estimates that are used.
Revenue Recognition
Revenue is recognized when title to the goods sold and the risk of loss have passed to the customer, there is persuasive evidence of a purchase arrangement, delivery has occurred or services are rendered, the price is determinable and collectibility is reasonably assured. Revenue is typically recognized at the time of shipment as the Company’s shipping terms are generally FOB shipping point. The Company recognizes less than one-percentone percent of total annual consolidated net revenue from post shipment obligations and service contracts, primarily within the Industrial Technology segment. Revenue is recognized under these contracts when the service is completed and all conditions of sale have been met. In addition, within the Industrial Technology segment, certain businesses sell large and complex equipment which requires construction and assembly and has long lead times. It is customary in these businesses to require a portion of the selling price to be paid in advance of construction. These payments are treated as deferred revenue and are classified in Other accrued liabilities in the Consolidated Balance Sheet. Once the equipment is shipped to the customer and meets the revenue recognition criteria, the deferred revenue is recognized in the Consolidated Statement of Income.
Further, certain of our businesses account for sales discounts and allowances based on sales volumes, specific programs and customer deductions, as is customary in electrical products markets. These items primarily relate to sales volume incentives, special pricing allowances, and returned goods. QuantitySales volume incentives represent rebates consist of volume incentive discount plans which includewith specific sales volume targets for specific customers. Certain distributors qualify for price rebates by subsequently reselling the Company’s products into select channels of end users. Following a distributor’s sale of an eligible product, the distributor submits a claim for a price rebate. A number of distributors, primarily in the Electrical segment, have a right to return goods under certain circumstances which are reasonably estimable by affected businesses and have historically ranged from 1%-3% of gross sales. This requires us to estimate at the time of sale the amounts that should not be recorded as revenue as these amounts are not expected to be collected in cash from customers. The Company principally relies on historical experience, specific customer agreements and anticipated future trends to estimate these amounts at the time of shipment.
Shipping and Handling Fees and Costs
The Company records shipping and handling costs as part of Cost of goods sold in the Consolidated Statement of Income. Any amounts billed to customers for reimbursement of shipping and handling are included in Net sales in the Consolidated Statement of Income.
45
HUBBELL INCORPORATED AND SUBSIDIARIES
NOTES TO CONSOLIDATED FINANCIAL STATEMENTS — (Continued)
Foreign Currency Translation
The assets and liabilities of international subsidiaries are translated to U.S. dollars at exchange rates in effect at the end of the year, and income and expense items are translated at average exchange rates in effect during the year. The effects of exchange rate fluctuations on the translated amounts of foreign currency assets and liabilities are included as translation adjustments in Accumulated other comprehensive income within Shareholders’ equity. Gains and losses from foreign currency transactions are included in income of the period.
49
HUBBELL INCORPORATED AND SUBSIDIARIES
NOTES TO CONSOLIDATED FINANCIAL STATEMENTS — (Continued)
Cash and Cash Equivalents
Cash equivalents consist of investments with original maturities of three months or less. The carrying value of cash equivalents approximates fair value because of their short maturities. BookWithin the Consolidated Statement of Cash Flow for the year ending December 31, 2005, the beginning of the year balance for cash and cash equivalents has been reclassified for book overdraft cash balances which have been reflected in Accounts payable beginning in 2005 and prior periods presented have been reclassifiedorder to conform to thisthe 2006 and 2007 presentation.
Investments
At December 31, 2006 and 2005, short-term investments consist of variable rate demand notes and auction rate securities. The Company defines short-term investments as securities with original maturities of greater than three months but less than one year. Investments in debt and equity securities are classified by individual security as eitheravailable-for-sale orheld-to-maturity. Variable Municipal bonds and variable rate demand notes and auction rate securities are classified asavailable-for-sale investments and are classified as short-term.Available-for-saleavailable-for-sale investments and are carried on the balance sheet at fair value with current period adjustments to carrying value recorded in Accumulated other comprehensive income within Shareholders’ equity, net of tax. DebtOther securities which the Company has the positive intent and ability to hold to maturity, are classified asheld-to-maturity and are carried on the balance sheet at amortized cost. The effects of amortizing these securities are recorded in current earnings. Realized gains and losses are recorded in income in the period of sale.
Accounts Receivable and Allowances
Trade accounts receivable are recorded at the invoiced amount and generally do not bear interest. The allowance for doubtful accounts is based on an estimated amount of probable credit losses in existing accounts receivable. The allowance is calculated based upon a combination of historical write-off experience, fixed percentages applied to aging categories and specific identification based upon a review of past due balances and problem accounts. The allowance is reviewed on at least a quarterly basis. Account balances are charged off against the allowance when it is determined that internal collection efforts should no longer be pursued. The Company also maintains a reserve for credit memos, cash discounts and product returns which are principally calculated based upon historical experience, specific customer agreements, as well as anticipated future trends.
Inventories
Inventories are stated at the lower of cost or market value. The cost of substantially all domestic inventories (approximately 85%82% of total net inventory value) is determined utilizing thelast-in, first-out (LIFO) method of inventory accounting. The cost of foreign inventories and certain domestic inventories is determined utilizing average cost orfirst-in, first-out (FIFO) methods of inventory accounting.
Property, Plant, and Equipment
Property, plant, and equipment values are stated at cost less accumulated depreciation. Maintenance and repair expenditures are charged to expense when incurred. Property, plant and equipment placed in service prior to January 1, 1999 are depreciated over their estimated useful lives, principally using accelerated methods. Assets placed in service subsequent to January 1, 1999 are depreciated over their estimated useful lives, using straight-line methods. Leasehold improvements are amortized over the shorter of their economic lives or the lease term. Gains
46
HUBBELL INCORPORATED AND SUBSIDIARIES
NOTES TO CONSOLIDATED FINANCIAL STATEMENTS — (Continued)
and losses arising on the disposal of property, plant and equipment are included in Operating Income in the Consolidated Statement of Income.
Capitalized Computer Software Costs
Qualifying costs of internal use software are capitalized in accordance with Statement of Position98-1, “Accounting for the Costs of Computer Software Developed or Obtained for Internal Use”. Capitalized costs include purchased materials and services and payroll and payroll related costs. General and administrative, overhead, maintenance and training costs, as well as the cost of software that does not add functionality to existing
50
HUBBELL INCORPORATED AND SUBSIDIARIES
NOTES TO CONSOLIDATED FINANCIAL STATEMENTS — (Continued)
systems, are expensed as incurred. The cost of internal use software is amortized on a straight-line basis over appropriate periods, generally five years. The unamortized balance of internal use software is included in Intangible assets and other in the Consolidated Balance Sheet.
Capitalized computer software costs, net of amortization, were $38.2$28.1 million and $33.3$38.2 million at December 31, 20062007 and 2005,2006, respectively. The Company recorded amortization expense of $10.9 million, $9.1 million and $5.6 million in 2007, 2006, and $1.2 million in 2006, 2005, and 2004, respectively, relating to capitalized computer software.
Goodwill and Other Intangible Assets
Goodwill represents costs in excess of fair values assigned to the underlying net assets of acquired companies. Indefinite-lived intangible assets and goodwill are subject to annual impairment testing using the specific guidance and criteria described in SFAS No. 142, “Goodwill and Other Intangible Assets”. This testing compares carrying values to estimated fair values and when appropriate, the carrying value of these assets will be reduced to estimated fair value. Fair values were calculated using a range of estimated future operating results and primarily utilized a discounted cash flow model. In the second quarter of 2006,2007, the Company performed its annual impairment testing of goodwill. This testing resulted in fair values for each reporting unit exceeding the reporting unit’s carrying value, including goodwill. The Company performed its annual impairment testing of indefinite-lived intangible assets which resulted in no impairment. The Company’s policy is to perform its annual goodwill impairment assessment in the second quarter of each year unless circumstances dictate the need for more frequent assessments. Intangible assets with definite lives are being amortized over periods ranging from 7-30 years.
Other Long-Lived Assets
The Company evaluates the potential impairment of other long-lived assets when appropriate in accordance with the provisions of SFAS No. 144, “Accounting for the Impairment or Disposal of Long-Lived Assets”. If the carrying value of assets exceeds the sum of the estimated future undiscounted cash flows, the carrying value of the asset is written down to estimated fair value. The Company continually evaluates events and circumstances to determine if revisions to values or estimates of useful lives are warranted.
Income Taxes
The Company operates within multiple taxing jurisdictions and is subject to audit in these jurisdictions. The IRS and other tax authorities routinely review the Company’s tax returns. These audits can involve complex issues which may require an extended period of time to resolve. The Company makes adequate provisions for best estimates of exposures on previously filed tax returns. Deferred income taxes are recognized for the tax consequence of differences between financial statement carrying amounts and the tax basis of assets and liabilities by applying the currently enacted statutory tax rates in accordance with SFAS No. 109, “Accounting for Income Taxes”. The effect of a change in statutory tax rates is recognized inas income in the period that includes the enactment date. SFAS No. 109 also requires that deferred tax assets be reduced by a valuation allowance if it is more likely than notmore-likely-than-not that some portion or all of the deferred tax asset will not be realized. The Company uses factors to assess the likelihood of realization of deferred tax assets such as the forecast of future taxable income and available tax planning strategies that could be implemented to realize the deferred tax assets.
47
HUBBELL INCORPORATED AND SUBSIDIARIES
NOTES TO CONSOLIDATED FINANCIAL STATEMENTS — (Continued)
On January 1, 2007, the Company adopted the provisions of FIN 48, “Accounting for Uncertainty in Income Taxes — an interpretation of FASB Statement No. 109”. FIN 48 prescribes a recognition threshold and measurement attribute for the financial statement recognition and measurement of the tax position taken or expected to be taken in a tax return. For any amount of benefit to be recognized, it must be determined that it is more-likely-than-not that a tax position will be sustained upon examination by taxing authorities based on the technical merits of the position. The amount of benefit to be recognized is based on the Company’s assertion of the most likely outcome resulting from an examination, including resolution of any related appeals or litigation processes. At adoption, companies are required to adjust their financial statements to reflect only those tax positions that are more-likely-than-not to be sustained. Details with respect to the impact on the Consolidated financial statements of these uncertain tax positions and the adoption are included in Note 13 — Income Taxes.
Research, Development & Engineering
Research, development and engineering expenditures represent costs to discoverand/or apply new knowledge in developing a new product, process, or in bringing about a significant improvement to an existing product or process. Research, development and engineering expenses are recorded as a component of Cost of goods sold. Expenses for research, development and engineering were less than 1% of Cost of goods sold for each of the years 2004, 2005,2007, 2006, and 2006.2005.
51
HUBBELL INCORPORATED AND SUBSIDIARIES
NOTES TO CONSOLIDATED FINANCIAL STATEMENTS — (Continued)
Retirement Benefits
The Company maintains various defined benefit pension plans for some of its U.S. and foreign employees. Effective December 31, 2006, the Company adopted the provisions of SFAS No. 158, “Employers’ Accounting for Defined Benefit Pension and Other Postretirement Plans, an amendment of FASB Statements No. 87, 88, 106 and 132 (R)132(R)”. SFAS No. 158 required the Company to recognize the funded status of its defined benefit pension and postretirement plans as an asset or liability in the Consolidated Balance Sheet. Gains or losses, prior service costs or credits, and transition assets or obligations that have not yet been included in net periodic benefit cost as of the end of the year of adoption are recognized as components of Accumulated other comprehensive income, net of tax, within Shareholders’ equity. The Company’s policy is to fund pension costs within the ranges prescribed by applicable regulations. In addition to providing defined benefit pension benefits, the Company provides health care and life insurance benefits for some of its active and retired employees. The Company’s policy is to fund these benefits through insurance premiums or as actual expenditures are made. The Company accounts for these benefits in accordance with SFAS No. 106 “Employers’ Accounting for Postretirement Benefits Other Than Pensions”. See also Note 11 — Retirement Benefits.
Earnings Per Share
Basic earnings per share is calculated as net income divided by the weighted average number of shares of common stock outstanding and earnings per diluted share is calculated as net income divided by the weighted average number of shares outstanding of common stock and common stock equivalents. See also Note 18 — Earnings Per Share.
Stock-Based Employee Compensation
On January 1, 2006, the Company adopted SFAS No. 123(R), “Share-Based Payment”. The standard requires expensing the value of all share-based payments, including stock options and similar awards, based upon the award’s fair value measurement on the grant date. SFAS No. 123(R) revises SFAS No. 123, “Accounting for Stock-Based Compensation”, and supersedes APB Opinion No. 25, “Accounting for Stock Issued to Employees” (“APB 25”). SFAS No. 123(R) is supplemented by SEC SAB No. 107, “Share-Based Payment”. SAB No. 107 expresses the SEC staff’s views regarding the interaction between SFAS No. 123(R) and certain rules and regulations including the valuation of share-based payment arrangements. The Company adopted the modified prospective transition
48
HUBBELL INCORPORATED AND SUBSIDIARIES
NOTES TO CONSOLIDATED FINANCIAL STATEMENTS — (Continued)
method as outlined in SFAS No. 123(R) and, therefore, prior year2005 amounts have not been restated. See also Note 17 — Stock-Based Compensation.
Comprehensive Income
Comprehensive income is a measure of net income and all other changes in Shareholders’ equity of the Company that result from recognized transactions and other events of the period other than transactions with shareholders. See also the Consolidated Statement of Changes in Shareholders Equity and Note 19 — Accumulated Other Comprehensive Income (Loss).
Derivatives
To limit financial risk in the management of its assets, liabilities and debt, the Company may use derivative financial instruments such as: foreign currency hedges, commodity hedges, interest rate hedges and interest rate swaps. All derivative financial instruments are matched with an existing Company asset, liability or proposed transaction. Market value gains or losses on the derivative financial instrument are recognized in income when the effects of the related price changes of the underlying asset or liability are recognized in income. Prior to the issuance in 2002 of $200 million, ten year non-callable notes, the Company entered into a forward interest rate lock to hedge its exposure to fluctuations in treasury rates, which resulted in a loss of approximately $1.3 million. This amount was recorded in Accumulated other comprehensive income within Shareholders’ equity and is being amortized over the life of the notes.
During 2007 and 2006, the Company entered into a series of forward exchange contracts to purchase U.S. dollars in order to hedge its exposure to fluctuating rates of exchange on anticipated inventory purchases. These contracts, each for
52
HUBBELL INCORPORATED AND SUBSIDIARIES
NOTES TO CONSOLIDATED FINANCIAL STATEMENTS — (Continued)
$1 $1 million expire ratably over the threenext 12 months through March 2007December 2008 and have been designated as cash flow hedges in accordance with SFAS No. 133, “Accounting for Derivative Instruments and Hedging Activities”, as amended.
As of December 31, 20062007 and 2005,2006, the Company had $0.8 million of unrealized cash flow hedge losses and $0.2 million of unrealized cash flow hedge gains, and $0.1 million of unrealized cash flow hedge losses, respectively, on foreign currency hedges and $0.7$0.6 million and $0.9$0.7 million, respectively, of unamortized losses on a forward interest rate lock arrangement recorded in Accumulated other comprehensive income. Amounts charged to income in 20062007 and 20052006 were immaterial.
Recent Accounting Pronouncements
In July 2006, the Financial Accounting Standards Board issued FASB Interpretation No. 48, “Accounting for Uncertainty in Income Taxes — an Interpretation of FASB Statement No. 109” (“FIN 48”). FIN 48 prescribes a recognition threshold and measurement attribute for the financial statement recognition and measurement of the tax position taken or expected to be taken in a tax return and provides guidance related to classification and disclosure matters. FIN 48 is effective for the Company beginning on January 1, 2007. Based upon a preliminary evaluation as of December 31, 2006, the Company does not expect the interpretation to have a material impact on results of operations or financial position.
In September 2006, the Financial Accounting Standards Board issued SFAS No. 157, “Fair Value Measurements”. SFAS No. 157 provides enhanced guidance for using fair value to measure assets and liabilities and expands disclosure with respect to fair value measurements. This statement is effective for fiscal years beginning after November 15, 2007. In February 2008, the FASB issued a final Staff Position to allow aone-year deferral of adoption of SFAS No. 157 for nonfinancial assets and nonfinancial liabilities that are recognized or disclosed at fair value in the financial statements on a non-recurring basis. However, companies still need to comply with SFAS No. 157’s recognition and disclosure requirements for financial assets and financial liabilities or for nonfinancial assets and nonfinancial liabilities that are measured at least annually. The Company does not anticipate that this standard will have any immediate material impact on its financial statements.
In February 2007, the FASB issued SFAS No. 159 “The Fair Value Option for Financial Assets and Financial Liabilities — Including an amendment of FASB Statement No. 115”. SFAS 159 provides companies with an option to report selected financial assets and liabilities at fair value. This statement is applicable to the Company on January 1, 2008. The Company is currently evaluatingdoes not plan to elect to report any selected financial assets or liabilities at fair value.
In December 2007, the impact that this standard may have onFASB issued SFAS No. 141(R) “Business Combinations”, which replaces SFAS No. 141. SFAS No. 141R establishes principles and requirements for how an acquirer in a business combination recognizes and measures in its financial statements.
Note 2 — Special Charges
Full year operating results in 2006, 2005 and 2004 include pretax special charges related to (1) actions approved followingstatements the acquisition of LCA in April 2002, which were undertaken to integrate and rationalizeidentifiable assets acquired, the combined lighting operations, and (2) other capacity reduction actions which relate to a factory closure. Both programs and all special charges for the three years ended December 31, 2006 occurred within the Electrical segment.liabilities
The following table summarizes activity by year with respect to special charges for the three years ending December 31, 2006 (in millions):
| | | | | | | | | | | | | | | | | | | | | |
| | | CATEGORY OF COSTS | |
| | | | | | Facility Exit
| | | | | | | | | | |
| | | Severance and
| | | and
| | | Asset
| | | Inventory
| | | | |
Year/Program | | Other Benefit Costs | | | Integration | | | Impairments | | | Write-Downs* | | | Total | |
| |
| 2004 | | | | | | | | | | | | | | | | | | | | |
| Lighting integration | | $ | 3.3 | | | $ | 2.8 | | | $ | 2.1 | | | $ | 1.3 | | | $ | 9.5 | |
| Other capacity reduction | | | 2.0 | | | | 0.3 | | | | 4.9 | | | | — | | | | 7.2 | |
| | | | | | | | | | | | | | | | | | | | | |
| | | $ | 5.3 | | | $ | 3.1 | | | $ | 7.0 | | | $ | 1.3 | | | $ | 16.7 | |
| | | | | | | | | | | | | | | | | | | | | |
| 2005 | | | | | | | | | | | | | | | | | | | | |
| Lighting integration | | $ | 5.7 | | | $ | 2.7 | | | $ | 1.2 | | | $ | 0.4 | | | $ | 10.0 | |
| Other capacity reduction | | | — | | | | 0.6 | | | | — | | | | 0.3 | | | | 0.9 | |
| | | | | | | | | | | | | | | | | | | | | |
| | | $ | 5.7 | | | $ | 3.3 | | | $ | 1.2 | | | $ | 0.7 | | | $ | 10.9 | |
| | | | | | | | | | | | | | | | | | | | | |
| 2006 | | | | | | | | | | | | | | | | | | | | |
| Lighting integration | | $ | 2.8 | | | $ | 1.6 | | | $ | 2.9 | | | $ | 0.2 | | | $ | 7.5 | |
| | | | | | | | | | | | | | | | | | | �� | | |
| |
* | Recorded in Cost of goods sold |
5349
HUBBELL INCORPORATED AND SUBSIDIARIES
NOTES TO CONSOLIDATED FINANCIAL STATEMENTS — (Continued)
assumed, and any controlling interest; recognizes and measures the goodwill acquired in the business combination or a gain from a bargain purchase; and determines what information to disclose to enable users of the financial statements to evaluate the nature and financial effects of the business combination. SFAS No. 141R is to be applied prospectively to business combinations for which the acquisition date is on or after an entity’s fiscal year that begins after December 15, 2008. The Company is currently evaluating the requirements of SFAS No. 141R and the impact that this standard will have on its financial statements.
In December 2007, the FASB issued SFAS No. 160 “Noncontrolling Interests in Consolidated Financial Statements — an amendment to ARB No. 51”. SFAS No. 160 establishes accounting and reporting standards that require the ownership interest in subsidiaries held by parties other than the parent be clearly identified and presented in the consolidated balance sheet within equity, but separate from the parent’s equity; the amount of consolidated net income attributable to the parent and the noncontrolling interest be clearly identified and presented on the face of the consolidated statement of earnings; and changes in a parent’s ownership interest while the parent retains its controlling financial interest in its subsidiary be accounted for consistently. This statement will be applicable to the Company on January 1, 2009. The Company is currently evaluating the impact that this standard will have on its financial statements.
Full year operating results in 2006 and 2005 include pretax special charges related to the lighting business integration and rationalization program. 2005 special charges also include final charges related to capacity reduction actions which resulted in a factory closure. The lighting business integration and rationalization program was substantially completed as of December 31, 2006. Any remaining costs in 2007 have been recorded as S&A expense or Cost of goods sold in the Consolidated Statement of Income. Both programs and all special charges for these years occurred within the Electrical segment.
The following table summarizes activity by year with respect to special charges for 2006 and 2005, (in millions):
| | | | | | | | | | | | | | | | | | | | | |
| | | CATEGORY OF COSTS | |
| | | | | | Facility Exit
| | | | | | | | | | |
| | | Severance and
| | | and
| | | Asset
| | | Inventory
| | | | |
Year/Program | | Other Benefit Costs | | | Integration | | | Impairments | | | Write-Downs* | | | Total | |
| |
| 2006 | | | | | | | | | | | | | | | | | | | | |
| Lighting integration | | $ | 2.8 | | | $ | 1.6 | | | $ | 2.9 | | | $ | 0.2 | | | $ | 7.5 | |
| | | | | | | | | | | | | | | | | | | | | |
| 2005 | | | | | | | | | | | | | | | | | | | | |
| Lighting integration | | $ | 5.7 | | | $ | 2.7 | | | $ | 1.2 | | | $ | 0.4 | | | $ | 10.0 | |
| Other capacity reduction | | | — | | | | 0.6 | | | | — | | | | 0.3 | | | | 0.9 | |
| | | | | | | | | | | | | | | | | | | | | |
| | | $ | 5.7 | | | $ | 3.3 | | | $ | 1.2 | | | $ | 0.7 | | | $ | 10.9 | |
| | | | | | | | | | | | | | | | | | | | | |
| | |
| * | | Recorded in Cost of goods sold |
Lighting Business Integration and Rationalization Program
All charges over the past three yearsCharges in connection with the Program arewere the result of a series of actions related to the consolidation of manufacturing, sales, and administrative functions occurring throughout the commercial and industrial lighting businesses and the relocation of the manufacturing and assembly of commercial lighting fixture products to low cost countries.
Charges associated with the ongoing Program primarily resulted from the following actions:
| | |
| • | Consolidation of four indoor, commercial products facilities within the U.S. to one facility. |
|
| • | Transition of manufacturing of two indoor, commercial product lines to a low cost country. |
|
| • | Outsourcing of commercial product lines to low cost countries. |
|
| • | Consolidation of four separate locations of administrative functions into a centralized administrative center in South Carolina. |
In 2006, Special charges totaled $7.5 million including $0.2 million of inventory write-downs reflected in Cost of goods sold. In total, $2.9 million of costs were expensed in connection with actions initiated during the year and $4.6
50
HUBBELL INCORPORATED AND SUBSIDIARIES
NOTES TO CONSOLIDATED FINANCIAL STATEMENTS — (Continued)
$4.6 million incurred in 2006 related to actions initiated and announced in prior years. In the fourth quarter of 2006, an outdoor, commercial products plant closure was announced and charges were recorded related to asset impairments of $2.4 million and severance and benefits of $0.5 million, including a pension curtailment charge. In total, approximately 100 people were affected by this announcement, all of which 10 have left the Company as of December 31, 2006, with the remainder scheduled to exit inend of the first quarter of 2007. The severance costs are beingwere recorded over the remaining service period of the affected employees. The fixed asset write-downs represent (1) a reduction in the carrying value of a building to fair market value and (2), machinery and equipment write-downs to salvage value based upon the age and location of the equipment.
Costs related to actions carried over from prior years primarily included severance costs of $2.3 million and facility exit and integration costs of $1.6 million related to production and administrative transfers of commercial products businesses.
Charges of $10 million recorded in 2005 related to the Program consisted of $5.7 million of severance and other employee benefit costs including a pension curtailment, $1.6 million for the write-down of equipment to fair market value, the write-off of leasehold improvements and inventory write-downs, and $2.7 million of other facility exit costs. A reduction of approximately 490 employees is expected as a result of projects initiated in 2005, of which approximately 250 employees have left the Company as of December 31, 20062007 with the remainder expected in 2007.by the end of 2008. A portion of the severance costs were recorded based upon the affected employees’ remaining service period following announcement of the programs. Asset write-downs primarily consisted of the write-down of the assets of the outdoor, commercial facility to fair market value and other equipment write-downs to record the equipment at estimated salvage value. In addition to the above, the Company recorded expenses related to facility exit costs including plant shutdown and facility remediation.
In 2004, a $9.5 million pretax charge was recorded in connection with the Program. Of this amount, $1.3 million was recorded in Cost of goods sold as it related to product line inventory write-downs. The remaining $8.2 million of special charges related to severance ($3.3 million), asset write-downs ($2.1 million) and facility exit costs ($2.8 million). Severance costs were a direct result of the relocation of two manufacturing facilities, outsourcing of a manufacturing facility to a low cost country, as well as the relocation of one office providing administrative functions to South Carolina. Approximately 500 employees were affected by the actions approved
54
HUBBELL INCORPORATED AND SUBSIDIARIES
NOTES TO CONSOLIDATED FINANCIAL STATEMENTS — (Continued)
between 2002 and 2004, of which approximately 360 had left the Company as of December 31, 2004, with the remainder separating in 2005.
Closure of a Wiring Device Factory
Also in 2004,In the second quarter of 2005, the Company recorded pretax charges in connection with the closure ofclosed a wiring device factory in Puerto Rico. The $7.2 millionclosure of this factory was announced in 2004 and the Company recorded special charge included $4.9 million of asset impairments including write-offs of leasehold improvements, and write-downs of equipment to fair market value, which approximated salvage value duecharges related to the overall age and location of the equipment. Severance costs of $2.0 million were recorded. In addition, $0.3 million was recorded related to facility exit costs.
The factory closed in the second quarter of 2005.closure at that time. Production activities were either outsourced or transferred to other existing facilities. In June 2005, the Company recorded an additional $0.9 million of pretax special charges consistingof $0.9 million associated with the closure, which consisted of $0.3 million of inventory write-downs and $0.6 million of facility related exit costs. Approximately 200 employees were impacted by this action, all of whom have left the Company as of December 31, 2006.
The following table sets forth the components of special charges recorded and accrued in 2004 —2005 and 2006, (in millions):
| | | | | | | | | | | | | | | | | | | | | | | | | | | | | | | | | | | | | | | | | |
| | | Accrued
| | | | | | | | | | | Accrued
| | | | | | | | | |
| | | Beginning
| | | | Cash
| | Non-cash
| | Accrued End
| | | Beginning
| | | | Cash
| | Non-cash
| | Accrued End
| |
| | | of Year Balance | | Provision | | Expenditures | | Write-downs | | of Year Balance | | | of Year Balance | | Provision | | Expenditures | | Write-downs | | of Year Balance | |
| |
Lighting Business Integration Program: | | | | | | | | | | | | | | | | | | | | | | | | | | | | | | | | | | | | | | | | |
| 2004 | | $ | — | | | $ | 9.5 | | | $ | (4.8 | ) | | $ | (3.4 | ) | | $ | 1.3 | | |
| 2005 | | | 1.3 | | | | 10.0 | | | | (5.9 | ) | | | (1.6 | ) | | | 3.8 | * | | $ | 1.3 | | | $ | 10.0 | | | $ | (5.9 | ) | | $ | (1.6 | ) | | $ | 3.8 | * |
| 2006 | | | 3.8 | | | | 7.5 | | | | (2.2 | ) | | | (3.1 | ) | | | 6.0 | * | | | 3.8 | | | | 7.5 | | | | (2.2 | ) | | | (3.1 | ) | | | 6.0 | * |
Wiring Device Factory Closure: | | | | | | | | | | | | | | | | | | | | | | | | | | | | | | | | | | | | | | | | |
| 2004 | | $ | — | | | $ | 7.2 | | | $ | (0.3 | ) | | $ | (4.9 | ) | | $ | 2.0 | | |
| 2005 | | | 2.0 | | | | 0.9 | | | | (2.3 | ) | | | (0.3 | ) | | | 0.3 | | | $ | 2.0 | | | $ | 0.9 | | | $ | (2.3 | ) | | $ | (0.3 | ) | | $ | 0.3 | |
| 2006 | | | 0.3 | | | | — | | | | (0.3 | ) | | | — | | | | — | | | | 0.3 | | | | — | | | | (0.3 | ) | | | — | | | | — | |
| | |
| * | | Included in the accrued balance at December 31, 2006 and December 31, 2005 is $3.2 million and $3.0 million, respectively, of accrued pension curtailment costs classified in Other Non-Current Liabilities within the Consolidated Balance Sheet at December 31, 2006 and 2005. |
As of December 31, 2007, a remaining accrued balance of $5.3 million related to severance cost and the pension curtailment in connection with the closure of one manufacturing facility. The severance is expected to be paid out upon closure of this facility in late 2008. The pension curtailment is included in long-term pension liability and is not expected to be paid out until future years.
51
Note 3 — Business AcquisitionsHUBBELL INCORPORATED AND SUBSIDIARIES
OnNOTES TO CONSOLIDATED FINANCIAL STATEMENTS — (Continued)
| |
| Note 3 — | Business Acquisitions |
In October 2007, the Company purchased all of the outstanding common stock of PCORE for $50.1 million in cash. PCORE has been added to the Power segment and the results of operations after October 1, 2007 are included in the Consolidated Financial Statements. PCORE, located in LeRoy, New York, is a leading manufacturer of high voltage condenser bushings. These products are used in the electric utility infrastructure.
The Company is in the process of finalizing the determination of fair values of the underlying assets and liabilities and, as a result, the allocations of purchase price related to the acquisition discussed above could change. The following table summarizes the preliminary allocation of the purchase price to estimated fair values of the assets acquired and liabilities assumed as of the purchase date for PCORE, (in millions):
| | | | | |
| Total purchase price including transaction expenses, net of cash acquired | | $ | 50.1 | |
| | | | | |
| Fair value assigned to assets acquired | | $ | 15.9 | |
| Fair value of liabilities assumed | | | (3.3 | ) |
| Amounts assigned to intangible assets | | | 15.5 | |
| Amount allocated to goodwill | | | 22.0 | |
| | | | | |
| Total allocation | | $ | 50.1 | |
| | | | | |
The fair value assigned to net assets acquired primarily relates to accounts receivable, inventory and fixed assets. Intangible assets identified primarily consist of tradenames and customer lists. The tradenames are being amortized over a period of 30 years and customer lists are being amortized over a period of 20 years. The excess of purchase price over the fair values of assets acquired, liabilities assumed and identifiable intangible assets has been allocated to goodwill. Goodwill is not expected to be deductible for tax purposes.
In March 2007, the Company purchased a small Brazilian manufacturing business for $2.1 million. This acquisition has been added to the Power segment and has been integrated into the Company’s Brazilian operations.
In June 1, 2006, the Company purchased all of the outstanding common stock of Strongwell Lenoir City, Inc. for $117.4 million in cash. Strongwell Lenoir City, Inc. (renamed Hubbell Lenoir City, Inc.) has beenfor $117.4 million in cash. Hubbell Lenoir City, Inc., added to the Power segment, and the results of operations after June 1, 2006 are included in the Consolidated Financial Statements. The acquired business has manufacturing facilities in Lenoir City, TN and San Jose, CA. Hubbell Lenoir City, Inc. designs and manufactures precast polymer concrete products used to house underground equipment and also has a line of surface drain products. These products are sold to the electrical utility and telecommunications industries. Hubbell Lenoir City, Inc. complements the existing product lines and shares a similar customer base to the existing businesses within the Power segment.
OnIn November 1, 2006, the Company purchased all of the outstanding common stock of Austdac for $28.1$28.8 million, net of $2.3 million of cash acquired. Austdac is based in New South Wales, Australia and manufactures a wide range of products used in harsh and hazardous applications in a variety of industries. Austdac has beenwas added to the Industrial Technology segment. In 2007 the Company paid an additional $0.7 million relating to this acquisition.
5552
HUBBELL INCORPORATED AND SUBSIDIARIES
NOTES TO CONSOLIDATED FINANCIAL STATEMENTS — (Continued)
The Companyaccounting for the purchase of these businesses acquired in 2006, including adjustments made in 2007, is in the processcomplete as of finalizing the determination of fair values of the underlying assets and liabilities and, as a result, the allocations of purchase price related to the acquisitions discussed above could change.December 31, 2007. The following table summarizes the preliminary allocations of the purchase price to estimatedfinal fair values of the assets acquired and liabilities assumed as of the purchase dates for the above noted acquired companies, in millions.December 31, 2007, (in millions):
| | | | | | | | | | | | | | | | | |
| | | Lenoir City | | Austdac | | | Lenoir City | | Austdac | |
| |
| Total purchase price including transaction expenses, net of cash acquired | | $ | 117.4 | | | $ | 28.1 | | | $ | 117.4 | | | $ | 28.8 | |
| | | | | | | | | | | |
| Fair value assigned to assets acquired | | $ | 35.4 | | | $ | 9.5 | | | $ | 34.6 | | | $ | 9.0 | |
| Fair value of liabilities assumed | | | (8.3 | ) | | | (3.3 | ) | | | (8.3 | ) | | | (6.5 | ) |
| Amounts assigned to intangible assets | | | 28.7 | | | | 7.6 | | | | 28.7 | | | | 11.3 | |
| Amount allocated to goodwill | | | 61.6 | | | | 14.3 | | | | 62.4 | | | | 15.0 | |
| | | | | | | | | | | |
| Total allocation | | $ | 117.4 | | | $ | 28.1 | | | $ | 117.4 | | | $ | 28.8 | |
| | | | | | | | | | | |
The fair valuevalues assigned to net assets acquired primarily relatesrelate to inventory and fixed assets. Intangible assets identified primarily consist of tradenames and customer lists. The tradenames are being amortized over a period of 30 years and customer lists are being amortized over a period of 7-10 years. The excess of purchase price over the fair values of assets acquired, liabilities assumed and identifiable intangible assets has been allocated to goodwill. All of the goodwill is expected to be deductible for tax purposes. These acquisitions have been included in the Company’s Consolidated Financial Statements from their respective dates of acquisition.
| |
| Note 4 — | Receivables and Allowances |
In 2005,
Receivables consist of the Company acquired five businesses through separate transactions. Total cash expended in 2005 on these acquisitions, including fees and expenses and net of cash acquired, was $54.3 million. In 2006 the Company paid out an additional $0.2 million related to an acquisition in the Power segment.following components at December 31, (in millions):
A total of $23.9 million of purchase price including fees and expenses was attributable to the purchase of two businesses in the third quarter of 2005 in the Industrial Technology segment; one which manufactures pressure switches for industrial markets and the other which manufactures contactors and switches used in the locomotive and industrial markets.
A total of $11.8 million of purchase price including fees and expenses was attributable to the purchase in the third quarter of 2005 of a harsh and hazardous lighting company located in the United Kingdom, which was added to the Electrical segment.
A total of $18.6 million of purchase price including fees and expenses and net of cash acquired and debt assumed in 2005 and an additional $0.2 million in 2006 was attributable to the purchase of two businesses in the Power segment; a civil anchor business and a Brazilian manufacturer of surge arresters, cutouts and other products serving the utility industry.
The accounting for the purchase of these businesses acquired in 2005, including adjustments made in 2006, is complete as of December 31, 2006. The following table summarizes the final fair values of the assets acquired and liabilities assumed as of December 31, 2006, in millions.
| | | | | |
| Total purchase price including transaction expenses, net of cash acquired | | $ | 54.5 | |
| | | | | |
| Fair value assigned to net assets acquired | | $ | 10.3 | |
| Amounts assigned to intangible assets | | | 13.2 | |
| Amount allocated to goodwill | | | 31.0 | |
| | | | | |
| Total allocation | | $ | 54.5 | |
| | | | | |
| | | | | | | | | |
| | | 2007 | | | 2006 | |
| |
| Trade accounts receivable | | $ | 349.0 | | | $ | 368.2 | |
| Non-trade receivables | | | 8.3 | | | | 10.1 | |
| | | | | | | | | |
| Accounts receivable, gross | | | 357.3 | | | | 378.3 | |
| Allowance for credit memos, returns, and cash discounts | | | (21.2 | ) | | | (20.8 | ) |
| Allowance for doubtful accounts | | | (3.7 | ) | | | (3.2 | ) |
| | | | | | | | | |
| Total allowances | | | (24.9 | ) | | | (24.0 | ) |
| | | | | | | | | |
| Accounts receivable, net | | $ | 332.4 | | | $ | 354.3 | |
| | | | | | | | | |
Intangible assets identified consist primarily of tradenames and customer lists. The tradenames
Inventories are being amortized over a period of 30 years. The customer lists and other intangibles are generally amortized over periods ranging from 7-15 years. The excess of purchase price over the fair values of assets acquired, liabilities assumed andclassified as follows at December 31, (in millions):
| | | | | | | | | |
| | | 2007 | | | 2006 | |
| |
| Raw material | | $ | 106.6 | | | $ | 106.6 | |
| Work-in-process | | | 62.2 | | | | 63.5 | |
| Finished goods | | | 227.7 | | | | 239.6 | |
| | | | | | | | | |
| | | | 396.5 | | | | 409.7 | |
| Excess of FIFO over LIFO cost basis | | | (73.6 | ) | | | (71.5 | ) |
| | | | | | | | | |
| Total | | $ | 322.9 | | | $ | 338.2 | |
| | | | | | | | | |
5653
HUBBELL INCORPORATED AND SUBSIDIARIES
NOTES TO CONSOLIDATED FINANCIAL STATEMENTS — (Continued)
identifiable intangible assets has been allocated to goodwill. A majority of the goodwill is expected to be deductible for tax purposes.
Note 4 — Receivables and Allowances
Receivables consist of the following components at December 31, (in millions):
| | | | | | | | | |
| | | 2006 | | | 2005 | |
| |
| Trade accounts receivable | | $ | 368.2 | | | $ | 322.6 | |
| Non-trade receivables | | | 10.1 | | | | 9.3 | |
| | | | | | | | | |
| Accounts receivable, gross | | | 378.3 | | | | 331.9 | |
| Allowance for credit memos, returns, and cash discounts | | | (20.8 | ) | | | (17.3 | ) |
| Allowance for doubtful accounts | | | (3.2 | ) | | | (4.2 | ) |
| | | | | | | | | |
| Total allowances | | | (24.0 | ) | | | (21.5 | ) |
| | | | | | | | | |
| Accounts receivable, net | | $ | 354.3 | | | $ | 310.4 | |
| | | | | | | | | |
Note 5 — Inventories
Inventories are classified as follows at December 31, (in millions):
| | | | | | | | | |
| | | 2006 | | | 2005 | |
| |
| Raw Material | | $ | 106.6 | | | $ | 83.0 | |
| Work-in-Process | | | 63.5 | | | | 53.6 | |
| Finished Goods | | | 239.6 | | | | 151.6 | |
| | | | | | | | | |
| | | | 409.7 | | | | 288.2 | |
| Excess of FIFO over LIFO cost basis | | | (71.5 | ) | | | (51.1 | ) |
| | | | | | | | | |
| Total | | $ | 338.2 | | | $ | 237.1 | |
| | | | | | | | | |
Note 6 — Goodwill and Other Intangible Assets
| |
| Note 6 — | Goodwill and Other Intangible Assets |
Changes in the carrying amounts of goodwill for the years ended December 31, 20062007 and 2005,2006, by segment, were as follows (in millions):
| | | | | | | | | | | | | | | | | | | | | | | | | | | | | | | | | |
| | | | | | | Industrial
| | | | | | | | | Industrial
| | | |
| | | Electrical | | Power | | Technology | | Total | | | Electrical | | Power | | Technology | | Total | |
| | |
| Balance December 31, 2004 | | $ | 172.3 | | | $ | 112.7 | | | $ | 41.6 | | | $ | 326.6 | | |
| Acquisitions | | | 7.6 | | | | 9.2 | | | | 11.9 | | | | 28.7 | | |
| Translation adjustments | | | (4.0 | ) | | | 0.2 | | | | — | | | | (3.8 | ) | |
| | | | | | | | | | |
| Balance December 31, 2005 | | | 175.9 | | | | 122.1 | | | | 53.5 | | | | 351.5 | | | $ | 175.9 | | | $ | 122.1 | | | $ | 53.5 | | | $ | 351.5 | |
| | | | | | | | | | | | | | | | | | | |
| Acquisitions | | | — | | | | 61.8 | | | | 16.4 | | | | 78.2 | | | | — | | | | 61.8 | | | | 16.4 | | | | 78.2 | |
| Translation adjustments | | | 5.5 | | | | 1.0 | | | | 0.5 | | | | 7.0 | | | | 5.5 | | | | 1.0 | | | | 0.5 | | | | 7.0 | |
| | | | | | | | | | | | | | | | | | | |
| Balance December 31, 2006 | | $ | 181.4 | | | $ | 184.9 | | | $ | 70.4 | | | $ | 436.7 | | | $ | 181.4 | | | $ | 184.9 | | | $ | 70.4 | | | $ | 436.7 | |
| | | | | | | | | | | | | | | | | | | |
| Acquisitions | | | | — | | | | 23.2 | | | | 0.7 | | | | 23.9 | |
| Translation adjustments | | | | 2.1 | | | | 2.1 | | | | 1.8 | | | | 6.0 | |
| | | | | | | | | | | |
| Balance December 31, 2007 | | | $ | 183.5 | | | $ | 210.2 | | | $ | 72.9 | | | $ | 466.6 | |
| | | | | | | | | | | |
In 20062007 and 20052006 the Company recorded additions to goodwill in connection with the purchase accounting for acquisitions. See also Note 3 — Business Acquisitions. Included in 20062007 acquisitions in the Power segment is $61.6$22.4 million of goodwill from the acquisitionacquisitions of Hubbell Lenoir City, Inc.PCORE and $0.2a product line from a small Brazilian manufacturing business and $0.8 million related to a final adjustment of acquisition costs related to the 2005 acquisition of a Brazilian manufacturer serving the utility
57
HUBBELL INCORPORATED AND SUBSIDIARIES
NOTES TO CONSOLIDATED FINANCIAL STATEMENTS — (Continued)
industry.2006 Hubbell Lenoir City, Inc. acquisition. Included in 20062007 acquisitions in the Industrial Technology segment is $14.3 million of goodwill from the acquisition of Austdac and a $2.1$0.7 million adjustment to goodwill forrelating to the 20052006 acquisition of a pressure switch business.Austdac. In 2005,2006, acquisitions consisted of the purchase of fivetwo separate businesses of which one iswas in the ElectricalPower segment and two arethe other was in each of the Power and Industrial Technology segments.segment. See also Note 3 — Business Acquisitions.
Identifiable intangible assets are recorded in Intangible assets and other in the Consolidated Balance Sheet. Identifiable intangible assets are comprised of the following (in millions):
| | | | | | | | | | | | | | | | | | | | | | | | | | | | | | | | | |
| | | December 31,
| | December 31,
| | | December 31,
| | December 31,
| |
| | | 2006 | | 2005 | | | 2007 | | 2006 | |
| | | | | Accumulated
| | | | Accumulated
| | | | | Accumulated
| | | | Accumulated
| |
| | | Gross Amount | | Amortization | | Gross Amount | | Amortization | | | Gross Amount | | Amortization | | Gross Amount | | Amortization | |
| |
Definite-lived: | | | | | | | | | | | | | | | | | | | | | | | | | | | | | | | | |
| Patents and trademarks | | $ | 36.8 | | | $ | (1.7 | ) | | $ | 6.7 | | | $ | (0.9 | ) | | $ | 44.3 | | | $ | (4.6 | ) | | $ | 36.8 | | | $ | (1.7 | ) |
| Other | | | 23.9 | | | | (6.1 | ) | | | 16.8 | | | | (3.2 | ) | | | 39.0 | | | | (8.6 | ) | | | 23.9 | | | | (6.1 | ) |
| | | | | | | | | | | | | | | | | | | |
| Total | | | 60.7 | | | | (7.8 | ) | | | 23.5 | | | | (4.1 | ) | | | 83.3 | | | | (13.2 | ) | | | 60.7 | | | | (7.8 | ) |
| | | | | | | | | | | | | | | | | | | |
Indefinite-lived: | | | | | | | | | | | | | | | | | | | | | | | | | | | | | | | | |
| Trademarks and other | | | 21.4 | | | | — | | | | 21.5 | | | | — | | | | 20.6 | | | | — | | | | 21.4 | | | | — | |
| | | | | | | | | | | | | | | | | | | |
| Totals | | $ | 82.1 | | | $ | (7.8 | ) | | $ | 45.0 | | | $ | (4.1 | ) | | $ | 103.9 | | | $ | (13.2 | ) | | $ | 82.1 | | | $ | (7.8 | ) |
| | | | | | | | | | | | | | | | | | | |
Other definite-lived intangibles consist primarily of customer relationships and technology.
Amortization expense in 2006 and 2005 was $5.5 million, $3.5 million and $1.7 million in 2007, 2006 and 2005, respectively. Amortization expense is expected to be $4.5 million in 2007, $4.3$5.2 million in 2008, and$5.0 million in 2009, and $4.1 million$4.8 in 2010 and 2011.2011, and $4.6 million in 2012.
Note 7 — Investments
At December 31, 2006,2007, available-for-sale investments consisted of $33.0 million of municipal bonds and $5.9 million of variable rate demand notes. At December 31, 2005,2006, available-for-sale investments consisted of auction$35.9 million of variable rate securities, U.S. Treasury Notes, and municipal, corporate, and asset-backed bonds.demand notes. These investments are stated at fair market value based on current
54
HUBBELL INCORPORATED AND SUBSIDIARIES
NOTES TO CONSOLIDATED FINANCIAL STATEMENTS — (Continued)
quotes. Variable rate demand notes are reset to current interest rates weekly. At December 31, 2007 and 2006,held-to-maturity investments consisted of Missouri state bonds. At December 31, 2005, held-to-maturity investments consisted of a Commonwealth of Puerto Rico bond. These held-to-maturity investments have been stated at amortized cost. There were no securities during 20062007 and 20052006 that were classified as trading investments.
The following table sets forth selected data with respect to the Company’s investments at December 31, (in millions):
| | | | | | | | | | | | | | | | | | | | | | | | | | | | | | | | | | | | | | | | | | | | | | | | | | | | | | | | | | | | | | | | | | | | | | | | | | | | | | | | | |
| | | 2006 | | 2005 | | | 2007 | | 2006 | |
| | | | | Gross
| | Gross
| | | | | | | | Gross
| | Gross
| | | | | | | | | Gross
| | Gross
| | | | | | | | Gross
| | Gross
| | | | | |
| | | Amortized
| | Unrealized
| | Unrealized
| | Fair
| | Carrying
| | Amortized
| | Unrealized
| | Unrealized
| | Fair
| | Carrying
| | | Amortized
| | Unrealized
| | Unrealized
| | Fair
| | Carrying
| | Amortized
| | Unrealized
| | Unrealized
| | Fair
| | Carrying
| |
| | | Cost | | Gains | | Losses | | Value | | Value | | Cost | | Gains | | Losses | | Value | | Value | | | Cost | | Gains | | Losses | | Value | | Value | | Cost | | Gains | | Losses | | Value | | Value | |
| |
Available-For-Sale Investments | | $ | 35.9 | | | $ | — | | | $ | — | | | $ | 35.9 | | | $ | 35.9 | | | $ | 179.4 | | | $ | — | | | $ | (0.6 | ) | | $ | 178.8 | | | $ | 178.8 | | | $ | 38.5 | | | $ | 0.5 | | | $ | (0.1 | ) | | $ | 38.9 | | | $ | 38.9 | | | $ | 35.9 | | | $ | — | | | $ | — | | | $ | 35.9 | | | $ | 35.9 | |
| | | | | | | | | | | | | | | | | | | | | | | | | | | | | | | | | | | | | | | | | | | |
Held-To-Maturity Investments | | $ | 0.3 | | | $ | — | | | $ | — | | | $ | 0.3 | | | $ | 0.3 | | | $ | 21.3 | | | $ | 0.1 | | | $ | — | | | $ | 21.4 | | | $ | 21.3 | | | | 0.3 | | | | — | | | | — | | | | 0.3 | | | | 0.3 | | | | 0.3 | | | | — | | | | — | | | | 0.3 | | | | 0.3 | |
| | | | | | | | | | | | | | | | | | | | | | | | | | | | | | | | | | | | | | | | | | | |
Total Investments | | $ | 36.2 | | | $ | — | | | $ | — | | | $ | 36.2 | | | $ | 36.2 | | | $ | 200.7 | | | $ | 0.1 | | | $ | (0.6 | ) | | $ | 200.2 | | | $ | 200.1 | | | $ | 38.8 | | | $ | 0.5 | | | $ | (0.1 | ) | | $ | 39.2 | | | $ | 39.2 | | | $ | 36.2 | | | $ | — | | | $ | — | | | $ | 36.2 | | | $ | 36.2 | |
| | | | | | | | | | | | | | | | | | | | | | | | | | | | | | | | | | | | | | | | | | | |
Contractual maturities of available-for-sale and held-to-maturity investments at December 31, 2007 were as follows (in millions):
| | | | | | | | | |
| | | Amortized
| | | Fair
| |
| | | Cost | | | Value | |
| |
Available-For-Sale Investments | | | | | | | | |
| After 1 year but within 5 years | | $ | 29.2 | | | $ | 29.5 | |
| Due after 10 years | | | 9.3 | | | | 9.4 | |
| | | | | | | | | |
Total | | $ | 38.5 | | | $ | 38.9 | |
| | | | | | | | | |
Held-To-Maturity Investments | | | | | | | | |
| Due within 1 year | | $ | 0.1 | | | $ | 0.1 | |
| After 1 year but within 5 years | | | 0.2 | | | | 0.2 | |
| | | | | | | | | |
Total | | $ | 0.3 | | | $ | 0.3 | |
| | | | | | | | | |
In 2007 and 2006, the Company recorded credits of $0.2 million and $0.3 million, respectively, to net unrealized gains on available-for-sale securities which have been included in Accumulated other comprehensive income(loss), net of tax. The cost basis used in computing the gain or loss on these securities was through specific identification. Realized gains and losses were immaterial in 2007, 2006 and 2005.
| |
| Note 8 — | Property, Plant, and Equipment |
Property, plant, and equipment, carried at cost, is summarized as follows at December 31, (in millions):
| | | | | | | | | |
| | | 2007 | | | 2006 | |
| |
| Land | | $ | 33.2 | | | $ | 30.9 | |
| Buildings and improvements | | | 200.1 | | | | 166.9 | |
| Machinery, tools and equipment | | | 579.2 | | | | 526.2 | |
| Construction-in-progress | | | 18.7 | | | | 65.7 | |
| | | | | | | | | |
| Gross property, plant, and equipment | | | 831.2 | | | | 789.7 | |
| Less accumulated depreciation | | | (504.1 | ) | | | (471.2 | ) |
| | | | | | | | | |
| Net property, plant, and equipment | | $ | 327.1 | | | $ | 318.5 | |
| | | | | | | | | |
5855
HUBBELL INCORPORATED AND SUBSIDIARIES
NOTES TO CONSOLIDATED FINANCIAL STATEMENTS — (Continued)
Contractual maturities ofavailable-for-sale andheld-to-maturity investments at December 31, 2006 were as follows (in millions):
| | | | | | | | | |
| | | Amortized
| | | Fair
| |
| | | Cost | | | Value | |
| |
Available-For-Sale Investments | | | | | | | | |
| Due after 10 years | | $ | 35.9 | | | $ | 35.9 | |
| | | | | | | | | |
Total | | $ | 35.9 | | | $ | 35.9 | |
| | | | | | | | | |
Held-To-Maturity Investments | | | | | | | | |
| Due within 1 year | | $ | 0.1 | | | $ | 0.1 | |
| After 1 year but within 5 years | | | 0.2 | | | | 0.2 | |
| | | | | | | | | |
Total | | $ | 0.3 | | | $ | 0.3 | |
| | | | | | | | | |
Included in theavailable-for-sale amounts above are variable rate demand notes of $35.9 million and auction rate securities of $100 million as of December 31, 2006 and 2005, respectively. These securities are reset to current interest rates periodically, typically every 28, 35 or 49 days. The 2006 amounts have been classified as having maturities beyond ten years in the table above.
In 2006, the Company recorded a $0.3 million credit to net unrealized gain/(loss) onavailable-for-sale securities that has been included in Accumulated other comprehensive income (loss), net of tax. In both 2005 and 2004, the Company recorded $0.3 million of charges to net unrealized gains/(loss). The cost basis used in computing the gain or loss on these securities was through specific identification. Realized gains and losses were immaterial in 2006, 2005 and 2004.
Note 8 — Property, Plant, and Equipment
Property, plant, and equipment, carried at cost, is summarized as follows at December 31, (in millions):
| | | | | | | | | |
| | | 2006 | | | 2005 | |
| |
| Land | | $ | 30.9 | | | $ | 23.5 | |
| Buildings and improvements | | | 166.9 | | | | 159.5 | |
| Machinery, tools and equipment | | | 526.2 | | | | 514.0 | |
| Construction-in-progress | | | 65.7 | | | | 24.0 | |
| | | | | | | | | |
| Gross property, plant, and equipment | | | 789.7 | | | | 721.0 | |
| Less accumulated depreciation | | | (471.2 | ) | | | (453.2 | ) |
| | | | | | | | | |
| Net property, plant, and equipment | | $ | 318.5 | | | $ | 267.8 | |
| | | | | | | | | |
Depreciable lives on buildings range between20-40 years. Depreciable lives on machinery, tools, and equipment range between 3-20 years. The Company recorded depreciation expense of $43.1 million, $42.3 million and $42.7 million for 2007, 2006 and $45.1 million for 2006, 2005, and 2004, respectively.
In the fourth quarter of 2005, the Company sold a factory/office building within the Electrical segment and entered into a sale-leaseback transaction for a term of five years for a portion of the facility. In connection with the sale of the building in 2005, the Company recorded cash proceeds of $11.6 million and recorded a $1.3 million receivable for additional cash proceeds which were received in 2006. The sales transaction resulted in a prior year gain of $7.9 million of which $4.9 million was recognized as a reduction of S&A expenses in 2005 and $3.0 million was deferred and is being recognized as a reduction of rent expense over the five year lease term.
59
HUBBELL INCORPORATED AND SUBSIDIARIES
NOTES TO CONSOLIDATED FINANCIAL STATEMENTS — (Continued)
Note 9 — Other Accrued Liabilities
| |
| Note 9 — | Other Accrued Liabilities |
Other Accrued Liabilities consists of the following at December 31, (in millions):
| | | | | | | | | | | | | | | | | |
| | | 2006 | | 2005 | | | 2007 | | 2006 | |
| |
| Insurance accruals | | $ | 42.8 | | | $ | 38.2 | | |
| Accrued income taxes | | | $ | 1.8 | | | $ | 18.5 | |
| Customer program incentives | | | 28.1 | | | | 21.2 | | | | 25.2 | | | | 28.1 | |
| Deferred revenue | | | | 23.3 | | | | 4.9 | |
| Other | | | 39.0 | | | | 30.4 | | | | 54.0 | | | | 37.5 | |
| | | | | | | | | | | |
| Total | | $ | 109.9 | | | $ | 89.8 | | | $ | 104.3 | | | $ | 89.0 | |
| | | | | | | | | | | |
Note 10 — Other Non-Current Liabilities
| |
| Note 10 — | Other Non-Current Liabilities |
Other Non-Current Liabilities consists of the following at December 31, (in millions):
| | | | | | | | | | | | | | | | | |
| | | 2006 | | 2005 | | | 2007 | | 2006 | |
| |
| Pensions | | $ | 79.2 | | | $ | 38.6 | | | $ | 47.5 | | | $ | 79.2 | |
| Other postretirement benefits | | | 33.6 | | | | 32.0 | | | | 30.1 | | | | 33.6 | |
| Deferred tax liabilities | | | 22.0 | | | | 19.6 | | | | 51.9 | | | | 22.0 | |
| Other | | | 19.6 | | | | 19.0 | | | | 32.4 | | | | 19.6 | |
| | | | | | | | | | | |
| Total | | $ | 154.4 | | | $ | 109.2 | | | $ | 161.9 | | | $ | 154.4 | |
| | | | | | | | | | | |
Note 11 — Retirement Benefits
| |
| Note 11 — | Retirement Benefits |
The Company has funded and unfunded non-contributory U.S. and foreign defined benefit pension plans. Benefits under these plans are generally provided based on either years of service and final average pay or a specified dollar amount per year of service. The Company also maintains fourfive defined contribution pension plans.
Effective January 1, 2004, the defined benefit pension plan for U.S. salaried and non-collectively bargained hourly employees was closed to employees hired on or after January 1, 2004. Effective January 1, 2006, the defined benefit pension plan for the Hubbell Canada salaried employees was closed to existing employees who did not meet certain age and service requirements as well as all new employees hired on or after January 1, 2006. Effective January 1, 2007 the defined benefit pension plan for Hubbell’s U.K. operations was closed to all new employees hired on or after January 1, 2007. These U.S., Canadian and U.K. employees are eligible instead for defined contribution plans. Effective December 31, 2007, the Company closed its Retirement Plan for Directors to active and future directors and transferred the present value liability to the Deferred Compensation Plan for directors.
The Company also has a number of health care and life insurance benefit plans covering eligible employees who reached retirement age while working for the Company. These benefits were discontinued in 1991 for substantially all future retirees, with the exception of Anderson Electrical Products which discontinued its plan for future retirees in 2004 and2004. A.B. Chance Company which still maintains aand PCORE maintain limited retiree medical planplans for itstheir union employees. The plans anticipateCompany anticipates future cost-sharing changes for its active and discontinued plans that are consistent with the Company’s past practices.
None of the acquisitions made in 2006 or 2005 impacted the defined benefit pension or other benefit assets or liabilities.
The In connection with the acquisition of PCORE in October 2007, the Company uses a December 31 measurement date for all ofacquired its plans. No amendments made in 2006 to the defined benefit pension plans had a significant impact on the total pension benefit obligation. Amendments made during 2005 to the Company’s defined benefit plans decreased the total pension benefit obligation by $1.4 million.and other post employment plans.
6056
HUBBELL INCORPORATED AND SUBSIDIARIES
NOTES TO CONSOLIDATED FINANCIAL STATEMENTS — (Continued)
The Company uses a December 31 measurement date for all of its plans. No amendments made in 2007 or 2006 to the defined benefit pension plans had a significant impact on the total pension benefit obligation.
The following table sets forth the reconciliation of beginning and ending balances of the benefit obligations and the plan assets for the Company’s defined benefit pension and other benefit plans at December 31, (in millions):
| | | | | | | | | | | | | | | | | | | | | | | | | | | | | | | | | |
| | | Pension Benefits | | Other Benefits | | | Pension Benefits | | Other Benefits | |
| | | 2006 | | 2005 | | 2006 | | 2005 | | | 2007 | | 2006 | | 2007 | | 2006 | |
| |
Change in benefit obligation | | | | | | | | | | | | | | | | | | | | | | | | | | | | | | | | |
| Benefit obligation at beginning of year | | $ | 580.4 | | | $ | 512.4 | | | $ | 41.3 | | | $ | 40.3 | | | $ | 591.4 | | | $ | 580.4 | | | $ | 33.6 | | | $ | 41.3 | |
| Service cost | | | 17.9 | | | | 16.1 | | | | 0.3 | | | | 0.8 | | | | 16.9 | | | | 17.9 | | | | 0.5 | | | | 0.3 | |
| Interest cost | | | 30.9 | | | | 29.1 | | | | 2.1 | | | | 2.1 | | | | 32.7 | | | | 30.9 | | | | 1.7 | | | | 2.1 | |
| Plan participants’ contributions | | | 0.6 | | | | 0.6 | | | | — | | | | — | | | | 0.9 | | | | 0.6 | | | | — | | | | — | |
| Amendments | | | — | | | | (1.4 | ) | | | (0.2 | ) | | | — | | | | — | | | | — | | | | — | | | | (0.2 | ) |
| Curtailment and settlement loss | | | 0.7 | | | | 3.1 | | | | — | | | | — | | | | — | | | | 0.7 | | | | — | | | | — | |
| Special termination benefits | | | — | | | | — | | | | 0.4 | | | | — | | | | — | | | | — | | | | 1.4 | | | | 0.4 | |
| Actuarial loss (gain) | | | (11.2 | ) | | | 44.8 | | | | (7.5 | ) | | | 1.0 | | | | (38.4 | ) | | | (11.2 | ) | | | (4.6 | ) | | | (7.5 | ) |
| Acquisitions/Divestitures | | | | (1.5 | ) | | | — | | | | 0.3 | | | | — | |
| Currency impact | | | | 2.6 | | | | — | | | | — | | | | — | |
| Other | | | | — | | | | — | | | | (0.2 | ) | | | — | |
| Benefits paid | | | (27.9 | ) | | | (24.3 | ) | | | (2.8 | ) | | | (2.9 | ) | | | (27.4 | ) | | | (27.9 | ) | | | (2.6 | ) | | | (2.8 | ) |
| | | | | | | | | | | | | | | | | | | |
| Benefit obligation at end of year | | $ | 591.4 | | | $ | 580.4 | | | $ | 33.6 | | | $ | 41.3 | | | $ | 577.2 | | | $ | 591.4 | | | $ | 30.1 | | | $ | 33.6 | |
| | | | | | | | | | | | | | | | | | | |
Change in plan assets | | | | | | | | | | | | | | | | | | | | | | | | | | | | | | | | |
| Fair value of plan assets at beginning of year | | $ | 481.9 | | | $ | 426.6 | | | $ | — | | | $ | — | | | $ | 531.6 | | | $ | 481.9 | | | $ | — | | | $ | — | |
| Actual return on plan assets | | | 66.2 | | | | 44.4 | | | | — | | | | — | | | | 69.9 | | | | 66.2 | | | | — | | | | — | |
| Acquisitions/Divestitures | | | | 0.4 | | | | — | | | | — | | | | — | |
| Employer contributions | | | 10.8 | | | | 34.6 | | | | — | | | | — | | | | 31.5 | | | | 10.8 | | | | — | | | | — | |
| Plan participants’ contributions | | | 0.6 | | | | 0.6 | | | | — | | | | — | | | | 0.9 | | | | 0.6 | | | | — | | | | — | |
| Currency impact | | | | 2.2 | | | | — | | | | — | | | | — | |
| Benefits paid | | | (27.9 | ) | | | (24.3 | ) | | | — | | | | — | | | | (27.4 | ) | | | (27.9 | ) | | | — | | | | — | |
| | | | | | | | | | | | | | | | | | | |
| Fair value of plan assets at end of year | | $ | 531.6 | | | $ | 481.9 | | | $ | — | | | $ | — | | | $ | 609.1 | | | $ | 531.6 | | | $ | — | | | $ | — | |
| | | | | | | | | | | | | | | | | | | |
Funded status | | $ | (59.8 | ) | | $ | (98.5 | ) | | $ | (33.6 | ) | | $ | (41.3 | ) | | $ | 31.9 | | | $ | (59.8 | ) | | $ | (30.1 | ) | | $ | (33.6 | ) |
| Unrecognized net actuarial loss | | | — | | | | 99.7 | | | | — | | | | 11.6 | | |
| Unrecognized prior service cost | | | — | | | | 1.7 | | | | — | | | | (2.3 | ) | |
| | | | | | | | | | | |
| Prepaid (accrued) benefit cost | | $ | (59.8 | ) | | $ | 2.9 | | | $ | (33.6 | ) | | $ | (32.0 | ) | |
| | | | | | | | | | | | | | | | | | | |
Amounts recognized in the consolidated balance sheet consist of: | | | | | | | | | | | | | | | | | | | | | | | | | | | | | | | | |
| Prepaid pensions | | $ | 22.5 | | | $ | 34.8 | | | $ | — | | | $ | — | | |
| Prepaid pensions (included in Intangible assets and other) | | | $ | 82.6 | | | $ | 22.5 | | | $ | — | | | $ | — | |
| Accrued benefit liability (short-term and long-term) | | | (82.3 | ) | | | (39.0 | ) | | | (33.6 | ) | | | (32.0 | ) | | | (50.7 | ) | | | (82.3 | ) | | | (30.1 | ) | | | (33.6 | ) |
| Intangible asset | | | — | | | | 0.6 | | | | — | | | | — | | |
| Accumulated other comprehensive income (loss), pretax | | | — | | | | 6.5 | | | | — | | | | — | | |
| | | | | | | | | | | | | | | | | | | |
| Net amount recognized | | $ | (59.8 | ) | | $ | 2.9 | | | $ | (33.6 | ) | | $ | (32.0 | ) | | $ | 31.9 | | | $ | (59.8 | ) | | $ | (30.1 | ) | | $ | (33.6 | ) |
| | | | | | | | | | | | | | | | | | | |
Pretax amounts recognized in Accumulated other comprehensive income consist of: | | | | | | | | | | | | | | | | | |
| Net actuarial loss | | $ | 57.0 | | | $ | — | | | $ | 3.6 | | | $ | — | | |
Amounts recognized in Accumulated other comprehensive (income) loss consist of: | | | | | | | | | | | | | | | | | |
| Net actuarial loss (gain) | | | $ | (9.9 | ) | | $ | 57.0 | | | $ | (1.1 | ) | | $ | 3.6 | |
| Prior service cost (credit) | | | 1.5 | | | | — | | | | (2.4 | ) | | | — | | | | 2.2 | | | | 1.5 | | | | (2.2 | ) | | | (2.4 | ) |
| Transition obligation | | | — | | | | — | | | | — | | | | — | | |
| | | | | | | | | | | | | | | | | | | |
| Net amount recognized | | $ | 58.5 | | | $ | — | | | $ | 1.2 | | | $ | — | | | $ | (7.7 | ) | | $ | 58.5 | | | $ | (3.3 | ) | | $ | 1.2 | |
| | | | | | | | | | | | | | | | | | | |
6157
HUBBELL INCORPORATED AND SUBSIDIARIES
NOTES TO CONSOLIDATED FINANCIAL STATEMENTS — (Continued)
The accumulated benefit obligation for all defined benefit pension plans was $523.3$516.2 million and $515.4$523.3 million at December 31, 20062007 and 2005,2006, respectively. Information with respect to plans with accumulated benefit obligations in excess of plan assets is as follows, (in millions):
| | | | | | | | | | | | | | | | | |
| | | 2006 | | 2005 | | | 2007 | | 2006 | |
| |
| Projected benefit obligation | | $ | 64.4 | | | $ | 65.0 | | | $ | 49.5 | | | $ | 64.4 | |
| Accumulated benefit obligation | | $ | 54.2 | | | $ | 56.1 | | | $ | 45.1 | | | $ | 54.2 | |
| Fair value of plan assets | | $ | 8.0 | | | $ | 8.7 | | | $ | 0.4 | | | $ | 8.0 | |
In accordance with SFAS No. 87, “Employers’ Accounting for Pensions”, additional liabilities to recognize the required minimum liability were as follows (in millions):
| | | | | | | | | |
| | | 2006 | | | 2005 | |
| |
Minimum liability included in Accumulated other comprehensive income (loss): | | | | | | | | |
| Increase (decrease) in minimum liability included in other comprehensive income | | $ | (3.4 | ) | | $ | 3.6 | |
No amortization of unrecognized loss (gain) or prior service cost (credit) was recognized in Accumulated other comprehensive income during either 2005 or 2006. The estimated unrecognized net loss and prior service (credit) for the defined benefit pension plans that will amortize from Accumulated other comprehensive income into net periodic benefit cost in 2007 are $2.1 million and ($0.3) million, respectively. The estimated prior service (credit) for other postretirement benefit plans that will amortize from Accumulated other comprehensive income into net periodic benefit cost in 2007 is ($0.2) million.
The following table summarizes the effect of the additional minimum liability (“AML”) and the initial adoption of SFAS No. 158 (in millions):
| | | | | | | | | | | | | | | | | |
| | | December 31, 2006
| | | | | | | | | December 31, 2006
| |
| | | Before Application
| | | | | | | | | After Application
| |
| | | of AML and
| | | AML
| | | SFAS No. 158
| | | of AML and
| |
| | | SFAS No. 158 | | | Adjustment | | | Adjustment | | | SFAS No. 158 | |
| |
| Pension and OPEB deferred taxes, net | | $ | 9.4 | | | $ | (1.3 | ) | | $ | 19.7 | | | $ | 27.8 | |
| Pension intangible | | | 0.6 | | | | 0.4 | | | | (1.0 | ) | | | — | |
| Prepaid pension | | | 40.5 | | | | — | | | | (18.0 | ) | | | 22.5 | |
| Pension liabilities | | | (48.9 | ) | | | 2.9 | | | | (36.3 | ) | | | (82.3 | ) |
| Postretirement liabilities | | | (32.4 | ) | | | — | | | | (1.2 | ) | | | (33.6 | ) |
| Accumulated other comprehensive income-pension | | | 4.1 | | | | (2.1 | ) | | | 36.8 | | | | 38.8 | |
62
HUBBELL INCORPORATED AND SUBSIDIARIES
NOTES TO CONSOLIDATED FINANCIAL STATEMENTS — (Continued)
The following table sets forth the components of pension and other benefits cost for the years ended December 31, (in millions):
| | | | | | | | | | | | | | | | | | | | | | | | | | | | | | | | | | | | | | | | | | | | | | | | | | | | |
| | | Pension Benefits | | Other Benefits | | | Pension Benefits | | Other Benefits | |
| | | 2006 | | 2005 | | 2004 | | 2006 | | 2005 | | 2004 | | | 2007 | | 2006 | | 2005 | | 2007 | | 2006 | | 2005 | |
| |
Components of net periodic benefit cost | | | | | | | | | | | | | | | | | | | | | | | | | | | | | | | | | | | | | | | | | | | | | | | | | | | | |
| Service cost | | $ | 17.9 | | | $ | 16.1 | | | $ | 13.9 | | | | | | | $ | 0.3 | | | $ | 0.8 | | | $ | 0.4 | | | $ | 16.9 | | | $ | 17.9 | | | $ | 16.1 | | | $ | 0.5 | | | $ | 0.3 | | | $ | 0.8 | |
| Interest cost | | | 30.9 | | | | 29.1 | | | | 27.9 | | | | | | | | 2.1 | | | | 2.1 | | | | 2.6 | | | | 32.7 | | | | 30.9 | | | | 29.1 | | | | 1.7 | | | | 2.1 | | | | 2.1 | |
| Expected return on plan assets | | | (37.5 | ) | | | (33.9 | ) | | | (28.7 | ) | | | | | | | — | | | | — | | | | — | | | | (42.6 | ) | | | (37.5 | ) | | | (33.9 | ) | | | — | | | | — | | | | — | |
| Amortization of prior service cost | | | (0.4 | ) | | | 0.4 | | | | 0.5 | | | | | | | | — | | | | — | | | | — | | | | (0.3 | ) | | | (0.4 | ) | | | 0.4 | | | | (0.2 | ) | | | — | | | | — | |
| Amortization of actuarial losses | | | 3.8 | | | | 2.3 | | | | 1.1 | | | | | | | | 0.3 | | | | 0.3 | | | | 0.6 | | | | 1.9 | | | | 3.8 | | | | 2.3 | | | | 0.1 | | | | 0.3 | | | | 0.3 | |
| Special termination benefits | | | — | | | | — | | | | — | | | | | | | | 0.4 | | | | — | | | | — | | | | — | | | | — | | | | — | | | | — | | | | 0.4 | | | | — | |
| Curtailment and settlement losses | | | 0.7 | | | | 3.1 | | | | — | | | | | | | | — | | | | — | | | | — | | | | (0.1 | ) | | | 0.7 | | | | 3.1 | | | | 1.4 | | | | — | | | | — | |
| | | | | | | | | | | | | | | | | | | | | | | | | | | |
| Net periodic benefit cost | | $ | 15.4 | | | $ | 17.1 | | | $ | 14.7 | | | | | | | $ | 3.1 | | | $ | 3.2 | | | $ | 3.6 | | | $ | 8.5 | | | $ | 15.4 | | | $ | 17.1 | | | $ | 3.5 | | | $ | 3.1 | | | $ | 3.2 | |
| | | | | | | | | | | | | | | | | | | | | | | | | | | |
Changes recognized in AOCI, before tax, (in millions): | | | | | | | | | | | | | | | | | | | | | | | | | |
| Current year net actuarial loss/(gain) | | | $ | (66.0 | ) | | | | | | | | | | $ | (4.8 | ) | | | | | | | | |
| Current year prior service cost | | | | — | | | | | | | | | | | | — | | | | | | | | | |
| Amortization of prior service cost | | | | 0.3 | | | | | | | | | | | | 0.2 | | | | | | | | | |
| Amortization of net actuarial (loss)/gain | | | | (1.9 | ) | | | | | | | | | | | (0.1 | ) | | | | | | | | |
| Other adjustments | | | | 0.1 | | | | | | | | | | | | — | | | | | | | | | |
| | | | | | | |
| Total recognized in accumulated other comprehensive income | | | | (67.5 | ) | | | | | | | | | | | (4.7 | ) | | | | | | | | |
| | | | | | | |
Total recognized in net periodic pension cost and accumulated other comprehensive income | | | $ | (59.0 | ) | | | | | | | | | | $ | (1.2 | ) | | | | | | | | |
| | | | | | | |
Amortization expected to be recognized through income during 2008 | | | | | | | | | | | | | | | | | | | | | | | | | |
| Amortization of prior service cost/(credit) | | | $ | 0.3 | | | | | | | | | | | $ | (0.2 | ) | | | | | | | | |
| Amortization of net loss/(gains) | | | | 1.3 | | | | | | | | | | | | — | | | | | | | | | |
| | | | | | | |
| Total expected to be recognized through income during next fiscal year | | | $ | 1.6 | | | | | | | | | | | $ | (0.2 | ) | | | | | | | | |
| | | | | | | |
In addition to the above, certain of the Company’s union employees participate in multi-employer defined benefit plans. The total Company cost of these plans was $0.7 million in both 2007 and 2006 and $0.5 million in 2005 and $0.6 million in 2004.2005.
58
HUBBELL INCORPORATED AND SUBSIDIARIES
NOTES TO CONSOLIDATED FINANCIAL STATEMENTS — (Continued)
The Company also maintains fourfive defined contribution pension plans (excluding an employer match for the 401(k) plan). The total cost of these plans was $5.8 million in 2007, $5.6 million in 2006 and $3.6 million in 2005 and $2.9 million in 2004.2005. This cost is not included in the above net periodic benefit cost for the defined benefit pension plans.
Assumptions
The following assumptions were used to determine the projected benefit obligations at the measurement date and the net periodic benefit cost for the year:
| | | | | | | | | | | | | | | | | | | | | | | | | | | | | | | | | | | | | | | | | | | | | | | | | |
| | | Pension Benefits | | Other Benefits | | | Pension Benefits | | Other Benefits | |
| | | 2006 | | 2005 | | 2004 | | 2006 | | 2005 | | 2004 | | | 2007 | | 2006 | | 2005 | | 2007 | | 2006 | | 2005 | |
| |
Weighted-average assumptions used to determine
benefit obligations at December 31 | | | | | | | | | | | | | | | | | | | | | | | | | | | | | | | | | | | | | | | | | | | | | | | | |
| Discount rate | | | 5.66 | % | | | 5.45 | % | | | 5.75 | % | | | 5.75 | % | | | 5.50 | % | | | 5.75 | % | | | 6.41 | % | | | 5.66 | % | | | 5.45 | % | | | 6.50 | % | | | 5.75 | % | | | 5.50 | % |
| Rate of compensation increase | | | 4.33 | % | | | 4.25 | % | | | 4.25 | % | | | N/A | | | | N/A | | | | N/A | | | | 4.58 | % | | | 4.33 | % | | | 4.25 | % | | | N/A | | | | N/A | | | | N/A | |
Weighted-average assumptions used to determine net periodic benefit cost for years ended December 31 | | | | | | | | | | | | | | | | | | | | | | | | | | | | | | | | | | | | | | | | | | | | | | | | |
| Discount rate | | | 5.45 | % | | | 5.75 | % | | | 6.25 | % | | | 5.50 | % | | | 5.75 | % | | | 6.25 | % | | | 5.66 | % | | | 5.45 | % | | | 5.75 | % | | | 5.75 | % | | | 5.50 | % | | | 5.75 | % |
| Expected return on plan assets | | | 8.00 | % | | | 8.00 | % | | | 8.25 | % | | | N/A | | | | N/A | | | | N/A | | | | 8.00 | % | | | 8.00 | % | | | 8.00 | % | | | N/A | | | | N/A | | | | N/A | |
| Rate of compensation increase | | | 4.33 | % | | | 4.25 | % | | | 4.25 | % | | �� | N/A | | | | N/A | | | | N/A | | | | 4.58 | % | | | 4.33 | % | | | 4.25 | % | | | N/A | | | | N/A | | | | N/A | |
At the beginning of each calendar year, the Company determines the appropriate expected return on assets for each plan based upon its strategic asset allocation (see discussion below). In making this determination, the Company utilizes expected returns for each asset class based upon current market conditions and expected risk premiums for each asset class.
63
HUBBELL INCORPORATED AND SUBSIDIARIES
NOTES TO CONSOLIDATED FINANCIAL STATEMENTS — (Continued)
The assumed health care cost trend rates used to determine the projected postretirement benefit obligation are as follows:
| | | | | | | | | | | | | | | | | | | | | | | | | |
| | | Other Benefits | | | Other Benefits | |
| | | 2006 | | 2005 | | 2004 | | | 2007 | | 2006 | | 2005 | |
| |
Assumed health care cost trend rates at December 31 | | | | | | | | | | | | | | | | | | | | | | | | |
| Health care cost trend assumed for next year | | | 9.0 | % | | | 9.0 | % | | | 9.0 | % | | | 9.0 | % | | | 9.0 | % | | | 9.0 | % |
| Rate to which the cost trend is assumed to decline | | | 5.0 | % | | | 5.0 | % | | | 5.0 | % | | | 5.0 | % | | | 5.0 | % | | | 5.0 | % |
| Year that the rate reaches the ultimate trend rate | | | 2015 | | | | 2015 | | | | 2014 | | | | 2015 | | | | 2015 | | | | 2015 | |
Assumed health care cost trend rates have a significant effect on the amounts reported for the postretirement benefit plans. A one-percentage-point change in assumed health care cost trend rates would have the following effects (in millions):
| | | | | | | | | | | | | | | | | |
| | | One Percentage
| | One Percentage
| | | One Percentage
| | One Percentage
| |
| | | Point Increase | | Point Decrease | | | Point Increase | | Point Decrease | |
| |
| Effect on total of service and interest cost | | $ | 0.2 | | | $ | (0.2 | ) | | $ | 0.1 | | | $ | (0.1 | ) |
| Effect on postretirement benefit obligation | | $ | 1.8 | | | $ | (2.2 | ) | | $ | 1.6 | | | $ | (1.4 | ) |
59
HUBBELL INCORPORATED AND SUBSIDIARIES
In December 2003, President Bush signed into law the Medicare Prescription Drug, Improvement and Modernization Act of 2003 (“the Act”). The Act expanded Medicare to include coverage for prescription drugs. This legislation resulted in a reduction of $2.6 million in the Company’s benefit obligation as of December 31, 2005 and resulted in a pretax benefit of approximately $0.2 million in 2006.NOTES TO CONSOLIDATED FINANCIAL STATEMENTS — (Continued)
Plan Assets
The Company’s combined targeted and actual domestic and foreign pension plans weighted average asset allocation at December 31, 2007 and 2006, and 2005, and 20072008 target allocation by asset category are as follows:
| | | | | | | | | | | | | | | | | | | | | |
| | | Target
| | Percentage of
| | | Target
| | | | | |
| | | Allocation
| | Plan Assets | | | Allocation
| | Percentage of Plan Assets | |
| | | 2007 | | 2006 | | 2005 | | | 2008 | | 2007 | | 2006 | |
| |
Asset Category | | | | | | | | | | | | | | | | | | | | | | | | |
| Equity Securities | | | 65 | % | | | 71 | % | | | 72 | % | | | 53 | % | | | 59 | % | | | 71 | % |
| Debt Securities & Cash | | | 35 | % | | | 28 | % | | | 26 | % | | | 25 | % | | | 26 | % | | | 20 | % |
| Alternative investments | | | | 20 | % | | | 12 | % | | | 8 | % |
| Other | | | — | | | | 1 | % | | | 2 | % | | | 2 | % | | | 3 | % | | | 1 | % |
| | | | | | | | | | | | | | | |
| Total | | | 100 | % | | | 100 | % | | | 100 | % | | | 100 | % | | | 100 | % | | | 100 | % |
| | | | | | | | | | | | | | | |
The Company has a written investment policy and asset allocation guidelines for its domestic and foreign pension plans. In establishing these policies, the Company has considered that its various pension plans are a major retirement vehicle for most plan participants and has acted to discharge its fiduciary responsibilities with regard to the plans solely in the interest of such participants and their beneficiaries. The goal underlying the establishment of the investment policies is to provide that pension assets shall be invested in a prudent manner and so that, together with the expected contributions to the plans, the funds will be sufficient to meet the obligations of the plans as they become due. To achieve this result, the Company conducts a periodic strategic asset allocation study to form a basis for the allocation of pension assets between various asset categories. Specific policy benchmark percentages are assigned to each asset category with minimum and maximum ranges established for each. The assets are then tactically managed within these ranges. At no time may derivatives be utilized to leverage the asset portfolio.
Equity securities include Company common stock in the amounts of $18.5 million (3.4% of total domestic plan assets) and $15.5 million (3% of total plan assets) and $14.8 million (3% of totaldomestic plan assets) at December 31, 2007 and 2006, and 2005, respectively.
64
HUBBELL INCORPORATED AND SUBSIDIARIES
NOTES TO CONSOLIDATED FINANCIAL STATEMENTS — (Continued)
The Company’s other postretirement benefits are unfunded. Therefore, no asset information is reported.
Cash Flows
Contributions
The Company contributed $15 million in the first quarter of 2007does not expect to make a contribution to its qualified domestic qualified, defined benefit pension plans.plans in 2008. The Company expects to contribute $5-$7approximately $7 million to its foreign plans in 2007.2008.
Estimated Future Benefit Payments
The following domestic and foreign benefit payments, which reflect future service, as appropriate, are expected to be paid, (in millions):
| | | | | | | | | | | | | | | | | | | | | | | | | | | | | | | | | |
| | | | | Other Benefits | | | | | Other Benefits | |
| | | | | | | Medicare
| | | | | | | | | Medicare
| | | |
| | | | | | | Part D
| | | | | Pension
| | | | Part D
| | | |
| | | Pension Benefits | | Gross | | Subsidy | | Net | | | Benefits | | Gross | | Subsidy | | Net | |
| |
| 2007 | | $ | 25.2 | | | $ | 2.8 | | | $ | 0.2 | | | $ | 2.6 | | |
| 2008 | | $ | 27.1 | | | $ | 2.8 | | | $ | 0.2 | | | $ | 2.6 | | | $ | 26.5 | | | $ | 2.6 | | | $ | 0.2 | | | $ | 2.4 | |
| 2009 | | $ | 28.3 | | | $ | 2.8 | | | $ | 0.2 | | | $ | 2.6 | | | $ | 28.1 | | | $ | 2.6 | | | $ | 0.2 | | | $ | 2.4 | |
| 2010 | | $ | 29.5 | | | $ | 2.9 | | | $ | 0.2 | | | $ | 2.7 | | | $ | 29.4 | | | $ | 2.6 | | | $ | 0.2 | | | $ | 2.4 | |
| 2011 | | $ | 31.0 | | | $ | 2.9 | | | $ | 0.2 | | | $ | 2.7 | | | $ | 31.4 | | | $ | 2.6 | | | $ | 0.2 | | | $ | 2.4 | |
| 2012-2016 | | $ | 178.1 | | | $ | 13.7 | | | $ | 1.0 | | | $ | 12.7 | | |
| 2012 | | | $ | 33.0 | | | $ | 2.6 | | | $ | 0.2 | | | $ | 2.4 | |
| 2013-2017 | | | $ | 194.9 | | | $ | 11.9 | | | $ | 1.0 | | | $ | 10.9 | |
Note 12 — Debt
The following table sets forth the components of the Company’s debt structure at December 31, (in millions):
| | | | | | | | | | | | | | | | | | | | | | | | | |
| | | 2006 | | | 2005 | |
| | | | | | | | | | | | | | | Senior Notes
| | | | |
| | | Short-Term
| | | Senior Notes
| | | | | | Short-Term
| | | (Current and
| | | | |
| | | Debt | | | (Long-Term) | | | Total | | | Debt | | | Long-Term) | | | Total | |
| |
| Balance at year end | | $ | 20.9 | | | $ | 199.3 | | | $ | 220.2 | | | $ | 29.6 | | | $ | 199.2 | | | $ | 228.8 | |
| Highest aggregate | | | | | | | | | | | | | | | | | | | | | | | | |
| month-end balance | | | | | | | | | | $ | 259.3 | | | | | | | | | | | $ | 307.3 | |
| Average borrowings | | $ | 24.5 | | | $ | 199.3 | | | $ | 223.8 | | | $ | 13.7 | | | $ | 274.1 | | | $ | 287.8 | |
| Weighted average | | | | | | | | | | | | | | | | | | | | | | | | |
| interest rate: | | | | | | | | | | | | | | | | | | | | | | | | |
| At year end | | | 5.53 | % | | | 6.38 | % | | | 6.29 | % | | | 4.85 | % | | | 6.38 | % | | | 6.18 | % |
| Paid during the year | | | 5.76 | % | | | 6.38 | % | | | 6.31 | % | | | 4.38 | % | | | 6.46 | % | | | 6.36 | % |
At December 31, 2006 and 2005, the Company had $20.9 million and $29.6 million, respectively, of debt reflected as Short-term debt in the Consolidated Balance Sheet. The 2006 short-term debt consisted of a $5.1 million money market loan and $15.8 million of commercial paper. The 2005 short-term debt consisted of a $7.5 million money market loan, $22.0 million of borrowings against the Company’s Credit Facility, and $0.1 million of other borrowings. At December 31, 2006 and 2005, the Company had $199.3 million and $199.2 million, respectively, of senior notes reflected as Long-Term Debt in the Consolidated Balance Sheet.
At December 31, 2006, the unused portion of the money market loan was 2.4 million pounds sterling ($4.7 million U.S.). The interest rate applicable to borrowings under the loan is a surcharge over LIBOR. There are no annual commitment fees associated with this loan.
6560
HUBBELL INCORPORATED AND SUBSIDIARIES
NOTES TO CONSOLIDATED FINANCIAL STATEMENTS — (Continued)
The following table sets forth the components of the Company’s debt structure at December 31, (in millions):
| | | | | | | | | | | | | | | | | | | | | | | | | |
| | | 2007 | | | 2006 | |
| | | Short-Term
| | | Senior Notes
| | | | | | Short-Term
| | | Senior Notes
| | | | |
| | | Debt | | | (Long-Term) | | | Total | | | Debt | | | (Long-Term) | | | Total | |
| |
| Balance at year end | | $ | 36.7 | | | $ | 199.4 | | | $ | 236.1 | | | $ | 20.9 | | | $ | 199.3 | | | $ | 220.2 | |
Highest aggregatemonth-end balance | | | | | | | | | | $ | 314.0 | | | | | | | | | | | $ | 259.3 | |
| Average borrowings | | $ | 64.2 | | | $ | 199.4 | | | $ | 263.6 | | | $ | 24.5 | | | $ | 199.3 | | | $ | 223.8 | |
Weighted average
interest rate: | | | | | | | | | | | | | | | | | | | | | | | | |
| At year end | | | 5.30 | % | | | 6.38 | % | | | 6.21 | % | | | 5.53 | % | | | 6.38 | % | | | 6.29 | % |
| Paid during the year | | | 5.25 | % | | | 6.38 | % | | | 6.10 | % | | | 5.76 | % | | | 6.38 | % | | | 6.31 | % |
At December 31, 2007 and 2006, the Company had $36.7 million and $20.9 million, respectively, of debt reflected as Short-term debt in the Consolidated Balance Sheet. The 2007 short-term debt consisted of $36.7 million of commercial paper. The 2006 short-term debt consisted of a $5.1 million money market loan and $15.8 million of commercial paper. At December 31, 2007 and 2006, the Company had $199.4 million and $199.3 million, respectively, of senior notes reflected as Long-Term Debt in the Consolidated Balance Sheet. Interest and fees paid related to total indebtedness totaled $17.1 million for 2007, $14.8 million forin 2006 and $18.6 million in 2005 and $19.8 million in 2004. During 2005, the Company amended and restated its domestic bank credit agreement to admit a wholly-owned foreign subsidiary as a borrower. This amendment and restatement was required in order for the Company to repatriate foreign earnings at a reduced tax rate under the American Jobs Creation Act of 2004. This repatriation was accomplished by borrowing $22.0 million, via the Credit Facility and through cash held outside the U.S. At December 31, 2006 and through the filing date of thisForm 10-K, the Company had domestic unused bank credit commitments of $200 million. The expiration date of the amended Credit Facility is October 20, 2009. The interest rate applicable to borrowings under the credit agreement is either the prime rate or a surcharge over LIBOR. Annual commitment fee requirements to support availability of the Company’s Credit Facility at December 31, 2006, totaled approximately $0.2 million. The Credit Facility includes covenants that shareholders’ equity will be greater than $675 million and total debt will not exceed 55% of total capitalization (defined as total debt plus total shareholders’ equity). The Company is in compliance with all debt covenants at December 31, 2006 and 2005. In addition, the Company has an unsecured line of credit for $40 million to support issuance of its letters of credit. At December 31, 2006 the Company had approximately $38 million of letters of credit outstanding under this facility.
In October 1995, the Company issued ten year, non-callable notes due in 2005 at face value of $100 million and a fixed interest rate of 6.625%. These notes were fully repaid in October 2005 using a combination of cash and commercial paper borrowings. In May 2002, the Company issued ten year, non- callable notes due in 2012 at face value of $200 million and a fixed interest rate of 6.375%. These notes are fixed rate indebtedness, are not callable and are only subject to accelerated payment prior to maturity if we failthe Company fails to meet certain non-financial covenants, all of which were met at December 31, 20062007 and 2005.2006. The most restrictive of these covenants limits our ability to enter into mortgages and sale-leasebacks of property having a net book value in excess of $5 million without the approval of the Note holders.
In October 2007, the Company entered into a revised five year, $250 million revolving credit facility to replace the previous $200 million facility which was scheduled to expire in October 2009. There have been no material changes from the previous facility other than the amount. The interest rate applicable to borrowings under the new credit agreement is either the prime rate or a surcharge over LIBOR. The expiration date of the new credit agreement is October 31, 2012. The covenants of the new facility require that shareholders’ equity be greater than $675 million and that total debt not exceed 55% of total capitalization (defined as total debt plus total shareholders’ equity). The Company is in compliance with all debt covenants at December 31, 2007 and 2006. Annual commitment fee requirements to support availability of the credit facility were not material. At December 31, 2007, the Company had approximately $19.5 million of letters of credit outstanding.
The Company also has a five million pounds sterling revolving credit agreement with Barclay’s Bank in the UK that will expire in July 2008. The interest rate applicable to borrowings under the credit agreement is a surcharge over LIBOR. There are no annual commitment fees associated with this credit agreement.
At December 31, 2007 and through the filing date of thisForm 10-K, the Company had unused bank credit commitments of $250 million and five million pounds sterling.
61
Note 13 — Income TaxesHUBBELL INCORPORATED AND SUBSIDIARIES
NOTES TO CONSOLIDATED FINANCIAL STATEMENTS — (Continued)
The following table sets forth selected data with respect to the Company’s income tax provisions for the years ended December 31, (in millions):
| | | | | | | | | | | | | | | | | | | | | | | | | |
| | | 2006 | | 2005 | | 2004 | | | 2007 | | 2006 | | 2005 | |
| |
| Income before income taxes: | | | | | | | | | | | | | | | | | | | | | | | | |
| United States | | $ | 151.1 | | | $ | 178.8 | | | $ | 169.6 | | | $ | 191.9 | | | $ | 151.1 | | | $ | 178.8 | |
| International | | | 70.4 | | | | 36.9 | | | | 27.7 | | | | 92.3 | | | | 70.4 | | | | 36.9 | |
| | | | | | | | | | | | | | | |
| Total | | $ | 221.5 | | | $ | 215.7 | | | $ | 197.3 | | | $ | 284.2 | | | $ | 221.5 | | | $ | 215.7 | |
| | | | | | | | | | | | | | | |
| Provision for income taxes — current: | | | | | | | | | | | | | | | | | | | | | | | | |
| Federal | | $ | 41.8 | | | $ | 29.5 | | | $ | 19.7 | | | $ | 60.6 | | | $ | 41.8 | | | $ | 29.5 | |
| State | | | 5.0 | | | | 5.1 | | | | 2.7 | | | | 7.7 | | | | 5.0 | | | | 5.1 | |
| International | | | 5.2 | | | | 9.6 | | | | 3.1 | | | | 11.3 | | | | 5.2 | | | | 9.6 | |
| | | | | | | | | | | | | | | |
| Total provision-current | | | 52.0 | | | | 44.2 | | | | 25.5 | | | | 79.6 | | | | 52.0 | | | | 44.2 | |
| | | | | | | | | | | | | | | |
| Provision for income taxes — deferred: | | | | | | | | | | | | | | | | | | | | | | | | |
| Federal | | | 7.8 | | | | 8.7 | | | | 14.1 | | | $ | (8.4 | ) | | $ | 7.8 | | | $ | 8.7 | |
| State | | | 0.8 | | | | 0.5 | | | | 1.2 | | | | (0.7 | ) | | | 0.8 | | | | 0.5 | |
| International | | | 2.8 | | | | (2.8 | ) | | | 1.8 | | | | 5.4 | | | | 2.8 | | | | (2.8 | ) |
| | | | | | | | | | | | | | | |
| Total provision — deferred | | | 11.4 | | | | 6.4 | | | | 17.1 | | | | (3.7 | ) | | | 11.4 | | | | 6.4 | |
| | | | | | | | | | | | | | | |
| Total provision for income taxes | | $ | 63.4 | | | $ | 50.6 | | | $ | 42.6 | | | $ | 75.9 | | | $ | 63.4 | | | $ | 50.6 | |
| | | | | | | | | | | | | | | |
Beginning in 2006, the Company’s Puerto Rico operations are classified as International for tax purposes as these operations began conducting business as foreign corporations.
6662
HUBBELL INCORPORATED AND SUBSIDIARIES
NOTES TO CONSOLIDATED FINANCIAL STATEMENTS — (Continued)
Beginning in 2006, the Company’s Puerto Rico operations are classified as International for tax purposes as these operations now conduct business as foreign corporations.
Deferred tax assets and liabilities result from differences in the basis of assets and liabilities for tax and financial statement purposes. The components of the deferred tax assets/(liabilities) at December 31, were as follows (in millions):
| | | | | | | | | | | | | | | | | |
| | | 2006 | | 2005 | | | 2007 | | 2006 | |
| |
Current tax assets/(liabilities): | | | | | | | | | |
Deferred tax assets: | | | | | | | | | |
| Inventory | | $ | 5.9 | | | $ | 5.3 | | | $ | 8.8 | | | $ | 3.1 | |
| LIFO inventory of acquired businesses | | | (9.3 | ) | | | (9.3 | ) | |
| Income tax credits | | | 2.3 | | | | 5.3 | | | | 4.8 | | | | 2.3 | |
| Accrued liabilities | | | 17.8 | | | | 20.1 | | | | 15.9 | | | | 14.6 | |
| Pension | | | 1.2 | | | | — | | | | — | | | | 15.3 | |
| Postretirement and post employment benefits | | | | 10.0 | | | | 12.8 | |
| Stock-based compensation | | | 3.9 | | | | — | | | | 6.7 | | | | 3.9 | |
| Foreign operating loss carryforward | | | | 0.8 | | | | 2.3 | |
| Miscellaneous other | | | 0.8 | | | | 0.8 | | | | 13.5 | | | | 11.2 | |
| | | | | | | | | | | |
| Total current tax asset (included in Deferred taxes and other) | | | 22.6 | | | | 22.2 | | |
| Total deferred tax asset | | | $ | 60.5 | | | $ | 65.5 | |
| | | | | | | | | | | |
Non-current tax assets/(liabilities): | | | | | | | | | |
| Foreign operating loss carryforward | | | 2.3 | | | | — | | |
| Pension | | | 5.2 | | | | — | | |
| Miscellaneous other | | | 0.7 | | | | — | | |
| | | | | | | |
| Total non-current tax assets — (included in Intangible assets and other) | | | 8.2 | | | | — | | |
| | | | | | | |
Deferred tax liabilities: | | | | | | | | | |
| Acquisition basis difference | | | | 30.1 | | | | 22.0 | |
| Property, plant, and equipment | | | (41.2 | ) | | | (44.8 | ) | | | 32.2 | | | | 34.7 | |
| Pension | | | 8.7 | | | | 5.3 | | | | 13.0 | | | | — | |
| Foreign operating loss carryforward | | | — | | | | 3.5 | | |
| Postretirement and post-employment benefits | | | 12.7 | | | | 12.1 | | |
| Miscellaneous other | | | (2.2 | ) | | | 4.9 | | |
| | | | | | | | | | | |
| Total non-current tax liabilities (included in Other Non-Current Liabilities) | | | (22.0 | ) | | | (19.0 | ) | |
| Total deferred tax liabilities | | | $ | 75.3 | | | $ | 56.7 | |
| | | | | | | | | | | |
| Total non-current liabilities, net | | | (13.8 | ) | | | (19.0 | ) | |
| Total net deferred tax asset/(liability) | | | $ | (14.8 | ) | | $ | 8.8 | |
| | | | | | | | | | | |
| Valuation allowance (included in Other Non-Current Liabilities) | | | — | | | | (0.6 | ) | |
Deferred taxes are reflected in the Consolidated Balance Sheet as follows (in millions): | | | | | | | | | |
| Current tax assets (included in Deferred taxes and other) | | | $ | 34.8 | | | $ | 22.6 | |
| Non-current tax assets (included in Intangible assets and other) | | | | 2.3 | | | | 8.2 | |
| Non-current tax liabilities (included in Other Non-current liabilities) | | | | (51.9 | ) | | | (22.0 | ) |
| | | | | | | | | | | |
| Total net deferred tax asset | | $ | 8.8 | | | $ | 2.6 | | |
| Total net deferred tax asset/(liability) | | | $ | (14.8 | ) | | $ | 8.8 | |
| | | | | | | | | | | |
Management determined that no valuation allowances are required at December 31, 2006. A valuation allowance in the amount of $0.6 million was required at December 31, 2005 for the tax operating loss carryforward benefits associated with (or related to) certain international locations because it was more likely than not that some or all of the deferred tax asset would not be utilized in the future. At December 31, 2006,2007, income and withholding taxes have not been provided on approximately $128$164.5 million of undistributed international earnings that are permanently reinvested in international operations. If such earnings were not indefinitely reinvested, a tax liability of approximately $16.8$28 million would be recognized.
Cash payments of income taxes were $79.7 million in 2007, $51.4 million in 2006 and $41.7 million in 2005.
The Company files income tax returns in the U.S. federal jurisdiction and various states and foreign jurisdictions. During 2007, the IRS completed an examination of the Company’s U.S. income tax returns for the years ended December 31, 2004 and 2005 (“04/05 Exam”). The Company has accepted all of the IRS proposed adjustments from the 04/05 Exam, none of which were significant. It is anticipated that the IRS will commence an examination of the Company’s 2006 and $31.1 million in 2004.2007 U.S. income tax returns during 2008. With few exceptions, the Company is no longer subject to state, local, ornon-U.S. income tax examinations by tax authorities for years prior to 2001.
6763
HUBBELL INCORPORATED AND SUBSIDIARIES
NOTES TO CONSOLIDATED FINANCIAL STATEMENTS — (Continued)
The following tax years, by major jurisdiction, are still subject to examination by taxing authorities:
| | | | |
Jurisdiction | | Open Years | |
|
| United States | | | 2006-2007 | |
| Canada | | | 2004-2007 | |
| United Kingdom | | | 2006-2007 | |
The Company adopted the provisions of FIN 48 on January 1, 2007. As a result of the implementation of FIN 48, the Company recognized a $4.7 million decrease in the liability for unrecognized tax benefits, which was accounted for as an increase to the January 1, 2007 balance of retained earnings. A reconciliation of the beginning and ending amount of unrecognized tax benefits is as follows (in millions):
| | | | | |
| Balance as of January 1, 2007 | | $ | 24.2 | |
| Additions based on tax positions relating to the current year | | | 2.8 | |
| Reductions based on expiration of statute of limitations | | | (1.3 | ) |
| Reductions to tax positions relating to previous years | | | (13.8 | ) |
| Settlements | | | (3.2 | ) |
| | | | | |
| Balance as of December 31, 2007 | | $ | 8.7 | |
| | | | | |
Included in the balance at December 31, 2007 are $5.7 million of tax positions which, if in the future are determined to be recognizable, would affect the annual effective income tax rate. Also, included in the balance at December 31, 2007 is $0.8 million of tax positions for which the ultimate deductibility is highly certain but for which there is uncertainty as to the timing of such deductibility. Because of the impact of deferred tax accounting, other than interest and penalties, the disallowance of the shorter deductibility period would not affect the annual effective tax rate but would accelerate the payment of cash to the taxing authority to an earlier period.
The Company’s policy is to record interest and penalties associated with the underpayment of income taxes within Provision for income taxes in the Condensed Consolidated Statement of Income. During the year ended December 31, 2007, the Company recorded interest expense of $0.4 million related to the 04/05 Exam. During the years ended December 31, 2006 and 2005, the Company did not incur any material expenses for interest and penalties. The Company has $1.0 million accrued for the payment of interest and penalties as of December 31, 2007.
The consolidated effective income tax rate varied from the United States federal statutory income tax rate for the years ended December 31, as follows:
| | | | | | | | | | | | | | | | | | | | | | | | | |
| | | 2006 | | 2005 | | 2004 | | | 2007 | | 2006 | | 2005 | |
| |
| Federal statutory income tax rate | | | 35.0 | % | | | 35.0 | % | | | 35.0 | % | | | 35.0 | % | | | 35.0 | % | | | 35.0 | % |
| State income taxes, net of federal benefit | | | 1.7 | | | | 1.7 | | | | 1.3 | | | | 1.8 | | | | 1.7 | | | | 1.7 | |
| Foreign income taxes | | | (5.5 | ) | | | (1.6 | ) | | | (1.3 | ) | | | (5.4 | ) | | | (5.5 | ) | | | (1.6 | ) |
| Non-taxable income from Puerto Rico operations | | | — | | | | (4.4 | ) | | | (7.1 | ) | | | — | | | | — | | | | (4.4 | ) |
| IRS audit settlement | | | — | | | | (5.1 | ) | | | (3.8 | ) | | | (1.9 | ) | | | — | | | | (5.1 | ) |
| R & D credit refund claim | | | — | | | | — | | | | (1.5 | ) | |
| Other, net | | | (2.6 | ) | | | (2.1 | ) | | | (1.0 | ) | | | (2.8 | ) | | | (2.6 | ) | | | (2.1 | ) |
| | | | | | | | | | | | | | | |
| Consolidated effective income tax rate | | | 28.6 | % | | | 23.5 | % | | | 21.6 | % | | | 26.7 | % | | | 28.6 | % | | | 23.5 | % |
| | | | | | | | | | | | | | | |
The 2007 consolidated effective income tax rate reflects the impact of tax benefits of $5.3 million recorded in connection with the completion of an IRS examination of the Company’s 2004 and 2005 tax returns. The 2005 consolidated effective income tax rate reflected the impact of tax benefits of $10.8 million recorded in connection with the completion of an IRS examination of the Company’s 2002 and 2003 tax returns. The 2004 consolidated effective income tax rate reflected the impact of tax benefits of $10.2 million recorded in connection with the closing of an IRS examination of the Company’s tax returns through 2001, which included refund claims for the years 1995 through 2000 related to research and development activities during these years.
64
FIN 48 is effective for the Company beginning on January 1, 2007. Based upon a preliminary evaluation as of December 31, 2006, the Company does not expect the interpretation to have a material impact on results of operations or financial condition.HUBBELL INCORPORATED AND SUBSIDIARIES
Note 14NOTES TO CONSOLIDATED FINANCIAL STATEMENTS — Financial Instruments(Continued)
| |
| Note 14 — | Financial Instruments |
Concentrations of Credit Risk: Financial instruments which potentially subject the Company to concentrations of credit risk consist of trade receivables, cash and cash equivalents and short-term investments. The Company grants credit terms in the normal course of business to its customers. Due to the diversity of its product lines, the Company has an extensive customer base including electrical distributors and wholesalers, electric utilities, equipment manufacturers, electrical contractors, telephone operating companies and retail and hardware outlets. No single customer accounted for more than 10% of total sales in any year during the three years ended December 31, 2006.2007. However, the Company’s top 10 customers accounted for approximately 27%30% of the accounts receivable balance at December 31, 2006.2007. As part of its ongoing procedures, the Company monitors the credit worthiness of its customers. Bad debt write-offs have historically been minimal. The Company places its cash and cash equivalents with financial institutions and limits the amount of exposure to any one institution.
Fair Value: The carrying amounts reported in the consolidated balance sheetssheet for cash and cash equivalents, short-term and long-term investments, receivables, bank borrowings, accounts payable and accruals approximate their fair values given the immediate or short-term nature of these items. See also Note 7 — Investments.
The fair value of the senior notes classified as long-term debt was determined by reference to quoted market prices of securities with similar characteristics and approximated $209.7$213.8 million and $215.1$209.7 million at December 31, 20062007 and 2005,2006, respectively.
Note 15 — Commitments and Contingencies
| |
| Note 15 — | Commitments and Contingencies |
Environmental and Legal
The Company is subject to environmental laws and regulations which may require that it investigate and remediate the effects of potential contamination associated with past and present operations. The Company is also subject to various legal proceedings and claims, including those relating to workers’ compensation, product liability and environmental matters, including, for each, past production of product containing toxic substances, which have
68
HUBBELL INCORPORATED AND SUBSIDIARIES
NOTES TO CONSOLIDATED FINANCIAL STATEMENTS — (Continued)
arisen in the normal course of its operations.operations or have been acquired through business combinations. Estimates of future liability with respect to such matters are based on an evaluation of currently available facts. Liabilities are recorded when it is probable that costs will be incurred and can be reasonably estimated. Given the nature of matters involved, it is possible that liabilities will be incurred in excess of amounts currently recorded. However, based upon available information, including the Company’s past experience, and reserves, management believes that the ultimate liability with respect to these matters will not have a material affect on the consolidated financial position, results of operations or cash flows of the Company.
In the fourth quarter of 2005, the Company adopted the provisionprovisions of FASB Interpretation No.FIN 47, “Accounting for Conditional Asset Retirement Obligations”, (“FIN 47”). FIN 47 clarifies the term “conditional asset retirement obligation” as used in SFAS No. 143, “Accounting for Asset Retirement Obligations” to refer to a legal obligation to perform an asset retirement activity in which the timingand/or method of settlement are conditional on a future event that may or may not be within the control of the Company. Accordingly, an entity is required to recognize a liability for the fair value of a conditional asset retirement obligation if the fair value of the liability can be reasonably estimated. The impact of the Company’s adoption of FIN 47 resulted in recording a liability of $0.7 million for certain legal obligations pertaining to environmental matters which were estimatable.was not material. The liability recorded was charged directly to income and was not reflected as a cumulative effect adjustment due to the amount not being material.immaterial amount. In addition to the amount recorded, the Company identified other legal obligations related to environmental clean up for which a settlement date could not be determined. Management does not believe these items were material to the Company’s results of operations, financial position or cash flows as of December 31, 2007, 2006 and 2005. This interpretation would not have a material impact on results of operations, financial position or cash flows had it been applied to all periods presented. The Company will continuecontinues to monitor and revalue its liability as necessary.necessary and, as of December 31, 2007 the liability continues to be immaterial.
65
HUBBELL INCORPORATED AND SUBSIDIARIES
NOTES TO CONSOLIDATED FINANCIAL STATEMENTS — (Continued)
Leases
Total rental expense under operating leases was $19.1$17.3 million in 2007, $17.7 million in 2006 and $16.6 million in 2005 and $15.8 million in 2004.2005. The minimum annual rentals on non-cancelable, long-term, operating leases in effect at December 31, 20062007 are expected to approximate $8.6 million in 2007, $6.9$12.6 million in 2008, $5.0$10.4 million in 2009, $4.1$7.8 million in 2010, $2.6$4.2 million in 2011, $2.8 million in 2012 and $15.8$20.1 million thereafter. The Company accounts for its leases in accordance with SFAS No. 13, “Accounting for Leases”. The Company’s leases consist of operating leases primarily for buildings or equipment. The terms for building leases typically range from 5-25 years with 5-10 year renewal periods.
69
HUBBELL INCORPORATED AND SUBSIDIARIES
NOTES TO CONSOLIDATED FINANCIAL STATEMENTS — (Continued)
Note 16 — Capital Stock
Activity in the Company’s common shares outstanding is set forth below for the three years ended December 31, 20062007, (in thousands, except per share amounts)thousands):
| | | | | | | | | | | | | | | | | |
| | | Common Stock | | | Common Stock | |
| | | Class A | | Class B | | | Class A | | Class B | |
| | |
Outstanding at December 31, 2003 | | | 9,490 | | | | 50,789 | | |
| | | | | | | |
| Exercise of stock options | | | — | | | | 1,192 | | |
| Acquisition/surrender of shares | | | (139 | ) | | | (117 | ) | |
| | | | | | |
Outstanding at December 31, 2004 | | | 9,351 | | | | 51,864 | | | | 9,351 | | | | 51,864 | |
| | | | | | | | | | | |
| Exercise of stock options | | | — | | | | 1,306 | | | | — | | | | 1,306 | |
| Shares issued under compensation arrangements | | | — | | | | 8 | | | | — | | | | 8 | |
| Non-vested shares issued under compensation arrangements | | | — | | | | 130 | | | | — | | | | 130 | |
| Acquisition/surrender of shares | | | (223 | ) | | | (1,345 | ) | | | (223 | ) | | | (1,345 | ) |
| | | | | | | | | | | |
Outstanding at December 31, 2005 | | | 9,128 | | | | 51,963 | | | | 9,128 | | | | 51,963 | |
| | | | | | | | | | | |
| Exercise of stock options | | | — | | | | 1,223 | | | | — | | | | 1,223 | |
| Shares issued under compensation arrangements | | | — | | | | 2 | | | | — | | | | 2 | |
| Non-vested shares issued under compensation arrangements | | | — | | | | 94 | | | | — | | | | 94 | |
| Acquisition/surrender of shares | | | (951 | ) | | | (1,281 | ) | | | (951 | ) | | | (1,281 | ) |
| | | | | | | | | | | |
Outstanding at December 31, 2006 | | | 8,177 | | | | 52,001 | | | | 8,177 | | | | 52,001 | |
| | | | | | | | | | | |
| Exercise of stock options/SARs | | | | — | | | | 1,356 | |
| Shares issued under compensation arrangements | | | | — | | | | 2 | |
| Non-vested shares issued under compensation arrangements | | | | — | | | | 108 | |
| Acquisition/surrender of shares | | | | (799 | ) | | | (2,917 | ) |
| | | | | | | |
Outstanding at December 31, 2007 | | | | 7,378 | | | | 50,550 | |
| | | | | | | |
Repurchased shares are retired when acquired and the purchase price is charged against par value and additional paid-in capital. Shares may be repurchased through the Company’s stock repurchase program, or acquired by the Company from employees under the Hubbell Incorporated Stock Option Plan for Key Employees (“Option Plan”) or surrendered to the Company by employees in settlement of their tax liability on vesting of restricted shares under the Hubbell Incorporated 2005 Incentive Award Plan, (“the Award Plan”). Voting rights per share: Class A Common — twenty; Class B Common — one. In addition, the Company has 5.9 million authorized shares of preferred stock; no preferred shares are outstanding.
The Company has a Stockholder Rights Agreement (“Rights Agreement”) under which holders of Class A Common Stock have Class A Rights and holders of Class B Common Stock have Class B Rights.Rights (collectively, “Rights”). These Rights become exercisable after a specified period of time only if a person or group of affiliated persons acquires beneficial ownership of 20 percent or more of the outstanding Class A Common Stock of the Company or announces or commences a tender or exchange offer that would result in the offeror acquiring beneficial ownership of 20 percent or more of the outstanding Class A Common Stock of the Company. Each
66
HUBBELL INCORPORATED AND SUBSIDIARIES
NOTES TO CONSOLIDATED FINANCIAL STATEMENTS — (Continued)
Class A Right entitles the holder to purchase from the Company one one-thousandth of a share of Series A Junior Participating Preferred Stock (“Series A Preferred Stock”), without par value, at a price of $175.00 per one one-thousandth of a share. Similarly, each Class B Right entitles the holder to purchase one one-thousandth of a share of Series B Junior Participating Preferred Stock (“Series B Preferred Stock”), without par value, at a price of $175.00 per one one-thousandth of a share. The Rights may be redeemed by the Company for one cent per Right prior to the day a person or group of affiliated persons acquires 20 percent or more of the outstanding Class A Common Stock of the Company. The Rights expire on December 31, 2008, unless earlier redeemed by the Company.
Shares of Series A Preferred Stock or Series B Preferred Stock purchasable upon exercise of the Rights will not be redeemable. Each share of Series A Preferred Stock or Series B Preferred Stock will be entitled, when, as and if declared, to a minimum preferential quarterly dividend payment of $10.00 per share but will be entitled to an aggregate dividend of 1,000 times the dividend declared per share of Common Stock. In the event of liquidation, the holders of the Series A Preferred Stock or Series B Preferred Stock will be entitled to a minimum preferential
70
HUBBELL INCORPORATED AND SUBSIDIARIES
NOTES TO CONSOLIDATED FINANCIAL STATEMENTS — (Continued)
liquidation payment of $100 per share (plus any accrued but unpaid dividends) but will be entitled to an aggregate payment of 1,000 times the payment made per share of Class A Common Stock or Class B Common Stock, respectively. Each share of Series A Preferred Stock will have 20,000 votes and each share of Series B Preferred Stock will have 1,000 votes, voting together with the Common Stock. Finally, in the event of any merger, consolidation, transfer of assets or earning power or other transaction in which shares of Common Stock are converted or exchanged, each share of Series A Preferred Stock or Series B Preferred Stock will be entitled to receive 1,000 times the amount received per share of Common Stock. These rights are protected by customary antidilution provisions.
Upon the occurrence of certain events or transactions specified in the Rights Agreement, each holder of a Right will have the right to receive, upon exercise, that number of shares of the Company’s common stock or the acquiring company’s shares having a market value equal to twice the exercise price.
Shares of the Company’s common stock were reserved at December 31, 20062007 as follows (in thousands):
| | | | | | | | | | | | | | | | | | | | | | | | | |
| | | Common Stock | | Preferred
| | | Common Stock | | Preferred
| |
| | | Class A | | Class B | | Stock | | | Class A | | Class B | | Stock | |
| |
| Exercise of outstanding stock options | | | — | | | | 4,552 | | | | — | | | | — | | | | 3,180 | | | | — | |
| Future grant of stock-based compensation | | | — | | | | 5,561 | | | | — | | | | — | | | | 5,321 | | | | — | |
| Exercise of stock purchase rights | | | — | | | | — | | | | 60 | | | | — | | | | — | | | | 58 | |
| Shares reserved under other equity compensation plans | | | 2 | | | | 298 | | | | — | | | | 2 | | | | 297 | | | | — | |
| | | | | | | | | | | | | | | |
| Total | | | 2 | | | | 10,411 | | | | 60 | | | | 2 | | | | 8,798 | | | | 58 | |
| | | | | | | | | | | | | | | |
Note 17 — Stock-Based CompensationExcluded from the Class B amounts above are 0.9 million SARs which have exercise prices above the market price of the Company’s Class B Common Stock as of December 31, 2007, and therefore, could not be converted to shares.
| |
| Note 17 — | Stock-Based Compensation |
As of December 31, 2006,2007, the Company had various stock-based awards outstanding which were issued to executives and other key employees. These awards have been accounted for using SFAS No. 123 (R) which was adopted on January 1, 2006. The Company recognizes the cost of these awards on a straight line attribution basis over their respective vesting periods, net of estimated forfeitures. The Company adopted the modified prospective transition method as outlined in SFAS 123 (R) and, therefore, prior year amounts have not been restated.
In 2005, the Company adopted a new long-term incentive program for awarding stock-based compensation using a combination of restricted stock, stock appreciation rights (“SARs”), and performance shares on the Company’s Class B Common Stock. In 2006, the Company issued stock-based awards using a combination of restricted stock and stock appreciation rights (“SARs”). These awards were made pursuant to the Hubbell Incorporated 2005 Incentive Award Plan (“the Award Plan”). In 2004 and 2003 the Company granted stock option awards on the Company’s Class B Common Stock under the Option Plan.
In 2006, the Company recorded $11.9 million of stock-based compensation, of which $11.8 million was recorded as expense and $0.1 million was capitalized to inventory. Of the total expense of $11.8 million, $11.3 million was recorded to S&A expense and $0.5 million was recorded to Cost of goods sold. Of the total 2006 expense, approximately $6.4 million relates to the expensing of stock options which would not have been expensed but for the adoption of SFAS 123 (R). In 2005, the Company recorded total S&A expense of $0.7 million related to stock-based compensation. The Company recorded income tax benefits of approximately $4.5 million and $0.3 million in 2006 and 2005, respectively, related to stock-based compensation. At December 31, 2006, these benefits are recorded as either a deferred tax asset in Deferred taxes and other or in Accrued income taxes in the Consolidated Balance Sheet. As of December 31, 2006, there was $21.5 million, pretax, of total unrecognized compensation cost related to non-vested share-based compensation arrangements. This cost is expected to be recognized through November 2009.
SFAS No. 123(R) requires that share-based compensation expense be recognized over the period from the grant date to the date on which the award is no longer contingent on the employee providing additional service (the “substantive vesting period”). In periods prior to the adoption of SFAS No. 123(R), share-based compensation expense was recorded for retirement-eligible employees over the awards’ stated vesting period. With the adoption of
7167
HUBBELL INCORPORATED AND SUBSIDIARIES
NOTES TO CONSOLIDATED FINANCIAL STATEMENTS — (Continued)
“substantive vesting period”). In periods prior to the adoption of SFAS No. 123(R), share-based compensation expense was recorded forretirement-eligible employees over the awards’ stated vesting period. With the adoption of
SFAS No. 123(R), the Company continues to follow the stated vesting period for the unvested portions of awards granted prior to adoption of SFAS No. 123(R) and follows the substantive vesting period for awards granted after the adoption of SFAS No. 123(R).
In 2005, the Company adopted a new long-term incentive program for awarding stock-based compensation using a combination of restricted stock, stock appreciation rights (“SARs”), and performance shares on the Company’s Class B Common Stock pursuant to the Award Plan. Under the Company’s Award Plan, the Company may authorize up to 5.9 million shares of Class B Common Stock in settlement of restricted stock, performance shares, SARs or any post-2004 grants of stock options. The Company issues new shares for settlement of any stock-based awards. In 2007, the Company issued stock-based awards using a combination of restricted stock, SARs and performance shares.
In 2007 and 2006, the Company recorded $12.7 million and $11.9 million of stock-based compensation costs, respectively. Of the total 2007 expense, $11.9 million was recorded to S&A expense and $0.8 million was recorded to Cost of goods sold. In 2006, $11.3 million was recorded to S&A expense and $0.5 million was recorded to Cost of goods sold. Stock-based compensation costs capitalized to inventory were $0.1 million in both 2007 and 2006. In 2005, the Company recorded total stock-based compensation of $0.7 million which was all recorded to S&A expense. The Company recorded income tax benefits of approximately $4.8 million, $4.5 million, and $0.3 million in 2007, 2006, and 2005 respectively, related to stock-based compensation. At December 31, 2007, these benefits are recorded as either a deferred tax asset in Deferred taxes and other or in Other accrued liabilities in the Consolidated Balance Sheet. As of December 31, 2007, there was $22.1 million, pretax, of total unrecognized compensation cost related to non-vested share-based compensation arrangements. This cost is expected to be recognized through 2010.
Each of the compensation arrangements is discussed below.
Restricted Stock
The restricted stock granted to date is not transferable and is subject to forfeiture in the event of the recipient’s termination of employment prior to vesting. The restricted stock will generally vest in one-third increments annually for three years on each anniversary of the date of grant or completely upon a change in control, termination of employment by reason of death or disability. Recipients are entitled to receive dividends and voting rights on their non-vested restricted stock regardless of vesting.stock. The fair values are measured using the average between the high and low trading prices of the Company’s Class B Common Stock on the most recent trading day immediately preceding the grant date, (“measurement date.date”).
Stock Issued to Non-employee Directors
In 2005, the compensation program for non-employee directors was changed to include an annual grant of 350 shares of Class B Common Stock of the Company. Each non-employee director received a grant of 350 shares in DecemberIn 2005, at a grant price of $49.29 for services during 2005. The shares received were not subject to any restrictions on transfer and were fully vested at grant date. Commencing inIn 2006 and 2007, each non-employee director who is re-elected, or first elected to the Board will receivereceived a grant of 350 shares of Class B Common Stock each year on the date of the annual meeting of shareholders which vested or will vest at the following year’s annual meeting of shareholders. These shares will be subject to forfeiture if the director’s service terminates prior to the date of the next regularly scheduled annual meeting of shareholders to be held in the following calendar year. In the second quarter of 2006,2007, the Company issued 350a total of 3,150 shares to each of the eight non-managementnon-employee members of its Board of Directors for a total of 2,800 shares.Directors.
68
HUBBELL INCORPORATED AND SUBSIDIARIES
NOTES TO CONSOLIDATED FINANCIAL STATEMENTS — (Continued)
Activity related to restricted stock for the year ended December 31, 20062007 is as follows (in thousands, except per share amounts):
| | | | | | | | | | | | | | | | | |
| | | | | Weighted
| | | | Weighted Average
| |
| | | Shares | | Average Value | | Shares | | Value/share | |
| |
| Non-vested restricted stock at December 31, 2005 | | | 130 | | | $ | 49.08 | | |
| Non-vested restricted stock at December 31, 2006 | | | | 177 | | | | 51.05 | |
| Shares granted | | | 94 | | | | 52.82 | | | | 108 | | | | 54.52 | |
| Shares vested | | | (41 | ) | | | 49.04 | | | | (72 | ) | | | 50.69 | |
| Shares forfeited | | | (6 | ) | | | 49.76 | | | | (7 | ) | | | 51.10 | |
| | | | | | | |
| Non-vested restricted stock at December 31, 2006 | | | 177 | | | | 51.05 | | |
| Non-vested restricted stock at December 31, 2007 | | | | 206 | | | | 52.99 | |
| | | | | | | |
The weighted average fair value per share of restricted stock granted during the years 2007, 2006 and 2005 was $54.52, $52.82 and $49.08, respectively.
Stock Appreciation Rights
The SARs granted to date entitle the recipient to the difference between the fair market value of the Company’s Class B Common Stock on the date of exercise and the grant price as determined using the average between the high and the low trading prices of the Company’s Class B Common Stock on the measurement date. This amount is payable in shares of the Company’s Class B Common Stock. One-third of the SARs vest and become exercisable each year for three years on the anniversary of the grant date and expire ten years after the grant date.
72
HUBBELL INCORPORATED AND SUBSIDIARIES
NOTES TO CONSOLIDATED FINANCIAL STATEMENTS — (Continued)
Activity related to SARs for the year ended December 31, 20062007 is as follows (in thousands, except per shareexercise amounts):
| | | | | | | | | | | | | | | | | | | | | | | | | |
| | | | | Weighted
| | | | | | Weighted
| | | |
| | | Shares | | Average Value | | | | Weighted
| | Average
| | | |
| | | | | Average
| | Remaining
| | Aggregate
| |
| Non-vested SARs at December 31, 2005 | | | 504 | | | $ | 49.76 | | |
| | | | Number of
| | Exercise
| | Contractual
| | Intrinsic
| |
| | | | Rights | | Price | | Term | | Value | |
| | |
| Non-vested SARs at December 31, 2006 | | | | 814 | | | $ | 51.63 | | | | | | | | | |
| SARs granted | | | 494 | | | | 52.85 | | | | 440 | | | | 54.56 | | | | | | | | | |
| SARs vested | | | (160 | ) | | | 49.76 | | | | (315 | ) | | | 51.34 | | | | | | | | | |
| SARs forfeited | | | (24 | ) | | | 49.76 | | | | (23 | ) | | | 50.98 | | | | | | | | | |
| | | | | | | | | |
| Non-vested SARs at December 31, 2006 | | | 814 | | | | 51.63 | | |
| Non-vested SARs at December 31, 2007 | | | | 916 | | | $ | 53.16 | | | | 9.2 years | | | $ | 0.3 | |
| | | | | | | | | | | | | |
| Exercisable SARs at December 31, 2007 | | | | 471 | | | $ | 50.82 | | | | 8.2 years | | | $ | 0.6 | |
| | | | | | | | | | | |
During 2007, approximately 5,000 SARs were exercised. The intrinsic value of the SARs exercised in 2007 was not material. There were no SARs exercised in 2006 and 2005.
The fair value of the SARs was measured using the Black-Scholes option pricing model. The following table summarizes the related assumptions used to determine the fair value of the SARs granted during the periods ended December 31, 2007, 2006 and 2005. Expected volatilities are based on historical volatilities of the Company’s stock and other factors. The Company uses historical data as well as other factors to estimate exercise behavior and employee termination. The expected term of SARs granted is based upon historical trends of stock option behavior as well as future projections. The risk-free interest rate is based on the U.S. Treasury yield curve in effect at the time of grant for the expected term of award.
| | | | | | | | | | | | | | | | | | | | | | | | | | | | | | | | | | | | | | | | | |
| | | | | | | | | | | Weighted Avg.
| | | | | | | | | | Weighted Avg.
| |
| | | | | | | | | | | Grant Date
| | | | | | | | | | Grant Date
| |
| | | Dividend
| | Expected
| | Risk Free
| | Expected
| | Fair Value
| | Dividend
| | Expected
| | Risk Free
| | Expected
| | Fair Value
| |
| | | Yield | | Volatility | | Interest Rate | | Term | | of 1 SAR | | Yield | | Volatility | | Interest Rate | | Term | | of 1 SAR | |
| |
| 2007 | | | | 2.6 | % | | | 23.5 | % | | | 3.5 | % | | | 6 Years | | | $ | 11.40 | |
| 2006 | | | 2.9 | % | | | 23.5 | % | | | 4.3 | % | | | 6 Years | | | $ | 11.47 | | | | 2.9 | % | | | 23.5 | % | | | 4.3 | % | | | 6 Years | | | $ | 11.47 | |
| 2005 | | | 2.7 | % | | | 23.5 | % | | | 4.3 | % | | | 6 Years | | | $ | 11.10 | | | | 2.7 | % | | | 23.5 | % | | | 4.3 | % | | | 6 Years | | | $ | 11.10 | |
69
HUBBELL INCORPORATED AND SUBSIDIARIES
NOTES TO CONSOLIDATED FINANCIAL STATEMENTS — (Continued)
Performance Shares
In 2005, the Company granted 35,178 performance shares. These performance shares vest and become deliverable based upon satisfaction of performance criteria established by the Company’s Compensation Committee. The criteria are based upon the Company’s average growth in earnings per share compared to a peer group of electrical and electronic equipment companies over a three-yearthree year period. Performance at target will result in vesting and issuance of the performance shares. Performance belowabove or abovebelow target can result in payment in the range of0%-250% of the number of shares granted. Performance shares are issued on the third anniversary of the date of grant assuming the performance measures have been met. The fair value of the performance shares is $46.23, which was measured using the average between the high and low trading prices of the Company’s Class B Common Stock on the measurement date, discounted for the non-payment of dividends during the requisite period. No shares have vested or been forfeited during 2005 or 2006. There were no performance shares granted in 2006. In 2007 and 2006, nostock-based compensation was recorded related to this award due to the fact that the performance criteria was deemed not probable of being met at the end of the vesting period. There were no performance shares granted in 2006.
In February and December 2007, the Company granted 34,783 and 30,292 performance shares, respectively, which vest at the end of a three year period. Each performance share represents the right to receive a share of the Company’s Class B Common Stock subject to the achievement of certain performance conditions. These performance conditions include both performance-based and market-based criteria established by the Company’s Compensation Committee. Performance at target will result in vesting and issuance of the number of performance shares granted, equal to 100% payout. Performance below or above target can result in payment in the range of 0%-200% of the number of shares granted. Performance shares vest and become payable upon satisfactory completion of the performance conditions determined by the Company’s Compensation Committee at the end of the performance period. No shares have vested or been forfeited during 2007, 2006 or 2005. In 2007, stock-based compensation of $0.9 million was recorded related to performance shares. As of December 31, 2006, 35,1782007, a total of 100,253 performance shares were outstanding.
The fair value of the performance shares was calculated separately for the performance criteria and the market-based criteria. The fair values of the performance criteria of $45.52 per share and $50.94 per share for February and December 2007, respectively, were measured using the average between the high and low trading prices of the Company’s Class B Common Stock on the measurement date, discounted for the non-payment of dividends during the requisite period. The fair values of the market-based criteria were determined based upon a lattice model. The following table summarizes the related assumptions used to determine the fair values of the performance shares with respect to the market-based criteria. Expected volatilities are based on historical volatilities of the Company’s stock over a three year period. The risk free interest rate is based on the U.S. Treasury yield curve in effect at the time of the grant for the expected term of award.
| | | | | | | | | | | | | | | | | | | | | | | | | |
| | | Stock Price on
| | | | | | | | | | | | | | | Weighted Avg.
| |
| | | Measurement
| | | Dividend
| | | Expected
| | | Risk Free
| | | Expected
| | | Grant Date
| |
| | | Date | | | Yield | | | Volatility | | | Interest Rate | | | Term | | | Fair Value | |
| |
| February 2007 | | $ | 48.23 | | | | 2.7 | % | | | 21.3 | % | | | 4.8 | % | | | 3 Years | | | $ | 55.20 | |
| December 2007 | | $ | 54.56 | | | | 2.4 | % | | | 21.1 | % | | | 2.9 | % | | | 3 Years | | | $ | 63.69 | |
Stock Option Awards
The Company granted options to officers and other key employees to purchase the Company’s Class B Common Stock in previous years. Options issued in 2004 and 2003 were partially vested on January 1, 2006, the effective date of SFAS 123(R). All options granted had an exercise price equal to the average between the high and low trading prices of the Company’s Class B Common Stock on the measurement date. These option awards generally vest annually over a three-year period and expire after ten years. Exercises of existing stock option grants are expected to be settled in the Company’s Class B Common Stock as authorized in the Option Plan.
7370
HUBBELL INCORPORATED AND SUBSIDIARIES
NOTES TO CONSOLIDATED FINANCIAL STATEMENTS — (Continued)
Stock option activity for the year ended December 31, 20062007 is set forth below (in thousands, except per share amounts):
| | | | | | | | | | | | | | | | | | | | | | | | | | | | | |
| | | Number of
| | Option Price Per
| | Weighted
| | | | | | Weighted
| | | |
| | | Shares | | Share Range | | Average | | | | | | Average
| | | |
| | | | | | | Remaining
| | Aggregate
| |
Outstanding at December 31, 2005 | | | 5,942 | | | $ | 24.59-$47.95 | | | $ | 39.04 | | |
| | | | | | Number of
| | Weighted Average
| | Contractual
| | Intrinsic
| |
| | | | Shares | | Exercise Price | | Term | | Value | |
| | |
Outstanding at December 31, 2006 | | | | 4,552 | | | $ | 39.61 | | | | | | | | | |
| Exercised | | | (1,223 | ) | | $ | 24.59-$47.95 | | | $ | 36.75 | | | | (1,356 | ) | | | 39.28 | | | | | | | | | |
| Forfeited | | | (158 | ) | | $ | 24.59-$47.95 | | | $ | 40.38 | | | | (11 | ) | | | 47.95 | | | | | | | | | |
| Canceled | | | (9 | ) | | $ | 44.31-$47.95 | | | $ | 46.66 | | | | (5 | ) | | | 37.06 | | | | | | | | | |
| | | | | | | | | |
Outstanding at December 31, 2006 | | | 4,552 | | | $ | 24.59-$47.95 | | | $ | 39.61 | | |
Outstanding at December 31, 2007 | | | | 3,180 | | | $ | 39.73 | | | | 5.1 years | | | $ | 37.7 | |
| | | | | | | | | | | | | |
Exercisable at December 31, 2007 | | | | 3,180 | | | $ | 39.73 | | | | 5.1 years | | | $ | 37.7 | |
| | | | | | | | | | | |
The aggregate intrinsic value of stock option exercises during 2007, 2006 and 2005 and 2004 was $19.9 million, $16.9 million and $22.4 million, and $18.6 million, respectively. The aggregate intrinsic value of both outstanding stock option awards and fully vested awards at December 31, 2006 was $28 million as all non-vested awards had an exercise price above the market price on December 31, 2006. Shares fully vested at December 31, 2006, 2005, and 2004 were 4,245, 4,937 and 4,983, respectively. Exercises of existing stock option grants are expected to be settled in the Company’s Class B Common Stock as authorized in the Option Plan.
The following table sets forth information related to options outstanding and fully vested at December 31, 2006:
| | | | | | | | | | | | | | | | | |
Weighted
| | Shares Outstanding | | | Shares Fully Vested | |
Average Remaining
| | Number of Shares
| | | Weighted Average
| | | Number of Shares
| | | Weighted Average
| |
Contractual Term | | (In Thousands) | | | Exercise Price | | | (In Thousands) | | | Exercise Price | |
| |
| 2 years | | | 782 | | | $ | 42.84 | | | | 782 | | | $ | 42.84 | |
| 4 years | | | 897 | | | $ | 27.47 | | | | 897 | | | $ | 27.47 | |
| 7 years | | | 2,873 | | | $ | 42.52 | | | | 2,566 | | | $ | 41.87 | |
| | | | | | | | | | | | | | | | | |
| | | | 4,552 | | | $ | 39.61 | | | | 4,245 | | | $ | 36.38 | |
Under the Company’s Award Plan, the Company may authorize up to 5.9 million shares of Class B Common Stock in settlement of grants of stock options, restricted stock, performance shares, or SARs. The Company’s policy is to issue new shares for settlement of any stock-based awards.
74
HUBBELL INCORPORATED AND SUBSIDIARIES
NOTES TO CONSOLIDATED FINANCIAL STATEMENTS — (Continued)
The following table illustrates the effect on net income and earnings per share if the Company had applied the fair value recognition provisions of SFAS No. 123 for stock options in 2005 and 2004 (in millions, except per share amounts):
| | | | | | | | | | | | | | | | | |
| | | Year Ended December 31 | | | | | | | |
| | | 2005 | | | 2004 | | | | | | | |
| |
| Net income, as reported | | $ | 165.1 | | | $ | 154.7 | | | | | | | | | |
| Deduct: Total stock-based employee compensation expense determined under fair value based method, net of related tax effects | | | (6.2 | ) | | | (5.7 | ) | | | | | | | | |
| | | | | | | | | | | | | | | | | |
| Pro forma net income | | $ | 158.9 | | | $ | 149.0 | | | | | | | | | |
| | | | | | | | | | | | | | | | | |
| Earnings per share: | | | | | | | | | | | | | | | | |
| Basic — as reported | | $ | 2.71 | | | $ | 2.55 | | | | | | | | | |
| | | | | | | | | | | | | | | | | |
| Basic — pro forma | | $ | 2.60 | | | $ | 2.45 | | | | | | | | | |
| | | | | | | | | | | | | | | | | |
| Diluted — as reported | | $ | 2.67 | | | $ | 2.51 | | | | | | | | | |
| | | | | | | | | | | | | | | | | |
| Diluted — pro forma | | $ | 2.58 | | | $ | 2.43 | | | | | | | | | |
| | | | | | | | | | | | | | | | | |
The pro forma amounts and fair value of each option grant were estimated on the date of grant using the Black-Scholes option pricing model using the following weighted average assumptions:
| | | | | | | | | | | | | | | | | | | | | |
| | | | | | | | | Risk
| | | | | | Weighted Avg.
| |
| | | | | | | | | Free
| | | | | | Grant Date
| |
| | | Dividend
| | | Expected
| | | Interest
| | | Expected
| | | Fair Value
| |
| | | Yield | | | Volatility | | | Rate | | | Option Term | | | of 1 Option | |
| |
| 2004 | | | 2.5 | % | | | 23.5 | % | | | 4.0 | % | | | 7 Years | | | $ | 11.31 | |
| | | | | |
| | | Year Ended
| |
| | | December 31,
| |
| | | 2005 | |
| |
| Net income, as reported | | $ | 165.1 | |
| Deduct: Total stock-based employee compensation expense determined under fair value based method, net of related tax effects | | | (6.2 | ) |
| | | | | |
| Pro forma net income | | $ | 158.9 | |
| | | | | |
| Earnings per share: | | | | |
| Basic — as reported | | $ | 2.71 | |
| | | | | |
| Basic — pro forma | | $ | 2.60 | |
| | | | | |
| Diluted — as reported | | $ | 2.67 | |
| | | | | |
| Diluted — pro forma | | $ | 2.58 | |
| | | | | |
Cash received from option exercises waswere $48.0 million, $38.5 million and $32.8 million for 2007, 2006 and $30.5 million for 2006, 2005, and 2004, respectively. The Company recorded a realized tax benefit from the exerciseequity-based awards of stock options of$6.9 million and $6.0 million for the periodperiods ended December 31, 2007 and 2006, respectively, which hashave been included in Cash Flows From Financing Activities in the Consolidated Statement of Cash Flows as prescribed by SFAS No. 123(R). The Company recorded a realized tax benefit from the exercise of stock options of $7.8 million and $6.7 million for the periodsyear ended December 31, 2005 and 2004, respectively, which has been included in Other, net within Cash Flows From Operating Activities in the Consolidated Statement of Cash Flows.
The Company has elected to adopt the shortcut method for determining the initial pool of excess tax benefits available to absorb tax deficiencies related to stock-based compensation subsequent to the adoption of SFAS 123R123(R) in accordance with the provisions of FASB StaffPosition No. 123(R)-3, “Transition Election Related to Accounting for Tax Effect ofShare-Based Payment Awards”. The shortcut method includes simplified procedures to establish the beginning balance of the pool of excess tax benefits (the “APIC Tax Pool”) and to determine the subsequent effect on the APIC Tax Pool and Consolidated Cash Flow Statements of the effects of employeestock-based compensation awards.
7571
HUBBELL INCORPORATED AND SUBSIDIARIES
NOTES TO CONSOLIDATED FINANCIAL STATEMENTS — (Continued)
Note 18 — Earnings Per Share
| |
| Note 18 — | Earnings Per Share |
The following table sets forth the computation of Earningsearnings per share for the three years ended December 31, (in millions, except per share amounts):
| | | | | | | | | | | | | | | | | | | | | | | | | |
| | | 2006 | | 2005 | | 2004 | | | 2007 | | 2006 | | 2005 | |
| |
| Net Income | | $ | 158.1 | | | $ | 165.1 | | | $ | 154.7 | | | $ | 208.3 | | | $ | 158.1 | | | $ | 165.1 | |
| | | | | | | | | | | | | | | |
| Weighted average number of common shares outstanding during the period | | | 60.4 | | | | 61.0 | | | | 60.7 | | | | 58.8 | | | | 60.4 | | | | 61.0 | |
| Potential dilutive shares | | | 0.7 | | | | 0.8 | | | | 0.9 | | | | 0.7 | | | | 0.7 | | | | 0.8 | |
| | | | | | | | | | | | | | | |
| Average number of shares outstanding (diluted) | | | 61.1 | | | | 61.8 | | | | 61.6 | | | | 59.5 | | | | 61.1 | | | | 61.8 | |
| | | | | | | | | | | | | | | |
| Earnings per share: | | | | | | | | | | | | | | | | | | | | | | | | |
| Basic | | $ | 2.62 | | | $ | 2.71 | | | $ | 2.55 | | | $ | 3.54 | | | $ | 2.62 | | | $ | 2.71 | |
| | | | | | | | | | | | | | | |
| Diluted | | $ | 2.59 | | | $ | 2.67 | | | $ | 2.51 | | | $ | 3.50 | | | $ | 2.59 | | | $ | 2.67 | |
| | | | | | | | | | | | | | | |
Certain common stock equivalents were not included in the full year computation of diluted earnings per share because the effect would be anti-dilutive. Anti-dilutive common stock and common stock equivalents excluded from the computation of diluted earnings per share were 0.4 million, 0.7 million, and 1.0 million, at December 31, 2007, 2006 and 2005, respectively. Stock appreciation rights and performance-based shares ofAdditionally, the Company had 1.3 million, 1.0 million and 0.6 million at December 31, 2006 and 2005,of stock appreciation rights, respectively, which were also excluded as the effect would be anti-dilutive.anti-dilutive at December 31, 2007, 2006 and 2005.
Note 19 — Accumulated Other Comprehensive Income (Loss)
| |
| Note 19 — | Accumulated Other Comprehensive Income (Loss) |
The following table reflects the accumulated balances of other comprehensive income (loss) (in millions):
| | | | | | | | | | | | | | | | | | | | | | | | | | | | | | | | | | | | | | | | | |
| | | | | | | | | | | Accumulated
| | | | | | | | | | | Accumulated
| |
| | | Pension
| | Cumulative
| | Unrealized Gain
| | Cash Flow
| | Other
| | | Pension/
| | Cumulative
| | Unrealized Gain
| | Cash Flow
| | Other
| |
| | | Liability
| | Translation
| | (Loss) on
| | Hedging
| | Comprehensive
| | | OPEB
| | Translation
| | (Loss) on
| | Hedging
| | Comprehensive
| |
| | | Adjustment | | Adjustment | | Investments | | Gain (Loss) | | Income (Loss) | | | Adjustment | | Adjustment | | Investments | | Gain (Loss) | | Income (Loss) | |
| | |
| Balance at December 31, 2003 | | $ | (4.1 | ) | | $ | (5.8 | ) | | $ | 0.3 | | | $ | (1.1 | ) | | $ | (10.7 | ) | |
| 2004 activity | | | 2.2 | | | | 7.9 | | | | (0.3 | ) | | | (0.6 | ) | | | 9.2 | | |
| | | | | | | | | | | | |
| Balance at December 31, 2004 | | | (1.9 | ) | | | 2.1 | | | | — | | | | (1.7 | ) | | | (1.5 | ) | | $ | (1.9 | ) | | $ | 2.1 | | | $ | — | | | $ | (1.7 | ) | | $ | (1.5 | ) |
| 2005 activity | | | (2.2 | ) | | | (7.5 | ) | | | (0.3 | ) | | | 0.7 | | | | (9.3 | ) | | | (2.2 | ) | | | (7.5 | ) | | | (0.3 | ) | | | 0.7 | | | | (9.3 | ) |
| | | | | | | | | | | | | | | | | | | | | | | |
| Balance at December 31, 2005 | | | (4.1 | ) | | | (5.4 | ) | | | (0.3 | ) | | | (1.0 | ) | | | (10.8 | ) | | | (4.1 | ) | | | (5.4 | ) | | | (0.3 | ) | | | (1.0 | ) | | | (10.8 | ) |
| 2006 activity | | | (34.7 | ) | | | 12.4 | | | | 0.3 | | | | 0.4 | | | | (21.6 | ) | | | (34.7 | ) | | | 12.4 | | | | 0.3 | | | | 0.4 | | | | (21.6 | ) |
| | | | | | | | | | | | | | | | | | | | | | | |
| Balance at December 31, 2006 | | $ | (38.8 | ) | | $ | 7.0 | | | $ | — | | | $ | (0.6 | ) | | $ | (32.4 | ) | | | (38.8 | ) | | | 7.0 | | | | — | | | | (0.6 | ) | | | (32.4 | ) |
| 2007 activity | | | | 44.9 | | | | 14.1 | | | | 0.2 | | | | (0.8 | ) | | | 58.4 | |
| | | | | | | | | | | | | | | | | | | | | | | |
| Balance at December 31, 2007 | | | $ | 6.1 | | | $ | 21.1 | | | $ | 0.2 | | | $ | (1.4 | ) | | $ | 26.0 | |
| | | | | | | | | | | | | |
The pension liability adjustment for 2006 includes the reversal of a minimum pension liability of $2.1 million and a charge of $36.8 million related to the adoption of SFAS No. 158.
Note 20 — Industry Segments and Geographic Area Information
| |
| Note 20 — | Industry Segments and Geographic Area Information |
Nature of Operations
Hubbell Incorporated was founded as a proprietorship in 1888, and was incorporated in Connecticut in 1905. Hubbell designs, manufactures and sells high quality electrical and electronic products for a broad range of commercial,non-residential and residential construction, industrial telecommunications,and utility and residential applications. Products are either sourced complete, or manufactured or assembled by subsidiaries in the United States, Canada, Switzerland, Puerto Rico, Mexico, Italy, the United Kingdom, Brazil and Australia. Hubbell also participates in joint ventures in Taiwan and
7672
HUBBELL INCORPORATED AND SUBSIDIARIES
NOTES TO CONSOLIDATED FINANCIAL STATEMENTS — (Continued)
Hong Kong,
the United Kingdom, Brazil and Australia. Hubbell also participates in joint ventures in Taiwan and the People’s Republic of China, and maintains sales offices in Singapore, the People’s Republic of China, Mexico, Hong Kong, South Korea and the Middle East.
The Company’s businesses are divided into three operatingreportable segments: Electrical, Power, and Industrial Technology. Information regarding operating segments has been presented as required by SFAS No. 131, “Disclosures about Segments of an Enterprise and Related Information”. At December 31, 2006,2007, the operatingreportable segments were comprised as follows:
The Electrical segment is comprised of businesses that primarily sell through distributors, lighting showrooms, home centers, and telephone and telecommunication companies, and represents stock and custom products including standard and special application wiring device products, lighting fixtures and controls, fittings, switches, and outlet boxes, enclosures, wire management products and voice and data signal processing components. The products are typically used in and around industrial, commercial and institutional facilities by electrical contractors, maintenance personnel, electricians, and telecommunicationtelecommunications companies. Certain lighting fixtures, wiring devices and electrical products also have residential application.applications. These products are primarily sold through electrical and industrial distributors, home centers, some retail and hardware outlets, and lighting showrooms. Special application products are sold primarily through wholesale distributors to contractors, industrial customers and OEMs.
The Power segment consists of businessesoperations that design and manufacture a wide varietyvarious transmission, distribution, substation and telecommunications products used by the utility industry. In addition, certain of construction, switching and protectionthese products hot line tools, grounding equipment, cover ups, fittings and fasteners, cable accessories, insulators, arresters, cutouts, sectionalizers, connectors and compression tools for the building and maintenance of overhead and underground power and telephone lines, as well as applicationsare used in the industrial,civil construction and pipelinetransportation industries. Products are sold to distributors and directly to users such as electric utilities, mining operations, industrial firms, construction and engineering firms.
The Industrial Technology segment consists of businessesoperations that design and manufacture a variety of high voltage test and measurement equipment, high voltage power supplies and variable transformers, industrial controls including motor speed controls, pendant-type push-button stations, overhead crane controls, control and pressure switches, DC devices, Gleason Reel® electric cable and hose reels, and specialized communications systems such as intra-facility communications systems, telephone systems,used in the commercial, industrial and land mobile radio peripherals.telecommunications markets. These products are primarily found in the oil and gas (onshore and offshore), mining, manufacturing and transportation industries. Products are sold primarily through direct sales and sales representatives to steel mills,contractors, industrial complexes, oil, gascustomers and petro-chemical industries, seaports, transportation authorities,OEMs throughout the security industry (mallsworld, with the exception of high voltage test and colleges),measurement equipment which is sold primarily by direct sales to customers through its sales engineers and cable and electronic equipment manufacturers.independent sales representatives throughout the world.
Financial Information
Financial information by industry segment and geographic area for the three years ended December 31, 2006,2007, is summarized below (in millions). When reading the data the following items should be noted:
| | |
| | • | Net sales comprise sales to unaffiliated customers — inter-segment and inter-area sales are not significant. |
| |
| | • | Segment operating income consists of net sales less operating expenses, including total corporate expenses, which are generally allocated to each segment on the basis of the segment’s percentage of consolidated net sales. Stock-based compensation, interestInterest expense and investment income and other expense, net have not been allocated to segments. |
| |
| | • | General corporate assets not allocated to segments are principally cash, prepaid pensions, investments and deferred taxes. |
|
| • | 2006 and 2005 segment operating income results have been adjusted to reflect the inclusion of stock-based compensation, consistent with the 2007 presentation. |
7773
HUBBELL INCORPORATED AND SUBSIDIARIES
NOTES TO CONSOLIDATED FINANCIAL STATEMENTS — (Continued)
Industry Segment Data
| | | | | | | | | | | | | | | | | | | | | | | | | |
| | | 2006 | | 2005 | | 2004 | | | 2007 | | 2006 | | 2005 | |
| |
Net Sales: | | | | | | | | | | | | | | | | | | | | | | | | |
| Electrical | | $ | 1,631.2 | | | $ | 1,496.8 | | | $ | 1,476.8 | | | $ | 1,639.9 | | | $ | 1,631.2 | | | $ | 1,496.8 | |
| Power | | | 573.7 | | | | 455.6 | | | | 386.2 | | | | 636.6 | | | | 573.7 | | | | 455.6 | |
| Industrial Technology | | | 209.4 | | | | 152.5 | | | | 130.0 | | | | 257.4 | | | | 209.4 | | | | 152.5 | |
| | | | | | | | | | | | | | | |
| Total | | $ | 2,414.3 | | | $ | 2,104.9 | | | $ | 1,993.0 | | | $ | 2,533.9 | | | $ | 2,414.3 | | | $ | 2,104.9 | |
| | | | | | | | | | | | | | | |
Operating Income: | | | | | | | | | | | | | | | | | | | | | | | | |
| Electrical | | $ | 140.2 | | | $ | 153.6 | | | $ | 173.4 | | | $ | 151.0 | | | $ | 132.2 | | | $ | 153.1 | |
| Special charges, net | | | (7.5 | ) | | | (10.9 | ) | | | (16.7 | ) | | | — | | | | (7.5 | ) | | | (10.9 | ) |
| | | | | | | | | | | | | | | |
| Total Electrical | | | 132.7 | | | | 142.7 | | | | 156.7 | | | | 151.0 | | | | 124.7 | | | | 142.2 | |
| Power | | | 78.6 | | | | 69.0 | | | | 41.2 | | | | 97.3 | | | | 75.8 | | | | 68.8 | |
| Industrial Technology | | | 34.4 | | | | 20.4 | | | | 14.7 | | | | 51.1 | | | | 33.4 | | | | 20.4 | |
| Stock-based compensation | | | (11.8 | ) | | | (0.7 | ) | | | — | | |
| Unusual item | | | — | | | | (4.6 | ) | | | — | | | | — | | | | — | | | | (4.6 | ) |
| | | | | | | | | | | | | | | |
| Operating income | | | 233.9 | | | | 226.8 | | | | 212.6 | | | | 299.4 | | | | 233.9 | | | | 226.8 | |
| Interest expense | | | (15.4 | ) | | | (19.3 | ) | | | (20.6 | ) | | | (17.6 | ) | | | (15.4 | ) | | | (19.3 | ) |
| Investment and other income, net | | | 3.0 | | | | 8.2 | | | | 5.3 | | | | 2.4 | | | | 3.0 | | | | 8.2 | |
| | | | | | | | | | | | | | | |
| Income before income taxes | | $ | 221.5 | | | $ | 215.7 | | | $ | 197.3 | | | $ | 284.2 | | | $ | 221.5 | | | $ | 215.7 | |
| | | | | | | | | | | | | | | |
Assets: | | | | | | | | | | | | | | | | | | | | | | | | |
| Electrical | | $ | 924.4 | | | $ | 815.8 | | | $ | 810.2 | | | $ | 894.0 | | | $ | 924.4 | | | $ | 815.8 | |
| Power | | | 478.5 | | | | 322.2 | | | | 279.4 | | | | 510.0 | | | | 478.5 | | | | 322.2 | |
| Industrial Technology | | | 178.8 | | | | 124.2 | | | | 95.6 | | | | 212.7 | | | | 178.8 | | | | 124.2 | |
| General Corporate | | | 169.8 | | | | 404.8 | | | | 471.2 | | | | 246.7 | | | | 169.8 | | | | 404.8 | |
| | | | | | | | | | | | | | | |
| Total | | $ | 1,751.5 | | | $ | 1,667.0 | | | $ | 1,656.4 | | | $ | 1,863.4 | | | $ | 1,751.5 | | | $ | 1,667.0 | |
| | | | | | | | | | | | | | | |
Capital Expenditures: | | | | | | | | | | | | | | | | | | | | | | | | |
| Electrical | | $ | 56.3 | | | $ | 47.7 | | | $ | 28.9 | | | $ | 35.7 | | | $ | 56.3 | | | $ | 47.7 | |
| Power | | | 16.2 | | | | 11.1 | | | | 6.3 | | | | 13.6 | | | | 16.2 | | | | 11.1 | |
| Industrial Technology | | | 3.4 | | | | 5.3 | | | | 2.7 | | | | 2.8 | | | | 3.4 | | | | 5.3 | |
| General Corporate | | | 10.9 | | | | 9.3 | | | | 1.2 | | | | 3.8 | | | | 10.9 | | | | 9.3 | |
| | | | | | | | | | | | | | | |
| Total | | $ | 86.8 | | | $ | 73.4 | | | $ | 39.1 | | | $ | 55.9 | | | $ | 86.8 | | | $ | 73.4 | |
| | | | | | | | | | | | | | | |
Depreciation and Amortization: | | | | | | | | | | | | | | | | | | | | | | | | |
| Electrical | | $ | 36.1 | | | $ | 36.0 | | | $ | 35.5 | | | $ | 36.4 | | | $ | 36.1 | | | $ | 36.0 | |
| Power | | | 15.1 | | | | 11.3 | | | | 10.4 | | | | 18.4 | | | | 15.1 | | | | 11.3 | |
| Industrial Technology | | | 4.2 | | | | 3.1 | | | | 3.0 | | | | 5.4 | | | | 4.2 | | | | 3.1 | |
| | | | | | | | | | | | | | | |
| Total | | $ | 55.4 | | | $ | 50.4 | | | $ | 48.9 | | | $ | 60.2 | | | $ | 55.4 | | | $ | 50.4 | |
| | | | | | | | | | | | | | | |
7874
HUBBELL INCORPORATED AND SUBSIDIARIES
NOTES TO CONSOLIDATED FINANCIAL STATEMENTS — (Continued)
Geographic Area Data
| | | | | | | | | | | | | | | | | | | | | | | | | |
| | | 2006 | | 2005 | | 2004 | | | 2007 | | 2006 | | 2005 | |
| |
Net Sales: | | | | | | | | | | | | | | | | | | | | | | | | |
| United States | | $ | 2,109.2 | | | $ | 1,866.5 | | | $ | 1,787.1 | | | $ | 2,175.9 | | | $ | 2,109.2 | | | $ | 1,866.5 | |
| International | | | 305.1 | | | | 238.4 | | | | 205.9 | | | | 358.0 | | | | 305.1 | | | | 238.4 | |
| | | | | | | | | | | | | | | |
| Total | | $ | 2,414.3 | | | $ | 2,104.9 | | | $ | 1,993.0 | | | $ | 2,533.9 | | | $ | 2,414.3 | | | $ | 2,104.9 | |
| | | | | | | | | | | | | | | |
Operating Income: | | | | | | | | | | | | | | | | | | | | | | | | |
| United States | | $ | 207.4 | | | $ | 203.3 | | | $ | 193.6 | | | $ | 250.3 | | | $ | 207.4 | | | $ | 203.3 | |
| Special charges, net | | | (7.5 | ) | | | (10.9 | ) | | | (16.7 | ) | | | — | | | | (7.5 | ) | | | (10.9 | ) |
| International | | | 34.0 | | | | 34.4 | | | | 35.7 | | | | 49.1 | | | | 34.0 | | | | 34.4 | |
| | | | | | | | | | | | | | | |
| Total | | $ | 233.9 | | | $ | 226.8 | | | $ | 212.6 | | | $ | 299.4 | | | $ | 233.9 | | | $ | 226.8 | |
| | | | | | | | | | | | | | | |
Property, Plant, and Equipment, net: | | | | | | | | | | | | | | | | | | | | | | | | |
| United States | | $ | 269.9 | | | $ | 222.5 | | | $ | 219.8 | | | $ | 277.6 | | | $ | 269.9 | | | $ | 222.5 | |
| International | | | 48.6 | | | | 45.3 | | | | 42.0 | | | | 49.5 | | | | 48.6 | | | | 45.3 | |
| | | | | | | | | | | | | | | |
| Total | | $ | 318.5 | | | $ | 267.8 | | | $ | 261.8 | | | $ | 327.1 | | | $ | 318.5 | | | $ | 267.8 | |
| | | | | | | | | | | | | | | |
On a geographic basis, the Company defines “international” as operations based outside of the United States and its possessions. Sales of international units were 13%14%, 11%13% and 10%11% of total sales in 2007, 2006 2005 and 2004,2005, respectively, with Canadian and United Kingdom markets representing approximately 70%63% collectively of the 20062007 total. Long-lived assets of international subsidiaries were 15% of the consolidated total in 2007 and 2006, and 17% in 2005, and 16% in 2004, with the Canadian and United Kingdom markets representing approximately 11% and 19%, respectively, of the 20062007 total. Export sales directly to customers or through electric wholesalers from United States operations were $145.8 million in 2007, $131.2 million in 2006 and $120.6 million in 2005 and $99.6 million in 2004.2005.
Note 21 — Quarterly Financial Data (Unaudited)
| |
| Note 21 — | Quarterly Financial Data (Unaudited) |
The table below sets forth summarized quarterly financial data for the years ended December 31, 20062007 and 20052006 (in millions, except per share amounts):
| | | | | | | | | | | | | | | | | | | | | | | | | | | | | | | | | |
| | | First
| | Second
| | Third
| | Fourth
| | | First
| | Second
| | Third
| | Fourth
| |
| | | Quarter | | Quarter | | Quarter | | Quarter | | | Quarter | | Quarter | | Quarter | | Quarter | |
| | |
2007 | | | | | | | | | | | | | | | | | |
| Net Sales | | | $ | 625.7 | | | $ | 640.8 | | | $ | 652.7 | | | $ | 614.7 | |
| Gross Profit | | | $ | 173.0 | | | $ | 187.3 | | | $ | 194.6 | | | $ | 180.9 | |
| Net Income | | | $ | 41.7 | | | $ | 53.3 | | | $ | 65.3 | | | $ | 48.0 | (1) |
| Earnings Per Share — Basic | | | $ | 0.70 | | | $ | 0.90 | | | $ | 1.12 | | | $ | 0.83 | |
| Earnings Per Share — Diluted | | | $ | 0.69 | | | $ | 0.89 | | | $ | 1.10 | | | $ | 0.82 | |
| | |
2006 | | | | | | | | | | | | | | | | | | | | | | | | | | | | | | | | |
| Net Sales | | $ | 573.0 | | | $ | 603.2 | | | $ | 649.0 | | | $ | 589.0 | | | $ | 573.0 | | | $ | 603.2 | | | $ | 649.0 | | | $ | 589.0 | |
| Gross Profit | | $ | 158.5 | (1) | | $ | 165.7 | | | $ | 180.9 | | | $ | 151.6 | | | $ | 158.5 | (2) | | $ | 165.7 | | | $ | 180.9 | | | $ | 151.6 | |
| Net Income | | $ | 39.7 | (1)(2) | | $ | 41.6 | (1)(2) | | $ | 47.6 | (1)(2) | | $ | 29.2 | (1)(2)(3) | | $ | 39.7 | (2) | | $ | 41.6 | (2) | | $ | 47.6 | (2) | | $ | 29.2 | (2)(3) |
| Earnings Per Share — Basic | | $ | 0.66 | | | $ | 0.68 | | | $ | 0.79 | | | $ | 0.49 | | | $ | 0.66 | | | $ | 0.68 | | | $ | 0.79 | | | $ | 0.49 | |
| Earnings Per Share — Diluted | | $ | 0.65 | | | $ | 0.67 | | | $ | 0.78 | | | $ | 0.48 | | | $ | 0.65 | | | $ | 0.67 | | | $ | 0.78 | | | $ | 0.48 | |
| | | | | | | | | | | | | | | | | | |
2005 | | | | | | | | | | | | | | | | | |
| Net Sales | | $ | 487.6 | | | $ | 520.5 | | | $ | 561.1 | | | $ | 535.7 | | |
| Gross Profit | | $ | 136.7 | | | $ | 143.1 | (4) | | $ | 164.2 | (4) | | $ | 151.0 | | |
| Net Income | | $ | 28.8 | (4)(5) | | $ | 35.7 | (4) | | $ | 48.5 | (4) | | $ | 52.1 | (4)(6) | |
| Earnings Per Share — Basic | | $ | 0.47 | | | $ | 0.58 | | | $ | 0.80 | | | $ | 0.86 | | |
| Earnings Per Share — Diluted | | $ | 0.46 | | | $ | 0.58 | | | $ | 0.79 | | | $ | 0.84 | | |
7975
HUBBELL INCORPORATED AND SUBSIDIARIES
NOTES TO CONSOLIDATED FINANCIAL STATEMENTS — (Continued)
| | |
| (1) | | Net Income in the fourth quarter of 2007 included an income tax benefit of $5.3 million related to the completion of IRS examinations for tax years 2004 and 2005. |
|
| (2) | | In the first, second, third and fourth quarters of 2006, Net Income included $1.7 million, $1.4 million, $0.7 million and $3.7 million of pretax special charges, respectively. These charges relate to the integration of the Company’s lighting operations in the Electrical segment. Included in the amounts above are inventory write-down costs which are recorded in Cost of goods sold for the first quarter of 2006 of $0.2 million, thereby reducing Gross Profit on a pretax basis. |
| |
(2) | | Net Income in the first, second, third and fourth quarters of 2006 included pretax costs of $2.7 million, $2.7 million, $2.8 million and $3.6 million, respectively, related to the Company’s adoption of SFAS No. 123R. |
|
| (3) | | Net Income in the fourth quarter of 2006 includes a tax benefit of $1.9 million which reflects the full year benefit associated with the reinstatement of the Federal research and development tax credit. |
| |
(4)Note 22 — | | In the first, second, third and fourth quarters of 2005, Net Income included $1.9 million, $2.7 million, $1.2 million and $5.1 million of pretax special charges, respectively. These charges relate to both the integration of the Company’s lighting operations and other consolidation actions within the Electrical segment. Included in the amounts above are inventory write-down costs which are recorded in Cost of goods sold and for the second and third quarters of 2005 were $0.5 million and $0.2 million, respectively, thereby reducing Gross Profit on a pretax basis. |
|
(5) | | Net Income in the first quarter of 2005 included a pretax charge of $4.6 million related to transactional expenses in support of the Company’s strategic growth initiatives. |
|
(6) | | Net Income in the fourth quarter of 2005 included an income tax benefit of $10.8 million related to the completion of IRS examinations for years through 2003 and a $4.9 million pretax gain on sale of a building in the Electrical segment.Guarantees |
Note 22 — Guarantees
The Company accrues for costs associated with guarantees when it is probable that a liability has been incurred and the amount can be reasonably estimated. The most likely cost to be incurred is accrued based on an evaluation of currently available facts, and where no amount within a range of estimates is more likely, the minimum is accrued.
The Company records a liability equal to the fair value of guarantees in the Consolidated Balance Sheet in accordance with FASB Interpretation No.FIN 45, “Guarantor’s Accounting and Disclosure Requirements for Guarantees, Including Indirect Guarantees of Indebtedness of Others,” (FIN 45)Others”. As of December 31, 20062007 and 2005,2006, the fair value and maximum potential payment related to the Company’s guarantees were not material. The Company may enter into various hedging instruments which are subject to disclosure in accordance with FIN 45. As of December 31, 20062007, the Company had three18 individual forward exchange contracts outstanding each for the purchase of $1.0 million U.S. dollars which expire ratably each month through March 2007.December 2008. These contracts were entered into in order to hedge the exposure to fluctuating rates of exchange on anticipated inventory purchases. These contracts have been designated as cash flow hedges in accordance with SFAS No. 133, as amended.
The Company offers a product warranty which covers defects on most of its products. These warranties primarily apply to products that are properly used for their intended purpose, installed correctly, and properly maintained. The Company generally accrues estimated warranty costs at the time of sale. Estimated warranty expenses are based upon historical information such as past experience, product failure rates, or the number of units repaired or replaced. Adjustments are made to the product warranty accrual as claims are incurred or as historical experience indicates. The product warranty accrual is reviewed for reasonableness on a quarterly basis and is adjusted as additional information regarding expected warranty costs become known. Changes in the accrual for product warranties in 20062007 are set forth below (in millions):
| | | | | | |
| Balance at December 31, 2005 | | $ | 3.8 | | |
| Current year provision | | | 1.1 | | |
| Expenditures | | | (0.7 | ) | |
| | | | | | | | |
| Balance at December 31, 2006 | | $ | 4.2 | | | $ | 4.2 | |
| Current year provision | | | | 2.9 | |
| Expenditures/other | | | | (1.0 | ) |
| | | | | | | |
| Balance at December 31, 2007 | | | $ | 6.1 | |
| | | | | |
| |
| Note 23 — | Subsequent Event |
On January 11, 2008, the Company acquired Kurt Versen, Inc. for approximately $100 million in cash. Located in Westwood, New Jersey, Kurt Versen, Inc. manufactures specification-grade lighting fixtures for a full range of office, commercial, retail, government, entertainment, hospitality and institution applications with annual sales of approximately $44 million. The acquisition enhances the Company’s position in the key spec-grade downlighting market and will be added to the Company’s Electrical segment.
8076
| |
| Item 9. | Changes in and Disagreements with Accountants on Accounting and Financial Disclosure |
Not applicable.
| |
| Item 9A. | Controls and Procedures |
The Company maintains disclosure controls and procedures that are designed to ensure that information required to be disclosed in Exchange Act reports is recorded, processed, summarized and reported within the time periods specified in the SEC’s rules and forms, and that such information is accumulated and communicated to management, including the Chief Executive Officer and Chief Financial Officer, as appropriate, to allow timely decisions regarding required disclosure. Management necessarily applied its judgment in assessing the costs and benefits of such controls and procedures which, by their nature, can provide only reasonable assurance regarding the reliability of financial reporting and the preparation of financial statements for external reporting purposes in accordance with generally accepted accounting principles. Because of its inherent limitations, internal control over financial reporting may not prevent or detect misstatements.
The Company carried out an evaluation, under the supervision and with the participation of management, including the Chief Executive Officer and Chief Financial Officer, of the effectiveness of the design and operation of the Company’s disclosure controls and procedures as defined in Exchange ActRules 13a-15(e) and15d-15(e), as of the end of the period covered by this report onForm 10-K. Based upon that evaluation, each of the Chief Executive Officer and Chief Financial Officer concluded that the Company’s disclosure controls and procedures are effective in timely alerting them to material information (including from consolidated subsidiaries) required to be included in Exchange Act reports.
Changes in Internal Controls — In October of 2006, the Company implemented another phase of a multi-year program to implement a fully integrated suite of SAP application software. The implementation has involved changes to certain internal controls over financial reporting. The Company has reviewed each system as it is being implemented and the controls affected by the new systems and made appropriate changes to affected internal controls as necessary. These controls were included in the Company’s assessment of the effectiveness of its Management’s annual report on internal control over financial reporting asand the independent registered public accounting firm’s audit report on the effectiveness of our internal control over financial reporting are included in the financial statements for the year ended December 31, 2006,2007 which isare included under “Management’s Report on Internal Control over Financial Reporting” in the “ReportItem 8 of Management” within this Annual Report onForm 10-K.
There have been no changes in the Company’s internal control over financial reporting that occurred during the Company’s most recently completed quarter that have materially affected, or are reasonably likely to materially affect, the Company’s internal control over financial reporting.
| |
Item 9B. | Other Information |
Item 9B. Other Information
Not applicable.
PART III
| |
| Item 10. | Directors and Executive Officers of the Registrant(1) |
The Company’s Chief Executive Officer made the annual certification required by Section 303A.12 of the NYSE Company Manual on May 5, 2006.7, 2007. The Company has filed with the SEC as exhibits to thisForm 10-K the Sarbanes-Oxley Act Section 302 Certifications of its Chief Executive Officer and Chief Financial Officer relating to the quality of its public disclosure.
| | |
| (1) | | Certain of the information required by this item regarding executive officers is included in Part I, Item 4 of thisForm 10-K and the remaining required information is incorporated by reference to the definitive proxy statement for the Company’s annual meeting of shareholders scheduled to be held on May 7, 2007.5, 2008. |
8177
| |
| Item 11. | Executive Compensation(2) |
| |
Item 12. | Security Ownership of Certain Beneficial Owners and Management and Related Stockholder Matters(3) |
Item 12. Security Ownership of Certain Beneficial Owners and Management and Related Stockholder Matters(3)
Equity Compensation Plan Information
The following table provides information as of December 31, 20062007 with respect to the Company’s common stock that may be issued under the Company’s equity compensation plans (in thousands, except per share amounts):
| | | | | | | | | | | | | | | | | | | | | | | | | |
| | | A | | B | | C | | | A | | B | | C | |
| | | | | Weighted Average
| | Number of Securities Remaining
| | | | | Weighted Average
| | Number of Securities Remaining
| |
| | | Number of Securities to be
| | Exercise Price of
| | Available for Future Issuance
| | | Number of Securities to be
| | Exercise Price of
| | Available for Future Issuance
| |
| | | Issued upon Exercise of
| | Outstanding
| | Under Equity Compensation
| | | Issued upon Exercise of
| | Outstanding
| | Under Equity Compensation
| |
| | | Outstanding Options,
| | Options,
| | Plans (Excluding Securities
| | | Outstanding Options,
| | Options,
| | Plans (Excluding Securities
| |
Plan Category | | Warrants and Rights | | Warrants and Rights | | Reflected in Column A) | | | Warrants and Rights | | Warrants and Rights | | Reflected in Column A) | |
| |
| Equity Compensation Plans Approved by Shareholders(a) | | | 4,640 | (c)(e) | | $ | 39.74 | | | | 5,561 | (c)(e) | | | 3,717 | (c)(e) | | $ | 41.28 | | | | 5,321 | (c)(e) |
| Equity Compensation Plans Not Requiring Shareholder Approval(b) | | | — | | | | — | | | | 2 | (d) | | | — | | | | — | | | | 2 | (d) |
| | | | — | | | | — | | | | 298 | (c) | | | — | | | | — | | | | 297 | (c) |
| | | | | | | | | | | | | | | |
| Total | | | 4,640 | | | $ | 39.74 | | | | 5,861 | | | | 3,717 | | | $ | 41.28 | | | | 5,620 | |
| | | | | | | | | | | | | | | |
| | |
| (a) | | The Company’s (a)(1) Stock Option Plan for Key Employees, and (b)(2) 2005 Incentive Award Plan. |
| |
| (b) | | The Company’s Deferred Compensation Plan for Directors. |
| |
| (c) | | Class B Common Stock |
| |
| (d) | | Class A Common Stock |
| |
| (e) | | Excluded from the amounts are a total of 974,443approximately 925 SARs which have exercise prices above the market price of the Company’s Class B Common Stock at December 31, 20062007 and, therefore, could not be converted into shares. |
| |
| Item 13. | Certain Relationships and Related Transactions(2) |
| |
Item 14. | Principal Accountant Fees and Services(2) |
Item 14. Principal Accountant Fees and Services(2)
| | |
| (2) | | The information required by this item is incorporated by reference to the definitive proxy statement for the Company’s annual meeting of shareholders scheduled to be held on May 7, 2007.5, 2008. |
| |
| (3) | | The remaining information required by this item is incorporated by reference to the definitive proxy statement for the Company’s annual meeting of shareholders scheduled to be held on May 7, 2007.5, 2008. |
8278
PART IV
| |
| Item 15. | Exhibits and Financial Statement Schedule |
| |
| 1. | Financial Statements and Schedule |
Financial statements and schedule listed in the Index to Financial Statements and Schedule are filed as part of this Annual Report onForm 10-K.
| | | |
Number | | Description |
| |
| 3a | | Restated Certificate of Incorporation, as amended and restated as of September 23, 2003.(1) Exhibit 3a of the registrant’s report onForm 10-Q for the third quarter (ended September 30), 2003, and filed on November 10, 2003, is incorporated by reference; and (2) Exhibit 1 of the registrant’s reports onForm 8-Aand 8-A and8-K, both dated and filed on December 17, 1998, are incorporated by reference. |
| 3b | | By-Laws, Hubbell Incorporated, as amended on June 4, 2003.6, 2007. Exhibit 3b3.1 of the registrant’s report onForm 10-Q8-K for the second quarter (ended June 30, 2003), 2003,dated and filed August 12, 2003,June 7, 2007, is incorporated by reference. |
| 3c | | Rights Agreement, dated as of December 9, 1998, between Hubbell Incorporated and ChaseMellon Shareholder Services, L.L.C. as Rights Agent is incorporated by reference to Exhibit 1 to the registrant’s Registration Statement onForm 8-A andForm 8-K, both dated and filed on December 17, 1998. Exhibit 3(c), being an Amendment to Rights Agreement, of the registrant’s report onForm 10-Q for the third quarter (ended September 30), 1999, and filed on November 12, 1999, is incorporated by reference. |
| 4a | | Instruments with respect to the 1996 issue of long-term debt have not been filed as exhibits to this Annual Report onForm 10-K as the authorized principal amount on such issue does not exceed 10% of the total assets of the registrant and its subsidiaries on a consolidated basis; registrant agrees to furnish a copy of each such instruments to the Commission upon request. |
| 4b | | Senior Indenture, dated as of September 15, 1995, between Hubbell Incorporated and JPMorgan Chase Bank (formerly known as The Chase Manhattan Bank and Chemical Bank), as trustee. Exhibit 4a of the registrant’s registration statement onForm S-4 filed June 18, 2002, is incorporated by reference. |
| 4c | | Specimen Certificate of 6.375% Notes due 2012. Exhibit 4b of the registrant’s registration statement onForm S-4 filed June 18, 2002, is incorporated by reference. |
| 4d | | Specimen Certificate of registered 6.37% Notes due 2010. Exhibit 4c of the registrant’s registration statement onForm S-4 filed June 18, 2002, is incorporated by reference. |
| 4e | | Registration Rights Agreement, dated as of May 15, 2002, among Hubbell Incorporated and J.P. Morgan Securities, Inc., BNY Capital Markets, Inc., Deutsche Bank Securities Inc., First Union Securities, Inc., Morgan Stanley & Co. Incorporated and Salomon Smith Barney Inc. as the Initial Purchasers. Exhibit 4d of the registrant’s registration statement onForm S-4 filed June 18, 2002, is incorporated by reference. |
| 10a† | | Hubbell Incorporated Supplemental Executive Retirement Plan, as amended and restated effective June 7, 2001.January 1, 2005. Exhibit 10a of the registrant’s report onForm 10-Q for the secondthird quarter (ended JuneSeptember 30), 2001,2007, filed August 9, 2001,October 26, 2007, is incorporated by reference. |
| 10b(1)† | | Hubbell Incorporated Stock Option Plan for Key Employees, as amended and restated effective May 5, 2003. (i) Exhibit 10b(1) of the registrant’s report onForm 10-Q for the second quarter (ended June 30), 2003, filed August 12, 2003, is incorporated by reference; (ii) Amendment, dated June 9, 2004, filed as Exhibit 10ee of the registrant’s report onForm 10-Q for the second quarter (ended June 30), 2004, filed August 5, 2004, is incorporated by reference. |
| 10b(2)† | | Amendment, dated September 21, 2006, to the Hubbell Incorporated Stock Option Plan for Key Employees. Exhibit 10.1 of the registrant’s report onForm 10-Q for the third quarter (ended September 30), 2006, filed on November 7, 2006 is incorporated by reference. |
8379
| | | |
Number | | Description |
| |
10bb10f* | | Credit Agreement, dated as of October 20, 2004, by and among Hubbell Incorporated, JPMorgan Chase bank as administrative agent and lender, other Lenders party thereto from time to time, Citibank, N.A., Fleet National Bank and Wachovia Bank, National Association as Syndication Agents, and J.P. Morgan Securities Inc., as Arranger and Bookrunner. Exhibit 99.1 of the registrant’s report onForm 8-K, filed October 21, 2004, is incorporated by reference. |
10c† | | Description of the Hubbell Incorporated, Post Retirement Death Benefit Plan for Participants in the Supplemental Executive Retirement Plan, as amended effective May 1, 1993. Exhibit 10c of the registrant’s report onForm 10-Q for the second quarter (ended June 30), 1993, filed on August 12, 1993, is incorporated by reference. |
10f | | Hubbell Incorporated Deferred Compensation Plan for Directors, as amended and restated effective January 1, 2005, as amended December 3, 2002. Exhibit 4(b) of the registrant’sForm S-8 Registration Statement, filed December 19, 2002, is incorporated by reference.4, 2007. |
10h10h† | | Hubbell Incorporated Key Man Supplemental Medical Insurance, as amended and restated effective December 9, 1986.January 1, 2005. Exhibit 10h of the registrant’s report onForm 10-K10-Q for the year 1987,third quarter (ended September 30), 2007, filed on March 25, 1988,October 26, 2007, is incorporated by reference. |
| 10i | | Hubbell Incorporated Retirement Plan for Directors, as amended and restated effective December 3, 2002.January 1, 2005. Exhibit 10i of the registrant’s report onForm 10-K10-Q for the year 2002,third quarter (ended September 30), 2007, filed March 24, 2003,October 26, 2007, is incorporated by reference. |
| 10o† | | Hubbell Incorporated Policy for Providing Severance Payments to Key Managers, as amended and restated effective September 9, 1993.12, 2007. Exhibit 10o of the registrant’s report onForm 10-Q for the third quarter (ended September 30), 1993,2007, filed on November 10, 1993,October 26, 2007, is incorporated by reference. |
| 10p† | | Hubbell Incorporated Senior Executive Incentive Compensation Plan, effective January 1, 1996. Exhibit C of the registrant’s proxy statement, dated March 22, 1996 and filed on March 27, 1996, is incorporated by reference. |
10.1†10.1*† | | Amended and Restated Continuity Agreement, dated as of March 14, 2005,November 1, 2007, between Hubbell Incorporated and Timothy H. Powers. Exhibit 10.1 of the registrant’s report onForm 8-K, dated and filed March 15, 2005, is incorporated by reference. |
10.2†10.3*† | | Amended and Restated Continuity Agreement, dated as of March 14, 2005, between Hubbell Incorporated and Gregory F. Covino. Exhibit 10.2 of the registrant’s report onForm 8-K, dated and filed March 15, 2005, is incorporated by reference. |
10.3† | | Continuity Agreement, dated as of March 14, 2005,November 1, 2007, between Hubbell Incorporated and Scott H. Muse. Exhibit 10.3 of the registrant’s report onForm 8-K, dated and filed March 15, 2005, is incorporated by reference. |
10.4†10.4*† | | Amended and Restated Continuity Agreement, dated as of March 14, 2005,November 1, 2007, between Hubbell Incorporated and Thomas P. Smith. Exhibit 10.4 of the registrant’s report onForm 8-K, dated and filed March 15, 2005, is incorporated by reference. |
10u†10u*† | | Amended and Restated Continuity Agreement, dated as of December 27, 1999,November 1, 2007, between Hubbell Incorporated and Richard W. Davies. Exhibit 10u of the registrant’s report onForm 10-K for the year 1999, filed March 27, 2000, is incorporated by reference. |
10.5†10v*† | | Amendment, dated as of March 14, 2005, toAmended and Restated Continuity Agreement, dated as of December 27, 1999, between Hubbell Incorporated and Richard W. Davies. Exhibit 10.5 of the registrant’s report onForm 8-K, dated and filed March 15, 2005, is incorporated by reference. |
10v† | | Continuity Agreement, dated as of December 27, 1999,November 1, 2007, between Hubbell Incorporated and James H. Biggart. Exhibit 10v of the registrant’s report onForm 10-K for the year 1999, filed March 27, 2000, is incorporated by reference. |
10.7† | | Amendment, dated as of March 14, 2005, to Continuity Agreement, dated as of December 27, 1999, between Hubbell Incorporated and James H. Biggart. Exhibit 10.7 of the registrant’s report onForm 8-K, dated and filed March 15, 2005, is incorporated by reference. |
| 10w† | | Hubbell Incorporated Top Hat Restoration Plan, as amended and restated effective June 6, 2002.January 1, 2005. Exhibit 10w of the registrant’s report onForm 10-Q for the secondthird quarter (ended JuneSeptember 30), 2007 filed August 12, 2002,October 26, 2007, is incorporated by reference. |
84
| | |
Number
| | Description
|
|
| 10x† | | Termination Agreement and General Release, dated as of October 21, 2001, between Hubbell Incorporated and Harry B. Rowell, Jr., Exhibit 10x of the registrant’s report onForm 10-K for the year 2001, filed March 19, 2002, is incorporated by reference. |
| 10y† | | The retirement arrangement with G. Jackson Ratcliffe is incorporated by reference to the registrant’s proxy Statements:(i), dated March 27, 2002 as set forth under the heading ‘‘Employment”Employment Agreements/Retirement Arrangements”, (ii) dated March 15, 2004 as set forth under the heading “Matters Relating to Directors and Shareholders”, and (iii) and dated as of March 16, 2005 as set forth under the heading “Matters Relating to Directors and Shareholders”. |
| 10z† | | Hubbell Incorporated Incentive Compensation Plan, adopted effective January 1, 2002. Exhibit 10z of the registrant’s report onForm 10-K for the year 2001, filed on March 19, 2002, is incorporated by reference. |
10aa†10aa*† | | Amended and Restated Continuity Agreement, dated as of December 27, 1999,November 1, 2007, between Hubbell Incorporated and W. Robert Murphy. Exhibit 10aa of the registrant’s report onForm 10-K for the year 2002, filed March 24, 2003, is incorporated by reference. |
10.6†10cc*† | | Amendment, dated as of March 14, 2005, toAmended and Restated Continuity Agreement, dated as of December 27, 1999, between Hubbell Incorporated and W. Robert Murphy. Exhibit 10.6 of the registrant’s report onForm 8-K dated and filed March 15, 2005, is incorporated by reference. |
10cc† | | Continuity Agreement, dated as of December 27, 1999,November 1, 2007, between Hubbell Incorporated and Gary N. Amato. Exhibit 10cc of the registrant’s report onForm 10-K for the year 2002, filed March 24, 2003, is incorporated by reference. |
10.8† | | Amendment, dated as of March 14, 2005, to Continuity Agreement, dated as of December 27, 1999, between Hubbell Incorporated and Gary N. Amato. Exhibit 10.8 of the registrant’s report onForm 8-K dated and filed March 15, 2005, is incorporated by reference. |
| 10.9† | | Grantor Trust for Senior Management Plans Trust Agreement, dated as of March 14, 2005, between Hubbell Incorporated and The Bank of New York, as Trustee. Exhibit 10.9 of the registrant’s report onForm 8-K dated and filed March 15, 2005, is incorporated by reference. |
| 10.9.1*† | | First Amendment, dated as of January 1, 2005, to the Hubbell Incorporated Grantor Trust for Senior Management Plans Trust Agreement. |
80
| | |
Number | | Description |
|
| 10.10† | | Grantor Trust for Non-Employee Director Plans Trust Agreement, dated as of March 14, 2005, between Hubbell Incorporated and The Bank of New York. Exhibit 10.10 of the registrant’s report onForm 8-K dated and filed March 15, 2005, is incorporated by reference. |
| 10.10.1*† | | First Amendment, dated as of January 1, 2005, to the Hubbell Incorporated Grantor Trust for Non-Employee Director Plans Trust Agreement. |
| 10.ee† | | Hubbell Incorporated 2005 Incentive Award Plan. Exhibit B of the registrant’s proxy statement, dated as of March 16, 2005, is incorporated by reference. |
| 10.ee(1)† | | Amendment, dated September 21, 2006, to the Hubbell Incorporated 2005 Incentive Award Plan. Exhibit 10.2 of the registrant’s report onForm 10-Q for the third quarter (ended September 30), 2006, filed on November 7, 2006 is incorporated by reference. |
| 10.ff† | | Letter Agreement, dated September 2005, between Hubbell Incorporated and David G. Nord. Exhibit 99.1 of the registrant’s report onForm 8-K dated and filed September 6, 2005, is incorporated by reference. |
10.gg†10.gg*† | | Amended and Restated Continuity Agreement, dated as of September 19, 2005,November 1, 2007, between Hubbell Incorporated and David G. Nord. Exhibit 10.12 of the registrant’s report onForm 10-Q dated and filed November 4, 2005 is incorporated by reference. |
| 10.hh† | | Restricted Award Agreement, dated September 19, 2005 between Hubbell Incorporated and David G. Nord. Exhibit 10.13 of the registrant’s report onForm 10-Q dated and filed November 4, 2005 is incorporated by reference. |
| 10.ii | | Credit Agreement, dated as of October 20, 2004 as Amended and Restated as of December 12, 200531, 2007 Among Hubbell Incorporated, Hubbell Cayman Limited, Hubbell Investments Limited, The Lenders Party hereto, Bank of America, N.A., Citibank, N.A., U.S. Bank ofNational Association, and Wachovia Bank National Association as Syndication Agents, and JPMorgan Chase Bank, N.A., as Administrative Agent, filedand J.P. Morgan Securities Inc. as Sole Lead Arranger and Bookrunner. Exhibit 10.ii of the registrant’s report onForm 10-K8-K dated and filed March 8, 2006November 5, 2007 is incorporated by reference. |
| 10.jj† | | Hubbell Incorporated Executive Deferred Compensation Plan, effective January 1, 2008. Exhibit 10.jj of the registrant’s report onForm 10-Q for the third quarter (ended September 30), 2007, filed on October 26, 2007, is incorporated by reference. |
| 10.kk† | | Hubbell Incorporated Supplemental Management Retirement Plan, effective September 12, 2007. Exhibit 10.ll of the registrant’s report onForm 10-Q for the third quarter (ended September 30), 2007, filed on October 26, 2007, is incorporated by reference. |
| 10.ll*† | | Continuity Agreement, dated as of November 1, 2007, between Hubbell Incorporated and William Tolley. |
| 10.mm*† | | Trust Agreement, dated as of January 1, 2008, by and between Hubbell Incorporated and T. Rowe Price Trust Company, as Trustee. |
| 10.nn*† | | Amendment, dated February 15, 2008, to Hubbell Incorporated Amended and Restated Supplemental Executive Retirement Plan. |
| 10.oo*† | | Amendment, dated February 15, 2008, to Amended and Restated Continuity Agreement for James H. Biggart. |
| 10.pp*† | | Amendment, dated February 15, 2008, to Amended and Restated Continuity Agreement for Timothy H. Powers. |
| 10.qq*† | | Amendment dated February 15, 2008, to Amended and Restated Continuity Agreement for Richard W. Davies. |
| 21* | | Listing of significant subsidiaries. |
| 23* | | Consent of PricewaterhouseCoopers LLP. |
85
| | |
Number
| | Description
|
|
| 31.1* | | Certification of Chief Executive Officer Pursuant to Item 601(b) (31) ofRegulation S-K, as adopted pursuant to Section 302 of the Sarbanes-Oxley Act of 2002. |
| 31.2* | | Certification of Chief Financial Officer Pursuant to Item 601(b) (31) ofRegulation S-K, as adopted pursuant to Section 302 of the Sarbanes-Oxley Act of 2002. |
81
| | |
Number | | Description |
|
| 32.1* | | Certification of Chief Executive Officer Pursuant to 18 U.S.C. Section 1350, as adopted pursuant to Section 906 of the Sarbanes-Oxley Act of 2002. |
| 32.2* | | Certification of Chief Financial Officer Pursuant to 18 U.S.C Section 1350, as adopted pursuant to Section 906 of the Sarbanes-Oxley Act of 2002. |
| |
| † | This exhibit constitutes a management contract, compensatory plan, or arrangement |
| |
| * | Filed hereunder |
Hubbell Incorporated
| | |
| | By | /s/ Jacqueline Donnelly |
Jacqueline Donnelly
Corporate Assistant Controller and
Chief Accounting Officer
David G. Nord
Senior Vice President and
Chief Financial Officer
Gregory F. Covino
Vice President, Controller
(and Chief Accounting Officer)
Date: February 27, 200725, 2008
8682
Pursuant to the requirements of the Securities Exchange Act of 1934, this report has been signed below by the following persons on behalf of the registrant and in the capacities and on the dates indicated.
| | | | | | | |
| | | | | Title | | Date |
| |
| By | | /s/ T. H. Powers
T. H. Powers
| | Chairman of the Board, President and Chief Executive Officer and Director | | 2/27/0725/08 |
| | | | | | | |
| By | | /s/ D. G. Nord
D. G. Nord | | Senior Vice President and Chief Financial Officer | | 2/27/0725/08 |
| | | | | | | |
| By | | /s/ E. R. BrooksJ. Donnelly
E. R. BrooksJ. Donnelly | | DirectorCorporate Assistant Controller and Chief Accounting Officer | | 2/27/0725/08 |
| | | | | | | |
| By | | /s/ G. W. Edwards, JrE. R. Brooks
G. W. Edwards, JrE. R. Brooks | | Director | | 2/27/0725/08 |
| | | | | | | |
| By | | /s/ A. J. GuzziG. W. Edwards, Jr
A. J. GuzziG. W. Edwards, Jr | | Director | | 2/27/0725/08 |
| | | | | | | |
| By | | /s/ A. J. S. HoffmanGuzzi
A. J. S. HoffmanGuzzi | | Director | | 2/27/0725/08 |
| | | | | | | |
| By | | /s/ A. Mcnally IVJ. S. Hoffman
A. McNally IVJ. S. Hoffman | | Director | | 2/27/0725/08 |
| | | | | | | |
| By | | /s/ D. J. MeyerA. Mcnally IV
D. J. MeyerA. McNally IV | | Director | | 2/27/0725/08 |
| | | | | | | |
| By | | /s/ G.D. J. RatcliffeMeyer
G.D. J. RatcliffeMeyer | | Director | | 2/27/0725/08 |
| | | | | | | |
| By | | /s/ R.G. J. SwiftRatcliffe
R.G. J. SwiftRatcliffe | | Director | | 2/27/0725/08 |
| | | | | | | |
| By | | /s/ R. J. Swift
R. J. Swift | | Director | | 2/25/08 |
| | | | | | |
| By | | /s/ D. S. Van Riper
D. S. Van Riper | | Director | | 2/27/0725/08 |
8783
Schedule II
HUBBELL INCORPORATED AND SUBSIDIARIES
FOR THE YEARS ENDED DECEMBER 31, 2004, 2005, 2006 AND 20062007
Reserves deducted in the balance sheet from the assets to which they apply (in millions):
| | | | | | | | | | | | | | | | | | | | | | | | | | | | | | | | | | | | | | | | | |
| | | | | Additions/
| | | | | | | | | | | Additions/
| | | | | | | |
| | | | | (Reversals)
| | | | | | | | | | | (Reversals)
| | | | | | | |
| | | Balance at
| | Charged to
| | Acquisitions/
| | | | Balance
| | | Balance at
| | Charged to
| | Acquisitions/
| | | | Balance
| |
| | | Beginning
| | Costs and
| | Disposition
| | | | at End
| | | Beginning
| | Costs and
| | Disposition
| | | | at End
| |
| | | of Year | | Expenses | | of Businesses | | Deductions | | of Year | | | of Year | | Expenses | | of Businesses | | Deductions | | of Year | |
| |
| Allowances for doubtful accounts receivable: | | | | | | | | | | | | | | | | | | | | | | | | | | | | | | | | | | | | | | | | |
| Year 2004 | | $ | 11.6 | | | $ | (2.9 | ) | | $ | — | | | $ | (2.6 | ) | | $ | 6.1 | | |
| Year 2005 | | $ | 6.1 | | | $ | (1.6 | ) | | $ | 0.1 | | | $ | (0.4 | ) | | $ | 4.2 | | | $ | 6.1 | | | $ | 0.9 | | | $ | 0.1 | | | $ | (2.9 | ) | | $ | 4.2 | |
| Year 2006 | | $ | 4.2 | | | $ | (0.8 | ) | | $ | 0.1 | | | $ | (0.3 | ) | | $ | 3.2 | | | $ | 4.2 | | | $ | 0.4 | | | $ | 0.1 | | | $ | (1.5 | ) | | $ | 3.2 | |
| Year 2007 | | | $ | 3.2 | | | $ | 1.5 | | | $ | — | | | $ | (1.0 | ) | | $ | 3.7 | |
| Allowance for credit memos and returns: | | | | | | | | | | | | | | | | | | | | | | | | | | | | | | | | | | | | | | | | |
| Year 2004 | | $ | 15.5 | | | $ | 6.9 | | | $ | — | | | $ | (6.1 | ) | | $ | 16.3 | | |
| Year 2005 | | $ | 16.3 | | | $ | 8.1 | | | $ | — | | | $ | (8.4 | ) | | $ | 16.0 | | | $ | 16.3 | | | $ | 96.4 | | | $ | — | | | $ | (96.7 | ) | | $ | 16.0 | |
| Year 2006 | | $ | 16.0 | | | $ | 11.3 | | | $ | 0.1 | | | $ | (8.6 | ) | | $ | 18.8 | | | $ | 16.0 | | | $ | 118.6 | | | $ | 0.1 | | | $ | (115.9 | ) | | $ | 18.8 | |
| Year 2007 | | | $ | 18.8 | | | $ | 123.2 | | | $ | — | | | $ | (123.1 | ) | | $ | 18.9 | |
| Allowances for excess/obsolete inventory: | | | | | | | | | | | | | | | | | | | | | | | | | | | | | | | | | | | | | | | | |
| Year 2004 | | $ | 34.2 | | | $ | 4.7 | * | | $ | — | | | $ | (16.8 | ) | | $ | 22.1 | | |
| Year 2005 | | $ | 22.1 | | | $ | 3.6 | * | | $ | 0.2 | | | $ | (9.4 | ) | | $ | 16.5 | | | $ | 22.1 | | | $ | 3.6 | * | | $ | 0.2 | | | $ | (9.4 | ) | | $ | 16.5 | |
| Year 2006 | | $ | 16.5 | | | $ | 6.4 | * | | $ | 0.2 | | | $ | (2.2 | ) | | $ | 20.9 | | | $ | 16.5 | | | $ | 6.4 | * | | $ | 0.2 | | | $ | (2.2 | ) | | $ | 20.9 | |
| Year 2007 | | | $ | 20.9 | | | $ | 9.5 | | | $ | 0.5 | | | $ | (3.3 | ) | | $ | 27.6 | |
| Valuation allowance on deferred tax assets: | | | | | | | | | | | | | | | | | | | | | | | | | | | | | | | | | | | | | | | | |
| Year 2004 | | $ | 4.9 | | | $ | (0.2 | ) | | $ | — | | | $ | — | | | $ | 4.7 | | |
| Year 2005 | | $ | 4.7 | | | $ | (4.1 | ) | | $ | — | | | $ | — | | | $ | 0.6 | | | $ | 4.7 | | | $ | (4.1 | ) | | $ | — | | | $ | — | | | $ | 0.6 | |
| Year 2006 | | $ | 0.6 | | | $ | (0.6 | ) | | $ | — | | | $ | — | | | $ | — | | | $ | 0.6 | | | $ | (0.6 | ) | | $ | — | | | $ | — | | | $ | — | |
| Year 2007 | | | $ | — | | | $ | — | | | $ | — | | | $ | — | | | $ | — | |
| | |
| * | | Includes the cost of product line discontinuances of $0.2 million $0.7 million and $1.3$0.7 million in 2006 2005 and 2004,2005, respectively. |
8884