SECURITIES AND EXCHANGE COMMISSION
WASHINGTON, D.C. 20549
FORM 10-K
FOR ANNUAL AND TRANSITION REPORTS
PURSUANT TO SECTION 13 OR 15(d) THE SECURITIES EXCHANGE ACT OF 1934
(Mark One)
| | |
þ | x | ANNUAL REPORT PURSUANT TO SECTION 13 OR 15(d) OF THE SECURITIES EXCHANGE ACT OF 1934 |
For the fiscal year ended December 31, 20062009
OR
| | |
| o | | TRANSITION REPORT PURSUANT TO SECTION 13 OR 15(d) OF THE SECURITIES EXCHANGE ACT OF 1934 |
For the transition period from ____________ to ___________
Commission File Number 0-4776
STURM, RUGER & COMPANY, INC.
(Exact Name of Registrant as Specified in Its Charter)
| | |
Delaware | | 06-0633559 |
(State or Other Jurisdiction of | | (I.R.S. Employer |
Incorporation or Organization) | | 06-0633559 (I.R.S. Employer Identification No.) |
| | |
Lacey Place, Southport, Connecticut
(Address of Principal Executive Offices) | | 06890
(Zip Code) |
(203) 259-7843
(Registrant’s telephone number, including area code)
Securities registered pursuant to Section 12(b) of the Act:
| | |
Title of Each Class Common Stock, $1 par value | | Name of Each Exchange on Which Registered |
Common Stock, $1 par value | | New York Stock Exchange |
Securities registered pursuant to Section 12(g) of the Act:
None
(Title of Class)
Indicate by check mark if the registrant is a well-known seasoned issuer, as defined in Rule 405 of the Securities Act.YESoNOþx
Indicate by check mark if the registrant is not required to file reports pursuant to Section 13 or Section 15(d) of the Act.YESoNOþx
Indicate by check mark whether the registrant (1) has filed all reports required to be filed by Section 13 or 15(d) of the Securities Exchange Act of 1934 during the preceding 12 months (or for such shorter period that the registrant was required to file such reports), and (2) has been subject to such filing requirements for the past 90 days. YES þx NO o
Indicate by check mark if disclosure of delinquent filers pursuant to Item 405 of Regulation S-K is not contained herein, and will not be contained, to the best of registrant’sregistrant's knowledge, in definitive proxy or information statements incorporated by reference in Part III of this Form 10-K or any amendment to this Form 10-Kþx.
Indicate by check mark whether the registrant is a large accelerated filer, an accelerated filer, or a non-accelerated filer. See definition of “accelerated filer and large accelerated filer” in Rule 12b-2 of the Exchange Act.LargeAct.
Large accelerated fileroAccelerated filerþx
Non-accelerated filer oSmaller reporting company o.
Indicate by check mark whether the registrant is a shell company (as defined in Rule 12b-2 of the Exchange Act).YESoNOþx
The aggregate market value of the voting and non-voting common equity held by non-affiliates of the registrant computed by reference to the price at which the common equity was last sold, or the average bid and asked price of such common equity, as of June 30, 2006:
2009:
Common Stock, $1 par value — $175,877,600- $233,905,000
The number of shares outstanding of the registrant’sregistrant's common stock as of February 15, 2007:
19, 2010:
Common Stock, $1 par value — 22,638,720- 19,072,780 shares
DOCUMENTS INCORPORATED BY REFERENCE.
Portions of the registrant’s Proxy Statement relating to its 2007 Annual Stockholders’ meeting, to be filed subsequently are incorporated by reference into Part III of this Report.
Portions of the registrant’s Proxy Statement relating to the 2010 Annual Meeting of Stockholders to be held April 24, 200728, 2010 are incorporated by reference into Part III (Items 10 through 14) of this Report.
2
In this Annual Report on Form 10-K, Sturm, Ruger & Company, Inc. (the “Company”) makes forward-looking statements and projections concerning future expectations. Such statements are based on current expectations and are subject to certain qualifying risks and uncertainties, such as market demand, sales levels of firearms, anticipated castings sales and earnings, the need for external financing for operations or capital expenditures, the results of pending litigation against the Company including lawsuits filed by mayors, attorneys general and other governmental entities and membership organizations, and the impact of future firearms control and environmental legislation, any one or more of which could cause actual results to differ materially from those projected. Readers are cautioned not to place undue reliance on these forward-looking statements, which speak only as of the date made. The Company undertakes no obligation to publish revised forward-looking statements to reflect events or circumstances after the date such forward-looking statements are made or to reflect the occurrence of subsequent unanticipated events.
ITEM 1—BUSINESS
Company Overview
Sturm, Ruger & Company, Inc. (the “Company”) is principally engaged in the design, manufacture, and sale of firearms to domestic customers. Approximately 98% of the Company’s total sales for the year ended December 31, 2009 were from the firearms segment, and precisionapproximately 2% were from investment castings. Export sales represent less than 4% of firearms sales. The Company’s design and manufacturing operations are located in the United States. Substantially all sales areStates and most product content is domestic.
The Company has been in the business since 1949 and was incorporated in its present form under the laws of Delaware in 1969. The Company offers products in all four industry product categories —– rifles, shotguns, pistols, and revolvers. The Company’s firearms are sold through a select number of independent wholesale distributors, principally to the commercial sporting market.
The Company manufactures and sells investment castings made from steel alloys for both outside customers and internal use in the firearms segment. Investment castings are manufactured from steel alloys. Investment castings are sold to outside customers, either directly to or through manufacturers’ representatives, to companies in a wide varietyrepresented approximately 2% of industries. In July 2006, the Company announcedCompany’s total sales for the cessation of titanium castings operations, which is expected to be completed in the first quarter of 2007. The Company continues to manufacture and sell steel investment castings for a wide variety of customers and end uses.year ended December 31, 2009.
For the years ended December 31, 2006, 2005,2009, 2008, and 2004,2007, net sales attributable to the Company’sCompany's firearms operations were approximately, $139.1$266.6 million, $132.8$174.4 million and $124.9$144.2 million or 83%approximately 98%, 86%96%, and 86%92%, respectively, of total net sales. The balance of the Company’sCompany's net sales for the aforementioned periods was attributable to its investment castings operations.
Firearms Products
The Company presently manufactures firearm products, under the “Ruger” name and trademark, in the following industry categories:
| Rifles | | Shotguns | |
| · | Single-shot | | | The Company presently manufactures firearm products, under the “Ruger” name· | Over and trademark, in the following industry categories:Under | |
| | · | Autoloading | | | | | |
Rifles
| | Shotguns
|
•
| | Single-shot | | • | | Over and Under |
•
| | Autoloading | | • | | Side by Side |
•
| · | Bolt-action | | | | | |
•
| | Lever action· | Modern sporting | | | | | |
3
| | | | | | | |
| Pistols | | Revolvers | |
•
| · | Rimfire autoloading | | • | · | Single action | |
•
| · | Centerfire autoloading | | • | · | Double action |
| | | | | • | | Muzzleloading |
Most firearms are available in several models based upon caliber, finish, barrel length, and other features. Many of the firearms introduced by the Company over the years have become “classics” which have retained their popularity for decades and are sought by collectors.
The Company manufactures a wide range of high quality products and does not manufacture inexpensive concealable firearms, sometimes known as “Saturday Night Specials,” nor does it sell commercially any firearm included on the list of “assault weapons” which was part of anti-crime legislation enacted by Congress in 1994 and since expired.
Rifles
A rifle is a long gun with spiral grooves cut into the interior of the barrel to give the bullet a stabilizing spin after it leaves the barrel. The Company presently manufactures twelve different types of rifles: the M77 Mark II, the M77 Hawkeye, the M77 Mark II Magnum, the 77/17, the 77/22, the 10/22, the Model 96/22, the Model 96/44, the Model 96/17, the Mini-14 Ranch Rifle, the Mini Thirty Ranch Rifle, and the No. 1 Single-Shot. Sales of rifles by the Company accounted for approximately $58.4$102.2 million, $58.0$69.4 million, and $61.1$64.9 million, of revenues for the years 2006, 20052009, 2008 and 2004,2007, respectively.
Shotguns
A shotgun is a long gun with a smooth barrel interior which fires lead or steel pellets. The Company presently manufactures two different types of shotguns: the Red Label over-and-under shotgun available in 12, 20, and 28 gauge and the Gold Label side-by-side shotgun in 12 gauge. Most of the Red Label models are available in special Sporting Clays, English Field, and engraved versions. Sales of shotguns by the Company accounted for approximately $5.5$1.2 million, $9.7$1.5 million, and $6.8$3.8 million of revenues for the years 2006, 20052009, 2008 and 2004,2007, respectively.
Pistols
A pistol is a handgun in which the ammunition chamber is an integral part of the barrel and which typically is fed ammunition from a magazine contained in the grip. The Company presently manufactures three different types of pistols: the Ruger Mark III .22 caliber in Standard, Competition, and Target models, the Ruger 22/45, and the P-Series centerfire autoloading pistols in various calibers, configurations, and finishes. Sales of pistols by the Company accounted for approximately $31.9$87.5 million, $32.5$52.5 million, and $24.8$33.4 million of revenues for the years 2006, 20052009, 2008 and 2004,2007, respectively.
Revolvers
A revolver is a handgun that has a cylinder that holds the ammunition in a series of chambers which are successively aligned with the barrel of the gun during each firing cycle. There are two general types of revolvers, single-action and double-action. To fire a single-action revolver, the hammer is pulled back to cock the gun and align the cylinder before the trigger is pulled. To fire a double-action revolver, a single trigger pull advances the cylinder and cocks and releases the hammer. The Company presently manufactures seven different types of single-action revolvers in a variety of calibers, configurations, and finishes: the New Model Single-Six, New Model Blackhawk, New Model Super Blackhawk, New Vaquero, Ruger Bisley Old Army Cap & Ball, New Bearcat, and Bisley Hunter revolvers. The Company presently manufactures four different types of double-action revolvers: the SP101, GP100,
4
Redhawk, and Super Redhawk. Sales of revolvers by the Company accounted for approximately $37.6$58.3 million, $27.5$41.0 million, and $27.2$35.6 million of revenues for the years 2006, 2005,2009, 2008, and 2004,2007, respectively.
The Company also manufactures and sells accessories and replacement parts for its firearms. These sales accounted for approximately $4.4$17.4 million, $3.9$9.9 million, and $4.3$6.5 million of revenues for the years 2006, 20052009, 2008 and 2004,2007, respectively.
Investment Casting Products
The Company is also engagedmanufactures and sells investment castings made from steel alloys for both outside customers and internal use in the manufacture of titanium and ferrous investmentfirearms segment. Investment castings for a wide variety of markets including sporting goods and commercial and military use. The investment castings products manufactured by the Company consist of carbon and low alloy steels, stainless steels, air melted nickel and cobalt based alloys, and ductile iron. The Company produces various products for a number ofsold to outside customers, in a variety of industries.
The Ruger Investment Casting Divisioneither directly to or through manufacturers’ representatives, represented approximately 2% of the Company located in Prescott, Arizona (“RIC-Prescott Division”) has engineered and produced titanium and ferrous castings. The Ruger Investment Casting Division ofCompany’s total sales for the Company located in Newport, New Hampshire (“RIC-Newport Division”) (formerly known as Pine Tree Castings) engineers and produces ferrous castings for a wide range of commercial customers. In July 2006, the Company announced the cessation of titanium castings operations, which is expected to be completed in 2007. The Company will consolidate its casting operations in its New Hampshire foundry in 2007. The Company expects to continue to manufacture and sell steel investment castings for a wide variety of customers and end uses.year ended December 31, 2009.
Net sales attributable to the Company’s investment casting operations (excluding intercompany transactions) accounted for approximately $28.5$4.4 million, $21.9$7.1 million, and $20.7$12.3 million, or 17%approximately 2%, 14%4%, and 14%8% of the Company’s total net sales for 2006, 2005,2009, 2008, and 2004,2007, respectively.
Manufacturing
Manufacturing
Firearms
The Company produces one model of pistol and all of its rifles, shotguns, and revolvers at the Newport, New Hampshire facility. All other pistols and one model revolver, are produced at the Prescott, Arizona facility.
Many of the basic metal component parts of the firearms manufactured by the Company are produced by the Company’sCompany's castings facilities through a process known as precision investment casting. See “Manufacturing-Investment Castings”"Manufacturing-Investment Castings" for a description of the investment casting process. The Company initiated the use of this process in the production of component parts for firearms in 1953. The Company believes that the investment casting process provides greater design flexibility and results in component parts which are generally close to their ultimate shape and, therefore, require less machining.machining than processes requiring machining a solid billet of metal to obtain a part. Through the use of investment castings, the Company endeavors to produce durable and less costly component parts for its firearms.
Third parties supply the Company with various raw materials for its firearms, such as fabricated steel components, walnut, birch, beech, maple and laminated lumber for rifle and shotgun stocks, various synthetic products and other component parts. There is a limited supply of these materials in the marketplace at any given time which can cause the purchase prices to vary based upon numerous market factors. The Company believes that it has adequate quantities of raw materials in inventory to provide
5
ample time to locate and obtain additional items at then-current market cost without interruption of its manufacturing operations. However, if market conditions result in a significant prolonged inflation of certain prices or if adequate quantities of raw materials can not be obtained, the Company’s manufacturing processes could be interrupted and the Company’s financial condition or results of operations could be materially adversely affected.
All assembly, inspection, and testing of firearms manufactured by the Company are performed at the Company’sCompany's manufacturing facilities. Every firearm, including every chamber of every revolver manufactured by the Company, is test-fired prior to shipment.
Investment Castings
To produce a product by the investment casting method, a wax model of the part is created and coated (“invested”) with several layers of ceramic material. The shell is then heated to melt the interior wax which is poured off, leaving a hollow mold. To cast the desired part, molten metal is poured into the mold and allowed to cool and solidify. The mold is then broken off to reveal a near net shape cast metal part.
All of the titanium investment castings and some of the ferrous investment castings products are manufactured by the Company’s RIC-Prescott Division. In July 2006, the Company announced the cessation of titanium castings operations, which is expected to be completed in the first quarter of 2007. The Company will consolidate its casting operations in its New Hampshire foundry in 2007.
The Company’s RIC-Newport Division manufactures ferrous investment castings.
Raw materials including wax, ceramic material, and metal alloys necessary for the production of investment cast products are supplied to the Company through third parties. The Company believes that these raw materials are readily available from multiple sources at competitive prices. However, if market conditions result in a significant prolonged inflation of certain prices or if adequate quantities of raw materials can not be obtained, the Company’s manufacturing processes could be interrupted and the Company’s financial condition or results of operations could be materially adversely affected.
Marketing and Distribution
Firearms
The Company’sCompany's firearms are primarily marketed through a network of selected licensedFederally-licensed independent wholesale distributors who purchase the products directly from the Company. They resell to Federally-licensed retail firearms dealers who in turn resell to legally authorized end-users. All retail purchasers are subject to a point-of-sale background check by law enforcement. These end-users include sportsmen, hunters, law enforcement and other governmental organizations, and gun collectors. Each distributor carries the entire line of firearms manufactured by the Company for the commercial market. Currently, 1614 distributors service the domestic commercial market, with an additional 1219 distributors servicing the domestic law enforcement market and two distributors servicing the Canadian market. FourFive of the Company’s distributors service both the domestic commercial market and the domestic law enforcement market. In 2006, Lipsey’s, Inc. accounted for 13% and 11% of net firearms sales and consolidated sales, respectively. AcuSport Corporation
One customer accounted for approximately 13%15%, 18% and 13% of net firearm sales and 15%, 17% and 12%, of net firearms sales and 10%, 11%, and 10% of consolidated net sales in 2006, 2005,2009, 2008, and 2004,2007, respectively. Jerry’s Sport CenterA second customer accounted for approximately 12%11%, and 13%, of the Company’s net firearms sales and 10% and 11% of consolidated net sales in 2005, and 2004, respectively. Sports
6
South Corporation accounted for approximately 13%, 16%, and 13% of net firearms sales in 2006, 2005, and 2004, respectively, and 11%, 14%12%, and 12% of consolidated net sales in 2009, 2008, and 2007, respectively. A third customer accounted for approximately 11%, 12%, and 12% of net firearms sales and 11%, 11%, and 11% of consolidated net sales in 2006, 2005,2009, 2008, and 2004,2007, respectively. A fourth customer accounted for approximately 11% and 10% of the Company's net firearms sales and consolidated net sales in 2009 and 2008, respectively. A fifth customer accounted for approximately 10% of net firearms sales and consolidated sales in 2009. A sixth customer accounted for 11% of net firearm sales and 10% of consolidated sales in 2007.
The Company employs eight employees and one independent contractor who service these distributors and call on dealers and law enforcement agencies. Because the ultimate demand for the Company’sCompany's firearms comes from end-users, rather than from the Company’sCompany's distributors, the Company believes that the loss of any distributor would not have a material long-term adverse effect on the Company, but may have a material impact on the Company’s financial results for a particular period. The Company considers its relationships with its distributors to be satisfactory.
The Company also exports its firearms through a network of selected commercial distributors and directly to certain foreign customers, consisting primarily of law enforcement agencies and foreign governments. Foreign sales were less than 5%6% of the Company’sCompany's consolidated net sales for each of the past three fiscal years. No material portion of the Company’s business is subject to renegotiation of profits or termination of contracts at the election of a government purchaser.
In prior years, the Company received one cancelable annual order in December from each of its distributors.
Effective December 1, 2006 the Company changed the manner in which distributors order firearms, and began receiving firm, non-cancelable purchase orders on a frequent basis from each of its distributors, with most orders for immediate delivery. As of February 15, 2007,1, 2010, the order backlog iswas approximately $24$70 million. The significant reduction from the $107 millionAs of February 1, 2009, order backlog at March 1, 2006 is directly attributable to the change in the manner in which distributors now order firearms.was approximately $87 million.
The Company does not consider its overall firearms business to be predictably seasonal; however, sales of certainmany models of firearms are usually lower in the third quarter of the fiscal year.
Investment Castings
The investment casting segment’ssegment's principal markets are commercial, sporting goods, and military. Sales are made directly to customers or through manufacturers’ representatives. The Company produces various products for a number of customers in a variety of industries, including over 20approximately 24 firearms and firearms component manufacturers. The investment castings segment provides castings for the Company’s firearms segment. The Company continues to evaluate the viability and profitability of the commercial castings market.
Competition
Competition
Firearms
Competition in the firearms industry is intense and comes from both foreign and domestic manufacturers. While some of these competitors concentrate on a single industry product category, such as rifles or pistols, several competitors manufacture products in allthe same four industry categories as the Company (rifles, shotguns, pistols, and revolvers). Some of these competitors are subsidiaries of larger corporations than the Company with substantially greater financial resources than the Company, which could affect the Company’s ability to compete. The principal methods of competition in the industry are product innovation, quality, availability, and price. The Company believes that it can compete effectively with all of its present competitors based upon innovation, high quality, reliability, and performance of its products, and the competitiveness of its pricing.competitors.
Investment Castings
7
There are a large number of investment castings manufacturers, both domestic and foreign, with which the Company competes. Competition varies based on the type of investment castings products and the end-use of the product (commercial, sporting goods, or military). Many of these competitors are larger corporations than the Company with substantially greater financial resources than the Company, which could affect the Company’s ability to compete with these competitors. The principal methods of competition in the industry are quality, price, and production lead time. The Company believes that it can compete effectively with its present domestic competitors. However, it is unknown at this time if the Company can compete with foreign competitors in the long-term.
Employees
As of February 1, 2007,2010, the Company employed 1,100approximately 1,150 full-time employees of which approximately 64%54% had at least ten years of service with the Company. In January 2007, 56 of the Company’s Newport, New Hampshire employees accepted the Company’s voluntary reduction-in-force program. The associated severance expense is estimated at $1.0 million and the associated annualized savings are estimated at $2.3 million.
None of the Company’sCompany's employees are subject to a collective bargaining agreement. The Company has never experienced a strike during its history and believes its employee relations are satisfactory.
Research and Development
In 2006, 2005,2009, 2008, and 2004,2007, the Company spent approximately $0.6$2.0 million, $0.8$1.5 million, and $0.9$0.7 million, respectively, on research activities relating to the development of new products and the improvement of existing products. As of February 15, 2007,2010, the Company had approximately 2517 employees engaged inwhose primary responsibilities were research and development activities as part of their responsibilities.activities.
Patents and Trademarks
The Company owns various United States and foreign patents and trademarks which have been secured over a period of years and which expire at various times. It is the policy of the Company to apply for patents and trademarks whenever new products or processes deemed commercially valuable are developed or marketed by the Company. However, none of these patents and trademarks are considered to be basic to any important product or manufacturing process of the Company and, although the Company deems its patents and trademarks to be of value, it does not consider its business materially dependent on patent or trademark protection.
Environmental Matters
The Company is committed to achieving high standards of environmental quality and product safety, and strives to provide a safe and healthy workplace for its employees and others in the communities in which it operates. The Company has programs in place that monitor compliance with various environmental regulations. However, in the normal course of its manufacturing operations the Company is subject to occasional governmental proceedings and orders pertaining to waste disposal, air emissions, and water discharges into the environment. These regulations are integrated into the Company’s manufacturing, assembly, and testing processes. The Company believes that it is generally in compliance with applicable environmental regulations and the outcome of any environmental
8
proceedings and orders will not have a material effect on the financial position of the Company, but could have a material impact on the financial results for a particular period.
Executive Officers of the Company
Set forth below are the names, ages, and positions of the executive officers of the Company. Officers serve at the pleasurediscretion of the Board of Directors of the Company.
| | | | | | | | | | |
Name | | Age | | Position With Company |
| | | | |
| |
| Michael O. Fifer | | | 49 | | 52 | Chief Executive Officer | | | | |
| | | | | | | | | | |
Stephen L. Sanetti | | | 57 | | | Vice Chairman of the Board of Directors, President, and General Counsel | | | | |
| | | | | | | | | | |
| Thomas A. Dineen | | | 38 | | 41 | Vice President, Treasurer and Chief Financial Officer | |
| | | |
| Christopher J. Killoy | 51 | Vice President of Sales and Marketing | | | | | |
| | | |
Robert R. StutlerMark T. Lang | 53 | | 63 | | | Group Vice President of Prescott Operations | | | | |
| | | | | | | | | | |
| Thomas P. Sullivan | | | 46 | | 49 | Vice President of Newport Operations | | | | |
| | | | | | | | | | |
Christopher J. Killoy | | | 48 | | | Vice President of Sales and Marketing | | | | |
| | | | | | | | | | |
| Leslie M. Gasper | | | 53 | | 56 | Corporate Secretary | | | �� | |
Michael O. Fifer joined the Company as Chief Executive Officer on September 25, 2006, and was named to the Board of Directors on October 19, 2006. Prior to joining the Company, Mr. Fifer was President of the Engineered Products Division of Mueller Industries, Inc. Prior to joining Mueller Industries, Inc., Mr. Fifer was President, North American Operations, Watts Water Technologies.
Stephen L. Sanetti became President on May 6, 2003. Mr. Sanetti has served as General Counsel since 1980. Prior to May 6, 2003, Mr. Sanetti had been Vice Chairman and Senior Executive Vice President since October 24, 2000. Mr. Sanetti has been a Director since March 1, 1998. Prior to October 24, 2000, he had been Vice President, General Counsel of the Company since 1993.
Thomas A. Dineen became Vice President on May 24, 2006. Previously he served as Treasurer and Chief Financial Officer since May 6, 2003 and had been Assistant Controller since 2001. Prior to that, Mr. Dineen had served as Manager, Corporate Accounting since 1997.
Robert R. Stutler became
Christopher J. Killoy rejoined the Company as Vice President of Sales and Marketing on November 27, 2006. Mr. Killoy originally joined the Company in 2003 as Executive Director of Sales and Marketing, and subsequently served as Vice President of Sales and Marketing from November 1, 2004 to January 25, 2005.
Mark T. Lang joined the Company as Group Vice President on February 18, 2008. Mr. Lang is responsible for management of the Prescott Firearms Division and the Company’s acquisition efforts. Prior to joining the Company, Mr. Lang was President of the Custom Products Business at Mueller Industries, Inc. Prior to joining Mueller, Mr. Lang was the Vice President of Operations for the Company’s Prescott, Arizona FirearmsAutomotive Division of Thomas and Foundry Divisions on March 17, 2006. Previously he served as General Manager of Prescott Operations since 2002 and General Manager of Prescott Firearms Division from 1990 to 2002. Mr. Stutler joined the Company in 1987.Betts, Inc.
Thomas P. Sullivan joined the Company as Vice President of Newport Operations for the Newport, New Hampshire Firearms and Pine Tree Castings divisions on August 14, 2006. Prior to joining the Company, Mr. Sullivan was Vice President of Lean Enterprises at IMI Norgren Ltd.
Christopher J. Killoy rejoined the Company as Vice President of Sales and Marketing on November 27, 2006. Mr. Killoy originally joined the Company in 2003 as Executive Director of Sales and Marketing,
9
and subsequently served as Vice President of Sales and Marketing from November 1, 2004 to January 25, 2005.
Leslie M. Gasper has been Secretary of the Company since 1994. Prior to this, she was the Administrator of the Company’s pension plans, a position she held for more than five years prior thereto.
Where You Can Find More Information
The Company is a reporting company and is therefore subject to the informational requirements of the Securities and Exchange Act of 1934, as amended (the “Exchange Act”"Exchange Act"), and accordingly files its Annual Report on Form 10-K, Quarterly Reports on Form 10-Q, Definitive Proxy Statements, Current Reports on Form 8-K, and other information with the Securities and Exchange Commission (the “SEC”"SEC"). The public may read and copy any materials filed with the SEC at the SEC’sSEC's Public Reference Room at 100 F Street NE, Washington, DC 20549. Please call the SEC at (800) SEC-0330 for further information on the Public Reference Room. As an electronic filer, the Company’sCompany's public filings are maintained on the SEC’sSEC's Internet site that contains reports, proxy and information statements, and other information regarding issuers that file electronically with the SEC. The address of that website is http://www.sec.gov.
The Company makes its Annual Report on Form 10-K, Quarterly Reports on Form 10-Q, Definitive Proxy Statements, Current Reports on Form 8-K and amendments to those reports filed or furnished pursuant to Section 13(a) or 15(d) of the Exchange Act accessible free of charge through the Company’sCompany's Internet site after the Company has electronically filed such material with, or furnished it to, the SEC. The address of that website is http://www.ruger.com. However, such reports may not be accessible through the Company’sCompany's website as promptly as they are accessible on the SEC’s website.
Additionally, the Company’s corporate governance materials, including its Corporate Governance Guidelines;Guidelines, the charters of the Audit, Compensation, and Nominating and Corporate Governance committees;committees, and the Code of Business Conduct and Ethics may also be found under the “Stockholder Relations” section of the Company’s Internet site at www.ruger.com. A copy of the foregoing corporate governance materials are available upon written request of the Corporate Secretary at Sturm, Ruger & Company, Inc., Lacey Place, Southport, Connecticut 06890.
In evaluating the Company’s business, the following risk factors, as well as other information in this report, should be carefully considered.
Firearms Legislation
(The following disclosures within “Firearms Legislation” are identical to the disclosures within “Firearms Legislation” in Item 7-Management’s Discussion and Analysis of Financial Condition and Results of Operations.)
The sale, purchase, ownership, and use of firearms are subject to thousands of federal, state and local governmental regulations. The basic federal laws are the National Firearms Act, the Federal Firearms Act, and the Gun Control Act of 1968. These laws generally prohibit the private ownership of fully
10
automatic weapons and place certain restrictions on the interstate sale of firearms unless certain licenses are obtained. The Company does not manufacture fully automatic weapons, other than for the law enforcement market, and holds all necessary licenses under these federal laws. From time to time, congressional committees review proposed bills relating to the regulation of firearms. These proposed bills generally seek either to restrict or ban the sale and, in some cases, the ownership of various types of firearms. Several states currently have laws in effect similar to the aforementioned legislation.
Until November 30, 1998, the “Brady Law” mandated a nationwide five-day waiting period and background check prior to the purchase of a handgun. As of November 30, 1998, the National Instant Check System, which applies to both handguns and long guns, replaced the five-day waiting period. The Company believes that the “Brady Law” and the National Instant Check System have not had a significant effect on the Company’s sales of firearms, nor does it anticipate any impact on sales in the future. On September 13, 1994, the “Crime Bill” banned so-called “assault weapons.” All the Company’s then-manufactured commercially-sold long guns were exempted by name as “legitimate sporting firearms.” This ban expired by operation of law on September 13, 2004. The Company remains strongly opposed to laws which would restrict the rights of law-abiding citizens to lawfully acquire firearms. The Company believes that the lawful private ownership of firearms is guaranteed by the Second Amendment to the United States Constitution and that the widespread private ownership of firearms in the United States will continue. However, there can be no assurance that the regulation of firearms will not become more restrictive in the future and that any such restriction would not have a material adverse effect on the business of the Company.
Firearms Litigation
(The following disclosures within “Firearms Litigation” are identical to the disclosures within “Firearms Litigation” in Item 7-Management’s Discussion and AnalysisNote 17 of Financial Condition and Results of Operations and Footnote #6-Contingentthe notes to the financial statements-Contingent Liabilities.)
As of December 31, 2006,2009, the Company iswas a defendant in approximately fourseven (7) lawsuits allegedly involving its products and is aware of certain other such claims.
Lawsuits and claimsinvolving the Company’s products generally fall into one of two categories:
| (i) | | Those that claim damages from the Company related to allegedly defective product design and/or manufacture which stem from a specific incident. ThesePending lawsuits and claims are based principally on the theory of “strict liability” but also may be based on negligence, breach of warranty, and other legal theories, andtheories; or |
|
| (ii) | | Those brought by cities municipalities, counties,or other governmental entities, and individuals against firearms manufacturers, distributors and dealersretailers seeking to recover damages allegedly arising out of the misuse of firearms by third-parties in the commission of homicides, suicides and other shootings involving juveniles and adults. The complaints by municipalities seek damages, among other things, for the costs of medical care, police and emergency services, public health services, and the maintenance of courts, prisons, and other services. In certain instances, the plaintiffs seek to recover for decreases in property values and loss of business within the city due to criminal violence. In addition, nuisance abatement and/or injunctive relief is sought to change the design, manufacture, marketing and distribution practices of the various defendants. These suits allege, among other claims, strict liability or negligence in the design of products, public nuisance, negligent entrustment, negligent distribution, deceptive or fraudulent advertising, violation of |
11
| | | consumer protection statutes and conspiracy or concert of action theories. Most of these cases do not allege a specific injury to a specific individual as a result of the misuse or use of any of the Company’s products. |
The Company has expended significant amounts
As to lawsuits of financial resources andthe first type, management time in connection with product liability litigation. Management believes that, in every case involving firearms, the allegations are unfounded, and that the shootings and any results therefrom were due to negligence or misuse of the firearms by third-parties or the claimant, and that there should be no recovery against the Company. Defenses further exist to the suits brought by cities, municipalities, counties, and a state attorney general based, among other reasons, on established state law precluding recovery by municipalities for essential government services, the remoteness of the claims, the types of damages sought to be recovered, and limitations on the extraterritorial authority which may be exerted by a city, municipality, county or state under state and federal law, including State and Federal Constitutions. Also, “The Protection of Lawful Commerce in Arms Act” signed into law on October 26, 2005 on its face requires dismissal of such claims.
The only case against the Company alleging liability for criminal shootings by third-parties to ever be permitted to go before a constitutional jury,Hamilton, et al. v. Accu-tek, et al., resulted in a defense verdict in favorremaining lawsuit of the Company on February 11, 1999. Insecond type is the lawsuit filed by the City of Gary. The complaint in that case numerous firearms manufacturersseeks damages, among other things, for the costs of medical care, police and distributors had been sued, alleging damagesemergency services, public health services, and other services as well as punitive damages. In addition, nuisance abatement and/or injunctive relief is sought to change the design, manufacture, marketing and distribution practices of the various defendants. The suit alleges, among other claims, negligence in the design of products, public nuisance, negligent distribution and marketing, negligence per se and deceptive advertising. The case does not allege a specific injury to a specific individual as a result of alleged negligent sales practices and “industry-wide” liability. The Company and its marketing and distribution practices were exonerated fromthe misuse or use of any claims of negligence in each of the seven cases decided by the jury. In subsequent proceedings involving other defendants, the New York Court of Appeals as a matter of law confirmed that 1) no legal duty existed under the circumstances to prevent or investigate criminal misuses of a manufacturer’s lawfully made products; and 2) liability of firearms manufacturers could not be apportioned under a market share theory. More recently, the New York Court of Appeals on October 21, 2003 declined to hear the appeal from the decision of the New York Supreme Court, Appellate Division, affirming the dismissal of New York Attorney General Eliot Spitzer’s public nuisance suit against the Company and other manufacturers and distributors of firearms. In its decision, the Appellate Division relied heavily onHamilton in concluding that it was “legally inappropriate,” “impractical,” “unrealistic” and “unfair” to attempt to hold firearms manufacturers responsible under theories of public nuisance for the criminal acts of others.
Of the lawsuits brought by municipalities or a state Attorney General, twenty have been concluded:Atlanta — dismissal by intermediate Appellate Court, no further appeal;Bridgeport — dismissal affirmed by Connecticut Supreme Court;County of Camden — dismissal affirmed by U.S. Third Circuit Court of Appeals;Miami — dismissal affirmed by intermediate appellate court, Florida Supreme Court declined review;New Orleans — dismissed by Louisiana Supreme Court, United States Supreme Court declined review;Philadelphia — U.S. Third Circuit Court of Appeals affirmed dismissal, no further appeal;Wilmington — dismissed by trial court, no appeal;Boston — voluntary dismissal with prejudice by the City at the close of fact discovery;Cincinnati — voluntarily withdrawn after a unanimous vote of the city council;Detroit — dismissed by Michigan Court of Appeals, no appeal;Wayne County — dismissed by Michigan Court of Appeals, no appeal;New York State — Court of Appeals denied plaintiff’s petition for leave to appeal the Intermediate Appellate Court’s dismissal, no further appeal;Newark — Superior Court of New Jersey Law Division for Essex County dismissed the case with prejudice;City of Camden — dismissed on July 7, 2003, not reopened;Jersey City — voluntarily dismissed and not re-filed;St. Louis — Missouri Supreme Court denied plaintiffs’ motion to appeal Missouri Appellate Court’s affirmance of dismissal;Chicago — Illinois Supreme Court denied plaintiffs’ petition for rehearing; andLos Angeles
12
City,Los Angeles County,San Francisco — Appellate Court affirmed summary judgment in favor of defendants, no further appeal; andCleveland — dismissed on January 24, 2006 for lack of prosecution.
The dismissal of theWashington, D.C. municipal lawsuit was sustained on appeal, but individual plaintiffs were permitted to proceed to discovery and attempt to identify the manufacturers of the firearms used in their shootings as “machine guns” under the city’s “strict liability” law. On April 21, 2005, the D.C. Court of Appeals, in anenbanc hearing, unanimously dismissed all negligence and public nuisance claims, but let stand individual claims based upon a Washington, D.C. act imposing “strict liability” for manufacturers of “machine guns.” Based on present information, none of the Company’s products hasproducts. Market share allegations have been identified with anyheld inapplicable by the Indiana Supreme Court.
The Indiana Court of Appeals affirmed the dismissal of theGary case by the trial court, but the Indiana Supreme Court reversed this dismissal and remanded the case for discovery proceedings on December 23, 2003.Gary is scheduled to begin trial in 2009. The On November 23, 2005, the defendants filed a motion to dismiss pursuant to the Protection of Lawful Commerce in Arms Act (“PLCAA”). The state court judge held the PLCAA unconstitutional and the defendants filed a motion with the Indiana Court of Appeals asking it to accept interlocutory appeal on the issue, which appeal was accepted on February 5, 2007.
In On October 29, 2007, the previously reportedNew York City municipal case,Indiana Appellate Court affirmed, holding that the defendants moved to dismiss the suit pursuantPLCAA does not apply to the ProtectionCity’s claims. A petition for rehearing was filed in the Appellate Court and denied on January 9, 2008. On February 8, 2008, a Petition to Transfer the appeal to the Supreme Court of Lawful CommerceIndiana was filed. The petition was denied on January 13, 2009 and the case was remanded to the trial court. No trial date has been set.
In addition to the foregoing, on August 18, 2009, the Company was served with a complaint captioned Steamfitters Local 449 Pension Fund, on Behalf of Itself and All Others Similarly Situated v. Sturm, Ruger & Co. Inc., et al. pending in Arms Act.the United States District Court for the District of Connecticut. The trial judge foundcomplaint seeks unspecified damages for alleged violations of the Securities Exchange Act to be constitutional but deniedof 1934 and is a purported class action on behalf of purchasers of the defendants’Company’s common stock between April 23, 2007 and October 29, 2007. On October 9, 2009, the Company waived service of a complaint captioned Alan R. Herrett, Individually and On Behalf of All Others Similarly Situated v. Sturm, Ruger & Co. Inc., et al. pending in the United States District Court for the District of Connecticut. This matter is based upon the same facts and basic allegations set forth in the Steamfitters Local 449 Pension Fund litigation. On October 12, 2009, a motion to dismissconsolidate the case, stating that the Acttwo actions was not applicable to the suit. The defendants were given leave to appeal and in fact have appealed the decision to the U.S. Court of Appealsfiled by counsel for the Second Circuit. That appeal is pending.
InSteamfitters. On January 11, 2010, theNAACP case, on May 14, 2003, an advisory jury returned a verdict rejecting the NAACP’s claims. On July 21, 2003, Judge Jack B. Weinstein court entered an order dismissingconsolidating theNAACP lawsuit, but this two matters. The January 11, 2010 order contained lengthy dicta whichalso sets a briefing schedule for plaintiffs to file a consolidated amended complaint and for defendants, believe are contraryincluding the Company, to lawfile a responsive pleading.
On September 11, 2009, the Company was served with a complaint captioned Secretary of Labor v. Sturm, Ruger & Co. Inc. pending before the Occupational Safety and fact. AppealsHealth Review Commission. The complaint arises out of a Notice of Contest filed by both sides were filed, but plaintiffs withdrew their appeal. On August 3, 2004, the United States Court of Appeals forCompany pursuant to an OSHA inspection conducted at the Second Circuit granted the NAACP’s motion to dismiss the defendants’ appeal of Judge Weinstein’s order denying defendants’ motion to strike his dicta madeCompany’s manufacturing facility in his order dismissing the NAACP’s case, and the defendants’ motion for summary dispositionNewport, New Hampshire. The matter was denied as moot. The rulingsettled by agreement of the Second Circuit effectively confirmed the decisionparties in favor of defendants and brought this matter to a conclusion.December 2009.
Legislation has been passed in approximately 34 states precluding suits of the type brought by the municipalities mentioned above. On the Federal level, the “Protection of Lawful Commerce in Arms Act” was signed by President Bush on October 26, 2005. The Act requires dismissal of suits against manufacturers arising out of the lawful sale of their products for harm resulting from the criminal or unlawful misuse of a firearm by a third party. The Company is pursuing dismissal of each action involving such claims, including the municipal cases described above. On February 1, 2007, plaintiff’s counsel in the previously reportedArnold case advised that plaintiff intends to voluntarily dismiss the case with prejudice. This will conclude this matter with no payment by the Company.
13
Punitive damages, as well as compensatory damages, are commonly demanded in manycertain of the lawsuits and claims brought against the Company.claims. Aggregate claimed amounts maypresently exceed product liability accruals and applicable insurance coverage. For claims made after July 10, 2000, coverage is provided on an annual basis for losses exceeding $5 million per claim, or an aggregate maximum loss of $10 million annually, except for certain new claims which might be brought by governments or municipalities after July 10, 2000, which are excluded from coverage.
Product liability claim payments are made when appropriate if, as, and when claimants and the Company reach agreement upon an amount to finally resolve all claims. Legal costs are paid as the lawsuits and claims develop, the timing of which may vary greatly from case to case. A time schedule cannot be determined in advance with any reliability concerning when payments will be made in any given case.
Provision is made for product liability claims based upon many factors related to the severity of the alleged injury and potential liability exposure, based upon prior claim experience. Because our experience in defending these lawsuits and claims is that unfavorable outcomes are typically not probable or estimable, only in rare cases is an accrual established for such costs. In most cases, an accrual is established only for estimated legal defense costs. Product liability accruals are periodically reviewed to reflect then-current estimates of possible liabilities and expenses incurred to date and reasonably anticipated in the future. Threatened product liability claims are reflected in our product liability accrual on the same basis as actual claims; i.e., an accrual is made for reasonably anticipated possible liability and claims-handling expenses on an ongoing basis.
A range of reasonably possible loss relating to unfavorable outcomes cannot be made. Currently, there are noHowever, in product liability cases in which a dollar amount of damages is claimed. If there were cases with claimed, damages, the amount of damages claimed, would bewhich totaled $7.7 million and $12.2 at December 31, 2009 and 2008, respectively, are set forth as an indication of possible maximum liability that the Company might be required to incur in these cases (regardless of the likelihood or reasonable probability of any or all of this amount being awarded to claimants) as a result of adverse judgments that are sustained on appeal.
As of December 31, 20062009 and 2005,2008, the Company was a defendant in 45 and 6 lawsuits, respectively, involving its products and is aware of other such claims. During the year ended December 31, 20062009 and 2005,2008, respectively, 2 and 31 claims were filed against the Company, 2 and 50 claims were dismissed, and 21 and 10 claims were settled. The average cost per settled claim was $47,000 and $150,000 in 2006 and 2005, respectively.
During the years ended December 31, 20062009 and 2005,2008, the Company incurred product liability expense of $2.5$1.6 million and $4.9$0.9 million, respectively, which includes the cost of outside legal fees, insurance, and other expenses incurred in the management and defense of product liability matters.
The Company management monitors the status of known claims and the product liability accrual, which includes amounts for asserted and unasserted claims. While it is not possible to forecast the outcome of litigation or the timing of costs, in the opinion of management, after consultation with special and corporate counsel, it is not probable and is unlikely that litigation, including punitive damage claims, will have a material adverse effect on the financial position of the Company, but may have a material impact on the Company’s financial results for a particular period.
14
The Company has reported all cases instituted against it through September 30, 2006A roll-forward of the product liability reserve and detail of product liability expense for the results of those cases, where terminated, to the S.E.C. on its previous Form 10-K and 10-Q reports, to which reference is hereby made.three years ended December 31, 2009 follows:
Balance Sheet RollforwardRoll-forward for Product Liability Reserve
(Dollars in thousands)
| | | | | | | | | | | | | | | | | | | | | | | | | | | | | |
| | | | | | | | | | | Cash Payments | | | | | | | | | | | | |
| | | | | | | Accrued | | | | | | | | | | | | | | | | | | | | |
| | | | | | | Legal | | | | | | | | | | | | | | | | | | | | |
| | | Balance | | | Expense | | | | | | | | | | | | | | | | | | | Balance | |
| | | Beginning of | | | (Reversal) | | | Legal Fees | | | Settlements | | | Insurance | | | Admin. | | | End | |
| | | Year (a) | | | (b) | | | (c) | | | (d) | | | Premiums | | | Expense | | | of Year (a) | |
| | | |
| 2004 | | $ | 6,665 | | | | ($1,598 | ) | | | ($1,935 | ) | | | — | | | | N/A | | | | N/A | | | $ | 3,132 | |
| | | | | | | | | | | | | | | | | | | | | | | | | | | | | |
| 2005 | | | 3,132 | | | | 2,514 | | | | (2,935 | ) | | | (515 | ) | | | N/A | | | | N/A | | | | 2,196 | |
| | | | | | | | | | | | | | | | | | | | | | | | | | | | | |
| 2006 | | | 2,196 | | | | 688 | | | | (1,000 | ) | | | (143 | ) | | | N/A | | | | N/A | | | | 1,741 | |
| | | | Cash Payments | | | |
| | Balance Beginning of Year (a) | Accrued Legal Expense (b) | Legal Fees (c) | Settlements (d) | Insurance Premiums | Admin.
Expense | Balance
End of Year (a) |
| | | | | | | | |
| 2007 | $1,741 | $639 | $(447) | $ - | N/A | N/A | $1,933 |
| | | | | | | | |
| 2008 | 1,933 | 176 | (358) | (7) | N/A | N/A | 1,744 |
| | | | | | | | |
| 2009 | 1,744 | 873 | (274) | (261) | N/A | N/A | 2,082 |
Income Statement Detail for Product Liability Expense
(Dollars in thousands)
| | | | | | | | | | | | | | | | | |
| | | Accrued | | | Insurance | | | | | | | Total | |
| | | Legal | | | Premium | | | Admin. | | | Product | |
| | | Expense | | | Expense | | | Expense | | | Liability | |
| | | (b) | | | (e) | | | (f) | | | Expense | |
| | | |
| 2004 | | $ | (1,598 | ) | | $ | 1,524 | | | $ | 878 | | | $ | 804 | |
| | | | | | | | | | | | | | | | | |
| 2005 | | | 2,514 | | | | 1,338 | | | | 1,041 | | | | 4,893 | |
| | | | | | | | | | | | | | | | | |
| 2006 | | | 688 | | | | 1,141 | | | | 691 | | | | 2,520 | |
| | Accrued Legal Expense (b) | Insurance Premium
Expense (e) | Admin.
Expense (f) | Total
Product
Liability
Expense | | | |
| | | | | | | | |
| 2007 | $639 | $748 | $299 | $1,686 | | | |
| | | | | | | | |
| 2008 | 176 | 739 | - | 915 | | | |
| | | | | | | | |
| 2009 | 873 | 745 | - | 1,618 | | | |
Notes
| | |
Notes |
|
| (a) | | The beginning and ending liability balances represent accrued legal fees only. Settlements and administrative costs are expensed as incurred. Only in rare instances is an accrual established for settlements. |
|
| (b) | | The expense accrued in the liability is for legal fees only. |
|
| (c) | | Legal fees represent payments to outside counsel related to product liability matters. |
|
| (d) | | Settlements represent payments made to plaintiffs or allegedly injured parties in exchange for a full and complete release of liability. |
|
| (e) | | Insurance expense represents the cost of insurance premiums. |
15
| | |
| (f) | | Administrative expense represents personnel related and travel expenses of Company employees and firearm experts related to the management and monitoring of product liability matters. |
There were no insurance recoveries during any of the above years.
Environmental
The Company is subject to numerous federal, state and local laws and governmental regulations and related state laws. These laws generally relate to potential obligations to remove or mitigate the environmental effects of the disposal or release of certain pollutants at the Company’s manufacturing facilities and at third-party or formerly owned sites at which contaminants generated by the Company may be located. This requires the Company to make capital and other expenses.
The Company is committed to achieving high standards of environmental quality and product safety, and strives to provide a safe and healthy workplace for its employees and others in the communities in which it operates. In an effort to comply with federal and state laws and regulations, the Company has programs in place that monitor compliance with various environmental regulations. However, in the normal course of its operations, the Company is subject to occasional governmental proceedings and orders pertaining to waste disposal, air emissions, and water discharges into the environment.
The Company believes that it is generally in compliance with applicable environmental regulations. However, the Company cannot assure that the outcome of any environmental proceedings and orders will not have a material adverse effect on the business.
Reliance on Two Facilities
The Newport, New Hampshire and Prescott, Arizona facilities are critical to the Company’s success. These facilities house the Company’s principal production, research, development, engineering, design, and shipping. Any event that causes a disruption of the operation of either of these facilities for even a relatively short period of time might have a material adverse affect on the Company’s ability to produce and ship products and to provide service to its customers.
ITEM 1B—UNRESOLVED STAFF COMMENTS
None
ITEM 2—PROPERTIES
The Company’s manufacturing operations are carried out at two facilities. The following table sets forth certain information regarding eachAvailability of these facilities:
| | | | | | | | |
| | Approximate | | | | |
| | Aggregate | | | | |
| | Usable | | | | |
| | Square Feet | | Status | | Segment |
| | |
Newport, New Hampshire | | | 350,000 | | | Owned | | Firearms/Castings |
Prescott, Arizona | | | 230,000 | | | Leased | | Firearms/Castings |
16
Each facility contains enclosed ranges for testing firearms and also contains modern tool room facilities. The lease of the Prescott facility provides for rental payments, which are approximately equivalent to estimated rates for real property taxes. The Company will consolidate its casting operations in its Newport, New Hampshire foundry in 2007.Raw Materials
The Company has other materially important facilities that were not used in its manufacturing operations in 2006:
| | | | | | | | |
| | Approximate | | | | |
| | Aggregate | | | | |
| | Usable | | | | |
| | Square Feet | | Status | | Segment |
| | |
Southport, Connecticut | | | 25,000 | | | Owned | | Corporate |
Newport, New Hampshire | | | 300,000 | | | Owned | | Shipping |
Prescott, Arizona | | | 120,000 | | | Owned | | Unused |
In 2005, the Company relocated its firearms shipping department into a portion of the 300,000 square foot facility in Newport, New Hampshire In 2006, certain of the Company’s sales department personnel were moved into a portion of the 300,000 square foot facility in Newport, New Hampshire.
The Company also has other real estate holdings that are not used in its manufacturing operations and are not materially important to the business of the Company. There are no mortgages or any other major encumbrance on any of the real estate owned by the Company. The Company plans to sell non-manufacturing real property assets that appear to have market values substantially in excess of their book values.
The Company’s principal executive offices are located in Southport, Connecticut. The Company believes that its existing facilities are suitable and adequate for its present purposes.
ITEM 3—LEGAL PROCEEDINGS
The nature of the legal proceedings against the Company is discussed at Note 6 to the financial statements included in this Form 10-K, which is incorporated herein by reference.
The Company has reported all cases instituted against it through September 30, 2006, and the results of those cases, where terminated, to the S.E.C. on its previous Form 10-Q and 10-K reports, to which reference is hereby made.
No cases were formally instituted against the Company during the three months ended December 31, 2006:
During the three months ending December 31, 2006, one previously reported case was settled:
| | | | | | |
| | Case NameKasting | | JurisdictionIndiana | | |
The settlement amount was within the Company’s limits of its self-insurance coverage.
For a description of all pending lawsuits against the Company through September 30, 2006, reference is made to the discussion under the caption “Item 1. LEGAL PROCEEDINGS” of the Company’s
17
Quarterly Reports on Form 10-Q for the quarters ended September 30, 1999, March 31 and September 30, 2000, and September 30, 2005.
ITEM 4—SUBMISSION OF MATTERS TO A VOTE OF SECURITY HOLDERS
None.
PART II
ITEM 5 — MARKET FOR REGISTRANT’S COMMON EQUITY, RELATED STOCKHOLDER MATTERS AND ISSUER PURCHASES OF EQUITY SECURITIES
The Company’s Common Stock is traded on the New York Stock Exchange under the symbol “RGR.” At February 1, 2007, the Company had 1,851 stockholders of record.
The following table sets forth, for the periods indicated, the high and low sales prices for the Common Stock as reported on the New York Stock Exchange and dividends paid on Common Stock.
| | | | | | | | | | | | | |
| | | | | | | | | | | Dividends | |
| | | High | | | Low | | | Per Share | |
| |
| 2005: | | | | | | | | | | | | |
| First Quarter | | $ | 8.83 | | | $ | 6.89 | | | $ | 0.10 | |
| Second Quarter | | | 8.50 | | | | 6.51 | | | | 0.10 | |
| Third Quarter | | | 11.19 | | | | 8.43 | | | | 0.10 | |
| Fourth Quarter | | | 9.20 | | | | 6.54 | | | | — | |
| | | | | | | | | | | | | |
| |
| 2006: | | | | | | | | | | | | |
| First Quarter | | $ | 8.03 | | | $ | 6.75 | | | | — | |
| Second Quarter | | | 7.78 | | | | 5.56 | | | | — | |
| Third Quarter | | | 7.85 | | | | 5.65 | | | | — | |
| Fourth Quarter | | | 10.78 | | | | 7.74 | | | | — | |
| | | | | | | | | | | | | |
| |
18
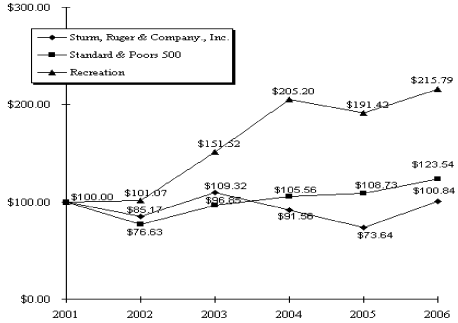
Comparison of Five-Year Cumulative Total Return*
Sturm, Ruger & Company, Inc., Standard & Poors 500 And
Value Line Recreation Index
(Performance Results Through 12/31/06)
Assumes $100 invested at the close of trading 12/01 in Sturm, Ruger & Company, Inc.
common stock, Standard & Poor 500, and Recreation Index.
*Cumulative total return assumes reinvestment of dividends.
Source: Value Line, Inc.
Factual material is obtained from sources believed to be reliable, but the publisher is not responsible for any errors or omissions contained herein.
| | | | | | | | | | | | | | | | | | | | | | | | | |
| | | 2001 | | | 2002 | | | 2003 | | | 2004 | | | 2005 | | | 2006 | |
Sturm, Ruger & Company, Inc. | | | 100.00 | | | | 85.17 | | | | 109.32 | | | | 91.56 | | | | 73.64 | | | | 100.84 | |
Standard & Poors 500 | | | 100.00 | | | | 76.63 | | | | 96.85 | | | | 105.56 | | | | 108.73 | | | | 123.54 | |
Recreation | | | 100.00 | | | | 101.07 | | | | 151.52 | | | | 205.20 | | | | 191.42 | | | | 215.79 | |
19
Securities Authorized for Issuance Under Equity Compensation Plans
The following table provides information regarding compensation plans under which equity securities of the Company are authorized for issuance as of December 31, 2006:
| | | | | | | | | |
| Equity Compensation Plan Information |
| | | | | | | | | Number of securities |
| | | | | | | | | remaining available for |
| | | | | | | | | future issuance under |
| | | | | | | Weighted-average | | equity compensation |
| | | Number of securities to be issued | | exercise price of | | plans (excluding |
| | | upon exercise of outstanding | | outstanding options, | | securities reflected in |
| | | options, warrants and rights | | warrants and rights | | column (a)) |
| Plan category | | (a) | | (b) | | (c) |
Equity compensation plans approved by security holders | | | | | | | | |
| | | | | | | | | |
| 1998 Stock Incentive Plan | | | 1,140,000 | | | $9.57 per share | | 860,000 |
| 2001 Stock Option Plan for Non-Employee Directors | | | 185,000 | | | $8.81 per share | | 15,000 |
| | | | | | | | | |
Equity compensation plans not approved by security holders | | | | | | | | |
| | | | | | | | | |
| None. | | | | | | | | |
| | | | | | | | | |
Total | | | 1,325,000 | | | $9.46 per share | | 875,000 |
| | | | | | | | | |
ITEM 6—SELECTED FINANCIAL DATA
(Dollars in thousands, except per share data)
| | | | | | | | | | | | | | | | | | | | | |
| | | December 31, | |
| | | 2006 | | | 2005 | | | 2004 | | | 2003 | | | 2002 | |
| |
| Net firearms sales | | $ | 139,110 | | | $ | 132,805 | | | $ | 124,924 | | | $ | 130,558 | | | $ | 139,762 | |
| Net castings sales | | | 28,510 | | | | 21,917 | | | | 20,700 | | | | 17,359 | | | | 21,825 | |
| |
| Total net sales | | | 167,620 | | | | 154,722 | | | | 145,624 | | | | 147,917 | | | | 161,587 | |
| |
| Cost of products sold | | | 143,382 | | | | 128,343 | | | | 115,725 | | | | 113,189 | | | | 125,376 | |
| Gross profit | | | 24,238 | | | | 26,379 | | | | 29,899 | | | | 34,728 | | | | 36,211 | |
| Income before income taxes | | | 1,843 | | | | 1,442 | | | | 8,051 | | | | 20,641 | | | | 14,135 | |
| Income taxes | | | 739 | | | | 578 | | | | 3,228 | | | | 8,277 | | | | 5,668 | |
| Net income | | | 1,104 | | | | 864 | | | | 4,823 | | | | 12,364 | | | | 8,467 | |
| Basic and diluted earnings per share | | | 0.04 | | | | 0.03 | | | | 0.18 | | | | 0.46 | | | | 0.31 | |
| Cash dividends per share | | $ | 0.00 | | | $ | 0.30 | | | $ | 0.60 | | | $ | 0.80 | | | $ | 0.80 | |
20
| | | | | | | | | | | | | | | | | | | | | |
| | | December 31, | |
| | | 2006 | | | 2005 | | | 2004 | | | 2003 | | | 2002 | |
| Working capital | | $ | 60,522 | | | $ | 83,522 | | | $ | 90,947 | | | $ | 102,715 | | | $ | 103,116 | |
| Total assets | | | 117,066 | | | | 139,639 | | | | 147,460 | | | | 162,873 | | | | 183,958 | |
| Total stockholders’ equity | | | 87,326 | | | | 111,578 | | | | 120,687 | | | | 133,640 | | | | 137,983 | |
| Book value per share | | $ | 3.86 | | | $ | 4.15 | | | $ | 4.48 | | | $ | 4.97 | | | $ | 5.13 | |
| Return on stockholders’ equity | | | 1.3 | % | | | 0.8 | % | | | 4.0 | % | | | 9.3 | % | | | 6.1 | % |
| Current ratio | | | 3.8 to 1 | | | | 5.5 to 1 | | | | 5.7 to 1 | | | | 5.7 to 1 | | | | 4.8 to 1 | |
| Common shares outstanding | | | 22,638,700 | | | | 26,910,700 | | | | 26,910,700 | | | | 26,910,700 | | | | 26,910,700 | |
| Number of stockholders of record | | | 1,851 | | | | 1,922 | | | | 1,977 | | | | 2,036 | | | | 2,026 | |
| Number of employees | | | 1,108 | | | | 1,250 | | | | 1,291 | | | | 1,251 | | | | 1,418 | |
ITEM 7—MANAGEMENT’S DISCUSSION AND ANALYSIS OF FINANCIAL CONDITION AND RESULTS OF OPERATIONS
Company Overview
Sturm, Ruger & Company, Inc. (the “Company”) is principally engaged in the design, manufacture, and sale of firearms and precision investment castings. The Company’s design and manufacturing operations are located in the United States. Substantially all sales are domestic. The Company’s firearms are sold through a select number of independent wholesale distributors principally to the commercial sporting market.
Investment castings are manufactured from titanium and steel alloys. Investment castings are sold either directly to or through manufacturers’ representatives to companies in a wide variety of industries. In July 2006, the Company announced the cessation of titanium castings operations, which is expected to be completed in the first quarter of 2007. The Company will consolidate its casting operations in its New Hampshire foundry in 2007. The Company continues to manufacture and sell steel investment castings for a wide variety of customers and end uses.
Because many of the Company’s competitors are not subject to public filing requirements and industry-wide data is generally not available in a timely manner, the Company is unable to compare its performance to other companies or specific current industry trends. Instead, the Company measures itself against its own historical results.
The Company does not consider its overall firearms business to be predictably seasonal; however, sales of certain models of firearms are usually lower in the third quarter of the year.
Results of Operations
Year ended December 31, 2006, as compared to year ended December 31, 2005:
Sales
Consolidated net sales were $167.6 million in 2006. This represents an increase of $12.9 million or 8.3% from 2005 consolidated net sales of $154.7 million.
Firearms segment net sales were $139.1 million in 2006. This represents an increase of $6.3 million or 4.7% from 2005 firearm net sales of $132.8 million.
21
Firearms unit shipments increased 3% in 2006 due to increased shipments of revolvers, partially offset by a decline in shipments of shotguns, pistols, and rifles. The increase in revolver shipments for 2006 is due to greater availability of revolver models in stronger demand. The decrease in shotgun shipments is due to decreased availability of the side-by-side shotgun, while the decrease in pistol shipments in 2006 appears to reflect a softening of demand as well as the shipment of 5,000 KP95D pistols to the U.S. Army and Tank-automotive and Armaments Command in January of 2005. The decrease in rifle shipments is the result of an apparent softening of demand. A modest price increase and a shift in product mix toward firearms with greater unit sales prices resulted in the greater percentage increase in sales than unit shipments. Effective January 1, 2006, the Company instituted a unilateral minimum distributor resale price policy for its firearms which remains in effect. This change in policy does not appear to have had an adverse effect on the Company’s firearm sales.
Casting segment net sales were $28.5 million in 2006. This represents an increase of $6.6 million or 30.1% from 2005 casting sales of $21.9 million.
The casting sales increase was due primarily to the acceleration of titanium shipments related to the cessation of titanium casting operations, as previously announced by the Company in July 2006. Shipments of titanium castings are expected to conclude in the first quarter of 2007. Titanium casting sales accounted for $16.2 million or 56% of casting sales in 2006. The Company continues to manufacture and sell steel investment castings for a wide variety of customers and end uses.
Cost of Products Sold and Gross Margin
Consolidated cost of products sold was $143.4 million in 2006. This represents an increase of $15.1 million or 11.7% from 2005 consolidated cost of products sold of $128.3 million.
The gross margin as a percent of sales was 14.5% in 2006. This represents a decline from the 2005 gross margin of 17.0% as illustrated below:
| | | | | | | | | | | | | | | | | |
| | | December 31, | |
| | | 2006 | | | 2005 | |
| Net sales | | $ | 167,620 | | | | 100.0 | % | | $ | 154,722 | | | | 100.0 | % |
| | | | | | | | | | | | | | | | | |
| Total cost of products sold, before LIFO and overhead rate inventory adjustments and product liability (Note 1) | | | 139,070 | | | | 83.0 | % | | | 124,715 | | | | 80.6 | % |
| | | | | | | | | | | | | |
| | | | | | | | | | | | | | | | | |
| Gross margin before LIFO and overhead rate inventory adjustments and product liability | | | 28,550 | | | | 17.0 | % | | | 30,007 | | | | 19.4 | % |
| | | | | | | | | | | | | |
| | | | | | | | | | | | | | | | | |
| LIFO and overhead rate inventory adjustments and product liability (Note 2) | | | 4,312 | | | | 2.5 | % | | | 3,628 | | | | 2.4 | % |
| | | | | | | | | | | | | |
| |
| Gross margin | | $ | 24,238 | | | | 14.5 | % | | $ | 26,379 | | | | 17.0 | % |
| | | | | | | | | | | | | |
22
| | |
| | Note 1: Gross margin before inventory adjustments and product liability was favorably impacted by stronger sales, and was adversely impacted by an excess and obsolete inventory charge of $3.2 million, compared to $0.5 million in 2005. The impact of the excess and obsolete inventory charge was 1.9% of sales in 2006 as compared to 0.3% of sales in 2005. |
|
| | Note 2: Gross margin was favorably impacted by a LIFO liquidation of $7.1 million and a reduction in product liability of $2.4 million, and was adversely impacted by a reduction in inventory value of $2.9 million related to overhead rate changes. |
Excess and Obsolete Inventory—In prior years, the Company received one cancelable annual order in December from each of its distributors. Effective December 1, 2006 the Company changed the manner in which distributors order firearms, and began receiving firm, non-cancelable purchase orders on a frequent basis, with most orders for immediate delivery. In the past, the Company adjusted production schedules to consume on-hand raw material and WIP inventories, regardless of customer demand for the finished goods so produced. This practice led to increased investment in inventory, and an unbalanced finished goods inventory.
Consistent with the change in the manner in which distributors order from the Company, the Company significantly changed its production scheduling philosophy from an annual production cycle to a customer-demand pull system in the fourth quarter of 2006. Under the Company’s new system, production is driven solely by customer demand. The Company is committed to producing the firearms demanded by its customers and does not alter its production mix to achieve the short-sighted goal of producing finished goods in excess of customer requirements for the purpose of consuming excess or slow-moving raw material and WIP parts, components, or subassemblies, or absorbing overhead expense. This change to a customer-demand pull system should result in a better match between production and customer demand and is likely to result in further reduction in inventories.
As a result of this new production philosophy, it is apparent the Company has inventory in excess of its needs over the foreseeable future. Given ever-changing market conditions, customer preferences and the anticipated introduction of new products, the Company concluded that it was not prudent nor supportable to carry inventory at full cost beyond that needed during the next 36 months. Therefore the Company evaluated the adequacy of the excess and obsolescence inventory reserve and concluded that additional reserves were required to reflect the estimated recoverable value of excess inventories below LIFO carrying cost. The required reserve was estimated based on the following parameters, and resulted in an excess and obsolete expense of $3.2 million and a reserve balance of $5.5 million:
| | | | | |
| Projected Year | | Required |
| Of Consumption | | Reserve % |
| 2007 | | | 2 | % |
| 2008 | | | 10 | % |
| 2009 | | | 35 | % |
| 2010 and thereafter | | | 90 | % |
23
LIFO—During 2006, gross inventories were reduced by $24.0 million. This reduction resulted in a liquidation of LIFO inventory quantities carried at lower costs that prevailed in prior years as compared with the current cost of purchases, the effect of which decreased costs of products sold by approximately $7.1 million. There was no LIFO liquidation in 2005.
The table below summarizes estimated LIFO impacts on the 2007 cost of products sold if further inventory reduction is realized, which represent potential LIFO liquidation amounts partially offset by estimated 2007 LIFO expenses. This is the amount by which costs of products sold might decrease and operating profit might increase in 2007. These estimates are based on potential levels of inventory reduction and possible 2007 LIFO indices (in thousands):
| | | | | | | | | | | | | | | | | |
| Estimated 2007 LIFO Index Range |
| |
| Inventory Reduction | | | 3 | % | | | 4 | % | | | 5 | % | | | 6 | % |
| |
| $10 million | | $ | 2,200 | | | $ | 1,900 | | | $ | 1,600 | | | $ | 1,400 | |
| $20 million | | | 8,300 | | | | 8,100 | | | | 7,900 | | | | 7,600 | |
| $30 million | | | 14,700 | | | | 14,500 | | | | 14,300 | | | | 14,200 | |
Reduction in inventory will generate positive cash flow for the Company, partially offset by the tax impact of a LIFO liquidation, which will generate negative cash flow as it creates taxable income, resulting in higher tax payments.
Product Liability—During the years ended December 31, 2006 and 2005, the Company incurred product liability expense of $2.5 million and $4.9 million, respectively, which includes the cost of outside legal fees, insurance, and other expenses incurred in the management and defense of product liability matters. See Footnote 6 “Contingent Liabilities” for further discussion of the Company’s product liability.
Overhead Rate Change—The change in inventory value in 2006 was a reduction of $2.9 million, which recognized progress made in lowering overhead rates during 2006. The change in inventory value in 2005 was an increase of $6.8 million, which recognized increasing overhead rates in 2005. The impact of the change in inventory value on gross margin was (1.8%) of sales in 2006 as compared to 4.4% of sales in 2005. The year-over-year impact of overhead rate changes on gross margin was a reduction of gross margin of $9.8 million, or 6.2% of sales.
Fourth Quarter Charges—In the fourth quarter of 2006, a $2.5 million non-cash inventory valuation adjustment, net of the LIFO impact, was recorded to recognize inefficiencies in labor and overhead during a period of rapid inventory reduction as the Company converted to a manufacturing system that emphasizes continuous improvement in customer service, quality and productivity. This over-absorption of labor and overhead was quantified by a physical inventory taken in the fourth quarter.
Due to the timing of the physical inventory, the Company was unable to quantify the impact of this delayed recognition of labor and overhead efficiencies, if any, on the financial results of prior quarters. As a consequence, raw material and work in process physical inventories are being performed at the end of each quarter until a permanent corrective action is established and determined to be adequate, making these physical inventories unnecessary.
The asset impairment charge of $0.5 million relates primarily to certain underutilized non-manufacturing real property assets whose net book value exceeds current market value.
24
Selling, General and Administrative
Selling, general and administrative expenses were $24.0 million in 2006. This represents a decrease of $0.5 million or 2.1% from 2005 selling, general and administrative expenses of $24.5 million. The decrease reflects a reduction in advertising and sales promotion expenses, partially offset by increased personnel-related expenses including $0.7 million related to the retirement of the former Chairman and Chief Executive Officer.
Other Income
Other income-net was $2.1 million in 2006. This represents an increase of $2.0 million from 2005 other income-net of $0.1 million. The increase is attributable to the gain on the sale of excess casting machinery and equipment and the sale of certain non-manufacturing real estate in 2006.
Income Taxes and Net Income
The effective income tax rate of 40.1% in 2006 remained consistent with the income tax rate in 2005.
As a result of the foregoing factors, consolidated net income was $1.1 million in 2006. This represents an increase of $0.2 million or 27.8% from 2005 consolidated net income of $0.9 million.
Results of Operations
Year ended December 31, 2005, as compared to year ended December 31, 2004:
Consolidated net sales of $154.7 million were achieved by the Company in 2005 representing an increase of $9.1 million or 6.2% from net sales of $145.6 million in 2004.
Firearms segment net sales increased by $7.9 million or 6.3% to $132.8 million in 2005 from $124.9 million in the prior year. Firearms unit shipments for 2005 increased 1.1% from 2004, as the increase in shipments of pistols and shotguns was largely offset by the decline in shipments of rifles and revolvers. The increase in pistol shipments in 2005 is attributable to the new Mark III pistols and the P345 centerfire pistols. In 2004, rifle shipments benefited from the popularity of the 40th Anniversary 10/22 carbine, which was available only in 2004. A modest price increase and a change in mix from lower priced products to higher priced resulted in the greater increase in sales versus unit shipments.
In 2005, the Company offered a sales incentive program for its distributors which allowed them to earn rebates of up to 1.5% if certain annual overall sales targets were achieved. This program replaced a similar sales incentive program in 2004. Effective January 1, 2006, the Company instituted a unilateral minimum distributor resale price policy for its firearms.
Casting segment net sales increased 5.8% to $21.9 million in 2005 from $20.7 million in 2004 as a result of higher unit volume. Increased sales were generated from existing customers as well as several new customers in 2005, in a variety of industries.
Consolidated cost of products sold for 2005 was $128.3 million compared to $115.7 million in 2004, representing and increase of 10.9%. This increase of $12.5 million was primarily attributable to increased sales, and increased unitary overhead expenses resulting from a reduction in firearm production volume, and increased product liability costs.
25
Gross profit as a percentage of net sales decreased to 17.0% in 2005 from 20.5% in 2004. This deterioration was caused by less efficient firearms production due to lower rates of firearm production, increased product liability expenses, and was partially offset by more efficient production in the castings segment.
Selling, general and administrative expenses increased 7.3% to $24.5 million in 2005 from $22.9 million in 2004 due principally to severance costs associated with several employee actions taken predominantly in the fourth quarter of 2005.
Total other income decreased from $1.0 million in 2004 to $0.1 million in 2005. Included in total other income in 2004 was a $0.9 million gain from the sale of the property and building that housed the Company’s Uni-Cast division prior to its sale in 2000. The Company’s earnings on short-term investments increased in 2005 as a result of more favorable interest rates, partially offset by reduced principal.
The effective income tax rate of 40.1% remained consistent in 2005 and 2004.
As a result of the foregoing factors, consolidated net income in 2005 decreased to $0.9 million from $4.8 million in 2004, representing a decrease of $3.9 million or 81.8%.
Financial Condition
Operations
At December 31, 2006, the Company had cash, cash equivalents and short-term investments of $29.3 million. The Company’s working capital of $118.1 million, less the LIFO reserve of $57.6 million, results in working capital of $60.5 million and a current ratio of 3.8 to 1.
Cash provided by operating activities was $30.2 million, $5.2 million, and $1.3 million in 2006, 2005, and 2004, respectively. The increase in cash provided in 2006 compared to 2005 is principally a result of a decrease in inventory and various fluctuations in operating asset and liability accounts during 2006 compared to 2005. The increase in cash provided by operations in 2005 compared to 2004 is primarily attributable to the decrease in inventories and trade receivables in 2005 compared to an increase in inventories and receivables in 2004, partially offset by the decline in net income.
Third parties supply the Company with various raw materials for its firearms and castings, such as fabricated steel components, walnut, birch, beech, maple and laminated lumber for rifle and shotgun stocks, wax, ceramic material, metal alloys, various synthetic products and other component parts. There is a limited supply of these materials in the marketplace at any given time, which can cause the purchase prices to vary based upon numerous market factors. The Company believes that it has adequate quantities of raw materials in inventory to provide ample time to locate and obtain additional items at then-current market cost without interruption of its manufacturing operations. However, if market conditions result in a significant prolonged inflation of certain prices or if adequate quantities of raw materials can not be obtained, the Company’s manufacturing processes could be interrupted and the Company’s financial condition or results of operations could be materially adversely affected.
26
Investing
ITEM 1B—UNRESOLVED STAFF COMMENTS
None
The Company’s manufacturing operations are carried out at two facilities. The following table sets forth certain information regarding each of these facilities:
| Approximate Aggregate Usable Square Feet | Status | Segment |
| | | |
| Newport, New Hampshire | 350,000 | Owned | Firearms/Castings |
| Prescott, Arizona | 230,000 | Leased | Firearms |
Each facility contains enclosed ranges for testing firearms and Financing
Capital expendituresalso contains modern tool room facilities. The lease of the Prescott facility provides for rental payments, which are approximately equivalent to estimated rates for real property taxes. The Company consolidated its casting operations in 2006 totaled $3.9 million. Forits Newport, New Hampshire foundry in 2007.
The Company has four other facilities that were not used in its manufacturing operations in 2009:
| Approximate Aggregate Usable Square Feet | Status | Segment |
| | | |
| Southport, Connecticut (Station Street property) | 5,000 | Owned | Not Utilized |
Southport, Connecticut (Lacey Place property) | 25,000 | Owned | Corporate |
Newport, New Hampshire (Dorr Woolen Building)(a) | 45,000 | Owned | Firearms |
| Enfield, Connecticut | 10,000 | Leased | Firearms |
| (a) | In 2005, the Company relocated its firearms shipping department into a portion of the Dorr Woolen Building. In 2006, certain of the Company’s sales department personnel were moved into the same facility. Approximately 255,000 square feet of the Dorr Woolen Building was demolished in the fall of 2009. |
There are no mortgages or any other major encumbrance on any of the real estate owned by the Company.
The Company’s principal executive offices are located in Southport, Connecticut. The Company believes that its existing facilities are suitable and adequate for its present purposes.
The nature of the legal proceedings against the Company is discussed at Note 17 to this Form 10-K report, which is incorporated herein by reference.
The Company has reported all cases instituted against it through October 3, 2009, and the results of those cases, where terminated, to the SEC on its previous Form 10-Q and 10-K reports, to which reference is hereby made.
One case was formally instituted against the Company during the three months ending December 31, 2009:
On October 9, 2009, the Company waived service of a complaint captioned Alan R. Herrett, Individually and On Behalf of All Others Similarly Situated v. Sturm, Ruger & Co., Inc., et al. pending in the United States District Court for the District of Connecticut. This matter is based upon the same facts and basic allegations set forth in the previously reported Steamfitters 449 Local Pension Fund on Behalf of Itself and All Others Similarly Situated v. Sturm, Ruger & Co., Inc., et al. On October 12, 2009, a motion to consolidate the two actions was filed by counsel for the Steamfitters. On January 11, 2010, the court entered an order consolidating the two matters. The January 11, 2010 order also sets a briefing schedule for plaintiffs to file a consolidated amended complaint and for defendants, including the Company, to file a responsive pleading.
During the three months ending December 31, 2009, no previously reported cases were settled.
ITEM 4—SUBMISSION OF MATTERS TO A VOTE OF SECURITY HOLDERS
None.
| ITEM 5— | MARKET FOR REGISTRANT'S COMMON EQUITY, RELATED STOCKHOLDER MATTERS AND ISSUER PURCHASES OF EQUITY SECURITIES |
The Company’s Common Stock is traded on the New York Stock Exchange under the symbol “RGR.” At February 1, 2010, the Company had 1,834 stockholders of record.
The following table sets forth, for the periods indicated, the high and low sales prices for the Common Stock as reported on the New York Stock Exchange and dividends paid on Common Stock.
| | | High | | | Low | | | Dividends Per Share | |
| 2008: | | | | | | | | | |
| First Quarter | | $ | 9.32 | | | $ | 7.32 | | | | - | |
| Second Quarter | | | 8.88 | | | | 6.95 | | | | - | |
| Third Quarter | | | 7.84 | | | | 5.60 | | | | - | |
| Fourth Quarter | | | 7.44 | | | | 4.36 | | | | - | |
| | | | | | | | | | | | | |
| 2009: | | | | | | | | | | | | |
| First Quarter | | $ | 13.06 | | | $ | 5.98 | | | | - | |
| Second Quarter | | | 13.71 | | | | 10.08 | | | $ | 0.086 | |
| Third Quarter | | | 15.20 | | | | 11.16 | | | | 0.123 | |
| Fourth Quarter | | | 13.70 | | | | 9.61 | | | | 0.096 | |
| | | | | | | | | | | | | |
Issuer Repurchase of Equity Securities
None.
| Comparison of Five-Year Cumulative Total Return* |
| Sturm, Ruger & Co., Inc., Standard & Poor’s 500,Recreation And Value Line Smith & Wesson Holding Index |
| (Performance Results Through 12/31/09) |
Assumes $100 invested at the close of trading 12/04 in Sturm, Ruger & Co., Inc. common stock, Standard & Poor’s 500, Recreation, and Smith & Wesson Holding.
*Cumulative total return assumes reinvestment of dividends.
Source: Value Line, Inc.
Factual material is obtained from sources believed to be reliable, but the publisher is not responsible for any errors or omissions contained herein.
| | | 2004 | | | 2005 | | | 2006 | | | 2007 | | | 2008 | | | 2009 | |
| Sturm, Ruger & Co., Inc. | | | 100.00 | | | | 80.42 | | | | 110.13 | | | | 94.99 | | | | 68.49 | | | | 114.33 | |
| Standard & Poor’s 500 | | | 100.00 | | | | 103.00 | | | | 117.03 | | | | 121.16 | | | | 74.53 | | | | 92.01 | |
| Recreation | | | 100.00 | | | | 93.29 | | | | 105.16 | | | | 93.87 | | | | 59.33 | | | | 97.11 | |
| Smith & Wesson Holding | | | 100.00 | | | | 224.57 | | | | 590.86 | | | | 348.57 | | | | 129.71 | | | | 233.71 | |
Securities Authorized for Issuance Under Equity Compensation Plans
The following table provides information regarding compensation plans under which equity securities of the Company are authorized for issuance as of December 31, 2009:
| Equity Compensation Plan Information |
| Plan category | Number of securities to be issued upon exercise of outstanding options, warrants and rights (a) | Weighted-average exercise price of outstanding options, warrants and rights (b) * | Number of securities remaining available for future issuance under equity compensation plans (excluding securities reflected in column (a)) (c) |
Equity compensation plans approved by security holders | | | |
| 1998 Stock Incentive Plan | 590,000 | $7.78 per share | - |
| 2001 Stock Option Plan for Non-Employee Directors | 160,000 | $8.60 per share | - |
| 2007 Stock Incentive Plan | 808,250 | $10.04 per share | 1,733,750 |
Equity compensation plans not approved by security holders | | | |
| None. | | | |
| Total | 1,558,250 | $9.00 per share | 1,733,750 |
| * | Restricted stock units are settled in shares of the Company's common stock on a one-for-one basis. Accordingly, such units have been excluded for purposes of computing the weighted-average exercise price." |
ITEM 6—SELECTED FINANCIAL DATA
| (Dollars in thousands, except per share data) | |
| | | December 31, | |
| | | 2009 | | | 2008 | | | 2007 | | | 2006 | | | 2005 | |
| Net firearms sales | | $ | 266,566 | | | $ | 174,416 | | | $ | 144,222 | | | $ | 139,110 | | | $ | 132,805 | |
| Net castings sales | | | 4,419 | | | | 7,067 | | | | 12,263 | | | | 28,510 | | | | 21,917 | |
| Total net sales | | | 270,985 | | | | 181,483 | | | | 156,485 | | | | 167,620 | | | | 154,722 | |
| Cost of products sold | | | 183,380 | | | | 138,730 | | | | 117,186 | | | | 139,610 | | | | 124,826 | |
| Gross profit | | | 87,605 | | | | 42,753 | | | | 39,299 | | | | 28,010 | | | | 29,896 | |
| Income before income taxes | | | 44,360 | | | | 13,978 | | | | 16,659 | | | | 1,843 | | | | 1,442 | |
| Income taxes | | | 16,857 | | | | 5,312 | | | | 6,330 | | | | 739 | | | | 578 | |
| Net income | | $ | 27,503 | | | $ | 8,666 | | | $ | 10,329 | | | $ | 1,104 | | | $ | 864 | |
| Basic and diluted earnings per share | | | 1.44 | | | | 0.43 | | | | 0.46 | | | | 0.04 | | | | 0.03 | |
| Cash dividends per share | | $ | 0.31 | | | $ | 0.00 | | | $ | 0.00 | | | $ | 0.00 | | | $ | 0.30 | |
| | | | |
| | | 2009 | | | 2008 | | | 2007 | | | 2006 | | | 2005 | |
| Working capital | | $ | 65,377 | | | $ | 46,250 | | | $ | 53,264 | | | $ | 60,522 | | | $ | 83,522 | |
| Total assets | | | 141,679 | | | | 112,760 | | | | 101,882 | | | | 117,066 | | | | 139,639 | |
| Total stockholders’ equity | | | 95,516 | | | | 65,603 | | | | 76,069 | | | | 87,326 | | | | 111,578 | |
| Book value per share | | $ | 5.01 | | | $ | 3.44 | | | $ | 3.57 | | | $ | 3.86 | | | $ | 4.15 | |
| Return on stockholders’ equity | | | 34.1 | % | | | 12.2 | % | | | 12.6 | % | | | 1.3 | % | | | 0.8 | % |
| Current ratio | | 3.0 to 1 | | | 2.6 to 1 | | | 3.6 to 1 | | | 3.8 to 1 | | | 5.5 to 1 | |
| Common shares outstanding | | | 19,072,800 | | | | 19,047,300 | | | | 20,571,800 | | | | 22,638,700 | | | | 26,910,700 | |
| Number of stockholders of record | | | 1,827 | | | | 1,841 | | | | 1,769 | | | | 1,851 | | | | 1,922 | |
| Number of employees | | | 1,145 | | | | 1,145 | | | | 1,154 | | | | 1,108 | | | | 1,250 | |
| MANAGEMENT'S DISCUSSION AND ANALYSIS OF FINANCIAL CONDITION AND RESULTS OF OPERATIONS |
Company Overview
Sturm, Ruger & Company, Inc. (the “Company”) is principally engaged in the design, manufacture, and sale of firearms to domestic customers. Approximately 98% of the Company’s total sales for 2009 were firearms sales, and 2% were investment castings sales. Export sales represent less than 4% of total sales. The Company’s design and manufacturing operations are located in the United States and almost all product content is domestic. The Company’s firearms are sold through a select number of independent wholesale distributors, principally to the commercial sporting market.
The Company manufactures investment castings made from steel alloys for internal use in its firearms and utilizes excess investment casting capacity to manufacture and sell castings to unaffiliated, third-party customers.
Because most of the Company’s competitors are not subject to public filing requirements and industry-wide data is generally not available in a timely manner, the Company is unable to compare its performance to other companies or specific current industry trends. Instead, the Company measures itself against its own historical results.
The Company does not consider its overall firearms business to be predictably seasonal; however, sales of many models of firearms are usually lower in the third quarter of the year.
| Results of Operations - 2009 |
Incoming unit orders in 2009 increased 23% from 2008, and 98% from 2007. The extraordinary retail demand that began in the latter months of 2008 caused independent distributors to place very large orders for our products in 2009, particularly during the first half of the year when orders from distributors substantially exceeded their sales of our products to retailers. This resulted in the Company having an abnormally large backlog of unshipped distributor orders throughout 2009.
The Company has temporarily placed less emphasis on incoming orders as a proxy for market demand. Instead, the Company is using the following estimate of sell-through of our products from distributors to retailers as a proxy for actual market demand and as a metric for planning production. Note, however, that we believe a portion of the 2009 sell-through from distributors to retailers resulted in an inventory build at retail rather than sales from retailers to consumers.
| | | 2009 | | | 2008 | | | 2007 | |
| | | | | | | | | | |
| Units Ordered | | | 958,700 | | | | 776,400 | | | | 485,000 | |
| | | | | | | | | | | | | |
| Estimated Units Sold from Distributors to Retailers (1) | | | 887,400 | | | | 631,000 | | | | 476,900 | |
| | | | | | | | | | | | | |
| Units on Backorder | | | 181,000 | | | | 175,900 | | | | 36,500 | |
| (1) | The estimates for each period were calculated by taking the beginning inventory at the distributors, plus shipments from the Company to distributors during the period, less the ending inventory at distributors. These estimates are only a proxy for actual market demand as they: |
| · | Rely on data provided by independent distributors that are not verified by the Company, |
| · | Do not consider potential timing issues within the distribution channel, including goods-in-transit, and |
| · | Do not consider fluctuations in inventory at retail. |
Estimated sell-through of our products from distributors to retail in 2009 increased by approximately 40% from 2008, and 86% from 2007. This annual growth substantially exceeds the 10% and 25% growth in National Instant Criminal Background Check System (NICS*) background checks over the same periods. This suggests the likelihood of market share gain by the Company during the past two years, and was the result of the introduction of new products and increased production and shipments of legacy products. The total number of NICS background checks for the past three years capital expenditures averaged approximately $5.1follows:
Number of NICS* background checks (in 000’s)
| | | 2009 | | | 2008 | | | 2007 | |
| | | | | | | | | | |
Total NICS* Background Checks | | | 14,000 | | | | 12,700 | | | | 11,200 | |
| * | While NICS background checks are not a precise measure of retail activity, they are commonly used as a proxy for retail demand. NICS background checks are performed when the ownership of most firearms, either new or used, is transferred by a Federal Firearms Licensee. NICS background checks are also performed for permit applications, permit renewals, and other administrative reasons. |
Annual Summary Unit Data
Firearms unit data for orders, production, shipments and backorders follows:
| | | 2009 | | | 2008 | | | 2007 | |
| | | | | | | | | | |
| Units Ordered | | | 958,700 | | | | 776,400 | | | | 485,000 | |
| | | | | | | | | | | | | |
| Units Produced | | | 934,200 | | | | 600,600 | | | | 464,900 | |
| | | | | | | | | | | | | |
| Units Shipped | | | 925,800 | | | | 626,500 | | | | 481,800 | |
| | | | | | | | | | | | | |
| Average Sales Price | | $ | 288 | | | $ | 278 | | | $ | 299 | |
| | | | | | | | | | | | | |
| Units on Backorder | | | 181,000 | | | | 175,900 | | | | 36,500 | |
The Company’s finished goods unit inventory levels increased slightly in 2009 from the recent historic low levels at the end of 2008. Strong consumer demand drove down inventories at both the Company and distributors in 2008. Increased production and shipments to distributors allowed for the replenishment of inventory at distributors, and to a lesser extent at the Company, during the latter months of 2009. Inventory data follows:
| | | December 31, | |
| | | 2009 | | | 2008 | | | 2007 | |
Units – Company Inventory | | | 20,100 | | | | 12,400 | | | | 38,300 | |
| | | | | | | | | | | | | |
| Units – Distributor Inventory (2) | | | 96,200 | | | | 57,500 | | | | 62,000 | |
| | | | | | | | | | | | | |
| Total inventory(3) | | | 116,300 | | | | 69,900 | | | | 100,300 | |
| (2) | Distributor ending inventory as provided by the independent distributors of the Company’s products. These numbers do not include goods-in-transit inventory that has been shipped from the Company but not yet received by the distributors. |
| (3) | This total does not include inventory at retailers. The Company does not have access to data on retailer inventories. |
Orders Received and Ending Backlog
(in millions except average sales price, including Federal Excise Tax):
| | | 2009 | | | 2008 | | | 2007 | |
| | | | | | | | | | |
| Orders Received | | $ | 299.4 | | | $ | 233.8 | | | $ | 156.4 | |
| | | | | | | | | | | | | |
| Average Sales Price of Orders Received (4) | | $ | 312 | | | $ | 301 | | | $ | 322 | |
| | | | | | | | | | | | | |
| Ending Backlog | | $ | 59.6 | | | $ | 47.8 | | | $ | 17.9 | |
| | | | | | | | | | | | | |
| Average Sales Price of Ending Backlog (4) | | $ | 330 | | | $ | 269 | | | $ | 444 | |
| (4) | Average sales price for orders received and ending backlog is net of Federal Excise Tax of 10% for handguns and 11% for long guns. |
The increase in orders received and the ending backlog is due to the strong demand for new products and the increase in overall market demand that started in late 2008.
In 2009, the average sales price of orders received and ending backlog increased from 2008 due to a significant increase in orders for certain higher-priced rifles, including the SR-556, which was introduced in 2009.
In 2008, the average sales price of orders received and ending backlog decreased from 2007 due to:
| · | the large quantity of new handgun products in the backlog with lower unit sales prices, and |
| · | the cancellation of $3.7 million of orders for Gold Label side-by-side shotguns with higher unit sales prices, that were received prior to 2008. |
Production
Production rates, which started to increase late in 2007, continued to improve throughout 2008 and 2009. In response to the significant increase in demand in 2009, the Company increased production in 2009 by 56% from 2008 and 101% from 2007.
This increased production was facilitated by the Company’s implementation of lean manufacturing, an ongoing process that started in 2006, including:
| · | transitioning from large-scale batch production to lean manufacturing, |
| · | establishing single-piece flow cells for small parts manufacturing, |
| · | refining existing cells, |
| · | developing pull systems and managing vendors, |
| · | increasing capacity for the products with the greatest unmet demand, and |
| · | re-engineering existing product designs for improved manufacturability. |
Year ended December 31, 2009, as compared to year ended December 31, 2008:
Sales
Consolidated net sales were $271.0 million per year.in 2009. This represents an increase of $89.5 million or 49.3% from 2008 consolidated net sales of $181.5 million.
Firearms segment net sales were $266.6 million in 2009. This represents an increase of $92.2 million or 52.8% from 2008 firearm net sales of $174.4 million. Firearms unit shipments increased 47.8% in 2009 due to increased shipments of pistols, rifles and revolvers. This increase is attributable to the introduction of new products in 2009, increased production of mature products, and increased overall industry demand. A shift in product mix toward firearms with higher unit sales prices, including some new products, resulted in the relatively lower percentage increase in unit shipments compared to the percentage increase in sales.
Casting segment net sales were $4.4 million in 2009. This represents a decrease of $2.7 million or 37.5% from 2008 casting sales of $7.1 million.
Cost of Products Sold and Gross Margin
Consolidated cost of products sold was $183.4 million in 2009. This represents an increase of $44.7 million or 32.2% from 2008 consolidated cost of products sold of $138.7 million.
The gross margin as a percent of sales was 32.3% in 2009. This represents an increase from the 2008 gross margin of 23.6% as illustrated below:
(in thousands)
| Year Ended December 31 | | 2009 | | | 2008 | |
| | | | | | | | | | | | | |
| Net sales | | $ | 270,985 | | | | 100.0 | % | | $ | 181,483 | | | | 100.0 | % |
| | | | | | | | | | | | | | | | | |
| Cost of products sold, before LIFO, overhead and labor rate adjustments to inventory, product liability and product recall | | | 183,540 | | | | 67.7 | % | | | 136,172 | | | | 75.0 | % |
| | | | | | | | | | | | | | | | | |
| LIFO expense (income) | | | (4,216 | ) | | | (1.6 | )% | | | 781 | | | | 0.4 | % |
| | | | | | | | | | | | | | | | | |
| Overhead rate adjustments to inventory | | | 1,324 | | | | 0.5 | % | | | (1,389 | ) | | | (0.7 | )% |
| | | | | | | | | | | | | | | | | |
| Labor rate adjustments to inventory | | | 436 | | | | 0.2 | % | | | (1,251 | ) | | | (0.7 | )% |
| | | | | | | | | | | | | | | | | |
| Product liability | | | 1,618 | | | | 0.6 | % | | | 915 | | | | 0.5 | % |
| | | | | | | | | | | | | | | | | |
| Product recalls | | | 678 | | | | 0.3 | % | | | 3,502 | | | | 1.9 | % |
| | | | | | | | | | | | | | | | | |
| Total cost of products sold | | | 183,380 | | | | 67.7 | % | | | 138,730 | | | | 76.4 | % |
| | | | | | | | | | | | | | | | | |
| Gross margin | | $ | 87,605 | | | | 32.3 | % | | $ | 42,753 | | | | 23.6 | % |
Cost of products sold, before LIFO, overhead and labor rate adjustments to inventory, product liability, and product recall- In 2009, cost of products sold, before LIFO, overhead and labor rate adjustments to inventory, product liability, and product recall decreased as a percentage of sales by 7.3% compared to 2008. The decrease was primarily related to increased comparable period sales and production while holding fixed-overhead expenses fairly stable. Labor efficiency also improved in 2009.
LIFO- Gross inventories were reduced by $8.8 million in 2009 and $4.5 million in 2008. In 2009, the Company recognized a LIFO credit resulting in decreased cost of products sold of $4.2 million. In 2008, the Company recognized a LIFO charge and increased cost of products sold of $0.8 million.
Overhead Rate Change- The net impact on inventory in 2009 from the change in the overhead rates used to absorb overhead expenses into inventory was a decrease of $1.3 million, reflecting improvement in overhead efficiency. This decrease in inventory value resulted in a corresponding increase to cost of sales in 2009. In 2008, the change in inventory value resulting from the change in the overhead rate used to absorb overhead expenses into inventory was an increase of $1.4 million. This increase in inventory value resulted in a corresponding decrease to cost of products sold.
Labor Rate Adjustments- In 2009, the change in inventory value resulting from the change in the labor rates used to absorb labor expenses into inventory was a decrease of $0.4 million, reflecting improvement in labor efficiency. This decrease in inventory value resulted in a corresponding increase to cost of products sold. The net impact in 2008 from the change in the labor rates used to absorb labor expenses into inventory was an increase to inventory of $1.3 million. This increase in inventory value resulted in a corresponding decrease to cost of sales.
Product Liability—In 2009 and 2008, the Company incurred product liability expense of $1.6 million and $0.9 million, respectively, which includes the cost of outside legal fees, insurance, and other expenses incurred in the management and defense of product liability matters. See Note 12 to the notes to the financial statements “Contingent Liabilities” for further discussion of the Company’s product liability.
Product Recalls—There were no product recalls initiated in 2009. In 2008, the Company received a small number of reports from the field that its SR9 pistols, and later, its LCP pistols, could discharge if dropped onto a hard surface. The Company began recalling SR9 pistols in April 2008 and LCP pistols in October 2008 to offer free safety retrofits. The cost of these safety retrofit programs totaled $0.7 million and $3.5 million in 2009 and 2008, respectively. The Company believes that costs incurred for these ongoing retrofit programs in future years will not be significant.
Gross Margin—Gross margin was $87.6 million or 32.3% of sales in 2009. This is an increase of $44.8 million or 105% from 2008 gross margin of $42.8 million or 23.6% of sales.
Selling, General and Administrative
Selling, general and administrative expenses were $42.5 million in 2009. This represents an increase of $12.4 million or 41.1% from 2008 selling, general and administrative expenses of $30.1 million. The increase reflects increased advertising and sales promotion expenses and greater personnel-related expenses including stock-based compensation and bonuses.
Other Operating Expenses (Income), net
Other operating expenses (income), net consist of the following (in thousands):
| | | 2009 | | | 2008 | |
| | | | | | | |
| Gain on sale of operating assets (a) | | $ | (45 | ) | | $ | (95 | ) |
| Frozen defined benefit pension plan expense (income) | | | 1,266 | | | | (745 | ) |
| | | | | | | | | |
| Total other operating expenses (income), net | | $ | 1,221 | | | $ | (840 | ) |
| (a) | The gain on sale of operating assets was generated primarily from the sale of used machinery and equipment. |
Operating Income—Operating Income was $43.9 million or 16.2% of sales in 2009. This is a 224% increase of $30.4 million from 2008 operating income of $13.5 million or 7.5% of sales.
Royalty Income
Royalty income was $0.5 million in 2009. This represents an increase of $0.4 million from 2008 royalty income of $0.1 million. The increase is primarily attributable to increased income from licensing agreements.
Interest income
Interest income was $0.1 million in 2009. This represents a decrease of $0.3 million from 2008 interest income of $0.4 million. The decrease is attributable primarily to decreased interest rates in 2009.
Income Taxes and Net Income
The effective income tax rate in 2009 was 38.0%, which is consistent with the 2008 effective income tax rate of 38.0%.
As a result of the foregoing factors, consolidated net income was $27.5 million in 2009. This represents an increase of $18.8 million from 2008 consolidated net income of $8.7 million.
Quarterly Data
To supplement the summary annual unit data and discussion above, the same data for the last eight quarters follows:
| | | 2009 | |
| | | | Q4 | | | | Q3 | | | | Q2 | | | | Q1 | |
| | | | | | | | | | | | | | | | | |
| Units Ordered (1) | | | 173,000 | | | | 80,000 | | | | 204,700 | | | | 501,000 | |
| | | | | | | | | | | | | | | | | |
| Units Produced | | | 234,600 | | | | 242,500 | | | | 247,300 | | | | 209,900 | |
| | | | | | | | | | | | | | | | | |
| Units Shipped | | | 228,500 | | | | 237,400 | | | | 246,200 | | | | 213,700 | |
| | | | | | | | | | | | | | | | | |
Estimated Units Sold from Distributors to Retailers | | | 209,400 | | | | 214,500 | | | | 227,500 | | | | 236,000 | |
| | | | | | | | | | | | | | | | | |
| Average Sales Price | | $ | 276 | | | $ | 295 | | | $ | 286 | | | $ | 283 | |
| | | | | | | | | | | | | | | | | |
| Units on Backorder(1) | | | 181,000 | | | | 240,700 | | | | 412,300 | | | | 458,900 | |
| | | | | | | | | | | | | | | | | |
| Units – Company Inventory | | | 20,100 | | | | 15,100 | | | | 9,600 | | | | 8,800 | |
| | | | | | | | | | | | | | | | | |
| Units – Distributor Inventory (2) | | | 96,200 | | | | 76,800 | | | | 53,900 | | | | 35,200 | |
| | | 2008 | |
| | | | Q4 | | | | Q3 | | | | Q2 | | | | Q1 | |
| | | | | | | | | | | | | | | | | |
| Units Ordered | | | 270,400 | | | | 125,700 | | | | 120,300 | | | | 260,100 | |
| | | | | | | | | | | | | | | | | |
| Units Produced | | | 167,100 | | | | 158,900 | | | | 150,600 | | | | 124,000 | |
| | | | | | | | | | | | | | | | | |
| Units Shipped | | | 208,100 | | | | 146,000 | | | | 136,700 | | | | 135,700 | |
| | | | | | | | | | | | | | | | | |
Estimated Units Sold from Distributors to Retailers | | | 216,400 | | | | 143,100 | | | | 135,600 | | | | 135,900 | |
| | | | | | | | | | | | | | | | | |
| Average Sales Price | | $ | 275 | | | $ | 276 | | | $ | 270 | | | $ | 296 | |
| | | | | | | | | | | | | | | | | |
| Units on Backorder | | | 175,900 | | | | 115,300 | | | | 137,700 | | | | 157,100 | |
| | | | | | | | | | | | | | | | | |
| Units – Company Inventory | | | 12,400 | | | | 52,600 | | | | 40,200 | | | | 24,900 | |
| | | | | | | | | | | | | | | | | |
| Units – Distributor Inventory (2) | | | 57,500 | | | | 65,800 | | | | 62,900 | | | | 61,800 | |
| (1) | During the third quarter of 2009, the Company unilaterally cancelled all of the unshipped orders for Mini-14 and Mini-Thirty autoloading rifles, and asked the distributors to submit new orders that better represented their forecasted needs. The cancellation of these unshipped orders, partially offset by the submission of new orders for these products, resulted in a net reduction to the backlog of approximately 34,000 units or $20 million. Had these orders not been cancelled, the Units Ordered in the third quarter would have been approximately 114,000 units. |
| (2) | Distributor ending inventory as provided by the independent distributors of the Company’s products. |
(in millions except average sales price, including Federal Excise Tax)
| | | 2009 | |
| | | | Q4 | | | | Q3 | | | | Q2 | | | | Q1 | |
| | | | | | | | | | | | | | | | | |
| Orders Received(3) | | $ | 47.6 | | | $ | 15.7 | | | $ | 81.8 | | | $ | 154.3 | |
| | | | | | | | | | | | | | | | | |
| Average Sales Price of Orders Received(3)(4) | | $ | 275 | | | $ | 196 | | | $ | 400 | | | $ | 308 | |
| | | | | | | | | | | | | | | | | |
| Ending Backlog(3) | | $ | 59.6 | | | $ | 78.0 | | | $ | 138.0 | | | $ | 136.3 | |
| | | | | | | | | | | | | | | | | |
| Average Sales Price of Ending Backlog(3)(4) | | $ | 330 | | | $ | 324 | | | $ | 335 | | | $ | 297 | |
| | | 2008 | |
| | | | Q4 | | | | Q3 | | | | Q2 | | | | Q1 | |
| | | | | | | | | | | | | | | | | |
| Orders Received | | $ | 86.1 | | | $ | 33.5 | | | $ | 37.0 | | | $ | 73.8 | |
| | | | | | | | | | | | | | | | | |
| Average Sales Price of Orders Received(4) | | $ | 287 | | | $ | 267 | | | $ | 275 | | | $ | 257 | |
| | | | | | | | | | | | | | | | | |
| Ending Backlog | | $ | 47.8 | | | $ | 27.9 | | | $ | 33.7 | | | $ | 40.7 | |
| | | | | | | | | | | | | | | | | |
| Average Sales Price of Ending Backlog(4) | | $ | 269 | | | $ | 242 | | | $ | 245 | | | $ | 234 | |
| (3) | See description in Note 1 above for information relating to Q3 2009 order cancellations. The cancellation of these orders reduced Orders Received in the third quarter of 2009 by $20 million and decreased the Average Sales Price of Orders Received by $115 per unit. Had these orders not been cancelled, the Average Sales Price of Orders Received would have been $311 per unit. The Average Sales Price of the Ending Backlog was also impacted for the same reasons. |
| (4) | Average sales price for orders received and ending backlog is net of Federal Excise Tax of 10% for handguns and 11% for long guns. |
Fourth Quarter Gross Margin Analysis
The gross margin as a percent of sales for the fourth quarter of 2009 and 2008 was 33.3% and 28.6%, respectively. Details of the gross margin are illustrated below:
(in thousands)
| Three Months Ended December 31 | | 2009 | | | 2008 | |
| | | | | | | | | | | | | |
| Net sales | | $ | 63,879 | | | | 100.0 | % | | $ | 58,491 | | | | 100.0 | % |
| | | | | | | | | | | | | | | | | |
| Cost of products sold, before LIFO, overhead and labor rate adjustments to inventory, product liability and product recall | | | 45,678 | | | | 71.5 | % | | | 44,177 | | | | 75.5 | % |
| | | | | | | | | | | | | | | | | |
| LIFO expense (income) | | | (1,536 | ) | | | (2.4 | )% | | | (3,026 | ) | | | (5.2 | )% |
| | | | | | | | | | | | | | | | | |
| Overhead rate adjustments to inventory | | | (1,408 | ) | | | (2.2 | )% | | | 90 | | | | 0.2 | % |
| | | | | | | | | | | | | | | | | |
| Labor rate adjustments to inventory | | | (323 | ) | | | (0.5 | )% | | | 60 | | | | 0.1 | % |
| | | | | | | | | | | | | | | | | |
| Product liability | | | 171 | | | | 0.2 | % | | | 420 | | | | 0.7 | % |
| | | | | | | | | | | | | | | | | |
| Product recalls | | | 32 | | | | 0.1 | % | | | 25 | | | | 0.1 | % |
| | | | | | | | | | | | | | | | | |
| Total cost of products sold | | | 42,614 | | | | 66.7 | % | | | 41,746 | | | | 71.4 | % |
| | | | | | | | | | | | | | | | | |
| Gross margin | | $ | 21,265 | | | | 33.3 | % | | $ | 16,745 | | | | 28.6 | % |
Note: For a discussion of the above table, please see “Cost of Products Sold and Gross Margin” discussion above.
Results of Operations - 2008
Year ended December 31, 2008, as compared to year ended December 31, 2007:
Annual Summary Unit Data
Firearms unit data for orders, production, shipments and ending inventory, and castings setups (a measure of foundry production) are as follows:
| | 2008 | 2007 | 2006 | 2005 |
| | | | | |
| Units Ordered | 776,400 | 485,000 | (1) | (1) |
| | | | | |
| Units Produced | 600,600 | 464,900 | 419,800 | 414,600 |
| | | | | |
| Units Shipped | 626,500 | 481,800 | 475,900 | 460,200 |
| | | | | |
| Average Sales Price | $278 | $299 | $292 | $289 |
| | | | | |
| Units on Backorder | 175,900 | 36,500 | (1) | (1) |
| | | | | |
| Units – Company Inventory | 12,400 | 38,300 | 55,200 | 111,246 |
| | | | | |
| Units – Distributor Inventory (2) | 57,500 | 62,000 | 57,100 | 70,498 |
| | | | | |
| Castings Setups | 144,600 | 156,100 | 169,100 | 174,443 |
Orders Received and Ending Backlog
(in millions except average sales price, including Federal Excise Tax):
| | | 2008 | | | 2007 | |
| | | | | | | |
| Orders Received | | $ | 233.8 | | | $ | 156.4 | |
| | | | | | | | | |
| Average Sales Price of Orders Received (3) | | $ | 301 | | | $ | 322 | |
| | | | | | | | | |
| Ending Backlog (3) | | $ | 47.8 | | | $ | 17.9 | |
| | | | | | | | | |
| Average Sales Price of Ending Backlog (3) | | $ | 269 | | | $ | 444 | |
| (1) | Prior to 2006, the Company received one cancelable annual firearms order in December from each independent distributor. Effective December 1, 2006, the Company changed the manner in which distributors order firearms, and began receiving firm, non-cancelable purchase orders on a frequent basis, with most orders for immediate delivery. Because of this change, comparable data for orders received and units on backorder for prior periods is not meaningful. |
| (2) | Distributor ending inventory as provided by the independent distributors of the Company’s products. |
| (3) | Average sales price for orders received and ending backlog is net of Federal Excise Tax of 10% for handguns and 11% for long guns. |
The increase in orders received in 2008 is attributable to the following:
| 1. | Increased demand for firearms during the fourth quarter, |
| 2. | New products introduced in 2008, and |
| 3. | Increased production and order fulfillment in 2008. |
The product mix of orders received in 2008 shows an increase in demand for firearms related to self defense, including the LCP pistol, which was introduced in the first quarter of 2008.
The decrease in the average sales price of the units in backlog in 2008 is due to the large quantity of new products in the backlog with lower unit sales prices and a reduction in backlog for certain rifle products where production has increased to meet demand.
Orders for certain discontinued models totaling $3.7 million at the end of 2007 were cancelled and have been eliminated from the 2008 backlog information. These orders were included in the backlog for 2007, and their elimination had a significant impact on the change in average sales price of the ending backlog from 2007 to 2008.
The increase in the order backlog is due to the strong incoming order rate for new products and the increase in overall demand that occurred in the fourth quarter.
Production
Production rates, which started to increase late in 2007, continued to improve throughout 2008. This allowed for a 29% increase in unit production from 2007 to 2008.
Inventories
The Company’s finished goods unit inventory levels decreased in 2008, ending at a recent historic low.
Quarterly Summary Unit Data
To supplement the summary annual unit data and discussion above, the same data for the last eight quarters follows:
| | | 2008 | |
| | | | Q4 | | | | Q3 | | | | Q2 | | | | Q1 | |
| | | | | | | | | | | | | | | | | |
| Units Ordered | | | 270,400 | | | | 125,700 | | | | 120,300 | | | | 260,100 | |
| | | | | | | | | | | | | | | | | |
| Units Produced | | | 167,100 | | | | 158,900 | | | | 150,600 | | | | 124,000 | |
| | | | | | | | | | | | | | | | | |
| Units Shipped | | | 208,100 | | | | 146,000 | | | | 136,700 | | | | 135,700 | |
| | | | | | | | | | | | | | | | | |
| Average Sales Price | | $ | 275 | | | $ | 276 | | | $ | 270 | | | $ | 296 | |
| | | | | | | | | | | | | | | | | |
| Units on Backorder | | | 175,900 | | | | 115,300 | | | | 137,700 | | | | 157,100 | |
| | | | | | | | | | | | | | | | | |
| Units – Company Inventory | | | 12,400 | | | | 52,600 | | | | 40,200 | | | | 24,900 | |
| | | | | | | | | | | | | | | | | |
| Units – Distributor Inventory (1) | | | 57,500 | | | | 65,800 | | | | 62,900 | | | | 61,800 | |
| | | 2007 | |
| | | | Q4 | | | | Q3 | | | | Q2 | | | | Q1 | |
| | | | | | | | | | | | | | | | | |
| Units Ordered | | | 113,100 | | | | 80,900 | | | | 115,300 | | | | 175,700 | |
| | | | | | | | | | | | | | | | | |
| Units Produced | | | 104,900 | | | | 100,800 | | | | 132,000 | | | | 127,200 | |
| | | | | | | | | | | | | | | | | |
| Units Shipped | | | 111,900 | | | | 98,600 | | | | 129,600 | | | | 141,700 | |
| | | | | | | | | | | | | | | | | |
| Average Sales Price | | $ | 283 | | | $ | 297 | | | $ | 306 | | | $ | 308 | |
| | | | | | | | | | | | | | | | | |
| Units on Backorder | | | 36,500 | | | | 35,700 | | | | 53,400 | | | | 68,300 | |
| | | | | | | | | | | �� | | | | | | |
| Units – Company Inventory | | | 38,300 | | | | 45,300 | | | | 43,100 | | | | 40,700 | |
| | | | | | | | | | | | | | | | | |
| Units – Distributor Inventory (1) | | | 62,000 | | | | 70,500 | | | | 78,800 | | | | 60,000 | |
| (1) | Distributor ending inventory as provided by the independent distributors of the Company’s products. |
Orders Received and Ending Backlog
(in millions except average sales price, including Federal Excise Tax)
| | | 2008 | |
| | | | Q4 | | | | Q3 | | | | Q2 | | | | Q1 | |
| | | | | | | | | | | | | | | | | |
| Orders Received | | $ | 86.1 | | | $ | 33.5 | | | $ | 37.0 | | | $ | 73.8 | |
| | | | | | | | | | | | | | | | | |
| Average Sales Price of Orders Received | | $ | 287 | | | $ | 267 | | | $ | 275 | | | $ | 257 | |
| | | | | | | | | | | | | | | | | |
| Ending Backlog | | $ | 47.8 | | | $ | 27.9 | | | $ | 33.7 | | | $ | 40.7 | |
| | | | | | | | | | | | | | | | | |
| Average Sales Price of Ending Backlog | | $ | 269 | | | $ | 242 | | | $ | 245 | | | $ | 234 | |
| | | 2007 | |
| | | | Q4 | | | | Q3 | | | | Q2 | | | | Q1 | |
| | | | | | | | | | | | | | | | | |
| Orders Received | | $ | 32.8 | | | $ | 25.4 | | | $ | 39.1 | | | $ | 58.9 | |
| | | | | | | | | | | | | | | | | |
| Average Sales Price of Orders Received | | $ | 262 | | | $ | 284 | | | $ | 307 | | | $ | 303 | |
| | | | | | | | | | | | | | | | | |
| Ending Backlog | | $ | 17.9 | | | $ | 16.2 | | | $ | 23.3 | | | $ | 27.9 | |
| | | | | | | | | | | | | | | | | |
| Average Sales Price of Ending Backlog | | $ | 444 | | | $ | 411 | | | $ | 395 | | | $ | 370 | |
| Note: | Average sales price for orders received and ending backlog is net of Federal Excise Tax of 10% for handguns and 11% for long guns. |
Sales
Consolidated net sales were $181.5 million in 2008. This represents an increase of $25.0 million or 16.0% from 2007 consolidated net sales of $156.5 million.
Firearms segment net sales were $174.4 million in 2008. This represents an increase of $30.2 million or 20.9% from 2007 firearm net sales of $144.2 million. Firearms unit shipments increased 30.0% in 2008 due to increased shipments of pistols, rifles and revolvers. This increase is attributable to the introduction of new products in 2008, increased production of mature products, and increased overall industry demand. A shift in product mix toward firearms with lower unit sales prices, including some new products, resulted in the greater percentage increase in unit shipments than sales.
Casting segment net sales were $7.1 million in 2008. This represents a decrease of $5.2 million or 42.4% from 2007 casting sales of $12.3 million.
The casting sales decrease in 2008 primarily reflects the cessation of titanium casting operations, as previously announced by the Company in July 2006. In 2007, titanium casting sales were $3.2 million of total casting sales. In 2007, the Company significantly increased prices to certain external customers, seeking to improve margins and free up available capacity for additional internal use. Certain customers accepted the price increases while others moved their business away from the Company as anticipated.
Cost of Products Sold and Gross Margin
Consolidated cost of products sold was $138.7 million in 2008. This represents an increase of $21.5 million or 18.4% from 2007 consolidated cost of products sold of $117.2 million.
The gross margin as a percent of sales was 23.6% in 2008. This represents a decrease from the 2007 gross margin of 25.1% as illustrated below:
(in thousands)
| Year Ended December 31 | | 2008 | | | 2007 | |
| | | | | | | | | | | | | |
| Net sales | | $ | 181,483 | | | | 100.0 | % | | $ | 156,485 | | | | 100.0 | % |
| | | | | | | | | | | | | | | | | |
| Cost of products sold, before LIFO, overhead and labor rate adjustments to inventory, product liability and product recall | | | 136,172 | | | | 75.0 | % | | | 123,170 | | | | 78.7 | % |
| | | | | | | | | | | | | | | | | |
| LIFO expense (income) | | | 781 | | | | 0.4 | % | | | (9,074 | ) | | | (5.8 | )% |
| | | | | | | | | | | | | | | | | |
| Overhead rate adjustments to inventory | | | (1,389 | ) | | | (0.7 | )% | | | 1,404 | | | | 0.9 | % |
| | | | | | | | | | | | | | | | | |
| Labor rate adjustments to inventory | | | (1,251 | ) | | | (0.7 | )% | | | - | | | | - | |
| | | | | | | | | | | | | | | | | |
| Product liability | | | 915 | | | | 0.5 | % | | | 1,686 | | | | 1.1 | % |
| | | | | | | | | | | | | | | | | |
| Product recalls | | | 3,502 | | | | 1.9 | % | | | - | | | | - | |
| | | | | | | | | | | | | | | | | |
| Total cost of products sold | | | 138,730 | | | | 76.4 | % | | | 117,186 | | | | 74.9 | % |
| | | | | | | | | | | | | | | | | |
| Gross margin | | $ | 42,753 | | | | 23.6 | % | | $ | 39,299 | | | | 25.1 | % |
Cost of products sold, before LIFO, overhead and labor rate adjustments to inventory, product liability, and product recall— In 2008, cost of products sold, before LIFO, overhead and labor rate adjustments to inventory, product liability, and product recall decreased as a percentage of sales by 3.7% compared to the comparable period in 2007. The decrease was primarily related to increased comparable period sales and production while holding fixed-overhead expenses fairly stable and decreases in non-personnel variable-overhead spending.
Excess and Obsolete Inventory—The excess and obsolete inventory reserve balances as of December 31, 2008 and December 31, 2007 were $3.6 million and $4.1 million, respectively. The reduction was principally attributable to continued reduction in work-in-process inventory.
LIFO—In 2008, gross inventories were reduced by $4.5 million compared to a decrease in gross inventories of $23.1 million in 2007. In 2008 the Company recognized a LIFO charge resulting in increased cost of products sold of $0.8 million compared to LIFO income and decreased cost of products sold of $9.1 million in 2007.
Overhead Rate Change—In the first half of 2008, increased expenses incurred related to expanding manufacturing capacity resulted in an increase in overhead absorbed into inventory of $1.5 million and a corresponding reduction in cost of sales. In the latter half of 2008, the change in inventory value resulting from the change in the overhead rates used to absorb overhead expenses into inventory was a decrease in inventory of $0.1 million.
The net impact in 2008 from the change in the overhead rates used to absorb overhead expenses into inventory was an increase to inventory of $1.4 million. This increase in inventory value resulted in a decrease to cost of sales in 2008.
In 2007, the change in inventory value resulting from the change in the overhead rate used to absorb overhead expenses into inventory was a decrease of $1.4 million. This reduction in inventory value resulted in an increase to cost of products sold.
Labor Rate Adjustments—Effective April 1, 2008, the Company changed its methodology for estimating standard direct labor rates for its firearms. This change in estimation resulted in an increase to gross inventories of $1.9 million and a corresponding reduction in cost of sales. For the remainder of 2008, the change in inventory value resulting from the change in the labor rates used to absorb labor expenses into inventory was a decrease in inventory of $0.6 million, reflecting continued improvement of labor efficiency.
The net impact in 2008 from the change in the labor rates used to absorb labor expenses into inventory was an increase to inventory of $1.3 million. This increase in inventory value resulted in a decrease to cost of sales in 2008.
Product Liability—During the years ended December 31, 2008 and 2007, the Company incurred product liability expense of $0.9 million and $1.7 million, respectively, which includes the cost of outside legal fees, insurance, and other expenses incurred in the management and defense of product liability matters. See Note 17 to the notes to the financial statements “Contingent Liabilities” for further discussion of the Company’s product liability.
Product Recalls—In 2008, the Company received a small number of reports from the field that its SR9 pistols, and later, its LCP pistols, could discharge if dropped onto a hard surface. The Company began recalling SR9 pistols in April 2008 and LCP pistols in October 2008 to offer free safety retrofits. The estimated cost of these safety retrofit programs of approximately $3.5 million was recorded in 2008. At December 31, 2008, an accrual of $1.5 million remained.
Gross Margin—Gross margin was $42.8 million or 23.6% of sales in 2008. This is an increase of $3.5 million or 8.7% from 2007 gross margin of $39.3 million or 25.1% of sales.
Selling, General and Administrative
Selling, general and administrative expenses were $30.1 million in 2008. This represents an increase of $1.3 million or 4.5% from 2007 selling, general and administrative expenses of $28.8 million. The increase reflects increased advertising and sales promotion expenses, many of which related to new products, and greater personnel-related expenses.
Pension Curtailment Charge
In 2007, the Company amended its hourly and salaried defined benefit pension plans which resulted in a $1.1 million pension curtailment charge. No such charge was incurred in 2008.
Other Operating Expenses (Income), net
Other operating expenses (income), net consist of the following (in thousands):
| | | 2008 | | | 2007 | |
| | | | | | | |
| Gain on sale of operating assets (a) | | $ | (95 | ) | | $ | (472 | ) |
| Impairment of operating assets (b) | | | - | | | | 489 | |
| Gain on sale of real estate (c) | | | - | | | | (1,521 | ) |
| Impairment of real estate held for sale (d) | | | - | | | | 1,775 | |
| Frozen defined benefit pension plan income | | | (745 | ) | | | - | |
| | | | | | | | | |
| Total other operating expenses (income), net | | $ | (840 | ) | | $ | 271 | |
| (a) | The gain on sale of operating assets was generated primarily from the sale of used machinery and equipment. The used equipment sold in 2008 was previously used in firearms manufacturing. Most of the used machinery and equipment sold in 2007 was related to titanium investment casting. |
| (b) | In 2007, the Company recognized an impairment charge of $0.5 million related to machinery and equipment previously in the Company’s Arizona investment casting operations. |
| (c) | In 2007, the Company sold a facility in Arizona for $5.0 million. This facility had not been used in the Company’s operations for several years. The Company realized a gain of approximately $1.5 million from this sale. |
| (d) | In the fourth quarter of 2007, the Company recognized an asset impairment charge of $1.8 million related to the Dorr Building, a non-manufacturing property in New Hampshire that has been for sale for an extended period of time without any meaningful market interest. |
Operating Income—Operating Income was $13.5 million or 7.5% of sales in 2008. This is a 48.5% increase of $4.4 million from 2007 operating income of $9.1 million or 5.8% of sales.
Gain on Sale of Real Estate—In 2007, the $5.2 million gain on sale of real estate reflects the sale of largely undeveloped non-manufacturing real property held for investment.
Interest income
Interest income was $0.4 million in 2008. This represents a decrease of $2.0 million from 2007 interest income of $2.4 million. The decrease is attributable primarily to reduced interest rates in 2008 and secondarily to reduced principal invested.
Income Taxes and Net Income
The effective income tax rate in 2008 was 38.0%, which is consistent with the 2007 effective income tax rate of 38.0%.
As a result of the foregoing factors, consolidated net income was $8.7 million in 2008. This represents a decrease of $1.6 million from 2007 consolidated net income of $10.3 million.
Financial Condition
Liquidity
At December 31, 2009, the Company had cash, cash equivalents and short-term investments of $55.7 million. The Company’s pre-LIFO working capital of $104.0 million, less the LIFO reserve of $38.7 million, resulted in working capital of $65.3 million and a current ratio of 3.0 to 1.
As the current surge in demand subsides, the Company expects to replenish its finished goods inventory. This planned replenishment to levels that will better serve our customers could increase the FIFO value of finished goods inventory by as much as $12 to $15 million from current depressed levels. We anticipate that the cash required to fund this increase in finished goods inventory would be partially offset by a reduction in accounts receivable which would be expected during a period of reduced demand.
During the first quarter of 2009, the Company paid down the $1 million balance on its $25 million credit facility, in response to the relative improvement in the global financial and credit markets. The credit facility, which expires on December 12, 2010, remains unused and the Company has no debt.
Operations
Cash provided by operating activities was $46.7 million, $11.2 million, and $19.3 million in 2009, 2008, and 2007, respectively. The increase in cash provided in 2009 compared to 2008 is principally attributable to increased profitability in 2009 and a slight decrease in accounts receivable 2009. The decrease in cash provided in 2008 compared to 2007 is principally attributable to a much smaller reduction in gross inventory in 2008 compared to 2007 and an increase in accounts receivable in 2008 due to strong fourth quarter sales in 2008.
Third parties supply the Company with various raw materials for its firearms and castings, such as fabricated steel components, walnut, birch, beech, maple and laminated lumber for rifle and shotgun stocks, wax, ceramic material, metal alloys, various synthetic products and other component parts. There is a limited supply of these materials in the marketplace at any given time, which can cause the purchase prices to vary based upon numerous market factors. The Company believes that it has adequate quantities of raw materials in inventory to provide ample time to locate and obtain additional items at then-current market cost without interruption of its manufacturing operations. However, if market conditions result in a significant prolonged inflation of certain prices or if adequate quantities of raw materials can not be obtained, the Company’s manufacturing processes could be interrupted and the Company’s financial condition or results of operations could be materially adversely affected.
Investing and Financing
Capital expenditures were $13.8 million, $9.5 million, and $4.5 million in 2009, 2008, and 2007, respectively. In 2010, the Company expects to spend approximately $5$10 to $15 million on capital expenditures to purchase tooling for new product introductions, and to upgrade and modernize manufacturing equipment, primarily at the Newport Firearms and Pine Tree Castings Divisions.to increase capacity of certain products in strong demand. The Company finances, and intends to continue to finance, all of these activities with funds provided by operations and current cash and short-term investments.
On September 26, 2006,
During the past several years, the Board of Directors authorized the Company to repurchase shares of its common stock. In 2009, the Company repurchased 4,272,000approximately 2,400 shares of its common stock under a 10b5-1 program, representing 0.01% of the then outstanding shares, in the open market at an average price of $6.03 per share. In 2008, the Company repurchased 1,535,000 shares of its common stock, representing 15.9%7.5% of the then outstanding shares, from entities controlled by membersin the open market at an average price of $6.57 per share. In 2007, the Company repurchased 2,216,000 shares of its common stock, representing 9.7% of the Ruger familythen outstanding shares, in the open market at aan average price of $5.90$8.99 per share. The purchase wasAll of these purchases were made with cash held by the Company soand no debt was required.incurred.
At December 31, 2009, $4.7 million remained authorized for share repurchases. On January 26, 2007,February 1, 2010, the Company announced that its Board of Directors authorized a stockexpanded this repurchase program. program from $4.7 million to $10 million.
The program allows the Company to repurchase up to $20paid dividends totaling $5.8 million of its common stock from time to time in the open market or through privately negotiated transactions.
2009. There were no dividends paid in 2006.2008 or 2007.
On February 24, 2010, the Company declared a dividend of 6¢ per share to shareholders of record on March 12, 2010. The payment of future dividends depends on many factors, including internal estimates of future performance, then-current cash and short-term investments, and the Company’s need for funds.
In 2007, the Company amended its hourly and salaried defined benefit pension plans so that employees no longer accrue benefits under them effective December 31, 2007. This action “froze” the benefits for all employees and prevented future hires from joining the plans, effective December 31, 2007. Currently, the Company provides supplemental discretionary contributions to substantially all employees’ individual 401(k) accounts.
In 2010 and future years, the Company may be required to make cash contributions to the two defined benefit pension plans according to the new rules of the Pension Protection Act of 2006. The annual contributions will be based on the amount of the unfunded plan liabilities derived from the frozen benefits and will not include liabilities for any future accrued benefits for any new or existing participants. The total amount of these future cash contributions will depend on the investment returns generated by the plans’ assets and the then-applicable discount rates used to calculate the plans’ liabilities.
There was no minimum required cash contribution for the defined benefit plans for 2009 or 2010, but there may be such a requirement in future years. The Company does not expectvoluntarily contributed $2.0 million to pay dividendsthe defined benefit plans in 2009. The Company plans on voluntarily contributing approximately $2 million in 2010. The intent of these discretionary contributions is to reduce the near term, but will reconsider a dividend later in 2007.
Historically,amount of time that the Company has notwill be required external financing. to continue to operate the frozen plans. The ongoing cost of running the plans (even if frozen) is approximately $200,000 per year, which includes PBGC premiums, actuary and audit fees, and other expenses.
In the first quarter of 2009, the Company settled $2.1 million of pension liabilities through the purchase of group annuities. This transaction resulted in an insignificant actuarial gain.
In February 2008, the Company made lump sum benefit payments to two participants in its only non-qualified defined benefit plan, the Supplemental Executive Retirement Plan (SERP). These payments, which totaled $2.1 million, represented the actuarial present value of the participants’ accrued benefit as of the date of payment. Only one, retired participant remains in this plan.
Based on its unencumbered assets, the Company believes it has the ability to raise substantial amounts of cash through issuance of short-term or long-term debt. During the first quarter of 2009, the Company paid down the $1 million balance on its $25 million credit facility, in response to the relative improvement in the global financial and credit markets. The credit facility, which expires on December 12, 2010, remains unused and the Company has no debt.
On March 8, 2007, the Company sold 42 parcels of non-manufacturing real property for $7.3 million to William B. Ruger, Jr., the Company’s former Chief Executive Officer and Chairman of the Board. The sale included substantially all of the Company’s raw land real property assets in New Hampshire. The sales price was based upon an independent appraisal, and the Company recognized a gain of $5.2 million on the sale in 2007.
On April 16, 2007, the Company sold a non-manufacturing facility in Arizona for $5.0 million. This facility had not been used in the Company’s operations for several years. The Company realized a gain of approximately $1.5 million from this sale in 2007.
The Company demolished most of its 300,000 square foot Dorr Woolen Building in 2009. A portion of the building remains and is being refurbished, and will continue to serve as a warehouse in New Hampshire. In 2009, $1.8 million was incurred related to this demolition. The remaining cost of this demolition, which is largely complete, is expected to be insignificant in 2010.
Contractual Obligations
The table below summarizes the Company’s significant contractual obligations at December 31, 2006,2009, and the effect such obligations are expected to have on the Company’s liquidity and cash flows in future periods. This table excludes amounts already recorded on the Company’s balance sheet as current liabilities at December 31, 2006.2009.
“Purchase Obligations” as used in the below table includes all agreements to purchase goods or services that are enforceable and legally binding on the Company and that specify all significant terms, including: fixed or minimum quantities to be purchased; fixed, minimum or variable price provisions; and the approximate timing of the transaction. Certain of the Company’s purchase orders or contracts for the purchase of raw materials and other goods and services that may not necessarily be enforceable or legally binding on the Company, are also included in “Purchase Obligations” in the table. Certain of the Company’s purchase orders or contracts therefore included in the table may represent authorizations to purchase rather than legally binding agreements. The Company expects to fund all of these commitments with cash flows from operations and current cash and short-terms investments.
| | | | | | | | | | | | | | | | | | | | | |
| Payment due by period (in thousands) | |
| | | | | | | Less than 1 | | | | | | | | | | | More than 5 | |
| Contractual Obligations | | Total | | | year | | | 1-3 years | | | 3-5 years | | | years | |
| |
| Long-Term Debt Obligations | | | — | | | | — | | | | — | | | | — | | | | — | |
| |
| Capital Lease Obligations | | | — | | | | — | | | | — | | | | — | | | | — | |
| |
| Operating Lease Obligations | | | — | | | | — | | | | — | | | | — | | | | — | |
| |
| Purchase Obligations | | $ | 11,482 | | | $ | 11,482 | | | | — | | | | — | | | | — | |
| |
27
| | | | | | | | | | | | | | | | | | | | | |
| Payment due by period (in thousands) | |
| | | | | | | Less than 1 | | | | | | | | | | | More than 5 | |
| Contractual Obligations | | Total | | | year | | | 1-3 years | | | 3-5 years | | | years | |
| Other Long-Term Liabilities | | | | | | | | | | | | | | | | | | | | |
| Reflected on the Registrant’s Balance Sheet under GAAP | | | — | | | | — | | | | — | | | | — | | | | — | |
| |
Total | | $ | 11,482 | | | $ | 11,482 | | | | — | | | | — | | | | — | |
| |
| Payment due by period (in thousands) | |
| Contractual Obligations | | Total | | | Less than 1 year | | | 1-3 years | | | 3-5 years | | | More than 5 years | |
| Long-Term Debt Obligations | | | - | | | | - | | | | - | | | | - | | | | - | |
| Capital Lease Obligations | | | - | | | | - | | | | - | | | | - | | | | - | |
| Operating Lease Obligations | | | - | | | | - | | | | - | | | | - | | | | - | |
| Purchase Obligations | | $ | 33,300 | | | $ | 33,300 | | | | - | | | | - | | | | - | |
Other Long-Term Liabilities Reflected on the Registrant’s Balance Sheet under GAAP | | | - | | | | - | | | | - | | | | - | | | | - | |
| | | | | | | | | | | | | | | | | | | | | |
| Total | | $ | 33,300 | | | $ | 33,300 | | | | - | | | | - | | | | - | |
The expected timing of payment of the obligations discussed above is estimated based on current information. Timing of payments and actual amounts paid may be different depending on the time of receipt of goods or services or changes to agreed-upon amounts for some obligations.
Firearms Legislation and Litigation
(The following disclosures within “Firearms Legislation” are identical to the disclosures within
See Item 1A-Risk1A - Risk Factors “Firearms Legislation.)
The sale, purchase, ownership, and usefor discussion of firearms are subject to thousands of federal, statelegislation and local governmental regulations. The basic federal laws are the National Firearms Act, the Federal Firearms Act, and the Gun Control Act of 1968. These laws generally prohibit the private ownership of fully automatic weapons and place certain restrictions on the interstate sale of firearms unless certain licenses are obtained. The Company does not manufacture fully automatic weapons, other than for the law enforcement market, and holds all necessary licenses under these federal laws. From time to time, congressional committees review proposed bills relating to the regulation of firearms. These proposed bills generally seek either to restrict or ban the sale and, in some cases, the ownership of various types of firearms. Several states currently have laws in effect similar to the aforementioned legislation.litigation.
Until November 30, 1998, the “Brady Law” mandated a nationwide five-day waiting period and background check prior to the purchase of a handgun. As of November 30, 1998, the National Instant Check System, which applies to both handguns and long guns, replaced the five-day waiting period. The Company believes that the “Brady Law” and the National Instant Check System have not had a significant effect on the Company’s sales of firearms, nor does it anticipate any impact on sales in the future. On September 13, 1994, the “Crime Bill” banned so-called “assault weapons.” All the Company’s then-manufactured commercially-sold long guns were exempted by name as “legitimate sporting firearms.” This ban expired by operation of law on September 13, 2004. The Company remains strongly opposed to laws which would restrict the rights of law-abiding citizens to lawfully acquire firearms. The Company believes that the lawful private ownership of firearms is guaranteed by the Second Amendment to the United States Constitution and that the widespread private ownership of firearms in the United States will continue. However, there can be no assurance that the regulation of firearms will not become more restrictive in the future and that any such restriction would not have a material adverse effect on the business of the Company.
Firearms Litigation
(The following disclosures within “Firearms Litigation” are identical to the disclosures within Item 1A-Risk Factors “Firearms Litigation” and Footnote #6-Contingent Liabilities.)
28
As of December 31, 2006, the Company is a defendant in approximately four lawsuits allegedly involving its products and is aware of certain other such claims. Lawsuits and claims fall into two categories:
| (i) | | Those that claim damages from the Company related to allegedly defective product design which stem from a specific incident. These lawsuits and claims are based principally on the theory of “strict liability” but also may be based on negligence, breach of warranty, and other legal theories, and |
|
| (ii) | | Those brought by cities, municipalities, counties, and individuals against firearms manufacturers, distributors and dealers seeking to recover damages allegedly arising out of the misuse of firearms by third-parties in the commission of homicides, suicides and other shootings involving juveniles and adults. The complaints by municipalities seek damages, among other things, for the costs of medical care, police and emergency services, public health services, and the maintenance of courts, prisons, and other services. In certain instances, the plaintiffs seek to recover for decreases in property values and loss of business within the city due to criminal violence. In addition, nuisance abatement and/or injunctive relief is sought to change the design, manufacture, marketing and distribution practices of the various defendants. These suits allege, among other claims, strict liability or negligence in the design of products, public nuisance, negligent entrustment, negligent distribution, deceptive or fraudulent advertising, violation of consumer protection statutes and conspiracy or concert of action theories. Most of these cases do not allege a specific injury to a specific individual as a result of the misuse or use of any of the Company’s products. |
The Company has expended significant amounts of financial resources and management time in connection with product liability litigation. Management believes that, in every case, the allegations are unfounded, and that the shootings and any results therefrom were due to negligence or misuse of the firearms by third-parties or the claimant, and that there should be no recovery against the Company. Defenses further exist to the suits brought by cities, municipalities, counties, and a state attorney general based, among other reasons, on established state law precluding recovery by municipalities for essential government services, the remoteness of the claims, the types of damages sought to be recovered, and limitations on the extraterritorial authority which may be exerted by a city, municipality, county or state under state and federal law, including State and Federal Constitutions. Also, “The Protection of Lawful Commerce in Arms Act” signed into law on October 26, 2005 on its face requires dismissal of such claims.
The only case against the Company alleging liability for criminal shootings by third-parties to ever be permitted to go before a constitutional jury,Hamilton, et al. v. Accu-tek, et al., resulted in a defense verdict in favor of the Company on February 11, 1999. In that case, numerous firearms manufacturers and distributors had been sued, alleging damages as a result of alleged negligent sales practices and “industry-wide” liability. The Company and its marketing and distribution practices were exonerated from any claims of negligence in each of the seven cases decided by the jury. In subsequent proceedings involving other defendants, the New York Court of Appeals as a matter of law confirmed that 1) no legal duty existed under the circumstances to prevent or investigate criminal misuses of a manufacturer’s lawfully made products; and 2) liability of firearms manufacturers could not be apportioned under a market share theory. More recently, the New York Court of Appeals on October 21, 2003 declined to hear the appeal from the decision of the New York Supreme Court, Appellate Division, affirming the dismissal of New York Attorney General Eliot Spitzer’s public nuisance suit against the
29
Company and other manufacturers and distributors of firearms. In its decision, the Appellate Division relied heavily onHamilton in concluding that it was “legally inappropriate,” “impractical,” “unrealistic” and “unfair” to attempt to hold firearms manufacturers responsible under theories of public nuisance for the criminal acts of others.
Of the lawsuits brought by municipalities or a state Attorney General, twenty have been concluded:Atlanta — dismissal by intermediate Appellate Court, no further appeal;Bridgeport — dismissal affirmed by Connecticut Supreme Court;County of Camden — dismissal affirmed by U.S. Third Circuit Court of Appeals;Miami — dismissal affirmed by intermediate appellate court, Florida Supreme Court declined review;New Orleans — dismissed by Louisiana Supreme Court, United States Supreme Court declined review;Philadelphia — U.S. Third Circuit Court of Appeals affirmed dismissal, no further appeal;Wilmington — dismissed by trial court, no appeal;Boston — voluntary dismissal with prejudice by the City at the close of fact discovery;Cincinnati — voluntarily withdrawn after a unanimous vote of the city council;Detroit — dismissed by Michigan Court of Appeals, no appeal;Wayne County — dismissed by Michigan Court of Appeals, no appeal;New York State — Court of Appeals denied plaintiff’s petition for leave to appeal the Intermediate Appellate Court’s dismissal, no further appeal;Newark — Superior Court of New Jersey Law Division for Essex County dismissed the case with prejudice;City of Camden — dismissed on July 7, 2003, not reopened;Jersey City — voluntarily dismissed and not re-filed;St. Louis — Missouri Supreme Court denied plaintiffs’ motion to appeal Missouri Appellate Court’s affirmance of dismissal;Chicago — Illinois Supreme Court denied plaintiffs’ petition for rehearing; andLos Angeles City,Los Angeles County,San Francisco — Appellate Court affirmed summary judgment in favor of defendants, no further appeal; andCleveland — dismissed on January 24, 2006 for lack of prosecution.
The dismissal of theWashington, D.C. municipal lawsuit was sustained on appeal, but individual plaintiffs were permitted to proceed to discovery and attempt to identify the manufacturers of the firearms used in their shootings as “machine guns” under the city’s “strict liability” law. On April 21, 2005, the D.C. Court of Appeals, in anenbanc hearing, unanimously dismissed all negligence and public nuisance claims, but let stand individual claims based upon a Washington, D.C. act imposing “strict liability” for manufacturers of “machine guns.” Based on present information, none of the Company’s products has been identified with any of the criminal assaults which form the basis of the individual claims. The writ of certiorari to the United States Supreme Court regarding the constitutionality of the Washington, D.C. act was denied and the case was remanded to the trial court for further proceedings. The defendants subsequently moved to dismiss the case based upon the Protection of Lawful Commerce in Arms Act, which motion was granted on May 22, 2006. The individual plaintiffs and the District of Columbia, which has subrogation claims in regard to the individual plaintiffs, have appealed.
The Indiana Court of Appeals affirmed the dismissal of theGary case by the trial court, but the Indiana Supreme Court reversed this dismissal and remanded the case for discovery proceedings on December 23, 2003.Gary is scheduled to begin trial in 2009. The defendants filed a motion to dismiss pursuant to the Protection of Lawful Commerce in Arms Act (“PLCAA”). The state court judge held the PLCAA unconstitutional and the defendants filed a motion with the Indiana Court of Appeals asking it to accept interlocutory appeal on the issue, which appeal was accepted on February 5, 2007.
In the previously reportedNew York City municipal case, the defendants moved to dismiss the suit pursuant to the Protection of Lawful Commerce in Arms Act. The trial judge found the Act to be constitutional but denied the defendants’ motion to dismiss the case, stating that the Act was not
30
applicable to the suit. The defendants were given leave to appeal and in fact have appealed the decision to the U.S. Court of Appeals for the Second Circuit. That appeal is pending.
In theNAACP case, on May 14, 2003, an advisory jury returned a verdict rejecting the NAACP’s claims. On July 21, 2003, Judge Jack B. Weinstein entered an order dismissing theNAACP lawsuit, but this order contained lengthy dicta which defendants believe are contrary to law and fact. Appeals by both sides were filed, but plaintiffs withdrew their appeal. On August 3, 2004, the United States Court of Appeals for the Second Circuit granted the NAACP’s motion to dismiss the defendants’ appeal of Judge Weinstein’s order denying defendants’ motion to strike his dicta made in his order dismissing the NAACP’s case, and the defendants’ motion for summary disposition was denied as moot. The ruling of the Second Circuit effectively confirmed the decision in favor of defendants and brought this matter to a conclusion.
Legislation has been passed in approximately 34 states precluding suits of the type brought by the municipalities mentioned above. On the Federal level, the “Protection of Lawful Commerce in Arms Act” was signed by President Bush on October 26, 2005. The Act requires dismissal of suits against manufacturers arising out of the lawful sale of their products for harm resulting from the criminal or unlawful misuse of a firearm by a third party. The Company is pursuing dismissal of each action involving such claims, including the municipal cases described above. On February 1, 2007, plaintiff’s counsel in the previously reportedArnold case advised that plaintiff intends to voluntarily dismiss the case with prejudice. This will conclude this matter with no payment by the Company.
Punitive damages, as well as compensatory damages, are commonly demanded in many of the lawsuits and claims brought against the Company. Aggregate claimed amounts may exceed product liability accruals and applicable insurance coverage. For claims made after July 10, 2000, coverage is provided on an annual basis for losses exceeding $5 million per claim, or an aggregate maximum loss of $10 million annually, except for certain new claims which might be brought by governments or municipalities after July 10, 2000, which are excluded from coverage.
Product liability claim payments are made when appropriate if, as, and when claimants and the Company reach agreement upon an amount to finally resolve all claims. Legal costs are paid as the lawsuits and claims develop, the timing of which may vary greatly from case to case. A time schedule cannot be determined in advance with any reliability concerning when payments will be made in any given case.
Provision is made for product liability claims based upon many factors related to the severity of the alleged injury and potential liability exposure, based upon prior claim experience. Because our experience in defending these lawsuits and claims is that unfavorable outcomes are typically not probable or estimable, only in rare cases is an accrual established for such costs. In most cases, an accrual is established only for estimated legal defense costs. Product liability accruals are periodically reviewed to reflect then-current estimates of possible liabilities and expenses incurred to date and reasonably anticipated in the future. Threatened product liability claims are reflected in our product liability accrual on the same basis as actual claims; i.e., an accrual is made for reasonably anticipated possible liability and claims-handling expenses on an ongoing basis.
A range of reasonably possible loss relating to unfavorable outcomes cannot be made. Currently, there are no product liability cases in which a dollar amount of damages is claimed. If there were cases with claimed damages, the amount of damages claimed would be set forth as an indication of possible
31
maximum liability that the Company might be required to incur in these cases (regardless of the likelihood or reasonable probability of any or all of this amount being awarded to claimants) as a result of adverse judgments that are sustained on appeal.
As of December 31, 2006 and 2005, the Company was a defendant in 4 and 6 lawsuits, respectively, involving its products and is aware of other such claims. During the year ended December 31, 2006 and 2005, respectively, 2 and 3 claims were filed against the Company, 2 and 5 claims were dismissed, and 2 and 1 claims were settled. The average cost per settled claim was $47,000 and $150,000 in 2006 and 2005, respectively.
During the years ended December 31, 2006 and 2005, the Company incurred product liability expense of $2.5 million and $4.9 million, respectively, which includes the cost of outside legal fees, insurance, and other expenses incurred in the management and defense of product liability matters.
The Company monitors the status of known claims and the product liability accrual, which includes amounts for asserted and unasserted claims. While it is not possible to forecast the outcome of litigation or the timing of costs, in the opinion of management, after consultation with special and corporate counsel, it is not probable and is unlikely that litigation, including punitive damage claims, will have a material adverse effect on the financial position of the Company, but may have a material impact on the Company’s financial results for a particular period.
The Company has reported all cases instituted against it through September 30, 2006 and the results of those cases, where terminated, to the S.E.C. on its previous Form 10-K and 10-Q reports, to which reference is hereby made.
Balance Sheet Rollforward for Product Liability Reserve
(Dollars in thousands)
| | | | | | | | | | | | | | | | | | | | | | | | | | | | | |
| | | | | | | | | | | Cash Payments | | | | | | | | | | | | |
| | | | | | | Accrued | | | | | | | | | | | | | | | | | | | | |
| | | | | | | Legal | | | | | | | | | | | | | | | | | | | | |
| | | Balance | | | Expense | | | | | | | | | | | | | | | | | | | Balance | |
| | | Beginning of | | | (Reversal) | | | Legal Fees | | | Settlements | | | Insurance | | | Admin. | | | End | |
| | | Year (a) | | | (b) | | | (c) | | | (d) | | | Premiums | | | Expense | | | of Year (a) | |
| | | |
| 2004 | | $ | 6,665 | | | | ($1,598 | ) | | | ($1,935 | ) | | | — | | | | N/A | | | | N/A | | | $ | 3,132 | |
| | | | | | | | | | | | | | | | | | | | | | | | | | | | | |
| 2005 | | | 3,132 | | | | 2,514 | | | | (2,935 | ) | | | (515 | ) | | | N/A | | | | N/A | | | | 2,196 | |
| | | | | | | | | | | | | | | | | | | | | | | | | | | | | |
| 2006 | | | 2,196 | | | | 688 | | | | (1,000 | ) | | | (143 | ) | | | N/A | | | | N/A | | | | 1,741 | |
Income Statement Detail for Product Liability Expense
(Dollars in thousands)
32
| | | | | | | | | | | | | | | | | |
| | | Accrued | | | Insurance | | | | | | | Total | |
| | | Legal | | | Premium | | | Admin. | | | Product | |
| | | Expense | | | Expense | | | Expense | | | Liability | |
| | | (b) | | | (e) | | | (f) | | | Expense | |
| | | |
| 2004 | | $ | (1,598 | ) | | $ | 1,524 | | | $ | 878 | | | $ | 804 | |
| | | | | | | | | | | | | | | | | |
| 2005 | | | 2,514 | | | | 1,338 | | | | 1,041 | | | | 4,893 | |
| | | | | | | | | | | | | | | | | |
| 2006 | | | 688 | | | | 1,141 | | | | 691 | | | | 2,520 | |
| | |
Notes |
|
(a) | | The beginning and ending liability balances represent accrued legal fees only. Settlements and administrative costs are expensed as incurred. Only in rare instances is an accrual established for settlements. |
|
(b) | | The expense accrued in the liability is for legal fees only. |
|
(c) | | Legal fees represent payments to outside counsel related to product liability matters. |
|
(d) | | Settlements represent payments made to plaintiffs or allegedly injured parties in exchange for a full and complete release of liability. |
|
(e) | | Insurance expense represents the cost of insurance premiums. |
|
(f) | | Administrative expense represents personnel related and travel expenses of Company employees and firearm experts related to the management and monitoring of product liability matters. |
There were no insurance recoveries during any of the above years.
Other Operational Matters
In the normal course of its manufacturing operations, the Company is subject to occasional governmental proceedings and orders pertaining to workplace safety, waste disposal, air emissions and water discharges into the environment. In 2009, the Company was served with a complaint captioned Secretary of Labor v. Sturm, Ruger & Co. Inc. pending before the Occupational Safety and Health Review Commission. The complaint arose out of a Notice of Contest filed by the Company pursuant to an OSHA inspection conducted at the Company’s manufacturing facility in Newport, New Hampshire. The matter was settled by agreement of the parties in December 2009. The Company believes that it is generally in compliance with applicable environmental and safety regulations and the outcome of suchany proceedings andor orders will not have a material adverse effect on the financial position or results of operations of the Company.
The Company self-insures a significant amount of its product liability, workersworkers’ compensation, medical, and other insurance. It also carries significant deductible amounts on various insurance policies.
The valuation of the future defined benefitdefined-benefit pension obligations at December 31, 20062009 and 20052008 indicated that these plans were underfunded by $7.6$12.2 million and $11.3$16.9 million, respectively, and resulted in a cumulative other comprehensive loss of $12.4$20.4 million and $12.2$23.0 million on the Company’s balance sheet at December 31, 20062009 and 2005,2008, respectively.
The Company expects to realize its deferred tax assets through tax deductions against future taxable income or carry back against taxes previously paid.income.
Inflation’s effect on the Company’s operations is most immediately felt in cost
reported income which would result from the slower recognition of increased costs when other methods are used. In 2006, however, the significant reduction in inventories resulted in a liquidation of LIFO inventory quantities carried at lower costs prevailing in prior years as compared with the current cost of purchases. This liquidation resulted in a reduction in costs of products sold by approximately $7.1 million in 2006. There was no LIFO liquidation in 2005 or 2004.
Critical Accounting Policies and Estimates
The preparation of financial statements in accordance with accounting principles generally accepted in the United States requires management to make assumptions and estimates that affect the reported amounts of assets and liabilities as of the balance sheet date and revenues and expenses recognized and incurred during the reporting period then ended. The Company bases estimates on prior experience, facts and circumstances, and other assumptions, including those reviewed with actuarial consultants and independent counsel, when applicable, that are believed to be reasonable. However, actual results may differ from these estimates.
The Company believes the determination of its product liability accrual is a critical accounting policy. The Company’s management reviews every lawsuit and claim at the outset and is in contact with independent and corporate counsel on an ongoing basis. The provision for product liability claims is based upon many factors, which vary for each case. These factors include the type of claim, nature and extent of injuries, historical settlement ranges, jurisdiction where filed, and advice of counsel. An accrual is established for each lawsuit and claim, when appropriate, based on the nature of each such lawsuit or claim.
Amounts are charged to product liability expense in the period in which the Company becomes aware that a claim or, in some instances a threat of claim, has been made when potential losses or costs of defense can be reasonably estimated. Such amounts are determined based on the Company’s experience in defending similar claims. Occasionally, charges are made for claims made in prior periods because the cumulative actual costs incurred for that claim, or reasonably expected to be incurred in the future, exceed amounts already provided. Likewise, credits may be taken if cumulative actual costs incurred for that claim, or reasonably expected to be incurred in the future, are less than amounts previously provided.
While it is not possible to forecast the outcome of litigation or the timing of costs, in the opinion of management, after consultation with independent and corporate counsel, it is not probable and is unlikely that litigation, including punitive damage claims, will have a material adverse effect on the financial position of the Company, but may have a material impact on the Company’s financial results for a particular period.
The Company believes the valuation of its inventory and the related excess and obsolescence reserve is also a critical accounting policy. Inventories are carried at the lower of cost, principally determined by the last-in, first-out (LIFO) method, or market. An actual valuation of inventory under the LIFO method is made at the end of each year based on the inventory levels and prevailing inventory costs existing at that time.
The Company determines its excess and obsolescence reserve by projecting the year in which inventory will be consumed into a finished product. Given ever-changing market conditions, customer preferences and the anticipated introduction of new products, it does not seem prudent nor supportable to carry
34
inventory at full cost beyond that needed during the next 36 months. Therefore, the Company estimates its excess and obsolescence inventory reserve based on the following parameters:
| | | | | |
| Projected Year | | Required | |
| Of Consumption | | Reserve % | |
| 2010 | | | 2 | % |
| 2011 | | | 10 | % |
| 2012 | | | 35 | % |
| 2010 and thereafter | | | 90 | % |
| Projected Year | Required |
| Of Consumption | Reserve % |
| | |
| 2010 | 2% |
| 2011 | 10% |
| 2012 | 35% |
| 2013 and thereafter | 90% |
Recent Accounting Pronouncements
In July 2006,June 2009, the Financial Accounting Standards Board (“FASB”(the “FASB”) issued Accounting Standards Codification (“ASC”) 105-10 (formerly SFAS 168), “The FASB Interpretation No. 48,Accounting for Uncertainty in Income Taxes.This Interpretation prescribes a recognition thresholdStandards Codification and measurement attribute for the financial statement recognition and measurementHierarchy of a tax position taken or expectedGenerally Accepted Accounting Principles.” ASC 105-10 became the authoritative U.S. GAAP recognized by the FASB to be taken in a tax return. This Interpretationapplied by nongovernment entities. It also provides guidance on derecognition, classification, interestmodifies the GAAP hierarchy to include only two levels of GAAP; authoritative and penalties, accounting in interim periods, disclosure, and transition. The Interpretation is effective for fiscal years beginning after December 15, 2006. We are currently evaluating the impact of this Interpretation on the Company’s financial position, results of operations and cash flows.
In September 2006, the FASB issued Statement of Financial Accounting Standards No. 157,Fair Value Measurements, (“FAS 157”). This Standard defines fair value, establishes a framework for measuring fair value under generally accepted accounting principles and expands disclosures about fair value measurements. FAS 157non-authoritative. ASC 105-10 is effective for financial statements issued for fiscal years beginninginterim and annual periods ending after NovemberSeptember 15, 2007 and interim periods within those fiscal years.2009. Therefore, the Company adopted ASC 105-10 for reporting in our 2009 third quarter. The adoption of FAS 157 isdid not expected to have a materialsignificant impact on the Company’s financial position, results of operations andor cash flows.
The
In July 2009, the FASB also issued in September 2006 StatementASC 855-10 (formally SFAS No. 165) “Subsequent Events,” which establishes general standards of Financial Accounting Standards No. 158,Employers’ Accountingaccounting for Defined Benefit Pension and Other Postretirement Plans — an amendmentdisclosures of FASB Statement No. 87, 88, 106 and 132(R),(“FAS 158”).FAS 158 provides recognition and disclosure elementsevents that occur after the balance sheet date but before financial statements are issued or are available to be effective asissued. The pronouncement requires the disclosure of the end of fiscal years ending after December 15, 2006date through which an entity has evaluated subsequent events and measurement elementsthe basis for that date, that is, whether that date represents the date the financial statements were issued or were available to be effective for fiscal years endingissued. This disclosure should alert all users of financial statements that an entity has not evaluated subsequent events after December 15, 2008. At December 31, 2006,that date in the set of financial statements being presented. The Company has reported $12.4 millionadopted FAS 165 during the second quarter of deferred pension losses, net of taxes, in accumulated other comprehensive income and has reported the $7.6 million unfunded status of the plans as a liability at December 31, 2006. See Footnote 3 “Pension Plans” for further discussion of the Company’s pension plans.2009.
Forward-Looking Statements and Projections
The Company may, from time to time, make forward-looking statements and projections concerning future expectations. Such statements are based on current expectations and are subject to certain qualifying risks and uncertainties, such as market demand, sales levels of firearms, anticipated castings sales and earnings, the need for external financing for operations or capital expenditures, the results of pending litigation against the Company including lawsuits filed by mayors, state attorneys general and other governmental entities and membership organizations, and the impact of future firearms control and
35
environmental legislation, any one or more of which could cause actual results to differ materially from those projected. Readers are cautioned not to place undue reliance on these forward-looking statements, which speak only as of the date made. The Company undertakes no obligation to publish revised forward-looking statements to reflect events or circumstances after the date such forward-looking statements are made or to reflect the occurrence of subsequent unanticipated events.
ITEM 7A—QUANTITATIVE AND QUALITATIVE DISCLOSURES ABOUT MARKET RISK
The Company is exposed to changing interest rates on its investments, which consistsconsist primarily of United States Treasury instruments with short-term (less than one year) maturities and cash. The interest rate market risk implicit in the Company’sCompany's investments at any given time is low, as the investments mature within short periods and the Company does not have significant exposure to changing interest rates on invested cash.
The Company has not undertaken any actions to cover interest rate market risk and is not a party to any interest rate market risk management activities.
A hypothetical ten percent change in market interest rates over the next year would not materially impact the Company’s earnings or cash flows. A hypothetical ten percent change in market interest rates would not have a material effect on the fair value of the Company’s investments.
ITEM 8—FINANCIAL STATEMENTS AND SUPPLEMENTARY DATA INDEX TO FINANCIAL STATEMENTS
| | |
| | Page |
Sturm, Ruger & Company, Inc. Financial Statements | | |
| | |
| Firm | | 3747 |
| | | |
| 2008 | | 4049 |
| | | |
| 2007 | | 4251 |
| | | |
| 2007 | | 4352 |
| | | |
| 2007 | | 4453 |
| | | |
| Financial Statements | | 4554 |
36
REPORT OF INDEPENDENT REGISTERED PUBLIC ACCOUNTING FIRM46
Report of Independent Registered Public Accounting Firm
To the Board of Directors and Stockholders
Sturm, Ruger & Company, Inc.
Southport, Connecticut
We have audited management’s assessment, included in Management’s Report on Internal Control over Financial Reporting appearing under Item 9A, that Sturm, Ruger & Company, Inc. maintained effective's internal control over financial reporting as of December 31, 2006,2009, based on criteria established inInternal Control-IntegratedControl—Integrated Framework issued by the Committee of Sponsoring Organizations of the Treadway Commission (COSO).Commission. Sturm, Ruger & Company, Inc.’s management is responsible for maintaining effective internal control over financial reporting and for its assessment of the effectiveness of internal control over financial reporting.reporting included in Management’s Report on Internal Control over Financial Reporting appearing under Item 9A. Our responsibility is to express an opinion on management’s assessment and an opinion on the effectiveness of the Company’sCompany's internal control over financial reporting based on our audit.
We conducted our audit in accordance with the standards of the Public Company Accounting Oversight Board (United
(United States). Those standards require that we plan and perform the audit to obtain reasonable assurance about whether effective internal control over financial reporting was maintained in all material respects. Our audit included obtaining an understanding of internal control over financial reporting, evaluating management’s assessment,assessing the risk that a material weakness exists, and testing and evaluating the design and operating effectiveness of internal control andbased on the assessed risk. Our audit also included performing such other procedures as we considered necessary in the circumstances. We believe that our audit provides a reasonable basis for our opinion.
A company’scompany's internal control over financial reporting is a process designed to provide reasonable assurance regarding the reliability of financial reporting and the preparation of financial statements for external purposes in accordance with generally accepted accounting principles. A company’scompany's internal control over financial reporting includes those policies and procedures that (1)(a) pertain to the maintenance of records that, in reasonable detail, accurately and fairly reflect the transactions and dispositions of the assets of the company; (2)(b) provide reasonable assurance that transactions are recorded as necessary to permit preparation of financial statements in accordance with generally accepted accounting principles, and that receipts and expenditures of the company are being made only in accordance with authorizations of management and directors of the company; and (3)(c) provide reasonable assurance regarding prevention or timely detection of unauthorized acquisition, use, or disposition of the company’scompany's assets that could have a material effect on the financial statements.
Because of its inherent limitations, internal control over financial reporting may not prevent or detect misstatements. Also, projections of any evaluation of effectiveness to future periods are subject to the risk that controls may become inadequate because of changes in conditions, or that the degree of compliance with the policies or procedures may deteriorate.
In our opinion, management’s assessment that Sturm, Ruger & Company, Inc. maintained effective internal control over financial reporting as of December 31, 2006, is fairly stated, in all material respects, based on criteria established inInternal Control-Integrated Framework issued by the Committee of Sponsoring Organizations of the Treadway Commission (COSO). Also, in our opinion, Sturm, Ruger & Company, Inc. maintained, in all material respects, effective internal control over financial reporting as of December 31, 2006,2009, based on the criteria established inInternal Control-IntegratedControl—Integrated Framework issued by the Committee of Sponsoring Organizations of the Treadway Commission (COSO).Commission.
We have also audited, in accordance with the standards of the Public Company Accounting Oversight Board (United States), the balance sheets of Sturm, Ruger & Company, Inc. as of December 31, 20062009 and 2005,2008, and the related statements of income, stockholders’ equity and cash flows for each of the three years thenin the period ended December 31, 2009, and our report dated March 2, 2007February 24, 2010 expressed an unqualified opinion.
/s/McGladrey & Pullen, LLP
Stamford, Connecticut
March 2, 2007
37
February 24, 2010
REPORT OF INDEPENDENT REGISTERED PUBLIC ACCOUNTINGReport of Independent Registered Public Accounting Firm
FIRM
To the Board of Directors and Stockholders
Sturm, Ruger & Company, Inc.
Southport, Connecticut
We have audited the accompanying balance sheets of Sturm, Ruger & Company, Inc. as of December 31, 20062009 and 2005,2008, and the related statements of income, stockholders’ equity, and cash flows for each of the three years then ended.in the period ended December 31, 2009. Our audits also included the financial statement schedule of Sturm, Ruger & Company, Inc. listed in Item 15(a) for 2006 and 2005.. These financial statements and financial statement schedule are the responsibility of the Company’sCompany's management. Our responsibility is to express an opinion on these financial statements based on our audits.
We conducted our audits in accordance with the standards of the Public Company Accounting Oversight Board (United States). Those standards require that we plan and perform the audits to obtain reasonable assurance about whether the financial statements are free of material misstatement. An audit includes examining, on a test basis, evidence supporting the amounts and disclosures in the financial statements. An audit also includes assessing the accounting principles used and significant estimates made by management, as well as evaluating the overall financial statement presentation. We believe that our audits provide a reasonable basis for our opinion.
In our opinion, the financial statements referred to above present fairly, in all material respects, the financial position of Sturm, Ruger & Company, Inc. as of December 31, 2006 and 2005, and the results of its operations and its cash flows for the years then ended in conformity with U.S. generally accepted accounting principles. Also, in our opinion, the related financial statement schedule, when considered in relation to the basic financial statements taken as a whole, presents fairly in all material respects the information set forth therein.
We also have audited, in accordance with the standards of the Public Company Accounting Oversight Board (United States), the effectiveness of Sturm, Ruger & Company, Inc.’s internal control over financial reporting as of December 31, 2006, based on criteria established inInternal Control-Integrated Framework issued by the Committee of Sponsoring Organizations of the Treadway Commission (COSO)and our report dated March 2, 2007 expressed an unqualified opinion on management’s assessment of the effectiveness of Sturm, Ruger & Company, Inc.’s internal control over financial reporting and an unqualified opinion on the effectiveness of Sturm, Ruger and Company, Inc.’s internal control over financial reporting.
/s/ McGladrey & Pullen, LLP
Stamford, Connecticut
March 2, 2007
38
Report of Independent Registered Public Accounting Firm
The Board of Directors and Stockholders
Sturm, Ruger & Company, Inc.:
We have audited the accompanying statements of income, stockholders’ equity, and cash flows of Sturm, Ruger & Company, Inc. for the year ended December 31, 2004. In connection with our audit of the financial statements, we have also audited the accompanying financial statement schedule. These financial statements and financial statement schedule are the responsibility of the Company’s management. Our responsibility is to express an opinion on these financial statements and financial statement schedule based on our audit.
We conducted our auditaudits in accordance with the standards of the Public Company Accounting Oversight Board (United States). Those standards require that we plan and perform the audit to obtain reasonable assurance about whether the financial statements are free of material misstatement. An audit includes examining, on a test basis, evidence supporting the amounts and disclosures in the financial statements. An audit also includes assessing the accounting principles used and significant estimates made by management, as well as evaluating the overall financial statement presentation. We believe that our audit providesaudits provide a reasonable basis for our opinion.
In our opinion, the financial statements referred to above present fairly, in all material respects, the results of operations and the cash flowsfinancial position of Sturm, Ruger & Company, Inc. as of December 31, 2009 and 2008, and the results of its operations and its cash flows for each of the yearthree years in the period ended December 31, 2004,2009, in conformity with U.S. generally accepted accounting principles. Also, in our opinion, the related financial statement schedule, when considered in relation to the basic financial statements taken as a whole, presents fairly in all material respects the information set forth therein.
/s/ KPMG LLP
Stamford, Connecticut
March 8, 2005, except as to note 4 to
We also have audited, in accordance with the standards of the Public Company Accounting Oversight Board (United States), Sturm, Ruger & Company, Inc.’s internal control over financial statements which isreporting as of MarchDecember 31, 20062009, based on criteria established in Internal Control—Integrated Framework issued by the Committee of Sponsoring Organizations of the Treadway Commission, and our report dated February 24, 2010 expressed an unqualified opinion on the effectiveness of Sturm, Ruger & Company, Inc.’s internal control over financial reporting.
39
/s/McGladrey & Pullen, LLP
Stamford, Connecticut
February 24, 2010
Balance Sheets
(Dollars in thousands, except per share data)
| | | | | | | | | |
| December 31, | | 2006 | | | 2005 | |
| |
Assets | | | | | | | | |
| | | | | | | | | |
| Current Assets | | | | | | | | |
| Cash and cash equivalents | | $ | 7,316 | | | $ | 4,057 | |
| Short-term investments | | | 22,026 | | | | 21,926 | |
| Trade receivables, net | | | 18,007 | | | | 15,777 | |
| | | | | | | | | |
| Gross inventories: | | | 87,477 | | | | 111,462 | |
| Less LIFO reserve | | | (57,555 | ) | | | (59,599 | ) |
| Less excess and obsolescence reserve | | | (5,516 | ) | | | (3,137 | ) |
| |
| Net inventories | | | 24,406 | | | | 48,726 | |
| |
| | | | | | | | | |
| Deferred income taxes | | | 8,347 | | | | 6,018 | |
| Prepaid expenses and other current assets | | | 1,683 | | | | 5,442 | |
| |
| Total Current Assets | | | 81,785 | | | | 101,946 | |
| | | | | | | | | |
| Property, Plant, and Equipment | | | 128,042 | | | | 155,174 | |
| Less allowances for depreciation | | | (105,081 | ) | | | (131,808 | ) |
| |
| Net property, plant and equipment | | | 22,961 | | | | 23,366 | |
| |
| | | | | | | | | |
| Deferred income taxes | | | 3,630 | | | | 3,200 | |
| Other assets | | | 8,690 | | | | 11,127 | |
| |
| Total Assets | | $ | 117,066 | | | $ | 139,639 | |
| |
| December 31, | | 2009 | | | 2008 | |
| | | | | | | |
Assets | | | | | | |
| Current Assets | | | | | | |
| Cash and cash equivalents | | $ | 5,008 | | | $ | 9,688 | |
| Short-term investments | | | 50,741 | | | | 18,558 | |
| Trade receivables, net | | | 25,049 | | | | 25,809 | |
| | | | | | | | | |
| Gross inventories | | | 51,048 | | | | 59,846 | |
| Less LIFO reserve | | | (38,663 | ) | | | (44,338 | ) |
| Less excess and obsolescence reserve | | | (2,727 | ) | | | (3,569 | ) |
| Net inventories | | | 9,658 | | | | 11,939 | |
| | | | | | | | | |
| Deferred income taxes | | | 5,893 | | | | 6,400 | |
| Prepaid expenses and other current assets | | | 2,062 | | | | 1,483 | |
| Total Current Assets | | | 98,411 | | | | 73,877 | |
| | | | | | | | | |
| Property, Plant, and Equipment | | | 134,057 | | | | 125,026 | |
| Less allowances for depreciation | | | (101,324 | ) | | | (98,807 | ) |
| Net property, plant and equipment | | | 32,733 | | | | 26,219 | |
| | | | | | | | | |
| Deferred income taxes | | | 6,190 | | | | 7,743 | |
| Other assets | | | 4,345 | | | | 4,921 | |
| Total Assets | | $ | 141,679 | | | $ | 112,760 | |
See accompanying notes to financial statements.
40
| | | | | | | | | |
| December 31, | | 2006 | | | 2005 | |
| |
Liabilities and Stockholders’ Equity | | | | | | | | |
| | | | | | | | | |
| Current Liabilities | | | | | | | | |
| Trade accounts payable and accrued expenses | | $ | 6,342 | | | $ | 3,619 | |
| Product liability | | | 904 | | | | 1,207 | |
| Employee compensation and benefits | | | 6,416 | | | | 7,544 | |
| Workers’ compensation | | | 6,547 | | | | 5,119 | |
| Income taxes payable | | | 1,054 | | | | 935 | |
| |
| Total Current Liabilities | | | 21,263 | | | | 18,424 | |
| | | | | | | | | |
| Accrued pension liability | | | 7,640 | | | | 8,648 | |
| Product liability | | | 837 | | | | 989 | |
| | | | | | | | | |
| Contingent liabilities (Note 6) | | | — | | | | — | |
| | | | | | | | | |
| Stockholders’ Equity | | | | | | | | |
| Common stock, non-voting, par value $1: | | | | | | | | |
| Authorized shares — 50,000; none issued | | | | | | | | |
| Common stock, par value $1: | | | | | | | | |
| Authorized shares — 40,000,000 | | | | | | | | |
| Issued and outstanding shares — 2006-22,638,700; 2005-26,910,700 | | | 22,639 | | | | 26,911 | |
| Additional paid-in capital | | | 2,615 | | | | 2,508 | |
| Retained earnings | | | 74,505 | | | | 94,334 | |
| Accumulated other comprehensive income (loss) | | | (12,433 | ) | | | (12,175 | ) |
| |
| Total Stockholders’ Equity | | | 87,326 | | | | 111,578 | |
| |
| Total Liabilities and Stockholders’ Equity | | $ | 117,066 | | | $ | 139,639 | |
| |
| December 31, | | 2009 | | | 2008 | |
| | | | | | | |
Liabilities and Stockholders’ Equity | | | | | | |
| Current Liabilities | | | | | | |
| Trade accounts payable and accrued expenses | | $ | 12,011 | | | $ | 10,235 | |
| Product liability | | | 1,147 | | | | 1,051 | |
| Employee compensation and benefits | | | 12,890 | | | | 7,994 | |
| Workers’ compensation | | | 5,443 | | | | 5,067 | |
| Income taxes payable | | | 1,543 | | | | 4,171 | |
| Line of credit | | | - | | | | 1,000 | |
| Total Current Liabilities | | | 33,034 | | | | 29,518 | |
| | | | | | | | | |
| Accrued pension liability | | | 12,194 | | | | 16,946 | |
| Product liability | | | 935 | | | | 693 | |
| | | | | | | | | |
| Contingent liabilities (Note 17) | | | - | | | | - | |
| | | | | | | | | |
| Stockholders’ Equity | | | | | | | | |
Common stock, non-voting, par value $1: Authorized shares – 50,000; none issued | | | | | | | | |
Common stock, par value $1: Authorized shares – 40,000,000 2009 – 22,826,601 issued,
19,072,780 outstanding 2008 – 22,798,732 issued,
19,047,323 outstanding | | | 22,827 | | | | 22,799 | |
| Additional paid-in capital | | | 8,031 | | | | 2,442 | |
| Retained earnings | | | 115,187 | | | | 93,500 | |
Less: Treasury stock – at cost
2009 – 3,753,821 shares
2008 – 3,751,419 shares | | | (30,167 | ) | | | (30,153 | ) |
| Accumulated other comprehensive loss | | | (20,362 | ) | | | (22,985 | ) |
| Total Stockholders’ Equity | | | 95,516 | | | | 65,603 | |
| Total Liabilities and Stockholders’ Equity | | $ | 141,679 | | | $ | 112,760 | |
See accompanying notes to financial statements.
41
Statements of Income
(In thousands, except per share data)
| | | | | | | | | | | | | |
| Year ended December 31, | | 2006 | | | 2005 | | | 2004 | |
| |
| Net firearms sales | | $ | 139,110 | | | $ | 132,805 | | | $ | 124,924 | |
| Net castings sales | | | 28,510 | | | | 21,917 | | | | 20,700 | |
| |
| Total net sales | | | 167,620 | | | | 154,722 | | | | 145,624 | |
| | | | | | | | | | | | | |
| Cost of products sold | | | 143,382 | | | | 128,343 | | | | 115,725 | |
| |
| Gross profit | | | 24,238 | | | | 26,379 | | | | 29,899 | |
| |
| |
| Expenses: | | | | | | | | | | | | |
| Selling | | | 16,150 | | | | 17,271 | | | | 16,700 | |
| General and administrative | | | 7,874 | | | | 7,271 | | | | 6,175 | |
| Impairment of assets | | | 494 | | | | 483 | | | | — | |
| |
| | | | 24,518 | | | | 25,025 | | | | 22,875 | |
| |
| | | | | | | | | | | | | |
| Operating (loss) income | | | (280 | ) | | | 1,354 | | | | 7,024 | |
| | | | | | | | | | | | | |
| Gain on sale of assets | | | 1,326 | | | | — | | | | 874 | |
| Other income-net | | | 797 | | | | 88 | | | | 153 | |
| |
| Total other income | | | 2,123 | | | | 88 | | | | 1,027 | |
| |
| | | | | | | | | | | | | |
| Income before income taxes | | | 1,843 | | | | 1,442 | | | | 8,051 | |
| | | | | | | | | | | | | |
| Income taxes | | | 739 | | | | 578 | | | | 3,228 | |
| |
| | | | | | | | | | | | | |
| Net income | | $ | 1,104 | | | $ | 864 | | | $ | 4,823 | |
| |
| | | | | | | | | | | | | |
| Basic and Diluted Earnings Per Share | | $ | 0.04 | | | $ | 0.03 | | | $ | 0.18 | |
| |
| | | | | | | | | | | | | |
| Cash Dividends Per Share | | $ | 0.00 | | | $ | 0.30 | | | $ | 0.60 | |
| |
| Year ended December 31, | | 2009 | | | 2008 | | | 2007 | |
| | | | | | | | | | |
| Net firearms sales | | $ | 266,566 | | | $ | 174,416 | | | $ | 144,222 | |
| Net castings sales | | | 4,419 | | | | 7,067 | | | | 12,263 | |
| Total net sales | | | 270,985 | | | | 181,483 | | | | 156,485 | |
| | | | | | | | | | | | | |
| Cost of products sold | | | 183,380 | | | | 138,730 | | | | 117,186 | |
| | | | | | | | | | | | | |
| Gross profit | | | 87,605 | | | | 42,753 | | | | 39,299 | |
| | | | | | | | | | | | | |
| Operating Expenses: | | | | | | | | | | | | |
| Selling | | | 21,822 | | | | 17,189 | | | | 15,092 | |
| General and administrative | | | 20,658 | | | | 12,867 | | | | 13,678 | |
| Pension plan curtailment charges | | | - | | | | - | | | | 1,143 | |
| Other operating (income) expenses, net | | | 1,221 | | | | (840 | ) | | | 271 | |
| Total operating expenses | | | 43,701 | | | | 29,216 | | | | 30,184 | |
| | | | | | | | | | | | | |
| Operating income | | | 43,904 | | | | 13,537 | | | | 9,115 | |
| | | | | | | | | | | | | |
| Other income: | | | | | | | | | | | | |
| Gain on sale of real estate | | | - | | | | - | | | | 5,168 | |
| Royalty income | | | 490 | | | | 141 | | | | 190 | |
| Interest income | | | 118 | | | | 405 | | | | 2,368 | |
| Interest expense | | | (158 | ) | | | (63 | ) | | | (107 | ) |
| Other income (expense), net | | | 6 | | | | (42 | ) | | | (75 | ) |
| Total other income, net | | | 456 | | | | 441 | | | | 7,544 | |
| | | | | | | | | | | | | |
| Income before income taxes | | | 44,360 | | | | 13,978 | | | | 16,659 | |
| | | | | | | | | | | | | |
| Income taxes | | | 16,857 | | | | 5,312 | | | | 6,330 | |
| | | | | | | | | | | | | |
| Net income | | $ | 27,503 | | | $ | 8,666 | | | $ | 10,329 | |
| | | | | | | | | | | | | |
| Basic Earnings Per Share | | $ | 1.44 | | | $ | 0.43 | | | $ | 0.46 | |
| | | | | | | | | | | | | |
| Fully Diluted Earnings Per Share | | $ | 1.42 | | | $ | 0.43 | | | $ | 0.46 | |
| | | | | | | | | | | | | |
| Cash Dividends Per Share | | $ | 0.31 | | | $ | 0.00 | | | $ | 0.00 | |
See accompanying notes to financial statements.
42
Statements of Stockholders’ Equity
(Dollars in thousands)
| | | | | | | | | | | | | | | | | | | | | |
| | | | | | | | | | | | | | | Accumulated | | |
| | | | | | | | | | | | | | | Other | | |
| | | Common | | Additional | | Retained | | Comprehensive | | |
| | | Stock | | Paid-in Capital | | Earnings | | Income (Loss) | | Total |
| |
| Balance at December 31, 2003 | | $ | 26,911 | | | $ | 2,508 | | | $ | 112,866 | | | $ | (8,645 | ) | | $ | 133,640 | |
| Net income | | | | | | | | | | | 4,823 | | | | | | | | 4,823 | |
| Additional minimum pension liability, net of deferred taxes of $1,086 | | | | | | | | | | | | | | | (1,630 | ) | | | (1,630 | ) |
| | | | | | | | | | | | | | | | | | | | | |
| Comprehensive income | | | | | | | | | | | | | | | | | | | 3,193 | |
| | | | | | | | | | | | | | | | | | | | | |
| Cash dividends | | | | | | | | | | | (16,146 | ) | | | | | | | (16,146 | ) |
| |
| Balance at December 31, 2004 | | | 26,911 | | | | 2,508 | | | | 101,543 | | | | (10,275 | ) | | | 120,687 | |
| Net income | | | | | | | | | | | 864 | | | | | | | | 864 | |
| Additional minimum pension liability, net of deferred taxes of $1,267 | | | | | | | | | | | | | | | (1,900 | ) | | | (1,900 | ) |
| | | | | | | | | | | | | | | | | | | | | |
| Comprehensive income | | | | | | | | | | | | | | | | | | | (1,036 | ) |
| | | | | | | | | | | | | | | | | | | | | |
| Cash dividends | | | | | | | | | | | (8,073 | ) | | | | | | | (8,073 | ) |
| |
| Balance at December 31, 2005 | | | 26,911 | | | | 2,508 | | | | 94,334 | | | | (12,175 | ) | | | 111,578 | |
| Net income | | | | | | | | | | | 1,104 | | | | | | | | 1,104 | |
| Pension liability, net of deferred taxes of $172 | | | | | | | | | | | | | | | (258 | ) | | | (258 | ) |
| Stock-based compensation, net of tax | | | | | | | 107 | | | | | | | | | | | | 107 | |
| | | | | | | | | | | | | | | | | | | | | |
| Comprehensive income | | | | | | | | | | | | | | | | | | | 953 | |
| | | | | | | | | | | | | | | | | | | | | |
| Repurchase of 4,272,000 shares of common stock | | | (4,272 | ) | | | | | | | (20,933 | ) | | | | | | | (25,205 | ) |
| |
| Balance at December 31, 2006 | | $ | 22,639 | | | $ | 2,615 | | | $ | 74,505 | | | $ | (12,433 | ) | | $ | 87,326 | |
| |
| | | Common Stock | | | Additional Paid-in Capital | | | Retained Earnings | | | Treasury Stock | | | Accumulated Other Comprehensive Loss | | | Total | |
| | | | | | | | | | | | | | | | | | | |
| Balance at December 31, 2006 | | $ | 22,639 | | | $ | 2,615 | | | $ | 74,505 | | | | - | | | $ | (12,433 | ) | | $ | 87,326 | |
| Net income | | | | | | | | | | | 10,329 | | | | | | | | | | | | 10,329 | |
| Pension liability, net of deferred taxes of $637 | | | | | | | | | | | | | | | | | | | (956 | ) | | | (956 | ) |
| Comprehensive income | | | | | | | | | | | | | | | | | | | | | | | 9,373 | |
| Stock-based compensation | | | 30 | | | | 1,017 | | | | | | | | | | | | | | | | 1,047 | |
| Exercise of options | | | 119 | | | | (1,796 | ) | | | | | | | | | | | | | | | (1,677 | ) |
| Repurchase of 2,216,000 shares of common stock | | | | | | | | | | | | | | $ | (20,000 | ) | | | | | | | (20,000 | ) |
| Balance at December 31, 2007 | | | 22,788 | | | | 1,836 | | | | 84,834 | | | | (20,000 | ) | | | (13,389 | ) | | | 76,069 | |
| Net income | | | | | | | | | | | 8,666 | | | | | | | | | | | | 8,666 | |
| Pension liability, net of deferred taxes of $5,882 | | | | | | | | | | | | | | | | | | | (9,596 | ) | | | (9,596 | ) |
| Comprehensive loss | | | | | | | | | | | | | | | | | | | | | | | (930 | ) |
| Stock-based compensation | | | 11 | | | | 606 | | | | | | | | | | | | | | | | 617 | |
| Repurchase of 1,535,400 shares of common stock | | | | | | | | | | | | | | | (10,153 | ) | | | | | | | (10,153 | ) |
| Balance at December 31, 2008 | | | 22,799 | | | | 2,442 | | | | 93,500 | | | | (30,153 | ) | | | (22,985 | ) | | | 65,603 | |
| Net income | | | | | | | | | | | 27,503 | | | | | | | | | | | | 27,503 | |
| Pension liability, net of deferred taxes of $1,608 | | | | | | | | | | | | | | | | | | | 2,623 | | | | 2,623 | |
| Comprehensive income | | | | | | | | | | | | | | | | | | | | | | | 30,126 | |
| Stock-based compensation | | | | | | | 4,205 | | | | | | | | | | | | | | | | 4,205 | |
| Exercise of options: | | | | | | | | | | | | | | | | | | | | | | | | |
| Tax benefit from exercise of options | | | | | | | 1,412 | | | | | | | | | | | | | | | | 1,412 | |
| Issuance of 27,869 shares of common stock | | | 28 | | | | (28 | ) | | | | | | | | | | | | | | | | |
| Repurchase of 2,401 shares of common stock | | | | | | | | | | | | | | | (14 | ) | | | | | | | (14 | ) |
| Dividends paid | | | | | | | | | | | (5,816 | ) | | | | | | | | | | | (5,816 | ) |
| Balance at December 31, 2009 | | $ | 22,827 | | | $ | 8,031 | | | $ | 115,187 | | | $ | (30,167 | ) | | $ | (20,362 | ) | | $ | 95,516 | |
See accompanying notes to financial statements.
43
Statements of Cash Flows
(In thousands)
| | | | | | | | | | | | | |
| Year ended December 31, | | 2006 | | | 2005 | | | 2004 | |
| |
Operating Activities | | | | | | | | | | | | |
| Net income | | $ | 1,104 | | | $ | 864 | | | $ | 4,823 | |
| Adjustments to reconcile net income to cash provided by operating activities: | | | | | | | | | | | | |
| Depreciation | | | 3,852 | | | | 5,440 | | | | 5,827 | |
| Impairment of assets | | | 494 | | | | 483 | | | | — | |
| Gain on sale of assets | | | (1,326 | ) | | | — | | | | (874 | ) |
| Deferred income taxes | | | (2,759 | ) | | | (328 | ) | | | 1,855 | |
| Changes in operating assets and liabilities: | | | | | | | | | | | | |
| Trade receivables | | | (2,230 | ) | | | 305 | | | | (3,268 | ) |
| Inventories | | | 24,320 | | | | 1,659 | | | | (1,855 | ) |
| Trade accounts payable and other liabilities | | | 3,023 | | | | 13 | | | | (81 | ) |
| Product liability | | | (455 | ) | | | (936 | ) | | | (3,533 | ) |
| Prepaid expenses and other assets | | | 4,077 | | | | (2,422 | ) | | | (1,132 | ) |
| Income taxes | | | 119 | | | | 167 | | | | (451 | ) |
| |
| Cash provided by operating activities | | | 30,219 | | | | 5,245 | | | | 1,311 | |
| | | | | | | | | | | | | |
Investing Activities | | | | | | | | | | | | |
| Property, plant, and equipment additions | | | (3,906 | ) | | | (4,460 | ) | | | (6,945 | ) |
| Purchases of short-term investments | | | (114,585 | ) | | | (125,245 | ) | | | (123,098 | ) |
| Proceeds from sales or maturities of short-term investments | | | 114,485 | | | | 131,749 | | | | 144,693 | |
| Net proceeds from sale of assets | | | 2,251 | | | | — | | | | 1,580 | |
| |
| Cash (used for) provided by investing activities | | | (1,755 | ) | | | 2,044 | | | | 16,230 | |
| | | | | | | | | | | | | |
Financing Activities | | | | | | | | | | | | |
| Repurchase and retirement of common stock | | | (25,205 | ) | | | — | | | | — | |
| Dividends paid | | | — | | | | (8,073 | ) | | | (16,146 | ) |
| |
| Cash used for financing activities | | | (25,205 | ) | | | (8,073 | ) | | | (16,146 | ) |
| |
| | | | | | | | | | | | | |
| Increase (Decrease) in cash and cash equivalents | | | 3,259 | | | | (784 | ) | | | 1,395 | |
| Cash and cash equivalents at beginning of year | | | 4,057 | | | | 4,841 | | | | 3,446 | |
| |
| Cash and Cash Equivalents at End of Year | | $ | 7,316 | | | $ | 4,057 | | | $ | 4,841 | |
| |
| Year ended December 31, | | 2009 | | | 2008 | | | 2007 | |
| | | | | | | | | | |
| Operating Activities | | | | | | | | | |
| Net income | | $ | 27,503 | | | $ | 8,666 | | | $ | 10,329 | |
Adjustments to reconcile net income to cash provided by operating activities: | | | | | | | | | | | | |
| Depreciation | | | 7,300 | | | | 5,365 | | | | 4,372 | |
| Stock-based compensation | | | 4,205 | | | | 467 | | | | 496 | |
| Slow moving inventory valuation adjustment | | | 239 | | | | 495 | | | | (1,590 | ) |
| Impairment of assets | | | - | | | | - | | | | 2,264 | |
| Pension plan curtailment charge | | | - | | | | - | | | | 1,143 | |
| Gain on sale of assets | | | (45 | ) | | | (95 | ) | | | (7,141 | ) |
| Deferred income taxes | | | 2,060 | | | | (4,639 | ) | | | 2,473 | |
| Changes in operating assets and liabilities: | | | | | | | | | | | | |
| Trade receivables | | | 760 | | | | (10,173 | ) | | | 2,371 | |
| Inventories | | | 2,042 | | | | 863 | | | | 12,699 | |
| Trade accounts payable and other liabilities | | | 7,046 | | | | 4,667 | | | | (1,001 | ) |
| Product liability | | | 339 | | | | (189 | ) | | | 192 | |
| Prepaid expenses and other assets | | | (2,132 | ) | | | 1,995 | | | | (6,644 | ) |
| Income taxes | | | (2,628 | ) | | | 3,760 | | | | (643 | ) |
| Cash provided by operating activities | | | 46,689 | | | | 11,182 | | | | 19,320 | |
| | | | | | | | | | | | | |
| Investing Activities | | | | | | | | | | | | |
| Property, plant, and equipment additions | | | (13,819 | ) | | | (9,488 | ) | | | (4,468 | ) |
| Purchases of short-term investments | | | (77,281 | ) | | | (45,363 | ) | | | (51,328 | ) |
| Proceeds from sales or maturities of short-term investments | | | 45,098 | | | | 57,309 | | | | 42,850 | |
| Net proceeds from sale of assets | | | 51 | | | | 95 | | | | 12,542 | |
| Cash provided by (used for) investing activities | | | (45,951 | ) | | | 2,553 | | | | (404 | ) |
| | | | | | | | | | | | | |
| Financing Activities | | | | | | | | | | | | |
| Dividends paid | | | (5,816 | ) | | | - | | | | - | |
| Tax benefit from exercise of stock options | | | 1,412 | | | | - | | | | - | |
| Cashless exercise of stock options | | | - | | | | - | | | | (1,126 | ) |
| Repurchase of common stock | | | (14 | ) | | | (10,153 | ) | | | (20,000 | ) |
| (Repayment of) increase in line of credit | | | (1,000 | ) | | | 1,000 | | | | - | |
| Cash used for financing activities | | | (5,418 | ) | | | (9,153 | ) | | | (21,126 | ) |
| | | | | | | | | | | | | |
| (Decrease) increase in cash and cash equivalents | | | (4,680 | ) | | | 4,582 | | | | (2,210 | ) |
| Cash and cash equivalents at beginning of year | | | 9,688 | | | | 5,106 | | | | 7,316 | |
| Cash and cash equivalents at end of year | | $ | 5,008 | | | $ | 9,688 | | | $ | 5,106 | |
See accompanying notes to financial statements.
44
Notes to Financial Statements
(Dollars in thousands, except per share)
1. Summary of Significant Accounting Policies
Organization
Sturm, Ruger & Company, Inc. (the “Company”) is principally engaged in the design, manufacture, and sale of firearms and precision investment castings.to domestic customers. Approximately 98% of the Company’s total sales for the year ended December 31, 2009 were from the firearms segment. Export sales represent less than 4% of firearms sales. The Company’s design and manufacturing operations are located in the United States. More than 95% of all sales areStates and most product content is domestic. Export sales account for less than 5% of total sales. The Company’s firearms are sold through a select number of independent wholesale distributors principally to the commercial sporting market.
The Company also manufactures and law enforcement markets.sells investment castings made from steel alloys for both outside customers and internal use in the firearms segment. Investment castings are sold to outside customers, either directly to or through manufacturer’smanufacturers’ representatives, to companies in a wide varietywere approximately 2% of industries.the Company’s total sales for the year ended December 31, 2009.
Use
Preparation of EstimatesFinancial Statements
The Company follows United States generally accepted accounting principles (“GAAP”). The preparation of financial statements in conformity with U.S. generally accepted accounting principlesGAAP requires management to make estimates and assumptions that affect the reported amounts reported inof assets and liabilities and disclosure of contingent liabilities at the date of the financial statements and accompanying notes.the reported amounts of revenues and expenses during the reporting period. Actual results could differ from thosethese estimates.
The significant accounting policies described below, together with the notes that follow, are an integral part of the Financial Statements.
Revenue Recognition
Substantially all product sales are sold FOB (free on board) shipping point. Revenue is recognized net of any estimated discounts, sales incentives, or rebates, when product is shipped and the customer takes ownership and assumes the risk of loss. Accruals are made for sales discounts and incentives based on the Company’s experience. The Company accounts for cash sales discounts as a reduction in sales and sales incentives as a charge to selling expense. Amounts billed to customers for shipping and handling fees are included in net sales and costs incurred by the Company for the delivery of goods are classified as cost of goods sold and other operating charges in the Statement of Income. Taxes on revenue producing transactions are excluded from net sales.
Cash Equivalents
The Company considers interest-bearing deposits with financial institutions with remaining maturities of three months or less at the time of acquisition to be cash equivalents.
Short-term Investments
Short-term investments consist principally of United States Treasury instruments, all maturing within one year, and are recorded at cost plus accrued interest, which approximates market, and consist of a bank-managed money market fund that invests principally in United States Treasury instruments, all maturing within one year.fair value. The income from short-term investments is included in other income —– net. The Company intends to hold these investments until maturity.
Accounts Receivable Accounts receivable balances for significant customers follow:
| | | | | | | | | |
| As of December 31, (in thousands) | | 2006 | | | 2005 | |
| |
| Customer 1 | | $ | 2,200 | | | $ | 1,900 | |
| Customer 2 | | $ | 1,800 | | | $ | 2,900 | |
| Customer 3 | | $ | 1,300 | | | $ | 2,200 | |
| Customer 4 | | $ | 700 | | | $ | 800 | |
| |
The allowance for doubtful accounts and discounts was $0.4 million and $0.7 million in 2006 and 2005, respectively.
The Company establishes an allowance for doubtful accounts based on the credit worthiness of its customers and historical experience. While the Company uses the best information available to make its evaluation, future adjustments to the allowance for doubtful accounts may be necessary if there are significant changes in economic and industry conditions or any other factors considered in the Company’s evaluation. Bad debt expense has been immaterial during each of the last three years.
45
Inventories
Inventories
The majority of the Company’s inventories are statedvalued at the lower of cost, principally determined by the last-in, first-out (LIFO) method, or market. IfElements of cost in inventories had been valued using the first-in, first-out method, inventory values would have been higher by approximately $57.6 millioninclude raw materials, direct labor and $59.6 million at December 31, 2006 and 2005, respectively. During 2006, inventory quantities were reduced. This reduction resulted in a liquidation of LIFO inventory quantities carried at lower costs prevailing in prior years as compared with the current cost of purchases, the effect of which decreased costs of products sold by approximately $7.1 million and increased net income by $4.3 million in 2006. There was no LIFO liquidation in 2005 or 2004.manufacturing overhead.
Inventories consist of the following:
| | | | | | | | | |
| As of December 31, (in thousands) | | 2006 | | | 2005 | |
| |
| Finished products | | $ | 3,906 | | | $ | 9,997 | |
| Materials and products in process | | | 20,500 | | | | 38,729 | |
| | | | | | | |
| Net inventories | | $ | 24,406 | | | $ | 48,726 | |
| | | | | | | |
Property, Plant, and Equipment
Property, plant, and equipment are stated on the basis ofcarried at cost. Depreciation is computed over useful lives using the straight-line and declining balance methods predominately over 15 years for buildings, 10 years for machinery and equipment and 3 years for buildings, machinery and equipment, and tools and dies, respectively.dies. When assets are retired, sold or otherwise disposed of, their gross carrying values and related accumulated depreciation are removed from the accounts and a gain or loss on such disposals is recognized when appropriate.
Property, plant
Maintenance and equipment consist of the following:repairs are charged to operations; replacements and improvements are capitalized.
| | | | | | | | | |
| As of December 31, (in thousands) | | 2006 | | | 2005 | |
| |
| Land and improvements | | $ | 1,652 | | | $ | 1,652 | |
| Buildings and improvements | | | 23,795 | | | | 23,501 | |
| Machinery and equipment | | | 86,155 | | | | 100,903 | |
| Dies and tools | | | 16,440 | | | | 29,118 | |
| | | | | | | |
| | | $ | 128,042 | | | $ | 155,174 | |
| | | | | | | |
Long-lived Assets
The Company evaluates the carrying value of long-lived assets are reviewed for impairment wheneverto be held and used when events or changes in circumstances indicate that the carrying amount of an assetvalue may not be recoverable in accordance with Statement of Financial Accounting Standards (“SFAS”) No. 144.recoverable. In performing this review, the carrying value of the assets is compared to the projected undiscounted cash flows to be generated from the assets. If the sum of the undiscounted expected future cash flows is less than the carrying value of the assets, the assets are considered to be impaired. Impairment losses are measured as the amount by which the carrying value of the assets exceeds thetheir fair value. The Company bases fair value of the assets on quoted market prices if available or, if not available, quoted market prices of similar assets. When fair value estimatesWhere quoted market prices are not available, the Company estimates fair value using the estimated future cash flows generated by the assets discounted at a rate commensurate with the risks associated with the recovery of the assets.
In 2006, $12.0 million of machinery and equipment and $13.4 million of dies and tools no longer used in operations, and $25.4 million of corresponding accumulated depreciation, were reclassified to other assets. As the net book value of these assets was zero, there was no increase to other assets. In 2005,
46
$8.3 million of buildings and improvements no longer used in operations, and $5.6 million of corresponding accumulated depreciation were reclassified to other assets.
Income Taxes
Income taxes are accounted for using the asset and liability method in accordance with SFAS No. 109.method. Under this method, deferred income taxes are recognized for the tax consequences of “temporary differences” by applying enacted statutory rates applicable to future years to temporary differences between the financial statement carrying amounts and the tax basis of the Company’s assets and liabilities.
Product Liability
The Company provides for product liability claims including estimated legal costs to be incurred defending such claims. The provision for product liability claims is charged to cost of products sold.
Advertising Costs
The Company expenses advertising costs as incurred. Advertising expenses for the years ended December 31, 2006, 2005,2009, 2008, and 2004,2007, were $1.9$2.7 million, $2.0$2.3 million, and $2.5$2.6 million, respectively.
Shipping Costs
Costs incurred related to the shipment of products are included in selling expense. Such costs totaled $1.9$2.7 million, $1.9$2.6 million, and $1.7$2.3 million in 2006, 2005,2009, 2008, and 2004,2007, respectively.
Stock Options
Effective January 1, 2006,Research and Development
In 2009, 2008, and 2007, the Company adopted the fair value recognition provisions of FASB Statement 123(R),Share-Based Payment, utilizing the modified prospective approach. Priorspent approximately $2.0 million, $1.5 million, and $0.7 million, respectively, on research activities relating to the adoptiondevelopment of SFAS 123(R)new products and the Company accounted for stock option grants in accordance with APB Opinion 25,Accounting for Stock Issued to Employees, (the intrinsic value method),improvement of existing products. Research and accordingly, recognized no compensation expense for stock option grants.development costs are expensed as incurred.
Under the modified prospective approach, the provisions of SFAS 123(R) apply to new awards and to awards that were outstanding on January 1, 2006 that are subsequently modified, repurchased or cancelled. Under the modified prospective approach, compensation cost recognized in the year ended December 31, 2006 includes compensation cost for all share-based payments granted prior to, but not yet vested as of January 1, 2006, based on the grant-date fair value estimated in accordance with the original provisions of SFAS 123, and compensation cost for all share-based payments granted subsequent to January 1, 2006, based on the grant-date fair value estimated in accordance with the provisions of SFAS 123(R). Prior periods were not restated to reflect the impact of adopting the new standard.
Earnings Perper Share
Basic earnings per share is based upon the weighted-average number of shares of Common Stockcommon stock outstanding during the year, which was 25,775,400 in 2006 and 26,910,700 in 2005 and 2004.year. Diluted earnings per share reflect the impact of options outstanding using the treasury stock method. This results in diluted weighted-average shares outstanding of 25,787,600 in 2006, 26,910,700 in 2005 and 26,930,000 in 2004.
Reclassifications
Certain prior year balances may have been reclassified to conform withto current year presentation.
47
Recent Accounting Pronouncements
In July 2006,June 2009, the Financial Accounting Standards Board (“FASB”(the “FASB”) issued Accounting Standards Codification (“ASC”) 105-10 (formerly SFAS 168), “The FASB Interpretation No. 48,Accounting for Uncertainty in Income Taxes.This Interpretation prescribes a recognition thresholdStandards Codification and measurement attribute for the financial statement recognition and measurementHierarchy of a tax position taken or expectedGenerally Accepted Accounting Principles.” ASC 105-10 became the authoritative U.S. GAAP recognized by the FASB to be taken in a tax return. This Interpretationapplied by nongovernment entities. It also provides guidance on de-recognition, classification, interestmodifies the GAAP hierarchy to include only two levels of GAAP; authoritative and penalties, accounting in interim periods, disclosure, and transition. The Interpretation is effective for fiscal years beginning after December 15, 2006. We are currently evaluating the impact of this Interpretation on the Company’s financial position, results of operations and cash flows.
In September 2006, the FASB issued Statement of Financial Accounting Standards No. 157,Fair Value Measurements, (“FAS 157”). This Standard defines fair value, establishes a framework for measuring fair value under generally accepted accounting principles and expands disclosures about fair value measurements. FAS 157non-authoritative. ASC 105-10 is effective for financial statements issued for fiscal years beginninginterim and annual periods ending after NovemberSeptember 15, 2007 and interim periods within those fiscal years.2009. Therefore, the Company adopted ASC 105-10 for reporting in our 2009 third quarter. The adoption of FAS 157 isdid not expected to have a materialsignificant impact on the Company’s financial position, results of operations andor cash flows.
In July 2009, the FASB issued ASC 855-10 (formally SFAS No. 165) “Subsequent Events,” which establishes general standards of accounting for and disclosures of events that occur after the balance sheet date but before financial statements are issued or are available to be issued. The pronouncement requires the disclosure of the date through which an entity has evaluated subsequent events and the basis for that date, that is, whether that date represents the date the financial statements were issued or were available to be issued. This disclosure should alert all users of financial statements that an entity has not evaluated subsequent events after that date in the set of financial statements being presented. The Company adopted FAS 165 during the second quarter of 2009.
2.Trade Receivables, Net
Trade receivables consist of the following:
| December 31, | | 2009 | | | 2008 | |
| | | | | | | |
| Trade receivables | | $ | 25,750 | | | $ | 26,384 | |
| Allowance for doubtful accounts | | | (209 | ) | | | (126 | ) |
| Allowance for discounts | | | (492 | ) | | | (449 | ) |
| | | $ | 25,049 | | | $ | 25,809 | |
In 2009, the largest individual trade receivables accounted for 16%, 14%, 13%, and 13% of total trade receivables. In 2008, the largest individual trade receivables accounted for 15%, 15%, 13%, 12%, and 12% of total trade receivables.
3.Inventories
Inventories consist of the following:
| December 31, | | 2009 | | | 2008 | |
| | | | | | | |
| Finished products | | $ | 4,623 | | | $ | 2,790 | |
| Materials and products in process | | | 43,698 | | | | 53,487 | |
| | | | 48,321 | | | | 56,277 | |
| Adjustment of inventories to a LIFO basis | | | (38,663 | ) | | | (44,338 | ) |
| | | $ | 9,658 | | | $ | 11,939 | |
During 2009 and 2008, inventory quantities were reduced. These reductions resulted in liquidations of LIFO inventory quantities carried at lower costs prevailing in prior years as compared with the current cost of purchases, the effect of which decreased costs of products sold by approximately $5.1 million and $3.7 million in 2009 and 2008, respectively.
4.Property, Plant and Equipment
Property, plant and equipment consist of the following:
| December 31, | | 2009 | | | 2008 | |
| | | | | | | |
| Land and improvements | | $ | 1,194 | | | $ | 1,194 | |
| Buildings and improvements | | | 24,535 | | | | 24,488 | |
| Machinery and equipment | | | 87,052 | | | | 80,046 | |
| Dies and tools | | | 21,276 | | | | 19,298 | |
| | | $ | 134,057 | | | $ | 125,026 | |
5.Other Assets
Other assets consist of the following:
| December 31, | | 2009 | | | 2008 | |
| | | | | | | |
| Patents, at cost | | $ | 4,504 | | | $ | 4,379 | |
| Less: accumulated amortization | | | (2,112 | ) | | | (1,851 | ) |
| Other | | | 1,953 | | | | 2,393 | |
| | | $ | 4,345 | | | $ | 4,921 | |
The FASB also issuedcapitalized cost of patents is amortized using the straight-line method over their useful lives. The cost of patent amortization was $0.3 million, $0.2 million and $0.2 million in September 2006 Statement of Financial Accounting Standards No. 158,Employers’ Accounting2009, 2008 and 2007, respectively. The estimated annual patent amortization cost for Defined Benefit Pension and Other Postretirement Plans – an amendment of FASB Statement No. 87, 88, 106 and 132(R),(“FAS 158”).FAS 158 provides recognition and disclosure elements to be effective aseach of the endnext five years is $0.2 million. Costs incurred to maintain existing patents are charged to expense in the year incurred.
6.Trade Accounts Payable and Accrued Expenses
Trade accounts payable and accrued expenses consist of fiscal years ending afterthe following:
| December 31, | | 2009 | | | 2008 | |
| | | | | | | |
| Trade accounts payable | | $ | 6,812 | | | $ | 4,129 | |
| Product safety modifications | | | 90 | | | | 1,584 | |
| Accrued expenses | | | 5,109 | | | | 4,522 | |
| | | $ | 12,011 | | | $ | 10,235 | |
7. Line of Credit
In December 15, 20062007, the Company established an unsecured $25 million revolving line of credit with a bank. This facility is renewable annually and measurement elements to be effective for fiscal years ending afternow terminates on December 15, 2008.12, 2010. The balance outstanding on this credit facility was $0.0 million and $1.0 million at December 31, 2009 and 2008, respectively. Borrowings under this facility bear interest at LIBOR (0.99% at December 31, 2009) plus 200 basis points and the Company is charged 50 basis points per year on the unused portion. At December 31, 2006,2009 and 2008, the Company has reported $12.4 million of deferred pension losses, net of taxes,was in accumulated other comprehensive incomecompliance with the terms and has reported the $7.6 million unfunded statuscovenants of the plans as a liability at December 31, 2006. See Footnote 3 “Pension Plans” for further discussioncredit facility.
2. Income Taxes
The Federal and state income tax provision consisted of the following (in thousands):8.Employee Benefit Plans
| | | | | | | | | | | | | | | | | | | | | | | | | |
| Year ended December 31, | | 2006 | | | 2005 | | | 2004 | |
| | | Current | | | Deferred | | | Current | | | Deferred | | | Current | | | Deferred | |
| |
| Federal | | $ | 2,587 | | | $ | (1,925 | ) | | $ | 690 | | | $ | (260 | ) | | $ | 931 | | | $ | 1,556 | |
| State | | | 739 | | | | (662 | ) | | | 204 | | | | (56 | ) | | | 442 | | | | 299 | |
| |
| | | $ | 3,326 | | | $ | (2,587 | ) | | $ | 894 | | | $ | (316 | ) | | $ | 1,373 | | | $ | 1,855 | |
| |
Significant components of the Company’s deferred tax assets and liabilities are as follows (in thousands):Defined Benefit Plans
| | | | | | | | | |
| December 31, | | 2006 | | | 2005 | |
| |
| Deferred tax assets: | | | | | | | | |
| Product liability | | $ | 698 | | | $ | 881 | |
| Employee compensation and benefits | | | 4,081 | | | | 3,749 | |
| Allowances for doubtful accounts and discounts | | | 458 | | | | 316 | |
48
| | | | | | | | | |
| December 31, | | 2006 | | | 2005 | |
| Inventories | | | 2,674 | | | | 1,715 | |
| Additional minimum pension liability | | | 8,289 | | | | 8,117 | |
| Other | | | 2,467 | | | | 1,533 | |
| |
| Total deferred tax assets | | | 18,667 | | | | 16,311 | |
| |
| Deferred tax liabilities: | | | | | | | | |
| Depreciation | | | 1,030 | | | | 783 | |
| Pension plans | | | 5,428 | | | | 5,994 | |
| Other | | | 232 | | | | 316 | |
| |
| Total deferred tax liabilities | | | 6,690 | | | | 7,093 | |
| |
| Net deferred tax assets | | $ | 11,977 | | | $ | 9,218 | |
| |
In accordance with the provisions of SFAS No. 87, “Employers’ Accounting for Pension Plan Costs,” changes in deferred tax assets relating to the additional minimum pension liability are not charged to expense and are therefore not included in the deferred tax provision, instead they are charged to other comprehensive income.
The effective income tax rate varied from the statutory Federal income tax rate as follows:
| | | | | | | | | | | | | |
| Year ended December 31, | | 2006 | | | 2005 | | | 2004 | |
| |
| Statutory Federal income tax rate | | | 34.0 | % | | | 34.0 | % | | | 35.0 | % |
| State income taxes, net of Federal tax benefit | | | 4.2 | | | | 7.5 | | | | 6.2 | |
| Other items | | | 1.9 | | | | (1.4 | ) | | | (1.1 | ) |
| |
| Effective income tax rate | | | 40.1 | % | | | 40.1 | % | | | 40.1 | % |
| |
The Company made income tax payments of approximately $0.2 million, $3.1 million, and $2.6 million, during 2006, 2005, and 2004, respectively. The Company expects to realize its deferred tax assets through tax deductions against future taxable income or carry back against taxes previously paid.
3. Pension Plans
The Company sponsors two qualified defined benefit pension plans that cover substantially all employees. A third defined benefit pension plan is non-qualified and covers certain executive officers of the Company. The Company also sponsors a defined contribution 401(k) plan that covers substantially all employees.
The cost of these
In 2007, the Company amended its hourly and salaried defined benefit pension plans so that employees no longer accrue benefits under them effective December 31, 2007. This action “froze” the benefits for all employees and prevented future hires from joining the plans, effective December 31, 2007. Currently, the Company provides supplemental discretionary contributions to substantially all employees’ individual 401(k) accounts.
There was no minimum required cash contribution for the defined benefit plans for 2009 or 2010, but there may be such a requirement in future years. The Company voluntarily contributed $2.0 million to the defined benefit plans in both 2008 and 2009. The Company plans on voluntarily contributing approximately $2 million in 2010. The intent of these discretionary contributions is to reduce the amount of time that the Company will be required to continue to operate the frozen plans. The ongoing cost of running the plans (even if frozen) is approximately $200,000 per year, which includes PBGC premiums, actuary and audit fees, and other expenses.
In the fourth quarter of 2008 and the balancesfirst quarter of 2009, the Company settled $2.3 million and $2.1 million, respectively, of pension liabilities through the purchases of group annuities. These transactions resulted in an insignificant actuarial gain.
There is no minimum required cash contribution for the defined benefit plans for 2010, but there may be such a requirement in future years because of recent market volatility which has adversely affected investment returns for the plans’ assets. In 2011 and future years, the Company may be required to make cash contributions to the two defined benefit pension plans according to the new rules of the Pension Protection Act of 2006. The annual contributions will be based on the amount of the unfunded plan liabilities derived from the frozen benefits and will not include liabilities for any future accrued benefits for any new or existing participants. The total amount of these future cash contributions will be dependent on the investment returns generated by the plans’ assets and obligations arethe then-applicable discount rates used to calculate the plans’ liabilities.
The measurement dates of the assets and liabilities of all plans presented for 2009 and 2008 were December 31, 2009 and December 31, 2008, respectively.
Summarized information on the Company’s defined benefit pension plans is as follows (in thousands):follows:
| | | | | | | | | |
| Change in Benefit Obligation | | 2006 | | | 2005 | |
| |
| Benefit obligation at January 1 | | $ | 64,481 | | | $ | 59,114 | |
| Service cost | | | 1,670 | | | | 1,650 | |
| Interest cost | | | 3,444 | | | | 3,340 | |
| Actuarial loss (gain) | | | (3,051 | ) | | | 2,248 | |
| Benefits paid | | | (2,377 | ) | | | (1,871 | ) |
| |
| Benefit obligation at December 31 | | | 64,167 | | | | 64,481 | |
| |
| | | | | | | | | |
Change in Plan Assets | | | | | | | | |
| |
| Fair value of plan assets at January 1 | | | 53,206 | | | | 50,344 | |
| Actual return on plan assets | | | 3,463 | | | | 1,876 | |
49
| Obligations and Funded Status at December 31 | | 2009 | | | 2008 | |
| | | | | | | |
| Change in Benefit Obligation | | | | | | |
| Benefit obligation at beginning of year | | $ | 60,326 | | | $ | 68,674 | |
| Service cost | | | - | | | | - | |
| Interest cost | | | 3,735 | | | | 3,768 | |
| Actuarial loss (gain) | | | 4,821 | | | | (3,727 | ) |
| Benefits paid | | | (4,742 | ) | | | (8,389 | ) |
| Benefit obligation at end of year | | | 64,140 | | | | 60,326 | |
| | | | | | | | | |
| Change in Plan Assets | | | | | | | | |
| Fair value of plan assets at beginning of year | | | 43,380 | | | | 63,834 | |
| Actual return on plan assets | | | 11,154 | | | | (15,001 | ) |
| Employer contributions | | | 2,154 | | | | 2,936 | |
| Benefits paid | | | (4,742 | ) | | | (8,389 | ) |
| Fair value of plan assets at end of year | | | 51,946 | | | | 43,380 | |
| | | | | | | | | |
| Funded Status | | | | | | | | |
| Funded status | | | (12,194 | ) | | | (16,946 | ) |
| Unrecognized net actuarial loss | | | 32,841 | | | | 37,065 | |
| Unrecognized prior service cost | | | - | | | | 6 | |
| Net amount recognized | | $ | 20,647 | | | $ | 20,125 | |
Weighted Average Assumptions for the years ended December 31, | | 2009 | | | 2008 | |
| Discount rate | | | 5.75 | % | | | 6.25 | % |
| Expected long-term return on plan assets | | | 8.00 | % | | | 8.00 | % |
| Rate of compensation increases | | | N/A | | | | N/A | |
| | | | | | | | | |
| Components of Net Periodic Pension Cost | | | 2009 | | | | 2008 | |
| Service cost | | $ | - | | | $ | - | |
| Interest cost | | | 3,735 | | | | 3,768 | |
| Expected return on assets | | | (3,361 | ) | | | (4,999 | ) |
| Recognized gains | | | 1,253 | | | | 581 | |
| Prior service cost recognized | | | 6 | | | | 13 | |
| Net periodic pension cost | | $ | 1,633 | | | $ | (637 | ) |
| Amounts Recognized on the Balance Sheet | | 2009 | | | 2008 | |
| Accrued benefit liability | | $ | (12,194 | ) | | $ | (16,946 | ) |
| Accumulated other comprehensive income, net of tax | | | 20,362 | | | | 22,985 | |
| Deferred tax asset | | | 12,479 | | | | 14,086 | |
| | | $ | 20,647 | | | $ | 20,125 | |
| | | | | | | | | |
| Change in Benefit Obligation | | 2006 | | | 2005 | |
| Employer contributions | | | 2,236 | | | | 2,857 | |
| Benefits paid | | | (2,378 | ) | | | (1,871 | ) |
| |
| Fair value of plan assets at December 31 | | | 56,527 | | | | 53,206 | |
| |
| | | | | | | | | |
Funded Status | | | | | | | | |
| |
| Funded status | | | (7,640 | ) | | | (11,275 | ) |
| Unrecognized net actuarial loss | | | 19,398 | | | | 22,920 | |
| Unrecognized prior service cost | | | 1,324 | | | | 1,484 | |
| Unrecognized transition obligation (asset) | | | — | | | | — | |
| |
| Net amount recognized | | $ | 13,082 | | | $ | 13,129 | |
| |
| | | | | | | | | |
| Weighted Average Assumptions for the years | | | | | | |
| ended December 31, | | 2006 | | | 2005 | |
| |
| Discount rate | | | 5.50 | % | | | 5.75 | % |
| Expected long-term return on plan assets | | | 8.00 | % | | | 8.00 | % |
| Rate of compensation increases | | | 5.00 | % | | | 5.00 | % |
| |
| | | | | | | | | |
Components of Net Periodic Pension Cost | | | | | | | | |
| |
| Service cost | | $ | 1,670 | | | $ | 1,650 | |
| Interest cost | | | 3,444 | | | | 3,340 | |
| Expected return on assets | | | (4,235 | ) | | | (4,041 | ) |
| Amortization of unrecognized transition asset | | | — | | | | 11 | |
| Recognized gains | | | 1,243 | | | | 1,041 | |
| Prior service cost recognized | | | 161 | | | | 257 | |
| |
| Net periodic pension cost | | $ | 2,283 | | | $ | 2,258 | |
| |
60
| | | | | | | | | |
| Amounts Recognized on the Balance Sheet | | 2006 | | | 2005 | |
| |
| Accrued benefit liability | | $ | (7,640 | ) | | $ | (8,648 | ) |
| Intangible asset | | | — | | | | 1,485 | |
| Accumulated other comprehensive income, net of tax | | | 12,433 | | | | 12,175 | |
| Deferred tax asset | | | 8,289 | | | | 8,117 | |
| |
| | | $ | 13,082 | | | $ | 13,129 | |
| |
| | | | | | | | | |
| Weighted Average Assumptions as of December 31, | | 2006 | | | 2005 | |
| |
| Discount rate | | | 5.75 | % | | | 5.50 | % |
| Rate of compensation increases | | | 5.00 | % | | | 5.00 | % |
| |
| | | | | | | | | |
| Information for Pension Plans with an Accumulated | | | | | | |
| Benefit Obligation in excess of plan assets | | 2006 | | | 2005 | |
| |
| Projected benefit obligation | | $ | 64,167 | | | $ | 64,481 | |
| Accumulated benefit obligation | | $ | 62,284 | | | $ | 61,854 | |
| Fair value of plan assets | | $ | 56,527 | | | $ | 53,206 | |
| |
50
| Weighted Average Assumptions as of December 31, | | 2009 | | | 2008 | |
| Discount rate | | | 5.75 | % | | | 6.25 | % |
| Rate of compensation increases | | | N/A | | | | N/A | |
| | | | | | | | | |
| Information for Pension Plans with an Accumulated Benefit Obligation in excess of plan assets | | | 2009 | | | | 2008 | |
| Projected benefit obligation | | $ | 64,140 | | | $ | 60,326 | |
| Accumulated benefit obligation | | $ | 64,140 | | | $ | 60,326 | |
| Fair value of plan assets | | $ | 51,946 | | | $ | 43,380 | |
| | | | | | | | | |
| Pension Weighted Average Asset Allocations as of December 31, | | | 2009 | | | | 2008 | |
| Debt securities | | | 29 | % | | | 35 | % |
| Equity securities | | | 65 | % | | | 58 | % |
| Real estate | | | 5 | % | | | 4 | % |
| Money market funds | | | 1 | % | | | 3 | % |
| | | | 100 | % | | | 100 | % |
| | | | | | | | | |
| Pension Weighted Average Asset Allocations as of | | | | | | |
| December 31, | | 2006 | | | 2005 | |
| |
| Debt securities | | | 70 | % | | | 70 | % |
| Equity securities | | | 27 | % | | | 27 | % |
| Money market funds | | | 3 | % | | | 3 | % |
| |
| | | | 100 | % | | | 100 | % |
| |
The estimated future benefit payments for the defined benefit plans which reflect future service as appropriate, for each of the next five years and the total amount for years six through ten, are as follows: 2007-$2.4 million, 2008-$2.6 million, 2009-2010-$3.0 million, 2010-2011-$3.1 million, 2011-2012-$3.3 million, 2013-$3.6 million, 2014-$3.8 million and for the five year period ending 2016-2019-$21.2 million.
The accumulated benefit obligation for all the defined benefit pension plans was $62.3 million and $61.9 million as of December 31, 2006 and 2005, respectively.
The measurement dates of the assets and liabilities of all plans presented for 2006 and 2005 were December 31, 2006 and December 31, 2005, respectively.
Prior service cost of $0.2 million and unrecognized losses of $1.1 million included in accumulated other comprehensive income as of December 31, 2006 are expected to be recognized as components of net periodic pension cost in 2007.
The Company expects to contribute $1.9 million in the form of cash payments to its pension plans in 2007. This contribution is not required by funding regulations or laws. The current investment objective is to produce income and long-term appreciation through a target asset allocation of 75% debt securities and other fixed income investments including cash and short-term instruments, and 25% of equity investments, to provide for the current and future benefit payments of the plans. The Company anticipates modifying the investment allocation during 2007 to include a higher percentage of equity investments, and to transition to the new asset allocation over the 18 months thereafter. The pension plans are not invested in the common stock of the Company.
The Company determines the expected return on plan assets based on the target asset allocations. In addition, the historical returns of the plan assets are also considered in arriving at the expected rate of return.
In accordance with SFAS No. 158, “Employers’ Accounting for Defined Benefit Pension and Other Postretirement Plans” and its predecessor, SFAS No. 87, “Employers’ Accounting for Pension Costs”, the
The Company recorded an additional minimum pension liability adjustment, net of tax, which increased comprehensive income by $2.6 million in 2009 and decreased comprehensive income by $0.3 million, $1.9$9.6 million and $1.6$0.9 million, in 2006, 2005,2008 and 2004,2007, respectively.
Plan Assets
The current investment objective is to produce income and long-term appreciation through a target asset allocation of 35% debt securities and other fixed income investments including cash and short-term instruments, and 65% equity investments, to provide for the current and future benefit payments of the plans. The pension plans are not invested in the common stock of the Company.
The Company adopted the provisions of ASC 820.10 which defines fair value, establishes a framework for measuring fair value in generally accepted accounting principles, and expands disclosures about fair value measurements. The Company has determined that all financial assets of both its defined benefit pension plans are level 2 in the fair value hierarchy established by ASC 820.10. The valuation of level 2 assets are based on inputs, other than quoted prices in active markets, that are either directly or indirectly observable for the assets.
The disclosures focus on the inputs used to measure fair value. The following is a description of the valuation methodologies used to measure the plans’ assets at fair value:
Pooled separate accounts: Valued at the net asset value (“NAV”) of units held by the plans at year end, which is determined by aggregating the quoted market values of the underlying assets.
Money market funds: Valued at the NAV of shares held by the plans at year end, which is generally intended to approximate one dollar per share.
The following table sets forth the defined benefit plans’ assets at fair value:
| December 31, | | 2009 | | | 2008 | |
| | | | | | | |
| Pooled separate accounts: | | | | | | |
| Equity securities: | | | | | | |
| U.S. small cap equity funds | | $ | 5,929 | | | $ | 4,396 | |
| U.S. mid-cap equity funds | | | 14,659 | | | | 10,468 | |
| U.S. large-cap equity funds | | | 5,342 | | | | 4,408 | |
| International equity funds | | | 8,502 | | | | 5,876 | |
| Domestic real estate funds | | | 2,439 | | | | 1,822 | |
| Fixed income securities: | | | | | | | | |
| Corporate bond funds | | | 15,014 | | | | 15,117 | |
| Money market fund | | | 61 | | | | 1,293 | |
| | | $ | 51,946 | | | $ | 43,380 | |
Defined Contribution Plans
Prior to 2007, the Company also sponsorssponsored two qualified defined contribution plans which coverthat covered substantially all of its hourly and salaried employees and a non-qualified defined contribution plan which covers certain of its salaried employees. Expenses related to the defined contribution plans were $1.1 million, $1.5 million, and $0.7 million in 2006, 2005, and 2004, respectively.
Effective January 1, 2007, allthe qualified and non-qualified defined contribution plans were merged into a single 401(k) plan. Under the terms of the 401(k) plan, the Company will begin matchingmatches a certain portion of employee contributions. Expenses related to matching employee contributions effective January 1, 2007.to the 401(k) plan were $1.8 million, $1.3 million and $0.8 million in 2009, 2008 and 2007, respectively.
Additionally, in 2009 and 2008 the Company costs underprovided supplemental discretionary contributions to the matchingindividual 401(k) accounts of substantially all employees. Each employee received a supplemental contribution to their account based on a uniform percentage of qualifying base compensation established annually. The cost of these supplemental contributions totaled $1.7 million and $1.4 million in 2009 and 2008, respectively.
51
Non-Qualified Plan
provisions
The Company also sponsors a non-qualified defined contribution plan, the Supplemental Executive Retirement Plan, which covers certain of its salaried employees. In the first quarter of 2008, the Company made lump sum benefit payments to two participants in this plan. These payments, which totaled $2.1 million, represented the actuarially determined present value of the new plan are expected to approximate aggregate Company costs recognized under the three prior defined contribution plans.
FAS No. 158 requires an employer to measure the funded status of a planparticipants’ accrued benefit as of the date of payment. Only one participant, who is retired, remains in this plan.
9.Other Operating Expenses (Income), net
Other net operating expenses (income) consist of the following:
| Year ended December 31, | | 2009 | | | 2008 | | | 2007 | |
| | | | | | | | | | |
| Gain on sale of operating assets (a) | | $ | (45 | ) | | $ | (95 | ) | | $ | (472 | ) |
| Impairment of operating assets (b) | | | - | | | | - | | | | 489 | |
| Gain on sale of real estate (c) | | | - | | | | - | | | | (1,521 | ) |
| Impairment of real estate held for sale (d) | | | - | | | | - | | | | 1,775 | |
| Frozen defined-benefit pension plan expense (income) | | | 1,266 | | | | (745 | ) | | | - | |
| Total other operating expenses (income), net | | $ | 1,221 | | | $ | (840 | ) | | $ | 271 | |
| (a) | The gain on sale of operating assets was generated primarily from the sale of used machinery and equipment related to firearms. Most of the used machinery and equipment sold in 2007, however, was related to titanium investment casting. |
| (b) | In 2007, the Company recognized an impairment charge of $0.5 million related to machinery and equipment previously in the Company’s Arizona investment casting operations. |
| (c) | On April 16, 2007, the Company sold a non-manufacturing facility in Arizona for $5.0 million. This facility had not been used in the Company’s operations for several years. The Company realized a gain of approximately $1.5 million from this sale. |
| (d) | In late 2007, the Company recognized an asset impairment charge of $1.8 million related to the Dorr Building, a non-manufacturing property in New Hampshire. The Company demolished most of the Dorr Building in 2009. |
The asset impairment charges were recognized to reduce the carrying value of these assets to fair value because the carrying value of the affected assets exceeded their projected future undiscounted cash flows. The amount of the impairment charge was estimated using present value techniques.
10.Income Taxes
The Company files income tax returns in the U.S. federal jurisdiction and various state jurisdictions. With few exceptions, the Company is no longer subject to U.S. federal and state income tax examinations by tax authorities for years before 2005.
The Federal and state income tax provision consisted of the following:
| Year ended December 31, | | 2009 | | | 2008 | | | 2007 | |
| | | Current | | | Deferred | | | Current | | | Deferred | | | Current | | | Deferred | |
| Federal | | $ | 13,572 | | | $ | 230 | | | $ | 3,298 | | | $ | 1,057 | | | $ | 3,782 | | | $ | 1,516 | |
| State | | | 3,005 | | | | 50 | | | | 721 | | | | 236 | | | | 687 | | | | 345 | |
| | | $ | 16,577 | | | $ | 280 | | | $ | 4,019 | | | $ | 1,293 | | | $ | 4,469 | | | $ | 1,861 | |
The effective income tax rate varied from the statutory federal income tax rate as follows:
| Year ended December 31, | | 2009 | | | 2008 | | | 2007 | |
| Statutory Federal income tax rate | | | 35.0 | % | | | 35.0 | % | | | 35.0 | % |
| State income taxes, net of Federal tax benefit | | | 4.5 | | | | 4.5 | | | | 4.3 | |
| Domestic production activities deduction | | | (2.1 | ) | | | (2.1 | ) | | | (1.7 | ) |
| Other items | | | 0.6 | | | | 0.6 | | | | 0.4 | |
| Effective income tax rate | | | 38.0 | % | | | 38.0 | % | | | 38.0 | % |
Significant components of the Company’s deferred tax assets and liabilities are as follows:
| December 31, | | 2009 | | | 2008 | |
| Deferred tax assets: | | | | | | |
| Product liability | | $ | 791 | | | $ | 663 | |
| Employee compensation and benefits | | | 3,527 | | | | 3,285 | |
| Allowances for doubtful accounts and discounts | | | 732 | | | | 458 | |
| Depreciation | | | 213 | | | | 201 | |
| Inventories | | | 1,114 | | | | 1,458 | |
| Additional minimum pension liability | | | 12,479 | | | | 14,086 | |
| Stock-based compensation | | | 939 | | | | - | |
| Asset impairment charges | | | 122 | | | | 913 | |
| Product safety modification charges | | | 34 | | | | 601 | |
| Other | | | 253 | | | | 393 | |
| Total deferred tax assets | | | 20,204 | | | | 22,057 | |
| Deferred tax liabilities: | | | | | | | | |
| Pension plans | | | 7,919 | | | | 7,721 | |
| Other | | | 202 | | | | 193 | |
| Total deferred tax liabilities | | | 8,121 | | | | 7,914 | |
| Net deferred tax assets | | $ | 12,083 | | | $ | 14,143 | |
Changes in deferred tax assets relating to the additional minimum pension liability are not charged to expense and are therefore not included in the deferred tax provision; instead they are charged to other comprehensive income.
The Company made income tax payments of approximately $18.9 million, $0.0 million, and $4.9 million, during 2009, 2008, and 2007, respectively. The Company expects to realize its year-end datedeferred tax assets through tax deductions against future taxable income or carry back against taxes previously paid. In 2009, the Company received a tax refund of $1.4 million related to the exercise of stock options in prior years.
The Company does not believe it has included any “uncertain tax positions” in its federal income tax return or any of the state income tax returns it is currently filing. The Company has made an evaluation of the potential impact of additional state taxes being assessed by jurisdictions in which the Company does not currently consider itself liable. The Company does not anticipate that such additional taxes, if any, would result in a material change to its financial position. However, the Company anticipates that it is more likely than not that additional federal and state tax liabilities in the range of $0.4 to $0.8 million exist. The Company has recorded $0.8 million relating to these additional federal and state income taxes, including approximately $0.2 million for the payment of interest and penalties. These amounts are included in income taxes payable at December 31, 2009 and 2008. The Company has included interest and penalties related to uncertain tax positions as a component of its provision for taxes.
11.Earnings Per Share
Set forth below is first effectivea reconciliation of the numerator and denominator for fiscal 2006basis and diluted earnings per share calculations for the periods indicated:
| Year ended December 31, | | 2009 | | | 2008 | | | 2007 | |
| | | | | | | | | | |
| Numerator: | | | | | | | | | |
| Net income | | $ | 27,503 | | | $ | 8,666 | | | $ | 10,329 | |
| Denominator: | | | | | | | | | | | | |
| Weighted average number of common shares outstanding - Basic | | | 19,061,321 | | | | 20,069,200 | | | | 22,441,700 | |
| Dilutive effect of options and restricted stock units outstanding under the Company’s employee compensation plans | | | 259,735 | | | | 15,400 | | | | 315,800 | |
| Weighted average number of common shares outstanding – Diluted | | | 19,321,056 | | | | 20,084,600 | | | | 22,757,500 | |
The dilutive effect of outstanding options and restricted stock units is calculated using the treasury stock method. The weighted average number of common shares outstanding decreased from the previous year in 2009 and 2008 as a result of the Company’s stock repurchase plans, which were authorized by the Board of Directors in 2007 and 2008. See Note 12 for further information.
The following average numbers of stock options are anti-dilutive and therefore are not included in the diluted earnings per share calculation:
| Year ended December 31, | | 2009 | | | 2008 | | | 2007 | |
| | | | | | | | | | |
| Average number of stock options | | | 456,250 | | | | 1,282,250 | | | | - | |
12.Stock Repurchases
In 2009, the Company repurchased 2,400 shares of its common stock, representing 0.1% of the then outstanding shares, in the open market at an average price of $6.03 per share.
In 2008, the Company repurchased 1,535,000 shares of its common stock, representing 7.5% of the then outstanding shares, in the open market at an average price of $6.57 per share.
In 2007, the Company repurchased 2,216,000 shares of its common stock, representing 9.7% of the then outstanding shares, in the open market at an average price of $8.99 per share.
All of these purchases were made with cash held by the Company and is reflected in the following presentationno debt was incurred.
At December 31, 2009, $4.7 million remained authorized for share repurchases. In February 2010, the Company recorded a chargeannounced that the Board of $1.6Directors expanded this repurchase program from $4.7 million net of tax, to other comprehensive income and a $2.6 million credit to accrued pension liability.$10 million.
4. Restatement of 2004 Financial Statements
As previously reported in 2005, the financial statements for the year ended December 31, 2004 have been restated to reduce cost of goods sold by $0.9 million. The misstatement was caused by an error in the calculation of the 2004 LIFO index. This restatement increased net income by $0.5 million or $0.02 per share for the year ended December 31, 2004.13.Share-based Compensation
5. Stock Incentive and Bonus Plans
In 1998, the Company adopted, and in May 1999 the shareholders approved, the 1998 Stock Incentive Plan (the “1998 Plan”) under which employees may bewere granted options to purchase shares of the Company’s Common Stock and stock appreciation rights. The Company has reserved 2,000,000 shares for issuance under the 1998 Plan. These options have an exercise price equal to the fair market value of the shares of the Company at the date of grant, become vested ratably over five years, and expire ten years from the date of grant. To date, noIn April 2007, all reserved shares for which a stock appreciation rights haveoption had not been granted.granted under the 1998 Plan were deregistered. No further stock options or stock will be granted under the 1998 Plan.
On December 18, 2000, the Company adopted, and in May 2001 the shareholders approved, the 2001 Stock Option Plan for Non-Employee Directors (the “2001 Plan”) under which non-employee directors arewere granted options to purchase shares of the Company’s authorized but unissued stock. The Company has reserved 200,000 shares for issuance under the 2001 Plan. Options granted under the 2001 Plan have an exercise price equal to the fair market value of the shares of the Company at the date of grant and expire ten years from the date of grant. Twenty-five percent of the options vest immediately upon grant and the remaining options vest ratably over three years. In April 2007, all reserved shares for which a stock option had not been granted under the 2001 Plan were deregistered. No further stock options or stock will be granted under the 2001 Plan.
In April 2007, the Company adopted and the shareholders approved the 2007 Stock Incentive Plan (the “2007 SIP”) under which employees, independent contractors, and non-employee directors may be granted stock options, restricted stock, deferred stock awards, restricted stock units, and stock appreciation rights, any of which may or may not require the achievement of performance objectives. Vesting requirements are determined by the Compensation Committee or the Board of Directors. The following table summarizesCompany reserved 2,550,000 shares for issuance under the activity of the Plans:
| | | | | | | | | | | | | | | | | |
| | | | | | | | | | | | | | | Weighted Avg |
| | | | | | | | | | | Weighted Avg | | Remaining |
| | | | | | | Weighted Avg | | Grant Date | | Contractual |
| | | Shares | | Exercise Price | | Fair Value | | Life (Years) |
| |
| Outstanding at December 31, 2003 | | | 1,095,000 | | | $ | 11.55 | | | $ | 1.86 | | | | 5.32 | |
| Granted | | | — | | | | — | | | | — | | | | — | |
| Exercised | | | — | | | | — | | | | — | | | | — | |
| Canceled | | | — | | | | — | | | | — | | | | — | |
| |
| Outstanding at December 31, 2004 | | | 1,095,000 | | | | 11.55 | | | | 1.86 | | | | 4.32 | |
| Granted | | | 40,000 | | | | 10.88 | | | | 2.24 | | | | 9.5 | |
| Exercised | | | — | | | | — | | | | | | | | | |
| Canceled | | | (115,000 | ) | | | 11.74 | | | | 1.83 | | | | 3.15 | |
| |
52
| | | | | | | | | | | | | | | | | |
| | | | | | | | | | | | | | | Weighted Avg |
| | | | | | | | | | | Weighted Avg | | Remaining |
| | | | | | | Weighted Avg | | Grant Date | | Contractual |
| | | Shares | | Exercise Price | | Fair Value | | Life (Years) |
| Outstanding at December 31, 2005 | | | 1,020,000 | | | | 11.50 | | | | 1.89 | | | | 3.31 | |
| Granted | | | 660,000 | | | | 8.51 | | | | 3.51 | | | | 9.7 | |
| Exercised | | | — | | | | — | | | | — | | | | — | |
| Canceled | | | (355,000 | ) | | | 11.90 | | | | 2.00 | | | | 2.3 | |
| |
| Outstanding at December 31, 2006 | | | 1,325,000 | | | | 9.46 | | | | 2.66 | | | | 5.4 | |
| |
| Exercisable Options Outstanding at December 31, 2006 | | | 670,000 | | | | 11.18 | | | | 1.95 | | | | 2.7 | |
| |
| Non-Vested Options Outstanding at December 31, 2006 | | | 655,000 | | | $ | 7.70 | | | $ | 3.50 | | | | 9.7 | |
| |
There were 670,000 exercisable options at December 31, 2006, with a weighted average exercise price of $11.18 and an average contractual life remaining of 2.7 years.2007 SIP. At December 31, 2006,2009, an aggregate of 875,0001,733,750 shares remain available for grant under the Plans.Plan.
Compensation expense related to stock options is recognized based on the grant-date fair value of the awards estimated using the Black-Scholes option pricing model. Compensation expense related to deferred stock, restricted stock, and restricted stock units is recognized based on the grant-date fair value of the Company’s common stock. The total stock-based compensation cost included in the Statements of Income was $4.2 million, $0.4 million and $0.1 million in 2009, 2008 and 2007, respectively. The 2009 expense was unusually high because stock options and restricted stock units that were granted over several years vested in 2009 as a result of the extraordinary operating performance in 2009.
Stock Options
For purposes of determining the fair value of stock option awards, the Company uses the Black-Scholes option pricing model to estimateand the fair value of stock-based awards withassumptions set forth in the following weighted average assumptions: dividend yield of 0.0%, expected volatility of 44.3%, risk free rate of return of 4.0%, and expected lives of 5 years. table below.
| | | 2009 | | | 2008 | | | 2007 | |
| Dividend yield | | | 0.0 | % | | | 0.0 | % | | | 0.0 | % |
| Expected volatility | | | 41.0 | % | | | 47.6 | % | | | 33.9 | % |
| Risk free rate of return | | | 4.0 | % | | | 4.0 | % | | | 4.0 | % |
| Expected lives | | 8.0 years | | | 7.5 years | | | 7.5 years | |
The estimated fair value of options granted is subject to the assumptions made and if the assumptions changed, the estimated fair value amounts could be significantly different.
The Company’s Stock Bonus Plan, as amended, covers its key employees excluding membersfollowing table summarizes the stock option activity of the Ruger family. Pursuant to the Plan, awards are made of Common Stock and a cash bonus approximating the estimated income tax on the awards. At December 31, 2005, 502,000 shares of Common Stock were reserved for future awards.Plans:
As a result of adopting Statement 123(R) on January 1, 2006, the Company’s income before income taxes and net income for the year ended December 31, 2006 are $176,000 and $106,000 lower, respectively, than if it had continued to account for share-based compensation under Opinion 25 for stock option grants. Basic and diluted earnings per share were unchanged. If the Company would have adopted Statement 123(R) for the year ended December 31, 2005, the Company’s income before income taxes and net income for that period would have been $39,000 and $23,000 lower, respectively, than the amounts previously reported and basic and diluted earnings per share would have been unchanged.
| | | Shares | | | Weighted Average Exercise Price | | | Weighted Average Grant Date Fair Value | | | Weighted Average Remaining Contractual Life (Years) | |
| Outstanding at December 31, 2006 | | | 1,325,000 | | | $ | 9.46 | | | $ | 2.66 | | | | 4.4 | |
| Granted | | | 311,250 | | | | 13.06 | | | | 5.67 | | | | 8.3 | |
| Exercised | | | (495,000 | ) | | | 11.77 | | | | 1.92 | | | | 0.2 | |
| Canceled | | | (50,000 | ) | | | 9.59 | | | | 1.24 | | | | 2.5 | |
| Outstanding at December 31, 2007 | | | 1,091,250 | | | | 9.44 | | | | 3.91 | | | | 7.4 | |
| Granted | | | 359,000 | | | | 8.10 | | | | 4.39 | | | | 8.4 | |
| Exercised | | | - | | | | - | | | | - | | | | - | |
| Canceled | | | (30,000 | ) | | | 13.39 | | | | 5.64 | | | | 7.5 | |
| Outstanding at December 31, 2008 | | | 1,420,250 | | | | 9.02 | | | | 3.99 | | | | 7.0 | |
| Granted | | | 115,900 | | | | 8.69 | | | | 4.57 | | | | 9.3 | |
| Exercised | | | (38,000 | ) | | | 8.73 | | | | 2.56 | | | | 4.1 | |
| Canceled | | | - | | | | - | | | | - | | | | - | |
| Outstanding at December 31, 2009 | | | 1,498,150 | | | | 9.00 | | | | 4.13 | | | | 7.1 | |
| Exercisable Options Outstanding at December 31, 2009 | | | 992,150 | | | | 9.13 | | | | 4.06 | | | | 6.9 | |
| Non-Vested Options Outstanding at December 31, 2009 | | | 506,000 | | | $ | 8.75 | | | $ | 4.28 | | | | 7.5 | |
At December 31, 2006,2009, the aggregate intrinsic value of all options, including exercisable options, was $2.7 million.
At December 31, 2009, there was $2.2$1.8 million of unrecognized compensation cost related to share-based paymentsstock options that is expected to be recognized over a weighted-average period of 4.54.0 years.
At December 31, 2006,
Deferred Stock
Deferred stock awards vest based on the passage of time or the Company’s attainment of performance objectives. Upon vesting, these awards convert one-for-one to common stock.
In 2007, 10,920 deferred stock awards were issued to non-employee directors that vested in April 2008.
In 2008, 18,222 deferred stock awards were issued to non-employee directors that vested in April 2009.
In 2009, 12,144 deferred stock awards were issued to non-employee directors that will vest in April 2010.
Compensation expense related to these awards is amortized ratably over the vesting period. Annual compensation expense related to these awards was $0.2 million.
Restricted Stock Units
Beginning in the second quarter of 2009, the Company began granting restricted stock units to senior employees, in lieu of incentive stock options, that vest dependent on the achievement of various corporate objectives established by the Compensation Committee of the Board of Directors.
During 2009, 60,100 restricted stock units were issued. Compensation costs related to these restricted stock units was $0.7 million, all of which was recognized in 2009 because the performance objectives were attained and the awards became fully vested.
Common Stock
In 2007, 29,500 shares available for futureof common stock option grantswere awarded to employees and directors under existing plans were 1.1employees. All compensation expense related to these awards, which totaled $0.4 million, and 60,000, respectively. At December 31, 2006 the aggregate intrinsic value of all options, including exercisable options, was zero. recognized in 2007. No common stock was awarded in 2008 or 2009.
14.Operating Segment Information
The Company has reserved 2.2 milliontwo reportable operating segments: firearms and investment castings. The firearms segment manufactures and sells rifles, pistols, revolvers, and shotguns principally to a select number of authorizedlicensed independent wholesale distributors primarily located in the United States. The investment castings segment manufactures and unissued sharessells steel investment castings.
Corporate segment income relates to interest income on short-term investments, the sale of its common stocknon-operating assets, and other non-operating activities. Corporate segment assets consist of cash and short-term investments and other non-operating assets.
The Company evaluates performance and allocates resources, in part, based on profit and loss before taxes. The accounting policies of the reportable segments are the same as those described in the summary of significant accounting policies (see Note 1). Intersegment sales are recorded at the Company’s cost plus a fixed profit percentage.
| Year ended December 31, | | 2009 | | | 2008 | | | 2007 | |
| Net Sales | | | | | | | | | |
| Firearms | | $ | 266,566 | | | $ | 174,416 | | | $ | 144,222 | |
| Castings | | | | | | | | | | | | |
| Unaffiliated | | | 4,419 | | | | 7,067 | | | | 12,263 | |
| Intersegment | | | 16,159 | | | | 10,135 | | | | 9,165 | |
| | | | 20,578 | | | | 17,202 | | | | 21,428 | |
| Eliminations | | | (16,159 | ) | | | (10,135 | ) | | | (9,165 | ) |
| | | $ | 270,985 | | | $ | 181,483 | | | $ | 156,485 | |
| Income (Loss) Before Income Taxes | | | | | | | | | | | | |
| Firearms | | $ | 46,339 | | | $ | 18,614 | | | $ | 11,400 | |
| Castings | | | (443 | ) | | | (2,836 | ) | | | (2,806 | ) |
| Corporate | | | (1,536 | ) | | | (1,800 | ) | | | 8,065 | |
| | | $ | 44,360 | | | $ | 13,978 | | | $ | 16,659 | |
| Identifiable Assets | | | | | | | | | | | | |
| Firearms | | $ | 66,011 | | | $ | 63,042 | | | $ | 47,870 | |
| Castings | | | 4,643 | | | | 4,842 | | | | 6,165 | |
| Corporate | | | 71,025 | | | | 44,876 | | | | 47,847 | |
| | | $ | 141,679 | | | $ | 112,760 | | | $ | 101,882 | |
| Depreciation | | | | | | | | | | | | |
| Firearms | | $ | 6,561 | | | $ | 4,515 | | | $ | 3,563 | |
| Castings | | | 739 | | | | 850 | | | | 809 | |
| | | $ | 7,300 | | | $ | 5,365 | | | $ | 4,372 | |
| Capital Expenditures | | | | | | | | | | | | |
| Firearms | | $ | 13,045 | | | $ | 8,972 | | | $ | 3,950 | |
| Castings | | | 774 | | | | 516 | | | | 518 | |
| | | $ | 13,819 | | | $ | 9,488 | | | $ | 4,468 | |
In 2009, the Company’s largest customers accounted for issuance15%, 11%, 11%, 11%, and 10% of stock under its stock option plans.total net sales. In 2008, the Company’s largest customers accounted for 17%, 12%, 11%, and 10% of total net sales. In 2007, the Company’s largest customers accounted for 12%, 12%, 11%, and 11% of total net sales.
6. Contingent Liabilities
(The Company’s assets are located entirely in the United States and domestic sales represent greater than 95% of total sales in 2009, 2008, and 2007.
15.Quarterly Results of Operations (Unaudited)
The following disclosures within “Contingent Liabilities” are identicalis a tabulation of the unaudited quarterly results of operations for the two years ended December 31, 2009:
| | Three Months Ended |
| | | 4/04/09 | | | 7/04/09 | | | 10/03/09 | | | 12/31/09 | |
| Net Sales | | $ | 63,529 | | | $ | 72,390 | | | $ | 71,186 | | | $ | 63,879 | |
| Gross profit | | | 19,526 | | | | 25,032 | | | | 21,782 | | | | 21,265 | |
| Net income | | | 5,807 | | | | 8,680 | | | | 7,108 | | | | 5,908 | |
| Basic earnings per share | | | 0.30 | | | | 0.46 | | | | 0.37 | | | | 0.31 | |
| Diluted earnings per share | | $ | 0.30 | | | $ | 0.45 | | | $ | 0.37 | | | $ | 0.30 | |
| | Three Months Ended |
| | | 3/29/08 | | | 6/28/08 | | | 9/27/08 | | | 12/31/08 | |
| Net Sales | | $ | 42,506 | | | $ | 38,664 | | | $ | 41,822 | | | $ | 58,491 | |
| Gross profit | | | 10,655 | | | | 8,495 | | | | 6,858 | | | | 16,745 | |
| Net income | | | 1,452 | | | | 1,082 | | | | 372 | | | | 5,760 | |
| Basic earnings per share | | | 0.07 | | | | 0.05 | | | | 0.02 | | | | 0.28 | |
| Diluted earnings per share | | $ | 0.07 | | | $ | 0.05 | | | $ | 0.02 | | | $ | 0.28 | |
16.Related Party Transactions
In the first quarter of 2008, the Company made lump sum pension benefit payments to William B. Ruger, Jr., the disclosures within Item 1A-Risk Factors “Firearms Litigation”former Chairman and “Firearms Litigation”Chief Executive Officer of the Company, and Stephen L. Sanetti, the former President of the Company. These payments totaled $2.1 million, which represented the actuarially determined present value of the accrued benefits payable to these individuals under the Supplementary Executive Retirement Plan as of the date of payment.
In March 2007 the Company sold 42 parcels of non-manufacturing real property held for investment for $7.3 million to William B. Ruger, Jr., the Company’s former Chief Executive Officer and Chairman of the Board. The sales price was based upon an independent appraisal. The sale included substantially all of the Company’s raw land non-manufacturing real property assets in Item 7-Management’s DiscussionNew Hampshire. The Company recognized a gain of $5.2 million on the sale. Also in March 2007, the Company sold several pieces of artwork to members of the Ruger family for $0.1 million and Analysis of Financial Condition and Results of Operations.)recognized insignificant gains from these sales.
53
17.Contingent Liabilities
As of December 31, 2006,2009, the Company iswas a defendant in approximately fourseven (7) lawsuits allegedly involving its products and is aware of certain other such claims.
Lawsuits and claimsinvolving the Company’s products generally fall into one of two categories:
| (i) | | Those that claim damages from the Company related to allegedly defective product design and/or manufacture which stem from a specific incident. ThesePending lawsuits and claims are based principally on the theory of “strict liability” but also may be based on negligence, breach of warranty, and other legal theories, andtheories; or |
|
| (ii) | | Those brought by cities municipalities, counties,or other governmental entities, and individuals against firearms manufacturers, distributors and dealersretailers seeking to recover damages allegedly arising out of the misuse of firearms by third-parties in the commission of homicides, suicides and other shootings involving juveniles and adults. The complaints by municipalities seek damages, among other things, for the costs of medical care, police and emergency services, public health services, and the maintenance of courts, prisons, and other services. In certain instances, the plaintiffs seek to recover for decreases in property values and loss of business within the city due to criminal violence. In addition, nuisance abatement and/or injunctive relief is sought to change the design, manufacture, marketing and distribution practices of the various defendants. These suits allege, among other claims, strict liability or negligence in the design of products, public nuisance, negligent entrustment, negligent distribution, deceptive or fraudulent advertising, violation of consumer protection statutes and conspiracy or concert of action theories. Most of these cases do not allege a specific injury to a specific individual as a result of the misuse or use of any of the Company’s products. |
The Company has expended significant amounts
As to lawsuits of financial resources andthe first type, management time in connection with product liability litigation. Management believes that, in every case involving firearms, the allegations are unfounded, and that the shootings and any results therefrom were due to negligence or misuse of the firearms by third-parties or the claimant, and that there should be no recovery against the Company. Defenses further exist to the suits brought by cities, municipalities, counties, and a state attorney general based, among other reasons, on established state law precluding recovery by municipalities for essential government services, the remoteness of the claims, the types of damages sought to be recovered, and limitations on the extraterritorial authority which may be exerted by a city, municipality, county or state under state and federal law, including State and Federal Constitutions. Also, “The Protection of Lawful Commerce in Arms Act” signed into law on October 26, 2005 on its face requires dismissal of such claims.
The only case against the Company alleging liability for criminal shootings by third-parties to ever be permitted to go before a constitutional jury,Hamilton, et al. v. Accu-tek, et al., resulted in a defense verdict in favorremaining lawsuit of the Company on February 11, 1999. Insecond type is the lawsuit filed by the City of Gary. The complaint in that case numerous firearms manufacturersseeks damages, among other things, for the costs of medical care, police and distributors had been sued, alleging damagesemergency services, public health services, and other services as well as punitive damages. In addition, nuisance abatement and/or injunctive relief is sought to change the design, manufacture, marketing and distribution practices of the various defendants. The suit alleges, among other claims, negligence in the design of products, public nuisance, negligent distribution and marketing, negligence per se and deceptive advertising. The case does not allege a specific injury to a specific individual as a result of alleged negligent sales practices and “industry-wide” liability. The Company and its marketing and distribution practices were exonerated fromthe misuse or use of any claims of negligence in each of the seven cases decided by the jury. In subsequent proceedings involving other defendants, the New York Court of Appeals as a matter of law confirmed that 1) no legal duty existed under the circumstances to prevent or investigate criminal misuses of a manufacturer’s lawfully made products; and 2) liability of firearms manufacturers could not be apportioned under a market share theory. More recently, the New York Court of Appeals on October 21, 2003 declined to hear the appeal from the decision of the New York Supreme Court, Appellate Division, affirming the dismissal of New York Attorney General Eliot Spitzer’s public nuisance suit against the
54
Company and other manufacturers and distributors of firearms. In its decision, the Appellate Division relied heavily onHamilton in concluding that it was “legally inappropriate,” “impractical,” “unrealistic” and “unfair” to attempt to hold firearms manufacturers responsible under theories of public nuisance for the criminal acts of others.
Of the lawsuits brought by municipalities or a state Attorney General, twenty have been concluded:Atlanta – dismissal by intermediate Appellate Court, no further appeal;Bridgeport – dismissal affirmed by Connecticut Supreme Court;County of Camden – dismissal affirmed by U.S. Third Circuit Court of Appeals;Miami – dismissal affirmed by intermediate appellate court, Florida Supreme Court declined review;New Orleans – dismissed by Louisiana Supreme Court, United States Supreme Court declined review;Philadelphia – U.S. Third Circuit Court of Appeals affirmed dismissal, no further appeal;Wilmington – dismissed by trial court, no appeal;Boston – voluntary dismissal with prejudice by the City at the close of fact discovery;Cincinnati – voluntarily withdrawn after a unanimous vote of the city council;Detroit – dismissed by Michigan Court of Appeals, no appeal;Wayne County – dismissed by Michigan Court of Appeals, no appeal;New York State – Court of Appeals denied plaintiff’s petition for leave to appeal the Intermediate Appellate Court’s dismissal, no further appeal;Newark – Superior Court of New Jersey Law Division for Essex County dismissed the case with prejudice;City of Camden – dismissed on July 7, 2003, not reopened;Jersey City – voluntarily dismissed and not re-filed;St. Louis – Missouri Supreme Court denied plaintiffs’ motion to appeal Missouri Appellate Court’s affirmance of dismissal;Chicago – Illinois Supreme Court denied plaintiffs’ petition for rehearing; andLos Angeles City,Los Angeles County,San Francisco – Appellate Court affirmed summary judgment in favor of defendants, no further appeal; andCleveland – dismissed on January 24, 2006 for lack of prosecution.
The dismissal of theWashington, D.C. municipal lawsuit was sustained on appeal, but individual plaintiffs were permitted to proceed to discovery and attempt to identify the manufacturers of the firearms used in their shootings as “machine guns” under the city’s “strict liability” law. On April 21, 2005, the D.C. Court of Appeals, in anenbanc hearing, unanimously dismissed all negligence and public nuisance claims, but let stand individual claims based upon a Washington, D.C. act imposing “strict liability” for manufacturers of “machine guns.” Based on present information, none of the Company’s products hasproducts. Market share allegations have been identified with any ofheld inapplicable by the criminal assaults which form the basis of the individual claims. The writ of certiorari to the United StatesIndiana Supreme Court regarding the constitutionality of the Washington, D.C. act was denied and the case was remanded to the trial court for further proceedings. The defendants subsequently moved to dismiss the case based upon the Protection of Lawful Commerce in Arms Act, which motion was granted on May 22, 2006. The individual plaintiffs and the District of Columbia, which has subrogation claims in regard to the individual plaintiffs, have appealed.Court.
The Indiana Court of Appeals affirmed the dismissal of theGary case by the trial court, but the Indiana Supreme Court reversed this dismissal and remanded the case for discovery proceedings on December 23, 2003.Gary is scheduled to begin trial in 2009. The On November 23, 2005, the defendants filed a motion to dismiss pursuant to the Protection of Lawful Commerce in Arms Act (“PLCAA”). The state court judge held the PLCAA unconstitutional and the defendants filed a motion with the Indiana Court of Appeals asking it to accept interlocutory appeal on the issue, which appeal was accepted on February 5, 2007.
In On October 29, 2007, the previously reportedNew York City municipal case,Indiana Appellate Court affirmed, holding that the defendants moved to dismiss the suit pursuantPLCAA does not apply to the ProtectionCity’s claims. A petition for rehearing was filed in the Appellate Court and denied on January 9, 2008. On February 8, 2008, a Petition to Transfer the appeal to the Supreme Court of Lawful CommerceIndiana was filed. The petition was denied on January 13, 2009 and the case was remanded to the trial court. No trial date has been set.
In addition to the foregoing, on August 18, 2009, the Company was served with a complaint captioned Steamfitters Local 449 Pension Fund, on Behalf of Itself and All Others Similarly Situated v. Sturm, Ruger & Co. Inc., et al. pending in Arms Act.the United States District Court for the District of Connecticut. The trial judge foundcomplaint seeks unspecified damages for alleged violations of the Securities Exchange Act to be constitutional but deniedof 1934 and is a purported class action on behalf of purchasers of the defendants’Company’s common stock between April 23, 2007 and October 29, 2007. On October 9, 2009, the Company waived service of a complaint captioned Alan R. Herrett, Individually and On Behalf of All Others Similarly Situated v. Sturm, Ruger & Co. Inc., et al. pending in the United States District Court for the District of Connecticut. This matter is based upon the same facts and basic allegations set forth in the Steamfitters Local 449 Pension Fund litigation. On October 12, 2009, a motion to dismissconsolidate the case, stating that the Acttwo actions was not
55
applicable to the suit. The defendants were given leave to appeal and in fact have appealed the decision to the U.S. Court of Appealsfiled by counsel for the Second Circuit. That appeal is pending.
InSteamfitters. On January 11, 2010, theNAACP case, on May 14, 2003, an advisory jury returned a verdict rejecting the NAACP’s claims. On July 21, 2003, Judge Jack B. Weinstein court entered an order dismissingconsolidating theNAACP lawsuit, but this two matters. The January 11, 2010 order contained lengthy dicta whichalso sets a briefing schedule for plaintiffs to file a consolidated amended complaint and for defendants, believe are contraryincluding the Company, to lawfile a responsive pleading.
On September 11, 2009, the Company was served with a complaint captioned Secretary of Labor v. Sturm, Ruger & Co. Inc. pending before the Occupational Safety and fact. AppealsHealth Review Commission. The complaint arises out of a Notice of Contest filed by both sides were filed, but plaintiffs withdrew their appeal. On August 3, 2004, the United States Court of Appeals forCompany pursuant to an OSHA inspection conducted at the Second Circuit granted the NAACP’s motion to dismiss the defendants’ appeal of Judge Weinstein’s order denying defendants’ motion to strike his dicta madeCompany’s manufacturing facility in his order dismissing the NAACP’s case, and the defendants’ motion for summary dispositionNewport, New Hampshire. The matter was denied as moot. The rulingsettled by agreement of the Second Circuit effectively confirmed the decisionparties in favor of defendants and brought this matter to a conclusion.December 2009.
Legislation has been passed in approximately 34 states precluding suits of the type brought by the municipalities mentioned above. On the Federal level, the “Protection of Lawful Commerce in Arms Act” was signed by President Bush on October 26, 2005. The Act requires dismissal of suits against manufacturers arising out of the lawful sale of their products for harm resulting from the criminal or unlawful misuse of a firearm by a third party. The Company is pursuing dismissal of each action involving such claims, including the municipal cases described above. On February 1, 2007, plaintiff’s counsel in the previously reportedArnold case advised that plaintiff intends to voluntarily dismiss the case with prejudice. This will conclude this matter with no payment by the Company.
Punitive damages, as well as compensatory damages, are commonly demanded in manycertain of the lawsuits and claims brought against the Company.claims. Aggregate claimed amounts maypresently exceed product liability accruals and applicable insurance coverage. For claims made after July 10, 2000, coverage is provided on an annual basis for losses exceeding $5 million per claim, or an aggregate maximum loss of $10 million annually, except for certain new claims which might be brought by governments or municipalities after July 10, 2000, which are excluded from coverage.
Product liability claim payments are made when appropriate if, as, and when claimants and the Company reach agreement upon an amount to finally resolve all claims. Legal costs are paid as the lawsuits and claims develop, the timing of which may vary greatly from case to case. A time schedule cannot be determined in advance with any reliability concerning when payments will be made in any given case.
Provision is made for product liability claims based upon many factors related to the severity of the alleged injury and potential liability exposure, based upon prior claim experience. Because our experience in defending these lawsuits and claims is that unfavorable outcomes are typically not probable or estimable, only in rare cases is an accrual established for such costs. In most cases, an accrual is established only for estimated legal defense costs. Product liability accruals are periodically reviewed to reflect then-current estimates of possible liabilities and expenses incurred to date and reasonably anticipated in the future. Threatened product liability claims are reflected in our product liability accrual on the same basis as actual claims; i.e., an accrual is made for reasonably anticipated possible liability and claims-handling expenses on an ongoing basis.
A range of reasonably possible loss relating to unfavorable outcomes cannot be made. Currently, there are noHowever, in product liability cases in which a dollar amount of damages is claimed. If there were cases with claimed, damages, the amount of damages claimed, would bewhich totaled $7.7 million and $12.2 million at December 31, 2009 and 2008, respectively, are set forth as an indication of possible
56
maximum liability that the Company might be required to incur in these cases (regardless of the likelihood or reasonable probability of any or all of this amount being awarded to claimants) as a result of adverse judgments that are sustained on appeal.
As of December 31, 20062009 and 2005,2008, the Company was a defendant in 45 and 6 lawsuits, respectively, involving its products and is aware of other such claims. During the year ended December 31, 20062009 and 2005,2008, respectively, 2 and 31 claims were filed against the Company, 2 and 50 claims were dismissed, and 21 and 10 claims were settled. The average cost per settled claim was $47,000 and $150,000 in 2006 and 2005, respectively.
During the years ended December 31, 20062009 and 2005,2008, the Company incurred product liability expense of $2.5$1.6 million and $4.9$0.9 million, respectively, which includes the cost of outside legal fees, insurance, and other expenses incurred in the management and defense of product liability matters.
The CompanyCompany’s management monitors the status of known claims and the product liability accrual, which includes amounts for asserted and unasserted claims. While it is not possible to forecast the outcome of litigation or the timing of costs, in the opinion of management, after consultation with special and corporate counsel, it is not probable and is unlikely that litigation, including punitive damage claims, will have a material adverse effect on the financial position of the Company, but may have a material impact on the Company’s financial results for a particular period.
The Company has reported all cases instituted against it through September 30, 2006
A roll-forward of the product liability reserve and detail of product liability expense for the results of those cases, where terminated, to the S.E.C. on its previous Form 10-K and 10-Q reports, to which reference is hereby made.three years ended December 31, 2009 follows:
Balance Sheet RollforwardRoll-forward for Product Liability Reserve
(Dollars in thousands)
| | | | | | | | | | | | | | | | | | | | | | | | | | | | | |
| | | | | | | | | | | Cash Payments | | | | | | | | | | | | |
| | | | | | | Accrued | | | | | | | | | | | | | | | | | | | | |
| | | | | | | Legal | | | | | | | | | | | | | | | | | | | | |
| | | Balance | | | Expense | | | | | | | | | | | | | | | | | | | Balance | |
| | | Beginning | | | (Reversal) | | | Legal Fees | | | | | | | Insurance | | | Admin. | | | End of | |
| | | of Year (a) | | | (b) | | | (c) | | | Settlements (d) | | | Premiums | | | Expense | | | Year (a) | |
| | | |
| 2004 | | $ | 6,665 | | | | ($1,598 | ) | | | ($1,935 | ) | | | — | | | | N/A | | | | N/A | | | $ | 3,132 | |
| | | | | | | | | | | | | | | | | | | | | | | | | | | | | |
| 2005 | | | 3,132 | | | | 2,514 | | | | (2,935 | ) | | | (515 | ) | | | N/A | | | | N/A | | | | 2,196 | |
| | | | | | | | | | | | | | | | | | | | | | | | | | | | | |
| 2006 | | | 2,196 | | | | 688 | | | | (1,000 | ) | | | (143 | ) | | | N/A | | | | N/A | | | | 1,741 | |
57
| | | Cash Payments | | | |
| | Balance Beginning of Year (a) | Accrued Legal Expense (b) | Legal Fees (c) | Settlements (d) | Insurance Premiums | Admin.
Expense | Balance
End of Year (a) |
| | | | | | | | |
| 2007 | $1,741 | $639 | $(447) | $ - | N/A | N/A | $1,933 |
| | | | | | | | |
| 2008 | 1,933 | 176 | (358) | (7) | N/A | N/A | 1,744 |
| | | | | | | | |
| 2009 | 1,744 | 873 | (274) | (261) | N/A | N/A | 2,082 |
| | | | | | | | |
Income Statement Detail for Product Liability Expense
(Dollars in thousands)
| | | | | | | | | | | | | | | | | |
| | | Accrued | | | Insurance | | | | | | | Total | |
| | | Legal | | | Premium | | | Admin. | | | Product | |
| | | Expense | | | Expense | | | Expense | | | Liability | |
| | | (b) | | | (e) | | | (f) | | | Expense | |
| | �� | |
| 2004 | | $ | (1,598 | ) | | $ | 1,524 | | | $ | 878 | | | $ | 804 | |
| | | | | | | | | | | | | | | | | |
| 2005 | | | 2,514 | | | | 1,338 | | | | 1,041 | | | | 4,893 | |
| | | | | | | | | | | | | | | | | |
| 2006 | | | 688 | | | | 1,141 | | | | 691 | | | | 2,520 | |
| | Accrued Legal Expense (b) | Insurance Premium Expense (e) | Admin.
Expense (f) | Total
Product
Liability
Expense | | | |
| | | | | | | | |
| 2007 | $639 | $748 | $299 | $1,686 | | | |
| | | | | | | | |
| 2008 | 176 | 739 | - | 915 | | | |
| | | | | | | | |
| 2009 | 873 | 745 | - | 1,618 | | | |
| | | | | | | | |
Notes
Notes
| (a) | | The beginning and ending liability balances represent accrued legal fees only. Settlements and administrative costs are expensed as incurred. Only in rare instances is an accrual established for settlements. |
|
| (b) | | The expense accrued in the liability is for legal fees only. |
|
| (c) | | Legal fees represent payments to outside counsel related to product liability matters. |
|
| (d) | | Settlements represent payments made to plaintiffs or allegedly injured parties in exchange for a full and complete release of liability. |
|
| (e) | | Insurance expense represents the cost of insurance premiums. |
|
| (f) | | Administrative expense represents personnel related and travel expenses of Company employees and firearm experts related to the management and monitoring of product liability matters. |
There were no insurance recoveries during any of the above years.
7. Asset Impairment Charges
In the fourth quarter of 2006 and 2005 the Company recognized asset impairment charges of $0.5 million and $0.5 million, respectively, related to certain assets in the investment castings and corporate segments. The Company was required to reduce the carrying value of these assets to fair value and recognized asset impairment charges because the carrying value of the affected assets exceeded their projected future undiscounted cash flows. The Company’s cessation of titanium castings operations did not result in an asset impairment charge.18.Financial Instruments
8. Related Party Transactions
In 2006, 2005 and 2004, the Company paid Newport Mills, $9,800, $205,500 and $243,000, respectively, for storage rental and office space. The sole proprietor of Newport Mills is William B. Ruger, Jr. who was Chairman and Chief Executive Officer of the Company at the time. As of December 31, 2006, the Company no longer occupied this storage and office space. On December 16, 2005, the Company sold two automobiles to Mr. Ruger, Jr. for $15,000.
9. Operating Segment Information
The Company has two reportable operating segments: firearmsdoes not hold or issue financial instruments for trading or hedging purposes, nor does it hold interest rate, leveraged, or other types of derivative financial instruments. Fair values of short-term investments, accounts receivable, accounts payable, accrued expenses and investment castings. The firearms segment manufactures and sells rifles, pistols, revolvers, and shotguns principally to a select number of licensed independent wholesale distributors primarily locatedincome taxes payable reflected in the United States. The investmentDecember 31, 2009 and 2008 balance sheets approximate carrying values at those dates.
58
19.Subsequent Events
castings segment consists
At December 31, 2009, $4.7 million remained authorized for share repurchases. In February 2010, the Company announced that the Board of two operating divisions which manufacture and sell titanium and steel investment castings.Directors expanded this repurchase program from $4.7 million to $10 million.
Corporate segment income relates
On February 24, 2010, the Company declared a dividend of 6¢ per share to interest incomeshareholders of record on short-term investments, the sale of non-operating assets, and other non-operating activities. Corporate segment assets consist of cash and short-term investments and other non-operating assets.March 12, 2010.
The Company evaluates performance and allocates resources, in part, based on profit and loss before taxes. The accounting policies of the reportable segments are the same as those described in the summary of significant accounting policies (see Note 1). Intersegment sales are recorded at the Company’s cost plus a fixed profit percentage.
The Company’s assets are located entirelymanagement has evaluated the period January 1, 2010 through February 24, 2010, the date the financial statements were issued, for subsequent events requiring recognition or disclosure in the United States and domestic sales represent over 95% of total sales.financial statements. During this period, no material recognizable subsequent events were identified.
Revenues from significant customers in 2006, 2005, and 2004 were as follows:
| | | | | | | | | | | | | |
| Year ended December 31, (in thousands) | | 2006 | | | 2005 | | | 2004 | |
| |
| Customer 1 | | $ | 18,600 | | | $ | 12,700 | | | $ | 10,100 | |
| Customer 2 | | | 18,100 | | | | 21,600 | | | | 16,000 | |
| Customer 3 | | | 17,400 | | | | 16,500 | | | | 15,100 | |
| Customer 4 | | | 10,500 | | | | 15,900 | | | | 15,700 | |
| |
| | | | | | | | | | | | | |
| Year ended December 31, (in thousands) | | 2006 | | | 2005 | | | 2004 | |
| |
| Net Sales | | | | | | | | | | | | |
| Firearms | | $ | 139,110 | | | $ | 132,805 | | | $ | 124,924 | |
| Castings | | | | | | | | | | | | |
| Unaffiliated | | | 28,510 | | | | 21,917 | | | | 20,700 | |
| Intersegment | | | 11,818 | | | | 18,045 | | | | 14,363 | |
| |
| | | | 40,328 | | | | 39,962 | | | | 35,063 | |
| Eliminations | | | (11,818 | ) | | | (18,045 | ) | | | (14,363 | ) |
| |
| | | $ | 167,620 | | | $ | 154,722 | | | $ | 145,624 | |
| |
| Income (Loss) Before Income Taxes | | | | | | | | | | | | |
| Firearms | | $ | 1,387 | | | $ | 2,524 | | | $ | 10,811 | |
| Castings | | | (1,178 | ) | | | (1,711 | ) | | | (3,942 | ) |
| Corporate | | | 1,634 | | | | 629 | | | | 1,182 | |
| |
| | | $ | 1,843 | | | $ | 1,442 | | | $ | 8,051 | |
| |
| Identifiable Assets | | | | | | | | | | | | |
| Firearms | | $ | 53,525 | | | $ | 73,035 | | | $ | 77,824 | |
| Castings | | | 17,154 | | | | 17,751 | | | | 19,657 | |
| Corporate | | | 46,387 | | | | 48,853 | | | | 49,979 | |
| |
| | | $ | 117,066 | | | $ | 139,639 | | | $ | 147,460 | |
| |
| Depreciation | | | | | | | | | | | | |
| Firearms | | $ | 2,475 | | | $ | 3,759 | | | $ | 3,220 | |
| Castings | | | 1,377 | | | | 1,681 | | | | 2,607 | |
| |
| | | $ | 3,852 | | | $ | 5,440 | | | $ | 5,827 | |
| |
59
| | | | | | | | | | | | | |
| Year ended December 31, (in thousands) | | 2006 | | | 2005 | | | 2004 | |
| Capital Expenditures | | | | | | | | | | | | |
| Firearms | | $ | 3,486 | | | $ | 3,116 | | | $ | 4,403 | |
| Castings | | | 420 | | | | 1,344 | | | | 2,542 | |
| |
| | | $ | 3,906 | | | $ | 4,460 | | | $ | 6,945 | |
| |
| CHANGES IN AND DISAGREEMENTS WITH ACCOUNTANTS ONACCOUNTING AND FINANCIAL DISCLOSURE |
10.Retirement of Chief Executive Officer and Chairman of the Board
William B. Ruger, Jr. resigned as Chairman of the Board and Director of the Company effective February 13, 2006. Mr. Ruger retired as Chief Executive Officer of the Company effective February 28, 2006. In connection with his retirement, the Company paid Mr. Ruger $0.7 million, substantially all of which was recognized as an expense in the first quarter of 2006.
11. Quarterly Results of Operations (Unaudited)
The following is a tabulation of the unaudited quarterly results of operations for the two years ended December 31, 2006 (in thousands, except per share data):
| | | | | | | | | | | | | | | | | |
| | | Three Months Ended | |
| | | 3/31/06 | | | 6/30/06 | | | 9/30/06 | | | 12/31/06 | |
| |
| Net Sales | | $ | 47,427 | | | $ | 35,276 | | | $ | 41,612 | | | $ | 43,305 | |
| Gross profit | | | 9,139 | | | | 7,457 | | | | 5,234 | | | | 2,407 | |
| Net income (loss) | | | 1,420 | | | | 1,448 | | | | 957 | | | | (2,721 | ) |
| Basic and diluted earnings (loss) per share | | | 0.05 | | | | 0.06 | | | | 0.04 | | | | (0.12 | ) |
| | | | | | | | | | | | | | | | | |
| | | Three Months Ended | |
| | | 3/31/05 | | | 6/30/05 | | | 9/30/05 | | | 12/31/05 | |
| |
| Net Sales | | $ | 44,260 | | | $ | 34,395 | | | $ | 35,090 | | | $ | 40,978 | |
| Gross profit | | | 11,848 | | | | 5,645 | | | | 4,900 | | | | 3,986 | |
| Net income (loss) | | | 3,681 | | | | (2 | ) | | | (979 | ) | | | (1,836 | ) |
| Basic and diluted earnings (loss) per share | | | 0.14 | | | | — | | | | (0.04 | ) | | | (0.07 | ) |
In the fourth quarter of 2006, a $2.5 million non-cash inventory valuation adjustment, net of the LIFO impact, was recorded to recognize inefficiencies in labor and overhead during a period of rapid inventory reduction as the Company converted to a manufacturing system that emphasizes continuous improvement in customer service, quality and productivity. This over-absorption of labor and overhead was quantified by a physical inventory taken in the fourth quarter.
Due to the timing of the physical inventory, the Company was unable to quantify the impact of this delayed recognition of labor and overhead efficiencies, if any, on the financial results of prior quarters. As a consequence, raw material and work in process physical inventories are being performed at the end of each quarter until a permanent corrective action is established and determined to be adequate, making these physical inventories unnecessary.
60
ITEM 9—CHANGES IN AND DISAGREEMENTS WITH ACCOUNTANTS ON ACCOUNTING AND FINANCIAL DISCLOSURE
None.
ITEM 9A—CONTROLS AND PROCEDURES
Evaluation of Disclosure Controls and Procedures
The Company conducted an evaluation, with the participation of its Chief Executive Officer and Chief Financial Officer, of the effectiveness of the design and operation of the Company’s disclosure controls and procedures, as defined in Rules 13a-15(e) and 15d-15(e) under the Securities Exchange Act of 1934, as amended, as of December 31, 2006.2009. Based upon that evaluation, the Chief Executive Officer and Chief Financial Officer have concluded that as of December 31, 2006,2009, the Company’s controls and procedures over financial reporting were effective.
Management’s Report on Internal Control over Financial Reporting
The Company’s management is responsible for establishing and maintaining adequate internal control over financial reporting as defined in Rules 13a-15(f) and 15d-15(f) under the Securities Exchange Act of 1934. Because of its inherent limitations, internal control over financial reporting may not prevent or detect misstatements. Also, projections of any evaluation of effectiveness to future periods are subject to the risk that controls may become inadequate because of changes in conditions, or that the degree of compliance with the policies or procedures may deteriorate.
The Company conducted an evaluation, with the participation of its Chief Executive Officer and Chief Financial Officer, of the effectiveness of its internal control over financial reporting as of December 31, 2006.2009. This evaluation was performed based on the frameworkcriteria established in “Internal Control — Integrated Framework” issued by the Committee of Sponsoring Organizations of the Treadway Commission (“COSO”).
Management has concluded that the Company maintained effective internal control over financial reporting as of December 31, 2006,2009, based on criteria established in “Internal Control — Integrated Framework” issued by the COSO.
Management’s assessment of the
The effectiveness of the Company’s internal control over financial reporting as of December 31, 20062009 has been audited by McGladrey & Pullen, LLP, an independent registered public accounting firm, as stated in their report which is included in this Form 10-K.
Changes in Internal Control over Financial Reporting
There were no changes in our internal control over financial reporting that occurred during our most recently completed fiscal quarter that has materially affected, or is reasonably likely to materially affect, our internal control over financial reporting except raw materialreporting.
New York Stock Exchange Certification
Pursuant to Section 303A.12(a) of the New York Stock Exchange Listed Company Manual, the Company submitted an unqualified certification of our Chief Executive Officer to the New York Stock Exchange on May 15, 2007. The Company has also filed, as exhibits to this Annual Report on Form 10-K, the Chief Executive Officer and work in process physical inventories are being performed atChief Financial Officer Certifications required under the endSarbanes-Oxley Act of each quarter.
61
ITEM 9B—OTHER INFORMATION
None.
ITEM 10—DIRECTORS, EXECUTIVE OFFICERS AND CORPORATE GOVERNANCE
Information concerning the Company’s directors, including the Company’s separately designated standing audit committee, and on the Company’s code of business conduct and ethics required by this Item is incorporated by reference from the Company’s Proxy Statement relating to the 20072010 Annual Meeting of Stockholders scheduled to be held April 24, 2007.28, 2010.
Information concerning the Company’s executive officers required by this Item is set forth in Item 1 of this Annual Report onForm 10-K under the caption “Executive Officers of the Company.”
Information concerning beneficial ownership reporting compliance required by this Item is incorporated by reference from the Company’s Proxy Statement relating to the 20072010 Annual Meeting of Stockholders scheduled to be held April 24, 2007.28, 2010.
ITEM 11—EXECUTIVE COMPENSATION
Information concerning director and executive compensation required by this Item is incorporated by reference from the Company’s Proxy Statement relating to the 20072010 Annual Meeting of Stockholders scheduled to be held April 24, 2007.28, 2010.
| SECURITY OWNERSHIP OF CERTAIN BENEFICIAL OWNERS AND MANAGEMENT AND RELATED STOCKHOLDER MATTERS |
Information concerning the security ownership of certain beneficial owners and management and related stockholder matters required by this Item is incorporated by reference from the Company’s Proxy Statement relating to the 20072010 Annual Meeting of Stockholders scheduled to be held April 24, 2007.28, 2010.
ITEM 13—CERTAIN RELATIONSHIPS AND RELATED TRANSACTIONS AND DIRECTOR INDEPENDENCE
Information concerting certain relationships and related transactions required by this Item is incorporated by reference from the Company’s Proxy Statement relating to the 20072010 Annual Meeting of Stockholders scheduled to be held April 24, 2007.28, 2010.
ITEM 14—PRINCIPAL ACCOUNTANT FEES AND SERVICES
Information concerning the Company’s principal accountant fees and services and the pre-approval policies and procedures of the audit committee of the board of directors required by this Item is incorporated by reference from the Company’s Proxy Statement relating to the 20072010 Annual Meeting of the Stockholders scheduled to be held April 24, 2007.28, 2010.
62
ITEM 15—EXHIBITS AND FINANCIAL STATEMENT SCHEDULES
| (a) | | Exhibits and Financial Statement Schedules |
| (1) | | Financial Statements can be found under Item 8 of Part II of this Form 10-K |
|
| (2) | | Schedules can be found on Page 6784 of this Form 10-K |
| | | | |
| | Exhibit 3.1 | | Certificate of Incorporation of the Company, as amended (Incorporated by reference to Exhibits 4.1 and 4.2 to the Form S-3 Registration Statement previously filed by the Company File No. 33-62702). |
| | |
| | | |
| | Exhibit 3.2 | | Bylaws of the Company, as amended. | |
| | | |
| Exhibit 3.3 | Amended and restated Article 3, Section 2 of Bylaws (Incorporated by reference to Exhibit 3.1 to the Company’s Current Report on Form 8-K filed with the SEC on April 24, 2007). | |
| | | |
| Exhibit 3.4 | Amended and restated Article 3, Section 4 and Article 4, Section 5 of Bylaws (Incorporated by reference to Exhibit 3.1 to the Company’s Current Report on Form 8-K filed with the SEC on April 24, 2007). | |
| | |
| Exhibit 3.5 | Amended and restated Bylaws (Incorporated by reference to Exhibit 3.1 to the Company’s Current Report on Form 8-K filed with the SEC on July 26, 2007). | |
| | |
| Exhibit 3.6 | Amended and restated Bylaws (Incorporated by reference to Exhibit 3.1 to the Company’s Current Report on Form 8-K filed with the SEC on April 25, 2008). | |
| | |
| Exhibit 3.7 | Amendment to Article 5, Section 1 of Bylaws (Incorporated by reference to Exhibit 3.1 to the Company’s Current Report on Form 8-K filed with the SEC on February 6, 2009). | |
| | |
| Exhibit 10.1 | | Sturm, Ruger & Company, Inc. 1986 Stock Bonus Plan (Incorporated by reference to Exhibit 10.1 to the Company’s Annual Report on Form 10-K for the year ended December 31, 1988, as amended by Form 8 filed March 27, 1990, SEC File No. 1-10435). |
| | |
| | | |
| | Exhibit 10.2 | | Amendment to Sturm, Ruger & Company, Inc. 1986 Stock Bonus Plan (Incorporated by reference to Exhibit 10.3 to the Company’s Annual Report on Form 10-K for the year ended December 31, 1991, SEC File No. 1-10435). |
| | | | |
| | | |
| Exhibit 10.3 | | Sturm, Ruger & Company, Inc. Supplemental Executive Profit Sharing Retirement Plan (Incorporated by reference to Exhibit 10.4 to the Company’s Annual Report on Form 10-K for the year ended December 31, 1991, SEC File No. 1-10435). |
| | |
| | | |
| | Exhibit 10.4 | | Agreement and Assignment of Lease dated September 30, 1987 by and between Emerson Electric Co. and Sturm, Ruger & Company, Inc. (Incorporated by reference to Exhibit 10.2 to the Company’s Annual Report on Form 10-K for the year ended December 31, 1991, SEC File No. 1-10435). |
| | |
| | | |
| | Exhibit 10.5 | | Sturm, Ruger & Company, Inc. Supplemental Executive Retirement Plan (Incorporated by reference to Exhibit 10.5 to the Company’s Annual Report on Form 10-K for the year ended December 31, 1995, SEC File No. 1-10435). |
| | |
| | | |
| | Exhibit 10.6 | | [Intentionally omitted.] |
| | | | |
| | Exhibit 10.7 | | Sturm, Ruger & Company, Inc. 1998 Stock Incentive Plan. (Incorporated by reference to Exhibit 10.7 to the Company’s Annual Report on Form 10-K for the year ended December 31, 1998, SEC File No. 1-10435). |
63
| | |
| | | |
| | Exhibit 10.8 | | Sturm, Ruger & Company, Inc. 2001 Stock Option Plan for Non-Employee Directors (Incorporated by reference to Exhibit 4 to the Form S-8 Registration Statement filed by the Company File No. 33-53234). |
| | |
| | | |
| | Exhibit 10.9 | | Agreement and Release,dated as of February 28, 2006, by and between Sturm, Ruger & Company, Inc. and William B. Ruger (Incorporated by reference to Exhibit 10.1 to the Company’s Current Report on Form 8-K filed with the SEC on April 4, 2006, SEC File No. 1-10435) |
| | | . | |
| | | |
| Exhibit 10.10 | | Sale and Purchase Agreement, dated as of September 26, 2006, by and between Sturm, Ruger & Company, Inc. and Ruger Business Holdings, L.P. (Incorporated by reference to Exhibit 10.1 to the Company’s Current Report on Form 8-K filed with the SEC on September 26, 2006, SEC File No. 1-10435) |
| | | . | |
| | | |
| Exhibit 10.11 | | Severance Agreement, dated as of September 21, 2006, by and between Sturm, Ruger & Company, Inc. and Stephen L. Sanetti (Incorporated by reference to Exhibit 10.1 to the Company’s Current Report on Form 8-K filed with the SEC on September 27, 2006, SEC File No. 1-10435) |
| | | . | |
| | | |
| Exhibit 10.12 | | Severance Agreement, dated as of September 21, 2006, by and between Sturm, Ruger & Company, Inc. and Thomas A. Dineen (Incorporated by reference to Exhibit 10.2 to the Company’s Current Report on Form 8-K filed with the SEC on September 27, 2006, SEC File No. 1-10435) |
| . | |
| | | |
| | Exhibit 10.13 | | Severance Agreement, dated as of September 21, 2006, by and between Sturm, Ruger & Company, Inc. and Robert R. Stutler (Incorporated by reference to Exhibit 10.4 to the Company’s Current Report on Form 8-K filed with the SEC on September 27, 2006, SEC File No. 1-10435) |
| | | . | |
| | | |
| Exhibit 10.14 | | Offer Letter, dated as of September 5, 2006, by and between Sturm, Ruger & Company, Inc. and Michael O. Fifer (Incorporated by reference to Exhibit 10.1 to the Company’s Current Report on Form 8-K filed with the SEC on September 28, 2006, SEC File No. 1-10435) |
| | | . | |
| | | |
| Exhibit 10.15 | | Severance Agreement, dated as of December 15, 2006, by and between Sturm, Ruger & Company, Inc. and Michael O. Fifer (Incorporated by reference to Exhibit 10.1 to the Company’s Current Report on Form 8-K filed with the SEC on December 19, 2006, SEC File No. 1-10435) |
| | | . | |
| | Exhibit 10.16 | | Severance Agreement, dated as of December 15, 2006, by and between Sturm, Ruger & Company, Inc. and Christopher John Killoy (Incorporated by reference to Exhibit 10.2 to the Company’s Current Report on Form 8-K filed with the SEC on December 19, 2006, SEC File No. 1-10435) |
| | | . | |
| | | |
| Exhibit 10.17 | | Amended Severance Agreement, dated as of December 15, 2006, by and between Sturm, Ruger & Company, Inc. and |
64
| | | | |
| | | | Thomas P. Sullivan (Incorporated by reference to Exhibit 10.3 to the Company’s Current Report on Form 8-K filed with the SEC on December 19, 2006, SEC File No. 1-10435) |
| | | . | |
| | | |
| Exhibit 10.18 | Retention and Consultation Agreement, dated December 4, 2007, by and between Sturm, Ruger & Company, Inc. and Robert R. Stutler. | |
| | |
| Exhibit 10.19 | Credit Agreement, dated as of December 14, 2007, by and between the Company and Bank of America (Incorporated by reference to Exhibit 10.18 to the Company's Current Report on Form 8-K filed with the SEC on December 20, 2007). | |
| | |
| Exhibit 10.20 | Severance Agreement, dated as of April 10, 2008, by and between the Company and Michael O. Fifer (Incorporated by reference to Exhibit 10.1 to the Company's Current Report on Form 8-K filed with the SEC on April 11, 2008). | |
| | |
| Exhibit 10.21 | Severance Agreement, dated as of April 10, 2008, by and between the Company and Thomas A. Dineen (Incorporated by reference to Exhibit 10.2 to the Company's Current Report on Form 8-K filed with the SEC on April 11, 2008). | |
| | |
| Exhibit 10.22 | Severance Agreement, dated as of April 10, 2008, by and between the Company and Mark T. Lang (Incorporated by reference to Exhibit 10.3 to the Company's Current Report on Form 8-K filed with the SEC on April 11, 2008). | |
| | |
| | |
| Exhibit 10.23 | Severance Agreement, dated as of April 10, 2008, by and between the Company and Christopher J. Killoy (Incorporated by reference to Exhibit 10.4 to the Company's Current Report on Form 8-K filed with the SEC on April 11, 2008). | |
| | |
| Exhibit 10.24 | Severance Agreement, dated as of April 10, 2008, by and between the Company and Steven M. Maynard Incorporated by reference to Exhibit 10.5 to the Company's Current Report on Form 8-K filed with the SEC on April 11, 2008). | |
| | |
| Exhibit 10.25 | Severance Agreement, dated as of April 10, 2008, by and between the Company and Thomas P. Sullivan (Incorporated by reference to Exhibit 10.6 to the Company's Current Report on Form 8-K filed with the SEC on April 11, 2008). | |
| | |
| Exhibit 10.26 | Severance Agreement, dated as of April 10, 2008, by and between the Company and Leslie M. Gasper (Incorporated by reference to Exhibit 10.7 to the Company's Current Report on Form 8-K filed with the SEC on April 11, 2008). | |
| | |
| Exhibit 10.27 | Agreement, dated as of April 10, 2008, by and between the Company and Stephen L. Sanetti (Incorporated by reference to Exhibit 10.8 to the Company's Current Report on Form 8-K/A filed with the SEC on April 30, 2008). | |
| | |
| Exhibit 10.28 | Severance Agreement, dated as of May 2, 2008 by and between the Company and Kevin B. Reid, Sr. (Incorporated by reference to Exhibit 10.1 to the Company's Current Report on Form 8-K filed with the SEC on May 5, 2008). | |
| | |
| Exhibit 10.29 | First Amendment to Credit Agreement, dated as of December 15, 2008, by and between the Company and Bank of America (Incorporated by reference to Exhibit 99.1 to the Company's Current Report on Form 8-K filed with the SEC on December 22, 2008). | |
| Exhibit 10.30 | Second Amendment to Credit Agreement, dated December 11, 2009, by and between the Company and Bank of America (Incorporated by reference to Exhibit 99.1 to the Company's Current Report on Form 8-K filed with the SEC on December 21, 2009). | |
| | |
| Exhibit 23.1 | | Consent of McGladrey & Pullen, LLP |
| | |
| | | |
| | Exhibit 23.2 | | Consent of KPMG LLP |
| | | | |
| | Exhibit 31.1 | | Certification of Chief Executive Officer Pursuant to Rule 13a-14(a) of the Exchange Act. |
| | |
| | | |
| | Exhibit 31.2 | | Certification of Treasurer and Chief Financial Officer Pursuant to Rule 13a-14(a) of the Exchange Act. |
| | | | |
| | Exhibit 32.1 | | Certification of the Chief Executive Officer Pursuant to Rule 13a-14(b) of the Exchange Act and 18 U.S.C. Section 1350, as Adopted Pursuant to Section 906 of the Sarbanes-Oxley Act of 2002. |
| | |
| | | |
| | Exhibit 32.2 | | Certification of the Treasurer and Chief Financial Officer Pursuant to Rule 13a-14(b) of the Exchange Act and 18 U.S.C. Section 1350, as Adopted Pursuant to Section 906 of the Sarbanes-Oxley Act of 2002. |
| | | | |
| | Exhibit 99.1 | | Item 1 LEGAL PROCEEDINGS from the Quarterly Report on Form 10-Q of the Company for the quarter ended September 30, 1999, SEC File No. 1-10435, incorporated by reference in Item 3 LEGAL PROCEEDINGS. |
| | |
| | | |
| | Exhibit 99.2 | | Item 1 LEGAL PROCEEDINGS from the Quarterly Report on Form 10-Q of the Company for the quarters ended March 31, and September 30, 2000, SEC File No. 1-10435, incorporated by reference in Item 3 LEGAL PROCEEDINGS. |
| | | | |
| | Exhibit 99.3 | | Item 1 LEGAL PROCEEDINGS from the Quarterly Report on Form 10-Q of the Company for the quarter ended SeptemberJune 30, 2005,2007, SEC File No. 1-10435, incorporated by reference in Item 3 LEGAL PROCEEDINGS. | |
| | |
| Exhibit 99.3 | Item 3 LEGAL PROCEEDINGS from the Annual Report on Form 10-K of the Company for the year ended December 31, 2008, SEC File No. 1-10435, incorporated by reference in Item 3 LEGAL PROCEEDINGS. | |
| | |
Exhibit 99.4 | Item 1 LEGAL PROCEEDINGS from the Quarterly Report on Form 10-Q of the Company for the quarter ended July 4, 2009, SEC File No. 1-10435, incorporated by reference in Item 3 LEGAL PROCEEDINGS. | |
| Exhibit 99.5 | Item 1 LEGAL PROCEEDINGS from the Quarterly Report on Form 10-Q of the Company for the quarter ended October 3, 2009, SEC File No. 1-10435, incorporated by reference in Item 3 LEGAL PROCEEDINGS. | |
65
Pursuant to the requirements of Section 13 or 15(d) of the Securities Exchange Act of 1934, the registrant has duly caused this report to be signed on its behalf by the undersigned, thereunto duly authorized.
| | | STURM, RUGER & COMPANY, INC. | |
| | (Registrant) | |
| | | | |
| | | STURM, RUGER & COMPANY, INC. | | |
| | | /S/THOMAS A. DINEEN | |
| | | (Registrant)Thomas A. Dineen Vice President, Treasurer and Chief Financial Officer (Principal Financial Officer) | |
| | | |
| | | | | |
| | | S/THOMAS A. DINEEN | | |
| | |
| | Thomas A. Dineen | | |
| | Vice President, Treasurer and | | |
| | Chief Financial Officer | | |
| | (Principal Financial Officer) | | |
| | | | |
| | March 5, 2007 | | |
| February 24, 2010 | |
| | | Date | | |
Pursuant to the requirements of the Securities Exchange Act of 1934, this report has been signed below by the following persons on behalf of the registrant and in the capacities and on the dates indicated.
| | | | | | |
| /S/MICHAEL O. FIFER | | 3/5/072/24/10 | | /S/STEPHEN L. SANETTIJOHN M. KINGSLEY, JR. | | 3/5/07 |
| | 2/24/10 |
| Michael O. Fifer | | | | Stephen L. Sanetti | John M. Kingsley, Jr. | |
| Chief Executive Officer, Director | | | | President, Director | | |
| (Principal Executive Officer) | | | | | | |
| | | | | | |
S/JOHN M. KINGSLEY, JR. | | 3/5/07 | | S/RICHARD T. CUNNIFF | | 3/5/07 |
| | |
John M. Kingsley, Jr. | | | | Richard T. Cunniff | | |
Director | | | | Director | | |
| | | | | | |
S/JAMES E. SERVICE . | | 3/5/07 | | S/JOHN A. COSENTINO | | 3/5/07 |
| | |
James E. Service | | | | John A. Cosentino, Jr. | | |
Director | | | | Director | | |
| | | | | | |
S/C. MICHAEL JACOBI | | 3/5/07 | | S/RONALD C. WHITAKER. | | 3/5/07 |
| | |
C. Michael Jacobi | | | | Ronald C. Whitaker | | |
Director | | | | Director | | |
| | | | | | |
S/STEPHEN T. MERKEL | | 3/5/07 | | | | |
| | | | | |
| | | | |
| /S/JAMES E. SERVICE | 2/24/10 | | /S/JOHN A. CONSENTINO, JR. | 2/24/10 |
| James E. Service | | | John A. Cosentino, Jr. | |
| Director | | | Director | |
| | | | |
| | | | |
| /S/C. MICHAEL JACOBI | 2/24/10 | | /S/RONALD C. WHITAKER | 2/24/10 |
| C. Michael Jacobi | | | Ronald C. Whitaker | |
| Director | | | Director | |
| | | | |
| | | | |
| /S/STEPHEN T. MERKEL | 2/24/10 | | /S/PHILLIP C. WIDMAN | 2/24/10 |
| Stephen T. Merkel | | | Phillip C. Widman | |
| Director | | | Director | |
| | | | |
| | | | |
| /S/AMIR P. ROSENTHAL | 2/24/10 | | | |
| Amir P. Rosenthal | | | | |
| Director | | | | |
| | Page No. |
| Exhibit 3.1 | Certificate of Incorporation of the Company, as amended (Incorporated by reference to Exhibits 4.1 and 4.2 to the Form S-3 Registration Statement previously filed by the Company File No. 33-62702). | |
| | |
| Exhibit 3.2 | Bylaws of the Company, as amended. | |
| | |
| Exhibit 3.3 | Amended and restated Article 3, Section 2 of Bylaws (Incorporated by reference to Exhibit 3.1 to the Company’s Current Report on Form 8-K filed with the SEC on April 24, 2007). | |
| | |
| Exhibit 3.4 | Amended and restated Article 3, Section 4 and Article 4, Section 5 of Bylaws (Incorporated by reference to Exhibit 3.1 to the Company’s Current Report on Form 8-K filed with the SEC on April 24, 2007). | |
| | |
| Exhibit 3.5 | Amended and restated Bylaws (Incorporated by reference to Exhibit 3.1 to the Company’s Current Report on Form 8-K filed with the SEC on July 26, 2007). | |
| | |
| Exhibit 3.6 | Amended and restated Bylaws (Incorporated by reference to Exhibit 3.1 to the Company’s Current Report on Form 8-K filed with the SEC on April 25, 2008). | |
| | |
| Exhibit 3.7 | Amendment to Article 5, Section 1 of Bylaws (Incorporated by reference to Exhibit 3.1 to the Company’s Current Report on Form 8-K filed with the SEC on February 6, 2009). | |
| | |
| Exhibit 10.1 | Sturm, Ruger & Company, Inc. 1986 Stock Bonus Plan (Incorporated by reference to Exhibit 10.1 to the Company’s Annual Report on Form 10-K for the year ended December 31, 1988, as amended by Form 8 filed March 27, 1990, SEC File No. 1-10435). | |
| | |
| Exhibit 10.2 | Amendment to Sturm, Ruger & Company, Inc. 1986 Stock Bonus Plan (Incorporated by reference to Exhibit 10.3 to the Company’s Annual Report on Form 10-K for the year ended December 31, 1991, SEC File No. 1-10435). | |
| | |
| Exhibit 10.3 | Sturm, Ruger & Company, Inc. Supplemental Executive Profit Sharing Retirement Plan (Incorporated by reference to Exhibit 10.4 to the Company’s Annual Report on Form 10-K for the year ended December 31, 1991, SEC File No. 1-10435). | |
| | |
| Exhibit 10.4 | Agreement and Assignment of Lease dated September 30, 1987 by and between Emerson Electric Co. and Sturm, Ruger & Company, Inc. (Incorporated by reference to Exhibit 10.2 to the Company’s Annual Report on Form 10-K for the year ended December 31, 1991, SEC File No. 1-10435). | |
EXHIBIT INDEX (continued)
| | |
| Exhibit 10.5 | Sturm, Ruger & Company, Inc. Supplemental Executive Retirement Plan (Incorporated by reference to Exhibit 10.5 to the Company’s Annual Report on Form 10-K for the year ended December 31, 1995, SEC File No. 1-10435). | |
| | |
| Exhibit 10.6 | [Intentionally omitted.] | |
| | |
| Exhibit 10.7 | Sturm, Ruger & Company, Inc. 1998 Stock Incentive Plan. (Incorporated by reference to Exhibit 10.7 to the Company’s Annual Report on Form 10-K for the year ended December 31, 1998, SEC File No. 1-10435). | |
| | |
| Exhibit 10.8 | Sturm, Ruger & Company, Inc. 2001 Stock Option Plan for Non-Employee Directors (Incorporated by reference to Exhibit 4 to the Form S-8 Registration Statement filed by the Company File No. 33-53234). | |
| | |
| Exhibit 10.9 | Agreement and Release, dated as of February 28, 2006, by and between Sturm, Ruger & Company, Inc. and William B. Ruger (Incorporated by reference to Exhibit 10.1 to the Company’s Current Report on Form 8-K filed with the SEC on April 4, 2006, SEC File No. 1-10435). | |
| | |
| Exhibit 10.10 | Sale and Purchase Agreement, dated as of September 26, 2006, by and between Sturm, Ruger & Company, Inc. and Ruger Business Holdings, L.P. (Incorporated by reference to Exhibit 10.1 to the Company’s Current Report on Form 8-K filed with the SEC on September 26, 2006, SEC File No. 1-10435). | |
| | |
| Exhibit 10.11 | Severance Agreement, dated as of September 21, 2006, by and between Sturm, Ruger & Company, Inc. and Stephen L. Sanetti (Incorporated by reference to Exhibit 10.1 to the Company’s Current Report on Form 8-K filed with the SEC on September 27, 2006, SEC File No. 1-10435). | |
| | |
| Exhibit 10.12 | Severance Agreement, dated as of September 21, 2006, by and between Sturm, Ruger & Company, Inc. and Thomas A. Dineen (Incorporated by reference to Exhibit 10.2 to the Company’s Current Report on Form 8-K filed with the SEC on September 27, 2006, SEC File No. 1-10435). | |
| | |
| Exhibit 10.13 | Severance Agreement, dated as of September 21, 2006, by and between Sturm, Ruger & Company, Inc. and Robert R. Stutler (Incorporated by reference to Exhibit 10.4 to the Company’s Current Report on Form 8-K filed with the SEC on September 27, 2006, SEC File No. 1-10435). | |
| | |
| Exhibit 10.14 | Offer Letter, dated as of September 5, 2006, by and between Sturm, Ruger & Company, Inc. and Michael O. Fifer (Incorporated by reference to Exhibit 10.1 to the Company’s Current Report on Form 8-K filed with the SEC on September 28, 2006, SEC File No. 1-10435). | |
| | |
66
EXHIBIT INDEX (continued)
| Exhibit 10.15 | Severance Agreement, dated as of December 15, 2006, by and between Sturm, Ruger & Company, Inc. and Michael O. Fifer (Incorporated by reference to Exhibit 10.1 to the Company’s Current Report on Form 8-K filed with the SEC on December 19, 2006, SEC File No. 1-10435). | |
| | |
| Exhibit 10.16 | Severance Agreement, dated as of December 15, 2006, by and between Sturm, Ruger & Company, Inc. and Christopher John Killoy (Incorporated by reference to Exhibit 10.2 to the Company’s Current Report on Form 8-K filed with the SEC on December 19, 2006, SEC File No. 1-10435). | |
| | |
| Exhibit 10.17 | Amended Severance Agreement, dated as of December 15, 2006, by and between Sturm, Ruger & Company, Inc. and Thomas P. Sullivan (Incorporated by reference to Exhibit 10.3 to the Company’s Current Report on Form 8-K filed with the SEC on December 19, 2006, SEC File No. 1-10435). | |
| | |
| Exhibit 10.18 | Retention and Consultation Agreement, dated December 4, 2007, by and between Sturm, Ruger & Company, Inc. and Robert R. Stutler. | |
| | |
| Exhibit 10.19 | Credit Agreement, dated as of December 14, 2007, by and between the Company and Bank of America (Incorporated by reference to Exhibit 10.18 to the Company's Current Report on Form 8-K filed with the SEC on December 20, 2007). | |
| | |
| Exhibit 10.20 | Severance Agreement, dated as of April 10, 2008, by and between the Company and Michael O. Fifer (Incorporated by reference to Exhibit 10.1 to the Company's Current Report on Form 8-K filed with the SEC on April 11, 2008). | |
| | |
| Exhibit 10.21 | Severance Agreement, dated as of April 10, 2008, by and between the Company and Thomas A. Dineen (Incorporated by reference to Exhibit 10.2 to the Company's Current Report on Form 8-K filed with the SEC on April 11, 2008). | |
| | |
| Exhibit 10.22 | Severance Agreement, dated as of April 10, 2008, by and between the Company and Mark T. Lang (Incorporated by reference to Exhibit 10.3 to the Company's Current Report on Form 8-K filed with the SEC on April 11, 2008). | |
| | |
| Exhibit 10.23 | Severance Agreement, dated as of April 10, 2008, by and between the Company and Christopher J. Killoy (Incorporated by reference to Exhibit 10.4 to the Company's Current Report on Form 8-K filed with the SEC on April 11, 2008). | |
| | |
| Exhibit 10.24 | Severance Agreement, dated as of April 10, 2008, by and between the Company and Steven M. Maynard Incorporated by reference to Exhibit 10.5 to the Company's Current Report on Form 8-K filed with the SEC on April 11, 2008). | |
| | |
EXHIBIT INDEX (continued)
| Exhibit 10.25 | Severance Agreement, dated as of April 10, 2008, by and between the Company and Thomas P. Sullivan (Incorporated by reference to Exhibit 10.6 to the Company's Current Report on Form 8-K filed with the SEC on April 11, 2008). | |
| | |
| Exhibit 10.26 | Severance Agreement, dated as of April 10, 2008, by and between the Company and Leslie M. Gasper (Incorporated by reference to Exhibit 10.7 to the Company's Current Report on Form 8-K filed with the SEC on April 11, 2008). | |
| | |
| Exhibit 10.27 | Agreement, dated as of April 10, 2008, by and between the Company and Stephen L. Sanetti (Incorporated by reference to Exhibit 10.8 to the Company's Current Report on Form 8-K/A filed with the SEC on April 30, 2008). | |
| | |
| Exhibit 10.28 | Severance Agreement, dated as of May 2, 2008 by and between the Company and Kevin B. Reid, Sr. (Incorporated by reference to Exhibit 10.1 to the Company's Current Report on Form 8-K filed with the SEC on May 5, 2008). | |
| | |
| Exhibit 10.29 | First Amendment to Credit Agreement, dated as of December 15, 2008, by and between the Company and Bank of America (Incorporated by reference to Exhibit 99.1 to the Company's Current Report on Form 8-K filed with the SEC on December 22, 2008). | |
| Exhibit 10.30 | Second Amendment to Credit Agreement, dated December 11, 2009, by and between the Company and Bank of America (Incorporated by reference to Exhibit 99.1 to the Company's Current Report on Form 8-K filed with the SEC on December 21, 2009). | |
| Exhibit 23.1 | Consent of McGladrey & Pullen, LLP | |
| | |
| Exhibit 31.1 | Certification of Chief Executive Officer Pursuant to Rule 13a-14(a) of the Exchange Act. | |
| | |
| Exhibit 31.2 | Certification of Treasurer and Chief Financial Officer Pursuant to Rule 13a-14(a) of the Exchange Act. | |
| | |
| Exhibit 32.1 | Certification of the Chief Executive Officer Pursuant to Rule 13a-14(b) of the Exchange Act and 18 U.S.C. Section 1350, as Adopted Pursuant to Section 906 of the Sarbanes-Oxley Act of 2002. | |
| | |
| Exhibit 32.2 | Certification of the Treasurer and Chief Financial Officer Pursuant to Rule 13a-14(b) of the Exchange Act and 18 U.S.C. Section 1350, as Adopted Pursuant to Section 906 of the Sarbanes-Oxley Act of 2002. | |
| | |
EXHIBIT INDEX (continued)
| Exhibit 99.1 | Item 1 LEGAL PROCEEDINGS from the Quarterly Report on Form 10-Q of the Company for the quarter ended September 30, 1999, SEC File No. 1-10435, incorporated by reference in Item 3 LEGAL PROCEEDINGS. | |
| | |
| Exhibit 99.2 | Item 1 LEGAL PROCEEDINGS from the Quarterly Report on Form 10-Q of the Company for the quarter ended June 30, 2007, SEC File No. 1-10435, incorporated by reference in Item 3 LEGAL PROCEEDINGS. | |
| | |
| Exhibit 99.3 | Item 3 LEGAL PROCEEDINGS from the Annual Report on Form 10-K of the Company for the year ended December 31, 2008, SEC File No. 1-10435, incorporated by reference in Item 3 LEGAL PROCEEDINGS. | |
| | |
| Exhibit 99.4 | Item 1 LEGAL PROCEEDINGS from the Quarterly Report on Form 10-Q of the Company for the quarter ended July 4, 2009, SEC File No. 1-10435, incorporated by reference in Item 3 LEGAL PROCEEDINGS. | |
| | |
| Exhibit 99.5 | Item 1 LEGAL PROCEEDINGS from the Quarterly Report on Form 10-Q of the Company for the quarter ended October 3, 2009, SEC File No. 1-10435, incorporated by reference in Item 3 LEGAL PROCEEDINGS. | |
YEAR ENDED DECEMBER 31, 20062009
STURM, RUGER & COMPANY, INC.
ITEMS 15(a)(2) AND 15(d)
FINANCIAL STATEMENT SCHEDULE
67
Sturm, Ruger & Company, Inc.
Item 15(a)(2) and Item 15(d)—Financial--Financial Statement Schedule
Schedule II—Valuation and Qualifying Accounts
(In Thousands)
| | | | | | | | | | | | | | | | | | | | | |
| COL. A | | COL. B | | | COL. C | | | COL. D | | | COL. E | |
| | | | | | | ADDITIONS | | | | | | | | |
| | | | | | | | | | | (2) | | | | | | | | |
| | | | | | | (1) | | | Charged to | | | | | | | | |
| | | Balance at | | | Charged (Credited)to | | | Other | | | | | | | Balance | |
| | | Beginning | | | Costs and | | | Accounts | | | | | | | at End | |
| Description | | of Period | | | Expenses | | | –Describe | | | Deductions | | | of Period | |
| Deductions from asset accounts: | | | | | | | | | | | | | | | | | | | | |
| Allowance for doubtful accounts: | | | | | | | | | | | | | | | | | | | | |
| Year ended December 31, 2006 | | $ | 351 | | | $ | (81 | ) | | | | | | $ | 115 | (a) | | $ | 155 | |
| | | | | | | | | | | | | | | | | |
| Year ended December 31, 2005 | | $ | 373 | | | | | | | | | | | $ | 22 | (a) | | $ | 351 | |
| | | | | | | | | | | | | | | | | | |
| Year ended December 31, 2004 | | $ | 441 | | | | | | | | | | | $ | 68 | (a) | | $ | 373 | |
| | | | | | | | | | | | | | | | | | |
| |
| Allowance for discounts: | | | | | | | | | | | | | | | | | | | | |
| Year ended December 31, 2006 | | $ | 346 | | | $ | 2,808 | | | | | | | $ | 2,948 | (b) | | $ | 206 | |
| | | | | | | | | | | | | | | | | |
| Year ended December 31, 2005 | | $ | 555 | | | $ | 3,508 | | | | | | | $ | 3,717 | (b) | | $ | 346 | |
| | | | | | | | | | | | | | | | | |
| Year ended December 31, 2004 | | $ | 772 | | | $ | 3,957 | | | | | | | $ | 4,174 | (b) | | $ | 555 | |
| | | | | | | | | | | | | | | | | |
| |
| Excess and obsolete inventory reserve: | | | | | | | | | | | | | | | | | | | | |
| Year ended December 31, 2006 | | $ | (3,137 | ) | | $ | 3,217 | | | | | | | $ | 838 | (c) | | $ | (5,516 | ) |
| | | | | | | | | | | | | | | | | |
| Year ended December 31, 2005 | | $ | (2,698 | ) | | $ | 461 | | | | | | | $ | 22 | (c) | | $ | (3,137 | ) |
| | | | | | | | | | | | | | | | | |
| Year ended December 31, 2004 | | $ | (2,015 | ) | | $ | 1,009 | | | | | | | $ | 326 | (c) | | $ | (2,698 | ) |
| | | | | | | | | | | | | | | | | |
| COL. A | | COL. B | | | COL. C | | COL. D | | | COL. E | |
| | | | | | ADDITIONS | | | | | | |
Description | | Balance at Beginning of Period | | | (1) Charged (Credited) to Costs and Expenses | | (2) Charged to Other Accounts –Describe | | Deductions | | | Balance at End of Period | |
| | | | | | | | | | | | | | |
| Deductions from asset accounts: | | | | | | | | | | | | | |
| Allowance for doubtful accounts: | | | | | | | | | | | | | |
| Year ended December 31, 2009 | | $ | 126 | | | $ | 92 | | | | $ | 9 | (a) | | $ | 209 | |
| Year ended December 31, 2008 | | $ | 127 | | | | | | | | $ | 1 | (a) | | $ | 126 | |
| Year ended December 31, 2007 | | $ | 155 | | | | | | | | $ | 28 | (a) | | $ | 127 | |
| | | | | | | | | | | | | | | | | | |
| Allowance for discounts: | | | | | | | | | | | | | | | | | |
| Year ended December 31, 2009 | | $ | 449 | | | $ | 4,869 | | | | $ | 4,826 | (b) | | $ | 492 | |
| Year ended December 31, 2008 | | $ | 233 | | | $ | 1,370 | | | | $ | 1,154 | (b) | | $ | 449 | |
| Year ended December 31, 2007 | | $ | 206 | | | $ | 998 | | | | $ | 971 | (b) | | $ | 233 | |
| | | | | | | | | | | | | | | | | | |
| Excess and obsolete inventory reserve: | | | | | | | | | | | | | | | | | |
| Year ended December 31, 2009 | | $ | 3,569 | | | $ | 239 | | | | $ | 1,081 | (c) | | $ | 2,727 | |
| Year ended December 31, 2008 | | $ | 4,143 | | | $ | 1,163 | | | | $ | 1,737 | (c) | | $ | 3,569 | |
| Year ended December 31, 2007 | | $ | 5,516 | | | $ | 755 | | | | $ | 2,128 | (c) | | $ | 4,143 | |
| | |
| (a) | | Accounts written off or (subsequently recovered) |
|
| (c) | | Inventory written off |
68