Our backlog is subject to unexpected adjustments and cancellations and, therefore, may not be a reliable indicator of our future earnings.
We have a backlog of uncompleted contracts. Orders included in our backlog are represented by customer purchase orders and contracts, which we believe to be firm. Backlog develops as a result of new business taken, which represents the revenue value of new project commitments received. Backlog consists of projects which either (1) have not yet been started or (2) are in progress and are not yet completed. In the latter case, the revenue value reported in backlog is the remaining value associated with work that has not yet been completed. From time to time, projects are cancelled that appeared to have a high certainty of going forward at the time they were recorded as new business taken. In the event of a project cancellation, we may be reimbursed for certain costs but typically have no contractual right to the total revenue reflected in our backlog. In addition to our being unable to recover certain direct costs, cancelled projects may also result in additional unrecoverable costs due to underutilization of our assets.
Our volume of fixed-price contracts and use of percentage-of-completion accounting could result in volatility in our results of operations.
As discussed in “Management’s Discussion and Analysis of Financial Condition and Results of Operations — Critical Accounting Policies and Estimates” and in Notes to Consolidated Financial Statements, our revenues are recognized on the percentage-of-completion method of accounting. The percentage-of-completion accounting practice we use results in our recognizing contract revenues and earnings ratably over the contract term in proportion to our incurrence of contract costs. The earnings or losses recognized on individual contracts are based on estimates of contract revenues, costs and profitability. The process of estimating costs on projects requires a significant amount of judgment and combines
7
professional engineering, cost estimating, pricing and accounting inputs. Contract losses are recognized in full when determined, and estimates of revenue and cost to complete are adjusted based on ongoing reviews of estimated contract performance. Previously recorded estimates are adjusted as the project progresses. In certain circumstances, it is possible that such adjustments could have a significant impact on our operating results for any fiscal quarter or year.
A portion of our contracts contain terms with penalty provisions.
Some of our contracts contain penalty provisions for the failure to meet specified contractual provisions. These contractual provisions define the conditions under which our customers may make claims against us. In many cases in which we have had potential exposure for damages, such damages ultimately were not fully asserted by our customers.
Fluctuations in the price and supply of raw materials used to manufacture ourproducts may reduce our profits and could materially impact our ability to meet commitments to our customers.
Our raw material costs represented 47% of our consolidated revenues for the fiscal year ended September 30, 2012. We purchase a wide variety of raw materials to manufacture our products, including steel, aluminum, copper and various electrical components. Unanticipated increases in raw material requirements, supplier availability or price increases could increase production costs and adversely affect profitability. Our ability to meet customer commitments could be negatively impacted due to the time and effort associated with the selection and qualification of a new supplier.
Our industry is highly competitive.
Some of our competitors are significantly larger and have substantially greater resources than we do. Competition in the industry depends on a number of factors, including price. Certain of our competitors may have lower cost structures and may, therefore, be able to provide their products or services at lower prices than we are able to provide. We cannot be certain that our competitors will not develop the expertise, experience and resources to provide products or services that are superior in both price and quality to our services. Similarly, we cannot be certain that we will be able to maintain or enhance our competitive position within our industry, maintain our customer base at current levels or increase our customer base.
Our operations could be adversely impacted by the continuing effects from government regulations.
Various regulations have been implemented related to new safety and certification requirements applicable to oil and gas drilling and production activities. While certain new drilling plans and drilling permits have been approved, we cannot predict whether operators will be able to satisfy these requirements. Further, we cannot predict what the continuing effects of government regulations on offshore deepwater drilling projects may have on offshore oil and gas exploration and development activity, or what actions may be taken by our customers or other industry participants in response to these regulations. Changes in laws or regulations regarding offshore oil and gas exploration and development activities and decisions by customers and other industry participants could reduce demand for our services, which would have a negative impact on our operations. Similarly, we cannot accurately predict future regulations by the government in any country in which we operate and how those regulations may affect our ability to perform projects in those regions.
International and political events may adversely affect our operations.
International sales accounted for approximately 23%42% of our revenues in fiscal 2009,2012, including sales from our operations in the United Kingdom. We primarily operateKingdom and Canada. Our manufacturing facilities are in developed countries with historically stable operating and fiscal environments. Our consolidated results of operations, cash flows and financial condition could be adversely affected by the occurrence of political and economic instability; social unrest, acts of terrorism, force majeure, war or other armed conflict; inflation; currency fluctuations, devaluations and conversion restrictions; governmental activities that limit or disrupt markets, restrict payments or limit the movement of funds and trade restrictions and economic embargoes imposed by the United StatesU.S. or other countries.
9
Our strategy has been to pursue growth and product diversification through the acquisition of companies or assets that will enable us to expand our product and service offerings. We routinely review potential acquisitions. However, weWe may be unable to implement this strategy if we cannot reach agreement on potential strategic acquisitions on acceptable terms or for other reasons. Moreover, our acquisition strategy involvesAcquisitions involve certain risks, including difficulties in the integration of operations and systems; failure to realize cost savings; the termination of relationships by key personnel and customers of the acquired company;company and a failure to add additional employees to handle the increased volume of business; additionalbusiness. Additionally, financial and accounting challenges and complexities in areas such as valuation, tax planning, treasury management and financial reporting; risks and liabilitiesreporting from our acquisitions some of whichpose risks to our strategy. Due diligence may not be discovered duringreveal all risks and challenges associated with our due diligence; a disruption ofacquisitions. It is possible impairment charges resulting from the overpayment for an acquisition may negatively impact our ongoing business or an inability of our ongoing business to receive sufficient management attention and a failure to realize the cost savings or other financial benefits we anticipated.
8
Our operating results may vary significantly from quarter to quarter.
Our quarterly results may be materially and adversely affected by changes in estimated costs or revenues under fixed-price contracts; the timing and volume of work under new agreements; general economic conditions; the spending patterns of customers; variations in the margins of projects performed during any particular quarter; losses experienced in our operations not otherwise covered by insurance; a change in the demand or production of our products and our services caused by severe weather conditions; a change in the mix of our customers, contracts and
10
Accordingly, our operating results in any particular quarter may not be indicative of the results that you can expect for any other quarter or for an entire year.
We may be unsuccessful at generating profitable internal growth.
Our ability to generate profitable internal growth will be affected by, among other factors, potential regulatory changes, our ability to attract new customers;customers, increase the number or size of projects performed for existing customers;customers, hire and retain employees, and increase volume utilizing our existing facilities and our ability to construct and integrate new facilities.
In addition, our customers may reduce the number or size of projects available to us. Many of the factors affecting our ability to generate internal growth may be beyond our control, and we cannot be certain that our strategies will be successful or that we will be able to generate cash flow sufficient to fund our operations and to support internal growth. If we are unsuccessful, we may not be able to achieve internal growth, expand our operations or grow our business.
The departure of key personnel could disrupt our business.
We depend on the continued efforts of our executive officers and senior management. We cannot be certain that any individual will continue in such capacity for any particular period of time. The loss of key personnel, or the inability to hire and retain qualified employees, could negatively impact our ability to manage our business.
9
Our business requires skilled labor, and we may be unable to attract and retainqualified employees.
Our ability to maintain our productivity and profitability will be limited by our ability to employ, train and retain skilled personnel necessary to meet our requirements. We may experience shortages of qualified personnel. We cannot be certain that we will be able to maintain an adequate skilled labor force necessary to operate efficiently and to support our growth strategy or that our labor expenses will not increase as a result of a shortage in the supply of skilled personnel. Labor shortages or increased labor costs could impair our ability to maintain our business or grow our revenues, and may adversely impact our profitability.
Actual and potential claims, lawsuits and proceedings could ultimately reduce ourprofitability and liquidity and weaken our financial condition.
We could be named as a defendant in future legal proceedings claiming damages from us in connection with the operation of our business. Most of the actions against us arise out of the normal course of our performing services or manufacturing equipment. We are and will likely continue to be a plaintiff in legal proceedings against customers, in which we seek to recover payment of contractual amounts due to us, as well as claims for increased costs incurred by us. When appropriate, we establish provisions against certain legal exposures, and we adjust such provisions from time to time according to ongoing developments related to each exposure. If in the future our assumptions and estimates related to such exposures prove to be inadequate or wrong, our consolidated results of operations, cash flows and financial condition could be adversely affected. In addition, claims, lawsuits and proceedings may harm our reputation or divert management resources away from operating our business.
Unforeseen difficulties with the implementation or operation of our enterprise resource planning system could adversely affect our internal controls and our business.
The efficient execution of our business is dependent upon the proper functioning of our enterprise resource planning (ERP) system that supports our human resources, accounting, estimating, financial, job management and customer systems. Any significant failure or malfunction of our ERP system may result in disruption of our operations. Our results of operations could be adversely affected if we encounter unforeseen problems with respect to the operation of this ERP system.
We carry insurance against many potential liabilities, and our management of risk mayleave us exposed to unidentified or unanticipated risks.
Although we maintain insurance policies with respect to our related exposures, including certain casualty, business interruption, self-insured medical and dental programs, these policies contain deductibles, self-insured retentions and limits of coverage. We estimate our liabilities for known claims and unpaid claims and expenses based on information available as well as projections for claims incurred but not reported. However, insurance liabilities, some of which are self-insured, are difficult to estimate due to various factors. If any of our insurance policies or programs are not effective in mitigating our risks, we may incur losses that are not covered by our insurance policies or that exceed our accruals or that exceed our coverage limits and could adversely impact our consolidated results of operations, cash flows and financial position.
11
We may incur additional healthcare costs arising from federal healthcare reform legislation.
In March 2010, the Patient Protection and Affordable Care Act and the Health Care and Education Reconciliation Act of 2010 were signed into law in the U.S. This legislation expands health care coverage to many uninsured individuals and expands coverage to those already insured. The changes required by this legislation could cause us to incur additional healthcare and other costs.
Technological innovations by competitors may make existing products and productionmethods obsolete.
All of the products manufactured and sold by the Company depend upon the best available technology for success in the marketplace. The competitive environment is highly sensitive to technological innovation in both segments of our business. It is possible for competitors (both domestic and foreign)international) to develop products or production methods which will make current products or methods obsolete or at least hasten their obsolescence.obsolescence; therefore, we cannot be certain that our competitors will not develop the expertise, experience and resources to provide products and services that are superior in both price and quality.
10
Catastrophic events could disrupt our business.
The occurrence of catastrophic events ranging from natural disasters such as hurricanes to epidemics such as health epidemics to acts of war and terrorism could disrupt or delay the Company’s ability to complete projects for its customers and could potentially expose the Company to third-party liability claims. Such events may or may not be fully covered by our various insurance policies or may be subject to deductibles. In addition, such events could impact the Company’s customers and suppliers, resulting in temporary or long-term delaysand/or cancellations of orders or raw materials used in normal business operations. These situations are outside the Company’s control and could have a significant adverse impact on the results of operations.
Unforeseen difficulties with the construction, relocation and start-up of our two new facilities could adversely affect our operations.
We haveare currently constructing a manufacturing/assembly facility in the United States, as well as one in Canada. We will relocate from two of our existing facilities upon completion of these two facilities. Any significant delay in the construction, relocation or start-up of either of these new facilities could adversely affect our operations.
Item 1B. Unresolved Staff Comments
None.
We own or lease manufacturing facilities, sales offices, field offices and repair centers located throughout the United States,U.S. and Canada, and we have a manufacturing facility located in the United Kingdom. We also rent office space in Singapore on an as-needed basis. Our facilities are generally located in areas that are readily accessible to raw materials and labor pools and are maintained in good condition. These facilities, together with recent expansions, are expected to meet our needs for the foreseeable future.
Our principal locations by segment as of September 30, 2009,2012, are as follows:
|
|
|
|
|
|
| |||
|
|
|
| Approximate | |||||
| Number |
|
| Square Footage | |||||
Location | of Facilities | Acres |
| Owned |
| Leased | |||
Electrical Power Products: |
|
|
| ||||||
Houston, TX | 3 | 152.5 |
| 446,600 |
| 138,600 | |||
North Canton, OH | 1 | 8.0 |
| 115,200 |
| — | |||
Northlake, IL | 1 | 10.0 |
| 103,500 |
| — | |||
Bradford, United Kingdom | 1 | 7.9 |
| 129,200 |
| — | |||
Acheson, Alberta, Canada | — | 20.1 |
| — |
| — | |||
Edmonton, Alberta, Canada | 2 |
| — |
| 70,700 | ||||
Calgary, Alberta, Canada | 1 |
| — |
| 8,200 | ||||
Process Control Systems: |
|
|
| ||||||
Pleasanton, CA | 1 |
| — |
| 21,200 | ||||
Duluth, GA | 1 |
| — |
| 41,700 | ||||
Chantilly, VA | 1 |
| — |
| 9,900 | ||||
East Rutherford, NJ | 1 |
| — |
| 8,700 | ||||
| Approximate | ||||||||||||||||
| Number | Square Footage | |||||||||||||||
Location | of Facilities | Acres | Owned | Leased | ||||||||||||
Electrical Power Products: | ||||||||||||||||
| Houston, TX | 3 | 78.1 | 430,600 | 138,600 | ||||||||||||
| North Canton, OH | 1 | 8.0 | 115,200 | — | ||||||||||||
| Northlake, IL | 1 | 10.0 | 103,500 | — | ||||||||||||
| Bradford, United Kingdom | 1 | 7.9 | 129,200 | — | ||||||||||||
Process Control Systems: | ||||||||||||||||
| Pleasanton, CA | 1 | — | 21,200 | |||||||||||||
| Duluth, GA | 1 | — | 29,700 | |||||||||||||
| Chantilly, VA | 1 | — | 5,200 | |||||||||||||
| East Rutherford, NJ | 1 | — | 7,300 | |||||||||||||
All leased properties are subject to long-term leases with remaining lease terms ranging from one to five11 years as of September 30, 2009.2012. We do not anticipate experiencing significant difficulty in retaining occupancy of any of our leased facilities through lease renewals prior to expiration or throughmonth-to-month occupancy, or in replacing them with equivalent facilities.
In fiscal 2012, we acquired land in Houston, Texas, and in Acheson, Alberta, Canada, and began construction of two facilities to allow us to expand our operations. We estimate the total cost of these facilities, including the land, will be approximately $75 million. Such costs are expected to be funded from our existing cash and cash equivalents and future cash flow from operations.
We are involved in various legal proceedings, claims and other disputes arising in the ordinary course of business which, in general, are subject to uncertainties and the outcomes are not predictable. We do not believe that the ultimate conclusion of these disputes could materially affect our financial position or results of operations.
12
Item 4. Mine Safety Disclosures
Not applicable.
11
Item 5. Market for Registrant’s Common Equity, Related StockholderMatters and Issuer Purchases of Equity Securities
Price Range of Common Stock
Our common stock trades on the NASDAQ Global Market (“NASDAQ”)(NASDAQ) under the symbol “POWL.” The following table sets forth, for the periods indicated, the high and low sales prices per share as reported on the NASDAQ for our common stock.
36.47 |
|
|
|
|
|
|
| High |
|
| Low |
Fiscal Year 2011: |
|
|
| ||
First Quarter | $ | 37.65 |
| $ | 29.13 |
Second Quarter |
| 40.88 |
|
| 32.97 |
Third Quarter |
| 40.82 |
|
| 32.01 |
Fourth Quarter |
| 41.64 |
|
| 30.28 |
Fiscal Year 2012: |
|
|
| ||
First Quarter | $ | 36.47 |
| $ | 25.76 |
Second Quarter |
| 38.51 |
|
| 30.67 |
Third Quarter |
| 38.62 |
|
| 30.00 |
Fourth Quarter |
| 43.65 |
|
| 33.37 |
| High | Low | |||||||
Fiscal Year 2008: | ||||||||
| First Quarter | $ | 47.00 | $ | 37.51 | ||||
| Second Quarter | 45.76 | 35.47 | ||||||
| Third Quarter | 55.50 | 38.50 | ||||||
| Fourth Quarter | 57.98 | 37.34 | ||||||
Fiscal Year 2009: | ||||||||
| First Quarter | $ | 41.00 | $ | 16.74 | ||||
| Second Quarter | 37.31 | 23.25 | ||||||
| Third Quarter | 44.93 | 30.60 | ||||||
| Fourth Quarter | 42.55 | 33.73 | ||||||
As of December 7, 2009,November 30, 2012, the last reported sales price of our common stock on the NASDAQ was $37.08$40.04 per share. As of December 7, 2009,November 30, 2012, there were 548496 stockholders of record of our common stock. All common stock held in street names are recorded in the Company’s stock register as being held by one stockholder.
See Part III, Item 12 for information regarding securities authorized for issuance under our equity compensation plans.
Dividend Policy
Our current credit agreements limit the payment of dividends, other than dividends payable solely in our capital stock, without prior consent of our lenders. To date, we have not paid cash dividends on our common stock, and for the foreseeable future we intend to retain earnings for the development of our business. Future decisions to pay cash dividends will be at the discretion of the Board of Directors and will depend upon our results of operations, financial condition and capital expenditure plans and restrictive covenants under our credit facilities, along with other relevant factors.
13
The following Performance Graph and related information shall not be deemed “soliciting“soliciting material” or to be “filed” with the Securities and Exchange Commission,nor shall such information be incorporated by reference into any future filing underthe Securities Act of 1933 or Securities Act of 1934, each as amended, except to theextent that we specifically incorporate it by reference into such filing.
The following graph compares, for the period from October 31, 2004,1, 2007, to September 30, 2009,2012, the cumulative stockholder return on our common stock with the cumulative total return on the NASDAQ Market Index and Industrial Electrical Equipment.Equipment Group (a select group of peer companies – Advanced Energy Industries, Inc.; Altra Holdings Inc.; AZZ Inc.; CTC Corporation; DXP Enterprises Inc.; ENGlobal Corporation; ESCO Technologies Inc.; Franklin Electric Company, Inc.; Integrated Electrical Services, Inc.; Methode Electronics Inc. and Power-One Inc.). The comparison assumes that $100 was invested on October 31, 2004,1, 2007, in our common stock, the NASDAQ Market Index and Industrial Electrical Equipment.Equipment Group. The stock price performance reflected on the following graph is not necessarily indicative of future stock price performance.
12
COMPARISON OF5-YEAR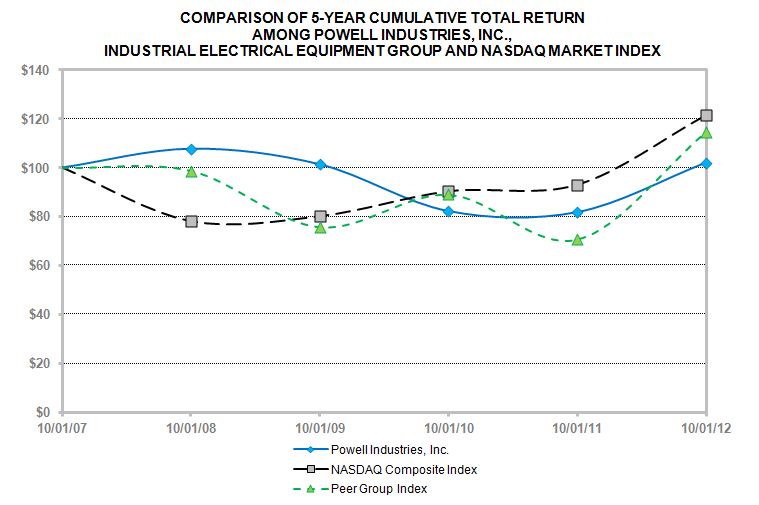
CUMULATIVE TOTAL RETURNAMONG POWELL INDUSTRIES, INC.,INDUSTRIAL ELECTRICAL EQUIPMENT AND NASDAQ MARKET INDEX
Item 6.

The selected financial data shown below for the past five years (including the11-month period ended September 30, 2006) was derived from our audited financial statements. The historical results are not necessarily indicative of the operating results to be expected in the future. The selected financial data should be read in conjunction with “Management’s Discussion and Analysis of Financial Condition and Results of Operations” and the consolidated financial statements and related notes included elsewhere in this Annual Report.
In December 2009, we purchasedacquired the business and certain assets relatedof PowerComm Inc. and its subsidiaries, Redhill Systems Ltd., Nextron Corporation, PCG Technical Services Inc. and Concorde Metal Manufacturing Ltd (the entire business of which is referred to the ANSI medium voltageherein as Powell Canada). Powell Canada is headquartered in Edmonton, Alberta, Canada, and provides electrical equipment, maintenance and services. Powell Canada is also a manufacturer of switchgear and circuit breaker business of GE’s Consumer & Industrial unit.related products, primarily serving the oil and gas industry in western Canada. The operating results of the Power/Vac® product line are included from that date.
14
13
|
|
|
|
|
|
|
|
|
|
|
|
|
|
|
| Years Ended September 30, | |||||||||||||
| 2012 |
| 2011 |
| 2010 |
| 2009 |
| 2008 | |||||
| (In thousands, except per share data) | |||||||||||||
|
|
|
|
|
|
|
|
|
|
|
|
|
| |
Revenues | $ | 717,194 |
| $ | 562,397 |
| $ | 550,692 |
| $ | 665,851 |
| $ | 638,704 |
Cost of goods sold |
| 577,256 |
|
| 462,467 |
|
| 408,635 |
|
| 520,802 |
|
| 512,298 |
Gross profit |
| 139,938 |
|
| 99,930 |
|
| 142,057 |
|
| 145,049 |
|
| 126,406 |
Selling, general and administrative expenses |
| 88,947 |
|
| 85,058 |
|
| 84,457 |
|
| 79,954 |
|
| 80,416 |
Amortization of intangible assets |
| 2,599 |
|
| 4,752 |
|
| 4,477 |
|
| 3,460 |
|
| 3,585 |
Impairments |
| — |
|
| 7,158 |
|
| 7,452 |
|
| — |
|
| — |
Operating income |
| 48,392 |
|
| 2,962 |
|
| 45,671 |
|
| 61,635 |
|
| 42,405 |
Gain on sale of investment |
| — |
|
| (1,229) |
|
| — |
|
| — |
|
| — |
Interest expense, net |
| 158 |
|
| 194 |
|
| 610 |
|
| 976 |
|
| 2,537 |
Income before income taxes |
| 48,234 |
|
| 3,997 |
|
| 45,061 |
|
| 60,659 |
|
| 39,868 |
Income tax provision |
| 18,577 |
|
| 6,712 |
|
| 19,894 |
|
| 20,734 |
|
| 14,072 |
Net income (loss) |
| 29,657 |
|
| (2,715) |
|
| 25,167 |
|
| 39,925 |
|
| 25,796 |
Net (income) loss attributable to noncontrolling interest |
| — |
|
| — |
|
| (159) |
|
| (208) |
|
| 51 |
Net income (loss) attributable to Powell Industries, Inc. | $ | 29,657 |
| $ | (2,715) |
| $ | 25,008 |
| $ | 39,717 |
| $ | 25,847 |
Basic earnings (loss) per share attributable to Powell Industries, Inc. | $ | 2.50 |
| $ | (0.23) |
| $ | 2.17 |
| $ | 3.48 |
| $ | 2.29 |
Diluted earnings (loss) per share attributable to Powell Industries, Inc. | $ | 2.49 |
| $ | (0.23) |
| $ | 2.14 |
| $ | 3.43 |
| $ | 2.26 |
|
|
|
|
|
| |||||
|
| |||||||||
| As of September 30, | |||||||||
| 2012 | 2011 | 2010 | 2009 | 2008 | |||||
| (In thousands) | |||||||||
Balance Sheet Data: | ||||||||||
Cash and cash equivalents | $ 90,040 | $ 123,466 | $ 115,353 | $ 97,403 | $ 10,134 | |||||
Property, plant and equipment, net | 78,652 | 59,637 | 63,676 | 61,036 | 61,546 | |||||
Total assets | 448,312 | 421,676 | 400,712 | 404,840 | 397,634 | |||||
Long-term debt and capital lease obligations, including current maturities | 4,355 | 5,441 | 6,885 | 9,492 | 41,758 | |||||
Total stockholders’ equity | 310,103 | 275,343 | 277,303 | 246,761 | 206,874 | |||||
Total liabilities and stockholders’ equity | 448,312 | 421,676 | 400,712 | 404,840 | 397,634 | |||||
Item 7. Management’s Discussion and assumed certain operating liabilitiesAnalysis of Financial Condition and contractsResults of Switchgear & Instrumentation Limited. The operating results of S&I are included from that date.
| 11 Months | ||||||||||||||||||||
| Years Ended | Ended | Year Ended | ||||||||||||||||||
| September 30, | September 30, | October 31, | ||||||||||||||||||
| 2009 | 2008 | 2007 | 2006 | 2005 | ||||||||||||||||
| (In thousands, except per share data) | ||||||||||||||||||||
Statements of Operations: | ||||||||||||||||||||
| Revenues | $ | 665,851 | $ | 638,704 | $ | 564,282 | $ | 374,547 | $ | 256,645 | ||||||||||
| Cost of goods sold | 520,802 | 512,298 | 468,691 | 305,489 | 213,411 | |||||||||||||||
| Gross profit | 145,049 | 126,406 | 95,591 | 69,058 | 43,234 | |||||||||||||||
| Selling, general and administrative expenses | 83,414 | 84,001 | 77,246 | 55,345 | 41,846 | |||||||||||||||
| Gain on sale of land and building | — | — | — | — | (1,052 | ) | ||||||||||||||
| Income before interest, income taxes, minority interest | 61,635 | 42,405 | 18,345 | 13,713 | 2,440 | |||||||||||||||
| Interest expense (income), net | 976 | 2,537 | 2,943 | 698 | (386 | ) | ||||||||||||||
| Income tax provision | 20,734 | 14,072 | 5,468 | 4,609 | 932 | |||||||||||||||
| Minority interest | 208 | (51 | ) | 21 | (3 | ) | 63 | |||||||||||||
| Net income | $ | 39,717 | $ | 25,847 | $ | 9,913 | $ | 8,409 | $ | 1,831 | ||||||||||
| Basic earnings per share | $ | 3.48 | $ | 2.29 | $ | 0.90 | $ | 0.77 | $ | 0.17 | ||||||||||
| Diluted earnings per share | $ | 3.43 | $ | 2.26 | $ | 0.88 | $ | 0.76 | $ | 0.17 | ||||||||||
| As of | ||||||||||||||||||||
| As of September 30, | October 31, | |||||||||||||||||||
| 2009 | 2008 | 2007 | 2006 | 2005 | ||||||||||||||||
| (In thousands) | ||||||||||||||||||||
Balance Sheet Data: | ||||||||||||||||||||
| Cash and cash equivalents | $ | 97,403 | $ | 10,134 | $ | 5,257 | $ | 10,495 | $ | 24,844 | ||||||||||
| Marketable securities | — | — | — | — | 8,200 | |||||||||||||||
| Property, plant and equipment, net | 61,036 | 61,546 | 67,401 | 60,336 | 55,678 | |||||||||||||||
| Total assets | 404,840 | 397,634 | 341,015 | 292,678 | 226,778 | |||||||||||||||
| Long-term debt and capital lease obligations, including current maturities | 9,492 | 41,758 | 35,836 | 42,396 | 21,531 | |||||||||||||||
| Total stockholders’ equity | 246,761 | 206,874 | 173,549 | 156,931 | 143,994 | |||||||||||||||
| Total liabilities and stockholders’ equity | 404,840 | 397,634 | 341,015 | 292,678 | 226,778 | |||||||||||||||
The following discussion should be read in conjunction with the accompanying consolidated financial statements and related notes. Any forward-looking statements made by or on our behalf are made pursuant to the safe-harbor provisions of the Private Securities Litigation Reform Act of 1995. Readers are cautioned that such forward-looking statements involve risks and uncertainties in that the actual results may differ materially from those projected in the forward-looking statements. For a description of the risks and uncertainties, please see “Cautionary Statement Regarding Forward-Looking Statements; Risk Factors” and “Item 1A. Risk Factors” contained in this Annual Report.
Overview
We develop, design, manufacture and service customengineered-to-order equipment and systems for the management and control of electrical energy and other critical processes. Headquartered in Houston, Texas, we
15
The markets in which Powell participates in are capital-intensive and cyclical in nature. Cyclicality is predominantly driven by customer demand, global economic conditions and anticipated environmental or regulatory changes which affect the manner in which our customers proceed with capital investments. Our customers analyze various factors including the demand for oil, gas and electrical energy, the overall financial environment, governmental budgets, regulatory actions and environmental concerns. These factors influence the release of new capital projects by our products and services. New investments incustomers.
14
We entered fiscal 2012 with a backlog of unfilled orders of $443.0 million, an increase of $160.7 million over the prior year, which provided our revenue growth during fiscal 2012. As of September 30, 2012, our order backlog remains strong; however, the quotation-to-order period is beginning to lengthen. We enter fiscal 2013 with a backlog of unfilled orders of $436.7 million. Our backlog includes various projects, some of which are for petrochemical, oil and gas construction and transportation infrastructure as well as new investments by municipal and transit authoritiesprojects which take a number of months to expand and improve public transportation, were key drivers of increased business activity in fiscal years 2008 and 2009. Customer inquiries, or requests for proposals, remained strong throughout fiscal 2008 and the first half of fiscal 2009. Accordingly, we entered fiscal 2009 with a strong backlog of orders which resulted in record revenues for fiscal 2009.
Results of Operations
Twelve Months Ended September 30, 2009 (“Fiscal 2009”)2012 (Fiscal 2012) Compared to Twelve MonthsEnded September 30, 2008 (“2011(Fiscal 2008”)2011)
Revenue and Gross Profit
Consolidated revenues increased $27.227.5%, or $154.8 million, to $665.9$717.2 million in Fiscal 2009 compared to $638.7 million in Fiscal 2008. Revenues increased as we have responded to strong market demand by increasing our capacity and throughput.2012. Domestic revenues increased by 10.0%8.9%, or $33.9 million, to $516.0$412.8 million in Fiscal 2009 compared2012 and international revenues increased 65.9%, or $120.9 million, to $469.1$304.4 million in Fiscal 2008. International revenues decreased from $169.6 million in Fiscal 2008 to $149.9 million in Fiscal 2009,2012. Revenues increased primarily as thea result of changes in the British PoundSterling-to-U.S. Dollar exchange rate. Thean increase in consolidated revenues was primarily due to an increased sales effortactivity in complex petrochemical and strong market demand in Fiscal 2008oil and the first half of Fiscal 2009. Gross profit in Fiscal 2009 increased by approximately $18.6 million compared to Fiscal 2008,gas construction projects, as a result of our abilityElectrical Power Products business segment.
Gross profit in Fiscal 2012 increased 40.0%, or $40.0 million, to absorb our fixed costs and improved pricing$139.9 million in Fiscal 2012. Gross profit as a percentage of revenues increased to 19.5% in Fiscal 2012, compared to 17.8% in Fiscal 2011 primarily as a result of strong market activity.
Electrical Power Products
Electrical Power Products business segment recorded revenues of $637.9increased 28.7%, or $153.3 million, to $686.6 million in Fiscal 2009, compared to $611.5 million2012. Revenues increased primarily as a result of an increase in Fiscal 2008. In Fiscal 2009, revenuesproject activity in certain markets. Revenues from public and private utilities were approximately $154.3decreased $51.3 million compared to $171.8$115.3 million in Fiscal 2008.2012. Revenues from commercial and industrial customers totaled $432.5increased $202.2 million to $522.7 million in Fiscal 2009, an increase of $32.5 million compared to Fiscal 2008. Municipal2012. Revenues from municipal and transit projects generated revenues of $51.1increased $2.4 million to $48.6 in Fiscal 2012.
Electrical Power Products business segment gross profit increased 44.4%, or $40.7 million, to $132.5 million in Fiscal 20092012. Gross profit, as a percentage of revenues, increased to 19.3% in Fiscal 2012 compared to $39.717.2% in Fiscal 2011, as a result of favorable operational execution and project management on certain large complex projects that were completed or near completion. Our increase in project activity in Fiscal 2012 also improved our ability to cover fixed and overhead operating costs, partially offset by the challenges on certain large projects at Powell Canada. These challenges resulted from scope changes and cost overruns on certain Canadian projects. We are currently pursuing recovery of certain of these costs; however, there is no assurance these costs can be recovered. Revenues have not been recognized on such costs as recovery has not been deemed probable until change orders are approved by the customer.
Process Control Systems
Process Control Systems business segment revenues increased 5.2%, or $1.5 million, to $30.6 million in Fiscal 2008.
For additional information related to our business segments, see Note M of Notes to Consolidated Financial Statements.
Consolidated Selling, General and Administrative Expenses
Selling, general and administrative expenses, as a percentage
16
15
Amortization of Intangible Assets
Amortization of intangible assets decreased to lower interest rates and the lower amounts outstanding under our credit facility during Fiscal 2009.
Provision for Income TaxesTax Provision
Our provision for income taxes reflectsreflected an effective tax rate on earnings before income taxes of 34.2%38.5% in Fiscal 20092012 compared to 35.3%167.9% in Fiscal 2008.2011. The decrease in the effective tax rate resulted primarily from an agreement reached withfor both Fiscal 2012 and 2011 were negatively impacted by our inability to record the taxing authoritiestax benefit related to pre-tax losses in Canada, offset by the favorable impact on our effective tax rate for the domestic production activities deduction in the United Kingdom resulting in a reduction in tax expense of approximately $568,000 related to foreign tax credits from previous years.
Net Income (Loss) Attributable to Powell Industries, Inc.
In Fiscal 2009,2012, we recorded net income of $39.7$29.7 million, or $3.43earnings of $2.49 per diluted share, compared to $25.8a net loss of $2.7 million, or $2.26a loss of $0.23 per diluted share, in Fiscal 2008. We generated higher revenues and2011. Net income improved gross profits for the Companyin Fiscal 2012 as a whole, while leveraging our existing infrastructure to support ourresult of increased production volume. As previously discussed, net incomerevenue and earnings from increased activity and favorable operational and project execution in Fiscal 2009 included2012. Fiscal 2011 was negatively impacted by the benefitimpairment of intangible assets for Powell Canada of $7.2 million, the $3.5$2.6 million mediated settlement, reduced by legalseparation charge with our former CEO and other expenses of approximately $0.7 million, net ofour inability to record the tax benefits related to a previously completed contract that wasthe pre-tax losses in dispute for several years.
Backlog
The order backlog at September 30, 2009,2012, was $365.8$436.7 million, compared to $518.6$443.0 million at September 30, 2008.2011. New orders placed during Fiscal 20092012 totaled $511.2$710.7 million compared to $705.4$725.2 million in Fiscal 2008. Our decline in2011. The backlog wasfor Fiscal 2012 decreased slightly due to the amountcompletion of projects completed being greater than the amount of orders received,certain complex oil and a number of our customers have delayed the start of new capital projects during the second half of Fiscal 2009.
Fiscal 2008 Compared to Twelve Months Ended September 30, 2007 (“Fiscal 2007”)2011 (Fiscal 2011) Compared to Twelve Months
Revenue and Gross Profit
Consolidated revenues increased $74.4$11.7 million to $638.7$562.4 million in Fiscal 20082011 compared to $564.3$550.7 million in Fiscal 2007.2010. Revenues increased primarily as we responded to strong market demand by increasing our capacity and throughput.a result of the $25.0 million full year impact of revenues from Powell Canada which was acquired in the first quarter of Fiscal 2010. Domestic revenues increaseddecreased by 25.9%3.6% to $469.1$378.9 million in Fiscal 20082011 compared to $372.7$393.3 million in Fiscal 2007.2010, primarily due to reduced manufacturing and service activities because of the lower level of backlog at the beginning of Fiscal 2011. International revenues decreasedincreased from $191.6$157.6 million in Fiscal 20072010 to $169.6$183.5 million in Fiscal 2008, as a large international project was substantially completed in Fiscal 2007. The increase in consolidated revenues was primarily due to higher levels of energy related investments, principally oil and gas projects.2011. Gross profit in Fiscal 2008 increased2011 decreased by approximately $30.8$42.1 million compared to Fiscal 2007,2010, as a result of improved pricing and productivity.
Electrical Power Products
Our Electrical Power Products business segment recorded revenues of $611.5$533.3 million in Fiscal 2008,2011, compared to $541.6$517.1 million in Fiscal 2007.2010. Revenues increased as a result of the $25.0 million full year impact of revenues from Powell Canada which was acquired in the first quarter of Fiscal 2010. Excluding the increase related to the revenues at Powell Canada, revenues decreased primarily due to reduced manufacturing and service activities because of the lower level of backlog at the beginning of Fiscal 2011. In Fiscal 2008,2011, revenues from public and private utilities were approximately $171.8$166.6 million compared to $174.4$148.6 million in Fiscal 2007.2010. Revenues from commercial and industrial customers totaled $400.0$320.5 million in Fiscal 2008, an increase2011, a decrease of $69.6$10.2 million compared to Fiscal 2007.2010. Municipal and transit projects generated revenues of $39.7$46.2 million in Fiscal 20082011 compared to $36.8$37.6 million in Fiscal 2007.
17
16
Process Control Systems
In Fiscal 2008,2011, our Process Control Systems business segment recorded revenues of $27.2$29.1 million, upa decrease from $22.7$33.6 million in Fiscal 2007.2010. Business segment gross profit, increased as a percentage of revenues, decreased to 30.2%28.2% for Fiscal 2008,2011, compared to 28.8%36.5% for Fiscal 2007.2010. This increasedecrease in revenues and gross profit as a percentage of revenues resulted from a less favorable mix of jobs and achieving synergies and increased efficiencies through regionalization of operations. Revenues and gross profit in Fiscal 2008 were also positively impacted by approximately $1.9 million related to the favorable settlement of a claim for extra work performed on a project that was substantially completed in prior years.
For additional information related to our business segments, see Note M of Notes to Consolidated Financial Statements.
Consolidated Selling, General and Administrative Expenses
Consolidated selling, general and administrative expenses decreased to 13.2%15.1% of revenues in Fiscal 20082011 compared to 13.7%15.3% of revenues in Fiscal 2007.2010. Selling, general and administrative expenses increased to $84.0remained relatively unchanged at $85.1 million in Fiscal 20082011 compared to $77.2$84.5 million in Fiscal 2007. This increase is a result of increased commissions, salaries2010. Decreases in short-term and long-term incentive compensation dueresulting from lower earnings compared to Fiscal 2010 were offset by increased volumesdepreciation expense related to the Company’s ERP system in Fiscal 2011, compared to Fiscal 2010. Additionally, separation payments of $2.6 million to our former CEO were recorded in selling, general and earnings.administrative expenses in the fourth quarter of which $1.2 million was paid in October 2011, with the balance being comprised of deferred payments and compensation expense related to the vesting of outstanding equity-based awards. In the prior year there were acquisition-related costs of $2.4 million related to the acquisition of Powell Canada. Selling, general and administrative expenses decreased as a percentage of revenues decreased duein Fiscal 2011 as a result of the increase in revenue of $11.7 million.
Amortization of Intangible Assets
Amortization of intangible assets increased to our ability to leverage our existing infrastructure to support our increased production volume.
Gain on sale of investment
Gain on sale of investment resulted from a $1.2 million gain recorded in the second quarter of Fiscal 2011 from cash received for the sale of our 50% equity investment in Kazakhstan which was previously a part of the acquisition of Powell Canada in Fiscal 2007.2010.
Impairments
An impairment charge of $7.2 million was recorded in Fiscal 2011 related to the impairment of the intangible assets related to Powell Canada. This decrease resultedimpairment of intangible assets was the result of continued operating losses from lower interest ratesPowell Canada and the execution-related challenges on certain large projects, which reduced the Company’s projections for future revenues and cash being usedflows from Powell Canada.
An impairment of goodwill of $7.5 million was recorded in Fiscal 2010 related to fund workingthe Powell Canada acquisition. The Company’s strategic decision to exit the 50% owned joint venture in Kazakhstan and delays in the anticipated growth in capital during Fiscal 2008.
Provision for Income TaxesTax Provision
Our provision for income taxes reflectsreflected an effective tax rate on earnings before income taxes of 35.3%167.9% in Fiscal 20082011 compared to 35.5%44.1% in Fiscal 2007. Our2010. The effective tax rate isfor Fiscal 2011 was negatively impacted by income generatedour inability to record the tax benefit of $4.5 million related to pre-tax losses in Canada, offset by the favorable impact on our effective tax rate for the domestic production activities deduction and the research and development credit in the United Kingdom, which has a lower statutory rate than the United States, as well as a mix of various state income taxes due to the relative mix of volume in the United States.
Net Income (Loss) Attributable to Powell Industries, Inc.
In Fiscal 2008,2011, we recorded a net incomeloss of $25.8$2.7 million, or $2.26a loss of $0.23 per diluted share, compared to $9.9net income of $25.0 million, or $0.88earnings of $2.14 per diluted share, in Fiscal 2007. As discussed above, we generated higher revenues2010. The impairment of intangible assets for Powell Canada of $7.2 million, and improvedour inability to record the tax benefits of $4.5 million related to the pre-tax losses in Canada contributed to our net loss in Fiscal 2011. Fiscal 2011 was also negatively impacted by execution-related challenges on certain large projects at Powell Canada. The overall decrease in net income in Fiscal 2011 compared to Fiscal 2010 resulted from competitive pressure on gross profitsmargins compared to Fiscal 2010 which benefitted from the favorable execution of large projects, as well as cancellation fees and the successful negotiation of change orders on projects which were substantially completed in allprior periods. Net income for Fiscal 2010 was negatively impacted by the impairment of goodwill of approximately $7.5 million and our business segments, while leveraging our existing infrastructureinability to support our increased production volume.record the tax benefit of $3.7 million related to the pre-tax losses in Canada.
17
Backlog
The order backlog at September 30, 2008,2011, was $518.6$443.0 million, compared to $464.5$282.3 million at September 30, 2007.2010. New orders placed during Fiscal 20082011 totaled $705.4$725.2 million compared to $667.1$466.8 million in Fiscal 2007.
18
Cash and cash equivalents increaseddecreased to approximately $97.4$90.0 million at September 30, 2009,2012, compared to $123.5 million at September 30, 2011, primarily as a result of cash flow provided by operationsthe recent purchases of approximately $127.0 million for Fiscal 2009. The approximately $127.0 million of cash flow from operations resulted from net income and our increased effortsland to manage inventory and billings to customers and was used to repay our U.S. revolving credit facility and our revolving credit facility and term loanbuild facilities in the United Kingdom, reducing total debt outstanding by approximately $26.6 million,States and Canada during Fiscal 2012 to financesupport our operational activities.continued expansion of the offshore production markets and the Canadian Oil Sands market. As of September 30, 2009,2012, current assets exceeded current liabilities by 2.12.6 times and our debt to total capitalization ratio was 3.7%1.4%.
We have a $58.5$75.0 million revolving credit facility in the U.S. and an additional £4.0 million (approximately $6.4 million) revolving credit facility in the United Kingdom, both of, which expireexpires in December 2012.2016. As of September 30, 2009,2012, there were no amounts borrowed under these linesthis line of credit. We also have a $10.2 million revolving credit facility in Canada. At September 30, 2012, there was no balance outstanding under the Canadian revolving credit facility. Total long-term debt and capital lease obligations, including current maturities, totaled $9.5$4.4 million at September 30, 2009,2012, compared to $41.8$5.4 million at September 30, 2008.2011. Letters of credit outstanding were $17.6$36.6 million and $31.3$13.2 million at September 30, 20092012 and 2008, respectively.2011, respectively, which reduce our availability under our U.S. credit facility and our Canadian revolving credit facility. Amounts available under the U.S. revolving credit facility andwere $38.5 million at September 30, 2012. Amounts available under the Canadian revolving credit facility in the United Kingdom were approximately $45.9$10.0 million and $6.4 million, respectively, at September 30, 2009.2012. For further information regarding our debt, see Notes HG and K of Notes to Consolidated Financial Statements.
Approximately $8.0 million of our cash at September 30, 2012, was held internationally for international operations. It is our intention to indefinitely reinvest all current and future foreign earnings internationally in order to ensure sufficient working capital and support and expand these operations. In the event that the Company elects to repatriate some or all of the foreign earnings that were previously deemed to be indefinitely reinvested outside the U.S., under current tax laws we would incur additional tax expense upon such repatriation.
We believe that cash available and borrowing capacity under our existing credit facilities should be sufficient to finance anticipated operating activities, capital improvements and expansions, as well as debt repayments for the foreseeable future. We will continue to monitor the factors that drive our markets and strive to maintain our leadership and competitive advantage in the markets we serve while aligning our cost structures with market conditions.
Operating Activities
During Fiscal 2009,2012, cash used in operating activities was $6.0 million. During Fiscal 2011 and Fiscal 2010, cash provided by operating activities was approximately $127.0 million.$15.5 million and $64.1 million, respectively. Cash flow from operations is primarily influenced by demand for our products and services and is impacted as our progress payment terms with our customers are matched with the payment terms with our suppliers. During Fiscal 2012, the cash used in operations of $6.0 million was primarily the result of increased unbilled contract receivables based on progress billing milestones. The increasedecrease in Fiscal 2011 cash flow from operations resulted primarily from the net incomeloss and our increased efforts to manage inventory and billings to customers.increase in accounts receivable. During Fiscal 2008, cash used in operating activities was approximately $5.2 million. Cash flow from operations was negatively impacted as accounts receivable and inventories increased due to higher volume as a result of demand for our products and services. During Fiscal 2007,2010, cash provided by operating activities was approximately $12.2 million.
Investing Activities
Purchases of property, plant and equipment during Fiscal 20092012 totaled approximately $8.1$29.1 million compared to $3.4$7.3 million and $14.3$4.4 million in Fiscal 20082011 and 2007,2010, respectively. OurA significant portion of the investments in Fiscal 2012 was to acquire land and build facilities in the United States and Canada to support our continued expansion in the offshore production markets and Canadian Oil Sands. During Fiscal 2011, we received cash of $1.2 million from the sale of our 50% equity investment in Kazakhstan and established a restricted cash account of $1.0 million for the purchase of land near Houston, Texas, which subsequently occurred in October 2011. During Fiscal 2011, our capital expenditures in Fiscal 2009primarily related primarily to the expansionimplementation of ERP systems and construction of a warehouse at one of our operating facilitiesU.S. facilities. During Fiscal 2010, we paid cash of $23.4 million, excluding debt assumed and for upgradesacquisition-related expenses, to acquire Powell Canada. Additionally, $0.6 million was paid to acquire the noncontrolling interest related to our enterprise resource planning system (“ERP system”). The majority of our 2007 capital expenditures were usedjoint venture in Singapore (Powell Asia), which has been strategically realigned from an operating entity to continue the implementation of our new ERP system,a sales and the expansion of two of our operating facilities.
There were no materialsignificant proceeds from the sale of fixed assets in Fiscal 20092012, 2011 or 2008. Proceeds2010.
Financing Activities
18
Net cash provided by financing activities was $1.3 million during Fiscal 2012 due to cash being received from the saleexercise of fixed assets provided cash of approximately $0.2 million in Fiscal 2007. Proceeds from the sale of fixed assets in Fiscal 2009 and 2007 were primarily from the sale of idled manufacturing facilities and equipment.
19
At September 30, 2009,2012, our long-term contractual obligations were limited to debt and leases. The table below details our commitments by type of obligation, including interest if applicable, and the period that the payment will become due (in thousands).
|
|
|
|
|
As of September 30, 2012, Payments Due by Period: | Long-Term Debt Obligations | Capital Lease Obligations | Operating Lease Obligations |
Total |
Less than 1 year | $ 416 | $ 347 | $ 5,597 | $ 6,360 |
1 to 3 years | 827 | 32 | 8,108 | 8,967 |
3 to 5 years | 820 | — | 5,184 | 6,004 |
More than 5 years | 2,018 | — | 7,725 | 9,743 |
Total long-term contractual obligations | $ 4,081 | $ 379 | $ 26,614 | $ 31,074 |
| Long-Term | Operating | |||||||||||
| As of September 30, 2009, | Debt | Lease | ||||||||||
Payments Due by Period: | Obligations | Obligations | Total | |||||||||
| Less than 1 year | $ | 5,929 | $ | 2,982 | $ | 8,911 | ||||||
| 1 to 3 years | 850 | 5,356 | 6,206 | |||||||||
| 3 to 5 years | 841 | 2,219 | 3,060 | |||||||||
| More than 5 years | 3,267 | — | 3,267 | |||||||||
| Total long-term contractual obligations | $ | 10,887 | $ | 10,557 | $ | 21,444 | ||||||
As of September 30, 2009,2012, the total unrecognized tax benefit related to uncertain tax positions was approximately $0.6$0.5 million. We estimate that none of this will be paid within the next 12 months. However, we believe that it is reasonably possible that within the next 12 months, the total unrecognized tax benefits will decrease by approximately $80,00039% due to the expiration of certain statutes of limitations.limitations in various state and local jurisdictions. We are unable to make reasonably reliable estimates regarding the timing of future cash outflows, if any, associated with the remaining unrecognized tax benefits.
Other Commercial Commitments
We are contingently liable for secured and unsecured letters of credit of $17.6$43.6 million as of September 30, 2009,2012, of which $12.6$36.6 million reduces our borrowing capacity.
The following table reflects potential cash outflows that may result from a contingentin the event relatedthat we are unable to perform under our letters of creditcontracts (in thousands):
�� | |
As of September 30, 2012, Payments Due by Period: | Letters of Credit |
Less than 1 year | $ 23,997 |
1 to 3 years | 8,162 |
3 to 5 years | 11,436 |
More than 5 years | — |
Total long-term commercial obligations | $ 43,595 |
| As of September 30, 2009, | Letters of | |||
Payments Due by Period: | Credit | |||
| Less than 1 year | $ | 9,312 | ||
| 1 to 3 years | 7,948 | |||
| 3 to 5 years | 135 | |||
| More than 5 years | 159 | |||
| Total long-term commercial obligations | $ | 17,554 | ||
We also had performance and maintenance bonds totaling approximately $182.8$249.1 million that were outstanding at September 30, 2009.2012. Performance and maintenance bonds are used to guarantee contract performance to our customers.
Outlook
The markets in largewhich Powell participates are capital-intensive projectsand cyclical in nature. Cyclicality is predominantly driven by customer demand, global economic conditions and anticipated environmental or regulatory changes which affect the oil and gas, petrochemical, utility and transportation markets,manner in which can take several years to plan and execute. Once our customers begin the construction phase, projectsproceed with capital investments. Market cycles are typically completed. Our record revenuesmany months or years in Fiscal 2009 were driven by the large numberlength and size of capital projects that were planned and initiated over the past two years.
20
19
Our operating results are frequently impacted by the timing and resolution of change orders and project close-out which could cause gross margins to improve during the period in which these items are approved and finalized with customers. As a result of these issues, the timing and ultimate financial outcome on some projects is often difficult to predict.
We believe that cash available and borrowing capacity under our existing revolverscredit facility should be sufficient to finance anticipated operational activities, capital improvements and debt repayments for the foreseeable future. During this period of economic and market uncertainty, we will continue to monitor the factors that drive our markets. Wemarkets and will strive to maintain our leadership and competitive advantage in the markets we serve while aligning our cost structures with market conditions.
Effects of Inflation
We have experienced significant price volatility related toare impacted by inflation which has caused increases in our costs of raw materials, primarily copper, aluminum and steel, during the past three years. Fixed priceFixed-price contracts can limit our ability to pass costthese increases to our customers, thus negatively impacting our earnings. We anticipate that the volatilityinflation in commodity prices could impact our operations in Fiscal 2010.
Critical Accounting Policies and Estimates
The preparation of consolidated financial statements in conformity with accounting principles generally accepted in the United States of America requires management to make estimates and assumptions that affect the reported amounts of assets, liabilities, revenues and expenses and the disclosures of contingent assets and liabilities. We base our estimates on historical experience and on various other assumptions that are believed to be reasonable under the circumstances. Actual results may differ from these estimates. We believe the following accounting policies and estimates to be critical in the preparation and reporting of our consolidated financial statements.
Revenue Recognition
Our revenues are primarily generated from engineering and manufacturing of custom products under long-term contracts that may last from one month to several years, depending on the contract. Revenues from long-term contracts are recognized on thepercentage-of-completion method of accounting.
Under thepercentage-of-completion method of accounting, revenues are recognized as work is performed primarily based on the estimated completion to date calculated by multiplying the total contract price by percentage of performance to date, based on total costs or total labor dollars incurred to date to the total estimated costs or total labor dollars estimated at completion. The method used to determine the percentage of completion is typically the cost method, unless the labor method is a more accurate method of measuring the progress of the project. Application of thepercentage-of-completion method of accounting requires the use of estimates of costs to be incurred for the performance of the contract. Contract costs include all direct material, direct labor costs and those indirect costs related to contract performance, such as indirect labor, supplies, tools, repairs and all costs associated with operation of equipment. The cost estimation process is based upon the professional knowledge and experience of the Company’sour engineers, project managers and financial professionals. Factors that are considered in estimating the work to be completed and ultimate contract recovery include the availability and productivity of labor, the nature and complexity of the work to be performed, the effect of change orders, the availability of materials, the effect of any delays in our project performance and the recoverability of any claims. Changes in job performance, job conditions, estimated profitability and final contract settlements, including our estimate of liquidated damages, if any, may result in revisions to costs and income, with their effects being recognized in the period in which the revisions are determined. Whenever revisions of estimated contract costs and contract values indicate that the contract costs will exceed estimated revenues, thus creating a loss, a provision for the total estimated loss is recorded in that period.
21
Costs and estimated earnings in excess of billings on uncompleted contracts also include certain costs associated with unapproved change orders. These costs are included when change order approval is probable. Amounts are carried at the lower of cost or net realizable value. Revenue is recognized to the extent of costs incurred when recovery is probable. The amounts recorded involve the use of judgments and estimates; thus, actual recoverable amounts could differ from original assumptions.
Allowance for Doubtful Accounts
We maintain and continually assess the adequacy of an allowance for doubtful accounts representing our estimate for losses resulting from the inability of our customers to pay amounts due to us. This estimated allowance is based on historical experience of uncollected accounts, the level of past due accounts, the overall level of outstanding accounts receivable, information about specific customers with respect to their inability to make payments and expectations of future conditions that could impact the collectibility of accounts receivable. However, future changes in our
20
customers’ operating performance and cash flows, or in general economic conditions, could have an impact on their ability to fully pay these amounts, which, among other things, could have a material adverse impact on our operating results.
Impairment of Long-Lived Assets
We evaluate the recoverability of the carrying amount ofreview long-lived assets including intangible assets with definite useful lives,for impairment whenever events or changes in circumstances indicate that the carrying value of an asset may not be fully recoverable. The review for impairment of these long-lived assets takes into account estimates ofrealizable. If an evaluation is required, the estimated future cash flows. For assets held for sale or disposal, the fair value of the asset is measured using quoted market prices or an estimation of net realizable value. An impairment loss exists when estimated undiscounted cash flows expectedassociated with the asset are compared to result from the useasset’s carrying amount to determine if an impairment of such asset is necessary. This requires us to make long-term forecasts of the assetfuture revenues and its eventual dispositioncosts related to the assets subject to review. Forecasts require assumptions about demand for our products and future market conditions. Estimating future cash flows requires significant judgment, and our projections may vary from cash flows eventually realized. Future events and unanticipated changes to assumptions could require a provision for impairment in a future period. The effect of any impairment would be reflected in income (loss) from operations in the Consolidated Statements of Operations. In addition, we estimate the useful lives of our long-lived assets and other intangibles and periodically review these estimates to determine whether these lives are less than its carrying amount.
Intangible Assets
Goodwill and other intangible assets with indefinite useful lives are no longer amortized, but are evaluated for impairment annually, or immediately if conditions indicate that impairment could exist. The annual evaluation forrequires a two-step impairment test to identify potential goodwill impairment and measure the amount of a goodwill and indefinite-lived intangible assetsimpairment loss. The first step of the test compares the fair value of a reporting unit with its carrying amount, including goodwill. If the carrying amount of a reporting unit exceeds its fair value, the second step of the goodwill impairment test is based on valuation models that incorporate assumptions and internal projectionsperformed to measure the amount of expected future cash flows and operating plans.
The costs of intangible assets with determinable useful lives are amortized over their estimated useful lives. When certain events or changes in operating conditions occur, an impairment assessment is performed and lives of intangible assets with determinable lives may be adjusted.
See Note D of the Notes to Consolidated Financial Statements for a discussion of our impairment recorded related to the acquisition of Powell Canada.
Accruals for Contingent Liabilities
From time to time, contingencies such as insurance, liquidated damages and legal claims arise in the normal course of business. Pursuant to current accounting standards, we must evaluate such contingencies to subjectively determine the likelihood that an asset has been impaired or a liability has been incurred at the date of the financial statements, as well as evaluating whether the amount of the loss can be reasonably estimated. If the likelihood is determined to be probable and it can be reasonably estimated, the estimated loss is recorded. The amounts we record for insurance claims, warranties, legal and other contingent liabilities require judgments regarding the amount of expenses that will ultimately be incurred. We use past experience and history, as well as the specific circumstances surrounding each contingent liability, in evaluating the amount of liability that should be recorded. Actual results could differ from our estimates.
Warranty Costs
We provide for estimated warranty costs at the time of sale based upon historical rates applicable to individual product lines. In addition, specific provisions are made when the costs of such warranties are expected to exceed accruals. Our standard terms and conditions of sale include a warranty for parts and service for the earlier of 18 months from the date of shipment or 12 months from the date of initial operations. Occasionally projects require warranty terms that are longer than our standard terms due to the nature of the project. Extended warranty terms may be negotiated and included in our contracts. We use past experience and historical claims to determine the estimated liability. Actual results could differ from our estimate.
22
We account for income taxes under the asset and liability method, based on the income tax laws and rates in the countries in which operations are conducted and income is earned. This approach requires the recognition of deferred tax assets and liabilities for the expected future tax consequences of temporary differences between the carrying amounts and the tax basis of assets and liabilities. Developing our provision for income taxes requires significant judgment and expertise in federal, international and state income tax laws, regulations and strategies, including the determination of deferred tax assets and liabilities and, if necessary, any valuation allowances that may be required for deferred tax assets. We haverecord a valuation allowance to reduce our deferred tax assets to the amount that is more likely than not to be realized. We believe that the net deferred tax asset recorded any valuation allowances as of September 30, 2009, because we believe that2012, is realizable through future reversals of existing taxable temporary differences and future taxable income will, more likely than not,income. If we were to subsequently determine that we would be sufficientable to realize deferred tax assets in the benefitsfuture in excess of thoseour net
21
recorded amount, an adjustment to deferred tax assets aswould increase earnings for the temporary differencesperiod in basis reverse over time.which such determination was made. We will continue to assess the adequacy of the valuation allowance on a quarterly basis. Our judgments and tax strategies are subject to audit by various taxing authorities.
The objectives of accounting for uncertainty in income taxes on October 1, 2007. This new accounting guidance addressesare to recognize the determinationamount of whethertaxes payable or refundable for the current year and deferred tax benefits claimedliabilities and assets for the future tax consequences of events that have been recognized in an entity’s financial statements or expected to be claimed on a tax return should be recorded in the financial statements. The Company mayreturns. We recognize the tax benefit from an uncertain tax positionsposition only if it is at least more likely than not that the tax position will be sustained on examination by the taxing authorities, based on the technical merits of the positions.position. The tax benefits recognized in the financial statements from such a position should be measured based on the largest benefit that has a greater than fifty percent50% likelihood of being realized upon settlement with the taxing authorities. This new accounting guidanceultimate settlement. Accounting literature also provides guidance on derecognition of income tax assets and liabilities, classification of current and deferred income tax assets and liabilities, accounting for interest and penalties onassociated with tax positions, and income taxes, accountingtax disclosures. Judgment is required in interim periods and requires increased disclosures.
See Note H of the Notes to Consolidated Financial Statements for disclosures related to the valuation allowance recorded related to foreign deferred taxes.
Foreign Currency Translation
The functional currency for our foreign subsidiaries is the local currency in which the entity is located. The financial statements of all subsidiaries with a functional currency other than the U.S. Dollar have been translated into U.S. Dollars. All assets and liabilities of foreign operations are translated into U.S. Dollars using year-end exchange rates, and all revenues and expenses are translated at average rates during the respective period. The U.S. Dollar results that arise from such translation, as well as exchange gains and losses on intercompany balances of a long-term investment nature, are included in the cumulative currency translation adjustments in accumulated other comprehensive income in stockholders’ equity.
Derivative Financial Instruments
As part of managing our exposure to changes in foreign currency exchange rates, we periodically utilize foreign exchange forward contracts. The objective of these contracts is to minimize impacts to cash flows and profitability due to changes in foreign currency exchange rates on accounts receivable, accounts payable and forecasted cash transactions. These contracts are recorded in the consolidated balance sheets at fair value, which is based upon an income approach consisting of a discounted cash flow model that takes into account the present value of the future cash flows under the terms of the contracts using current market information, as of the reporting date, such as foreign currency spot and forward rates.
We formally document our hedging relationships, including identifying the hedging instruments and the hedged items, as well as our risk management objectives and strategies for undertaking the hedge transactions. We also formally assess, both at inception and at least quarterly thereafter, whether the derivatives that are used in hedging transactions are highly effective in offsetting changes in the cash flows of the hedged item. The effective portion of the change in fair value of a derivative is recorded as a component of accumulated other comprehensive income in the consolidated balance sheets. When the hedged item affects the incomeconsolidated statement of operations, the gain or loss included in accumulated other comprehensive income is reported on the same line in the consolidated statements of operations as the hedged item. In addition, any ineffective portion of the changes in the fair value of derivatives used as cash flow hedges is reported in the consolidated statements of operations as the changes occur. If it is determined that a derivative ceases to be a highly effective hedge, or ifit is probable that the anticipatedforecasted transaction is no longer likely towill not occur, we discontinue hedge accounting and any unrealized gains or losses are recorded in the consolidated statementsstatement of operations.
23
New Accounting Pronouncements
From time to time, new accounting pronouncements are issued by the Financial Accounting Standards Board (“FASB”)(the FASB), which are adopted by us as of the specified effective date. Unless otherwise discussed, management believes that the impact of recently issued standards, which are not yet effective, will not have a material impact on our consolidated statements upon adoption.
In January 2010, the FASB issued updated guidance to amend the disclosure requirements related to recurring and nonrecurring fair value measurements. This update requires new disclosures about significant transfers of assets and liabilities between Level 1 and Level 2 of the fair value hierarchy (including the reasons for these transfers) and the reasons for any transfers in or out of Level 3. This update also requires a reconciliation of recurring Level 3 measurements about purchases, sales, issuances and settlements on a gross basis. In addition to these new
22
disclosure requirements, this update clarifies certain existing disclosure requirements. For example, this update clarifies that reporting entities are required to provide fair value measurement disclosures for each class of assets and liabilities, rather than each major category of assets or liabilities. This update also clarifies the requirement for entities to disclose information about both the valuation techniques and inputs used in estimating Level 2 and Level 3 fair value measurements. This update became effective for us with the interim and annual reporting period beginning after December 15, 2009, our fiscal year 2011, except for the requirement to provide the Level 3 activity of purchases, sales, issuances and settlements on a gross basis, which became effective for us with the interim and annual reporting period beginning after December 15, 2010, our fiscal year 2012. We were not required to provide the amended disclosures for any previous periods presented for comparative purposes. Other than requiring additional disclosures, adoption of this update has codifiednot had a single source of authoritative nongovernmentalmaterial impact on our consolidated financial statements.
In May 2011, the FASB issued accounting guidance related to fair value measurement, which amends current guidance to achieve common fair value measurement and disclosure requirements in U.S. GAAP theAccounting Standards Codification(“Codification”). While the Codification doesand International Financial Reporting Standards. This guidance generally represents clarification of fair value measurement standards, but also includes instances where a particular principle or requirement for measuring fair value of disclosing information about fair value measurements has changed. This guidance is effective for fiscal years, and interim periods within those years, beginning after December 15, 2011. We will adopt this guidance for our fiscal year beginning October 1, 2012. We do not change U.S. GAAP, it introducesexpect this pronouncement to have a new structure that is organized in an easily accessible, user-friendly on-line research system. The Codification supersedes all existing accounting standards documents. All other accounting literature not included in the Codification will be considered nonauthoritative. Unless needed to clarify a point to readers, we will refrain from citing specific section references when discussing application of accounting principles or addressing new or pending accounting rule changes.
In December 2007,June 2011, the FASB issued new accounting guidance on business combinations.the presentation of comprehensive income in financial statements. Entities are required to present total comprehensive income either in a single, continuous statement of comprehensive income or in two separate, but consecutive, statements. Under the single-statement approach, entities must include the components of net income, a total for net income, the components of other comprehensive income and a total for comprehensive income. Under the two-statement approach, entities must report an income statement and, immediately following, a statement of other comprehensive income. Under either method, entities must display adjustments for items reclassified from other comprehensive income to net income in both net income and other comprehensive income. The newprovisions for this guidance establishes principlesare effective for fiscal years, and requirements for how an acquirer recognizes and measures in its financial statements the identifiable assets acquired, the liabilities assumed, any noncontrolling interest in the acquiree and the goodwill acquired. The new accounting guidance also establishes disclosure requirements to enable the evaluation of the nature and financial effects of the business combination. The new guidance is effective as of theinterim periods within those years, beginning of an entity’s fiscal year that begins after December 15, 2008, and2011, with early adoption permitted. We will be adopted by us in the first quarter of Fiscal 2010. We are currently unable to predict the potential impact, if any, of the adoption ofadopt this new accounting guidance on future acquisitions.
In December 2007,September 2011, the FASB issued new accounting guidance which simplifies how an entity is required to test goodwill for noncontrolling interests in consolidated financial statements. This new guidance establishes accounting and reporting standards for ownership interests in subsidiaries held by parties other than the parent, the amount of consolidated net income attributable to the parent and to the noncontrolling interest, changes in a parent’s ownership interest and the valuation of retained noncontrolling equity investments when a subsidiary is deconsolidated. The new accounting guidance also establishes disclosure requirements that clearly identify and distinguish between the interests of the parent and the interests of the noncontrolling owners. The new guidance is effective as of the beginning of an entity’s fiscal year that begins after December 15, 2008, and will be adopted by us in the first quarter of Fiscal 2010. We are currently evaluating the potential impact of the adoption ofimpairment. Under this guidance, on our consolidated results of operations and financial condition.
24
In April 2009,July 2012, the FASB issued newan accounting guidance addressingstandards update regarding the interim disclosures abouttesting of indefinite-lived intangible assets for impairment. Under this update, an entity has the option to first assess qualitative factors to determine whether the existence of events and circumstances indicate that it is more likely than not that the indefinite-lived intangible asset is impaired. If, after assessing the events and circumstances, an entity concludes that it is more likely than not that the indefinite-lived intangible asset is impaired, then the entity is not required to take further action. However, if any entity concludes otherwise, it is required to determine the fair value of financial instruments, which amended the previous disclosures regardingindefinite-lived intangible asset and perform the quantitative impairment testing by comparing the fair value of financial instruments,with the carrying amount. An entity also has the option to bypass the qualitative assessment for any indefinite-lived intangible asset in any period and proceed directly to performing the quantitative test. An entity will be able to resume performing the qualitative assessment in any subsequent period. This update is effective for annual and interim financial reporting.tests performed for fiscal years beginning after September 15, 2012, our fiscal year 2013. Early adoption is permitted; however, we will not adopt this guidance until October 1, 2012. This new guidance requires disclosures about the fair value of financial instruments in interim financial statements, in additionis not expected to the annual financial statements as already required. This new accounting guidance became effective for interim periods ending after June 15, 2009, and was adopted by us in the third quarter of Fiscal 2009. The adoption of this new guidance had nohave a material impact on our consolidatedreported results of operations or financial statements.
In April 2009,August 2012, the FASB issued new accounting guidance regardingSEC adopted a rule mandated by the accounting for assets acquired and liabilities assumedDodd-Frank Act to require companies to publicly disclose their use of conflict minerals that originated in a business combination due to contingencies. This new guidance clarifies the initial and subsequent recognition, subsequent accounting and disclosure of assets and liabilities arising from contingencies in a business combination. This new guidance requires that assets acquired and liabilities assumed in a business combination that arise from contingencies be recognized at fair value, if the acquisition — date fair value can be reasonably estimated. If the acquisition-date fair value of an asset or liability cannot be reasonably estimated, the asset or liability would be measured at the amount that would be recognized using the accounting guidance related to accounting for contingencies or the guidance for reasonably estimating losses. This new accounting guidance becomes effective for us on October 1, 2010; however, as the provisionDemocratic Republic of the guidance will be applied prospectivelyCongo or an adjoining country. The final rule applies to business combinationsa company that uses minerals including tantalum, tin, gold or tungsten. The final rule requires companies to provide disclosure on a new form filed with an acquisition datethe SEC, with the first specialized disclosure report due on or afterMay 31, 2014, for the guidance becomes effective,2013 calendar year, and annually on May 31 each year thereafter. We are currently evaluating the impact to us cannot be determined until a transaction occurs.
Item 7A. Quantitative and level of activity for assets or liabilities have significantly decreased, and identifying transactions that are not orderly. This guidance requires an evaluation of whether there has been a significant decrease in the volume and level of activity for the asset or liability in relation to normal market activity for the asset or liability. If there has, transactions or quoted prices may not be indicative of fair value and a significant adjustment may need to be made to those prices to estimate fair value. Additionally, an entity must consider whether the observed transaction was orderly (that is, not distressed or forced). If the transaction was orderly, the obtained price can be considered a relevant observable input for determining fair value. If the transaction is not orderly, other valuation techniques must be used when estimating fair value. This new accounting guidance must be applied prospectively for interim periods ending after June 15, 2009, and was adopted by us effective June 30, 2009, but currently has no impact on our financial statements.
We are exposed to certain market risks arising from transactions we have entered into in the normal course of business. These risks primarily relate to fluctuations in interest rates, foreign exchange rates and commodity prices.
Interest Rate Risk
23
If we decide to borrow under one of our credit facilities, we will be subject to market risk resulting from changes in interest rates related to our floating rate bank credit facility. At September 30, 2009, $12.6 million was outstanding, bearing interest at approximately 3.0% per year. AIf we were to make such borrowings, a hypothetical 100 basis point increase in variable interest rates wouldmay result in a total annual increase in interest expense of approximately $126,000.material impact to our financial statements. While we do not currently have any derivative contracts to hedge our exposure to interest rate risk, we have in the past and may in the future enter into such contracts. During each of the past three years, we have not experienced a significant effect on our business due to changes in interest rates.
25
We have significant operations that expose us to currency risk in the British Pound Sterling, the Canadian Dollar and to a lesser extent the Euro. Amounts invested in our foreign operations are translated into U.S. Dollars at the exchange rates in effect at the balance sheet date. The resulting translation adjustments are recorded as accumulated other comprehensive income (loss), a component of stockholders’ equity in our consolidated balance sheets. We believe the exposure to the effects that fluctuating foreign currencies have on our consolidated results of operations is limited because the foreign operations primarily invoice customers and collect obligations in their respective currencies or U.S. Dollars and a portion of ourDollars. Our international operations are financed utilizing local credit facility is payablefacilities denominated in British Pound Sterling.local currencies. Additionally, expenses associated with these transactions are generally contracted and paid for in the same local currencies. A 10% unfavorable change in the British PoundSterling-to-U.S.U.S. Dollar exchange rate, relative to other functional currencies in which we operate, would not materially impact our consolidated balance sheet at September 30, 2009.
During Fiscal 2009,2011 and Fiscal 2012, we entered into foureight foreign currency forward contracts to manage the volatility of future cash flows on certain largelong-term contracts that are denominated in the British Pound Sterling. The contracts arewere designated as cash flow hedges for accounting purposes. The changes in fair value related to the effective portion of the hedges are recognized as a component of accumulated other comprehensive income on our consolidated balance sheets. At September 30, 2009, a net liability of approximately $0.8 million was2012, all foreign currency forward contracts have been settled, with no balances recorded on our consolidated balance sheets related to these transactions.
24
Commodity Price Risk
We are subject to market risk from fluctuating market prices of certain raw materials. While such materials are typically available from numerous suppliers, commodity raw materials are subject to price fluctuations. We attempt to pass along such commodity price increases to our customers on acontract-by-contract basis to avoid a negative effect on profit margin. While we may do so in the future, we have not currently entered into any derivative contracts to hedge our exposure to commodity risk. We continue to experience price volatility with some of our key raw materials and components. Fixed priceFixed-price contracts may limit our ability to pass cost increases to our customers, thus negatively impacting our earnings. Fluctuations in commodity prices may have a material impact on our future earnings and cash flows.
Market Risk
We are also exposed to general market and other risk and its potential impact on accounts receivable or costs and estimated earnings in excess of billings on uncompleted contracts. The amounts recorded may be at risk if our customers’ ability to pay these obligations is negatively impacted by economic conditions. Our customers and their industries are typically EPC firms, oil and gas producers, oil and gas pipelines, refineries, petrochemical plants, electrical power generators, public and private utilities, co-generation facilities, mining/metals operations, pulp and paper plants, transportation authorities, governmental agencies and other large industrial customers. We maintain on-goingongoing discussions with customers regarding contract status with respect to payment status, change orders and billing terms in an effort to monitor collections of amounts billed.
26
25
Item 8. Financial Statements and Supplementary Data
|
Index to Consolidated Financial Statements | Page | |||
Financial Statements: | ||||
27 | ||||
| 2011 | 28 | |||
| 2010 | 29 | |||
| 2010 | 30 | |||
| 2010 | 31 | |||
32 | ||||
27
26
REPORT OF INDEPENDENT REGISTERED PUBLIC ACCOUNTING FIRM
To the Board of Directors
and Stockholders of Powell Industries, Inc.:
In our opinion, the consolidated financial statements listed in the accompanying index present fairly, in all material respects, the financial position of Powell Industries, Inc. and its subsidiaries at September 30, 20092012 and 2008,2011, and the results of their operations and their cash flows for each of the three years in the period ended September 30, 2009,2012 in conformity with accounting principles generally accepted in the United States of America. Also, in our opinion, the Company maintained, in all material respects, effective internal control over financial reporting as of September 30, 2009,2012, based on criteria established inInternal Control —- Integrated Framework issued by the Committee of Sponsoring Organizations of the Treadway Commission (COSO). The Company’sCompany's management is responsible for these financial statements, for maintaining effective internal control over financial reporting and for its assessment of the effectiveness of internal control over financial reporting included in Management’s Report on Internal Control over Financial Reporting appearing under Item 9A.management's report referred to above. Our responsibility is to express opinions on these financial statements and on the Company’sCompany's internal control over financial reporting based on our integrated audits. We conducted our audits in accordance with the standards of the Public Company Accounting Oversight Board (United States). Those standards require that we plan and perform the audits to obtain reasonable assurance about whether the financial statements are free of material misstatement and whether effective internal control over financial reporting was maintained in all material respects. Our audits of the financial statements included examining, on a test basis, evidence supporting the amounts and disclosures in the financial statements, assessing the accounting principles used and significant estimates made by management, and evaluating the overall financial statement presentation. Our audit of internal control over financial reporting included obtaining an understanding of internal control over financial reporting, assessing the risk that a material weakness exists, and testing and evaluating the design and operating effectiveness of internal control based on the assessed risk. Our audits also included performing such other procedures as we considered necessary in the circumstances. We believe that our audits provide a reasonable basis for our opinions.
A company’s internal control over financial reporting is a process designed to provide reasonable assurance regarding the reliability of financial reporting and the preparation of financial statements for external purposes in accordance with generally accepted accounting principles. A company’s internal control over financial reporting includes those policies and procedures that (i) pertain to the maintenance of records that, in reasonable detail, accurately and fairly reflect the transactions and dispositions of the assets of the company; (ii) provide reasonable assurance that transactions are recorded as necessary to permit preparation of financial statements in accordance with generally accepted accounting principles, and that receipts and expenditures of the company are being made only in accordance with authorizations of management and directors of the company; and (iii) provide reasonable assurance regarding prevention or timely detection of unauthorized acquisition, use, or disposition of the company’s assets that could have a material effect on the financial statements.
Because of its inherent limitations, internal control over financial reporting may not prevent or detect misstatements. Also, projections of any evaluation of effectiveness to future periods are subject to the risk that controls may become inadequate because of changes in conditions, or that the degree of compliance with the policies or procedures may deteriorate.
/s/ PricewaterhouseCoopers LLP
Houston, Texas
December 11, 2009
28
27
POWELL INDUSTRIES, INC. AND SUBSIDIARIES
(In thousands, except share and per share data)
|
|
|
| September 30, | |
| 2012 | 2011 |
ASSETS | ||
Current Assets: | ||
Cash and cash equivalents | $ 90,040 | $ 123,466 |
Cash held in escrow | — | 1,000 |
Accounts receivable, less allowance for doubtful accounts of $1,399 and $391, respectively | 125,771 | 109,317 |
Costs and estimated earnings in excess of billings on uncompleted contracts | 86,734 | 51,568 |
Inventories, net | 32,917 | 36,640 |
Income taxes receivable | 485 | 4,071 |
Deferred income taxes | 4,598 | 3,580 |
Prepaid expenses and other current assets | 5,865 | 7,040 |
Total Current Assets | 346,410 | 336,682 |
Property, plant and equipment, net | 78,652 | 59,637 |
Goodwill | 1,003 | 1,003 |
Intangible assets, net | 13,317 | 15,847 |
Other assets | 8,930 | 8,507 |
Total Assets | $ 448,312 | $ 421,676 |
|
|
|
LIABILITIES AND STOCKHOLDERS’ EQUITY | ||
Current Liabilities: | ||
Current maturities of long-term debt and capital lease obligations | $ 725 | $ 1,140 |
Income taxes payable | 3,516 | 881 |
Accounts payable | 48,490 | 56,893 |
Accrued salaries, bonuses and commissions | 25,822 | 22,314 |
Billings in excess of costs and estimated earnings on uncompleted contracts | 37,144 | 44,523 |
Accrued product warranty | 5,714 | 4,603 |
Other accrued expenses | 9,462 | 7,370 |
Total Current Liabilities | 130,873 | 137,724 |
Long-term debt and capital lease obligations, net of current maturities | 3,630 | 4,301 |
Deferred compensation | 2,891 | 3,242 |
Postretirement benefit obligation | 685 | 900 |
Other liabilities | 130 | 166 |
Total Liabilities | 138,209 | 146,333 |
|
|
|
Commitments and Contingencies (Note K) | ||
|
|
|
Stockholders’ Equity: | ||
Preferred stock, par value $.01; 5,000,000 shares authorized; none issued | — | — |
Common stock, par value $.01; 30,000,000 shares authorized; 11,915,673 and 11,752,393 shares issued and outstanding, respectively | 119 | 117 |
Additional paid-in capital | 38,452 | 34,343 |
Retained earnings | 271,911 | 242,254 |
Accumulated other comprehensive income (loss) | (379) | (1,371) |
Total Stockholders’ Equity | 310,103 | 275,343 |
Total Liabilities and Stockholders’ Equity | $ 448,312 | $ 421,676 |
| September 30, | ||||||||
| 2009 | 2008 | |||||||
ASSETS | ||||||||
| Current Assets: | ||||||||
| Cash and cash equivalents | $ | 97,403 | $ | 10,134 | ||||
| Accounts receivable, less allowance for doubtful accounts of $1,607 and $1,180, respectively | 114,274 | 132,446 | ||||||
| Costs and estimated earnings in excess of billings on uncompleted contracts | 46,335 | 82,574 | ||||||
| Inventories, net | 46,252 | 72,679 | ||||||
| Income taxes receivable | 695 | 149 | ||||||
| Deferred income taxes | 3,303 | 1,518 | ||||||
| Prepaid expenses and other current assets | 6,741 | 3,935 | ||||||
| Total Current Assets | 315,003 | 303,435 | ||||||
| Property, plant and equipment, net | 61,036 | 61,546 | ||||||
| Goodwill | 1,084 | 1,084 | ||||||
| Intangible assets, net | 21,305 | 25,014 | ||||||
| Other assets | 6,412 | 6,555 | ||||||
| Total Assets | $ | 404,840 | $ | 397,634 | ||||
| LIABILITIES AND STOCKHOLDERS’ EQUITY | ||||||||
| Current Liabilities: | ||||||||
| Current maturities of long-term debt and capital lease obligations | $ | 4,692 | $ | 7,814 | ||||
| Income taxes payable | 7,637 | 7,223 | ||||||
| Accounts payable | 48,124 | 54,168 | ||||||
| Accrued salaries, bonuses and commissions | 24,503 | 26,361 | ||||||
| Billings in excess of costs and estimated earnings on uncompleted contracts | 44,772 | 39,336 | ||||||
| Accrued product warranty | 7,558 | 6,793 | ||||||
| Other accrued expenses | 11,856 | 11,041 | ||||||
| Total Current Liabilities | 149,142 | 152,736 | ||||||
| Long-term debt and capital lease obligations, net of current maturities | 4,800 | 33,944 | ||||||
| Deferred compensation | 2,685 | 2,821 | ||||||
| Postretirement benefit obligation | 784 | 807 | ||||||
| Other liabilities | 212 | 204 | ||||||
| Total Liabilities | 157,623 | 190,512 | ||||||
| Commitments and Contingencies (Note K) | ||||||||
| Minority Interest | 456 | 248 | ||||||
| Stockholders’ Equity: | ||||||||
| Preferred stock, par value $.01; 5,000,000 shares authorized; none issued | — | — | ||||||
| Common stock, par value $.01; 30,000,000 shares authorized; 11,479,610 and 11,403,687 shares issued, respectively; 11,479,610 and 11,403,687 shares outstanding, respectively | 115 | 114 | ||||||
| Additional paid-in capital | 29,970 | 26,921 | ||||||
| Retained earnings | 219,961 | 180,244 | ||||||
| Accumulated other comprehensive income | (2,716 | ) | 335 | |||||
| Deferred compensation | (569 | ) | (740 | ) | ||||
| Total Stockholders’ Equity | 246,761 | 206,874 | ||||||
| Total Liabilities and Stockholders’ Equity | $ | 404,840 | $ | 397,634 | ||||
The accompanying notes are an integral part of these consolidated financial statements.
29
28
POWELL INDUSTRIES, INC. AND SUBSIDIARIES
(In thousands, except per share data)
|
|
|
|
| Year Ended September 30, | ||
| 2012 | 2011 | 2010 |
Revenues | $ 717,194 | $ 562,397 | $ 550,692 |
Cost of goods sold | 577,256 | 462,467 | 408,635 |
Gross profit | 139,938 | 99,930 | 142,057 |
|
|
|
|
Selling, general and administrative expenses | 88,947 | 85,058 | 84,457 |
Amortization of intangible assets | 2,599 | 4,752 | 4,477 |
Impairments | — | 7,158 | 7,452 |
Operating income | 48,392 | 2,962 | 45,671 |
|
|
|
|
Gain on sale of investment | — | (1,229) | — |
Interest expense | 272 | 408 | 870 |
Interest income | (114) | (214) | (260) |
Income before income taxes | 48,234 | 3,997 | 45,061 |
|
|
|
|
Income tax provision | 18,577 | 6,712 | 19,894 |
Net income (loss) | 29,657 | (2,715) | 25,167 |
|
|
|
|
Net income attributable to noncontrolling interest | — | — | (159) |
|
|
|
|
Net income (loss) attributable to Powell Industries, Inc. | $ 29,657 | $ (2,715) | $ 25,008 |
|
|
|
|
Earnings (loss) per share attributable to Powell Industries, Inc.: | |||
Basic | $ 2.50 | $ (0.23) | $ 2.17 |
Diluted | $ 2.49 | $ (0.23) | $ 2.14 |
|
|
|
|
Weighted average shares: | |||
Basic | 11,850 | 11,735 | 11,545 |
Diluted | 11,925 | 11,735 | 11,693 |
| Year Ended September 30, | ||||||||||||
| 2009 | 2008 | 2007 | ||||||||||
| Revenues | $ | 665,851 | $ | 638,704 | $ | 564,282 | ||||||
| Cost of goods sold | 520,802 | 512,298 | 468,691 | |||||||||
| Gross profit | 145,049 | 126,406 | 95,591 | |||||||||
| Selling, general and administrative expenses | 83,414 | 84,001 | 77,246 | |||||||||
| Income before interest, income taxes and minority interest | 61,635 | 42,405 | 18,345 | |||||||||
| Interest expense | 1,107 | 2,892 | 3,501 | |||||||||
| Interest income | (131 | ) | (355 | ) | (558 | ) | ||||||
| Income before income taxes and minority interest | 60,659 | 39,868 | 15,402 | |||||||||
| Income tax provision | 20,734 | 14,072 | 5,468 | |||||||||
| Minority interest in net income (loss) | 208 | (51 | ) | 21 | ||||||||
| Net income | $ | 39,717 | $ | 25,847 | $ | 9,913 | ||||||
| Net earnings per common share: | ||||||||||||
| Basic | $ | 3.48 | $ | 2.29 | $ | 0.90 | ||||||
| Diluted | $ | 3.43 | $ | 2.26 | $ | 0.88 | ||||||
| Weighted average shares: | ||||||||||||
| Basic | 11,424 | 11,265 | 11,045 | |||||||||
| Diluted | 11,591 | 11,452 | 11,233 | |||||||||
The accompanying notes are an integral part of these consolidated financial statements.
30
29
POWELL INDUSTRIES, INC. AND SUBSIDIARIES
(In thousands)
|
|
|
|
|
|
|
|
|
|
|
|
| Accumulated |
| |
| Other |
| Additional |
| Other |
| |
| Comprehensive | Common Stock | Paid-in | Retained | Comprehensive |
| |
| Income (Loss) | Shares | Amount | Capital | Earnings | Income/(Loss) | Total |
Balance, September 30, 2009 | 11,480 | $ 115 | $ 29,401 | $ 219,961 | $ (2,716) | $ 246,761 | |
Net income | $ 25,008 | — | — | — | 25,008 | — | 25,008 |
Foreign currency translation adjustments | 1,467 | — | — | — | — | 1,467 | 1,467 |
Exercise of stock options | — | 109 | 1 | 1,699 | — | — | 1,700 |
Stock-based compensation | — | 58 | 1 | 791 | — | — | 792 |
Income tax benefit from stock options exercised | — | — | — | 878 | — | — | 878 |
Amortization of restricted stock | — | — | — | 467 | — | — | 467 |
Issuance of restricted stock | — | 30 | — | 333 | — | — | 333 |
Unrealized loss on cash flow hedges, net of tax of $265 | (206) | — | — | — | — | (206) | (206) |
Postretirement benefit adjustment, net of tax of $58 | 103 | — | — | — | — | 103 | 103 |
Total comprehensive income | 26,372 | — | — | — | 25,008 | 1,364 | 26,372 |
Balance, September 30, 2010 | 11,677 | 117 | 33,569 | 244,969 | (1,352) | 277,303 | |
Net loss | (2,715) | — | — | — | (2,715) | — | (2,715) |
Foreign currency translation adjustments | (19) | — | — | — | — | (19) | (19) |
Exercise of stock options | — | 27 | — | 495 | — | — | 495 |
Stock-based compensation | — | 20 | — | (1,223) | — | — | (1,223) |
Income tax benefit from stock options exercised | — | — | — | 180 | — | — | 180 |
Amortization of restricted stock | — | — | — | 280 | — | — | 280 |
Issuance of restricted stock | — | 28 | — | 1,042 | — | — | 1,042 |
Unrealized gain on cash flow hedges, net of tax of $94 | 111 | — | — | — | — | 111 | 111 |
Postretirement benefit adjustment, net of tax of $60 | (111) | — | — | — | — | (111) | (111) |
Total comprehensive income (loss) | (2,734) | — | — | — | (2,715) | (19) | (2,734) |
Balance, September 30, 2011 | 11,752 | 117 | 34,343 | 242,254 | (1,371) | 275,343 | |
Net income | 29,657 | — | — | — | 29,657 | — | 29,657 |
Foreign currency translation adjustments | 833 | — | — | — | — | 833 | 833 |
Exercise of stock options | — | 98 | 1 | 1,798 | — | — | 1,799 |
Stock-based compensation | — | 7 | — | 1,004 | — | — | 1,004 |
Income tax benefit from stock options exercised | — | — | — | 589 | — | — | 589 |
Amortization of restricted stock | — | — | — | 135 | — | — | 135 |
Issuance of restricted stock | — | 74 | 1 | 583 | — | — | 584 |
Retirement of stock | (15) | — | — | — | — | — | |
Postretirement benefit adjustment, net of tax of $20 | 159 | — | — | — | — | 159 | 159 |
Total comprehensive income | $ 30,649 | — | — | — | 29,657 | 992 | 30,649 |
Balance, September 30, 2012 | 11,916 | $ 119 | $ 38,452 | $ 271,911 | $ (379) | $ 310,103 | |
|
|
|
|
|
|
|
|
|
|
|
|
|
|
|
|
| �� | ||||||||||||||||||||||||||||||||||||
| Accumu- | ||||||||||||||||||||||||||||||||||||
| lated | ||||||||||||||||||||||||||||||||||||
| Other | ||||||||||||||||||||||||||||||||||||
| Other | Compre- | |||||||||||||||||||||||||||||||||||
| Compre- | Additional | hensive | Deferred | |||||||||||||||||||||||||||||||||
| hensive | Common Stock | Paid-in | Retained | Treasury | Income | Compen- | ||||||||||||||||||||||||||||||
| Income | Shares | Amount | Capital | Earnings | Stock | (Loss) | sation | Total | ||||||||||||||||||||||||||||
| Balance, September 30, 2006 | 11,002 | $ | 110 | $ | 12,776 | $ | 144,659 | $ | (525 | ) | $ | 817 | $ | (906 | ) | $ | 156,931 | |||||||||||||||||||
| Net income | $ | 9,913 | 9,913 | 9,913 | ||||||||||||||||||||||||||||||||
| Foreign currency translation adjustments | 1,528 | 1,528 | 1,528 | |||||||||||||||||||||||||||||||||
| Amortization of deferred compensation-ESOP | 361 | 361 | ||||||||||||||||||||||||||||||||||
| Exercise of stock options | 124 | 1 | 2,847 | 416 | 3,264 | |||||||||||||||||||||||||||||||
| Stock-based compensation | 664 | 664 | ||||||||||||||||||||||||||||||||||
| Income tax benefit from stock options exercised | 393 | 393 | ||||||||||||||||||||||||||||||||||
| Amortization of restricted stock | 296 | 296 | ||||||||||||||||||||||||||||||||||
| Deferred compensation — restricted stock | (13 | ) | (13 | ) | ||||||||||||||||||||||||||||||||
| Issuance of restricted stock | 18 | (109 | ) | 109 | — | |||||||||||||||||||||||||||||||
| Total comprehensive income | 11,441 | 9,913 | 1,528 | 11,441 | ||||||||||||||||||||||||||||||||
| Incremental adjustment to adopt postretirement benefit accounting guidance, net of tax of $116 | 212 | 212 | 212 | |||||||||||||||||||||||||||||||||
| Balance, September 30, 2007 | 11,144 | 111 | 16,854 | 154,572 | — | 2,557 | (545 | ) | 173,549 | |||||||||||||||||||||||||||
| Net income | 25,847 | 25,847 | 25,847 | |||||||||||||||||||||||||||||||||
| Foreign currency translation adjustments | (2,395 | ) | (2,395 | ) | (2,395 | ) | ||||||||||||||||||||||||||||||
| Amortization of deferred compensation-ESOP | 387 | 387 | ||||||||||||||||||||||||||||||||||
| Exercise of stock options | 239 | 3 | 4,234 | 4,237 | ||||||||||||||||||||||||||||||||
| Stock-based compensation | 2,166 | 2,166 | ||||||||||||||||||||||||||||||||||
| Income tax benefit from stock options exercised | 2,510 | 2,510 | ||||||||||||||||||||||||||||||||||
| Amortization of restricted stock | 290 | 134 | 424 | |||||||||||||||||||||||||||||||||
| Deferred compensation — restricted stock | 7 | 111 | 111 | |||||||||||||||||||||||||||||||||
| Issuance of restricted stock | 14 | 716 | (716 | ) | — | |||||||||||||||||||||||||||||||
| Adjustment from adoption of accounting guidance on the accounting for uncertainty in income taxes | 40 | (175 | ) | (135 | ) | |||||||||||||||||||||||||||||||
| Postretirement benefit adjustment, net of tax of $97 | 173 | 173 | 173 | |||||||||||||||||||||||||||||||||
| Total comprehensive income | 23,625 | 25,847 | (2,222 | ) | 23,625 | |||||||||||||||||||||||||||||||
| Balance, September 30, 2008 | 11,404 | 114 | 26,921 | 180,244 | — | 335 | (740 | ) | 206,874 | |||||||||||||||||||||||||||
| Net income | 39,717 | 39,717 | 39,717 | |||||||||||||||||||||||||||||||||
| Foreign currency translation adjustments | (2,867 | ) | (2,867 | ) | (2,867 | ) | ||||||||||||||||||||||||||||||
| Amortization of deferred compensation-ESOP | 158 | 158 | ||||||||||||||||||||||||||||||||||
| Exercise of stock options | 31 | 1 | 513 | 514 | ||||||||||||||||||||||||||||||||
| Stock-based compensation | 29 | 1,623 | 1,623 | |||||||||||||||||||||||||||||||||
| Income tax benefit from stock options exercised | 291 | 291 | ||||||||||||||||||||||||||||||||||
| Amortization of restricted stock | 476 | 476 | ||||||||||||||||||||||||||||||||||
| Issuance of restricted stock | 16 | 622 | (463 | ) | 159 | |||||||||||||||||||||||||||||||
| Unrealized loss on cash flow hedges, net of tax of $164 | (304 | ) | (304 | ) | (304 | ) | ||||||||||||||||||||||||||||||
| Postretirement benefit adjustment, net of tax of $67 | 120 | 120 | 120 | |||||||||||||||||||||||||||||||||
| Total comprehensive income | $ | 36,666 | 39,717 | (3,051 | ) | 36,666 | ||||||||||||||||||||||||||||||
| Balance, September 30, 2009 | 11,480 | $ | 115 | $ | 29,970 | $ | 219,961 | $ | — | $ | (2,716 | ) | $ | (569 | ) | $ | 246,761 | |||||||||||||||||||
The accompanying notes are an integral part of these consolidated financial statements.
31
30
POWELL INDUSTRIES, INC. AND SUBSIDIARIES
(In thousands)
|
|
|
|
| Year Ended September 30, | ||
| 2012 | 2011 | 2010 |
Operating Activities: | |||
Net income (loss) | $ 29,657 | $ (2,715) | $ 25,167 |
Adjustments to reconcile net income (loss) to net cash provided by operating activities: | |||
Depreciation | 10,465 | 10,598 | 9,154 |
Amortization | 2,612 | 4,848 | 4,549 |
Impairments | — | 7,158 | 7,452 |
Stock-based compensation | 1,723 | 99 | 1,929 |
Bad debt expense (recovery) | 842 | (114) | 410 |
Deferred income taxes | (1,422) | (425) | (348) |
Gain on sale of investment | — | (1,229) | — |
Changes in operating assets and liabilities: | |||
Accounts receivable, net | (16,209) | (17,616) | 39,687 |
Costs and estimated earnings in excess of billings on uncompleted contracts | (34,755) | (13,519) | 8,243 |
Inventories | 3,948 | 1,542 | 12,320 |
Prepaid expenses and other current assets | 4,821 | 4,514 | (5,813) |
Other assets | (13) | (2,627) | 440 |
Accounts payable and income taxes payable | (6,036) | 14,487 | (20,281) |
Accrued liabilities | 6,411 | (4,255) | (5,392) |
Billings in excess of costs and estimated earnings on uncompleted contracts | (7,492) | 13,553 | (13,762) |
Other, net | (517) | 1,188 | 378 |
Net cash provided (used in) by operating activities | (5,965) | 15,487 | 64,133 |
|
|
|
|
Investing Activities: | |||
Proceeds from sale of property, plant and equipment | 195 | 354 | 14 |
Purchases of property, plant and equipment | (29,063) | (7,347) | (4,420) |
Proceeds from sale of investment | — | 1,229 | — |
Decrease in cash held in escrow | 1,000 | — | — |
Increase in cash held in escrow | — | (1,000) | — |
Purchase of noncontrolling interest – Powell Asia | — | — | (659) |
Acquisition of Powell Canada | — | — | (23,394) |
Net cash used in investing activities | (27,868) | (6,764) | (28,459) |
|
|
|
|
Financing Activities: | |||
Borrowings on Canadian revolving line of credit | 7,992 | 7,810 | 891 |
Payments on Canadian revolving line of credit | (7,992) | (7,818) | (13,984) |
Payments on Canadian term loan | — | — | (2,429) |
Payments on industrial development revenue bonds | (400) | (400) | (400) |
Payments on deferred acquisition payable | — | — | (4,292) |
Payments on short-term and other financing | (717) | (1,068) | (1,087) |
Proceeds from exercise of stock options | 1,799 | 495 | 1,700 |
Tax benefit from exercise of stock options | 589 | 180 | 209 |
Net cash provided by (used in) financing activities | 1,271 | (801) | (19,392) |
|
|
|
|
Net increase (decrease) in cash and cash equivalents | (32,562) | 7,922 | 16,282 |
Effect of exchange rate changes on cash and cash equivalents | (864) | 191 | 1,668 |
Cash and cash equivalents at beginning of year | 123,466 | 115,353 | 97,403 |
Cash and cash equivalents at end of year | $ 90,040 | $ 123,466 | $ 115,353 |
| Year Ended September 30, | ||||||||||||
| 2009 | 2008 | 2007 | ||||||||||
| Operating Activities: | ||||||||||||
| Net income | $ | 39,717 | $ | 25,847 | $ | 9,913 | ||||||
| Adjustments to reconcile net income to net cash provided by (used in) operating activities: | ||||||||||||
| Depreciation | 7,493 | 8,133 | 7,688 | |||||||||
| Amortization | 3,469 | 3,740 | 3,876 | |||||||||
| Amortization of unearned restricted stock | 634 | 425 | 296 | |||||||||
| Minority interest earnings (loss) | 208 | (51 | ) | 21 | ||||||||
| Stock-based compensation | 1,622 | 2,167 | 651 | |||||||||
| Bad debt expense | 959 | 637 | 1,192 | |||||||||
| Deferred income taxes | (1,447 | ) | 318 | (592 | ) | |||||||
| Changes in operating assets and liabilities: | ||||||||||||
| Accounts receivable, net | 15,392 | (27,146 | ) | 578 | ||||||||
| Costs and estimated earnings in excess of billings on uncompleted contracts | 35,701 | (14,062 | ) | (25,945 | ) | |||||||
| Inventories | 25,884 | (25,513 | ) | (19,148 | ) | |||||||
| Prepaid expenses and other current assets | (3,432 | ) | 657 | (2,354 | ) | |||||||
| Other assets | (194 | ) | — | (1,530 | ) | |||||||
| Accounts payable and income taxes payable | (4,891 | ) | (4,916 | ) | 18,657 | |||||||
| Accrued liabilities | (40 | ) | 10,422 | 7,877 | ||||||||
| Billings in excess of costs and estimated earnings on uncompleted contracts | 5,789 | 13,773 | 8,883 | |||||||||
| Deferred compensation | 23 | 164 | 1,781 | |||||||||
| Other | 97 | 217 | 316 | |||||||||
| Net cash provided by (used in) operating activities | 126,984 | (5,188 | ) | 12,160 | ||||||||
| Investing Activities: | ||||||||||||
| Proceeds from sale of fixed assets | 30 | — | 175 | |||||||||
| Purchases of property, plant and equipment | (8,081 | ) | (3,428 | ) | (14,338 | ) | ||||||
| Net cash used in investing activities | (8,051 | ) | (3,428 | ) | (14,163 | ) | ||||||
| Financing Activities: | ||||||||||||
| Borrowings on US revolving line of credit | 50,953 | 229,480 | 69,385 | |||||||||
| Payments on US revolving line of credit | (69,953 | ) | (212,480 | ) | (70,385 | ) | ||||||
| Borrowings on UK revolving line of credit | — | — | 2,276 | |||||||||
| Payments on UK revolving line of credit | (2,388 | ) | (1,596 | ) | (1,143 | ) | ||||||
| Payments on UK term loan | (4,223 | ) | (2,343 | ) | (1,564 | ) | ||||||
| Payments on capital lease obligations | (13 | ) | (52 | ) | (52 | ) | ||||||
| Payments on short-term financing | — | — | (623 | ) | ||||||||
| Payments on industrial development revenue bonds | (400 | ) | (400 | ) | (400 | ) | ||||||
| Payments on deferred acquisition payable | (5,220 | ) | (5,563 | ) | (5,198 | ) | ||||||
| Proceeds from exercise of stock options | 515 | 4,236 | 3,264 | |||||||||
| Tax benefit from exercise of stock options | 291 | 2,510 | 393 | |||||||||
| Net cash (used in) provided by financing activities | (30,438 | ) | 13,792 | (4,047 | ) | |||||||
| Net increase (decrease) in cash and cash equivalents | 88,495 | 5,176 | (6,050 | ) | ||||||||
| Effect of exchange rate changes on cash and cash equivalents | (1,226 | ) | (299 | ) | 812 | |||||||
| Cash and cash equivalents at beginning of year | 10,134 | 5,257 | 10,495 | |||||||||
| Cash and cash equivalents at end of year | $ | 97,403 | $ | 10,134 | $ | 5,257 | ||||||
The accompanying notes are an integral part of these consolidated financial statements.
32
31
POWELL INDUSTRIES, INC. AND SUBSIDIARIES
A. Business and Organization
Powell Industries, Inc. (“we,” “us,” “our,” “Powell”(we, us, our, Powell or the “Company”)Company) was incorporated in the state of Delaware in 2004 as a successor to a Nevada company incorporated in 1968. The Nevada corporation was the successor to a company founded by William E. Powell in 1947, which merged into the Company in 1977. Our major subsidiaries, all of which are wholly-owned, include: Powell Electrical Systems, Inc.; Transdyn, Inc.; Powell Industries International, Inc.; Switchgear & Instrumentation Limited (S&I) and Switchgear & Instrumentation Properties Limited.
We develop, design, manufacture and service customengineered-to-order equipment and systems for the management and control of electrical energy and other critical processes. Headquartered in Houston, Texas, we serve the transportation, environmental, energy, industrial and utility industries.
B. Summary of General Electric Company’s (“GE”) Consumer & Industrial unit located at its West Burlington, Iowa facility. We refer to the acquired product line herein as “Power/Vac®.” The operating results of the Power/Vac® product line are included from the acquisition date.
Principles of Consolidation
The consolidated financial statements include the accounts of Powell and our wholly-owned subsidiaries. The financial position and results of operation of our Singapore joint venture, in which we holdheld a majority ownership, have also been consolidated. As a result of this consolidation, we record minoritynoncontrolling interest on our balance sheet for our joint venture partner’s share of equity.equity in the joint venture. All significant intercompany accounts and transactions have been eliminated in consolidation.
Reclassifications
Certain reclassifications have been made in prior years’ financial statements to conform to the presentation used in the current year. These reclassifications have not resulted in any changes to previously reported net income for any periods.
Use of Estimates
The preparation of financial statements in conformity with accounting principles generally accepted in the United States (“U.S. GAAP”)(U.S. GAAP) requires management to make estimates and assumptions that affect the amounts reported in the consolidated financial statements and accompanying footnotes. The most significant estimates used in our financial statements affect revenue and cost recognition for construction contracts, the allowance for doubtful accounts, provision for excess and obsolete inventory, goodwill and other intangible assets, self-insurance, warranty accruals, income taxes and estimates related to acquisition valuations. The amounts we recordrecorded for insurance claims, warranties, legal, income taxes and other contingent liabilities require judgments regarding the amount of expenses that will ultimately be incurred. We base our estimates on historical experience and on various other assumptions, as well as the specific circumstances surrounding these contingent liabilities, in evaluating the amount of liability that should be recorded. Estimates may change as new events occur, additional information becomes available or operating environments change. Actual results may differ from our estimates. The most significant estimates used in our financial statements affect revenue and cost recognition for construction contracts, the allowance for doubtful accounts, self-insurance, warranty accruals and postretirement benefit obligations.
Cash and Cash Equivalents
Cash and cash equivalents include cash on hand, deposits with banks and highly liquid investments with original maturities of three months or less.
Restricted Cash
Cash of $1.0 million was held in escrow at September 30, 2011. This restricted cash was related to a purchase of land which closed in October 2011 for $6.5 million.
32
Supplemental Disclosures of Cash Flow Information (in thousands):
| Year Ended September 30, |
|
| |||||||||||||
| 2009 | 2008 | 2007 | Year Ended September 30, | ||||||||||||
2012 | 2011 | 2010 | |||||||||||||
| Cash paid during the period for: | |||||||||||||||
| Interest | $ | 439 | $ | 1,447 | $ | 1,309 | $ 141 | $ 102 | $ 563 | ||||||
| Income taxes, net of refunds | 21,527 | 3,641 | 2,392 | 12,104 | 3,889 | 31,993 | |||||||||
33
Financial instruments include cash, short-term investments, marketable securities, receivables, payables and debt obligations. Except as described below, due to the short-term nature of the investments, the book value is representative of their fair value. The carrying value of debt approximates fair value as interest rates are indexed to the Federal Funds Rate, the London interbank offered rate (“LIBOR”)Canadian Prime Rate or the bank’s prime rate.
Accounts Receivable
Accounts receivable are stated net of allowances for doubtful accounts. We maintain and continually assess the adequacy of the allowance for doubtful accounts representing our estimate for losses resulting from the inability of our customers to pay amounts due to us. This estimated allowance is based on historical experience of uncollected accounts, the level of past due accounts, the overall level of outstanding accounts receivable, information about specific customers with respect to their inability to make payments and expectations of future conditions that could impact the collectibility of accounts receivable. Future changes in our customers’ operating performance and cash flows or in general economic conditions could have an impact on their ability to fully pay these amounts, which could have a material impact on our operating results. In most cases, receivables are not collateralized. However, we utilize letters of credit to secure payment on sales when possible. At September 30, 20092012 and 2008,2011, accounts receivable included retention amounts of $8.1$8.7 million and $8.5$6.1 million, respectively. Retention amounts are in accordance with applicable provisions of engineering and construction contracts and become due upon completion of contractual requirements. Approximately $0.6$4.0 million of the retained amount at September 30, 2009,2012, is expected to be collected subsequent to September 30, 2010.
Costs and Estimated Earnings in Excess of Billings on Uncompleted Contracts
Costs and estimated earnings in excess of billings on uncompleted contracts arise when revenues are recorded on apercentage-of-completion basis but cannot be invoiced under the terms of the contract. Such amounts are invoiced upon completion of contractual milestones.
Costs and estimated earnings in excess of billings on uncompleted contracts also include certain costs associated with unapproved change orders. These costs are included when change order approval is probable. Amounts are carried at the lower of cost or net realizable value. No profitRevenue is recognized onto the extent of costs incurred until change order approvalwhen recovery is obtained.probable. The amounts recorded involve the use of judgments and estimates; thus, actual recoverable amounts could differ from original assumptions. See Note K — Commitments and Contingencies for a discussion related to certain costs recorded in costs and estimated earnings in excess of billings on uncompleted contracts.
In accordance with industry practice, assets and liabilities related to costs and estimated earnings in excess of billings on uncompleted contracts, as well as billings in excess of costs and estimated earnings on uncompleted contracts, have been classified as current. The contract cycle for certain long-term contracts may extend beyond one year; thus, collection of amounts related to these contracts may extend beyond one year.
Inventories
Inventories are stated at the lower of cost or market usingfirst-in, first-out (FIFO) or weighted-average methods and include the cost of materials, labor and manufacturing overhead. We use estimates in determining the level of reserves required to state inventory at the lower of cost or market. Our estimates are based on market activity levels, production requirements, the physical condition of products and technological innovation. Changes in any of these factors may result in adjustments to the carrying value of inventory.
34
Property, plant and equipment are stated at cost and are depreciated using the straight-line method over the estimated useful lives of the assets. Expenditures for repairs and maintenance are charged to expense when incurred. Expenditures for major renewals and improvements, which extend the useful lives of existing equipment, are capitalized and depreciated. Upon retirement or disposition of property, plant and equipment, the cost and related accumulated depreciation are removed from the accounts, and any resulting gain or loss is recognized in the Consolidated Statements of Operations.
We evaluate the recoverability of the carrying amount of long-lived assets, including intangible assets with definite useful lives,review property, plant and equipment for impairment whenever events or changes in circumstances indicate that the carrying value of an asset may not be fully recoverable. The review for impairment of these long-lived assets takes into account estimates ofrealizable. If an evaluation is required, the estimated future cash flows. For assets held for sale or disposal, the fair value of the asset is measured using quoted market prices or an estimation of net realizable value. An impairment loss exists when estimated undiscounted cash flows expectedassociated with the asset are compared to result from the useasset’s carrying amount to determine if an impairment of such asset is necessary. This requires us to make long-term forecasts of the asset future revenues
33
and its eventual disposition are less than its carrying amount.
Intangible Assets Which Are Amortized
The costs of intangible assets with determinable useful lives are amortized over their estimated useful lives. When certain events or changes in operating conditions occur, the estimated future undiscounted cash flows associated with the asset are compared to the asset’s carrying amount to determine if an impairment assessmentof such assets is performed and lives ofnecessary. For intangible assets with determinablethat are amortized, we review their estimated useful lives may be adjusted.and evaluate whether events and circumstances warrant a revision to the remaining useful life. For additional information regarding our intangible assets and related impairment, see Note J.
Goodwill and Indefinite Lived Assets
Goodwill and other intangible assets with indefinite useful lives are evaluated for impairment annually, or immediately if conditions indicate that impairment could exist. The evaluation requires a two-step impairment test to identify potential goodwill impairment and measure the amount of a goodwill impairment loss. The first step of the test compares the fair value of a reporting unit with its carrying amount, including goodwill. If the carrying amount of a reporting unit exceeds its fair value, the second step of the goodwill impairment test is performed to measure the amount of the impairment loss. Both steps of the goodwill impairment testing involve significant estimates.
Income Taxes
We account for income taxes under the asset and liability method.method, based on the income tax laws and rates in the countries in which operations are conducted and income is earned. This approach requires the recognition of deferred tax assets and liabilities for the expected future tax consequences of temporary differences between the carrying amounts and the tax basis of assets and liabilities. Developing our provision for income taxes requires significant judgment and expertise in federal, stateinternational and internationalstate income tax laws, regulations and strategies, including the determination of deferred tax assets and liabilities and, if necessary, any valuation allowances that may be required for deferred tax assets. We haverecord a valuation allowance to reduce our deferred tax assets to the amount that is more likely than not to be realized. We believe that the deferred tax asset recorded any valuation allowances as of September 30, 2009, because we believe that2012, is realizable through future reversals of existing taxable temporary differences and future taxable income will, more likely than not,income. If we were to subsequently determine that we would be sufficientable to realize deferred tax assets in the benefitsfuture in excess of thoseour net recorded amount, an adjustment to deferred tax assets aswould increase earnings for the temporary differencesperiod in basis reverse over time.which such determination was made. We will continue to assess the adequacy of the valuation allowance on a quarterly basis. Our judgments and tax strategies are subject to audit by various taxing authorities.
The objectives of accounting for uncertainty in income taxes on October 1, 2007. This guidance addressesare to recognize the determinationamount of whethertaxes payable or refundable for the current year and deferred tax benefits claimedliabilities and assets for the future tax consequences of events that have been recognized in an entity’s financial statements or expected to be claimed on a tax return should be recorded in the financial statements. The Company mayreturns. We recognize the tax benefit from an uncertain tax positionsposition only if it is at least more likely than not that the tax position will be sustained on examination by the taxing authorities, based on the technical merits of the position. The tax benefits recognized in the financial statements from such a position should be measured based on the largest benefit that has a greater than 50% likelihood of being realized upon settlement with the taxing authorities. This accounting guidanceultimate settlement. Accounting literature also provides guidance on derecognition of income tax assets and liabilities, classification of current and deferred income tax assets and liabilities, accounting for interest and penalties onassociated with tax positions, and income taxes, accountingtax disclosures. Judgment is required in interim periods and requires increased disclosures.
35
34
Revenue Recognition
Our revenues are primarily generated from engineering and manufacturing of custom products under long-term contracts that may last from one month to several years, depending on the contract. Revenues from long-term contracts are recognized on thepercentage-of-completion method of accounting.
Under thepercentage-of-completion method of accounting, revenues are recognized as work is performed primarily based on the estimated completion to date calculated by multiplying the total contract price by percentage of performance to date, based on total costs or total labor dollars incurred to date to the total estimated costs or total labor dollars estimated at completion. The method used to determine the percentage of completion is typically the cost method, unless the labor method is determined to be a more accurate method of measuring the progress of the projects. Application of thepercentage-of-completion method of accounting requires the use of estimates of costs to be incurred for the performance of the contract. Contract costs include all direct material, direct labor costs and those indirect costs related to contract performance, such as indirect labor, supplies, tools, repairs and all costs associated with operation of equipment. The cost estimation process is based upon the professional knowledge and experience of the Company’sour engineers, project managers and financial professionals. Factors that are considered in estimating the work to be completed and ultimate contract recovery include the availability and productivity of labor, the nature and complexity of the work to be performed, the effect of change orders, the availability of materials, the effect of any delays in our project performance and the recoverability of any claims. Changes in job performance, job conditions, estimated profitability and final contract settlements, including our estimate of liquidated damages, if any, may result in revisions to costs and income, with their effects being recognized in the period in which the revisions are determined. Whenever revisions of estimated contract costs and contract values indicate that the contract costs will exceed estimated revenues, thus creating a loss, a provision for the total estimated loss is recorded in that period.
Revenues associated with maintenance, repair and service contracts are recognized when the services are performed. Expenses related to these types of services are recognized as incurred.
Warranties
We provide for estimated warranty costs at the time of sale based upon historical rates applicable to individual product lines. In addition, specific provisions are made when the costs of such warranties are expected to exceed accruals. Our standard terms and conditions of sale include a warranty for parts and service for the earlier of 18 months from the date of shipment or 12 months from the date of initial operations.
Research and Development Expense
Research and development costs are charged to expense as incurred. These costs are included as a component of selling, general and administrative expenses on the Consolidated Statements of Operations. Such amounts were $6.0$7.7 million, $6.6$7.5 million and $5.6$6.5 million in fiscal years 2009, 20082012, 2011 and 2007,2010, respectively.
Foreign Currency Translation
The functional currency for our foreign subsidiaries is the local currency in which the entity is located. The financial statements of all subsidiaries with a functional currency other than the U.S. Dollar have been translated into U.S. Dollars. All assets and liabilities of foreign operations are translated into U.S. Dollars using year-end exchange rates, and all revenues and expenses are translated at average rates during the respective period. The U.S. Dollar results that arise from such translation, as well as exchange gains and losses on intercompany balances of a long-term investment nature, are included in the cumulative currency translation adjustments in accumulated other comprehensive income in stockholders’ equity.
36
We measure stock-based compensation cost at the first quarter of fiscal year 2006, we adopted accounting guidance that generally requires the recognition of the cost of employee services for share-based compensationgrant date based on the grant date fair value of the equity or liability instruments issuedrestricted stock award and any unearned or deferred compensation (contra-equity accounts) related to awards prior to adoption be eliminated againstrecognize it as expense over the appropriate equity accounts. Also underapplicable vesting period of the new standard, excessstock award using the straight-line method. Excess income tax benefits related to share-based compensation expense that must be recognized directly in equity are considered financing rather than operating cash flow activities.
35
Derivative Financial Instruments
As part of managing our exposure to changes in foreign currency exchange rates, we periodically utilize foreign exchange forward contracts. The objective of these contracts is to minimize impacts to cash flows and profitability due to changes in foreign currency exchange rates on accounts receivable, accounts payable and forecasted cash transactions. These contracts are recorded in the Consolidated Balance Sheets at fair value, which is based upon an income approach consisting of a discounted cash flow model that takes into account the present value of the future cash flows under the terms of the contracts using current market information as of the reporting date, such as foreign currency spot and forward rates.
We formally document our hedging relationships, including identifying the hedging instruments and the hedged items, as well as our risk management objectives and strategies for undertaking the hedge transaction. We also formally assess, both at inception and at least quarterly thereafter, whether the derivatives that are used in hedging transactions are highly effective in offsetting changes in the cash flows of the hedged item. The effective portion of the change in fair value of a derivative is recorded as a component of accumulated other comprehensive income in the Consolidated Balance Sheets. When the hedged item affects the income statement, the gain or loss included in accumulated other comprehensive income is reported on the same line in the Consolidated Statements of Operations as the hedged item. In addition, any ineffective portion of the changes in the fair value of derivatives used as cash flow hedges is reported in the Consolidated Statements of Operations as the changes occur. If it is
37
We provide 1) qualitative disclosures regarding the objectives and strategies for using derivative instruments and engaging in hedging activities in the context of our overall risk exposure; 2) quantitative disclosure in tabular format of the fair values of derivative instruments and their gains and losses and 3) disclosures about credit-risk related contingent features in derivative instruments.
Accumulated Other Comprehensive Income (Loss)
Accumulated other comprehensive income (loss), which is included as a component of stockholders’ equity net of tax, includes unrealized gains or losses onavailable-for-sale marketable securities, derivative instruments, postretirement benefit adjustments and currency translation adjustments in foreign consolidated subsidiaries.
Fair Value MeasurementsNew Accounting Standards
From time to time, new accounting pronouncements are issued by the Financial Accounting Standards Board (the FASB), which are adopted by us as of the specified effective date. Unless otherwise discussed, management believes that the impact of recently issued standards, which are not yet effective, will not have a material impact on our consolidated statements upon adoption.
In January 2010, the FASB issued updated guidance onto amend the disclosure requirements related to recurring and nonrecurring fair value measurements. TheThis update requires new guidance definesdisclosures about significant transfers of assets and liabilities between Level 1 and Level 2 of the fair value establisheshierarchy (including the reasons for these transfers) and the reasons for any transfers in or out of Level 3. This update also requires a frameworkreconciliation of recurring Level 3 measurements about purchases, sales, issuances and settlements on a gross basis. In addition to these new disclosure requirements, this update clarifies certain existing disclosure requirements. For example, this update clarifies that reporting entities are required to provide fair value measurement disclosures for each class of assets and liabilities, rather than each major category of assets or liabilities. This update also clarifies the requirement for entities to disclose information about both the valuation techniques and inputs used in estimating Level 2 and Level 3 fair value measurements. This update became effective for us with the interim and annual reporting period beginning after December 15, 2009, our fiscal year 2011, except for the requirement to provide the Level 3 activity of purchases, sales, issuances and settlements on a gross basis, which became effective for us with the interim and annual reporting period beginning after December 15, 2010, our fiscal year 2012. We were not required to provide the amended disclosures for any previous periods presented for comparative purposes. Other than requiring additional disclosures, adoption of this update has not had a material impact on our consolidated financial statements.
In May 2011, the FASB issued accounting guidance related to fair value measurement, which amends current guidance to achieve common fair value measurement and disclosure requirements in U.S. GAAP and International Financial Reporting Standards. This guidance generally represents clarification of fair value measurement standards, but also includes instances where a particular principle or requirement for measuring fair value under U.S. GAAP and expands disclosuresof disclosing information about fair value measurements. It was effective for us beginning October 1, 2008, for certain financial assets and liabilities. Refer to Note C for additional information regarding our fair value measurements for financial assets and liabilities. The newhas changed. This guidance is effective for non-financial assetsfiscal years, and liabilities recognized or disclosed at fair value on a nonrecurring basisinterim periods within those years, beginning after December 15, 2011. We will adopt this guidance for our fiscal year beginning October 1, 2009.2012. We believe that the adoption of the new guidance applicabledo not expect this pronouncement to non-financial assets and liabilities will not have a material effect on our consolidated financial position, results of operations or cash flows.
In December 2007,June 2011, the FASB issued new accounting guidance on business combinations.the presentation of comprehensive income in financial statements. Entities are required to present total comprehensive income either in a single, continuous statement of comprehensive income or in two separate, but consecutive, statements. Under the single-statement approach, entities must include the components of net income, a total for net income, the components of other comprehensive income and a total for comprehensive income. Under the two-statement approach, entities must report an income statement and, immediately following, a statement of other comprehensive income. Under either method, entities must display adjustments for items reclassified from other comprehensive income to net income in both net income and other comprehensive income. The newprovisions for this guidance establishes principlesare effective for fiscal years, and requirements for how an acquirer recognizes and measures in its financial statements the identifiable assets acquired, the liabilities assumed, any noncontrolling interest in the acquiree and the goodwill acquired. The new accounting guidance also establishes disclosure requirements to enable the evaluation of the nature and financial effects of the business combination. The new guidance is effective as of theinterim periods within those years, beginning of an
38
36
In December 2007,September 2011, the FASB issued new accounting guidance which simplifies how an entity is required to test goodwill for noncontrolling interests in consolidated financial statements. This new guidance establishes accounting and reporting standards for ownership interests in subsidiaries held by parties other than the parent, the amount of consolidated net income attributable to the parent and to the noncontrolling interest, changes in a parent’s ownership interest and the valuation of retained noncontrolling equity investments when a subsidiary is deconsolidated. The new accounting guidance also establishes disclosure requirements that clearly identify and distinguish between the interests of the parent and the interests of the noncontrolling owners. The new guidance is effective as of the beginning of an entity’s fiscal year that begins after December 15, 2008, and will be adopted by us in the first quarter of fiscal year 2010. We are currently evaluating the potential impact of the adoption ofimpairment. Under this guidance, on our consolidated results of operations and financial condition.
In July 2012, the FASB issued an accounting standards update regarding the testing of indefinite-lived intangible assets for impairment. Under this update, an entity has the option to first assess qualitative factors to determine whether the existence of events and circumstances indicate that it is more likely than not that the indefinite-lived intangible asset is impaired. If, after assessing the events and circumstances, an entity concludes that it is more likely than not that the indefinite-lived intangible asset is impaired, then the entity is not required to take further action. However, if any entity concludes otherwise, it is required to determine the fair value of the indefinite-lived intangible asset and perform the quantitative impairment testing by comparing the fair value with the carrying amount. An entity also has the option to bypass the qualitative assessment for any indefinite-lived intangible asset in any period and proceed directly to performing the quantitative test. An entity will be able to resume performing the qualitative assessment in any subsequent period. This update is effective for annual and interim tests performed for fiscal years beginning after September 15, 2012, our fiscal year 2013. Early adoption is permitted; however, we will not adopt this guidance until October 1, 2012. This guidance is not expected to have a material impact on our reported results of operations or financial position.
In August 2012, the SEC adopted a rule mandated by usthe Dodd-Frank Act to require companies to publicly disclose their use of conflict minerals that originated in the Democratic Republic of the Congo or an adjoining country. The final rule applies to a company that uses minerals including tantalum, tin, gold or tungsten. The final rule requires companies to provide disclosure on a new form filed with the SEC, with the first quarter of fiscalspecialized disclosure report due on May 31, 2014, for the 2013 calendar year, 2010. Earlier application is not permitted.and annually on May 31 each year thereafter. We are currently evaluating the potential impact if any, of adoption.
Subsequent Events
We evaluated subsequent events through the adoptiontime of filing this Annual Report on Form 10-K. No significant events occurred subsequent to the balance sheet or prior to the filing of this new guidance on our consolidated results of operations and financial condition.
39
C. Fair Value Measurements
We measure certain financial assets and liabilities at fair value. New accounting guidance defines fair value, establishes a framework for measuring fair value and expands disclosures about fair value measurements. Fair value is defined as an “exit price” which represents the amount that would be received to sell an asset or paid to transfer a liability in an orderly transaction between market participants as of the measurement date. As such, fair value is a market-based measurement that should be determined based on assumptions that market participants would use in valuing an asset or liability. The new accounting guidance also requires the use of valuation techniques to measure fair value that maximize the use of observable inputs and minimize the use of unobservable inputs. As a basis for considering such assumptions and inputs, a fair value hierarchy has been established which identifies and prioritizes three levels of inputs to be used in measuring fair value.
The three levels of the fair value hierarchy are as follows:
Level 1 — Observable inputs such as quoted prices (unadjusted) in active markets for identical assets or liabilities.
Level 2 — Inputs other than the quoted prices in active markets that are observable either directly or indirectly, including: quoted prices for similar assets and liabilities in active markets; quoted prices for identical or similar assets and liabilities in markets that are not active or other inputs that are observable or can be corroborated by observable market data.
Level 3 — Unobservable inputs that are supported by little or no market data and require the reporting entity to develop its own assumptions.
40
|
|
|
|
|
|
|
|
|
| Fair Value Measurements at September 30, 2012 |
|
| |||||
|
| Quoted Prices in Active Markets for Identical Assets (Level 1) |
| Significant Other Observable Inputs (Level 2) |
| Significant Unobservable Inputs (Level 3) |
|
Fair Value at September 30, 2012 |
Assets |
|
|
|
|
|
|
|
|
Cash equivalents | $ | 45,888 | $ | — | $ | — | $ | 45,888 |
Total | $ | 45,888 | $ | — | $ | — | $ | 45,888 |
Liabilities |
|
|
|
|
|
|
|
|
Foreign currency forward contracts | $ | — | $ | — | $ | — | $ | — |
Total | $ | — | $ | — | $ | — | $ | — |
37
| Fair Value Measurements at Reporting Date Using | ||||||||||||||||
| Quoted Prices in | Significant Other | |||||||||||||||
| Active Markets for | Observable | Significant | Fair Value at | |||||||||||||
| Identical Assets | Inputs | Unobservable Inputs | September 30, | |||||||||||||
| (Level 1) | (Level 2) | (Level 3) | 2009 | |||||||||||||
| Assets | ||||||||||||||||
| Cash equivalents | $ | 59,324 | $ | — | $ | — | $ | 59,324 | ||||||||
| Total | $ | 59,324 | $ | — | $ | — | $ | 59,324 | ||||||||
| Liabilities | ||||||||||||||||
| Foreign currency forward contracts | $ | — | $ | 752 | $ | — | $ | 752 | ||||||||
| Total | $ | — | $ | 752 | $ | — | $ | 752 | ||||||||
The following table summarizes the fair value of our assets and liabilities that were accounted for at fair value on a recurring basis as of September 30, 2011 (in thousands):
|
|
|
|
|
|
|
|
|
| Fair Value Measurements at September 30, 2011 |
|
| |||||
|
| Quoted Prices in Active Markets for Identical Assets (Level 1) |
| Significant Other Observable Inputs (Level 2) |
| Significant Unobservable Inputs (Level 3) |
|
Fair Value at September 30, 2011 |
Assets |
|
|
|
|
|
|
|
|
Cash equivalents | $ | 65,792 | $ | — | $ | — | $ | 65,792 |
Total | $ | 65,792 | $ | — | $ | — | $ | 65,792 |
Liabilities |
|
|
|
|
|
|
|
|
Foreign currency forward contracts | $ | — | $ | — | $ | — | $ | — |
Total | $ | — | $ | — | $ | — | $ | — |
Cash equivalents, primarily funds held in commercial paper, bank notes and money market savings instruments, are reported at their current carrying value which approximates fair value due to the short-term nature of these instruments and are included in cash and cash equivalents in our Consolidated Balance Sheets. Our commercial paper, bank notes and money market instruments are valued primarily using quoted market prices and are included in Level 1 inputs. The fair value at September 30, 2009, for cash equivalents was approximately $59.3 million.
Foreign currency forward contracts are valued using an income approach which consists of a discounted cash flow model that takes into account the present value of future cash flows under the terms of the contracts using observable market spot and forward rates as of our reporting date, and are included in Level 2 inputs in the above table.tables. We use these derivative instruments to mitigate non-functional currency transaction exposure on certain contracts with customers and vendors. We mitigate derivative credit risk by transacting with highly rated counterparties. We have evaluated the credit and non-performance risks associated with our derivative counterparties and believe them to be insignificant at September 30, 2009.2012. All contracts are recorded at fair value andmarked-to-market at the end of each reporting period, with unrealized gains and losses being included in accumulated other comprehensive income on the Consolidated Balance Sheets for that period. The $0.8 million net fair value of ourAt September 30, 2012, all foreign currency forward contracts have been settled, with no balances recorded on our consolidated balance sheets related to these transactions.
D. Intangible Assets
Our intangible assets consist of (1) goodwill, which is not being amortized, and (2) customer relationships (15 years), trademarks (15 years), trade names (10 years), non-compete agreements (5 years), a supply agreement (15 years) and purchased technologies (6 to 7 years) which are amortized over their estimated useful lives. We test for impairment of goodwill annually, or immediately if conditions indicate that impairment could exist.
During the year ended September 30, 2010, we acquired intangible assets and recorded goodwill in connection with our acquisition of Powell Canada and our acquisition of a 50% interest in the operations of a joint venture in Kazakhstan. During fiscal year 2010, our impairment analyses for goodwill indicated that an impairment was required. A loss on impairment of $7.5 million was recorded in fiscal year 2010 related to the Powell Canada acquisition. Our strategic decision to exit the 50% owned joint venture in Kazakhstan and delays in the anticipated growth in capital investments in the Oil Sands Region of western Canada, relative to our expectations, resulted in the impairment charge. No impairment was identified as a result of performing our annual impairment test of goodwill for fiscal years 2012 or 2011.
During fiscal year 2011, our impairment analysis indicated that the non-compete agreements, trade name and customer relationships intangible assets related to the Powell Canada acquisition were impaired due to continued operating losses at Powell Canada, which have reduced our projections for future revenues and cash flows. Accordingly, we recognized a loss on impairment of $7.2 million.
38
Intangible assets balances, subject to amortization, at September 30, 2012, and September 30, 2011, consisted of the following (in thousands):
|
|
|
|
|
|
|
|
| September 30, 2012 |
| September 30, 2011 | ||||
| Gross Carrying Value | Accumulated Amortization | Net Carrying Value |
| Gross Carrying Value | Accumulated Amortization | Net Carrying Value |
Supply agreement | $ 17,580 | $ (7,225) | $ 10,355 |
| $ 17,580 | $ (6,052) | $ 11,528 |
Purchased technology | 11,818 | (9,121) | 2,697 |
| 11,747 | (7,759) | 3,988 |
Non-compete agreements | 4,170 | (4,170) | — |
| 4,170 | (4,170) | — |
Trade name | 1,136 | (871) | 265 |
| 1,098 | (767) | 331 |
|
|
|
|
|
|
|
|
Total | $ 34,704 | $ (21,387) | $ 13,317 |
| $ 34,595 | $ (18,748) | $ 15,847 |
All goodwill and intangible assets disclosed above are reported in our Electrical Power Products business segment.
Amortization of intangible assets recorded for the years ended September 30, 2012, 2011 and 2010, was $2.6 million, $4.8 million and $4.5 million, respectively.
Estimated amortization expense for each of the five subsequent fiscal years is expected to be (in thousands):
|
|
Years Ending September 30, | Total |
2013 | $ 1,673 |
2014 | 1,673 |
2015 | 1,649 |
2016 | 1,576 |
2017 | 1,576 |
E. Earnings Per Share
The following table sets forth the computation of basic and diluted earnings per share (in thousands, except per share data):
|
|
|
|
| Year Ended September 30, | ||
| 2012 | 2011 | 2010 |
Numerator: | |||
Net income (loss) attributable to Powell Industries, Inc. | $ 29,657 | $ (2,715) | $ 25,008 |
|
|
|
|
Denominator: | |||
Weighted average basic shares | 11,850 | 11,735 | 11,545 |
Dilutive effect of stock options, restricted stock and restricted stock units (1) | 75 | — | 148 |
Weighted average diluted shares with assumed conversions | 11,925 | 11,735 | 11,693 |
|
|
|
|
Net earnings (loss) per share: | |||
Basic | $ 2.50 | $ (0.23) | $ 2.17 |
Diluted | $ 2.49 | $ (0.23) | $ 2.14 |
(1) In fiscal year 2011, these items were excluded from diluted income (loss) per share as the effect would have been anti-dilutive.
Approximately 23,000 shares related to outstanding stock options and restricted stock units were excluded from the computation of diluted earnings (loss) per share because they were antidilutive at September 30, 2011. All options were included in the computation of diluted earnings per share for the years ended September 30, 2012 and 2010, respectively, as the options’ exercise prices were less than the average market price of our common stock.
F. Detail of Selected Balance Sheet Accounts
Allowance for Doubtful Accounts
Activity in our allowance for doubtful accounts receivable consisted of the following (in thousands):
|
|
|
| September 30, | |
| 2012 | 2011 |
Balance at beginning of year | $ 391 | $ 907 |
Increase (decrease) to bad debt expense | 842 | (114) |
Deductions for uncollectible accounts written off, net of recoveries | 142 | (394) |
Increase (decrease) due to foreign currency translation | 24 | (8) |
Balance at end of year | $ 1,399 | $ 391 |
39
Warranty Accrual
Activity in our product warranty accrual consisted of the following (in thousands):
|
|
|
| September 30, | |
| 2012 | 2011 |
Balance at beginning of year | $ 4,603 | $ 5,929 |
Increase to warranty expense | 3,624 | 788 |
Deductions for warranty charges | (2,323) | (2,432) |
Increase (decrease) due to foreign currency translation | (190) | 318 |
Balance at end of year | $ 5,714 | $ 4,603 |
In addition to our standard estimated warranty accrual, during fiscal year 2012, we recorded an additional $1.0 million of warranty expense related to the estimated costs to replace certain component parts which may be defective.
Inventories
The components of inventories are summarized below (in thousands):
|
|
| |
| September 30, | ||
| 2012 | 2011 | |
Raw materials, parts and subassemblies | $ 33,632 | $ 38,400 | |
Work-in-progress | 6,422 | 5,892 | |
Provision for excess and obsolete inventory | (7,137) | (7,652) | |
Total inventories | $ 32,917 | $ 36,640 | |
Cost and Estimated Earnings on Uncompleted Contracts
The components of costs and estimated earnings and related amounts billed on uncompleted contracts are summarized below (in thousands):
|
|
|
| September 30, | |
| 2012 | 2011 |
Costs incurred on uncompleted contracts | $ 635,714 | $ 475,525 |
Estimated earnings | 168,480 | 131,367 |
| 804,194 | 606,892 |
Less: Billings to date | 754,604 | 599,847 |
Net underbilled position | $ 49,590 | $ 7,045 |
|
|
|
Included in the accompanying balance sheets under the following captions: | ||
Costs and estimated earnings in excess of billings on uncompleted contracts – underbilled | $ 86,734 | $ 51,568 |
Billings in excess of costs and estimated earnings on uncompleted contracts – overbilled | (37,144) | (44,523) |
Net underbilled position | $ 49,590 | $ 7,045 |
40
Property, Plant and Equipment
Property, plant and equipment are summarized below (in thousands):
|
|
|
|
| September 30, | Range of | |
| 2012 | 2011 | Asset Lives |
Land | $ 24,766 | $ 7,640 | — |
Buildings and improvements | 55,431 | 54,321 | 3 - 39 Years |
Machinery and equipment | 67,007 | 62,456 | 3 - 15 Years |
Furniture and fixtures | 2,940 | 3,203 | 3 - 10 Years |
Construction in process | 7,224 | 2,625 | — |
| 157,368 | 130,245 |
|
Less: Accumulated depreciation | (78,716) | (70,608) |
|
Total property, plant and equipment, net | $ 78,652 | $ 59,637 |
|
The increases in land and construction in process are primarily the result of construction of facilities in Houston, Texas, and Acheson, Alberta, Canada.
Included in property and equipment are assets under capital lease of $1.8 million and $2.9 million at September 30, 2012 and 2011, with related accumulated depreciation of $1.0 million and $1.4 million, respectively. Depreciation expense, including the depreciation of capital leases, was $10.5 million, $10.6 million and $9.2 million for fiscal years 2012, 2011 and 2010, respectively.
G. Long-Term Debt
Long-term debt consisted of the following (in thousands):
|
|
|
| September 30, | |
| 2012 | 2011 |
Industrial development revenue bonds | $ 4,000 | $ 4,400 |
Capital lease obligations | 355 | 1,041 |
Subtotal long-term debt and capital lease obligations | 4,355 | 5,441 |
Less current portion | (725) | (1,140) |
Total long-term debt and capital lease obligations | $ 3,630 | $ 4,301 |
The annual maturities of long-term debt as of September 30, 2012, were as follows (in thousands):
|
|
Year Ending September 30, | Long-Term Debt Maturities |
2013 | $ 725 |
2014 | 428 |
2015 | 402 |
2016 | 400 |
2017 | 400 |
Thereafter | 2,000 |
Total long-term debt maturities | $ 4,355 |
US Revolver
In March 2012, we amended our existing credit agreement (Amended Credit Agreement) with a major domestic bank. This amendment to our credit facility was made to increase the dollar limit on capital expenditures to allow us to support our continued expansions, including the Canadian Oil Sands and offshore production markets. The Amended Credit Agreement provides for a $75.0 million revolving credit facility (US Revolver). Obligations are collateralized by the stock of certain of our subsidiaries.
The interest rate for amounts outstanding under the Amended Credit Agreement for the US Revolver is a floating rate based upon the higher of the Federal Funds Rate plus 0.5%, or the bank’s prime rate. Once the applicable rate is determined, a margin ranging up to 1.75%, as determined by our consolidated leverage ratio, is added to the applicable rate.
The US Revolver provides for the issuance of letters of credit which reduce the amounts which may be borrowed under the revolver. The amount available under the US Revolver was reduced by $36.5 million for our outstanding letters of credit at September 30, 2012.
41
There were no borrowings under the US Revolver as of September 30, 2012. Amounts available under the US Revolver were $38.5 million at September 30, 2012. The US Revolver expires on December 31, 2016.
The Amended Credit Agreement contains certain restrictive and maintenance-type covenants, including restrictions on our ability to pay dividends, as well as restriction on the amount of capital expenditures allowed. It also contains financial covenants defining various financial measures and the levels of these measures with which we must comply, as well as a “material adverse change” clause. A “material adverse change” is defined as a material change in our operations, business, properties, liabilities or condition (financial or otherwise) or a material impairment of our ability to perform our obligations under our credit agreements.
The Amended Credit Agreement’s principal financial covenants include:
Minimum Fixed Charge Coverage Ratio — The Amended Credit Agreement requires that the consolidated fixed charge coverage ratio be greater than 1.25 to 1.00. The consolidated fixed charge calculation is income before interest and income taxes, increased by depreciation and amortization expense (EBITDA) and reduced by income taxes and capital expenditures for the previous 12 months, divided by the sum of payments on long-term debt, excluding the US Revolver and interest expense, during the previous 12 months.
Maximum Leverage Ratio — The Amended Credit Agreement requires that the ratio be less than 2.75 to 1.00. The maximum leverage ratio is the sum of total long-term debt and outstanding letters of credit, less industrial development revenue bonds, divided by the EBITDA for the previous 12 months.
The Amended Credit Agreement is collateralized by a pledge of 100% of the voting capital stock of each of our domestic subsidiaries and 66% of the voting capital stock of each non-domestic subsidiary, excluding Powell Canada. The Amended Credit Agreement provides for customary events of default and carries cross-default provisions with other existing debt agreements. If an event of default (as defined in the Amended Credit Agreement) occurs and is continuing, on the terms and subject to the conditions set forth in the Amended Credit Agreement, amounts outstanding under the Amended Credit Agreement may be accelerated and may become immediately due and payable. As of September 30, 2012, we were in compliance with all of the financial covenants of the Amended Credit Agreement.
Canadian Revolver
On December 15, 2009, we entered into a credit agreement with a major international bank (the Canadian Facility) to finance the acquisition of Powell Canada and provide additional working capital support for our operations in Canada. In March 2012, we reduced the Canadian Facility from a $20.0 million CAD (approximately $20.3 million) revolving credit facility (the Canadian Revolver) to $10.0 million CAD (approximately $10.2 million), and eliminated the restrictions on amounts which may be borrowed based on a borrowing base calculation.
The Canadian Revolver provides for the issuance of letters of credit which reduce the amounts which may be borrowed under the Canadian Revolver. The amount available under the Canadian Revolver was reduced by $0.1 million for an outstanding letter of credit at September 30, 2012.
There were no borrowings outstanding under the Canadian Revolver, and $10.0 million was available at September 30, 2012. The Canadian Facility expires on February 28, 2015. The interest rate for amounts outstanding under the Canadian Revolver is a floating interest rate based upon either the Canadian Prime Rate, or the lender’s US Bank Rate. Once the applicable rate is determined, a margin of 0.375% to 1.125%, as determined by our consolidated leverage ratio, is added to the applicable rate.
The principal financial covenants are consistent with those described in our Amended Credit Agreement. The Canadian Facility contains a “material adverse effect” clause. A “material adverse effect” is defined as a material change in the operations of Powell or Powell Canada in relation to our financial condition, property, business operations, expected net cash flows, liabilities or capitalization.
The Canadian Facility is secured by the assets of our Canadian operations and provides for customary events of default and carries cross-default provisions with our existing debt agreements. If an event of default (as defined in the Canadian Facility) occurs and is continuing, on the terms and subject to the conditions set forth in the Canadian Facility, amounts outstanding under the Canadian Facility may be accelerated and may become immediately due and payable. As of September 30, 2012, we were in compliance with all of the financial covenants of the Canadian Facility.
Industrial Development Revenue Bonds
We borrowed $8.0 million in October 2001 through a loan agreement funded with proceeds from tax-exempt industrial development revenue bonds (Bonds). These Bonds were issued by the Illinois Development Finance Authority and were used for the completion of our Northlake, Illinois, facility. Pursuant to the Bond issuance, a reimbursement agreement between us and a major domestic bank required an issuance by the bank of an irrevocable direct-pay letter of credit (Bond LC), as collateral, to the Bonds’ trustee to guarantee payment of the Bonds’ principal and interest when due. The Bond LC is subject to both early termination and extension provisions customary to such agreements, as well as various
42
covenants, for which we were in compliance at September 30, 2012. While the Bonds mature in 2021, the reimbursement agreement requires annual redemptions of $400,000 that commenced on October 25, 2002. A sinking fund is used for the redemption of the Bonds. At September 30, 2012, the balance in the restricted sinking fund was approximately $434,000 and was recorded in cash and cash equivalents. The Bonds bear interest at a floating rate determined weekly by the Bonds’ remarketing agent, which was the underwriter for the Bonds and is an affiliate of the bank. This interest rate was 0.45% per year on September 30, 2012.
H. Income Taxes
The components of the income tax provision were as follows (in thousands):
|
|
|
|
| Year Ended September 30, | ||
| 2012 | 2011 | 2010 |
Current: | |||
Federal | $ 18,156 | $ 5,470 | $ 18,126 |
State | 1,512 | 939 | 1,750 |
Foreign | 331 | 563 | 1,071 |
| 19,999 | 6,972 | 20,947 |
|
|
|
|
Deferred: |
|
|
|
Federal | (1,840) | (122) | (1,189) |
State | 25 | (76) | 23 |
Foreign | 393 | (62) | 113 |
| (1,422) | (260) | (1,053) |
Total income tax provision | $ 18,577 | $ 6,712 | $ 19,894 |
Income before income taxes and minority interest was as follows (in thousands):
|
|
|
| |
| Year Ended September 30, | |||
| 2012 | 2011 | 2010 | |
U.S. | $ 53,885 | $ 19,850 | $ 53,467 | |
Other than U.S. | (5,651) | (15,853) | (8,406) | |
Income from continuing operations before provision for income taxes | $ 48,234 | $ 3,997 | $ 45,061 | |
A reconciliation of the statutory U.S. income tax rate and the effective income tax rate, as computed on earnings before income tax provision in each of the three years presented in the Consolidated Statements of Operations, was as follows:
|
|
|
|
| Year Ended September 30, | ||
| 2012 | 2011 | 2010 |
Statutory rate | 35% | 35% | 35% |
State income taxes, net of federal benefit | 2 | 14 | 3 |
International withholding tax | (1) | (9) | — |
Other permanent tax items | — | 5 | — |
Foreign rate differential | 1 | 33 | 1 |
Domestic production activities deduction | (3) | (16) | (2) |
Foreign valuation allowance and other | 4 | 106 | 7 |
Effective rate | 38% | 168% | 44% |
Our provision for income taxes reflects an effective tax rate on earnings before income taxes of 38% in fiscal year 2012 compared to 168% and 44% in fiscal years 2011 and 2010, respectively. The increase in the effective tax rate for fiscal year 2011 resulted from a valuation allowance against deferred tax assets in Canada.
We have not recorded deferred income taxes on $16 million of undistributed earnings of our foreign subsidiaries because of management’s intent to indefinitely reinvest such earnings. Upon distribution of these earnings in the form of dividends or otherwise, we may be subject to U.S. income taxes and foreign withholding taxes. It is not practical, however, to estimate the amount of taxes that may be payable on the eventual remittance of these earnings.
We are subject to income tax in the U.S., multiple state jurisdictions and a few international jurisdictions, primarily the U.K. and in Canada since December 15, 2009. For U.S. Federal income tax purposes, all years prior to 2009 are closed. We do not consider any state in which we do business to be a major tax jurisdiction. We remain open to examination in the U.K. for tax years 2008 to the present.
43
The net deferred income tax asset (liability) was comprised of the following (in thousands):
|
|
|
| September 30, | |
| 2012 | 2011 |
Current deferred income taxes: | ||
Gross assets | $ 7,053 | $ 6,801 |
Gross liabilities | (2,455) | (3,221) |
Net current deferred income tax asset | 4,598 | 3,580 |
Noncurrent deferred income taxes: | ||
Gross assets | 2,422 | 2,133 |
Gross liabilities | — | (114) |
Net noncurrent deferred income tax asset | 2,422 | 2,019 |
Net deferred income tax asset | $ 7,020 | $ 5,599 |
At September 30, 2012 and 2011, the noncurrent deferred income tax asset was included in other accrued expenses in ourassets on the Consolidated Balance Sheets.
The tax effect of temporary differences between U.S. GAAP accounting and federal income tax accounting creating deferred income tax assets and liabilities were as follows (in thousands):
|
|
|
| September 30, | |
| 2012 | 2011 |
Deferred Tax Assets: |
|
|
Allowance for doubtful accounts | $ 367 | $ 89 |
Workers compensation | 360 | 39 |
Stock-based compensation | 729 | 354 |
Reserve for accrued employee benefits | 1,546 | 1,579 |
Warranty accrual | 1,336 | 935 |
Depreciation and amortization | 1,366 | 956 |
Deferred compensation | 1,013 | 1,343 |
Postretirement benefits liability | 373 | 460 |
Accrued legal | 114 | 182 |
Uniform capitalization and inventory | 3,683 | 4,667 |
Goodwill impairment | 1,285 | 1,360 |
Other | 14 | 41 |
Net operating loss | 4,787 | 3,144 |
Gross deferred tax asset | 16,973 | 15,149 |
Less: valuation allowance | 7,498 | 6,215 |
Deferred tax assets | 9,475 | 8,934 |
|
|
|
Deferred Tax Liabilities: |
|
|
Uncompleted contracts | (2,455) | (3,221) |
Other | — | (5) |
Capital lease | — | (109) |
Deferred tax liabilities | (2,455) | (3,335) |
|
|
|
Net deferred tax asset | $ 7,020 | $ 5,599 |
At September 30, 2012, we had $19.1 million of gross foreign operating loss carryforwards, which are subject to a 20-year carryforward period. As of September 30, 2012, we have recorded a net valuation allowance of $7.5 million against our Canadian deferred tax assets, which we expect cannot be realized through future reversals of existing taxable temporary differences and future taxable income. We believe that our deferred tax assets in other tax jurisdictions are more likely than not realizable through future reversals of existing taxable temporary differences and our estimate of future taxable income.
We previously adopted accounting guidance on the accounting for uncertainty in income taxes. Upon adoption of the guidance, we recorded a $0.3 million increase in our tax reserves, an offsetting decrease of $0.2 million to retained earnings for uncertain tax positions and an increase in deferred income tax assets of $0.1 million. As of the adoption date, we had total tax reserves of $1.2 million. This reserve includes an estimate of potential interest and penalties on estimated liabilities for uncertain tax positions, which were recorded as components of income tax expense, in the amount of $160,000 as of September 30, 2012. A reconciliation of the beginning and ending amount of the unrecognized tax liabilities follows (in thousands):
Balance as of September 30, 2011 | $ 763 |
Increases related to tax positions taken during a prior period | 43 |
Decreases related to settlements with taxing authorities | (32) |
Decreases related to expirations of statute of limitations | (263) |
Balance as of September 30, 2012 | $ 511 |
44
Our continuing policy is to recognize interest and penalties related to income tax matters as tax expense. The amount of interest and penalty expense recorded for the year ended September 30, 2012, was not material.
There was no material change in the net amount of unrecognized tax benefits in the year ended September 30, 2012. Management believes that it is reasonably possible that within the next 12 months, the total unrecognized tax benefits will decrease by approximately 39% due to the expiration of certain statutes of limitations in various state and local jurisdictions.
Management believes that an adequate provision has been made for any adjustments that may result from tax examinations. However, the outcome of tax audits cannot be predicted with certainty. If any issues addressed in our tax audits are resolved in a manner not consistent with management’s expectations, we could be required to adjust our provision for income tax in the period such resolution occurs. Although timing of the resolution and/or closure of audits is highly uncertain, we do not believe it is reasonably possible that our unrecognized tax benefits would materially change in the next 12 months.
I. Derivative Instruments and Hedging Strategies
We operate in various countries and have operations in the United Kingdom and Canada. These international operations expose us to market risk associated with foreign currency exchange rate fluctuations. We have entered into certain forward contracts to hedge the risk of certain foreign currency rate fluctuations. To the extent we choose to manage volatility associated with the net exposures, we enter into various financial transactions which we account for using the applicable accounting guidance for derivative instruments and hedging activities. Our objective is to hedge the variability in forecasted cash flow due to the foreign currency risk associated with certain long-term sales. As of September 30, 2012, we held no derivatives.
In order for a derivative to qualify for hedge accounting, the derivative must be formally designated as a hedge by documenting the relationship between the derivative and the hedged item. The documentation includes a description of the hedging instrument, the hedge item, the risk being hedged, our risk management objective and strategy for undertaking the hedge, the method for assessing the effectiveness of the hedge and the method for measuring hedge ineffectiveness. Additionally, the hedge relationship must be expected to be highly effective at offsetting changes in either the fair value or cash flows of the hedged item at both inception of the hedge and on an ongoing basis. We assess the ongoing effectiveness of our hedges in accordance with the Cumulative Dollar-Offset Approach, and measure and record hedge ineffectiveness at the end of each fiscal quarter, as necessary.
All derivatives are recognized on the Consolidated Balance Sheets at their fair value and classified based on the instrument’s maturity date. There were no outstanding derivatives as of September 30, 2011, and September 30, 2012.
J. Employee Benefit Plans
401(k) Plan
We have a defined employee contribution 401(k) plan for substantially all of our U.S. employees. We match 100% of employee contributions up to an employee contribution of 4% of each employee’s salary. We recognized expenses of $4.6 million, $3.4 million and $2.9 million in fiscal years 2012, 2011 and 2010, respectively, under this plan primarily related to matching contributions.
Deferred Compensation
We offer an unfunded, non-qualified deferred compensation plan to a select group of management and highly compensated individuals. The plan permits the deferral of up to 50% of a participant’s base salary and/or 100% of a participant’s annual incentive bonus. The deferrals are held in a separate trust, which has been established to administer the plan. The assets of the trust are subject to the claims of our creditors in the event that we become insolvent. Consequently, the trust qualifies as a grantor trust for income tax purposes (a Rabbi Trust). The assets and liabilities of the plan are recorded in other assets and deferred compensation in the accompanying Consolidated Balance Sheets, respectively. Changes in the deferred compensation balance are charged to compensation expense. The plan is not qualified under Section 401 of the Internal Revenue code. There was no compensation expense related to this plan in fiscal year 2012. Total assets held by the trustee and deferred compensation liabilities were $2.1 million at September 30, 2012.
45
Certain executives were provided an executive benefit plan which provides for fixed payments upon normal retirement on or after age 65 and the completion of at least 10 years of continuous employment. The estimated present value of these payments were accrued over the service life of these individuals, and $0.8 million is recorded in deferred compensation in the accompanying Consolidated Balance Sheets related to this executive benefit plan. To assist in funding the deferred compensation liability, we have invested in corporate-owned life insurance policies. The cash surrender value of these policies is presented in other assets in the accompanying Consolidated Balance Sheets. The cash surrender value of life insurance policies was $4.1 million at September 30, 2012.
Retiree Medical Plan
We have a plan to extend to retirees health benefits which are available to active employees under our existing health plans. This plan is unfunded. The plan provides coverage for employees with at least 10 years of service and who are age 55 or older but less than 65. The retiree is required to pay the COBRA rate less a subsidy provided by us based on years of service at the time of retirement.
For the year ended September 30, 2012, the measurement of postretirement benefit expense was based on assumptions used to value the postretirement benefit liability as of September 30, 2012, our measurement date.
Amounts recognized in accumulated other comprehensive income as of September 30, 2012 and 2011, consisted of the following on a pretax basis (in thousands):
908 |
|
|
| September 30, | |
| 2012 | 2011 |
Net actuarial gain | $ (909) | $ (827) |
Prior service cost | — | 51 |
Total recognized in accumulated other comprehensive income | $ (909) | $ (776) |
Amounts in accumulated other comprehensive income as of September 30, 2012, expected to be recognized as components of net periodic postretirement benefit cost in 2013 were as follows (in thousands):
Net actuarial gain | $ (67) |
Prior service cost | — |
Total | $ (67) |
46
The following table illustrates the changes in accumulated postretirement benefit obligation, changes in fair value of assets and the funded status of the postretirement benefit plan (in thousands):
|
|
|
|
|
| ||
| September 30, | ||||||
|
| 2012 |
|
| 2011 | ||
Changes in postretirement benefit obligation: |
|
|
| ||||
Balance at beginning of year | $ | 895 |
| $ | 663 | ||
Service cost |
| 23 |
|
| 40 | ||
Interest cost |
| 17 |
|
| 39 | ||
Actuarial loss (gain) |
| (189) |
|
| 248 | ||
Benefits paid |
| (57) |
|
| (95) | ||
Balance at end of year | $ | 689 |
| $ | 895 | ||
Change in plan assets: |
|
|
| ||||
Fair value of assets at beginning of year | $ | — |
| $ | — | ||
Employer contributions |
| 57 |
|
| 95 | ||
Benefits paid |
| (57) |
|
| (95) | ||
Fair value of assets at end of year | $ | — |
| $ | — | ||
Reconciliation of funded status: |
|
|
| ||||
Unfunded liability | $ | (689) |
| $ | (895) | ||
Unrecognized prior service cost |
| — |
|
| 51 | ||
Unrecognized net actuarial gain |
| (909) |
|
| (827) | ||
Net liability recognized | $ | (1,598) |
| $ | (1,671) | ||
|
|
|
| 2012 | 2011 |
Weighted-average assumptions used to determine benefit obligations at September 30: | ||
Discount rate pre-retirement | 0.00% | 0.00% |
Discount rate post-retirement | 3.08 | 4.24 |
Current year trend rate | 8.40 | 10.00 |
Ultimate trend rate | 5.00 | 5.00 |
Year ultimate trend rate reached | 2023 | 2014 |
If the medical care cost trend rate assumptions were increased or decreased by 1% as of September 30, 2012, the effect of this change on the accumulated postretirement benefit obligation and service and interest costs would be an increase of $102,000 and $5,000 or a decrease of $53,000 and $3,000, respectively.
|
|
|
|
| Year Ended September 30, | ||
| 2012 | 2011 | 2010 |
Components of net periodic postretirement benefit cost: | |||
Service cost | $ 23 | $ 40 | $ 33 |
Interest cost | 17 | 39 | 39 |
Prior service cost | 51 | 115 | 115 |
Net gain recognized | (107) | (37) | (49) |
Net periodic postretirement benefit cost | $ (16) | $ 157 | $ 138 |
|
|
|
| 2012 | 2011 |
Weighted-average assumptions used to determine benefit costs at September 30: | ||
Discount rate pre-retirement | 0.00% | 0.00% |
Discount rate post-retirement | 4.24 | 4.56 |
Current year trend rate | 9.00 | 10.00 |
Ultimate trend rate | 5.00 | 5.00 |
Year ultimate trend rate reached | 2015 | 2013 |
47
Future expected benefit payments as of September 30, 2012, related to postretirement benefits for the subsequent five years were as follows (in thousands):
|
|
Year Ending September 30, | Expected Benefit Payments |
2013 | $ 61 |
2014 | 44 |
2015 | 47 |
2016 | 46 |
2017 | 54 |
2018 through 2022 | 283 |
K. Commitments and Contingencies
Long-Term Debt
See Note LG herein for further discussion regardingof our derivative instruments.long-term debt.
Leases
We lease certain offices, facilities and equipment under operating leases expiring at various dates through 2023. At September 30, 2012, the minimum annual rental commitments under leases having terms in excess of one year were as follows (in thousands):
|
|
Years Ending September 30, | Operating Leases |
2013 | $ 5,597 |
2014 | 4,575 |
2015 | 3,533 |
2016 | 2,910 |
2017 | 2,274 |
Thereafter | 7,725 |
Total lease commitments | $ 26,614 |
Lease expense for all operating leases was $5.4 million, $3.7 million and $3.3 million for fiscal years 2012, 2011 and 2010, respectively.
Letters of Credit and Bonds
Certain customers require us to post bank letter of credit guarantees or performance bonds issued by a surety. These guarantees and performance bonds assure that we will perform under the terms of our contract. In the event of default, the counterparty may demand payment from the bank under a letter of credit or performance by the surety under a performance bond. To date, there have been no significant expenses related to either for the periods reported. We were contingently liable for secured and unsecured letters of credit of $36.6 million as of September 30, 2012. We also had performance and maintenance bonds totaling $249.1 million that were outstanding, with additional bonding capacity of $150.9 million available, at September 30, 2012.
We have a facility agreement (Facility Agreement) between S&I and a large international bank. The $12.1 million facility agreement provides S&I the ability to enter into forward exchange contracts, currency options and performance bonds. At September 30, 2012, we had outstanding a total of $7.0 million of guarantees under this Facility Agreement.
The Facility Agreement provides for financial covenants, customary events of default and carries cross-default provisions with our Amended Credit Facility. If an event of default (as defined in the Facility Agreement) occurs and is continuing, on the terms and subject to the conditions set forth in the Facility Agreement, obligations outstanding under the Facility Agreement may be accelerated and may become or be declared immediately due and payable.
Litigation
We are involved in various legal proceedings, claims and other disputes arising in the ordinary course of business which, in general, are subject to uncertainties and the outcomes are not predictable. Although we can give no assurance about the outcome of pending or threatened litigation and the effect such outcomes may have on us, management believes that any ultimate liability resulting from the outcome of such proceedings, to
48
the extent not otherwise provided or covered by insurance, will not have a material adverse effect on our consolidated financial position or results of operations or liquidity.
L. Stock-Based Compensation
We have the following stock-based compensation plans:
Restricted Stock
We have a Restricted Stock Plan for the benefit of members of the Board of Directors of the Company (the Board) who, at the time of their service, are not employees of the Company or any of its affiliates. Subject to certain conditions and restrictions as determined by the Compensation Committee of the Board of Directors and proportionate adjustments in the event of stock dividends, stock splits and similar corporate transactions, each eligible director will receive 2,000 shares of restricted stock annually. In Fiscal 2009,fiscal 2012, 16,000 shares of restricted stock were issued to such directors at a price of $38.87$37.50 per share. In fiscal 2011, 17,500 shares of restricted stock were issued to such directors at a price of $33.49 per share. The maximum aggregate number of shares of stock that may be issued under the Restricted Stock Plan is 150,000 and will consist of authorized but unissued or reacquired shares of stock, or any combination thereof. The restricted stock grants vest 50% per year over a two-year period on each anniversary of the grant date. Unless terminated by the Board, the Restricted Stock Plan will terminate at the close of business on December 16, 2014, and no further grants shall be made under the plan after such date. Awards granted before such date shall continue to be subject to the terms and conditions of the plan and the respective agreements pursuant to which they were granted. The total number of shares of common stock available for future awards under the plan was 84,00032,879 shares as of September 30, 2009.
41
The 2006 Equity Compensation Plan (the “2006 Plan”), which became retroactively effective to September 29, 2006. Under the 2006 Plan,Plan) grants any employee of the Company and its subsidiaries and consultants, are eligiblethe right to participate in the plan and receive awards. Awards can take the form of options, stock appreciation rights, stock awards and performance unit awards. A totalThe maximum aggregate number of 750,000 shares of our common stock are available for issuancethat may be issued under the 2006 Plan is 750,000 shares. The total number of shares of common stock available under the plan was 508,403 shares as of September 30, 2012.
In August 2012, 45,000 shares of restricted stock were issued under the 2006 Plan to our new President and Chief Executive Officer. These shares were issued at a price of $39.11 per share. The restricted stock grant vests 33% per year over a three-year period on each anniversary of the grant date.
In June 2012, 2,000 shares of restricted stock were issued under the 2006 Plan to the Chairman of the Board, who was an employee of the Company at the time the shares were issued. These shares were issued at a price of $37.50 per share. The restricted stock grant vests 50% per year over a two-year period on each anniversary of the grant date.
During the first quarter of fiscal 2011, 26,000 shares of restricted stock were issued to certain officers and key employees of the Company with a fair value ranging from $30.79 to $32.12 per share under the 2006 Plan. The restricted stock grant vests over a three-year period on each anniversary of the grant date. Compensation expense is recognized over a three-year period based on the price per share on the grant date. In conjunction with the separation of our former President and Chief Executive Officer (CEO) in September 2011, the remaining unvested 7,601 shares previously issued to him became immediately vested and were expensed in selling, general and administrative expenses.
During the first quarter of fiscal 2010, 10,000 shares of restricted stock were issued to our former CEO at a price of $37.67 per share under the 2006 Plan. The restricted stock grant vests 20% per year over a five-year period on each anniversary of the grant date. Compensation expense is recognized over the five-year vesting period based on the $37.67 price per share on the grant date. In conjunction with the separation of our former CEO in September 2011, the remaining unvested 8,000 shares previously issued to him became immediately vested and were expensed in selling, general and administrative expenses.
During the year ended September 30, 2012, we recorded compensation expense of $0.7 million related to restricted stock grants. We recorded compensation expense of $0.8 million and $0.8 million related to restricted stock grants for the years ended September 30, 2011 and 2010, respectively.
Restricted Stock Units
49
In October 2006, October 20072009 and October 2008,2010, we granted approximately 107,000, 34,30034,700 and 32,90034,566 restricted stock units (“RSU”s)(RSUs), respectively, with a fair value of $31.86, $37.89$38.36 and $40.81$30.79 per share,unit, respectively, to certain officers and key employees.employees of the Company. An additional 4,482 RSUs were granted in October 2010, with a fair value of $32.12. The RSUs vest over a three-year period from their date of issuance. The fair value of the RSUs was based on the closing price of our common stock as reported on the NASDAQ Global Market (“NASDAQ”)(NASDAQ) on the grant dates. TheSixty-percent of the actual amount of the RSUs earned will be based on the cumulative earnings per share as reported relative to established goals for the three-year performance cyclescycle which began October 1 of the year granted, and ranges from 0% to 150% of the target RSUs granted. The remaining forty-percent of the RSUs are time-based and vest over a three-year period. At September 30, 2009,2012, there were approximately 94,60099,725 RSUs outstanding with a vesting period of three years.outstanding. The RSUs do not have voting rights of common stock, and the shares of common stock underlying the RSUs are not considered issued and outstanding until actually issued.
During the first quarter of fiscal 2012, we granted 32,894 performance-based RSUs with a fair value of $31.18 per unit to certain officers and key employees of the Company. The RSUs vest over a three-year period from their date of issuance, and are earned over a three-year performance cycle.
During the first quarter of fiscal 2012, we also granted 21,931 time-based RSUs with a fair value of $31.18 per unit to certain officers and key employees of the Company. The RSUs vest over a three-year period from their date of issuance, and are time-based.
RSU activity (number of shares) for us was as follows:
|
|
|
|
Number of Restricted Stock Units | Weighted Average Grant Date Fair Value Per Share |
|
|
|
Outstanding at September 30, 2009 | 94,589 | $ 36.04 |
Granted | 34,688 | 38.36 |
Expired or cancelled | — | — |
Vested/exercised | (41,823) | 31.86 |
Outstanding at September 30, 2010 | 87,454 | 38.96 |
Granted | 39,048 | 30.94 |
Expired or cancelled | — | — |
Vested/exercised | (57,124) | 36.94 |
Outstanding at September 30, 2011 | 69,378 | 36.10 |
Granted | 54,825 | 31.18 |
Expired or cancelled | (24,478) | 38.71 |
Vested/exercised | — | — |
Outstanding at September 30, 2012 | 99,725 | $ 32.69 |
We recorded compensation expense of approximately $1.7$1.5 million and $2.3$1.3 million related to RSUs for the years ended September 30, 20092012 and 2008,2010, respectively. For the year ended September 30, 2007, no2011, we recorded a credit to compensation expense was recognizedof $1.4 million related to the RSUs, as the required performance targetsestimated earnings per share goals were not met.
Stock Options
The 1992 Stock Option Plan, as amended (the “1992 Plan”)1992 Plan), permits us to grant to key employees non-qualified options and stock grants, subject to certain conditions and restrictions as determined by the Compensation Committee of the Board of Directors and proportionate adjustments in the event of stock dividends, stock splits and similar corporate transactions. At the April 15, 2005 Annual Meeting, stockholders approved an amendment toThe maximum number of shares that may be issued under the 1992 Plan to increase the number of shares available for issuance under the plan from 2.1 million shares tois 2.7 million shares. Stock options are granted at an exercise price equal to the fair market value of the common stock on the date of the grant. Generally, options granted have an expiration date of seven years from the grant date and vest in increments of 20% per year over a five-year period. Pursuant to the 1992 Plan, option holders who exercise their options and hold the underlying shares of common stock for five years, vest in a stock grant equal to 20% of the original option shares. While restricted until the expiration of five years, the stock grant is considered issued at the date of the stock option exercise and is included in earnings per share. During fiscal years 2012 and 2010, 3,740 shares and 12,380 shares, respectively, of restricted stock were issued to option holders who met specified requirements under the 1992 Plan. There were 0.5 millionno restricted stock grants under the 1992 Plan during fiscal year 2011. There have been no stock options granted since July 2005, and all outstanding options under the 1992 Plan were exercised or forfeited as of September 30, 2012. There were 466,392 shares available to be granted under this plan as of September 30, 2009. There were no restricted stock grants under the 1992 Plan during fiscal years 2009, 2008 and 2007.
42
M. Business Segments
50
| Remaining | ||||||||||||||||
| Weighted | Weighted | |||||||||||||||
| Average | Average | Aggregate | ||||||||||||||
| Stock | Exercise | Contractual | Intrinsic | |||||||||||||
| Options | Price | Term (Years) | Value | |||||||||||||
| (In thousands) | ||||||||||||||||
| Outstanding at September 30, 2006 | 732,770 | 17.37 | ||||||||||||||
| Granted | — | — | ||||||||||||||
| Exercised | (193,520 | ) | 17.13 | |||||||||||||
| Forfeited | (33,800 | ) | 17.63 | |||||||||||||
| Outstanding at September 30, 2007 | 505,450 | 17.44 | ||||||||||||||
| Granted | — | — | ||||||||||||||
| Exercised | (235,350 | ) | 17.79 | |||||||||||||
| Forfeited | (2,800 | ) | 17.85 | |||||||||||||
| Outstanding at September 30, 2008 | 267,300 | 17.14 | ||||||||||||||
| Granted | — | — | ||||||||||||||
| Exercised | (29,950 | ) | 17.15 | |||||||||||||
| Forfeited | — | — | ||||||||||||||
| Outstanding at September 30, 2009 | 237,350 | 17.14 | 2.21 | $ | 4,068 | |||||||||||
| Exercisable at September 30, 2009 | 198,350 | 16.88 | 2.05 | $ | 3,348 | |||||||||||
| Outstanding | Exercisable | |||||||||||||||||||
| Weighted | Weighted | Weighted | ||||||||||||||||||
| Number | Average | Average | Number | Average | ||||||||||||||||
| Range of | Outstanding at | Remaining | Exercise | Exercisable at | Exercise | |||||||||||||||
| Exercise Prices | 09/30/09 | Contractual Life | Price | 09/30/09 | Price | |||||||||||||||
| $13.06 - 15.10 | 91,400 | 1.0 | $ | 15.10 | 91,400 | $ | 15.10 | |||||||||||||
| 16.30 - 18.44 | 145,950 | 3.0 | 18.41 | 106,950 | 18.40 | |||||||||||||||
| Total Options | 237,350 | 2.2 | 17.14 | 198,350 | 16.88 | |||||||||||||||
43
| Year Ended September 30, | ||||||||||||
| 2009 | 2008 | 2007 | ||||||||||
Numerator: | ||||||||||||
| Net income | $ | 39,717 | $ | 25,847 | $ | 9,913 | ||||||
Denominator: | ||||||||||||
| Denominator for basic earnings per share-weighted average shares | 11,424 | 11,265 | 11,045 | |||||||||
| Dilutive effect of stock options, restricted stock and restricted stock units | 167 | 187 | 188 | |||||||||
| Denominator for diluted earnings per share-adjusted weighted average shares with assumed conversions | 11,591 | 11,452 | 11,233 | |||||||||
Net earnings per share: | ||||||||||||
| Basic | $ | 3.48 | $ | 2.29 | $ | 0.90 | ||||||
| Diluted | $ | 3.43 | $ | 2.26 | $ | 0.88 | ||||||
| September 30, | ||||||||
| 2009 | 2008 | |||||||
| Balance at beginning of period | $ | 1,180 | $ | 1,739 | ||||
| Accrued bad debt expense | 959 | 637 | ||||||
| Deductions for uncollectible accounts written off, net of recoveries | (631 | ) | (1,163 | ) | ||||
| (Decrease) increase due to foreign currency translation | 99 | (33 | ) | |||||
| Balance at end of period | $ | 1,607 | $ | 1,180 | ||||
| September 30, | ||||||||
| 2009 | 2008 | |||||||
| Balance at beginning of period | $ | 6,793 | $ | 5,787 | ||||
| Accrued warranty expense | 5,124 | 3,946 | ||||||
| Deductions for warranty charges | (4,008 | ) | (2,746 | ) | ||||
| Decrease due to foreign currency translation | (351 | ) | (194 | ) | ||||
| Balance at end of period | $ | 7,558 | $ | 6,793 | ||||
44
| September 30, | ||||||||
| 2009 | 2008 | |||||||
| Raw materials, parts and subassemblies | $ | 37,655 | $ | 57,742 | ||||
| Work-in-progress | 8,597 | 14,937 | ||||||
| Total inventories | $ | 46,252 | $ | 72,679 | ||||
| September 30, | ||||||||
| 2009 | 2008 | |||||||
| Costs incurred on uncompleted contracts | $ | 552,805 | $ | 513,549 | ||||
| Estimated earnings | 136,603 | 120,571 | ||||||
| 689,408 | 634,120 | |||||||
| Less: Billings to date | 687,845 | 590,882 | ||||||
| Net underbilled position | $ | 1,563 | $ | 43,238 | ||||
| Included in the accompanying balance sheets under the following captions: | ||||||||
| Costs and estimated earnings in excess of billings on uncompleted contracts | $ | 46,335 | $ | 82,574 | ||||
| Billings in excess of costs and estimated earnings on uncompleted contracts | (44,772 | ) | (39,336 | ) | ||||
| Net underbilled position | $ | 1,563 | $ | 43,238 | ||||
| September 30, | Range of | |||||||||||
| 2009 | 2008 | Asset Lives | ||||||||||
| Land | $ | 7,268 | $ | 7,628 | — | |||||||
| Buildings and improvements | 51,056 | 49,500 | 3 - 39 Years | |||||||||
| Machinery and equipment | 51,977 | 51,037 | 3 - 15 Years | |||||||||
| Furniture and fixtures | 3,050 | 2,992 | 3 - 10 Years | |||||||||
| Construction in process | 3,771 | 508 | — | |||||||||
| 117,122 | 111,665 | |||||||||||
| Less: Accumulated depreciation | (56,086 | ) | (50,119 | ) | ||||||||
| Total property, plant and equipment, net | $ | 61,036 | $ | 61,546 | ||||||||
45
46
| Net actuarial gain | $ | (1,067 | ) | |
| Prior service cost | 282 | |||
| Total recognized in accumulated other comprehensive income | $ | (785 | ) | |
| Net actuarial gain | $ | (85 | ) | |
| Prior service cost | 116 | |||
| Total | $ | 31 | ||
| September 30, | ||||||||
| 2009 | 2008 | |||||||
| Changes in postretirement benefit obligation: | ||||||||
| Balance at beginning of year | $ | 807 | $ | 942 | ||||
| Service cost | 60 | 52 | ||||||
| Interest cost | 59 | 49 | ||||||
| Actuarial loss (gain) | (147 | ) | (234 | ) | ||||
| Benefits paid | (38 | ) | (2 | ) | ||||
| Balance at end of year | $ | 741 | $ | 807 | ||||
| Change in plan assets: | ||||||||
| Fair value of assets at beginning of year | $ | — | $ | — | ||||
| Employer contributions | 38 | 2 | ||||||
| Benefits paid | (38 | ) | (2 | ) | ||||
| Fair value of assets at end of year | $ | — | $ | — | ||||
| Reconciliation of funded status: | ||||||||
| Unfunded liability | $ | (741 | ) | $ | (807 | ) | ||
| Unrecognized prior service cost | 282 | 398 | ||||||
| Unrecognized net actuarial gain | (1,067 | ) | (996 | ) | ||||
| Net liability recognized | $ | (1,526 | ) | $ | (1,405 | ) | ||
47
| 2009 | 2008 | |||||||
| Weighted-average assumptions used to determine benefit obligations at September 30: | ||||||||
| Discount rate pre-retirement | 0.00 | % | 0.00 | % | ||||
| Discount rate post-retirement | 5.45 | 7.45 | ||||||
| Current year trend rate | 9.00 | 9.00 | ||||||
| Ultimate trend rate | 5.00 | 5.00 | ||||||
| Year ultimate trend rate reached | 2012 | 2011 | ||||||
| Year Ended September 30, | ||||||||||||
| 2009 | 2008 | 2007 | ||||||||||
| Components of net periodic postretirement benefit cost: | ||||||||||||
| Service cost | $ | 60 | $ | 52 | $ | 53 | ||||||
| Interest cost | 59 | 49 | 50 | |||||||||
| Prior service cost | 115 | 115 | 106 | |||||||||
| Net gain recognized | (75 | ) | (79 | ) | (71 | ) | ||||||
| Net periodic postretirement benefit cost | $ | 159 | $ | 137 | $ | 138 | ||||||
| 2009 | 2008 | |||||||
| Weighted-average assumptions used to determine benefit costs at September 30: | ||||||||
| Discount rate pre-retirement | 0.00 | % | 0.00 | % | ||||
| Discount rate post-retirement | 7.45 | 6.24 | ||||||
| Current year trend rate | 9.00 | 9.00 | ||||||
| Ultimate trend rate | 5.00 | 5.00 | ||||||
| Year ultimate trend rate reached | 2011 | 2010 | ||||||
| Expected | ||||
| Benefit | ||||
Year Ending September 30, | Payments | |||
| 2010 | $ | 33 | ||
| 2011 | 46 | |||
| 2012 | 49 | |||
| 2013 | 58 | |||
| 2014 | 59 | |||
| 2015 through 2019 | 434 | |||
48
| September 30, | ||||||||
| 2009 | 2008 | |||||||
| US Revolver | $ | — | $ | 19,000 | ||||
| UK Revolver | — | 2,726 | ||||||
| UK Term Loan | — | 4,907 | ||||||
| Deferred acquisition payable | 4,292 | 9,512 | ||||||
| Industrial development revenue bonds | 5,200 | 5,600 | ||||||
| Capital lease obligations | — | 13 | ||||||
| Subtotal long-term debt and capital lease obligations | 9,492 | 41,758 | ||||||
| Less current portion | (4,692 | ) | (7,814 | ) | ||||
| Total long-term debt and capital lease obligations | $ | 4,800 | $ | 33,944 | ||||
| Long-Term | ||||
| Debt | ||||
Year Ending September 30, | Maturities | |||
| 2010 | $ | 4,692 | ||
| 2011 | 400 | |||
| 2012 | 400 | |||
| 2013 | 400 | |||
| 2014 | 400 | |||
| Thereafter | 3,200 | |||
| Total long-term debt maturities | $ | 9,492 | ||
49
50
| September 30, | ||||||||
| 2009 | 2008 | |||||||
| Current deferred income taxes: | ||||||||
| Gross assets | $ | 9,457 | $ | 8,505 | ||||
| Gross liabilities | (6,154 | ) | (6,987 | ) | ||||
| Net current deferred income tax asset | 3,303 | 1,518 | ||||||
| Noncurrent deferred income taxes: | ||||||||
| Gross assets | 3,894 | 3,600 | ||||||
| Gross liabilities | (2,703 | ) | (2,071 | ) | ||||
| Net noncurrent deferred income tax asset | 1,191 | 1,529 | ||||||
| Net deferred income tax asset | $ | 4,494 | $ | 3,047 | ||||
51
| September 30, | ||||||||
| 2009 | 2008 | |||||||
| Allowance for doubtful accounts | $ | 40 | $ | 330 | ||||
| Workers’ compensation | 388 | 340 | ||||||
| Stock-based compensation | 458 | 340 | ||||||
| Reserve for accrued employee benefits | 2,431 | 1,972 | ||||||
| Warranty accrual | 2,900 | 2,692 | ||||||
| Uncompleted long-term contracts | (6,155 | ) | (6,987 | ) | ||||
| Depreciation and amortization | (627 | ) | (143 | ) | ||||
| Deferred compensation | 1,062 | 1,341 | ||||||
| Postretirement benefits liability | 396 | 201 | ||||||
| Accrued legal | 93 | 65 | ||||||
| Uniform capitalization and inventory | 3,495 | 3,212 | ||||||
| Software development costs | (488 | ) | (483 | ) | ||||
| Other | 501 | 167 | ||||||
| Net deferred income tax asset | $ | 4,494 | $ | 3,047 | ||||
| Year Ended September 30, | ||||||||||||
| 2009 | 2008 | 2007 | ||||||||||
| U.S. | $ | 56,115 | $ | 35,089 | $ | 11,329 | ||||||
| Other than U.S. | 4,544 | 4,779 | 4,073 | |||||||||
| Income from continuing operations before provision for income taxes | $ | 60,659 | $ | 39,868 | $ | 15,402 | ||||||
| Year Ended September 30, | ||||||||||||
| 2009 | 2008 | 2007 | ||||||||||
| Current: | ||||||||||||
| Federal | $ | 18,028 | $ | 10,487 | $ | 3,904 | ||||||
| State | 2,910 | 1,628 | 641 | |||||||||
| Foreign | 1,146 | 1,601 | 1,626 | |||||||||
| Deferred | (1,350 | ) | 356 | (703 | ) | |||||||
| Total income tax provision | $ | 20,734 | $ | 14,072 | $ | 5,468 | ||||||
52
| Year Ended September 30, | ||||||||||||
| 2009 | 2008 | 2007 | ||||||||||
| Statutory rate | 35 | % | 35 | % | 35 | % | ||||||
| State income taxes, net of federal benefit | 3 | 3 | 3 | |||||||||
| International withholding tax | (1 | ) | — | — | ||||||||
| Other permanent tax items | — | (1 | ) | (2 | ) | |||||||
| Foreign rate differential | (1 | ) | (1 | ) | (1 | ) | ||||||
| Domestic production activities deduction | (2 | ) | (1 | ) | — | |||||||
| Effective rate | 34 | % | 35 | % | 35 | % | ||||||
| Balance as of September 30, 2008 | $ | 997 | ||
| Increases related to tax positions taken during a prior period | 229 | |||
| Decreases related to expectations of statute of limitations | (638 | ) | ||
| Balance as of September 30, 2009 | $ | 588 | ||
53
| September 30, 2009 | September 30, 2008 | |||||||||||||||
| Historical | Accumulated | Historical | Accumulated | |||||||||||||
| Cost | Amortization | Cost | Amortization | |||||||||||||
| Goodwill not subject to amortization | $ | 1,265 | $ | 181 | $ | 1,265 | $ | 181 | ||||||||
| Intangible assets subject to amortization: | ||||||||||||||||
Supply agreement — Power/Vac® | 17,580 | 3,709 | 17,580 | 2,538 | ||||||||||||
| Non-compete agreements | 4,170 | 2,643 | 4,170 | 1,809 | ||||||||||||
| Patents and Trademarks | 804 | 804 | 804 | 774 | ||||||||||||
| Tradenames and unpatented technology | 11,444 | 5,537 | 11,938 | 4,358 | ||||||||||||
| Deferred loan costs | 829 | 649 | 809 | 620 | ||||||||||||
| $ | 36,092 | $ | 13,523 | $ | 36,566 | $ | 10,280 | |||||||||
Years Ending September 30, | Total | |||
| 2010 | $ | 3,555 | ||
| 2011 | 3,399 | |||
| 2012 | 2,262 | |||
| 2013 | 1,474 | |||
| 2014 | 1,474 | |||
54
| Operating | ||||
Years Ending September 30, | Leases | |||
| 2010 | $ | 2,982 | ||
| 2011 | 2,806 | |||
| 2012 | 2,550 | |||
| 2013 | 1,539 | |||
| 2014 | 680 | |||
| Thereafter | — | |||
| Total lease commitments | $ | 10,557 | ||
55
56
| Asset Derivatives | Liability Derivatives | |||||||||||
| Fair | Fair | |||||||||||
| Balance Sheet Location | Value | Balance Sheet Location | Value | |||||||||
| (In thousands) | ||||||||||||
| Derivatives designated as hedging instruments: | ||||||||||||
| Foreign exchange forwards | Prepaid expenses and other current assets | $ | — | Other accrued expenses | $ | 752 | ||||||
| Foreign exchange forwards | Deferred income taxes | 164 | Other liabilities | — | ||||||||
| Total derivatives | $ | 164 | $ | 752 | ||||||||
| Amount of Gain (Loss) | ||||||||||
| Amount of Gain (Loss) | Reclassified from | |||||||||
| Recognized in Other | Accumulated Other | |||||||||
| Comprehensive Income | Location of Gain (Loss) | Comprehensive Income | ||||||||
| on Derivatives(1) | Reclassified from Accumulated | into Income(1) | ||||||||
| Year Ended | Other Comprehensive | Year Ended | ||||||||
Derivatives Designated | September 30, 2009 | Income into Income | September 30, 2009 | |||||||
| Derivatives designated as cash flow hedges: | ||||||||||
| Foreign exchange forwards | $ | (467 | ) | Other income (expense) | $ | 22 | ||||
| Total designated cash flow hedges | $ | (467 | ) | $ | 22 | |||||
57
The tablestable below reflectreflects certain information relating to our operations by business segment. All revenues represent sales from unaffiliated customers. The accounting policies of the business segments are the same as those described in the summary of significant accounting policies. Corporate expenses and certain assets are allocated to the operating business segments primarily based on revenues. The corporate assets are mainly cash, cash equivalents and marketable securities.
58
|
|
|
|
| Year Ended September 30, | ||
| 2012 | 2011 | 2010 |
Revenues: | |||
Electrical Power Products | $ 686,581 | $ 533,339 | $ 517,069 |
Process Control Systems | 30,613 | 29,058 | 33,623 |
Total | $ 717,194 | $ 562,397 | $ 550,692 |
|
|
|
|
Gross profit: | |||
Electrical Power Products | $ 132,458 | $ 91,730 | $ 129,780 |
Process Control Systems | 7,480 | 8,200 | 12,277 |
Total | $ 139,938 | $ 99,930 | $ 142,057 |
|
|
|
|
Income before income taxes: | |||
Electrical Power Products | $ 48,055 | $ 3,888 | $ 41,378 |
Process Control Systems | 179 | 109 | 3,683 |
Total | $ 48,234 | $ 3,997 | $ 45,061 |
|
|
|
|
Depreciation and amortization: | |||
Electrical Power Products | $ 13,010 | $ 15,188 | $ 13,453 |
Process Control Systems | 55 | 162 | 177 |
Total | $ 13,065 | $ 15,350 | $ 13,630 |
|
|
|
|
| Year Ended September 30, | ||||||||||||
| 2009 | 2008 | 2007 | ||||||||||
| Revenues: | �� | |||||||||||
| Electrical Power Products | $ | 637,845 | $ | 611,470 | $ | 541,584 | ||||||
| Process Control Systems | 28,006 | 27,234 | 22,698 | |||||||||
| Total | $ | 665,851 | $ | 638,704 | $ | 564,282 | ||||||
| Gross profit: | ||||||||||||
| Electrical Power Products | $ | 133,629 | $ | 118,171 | $ | 89,044 | ||||||
| Process Control Systems | 11,420 | 8,235 | 6,547 | |||||||||
| Total | $ | 145,049 | $ | 126,406 | $ | 95,591 | ||||||
| Income (loss) before income taxes and minority interest: | ||||||||||||
| Electrical Power Products | $ | 56,700 | $ | 38,241 | $ | 14,781 | ||||||
| Process Control Systems | 3,959 | 1,627 | 621 | |||||||||
| Total | $ | 60,659 | $ | 39,868 | $ | 15,402 | ||||||
| September 30, | ||||||||
| 2009 | 2008 | |||||||
| Identifiable tangible assets: | ||||||||
| Electrical Power Products | $ | 258,012 | $ | 342,105 | ||||
| Process Control Systems | 6,863 | 8,734 | ||||||
| Corporate | 117,398 | 20,507 | ||||||
| Total | $ | 382,273 | $ | 371,346 | ||||
Income before income taxes includes a $1.2 million gain recorded in the second quarter of fiscal 2011 resulting from cash received from the sale of our 50% equity investment in Kazakhstan. This gain was recorded in our Electrical Power Products business segment had approximately $1,084,000 and $1,084,000segment. Income before taxes for fiscal 2011 includes an impairment charge of $7.2 million, which was recorded in the fourth quarter, to reflect the impairment for the value of the intangible assets that were recorded in relation to the acquisition of Powell Canada. This loss was recorded in our Electrical Power Products business segment.
Income before income taxes for fiscal 2010 includes an impairment charge of $7.5 million to reflect the impairment for the value of goodwill and $21,305,000 and $25,014,000that was recorded in relation to the acquisition of intangible and other assets asPowell Canada. This loss was recorded in our Electrical Power Products business segment.
51
Geographic Information
Revenues are as follows (in thousands):
| Year Ended September 30, |
| ||||||||||||||
| 2009 | 2008 | 2007 | Year Ended September 30, | ||||||||||||
2012 | 2011 | 2010 | |||||||||||||
| Europe (including former Soviet Union) | $ | 30,582 | $ | 50,807 | $ | 28,118 | $ 24,857 | $ 7,107 | $ 25,174 | ||||||
| Far East | 62,155 | 13,092 | 27,600 | 14,865 | 17,172 | 24,998 | |||||||||
| Middle East and Africa | 28,405 | 55,960 | 58,879 | 79,781 | 46,304 | 25,880 | |||||||||
| North, Central and South America (excluding U.S.) | 28,737 | 49,772 | 76,964 | 184,935 | 112,949 | 81,506 | |||||||||
| United States | 515,972 | 469,073 | 372,721 | 412,756 | 378,865 | 393,134 | |||||||||
| Total revenues | $ | 665,851 | $ | 638,704 | $ | 564,282 | $ 717,194 | $ 562,397 | $ 550,692 | ||||||
59
|
|
|
| September 30, | |
| 2012 | 2011 |
Long-lived assets: | ||
United States | $ 60,012 | $ 47,966 |
United Kingdom | 6,238 | 6,409 |
Canada | 12,402 | 5,262 |
Total | $ 78,652 | $ 59,637 |
| September 30, | ||||||||
| 2009 | 2008 | |||||||
| Long-lived assets: | ||||||||
| United States | $ | 53,503 | $ | 52,943 | ||||
| United Kingdom | 7,481 | 8,563 | ||||||
| Other | 52 | 40 | ||||||
| Total | $ | 61,036 | $ | 61,546 | ||||
Long-lived assets consist of property, plant and equipment net of accumulated depreciation.
N. Quarterly Results of Operations (Unaudited)
|
|
|
|
|
|
| ||||
| 2012 Quarters | ||||||||
| First | Second | Third | Fourth | 2012 | ||||
Revenues | $ 157,456 | $ 181,486 | $ 194,093 | $ 184,159 | $ 717,194 | ||||
Gross profit | 20,378 | 34,237 | 43,843 | 41,480 | 139,938 | ||||
Net income (loss) | (1,745) | 7,411 | 12,138 | 11,853 | 29,657 | ||||
Basic earnings (loss) per share | (0.15) | 0.63 | 1.03 | 0.99 | 2.50 | ||||
Diluted earnings (loss) per share | (0.15) | 0.63 | 1.02 | 0.99 | 2.49 | ||||
|
|
|
|
|
| ||||
| 2011 Quarters | ||||||||
| First | Second | Third | Fourth | 2011 | ||||
Revenues | $ 124,674 | $ 125,111 | $ 141,369 | $ 171,243 | $ 562,397 | ||||
Gross profit | 25,865 | 24,877 | 21,864 | 27,324 | 99,930 | ||||
Net income (loss) | 2,432 | 1,733 | 73 | (6,953) | (2,715) | ||||
Basic earnings (loss) per share | 0.21 | 0.15 | 0.01 | (0.59) | (0.23) | ||||
Diluted earnings (loss) per share | 0.21 | 0.15 | 0.01 | (0.59) | (0.23) | ||||
| 2009 Quarters | ||||||||||||||||||||
| First | Second | Third | Fourth | 2009 | ||||||||||||||||
| Revenues | $ | 170,489 | $ | 164,099 | $ | 165,942 | $ | 165,321 | $ | 665,851 | ||||||||||
| Gross profit | 34,502 | 33,844 | 41,107 | 35,596 | 145,049 | |||||||||||||||
| Net income | 7,853 | 8,852 | 13,138 | 9,874 | 39,717 | |||||||||||||||
| Basic earnings per share | 0.69 | 0.78 | 1.15 | 0.86 | 3.48 | |||||||||||||||
| Diluted earnings per share | 0.68 | 0.77 | 1.14 | 0.85 | 3.43 | |||||||||||||||
| 2008 Quarters | ||||||||||||||||||||
| First | Second | Third | Fourth | 2008 | ||||||||||||||||
| Revenues | $ | 147,121 | $ | 160,333 | $ | 164,123 | $ | 167,127 | $ | 638,704 | ||||||||||
| Gross profit | 26,695 | 30,692 | 35,002 | 34,017 | 126,406 | |||||||||||||||
| Net income | 3,586 | 6,029 | 7,893 | 8,339 | 25,847 | |||||||||||||||
| Basic earnings per share | 0.32 | 0.54 | 0.70 | 0.73 | 2.29 | |||||||||||||||
| Diluted earnings per share | 0.32 | 0.53 | 0.69 | 0.72 | 2.26 | |||||||||||||||
The sum of the individual earnings per share amounts may not agree withyear-to-date earnings per share as each period’speriod��s computation is based on the weighted-average number of shares outstanding during the period.
Income before income taxes includes a $1.2 million gain recorded in the second quarter of fiscal 2011 resulting from cash received from the sale of our 50% equity investment in Kazakhstan. Income before taxes for recognition and disclosure through December 9, 2009,fiscal 2011 includes an impairment charge of $7.2 million, which was recorded in the datefourth quarter, to reflect the impairment for the value of the filingintangible assets that were recorded in relation to the acquisition of this Annual Report onForm 10-K with the SEC.
60
52
Table of PowerComm including bank debt, accounts payableContents
Item 9. Changes in and obligations under capital leases estimated to total approximately $21.4 million ($22.5 million CAD).
None.
61
We have established and maintain a system of disclosure controls and procedures that are designed to provide reasonable assurance that information required to be disclosed in our reports filed with the Securities and Exchange Commission (SEC) pursuant to the Securities Exchange Act of 1934, as amended (Exchange Act), is recorded, processed, summarized and reported within the time periods specified in the rules and forms of the CommissionSEC and that such information is accumulated and communicated to our management, including our Chief Executive Officer (“CEO”)(CEO) and Chief Financial Officer (“CFO”)(CFO), as appropriate, to allow timely decisions regarding required disclosures.
Management, with the participation of our CEO and CFO, has evaluated the effectiveness of the design and operation of our disclosure controls and procedures (as defined inRules 13a-15(e) and15d-15(e) of the Securities Exchange Act of 1934, as amended)Act) as of the end of the period covered by this report. Based on such evaluation, our CEO and CFO have each concluded that as of the end of suchthe period, our disclosure controls and procedures were effective to provide reasonable assurance that information required to be disclosed by us in reports that we file or submit under the Securities Exchange Act of 1934, as amended, is recorded, processed, summarized and reported within the time periods specified in the Securities and Exchange Commission’sSEC’s rules and forms and that such information is accumulated and communicated to our management, including the CEO and CFO, as appropriate, to allow timely decisions regarding required disclosures.
Management’s Report on Internal Control Over Financial Reporting
Management is responsible for establishing and maintaining adequate internal control over financial reporting as defined inRule 13a-15(f) under the Securities and Exchange Act of 1934.Act. Our internal control system was designed to provide reasonable assurance regarding the reliability of financial reporting and the preparation of financial statements for external purposes in accordance with generally accepted accounting principles. Due to its inherent limitations, internal control over financial reporting may not prevent or detect misstatements. Also, projections of any evaluation of effectiveness to future periods are subject to the risk that controls may become inadequate because of changes in conditions, or that the degree of compliance with the policies or procedures may deteriorate.
Management of the Company has assessed the effectiveness of our internal control over financial reporting as of September 30, 2009.2012. Management evaluated the effectiveness of internal control over financial reporting based on the criteria in Internal Control —– Integrated Framework issued by the Committee of Sponsoring Organizations of the Treadway Commission (COSO). Based on management’s evaluation, management has concluded that internal control over financial reporting was effective at the reasonable assurance level as of September 30, 2009,2012, based on criteria in Internal Control —– Integrated Framework issued by the COSO.
PricewaterhouseCoopers LLP, an independent registered public accounting firm, has audited and issued their report on the effectiveness of our internal control over financial reporting as of September 30, 2009,2012, which appears in their report to the financial statements included herein.
Changes in Internal Control over Financial Reporting
There hashave been no changechanges in our internal control over financial reporting that occurred during the year ended September 30, 2009,last fiscal quarter that hashave materially affected, or isare reasonably likely to materially affect, our internal control over financial reporting.
62
None.
53
Item 10. Directors, Executive Officers and CorporateGovernance
The information required by this item is incorporated in this Annual Report by reference to our definitive proxy statement pursuant to Regulation 14A, to be filed with the Securities and Exchange Commission not later than 120 days after the close of our fiscal year ended September 30, 2009.
We have adopted a Code of Business Conduct and Ethics that applies to all employees, including our executive officers and directors. A copy of our Code of Business Conduct and Ethics may be obtained at the Investor Relations section of our website,www.powellind.com, or by written request addressed to the Secretary, Powell Industries, Inc., 8550 Mosley Drive, Houston, Texas 77075. We will satisfy the requirements under Item 5.05 ofForm 8-K regarding disclosure of amendments to, or waivers from, provisions of our code of ethics that apply to the chief executive officer, chief financial officer or controller by posting such information on our website.
Item 11. Executive Compensation
The information required by this item is incorporated in this Annual Report by reference to our definitive proxy statement pursuant to Regulation 14A, to be filed with the Securities and Exchange Commission not later than 120 days after the close of our fiscal year ended September 30, 2009.
Item 12. Security Ownership of Certain Beneficial Owners and Managementand Related Stockholder Matters
The information required by this item is incorporated in this Annual Report by reference to our definitive proxy statement pursuant to Regulation 14A, to be filed with the Securities and Exchange Commission not later than 120 days after the close of our fiscal year ended September 30, 2009.
Item 13. Certain Relationships and Related Transactions, and DirectorIndependence
The information required by this item is incorporated in this Annual Report by reference to our definitive proxy statement pursuant to Regulation 14A, to be filed with the Securities and Exchange Commission not later than 120 days after the close of our fiscal year ended September 30, 2009.
Item 14. Principal Accountant Fees and Services
The information required by this item is incorporated in this Annual Report by reference to our definitive proxy statement pursuant to Regulation 14A, to be filed with the Securities and Exchange Commission not later than 120 days after the close of our fiscal year ended September 30, 2009.2012.
54
Item 15. Exhibits and Financial Statement Schedules
|
2. Financial Statement Schedule. All schedules are omitted because they are not applicable or the required information is shown in the financial statements or the notes to the financial statements.
63
3. Exhibits.
Number | Description of Exhibits | |||||
| 2 | .4 | — | Asset Purchase Agreement dated October 21, 2009 by and among, Powell PowerComm Inc. (as a Buyer) and PowerComm Inc., Redhill Systems Ltd., Nextron Corporation, PCG Technical Services Inc., and Concorde metal Manufacturing Ltd. (as Sellers) (filed as Exhibit 2.1 to our Form 8-K filed October 27, 2009, and incorporated herein by reference). | |||
| 2 | .5 | — | Purchase Agreement dated October 21, 2009 by and among Powell PowerComm KO Inc. (as a Buyer) and PowerComm Inc. (as a Seller) (filed as Exhibit 2.2 to our Form 8-K filed October 27, 2009, and incorporated herein by reference). | |||
| 2 | .6 | — | Purchase Agreement dated October 21, 2009 by and among Powell PowerComm Ventures Inc. (as a Buyer) and PowerComm Inc. (as a Seller) (filed as Exhibit 2.3 to our Form 8-K filed October 27, 2009, and incorporated herein by reference). | |||
| 3 | .1 | — | Certificate of Incorporation of Powell Industries, Inc. filed with the Secretary of State of the State of Delaware on February 11, 2004 (filed as Exhibit 3.1 to our Form 8-A/A filed November 1, 2004, and incorporated herein by reference). | |||
| 3 | .2 | — | By-laws of Powell Industries, Inc. (filed as Exhibit 3.2 to our Form 8-A/A filed November 1, 2004, and incorporated herein by reference). | |||
| 10 | .1 | — | Powell Industries, Inc., Incentive Compensation Plan (filed as Exhibit 10.1 to our Form 10-K for the fiscal year ended October 31, 2003, and incorporated herein by reference). | |||
| 10 | .2 | — | Description of Supplemental Executive Benefit Plan (filed as Exhibit 10 to our Form 10-K for the fiscal year ended October 31, 1984, and incorporated herein by reference). | |||
| 10 | .3 | — | 1992 Powell Industries, Inc. Stock Option Plan (filed as an exhibit to our preliminary proxy statement dated January 24, 1992, and incorporated herein by reference). | |||
| 10 | .4 | — | Amendment to 1992 Powell Industries, Inc. Stock Option Plan (filed as Exhibit 10.8 to our Form 10-Q for the quarter ended April 30, 1996, and incorporated herein by reference). | |||
| 10 | .5 | — | Amendment to 1992 Powell Industries, Inc. Stock Option Plan (the cover of the 1992 Powell Industries, Inc. Stock Option Plan has been noted to reflect the increase in the number of shares authorized for issuance under the Plan from 2,100,000 to 2,700,000, which increase was approved by the stockholders of the Company at the 2005 Annual Meeting of Stockholders). | |||
| 10 | .6 | — | Powell Industries, Inc. Directors’ Fees Program (filed as Exhibit 10.7 to our Form 10-K for the fiscal year ended October 31, 1992, and incorporated herein by reference). | |||
| 10 | .7 | — | Powell Industries, Inc. Executive Severance Protection Plan (filed as Exhibit 10.7 to our Form 10-K for the fiscal year ended October 31, 2002, and incorporated herein by reference). | |||
| 10 | .8 | — | Powell Industries, Inc. Non-Employee Directors Stock Option Plan (filed as Exhibit 10.9 to our Form 10-K for the fiscal year ended October 31, 2002, and incorporated herein by reference). | |||
| 10 | .9 | — | Powell Industries, Inc. Deferred Compensation Plan (filed as Exhibit 10.9 to our Form 10-K for the fiscal year ended October 31, 2002, and incorporated herein by reference). | |||
| 10 | .10 | — | Powell Industries, Inc. Non-Employee Director Restricted Stock Plan (filed as Exhibit 10.10 to our Form 10-K for the fiscal year ended October 31, 2005, and incorporated herein by reference). | |||
| 10 | .11 | — | Amended Loan Agreement dated October 29, 2004, between Powell Industries, Inc. and Bank of America, N.A. (filed as Exhibit 10.10 to our Form 10-K for the fiscal year ended October 31, 2004, and incorporated herein by reference). | |||
| 10 | .12 | — | Credit and Reimbursement Agreement dated April 15, 2004, between Powell Industries, Inc. and Bank of America, N.A. (filed as Exhibit 10.11 to our Form 10-K for the fiscal year ended October 31, 2004, and incorporated herein by reference). | |||
| 10 | .13 | — | Credit Agreement dated June 29, 2005 among Powell Industries, Inc., Inhoco 3210 Limited and Switchgear & Instrumentation Properties Limited, and Bank of America and the other lenders parties thereto (filed as Exhibit 10.1 to our Form 8-K filed July 6, 2005, and incorporated herein by reference). | |||
| 10 | .14 | — | First Amendment to Credit Agreement dated November 7, 2005 among Powell Industries, Inc., Inhoco 3210 Limited (n/k/a Switchgear & Instrumentation Limited), Switchgear & Instrumentation Properties Limited, Bank of America, N.A., and the other lenders parties thereto (filed as Exhibit 10.14 to our Form 10-K for the fiscal year ended October 31, 2005, and incorporated herein by reference). | |||
64
Number | Description of Exhibits | |||||
| 10 | .15 | — | Second Amendment to Credit Agreement dated January 11, 2006 among Powell Industries, Inc., Switchgear & Instrumentation Limited, Switchgear & Instrumentation Properties Limited, Bank of America, N.A., and the other lenders parties thereto (filed as Exhibit 10.15 to our Form 10-K for the fiscal year ended October 31, 2005, and incorporated herein by reference). | |||
| 10 | .16 | — | Third Amendment to Credit Agreement dated August 4, 2006 among Powell Industries, Inc., Switchgear & Instrumentation Limited, Switchgear & Instrumentation Properties Limited, Bank of America, N.A., and the other lenders parties thereto (filed as Exhibit 10.3 to our Form 8-K filed August 9, 2006, and incorporated herein by reference). | |||
| 10 | .17 | — | Fourth Amendment to Credit Agreement dated December 7, 2006 among Powell Industries, Inc., Switchgear & Instrumentation Limited, Switchgear & Instrumentation Properties Limited, Bank of America, N.A., and the other lenders parties thereto (filed as Exhibit 10.17 to our Transition report on Form 10-K for the fiscal year ended September 30, 2006, and incorporated herein by reference). | |||
| 10 | .18 | — | Fifth Amendment to Credit Agreement, dated as of December 4, 2007, among Powell Industries, Inc., as Parent, the subsidiaries of Powell Industries, Inc. identified therein, as Borrowers, Bank of America, N.A., as Administrative Agent, Swing Line Lender and L/C Issuer, and the Lenders party thereto (filed as Exhibit 10.1 to our Quarterly Report on Form 10-Q for the quarter ended December 31, 2007, and incorporated herein by reference). | |||
| 10 | .19 | — | Sixth Amendment to Credit Agreement, dated as of December 14, 2007, among Powell Industries, Inc., as Parent, the subsidiaries of Powell Industries, Inc. identified therein, as Borrowers, Bank of America, N.A., as Administrative Agent, Swing Line Lender and L/C issuer, and the Lenders party thereto (filed as Exhibit 10.1 to our Form 8-K filed December 19, 2007, and incorporated herein by reference). | |||
| 10 | .20 | — | Banking facilities between HSBC Bank plc and Switchgear & Instrumentation Limited and Switchgear & Instrumentation Properties Limited dated September 12, 2005 (filed as Exhibit 10.16 to ourForm 10-K for the fiscal year ended October 31, 2005, and incorporated herein by reference). | |||
| **10 | .21 | — | Powell Supply Agreement between the Company and General Electric Company dated August 7, 2006 (filed as Exhibit 10.1 to our Form 8-K/A filed June 16, 2008, and incorporated herein by reference). | |||
| 10 | .22 | — | Lease Agreement between the Company and C&L Partnership, Ltd. dated April 19, 2006 (filed as Exhibit 10.2 to our Form 8-K filed August 9, 2006, and incorporated herein by reference). | |||
| 10 | .23 | — | Consulting Agreement dated July 18, 2008 between the Company and Thomas W. Powell (filed as Exhibit 10.1 to our Form 8-K filed July 24, 2008, and incorporated herein by reference). | |||
| 10 | .24 | — | Seventh Amendment to Credit Agreement, dated as of December 10, 2008, among Powell Industries, Inc., as Parent, the subsidiaries of Powell Industries, Inc. identified therein, as Borrowers, Bank of America, N.A., as Administrative Agent, Swing Line Lender and L/C issuer, and the Lenders party (filed as Exhibit 10.24 to our form 10-K for the fiscal year ended September 30, 2008, and incorporated herein by reference). | |||
| *21 | .1 | — | Subsidiaries of Powell Industries, Inc. | |||
| *23 | .2 | — | Consent of PricewaterhouseCoopers, LLP. | |||
| *31 | .1 | — | Certification of Chief Executive Officer pursuant to Rule 13a-14(a)/15d-14(a). | |||
| *31 | .2 | — | Certification of Chief Financial Officer pursuant to Rule 13a-14(a)/15d-14(a). | |||
| *32 | .1 | — | Certification of Chief Executive Officer Pursuant to Section 18 U.S.C. Section 1350, as Adopted Pursuant to Section 906 of the Sarbanes-Oxley Act of 2002. | |||
| *32 | .2 | — | Certification of Chief Financial Officer Pursuant to Section 18 U.S.C. Section 1350, as Adopted Pursuant to Section 906 of the Sarbanes-Oxley Act of 2002. | |||
Number | Description of Exhibits | |
— | Certificate of Incorporation of Powell Industries, Inc. filed with the Secretary of State of the State of Delaware on February 11, 2004 (filed as Exhibit 3.1 to our Form 8-A/A filed November 1, 2004, and incorporated herein by reference). | |
| 3.2 | — | By-laws of Powell Industries, Inc. (filed as Exhibit 3.2 to our Form 8-A/A filed November 1, 2004, and incorporated herein by reference). |
| 3.3 | — | Amended and Restated By-laws of Powell Industries, Inc. (filed as Exhibit 3.1 to our Form 8-K filed October 12, 2012, and incorporated herein by reference). |
| 10.1 | — | Powell Industries, Inc., Incentive Compensation Plan (filed as Exhibit 10.1 to our Form 10-K for the fiscal year ended October 31, 2003, and incorporated herein by reference). |
| 10.2 | — | Description of Supplemental Executive Benefit Plan (filed as Exhibit 10 to our Form 10-K for the fiscal year ended October 31, 1984, and incorporated herein by reference). |
| 10.3 | — | 1992 Powell Industries, Inc. Stock Option Plan (filed as Exhibit 10.1 to our registration statement on Form S-8 filed on December 21, 2010, and incorporated herein by reference). |
| 10.4 | — | Amendment to 1992 Powell Industries, Inc. Stock Option Plan (filed as Exhibit 10.8 to our Form 10-Q for the quarter ended April 30, 1996, and incorporated herein by reference). |
| 10.5 | — | Amendment to 1992 Powell Industries, Inc. Stock Option Plan (the cover of the 1992 Powell Industries, Inc. Stock Option Plan has been noted to reflect the increase in the number of shares authorized for issuance under the Plan from 2,100,000 to 2,700,000, which increase was approved by the stockholders of the Company at the 2005 Annual Meeting of Stockholders). |
| 10.6 | — | Powell Industries, Inc. Directors’ Fees Program (filed as Exhibit 10.7 to our Form 10-K for the fiscal year ended October 31, 1992, and incorporated herein by reference). |
| 10.7 | — | Powell Industries, Inc. Executive Severance Protection Plan (filed as Exhibit 10.7 to our Form 10-K for the fiscal year ended October 31, 2002, and incorporated herein by reference). |
| 10.8 | — | Powell Industries, Inc. Non-Employee Directors Stock Option Plan (filed as Exhibit 10.9 to our Form 10-K for the fiscal year ended October 31, 2002, and incorporated herein by reference). |
| 10.9 | — | Powell Industries, Inc. Deferred Compensation Plan (filed as Exhibit 10.9 to our Form 10-K for the fiscal year ended October 31, 2002, and incorporated herein by reference). |
| 10.10 | — | Powell Industries, Inc. Non-Employee Director Restricted Stock Plan (filed as Exhibit 10.3 to our registration statement on Form S-8 filed on December 21, 2010, and incorporated herein by reference). |
| 10.11 | — | Amended Loan Agreement dated October 29, 2004, between Powell Industries, Inc. and Bank of America, N.A. (filed as Exhibit 10.10 to our Form 10-K for the fiscal year ended October 31, 2004, and incorporated herein by reference). |
| 10.12 | — | Credit and Reimbursement Agreement dated April 15, 2004, between Powell Industries, Inc. and Bank of America, N.A. (filed as Exhibit 10.11 to our Form 10-K for the fiscal year ended October 31, 2004, and incorporated herein by reference). |
| 10.13 | — | Credit Agreement dated June 29, 2005 among Powell Industries, Inc., Inhoco 3210 Limited and Switchgear & Instrumentation Properties Limited, and Bank of America and the other lenders parties thereto (filed as Exhibit 10.1 to our Form 8-K filed July 6, 2005, and incorporated herein by reference). |
| 10.14 | — | First Amendment to Credit Agreement dated November 7, 2005 among Powell Industries, Inc., Inhoco 3210 Limited (n/k/a Switchgear & Instrumentation Limited), Switchgear & Instrumentation Properties Limited, Bank of America, N.A., and the other lenders parties thereto (filed as Exhibit 10.14 to our Form 10-K for the fiscal year ended October 31, 2005, and incorporated herein by reference). |
| 10.15 | — | Second Amendment to Credit Agreement dated January 11, 2006 among Powell Industries, Inc., Switchgear & Instrumentation Limited, Switchgear & Instrumentation Properties Limited, Bank of America, N.A., and the other lenders parties thereto (filed as Exhibit 10.15 to our Form 10-K for the fiscal year ended October 31, 2005, and incorporated herein by reference). |
| 10.16 | — | Third Amendment to Credit Agreement dated August 4, 2006 among Powell Industries, Inc., Switchgear & Instrumentation Limited, Switchgear & Instrumentation Properties Limited, Bank of America, N.A., and the other lenders parties thereto (filed as Exhibit 10.3 to our Form 8-K filed August 9, 2006, and incorporated herein by reference). |
| 10.17 | — | Fourth Amendment to Credit Agreement dated December 7, 2006 among Powell Industries, Inc., Switchgear & Instrumentation Limited, Switchgear & Instrumentation Properties Limited, Bank of America, N.A., and the other lenders parties thereto (filed as Exhibit 10.17 to our Transition report on Form 10-K for the fiscal year ended September 30, 2006, and incorporated herein by reference). |
| 10.18 | — | Fifth Amendment to Credit Agreement, dated as of December 4, 2007, among Powell Industries, Inc., as Parent, the subsidiaries of Powell Industries, Inc. identified therein, as Borrowers, Bank of America, N.A., as Administrative Agent, Swing Line Lender and L/C Issuer, and the Lenders party thereto (filed as Exhibit 10.1 to our Quarterly Report on Form 10-Q for the quarter ended December 31, 2007, and incorporated herein by reference). |
| 10.19 | — | Sixth Amendment to Credit Agreement, dated as of December 14, 2007, among Powell Industries, Inc., as Parent, the subsidiaries of Powell Industries, Inc. identified therein, as Borrowers, Bank of America, N.A., as Administrative Agent, Swing Line Lender and L/C issuer, and the Lenders party thereto (filed as Exhibit 10.1 to our Form 8-K filed December 19, 2007, and incorporated herein by reference). |
| 10.20 | — | Banking facilities between HSBC Bank plc and Switchgear & Instrumentation Limited and Switchgear & Instrumentation Properties Limited dated September 12, 2005 (filed as Exhibit 10.16 to our Form 10-K for the fiscal year ended October 31, 2005, and incorporated herein by reference). |
**10.21 | — | Powell Supply Agreement between the Company and General Electric Company dated August 7, 2006 (filed as Exhibit 10.1 to our Form 8-K/A filed June 16, 2008, and incorporated herein by reference). |
| 10.22 | — | Lease Agreement between the Company and C&L Partnership, Ltd. dated April 19, 2006 (filed as Exhibit 10.2 to our Form 8-K filed August 9, 2006, and incorporated herein by reference). |
| 10.23 | — | Consulting Agreement dated July 18, 2008 between the Company and Thomas W. Powell (filed as Exhibit 10.1 to our Form 8-K filed July 24, 2008, and incorporated herein by reference). |
| 10.24 | — | Seventh Amendment to Credit Agreement, dated as of December 10, 2008, among Powell Industries, Inc., as Parent, the subsidiaries of Powell Industries, Inc. identified therein, as Borrowers, Bank of America, N.A., as Administrative Agent, Swing Line Lender and L/C issuer, and the Lenders party (filed as Exhibit 10.24 to our Form 10-K for the fiscal year ended September 30, 2008, and incorporated herein by reference). |
| 10.25 | — | Powell Industries, Inc. 2006 Equity Compensation Plan (filed as Exhibit 10.2 to our registration statement on Form S-8 filed on December 21, 2010, and incorporated herein by reference). |
| 10.26 | — | Credit Agreement dated as of December 15, 2009, between Powell PowerComm Inc., as Borrower, Powell Industries, Inc., Nextron Limited, PPC Technical Services Inc., as Guarantors, and HSBC Bank Canada, as Lender (filed as Exhibit 10.1 to our Form 8-K filed on December 21, 2009, and incorporated herein by reference). |
| 10.27 | — | Ninth Amendment to Credit Agreement, dated as of May 18, 2011, among Powell Industries, Inc., as Parent, the subsidiaries of Powell Industries, Inc. identified therein, as Borrowers, Bank of America, N.A., as Administrative Agent, Swing Line Lender and L/C issuer, and the Lenders party (filed as Exhibit 10.1 to our Form 8-K dated May 18, 2011, and incorporated herein by reference.) |
| 10.28 | — | Severance Agreement and Release dated as of October 7, 2011 between the Company and Patrick L. McDonald. |
| 10.29 | — | Employment Agreement dated as of May 8, 2012 between the Company and Don R. Madison (filed as Exhibit 10.1 to our Form 10-Q for the quarter ended March 31, 2012, and incorporated herein by reference). |
| 10.30 | — | Employment Agreement dated as of May 8, 2012 between the Company and Milburn E. Honeycutt (filed as Exhibit 10.2 to our Form 10-Q for the quarter ended March 31, 2012, and incorporated herein by reference). |
| 10.31 | — | Tenth Amendment to Credit Agreement, dated as of March 26, 2012, among Powell Industries, Inc., as Parent, the subsidiaries of Powell Industries, Inc. identified herein, as Borrowers, Bank of America, N.A., as Administrative Agent, Swing Line Lender and L/C issuer, and the Lenders party (filed as Exhibit 10.3 to our Form 10-Q for the quarter ended March 31, 2012, and incorporated herein by reference). |
| 10.32 | — | Amended and Restated Credit Agreement dated as of April 26, 2012, between Powell PowerComm Inc., as Borrower, Powell Industries, Inc., Nextron Limited, PPC Technical Services Inc., as Guarantors, and HSBC Bank Canada, as Lender (filed as Exhibit 10.4 to our Form 10-Q for the quarter ended March 31, 2012, and incorporated herein by reference). |
| 10.33 | — | Employment Agreement dated as of August 20, 2012, between the Company and Michael A. Lucas (filed as Exhibit 10.1 to our Form 8-K dated August 9, 2012, and incorporated herein by reference). |
*21.1 | — | Subsidiaries of Powell Industries, Inc. |
*23.2 | — | Consent of PricewaterhouseCoopers LLP. |
*31.1 | — | Certification of Chief Executive Officer pursuant to Rule 13a-14(a)/15d-14(a). |
*31.2 | — | Certification of Chief Financial Officer pursuant to Rule 13a-14(a)/15d-14(a). |
*32.1 | — | Certification of Chief Executive Officer Pursuant to Section 18 U.S.C. Section 1350, as Adopted Pursuant to Section 906 of the Sarbanes-Oxley Act of 2002. |
*32.2 | — | Certification of Chief Financial Officer Pursuant to Section 18 U.S.C. Section 1350, as Adopted Pursuant to Section 906 of the Sarbanes-Oxley Act of 2002. |
101.INS | — | XBRL Instance Document |
101.SCH | — | XBRL Taxonomy Extension Schema Document |
101.CAL | — | XBRL Taxonomy Extension Calculation Linkbase Document |
101.DEF | — | XBRL Taxonomy Extension Definition Linkbase Document |
101.LAB | — | XBRL Taxonomy Extension Label Linkbase Document |
101.PRE | — | XBRL Taxonomy Extension Presentation Linkbase Document |
55
56
____________
* | Filed herewith |
** | Portions of this exhibit have been omitted based on a request for confidential treatment pursuant toRule 24b-2 of the Securities Exchange Act of 1934. Such omitted portions have been filed separately with the Commission. |
65
57
Pursuant to the requirements of Section 13 or 15(d) of the Securities Exchange Act of 1934, the Registrant has duly caused this report to be signed on its behalf by the undersigned, thereunto duly authorized.
POWELL INDUSTRIES, INC.
By: /s/ Michael A. Lucas
Michael A. Lucas
President and Chief Executive Officer
(Principal Executive Officer)
Pursuant to the requirements of the Securities Exchange Act of 1934, this report has been signed below by the following persons on behalf of the registrant in the capacities and on the date indicated:
Signature | Title | |||
/s/ Thomas W. Powell Thomas W. Powell | Chairman of the Board | |||
/s/ Michael A. Lucas Michael A. Lucas | Director President and Chief Executive Officer (Principal Executive Officer) | |||
/s/ Don R. Madison Don R. Madison | Executive Vice President Chief Financial and Administrative Officer (Principal Financial Officer) | |||
/s/ Milburn Honeycutt Milburn Honeycutt | Vice President Chief Accounting Officer Corporate Controller (Principal Accounting Officer) | |||
/s/ Joseph L. Becherer Joseph L. Becherer | Director | |||
/s/ Eugene L. Butler Eugene L. Butler | Director | |||
/s/ James F. Clark James F. Clark | Director | |||
/s/ Christopher E. Cragg Christopher E. Cragg | Director | |||
/s/ Bonnie V. Hancock Bonnie V. Hancock | Director | |||
/s/ Scott E. Rozzell Scott E. Rozzell | Director | |||
/s/ Stephen W. Seale, Jr. Stephen W. Seale, Jr. | Director | |||
/s/ Robert C. Tranchon Robert C. Tranchon | Director | |||
Date: December 5, 2012
58
EXHIBIT INDEX
Number | Description of Exhibits | |
— |
66
Certificate of Incorporation of Powell Industries, Inc. filed with the Secretary of State of the State of Delaware on February 11, 2004 (filed as Exhibit 3.1 to our Form 8-A/A filed November 1, 2004, and incorporated herein by reference).
Number | Exhibit Title | |||||
| 2 | .4 | — | Asset Purchase Agreement dated October 21, 2009 by and among, Powell PowerComm Inc. (as a Buyer) and PowerComm Inc., Redhill Systems Ltd., Nextron Corporation, PCG Technical Services Inc., and Concorde metal Manufacturing Ltd. (as Sellers) (filed as Exhibit 2.1 to our Form 8-K filed October 27, 2009, and incorporated herein by reference). | |||
| 2 | .5 | — | Purchase Agreement dated October 21, 2009 by and among Powell PowerComm KO Inc. (as a Buyer) and PowerComm Inc. (as a Seller) (filed as Exhibit 2.2 to our Form 8-K filed October 27, 2009, and incorporated herein by reference). | |||
| 2 | .6 | — | Purchase Agreement dated October 21, 2009 by and among Powell PowerComm Ventures Inc. (as a Buyer) and PowerComm Inc. (as a Seller) (filed as Exhibit 2.3 to our Form 8-K filed October 27, 2009, and incorporated herein by reference). | |||
| 3 | .1 | — | Certificate of Incorporation of Powell Industries, Inc. filed with the Secretary of State of the State of Delaware on February 11, 2004 (filed as Exhibit 3.1 to our Form 8-A/A filed November 1, 2004, and incorporated herein by reference). | |||
| 3 | .2 | — | By-laws of Powell Industries, Inc. (filed as Exhibit 3.2 to our Form 8-A/A filed November 1, 2004, and incorporated herein by reference). | |||
| 10 | .1 | — | Powell Industries, Inc., Incentive Compensation Plan (filed as Exhibit 10.1 to our Form 10-K for the fiscal year ended October 31, 2003, and incorporated herein by reference). | |||
| 10 | .2 | — | Description of Supplemental Executive Benefit Plan (filed as Exhibit 10 to our Form 10-K for the fiscal year ended October 31, 1984, and incorporated herein by reference). | |||
| 10 | .3 | — | 1992 Powell Industries, Inc. Stock Option Plan (filed as an exhibit to our preliminary proxy statement dated January 24, 1992, and incorporated herein by reference). | |||
| 10 | .4 | — | Amendment to 1992 Powell Industries, Inc. Stock Option Plan (filed as Exhibit 10.8 to our Form 10-Q for the quarter ended April 30, 1996, and incorporated herein by reference). | |||
| 10 | .5 | — | Amendment to 1992 Powell Industries, Inc. Stock Option Plan (the cover of the 1992 Powell Industries, Inc. Stock Option Plan has been noted to reflect the increase in the number of shares authorized for issuance under the Plan from 2,100,000 to 2,700,000, which increase was approved by the stockholders of the Company at the 2005 Annual Meeting of Stockholders). | |||
| 10 | .6 | — | Powell Industries, Inc. Directors’ Fees Program (filed as Exhibit 10.7 to our Form 10-K for the fiscal year ended October 31, 1992, and incorporated herein by reference). | |||
| 10 | .7 | — | Powell Industries, Inc. Executive Severance Protection Plan (filed as Exhibit 10.7 to our Form 10-K for the fiscal year ended October 31, 2002, and incorporated herein by reference). | |||
| 10 | .8 | — | Powell Industries, Inc. Non-Employee Directors Stock Option Plan (filed as Exhibit 10.9 to ourForm 10-K for the fiscal year ended October 31, 2002, and incorporated herein by reference). | |||
| 10 | .9 | — | Powell Industries, Inc. Deferred Compensation Plan (filed as Exhibit 10.9 to our Form 10-K for the fiscal year ended October 31, 2002, and incorporated herein by reference). | |||
| 10 | .10 | — | Powell Industries, Inc. Non-Employee Director Restricted Stock Plan (filed as Exhibit 10.10 to our Form 10-K for the fiscal year ended October 31, 2005, and incorporated herein by reference). | |||
| 10 | .11 | — | Amended Loan Agreement dated October 29, 2004, between Powell Industries, Inc. and Bank of America, N.A. (filed as Exhibit 10.10 to our Form 10-K for the fiscal year ended October 31, 2004, and incorporated herein by reference). | |||
| 10 | .12 | — | Credit and Reimbursement Agreement dated April 15, 2004, between Powell Industries, Inc. and Bank of America, N.A. (filed as Exhibit 10.11 to our Form 10-K for the fiscal year ended October 31, 2004, and incorporated herein by reference). | |||
| 10 | .13 | — | Credit Agreement dated June 29, 2005 among Powell Industries, Inc., Inhoco 3210 Limited, and Switchgear & Instrumentation Properties Limited, and Bank of America and the other lenders parties thereto (filed as Exhibit 10.1 to our Form 8-K filed July 6, 2005, and incorporated herein by reference). | |||
67
Number | Exhibit Title | |||||
| 10 | .14 | — | First Amendment to Credit Agreement dated November 7, 2005 among Powell Industries, Inc., Inhoco 3210 Limited (n/k/a Switchgear & Instrumentation Limited.), Switchgear & Instrumentation Properties Limited, Bank of America, N.A., and the other lenders parties thereto (filed as Exhibit 10.14 to our Form 10-K for the fiscal year ended October 31, 2005, and incorporated herein by reference). | |||
| 10 | .15 | — | Second Amendment to Credit Agreement dated January 11, 2006 among Powell Industries, Inc., Switchgear & Instrumentation Limited, Switchgear & Instrumentation Properties Limited, Bank of America, N.A., and the other lenders parties thereto (filed as Exhibit 10.15 to our Form 10-K for the fiscal year ended October 31, 2005, and incorporated herein by reference). | |||
| 10 | .16 | — | Third Amendment to Credit Agreement dated August 4, 2006 among Powell Industries, Inc., Switchgear & Instrumentation Limited, Switchgear & Instrumentation Properties Limited, Bank of America, N.A., and the other lenders parties thereto (filed as Exhibit 10.3 to our Form 8-K filed August 9, 2006, and incorporated herein by reference). | |||
| 10 | .17 | — | Fourth Amendment to Credit Agreement dated December 7, 2006 among Powell Industries, Inc., Switchgear & Instrumentation Limited, Switchgear & Instrumentation Properties Limited, Bank of America, N.A., and the other lenders parties thereto (filed as Exhibit 10.17 to our Transition report on Form 10-K for the fiscal year ended September 30, 2006, and incorporated herein by reference). | |||
| 10 | .18 | — | Fifth Amendment to Credit Agreement, dated as of December 4, 2007, among Powell Industries, Inc., as Parent, the subsidiaries of Powell Industries, Inc. identified therein, as Borrowers, Bank of America, N.A., as Administrative Agent, Swing Line Lender and L/C Issuer, and the Lenders party thereto (filed as Exhibit 10.1 to our Quarterly Report on Form 10-Q for the quarter ended December 31, 2007, and incorporated herein by reference). | |||
| 10 | .19 | — | Sixth Amendment to Credit Agreement, dated as of December 14, 2007, among Powell Industries, Inc., as Parent, the subsidiaries of Powell Industries, Inc. identified therein, as Borrowers, Bank of America, N.A., as Administrative Agent, Swing Line Lender and L/C Issuer, and the Lenders party thereto (filed as Exhibit 10.1 to our Form 8-K filed December 19, 2007, and incorporated herein by reference). | |||
| 10 | .20 | — | Banking facilities between HSBC Bank plc and Switchgear & Instrumentation Limited and Switchgear & Instrumentation Properties Limited dated September 12, 2006 (filed as Exhibit 10.16 to ourForm 10-K for the fiscal year ended October 31, 2005, and incorporated herein by reference). | |||
| **10 | .21 | — | Powell Supply Agreement between the Company and General Electric Company dated August 7, 2006 (filed as Exhibit 10.1 to our Form 8-K/A filed June 16, 2008, and incorporated herein by reference). | |||
| 10 | .22 | — | Lease Agreement between the Company and C&L Partnership, Ltd. dated April 19, 2006 (filed as Exhibit 10.2 to our Form 8-K filed August 9, 2006, and incorporated herein by reference). | |||
| 10 | .23 | — | Consulting Agreement dated July 18, 2008 between the Company and Thomas W. Powell (filed as Exhibit 10.1 to our Form 8-K filed on July 24, 2008, and incorporated herein by reference). | |||
| 10 | .24 | — | Seventh Amendment to Credit Agreement, dated as of December 10, 2008, among Powell Industries, Inc., as Parent, the subsidiaries of Powell Industries, Inc. identified therein, as Borrowers, Bank of America, N.A., as Administrative Agent, Swing Line Lender and L/C issuer, and the Lenders party (filed as Exhibit 10.24 to out Form 10-K for the fiscal year ended September 30, 2008, and incorporated herein by reference). | |||
| *21 | .1 | — | Subsidiaries of Powell Industries, Inc. | |||
| *23 | .2 | — | Consent of PricewaterhouseCoopers, LLP. | |||
| *31 | .1 | — | Certification of Chief Executive Officer pursuant to Rule 13a-14(a)/15d-14(a). | |||
| *31 | .2 | — | Certification of Chief Financial Officer pursuant to Rule 13a-14(a)/15d-14(a). | |||
| *32 | .1 | — | Certification of Chief Executive Officer Pursuant to Section 18 U.S.C. Section 1350, as Adopted Pursuant to Section 906 of the Sarbanes-Oxley Act of 2002. | |||
| *32 | .2 | — | Certification of Chief Financial Officer Pursuant to Section 18 U.S.C. Section 1350, as Adopted Pursuant to Section 906 of the Sarbanes-Oxley Act of 2002. | |||
| 3.2 | — | By-laws of Powell Industries, Inc. (filed as Exhibit 3.2 to our Form 8-A/A filed November 1, 2004, and incorporated herein by reference). |
| 3.3 | — | Amended and Restated By-laws of Powell Industries, Inc. (filed as Exhibit 3.1 to our Form 8-K filed October 12, 2012, and incorporated herein by reference). |
| 10.1 | — | Powell Industries, Inc., Incentive Compensation Plan (filed as Exhibit 10.1 to our Form 10-K for the fiscal year ended October 31, 2003, and incorporated herein by reference). |
| 10.2 | — | Description of Supplemental Executive Benefit Plan (filed as Exhibit 10 to our Form 10-K for the fiscal year ended October 31, 1984, and incorporated herein by reference). |
| 10.3 | — | 1992 Powell Industries, Inc. Stock Option Plan (filed as Exhibit 10.1 to our registration statement on Form S-8 filed on December 21, 2010, and incorporated herein by reference). |
| 10.4 | — | Amendment to 1992 Powell Industries, Inc. Stock Option Plan (filed as Exhibit 10.8 to our Form 10-Q for the quarter ended April 30, 1996, and incorporated herein by reference). |
| 10.5 | — | Amendment to 1992 Powell Industries, Inc. Stock Option Plan (the cover of the 1992 Powell Industries, Inc. Stock Option Plan has been noted to reflect the increase in the number of shares authorized for issuance under the Plan from 2,100,000 to 2,700,000, which increase was approved by the stockholders of the Company at the 2005 Annual Meeting of Stockholders). |
| 10.6 | — | Powell Industries, Inc. Directors’ Fees Program (filed as Exhibit 10.7 to our Form 10-K for the fiscal year ended October 31, 1992, and incorporated herein by reference). |
| 10.7 | — | Powell Industries, Inc. Executive Severance Protection Plan (filed as Exhibit 10.7 to our Form 10-K for the fiscal year ended October 31, 2002, and incorporated herein by reference). |
| 10.8 | — | Powell Industries, Inc. Non-Employee Directors Stock Option Plan (filed as Exhibit 10.9 to our Form 10-K for the fiscal year ended October 31, 2002, and incorporated herein by reference). |
| 10.9 | — | Powell Industries, Inc. Deferred Compensation Plan (filed as Exhibit 10.9 to our Form 10-K for the fiscal year ended October 31, 2002, and incorporated herein by reference). |
| 10.10 | — | Powell Industries, Inc. Non-Employee Director Restricted Stock Plan (filed as Exhibit 10.3 to our registration statement on Form S-8 filed on December 21, 2010, and incorporated herein by reference). |
| 10.11 | — | Amended Loan Agreement dated October 29, 2004, between Powell Industries, Inc. and Bank of America, N.A. (filed as Exhibit 10.10 to our Form 10-K for the fiscal year ended October 31, 2004, and incorporated herein by reference). |
| 10.12 | — | Credit and Reimbursement Agreement dated April 15, 2004, between Powell Industries, Inc. and Bank of America, N.A. (filed as Exhibit 10.11 to our Form 10-K for the fiscal year ended October 31, 2004, and incorporated herein by reference). |
| 10.13 | — | Credit Agreement dated June 29, 2005 among Powell Industries, Inc., Inhoco 3210 Limited and Switchgear & Instrumentation Properties Limited, and Bank of America and the other lenders parties thereto (filed as Exhibit 10.1 to our Form 8-K filed July 6, 2005, and incorporated herein by reference). |
| 10.14 | — | First Amendment to Credit Agreement dated November 7, 2005 among Powell Industries, Inc., Inhoco 3210 Limited (n/k/a Switchgear & Instrumentation Limited), Switchgear & Instrumentation Properties Limited, Bank of America, N.A., and the other lenders parties thereto (filed as Exhibit 10.14 to our Form 10-K for the fiscal year ended October 31, 2005, and incorporated herein by reference). |
| 10.15 | — | Second Amendment to Credit Agreement dated January 11, 2006 among Powell Industries, Inc., Switchgear & Instrumentation Limited, Switchgear & Instrumentation Properties Limited, Bank of America, N.A., and the other lenders parties thereto (filed as Exhibit 10.15 to our Form 10-K for the fiscal year ended October 31, 2005, and incorporated herein by reference). |
| 10.16 | — | Third Amendment to Credit Agreement dated August 4, 2006 among Powell Industries, Inc., Switchgear & Instrumentation Limited, Switchgear & Instrumentation Properties Limited, Bank of America, N.A., and the other lenders parties thereto (filed as Exhibit 10.3 to our Form 8-K filed August 9, 2006, and incorporated herein by reference). |
| 10.17 | — | Fourth Amendment to Credit Agreement dated December 7, 2006 among Powell Industries, Inc., Switchgear & Instrumentation Limited, Switchgear & Instrumentation Properties Limited, Bank of America, N.A., and the other lenders parties thereto (filed as Exhibit 10.17 to our Transition report on Form 10-K for the fiscal year ended September 30, 2006, and incorporated herein by reference). |
| 10.18 | — | Fifth Amendment to Credit Agreement, dated as of December 4, 2007, among Powell Industries, Inc., as Parent, the subsidiaries of Powell Industries, Inc. identified therein, as Borrowers, Bank of America, N.A., as Administrative Agent, Swing Line Lender and L/C Issuer, and the Lenders party thereto (filed as Exhibit 10.1 to our Quarterly Report on Form 10-Q for the quarter ended December 31, 2007, and incorporated herein by reference). |
| 10.19 | — | Sixth Amendment to Credit Agreement, dated as of December 14, 2007, among Powell Industries, Inc., as Parent, the subsidiaries of Powell Industries, Inc. identified therein, as Borrowers, Bank of America, N.A., as Administrative Agent, Swing Line Lender and L/C issuer, and the Lenders party thereto (filed as Exhibit 10.1 to our Form 8-K filed December 19, 2007, and incorporated herein by reference). |
| 10.20 | — | Banking facilities between HSBC Bank plc and Switchgear & Instrumentation Limited and Switchgear & Instrumentation Properties Limited dated September 12, 2005 (filed as Exhibit 10.16 to our Form 10-K for the fiscal year ended October 31, 2005, and incorporated herein by reference). |
**10.21 | — | Powell Supply Agreement between the Company and General Electric Company dated August 7, 2006 (filed as Exhibit 10.1 to our Form 8-K/A filed June 16, 2008, and incorporated herein by reference). |
| 10.22 | — | Lease Agreement between the Company and C&L Partnership, Ltd. dated April 19, 2006 (filed as Exhibit 10.2 to our Form 8-K filed August 9, 2006, and incorporated herein by reference). |
| 10.23 | — | Consulting Agreement dated July 18, 2008 between the Company and Thomas W. Powell (filed as Exhibit 10.1 to our Form 8-K filed July 24, 2008, and incorporated herein by reference). |
| 10.24 | — | Seventh Amendment to Credit Agreement, dated as of December 10, 2008, among Powell Industries, Inc., as Parent, the subsidiaries of Powell Industries, Inc. identified therein, as Borrowers, Bank of America, N.A., as Administrative Agent, Swing Line Lender and L/C issuer, and the Lenders party (filed as Exhibit 10.24 to our Form 10-K for the fiscal year ended September 30, 2008, and incorporated herein by reference). |
| 10.25 | — | Powell Industries, Inc. 2006 Equity Compensation Plan (filed as Exhibit 10.2 to our registration statement on Form S-8 filed on December 21, 2010, and incorporated herein by reference). |
| 10.26 | — | Credit Agreement dated as of December 15, 2009, between Powell PowerComm Inc., as Borrower, Powell Industries, Inc., Nextron Limited, PPC Technical Services Inc., as Guarantors, and HSBC Bank Canada, as Lender (filed as Exhibit 10.1 to our Form 8-K filed on December 21, 2009, and incorporated herein by reference). |
| 10.27 | — | Ninth Amendment to Credit Agreement, dated as of May 18, 2011, among Powell Industries, Inc., as Parent, the subsidiaries of Powell Industries, Inc. identified therein, as Borrowers, Bank of America, N.A., as Administrative Agent, Swing Line Lender and L/C issuer, and the Lenders party (filed as Exhibit 10.1 to our Form 8-K dated May 18, 2011, and incorporated herein by reference.) |
| 10.28 | — | Severance Agreement and Release dated as of October 7, 2011 between the Company and Patrick L. McDonald. |
| 10.29 | — | Employment Agreement dated as of May 8, 2012 between the Company and Don R. Madison (filed as Exhibit 10.1 to our Form 10-Q for the quarter ended March 31, 2012, and incorporated herein by reference). |
| 10.30 | — | Employment Agreement dated as of May 8, 2012 between the Company and Milburn E. Honeycutt (filed as Exhibit 10.2 to our Form 10-Q for the quarter ended March 31, 2012, and incorporated herein by reference). |
| 10.31 | — | Tenth Amendment to Credit Agreement, dated as of March 26, 2012, among Powell Industries, Inc., as Parent, the subsidiaries of Powell Industries, Inc. identified herein, as Borrowers, Bank of America, N.A., as Administrative Agent, Swing Line Lender and L/C issuer, and the Lenders party (filed as Exhibit 10.3 to our Form 10-Q for the quarter ended March 31, 2012, and incorporated herein by reference). |
| 10.32 | — | Amended and Restated Credit Agreement dated as of April 26, 2012, between Powell PowerComm Inc., as Borrower, Powell Industries, Inc., Nextron Limited, PPC Technical Services Inc., as Guarantors, and HSBC Bank Canada, as Lender (filed as Exhibit 10.4 to our Form 10-Q for the quarter ended March 31, 2012, and incorporated herein by reference). |
| 10.33 | — | Employment Agreement dated as of August 20, 2012, between the Company and Michael A. Lucas (filed as Exhibit 10.1 to our Form 8-K dated August 9, 2012, and incorporated herein by reference). |
*21.1 | — | Subsidiaries of Powell Industries, Inc. |
*23.2 | �� | Consent of PricewaterhouseCoopers LLP. |
*31.1 | — | Certification of Chief Executive Officer pursuant to Rule 13a-14(a)/15d-14(a). |
*31.2 | — | Certification of Chief Financial Officer pursuant to Rule 13a-14(a)/15d-14(a). |
*32.1 | — | Certification of Chief Executive Officer Pursuant to Section 18 U.S.C. Section 1350, as Adopted Pursuant to Section 906 of the Sarbanes-Oxley Act of 2002. |
*32.2 | — | Certification of Chief Financial Officer Pursuant to Section 18 U.S.C. Section 1350, as Adopted Pursuant to Section 906 of the Sarbanes-Oxley Act of 2002. |
101.INS | — | XBRL Instance Document |
101.SCH | — | XBRL Taxonomy Extension Schema Document |
101.CAL | — | XBRL Taxonomy Extension Calculation Linkbase Document |
101.DEF | — | XBRL Taxonomy Extension Definition Linkbase Document |
101.LAB | — | XBRL Taxonomy Extension Label Linkbase Document |
101.PRE | — | XBRL Taxonomy Extension Presentation Linkbase Document |
59
60
____________
* | Filed herewith |
** | Portions of this exhibit have been omitted based on a request for confidential treatment pursuant toRule 24b-2 of the Securities Exchange Act of 1934. Such omitted portions have been filed separately with the Commission. |
68
61