UNITED STATES
SECURITIES AND EXCHANGE COMMISSION
Washington, D.C. 20549
Form 10-K
| ý | ANNUAL REPORT PURSUANT TO SECTION 13 OR 15(d) OF THE SECURITIES EXCHANGE ACT OF 1934 | ||
For the fiscal year ended December 31, 2011
or
| ¨ | TRANSITION REPORT PURSUANT TO SECTION 13 OR 15(d) OF THE SECURITIES EXCHANGE ACT OF 1934 | ||
For the transition period from to
Commission filenumber: 1-4717
KANSAS CITY SOUTHERN
(Exact name of registrant as specified in its charter)
Delaware (State or other jurisdiction of incorporation or organization) |  | 44-0663509 (I.R.S. Employer Identification No.) | ||
427 West 12th Street, Kansas City, Missouri | 64105 | |||
| (Address of principal executive offices) |  | (Zip Code) | ||
816.983.1303
(Registrant’s telephone number, including area code)
None
(Former name, former address and former fiscal year, if changed since last report)
Securities registered pursuant to Section 12(b) of the Act:
| Title of Each Class | Name of Each Exchange on Which Registered | |||
| Preferred Stock, Par Value $25 Per Share, 4%, Noncumulative | New York Stock Exchange | |||
| Common Stock, $.01 Per Share Par Value | New York Stock Exchange | |||
Securities registered pursuant to Section 12(g) of the Act:
None
Indicate by check mark if the registrant is a well-known seasoned issuer, as defined in Rule 405 of the Securities Act. Yes þý No o¨
Indicate by check mark if the registrant is not required to file reports pursuant to Section 13 or Section 15(d) of the Exchange Act. Yes o¨ No þý
Indicate by check mark whether the registrant (1) has filed all reports required to be filed by Section 13 or 15(d) of the Securities Exchange Act of 1934 during the preceding 12 months (or for such shorter period that the registrant was required to file such reports), and (2) has been subject to such filing requirements for the past 90 days. Yes þý No o¨
Indicate by check mark whether the registrant has submitted electronically and posted on its corporate Web site, if any, every Interactive Data File required to be submitted and posted pursuant to Rule 405 ofRegulation S-T during the preceding 12 months (or for such shorter period that the registrant was required to submit and post such files). Yes oý No o¨
Indicate by check mark if disclosure of delinquent filers pursuant to Item 405 ofRegulation S-K is not contained herein, and will not be contained, to the best of registrant’s knowledge, in definitive proxy or information statements incorporated by reference in Part III of thisForm 10-K or any amendment to thisForm 10-K. o¨
Indicate by check mark whether the registrant is a large accelerated filer, an accelerated filer, a non-accelerated filer, or a smaller reporting company. See the definitions of “large accelerated filer,” “accelerated filer” and “smaller reporting company” inRule 12b-2 of the Exchange Act. (Check one):
Large accelerated filer | Accelerated filer o | Non-accelerated filer o | Smaller reporting company o | |
| (Do not check if a smaller reporting company) | ||||
Indicate by check mark whether the registrant is a shell company (as defined inRule 12b-2 of the Exchange Act). Yes o¨ No þý
The aggregate market value of common stock held by non-affiliates of the registrant was $1.49$6.40 billion at June 30, 2009.2011. There were 96,519,854109,934,820 shares of $.01 par common stock outstanding at February 4, 2010.1, 2012.
DOCUMENTS INCORPORATED BY REFERENCE
Kansas City Southern’s Definitive Proxy Statement for the 20102012 Annual Meeting of Stockholders which will be filed no later than 120 days after December 31, 2009,2011, is incorporated by reference in Parts I and III.
KANSAS CITY SOUTHERN
2011 FORM 10-K ANNUAL REPORT
2
| Item 1. | Business |
COMPANY OVERVIEW
Kansas City Southern, a Delaware corporation, is a holding company with domestic and international rail operations in North America that are strategically focused on the growing north/south freight corridor connecting key commercial and industrial markets in the central United States with major industrial cities in Mexico. As used herein, “KCS” or the “Company” may refer to Kansas City Southern or, as the context requires, to one or more subsidiaries of Kansas City Southern. KCS and its subsidiaries had approximately 6,1006,140 employees on December 31, 2009. 2011.
The Kansas City Southern Railway Company (“KCSR”), which was founded in 1887, is a U.S. Class I railroad. KCSR serves a ten-state region in the midwest and southeast regions of the United States and has the shortest north/south rail route between Kansas City, Missouri and several key ports along the Gulf of Mexico in Alabama, Louisiana, Mississippi, and Texas.
KCS controls and owns all of the stock of Kansas City Southern de México, S.A. de C.V. (“KCSM”). KCS previously owned this stock throughThrough its wholly-owned subsidiary, Grupo KCSM, S.A. de C.V. (“Grupo KCSM”), formerly known as Grupo Transportación Ferroviaria Mexicana, S.A. de C.V., or Grupo TFM. Effective May 8, 2007, Grupo KCSM was merged into KCSM. Through its50-year concession from the Mexican government (the “Concession”), which could expire in 2047 unless extended, KCSM operates a key commercial corridor of the Mexican railroad system and has as its core route the most strategic portion of the shortest, most direct rail passageway between Mexico City and Laredo, Texas. KCSM serves most of Mexico’s principal industrial cities and three of its major seaports. KCSM’s rail lines provide exclusive rail access to the United States and Mexico border crossing at Nuevo Laredo, Tamaulipas, the largest rail freight interchange point between the United States and Mexico. Under the Concession, KCSM has the right to control and operate the southern half of the rail bridge at Laredo, Texas, which spans the Rio Grande River between the United States and Mexico.
KCSM provides exclusive rail access to the Port of Lazaro Cardenas on the Pacific Ocean. The Mexican government is developing the port at Lazaro Cardenas principally to serve Mexican markets and as an alternative to the congested U.S. west coast ports of Long Beach and Los Angeles.ports. KCSM is the sole provider of rail service to this port, which provides an alternate route for Asian and South American traffic bound for the eastern, southern and midwestern United States. Traffic at Lazaro Cardenas is both domestic and import traffic, consisting of intermodal containers, minerals, iron, steel slabs, wire rods, and fertilizers.
North America.
The Company wholly owns directly and indirectly through its wholly-owned subsidiaries, Mexrail, Inc. (“Mexrail”) which, in turn, wholly owns The Texas Mexican Railway Company (“Tex-Mex”). Tex-Mex owns a157-mile rail line extending from Laredo, Texas to the port city of Corpus Christi, Texas, which connects the operations of KCSR with KCSM. Through its ownership of Mexrail, the Company owns the northern half of the rail bridge at Laredo, Texas. Laredo is a principal international gateway through which more than half of all rail and truck traffic between the United States and Mexico crosses the border. The Company also controls the southern half of this bridge through its ownership of KCSM.
The KCS coordinated rail network (KCSR, KCSM and Tex-Mex) comprises approximately 6,0006,200 route miles of main and branch lines extending from the midwest and southeast portions of the United States south into Mexico and connects with all other Class I railroads, providing shippers with an effective alternative to other railroad routes and giving direct access to Mexico and the southeast and southwest United States through less congestedalternate interchange hubs.
Panama Canal Railway Company (“PCRC”), an unconsolidated joint venture company owned equally by KCS andMi-Jack Products, Inc. (“Mi-Jack”), was awarded a concession from the Republic of Panama to reconstruct and operate the Panama Canal Railway, a47-mile railroad located adjacent to the Panama Canal that provides international container shipping companies with a railway transportation option in lieu of the Panama Canal. The concession was awarded in 1998 for an initial term of 25 years with an automatic renewal for an additional 25 year term. The Panama Canal Railway is a north-south railroad traversing the Isthmus of Panama between the Atlantic and Pacific Oceans. PCRC’s wholly-owned subsidiary, Panarail Tourism
3
Company (“Panarail”), operates and promotes commuter and tourist passenger service over the Panama Canal Railway.
Other subsidiaries and affiliates of KCS include the following:
Meridian Speedway, LLC (“MSLLC”), a seventy-one percent-owned consolidated affiliate that owns the former KCSR rail line between Meridian, Mississippi and Shreveport, Louisiana, which is the portion of the KCSR rail line between Dallas, Texas and Meridian known as the “Meridian Speedway.” Norfolk Southern Corporation (“NS”) through its wholly-owned subsidiary, The Alabama Great Southern Railroad Company, owns the remaining twenty-nine percent of MSLLC. Ultimately KCS will own seventy percent and NS will own thirty percent of MSLLC upon the contribution of additional capital by NS to MSLLC;
3
Pabtex, Inc., a wholly-owned and consolidated owner of a bulk materials handling facility with deep-water access to the Gulf of Mexico at Port Arthur, Texas that stores and transfers petroleum coke from rail cars to ships, primarily for export;
Trans-Serve, Inc. (doing business as Superior Tie and Timber), a wholly-owned and consolidated operator of a railroad wood-tie treatment facility;
TransFin Insurance, Ltd., a wholly-owned and consolidated captive insurance company providing property, general liability and certain other insurance coverage to KCS and its subsidiaries and affiliates;
Southern Capital Corporation, LLC (“Southern Capital”), a fifty percent-owned unconsolidated affiliate that leases locomotives and other equipment;
Ferrocarril y Terminal del Valle de México, S.A. de C.V. (“FTVM”), a twenty-five percent-owned unconsolidated affiliate that provides railroad services as well as ancillary services in the greater Mexico City area; and
PTC-220, LLC (“PTC-220”), a fourteen percent-owned unconsolidated affiliate that holds the licenses to large blocks of radio spectrum and other assets for the deployment of positive train control.
MARKETS SERVED
2011 Revenues Business Mix | |||
Chemical and petroleum. This sector includes products such as petroleum, rubber, plastics and miscellaneous chemicals. KCS transports these products to markets in the midwest, southeast and northeast United States and throughout Mexico through interchanges with other rail carriers. The products within the chemicals and plastics channels are used in the automotive, housing and packaging industries as well as in the production of other chemicals |  | ||
| and plastic products. KCS hauls petroleum products across its network and as petroleum refineries have continued to increase their refining capacity, they have coordinated with KCS to develop additional long-term storage opportunities which complement a fluid freight railroad operation. | 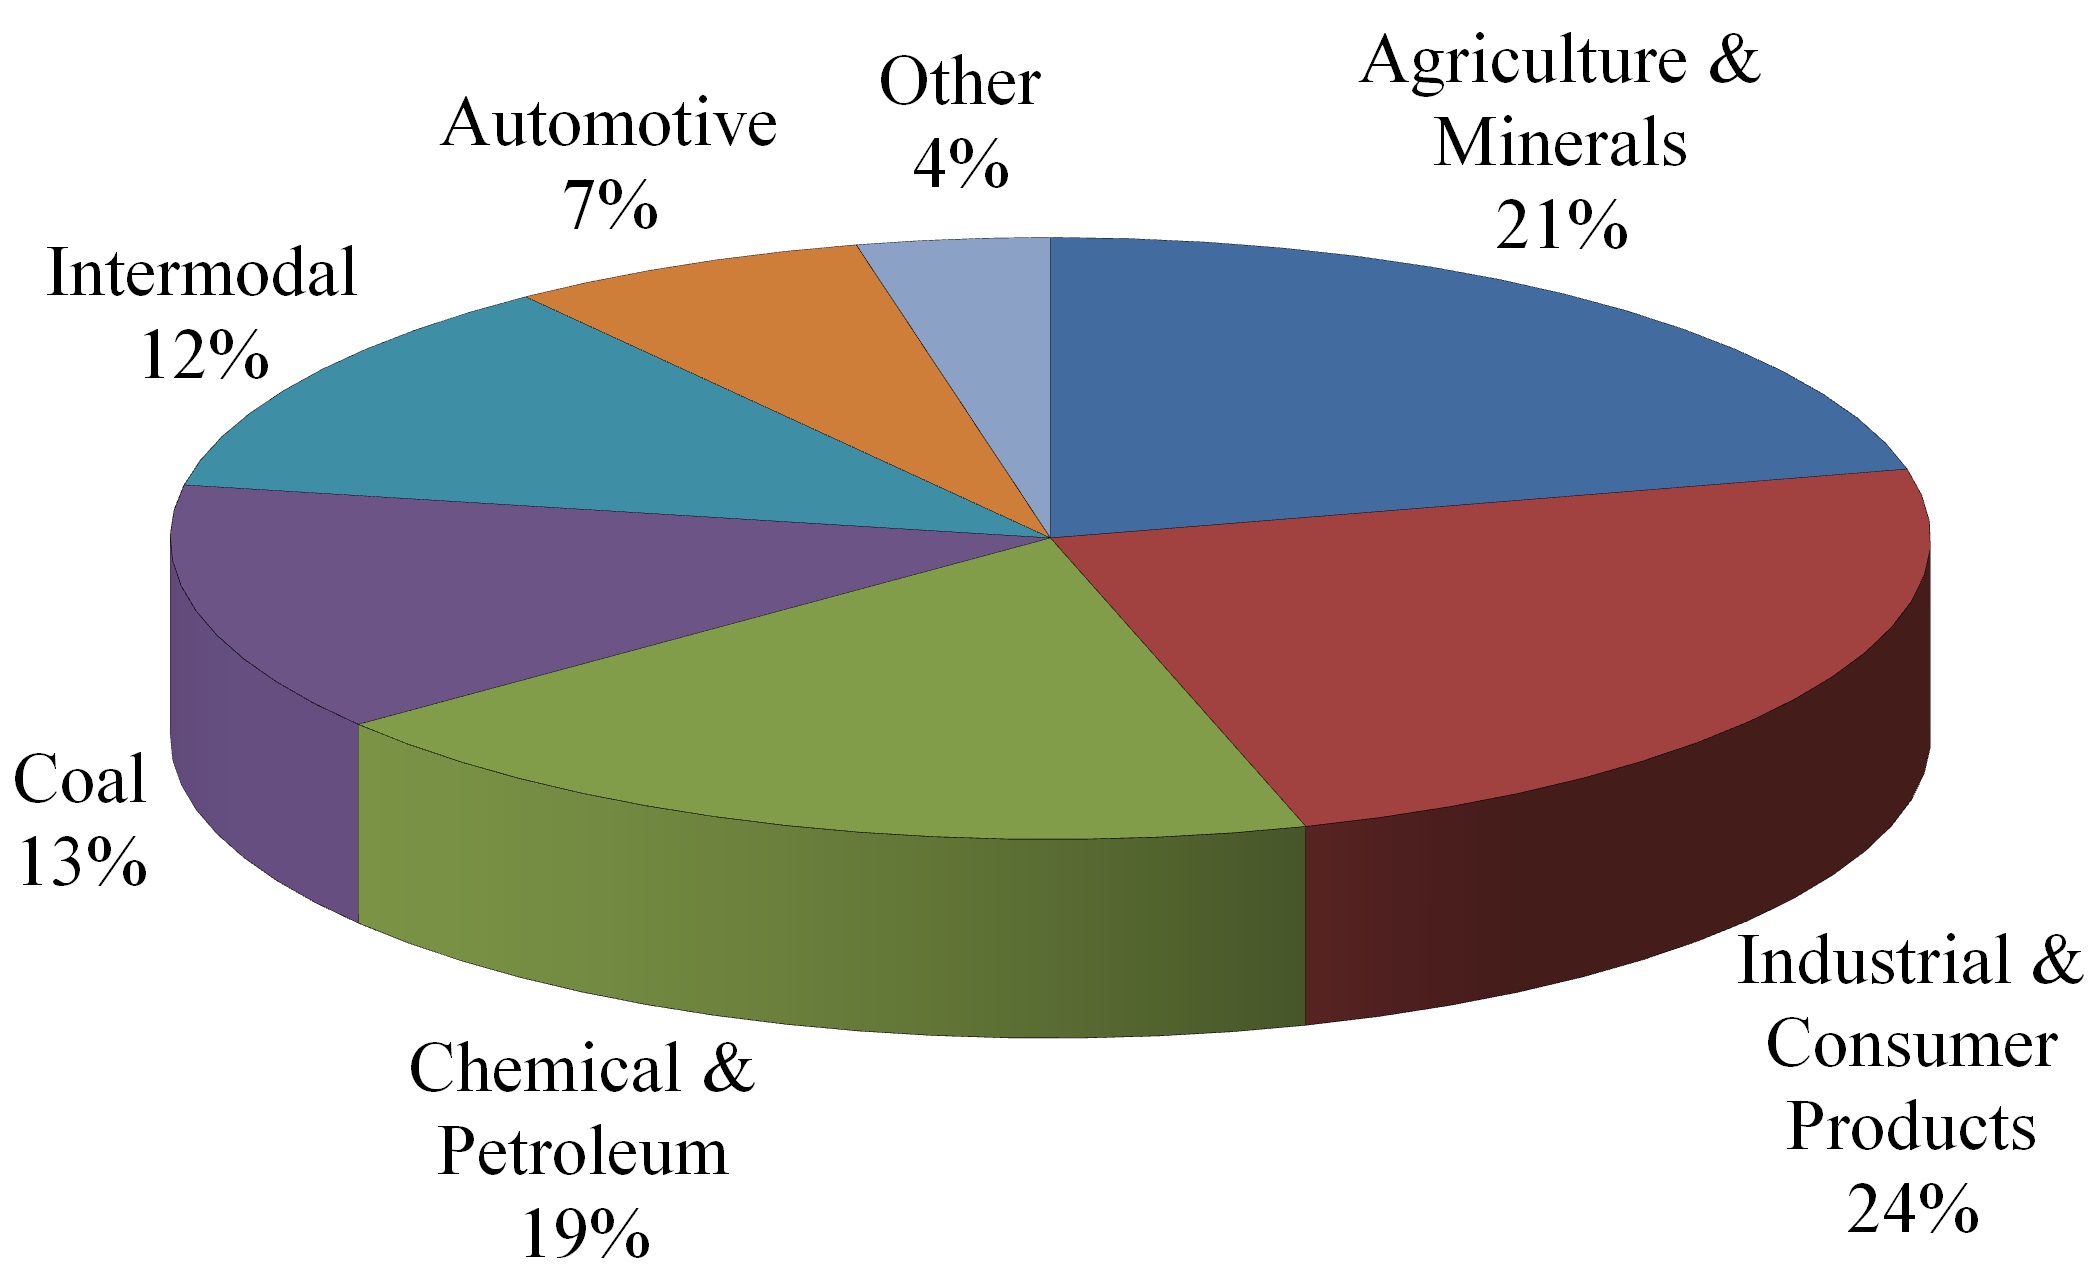 | ||
Industrial and consumer products. KCS’ KCS serves paper mills directly and indirectly through its various short-line connections. KCS’s rail lines run through the heart of the southeast United States timber-producing region. The Company believes that forestForest products made from trees in this region are generally less expensive than those from other regions due to lower production costs. As a result, southern yellow pine products from the southeast are increasingly being used at the expenseinstead of western producers that have experienced capacity reductions because of environmental and public policy considerations. KCS serves paper mills directly and indirectly through its various short-line connections.
This sector also includes metals and ores such as iron, steel, zinc and copper. The majority of metals, minerals and ores mined, and steel produced in Mexico are consumed within Mexico. The volume of Mexican steel exports fluctuates based on global market prices. Higher-end finished products such as steel coils are used by Mexican manufacturers in automobiles, household appliances and other consumer goods which are imported to the United States through Nuevo Laredo and through the seaports served by KCS’KCS’s rail network. KCS also transports steel coils from U.S. based mini-mills in Mississippi and Alabama to Texas and Mexico for appliance and automotive applications.
4
Agriculture and minerals. The agriculture and minerals sector consists primarily of grain and food products. Shipper demand for agriculture products is affected by competition among sources of grain and grain products, as well as price fluctuations in international markets for key commodities. In the United States, KCS’KCS’s rail lines receive and originate shipments of grain and grain products for delivery to feed mills serving the poultry industry. KCS currently serves feed mills along its rail lines throughout the midwest and southeast United States, and through its marketing agreements, KCS has access to sources of
4
corn and other grain in the Midwest. United States export grain shipments and Mexico import grain shipments include primarily corn, wheat, and soybeans transported to Mexico via Laredo and to the Gulf of Mexico for overseas destinations.Mexico. Over the long term, export grain shipments to Mexico are expected to increase as a result of Mexico’s reliance on grain imports and KCS’KCS’s coordinated rail network is well positioned to meet these increases in demand. Food products consistsconsist mainly of soybean meal, grain meal, oils, canned goods, corn syrup and sugar. Other shipments consist of a variety of products including ores, minerals, clay and glass used across North America.
Coal. KCS hauls unit trains (trains transporting a single commodity from one source to one destination) of coal for nine electric generating plants in the central United States. The coal originates from the Powder River Basin in Wyoming and is interchanged to KCS at Kansas City, Missouri. Coal mined in the midwest United States is transported in non-unit trains to industrial consumers such as paper mills, steel mills, and cement companies. Petroleum coke is also included in the coal sector, which KCS transports from refineries in the United States to cement companies in Mexico as well as to vessels for international distribution through the Pabtex export terminal located in Port Arthur, Texas.
Intermodal. The intermodal freight business consists primarily of hauling freight containers or truck trailers on behalf of steamship lines, motor carriers, and intermodal marketing companies with rail carriers serving as long-distance haulers. KCS serves and supports the U.S. and Mexican markets, as well as cross border traffic between the U.S. and Mexico. In light of the importance of trade between Asia and North America, the Company believes the Port of Lazaro Cardenas continues to be a strategically beneficial location for ocean carriers, manufacturers and retailers. The Asia/Mexico commerce is handled through the Port of Lazaro Cardenas in conjunction with cross border movement on the single coordinated rail network into markets in the U.S. The Company also provides premium service to customers over its line from Dallas through the Meridian Speedway — a critical link in creating the most direct transcontinental lineroute between the southwest and southeastsoutheast/northeast U.S.
Automotive. KCS provides rail transportation to every facet of the automotive industry supply chain, including automotive manufacturers, assembly plants and distribution centers throughout North America. Several U.S. automakers have moved assembly plants into central Mexico to take advantage of access to lower costs, which has driven a shift in production and distribution patterns from the U.S. to Mexico. In addition, KCS transports finished vehicles imported and exported to and from Asia through a distribution facility at the Port of Lazaro Cardenas. As the automotive industry shifts production and distribution patterns, KCS is poised to serve as a key partner with the automakers, with the technology and rail network to quickly adapt to the automotive industry’s evolving transportation requirements.
GOVERNMENT REGULATION
The Company’s United States operations are subject to federal, state and local laws and regulations generally applicable to all businesses. Rail operations are also subject to the regulatory jurisdiction of the Surface Transportation Board (“STB”) of the U.S. Department of Transportation (“DOT”), the Federal Railroad Administration of the DOT, the Occupational Safety and Health Administration (“OSHA”), as well as other federal and state regulatory agencies. The STB has jurisdiction over disputes and complaints involving certain rates, routes and services, the sale or abandonment of rail lines, applications for line extensions and construction, and consolidation or merger with, or acquisition of control of, rail common carriers. DOT and OSHA each has jurisdiction under several federal statutes over a number of safety and health aspects of rail operations, including the transportation of hazardous materials. In the fourth quarter of 2008, the President of the United States signed the Rail Safety Improvement Act of 2008 into law, which, among other things, revises hours of service rules for train and certain other railroad employees and mandates implementation of positive train control (aat certain locations by the end of 2015. Positive train control is a technology designed to help preventtrain-to-train collisions, overspeed derailments, incursions into rail work zones, and entry into main line track if a switch is misaligned)misaligned at certain locations, (includingincluding main
5
line track where toxic inhalation hazard or poison inhalation hazard movements occur or where passenger operations occur) byoccur. In addition, the endRail Safety Improvement Act of 2015,2008 addresses safety at rail crossings, increases the number of safety related employees of the Federal Railroad Administration, and increases fines that may be levied against railroads for safety violations. State agencies regulate some aspects of rail operations with respect to health and safety in areas not otherwise regulated by federal law.
Primary regulatory jurisdiction for the Company’s Mexican operations is overseen by the Mexican Secretaría de Comunicaciones y Transportes (“Secretary of Communications and Transportation (“SCT”Transportation” or “SCT”). The SCT establishes
5
regulations concerning railway safety and operations, and is responsible for resolving disputes between railways and between railways and customers. In addition, KCSM must register its maximum rates with the SCT and make regular reports to the SCT on investment and traffic volumes. See Note 1 to the Consolidated Financial Statements in Item 8 of thisForm 10-K “Description of the Business —The KCSM Concession.”
The Mexican operations are subject to Mexican federal and state laws and regulations relating to the protection of the environment through the establishment of standards for water discharge, water supply, emissions, noise pollution, hazardous substances and transportation and handling of hazardous and solid waste. The Mexican government may bring administrative and criminal proceedings and impose economic sanctions against companies that violate environmental laws, and temporarily or even permanently close non-complying facilities.
Noncompliance with applicable legal provisions may result in the imposition of fines, temporary or permanent shutdown of operations or other injunctive relief, criminal prosecution or the termination of the Concession. KCS believes that facilities which it operates are in substantial compliance with applicable environmental laws, regulations and agency agreements. KCS maintains environmental reservesprovisions which are believed by management to be appropriate with respect to known and existing environmental contamination of its properties which KCS may be responsible to remedy. In addition, KCS’s subsidiaries are party to contracts and other legally binding obligations by which previous owners of certain facilities now owned by KCS are responsible to remedy contamination of such sites remaining from their previous ownership. There are currently no material legal or administrative proceedings pending against the Company with respect to any environmental matters and management does not believe that continued compliance with environmental laws will have any material adverse effect on the Company’s consolidated financial condition.statements. KCS cannot predict the effect, if any, that unidentified environmental matters or the adoption of additional or more stringent environmental laws and regulations would have on the Company’s results of operations, cash flows orconsolidated financial condition.statements.
COMPETITION
The Company competes against other railroads, many of which are much larger and have significantly greater financial and other resources. The railroad industry is dominated by a few very large carriers. The larger western railroads (BNSF Railway Company and Union Pacific Railroad Company), in particular, are significant competitors of KCS because of their substantial resources and competitive routes.
In November 2005, Ferrocarril Mexicano, S.A. de C.V. (“Ferromex”) acquired control of and merged with Ferrosur S.A. de C.V. (“Ferrosur”). In March 2011, the Comisión Federal de Competencia (Mexican Antitrust Commission or “COFECO”) approved the merger between Ferromex and Ferrosur. These merged operations are much larger than KCSM, serving most of the major ports and cities in Mexico and together own fifty percent of FTVM, which serves industries located within Mexico City.
The ongoing impact of past and future rail consolidation is uncertain. However, KCS believes that its investments and strategic alliances continue to competitively position the Company to attract additional rail traffic throughout its rail network.
6
The Company is subject to competition from motor carriers, barge lines and other maritime shipping, which compete across certain routes in KCS’KCS’s operating areas. In the past, truck carriers have generally eroded the railroad industry’s share of total transportation revenues. Intermodal traffic and certain other traffic face highly price sensitive competition, particularly from motor carriers. However, rail carriers, including KCS, have placed an emphasis on competing in the intermodal marketplace and working with motor carriers to provideend-to-end transportation of products.
While deregulation of U.S. freight rates has enhanced the ability of railroads to compete with each other and with alternative modes of transportation, this increased competition has generally resulted in downward pressure on freight rates.rates since deregulation. Competition with other railroads and other modes of transportation is generally based on the rates charged, the quality and reliability of the service provided and the quality of the carrier’s equipment for certain commodities.
RAIL SECURITY
6
efforts the Company has made to safeguard against terrorism and other security incidents, the following paragraphs will provide only a general overview of some of these efforts. KCSR and KCSM utilize a security plan based on an industry wide security plan developed by Association of American Railroads (“AAR”) members which focuses on comprehensive risk assessments in five areas — hazardous materials; train operations; critical physical assets; military traffic; and information technology and communications. The security plan is kept confidential, with access to the plan tightly limited to members of management with direct security and anti-terrorism implementation responsibilities. KCSR and KCSM participate with other AAR members in periodic drills under the industry plan to test and refine its various provisions.
The Company’s security activities range from periodically mailing each employee a security awareness brochure (which is also posted under the “Employees” tab on the Company’s internet website, www.kcsouthern.com) to its ongoing implementation of security plans for rail facilities in areas labeled by the DHS as High Threat Urban Areas (“HTUAs”). The Company’s other activities to bolster security against terrorism include, but are not limited to, the following:
Conferring regularly with other railroads’ security personnel and with industry experts on security issues;
Routing shipments of certain chemicals, which might be toxic if inhaled, pursuant to federal regulations;
Initiating a series of over 20 voluntary action items agreed to between AAR and DHS as enhancing security in the rail industry;
Conducting constant security training as part of the scheduled training for operating employees and managers;
Developing a multi-layered security model using high-speed digital imaging, system velocity, covert and overt security filters to mitigate the risk of illicit activity; and
Implementation of a Tactical Intelligence Center by KCSM, training core members in new technology helping to prevent, detect, deter and respond to illicit activities.
In addition, the Company employs a Director of Homeland Security to oversee the ongoing and increasingly complex security efforts of the Company in both the United States and Mexico. The Company identified and retained an individual to fill the position who has an extensive law enforcement background, including being formerly employed as an analyst with the Federal Bureau of Investigation (“FBI”) for 12 years. This member of management remains a member of the FBI’s Joint Terrorism Task Force and is a valuable asset to the Company in developing and implementing anti-terrorism and other security initiatives.
While the risk of theft and vandalism is higher in Mexico, KCSM remains among the safest methods of transportation for freight shipments in Mexico. KCSM’s record in rail safety is due in large part to the implementation of a multi-layered, safety and security process throughout the KCSM network. In addition to having its own internal system, the process is connected to, and supported by a high level of federal, state and local law enforcement. A primary focus of this effort involves maintaining train velocity, which reduces the likelihood for incidents to occur.
RAILWAY LABOR RELATIONS
ACT
Labor relations in the U.S. railroad industry are subject to extensive governmental regulation under the Railway Labor Act (“RLA”). Under the RLA, national labor agreements are renegotiated on an industry-wide scale when they become open for modification, but their terms remain in effect until new agreements are reached or the RLA’s procedures (which include mediation, cooling-off periods, and the possibility of presidential intervention) are exhausted. Contract negotiations with the various unions generally take place over an extended period of time and the Company rarely experiences work stoppages during negotiations. Wages, health and welfare benefits, work rules and other issues have traditionally been addressed during these negotiations.
COLLECTIVE BARGAINING
Approximately 80% of KCSR employees are covered by various collective bargaining agreements. KCSR participates in industry-wide bargaining as a member of the National Carriers’ Conference Committee. A negotiating process for new, major collective bargaining agreements covering all of KCSR’s union employees has been underway since the bargaining round was initiated in November of 2009. Long termLong-term settlement agreements were reached during 2007 and 2008 covering all of KCSR’sKCSR's unionized work force through January 1,June 30, 2010. The union labor negotiation hasThese agreements continue in effect until new agreements are reached. Labor negotiations in the rail industry are governed by the RLA, which bars strikes or other self-help until exhaustion of mandatory procedures. Contract negotiations with the various unions generally take place over an extended period of time and have not historically resulted in any strike, boycott, or other disruption in the Company’s business operations.
7
The Company doesnation's largest freight railroads, including KCSR, have been in national (multi-employer) bargaining with the rail unions since January 2010. In September 2011, the railroads ratified the agreement with the largest union, the United Transportation Union, which represents about one third of the KCSR employees covered by this bargaining agreement. On November 5, 2011, a Presidential Emergency Board (“PEB”) appointed by President Obama issued recommendations to resolve the disputes between the U.S. railroads and the 12 unions that had not believeyet reached agreements. As of December 31, 2011, tentative agreements were reached with 11 of those 12 unions. As of the expected settlementsdate of this filing, these agreements have been ratified and will havebe in effect through 2015.
On February 2, 2012, the railroad industry reached a material impact totentative agreement with the consolidated financial statements.remaining union. The union will commence ratification of this tentative agreement by its members.
KCSM union employees are covered by one labor agreement, which was signed on June 23, 1997, between KCSM and theSindicato de Trabajadores Ferrocarrileros de la República Mexicana (Mexican Railroad Union), for a term of 50 years, for the purpose of regulating the relationship between the parties and improving conditions for the union employees.parties. Approximately 80% of KCSM employees are covered by this labor agreement. The compensation terms under this labor agreement are subject to renegotiation on an annual basis and all other termsbenefits are subject to negotiation every two years. In June of 2009, the negotiation of theOctober 2011, compensation terms and all other benefits was started withcovering the period from July 1, 2011 through June 30, 2012 and the period from July 1, 2011 through June 30, 2013, respectively, were finalized between KCSM and the Mexican Railroad Union. The union labor negotiation with the Mexican Railroad Union has not historically resulted in any strike, boycott, or other disruption in KCSM’s business operations.
EXECUTIVE OFFICERS OF KCS AND SUBSIDIARIES
All executive officers are elected annually and serve at the discretion of the Board of Directors. All of the executive officers have employment agreements with KCS and/or its subsidiaries. The mailing address of the principal executive officers other than Mr. Zozaya is 427 W. 12th Street, Kansas City, Missouri 64105. Mr. Zozaya’s mailing address is Montes Urales No. 625, Col. Lomas de Chapultepec, C.P. 11000, Mexico D.F.
Michael R. Haverty — Executive Chairman of the Board — 67 — Served in this capacity since August 1, 2010. Mr. Haverty has been a director of KCS since May 1995 and has served as Chairman of the Board of KCS since January 1, 2001. From July 12, 2000 until July 31, 2010, Mr. Haverty served as Chief Executive Officer of KCS. Mr. Haverty served as President of KCS from July 2000 to June 2006. Mr. Haverty served as Executive Vice President of KCS from May 1995 until July 2000, and as President and Chief Executive Officer of KCSR from 1995 to 2005 and as a director of KCSR since 1995. He has served as Chairman of the Board of KCSR since 1999. Since April 1, 2005, Mr. Haverty has served as Chairman of the Board of KCSM. Mr. Haverty has served as a director of the PCRC since 1996 and as Co-Chairman of the Board of Directors of that company since 1999. Mr. Haverty has served as Co-Chairman of Panarail since 2000.
David L. Starling — President and Chief Executive Officer — 62 — Served in this capacity since August 1, 2010. Mr. Starling has been a director of KCS since May 6, 2010. He served as President and Chief Operating Officer of KCS from July 1, 2008 through August 1, 2010. Mr. Starling has also served as a Director, President and Chief Executive Officer of KCSR since July 1, 2008. He has also served as Vice Chairman of the Board of Directors of KCSM does not believesince September 2009. Mr. Starling has served as Vice Chairman of the expected settlements will have a material impactBoard of Directors of PCRC and Panarail since July 2008. Prior to joining KCS, Mr. Starling served as President and Director General of PCRC from 1999 through June 2008.
David R. Ebbrecht — Executive Vice President Operations - 45 - Served in this capacity since March 2011. Mr. Ebbrecht served as Senior Vice President of Operations of KCSR from August 2009 until March 2011. He served as Vice President of Transportation of KCSR from March 2008 until August 2009. From January 2007 until March 2008, Mr. Ebbrecht served as Assistant Vice President in various departments for KCSR including logistics, business development and operations. He joined KCSR in January 2001. Prior to joining KCSR, Mr. Ebbrecht served in various leadership positions at CSX Corporation, Inc.
Warren K. Erdman — Executive Vice President — Administration and Corporate Affairs — 53 — Served in this capacity since April 2010. Mr. Erdman served as Executive Vice President — Corporate Affairs from October 2007 until April 2010. He served as Senior Vice President — Corporate Affairs of KCS and KCSR from January 2006 to September 2007. Mr. Erdman served as Vice President — Corporate Affairs of KCS from April 15, 1997 to December 31, 2005 and as Vice President — Corporate Affairs of KCSR from May 1997 to December 31, 2005. Prior to joining KCS, Mr. Erdman served as Chief of Staff to United States Senator Kit Bond of Missouri from 1987 to 1997.
8
Patrick J. Ottensmeyer — Executive Vice President Sales and Marketing — 54 — Served in this capacity since October 16, 2008. Mr. Ottensmeyer joined KCS in May 2006 as Executive Vice President and Chief Financial Officer. Prior to joining KCS, Mr. Ottensmeyer served as Chief Financial Officer of Intranasal Therapeutics, Inc. from 2001 to May 2006. From 2000 to 2001, he served as Corporate Vice President Finance and Treasurer for Dade-Behring Holdings, Inc. From 1993 to 1999, Mr. Ottensmeyer served as Vice President Finance and Treasurer at Burlington Northern Santa Fe Corporation and BNSF Railway and their predecessor companies.
Michael W. Upchurch — Executive Vice President and Chief Financial Officer — 51 — Served in this capacity since October 16, 2008. Mr. Upchurch joined KCS in March 2008 as Senior Vice President Purchasing and Financial Management. Prior to joining KCS, Mr. Upchurch served as Senior Vice President Finance of Red Development LLC, from December 2007 through February 2008. From September 2006 through December 2007, Mr. Upchurch worked as an independent consultant providing financial consulting services. From 1990 through September 2006, Mr. Upchurch served in various senior financial leadership positions at Sprint Nextel Corporation and its predecessor, Sprint Corporation, including Senior Vice President Financial Operations, Senior Vice President Finance Sprint Business Solutions and Senior Vice President Finance Long Distance Division.
José Guillermo Zozaya Delano — President and Executive Representative — KCSM — 59 — Has served in this position since April 20, 2006. Mr. Zozaya has 35 years of experience in law and government relations, most recently as the legal and government relations director for ExxonMobil México, S.A. de C.V., where he spent nine years prior to joining KCSM.
John E. Derry — Senior Vice President Human Resources — 44 — Served in this capacity since July 2008. He served as Vice President of Human Resources from February 2008 until July 2008. Mr. Derry joined KCS from YRC Worldwide, Inc. where he served in various Human Resource functions from January 2004 to February 2008. From September 2006 to February 2008, Mr. Derry served as Vice President of Human Resources for Yellow Transportation. Prior to joining YRC Worldwide, Inc. Mr. Derry spent 17 years with General Mills Inc. in various operations, labor relations and human resource roles.
Mary K. Stadler — Senior Vice President and Chief Accounting Officer — 52 — Served in this capacity since March 2, 2009. From April 1990 through August 2008, Ms. Stadler served in various finance leadership positions at Sprint Nextel Corporation and its predecessor, Sprint Corporation, including Vice President — Finance Operations and most recently served as its Vice President — Assistant Controller.
William J. Wochner — Senior Vice President and Chief Legal Officer — 64 — Served in this capacity since February 2007. He served as Vice President and Interim General Counsel from December 2006 to January 2007. From September 2006 to December 2006, Mr. Wochner served as Vice President and Associate General Counsel. From March 2005 to September 2006, Mr. Wochner served as Vice President Sales and Marketing/Contracts for KCSR. From February 1993 to March 2005, Mr. Wochner served as Vice President and General Solicitor of KCSR.
There are no arrangements or understandings between the executive officers and any other person pursuant to which the executive officer was or is to be selected as an officer of KCS, except with respect to the consolidated financial statements.executive officers who have entered into employment agreements designating the position(s) to be held by the executive officer.
7
AVAILABLE INFORMATION
8
9
See Item 8, Financial Statements and Supplementary Data — Note 1 “Description of the Business” and Note 1718 “Geographic Information” for more information on the description and general development of the Company’s business and financial information about geographic areas.
| Item 1A. | Risk Factors |
Risks Related to an Investment in KCS’KCS’s Common Stock
The price of KCS’KCS’s common stock may fluctuate significantly, which may make it difficult for investors to resell common stock when they want to or at prices they find attractive.
The price of KCS’KCS’s common stock on the New York Stock Exchange (“NYSE”), listed under the ticker symbol “KSU”, constantly changes. The Company expects that the market price of its common stock will continue to fluctuate.
The Company’s stock price can fluctuate as a result of a variety of factors, many of which are beyond KCS’KCS’s control. These factors include, but are not limited to:
quarterly variations in operating results;
operating results that vary from the expectations of management, securities analysts, ratings agencies and investors; changes in expectations as to future financial performance, including financial estimates by management, securities analysts, ratings agencies and investors; developments generally affecting the railroad industry; announcements by KCS or its competitors of significant contracts, acquisitions, joint marketing relationships, joint ventures or capital commitments; the assertion or resolution of significant claims or proceedings involving KCS; KCS’s dividend policy and limitations on the payment of dividends; future sales of KCS’s equity or equity-linked securities; the issuance of common stock in payment of dividends on preferred stock or upon conversion of preferred stock or convertible debt; and general domestic and international economic conditions including the availability of short- and long-term financing. |
In addition, from time to time the stock market in general has experienced extreme volatility that has often been unrelated to the operating performance of a particular company. These broad market fluctuations may adversely affect the market price of KCS’KCS’s common stock.
KCSR Credit Agreement.
KCS has agreed, and may agree in the future, to restrictionslimitations on its ability to pay cash dividends on its common stock. In addition, to maintain its credit ratings, the Company may be limited in its ability to pay cash dividends on its common stock so that it can maintain an appropriate level of liquidity or debt. During the first quarter of 2000, the Board of Directors suspended common stock dividends. KCS does not anticipate making any cash dividend payments to its common stockholders in the foreseeable future.
9
Sales of substantial amounts of KCS’KCS’s common stock in the public market could adversely affect the prevailing market price of the common stock.
As of December 31, 2009,2011, there were 8,763,1076,414,464 shares of common stock issued or reserved for issuance under the 1991 Amended and Restated Stock Option and Performance Award Plan, the 2008 Stock Option and Performance Award Plan and the 2009 Employee Stock Purchase Plan, 2,117,095and 1,863,360 shares of common stock held by executive officers and directors outside those plans, and 6,999,826 shares of common stock reserved for issuance upon conversion of the outstanding shares of convertible preferred stock.plans. Sales of common stock by employees upon exercise of their options, sales by executive officers and directors subject to compliance with Rule 144 under the Securities Act, and sales of common stock that may be issued upon conversion of the outstanding preferred stock, or the perception that such sales could occur, may adversely affect the market price of KCS’ common stock.
10
KCS has provisions in its charter bylaws and Rights Agreementbylaws that could deter, delay or prevent a third party from acquiring a controlling interest in KCS and that could deprive an investor of an opportunity to obtain a takeover premium for shares of KCS’KCS’s common stock.
KCS has provisions in its charter and bylaws that may delay or prevent unsolicited takeover bids from third parties, including provisions providing for a classified board and supermajority stockholder approval requirements in order to increase the size of the board of directors, abolish cumulative voting, abolish the classification of the Board, or effectaffect certain merger, consolidation or sale transactions. The bylaws provide that a stockholder must give the Company advance written notice of its intent to nominate a director or raise a matter at an annual meeting. In addition, the Company has adopted a Rights Agreement which under certain circumstances would significantly impair the ability of third parties to acquire control of KCS without prior approval of the Board of Directors. These provisions may deprive KCS’KCS’s stockholders of an opportunity to sell their shares at a premium over prevailing market prices.
10
Risks Related to KCS’KCS’s Business
KCS competes against other railroads and other transportation providers.
The Company’s domestic and international operations are subject to competition from other railroads, particularly the Union Pacific Railroad Company (“UP”) and BNSF Railway Company (“BNSF”) in the United States and Ferromex and Ferrosur in Mexico, as well as from truck carriers, barge lines, and other maritime shippers. Many of KCS’KCS’s rail competitors are much larger and have significantly greater financial and other resources than KCS, which may enable rail competitors to reduce rates and make KCS’KCS’s freight services less competitive. KCS’KCS’s ability to respond to competitive pressures by matching rate reductions and decreasing rates without adversely affecting gross margins and operating results will depend on, among other things, the ability to reduce operating costs. KCS’KCS’s failure to respond to competitive pressures, and particularly rate competition, in a timely manner could have a material adverse effect on the Company’s results of operation andconsolidated financial condition.
statements.
The railroad industry is dominated by a few large carriers. These larger railroads could attempt to use their size and pricing power to block other railroads’ access to efficient gateways and routing options that are currently and have historically been available. In addition, if there is future consolidation in the railroad industry in the United States or Mexico, there can be no assurance that it will not have an adverse effect on operations.
the Company’s consolidated financial statements.
Trucking, maritime, and barge competitors, while able to provide rate and service competition to the railroad industry, are able to use publicrights-of-way, require substantially smaller capital investment and maintenance expenditures than railroads and allow for more frequent and flexible scheduling. Continuing competitive pressures, any reduction in margins due to competitive pressures, future improvements that increase the quality of alternative modes of transportation in the locations in which the Company operates, or legislation or regulations that provide motor carriers with additional advantages, such as increased size of vehicles and reduced weight restrictions, could result in downward pressure on freight rates, which in turn could have a material adverse effect on results of operations,the Company’s consolidated financial condition and liquidity.
statements.
A central part of KCS’KCS’s growth strategy is based upon the conversion of truck traffic to rail. There can be no assurance the Company will succeed in its efforts to convert traffic from truck to rail transport or that the customers already converted will be retained. If the railroad industry in general is unable to preserve its competitive advantages vis-à-vis the trucking industry, projected revenue growth could be adversely affected. Additionally, revenue growth could be affected by, among other factors, an expansion in the availability, or an improvement in the quality, of the trucking services offered by carriers resulting from regulatory and administrative interpretations and implementation of certain provisions of the North American Free Trade Agreement (“NAFTA”), and KCS’KCS’s inability to grow its existing customer base and capture additional cargo transport market share because of competition from the shipping industry and other railroads.
11
12
13
14
15
16
17
KCSM’s Mexican Concession is subject to revocation or termination in certain circumstances which would prevent KCSM from operating its railroad and would have a material adverse effect on the Company’s business andconsolidated financial condition.
statements.
KCSM operates under the Concession granted by the Mexican government in June 1997, which is renewable for additional periods of up to 50 years, subject to certain conditions. The Concession gives KCSM exclusive rights to provide freight transportation services over its rail lines for the first 30 years of the50-year Concession, subject to certain trackage and haulage rights granted to other concessionaires. The SCT, which is principally responsible for regulating railroad services in Mexico, has broad powers to monitor KCSM’s compliance with the Concession, and it can require KCSM to supply it with any technical, administrative and financial information it requests. Among other obligations, KCSM must comply with the investment commitments established in its business plan, which forms an integral part of the Concession, and must update the
11
plan every five years. The SCT treats KCSM’s business plans confidentially. The SCT also monitors KCSM’s compliance with efficiency and safety standards established in the Concession. The SCT reviews, and may amend, these standards every five years.
The Mexican Railroad Services Law and regulations provide the Mexican government certain rights in its relationship with KCSM under the Concession, including the right to take over the management of KCSM and its railroad in certain extraordinary cases, such as imminent danger to national security. In the past, the Mexican government has used such power with respect to other privatized industries, including the telecommunications industry, to ensure continued service during labor disputes. In addition, under Article 47 of the Mexican Railroad Services Law and its regulations, the SCT, in consultation with the Mexican Antitrust Commission,COFECO, reserves the right to set service rates if it determines that effective competition does not exist in the Mexican railroad industry. The Mexican Antitrust Commission,COFECO, however, has not published guidelines regarding the factors that constitute a lack of competition. It is therefore unclear under what particular circumstances the Mexican Antitrust CommissionCOFECO would deem a lack of competition to exist. If the SCT intervenes and sets service rates, the rates it sets may be too low to allow KCSM to operate profitably.
Under the Concession, KCSM has the right to operate its rail lines, but it does not own the land, roadway or associated structures. If the Mexican government legally terminates the Concession, it would own, control, and manage such public domain assets used in the operation of KCSM’s rail lines. All other property not covered by the Concession, including all locomotives and railcars otherwise acquired, willwould remain KCSM’s property. TheIn the event of early termination, or total or partial revocation, the Mexican government willwould have the right to cause the Company to lease all service-related assets to it for a term of at least one year, automatically renewable for additional one-year terms up to five years. The amount of the rent would be determined by experts appointed by KCSM and the Mexican government. The Mexican government must exercise this right within four months after early termination or revocation of the Concession. In addition, the Mexican government willwould also have a right of first refusal with respect to certain transfers by KCSM of railroad equipment within 90 days after revocation of the Concession.
The Mexican government may also temporarily seize control of KCSM’s rail lines and its assets in the event of a natural disaster, war, significant public disturbance or imminent danger to the domestic peace or economy. In such a case, the SCT may restrict KCSM’s ability to exploit the Concession in such manner as the SCT deems necessary under the circumstances, but only for the duration of any of the foregoing events. Mexican law requires that the Mexican government pay compensation if it effects a statutory appropriation for reasons of the public interest. With respect to a temporary seizure due to any cause other than international war, the Mexican Railroad Services Law and regulations provide that the Mexican government will indemnify an affected concessionaire for an amount equal to damages caused and losses suffered. However, these payments may not be sufficient to compensate KCSM for its losses and may not be timely made.
18
The SCT may revoke the Concession if KCSM is sanctioned on three distinct occasions for unjustly interrupting the operation of its rail lines or for charging tariffs higher than the tariffs it has registered with the SCT. In addition, the SCT may revoke the Concession if, among other things, KCSM is sanctioned on five distinct occasions because KCSM restricts the ability of other Mexican rail operators to use its rail lines; KCSM fails to make payments for damages caused during the performance of services; KCSM fails to comply with any term or condition of the Mexican Railroad Services Law and regulations or the Concession; KCSM fails to make the capital investments required under its five-year business plan filed with the SCT; or KCSM fails to maintain an obligations compliance bond and insurance coverage as specified in the Mexican Railroad Services Law and regulations. In addition, the Concession would revoke automatically if KCSM changes its nationality or assigns or creates any lien on the Concession, or if there is a change in control of KCSM without the SCT’s approval. The SCT may also terminate the Concession as a result of KCSM’s surrender of its rights under the Concession, or for reasons of public interest or upon KCSM’s liquidation or bankruptcy. Revocation or termination of the Concession would prevent KCSM from operating its railroad and would materially adversely affect the Mexican operations and the ability to make payments on KCSM’s debt. If the Concession is terminated or revoked by the SCT for any reason, KCSM would receive no compensation and its interest in its rail lines and all other fixtures covered by the Concession, as well as all improvements made by it, would revert to the Mexican government. Revocation or termination of the Concession would prevent KCSM from operating its railroad and would materially adversely affect the Mexican operations and the ability to make payments on KCSM’s debt as well as materially adversely affect the Company’s consolidated financial statements.
KCS’s business strategy, operations and growth rely significantly on agreements with other railroads and third parties.
12
the Company does not own. KCS’s ability to provide comprehensive rail service to its customers depends in large part upon its ability to maintain these agreements with other railroads and third parties. The termination of, or the failure to renew, these agreements could adversely affect KCS’s consolidated financial statements. KCS is also dependent in part upon the financial strength and efficient performance of other railroads. There can be no assurance that KCS will not be materially adversely affected by operational or financial difficulties of other railroads.
KCSM’s operations are subject to certain trackage rights, haulage rights and interline service agreements with another Mexican rail carrier, some of which are in dispute.
Through KCSM’s Concession from the Mexican government, KCSM is required to grant short and long distance trackage rights to Ferromex. Applicable law stipulates that Ferromex similarly is required to grant to KCSM rights to use portions of their tracks. These trackage rights have been granted under the Concession. The rates to be charged for use of the Trackage Rights after January 1, 2009, were agreed to by KCSM and Ferromex pursuant to the Trackage Rights Agreement, dated February 9, 2010. The Trackage Rights Agreement did not establish rates that may be charged for the right to use the trackage rights for the periods beginning in 1998 through December 31, 2008.
If KCSM cannot reach an agreement with Ferromex for rates applicable for services prior to January 1, 2009, which are not subject to the Trackage Rights Agreement, the SCT initiatedis entitled to set the rates in accordance with Mexican law and regulations, which rates may not adequately compensate KCSM. KCSM is currently involved in legal proceedings against KCSM, claiming that KCSM had failed to make certain minimum capital investments projected for 2004 and 2005 under its five-year business plan filed with the SCT and discussions with Ferromex regarding the rates payable to each other for trackage rights, interline services and haulage rights for periods prior to its April 2005 acquisition by KCS (collectively, the “Capital Investment Proceedings”).January 1, 2009. Certain of these disputes continue under litigation. Any resolution of such procedures adverse to KCSM believes it made capital expenditures exceeding the required amounts. KCSM responded to the SCT by providing evidence in support of its investments and explaining why it believes sanctions are not appropriate. In May 2007, KCSM was served with an SCT resolution regarding the Capital Investment Proceeding for 2004, in which the SCT resolved to impose no sanction. In June 2007, KCSM was served with an SCT resolution regarding the Capital Investment Proceeding for 2005, in which the SCT determined that KCSM had indeed failed to make the minimum capital investments required for such year, and imposedcould have a minimal fine. KCSM has filed an action in the Mexican Administrative and Fiscal Federal Court challenging this ruling. KCSM will have the right to challenge any adverse ruling.
KCS’s flexibility to operate its business could be reduced by provisions in its debt obligations.
KCS’s debt instruments contain covenants which restrict or prohibit certain actions (“negative covenants”), including, but not limited to, KCS’s ability to incur debt, create or suffer to exist liens, make prepayments of particular debt, pay dividends, make investments, engage in transactions with stockholders and affiliates, issue capital stock, sell certain assets, engage in mergers and consolidations or in sale-leaseback transactions. KCS’s debt instruments also contain covenants requiring KCS to, among other things, maintain specified financial ratios (“affirmative covenants”). Failure to comply with these negative and affirmative covenants could result in an event of default that, if not cured or waived, could restrict the Company’s access to liquidity and have a material adverse effect on the Company’s business or prospects. If the Company does not have enough cash to service its debt or fund other liquidity needs, KCS may be required to take actions such as requesting a waiver from lenders, reducing or delaying capital expenditures, selling assets, restructuring or refinancing all or part of the existing debt, or seeking additional equity capital. KCS cannot assure that any of these remedies can be effected on commercially reasonable terms or at all.
The failure of a bank to fund all or a portion of a request by KCS to borrow money under its existing revolving credit facilities could reduce KCS’s ability to fund capital expenditures or otherwise properly fund its operations.
The Company and its subsidiaries are in an industry that requires continuing infrastructure improvements and acquisitions of capital assets, necessitating substantial expenditure of cash. KCS has existing revolving credit facilities with multiple banking institutions to provide additional liquidity. If any of the banking institutions that are a party to such credit facilities fails to fund its pro rata share of a request by KCS to borrow money under its credit facilities, KCS’s ability to fund capital expenditures, fund its operations and pay debt service could be reduced, each of which could have a material adverse effect on KCS’s consolidated financial statements.
The failure of any bank or money market instrument in which the Company maintains deposits could reduce the amount of cash the Company has available to pay distributions, fund its operations, pay debt service and make additional investments.
Given the developments in the financial markets, financial institutions have additional capital risks. The Company has diversified its holdings of cash and cash equivalents among several banking institutions and money market instruments in an attempt to minimize its exposure. All of the Company’s bank deposits in the United States are fully insured by the Federal Deposit Insurance Corporation or “FDIC” (FDIC insurance is unlimited through the end of 2012 for non-interest bearing deposit accounts). However, the Company’s investments in money market instruments are insured only up to $500,000 and
13
deposits in Mexican financial institutions are not insured. The loss of the Company’s deposits resulting from the failure of an institution or fund could reduce the amount of cash the Company has available to adequately fund its activities, distribute or invest and could have a material adverse effect on KCS’s consolidated financial statements.
A downturn in the debt capital markets or a downgrade of the Company’s credit ratings may increase the cost of borrowing and make financing difficult to obtain.
Events in the financial markets may have an adverse impact on the debt capital markets and, as a result, credit may become more expensive and difficult to obtain. Lenders may impose more stringent restrictions on the terms of credit and there may be a general reduction in the amount of credit available in the markets in which KCS conducts business. Also, the Company and its securities are rated by Standard & Poor’s Rating Services (“S&P”) and Moody’s Investors Service (“Moody’s”). These ratings impact the Company’s cost of funds and its access to the debt capital markets. The negative impact of tightening credit markets, adverse changes in the debt capital markets generally and/or a downgrade of the Company’s credit ratings may have a material adverse effect on KCS’s consolidated financial statements resulting from, but not limited to, an inability to finance capital expansion on favorable terms, if at all, reduced liquidity as a result of limited alternatives to refinance short-term debt, increased financing costs and/or financial condition. However,terms with increasingly restrictive covenants.
KCS’s business is capital intensive.
The Company’s business is capital intensive and requires substantial ongoing expenditures for, among other things, additions and improvements to roadway, structures and technology, acquisitions, and maintenance and repair of equipment and the rail system. KCS’s failure to make necessary capital expenditures to maintain its operations could impair its ability to serve existing customers, accommodate increases in traffic volumes or result in increased derailments.
KCSM’s Concession from the Mexican government requires KCSM to make investments and undertake capital projects. If KCSM fails to make such capital investments, KCSM’s business plan commitments with the Mexican government may be at risk, requiring KCSM to seek waivers of its business plan. There is no assurance that such waivers, if a sanction were to be imposed, itrequested, would be considered a “generic” sanctiongranted by the SCT. KCSM may defer capital expenditures under Mexican law (i.e., sanctions applied to conduct not specifically referred to in specific subsectionsits business plan with the permission of the Mexican railway law). IfSCT. However, the SCT might not grant this permission, and any failure by KCSM is ultimately sanctionedto comply with the capital investment commitments in its business plan could result in sanctions imposed by the SCT, for “generic” sanctions on five occasions over the termand could result in revocation of the Concession if sanctions are imposed on five distinct occasions. The Company cannot assure that the Mexican government would grant any such permission or waiver. If such permission or waiver is not obtained in any instance and KCSM couldis sanctioned, its Concession might be subject to possible future SCT action seekingat risk of revocation, of the Concession. Such revocationwhich would materially adversely affect KCS’s consolidated financial statements. See “KCSM’s Mexican Concession is subject to revocation or termination in certain circumstances” above.
KCS has funded, and expects to continue to fund capital expenditures with operating cash flows, debt and equity financing and equipment leases. KCS may not be able to generate sufficient cash flows from its operations or obtain sufficient funds from external sources to fund capital expenditure requirements. Even if financing is available, it may not be obtainable on acceptable terms and within the resultslimitations contained in the indentures and other agreements relating to KCS’s existing debt.
KCS is dependent on certain key suppliers of core rail equipment.
KCS relies on a limited number of suppliers of core rail equipment (including locomotives, rolling stock equipment, rail and ties). The capital intensive nature and complexity of such equipment creates high barriers of entry for any potential new suppliers. If any of KCS’s suppliers discontinue production or experience capacity or supply shortages, this could result in increased costs or difficulty in obtaining rail equipment and materials, which could have a material adverse effect on KCS’s consolidated financial statements.
KCS depends on the stability, availability and security of its information technology systems to operate its business.
KCS relies on information technology in all aspects of its business. A significant disruption or failure of its information technology systems, including its computer hardware, software and communications equipment, could result in service interruptions, safety failures, security failures, regulatory compliance failures or other operational difficulties.
The security risks associated with information technology systems have increased in recent years because of the increased sophistication and activities of perpetrators of cyber attacks. A failure in or breach of KCS’s information technology security systems, or those of its third party service providers, as a result of cyber attacks or unauthorized access to its network could
14
disrupt KCS’s business, result in the disclosure or misuse of confidential or proprietary information, increase its costs and/or cause losses. KCS also confronts the risk that a terrorist or other third parties may seek to use its property, including KCS’s information technology systems, to inflict major harm.
KCS continually takes steps to make appropriate enhancements to its information technology systems; however, KCS’s systems may be vulnerable to disruption, failure or unauthorized access which could have a material adverse effect on KCS’s consolidated financial statements.
KCS’s business may be adversely affected by changes in general economic, weather or other conditions.
KCS’s operations may be adversely affected by changes in the economic conditions of the industries and geographic areas that produce and consume the freight that KCS transports. The relative strength or weakness of the United States and Mexican economies affects the businesses served by KCS. Prolonged negative changes in domestic and global economic conditions or disruptions of either or both of the financial and credit markets, including the availability of short and long-term debt financing, may affect KCS, as well as the producers and consumers of the commodities that KCS transports and may have a material adverse effect on KCS’s consolidated financial statements.
The transportation industry is highly cyclical, generally tracking the cycles of the world economy. Although transportation markets are affected by general economic conditions, there are numerous specific factors within each particular market that may influence operating results. Some of KCS’s customers do business in industries that are highly cyclical, including the oil and gas, automotive, housing and agriculture industries. Any downturn in these industries could have a material adverse effect on operating results. Also, some of the products transported have had a historical pattern of price cyclicality which has typically been influenced by the general economic environment and by industry capacity and demand. For example, global steel and petrochemical prices have decreased in the past, and reduced demand for automotive vehicles and related shipments may result in decreased prices. KCS cannot assure that prices and demand for these products will not decline in the future, adversely affecting those industries and, in turn, the Company’s consolidated financial statements.
Traffic congestion experienced in the U.S. or Mexican railroad system may result in overall traffic congestion which would impact the ability to move traffic to and from Mexico and adversely affect KCS’s operations. This system congestion may also result in certain equipment shortages. Any similar congestion experienced by railroads in Mexico could have an adverse effect on the Company’s consolidated financial statements. In addition, the growth of cross border traffic in recent years has contributed to congestion on the international bridge at the Nuevo Laredo-Laredo border gateway, which is expected to continue in the near future. This may adversely affect KCS’s consolidated financial statements.
The Company’s operations may also be affected by natural disasters or adverse weather conditions. The Company operates in and along the Gulf of Mexico, and its facilities may be adversely affected by hurricanes, floods and other extreme weather conditions that could also adversely affect KCS’s shipping, agricultural, chemical and other customers. Significant reductions in the volume of rail shipments due to economic, weather, or other conditions could have a material adverse effect on KCS’s consolidated financial statements.
KCS’s business may be affected by market and regulatory responses to climate change.
KCS’s operations may be adversely affected by restrictions, caps, taxes, or other controls on emissions of greenhouse gases, including diesel exhaust. Restrictions on emissions could also affect KCS’s customers that use commodities that KCS transports to produce energy, use significant amounts of energy in producing or delivering the commodities KCS transports, or manufacture or produce goods that consume significant amounts of energy or burn fossil fuels, including coal-fired power plants, chemical producers, farmers and food producers, and automakers and other manufacturers. Significant cost increases, government regulation, or changes of consumer preferences for goods or services relating to alternative sources of energy or emissions reductions could materially affect the markets for the commodities KCS transports, which in turn could have a material adverse effect on KCS’s consolidated financial statements. Government incentives encouraging the use of alternative sources of energy could also affect certain customers and their respective markets for certain commodities KCS transports in an unpredictable manner that could alter traffic patterns, including, for example, the impacts of ethanol incentives on farming and ethanol producers. Any of these factors, individually or in conjunction with one or more of the other factors, or other unforeseen impacts of climate change could have a material adverse effect on KCS’s consolidated financial statements.
15
KCS is exposed to the credit risk of its customers and counterparties and their failure to meet their financial obligations could adversely affect KCS’s consolidated financial statements.
KCS’s business is subject to credit risk including the risk that a customer or counterparty will fail to meet its obligations when due. Customers and counterparties that owe the Company money may default on their obligations to the Company due to bankruptcy, lack of liquidity, operational failure or other reasons. Although the Company has procedures for reviewing its receivables and credit exposures to specific customers and counterparties to address present credit concerns, default risk may arise from events or circumstances that are difficult to detect or foresee. Some of the Company’s risk management methods depend upon the evaluation of information regarding markets, clients or other matters that are publicly available or otherwise accessible by the Company. That information may not, in all cases, be accurate, complete, up-to-date or properly evaluated. In addition, concerns about, or a default by, one customer or counterparty could lead to significant liquidity problems, losses or defaults by other customers or counterparties, which in turn could adversely affect the Company. The Company may be materially and adversely affected in the event of a significant default by its customers and counterparties.
KCS’s business is subject to regulation by international, federal, state and local regulatory agencies, including environmental, health, safety laws and regulations and tax that could require KCS to incur material costs or liabilities.
KCS is subject to governmental regulation by international, federal, state and local regulatory agencies with respect to its railroad operations, including the Department of Transportation and the Department of Homeland Security in the United States and the Secretary of Communications and Transportation in Mexico, as well as a variety of health, safety, labor, environmental, and other matters. Government regulation of the railroad industry is a significant determinant of the competitiveness and profitability of railroads. As part of the Rail Safety Improvement Act of 2008 in the United States, Class I railroad carriers and passenger and commuter rail operators must implement positive train control (a technology designed to help prevent train-to-train collisions, overspeed derailments, incursions into rail work zones, and entry into main line track if a switch is misaligned) at certain locations (including main line track where toxic inhalation hazard or poison inhalation hazard movements occur or where passenger operations occur) by the end of 2015, which will add to operating costs, increase the number of employees the Company employs and require KCS to invest significant amounts of money into new safety technology. KCS’s inadvertent failure or inability to comply with applicable laws and regulations could have a material adverse effect on the Company’s consolidated financial statements and operations, including limitations on operating activities until compliance with applicable requirements is achieved. These government agencies may change the legislative or regulatory framework within which the Company operates without providing any recourse for any adverse effects on the Company’s business that occur as a result of such change. Additionally, some of the regulations require KCS to obtain and maintain various licenses, permits and other authorizations. Any failure to maintain these licenses, permits, and other authorizations could adversely affect KCS’s business.
From time to time, certain KCS facilities have not been in compliance with environmental, health and safety laws and regulations and there can be no assurance that KCS will always be in compliance with such laws and regulations in the future. Environmental liability under federal and state law in the United States can also extend to previously owned or operated properties, leased properties and properties owned by third parties, as well as to properties currently owned and used by the Company. Environmental liabilities may also arise from claims asserted by adjacent landowners or other third parties. Given the nature of its business, the Company incurs, and expects to continue to incur, environmental compliance costs, including, in particular, costs necessary to maintain compliance with requirements governing chemical and hazardous material shipping operations, refueling operations and repair facilities. KCS presently has environmental investigation and remediation obligations at certain sites, and will likely incur such obligations at additional sites in the future. Liabilities accrued for environmental costs represent the Company’s best estimate of the probable future obligation for the remediation and settlement of these sites. Although the recorded liability is the best estimate of all probable costs, clean-up costs may exceed such estimates, due to various factors such as evolving environmental laws and regulations, changes in technology, the extent of other parties’ participation, developments in environmental surveys and studies, and the extent of corrective action that may ultimately be required. New laws and regulations, stricter enforcement of existing requirements, accidental spills, releases or violations or the discovery of previously unknown contamination could require KCS to incur costs or subject KCS to liabilities that could have a material adverse effect on KCS’s consolidated financial conditionstatements.
The Company’s Mexican operations are subject to Mexican federal and state laws and regulations relating to the protection of KCSM.the environment, including standards for, among other things, water discharge, water supply, emissions, noise pollution, hazardous substances and transportation and handling of hazardous and solid waste. Under applicable Mexican law and regulations, administrative and criminal proceedings may be brought and economic sanctions imposed against companies that violate environmental laws, and non-complying facilities may be temporarily or permanently closed. KCSM is also subject
16
to the laws of various jurisdictions and international conferences with respect to the discharge of materials into the environment and to environmental laws and regulations issued by the governments of each of the Mexican states in which KCSM’s facilities are located. The terms of KCSM’s Concession from the Mexican government also impose environmental compliance obligations on KCSM. The Company cannot predict the effect, if any, that unidentified environmental matters or the adoption of additional or more stringent environmental laws and regulations would have on KCS’s consolidated financial statements. Failure to comply with any environmental laws or regulations may result in the termination of KCSM’s Concession or in fines or penalties that may affect profitability.
KCS is subject to income taxes as well as non-income based taxes, in both the United States and Mexico. Changes in tax rates, enactment of new tax laws, and revisions of tax regulations could have a material adverse effect on the Company’s consolidated financial statements. Although KCS believes its tax estimates are reasonable, the final determination of tax audits, claims or litigation could differ from what is reflected in KCS’s income tax provisions and accruals.
KCS, as a common carrier by rail, is required by United States and Mexican laws to transport hazardous materials, which could expose KCS to significant costs and claims.
Under United States federal statutes and applicable Mexican laws, KCS’s common carrier responsibility requires it to transport hazardous materials. Any rail accident or other incident or accident on KCS’s network, facilities, or at the facilities of KCS’s customers involving the release of hazardous materials, including toxic inhalation hazard (or TIH) materials, could involve significant costs and claims for personal injury, property damage, and environmental penalties and remediation, which could have a material adverse effect on KCS’s consolidated financial statements.
KCS’s business is vulnerable to rising fuel costs and disruptions in fuel supplies. Any significant increase in the cost of fuel that is not adequately covered by fuel surcharges, or severe disruption of fuel supplies, would have a material adverse effect on KCS’s consolidated financial statements.
KCS incurs substantial fuel costs in its railroad operations and these costs represent a significant portion of its transportation expenses. Significant price increases for fuel may have a material adverse effect on operating results. If KCS is unable to recapture its costs of fuel from its customers, operating results could be materially adversely affected. In addition, a severe disruption of fuel supplies resulting from supply shortages, political unrest, a disruption of oil imports, weather events, war, or otherwise, and the resulting impact on fuel prices could materially adversely affect KCS’s consolidated financial statements.
KCS currently meets, and expects to continue to meet, fuel requirements for its Mexican operations almost exclusively through purchases at market prices from PEMEX Refinación (“PEMEX”), the national oil company of Mexico, a government-owned entity exclusively responsible for the distribution and sale of diesel fuel in Mexico. KCSM is party to a fuel supply contract with PEMEX of indefinite duration based on market prices. Either party may terminate the contract upon 30 days written notice to the other at any time. If the fuel contract is terminated and KCSM is unable to acquire diesel fuel from alternate sources on acceptable terms, the Mexican operations could be materially adversely affected.
Market fluctuations could adversely impact KCS’s operating results as it hedges certain transactions.
From time to time, KCS may use various financial instruments to reduce its exposure to various market risks, including interest rates, foreign currency, and fuel and commodity prices. While these financial instruments reduce the Company’s exposure to changes in market risks, the use of such instruments may ultimately limit the Company’s ability to benefit from favorable changes in underlying rates or prices due to amounts fixed at the time of entering into the hedge agreement.
The loss of key personnel could negatively affect business.
KCS’s success substantially depends on its ability to attract and retain key members of the senior management team and the principals of its foreign subsidiaries. Recruiting, motivating, and retaining qualified management personnel, particularly those with expertise in the railroad industry, are vital to operations and success. There is substantial competition for qualified management personnel and there can be no assurance that KCS will always be able to attract or retain qualified personnel. Employment agreements with senior management are terminable at any time by either party. If KCS loses one or more of these key executives or principals, its ability to successfully implement its business plans and the value of its common stock could be materially adversely affected.
17
A majority of KCS’s employees belong to labor unions. Strikes or work stoppages could adversely affect operations.
KCS faces possible catastrophic loss and liability, and its insurance may not be sufficient to cover its damages or damages to others.
The operation of any railroad carries with it an inherent risk of catastrophe, mechanical failure, collision, and property loss. In the course of KCS’s operations, spills or other environmental mishaps, cargo loss or damage, business interruption due to political developments, as well as labor disputes, strikes and adverse weather conditions, could result in a loss of revenues or increased liabilities and costs. Collisions, environmental mishaps, or other accidents can cause serious bodily injury, death and extensive property damage, particularly when such accidents occur in heavily populated areas. Additionally, KCS’s operations may be affected from time to time by natural disasters such as earthquakes, volcanoes, floods, hurricanes or other storms. The occurrence of a major natural disaster could have a material adverse effect on KCS’s consolidated financial statements. The Company maintains insurance that is consistent with industry practice against the accident-related risks involved in the conduct of its business, property damage and business interruption due to natural disasters. However, this insurance is subject to a number of limitations on coverage, depending on the nature of the risk insured against. This insurance may not be sufficient to cover KCS’s damages or damages to others, and this insurance may not continue to be available at commercially reasonable rates. In addition, KCS is subject to the risk that one or more of its insurers may become insolvent and would be unable to pay a claim that may be made in the future. Even with insurance, if any catastrophic interruption of service occurs, KCS may not be able to restore service without a significant interruption to operations which could have an adverse effect on KCS’s consolidated financial statements.
KCS’s business may be affected by future acts of terrorism, war or other acts of violence or crime.
Terrorist attacks, such as an attack on the Company’s chemical transportation activities, any government response thereto and war or risk of war may adversely affect KCS’s consolidated financial statements. These acts may also impact the Company’s ability to raise capital or its future business opportunities. KCS’s rail lines and facilities could be direct targets or indirect casualties of acts of terror, which could cause significant business interruption and damage to KCS’s property. In recent years, there have been reported incidents of train-related robberies in Mexico, including incidents involving KCSM’s trains and infrastructure. Other acts of violence or crime could also adversely affect the Company’s business.
As a result, acts of terrorism or war or acts of crime or violence could result in increased costs and liabilities and decreased revenues for KCS. In addition, insurance premiums charged for some or all of the applicable coverage currently maintained by KCS could increase dramatically or certain coverage may not be adequate to cover losses or may not be available in the future.
KCS’s ownership of KCSM and operations in Mexico subject it to economic and political risks.
The Mexican government has exercised, and continues to exercise, significant influence over the Mexican economy. Accordingly, Mexican governmental actions concerning the economy and state-owned enterprises could have a significant impact on Mexican private sector entities in general and on KCSM’s Mexican operations in particular. KCS cannot predict the impact that the political landscape, including the recently implemented multiparty rule, will have on the Mexican economy. Furthermore, KCSM’sKCS’s consolidated financial condition, results of operationsstatements and prospects may be affected by currency fluctuations, inflation, interest rates, regulation, taxation social instability and other political, social and economic developments in or affecting Mexico.
18
The Mexican economy in the past has suffered balance of payment deficits and shortages in foreign exchange reserves. Although Mexico has imposed foreign exchange controls in the past, there are currently no exchange controls in Mexico. Pursuant to the provisions of NAFTA, if Mexico experiences serious balance of payment difficulties or the threat of such difficulties in the future, Mexico would have the right to impose foreign exchange controls on investments made in Mexico, including those made by United States and
19
Canadian investors. Any restrictive exchange control policy could adversely affect KCS’KCS’s ability to obtain dollars or to convert pesos into dollars for purposes of making interest and principal payments due on indebtedness, to the extent KCS may have to effect those conversions, and could adversely affect the Company’s investment in KCSM. This could have a material adverse effect on KCS’ businessKCS’s consolidated financial statements.
Presidential and federal congress elections in Mexico will be held in July 2012. The electoral process could lead to further friction among political parties and the executive branch officers, which could potentially cause political and economic tension. Additionally, once the President and representatives are elected, changes in laws, public policies and government programs could be enacted, which could have an adverse effect on the Company’s consolidated financial condition.
statements.
Mexican national politicians are currently focused on the 2012 elections as well as certain regional, political and social tensions, and reforms regarding fiscal and labor policies, gas, electricity, social security, and oil have not been and may not be approved. The social and political situation in Mexico could adversely affect the Mexican economy, which in turn could have a material adverse effect on KCS’ business,KCS’s consolidated financial condition, and results of operation.statements.
Downturns in the United States economy or in trade between the United States and Asia or Mexico and fluctuations in the peso-dollar exchange raterates would likely have adverse effects on KCS’ business and results of operations.
KCS’s consolidated financial statements.
The level and timing of KCS’KCS’s Mexican business activity is heavily dependent upon the level of United States-Mexican trade and the effects of NAFTA on such trade. The Mexican operations depend on the United States and Mexican markets for the products KCSM transports, the relative position of Mexico and the United States in these markets at any given time, and tariffs or other barriers to trade. Downturns in the United States or Mexican economyeconomies or in trade between the United States and Mexico would likely have adverse effects on KCS’ business results of operationsKCS’s consolidated financial statements and the Company’s ability to meet debt service obligations. In addition, KCS has invested significant amounts in developing its intermodal operations, atincluding the Port of Lazaro Cardenas, in part to provide Asian importers with an alternative to the west coast ports of the United States, and the level of intermodal traffic depends, to an extent, on the volume of Asian shipments routed through Lazaro Cardenas. Reduction in trading volumes, which may be caused by factors beyond KCS’KCS’s control, including increased government regulations in light of recent concerns regarding the safety and quality of Asian-manufactured products, may adversely affect KCS’ business and results of operations.
KCS’s consolidated financial statements.
Also, fluctuations in the peso-dollar exchange rates could lead to shifts in the types and volumes of Mexican imports and exports. Although a decrease in the level of exports of some of the commodities that KCSM transports to the United States may be offset by a subsequent increase in imports of other commodities KCSM hauls into Mexico and vice versa, any offsetting increase might not occur on a timely basis, if at all. Future developments in United States-Mexican trade beyond the Company’s control may result in a reduction of freight volumes or in an unfavorable shift in the mix of products and commodities KCSM carries.
The indebtedness of KCSM exposes it to risks of exchange rate fluctuations because any devaluation of the peso would cause the cost of KCSM’s dollar-denominated debt to increase and could place the Company at a competitive disadvantage in Mexico, compared to Mexican competitors that have less dollar-denominated debt and greater operating and financial flexibility than KCSM.
Any devaluation of the peso would cause the peso cost of KCSM’s dollar-denominated debt to increase, adversely affecting its ability to make payments on its indebtedness. Severe devaluation or depreciation of the peso may result in disruption of the international foreign exchange markets and may limit the ability to transfer pesos or to convert pesos into U.S. dollars for the purpose of making timely payments of interest and principal on the non-peso denominated indebtedness. Although the Mexican government currently does not restrict, and for many years has not restricted, the right or ability of Mexican or foreign persons or entities to convert pesos into U.S. dollars or to transfer foreign currencies out of Mexico, the Mexican government could, as in the past, institute restrictive exchange rate policies that could limit the ability to transfer or convert pesos into U.S. dollars or other currencies for the purpose of making timely payments of the U.S. dollar-denominated debt and contractual commitments. Devaluation or depreciation of the peso against the U.S. dollar may also adversely affect U.S. dollar prices for KCS’KCS’s securities. Currency fluctuations are likely to continue to
19
Fluctuations in the peso-dollar exchange rates also have an effect on KCS’KCS’s consolidated financial conditionstatements. A devaluation of the peso would cause reported peso-denominated revenues and expenses to decrease, and would increase reported foreign exchange loss due to the Company’s net monetary assets that are peso-denominated. Exchange rate variations also affect the calculation of taxes under Mexican income tax law, and an appreciation of the peso would cause an increase in future periods.the Company’s reported income tax provision and effective income tax rate.
Mexico may experience high levels of inflation in the future which could adversely affect KCS’ results of operations.KCS’s consolidated financial statements.
Mexico has a history of high levels of inflation and may experience high inflation in the future. During most of the 1980s and during the mid and late 1990s, Mexico experienced periods of high levels of inflation. The annual rates of inflation for the last three years, as measured by changes in the National Consumer Price Index, as provided by Banco de México, were 3.8% in 2011, 4.4% in 2010 and 3.6% in 2009 6.5% in 2008 and 3.8% in 2007.. A substantial
20
increase in the Mexican inflation rate would have the effect of increasing some of KCSM’s costs, which could adversely affect its results of operations andconsolidated financial condition.statements. High levels of inflation may also affect the balance of trade between Mexico and the United States, and other countries, which could adversely affect KCSM’s results of operations.consolidated financial statements.
Risk Factors Relating to Ongoing Litigation
KCS is party to various legal proceedings and administrative actions arising in the ordinary course of business including those specifically mentioned below:
KCSM is involved in several disputes related to providing service to a Mexican subsidiary of a large U.S. auto manufacturer,with the SCT, which if adversely resolved could have a negative impact on its business and operations.
21
consolidated financial statements.
On July 23, 2008, the SCT delivered notice to KCSM of new proceedings against KCSM, claiming, among other things, that KCSM refused to grant Ferromex access to certain trackage over which Ferromex alleges it has trackage rights on six different occasions and thus denied Ferromex the ability to provide service to the Auto Manufacturera Mexican subsidiary of a large U.S. auto manufacturer at this location.
On August 13, 2008, KCSM filed a response to the SCT. On July 15, 2010, the SCT resolved to consolidate these six sanctioning proceedings into a single proceeding, determining that the actions that motivated the underlying claims constitute a single occasion. On August 19, 2010, Ferromex filed an appeal and on December 28, 2011, it was dismissed by the Federal Court of Appeals.
KCSM believes it has defenses to the imposition of sanctionsa sanction for the forgoing proceedingsforegoing proceeding and is vigorously contesting these allegations. KCSM does not believe that thesethe SCT proceedingsproceeding will have a material adverse effect on its results of operations orKCS’s consolidated financial condition.statements. However, if KCSM is ultimately sanctioned by the SCT for “generic” sanctions on five occasions over the term of the Concession, KCSM could be subject to possible future SCT action seeking revocation of the Concession. Revocation of the Concession would materially adversely affect KCSM’s results of operations andKCS’s consolidated financial condition.statements.
| Item 1B. | Unresolved Staff Comments |
None.
| Item 2. | Properties |
Track Configuration
KCSR operates over a railroad system consisting of approximately 3,3003,100 route miles of main and branch lines in ten states extending from the midwest and southeast portions of the United States south to the Mexican border. Approximatelyborder, and approximately 400 miles of KCSR’s system consists of trackage rights that permit KCSR to operate its trains with its crews over other railroad’srailroads’ tracks.
Under its Concession from the Mexican government, KCSM has the right to operate approximately 2,6003,100 route miles, of main and branch lines, but does not own the land, roadway, or associated structures, and additionally has approximately 700 miles of trackage rights. The Concession requires KCSM to make investments as described in a business plan filed every five years with the Mexican government. KCSM may defer capital expenditures with respect to its five-year business plan with the permission of the SCT. However, should the SCT not grant this permission, KCSM’s failure to comply with the commitments in its business plan could result in fines and ultimately the Mexican government revoking the Concession. See Item 1A, “Risk Factors — KCSM’s Mexican Concession is subject to revocation or termination in certain circumstances which would prevent KCSM from operating its railroad and would have a material adverse effect on the Company’s business andconsolidated financial condition.statements.”
20
Equipment Configuration
As of December 31, 20092011 and 2008,2010, KCS leased and owned or leased the following units of equipment:
| 2009 | 2008 | |||||||||||||||
| Leased | Owned | Leased | Owned | |||||||||||||
| Locomotives | 382 | 536 | 416 | 627 | ||||||||||||
Rolling stock: | ||||||||||||||||
| Box cars | 6,199 | 875 | 6,460 | 1,581 | ||||||||||||
| Gondolas | 2,856 | 1,746 | 3,271 | 1,781 | ||||||||||||
| Hoppers | 4,949 | 882 | 5,841 | 923 | ||||||||||||
| Flat cars (intermodal and other) | 1,335 | 512 | 2,071 | 583 | ||||||||||||
| Auto racks | 1,761 | — | 1,753 | — | ||||||||||||
| Tank cars | 527 | 15 | 524 | 32 | ||||||||||||
| Other | — | 51 | — | 57 | ||||||||||||
| Total | 17,627 | 4,081 | 19,920 | 4,957 | ||||||||||||
22
Average Age (In Years) of Leased and Owned Locomotives: | 2009 | 2008 | ||||||
| Road locomotives | 13.5 | 13.5 | ||||||
| All locomotives | 20.0 | 19.3 | ||||||
| 2011 | 2010 | ||||||||||
| Leased | Owned | Leased | Owned | ||||||||
| Locomotives | 295 | 628 | 371 | 527 | |||||||
| Rolling stock: | |||||||||||
| Box cars | 5,714 | 1,031 | 5,887 | 873 | |||||||
| Hoppers | 4,644 | 872 | 4,861 | 877 | |||||||
| Gondolas | 3,114 | 1,229 | 2,873 | 1,535 | |||||||
| Auto racks | 1,869 | — | 1,854 | — | |||||||
| Tank cars | 661 | 15 | 693 | 15 | |||||||
| Flat cars (intermodal and other) | 605 | 501 | 625 | 514 | |||||||
| Total | 16,607 | 3,648 | 16,793 | 3,814 | |||||||
| Average Age (in Years) of Leased and Owned Locomotives: | 2011 | 2010 | |||
| Road locomotives | 13.7 | 14.0 | |||
| All locomotives | 21.1 | 20.8 | |||
Property and Facilities
KCS operates numerous facilities, including terminals for intermodal and other freight;freight, rail yards for train-building, switching,storage-in-transit (the temporary storage of customer goods in rail cars prior to shipment) and other activities; offices to administer and manage operations; dispatch centers to direct traffic on the rail network; crew quarters to house train crews along the rail line; and shops and other facilities for fueling, maintenance, and repair of locomotives and maintenance of freight cars and other equipment.
Capital Expenditures
The Company’s cash capital expenditures for the three years ended December, 31, 2009, 2008,2011, 2010, and 2007,2009, and planned 20102012 capital expenditures are included in Item 7, “Management’s Discussion and Analysis of Financial Condition and Results of Operations — Liquidity and Capital Resources — Capital Expenditures”. See also Item 7, “Management’s Discussion and Analysis of Financial Condition and Results of Operations — Critical Accounting Policies and Estimates — Capitalization, Depreciation and Amortization of Property and Equipment, Includingincluding Concession Assets” regarding the Company’s policies and guidelines related to capital expenditures.
| Item 3. | Legal Proceedings |
The Company is subject to various legal proceedings and claims that arise in the ordinary course of business. For more information on legal proceedings, see Item 1A, “Risk Factors — RisksRisk Factors Relating to Ongoing Litigation,” Item 7, “Management’s Discussion and Analysis of Financial Condition and Results of Operations — Critical Accounting Policies and Estimates — Provision for Environmental Remediation — Provision for Personal Injury Claims,” and — “Other Matters — Litigation,” and Item 8, “Financial Statements and Supplementary Data — Note 1214 Commitments and Contingencies,” and Item 9B, “Other Information”Contingencies”.
| Item 4. |
Part II
23
24
| Item 5. | Market for |
Market Information
The Company’s common stock is traded on the New York Stock Exchange under the ticker symbol “KSU”. Information as toThe following table presents the dividends declared on the Company’s preferred stock and the high and low sales price of the Company’s common and preferred stock, for the years ended December 31, 2009quarters indicated.
| Fourth | Third | Second | First | ||||||||||||
| 2011 | |||||||||||||||
| Dividends per share: | |||||||||||||||
| $25 par preferred stock | $ | 0.25 | $ | 0.25 | $ | 0.25 | $ | 0.25 | |||||||
| $1 par series D preferred stock | — | — | — | 12.81 | |||||||||||
| Stock price ranges: | |||||||||||||||
| $25 par preferred: | |||||||||||||||
| — High | $ | 27.17 | $ | 24.74 | $ | 24.31 | $ | 23.85 | |||||||
| — Low | 22.61 | 22.90 | 22.85 | 21.87 | |||||||||||
| Common: | |||||||||||||||
| — High | $ | 70.48 | $ | 62.78 | $ | 59.50 | $ | 56.98 | |||||||
| — Low | 47.12 | 45.63 | 50.27 | 47.14 | |||||||||||
| 2010 | |||||||||||||||
| Dividends per share: | |||||||||||||||
| $25 par preferred stock | $ | 0.25 | $ | 0.25 | $ | 0.25 | $ | 0.25 | |||||||
| $1 par series D preferred stock | 12.81 | 12.81 | 12.81 | 12.81 | |||||||||||
| Stock price ranges: | |||||||||||||||
| $25 par preferred: | |||||||||||||||
| — High | $ | 23.96 | $ | 23.60 | $ | 22.48 | $ | 22.00 | |||||||
| — Low | 22.12 | 21.25 | 18.88 | 19.01 | |||||||||||
| Common: | |||||||||||||||
| — High | $ | 50.07 | $ | 39.51 | $ | 42.32 | $ | 36.91 | |||||||
| — Low | 36.17 | 31.73 | 32.61 | 29.52 | |||||||||||
Dividend Policy
Common Stock. The Board of Directors of the Company suspended the payment of dividends on the Company’s common stock in 2000. Under the terms of a previous credit agreement completed in 2006, KCS was prohibited from paying cash dividends on its common stock. During 2011, KCS entered into an amended and 2008 is set forth in Note 15restated credit agreement (the “2011 KCSR Credit Agreement”) which allows KCS to the Consolidated Financial Statements in Item 8 of thisForm 10-K and is incorporated by reference herein.
Holders
There were 4,4463,502 record holders of KCS common stock on February 4, 2010;1, 2012; however, the number of actual holders of KCS common stock is greater due to the practice of brokerage firms registering many shares for clients in the brokerage firm’s name.
22
Securities Authorized for Issuance Under Equity Compensation Plans
See Part III, Item 12, “Security Ownership of Certain Beneficial Owners and Management and Related Stockholder Matters” for information about securities authorized for issuance under KCS’KCS’s equity compensation plans.
The Company maintains a 401(k) profit sharing plan, which is designed to meet the requirements of qualification under Section 401(a) of the Internal Revenue Code. Participants have the ability to direct the investment of their plan accounts among various investment alternatives, one of which is a KCS common stock fund. KCS registered 660,000 shares of common stock for issuance under the plan pursuant to a Form S-8 Registration Statement filed in December 2000. Since that time the third party record keeper for the plan has changed several times. Because certain of the record keepers cannot provide detailed records of the actual shares sold under the plan, KCS is unable to determine whether more than 660,000 shares have been purchased since the Form S-8 was originally filed. However, even if this share limit were exceeded, the Company does not believe the excess amount to be material. The Company is filing a new Form S-8 to register additional shares for use under the plan.
23
Performance Graph
The following graph shows the changes in value over the five years ended December 31, 2009,2011, of an assumed investment of $100 in: (i) KCS’KCS’s common stock; (ii) the stocks that comprise the Dow Jones U.S. Industrial Transportation Average Index(1); and (iii) the stocks that comprise the S&P 500 Index(2). The table following the graph shows the value of those investments on December 31 for each of the years indicated. The values for the assumed investments depicted on the graph and in the table have been calculated assuming that any cash dividends are reinvested.
COMPARISON OF FIVE YEAR CUMULATIVE TOTAL RETURN
Among Kansas City Southern, the S&P 500 Index
and the Dow Jones U.S. Industrial Transportation Index
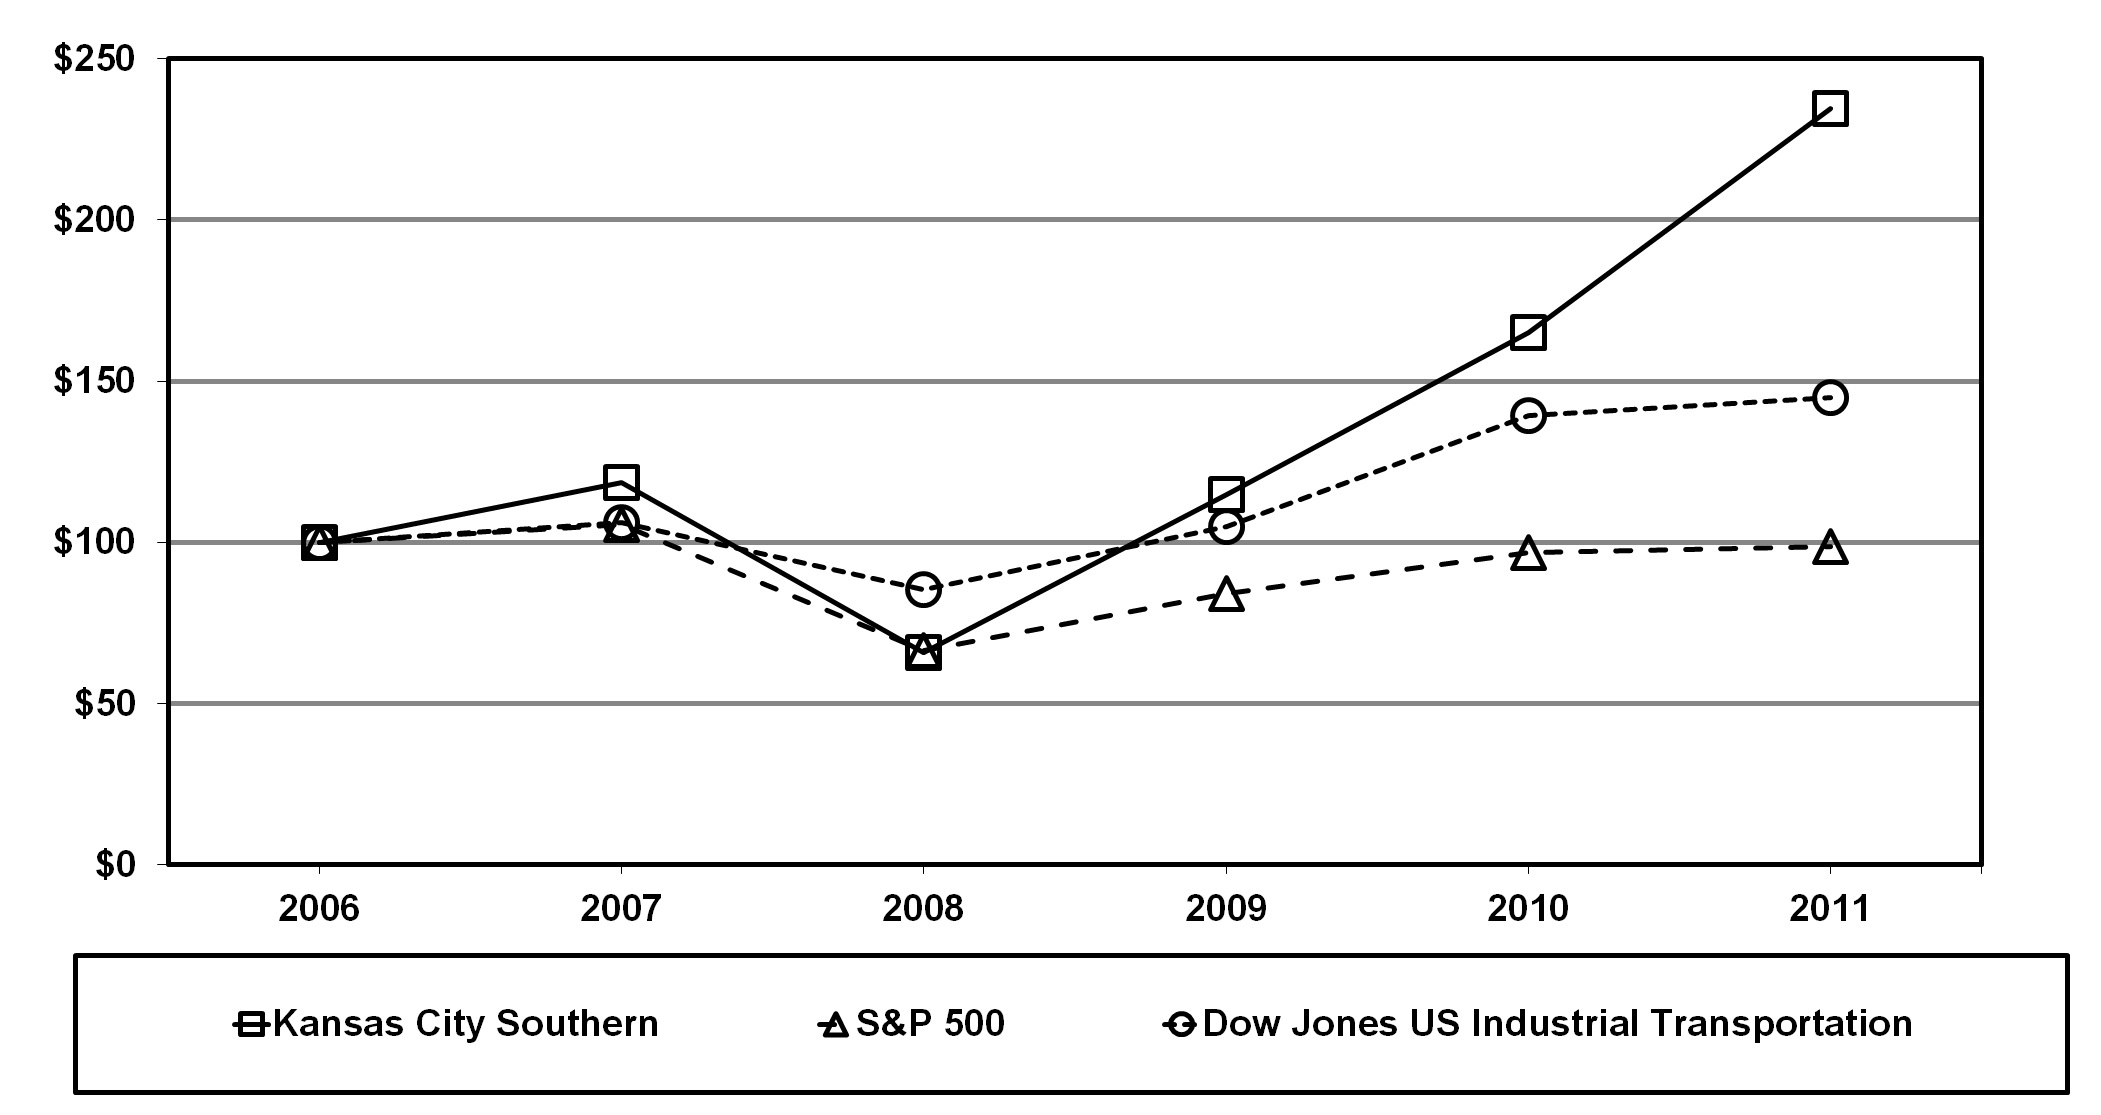
| 2004 | 2005 | 2006 | 2007 | 2008 | 2009 | 2006 | 2007 | 2008 | 2009 | 2010 | 2011 | |||||||||||||||||||||||||||||||
| Kansas City Southern | 100.00 | 137.79 | 163.45 | 193.63 | 107.45 | 187.76 | 100.00 | 118.46 | 65.73 | 114.87 | 165.15 | 234.68 | ||||||||||||||||||||||||||||||
| S&P 500 | 100.00 | 104.91 | 121.48 | 128.16 | 80.74 | 102.11 | 100.00 | 105.49 | 66.46 | 84.05 | 96.71 | 98.75 | ||||||||||||||||||||||||||||||
| Dow Jones Transportation Average | 100.00 | 111.27 | 120.01 | 127.37 | 102.44 | 126.00 | ||||||||||||||||||||||||||||||||||||
| Dow Jones U.S. Industrial Transportation | 100.00 | 106.13 | 85.36 | 104.99 | 139.40 | 144.83 | ||||||||||||||||||||||||||||||||||||
_____________________
| (1) | The Dow Jones U.S. Industrial Transportation |
| (2) | The S&P 500 is |
24
| Item 6. | Selected Financial Data |
The selected financial data below(in millions, except per share amounts)should be read in conjunction with “Management’s Discussion and Analysis of Financial Condition and Results of Operations” included under Item 7 of thisForm 10-K as well as the consolidated financial statements and the related notes.
| 2009 | 2008 | 2007 | 2006 | 2005(i) | ||||||||||||||||
Results of Operations | ||||||||||||||||||||
| Revenues | $ | 1,480.2 | $ | 1,852.1 | $ | 1,742.8 | $ | 1,659.7 | $ | 1,352.0 | ||||||||||
| Operating expenses | 1,212.0 | 1,461.9 | 1,380.4 | 1,355.4 | 1,289.7 | |||||||||||||||
| Operating income | $ | 268.2 | $ | 390.2 | $ | 362.4 | $ | 304.3 | $ | 62.3 | ||||||||||
| Net income | $ | 69.0 | $ | 184.2 | $ | 154.2 | $ | 109.2 | $ | 83.1 | ||||||||||
| Earnings per common share: | ||||||||||||||||||||
| Basic | $ | 0.61 | $ | 2.02 | $ | 1.77 | $ | 1.20 | $ | 1.21 | ||||||||||
| Diluted | 0.61 | 1.86 | 1.57 | 1.08 | 1.10 | |||||||||||||||
Financial Position | ||||||||||||||||||||
| Total assets | $ | 5,479.1 | $ | 5,439.2 | $ | 4,928.2 | $ | 4,637.3 | $ | 4,423.6 | ||||||||||
| Total debt obligations, including current portion | 1,980.0 | 2,086.1 | 1,755.9 | 1,757.0 | 1,860.6 | |||||||||||||||
| Total stockholders’ equity | 2,058.8 | 1,911.5 | 1,726.3 | 1,582.4 | 1,426.2 | |||||||||||||||
| Total equity(ii) | 2,341.6 | 2,185.2 | 1,969.3 | 1,682.7 | 1,426.2 | |||||||||||||||
Other Data Per Common Share | ||||||||||||||||||||
| Cash dividends per common share | $ | — | $ | — | $ | — | $ | — | $ | — | ||||||||||
| 2011 | 2010 | 2009 | 2008 | 2007 | |||||||||||||||
| Earnings From Continuing Operations | |||||||||||||||||||
| Revenues | $ | 2,098.3 | $ | 1,814.8 | $ | 1,480.2 | $ | 1,852.1 | $ | 1,742.8 | |||||||||
| Operating expenses (i) | 1,486.7 | 1,328.3 | 1,213.4 | 1,464.7 | 1,384.1 | ||||||||||||||
| Operating income | $ | 611.6 | $ | 486.5 | $ | 266.8 | $ | 387.4 | $ | 358.7 | |||||||||
| Net income | $ | 331.9 | $ | 180.0 | $ | 68.1 | $ | 182.1 | $ | 151.8 | |||||||||
| Earnings per common share: | |||||||||||||||||||
| Basic | $ | 3.04 | $ | 1.69 | $ | 0.60 | $ | 1.99 | $ | 1.73 | |||||||||
| Diluted | 3.00 | 1.67 | 0.60 | 1.84 | 1.55 | ||||||||||||||
| Financial Position | |||||||||||||||||||
| Total assets | $ | 6,173.0 | $ | 5,640.9 | $ | 5,454.3 | $ | 5,415.9 | $ | 4,907.7 | |||||||||
| Total debt obligations, including current portion | 1,639.1 | 1,639.7 | 1,980.0 | 2,086.1 | 1,755.9 | ||||||||||||||
| Total stockholders’ equity | 2,764.5 | 2,431.1 | 2,043.0 | 1,896.6 | 1,713.5 | ||||||||||||||
| Total equity | 3,058.7 | 2,713.7 | 2,325.8 | 2,170.3 | 1,956.5 | ||||||||||||||
| Other Data Per Common Share | |||||||||||||||||||
| Cash dividends per common share | $ | — | $ | — | $ | — | $ | — | $ | — | |||||||||
_____________________
| (i) | ||
25
| Item 7. | Management’s Discussion and Analysis of Financial Condition and Results of Operations |
The following is a discussion is intended to clarify and focus onof Kansas City Southern’s results of operations, certain changes in its financial position, liquidity, capital structure and business developments for the periods covered by the consolidated financial statements included under Item 8 of thisForm 10-K. This discussion should be read in conjunction with the included consolidated financial statements, the related notes, and other information included in this report.
CAUTIONARY INFORMATION
The discussions set forth in this Annual Report onForm 10-K may contain forward-looking statements within the meaning of Section 27A of the Securities Act of 1933, as amended, and Section 21E of the Securities Exchange Act of 1934, as amended. In addition, management may make forward-looking statements orally or in other writings, including, but not limited to, in press releases, quarterly earnings calls, executive presentations, in the annual report to stockholders and in other filings with the Securities and Exchange Commission. Readers can identify these forward-looking statements by the use of such verbs as “expects,” “anticipates,” “believes” or similar verbs or conjugations of such verbs. These statements involve a number of risks and uncertainties. Actual results could materially differ from those anticipated by such forward-looking statements. Such differences could be caused by a number of factors or combination of factors including, but not limited to, the factors identified below and those discussed under Item 1A of thisForm 10-K, “Risk
27
Factors.” Readers are strongly encouraged to consider these factors and the following factors when evaluating any forward-looking statements concerning the Company:
fluctuations in the market price for the Company’s common stock;
KCS’s dividend policy and limitations on its ability to pay dividends on its common stock;
KCS’s potential need for and ability to obtain additional financing;
KCS’s ability to successfully implement its business strategy, including the strategy to convert customers from using trucking services to rail transportation services;
the impact of competition, including competition from other rail carriers, trucking companies and maritime shippers in the United States and Mexico;
United States, Mexican and global economic, political and social conditions;
the effects of the North American Free Trade Agreement, or NAFTA, on the level of trade among the United States, Mexico and Canada;
uncertainties regarding the litigation KCS faces and any future claims and litigation;
the effects of employee training, stability of the existing information technology systems, technological improvements and capital expenditures on labor productivity, operating efficiencies and service reliability;
the adverse impact of any termination or revocation of KCSM’s Concession by the Mexican government;
legal or regulatory developments in the United States, Mexico or Canada;
KCS’s ability to generate sufficient cash, including its ability to collect on its customer receivables, to pay principal and interest on its debt, meet its obligations and fund its other liquidity needs;
the effects of adverse general economic conditions affecting customer demand and the industries and geographic areas that produce and consume the commodities KCS carries;
material adverse changes in economic and industry conditions, including the availability of short and long-term financing, both within the United States and Mexico and globally;
natural events such as severe weather, fire, floods, hurricanes, earthquakes or other disruptions to the Company’s operating systems, structures and equipment or the ability of customers to produce or deliver their products;
market and regulatory responses to climate change;
disruption in fuel supplies, changes in fuel prices and the Company’s ability to assess fuel surcharges;
KCS’s ability to attract and retain qualified management personnel;
changes in labor costs and labor difficulties, including work stoppages affecting either operations or customers’ abilities to deliver goods for shipment;
credit risk of customers and counterparties and their failure to meet their financial obligations;
Forward-looking statements reflect the information only as of the date on which they are made. The Company willdoes not undertake any obligation to update any forward-looking statements to reflect future events, developments, or other information. If KCS does update one or more forward-looking statements, no inference should be drawn that additional updates will be made regarding that statement or any other forward-looking statements.
CORPORATE OVERVIEW
Kansas City Southern, a Delaware corporation, is a transportation holding company that has railroad investments in the U.S., Mexico and Panama. In the U.S., the Company serves the central and south central U.S. Its international holdings serve northeastern and central Mexico and the port cities of Lazaro Cardenas, Tampico and Veracruz, and a fifty percent interest in Panama Canal Railway Company providesocean-to-ocean freight and passenger service along the Panama Canal. KCS’KCS’s North American rail holdings and strategic alliances are primary components of a NAFTA railway system, linking the commercial and industrial centers of the U.S., Canada and Mexico. Its principal subsidiaries and affiliates include the following:
The Kansas City Southern Railway Company (“KCSR”), a wholly-owned subsidiary;
Kansas City Southern de México, S.A. de C.V. (“KCSM”), a wholly-owned subsidiary; Mexrail, Inc. (“Mexrail”), a wholly-owned consolidated subsidiary; which, in turn, wholly owns The Texas Mexican Railway Company (“Tex-Mex”); Meridian Speedway, LLC (“MSLLC”), a seventy-one percent-owned consolidated affiliate; Panama Canal Railway Company (“PCRC”), a fifty percent-owned unconsolidated affiliate, that provides international container shipping companies with a railway transportation option in lieu of the Panama Canal and the operations of PCRC’s wholly-owned subsidiary, Panarail Tourism Company (“Panarail”); Southern Capital Corporation, LLC (“Southern Capital”), a fifty percent-owned unconsolidated affiliate that owns and leases locomotives and other equipment; and Ferrocarril y Terminal del Valle de México, S.A. de C.V. (“FTVM”), a twenty-five percent-owned unconsolidated affiliate that provides railroad services as well as ancillary |
PTC-220, LLC (“PTC-220”), a fourteen percent-owned unconsolidated affiliate that holds the licenses to management serviceslarge blocks of radio spectrum and other assets for various other “non-operating” investments.the deployment of positive train control.
EXECUTIVE SUMMARY
Revenues in 2011 increased 16% over 2010, driven primarily by positive pricing impacts, an increase in carload/unit volumes and increased fuel surcharge. Operating expenses increased 12% compared to make difficult decisions about wherethe same period in 2010 due primarily to invest valuable resources for growthhigher volumes, increases in fuel prices and compensation and benefit rates. These increases in operating expenses were partially offset by the future. The Company has remained focused$25.6 million pre-tax gain on maximizinginsurance recoveries recognized within operating expenses as a result of the settlement of the Hurricane Alex insurance claim in 2011.
27
KCSM’s revenues and operating expenses are affected by fluctuations in the value of the cross border networkMexican peso against the value of the U.S. dollar. Based on the volume of revenue and the visionexpense transactions denominated in Mexican pesos, revenue and expense fluctuations generally offset, with insignificant net impacts to be a strong, independent transportation company that consistently delivers exceptional service to its customers and increasing value to its shareholders. Management believes the Company’s efforts leave it well positioned as the global economy begins to recover.
operating income.
The Company reported 20092011 earnings of $0.61$3.00 per diluted share on consolidated net income attributable to Kansas City Southern and subsidiaries of $68.0$330.3 million for the year ended December 31, 2009,2011, compared to annual earnings of $1.86$1.67 per diluted share on consolidated net income attributable to Kansas City Southern and subsidiaries of $183.9$180.2 million for 2008. This earnings decline reflects a 20% reduction in
29
RESULTS OF OPERATIONS
Year Ended December 31, 2009,2011, compared with the Year Ended December 31, 20082010
The following summarizes theKCS’s consolidated income statement components of KCS(in millions):
| Change | ||||||||||||||||
| 2009 | 2008 | Dollars | Percent | |||||||||||||
| Revenues | $ | 1,480.2 | $ | 1,852.1 | $ | (371.9 | ) | (20 | )% | |||||||
| Operating expenses | 1,212.0 | 1,461.9 | (249.9 | ) | (17 | )% | ||||||||||
| Operating income | 268.2 | 390.2 | (122.0 | ) | (31 | )% | ||||||||||
| Equity in net earnings of unconsolidated affiliates | 7.7 | 18.0 | (10.3 | ) | (57 | )% | ||||||||||
| Interest expense | (173.7 | ) | (138.9 | ) | (34.8 | ) | 25 | % | ||||||||
| Debt retirement costs | (5.9 | ) | (5.6 | ) | (0.3 | ) | 5 | % | ||||||||
| Foreign exchange gain (loss) | 2.1 | (21.0 | ) | 23.1 | (110 | )% | ||||||||||
| Other income, net | 5.2 | 6.0 | (0.8 | ) | (13 | )% | ||||||||||
| Income before income taxes and noncontrolling interest | 103.6 | 248.7 | (145.1 | ) | (58 | )% | ||||||||||
| Income tax expense | 34.6 | 64.5 | (29.9 | ) | (46 | )% | ||||||||||
| Net income | 69.0 | 184.2 | (115.2 | ) | (63 | )% | ||||||||||
| Noncontrolling interest | 1.0 | 0.3 | 0.7 | 233 | % | |||||||||||
| Net income attributable to Kansas City Southern and subsidiaries | $ | 68.0 | $ | 183.9 | $ | (115.9 | ) | (63 | )% | |||||||
| 2011 | 2010 | Change Dollars | |||||||||
| Revenues | $ | 2,098.3 | $ | 1,814.8 | $ | 283.5 | |||||
| Operating expenses | 1,486.7 | 1,328.3 | 158.4 | ||||||||
| Operating income | 611.6 | 486.5 | 125.1 | ||||||||
| Equity in net earnings of unconsolidated affiliates | 18.2 | 19.7 | (1.5 | ) | |||||||
| Interest expense | (129.1 | ) | (158.1 | ) | 29.0 | ||||||
| Debt retirement costs | (38.7 | ) | (68.3 | ) | 29.6 | ||||||
| Foreign exchange gain (loss) | (9.2 | ) | 4.7 | (13.9 | ) | ||||||
| Other income, net | 2.2 | 4.7 | (2.5 | ) | |||||||
| Income before income taxes | 455.0 | 289.2 | 165.8 | ||||||||
| Income tax expense | 123.1 | 109.2 | 13.9 | ||||||||
| Net income | 331.9 | 180.0 | 151.9 | ||||||||
| Less: Net income (loss) attributable to noncontrolling interest | 1.6 | (0.2 | ) | 1.8 | |||||||
| Net income attributable to Kansas City Southern and subsidiaries | $ | 330.3 | $ | 180.2 | $ | 150.1 | |||||
28
Revenues
The following summarizes revenues(in millions)and carload/unit statistics(in thousands)and revenue per carload/unit:
| Revenues | Carloads and Units | Revenue per Carload/Unit | ||||||||||||||||||||||||||||||||||
| 2009 | 2008 | % Change | 2009 | 2008 | % Change | 2009 | 2008 | % Change | ||||||||||||||||||||||||||||
| Chemical and petroleum | $ | 323.4 | $ | 347.8 | (7 | )% | 238.3 | 240.2 | (1 | )% | $ | 1,357 | $ | 1,448 | (6 | )% | ||||||||||||||||||||
| Industrial and consumer products | 344.4 | 508.6 | (32 | )% | 267.0 | 367.6 | (27 | )% | 1,290 | 1,384 | (7 | )% | ||||||||||||||||||||||||
| Agriculture and minerals | 360.0 | 455.0 | (21 | )% | 246.3 | 293.3 | (16 | )% | 1,462 | 1,551 | (6 | )% | ||||||||||||||||||||||||
| Total general commodities | 1,027.8 | 1,311.4 | (22 | )% | 751.6 | 901.1 | (17 | )% | 1,367 | 1,455 | (6 | )% | ||||||||||||||||||||||||
| Coal | 187.2 | 203.7 | (8 | )% | 301.2 | 301.3 | — | 622 | 676 | (8 | )% | |||||||||||||||||||||||||
| Intermodal | 143.4 | 160.6 | (11 | )% | 516.4 | 520.9 | (1 | )% | 278 | 308 | (10 | )% | ||||||||||||||||||||||||
| Automotive | 52.9 | 105.6 | (50 | )% | 51.7 | 101.6 | (49 | )% | 1,023 | 1,039 | (2 | )% | ||||||||||||||||||||||||
| Subtotal | 1,411.3 | 1,781.3 | (21 | )% | 1,620.9 | 1,824.9 | (11 | )% | $ | 871 | $ | 976 | (11 | )% | ||||||||||||||||||||||
| Other revenue | 68.9 | 70.8 | (3 | )% | ||||||||||||||||||||||||||||||||
| Total revenues(i) | $ | 1,480.2 | $ | 1,852.1 | (20 | )% | ||||||||||||||||||||||||||||||
| (i) Included in revenues: | ||||||||||||||||||||||||||||||||||||
| Fuel surcharge | $ | 77.9 | $ | 200.3 | ||||||||||||||||||||||||||||||||
| Revenues | Carloads and Units | Revenue per Carload/Unit | ||||||||||||||||||||||||||||
| 2011 | 2010 | % Change | 2011 | 2010 | % Change | 2011 | 2010 | % Change | ||||||||||||||||||||||
| Chemical and petroleum | $ | 399.9 | $ | 363.2 | 10 | % | 254.7 | 249.4 | 2 | % | $ | 1,570 | $ | 1,456 | 8 | % | ||||||||||||||
| Industrial and consumer products | 503.6 | 426.7 | 18 | % | 326.6 | 309.9 | 5 | % | 1,542 | 1,377 | 12 | % | ||||||||||||||||||
| Agriculture and minerals | 447.4 | 429.1 | 4 | % | 259.9 | 268.1 | (3 | %) | 1,721 | 1,601 | 7 | % | ||||||||||||||||||
| Total general commodities | 1,350.9 | 1,219.0 | 11 | % | 841.2 | 827.4 | 2 | % | 1,606 | 1,473 | 9 | % | ||||||||||||||||||
| Coal | 282.0 | 238.6 | 18 | % | 288.1 | 282.5 | 2 | % | 979 | 845 | 16 | % | ||||||||||||||||||
| Intermodal | 251.8 | 194.2 | 30 | % | 798.8 | 678.4 | 18 | % | 315 | 286 | 10 | % | ||||||||||||||||||
| Automotive | 139.2 | 97.7 | 42 | % | 85.6 | 71.1 | 20 | % | 1,626 | 1,374 | 18 | % | ||||||||||||||||||
| Carload revenues, carloads and units | 2,023.9 | 1,749.5 | 16 | % | 2,013.7 | 1,859.4 | 8 | % | $ | 1,005 | $ | 941 | 7 | % | ||||||||||||||||
| Other revenue | 74.4 | 65.3 | 14 | % | ||||||||||||||||||||||||||
| Total revenues (i) | $ | 2,098.3 | $ | 1,814.8 | 16 | % | ||||||||||||||||||||||||
| (i) Included in revenues: | ||||||||||||||||||||||||||||||
| Fuel surcharge | $ | 244.6 | $ | 156.1 | ||||||||||||||||||||||||||
Freight revenues include both revenue for transportation services and fuel surcharges. For the year ended December 31, 2009,2011, revenues decreased $371.9increased $283.5 million compared to the prior year, primarily due to the overall decreasepositive pricing impacts, increase in carload/unit volumes resulting from the downturn in the economy, decreasedand increased fuel surcharge, and thesurcharge. The effect of unfavorable fluctuations in the value of the U.S. dollarMexican peso against the value of the Mexican peso for revenues denominated in Mexican pesos, partially offset by an increase in core pricing. Revenue per carload/unit decreased by 11% for the year ended December 31, 2009, reflecting unfavorable commodity mix in addition to the factors discussed above.
U.S. dollar was not significant.
KCS’s fuel surcharge is a mechanism to adjust revenue based upon changing fuel prices. Fuel surcharges are calculated differently depending on the type of commodity transported. For most commodities, fuel surcharge is calculated using a fuel price from a prior time period that can be as much asup to 60 days earlier. In a period of volatile fuel prices or changing customer business mix, changes in fuel expense and fuel surcharge may significantly differ.
31
The following discussion provides an analysis of revenues by commodity group:
Revenues by commodity
group for 2011
Chemical and petroleum. Revenues | 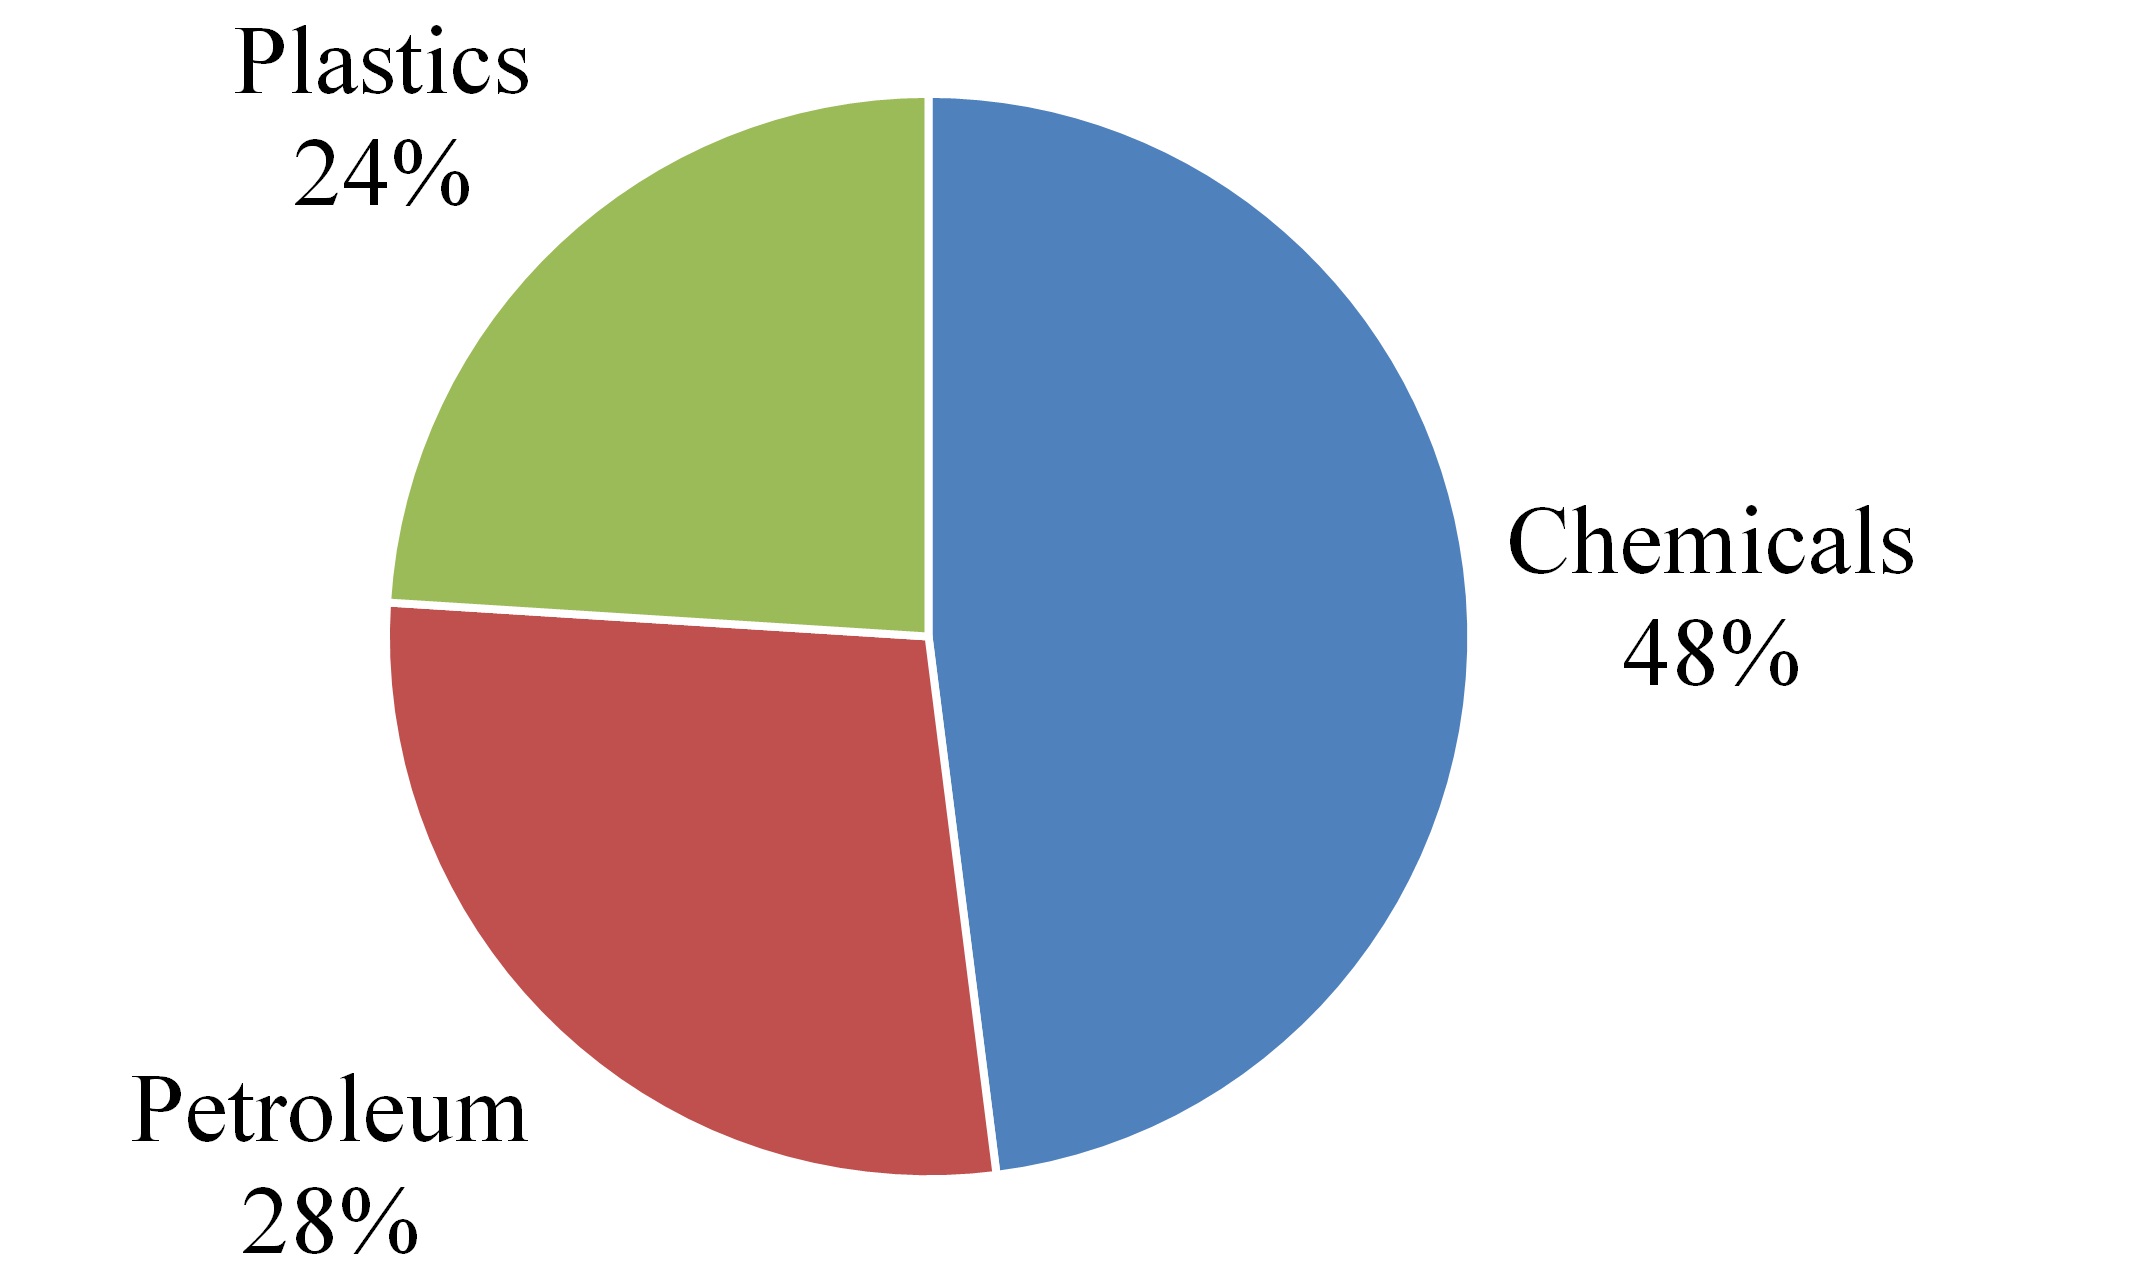 | ||||
29
 | ||||
Industrial and consumer products. Revenues |  | |||
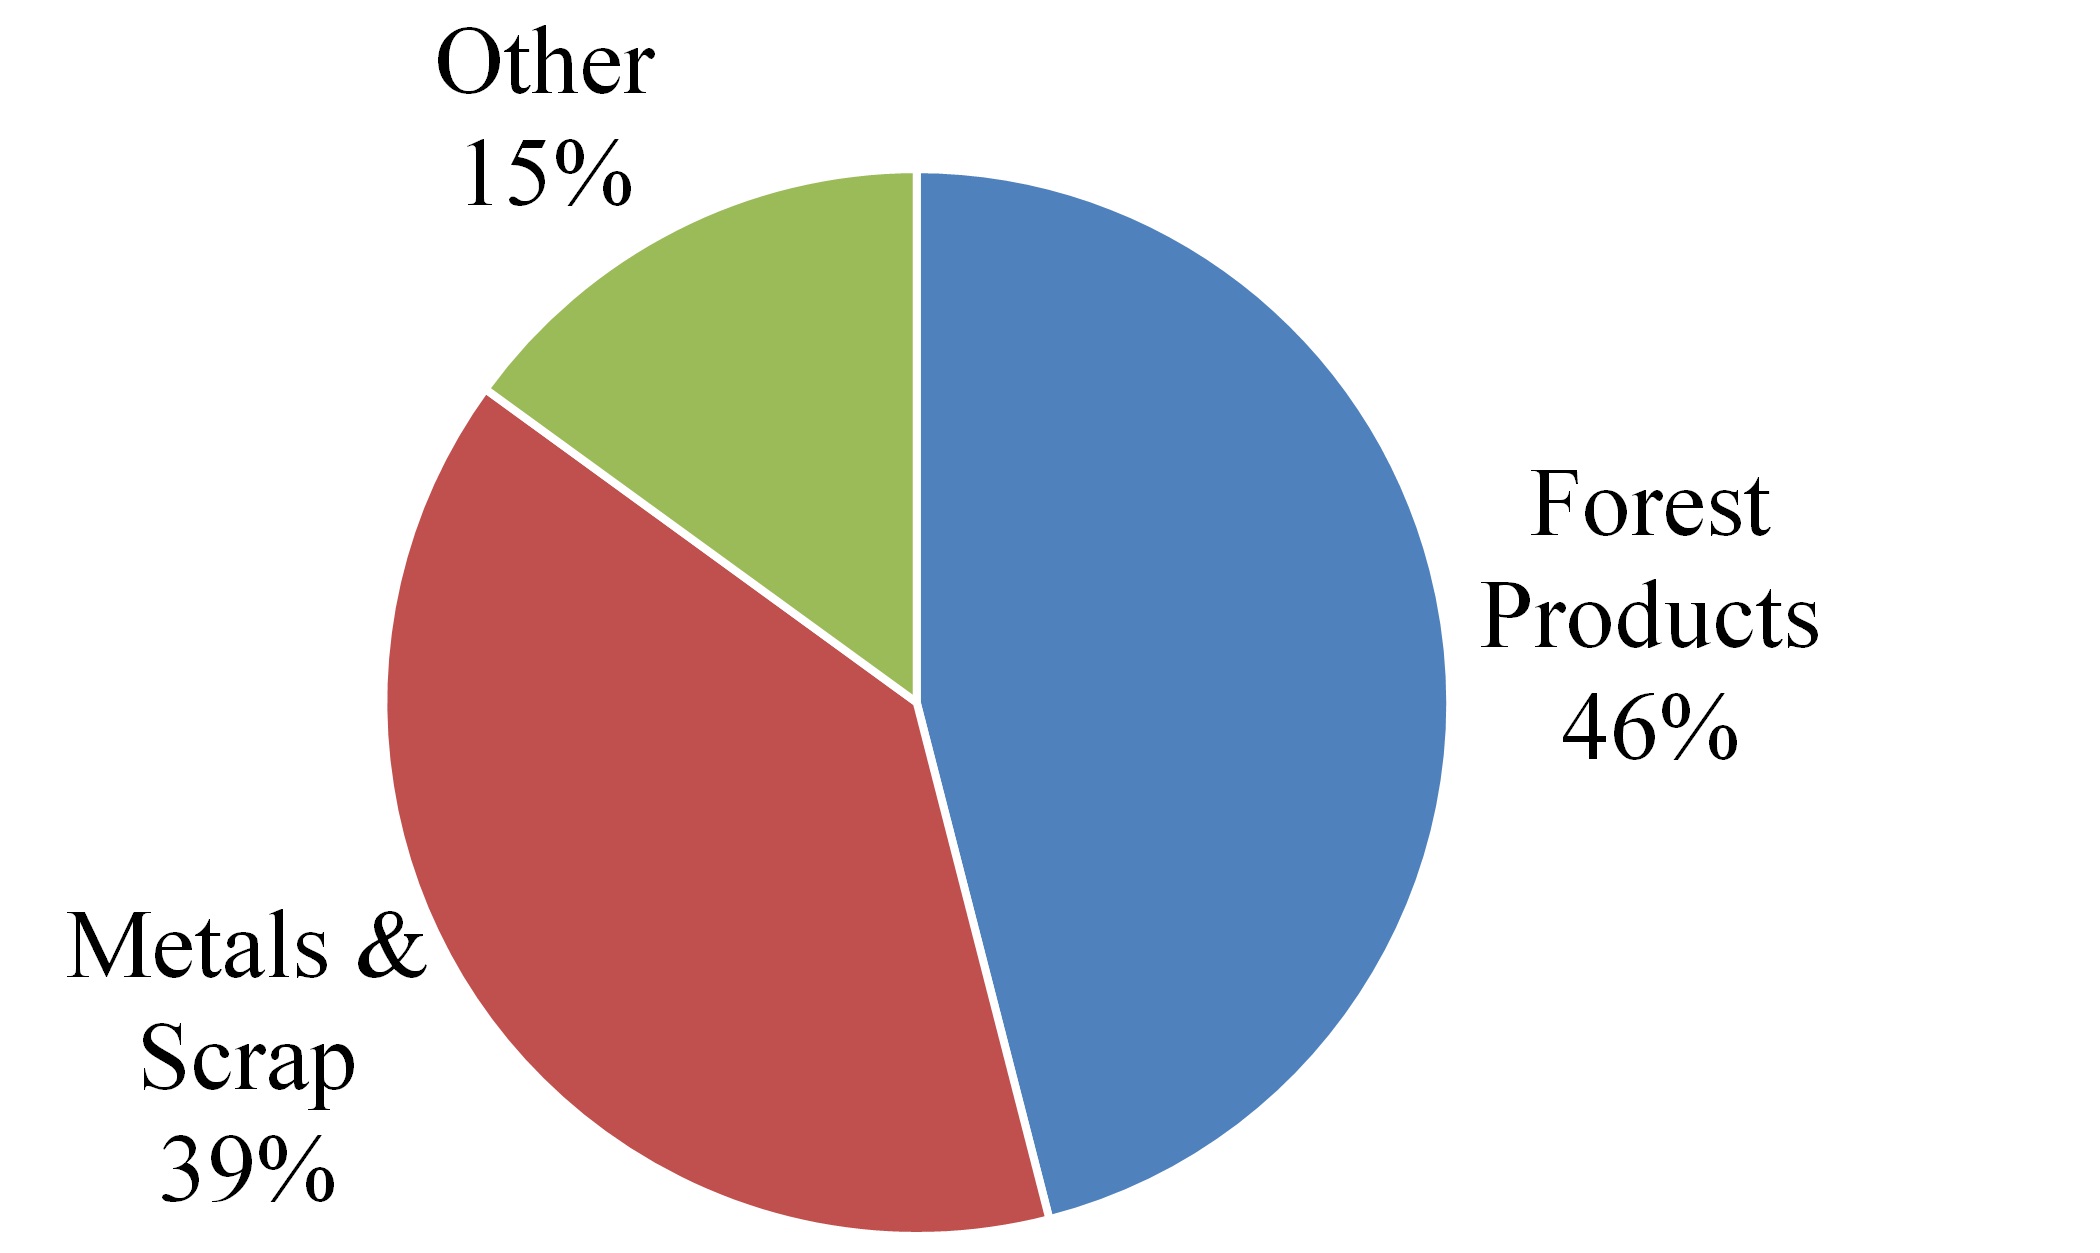 | ||||
Agriculture and minerals. Revenues |  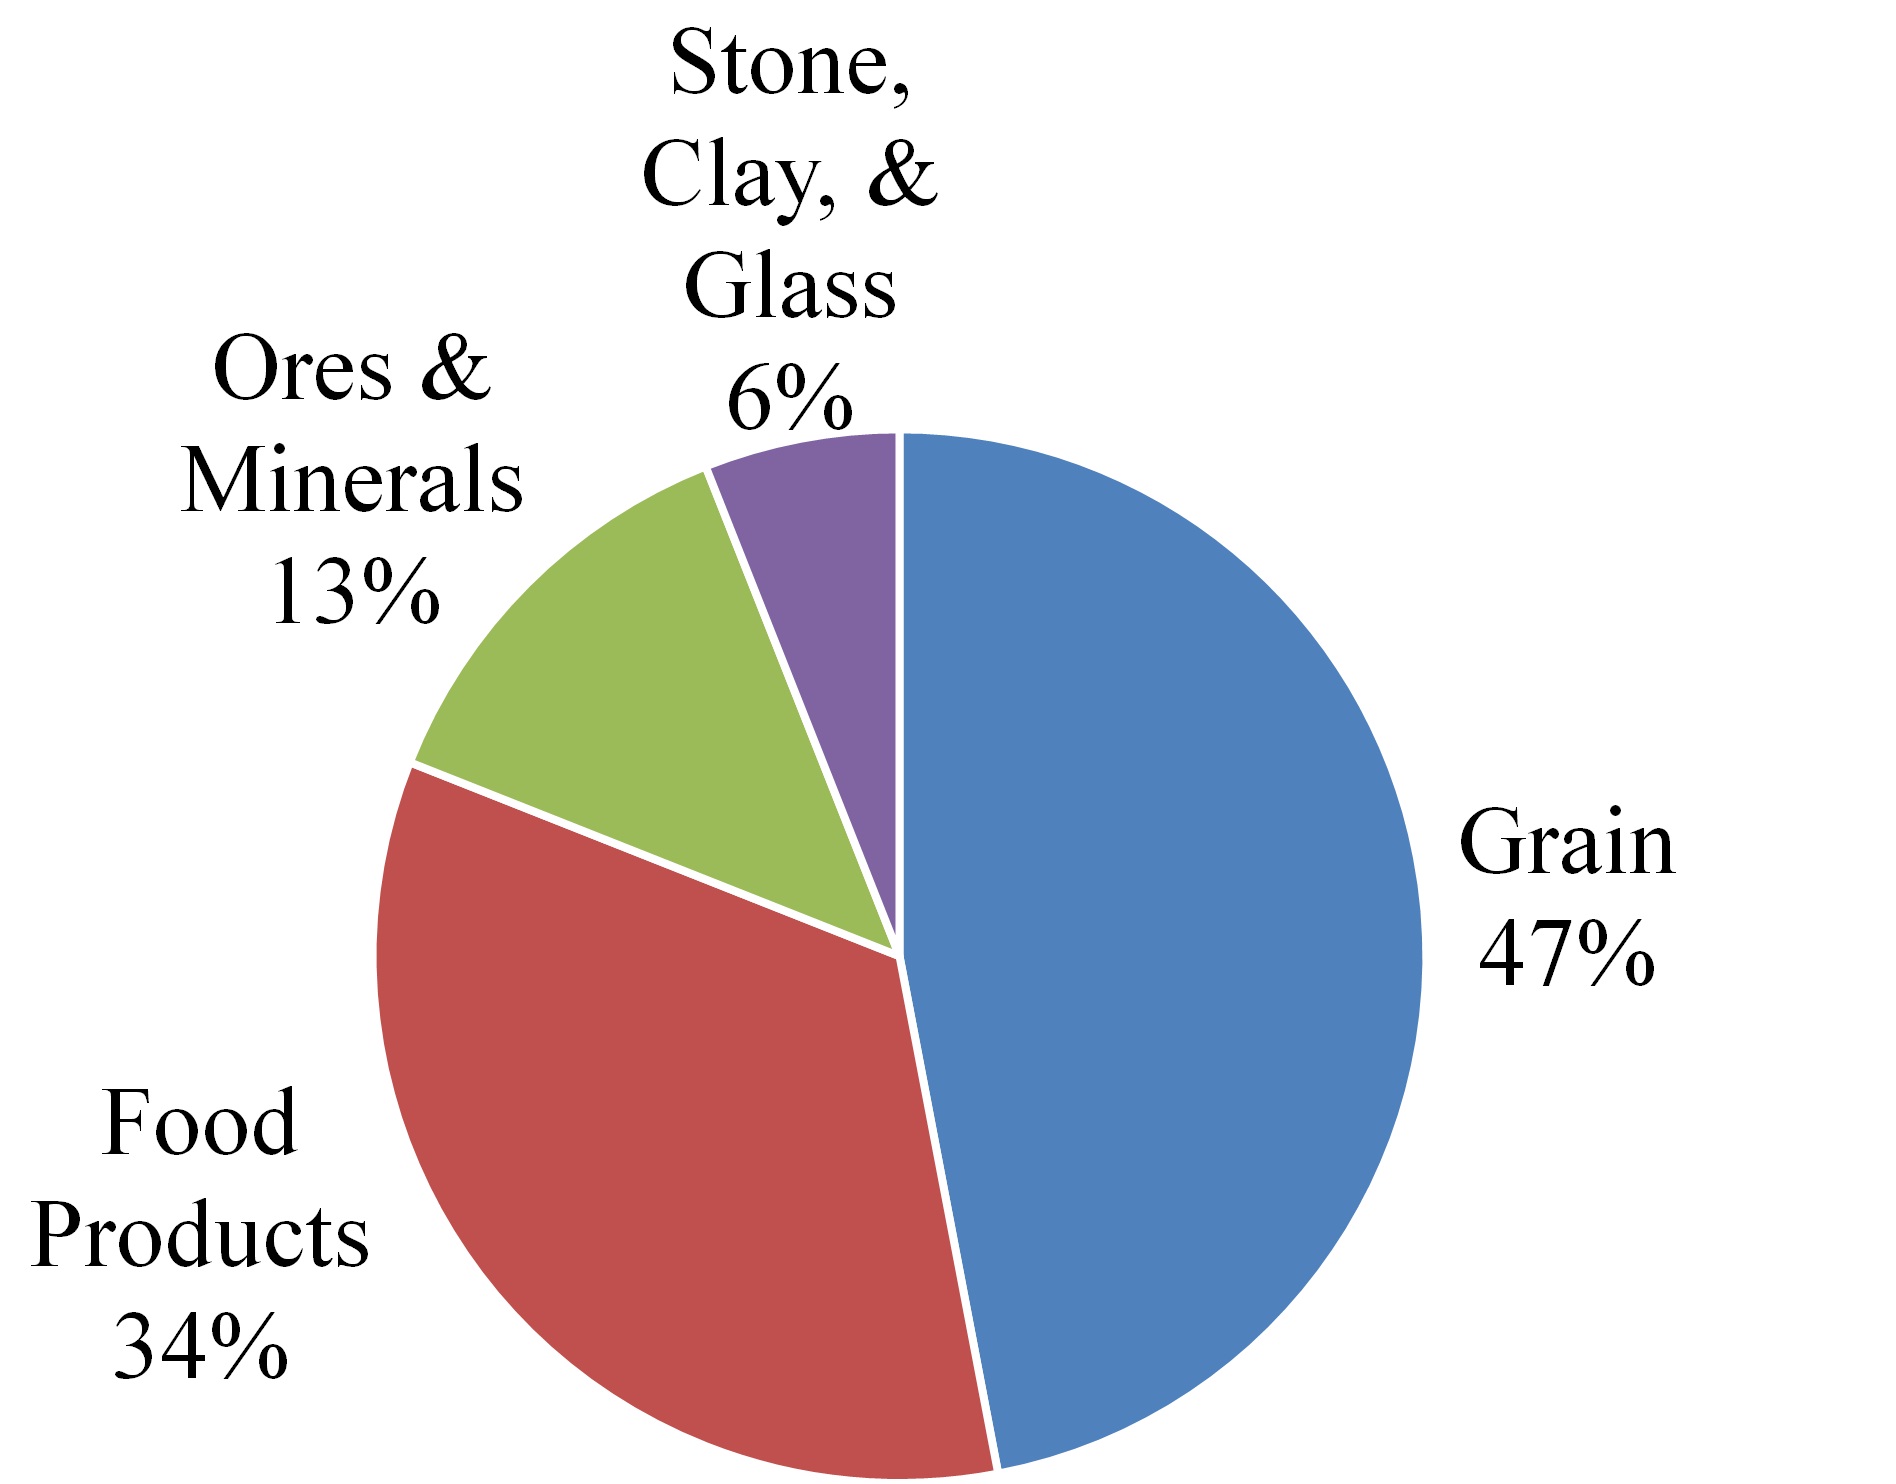 | |||
Coal. Revenues decreased $16.5increased $43.4 million for the year ended December 31, 2009,2011, compared to 2010, primarily due to a reductionincreases in pricing and fuel surcharge and a decline in petroleum coke shipments going to the cement and steel industry markets in Mexico, which continue to be affected by the decline in construction projects. Unit coal volumessurcharge. Revenues to existing electric generation customers increased during 2009; however, related revenue per unit declined primarily due to a reductionre-pricing of coal contracts in fuel surcharge.the second half of 2010.
Intermodal. Revenues decreased $17.2increased $57.6 million for the year ended December 31, 2009,2011, compared to 2010, primarily due to a declineincreases in the fuel surcharge and an unfavorable change in product mix. The decrease in volume is due to the loss of businessvolume. Growth was driven by unfavorable fluctuations in the value of the U.S. dollar against the value of the Mexican peso, reduced demand in consumer retail,increased domestic and aggressive truck competition. The volume reduction was partially offset by an increase in haulage business and a fourth quarter increase in cross border automotive parts shipments.business, conversion of truck traffic to rail and South American/trans-Pacific container volume.
Automotive. Revenues decreased $52.7increased $41.5 million for the year ended December 31, 2009,2011, compared to 2010, primarily due to a declineincreases in volume and unfavorable fluctuations in the value of the U.S. dollar against the value of the Mexican peso.pricing. The volume decreaseincrease was driven by strong year over year growth in North American automobile sales for Original Equipment Manufacturers, new cross border vehicle routings, increased import/export volume through the continued overall downturn inPort of Lazaro Cardenas and the automotive industry caused by consumer uncertainty and tightening credit markets. In addition, the bankruptcyshipment of two U.S. automotive companies resulted in several unscheduled plant shutdowns in the first halfnew automobile models.
30
Operating expensesExpenses
Operating expenses, as shown below (in millions), decreased $249.9increased $158.4 million for the year ended December 31, 2009,2011, when compared to the same period in 2008,2010, primarily due to decreased carload/unithigher volumes, fuel expense, cost containment measures and the effect of favorable fluctuationsincreases in the value of the U.S. dollar against the value of the Mexican peso for operating expenses denominated in Mexican pesos. Certain prior period amounts have been reclassified to conform to the current year presentation.
| Change | ||||||||||||||||
| 2009 | 2008 | Dollars | Percent | |||||||||||||
| Compensation and benefits | $ | 328.8 | $ | 369.9 | $ | (41.1 | ) | (11 | )% | |||||||
| Purchased services | 171.3 | 209.1 | (37.8 | ) | (18 | )% | ||||||||||
| Fuel | 189.4 | 324.6 | (135.2 | ) | (42 | )% | ||||||||||
| Equipment costs | 164.1 | 178.6 | (14.5 | ) | (8 | )% | ||||||||||
| Depreciation and amortization | 182.5 | 168.6 | 13.9 | 8 | % | |||||||||||
| Casualties and insurance | 43.1 | 72.7 | (29.6 | ) | (41 | )% | ||||||||||
| Materials and other | 132.8 | 138.4 | (5.6 | ) | (4 | )% | ||||||||||
| Total operating expenses | $ | 1,212.0 | $ | 1,461.9 | $ | (249.9 | ) | (17 | )% | |||||||
33
34
| Change | ||||||||||||||||
| 2008 | 2007 | Dollars | Percent | |||||||||||||
| Revenues | $ | 1,852.1 | $ | 1,742.8 | $ | 109.3 | 6 | % | ||||||||
| Operating expenses | 1,461.9 | 1,380.4 | 81.5 | 6 | % | |||||||||||
| Operating income | 390.2 | 362.4 | 27.8 | 8 | % | |||||||||||
| Equity in net earnings of unconsolidated affiliates | 18.0 | 11.4 | 6.6 | 58 | % | |||||||||||
| Interest expense | (138.9 | ) | (156.7 | ) | 17.8 | (11 | )% | |||||||||
| Debt retirement costs | (5.6 | ) | (6.9 | ) | 1.3 | (19 | )% | |||||||||
| Foreign exchange loss | (21.0 | ) | (0.9 | ) | (20.1 | ) | 2,233 | % | ||||||||
| Other income, net | 6.0 | 12.0 | (6.0 | ) | (50 | )% | ||||||||||
| Income before income taxes and noncontrolling interest | 248.7 | 221.3 | 27.4 | 12 | % | |||||||||||
| Income tax expense | 64.5 | 67.1 | (2.6 | ) | (4 | )% | ||||||||||
| Net income | 184.2 | 154.2 | 30.0 | 19 | % | |||||||||||
| Noncontrolling interest | 0.3 | 0.4 | (0.1 | ) | (25 | )% | ||||||||||
| Net income attributable to Kansas City Southern and subsidiaries | $ | 183.9 | $ | 153.8 | $ | 30.1 | 20 | % | ||||||||
| Revenues | Carloads and Units | Revenue per Carload/Unit | ||||||||||||||||||||||||||||||||||
| 2008 | 2007 | % Change | 2008 | 2007 | % Change | 2008 | 2007 | % Change | ||||||||||||||||||||||||||||
| Chemical and petroleum | $ | 347.8 | $ | 320.4 | 9 | % | 240.2 | 228.3 | 5 | % | $ | 1,448 | $ | 1,403 | 3 | % | ||||||||||||||||||||
| Industrial and consumer products | 508.6 | 501.1 | 1 | % | 367.6 | 393.8 | (7 | )% | 1,384 | 1,272 | 9 | % | ||||||||||||||||||||||||
| Agriculture and minerals | 455.0 | 403.7 | 13 | % | 293.3 | 297.9 | (2 | )% | 1,551 | 1,355 | 14 | % | ||||||||||||||||||||||||
| Total general commodities | 1,311.4 | 1,225.2 | 7 | % | 901.1 | 920.0 | (2 | )% | 1,455 | 1,332 | 9 | % | ||||||||||||||||||||||||
| Coal | 203.7 | 193.0 | 6 | % | 301.3 | 314.1 | (4 | )% | 676 | 614 | 10 | % | ||||||||||||||||||||||||
| Intermodal | 160.6 | 143.1 | 12 | % | 520.9 | 526.4 | (1 | )% | 308 | 272 | 13 | % | ||||||||||||||||||||||||
| Automotive | 105.6 | 110.9 | (5 | )% | 101.6 | 108.4 | (6 | )% | 1,039 | 1,023 | 2 | % | ||||||||||||||||||||||||
| Subtotal | 1,781.3 | 1,672.2 | 7 | % | 1,824.9 | 1,868.9 | (2 | )% | $ | 976 | $ | 895 | 9 | % | ||||||||||||||||||||||
| Other revenue | 70.8 | 70.6 | — | |||||||||||||||||||||||||||||||||
| Total revenues(i) | $ | 1,852.1 | $ | 1,742.8 | 6 | % | ||||||||||||||||||||||||||||||
| (i) Included in revenues: | ||||||||||||||||||||||||||||||||||||
| Fuel surcharge | $ | 200.3 | $ | 133.2 | ||||||||||||||||||||||||||||||||
35
| Change | ||||||||||||||
| 2011 | 2010 | Dollars | Percent | |||||||||||
| Compensation and benefits | $ | 423.8 | $ | 369.3 | $ | 54.5 | 15 | % | ||||||
| Purchased services | 204.8 | 189.1 | 15.7 | 8 | % | |||||||||
| Fuel | 346.5 | 263.6 | 82.9 | 31 | % | |||||||||
| Equipment costs | 167.1 | 157.4 | 9.7 | 6 | % | |||||||||
| Depreciation and amortization | 186.2 | 184.9 | 1.3 | 1 | % | |||||||||
| Materials and other | 183.9 | 164.0 | 19.9 | 12 | % | |||||||||
| Gain on insurance recoveries related to hurricane damage | (25.6 | ) | — | (25.6 | ) | 100 | % | |||||||
| Total operating expenses | $ | 1,486.7 | $ | 1,328.3 | $ | 158.4 | 12 | % | ||||||
Compensation and benefits. Compensation and benefits increased $54.5 million for the year ended December 31, 2011, compared to 2010, primarily due to annual salary and benefit rate increases and increased carload/unit volumes. In addition, in the third quarter of 2010, the Company recorded a decrease of $6.2 million in KCSM’s post-employment benefit obligations as a result of the completion of negotiations with the Mexican labor union.
Purchased services. Purchased services increased $15.7 million for the year ended December 31, 2011, compared to 2010, due to increases in volume-sensitive costs, primarily locomotive maintenance expense, freight car repairs, truck and terminal services, security and an increase in track structure maintenance expense. These increases were partially offset by higher net joint facility income in the second half of 2011 as a result of non-recurring usage of certain trackage rights.
Fuel. Fuel expense increased $82.9 million for the year ended December 31, 2011, compared to 2010, primarily due to higher diesel fuel prices as the average fuel price per gallon increased by approximately 22% and higher consumption due to an increase in carload/unit volumes.
Equipment costs. Equipment costs increased $9.7 million for the year ended December 31, 2011, compared to 2010 primarily due to the increase in the use of other railroads’ freight cars due to increased traffic volumes. These increases were partially offset by lower locomotive lease expense primarily due to the acquisition of 75 locomotives during the third quarter of 2011, which were previously leased by the Company under an operating lease agreement.
Depreciation and amortization. Depreciation and amortization increased $1.3 million for the year ended December 31, 2011, compared to 2010, primarily due to a larger asset base offset by changes in depreciation rates on certain locomotives and road assets based on reassessment of the adequacy of the accumulated depreciation provisions, asset usage and replacement patterns, which were effective October 1, 2010.
Materials and other. Materials and other increased $19.9 million for the year ended December 31, 2011, compared to 2010, primarily due to higher materials and supplies expense and casualty expense. The Company expects materials and other expense to increase by approximately $4.0 million for the year ending December 31, 2012 due to an increase in the concession duty rate. KCSM currently pays concession duty expense of 0.5% of gross revenues and beginning on June 24, 2012, KCSM will pay 1.25% of gross revenues for the remaining years of the Concession.
Gain on insurance recoveries related to hurricane damage. In the third quarter of 2011, the Company settled its insurance claims related to Hurricane Alex and recognized a $25.6 million gain on insurance recoveries which primarily represents the recovery of lost profits and the replacement value of property in excess of its carrying value, net of the self-insured retentions.
31
Non-Operating Expenses
Equity in net earnings of unconsolidated affiliates. Equity in earnings from unconsolidated affiliates decreased $1.5 million for the year ended December 31, 2011, compared to 2010. Significant components of this change were as follows:
Equity in earnings of PCRC increased by $2.7 million for the year ended December 31, 2011, compared to 2010, primarily due to an increase in container volume attributable to the improvement in the economy.
Equity in earnings of Southern Capital decreased by $3.5 million for the year ended December 31, 2011, compared to 2010, primarily due to recognizing a gain on sale of railcars and other equipment in 2010.
KCSM’s equity in earnings of FTVM decreased by $0.4 million for the year ended December 31, 2011, compared to 2010, primarily due to higher operating expenses.
Interest expense. Interest expense decreased $29.0 million for the year ended December 31, 2011, compared to 2010, primarily due to lower average interest rates and average debt balances. For the years ended December 31, 2011 and 2010, the average debt balances were $1,656.7 million and $1,787.5 million, respectively.
Debt retirement costs. Debt retirement costs were $38.7 million and $68.3 million for the years ended December 31, 2011 and 2010, respectively. On December 15, 2011, the Company redeemed all of the outstanding $123.5 million aggregate principal amount of the 13.0% senior unsecured notes due December 15, 2013 (the “13.0% Senior Notes”) and recognized $24.5 million in debt retirement costs related to the call premium and the write-off of unamortized debt issuance costs. On July 12, 2011, KCSR entered into an amended and restated credit agreement and wrote off $3.9 million in unamortized debt issuance costs related to the previous credit agreement. During 2011, KCSM purchased and redeemed the remaining $32.4 million principal amount of its 7 5/8% senior unsecured notes due December 1, 2013 (the “75/8% Senior Notes”) and all of the outstanding $165.0 million aggregate principal amount of its 7 3/8% senior unsecured notes due June 1, 2014 (the “73/8% Senior Notes”). KCSM recognized associated debt retirement cost of $10.3 million related to the call and tender premiums and the write-off of unamortized debt issuance costs. On December 20, 2010, KCSM purchased $142.6 million principal amount of the 7 5/8% Senior Notes and $31.9 million principal amount of the 12 1/2% senior unsecured notes due April 1, 2016 (the “121/2% Senior Notes”) and recognized debt retirement costs of $19.0 million related to the tender premiums and the write-off of unamortized debt issuance costs and original issue discount. On September 30, 2010, KCSM redeemed the remaining $63.7 million principal amount of the 9 3/8% senior unsecured notes due May 1, 2012 (the “93/8% Senior Notes”) and recognized debt retirement costs of $1.9 million related to the call premium and the write-off of unamortized debt issuance costs. On June 4, 2010, the Company redeemed $66.5 million principal amount of the 13.0% Senior Notes issued by KCSR, $70.0 million principal amount of the 12 1/2% Senior Notes issued by KCSM and $100.0 million principal amount of the 9 3/8% Senior Notes issued by KCSM, and paid $19.7 million of call premiums and other expenses related to the redemptions. In addition, the Company wrote-off $12.8 million of unamortized debt issuance costs and original issue discounts associated with the redemption of the notes. In the first quarter of 2010, KCSM purchased $296.3 million of the 9 3/8% Senior Notes. The Company recorded debt retirement costs of $14.9 million related to the tender premium and the write-off of unamortized debt issuance costs.
Foreign exchange. Fluctuations in the value of the Mexican peso was not significantagainst the value of the U.S. dollar for the years ended December 31, 2011 and 2010 resulted in a foreign exchange loss of $9.2 million and a foreign exchange gain of $4.7 million, respectively.
Other income, net. Other income, net, decreased $2.5 million for the year ended December 31, 2008.2011 compared to the same period in 2010, primarily due to lower gains on sale of land and miscellaneous income.
Income tax expense. Income tax expense increased $13.9 million for the year ended December 31, 2011, compared to 2010, due to higher pre-tax income partially offset by foreign exchange rate fluctuations. The effective income tax rate was 27.1% and 37.8% for the years ended December 31, 2011 and 2010, respectively. The decrease in the effective tax rate was due to foreign exchange rate fluctuations, partially offset by the recognition of a tax benefit in 2010 for the reduction of a deferred tax asset valuation allowance in Mexico.
32
Year Ended December 31, 2010, compared with the Year Ended December 31, 2009
The following summarizes KCS’s consolidated income statement components (in millions):
| 2010 | 2009 | Change Dollars | |||||||||
| Revenues | $ | 1,814.8 | $ | 1,480.2 | $ | 334.6 | |||||
| Operating expenses | 1,328.3 | 1,213.4 | 114.9 | ||||||||
| Operating income | 486.5 | 266.8 | 219.7 | ||||||||
| Equity in net earnings of unconsolidated affiliates | 19.7 | 7.7 | 12.0 | ||||||||
| Interest expense | (158.1 | ) | (173.7 | ) | 15.6 | ||||||
| Debt retirement costs | (68.3 | ) | (5.9 | ) | (62.4 | ) | |||||
| Foreign exchange gain | 4.7 | 2.1 | 2.6 | ||||||||
| Other income, net | 4.7 | 5.2 | (0.5 | ) | |||||||
| Income before income taxes | 289.2 | 102.2 | 187.0 | ||||||||
| Income tax expense | 109.2 | 34.1 | 75.1 | ||||||||
| Net income | 180.0 | 68.1 | 111.9 | ||||||||
| Less: Net income (loss) attributable to noncontrolling interest | (0.2 | ) | 1.0 | (1.2 | ) | ||||||
| Net income attributable to Kansas City Southern and subsidiaries | $ | 180.2 | $ | 67.1 | $ | 113.1 | |||||
Revenues
The following summarizes revenues (in millions) and carload/unit statistics (in thousands) and revenue per carload/unit:
| Revenues | Carloads and Units | Revenue per Carload/Unit | ||||||||||||||||||||||||||||
| 2010 | 2009 | % Change | 2010 | 2009 | % Change | 2010 | 2009 | % Change | ||||||||||||||||||||||
| Chemical and petroleum | $ | 363.2 | $ | 323.4 | 12 | % | 249.4 | 238.3 | 5 | % | $ | 1,456 | $ | 1,357 | 7 | % | ||||||||||||||
| Industrial and consumer products | 426.7 | 344.4 | 24 | % | 309.9 | 267.0 | 16 | % | 1,377 | 1,290 | 7 | % | ||||||||||||||||||
| Agriculture and minerals | 429.1 | 360.0 | 19 | % | 268.1 | 246.3 | 9 | % | 1,601 | 1,462 | 10 | % | ||||||||||||||||||
| Total general commodities | 1,219.0 | 1,027.8 | 19 | % | 827.4 | 751.6 | 10 | % | 1,473 | 1,367 | 8 | % | ||||||||||||||||||
| Coal | 238.6 | 187.2 | 27 | % | 282.5 | 301.2 | (6 | %) | 845 | 622 | 36 | % | ||||||||||||||||||
| Intermodal | 194.2 | 143.4 | 35 | % | 678.4 | 516.4 | 31 | % | 286 | 278 | 3 | % | ||||||||||||||||||
| Automotive | 97.7 | 52.9 | 85 | % | 71.1 | 51.7 | 38 | % | 1,374 | 1,023 | 34 | % | ||||||||||||||||||
| Carload revenues, carloads and units | 1,749.5 | 1,411.3 | 24 | % | 1,859.4 | 1,620.9 | 15 | % | $ | 941 | $ | 871 | 8 | % | ||||||||||||||||
| Other revenue | 65.3 | 68.9 | (5 | %) | ||||||||||||||||||||||||||
| Total revenues (i) | $ | 1,814.8 | $ | 1,480.2 | 23 | % | ||||||||||||||||||||||||
| (i) Included in revenues: | ||||||||||||||||||||||||||||||
| Fuel surcharge | $ | 156.1 | $ | 77.9 | ||||||||||||||||||||||||||
Freight revenues include both revenue for transportation services and fuel surcharges. For the year ended December 31, 2010, revenues increased $334.6 million compared to the prior year, primarily due to the overall increase in carload/unit volumes resulting from the improvement in the economy and the conversion of traffic to rail, positive pricing impacts and increased fuel surcharge. In the third quarter of 2010, revenues for certain commodity groups were affected by Hurricane Alex as customers were required to use alternate carriers or modes of transportation until rail service was restored. The Company estimates the related effect on its 2010 financial results was approximately $40.0 million of lost revenue before related avoided
33
costs. Revenue per carload/unit increased by 8% for the year ended December 31, 2010, compared to the same period in 2009 reflecting favorable commodity mix in addition to the factors discussed above. The effect of fluctuations in the value of the Mexican peso against the value of the U.S. dollar was not significant.
KCS’s fuel surcharge is a mechanism to adjust revenue based upon changing fuel prices. Fuel surcharges are calculated differently depending on the type of commodity transported. For most commodities, fuel surcharge is calculated using a fuel price from a prior time period that can be as much as 60 days earlier. In a period of volatile fuel prices or changing customer business mix, changes in fuel expense and fuel surcharge may significantly differ.
The following discussion provides an analysis of revenues by commodity group.group:
Revenues by commodity
group for 2010
Chemical and petroleum. Revenues increased | 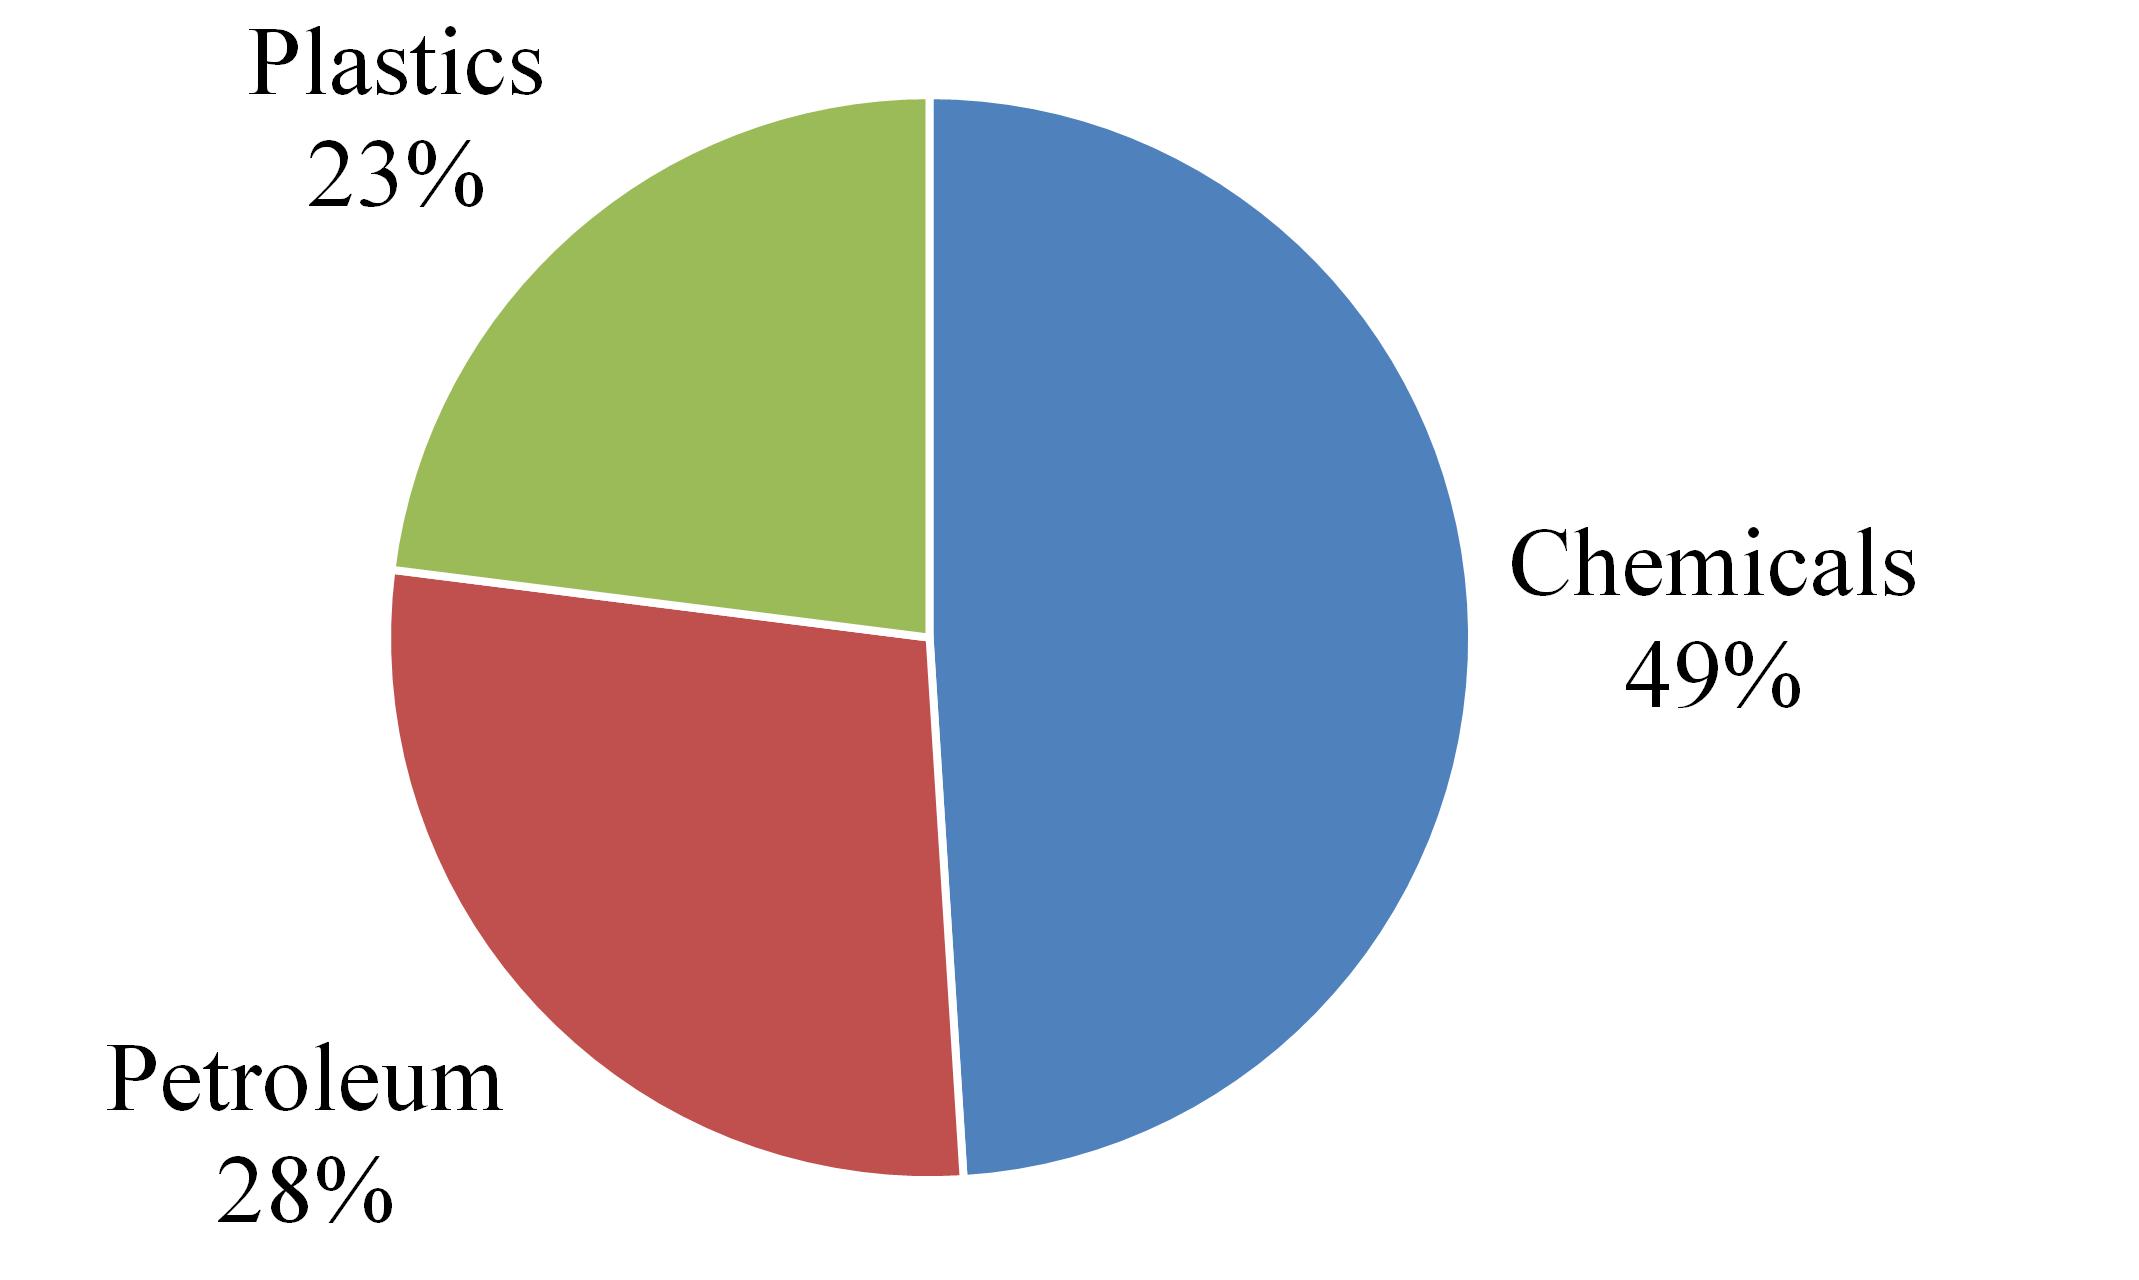 | ||||
 | ||||
Industrial and consumer products. Revenues increased | 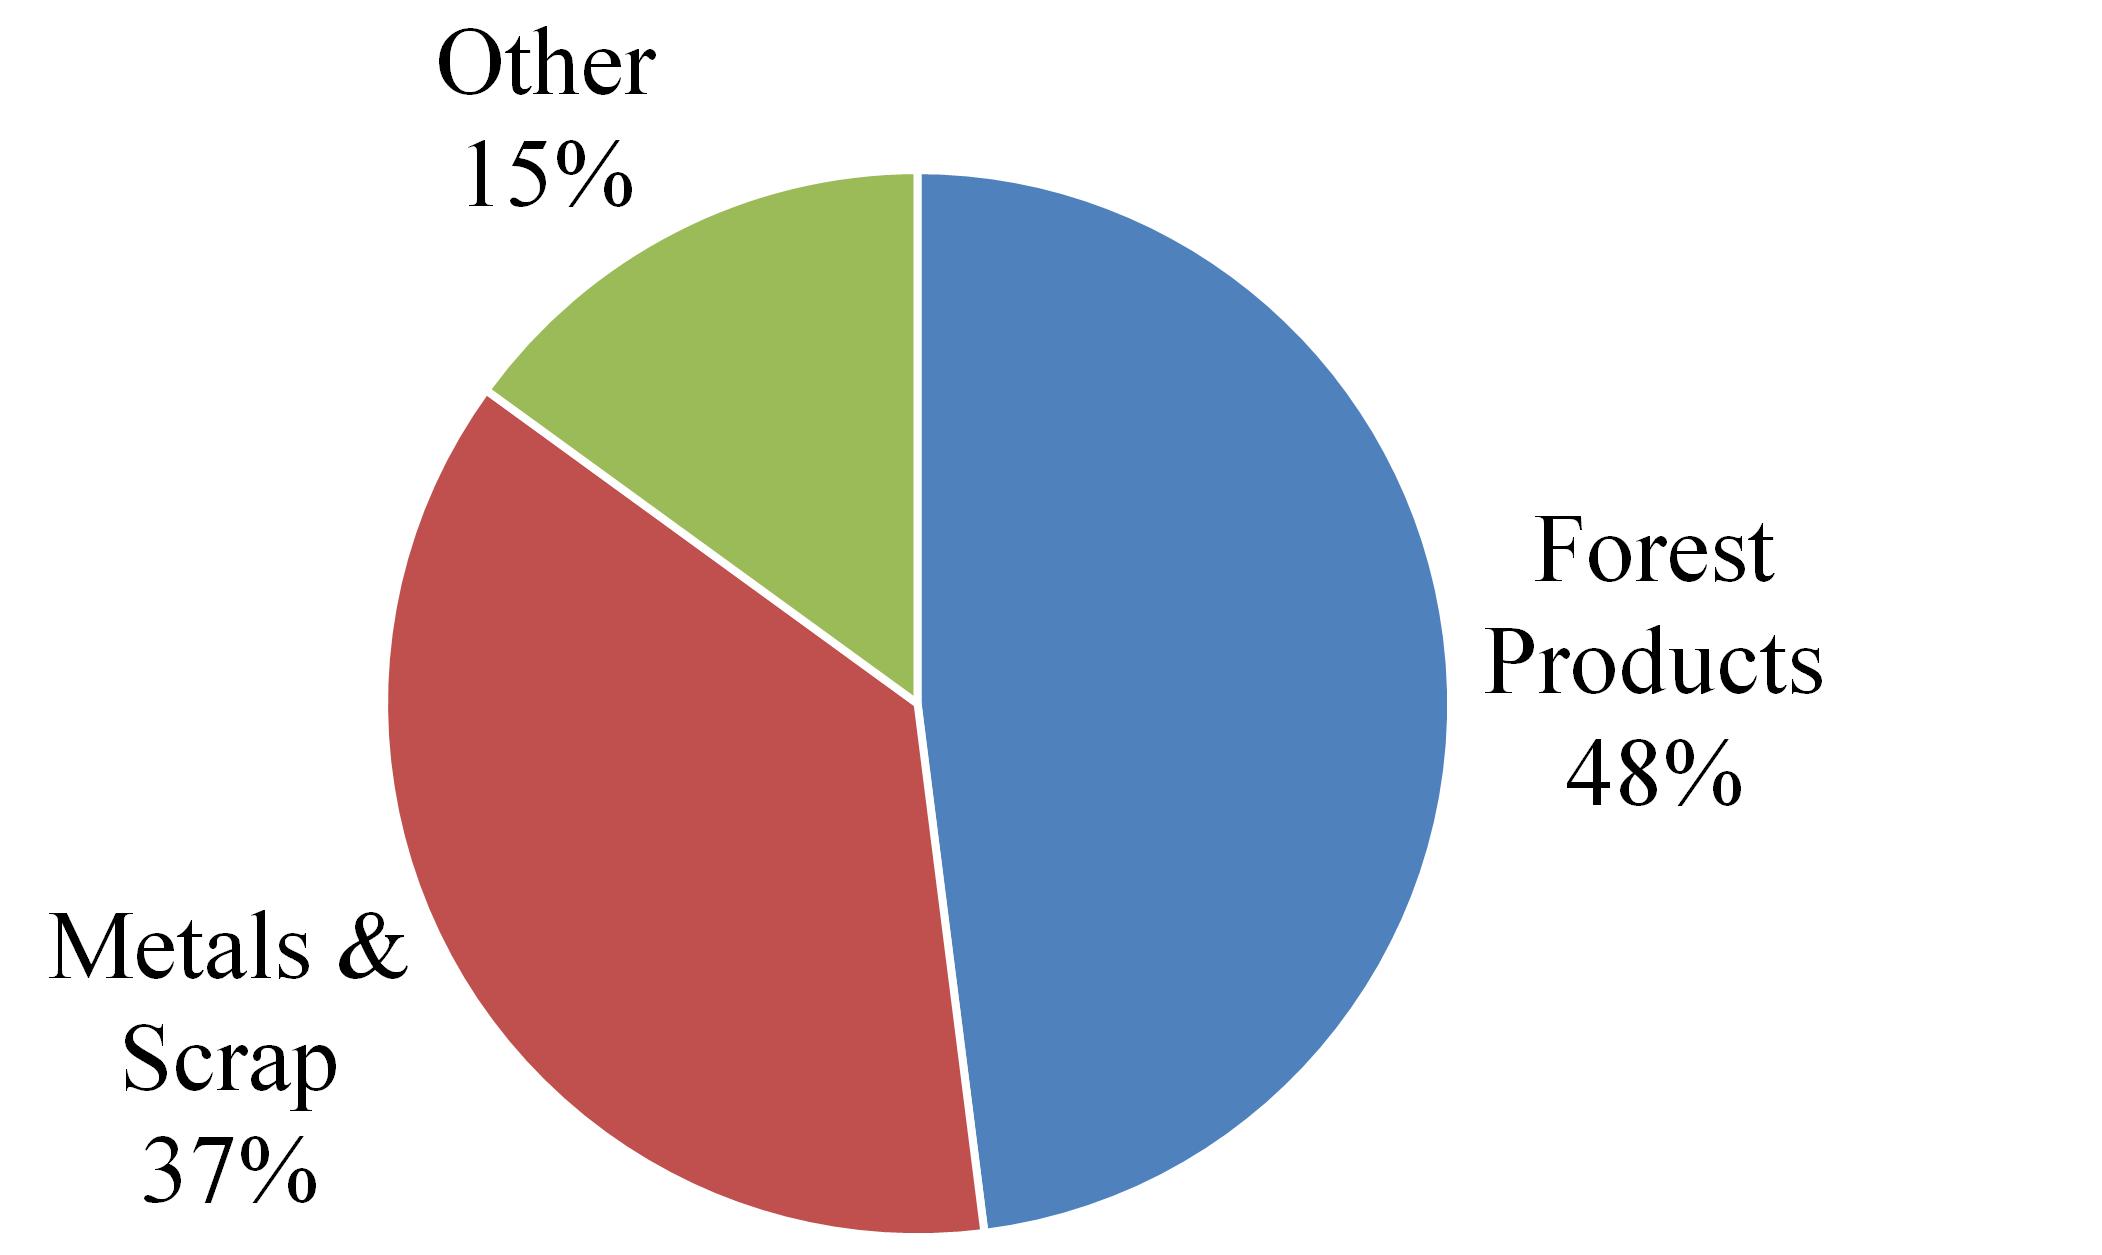 | |||
 | ||||
Agriculture and minerals. Revenues increased |  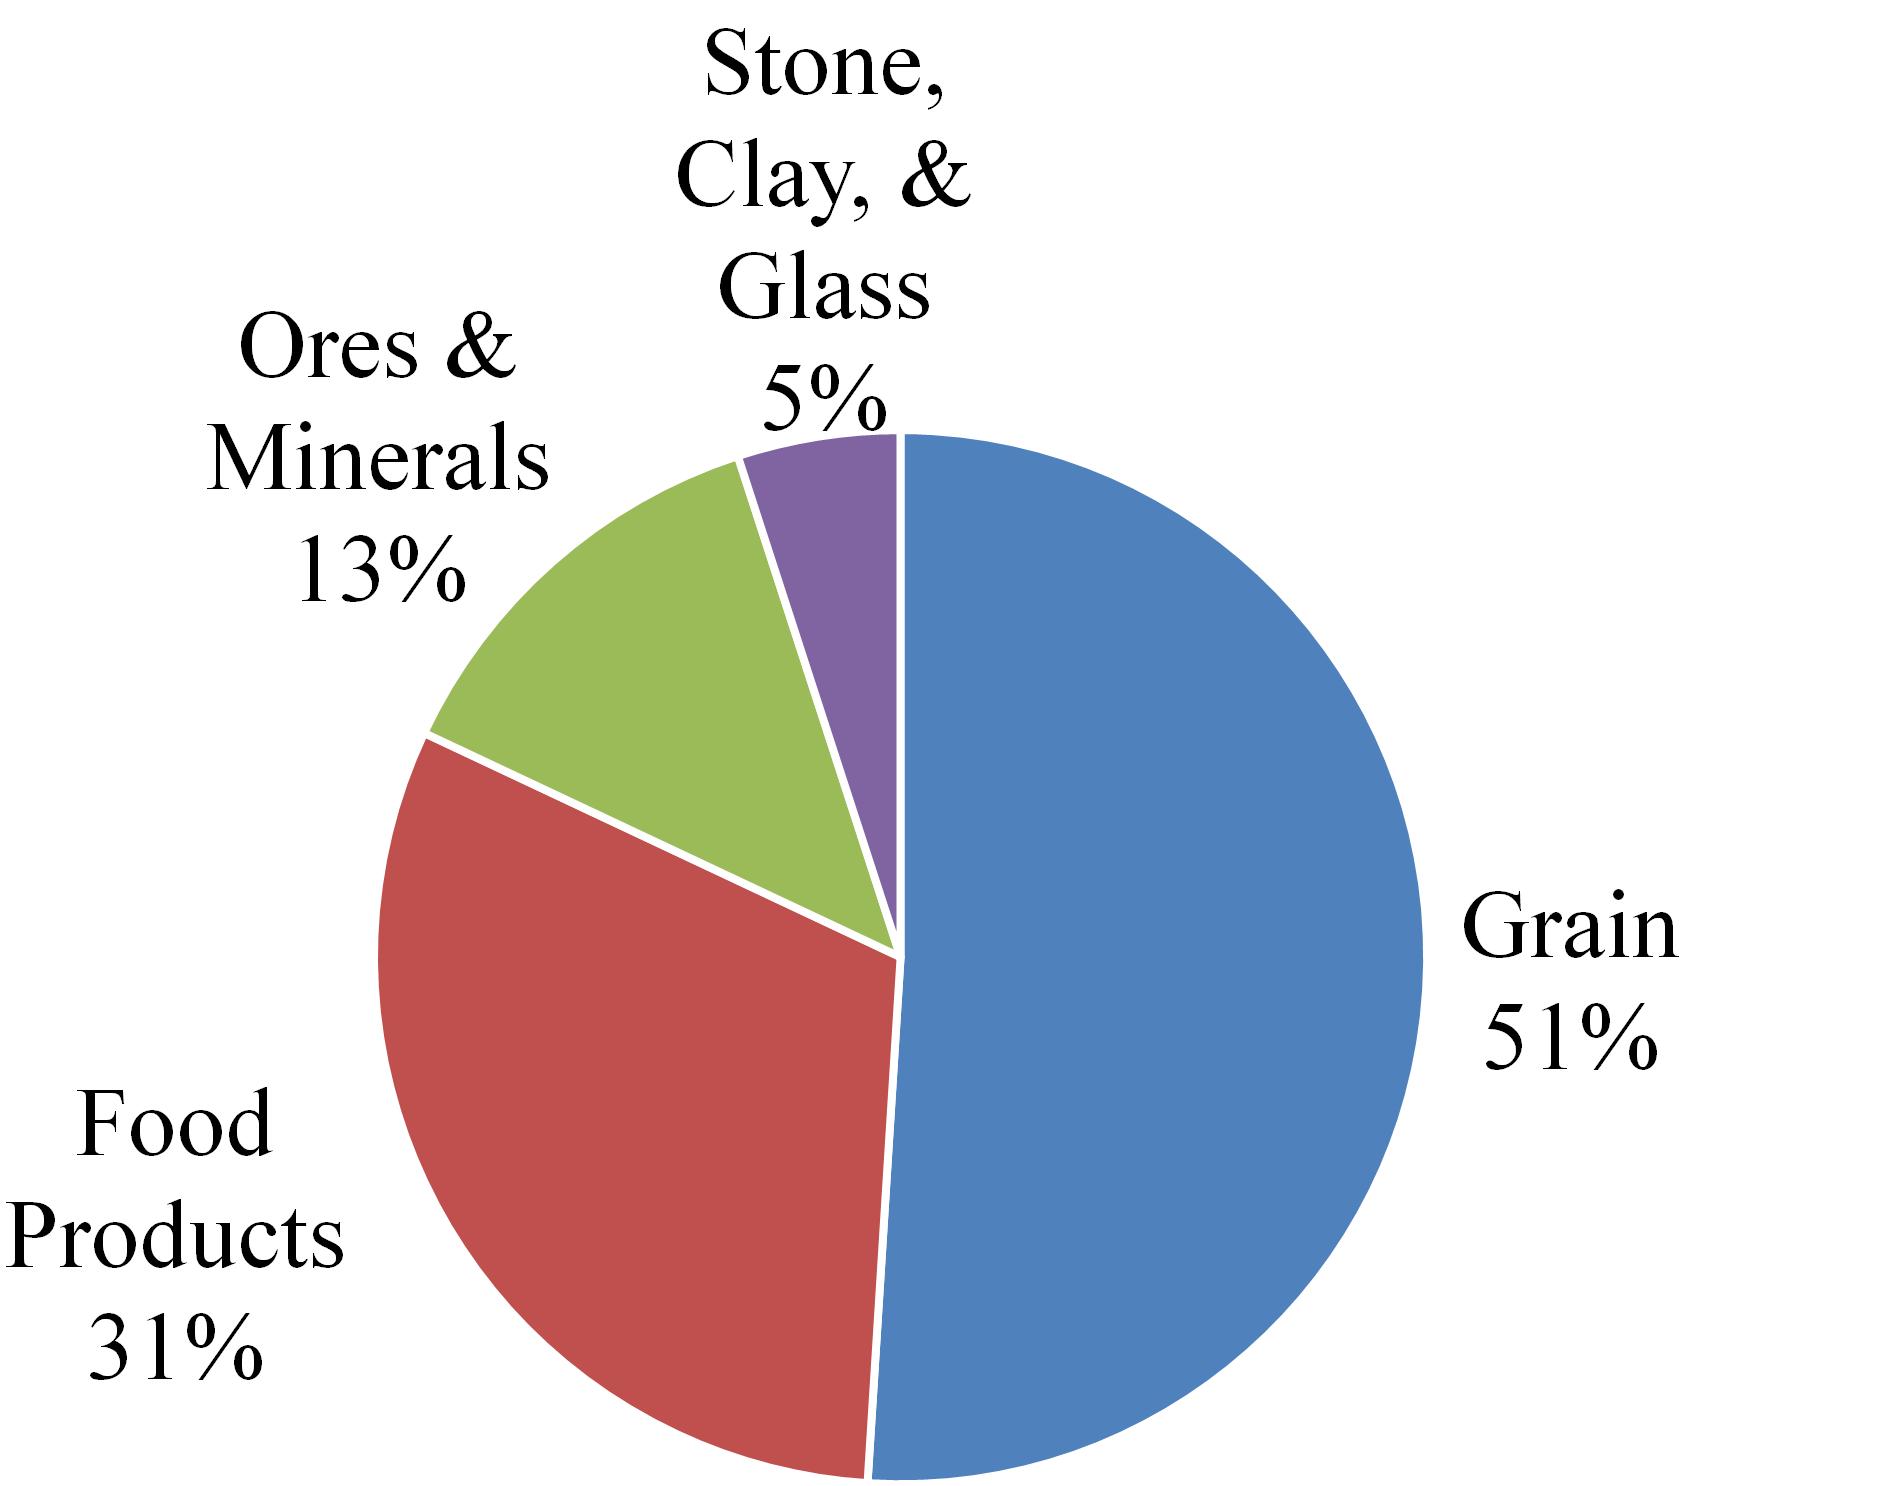 | |||
Coal. Revenues increased $10.7$51.4 million for the year ended December 31, 2008,2010, compared to 2009, primarily due to increases in pricing and fuel surcharge. Revenues to existing electric generation customers increased due to re-pricing of coal contracts and increased fuel surcharge, which was partially offset by lower unit coal volumes.
34
Intermodal. Revenues increased $50.8 million for the year ended December 31, 2010, compared to 2009, primarily due to an increase in fuel surcharge participation,volume. Growth was driven by increased lengthautomotive parts traffic, conversion of haul, rate increases,cross border truck traffic to rail, trans-Pacific container volume, the emergence of cross border international cargo and improved system velocity on coal trainsimprovement in the second half of 2008. The increase was partially offset by lower volumes during the first half of 2008 due to higher stockpile levels, utility customer maintenance outages, and adverse weather in the Midwest affecting deliveries.economy.
Operating Expenses
Operating expenses, as shown below (in millions), increased and were offset by decreases in automotive related traffic (parts distribution) as well as certain haulage business.
| Change | ||||||||||||||
| 2010 | 2009 | Dollars | Percent | |||||||||||
| Compensation and benefits | $ | 369.3 | $ | 328.7 | $ | 40.6 | 12 | % | ||||||
| Purchased services | 189.1 | 173.7 | 15.4 | 9 | % | |||||||||
| Fuel | 263.6 | 189.4 | 74.2 | 39 | % | |||||||||
| Equipment costs | 157.4 | 164.1 | (6.7 | ) | (4 | %) | ||||||||
| Depreciation and amortization | 184.9 | 181.6 | 3.3 | 2 | % | |||||||||
| Materials and other | 164.0 | 175.9 | (11.9 | ) | (7 | %) | ||||||||
| Total operating expenses | $ | 1,328.3 | $ | 1,213.4 | $ | 114.9 | 9 | % | ||||||
Compensation and tightening credit markets have automobile manufacturers re-tooling factories to build more fuel efficient vehicles as well as developing programs to incent the purchase of new cars. The overall decrease was partially offset by targeted rate increasesbenefits. Compensation and new longer haul traffic in the first half of 2008.
36
benefits increased Operating expenses$40.6 million
Purchased services. Purchased services increased $15.4 million for the year ended December 31, 2008. The following summarizes2010, compared to 2009, due to increases in volume-sensitive costs, primarily security and terminal services. In addition, the Company’s operating expenses(in millions).Certain prior period amounts have been reclassified to conformCompany recognized a deferred credit of $6.1 million related to the current year presentation.partial cancellation of a maintenance contract in 2009. These increases were partially offset by lower locomotive maintenance as a result of a newer locomotive fleet and having fewer locomotives covered by maintenance agreements.
| Change | ||||||||||||||||
| 2008 | 2007 | Dollars | Percent | |||||||||||||
| Compensation and benefits | $ | 369.9 | $ | 384.0 | $ | (14.1 | ) | (4 | )% | |||||||
| Purchased services | 209.1 | 198.4 | 10.7 | 5 | % | |||||||||||
| Fuel | 324.6 | 270.2 | 54.4 | 20 | % | |||||||||||
| Equipment costs | 178.6 | 184.6 | (6.0 | ) | (3 | )% | ||||||||||
| Depreciation and amortization | 168.6 | 159.0 | 9.6 | 6 | % | |||||||||||
| Casualties and insurance | 72.7 | 69.3 | 3.4 | 5 | % | |||||||||||
| Materials and other | 138.4 | 114.9 | 23.5 | 20 | % | |||||||||||
| Total operating expenses | $ | 1,461.9 | $ | 1,380.4 | $ | 81.5 | 6 | % | ||||||||
Equipment costs. Equipment costs decreased $6.0$6.7 million for the year ended December 31, 2008,2010, compared to 2007,2009 primarily due to a decreaselower freight car equipment lease expense which was partially offset by the increase in the use of other railroads’ freight cars.cars due to increased traffic volumes.
Depreciation and amortization. Depreciation and amortization increased $9.6$3.3 million for the year ended December 31, 2008,2010, compared to 2007,2009, primarily due to a larger asset base. The increase was partially offset by a decrease in amortization expense due to extending the estimated useful lives of certain Mexican concession assets, which was effective as of October 1, 2009. The increase was also partially offset by changes in depreciation rates on certain locomotive and road assets based on reassessment of the adequacy of the accumulated depreciation provisions, asset usage and replacement patterns which were effective October 1, 2010. Net depreciation expense on the asset base as of year-end 2010 will be lower on an annual basis by approximately $4.2 million as a result of these rate changes.
35
Non-Operating Expenses
Equity in Net Earningsnet earnings of Unconsolidated Affiliates.unconsolidated affiliates. Equity in earnings from unconsolidated affiliates was $18.0increased $12.0 million and $11.4 million for the yearsyear ended December 31, 2008 and 2007, respectively.2010, compared to 2009. Significant components of this change were as follows:
37
Equity in earnings of Southern Capital increased by $3.3 million for the year ended December 31, 2010, compared to 2009, primarily due to recognizing a gain on sale of railcars and other equipment in 2010.
KCSM’s equity in earnings of FTVM increased by $1.9 million for the year ended December 31, 2010, compared to 2009, primarily due to an increase in volumes.
Interest expense. Interest expense decreased $15.6 million for the year ended December 31, 2010, compared to 2009, primarily due to lower average debt balances and interest rates related torates. For the years ended December 31, 2010 and 2009, the average debt refinancing as well as lower accrued interest for various tax related matters as a result of certain settlements in the second quarter of 2008.balances were $1,787.5 million and $2,016.5 million, respectively.
Debt Retirement Costs.retirement costs. Debt retirement costs decreased $1.3were $68.3 million and $5.9 million for the yearyears ended December 31, 2008, compared to2010 and 2009, respectively. On December 20, 2010, KCSM purchased $142.6 million principal amount of the year ended December 31, 2007. In May 2008, KCSR redeemed its 971 5/28% Senior Notes and $31.9 million principal amount of the 12 1/2% Senior Notes and recognized debt retirement costs of $19.0 million related to the tender premiums and the write-off of unamortized debt issuance costs and original issue discount. On September 30, 2010, KCSM redeemed the remaining $63.7 million principal amount of the 9 3/8% Senior Notes and recognized debt retirement costs of $1.9 million related to the call premium and the write-off of unamortized debt issuance costs. On June 4, 2010 the Company redeemed $66.5 million principal amount of the 13.0% Senior Notes issued by KCSR, $70.0 million principal amount of the 12 1/2% Senior Notes issued by KCSM and $100.0 million principal amount of the 9 3/8% Senior Notes issued by KCSM, and paid $19.7 million of call premiums and other expenses related to the redemptions. In addition, the Company wrote-off $12.8 million of unamortized debt issuance costs and original issue discounts associated with the redemption of the notes. In the first quarter of 2010, KCSM purchased $296.3 million of the 9 3/8% Senior Notes. The Company recorded debt retirement costs of $14.9 million related to the tender premium and the write-off of unamortized debt issuance costs. In January 2009, KCSR purchased its 7 1/2% senior unsecured notes due October June 15, 2009 (the “71 2008/2% Senior Notes”) and expensed $5.6$5.3 million for cash tender offer expenses and unamortized debt issuance costs. In June ofaddition, in March 2009, KCSM repaid all amounts outstanding under the 2007 KCSM redeemed its 121/2% Senior Notes due 2012Credit Agreement and entered into a new bank credit agreement. The charge of $16.7upon termination, wrote-off $0.6 million for the call premium and the write-off of unamortized debt issuance costs associated withrelated to this debt.
Foreign exchange. Fluctuations in the extinguished debt was partially offset by the $9.8 million write offvalue of the unamortized purchase accounting fair value effect related to the 121/2% Senior Notes.
Other Income,income, net. Other income, net, decreased $6.0$0.5 million for the year ended December 31, 20082010 compared to the same period in 2007,2009, primarily due to lower interest and dividend income, and fewerhigher gains on salessale of land recognized in 2008 as compared to the same period2009. The decrease was partially offset by an increase in 2007.miscellaneous income in 2010.
Income Tax Expense.tax expense. For the year ended December 31, 2008,2010, the Company’s income tax expense was $64.5$109.2 million a decrease, an increase of $2.6$75.1 million as compared to $67.1$34.1 million for the year ended December 31, 2007.2009. The increase in income tax expense was primarily due to higher pre-tax income. The effective income tax rate was 37.8% and 33.4% for the years ended December 31, 2010 and 2009, respectively. The increase in the effective tax rate was 25.9% and 30.3%primarily due to the recognition of a tax benefit in 2009 for the years ended December 31, 2008 and 2007, respectively. The reductionchange in theyear-over-year effective rate reflects changes in Mexican statutory tax rates, foreign exchange ratesrate fluctuations and inflation, partially offset by the reduction of a deferred tax asset valuation allowance recorded by KCSM during 2008.in Mexico in 2010.
LIQUIDITY AND CAPITAL RESOURCES
Overview
36
revolving credit facilities by $175.0 million and extending the maturities on these facilities. On December 31, 2011, total available liquidity (the unrestricted cash balance plus revolving credit facility availability) was $422.4 million, compared to available liquidity at December 31, 2010, of $310.4 million.
KCS’s primary uses of cash are to support operations; maintain and improve its railroad; pay debt service and preferred stock dividends;costs; acquire new and maintain existing locomotives, rolling stock and other equipment;equipment and meet other obligations. KCS’KCS’s cash flowflows from operations hashave historically been sufficient to fund operations, maintenance capital expenditures and debt service. External sources of cash (principally bank debt, public and private debt, common and preferred stock and leases) have historically been used to refinance existing indebtedness and to fund acquisitions, new investments and equipment additions. DueIn 2011, the Company’s cash flows from operations were sufficient to the downturn in the economyfund capital expenditures and the timing of debt refinancingother investing activities the Company utilized $112.4 million of cash and cash equivalents during the year ended December 31, 2009 — see “Cash Flow Information” below. On December 31, 2009, total available liquidity (the unrestricted cash balance plus revolving credit facility availability) was approximately $203 million.
reduce debt.
The Company believes, based on current expectations, that cash and other liquid assets, operating cash flows, access to debt and equity capital markets, and other available financing resources will be sufficient to fund anticipated operating, capital, and debt service requirements and other commitments in the foreseeable future. The Company intends to repay the outstanding balance of $40.0 million under the KCSR revolving credit facility prior to its scheduled maturity date of April 28, 2011. KCS has no significant scheduled debt maturities until 2012.
38
Standard & Poor’s Rating Services (“S&P”) rates the senior secured debt as BB-, the senior unsecured debt as B+, and the preferred stock as CCC. S&P maintains a corporate rating of B and recently improved the Company’s outlook to stable. Moody’s Investors Service (“Moody’s”) rateseach rate the senior secured debtcredit facility under the new KCSR Credit Agreement as Ba2,investment grade. They also rate the senior unsecured debt, as B2, and the preferred stock as B3. Moody’s maintains aand corporate ratingcredit of B1 for KCS and B2 for KCSM as non-investment grade and recently improvedprovide their view of each company’s outlook. These ratings and outlooks change from time to time and can be found on the outlook to stable for all issuers.websites of S&P and Moody’s.
37
39
Cash Flow Information and Contractual Obligations
Summary cash flow data follows(in millions):
| 2009 | 2008 | 2007 | ||||||||||
| Cash flows provided by (used for): | ||||||||||||
| Operating activities | $ | 292.9 | $ | 413.0 | $ | 367.8 | ||||||
| Investing activities | (346.4 | ) | (538.0 | ) | (366.8 | ) | ||||||
| Financing activities | (58.9 | ) | 299.4 | (24.5 | ) | |||||||
| Net increase (decrease) in cash and cash equivalents | (112.4 | ) | 174.4 | (23.5 | ) | |||||||
| Cash and cash equivalents beginning of year | 229.9 | 55.5 | 79.0 | |||||||||
| Cash and cash equivalents end of year | $ | 117.5 | $ | 229.9 | $ | 55.5 | ||||||
| 2011 | 2010 | 2009 | |||||||||
| Cash flows provided by (used for): | |||||||||||
| Operating activities | $ | 638.0 | $ | 496.3 | $ | 290.5 | |||||
| Investing activities | (510.4 | ) | (311.5 | ) | (344.0 | ) | |||||
| Financing activities | (140.6 | ) | (216.9 | ) | (58.9 | ) | |||||
| Net decrease in cash and cash equivalents | (13.0 | ) | (32.1 | ) | (112.4 | ) | |||||
| Cash and cash equivalents beginning of year | 85.4 | 117.5 | 229.9 | ||||||||
| Cash and cash equivalents end of year | $ | 72.4 | $ | 85.4 | $ | 117.5 | |||||
During 2009,2011, cash and cash equivalents decreased $112.4 million. Capital expenditures were partially offset by$13.0 million as increased cash flows from operating activities which decreased as a result of lower net income from reduced carload/unit volumes duewere used to the downturn in the economy. In addition, the Company repaid $319.1 million of debtfund investing activities and received net proceeds of $262.9 million from the issuance of common stockto refinance and the 121/2% Senior Notes.reduce outstanding debt. During 2008,2010, cash and cash equivalents decreased $32.1 million, as increased $174.4 million duecash flows from operating activities were used to improved operating performance, netfund investing activities, and together with the proceeds from the issuance of the 8.0% Senior Notesa common stock offering, to refinance and the 13.0% Senior Notes, and loan proceeds received from
40
Operating Cash Flows. Net operating cash flows for 2009 decreased $120.12011 increased $141.7 million to $292.9 million.$638.0 million. The decreaseincrease in operating cash flows was primarily a result of lowerincreased net income from reducedpositive pricing impacts, higher carload/unit volumes dueand the receipt of insurance proceeds related to hurricane damage. These increases were partially offset by changes in working capital items, resulting mainly from the downturn in the economy.timing of certain payments and receipts. Net operating cash flows for 20082010 increased $45.2$205.8 million to $413.0 million.$496.3 million. The increase in operating cash flows was primarily attributable to increased net income.income from higher carload/unit volumes due to the improvement in the economy and the Company’s cost control program.
Investing Cash Flows. Net investing cash outflows were $346.4$510.4 million and $538.0$311.5 million during 20092011 and 2008,2010, respectively. This $191.6$198.9 million decrease increase was primarily due to a reducedan increase in capital programexpenditures, partially offset by the insurance proceeds relating to hurricane damage and the acquisition of an intermodal facility in response2010. Insurance proceeds recognized in investing cash flows are related to decreasedproceeds from property damage. All other insurance proceeds related to hurricane damage are recognized in operating cash flows. Net investing cash outflows for 2008 increased $171.22010 decreased $32.5 million as compared to 2007, which2009, due to the completion of the Victoria-Rosenberg line in 2009. The decrease was related to a higher levelpartially offset by the acquisition of capital expenditures.an intermodal facility in 2010.
Financing Cash Flows. Financing cash inflows were generated from the issuance of long-term debt, proceeds from the ATM Equity Offering and Common Stock Purchase Programcommon stock offerings and proceeds from the issuance of common stock under employee stock plans. Financing cash outflows were used for the repayment of debt, the payment of dividends on KCS’KCS’s preferred stock and the payment of debt costs. Financing cash flows for 2009, 2008,2011, 2010, and 20072009 are discussed in more detail below:
| • | Net financing cash outflows for |
| • | Net financing cash outflows for 2010 were $216.9 million. During 2010, the Company repaid $839.7 million of outstanding debt and paid $65.1 million in debt costs. During the same period, the Company received net proceeds of $214.9 million from a common stock offering and $480.7 million from the issuance of the KCSM 8.0% and 6 5/8% Senior Notes. |
| • | Net financing cash outflows for 2009 were $58.9 million. During 2009, the Company repaid | |
41
38
Contractual Obligations. The following table outlines the material obligations under long-term debt, operating leases, and other contractual commitments on as of December 31, 20092011(in millions). Typically, payments for operating leases, other contractual obligations and interest on long-term debt are funded through operating cash flows. Principal payment obligations on long-term debt are typically refinanced by issuing new long-term debt or equity. If operating cash flows are not sufficient, funds received from other sources, including borrowings under revolving credit facilities and proceeds from property and other asset dispositions might also be available. These obligations are customary transactions similar to those entered into by others in the transportation industry.
| Payments Due by Period | ||||||||||||||||||||
| Less than | 1-3 | 3-5 | More than | |||||||||||||||||
| Total | 1 Year | Years | Years | 5 Years | ||||||||||||||||
| Long-term debt (including interest and capital lease obligations) | $ | 2,701.6 | $ | 230.0 | $ | 770.6 | $ | 1,032.0 | $ | 669.0 | ||||||||||
| Operating leases | 1,104.2 | 146.6 | 252.5 | 199.3 | 505.8 | |||||||||||||||
| Obligations due to uncertainty in income taxes | 2.1 | — | 0.4 | 1.7 | — | |||||||||||||||
| Capital expenditures obligations(i) | 379.0 | 121.0 | 258.0 | — | — | |||||||||||||||
| Other contractual obligations(ii) | 422.3 | 53.8 | 104.4 | 80.1 | 184.0 | |||||||||||||||
| Total | $ | 4,609.2 | $ | 551.4 | $ | 1,385.9 | $ | 1,313.1 | $ | 1,358.8 | ||||||||||
| Payments Due by Period | More than 5 years | ||||||||||||||||||
| Total | Less Than 1 Year | 1-3 Years | 3-5 Years | ||||||||||||||||
| Long-term debt (including interest and capital lease obligations) | $ | 2,308.5 | $ | 144.7 | $ | 301.1 | $ | 678.5 | $ | 1,184.2 | |||||||||
| Operating leases | 780.4 | 118.2 | 198.9 | 142.2 | 321.1 | ||||||||||||||
| Obligations due to uncertainty in income taxes | 1.7 | — | — | 1.7 | — | ||||||||||||||
| Capital expenditures obligations (i) | 217.7 | 152.7 | 48.0 | 17.0 | — | ||||||||||||||
| Other contractual obligations (ii) | 531.3 | 89.0 | 138.5 | 136.3 | 167.5 | ||||||||||||||
| Total | $ | 3,839.6 | $ | 504.6 | $ | 686.5 | $ | 975.7 | $ | 1,672.8 | |||||||||
_____________________
| (i) | Capital expenditure obligations include minimum capital expenditures under the KCSM Concession |
| (ii) | Other contractual obligations include purchase commitments and certain maintenance agreements. |
In the normal course of business, the Company enters into long-term contractual commitments for future goods and services needed for the operations of the business. Such commitments are not in excess of expected requirements and are not reasonably likely to result in performance penalties or payments that would have a material adverse effect on the Company’s liquidity.
Such commitments are not included in the above table.
The Company is party to nineeighteen utilization leases covering 2,0842,394 railcars where car hire revenue as defined in the lease agreements is shared between the lessor and the Company. The leases expire at various times through 2015. Amounts that may be due to lessors under these utilization leases vary from month to month based on car hire rental with the minimum monthly cost to the Company being zero. Accordingly, the utilization leases have been excluded from contractual obligations above.
The SCT requires KCSM to submit a five year capital expenditures plan every five years. The next five year plan will be submitted in 2012 for the years 2013 — 2017. KCSM expects to continue capital spending at current levels in future years and will continue to have capital expenditure obligations past 2012.2012, which are not included in the table above.
Off-Balance Sheet Arrangements
On November 2, 2007, PCRC completed an offering of $100 million of 7.0% senior secured notes due November 1, 2026 (the “Notes”). The Notes are senior obligations of PCRC, secured by certain assets of PCRC. KCS has pledged its shares of PCRC as security for the Notes. The Notes are otherwise non-recourse to KCS. The Company has agreed, along with Mi-Jack Products, Inc,Inc. (“Mi-Jack”), the other 50% owner of PCRC, to each fund one-half of any debt service reserve or liquidity reserve shortfall by PCRC, (reserves which wereare required to be established by PCRC in connection with the issuance of the Notes). As of December 31, 2009,2011, the Company’s portion of this reserve shortfallthese reserves was $3.9 million.$3.8 million. The Company has issued a standby letter of credit in the amount of $3.9 million.$3.8 million. The Company also has issued fivefour irrevocable standby letters of credit totaling approximately $3.2$1.2 million to fulfill the Company’s fifty percent guarantee of additional equipment loans at PCRC.
42
Capital Expenditures
KCS has funded, and expects to continue to fund capital expenditures with funds from operating cash flows, equipment leases, and debt and equity financing.financing and equipment leases.
39
The following table summarizes capital expenditures by type for the consolidated operations for the years ended December 31, 2009, 2008,2011, 2010, and 20072009 respectively(in millions).:
| 2009 | 2008 | 2007 | ||||||||||
| Roadway capital program | $ | 154.5 | $ | 243.8 | $ | 162.5 | ||||||
| Equipment | 11.2 | 49.1 | 40.3 | |||||||||
| Capacity | 76.8 | 166.0 | 47.4 | |||||||||
| Locomotive acquisitions | — | 79.2 | 127.2 | |||||||||
| Information technology | 6.5 | 16.8 | 12.3 | |||||||||
| Other | 33.9 | 21.6 | 20.8 | |||||||||
| Total capital expenditures (accrual basis) | 282.9 | 576.5 | 410.5 | |||||||||
| Change in capital accruals | 66.3 | (42.7 | ) | (13.7 | ) | |||||||
| Total cash capital expenditures | $ | 349.2 | $ | 533.8 | $ | 396.8 | ||||||
| 2011 | 2010 | 2009 | |||||||||
| Roadway capital program | $ | 273.8 | $ | 224.9 | $ | 152.1 | |||||
| Locomotive acquisitions (i) | 173.7 | — | — | ||||||||
| Capacity (ii) | 25.7 | 10.1 | 76.8 | ||||||||
| Information technology | 14.3 | 12.0 | 6.5 | ||||||||
| Equipment | 9.5 | 12.8 | 11.2 | ||||||||
| Other | 93.7 | 60.0 | 33.9 | ||||||||
| Total capital expenditures (accrual basis) | 590.7 | 319.8 | 280.5 | ||||||||
| Locomotives financed under operating lease buyout (i) | (91.1 | ) | — | — | |||||||
| Change in capital accruals | (4.6 | ) | (32.5 | ) | 66.3 | ||||||
| Total cash capital expenditures | $ | 495.0 | $ | 287.3 | $ | 346.8 | |||||
| (i) | In 2011, KCSM entered into five loan agreements with General Electric Capital Corporation (“GE”) to finance approximately 88% of the purchase price of seventy-five locomotives. These locomotives were previously leased by KCSM under an operating lease. |
| (ii) | Capacity projects in 2009 were primarily the result of the construction of the Victoria-Rosenberg line, which opened in the second quarter of 2009. |
Generally, the Company’s capital program consists of capital replacement. For 2010,2012, internally generated cash flows are expected to fund cash capital expenditures which are currently estimated at approximately $300.0to be between $400.0 million and $425.0 million.
Property Statistics
The following table summarizes certain property statistics as of December 31:
| 2011 (i) | 2010 | 2009 (ii) | ||||||
| Track miles of rail installed | 125 | 81 | 120 | |||||
| Cross ties installed | 777,930 | 762,228 | 806,908 | |||||
_____________________
| (i) | The increase in the miles of rail and cross ties installed in 2011 primarily reflects the increase in maintenance and capacity expansion activities. |
| (ii) | The miles of rail and cross ties installed in 2009 primarily reflects the construction of the Victoria- Rosenberg line. |
Debt and Capital Structure
| 2009 | 2008 | |||||||
| Debt due within one year | $ | 68.1 | $ | 637.4 | ||||
| Long-term debt | 1,911.9 | 1,448.7 | ||||||
| Total debt | 1,980.0 | 2,086.1 | ||||||
| Total equity | 2,341.6 | 2,185.2 | ||||||
| Total debt plus total equity | $ | 4,321.6 | $ | 4,271.3 | ||||
| 2011 | 2010 | ||||||
| Debt due within one year | $ | 36.3 | $ | 18.1 | |||
| Long-term debt | 1,602.8 | 1,621.6 | |||||
| Total debt | 1,639.1 | 1,639.7 | |||||
| Total equity | 3,058.7 | 2,713.7 | |||||
| Total debt plus total equity | $ | 4,697.8 | $ | 4,353.4 | |||
40
KCSR Debt
Revolving Credit Facility and Term Loans. On April 28, 2006, KCS, KCSR and the other subsidiary guarantors named therein entered into an amended and restated credit agreement (the “2006 KCSR Credit Agreement”), in an aggregate amount of $371.1 million with The Bank of Nova Scotia and other lenders named in the 2006 KCSR Credit Agreement. The 2006 KCSR Credit Agreement initially consisted of a $125.0 million revolving credit facility with a letter of credit sublimit of $25.0 million and swing line advances of up to $15.0 million, and a $246.1 million term loan facility (the “Term Loan B Facility”). On May 31, 2007, KCSR entered into Amendment No. 1 to the 2006 KCSR Credit Agreement which provided for a new $75.0 million term loan facility (the “Term Loan C Facility”) under the 2006 KCSR Credit Agreement. On March 16, 2010, KCSR entered into Amendment No. 2 to the 2006 KCSR Credit Agreement which extended the maturity of the revolving credit facility of the 2006 KCSR Credit Agreement from April 28, 2011 to April 28, 2013. In consideration for this change, the Applicable Margin (as defined in Amendment No. 2) in respect of the revolving credit facility and swing line advances was increased. In addition, Amendment No. 2 modified certain covenants of the 2006 KCSR Credit Agreement to permit the incurrence of certain indebtedness and the creation of liens related to such indebtedness, as well as certain prepayments of existing unsecured debt.
On July 12, 2011, KCS together with KCSR and certain subsidiaries named therein as guarantors (the “Subsidiary Guarantors”), entered into an amended and restated credit agreement (the “2011 KCSR Credit Agreement”) with various lenders. The 2011 KCSR Credit Agreement provides KCSR with (i) a five-and-one-half year $300.0 million term loan credit facility (the “Term Loan Facility”) and (ii) a five-year $200.0 million revolving credit facility consisting of a revolving facility up to $200.0 million (the “Revolving Facility”), a letter of credit facility of $25.0 million (the “Letter of Credit Facility”) and a swing line facility of up to $15.0 million (the “Swing Line Facility”). The Letter of Credit Facility and the Swing Line Facility each constitute usage under the Revolving Facility.
The $305.8 million outstanding term loans under the 2006 KCSR Credit Agreement were combined and refinanced with those under the Term Loan Facility and KCSR used available cash to reduce the principal balance of the prior term loans by $5.8 million. Under the 2011 KCSR Credit Agreement, the final maturity of the term loans was extended from April 28, 2013 to January 15, 2017. Commitments under KCSR’s prior revolving credit facility were rolled over into the new Revolving Facility and the maturity was extended from April 28, 2013 to July 15, 2016.
KCSR is required to make quarterly principal payments on the Term Loan Facility commencing December 31, 2011, with any remaining unpaid principal balance due and payable on January 15, 2017. The outstanding principal balance of loans under the Term Loan Facility and the Revolving Facility bear interest at floating rates. At KCSR’s option, the loans will bear interest at either (i) the greater of (a) The Bank of Nova Scotia’s base rate, (b) the federal funds rate plus 0.50% or (c) one-month London Interbank Offered Rate (“LIBOR”) plus 1.00% (the “Base Rate”) plus a margin of 0.25% to 1.50% (depending on the leverage ratio as defined in the 2011 KCSR Credit Agreement, the “Leverage Ratio”) or (ii) LIBOR plus a margin of 1.25% to 2.50% (depending on the Leverage Ratio). The outstanding principal balance of loans under the Swing Line Facility will bear interest at the Base Rate plus a margin of 0.25% to 1.50% (depending on the Leverage Ratio). As of December 31, 2011, advances under the Revolving Facility totaled $50.0 million.
The obligations under the 2011 KCSR Credit Agreement are secured by a significant portion of the assets of KCS, KCSR and the Subsidiary Guarantors pursuant to an Amended and Restated Security Agreement dated July 12, 2011 (the “Security Agreement”) among KCS, KCSR, each Subsidiary Guarantor and The Bank of Nova Scotia, as administrative agent and collateral agent for the lenders. Under the terms of the Security Agreement, KCS, KCSR and their restricted subsidiaries (as defined in the 2011 KCSR Credit Agreement) agreed to subordinate payment of certain intercompany debt. In addition, KCS and each Subsidiary Guarantor guaranteed repayment of the amounts due under the 2011 KCSR Credit Agreement and the equity interests of KCSR and each Subsidiary Guarantor have been pledged pursuant to the Security Agreement to secure obligations under the 2011 KCSR Credit Agreement.
The 2011 KCSR Credit Agreement contains covenants that restrict or prohibit certain actions, including, but not limited to, KCS’s ability to incur debt, create or suffer to exist liens, make prepayment of particular debt, pay dividends, make investments, engage in transactions with stockholders and affiliates, issue capital stock, sell certain assets, and engage in mergers and consolidations or in sale-leaseback transactions. In addition, KCS must meet certain consolidated interest coverage and leverage ratios. Failure to maintain compliance with the covenants could constitute a default which could accelerate the payment of any outstanding amounts under the 2011 KCSR Credit Agreement.
41
8.0% Senior Notes. On May 30, 2008, KCSR issued $275.0 million principal amount of 8.0% senior unsecured notes due June 1, 2015 (the “8.0% Senior Notes”), which bear interest semiannually at a fixed annual rate of 8.0%. A portion of the proceeds from the issuance of the 8.0% Senior Notes was used to purchase the 91/2% senior unsecured notes due October 1, 2008 (the “91/2% Senior Notes”) tendered under an offer to purchase. The remaining proceeds from the issuance were used to reduce borrowings under the KCSR revolving credit facility and for general corporate purposes. The 8.0% Senior Notes are redeemable in whole or in part prior to June 1, 2012 by paying the greater of either 101% of the principal amount or the principal amount plus a “make whole” premium and in whole or in part on and after June 1, 2012, at the following redemption prices (expressed as a percentage of principal amount) plus any accrued and unpaid interest: 2012 -104%, 2013 - 102% and 2014 - 100%. The 8.0% Senior Notes are fully and unconditionally guaranteed by KCS and certain subsidiaries of KCS who guarantee the 2011 KCSR Credit Agreement (the “Note Guarantors”). The 8.0% Senior Notes and the note guarantees rank pari passu in right of payment with KCSR’s, KCS’s, and the Note Guarantors’ existing and future unsecured, unsubordinated obligations. In addition, the 8.0% Senior Notes include certain covenants which are customary for these types of debt instruments issued by borrowers with similar credit ratings, restrict or prohibit certain actions and are similar in nature to those contained in the 2011 KCSR Credit Agreement. Certain of these covenants no longer apply if the 8.0% Senior Notes are assigned an investment grade rating by both Moody’s Investors Service and Standard & Poor’s.
13.0% Senior Notes. On December 18, 2008, KCSR issued $190.0 million principal amount of 13.0% senior unsecured notes due December 15, 2013, (the “13.0% Senior Notes”) which bore interest semiannually at a fixed annual rate of 13.0%. The 13.0% Senior Notes were issued at a discount to par value, resulting in a $22.0 million discount and a yield to maturity of 16.5%. KCS used the net proceeds from the offering, along with other borrowings, to purchase the 71/2% senior unsecured notes due June 15, 2009 (the “71/2% Senior Notes”) tendered under an offer to purchase. The 13.0% Senior Notes were redeemable in whole or in part prior to December 15, 2011 by paying the greater of either 101% of the principal amount or the principal amount plus a “make whole” premium and in whole or in part on and after December 15, 2011, at the following redemption prices (expressed as percentages of principal amount) plus any accrued and unpaid interest: 2011 - 113% and 2012 - 106.5%. On June 4, 2010, the Company redeemed $66.5 million principal amount of the 13.0% Senior Notes pursuant to a provision which allowed KCSR to redeem up to 35% of the 13.0% Senior Notes at any time prior to December 15, 2011 at par value plus coupon from the proceeds of any sale of capital stock in KCSM or KCS. This followed KCS’s offering of 5.8 million shares for net proceeds of $214.9 million in May 2010. On December 15, 2011, the Company used available cash to redeem all of the outstanding $123.5 million aggregate principal amount of the 13.0% Senior Notes at a redemption price of 113% of the principal amount.
Tex-Mex Debt
RRIF Loan Agreement. On June 28, 2005, Tex-Mex entered into an agreement with the Federal Railroad Administration (“FRA”) to borrow $50.0 million to be used for infrastructure improvements in order to accommodate growing freight rail traffic related to the NAFTA corridor. The note bears interest at 4.29% annually and the principal balance amortizes quarterly with a final maturity of July 13, 2030. The loan was made under the Railroad Rehabilitation and Improvement Financing (“RRIF”) Program administered by the FRA. The loan is guaranteed by Mexrail, which has issued a Pledge Agreement in favor of the lender equal to the gross revenues earned by Mexrail on per-car fees on traffic crossing the International Rail Bridge in Laredo, Texas. In addition, the Company has agreed to guarantee the scheduled principal payment installments due to the FRA from Tex-Mex under the loan agreement on a rolling five-year basis.
KCSM Debt
Revolving Credit Facility. On August 30, 2010, KCSM entered into a secured credit agreement (the “2010 KCSM Credit Agreement”) with various lenders and other institutions which provided KCSM with a three-year $100.0 million revolving credit facility consisting of (i) a revolving facility in an amount up to $100.0 million (the “2010 Revolving Facility”) and, (ii) a letter of credit and a swing line facility in an amount up to $10.0 million each.
On September 30, 2011, KCSM entered into an amended and restated credit agreement (the “2011 KCSM Credit Agreement”) with various financial institutions. The 2011 KCSM Credit Agreement increased the revolving credit facility to $200.0 million and extended the maturity to September 30, 2016. The 2011 KCSM Credit Agreement includes (i) a revolving credit facility up to $200.0 million (the “2011 KCSM Revolving Facility”), (ii) a letter of credit facility up to $15.0 million (the “KCSM Letter of Credit Facility”), and (iii) a swing line facility up to $15.0 million (the “KCSM Swing Line Facility”). The KCSM Letter of Credit Facility and the KCSM Swing Line Facility each constitute usage under the 2011 KCSM Revolving Facility.
42
Any outstanding principal balance of loans under the 2011 KCSM Revolving Facility bear interest at floating rates. At KCSM’s option, the loans bear interest at either (i) the greater of (a) JPMorgan Chase Bank, N.A.’s prime rate, (b) the federal funds rate plus 0.50% or (c) one-month LIBOR plus 1.00% (the “Base Rate”) plus a margin of 0.25% to 1.50% (depending on KCSM’s leverage ratio), or (ii) one, two, three or six-month LIBOR plus a margin of 1.25% to 2.50% (depending on KCSM’s leverage ratio). The outstanding principal balance of loans under the KCSM Swing Line Facility bear interest at the Base Rate plus a margin of 0.25% to 1.50% (depending on KCSM’s leverage ratio).
The 2011 KCSM Credit Agreement is secured by the accounts receivable and certain locomotives of KCSM and certain of its subsidiaries. In addition, KCSM and certain of its subsidiaries agreed to subordinate payment of certain intercompany debt, certain KCSM subsidiaries guaranteed repayment of the amounts due under the 2011 KCSM Credit Agreement (up to the amount permitted by KCSM’s outstanding indentures) and certain equity interests as defined in the 2011 KCSM Credit Agreement were pledged to secure obligations under the 2011 KCSM Credit Agreement.
The 2011 KCSM Credit Agreement contains representations, warranties and covenants typical of such credit agreements, including financial covenants related to a leverage ratio and an interest coverage ratio as defined in the 2011 KCSM Credit Agreement. Events of default under the 2011 KCSM Credit Agreement include, but are not limited to, certain payment defaults; breach of any representation or warranty; non-performance of covenants and obligations; default on other indebtedness; certain judgments rendered; restrictions or requirements limiting the availability or the transfer of foreign exchange; a change in control; bankruptcy or insolvency of KCSM and certain subsidiaries and obligors; an impairment of security; the failure of subordination; certain actions by a governmental authority; failure to obtain certain consents; and termination of the concession title. The occurrence of an event of default could result in the acceleration of the repayment of any outstanding principal balance of the 2011 KCSM Revolving Facility.
As of December 31, 2011, KCSM had no outstanding amount under the 2011 KCSM Revolving Facility.
75/8% Senior Notes. On November 21, 2006, KCSM issued $175.0 million principal amount of 75/8% senior unsecured notes due December 1, 2013 (the “75/8% Senior Notes”), which bore interest semiannually at a fixed annual rate of 75/8%. The 75/8% Senior Notes were redeemable at KCSM’s option in whole or in part on or after December 1, 2010, subject to certain limitations, at the following redemption prices (expressed in percentages of principal amount), plus any accrued and unpaid interest: 2010 - 103.813%, 2011 - 101.906% and 2012 - 100.000%. In addition, the 75/8% Senior Notes were redeemable, in whole but not in part, at KCSM’s option at their principal amount, plus any accrued and unpaid interest, in the event of certain changes in the Mexican withholding tax rate.
On November 2, 2010, pursuant to an offer to purchase, KCSM commenced a cash tender offer and a consent solicitation for its 75/8% Senior Notes. On December 20, 2010, KCSM purchased $142.6 million principal amount of the tendered 75/8% Senior Notes in accordance with the terms and conditions of the tender offer set forth in the offer to purchase using the proceeds received from the issuance of $185.0 million principal amount of KCSM 65/8% senior unsecured notes due December 15, 2020 (the “65/8% Senior Notes”). On May 6, 2011, pursuant to an offer to purchase, KCSM commenced a cash tender offer and consent solicitation for all of the outstanding 75/8% Senior Notes. Through June 7, 2011, KCSM purchased and redeemed the remaining $32.4 million of the 75/8% Senior Notes using the proceeds received from the issuance of $200.0 million principal amount of 61/8% senior unsecured notes due June 15, 2021 (the “61/8% Senior Notes”) and available cash.
73/8% Senior Notes. On May 16, 2007, KCSM issued $165.0 million principal amount of 73/8% senior unsecured notes due June 1, 2014 (the “73/8% Senior Notes”), which bore interest semiannually at a fixed annual rate of 73/8%. The 73/8% Senior Notes were redeemable at KCSM’s option, in whole but not in part, at 100% of their principal amount, plus any accrued and unpaid interest, in the event of certain changes in the Mexican withholding tax rate, and in whole or in part, on or after June 1, 2011, subject to certain limitations, at the following redemption prices (expressed as percentages of principal amount) plus any accrued and unpaid interest: 2011 - 103.688%, 2012 - 101.844% and 2013 - 100.000%.
On May 6, 2011, pursuant to an offer to purchase, KCSM commenced a cash tender offer and consent solicitation for all of the outstanding 73/8% Senior Notes. Through June 7, 2011, KCSM purchased and redeemed all of the outstanding $165.0 million of the 73/8% Senior Notes using the proceeds received from the issuance of the 61/8% Senior Notes and available cash.
121/2% Senior Notes. On March 30, 2009, KCSM issued $200.0 million principal amount of 121/2% senior unsecured notes due April 1, 2016 (the “121/2% Senior Notes”), which bear interest semiannually at a fixed annual rate of 121/2%. The 121/2% Senior Notes were issued at a discount to par value, resulting in an $11.0 million discount and a yield to maturity of 133/4%. KCSM used a portion of the net proceeds from the offering to repay all amounts outstanding under a credit agreement
43
KCSM entered into on June 14, 2007 (the “2007 KCSM Credit Agreement”). The 121/2% Senior Notes are redeemable at KCSM’s option in whole or in part on and after April 1, 2013, at the following redemption prices (expressed as percentages of principal amount) plus any accrued and unpaid interest: 2013 - 106.250%, 2014 - 103.125% and 2015 - 100.000%. In addition, the notes are redeemable, in whole but not in part, at KCSM’s option at their principal amount, plus any accrued and unpaid interest, in the event of certain changes in the Mexican withholding tax rate.
On June 4, 2010, the Company redeemed $70.0 million principal amount of the 121/2% Senior Notes pursuant to a provision which allowed KCSM to redeem up to 35% of the 12 ½% Senior Notes any time prior to April 1, 2012 at par value plus coupon from the proceeds of any sale of capital stock in KCSM or KCS. This followed KCS’s offering of 5.8 million shares of common stock for net proceeds of $214.9 million in May 2010. On November 2, 2010, pursuant to an offer to purchase, KCSM commenced a cash tender offer for its 121/2% Senior Notes and on December 20, 2010, KCSM purchased $31.9 million principal amount of the tendered 121/2% Senior Notes in accordance with the terms and conditions of the tender offer set forth in the offer to purchase using the proceeds received from the issuance of the 65/8% Senior Notes.
KCSM 8.0% Senior Notes. On January 22, 2010, KCSM issued $300.0 million principal amount of 8.0% senior unsecured notes due February 1, 2018 (the “KCSM 8.0% Senior Notes”), which bear interest semiannually at a fixed annual rate of 8.0%. The KCSM 8.0% Senior Notes were issued at a discount to par value, resulting in a $4.3 million discount and a yield to maturity of 81/4%. KCSM used the net proceeds from the issuance of the KCSM 8.0% Senior Notes and available cash to purchase $290.0 million principal amount of the 93/8% senior unsecured notes due May 1, 2012 (the “93/8% Senior Notes”) tendered under an offer to purchase and pay all fees and expenses incurred in connection with the KCSM 8.0% Senior Notes offering and the tender offer. The KCSM 8.0% Senior Notes are redeemable at KCSM’s option, in whole or in part, on and after February 1, 2014, at the following redemption prices (expressed as percentages of principal amount) plus any accrued and unpaid interest: 2014 - 104.000%, 2015 - 102.000%, 2016 and thereafter - 100.000%. In addition, KCSM may redeem up to 35% of the KCSM 8.0% Senior Notes any time prior to February 1, 2013 at par value plus coupon from the proceeds of the sale of capital stock in KCSM or KCS and the notes are redeemable, in whole but not in part, at KCSM’s option at their principal amount, plus any accrued and unpaid interest, in the event of certain changes in the Mexican withholding tax rate.
65/8% Senior Notes. On December 20, 2010, KCSM issued the 65/8% Senior Notes due December 15, 2020, which bear interest semiannually at a fixed annual rate of 65/8%. KCSM used the net proceeds from the issuance of the 65/8% Senior Notes and available cash to purchase $142.6 million principal amount of the 75/8% Senior Notes and $31.9 million principal amount of the 121/2% Senior Notes tendered under an offer to purchase and pay all fees and expenses incurred in connection with the 65/8% Senior Notes offering and the tender offers. The 65/8% Senior Notes are redeemable at KCSM’s option, in whole or in part prior to December 15, 2015, by paying the greater of either 101% of the principal amount or the principal amount plus a “make whole” premium and in whole or in part on and after December 15, 2015, at the following redemption prices (expressed as percentages of principal amount) plus any accrued and unpaid interest: 2015 - 103.313%, 2016 - 102.208%, 2017 -101.104%, 2018 and thereafter - 100.000%. In addition, KCSM may redeem up to 35% of the 65/8% Senior Notes at a redemption price equal to 106.625% any time prior to December 15, 2013 at par value plus coupon from the proceeds of the sale of capital stock in KCSM or KCS and the notes are redeemable, in whole but not in part, at KCSM’s option at their principal amount, plus any accrued and unpaid interest, in the event of certain changes in the Mexican withholding tax rate.
61/8% Senior Notes. On May 20, 2011, KCSM issued the 61/8% Senior Notes due June 15, 2021 at par, which bear interest semiannually at a fixed annual rate of 61/8%. KCSM used the proceeds from the issuance of the 61/8% Senior Notes and available cash to purchase and redeem the 75/8% Senior Notes and 73/8% Senior Notes as discussed above, and pay all fees and expenses incurred in connection with the 61/8% Senior Notes offering and the tender offers. The 61/8% Senior Notes are redeemable at KCSM’s option, in whole or in part prior to June 15, 2016, by paying the greater of either 101% of the principal amount or the principal amount plus a “make whole” premium and in whole or in part after June 15, 2016, at the following redemption prices (expressed as percentages of principal amount) if redeemed during the 12-month period commencing on June 15 of the following years, plus any accrued and unpaid interest to the date of redemption: 2016 - 103.063%, 2017 - 102.042%, 2018 - 101.021%, 2019 and thereafter - 100.000%. In addition, KCSM may redeem up to 35% of the 61/8% Senior Notes at a redemption price equal to 106.125% any time prior to June 15, 2014 from the proceeds of the sale of KCSM’s capital stock or the capital stock of KCS, and the notes are redeemable, in whole but not in part, at KCSM’s option at their principal amount, plus any accrued unpaid interest in the event of certain changes in the Mexican withholding tax rate.
All of KCSM’s senior notes described above are denominated in dollars, are unsecured, unsubordinated obligations, rank pari passu in right of payment with KCSM’s existing and future unsecured, unsubordinated obligations, and are senior in right of payment to KCSM’s future subordinated indebtedness. In addition, KCSM’s senior notes include certain covenants which
44
are customary for these types of debt instruments issued by borrowers with similar credit ratings, restrict or prohibit certain actions and are similar in nature to those contained in the 2011 KCSM Credit Agreement. Certain of these covenants no longer apply if KCSM’s senior notes are assigned an investment grade rating by both Moody’s Investors Service and Standard & Poor’s Rating Services.
5.737% Financing Agreement. On February 26, 2008, KCSM entered into a financing agreement with Export Development Canada (“EDC”) for an aggregate principal amount of $72.8 million. KCSM used the proceeds to finance 85.0% of the purchase price of forty new SD70ACe locomotives purchased by KCSM in late 2007 and early 2008. KCSM granted EDC a security interest in the locomotives to secure the loan. The financing agreement requires KCSM to make thirty equal semi-annual principal payments of approximately $2.4 million plus interest at an annual rate of 5.737%, with the final payment due and payable on February 28, 2023.
6.195% Financing Agreement. On September 24, 2008, KCSM entered into a financing agreement with DVB Bank AG (“DVB”) for an aggregate principal amount of $52.2 million. KCSM used the proceeds to finance approximately 80% of the purchase price of twenty-nine ES44AC locomotives purchased by KCSM in June 2008. KCSM granted DVB a security interest in the locomotives to secure the loan. The financing agreement requires KCSM to make sixty equal quarterly principal payments plus interest at an annual rate of 6.195%, with the final payment due and payable on September 29, 2023.
9.310% Loan Agreements. On September 1, 2011, KCSM, as borrower, entered into five Loan Agreements (each a “Loan Agreement”, and collectively, the “Loan Agreements”) with General Electric Capital Corporation, as lender (“GE”), each with a principal amount of approximately $18.2 million. KCSM used the loan proceeds to finance approximately 88% of the purchase price of seventy-five GE AC4400 CW locomotives (the “Locomotives”) purchased by KCSM from GE on September 1, 2011. The Locomotives were previously leased by KCSM from GE pursuant to a Lease Agreement dated April 30, 1998. The Lease Agreement, which had been accounted for as an operating lease, was terminated with the purchase of the Locomotives by KCSM. To secure the loans from GE, KCSM transferred legal ownership of the Locomotives to five irrevocable trusts established by KCSM to which GE is the primary beneficiary and KCSM has a right of reversion upon satisfaction of the obligations of the Loan Agreements.
Each Loan Agreement requires KCSM to make thirty-eight quarterly principal payments plus interest at an annual rate of 9.31%, which approximates the implicit interest rate in the Lease Agreement. KCSM generated certain tax benefits as a result of purchasing the locomotives. The first payments were due and payable on September 15, 2011, and the final payments are due and payable on December 15, 2020.
KCSM’s locomotive financing agreements contain representations, warranties and covenants typical of such equipment loan agreements. Events of default in the financing agreements include, but are not limited to, certain payment defaults, certain bankruptcy and liquidation proceedings and the failure to perform any covenants or agreements contained in the financing agreements. Any event of default could trigger acceleration of KCSM’s payment obligations under the terms of the financing agreements.
Other Debt Provisions
Other Agreements, Guarantees, Provisions and Restrictions. The Company’s debt agreements contain provisions which are customary for these types of debt instruments and for borrowers with similar credit ratings including restrictions on subsidiary indebtedness, advances and transfers of assets, and sale and leaseback transactions, as well as requiring compliance with various financial covenants. Because of certain financial covenants contained in the debt agreements, however, maximum utilization of the Company’s available lines of credit may be restricted.
Change in Control Provisions. Certain loan agreements and debt instruments entered into or guaranteed by the Company and its subsidiaries provide for default in the event of a specified change in control of the Company or particular subsidiaries of the Company.
Shelf Registration Statements and Public Securities Offerings
KCS has one current shelf registration statement on file with the SEC (the “Universal Shelf” — RegistrationNo. 333-155601)333-178086). The Universal Shelf was filed on November 21, 20082011 in accordance with the securities offering reform rules of the SEC that allow “well-known seasoned issuers” to register an unspecified amount of different types of securities on an immediately effectiveForm S-3 registration statement. The Universal Shelf will expire on November 20, 2011. On December 18, 2008, the Company’s subsidiary KCSR completed the sale and issuance21, 2014.
45
CRITICAL ACCOUNTING POLICIES AND ESTIMATES
43
Audit Committee has reviewed the selection, application and disclosure of the Company’s critical accounting policies and estimates.
Capitalization, Depreciation and Amortization of Property and Equipment (including Concession Assets)
Due to the highly capital intensive nature of the railroad industry, capitalization and depreciation of property and equipment is aare substantial operating cost for the Company and the industry as a whole. A significant portioncomponents of the Company’s consolidated financial statements. Net property and equipment, including concession assets, comprised approximately 87% of the Company’s total assets as of December 31, 2011, and related depreciation and amortization comprised approximately 13% of total operating expenses for the year ended December 31, 2011.
The Company’s annual capital expenditures are primarily for capital replacement programs and track expansions which are generally constructed by employees. KCS capitalizes costs for self-constructed additions and improvements to property including direct labor and material, indirect overhead costs, and interest during long-term construction projects. Direct costs are charged to capital projects based on the work performed and the material used. Indirect overhead costs are allocated to capital projects as a standard percentage, which is evaluated annually, and applied to direct labor and material costs. Asset removal activities are performed in conjunction with replacement activities; therefore, removal costs are estimated based on a standard percentage of direct labor and indirect overhead costs related to capital replacement projects. For purchased assets, all costs necessary to make the asset ready for its intended use are capitalized. Properties and equipment are carried at cost and are depreciated on a straight-line basis over their estimated service lives measured in years. Expenditures that significantly increase asset values or extend useful lives are capitalized. Repair and maintenance costs are expensed as incurred.
Properties and equipment are carried at cost and are depreciated primarily on the group method of depreciation, which the Company believes closely approximates a straight line basis over the estimated useful lives measured in years. Costs incurred by the Company to acquire the concession rights and related assets, as well as subsequent improvements to the concession assets, are capitalized and amortized using the group method of depreciation over the lesser of the current expected Concession term, including probable renewal, or the estimated useful lives of the assets and rights. Remaining properties, primarily technology and leasehold improvements, are depreciated using the straight line method over the lesser of estimated useful or lease lives.
KCS follows the group method of depreciation which applies a composite rate to classes of similar assets rather than to individual assets. Composite depreciation rates are based upon the Company’s estimates of the expected average serviceuseful lives of assets as well as expected net salvage value at the end of their useful lives. The estimated average service lives of assets and salvage values are determined throughIn developing these estimates, the Company utilizes periodic depreciation studies.studies performed by an independent engineering firm. Depreciation rate studies are performed at least every three years for equipment and at least every six years for road property (rail, ties, ballast, etc.). The depreciation studies take into account factors such as:
Statistical analysis of historical patterns of use and retirements of each asset class;
Evaluation of any expected changes in current operations and the outlook for the continued use of the assets;
Evaluation of technological advances and changes to maintenance practices; and
Historical and expected salvage to be received upon retirement.
The depreciation studies may also indicate that the recorded amount of accumulated depreciation is deficient or in excess of the amount indicated by the study. Any such deficiency or excess is amortized as a component of depreciation expense over the remaining useful lives of the affected asset class, as determined by the study. The Company also monitors these factors in non-study years to determine if adjustments should be made to depreciation rates.
Also under the group method of depreciation, the cost of railroad property and equipment (net of salvage)salvage or sales proceeds) retired or replaced in the normal course of business is charged to accumulated depreciation with no gain or loss
46
recognized. The cost of the property and equipment retired is based on actual historical costs. Gains or losses on dispositions of land or non-railroadnon-group property and abnormal retirements of railroad property are recognized through income. A retirement of railroad property would be considered abnormal if the cause of the retirement is unusual in nature and its serviceactual life is significantly shorter than what would be expected for that group based on the depreciation studies. An abnormal retirement could cause the Company to reevaluatere-evaluate the estimated useful life of the impacted asset class. There were no significant gains or losses from abnormal retirements of property or equipment for any of the three years ended December 31, 2011.
During the year ended December 31, 2009,2011, KCS engaged an independent engineering firm to assist management in performing a depreciation study on equipmentKCSM’s road property and equipment. The depreciation impacts of the study results were immaterial to 2011 consolidated financial results.
Effective as well as to assessof October 1, 2010, the Company changed depreciation rates on certain locomotive and road assets based on reassessment of the adequacy of the accumulated reserves for road property. The results of the study determined that overall KCS’ depreciation rates should be lowered to better reflectprovisions, asset usage and replacement patterns. This change in accounting estimate was implemented effective January 1, 2009. The full year reduction ofnet depreciation expense reduction in 20092011 resulting from the change in depreciation and amortization ratesthese changes was $4.0 million.$4.2 million.
| ▪ | KCSM operations are an integral part of the KCS operations strategy, and related investment analyses and operational decisions assume that the Company’s cross border rail business operates into perpetuity, and do not assume that Mexico operations terminate at the end of the current Concession term; |
| ▪ | The Company’s executive management is dedicated to ensuring compliance with the various provisions of the Concession agreement and to maintaining positive relationships with the SCT and other Mexican federal, state, and municipal governmental authorities; |
| ▪ | During the time since the Concession was granted, the relationships between KCSM and the various Mexican governmental authorities have matured and the guidelines for operating under the Concession have become more defined with experience; and |
| ▪ | There are no known supportable sanctions or compliance issues that would cause the SCT to revoke the Concession or prevent KCSM from renewing the Concession. |
Based on the above factors, the Company continues to believe it is probable that the Concession will continuebe renewed for an additional 50-year term beyond the current term. Accordingly, capital assets required to be reviewed in relation to KCS’ experience in operatingoperate under the Concession.Concession are depreciated over the shorter of the asset group’s useful life or the current Concession term plus one additional 50-year term. Considering the asset base in service at the time of the 2009 reassessment, lengthening of the assumed Concession term reduced annual depreciation expense by approximately $10.4 million.
Estimation of the average serviceuseful lives of assets and net salvage value requiresvalues require significant management judgment. Estimated average serviceuseful lives may vary over time due to changes in physical use, technology,
44
asset strategies and other factors that could have an impact on the retirement experience of the asset classes. Accordingly, changes in the asset’sassets’ estimated useful lives could materially impact future period’speriods’ depreciation expense. Depreciation and amortization expense for the year ended December 31, 20092011 was $182.5 million.$186.2 million. If the weighted average useful lives of assets were changed by one year, annual depreciation and amortization expense would change approximately $6.0$5.9 million.
Long-lived assets are reviewed for impairment when events or circumstances indicate that the carrying amount of an asset may not be recoverable. If impairment indicators are present and the estimated future undiscounted cash flows are less than the carrying value of the long-lived assets, the carrying value iswould be reduced to the estimated fair value. Future cash flow estimates for an impairment review would be based on the lowest level of identifiable cash flows, which are the Company’s U.S. and Mexican operations. During the year ended December 31, 2011, management did not identify any indicators of impairment.
47
Provision for Personal Injury Claims
Due to the nature of railroad operations, claims related to personal injuries and third party liabilities resulting from crossing collisions and derailments isare a substantial expense to KCS. Claims are estimated and recorded for known reported occurrences as well as for incurred but not reported (“IBNR”) occurrences. Consistent with general practices within the railroad industry, the estimated liability is actuarially determined on an undiscounted basis. The actuarial analysis is performed semi-annually by an independent third party actuarial firm and reviewed by management. In estimating the liability, KCS bases the estimate on semi-annual actuarial studies, whichstudy calculates an estimate using historical experience and estimates of claim costs as well as numerous assumptions regarding factors relevant to the derivation of an estimate of future claim costs.
Personal injury claims are subject to a significant degree of uncertainty, especially estimates related to incurred but not reported personal injuries for which a party has yet to assert a claim. In deriving an estimate of the provision for personal injury claims, management must make assumptions related to substantially uncertain matters (injury severity, claimant age and legal jurisdiction). Changes in the assumptions used for actuarial studies could have a material effect on the estimate of the provision for personal injury claims. The most sensitive assumptions for personal injury accruals are the expected average cost per claim and the projected frequency rates for the number of claims that will ultimately result in payment. Management believes that the accounting estimate related to the liability for personal injuries claims is critical to KCS’KCS’s results of operations. See also Note 1214 to the Consolidated Financial Statements in Item 8 of thisForm 10-K.
Provision for Income Taxes
Deferred income taxes represent a substantial net liability of the Company. For financial reporting purposes, management determines the current tax liability, as well as deferred tax assets and liabilities, in accordance with the liability method of accounting for income taxes. The provision for income taxes is the sum of income taxes both currently payable and deferred into the future. Currently payable income taxes represent the liability related to the Company’s U.S., state and foreign income tax returns for the current year and anticipated tax payments resulting from income tax audits, while the net deferred tax expense or benefit represents the change in the balance of deferred tax assets or liabilities as reported on the balance sheet. The changes in deferred tax assets and liabilities are determined based upon the changes in differences between the basiscarrying amount of assets and liabilities for financial reporting purposes and the basis of assets and liabilities for tax purposes as measured using the enacted tax rates that management estimates will be in effect when these differences reverse.
In addition to estimating the future tax rates applicable to the reversal of tax differences, management must make certain assumptions regarding whether tax differences are permanent or temporary. If the differences are temporary, management must estimate the timing of their reversal, and whether taxable operating income in future periods will be sufficient to fully recognize any gross deferred tax assets of the Company. The tax provision for Mexico has additional complexities such as the impacts of inflation and exchange rate variations and inflation, both of which can have a significant impact on the calculations. Finally, the Company is required to pay the greater of Mexican income tax or the Entrepreneurial Tax of Unique Rate
45
The general principles and complexities of income tax accounting related to Mexico apply to the calculation of the statutorily required Mexico employee profit sharing expense, current liability and deferred liability. The employee profit sharing expense is recorded within compensation and benefits in the consolidated statementstatements of income.
For the year ended December 31, 2009,2011, income tax expense totaled $34.6 million.$123.1 million. For every 1% change in the 20092011 effective rate, income tax expense would have changed by $1.0approximately $4.6 million. If the exchange rate used at the end of 2011 increased by Ps.0.1 from Ps.14.0 per U.S. dollar to Ps.14.1 per U.S. dollar, the tax expense would have decreased by approximately $2.0 million. For an increase of 1% in the Mexican inflation rate, the tax expense would increasehave increased by approximately $0.7$0.8 million. If the exchange rate used at the end of 2009 increased by Ps.0.10 from Ps.13.1 per U.S. dollar to Ps.13.2 per dollar, the tax expense would have decreased by approximately $1.9 million.
OTHER MATTERS
Litigation. The Company is a party to various legal proceedings and administrative actions, all of which are of an ordinary, routine nature and incidental to its operations. Included in these proceedings are various tort claims brought by current and former employees for job related injuries and by third parties for injuries related to railroad operations. KCS aggressively defends these matters and has established liability reservesprovisions that management believes are adequate to cover expected costs. Although it is not possible to predict the outcome of any legal proceeding, in the opinion of the Company’s management, other
48
than those proceedings described in Note 1214 to the Consolidated Financial Statements in Item 8 of thisForm 10-K, such proceedings and actions should not, individually, or in the aggregate, have a material adverse effect on the Company’s consolidated financial condition.statements.
Inflation. U.S. generally accepted accounting principles require the use of historical cost, which does not reflect the effects of inflation on the replacement cost of property. Due to the capital intensive nature of
46
Recent Accounting Pronouncements.Refer to Note 2 to the Consolidated Financial Statements in Item 8 of thisForm
10-K for information relative to recent accounting pronouncements.
| Item 7A. | Quantitative and Qualitative Disclosures About Market Risk |
KCS utilizes various financial instruments that have certain inherent market risks, but theserisks. These instruments have not been entered into for trading purposes. The following information, together with information included in Item 7, “Management’s Discussion and Analysis of Financial Condition and Results of Operations” and Note 1415 to the Consolidated Financial Statements in Item 8 of thisForm 10-K, describe the key aspects of certain financial instruments that have market risk to KCS.
Interest Rate Sensitivity. Floating-rate indebtedness totaled $350.6$346.3 million and $443.9$307.4 million at December 31, 20092011 and 2008,2010, respectively. A credit agreement, comprised of aThe Company’s revolving credit facilityfacilities and term loan facilities containscontain variable rate debt whichthat accrues interest based on target interest indexes (London Interbank Offered Rate — “LIBOR” or an alternative base rate) plus an applicable spread, as set forth in the credit agreement. The Company has an aggregate notional amount of $250.0 million of interest rate hedges at December 31, 2009, which effectively convert interest payments from variable rates to fixed rates.spread. Given the balance of $100.6$346.3 million at December 31, 2009 of variable rate debt net of interest rate hedges,at December 31, 2011, KCS is sensitive to fluctuations in interest rates. For example, a hypothetical 100 basis points increase in each of the respective target interest indexes would result in additional interest expense of $1.0$3.5 million on an annualized basis for the net floating-rate instruments issued by the Company as of December 31, 2009.2011.
Based upon the borrowing rates available to KCS and its subsidiaries for indebtedness with similar terms and average maturities, the fair value of debt was approximately $2,031.1$1,741.3 million and $1,911.5$1,739.8 million at December 31, 20092011 and 2008,2010, respectively, compared with a carrying value of $1,980.0$1,639.1 million and $2,086.1$1,639.7 million at December 31, 20092011 and 2008,2010, respectively.
Commodity Price Sensitivity. KCS periodically participates in diesel fuel purchase commitment and swap transactions. At December 31, 20092011 and 2008,2010, KCS did not have any outstanding fuel swap agreements. The Company also holds fuel inventories for use in operations. These inventories are not material to KCS’KCS’s overall financial position. Fuel costs are expected to mirrorreflect market conditions in 2010,2012; however, fuel costcosts are unpredictable and subject to a variety of factors outside the Company’s control. Assuming annual consumption of 130 million gallons, a 10 cent change in the price per gallon of fuel would cause a $13.0 million change in operating expenses. KCS is able to reduce the impact of increased fuel costs through fuel surcharge revenues from customers. Assuming annual consumption of 110 million gallons, a 10 cent change in the price per gallon of fuel would cause an $11.0 million change in operating expenses.
Foreign Exchange Sensitivity. KCSM uses While KCS’s foreign subsidiaries use the U.S. dollar as itstheir functional currency. Earnings from KCSM includedcurrency, a portion of the foreign subsidiaries’ revenues and expenses are denominated in Mexican pesos. Based on the Company’s resultsvolume of operations reflect revaluation gainsrevenue and losses that KCSM recordsexpense transactions denominated in the process of remeasuring certain transactions fromMexican pesos, revenue and expense fluctuations generally offset, with insignificant net impacts to dollars. Therefore, theoperating income.
The Company has exposure to fluctuations in the value of the peso. KCS manages this risk by monitoringMexican peso against the U.S. dollar due to its pesonet monetary assets that are denominated cash inflows and outflows.in Mexican pesos. For example, a hypothetical 10% increase in the U.S. dollarMexican peso to the Mexican pesoU.S. dollar exchange rate on net peso denominated monetary assets of Ps.495Ps.835.3 million at December 31, 2011, would result in a foreign exchange loss of approximately $3.4$5.4 million, and a 10% decrease in the exchange rate would result in a foreign exchange gain of approximately $4.2$6.6 million.
For income taxes paid in Mexico, which are paid in Mexican pesos, the revaluation of U.S. denominated amounts (primarily debt) into Mexican pesos is taxed currently under Mexican tax law. If the exchange rate used at the end of 2011 increased from Ps. 14.0 per U.S. dollar to Ps. 14.1 per U.S. dollar, income tax expense for the year ended December 31, 2011 would have decreased by approximately $2.0 million.
49
| Item 8. | Financial Statements and Supplementary Data |
Index to Consolidated Financial Statements
| Page | ||||
| Financial Statement Schedules: | ||||
All schedules are omitted because they are not applicable, are insignificant, or the required information is shown in the consolidated financial statements or notes thereto.
50
Management’s Report on Internal Control over Financial Reporting
The management of Kansas City Southern is responsible for establishing and maintaining adequate internal control over financial reporting as such term is defined in Exchange ActRules 13a-15(f) and15d-15(f). KCS’ KCS’s internal control over financial reporting was designed to provide reasonable assurance to the Company’s management and Board of Directors regarding the preparation and fair presentation of published financial statements.
All internal control systems, no matter how well designed, have inherent limitations. Therefore, even those systems determined to be effective can provide only reasonable assurance with respect to financial statement preparation and presentation.
Under the supervision and participation of the Company’s Chief Executive Officer and Chief Financial Officer, management conducted an evaluation of the effectiveness of the Company’s internal control over financial reporting as of December 31, 2009,2011, based on the framework established by the Committee of Sponsoring Organizations of the Treadway Commission inInternal Control — Integrated Framework(commonly (commonly referred to as the COSO framework). Based on its evaluation, management concluded that the Company’s internal control over financial reporting was effective as of December 31, 2009,2011, based on the criteria outlined in the COSO framework.
The effectiveness of the Company’s internal control over financial reporting as of December 31, 2009,2011, has been audited by KPMG LLP, an independent registered public accounting firm, as stated in their attestation report, which immediately follows this report.
51
Report of Independent Registered Public Accounting Firm
The Board of Directors and Stockholders
Kansas City Southern:
We have audited Kansas City Southern’s (the Company) internal control over financial reporting as of December 31, 2009,2011, based on criteria established inInternal Control — Integrated Frameworkissued by the Committee of Sponsoring Organizations of the Treadway Commission (COSO). The Company’s management is responsible for maintaining effective internal control over financial reporting and for its assessment of the effectiveness of internal control over financial reporting, included in the accompanying Management’s Report on Internal Control over Financial Reporting. Our responsibility is to express an opinion on the Company’s internal control over financial reporting based on our audit.
We conducted our audit in accordance with the standards of the Public Company Accounting Oversight Board (United States). Those standards require that we plan and perform the audit to obtain reasonable assurance about whether effective internal control over financial reporting was maintained in all material respects. Our audit included obtaining an understanding of internal control over financial reporting, assessing the risk that a material weakness exists, and testing and evaluating the design and operating effectiveness of internal control based on the assessed risk. Our audit also included performing such other procedures as we considered necessary in the circumstances. We believe that our audit provides a reasonable basis for our opinion.
A company’s internal control over financial reporting is a process designed to provide reasonable assurance regarding the reliability of financial reporting and the preparation of financial statements for external purposes in accordance with generally accepted accounting principles. A company’s internal control over financial reporting includes those policies and procedures that (1) pertain to the maintenance of records that, in reasonable detail, accurately and fairly reflect the transactions and dispositions of the assets of the company; (2) provide reasonable assurance that transactions are recorded as necessary to permit preparation of financial statements in accordance with generally accepted accounting principles, and that receipts and expenditures of the company are being made only in accordance with authorizations of management and directors of the company; and (3) provide reasonable assurance regarding prevention or timely detection of unauthorized acquisition, use, or disposition of the company’s assets that could have a material effect on the financial statements.
Because of its inherent limitations, internal control over financial reporting may not prevent or detect misstatements. Also, projections of any evaluation of effectiveness to future periods are subject to the risk that controls may become inadequate because of changes in conditions, or that the degree of compliance with the policies or procedures may deteriorate.
In our opinion, Kansas City Southern maintained, in all material respects, effective internal control over financial reporting as of December 31, 2009,2011, based on criteria established inInternal Control — Integrated Frameworkissued by COSO.the Committee of Sponsoring Organizations of the Treadway Commission.
We also have audited, in accordance with the standards of the Public Company Accounting Oversight Board (United States), the consolidated balance sheets of Kansas City Southern as of December 31, 20092011 and 2008,2010, and the related consolidated statements of income, changes in equity and comprehensive income, and cash flows for each of the years in the three-year period ended December 31, 2009,2011, and our report dated February 11, 20108, 2012 expressed an unqualified opinion on those consolidated financial statements.
/s/ KPMG LLP
Kansas City, Missouri
February 11, 20108, 2012
52
Report of Independent Registered Public Accounting Firm
The Board of Directors and Stockholders
Kansas City Southern:
We have audited the accompanying consolidated balance sheets of Kansas City Southern and subsidiaries (the Company) as of December 31, 20092011 and 2008,2010, and the related consolidated statements of income, changes in equity and comprehensive income, and cash flows for each of the years in the three-year period ended December 31, 2009.2011. These consolidated financial statements are the responsibility of the Company’s management. Our responsibility is to express an opinion on these consolidated financial statements based on our audits.
We conducted our audits in accordance with the standards of the Public Company Accounting Oversight Board (United States). Those standards require that we plan and perform the audit to obtain reasonable assurance about whether the financial statements are free of material misstatement. An audit includes examining, on a test basis, evidence supporting the amounts and disclosures in the financial statements. An audit also includes assessing the accounting principles used and significant estimates made by management, as well as evaluating the overall financial statement presentation. We believe that our audits provide a reasonable basis for our opinion.
In our opinion, the consolidated financial statements referred to above present fairly, in all material respects, the financial position of Kansas City Southern and subsidiaries as of December 31, 20092011 and 2008,2010, and the results of their operations and their cash flows for each of the years in the three-year period ended December 31, 2009,2011, in conformity with U.S. generally accepted accounting principles.
We also have audited, in accordance with the standards of the Public Company Accounting Oversight Board (United States), Kansas City Southern’s internal control over financial reporting as of December 31, 2009,2011, based on criteria established inInternal Control — Integrated Framework issued by the Committee of Sponsoring Organizations of the Treadway Commission (COSO), and our report dated February 11, 20108, 2012 expressed an unqualified opinion on the effectiveness of the Company’s internal control over financial reporting.
/s/ KPMG LLP
Kansas City, Missouri
February 11, 20108, 2012
53
Kansas City Southern and Subsidiaries
Consolidated Statements of Income
Years Ended December 31,
| 2009 | 2008 | 2007 | ||||||||||
| In millions, except share | ||||||||||||
| and per share amounts | ||||||||||||
| Revenues | $ | 1,480.2 | $ | 1,852.1 | $ | 1,742.8 | ||||||
| Operating expenses: | ||||||||||||
| Compensation and benefits | 328.8 | 369.9 | 384.0 | |||||||||
| Purchased services | 171.3 | 209.1 | 198.4 | |||||||||
| Fuel | 189.4 | 324.6 | 270.2 | |||||||||
| Equipment costs | 164.1 | 178.6 | 184.6 | |||||||||
| Depreciation and amortization | 182.5 | 168.6 | 159.0 | |||||||||
| Casualties and insurance | 43.1 | 72.7 | 69.3 | |||||||||
| Materials and other | 132.8 | 138.4 | 114.9 | |||||||||
| Total operating expenses | 1,212.0 | 1,461.9 | 1,380.4 | |||||||||
| Operating income | 268.2 | 390.2 | 362.4 | |||||||||
| Equity in net earnings of unconsolidated affiliates | 7.7 | 18.0 | 11.4 | |||||||||
| Interest expense | (173.7 | ) | (138.9 | ) | (156.7 | ) | ||||||
| Debt retirement costs | (5.9 | ) | (5.6 | ) | (6.9 | ) | ||||||
| Foreign exchange gain (loss) | 2.1 | (21.0 | ) | (0.9 | ) | |||||||
| Other income, net | 5.2 | 6.0 | 12.0 | |||||||||
| Income before income taxes and noncontrolling interest | 103.6 | 248.7 | 221.3 | |||||||||
| Income tax expense | 34.6 | 64.5 | 67.1 | |||||||||
| Net income | 69.0 | 184.2 | 154.2 | |||||||||
| Noncontrolling interest | 1.0 | 0.3 | 0.4 | |||||||||
| Net income attributable to Kansas City Southern and subsidiaries | 68.0 | 183.9 | 153.8 | |||||||||
| Preferred stock dividends | 11.0 | 15.2 | 19.8 | |||||||||
| Net income available to common shareholders | $ | 57.0 | $ | 168.7 | $ | 134.0 | ||||||
| Earnings per share: | ||||||||||||
| Basic earnings per share | $ | 0.61 | $ | 2.02 | $ | 1.77 | ||||||
| Diluted earnings per share | $ | 0.61 | $ | 1.86 | $ | 1.57 | ||||||
Average shares outstanding(in thousands): | ||||||||||||
| Basic | 93,145 | 83,674 | 75,832 | |||||||||
| Potentially dilutive common shares | 504 | 14,928 | 21,784 | |||||||||
| Diluted | 93,649 | 98,602 | 97,616 | |||||||||
| 2011 | 2010 | 2009 | |||||||||
(In millions, except share and per share amounts) | |||||||||||
| Revenues | $ | 2,098.3 | $ | 1,814.8 | $ | 1,480.2 | |||||
| Operating expenses: | |||||||||||
| Compensation and benefits | 423.8 | 369.3 | 328.7 | ||||||||
| Purchased services | 204.8 | 189.1 | 173.7 | ||||||||
| Fuel | 346.5 | 263.6 | 189.4 | ||||||||
| Equipment costs | 167.1 | 157.4 | 164.1 | ||||||||
| Depreciation and amortization | 186.2 | 184.9 | 181.6 | ||||||||
| Materials and other | 183.9 | 164.0 | 175.9 | ||||||||
| Gain on insurance recoveries related to hurricane damage | (25.6 | ) | — | — | |||||||
| Total operating expenses | 1,486.7 | 1,328.3 | 1,213.4 | ||||||||
| Operating income | 611.6 | 486.5 | 266.8 | ||||||||
| Equity in net earnings of unconsolidated affiliates | 18.2 | 19.7 | 7.7 | ||||||||
| Interest expense | (129.1 | ) | (158.1 | ) | (173.7 | ) | |||||
| Debt retirement costs | (38.7 | ) | (68.3 | ) | (5.9 | ) | |||||
| Foreign exchange gain (loss) | (9.2 | ) | 4.7 | 2.1 | |||||||
| Other income, net | 2.2 | 4.7 | 5.2 | ||||||||
| Income before income taxes | 455.0 | 289.2 | 102.2 | ||||||||
| Income tax expense | 123.1 | 109.2 | 34.1 | ||||||||
| Net income | 331.9 | 180.0 | 68.1 | ||||||||
| Less: Net income (loss) attributable to noncontrolling interest | 1.6 | (0.2 | ) | 1.0 | |||||||
| Net income attributable to Kansas City Southern and subsidiaries | 330.3 | 180.2 | 67.1 | ||||||||
| Preferred stock dividends | 1.6 | 11.0 | 11.0 | ||||||||
| Net income available to common stockholders | $ | 328.7 | $ | 169.2 | $ | 56.1 | |||||
| Earnings per share: | |||||||||||
| Basic earnings per share | $ | 3.04 | $ | 1.69 | $ | 0.60 | |||||
| Diluted earnings per share | $ | 3.00 | $ | 1.67 | $ | 0.60 | |||||
Average shares outstanding (in thousands): | |||||||||||
| Basic | 108,208 | 100,054 | 93,145 | ||||||||
| Potentially dilutive common shares | 1,622 | 7,480 | 504 | ||||||||
| Diluted | 109,830 | 107,534 | 93,649 | ||||||||
See accompanying notes to consolidated financial statements.
52
54
Kansas City Southern and Subsidiaries
Consolidated Balance Sheets
December 31,
| 2009 | 2008 | |||||||
| In millions, except | ||||||||
| share amounts | ||||||||
ASSETS | ||||||||
| Current assets: | ||||||||
| Cash and cash equivalents | $ | 117.5 | $ | 229.9 | ||||
| Accounts receivable, net | 139.4 | 163.8 | ||||||
| Restricted funds | 35.8 | 34.0 | ||||||
| Materials and supplies | 106.4 | 96.3 | ||||||
| Deferred income taxes | 151.7 | 62.8 | ||||||
| Other current assets | 63.0 | 98.8 | ||||||
| Total current assets | 613.8 | 685.6 | ||||||
| Investments | 46.8 | 60.5 | ||||||
| Property and equipment (including concession assets), net | 4,747.2 | 4,598.4 | ||||||
| Deferred income taxes | — | 36.4 | ||||||
| Other assets | 71.3 | 58.3 | ||||||
| Total assets | $ | 5,479.1 | $ | 5,439.2 | ||||
| LIABILITIES AND EQUITY | ||||||||
| Current liabilities: | ||||||||
| Debt due within one year | $ | 68.1 | $ | 637.4 | ||||
| Accounts payable and accrued liabilities | 342.7 | 455.4 | ||||||
| Total current liabilities | 410.8 | 1,092.8 | ||||||
| Long-term debt | 1,911.9 | 1,448.7 | ||||||
| Deferred income taxes | 567.1 | 492.4 | ||||||
| Other noncurrent liabilities and deferred credits | 247.7 | 220.1 | ||||||
| Total liabilities | 3,137.5 | 3,254.0 | ||||||
| Commitments and contingencies | — | — | ||||||
| Stockholders’ equity: | ||||||||
| $25 par, 4% noncumulative, preferred stock, 840,000 shares authorized, 649,736 shares issued, 242,170 shares outstanding | 6.1 | 6.1 | ||||||
| Series D — cumulative convertible perpetual preferred stock, $1 par, 5.125%, 210,000 shares authorized and issued, 209,995 shares outstanding with a liquidation preference of $1,000 per share | 0.2 | 0.2 | ||||||
| $.01 par, common stock, 400,000,000 shares authorized; 110,583,068 and 106,252,860 shares issued at December 31, 2009 and 2008, respectively; 96,213,346 and 91,463,762 shares outstanding at December 31, 2009 and 2008, respectively | 0.9 | 0.9 | ||||||
| Paid-in capital | 661.4 | 572.3 | ||||||
| Retained earnings | 1,394.6 | 1,337.6 | ||||||
| Accumulated other comprehensive loss | (4.4 | ) | (5.6 | ) | ||||
| Total stockholders’ equity | 2,058.8 | 1,911.5 | ||||||
| Noncontrolling interest | 282.8 | 273.7 | ||||||
| Total equity | 2,341.6 | 2,185.2 | ||||||
| Total liabilities and equity | $ | 5,479.1 | $ | 5,439.2 | ||||
| 2011 | 2010 | ||||||
(In millions, except share and per share amounts) | |||||||
| ASSETS | |||||||
| Current assets: | |||||||
| Cash and cash equivalents | $ | 72.4 | $ | 85.4 | |||
| Accounts receivable, net | 166.0 | 160.0 | |||||
| Materials and supplies | 109.6 | 101.4 | |||||
| Deferred income taxes | 225.0 | 138.2 | |||||
| Other current assets | 69.5 | 91.2 | |||||
| Total current assets | 642.5 | 576.2 | |||||
| Investments | 50.4 | 46.4 | |||||
| Restricted funds | 21.7 | 22.0 | |||||
| Property and equipment (including concession assets), net | 5,349.5 | 4,902.4 | |||||
| Other assets | 108.9 | 93.9 | |||||
| Total assets | $ | 6,173.0 | $ | 5,640.9 | |||
| LIABILITIES AND EQUITY | |||||||
| Current liabilities: | |||||||
| Debt due within one year | $ | 36.3 | $ | 18.1 | |||
| Accounts payable and accrued liabilities | 401.1 | 403.0 | |||||
| Total current liabilities | 437.4 | 421.1 | |||||
| Long-term debt | 1,602.8 | 1,621.6 | |||||
| Deferred income taxes | 861.4 | 654.5 | |||||
| Other noncurrent liabilities and deferred credits | 212.7 | 230.0 | |||||
| Total liabilities | 3,114.3 | 2,927.2 | |||||
| Commitments and contingencies | — | — | |||||
| Stockholders’ equity: | |||||||
| $25 par, 4% noncumulative, preferred stock, 840,000 shares authorized, 649,736 shares issued, 242,170 shares outstanding | 6.1 | 6.1 | |||||
| Series D — cumulative convertible perpetual preferred stock, $1 par, 5.125%, 210,000 shares authorized and issued at December 31, 2010; 209,995 shares outstanding with a liquidation preference of $1,000 per share at December 31, 2010 | — | 0.2 | |||||
| $.01 par, common stock, 400,000,000 shares authorized; 123,352,185 and 116,352,298 shares issued at December 31, 2011 and 2010, respectively; 109,910,857 and 102,648,845 shares outstanding at December 31, 2011 and 2010, respectively | 1.1 | 1.0 | |||||
| Paid-in capital | 884.2 | 877.2 | |||||
| Retained earnings | 1,875.3 | 1,548.0 | |||||
| Accumulated other comprehensive loss | (2.2 | ) | (1.4 | ) | |||
| Total stockholders’ equity | 2,764.5 | 2,431.1 | |||||
| Noncontrolling interest | 294.2 | 282.6 | |||||
| Total equity | 3,058.7 | 2,713.7 | |||||
| Total liabilities and equity | $ | 6,173.0 | $ | 5,640.9 | |||
See accompanying notes to consolidated financial statements.
53
55
Kansas City Southern and Subsidiaries
Consolidated Statements of Cash Flows
Years Ended December 31,
| 2009 | 2008 | 2007 | ||||||||||
| In millions | ||||||||||||
Operating activities: | ||||||||||||
| Net income | $ | 69.0 | $ | 184.2 | $ | 154.2 | ||||||
| Adjustments to reconcile net income to net cash provided by operating activities: | ||||||||||||
| Depreciation and amortization | 182.5 | 168.6 | 159.0 | |||||||||
| Deferred income taxes | 31.4 | 63.8 | 66.3 | |||||||||
| Equity in undistributed earnings of unconsolidated affiliates | (7.7 | ) | (18.0 | ) | (11.4 | ) | ||||||
| Share-based compensation | 9.9 | 7.4 | 11.1 | |||||||||
| Excess tax benefit from share-based compensation | (1.5 | ) | (5.6 | ) | (2.4 | ) | ||||||
| Other deferred compensation | 3.3 | (1.9 | ) | (2.1 | ) | |||||||
| Distributions from unconsolidated affiliates | 7.3 | 18.9 | 4.0 | |||||||||
| Gain on sale of assets | (3.8 | ) | (3.4 | ) | (5.7 | ) | ||||||
| Debt retirement costs | 5.9 | 5.6 | 6.9 | |||||||||
| Changes in working capital items: | ||||||||||||
| Accounts receivable | 23.3 | 52.6 | 81.0 | |||||||||
| Materials and supplies | (12.3 | ) | (6.0 | ) | (12.4 | ) | ||||||
| Other current assets | 8.6 | (8.0 | ) | 0.9 | ||||||||
| Accounts payable and accrued liabilities | (19.9 | ) | (42.8 | ) | (65.4 | ) | ||||||
| Other, net | (3.1 | ) | (2.4 | ) | (16.2 | ) | ||||||
| Net cash provided by operating activities | 292.9 | 413.0 | 367.8 | |||||||||
Investing activities: | ||||||||||||
| Capital expenditures | (349.2 | ) | (533.8 | ) | (396.8 | ) | ||||||
| Proceeds from disposal of property | 13.9 | 20.9 | 16.6 | |||||||||
| Contribution from NS for MSLLC | — | 27.0 | 143.4 | |||||||||
| Property investments in MSLLC | (22.0 | ) | (30.4 | ) | (118.0 | ) | ||||||
| Proceeds and repayments from loans to equity affiliates | — | — | 14.4 | |||||||||
| Other, net | 10.9 | (21.7 | ) | (26.4 | ) | |||||||
| Net cash used for investing activities | (346.4 | ) | (538.0 | ) | (366.8 | ) | ||||||
Financing activities: | ||||||||||||
| Proceeds from issuance of long-term debt | 202.1 | 580.1 | 326.6 | |||||||||
| Repayment of long-term debt | (319.1 | ) | (262.8 | ) | (311.3 | ) | ||||||
| Debt costs | (9.3 | ) | (16.9 | ) | (19.6 | ) | ||||||
| Proceeds from common stock issuance | 73.9 | — | — | |||||||||
| Proceeds from stock plans | 3.0 | 8.6 | 0.7 | |||||||||
| Excess tax benefit from share-based compensation | 1.5 | 5.6 | 2.4 | |||||||||
| Preferred stock dividends paid | (11.0 | ) | (15.2 | ) | (23.3 | ) | ||||||
| Net cash provided by (used for) financing activities | (58.9 | ) | 299.4 | (24.5 | ) | |||||||
| Cash and cash equivalents: | ||||||||||||
| Net increase (decrease) during each year | (112.4 | ) | 174.4 | (23.5 | ) | |||||||
| At beginning of year | 229.9 | 55.5 | 79.0 | |||||||||
| At end of year | $ | 117.5 | $ | 229.9 | $ | 55.5 | ||||||
Supplemental cash flow information | ||||||||||||
| Non-cash investing and financing activities: | ||||||||||||
| Capital expenditures accrued but not yet paid at year end | $ | 24.9 | $ | 91.2 | $ | 48.5 | ||||||
| Capital lease obligations incurred | — | 13.1 | 7.2 | |||||||||
| Non-cash asset acquisitions | 21.3 | 21.8 | — | |||||||||
| Property contribution from NS for MSLLC | 9.6 | 3.5 | — | |||||||||
| Property dividend from Southern Capital | — | — | 10.3 | |||||||||
| Cash payments: | ||||||||||||
| Interest paid, net of amounts capitalized | $ | 174.0 | $ | 136.8 | $ | 141.5 | ||||||
| Income tax payments net of refunds | 3.5 | 1.5 | 13.6 | |||||||||
| 2011 | 2010 | 2009 | |||||||||
| (In millions) | |||||||||||
| Operating activities: | |||||||||||
| Net income | $ | 331.9 | $ | 180.0 | $ | 68.1 | |||||
| Adjustments to reconcile net income to net cash provided by operating activities: | |||||||||||
| Depreciation and amortization | 186.2 | 184.9 | 181.6 | ||||||||
| Deferred income taxes | 120.7 | 106.2 | 30.9 | ||||||||
| Equity in net earnings of unconsolidated affiliates | (18.2 | ) | (19.7 | ) | (7.7 | ) | |||||
| Share-based compensation | 8.5 | 8.8 | 9.9 | ||||||||
| Excess tax benefit from share-based compensation | (0.2 | ) | (1.2 | ) | (1.5 | ) | |||||
| Deferred compensation | 22.6 | 5.1 | 3.2 | ||||||||
| Distributions from unconsolidated affiliates | 18.1 | 19.5 | 7.3 | ||||||||
| Gain on insurance recoveries related to hurricane damage | (25.6 | ) | — | — | |||||||
| Cash payments related to hurricane damage | (3.3 | ) | (27.8 | ) | — | ||||||
| Insurance proceeds related to hurricane damage | 40.2 | 8.2 | — | ||||||||
| Gains on sale of assets | (0.5 | ) | (1.7 | ) | (3.8 | ) | |||||
| Debt retirement costs | 38.7 | 68.3 | 5.9 | ||||||||
| Changes in working capital items: | |||||||||||
| Accounts receivable | (1.5 | ) | (20.2 | ) | 23.3 | ||||||
| Materials and supplies | (7.2 | ) | 6.3 | (12.3 | ) | ||||||
| Other current assets | (26.8 | ) | (4.8 | ) | 8.6 | ||||||
| Accounts payable and accrued liabilities | (10.6 | ) | 18.5 | (19.9 | ) | ||||||
| Other, net | (35.0 | ) | (34.1 | ) | (3.1 | ) | |||||
| Net cash provided by operating activities | 638.0 | 496.3 | 290.5 | ||||||||
| Investing activities: | |||||||||||
| Capital expenditures | (495.0 | ) | (287.3 | ) | (346.8 | ) | |||||
| Acquisition of an intermodal facility, net of cash acquired | — | (25.0 | ) | — | |||||||
| Property investments in MSLLC | (33.3 | ) | (25.2 | ) | (22.0 | ) | |||||
| Contributions from noncontrolling interest | 10.0 | — | — | ||||||||
| Insurance proceeds related to hurricane damage | 12.4 | 1.8 | — | ||||||||
| Proceeds from disposal of property | 10.0 | 8.3 | 13.9 | ||||||||
| Other, net | (14.5 | ) | 15.9 | 10.9 | |||||||
| Net cash used for investing activities | (510.4 | ) | (311.5 | ) | (344.0 | ) | |||||
| Financing activities: | |||||||||||
| Proceeds from issuance of long-term debt | 550.0 | 480.7 | 202.1 | ||||||||
| Repayment of long-term debt | (653.3 | ) | (839.7 | ) | (319.1 | ) | |||||
| Proceeds from common stock issuance | — | 214.9 | 73.9 | ||||||||
| Debt costs | (36.6 | ) | (65.1 | ) | (9.3 | ) | |||||
| Proceeds from employee stock plans | 2.1 | 2.1 | 3.0 | ||||||||
| Excess tax benefit from share-based compensation | 0.2 | 1.2 | 1.5 | ||||||||
| Preferred stock dividends paid | (3.0 | ) | (11.0 | ) | (11.0 | ) | |||||
| Net cash used for financing activities | (140.6 | ) | (216.9 | ) | (58.9 | ) | |||||
| Cash and cash equivalents: | |||||||||||
| Net decrease during each year | (13.0 | ) | (32.1 | ) | (112.4 | ) | |||||
| At beginning of year | 85.4 | 117.5 | 229.9 | ||||||||
| At end of year | $ | 72.4 | $ | 85.4 | $ | 117.5 | |||||
| Supplemental cash flow information | |||||||||||
| Non-cash investing and financing activities: | |||||||||||
| Capital expenditures accrued but not yet paid at end of year | $ | 62.0 | $ | 57.4 | $ | 24.9 | |||||
| Capital lease obligations incurred | 0.7 | 3.7 | — | ||||||||
| Non-cash asset acquisitions | 116.1 | 7.3 | 21.3 | ||||||||
| Property contribution from noncontrolling interest | — | — | 9.6 | ||||||||
| Cash payments: | |||||||||||
| Interest paid, net of amounts capitalized | $ | 125.0 | $ | 153.0 | $ | 174.0 | |||||
| Income tax payments, net of refunds | 0.9 | 1.6 | 3.5 | ||||||||
See accompanying notes to consolidated financial statements.
54
56
Kansas City Southern and Subsidiaries
Consolidated Statements of Changes in Equity and Comprehensive Income
| $1 Par Cumulative | Accumulated | |||||||||||||||||||||||||||||||||||
| $25 Par | Preferred Stock | $.01 Par | Other | |||||||||||||||||||||||||||||||||
| Preferred | Series C | Series D | Common | Paid in | Retained | Comprehensive | Noncontrolling | |||||||||||||||||||||||||||||
| Stock | 4.25% | 5.125% | Stock | Capital | Earnings | Income (Loss) | Interest | Total | ||||||||||||||||||||||||||||
| In millions | ||||||||||||||||||||||||||||||||||||
Balance at December 31, 2006 | $ | 6.1 | $ | 0.4 | $ | 0.2 | $ | 0.7 | $ | 523.0 | $ | 1,050.7 | $ | 1.3 | $ | 100.3 | $ | 1,682.7 | ||||||||||||||||||
| Comprehensive income: | ||||||||||||||||||||||||||||||||||||
| Net income | 153.8 | 0.4 | 154.2 | |||||||||||||||||||||||||||||||||
| Prior service cost and amortization net of tax of $0.6 million | (0.9 | ) | (0.9 | ) | ||||||||||||||||||||||||||||||||
| Comprehensive income | — | — | — | — | — | 153.8 | (0.9 | ) | 0.4 | 153.3 | ||||||||||||||||||||||||||
| Contributions from noncontrolling interest | 143.4 | 143.4 | ||||||||||||||||||||||||||||||||||
| Distribution to noncontrolling interest | (1.1 | ) | (1.1 | ) | ||||||||||||||||||||||||||||||||
| Dividends on $25 par preferred stock ($1.00/share) | (0.2 | ) | (0.2 | ) | ||||||||||||||||||||||||||||||||
| Dividends on series C cumulative preferred stock ($37.53/share) | (15.0 | ) | (15.0 | ) | ||||||||||||||||||||||||||||||||
| Dividends on series D cumulative preferred stock ($90.67/share) | 11.0 | (19.1 | ) | (8.1 | ) | |||||||||||||||||||||||||||||||
| Options exercised and stock subscribed | 0.1 | 2.0 | 2.1 | |||||||||||||||||||||||||||||||||
| Tax benefit from share-based compensation | 2.4 | 2.4 | ||||||||||||||||||||||||||||||||||
| Share-based compensation | 11.1 | 11.1 | ||||||||||||||||||||||||||||||||||
Adjustment to income tax payable upon adoption of certain provisions of FASB ASC740-10 (formerly FIN 48) | (1.3 | ) | (1.3 | ) | ||||||||||||||||||||||||||||||||
Balance at December 31, 2007 | 6.1 | 0.4 | 0.2 | 0.8 | 549.5 | 1,168.9 | 0.4 | 243.0 | 1,969.3 | |||||||||||||||||||||||||||
| Comprehensive income: | ||||||||||||||||||||||||||||||||||||
| Net income | 183.9 | 0.3 | 184.2 | |||||||||||||||||||||||||||||||||
| Unrealized gain (loss) on cash flow hedges, net of tax of $(2.1) million | (3.4 | ) | (3.4 | ) | ||||||||||||||||||||||||||||||||
| Reclassification adjustment from cash flow hedges included in net income, net of tax of $(0.2) million | (0.3 | ) | (0.3 | ) | ||||||||||||||||||||||||||||||||
| Prior service cost amortization and adjustment, net of tax of $0.1 million | 0.6 | 0.6 | ||||||||||||||||||||||||||||||||||
| Cumulative translation adjustment — FTVM, net of tax of $(1.1) million | (2.9 | ) | (2.9 | ) | ||||||||||||||||||||||||||||||||
| Comprehensive income | — | — | — | — | — | 183.9 | (6.0 | ) | 0.3 | 178.2 | ||||||||||||||||||||||||||
| Contributions from noncontrolling interest | 30.9 | 30.9 | ||||||||||||||||||||||||||||||||||
| Distribution to noncontrolling interest | (0.5 | ) | (0.5 | ) | ||||||||||||||||||||||||||||||||
| Conversion of Series C cumulative convertible preferred stock | (0.4 | ) | 0.1 | 0.3 | — | |||||||||||||||||||||||||||||||
| Dividends on $25 par preferred stock ($1.00/share) | (0.2 | ) | (0.2 | ) | ||||||||||||||||||||||||||||||||
| Dividends on series C cumulative preferred stock ($10.62/share) | (4.2 | ) | (4.2 | ) | ||||||||||||||||||||||||||||||||
| Dividends on series D cumulative preferred stock ($51.24/share) | (10.8 | ) | (10.8 | ) | ||||||||||||||||||||||||||||||||
| Options exercised and stock subscribed | 9.5 | 9.5 | ||||||||||||||||||||||||||||||||||
| Tax benefit from share-based compensation | 5.6 | 5.6 | ||||||||||||||||||||||||||||||||||
| Share-based compensation | 7.4 | 7.4 | ||||||||||||||||||||||||||||||||||
Balance at December 31, 2008 | 6.1 | — | 0.2 | 0.9 | 572.3 | 1,337.6 | (5.6 | ) | 273.7 | 2,185.2 | ||||||||||||||||||||||||||
| Comprehensive income: | ||||||||||||||||||||||||||||||||||||
| Net income | 68.0 | 1.0 | 69.0 | |||||||||||||||||||||||||||||||||
| Unrealized gain (loss) on cash flow hedges, net of tax of $(0.9) million | (1.6 | ) | (1.6 | ) | ||||||||||||||||||||||||||||||||
| Reclassification adjustment from cash flow hedges included in net income, net of tax of $1.3 million | 2.3 | 2.3 | ||||||||||||||||||||||||||||||||||
| Prior service cost amortization net of tax of $(0.1) million | (0.2 | ) | (0.2 | ) | ||||||||||||||||||||||||||||||||
| Cumulative translation adjustment — FTVM, net of tax of $(0.1) million | 0.7 | 0.7 | ||||||||||||||||||||||||||||||||||
| Comprehensive income | — | — | — | — | — | 68.0 | 1.2 | 1.0 | 70.2 | |||||||||||||||||||||||||||
| Contributions from noncontrolling interest | 9.6 | 9.6 | ||||||||||||||||||||||||||||||||||
| Distribution to noncontrolling interest | (1.5 | ) | (1.5 | ) | ||||||||||||||||||||||||||||||||
| Common stock issued | 73.9 | 73.9 | ||||||||||||||||||||||||||||||||||
| Dividends on $25 par preferred stock ($1.00/share) | (0.2 | ) | (0.2 | ) | ||||||||||||||||||||||||||||||||
| Dividends on series D cumulative preferred stock ($51.24/share) | (10.8 | ) | (10.8 | ) | ||||||||||||||||||||||||||||||||
| Options exercised and stock subscribed | 3.8 | 3.8 | ||||||||||||||||||||||||||||||||||
| Tax benefit from share-based compensation | 1.5 | 1.5 | ||||||||||||||||||||||||||||||||||
| Share-based compensation | 9.9 | 9.9 | ||||||||||||||||||||||||||||||||||
Balance at December 31, 2009 | $ | 6.1 | $ | — | $ | 0.2 | $ | 0.9 | $ | 661.4 | $ | 1,394.6 | $ | (4.4 | ) | $ | 282.8 | $ | 2,341.6 | |||||||||||||||||
$25 Par Preferred Stock | $1 Par Cumulative Preferred Stock | $.01 Par Common Stock | Paid in Capital | Retained Earnings | Accumulated Other Comprehensive Income (Loss) | Non- controlling Interest | Total | ||||||||||||||||||||||||
Series D 5.125% | |||||||||||||||||||||||||||||||
| (In millions) | |||||||||||||||||||||||||||||||
| Balance at December 31, 2008 | $ | 6.1 | $ | 0.2 | $ | 0.9 | $ | 572.3 | $ | 1,322.7 | $ | (5.6 | ) | $ | 273.7 | $ | 2,170.3 | ||||||||||||||
| Comprehensive income: | |||||||||||||||||||||||||||||||
| Net income | 67.1 | 1.0 | 68.1 | ||||||||||||||||||||||||||||
| Unrealized loss on cash flow hedges, net of tax of $(0.9) million | (1.6 | ) | (1.6 | ) | |||||||||||||||||||||||||||
| Reclassification adjustment from cash flow hedges included in net income, net of tax of $1.3 million | 2.3 | 2.3 | |||||||||||||||||||||||||||||
| Amortization of prior service credit, net of tax of $(0.1) million | (0.2 | ) | (0.2 | ) | |||||||||||||||||||||||||||
| Cumulative translation adjustment - FTVM, net of tax of $(0.1) million | 0.7 | 0.7 | |||||||||||||||||||||||||||||
| Comprehensive income | — | — | — | — | 67.1 | 1.2 | 1.0 | 69.3 | |||||||||||||||||||||||
| Contributions from noncontrolling interest | 9.6 | 9.6 | |||||||||||||||||||||||||||||
| Distribution to noncontrolling interest | (1.5 | ) | (1.5 | ) | |||||||||||||||||||||||||||
| Common stock issued | 73.9 | 73.9 | |||||||||||||||||||||||||||||
| Dividends on $25 par preferred stock ($1.00/share) | (0.2 | ) | (0.2 | ) | |||||||||||||||||||||||||||
| Dividends on series D cumulative preferred stock ($51.24/share) | (10.8 | ) | (10.8 | ) | |||||||||||||||||||||||||||
| Options exercised and stock subscribed, net of shares withheld for employee taxes | 3.8 | 3.8 | |||||||||||||||||||||||||||||
| Tax benefit from share-based compensation | 1.5 | 1.5 | |||||||||||||||||||||||||||||
| Share-based compensation | 9.9 | 9.9 | |||||||||||||||||||||||||||||
| Balance at December 31, 2009 | 6.1 | 0.2 | 0.9 | 661.4 | 1,378.8 | (4.4 | ) | 282.8 | 2,325.8 | ||||||||||||||||||||||
| Comprehensive income: | |||||||||||||||||||||||||||||||
| Net income | 180.2 | (0.2 | ) | 180.0 | |||||||||||||||||||||||||||
| Unrealized loss on cash flow hedges, net of tax of $(0.3) million | (0.4 | ) | (0.4 | ) | |||||||||||||||||||||||||||
| Reclassification adjustment from cash flow hedges included in net income, net of tax of $1.9 million | 3.2 | 3.2 | |||||||||||||||||||||||||||||
| Amortization of prior service credit, net of tax of $(0.1) million | (0.2 | ) | (0.2 | ) | |||||||||||||||||||||||||||
| Cumulative translation adjustment - FTVM, net of tax of $0.2 million | 0.4 | 0.4 | |||||||||||||||||||||||||||||
| Comprehensive income | — | — | — | — | 180.2 | 3.0 | (0.2 | ) | 183.0 | ||||||||||||||||||||||
| Common stock issued | 0.1 | 214.8 | 214.9 | ||||||||||||||||||||||||||||
| Dividends on $25 par preferred stock ($1.00/share) | (0.2 | ) | (0.2 | ) | |||||||||||||||||||||||||||
| Dividends on series D cumulative preferred stock ($51.24/share) | (10.8 | ) | (10.8 | ) | |||||||||||||||||||||||||||
| Options exercised and stock subscribed, net of shares withheld for employee taxes | (9.0 | ) | (9.0 | ) | |||||||||||||||||||||||||||
| Tax benefit from share-based compensation | 1.2 | 1.2 | |||||||||||||||||||||||||||||
| Share-based compensation | 8.8 | 8.8 | |||||||||||||||||||||||||||||
| Balance at December 31, 2010 | 6.1 | 0.2 | 1.0 | 877.2 | 1,548.0 | (1.4 | ) | 282.6 | 2,713.7 | ||||||||||||||||||||||
| Comprehensive income: | |||||||||||||||||||||||||||||||
| Net income | 330.3 | 1.6 | 331.9 | ||||||||||||||||||||||||||||
| Reclassification adjustment from cash flow hedges included in net income, net of tax of $0.2 million | 0.2 | 0.2 | |||||||||||||||||||||||||||||
| Amortization of prior service credit, net of tax of $(0.1) million | (0.2 | ) | (0.2 | ) | |||||||||||||||||||||||||||
| Cumulative translation adjustment - FTVM, net of tax of $(0.5) million | (0.8 | ) | (0.8 | ) | |||||||||||||||||||||||||||
| Comprehensive income | — | — | — | — | 330.3 | (0.8 | ) | 1.6 | 331.1 | ||||||||||||||||||||||
| Contributions from noncontrolling interest | 10.0 | 10.0 | |||||||||||||||||||||||||||||
| Conversion of series D cumulative convertible preferred stock | (0.2 | ) | (0.2 | ) | |||||||||||||||||||||||||||
| Common stock issued for conversion of series D cumulative convertible preferred stock | 0.1 | 0.1 | 0.2 | ||||||||||||||||||||||||||||
| Dividends on $25 par preferred stock ($1.00/share) | (0.3 | ) | (0.3 | ) | |||||||||||||||||||||||||||
| Dividends on series D cumulative preferred stock ($12.81/share) | (2.7 | ) | (2.7 | ) | |||||||||||||||||||||||||||
| Options exercised and stock subscribed, net of shares withheld for employee taxes | (1.8 | ) | (1.8 | ) | |||||||||||||||||||||||||||
| Tax benefit from share-based compensation | 0.2 | 0.2 | |||||||||||||||||||||||||||||
| Share-based compensation | 8.5 | 8.5 | |||||||||||||||||||||||||||||
| Balance at December 31, 2011 | $ | 6.1 | $ | — | $ | 1.1 | $ | 884.2 | $ | 1,875.3 | $ | (2.2 | ) | $ | 294.2 | $ | 3,058.7 | ||||||||||||||
See accompanying notes to consolidated financial statements.
55
57
Kansas City Southern
Notes to Consolidated Financial Statements
Note 1. | Description of the Business |
Kansas City Southern (“KCS” or the “Company”), a Delaware corporation, was initially organized in 1962 as Kansas City Southern Industries, Inc. In 2002, the Company formally changed its name to Kansas City Southern. KCS is a holding company with principal operations in rail transportation.
The Company is engaged primarily in the freight rail transportation business operating through a single coordinated rail network under one reportable business segment. Effective January 1, 2008, the Company realigned its segments into one reportable segment to reflect the strategic focus on the single coordinated rail network. Prior to January 1, 2008, the Company reported two segments. All prior period segment information has been recast to conform to the current year presentation.
The Company generates revenues and cash flows by providing its customers with freight delivery services both within its regions, and throughout North America through connections with other Class I rail carriers. KCS’KCS’s customers conduct business in a number of different industries, including electric-generating utilities, chemical and petroleum products, paper and forest products, agriculture and mineral products, automotive products and intermodal transportation.
The primary subsidiaries of the Company consist of the following:
| The Kansas City Southern Railway Company (“KCSR”), a wholly-owned consolidated subsidiary; | ||
Mexrail, Inc. (“Mexrail”), a wholly-owned consolidated subsidiary; which wholly owns The Texas Mexican Railway Company (“Tex-Mex”);
Meridian Speedway, LLC (“MSLLC”), a seventy-one percent-owned consolidated affiliate. On December 1, 2005, KCS and KCSR entered into a transaction agreement with Norfolk Southern Corporation (“NS”) and its wholly-owned subsidiary, The Alabama Great Southern Railroad Company (“AGS”), providing for the formation of a limited liability company between the parties relating to the ownership and improvement of the KCSR rail line between Meridian, Mississippi and Shreveport, Louisiana, which is the portion of the KCSR rail line between Dallas, Texas and Meridian known as the “Meridian Speedway”;
Including equity investments in:
Panama Canal Railway Company (“PCRC”), a fifty percent-owned unconsolidated affiliate which includes Panarail Tourism Company (“Panarail”), a wholly-owned subsidiary of PCRC;
Southern Capital Corporation, LLC (“Southern Capital”), a fifty percent-owned unconsolidated affiliate that owns and leases locomotives and other equipment; Ferrocarril y Terminal del Valle de México, |
PTC-220, LLC (“TMM”PTC-220”), entered into a settlement agreement withfourteen percent-owned unconsolidated affiliate that holds the Mexican government resolvinglicenses to large blocks of radio spectrum and other assets for the controversies and disputes between the companies and the Mexican government concerning the paymentdeployment of a VAT refund to KCSM and thepositive train control.
56
The KCSM Concession. KCSM holds a concession from the Mexican government (the “Concession”) until June 2047 (exclusive through 2027, subject to certain trackage and haulage rights granted to other concessionaires), which is renewable under certain conditions for additional periods of up to 50 years.years. The Concession is to provide freight transportation services over rail lines which are a primary commercial corridor of the Mexican railroad system. These lines include the shortest, most direct rail passageway between Mexico City and Laredo, Texas and serve most of Mexico’s principal industrial cities and three of its major shipping ports. KCSM has the right to use, but does not own, all track and buildings that are necessary for the rail lines’ operation. KCSM is obligated to maintain the right of way, track structure, buildings and related maintenance facilities to the operational standards specified in the Concession agreement and to return the assets in that condition at the end of the Concession period. KCSM is required to pay the Mexican government a concession duty equal to 0.5% of gross revenues during the first 15 years of the Concession period and, beginning on June 24, 2012, 1.25% of such revenues during the remainder of the period.
Under the Concession and Mexican law, the Company may freely set rates unless the Mexican government determines that there is no effective competition in Mexico’s rail industry. KCSM is required to register its rates with the Mexican government and to provide railroad services to all users on a fair and non-discriminatory basis and in accordance with
58
efficiency and safety standards approved periodically by the Mexican government. In the event that rates charged are higher than the registered rates, KCSM must reimburse customers with interest, and risk the revocation of the Concession.
Mexican Railroad Services Law and regulations and the Concession establish several circumstances under which the Concession will terminate: revocation by the Mexican government, statutory appropriation, or KCSM’s voluntary surrender of its rights or liquidation or bankruptcy. The Concession requires the undertaking of capital projects, including those described in a business plan filed every five years with the Mexican government. KCSM filed its third business plan with the Mexican government in December 2007 in which KCSM committed to certain minimum investment and capital improvement goals, which may be waived by the Mexican government upon application for relief for good cause. Mexico mayThe Mexican government could also revoke KCSM’s exclusivity after 2027 if it determines that there is insufficient competition.
The Concession is subject to early termination or revocation under certain circumstances. In the event that the Concession is revoked by the Mexican government, KCSM will receive no compensation. Rail lines and all other fixtures covered by the Concession, as well as all improvements made by KCSM or third parties, will revert to the Mexican government. All other property not covered by the Concession, including all locomotives and railcars otherwise acquired, will remain KCSM’s property. TheIn the event of early termination, or total or partial revocation, the Mexican government willwould have the right to cause KCSM to lease all service-related assets to it for a term of at least one year, automatically renewable for additional one-year terms up to five years. The amount of the rent would be determined by experts appointed by KCSM and the Mexican government. The Mexican government must exercise this right within four months after early termination or revocation of the Concession. In addition, the Mexican government willwould have a right of first refusal with respect to certain transfers by KCSM of railroad equipment within 90 days after any revocation of the Concession. The Mexican government may also temporarily seize the rail lines and assets used in operating the rail lines in the event of a natural disaster, war, significant public disturbances, or imminent danger to the domestic peace or economy for the duration of any of the foregoing events; provided, however, that Mexican law requires that the Mexican government pay KCSM compensation equal to damages caused and losses suffered if it effects a statutory appropriation for reasons of the public interest. These payments may not be sufficient to compensate the Company for its losses and may not be timely made.
Employees and Labor Relations. Labor relations in the U.S. railroad industry are subject to extensive governmental regulation under the Railway Labor Act (“RLA”). Under the RLA, national labor agreements are renegotiated on an industry-wide scale when they become open for modification, but their terms remain in effect until new agreements are reached or the RLA’s procedures (which include mediation, cooling-off
57
Approximately 80% of KCSR employees are covered by various collective bargaining agreements. KCSR participates in industry-wide bargaining as a member of the National Carriers’ Conference Committee. A negotiating process for new, major collective bargaining agreements covering all of KCSR’s union employees has been underway since the bargaining round was initiated in November of 2009. Long termLong-term settlement agreements were reached during 2007 and 2008 covering all of KCSR’s unionized work force through January 1,June 30, 2010. The union labor negotiation hasThese agreements continue in effect until new agreements are reached. Labor negotiations in the rail industry are governed by the Railway Labor Act (the “RLA”), which bars strikes or other self-help until exhaustion of mandatory procedures. Contract negotiations with the various unions generally take place over an extended period of time and have not historically resulted in any strike, boycott, or other disruption in the Company’s business operations.
The Company doesnation's largest freight railroads, including KCSR, have been in national (multi-employer) bargaining with the rail unions since January 2010. In September 2011, the railroads ratified the agreement with the largest union, the United Transportation Union, which represents about one third of the KCSR employees covered by this bargaining agreement. On November 5, 2011, a Presidential Emergency Board (“PEB”) appointed by President Obama issued recommendations to resolve the disputes between the U.S. railroads and the 12 unions that had not believeyet reached agreements. As of December 31, 2011, tentative agreements were reached with 11 of those 12 unions. As of the expected settlementsdate of this filing, these agreements have been ratified and will havebe in effect through 2015.
On February 2, 2012, the railroad industry reached a material impact totentative agreement with the consolidated financial statements.remaining union. The union will commence ratification of this tentative agreement by its members.
KCSM union employees are covered by one labor agreement, which was signed on June 23, 1997, between KCSM and the Sindicato de Trabajadores Ferrocarrileros de la República Mexicana (Mexican Railroad Union), for a term of 50 years, for the purpose of regulating the relationship between the parties and improving conditions for the union employees.parties. Approximately 80% of KCSM employees are covered by this labor agreement. The compensation terms under this labor agreement are subject to renegotiation on an annual basis and all other termsbenefits are subject to negotiation every two years. In June of 2009, the negotiation of theOctober 2011, compensation terms and all other benefits was started withcovering the period from July 1, 2011 through June 30, 2012 and the period from July 1, 2011 through June 30, 2013, respectively, were
59
finalized between KCSM and the Mexican Railroad Union. The union labor negotiation with the Mexican Railroad Union has not historically resulted in any strike, boycott, or other disruption in KCSM’s business operations. KCSM does not believe the expected settlements will have a material impact to the consolidated financial statements.
Note 2. | Significant Accounting Policies |
Principles of Consolidation. The accompanying consolidated financial statements are presented using the accrual basis of accounting and include the Company and its majority ownedmajority-owned subsidiaries. All significant intercompany accounts and transactions have been eliminated. Certain prior year amounts have been reclassified to conform to the current year presentation.
The equity method of accounting is used for all entities in which the Company or its subsidiaries have significant influence, but not a controlling interest. The Company evaluates less than majority ownedless-than-majority-owned investments for consolidation pursuant to consolidation and variable interest entity guidance. The Company does not have any less than majority ownedless-than-majority-owned investments requiring consolidation.
58
Use of Estimates. The accounting and financial reporting policies of the Company conform to accounting principles generally accepted in the United States (“U.S. GAAP”). The preparation of financial statements in conformity with U.S. GAAP requires management to make estimates and assumptions that affect the reported amounts of assets and liabilities, the disclosure of contingent assets and liabilities at the date of the financial statements, and the reported amounts of revenues and expenses during the reporting period. Significant items subject to such estimates and assumptions include those related to the recoverability and useful lives of assets, environmental remediation, personal injury claims, litigation provisions and deferred tax assets.income taxes. Changes in facts and circumstances may result in revised estimates. Actualestimates and actual results could differ from those estimates.
Revenue Recognition. The Company recognizes freight revenue based upon the percentage of completion of a commodity movement as a shipment moves from origin to destination, with the related expense recognized as incurred. Other revenues, in general, are recognized when the product is shipped, as services are performed or contractual obligations are fulfilled.
Foreign Exchange Gain (Loss). For financial reporting purposes, KCSM and itsforeign subsidiaries maintain records in U.S. dollars, which is the functional currency. The dollar is the currency that reflects the economic substance of the underlying events and circumstances relevant to the entity. Monetary assets and liabilities denominated in pesos are remeasured into dollars using current exchange rates. The difference between the exchange rate on the date of the transaction and the exchange rate on the settlement date, or balance sheet date if not settled, is included in the income statement as foreign exchange gain or loss. For tax purposes, KCSM and its subsidiaries are required to maintain their books and records in Mexican pesos.
Cash Equivalents. Short-term liquid investments with an initial maturity of three months or less when purchased are classified as cash and cash equivalents.
Accounts Receivable, net. Accounts receivable are net of an allowance for uncollectible accounts as determined by historical experience and adjusted for economic uncertainties or known trends. Accounts are charged to the allowance when a customer enters bankruptcy, when an account has been transferred to a collection agent or submitted for legal action, or when a customer is significantly past due and all available means of collection have been exhausted. At December 31, 20092011 and 2008,2010, the allowance for doubtful accounts was $6.4$4.6 million and $8.7$3.7 million, respectively. Bad debt expense was $1.8$0.9 million and $1.8 million for the yearyears ended December 31, 2009.2011 and 2009, respectively. For the year ended December 31, 2008,2010, accounts receivable allowance recovery was $0.5 million.$1.4 million.
Materials and Supplies. Materials and supplies consisting of diesel fuel, items to be used in the maintenance of rolling stock and items to be used in the maintenance or construction of road property are valued at the lower of average cost or market.cost.
Derivative Instruments. Derivatives are measured at fair value and recorded on the balance sheet as either assets or liabilities. Changes in the fair value of derivatives are recorded either through current earnings or as other comprehensive income, depending on hedge designation. Gains and losses on derivative instruments classified as cash flow hedges are reported in other comprehensive income and are reclassified into earnings in the periods in which earnings are impacted by the variability of the cash flow of the hedged item. The ineffective portion of all hedge transactions is recognized in current period earnings.
60
Restricted Funds. Restricted funds represents cash held by MSLLC which is restricted for use by KCS. These funds are restricted until they are used by MSLLC for capacity additions on the Meridian Speedway.
Property and Equipment (including Concession Assets).KCS capitalizes costs for self-constructed additions and improvements to property including direct labor and material, indirect overhead costs, and interest during long-term construction projects. Direct costs are charged to capital projects based on the work performed and the material used. Indirect overhead costs are allocated to capital projects as a standard percentage, which is evaluated annually, and applied to direct labor and material costs. Asset removal activities are performed in conjunction with replacement activities; therefore, removal costs are estimated based on a standard percentage of direct labor and indirect overhead costs related to capital replacement projects. For purchased assets, all costs necessary to make the asset ready for its intended use are capitalized. Property and equipment is carried at cost and is depreciated on a
59
Properties and equipment are carried at cost and are depreciated primarily on the group method of depreciation, which the Company believes closely approximates a straight line basis over the estimated useful lives measured in years. Costs incurred by the Company to acquire the Concessionconcession rights and related assets, as well as subsequent improvements to the concession assets, are capitalized and amortized using the group method of depreciation over the lesser of the current expected Concession term, including probable renewal, or the estimated useful lives of the assets and rights.
Remaining properties, primarily technology and leasehold improvements, are depreciated using the straight line method over the lesser of estimated useful or lease lives.
KCS follows the group method of depreciation which applies a composite rate to classes of similar assets rather than to individual assets. Composite depreciation rates are based upon the Company’s estimates of the expected average serviceuseful lives of assets as well as expected net salvage value at the end of their useful lives. The estimated average service lives of assets and salvage values are determined throughIn developing these estimates, the Company utilizes periodic depreciation studies.studies performed by an independent engineering firm. Depreciation rate studies are performed at least every three years for equipment and at least every six years for road property (rail, ties, ballast, etc.). The depreciation studies take into account factors such as:
Statistical analysis of historical patterns of use and retirements of each asset class;
Evaluation of any expected changes in current operations and the outlook for the continued use of the assets;
Evaluation of technological advances and changes to maintenance practices; and
Historical and expected salvage to be received upon retirement.
The depreciation studies may also indicate that the recorded amount of accumulated depreciation is deficient or in excess of the amount indicated by the study. Any such deficiency or excess is amortized as a component of depreciation expense over the remaining useful lives of the affected asset class, as determined by the study. The Company also monitors these factors in non-study years to determine if adjustments should be made to depreciation rates.
Also under the group method of depreciation, the cost of railroad property and equipment (net of salvage)salvage or sales proceeds) retired or replaced in the normal course of business is charged to accumulated depreciation with no gain or loss recognized. The cost of the property and equipment retired is based on actual historical costs. Gains or losses on dispositions of land or non-railroadnon-group property and abnormal retirements of railroad property are recognized through income. A retirement of railroad property would be considered abnormal if the cause of the retirement is unusual in nature and its serviceactual life is significantly shorter than what would be expected for that group based on the depreciation studies. An abnormal retirement could cause the Company to reevaluate the estimated useful life of the impacted asset class.
During the year ended December 31, 2011, KCS engaged an independent engineering firm to assist management in performing a depreciation study on KCSM’s road property and equipment. The depreciation impacts of the study results were immaterial to 2011 consolidated financial results.
Effective as of October 1, 2010, the Company changed depreciation rates on certain locomotive and road assets based on reassessment of the adequacy of the accumulated depreciation provisions, asset usage and replacement patterns. The full year net depreciation expense reduction in 2011 resulting from these changes was $4.2 million.
61
Effective as of October 1, 2009, KCSM extended its useful life estimates for its concession assets. At the time the Concession was granted, because there was no previous experience with the Mexican government granting railroad concessions to private companies and due to the lack of experience in working with the Mexican Secretaría de Comunicaciones y Transportes (“Secretary of Communications and Transportation” or “SCT”) and operating under the concession rights, the Company used the shorter of the estimated useful life of the underlying assets or the current Concession term, which ends in 2047, as the useful life estimate for concession assets. As part of the Company’s ongoing assessment of useful lives of property, a determination was made in the fourth quarter of 2009 that it was probable that the Concession would be renewed for an additional 50-year term at the end of the current term and that the capital assets required to operate under the Concession would be depreciated over the shorter of the asset group’s useful life or the current Concession term plus one additional 50-year term. This change in accounting estimate was implemented prospectively effective October 1, 2009, reducing amortization expense in the fourth quarter of 2009 by approximately $2.6 million and $10.4 million for each of the years ended December 31, 2011 and 2010, respectively.
Long-lived assets are reviewed for impairment when events or circumstances indicate that the carrying amount of an asset may not be recoverable. If impairment indicators are present and the estimated future undiscounted cash flows are less than the carrying value of the long-lived assets, the carrying value iswould be reduced to the estimated fair value. Future cash flow estimates for an impairment review would be based on the lowest level of identifiable cash flows, which are the Company’s U.S. and Mexican operations. During the year ended December 31, 2011, management did not identify any indicators of impairment.
60
Fair Value of Financial Instruments. Effective January 1, 2009, KCS adopted the guidance prospectively for non-financial Non-financial assets and liabilities are recognized at fair value on a nonrecurring basis. These assets and liabilities are measured at fair value on an ongoing basis but are subject to fair value only in certain circumstances. Fair value is defined as the exchange price that would be received for an asset or paid to transfer a liability (an exit price) in the principal or most advantageous market for the asset or liability in an orderly transaction between market participants on the measurement date. The Company determines the fair values of its financial instruments based on the fair value hierarchy which requires an entity to maximize the use of observable inputs and minimize the use of unobservable inputs when measuring fair value. The hierarchy is broken down into three levels based upon the observability of inputs. Fair values determined by Level 1 inputs utilize quoted prices (unadjusted) in active markets for identical assets or liabilities that the Company has the ability to access. Level 2 inputs include quoted prices for similar assets and liabilities in active markets, and inputs other than quoted prices that are observable for the asset or liability. Level 3 inputs are unobservable inputs for the asset or liability, and include situations where there is little, if any, market activity for the asset or liability. In certain cases, the inputs used to measure fair value may fall into different levels of the fair value hierarchy. In such cases, the level in the fair value hierarchy within which the fair value measurement in its entirety falls has been determined based on the lowest level input that is significant to the fair value measurement in its entirety. The Company’s assessment of the significance of a particular input to the fair value in its entirety requires judgment and considers factors specific to the asset or liability.
Environmental Liabilities. The Company records liabilities for remediation and restoration costs related to past activities when the Company’s obligation is probable and the costs can be reasonably estimated. Costs of future expenditures for environmental remediation are not discounted to their present value. Recoveries of environmental remediation costs from other parties are recorded as assets when their receipt is deemed probable. Costs of ongoing compliance activities related to current operations are expensed as incurred.
Personal Injury Claims. Personal injury claims in excess of self-insurance levels are insured up to certain coverage amounts, depending on the type of claim and year of occurrence. The Company’s personal injury reserveliability is based on actuarial studies performed on an undiscounted basis.basis by an independent third party actuarial firm and reviewed by management. The reserve
62
liability is based on claims filed and an estimate of claims incurred but not yet reported. While the ultimate amount of claims incurred is dependent on various factors, it is management’s opinion that the recorded liability is a reasonable estimate of aggregate future claims. Adjustments to the liability will beare reflected as operating expenses in the period in which the adjustments are known. Legal fees related to personal injury claims are recorded in operating expense in the period incurred.
Health and Welfare and KCSM Post-Employment Benefits. The Company provides certain medical, life and other post-employment benefits to certain active employees and retirees. The Company uses actuaries to assist management in measuring the benefit obligation and cost based on the current plan provisions, employee demographics, and assumptions about financial and demographic factors affecting the probability, timing and amount of expected future benefit payments. Significant assumptions include the discount rate, rate of increase in compensation levels, and the heathhealth care cost trend rate. Actuarial gains and losses determined at the measurement date (typically December 31) are recognized immediately in the consolidated statementstatements of income.
KCSM Employees’ Statutory Profit Sharing. KCSM Mexican employees are statutorily entitled to receive Participacion a los Trabajadores de las Utilidades (referred to by its Spanish acronym, PTU or Statutory Profit Sharing). This payment is subject to employee statutorybased on an employer’s net profit sharing requirements underbased on accounting principles as prescribed in Mexican law, and calculatesrather than net profit sharing liability as 10% of KCSM net taxable income, adjusted as prescribed by the Mexican income tax law.based on U.S. GAAP. Deferred employees’ statutory profit sharing is
61
accounted for using the liability method in a manner similar to income taxes and included as a component of compensation and benefits within the consolidated statementstatements of income.
Share-Based Compensation. The Company accounts for all share-based compensation in accordance with fair value recognition provisions. Under this method, compensation expense is measured at grant date based on the then fair value of the award and is recognized over the requisite service period in which the award is earned. Forfeitures are estimated at the time of the grant and revised, as necessary, in subsequent periods should actual forfeitures differ from those estimates.
The Company issues treasury stock to settle share-based awards. The Company does not intend to repurchase any shares in 20102012 to provide shares to issue as share-based awards; however, management continuallyfrequently evaluates the appropriateness of the level of shares outstanding.
Income Taxes. Deferred income tax effects of transactions reported in different periods for financial reporting and income tax return purposes are recorded under the liability method of accounting for income taxes. This method gives consideration to the future tax consequences of the deferred income tax items and immediately recognizes changes in income tax laws upon enactment. In addition, the Company has not provided U.S. federal income taxes on the undistributed operating earnings of its foreign investments since the earnings will be investedreinvested indefinitely or the earnings will be remitted in a tax-free transaction.
The Company has recognized a deferred tax asset, net of a valuation allowance, for net operating loss carryovers. The Company projects sufficient future taxable income to realize the deferred tax asset recorded less the valuation allowance. These projections take into consideration assumptions about inflation rates, currency fluctuations, future income and future capital expenditures. If assumptions or actual conditions change, the deferred tax asset, net of the valuation allowance, will be adjusted to properly reflect the expected tax benefit.
New Accounting Pronouncements
In June of 2009,2011, the Financial Accounting Standards Board (the “FASB”) approvedissued new guidance on the “FASB Accounting Standards Codification” (the “FASB ASC”)presentation of comprehensive income, which requires companies to becomereport net income and other comprehensive income in either a single statement or in two consecutive statements. As the single source of authoritative U.S. GAAP (other than guidance issued byimpacts presentation only, there are no changes to the SEC) superseding all then-existing non-SECcomponents that are recognized in net income or other comprehensive income under current accounting and reporting standards. The FASB ASC does not change current U.S. GAAP, but is intended to simplify user access to all authoritative U.S. GAAP through the introduction of a new structure providing all authoritative literature by topic in one place.
guidance. In December of 2009,2011, the FASB issued Accounting Standards Update (“ASU”)No. 2009-17, “Improvementsan amendment to Financial Reportingthis guidance which indefinitely defers the requirement to present reclassification adjustments out of accumulated other comprehensive income by Enterprises Involved with Variable Interest Entities” (“ASU2009-17”).ASU 2009-17 addressescomponent in both the elimination of certain exceptions to consolidating qualifying special-purpose entitiesstatement in which means more entitiesnet income is presented and the statement in which other comprehensive income is presented. The guidance will be subject to consolidation assessments and reassessments. The statement requires ongoing reassessment of whether a company is the primary beneficiary of a variable interest entity (“VIE”) and clarifies characteristics that identify a VIE. In addition, ASU2009-17 requires additional disclosures about a company’s involvement with a VIE and any significant changes in risk exposure due to that involvement. This standard is effective for the Company beginning in the first quarter of 2012 with retrospective application required.
In September 2011, the FASB amended the guidance on January 1, 2010. Thetesting goodwill for impairment. Under this new guidance, companies have the option to first assess qualitative factors to determine if it is more likely than not that goodwill might be
63
impaired and whether it is necessary to perform the two-step quantitative goodwill impairment test required under current accounting standards. This guidance will be effective for the Company expects thatbeginning in the adoptionfirst quarter of this standard will not have an impact on the Company’s results of operations and financial condition.2012.
Note 3. | Earnings Per Share |
Basic earnings per common share is computed by dividing net income available to common stockholders by the weighted average number of common shares outstanding for the period. Nonvested stock awards granted to employees and officers isare included in weighted average shares as it isthey are earned for purposes of computing basic earnings per common share. Diluted earnings per share adjusts basic earnings per common share for the effects of potentially dilutive common shares, if the effect is not anti-dilutive. Potentially dilutive common shares
62
include the dilutive effects of shares issuable upon the conversion of preferred stock to common stock and shares issuable under the Stock Option and Performance Award Plan. During the first quarter of 2011, the Company converted all of the remaining outstanding Cumulative Convertible Perpetual Preferred Stock, Series D, into 6,999,887 shares of common stock.
The following table reconciles the weighted average shares used for the basic earnings per share computation to the shares used for the diluted earnings per share computation(in thousands)millions, except share and per share amounts):
| 2009 | 2008 | 2007 | ||||||||||
| Basic shares | 93,145 | 83,674 | 75,832 | |||||||||
| Additional weighted average shares attributable to: | ||||||||||||
| Convertible preferred stock | — | 13,882 | 20,389 | |||||||||
| Stock options | 502 | 987 | 1,327 | |||||||||
| Nonvested shares | 2 | 59 | 68 | |||||||||
| Diluted shares | 93,649 | 98,602 | 97,616 | |||||||||
| 2011 | 2010 | 2009 | |||||||||
| Net income available to common stockholders for purposes of computing basic earnings per share | $ | 328.7 | $ | 169.2 | $ | 56.1 | |||||
| Effect of dividends on conversion of convertible preferred stock | 1.3 | 10.8 | — | ||||||||
| Net income available to common stockholders for purposes of computing diluted earnings per share | $ | 330.0 | $ | 180.0 | $ | 56.1 | |||||
Weighted-average number of shares outstanding (in thousands): | |||||||||||
| Basic shares | 108,208 | 100,054 | 93,145 | ||||||||
| Additional weighted average shares attributable to: | |||||||||||
| Convertible preferred stock | 1,245 | 7,000 | — | ||||||||
| Stock options and nonvested shares | 377 | 480 | 504 | ||||||||
| Diluted shares | 109,830 | 107,534 | 93,649 | ||||||||
| Basic earnings per share | $ | 3.04 | $ | 1.69 | $ | 0.60 | |||||
| Diluted earnings per share | $ | 3.00 | $ | 1.67 | $ | 0.60 | |||||
Potentially dilutive shares excluded from the calculation(in thousands):
| 2009 | 2008 | 2007 | ||||||||||
| Stock options where the exercise price is greater than the average market price of common shares | 50 | 64 | 39 | |||||||||
| Convertible preferred stock which are anti-dilutive | 7,000 | — | — | |||||||||
| 2011 | 2010 | 2009 | ||||||
| Stock options which effect on diluted earnings per share is anti-dilutive | 96 | 4 | 50 | |||||
| Convertible preferred stock which is anti-dilutive | — | — | 7,000 | |||||
Note 4. Hurricane Alex
Hurricane Alex made landfall on June 30, 2010, causing widespread damage and flooding in central and northeastern Mexico. The following table reconciles net income availablehurricane resulted in extensive damage to common stockholders for purposes of basic earnings per share to net income for purposes of diluted earnings per share(in millions):
| 2009 | 2008 | 2007 | ||||||||||
| Net income available to common stockholders for purposes of computing basic earnings per share | $ | 57.0 | $ | 168.7 | $ | 134.0 | ||||||
| Effect of dividends on conversion of convertible preferred stock | — | 14.9 | 19.6 | |||||||||
| Net income available to common stockholders for purposes of computing diluted earnings per share | $ | 57.0 | $ | 183.6 | $ | 153.6 | ||||||
63
Kansas City Southern
de México, S.A. de C.V.’s track and bridge infrastructures, and also caused multiple track-related incidents and significantly disrupted the Company’s rail service.
de México, S.A. de C.V.’s track and bridge infrastructures, and also caused multiple track-related incidents and significantly disrupted the Company’s rail service.
The Company maintains a comprehensive insurance program intended to cover such events. The property and casualty insurance program covers loss or damage to Company property and third-party property over which the Company has custody and control and covers losses associated with business interruption. This program has combined coverage for both property damage and business interruption and has a self-insured retention amount of $10.0 million for flood related losses. In addition,
64
Kansas City Southern
Notes to Consolidated Financial Statements — Statements-(Continued)
the Company also maintains a general liability insurance program. This program had a self-insured retention of $1.0 million in Mexico at the time of Hurricane Alex.
The Company experienced lost revenues in the third quarter of 2010, as customers were required to use alternate carriers or modes of transportation until rail service was restored. In addition, the Company incurred losses related to property damage and incremental expenses, which were fully offset by a receivable for probable insurance recoveries.
For the years ended December 31, 2011 and 2010, the Company received insurance proceeds of $52.6 million and $10.0 million, respectively.
Note 5. Property and Equipment.Equipment (including Concession Assets)
Property and Equipment. Property and equipment, including concession assets, and related accumulated depreciation and amortization and depreciation rates for each category are summarized below at December 31(in millions)millions, except percentages):
| 2009 | ||||||||||||
| 2009 | 2008 | Depreciation Rate | ||||||||||
| Land | $ | 162.9 | $ | 162.7 | ||||||||
| Concession land rights | 137.6 | 138.0 | 1.0 | % | ||||||||
| Road property | ||||||||||||
| Rail and other track material | 1,320.4 | 1,255.7 | 2.8 | % | ||||||||
| Ties | 1,000.6 | 912.3 | 3.6 | % | ||||||||
| Grading | 729.1 | 698.8 | 0.9 | % | ||||||||
| Bridges and tunnels | 513.2 | 464.1 | 1.4 | % | ||||||||
| Ballast | 434.1 | 364.0 | 3.5 | % | ||||||||
| Other (i) | 675.3 | 609.5 | 3.0 | % | ||||||||
| Road property total | 4,672.7 | 4,304.4 | ||||||||||
| Equipment | ||||||||||||
| Locomotives | 487.8 | 488.4 | 6.9 | % | ||||||||
| Freight cars | 149.5 | 164.2 | 5.2 | % | ||||||||
| Work equipment | 17.3 | 15.9 | 2.1 | % | ||||||||
| Other | 24.7 | 19.7 | 8.8 | % | ||||||||
| Equipment total | 679.3 | 688.2 | ||||||||||
| Technology and other | 125.3 | 115.8 | 11.2 | % | ||||||||
| Construction in progress | 165.6 | 354.3 | ||||||||||
| Total property | 5,943.4 | 5,763.4 | ||||||||||
| Accumulated depreciation and amortization | 1,196.2 | 1,165.0 | ||||||||||
| Net property | $ | 4,747.2 | $ | 4,598.4 | ||||||||
| As of December 31, 2011 | Cost | Accumulated Depreciation | Net Book Value | Depreciation Rates for 2011 | ||||||||||
| Land | $ | 207.4 | $ | — | $ | 207.4 | N/A | |||||||
| Concession land rights | 141.2 | (18.0 | ) | 123.2 | 1.0 | % | ||||||||
| Rail and other track material (a) | 1,431.0 | (317.8 | ) | 1,113.2 | 1.8-2.9% | |||||||||
| Ties (a) | 1,250.6 | (259.0 | ) | 991.6 | 2.0-4.1% | |||||||||
| Grading | 830.5 | (114.7 | ) | 715.8 | 1.0 | % | ||||||||
| Bridges and tunnels | 555.1 | (103.3 | ) | 451.8 | 1.3 | % | ||||||||
| Ballast (a) | 541.1 | (122.8 | ) | 418.3 | 2.7-4.3% | |||||||||
| Other (b) | 717.7 | (206.2 | ) | 511.5 | 2.9 | % | ||||||||
| Total road property | 5,326.0 | (1,123.8 | ) | 4,202.2 | 2.6 | % | ||||||||
| Locomotives | 654.4 | (127.0 | ) | 527.4 | 5.5 | % | ||||||||
| Freight cars | 142.0 | (69.5 | ) | 72.5 | 4.1 | % | ||||||||
| Other equipment | 37.3 | (9.2 | ) | 28.1 | 6.8 | % | ||||||||
| Total equipment | 833.7 | (205.7 | ) | 628.0 | 5.3 | % | ||||||||
| Technology and other | 123.3 | (87.7 | ) | 35.6 | 14.0 | % | ||||||||
| Construction in progress | 153.1 | — | 153.1 | N/A | ||||||||||
| Total property and equipment (including concession assets) | $ | 6,784.7 | $ | (1,435.2 | ) | $ | 5,349.5 | N/A | ||||||
_____________
| (a) | Depreciation rates reflect the range of rates applied based on the density class. |
| (b) | Other |
65
| As of December 31, 2010 | Cost | Accumulated Depreciation | Net Book Value | Depreciation Rates for 2010 | ||||||||||
| Land | $ | 177.0 | $ | — | $ | 177.0 | N/A | |||||||
| Concession land rights | 141.2 | (16.6 | ) | 124.6 | 1.0 | % | ||||||||
| Rail and other track material (a) | 1,308.3 | (287.3 | ) | 1,021.0 | 1.5-4.2% | |||||||||
| Ties (a) | 1,135.5 | (227.4 | ) | 908.1 | 2.0-4.0% | |||||||||
| Grading | 815.2 | (106.1 | ) | 709.1 | 0.9 | % | ||||||||
| Bridges and tunnels | 531.1 | (85.0 | ) | 446.1 | 1.3 | % | ||||||||
| Ballast (a) | 494.1 | (116.6 | ) | 377.5 | 2.5-4.6% | |||||||||
| Other (b) | 650.3 | (196.1 | ) | 454.2 | 2.7 | % | ||||||||
| Total road property | 4,934.5 | (1,018.5 | ) | 3,916.0 | 2.6 | % | ||||||||
| Locomotives | 501.8 | (115.0 | ) | 386.8 | 5.8 | % | ||||||||
| Freight cars | 144.0 | (65.5 | ) | 78.5 | 4.4 | % | ||||||||
| Other equipment | 36.9 | (8.4 | ) | 28.5 | 5.5 | % | ||||||||
| Total equipment | 682.7 | (188.9 | ) | 493.8 | 5.5 | % | ||||||||
| Technology and other | 121.9 | (74.4 | ) | 47.5 | 12.8 | % | ||||||||
| Construction in progress | 143.5 | — | 143.5 | N/A | ||||||||||
Total property and equipment (including concession assets) | $ | 6,200.8 | $ | (1,298.4 | ) | $ | 4,902.4 | N/A | ||||||
_____________
| (a) | Depreciation rates reflect the range of rates applied based on the density class. |
| (b) | Other includes signals, buildings and other road assets. |
Concession assets, net of accumulated amortization of $259.8$347.1 million and $254.3$305.3 million, totaled $1,774.2$1,855.1 million and $1,775.2$1,800.1 million for 2009 at December 31, 2011 and 2008,2010, respectively.
The Company capitalized $2.8$1.0 million, $1.3 million, and $4.4$2.8 million of interest for the years ended December 31, 20092011, 2010, and 2008,2009, respectively.
Depreciation and amortization of property and equipment (including concession assets) totaled $182.5$186.2 million $168.6, $184.9 million and $159.0$181.6 million, for 2009, 2008,2011, 2010, and 2007,2009, respectively.
64
Note 6. Other Balance Sheet Captions |
Other Current Assets. Other current assets included the following items at December 31(in millions):
| 2009 | 2008 | |||||||
| Deferred employees statutory profit sharing asset | $ | 36.8 | $ | 12.2 | ||||
| Prepaid expenses | 16.1 | 14.6 | ||||||
| Refundable taxes | 5.9 | 38.9 | ||||||
| Deposits | 0.3 | 20.6 | ||||||
| Purchase accounting for the fair value of certain contracts | — | 11.3 | ||||||
| Other | 3.9 | 1.2 | ||||||
| Other current assets, net | $ | 63.0 | $ | 98.8 | ||||
| 2011 | 2010 | ||||||
| Refundable taxes | $ | 31.8 | $ | 8.0 | |||
| Prepaid expenses | 25.6 | 21.1 | |||||
| Deferred employees’ statutory profit sharing asset | 11.7 | 36.8 | |||||
| Insurance receivable related to hurricane damage | — | 23.4 | |||||
| Other | 0.4 | 1.9 | |||||
| Other current assets | $ | 69.5 | $ | 91.2 | |||
66
Accounts Payable and Accrued Liabilities. Accounts payable and accrued liabilities included the following items at December 31(in millions):
| 2009 | 2008 | |||||||
| Accounts payable | $ | 169.6 | $ | 255.8 | ||||
| Derailments, personal injury and other claim reserves | 60.6 | 64.1 | ||||||
| Accrued wages and vacation | 39.1 | 42.3 | ||||||
| Interest payable | 23.6 | 25.5 | ||||||
| Rents and leases | 19.3 | 14.2 | ||||||
| Income and other taxes | 8.1 | 23.2 | ||||||
| Other | 22.4 | 30.3 | ||||||
| Accounts payable and accrued liabilities | $ | 342.7 | $ | 455.4 | ||||
| 2011 | 2010 | ||||||
| Accounts payable | $ | 202.6 | $ | 198.3 | |||
| Derailments, personal injury and other claim provisions | 65.2 | 56.0 | |||||
| Accrued wages and vacation | 63.7 | 66.4 | |||||
| Interest payable | 17.5 | 19.5 | |||||
| Rents and leases payable | 14.3 | 17.4 | |||||
| Income and other taxes | 11.4 | 12.2 | |||||
| Other | 26.4 | 33.2 | |||||
| Accounts payable and accrued liabilities | $ | 401.1 | $ | 403.0 | |||
Note 7. Acquisition
On March 3, 2010, the Company acquired an intermodal facility in Mexico. The aggregate purchase price for the intermodal facility was $25.1 million, which was funded with available cash. As a result of the final valuation completed in the second quarter of 2010, the Company recorded goodwill of $2.6 million and identifiable intangible assets of $2.0 million. The acquisition is not material to the Company’s consolidated financial statements.
Note 8. Fair Value Measurements |
The Company’s short-term financial instruments include cash and cash equivalents, accounts receivable, and accounts payable. The carrying value of the short-term financial instruments approximates the fair value due to their short-term nature.
The fair value of the Company’s debt is estimated using quoted market prices when available. When quoted market prices are not available, fair value is estimated based on current market interest rates for debt with similar maturities and credit quality. The fair value of the Company’s debt was $2,031.1$1,741.3 million and $1,911.5$1,739.8 million at December 31, 20092011 and 2008,2010, respectively. The financial statement carrying value was $1,980.0$1,639.1 million and $2,086.1$1,639.7 million at December 31, 20092011 and 2008,2010, respectively.
The Company’s assets and liabilities recorded at fair value have been categorized based upon a fair value hierarchy as described in Note 2 — “Significant Accounting Policies”.
65
| Fair Value Measurements | Net Assets (Liabilities) | |||||||||||
| Level 1 | Level 2 | Level 3 | at Fair Value | |||||||||
2009 | ||||||||||||
| Interest rate contracts | $— | $ | (4.9 | ) | $— | $ | (4.9 | ) | ||||
| Net asset (liabilities), at fair value | $— | $ | (4.9 | ) | $— | $ | (4.9 | ) | ||||
| Fair Value Measurements | Net Assets (Liabilities) | |||||||||||
| Level 1 | Level 2 | Level 3 | at Fair Value | |||||||||
2008 | ||||||||||||
| Investments (i) | $— | $ | — | $12.4 | $ | 12.4 | ||||||
| Interest rate contracts | — | (5.7 | ) | — | (5.7 | ) | ||||||
| Net asset (liabilities), at fair value | $— | $ | (5.7 | ) | $12.4 | $ | 6.7 | |||||
2011. The Company determines the fair values of its derivative financial instrument positions based upon pricing models using inputs observed from actively quoted markets. Pricing models take into consideration the contract terms as well as other inputs, including forward interest rate curves. As prescribed by the guidance, the Company recognizes the fair value
67
| 2009 | 2008 | |||||||
| Balance at beginning of period | $ | 12.4 | $ | 37.8 | ||||
| Total gains/(losses) (realized and unrealized) | 0.8 | (0.8 | ) | |||||
| Purchases, issuances and settlements | (13.2 | ) | (24.6 | ) | ||||
| Transfers in and/or out of level 3 | — | — | ||||||
| Balance at end of period | $ | — | $ | 12.4 | ||||
66
Kansas City Southern
Notes to Consolidated Financial Statements — Statements-(Continued)
Note 9. Long-Term Debt
Long-term debt at December 31(in millions):
| 2009 | 2008 | |||||||
KCS | ||||||||
| Other debt obligations | $ | 0.6 | $ | 0.2 | ||||
KCSR | ||||||||
| Revolving credit facility, variable interest rate, 1.510% at December 31, 2009, due 2011 | 40.0 | 100.0 | ||||||
| Term loans, variable interest rate, 1.959% at December 31, 2009, due 2013 | 310.6 | 313.9 | ||||||
71/2% senior notes, due 2009 | — | 200.0 | ||||||
| 13.0% senior notes, due 2013 | 171.2 | 168.1 | ||||||
| 8.0% senior notes, due 2015 | 275.0 | 275.0 | ||||||
| Capital lease obligations, due serially to 2017 | 11.0 | 12.1 | ||||||
| Other debt obligations | 11.8 | 11.7 | ||||||
Tex-Mex | ||||||||
| RRIF loan, 4.29%, due serially to 2030 | 45.3 | 46.7 | ||||||
KCSM | ||||||||
| Term loan, variable interest rate, due 2012 | — | 30.0 | ||||||
93/8% senior notes, due 2012 | 460.0 | 460.0 | ||||||
75/8% senior notes, due 2013 | 175.0 | 175.0 | ||||||
73/8% senior notes, due 2014 | 165.0 | 165.0 | ||||||
121/2% senior notes, due 2016 | 189.7 | — | ||||||
| 5.737% financing agreement | 65.5 | 70.3 | ||||||
| 6.195% financing agreement | 47.8 | 51.3 | ||||||
| Capital lease obligations, due serially to 2012 | 5.0 | 6.8 | ||||||
| Other debt obligations | 6.5 | — | ||||||
| Total | 1,980.0 | 2,086.1 | ||||||
| Less: Debt due within one year | 68.1 | 637.4 | ||||||
| Long-term debt | $ | 1,911.9 | $ | 1,448.7 | ||||
| 2011 | 2010 | ||||||
| KCSR | |||||||
| Revolving credit facility, variable interest rate, 1.800% at December 31, 2011, due 2016 | $ | 50.0 | $ | — | |||
| Term loan, variable interest rate, 1.795% at December 31, 2011, due 2017 | 296.3 | 307.4 | |||||
| 13.0% senior notes | — | 113.7 | |||||
| 8.0% senior notes, due 2015 | 275.0 | 275.0 | |||||
| Capital lease obligations, due serially to 2017 | 11.7 | 13.4 | |||||
| Other debt obligations | 0.4 | 0.5 | |||||
| Tex-Mex | |||||||
| RRIF loan, 4.29%, due serially to 2030 | 42.5 | 43.9 | |||||
| KCSM | |||||||
| Revolving credit facility, variable interest rate, due 2016 | — | — | |||||
7 5/8% senior notes | — | 32.4 | |||||
7 3/8% senior notes | — | 165.0 | |||||
12 1/2% senior notes, due 2016 | 94.3 | 93.6 | |||||
| 8.0% senior notes, due 2018 | 296.5 | 296.0 | |||||
6 5/8% senior notes, due 2020 | 185.0 | 185.0 | |||||
6 1/8% senior notes, due 2021 | 200.0 | — | |||||
| 5.737% financing agreement, due 2023 | 52.8 | 60.6 | |||||
| 6.195% financing agreement, due 2023 | 40.9 | 44.4 | |||||
| 9.310% loan agreements, due 2020 | 88.1 | — | |||||
| Capital lease obligations, due serially to 2012 | 1.5 | 3.4 | |||||
| Other debt obligations | 3.9 | 5.2 | |||||
| KCS | |||||||
| Other debt obligations | 0.2 | 0.2 | |||||
| Total | 1,639.1 | 1,639.7 | |||||
| Less: Debt due within one year | 36.3 | 18.1 | |||||
| Long-term debt | $ | 1,602.8 | $ | 1,621.6 | |||
KCSR Debt
Revolving Credit Facility and Term Loans. On April 28, 2006, KCS, KCSR and the other subsidiary guarantors named therein entered into an amended and restated credit agreement (the “2006 KCSR Credit Agreement”), in an aggregate amount of $371.1$371.1 million with The Bank of Nova Scotia and other lenders named in the 2006 KCSR Credit Agreement. The 2006 KCSR Credit Agreement initially consisted of a $125.0$125.0 million revolving credit facility with a letter of credit sublimit of $25.0$25.0 million and swing line advances of up to $15.0$15.0 million, and a $246.1$246.1 million term loan facility (the “Term Loan B Facility”). On May 31, 2007, KCSR entered into Amendment No. 1 to the 2006 KCSR Credit Agreement which provided for a new $75.0$75.0 million term loan facility (the “Term Loan C Facility”) under the 2006 KCSR Credit Agreement. TheOn March 16, 2010, KCSR entered into Amendment No. 2 to the 2006 KCSR Credit Agreement which extended the maturity of the revolving credit facility bearsof the 2006 KCSR Credit Agreement from April 28, 2011 to April 28, 2013. In consideration for this change, the Applicable Margin (as defined in Amendment No. 2) in respect of the revolving credit facility and swing line advances was increased. In addition, Amendment No. 2 modified certain covenants of the 2006 KCSR Credit Agreement to permit the
68
incurrence of certain indebtedness and the creation of liens related to such indebtedness, as well as certain prepayments of existing unsecured debt.
On July 12, 2011, KCS together with KCSR and certain subsidiaries named therein as guarantors (the “Subsidiary Guarantors”), entered into an amended and restated credit agreement (the “2011 KCSR Credit Agreement”) with various lenders. The 2011 KCSR Credit Agreement provides KCSR with (i) a five-and-one-half year $300.0 million term loan credit facility (the “Term Loan Facility”) and (ii) a five-year $200.0 million revolving credit facility consisting of a revolving facility up to $200.0 million (the “Revolving Facility”), a letter of credit facility of $25.0 million (the “Letter of Credit Facility”) and a swing line facility of up to $15.0 million (the “Swing Line Facility”). The Letter of Credit Facility and the Swing Line Facility each constitute usage under the Revolving Facility.
The $305.8 million outstanding term loans under the 2006 KCSR Credit Agreement were combined and refinanced with those under the Term Loan Facility and KCSR used available cash to reduce the principal balance of the prior term loans by $5.8 million. Under the 2011 KCSR Credit Agreement, the final maturity of the term loans was extended from April 28, 2013 to January 15, 2017. Commitments under KCSR’s prior revolving credit facility were rolled over into the new Revolving Facility and the maturity was extended from April 28, 2013 to July 15, 2016.
KCSR is required to make quarterly principal payments on the Term Loan Facility commencing December 31, 2011, with any remaining unpaid principal balance due and payable on January 15, 2017. The outstanding principal balance of loans under the Term Loan Facility and the Revolving Facility bear interest at floating rates. At KCSR’s option, the loans bear interest at either LIBOR, or an alternate(i) the greater of (a) The Bank of Nova Scotia’s base rate, (b) the federal funds rate plus 0.50% or (c) one-month London Interbank Offered Rate (“LIBOR”) plus 1.00% (the “Base Rate”) plus a spread basedmargin of 0.25% to 1.50% (depending on the Company’s leverage ratio as defined in the 20062011 KCSR Credit Agreement.Agreement, the “Leverage Ratio”) or (ii) LIBOR plus a margin of 1.25% to 2.50% (depending on the Leverage Ratio). The Term Loan Boutstanding principal balance of loans under the Swing Line Facility bearsbear interest at LIBORthe Base Rate plus 175 basis points ora margin of 0.25% to 1.50% (depending on the alternative base rate plus 75 basis points. Leverage Ratio). As of December 31, 2011, advances under the Revolving Facility totaled $50.0 million.
The Term Loan C Facility bears interest at LIBOR plus
67
obligations under the 2011 KCSR Credit Agreement are secured by a significant portion of the assets of KCS, KCSR and the Subsidiary Guarantors pursuant to an Amended and Restated Security Agreement dated July 12, 2011 (the “Security Agreement”) among KCS, KCSR, each Subsidiary Guarantor and The Bank of Nova Scotia, as administrative agent and collateral agent for the lenders. Under the terms of the Security Agreement, KCS, KCSR and their restricted subsidiaries (as defined in the 2011 KCSR Credit Agreement) agreed to subordinate payment of certain intercompany debt. In addition, KCS and each Subsidiary Guarantor guaranteed repayment of the amounts due under the 2011 KCSR Credit Agreement and the equity interests of KCSR and each Subsidiary Guarantor have been pledged pursuant to the Security Agreement to secure obligations under the 2011 KCSR Credit Agreement.
8.0% Senior Notes. On May 30, 2008, KCSR issued the $275.0 million principal amount of 8.0% senior unsecured notes due June 1, 2015 (the “8.0% Senior Notes,Notes”), which bear interest semiannually at a fixed annual rate of 8.0%. A portion of the proceeds from the issuance of the 8.0% Senior Notes was used to pay $198.7 million ofpurchase the principal amount of the 91/2% senior unsecured notes due October 1, 2008 (the “91/2% Senior Notes and the applicable premium and expenses associated with the redemption and the remaining $1.3 million principal amount upon maturity.Notes”) tendered under an offer to purchase. The remaining proceeds from the issuance were used to reduce borrowings under the KCSR revolving credit facility and for general corporate purposes. The 8.0% Senior Notes are redeemable in whole or in part prior to June 1, 2012 by paying the greater of either 101% of the principal amount or the principal amount plus a “make whole” premium and in whole or in part on and after June 1, 2012, at the following redemption prices (expressed as a percentage of principal amount) plus any accrued and unpaid interest: 2012 —104%, 2013 — 104%, 2013102% and 2014 — 102%, 2014 — 100%. The 8.0% Senior Notes are fully and unconditionally guaranteed by KCS and certain subsidiaries of KCS who guarantee the 2011 KCSR Credit Agreement (the “Note Guarantors”). The 8.0% Senior Notes and the note guarantees rank pari
69
passu in right of payment with KCSR’s, KCS’s, and the Note Guarantors’ existing and future unsecured, unsubordinated obligations. In addition, KCSR may redeem up to 35% of the 8.0% Senior Notes priorinclude certain covenants which are customary for these types of debt instruments issued by borrowers with similar credit ratings, restrict or prohibit certain actions and are similar in nature to June 1,those contained in the 2011 usingKCSR Credit Agreement. Certain of these covenants no longer apply if the proceeds of one or more equity offerings.8.0% Senior Notes are assigned an investment grade rating by both Moody’s Investors Service and Standard & Poor’s.
13.0% Senior Notes. On December 18, 2008, KCSR issued $190.0$190.0 million principal amount of 13.0% senior unsecured notes due December 15, 2013, (the “13.0%“13.0% Senior Notes”) which bearbore interest semiannually at a fixed annual rate of 13.0%. The 13.0% Senior Notes were issued at a discount to par value, resulting in a $22.0$22.0 million discount and a yield to maturity of 16.5%. KCS used the net proceeds from the offering, along with other borrowings, to purchase the KCSR 71/2% senior unsecured notes due June 15, 2009 (the “71/2% Senior Notes”) tendered under an offer to purchase. The 13.0% Senior Notes arewere redeemable at KCSR’s option in whole or in part prior to December 15, 2011 by paying the greater of either 101% of the principal amount or the principal amount plus a “make whole” premium and in whole or in part on and after December 15, 2011, at the following redemption prices (expressed as percentages of principal amount) plus any accrued and unpaid interest: 2011 — 113%, and 2012 — 106.5%. In addition,On June 4, 2010, the Company redeemed $66.5 million principal amount of the 13.0% Senior Notes pursuant to a provision which allowed KCSR mayto redeem up to 35% of the 13.0% Senior Notes at any time prior to December 15, 2010 using at par value plus coupon from the proceeds of oneany sale of capital stock in KCSM or more equity offerings.
68
Tex-Mex Debt
RRIF Loan Agreement. On June 28, 2005, Tex-Mex entered into an agreement with the Federal Railroad Administration (“FRA”) to borrow $50.0$50.0 million to be used for infrastructure improvements in order to accommodate growing freight rail traffic related to the NAFTA corridor. The note bears interest at 4.29% annually and the principal balance amortizes quarterly with a final maturity of July 13, 2030.2030. The loan was made under the Railroad Rehabilitation and Improvement Financing (“RRIF”) Program administered by the FRA. The loan is guaranteed by Mexrail, which has issued a Pledge Agreement in favor of the lender equal to the gross revenues earned by Mexrail on per-car fees on traffic crossing the International Rail Bridge in Laredo, Texas. In addition, the Company has agreed to guarantyguarantee the scheduled principal payment installments due to the FRA from Tex-Mex under the loan agreement on a rolling five-year basis.
KCSM Debt
Revolving Credit FacilityFacility. On August 30, 2010, KCSM entered into a secured credit agreement (the “2010 KCSM Credit Agreement”) with various lenders and Term Loan.other institutions which provided KCSM with a three-year $100.0 million revolving credit facility consisting of (i) a revolving facility in an amount up to $100.0 million (the “2010 Revolving Facility”) and, (ii) a letter of credit and a swing line facility in an amount up to $10.0 million each.
On June 14, 2007,September 30, 2011, KCSM entered into an unsecuredamended and restated credit agreement (the “2007“2011 KCSM Credit Agreement”), in an aggregate amount of up with various financial institutions. The 2011 KCSM Credit Agreement increased the revolving credit facility to $111.0$200.0 million consisting of and extended the maturity to September 30, 2016. The 2011 KCSM Credit Agreement includes (i) a revolving credit facility of up to $81.0$200.0 million (the “2011 KCSM Revolving Facility”), (ii) a letter of credit facility up to $15.0 million (the “KCSM Letter of Credit Facility”), and (iii) a term loanswing line facility up to $15.0 million (the “KCSM Swing Line Facility”). The KCSM Letter of $30.0 million with Bank of America, N.A., BBVA Bancomer, S.A., Institución de Banca Múltiple,Credit Facility and the other lenders namedKCSM Swing Line Facility each constitute usage under the 2011 KCSM Revolving Facility.
Any outstanding principal balance of loans under the 2011 KCSM Revolving Facility bear interest at floating rates. At KCSM’s option, the loans bear interest at either (i) the greater of (a) JPMorgan Chase Bank, N.A.’s prime rate, (b) the federal funds rate plus 0.50% or (c) one-month LIBOR plus 1.00% (the “Base Rate”) plus a margin of 0.25% to 1.50% (depending on KCSM’s leverage ratio), or (ii) one, two, three or six-month LIBOR plus a margin of 1.25% to 2.50% (depending on KCSM’s leverage ratio). The outstanding principal balance of loans under the KCSM Swing Line Facility bear interest at the Base Rate plus a margin of 0.25% to 1.50% (depending on KCSM’s leverage ratio).
70
The 2011 KCSM Credit Agreement is secured by the accounts receivable and certain locomotives of KCSM and certain of its subsidiaries. In addition, KCSM and certain of its subsidiaries agreed to subordinate payment of certain intercompany debt, certain KCSM subsidiaries guaranteed repayment of the amounts due under the 2011 KCSM Credit Agreement (up to the amount permitted by KCSM’s outstanding indentures) and certain equity interests as defined in the 20072011 KCSM Credit Agreement were pledged to secure obligations under the 2011 KCSM Credit Agreement. On March 30, 2009,
The 2011 KCSM usedCredit Agreement contains representations, warranties and covenants typical of such credit agreements, including financial covenants related to a portionleverage ratio and an interest coverage ratio as defined in the 2011 KCSM Credit Agreement. Events of default under the 2011 KCSM Credit Agreement include, but are not limited to, certain payment defaults; breach of any representation or warranty; non-performance of covenants and obligations; default on other indebtedness; certain judgments rendered; restrictions or requirements limiting the availability or the transfer of foreign exchange; a change in control; bankruptcy or insolvency of KCSM and certain subsidiaries and obligors; an impairment of security; the failure of subordination; certain actions by a governmental authority; failure to obtain certain consents; and termination of the net proceeds fromconcession title. The occurrence of an event of default could result in the $200.0acceleration of the repayment of any outstanding principal balance of the 2011 KCSM Revolving Facility.
As of December 31, 2011, KCSM had no outstanding amount under the 2011 KCSM Revolving Facility.
75/8% Senior Notes. On November 21, 2006, KCSM issued $175.0 million 121 principal amount of 75/28% senior unsecured notes due AprilDecember 1, 20162013 (the “12“715/28% Senior Notes”) offering to repay all amounts outstanding under the 2007 KCSM Credit Agreement. Upon repayment of the outstanding amounts, KCSM terminated the 2007 KCSM Credit Agreement.
On January 7,November 2, 2010, pursuant to an offer to purchase, KCSM commenced a cash tender offer and a consent solicitation for a portion of its 9735/8% Senior Notes. On January 22,December 20, 2010, the CompanyKCSM purchased $290.0$142.6 million principal amount of the tendered 9735/8% Senior Notes in accordance with the terms and conditions of the tender offer set forth in the offer to purchase using the proceeds received from the issuance of $300.0$185.0 million of KCSM 8.0% senior unsecured notes due February 1, 2018 (the “KCSM 8.0% Senior Notes”). Additionally on February 1, 2010, KCSM repurchased $6.3 million of the 93/8% Senior Notes. KCSM recorded debt retirement costs of $14.9 million in the first quarter of 2010. The remaining 93/8% Senior Notes mature on May 1, 2012 and are redeemable by KCSM at its option.
73/8% Senior Notes. On May 16, 2007, KCSM issued $165.0 million principal amount of 73/8% senior unsecured notes due June 1, 20132014 (the “753/8% Senior Notes”), which bearbore interest semiannually at a fixed annual rate of 753/8%. The 753/8% Senior Notes arewere redeemable at KCSM’s option, in whole or in
69
On May 6, 2011, — 103.688%, 2012 — 101.844%, 2013 — 100.000%.
121/2% Senior Notes. On March 30, 2009, KCSM issued the$200.0 million principal amount of 121/2% senior unsecured notes due April 1, 2016 (the “121/2% Senior Notes,Notes”), which bear interest semiannually at a fixed annual rate of 121/2%. The 121/2% Senior Notes were issued at a discount to par value, resulting in an $11.0$11.0 million discount and a yield to maturity of 133/4%. KCSM used a portion of the net proceeds from the offering to repay all amounts outstanding under thea credit agreement KCSM entered into on June 14, 2007 (the “2007 KCSM Credit Agreement.Agreement”). The 121/2% Senior Notes are redeemable at KCSM’s option in whole or in part on and after April 1, 2013, at the following redemption prices (expressed as percentages of principal amount) plus any accrued and unpaid interest: 2013 — 106.250%, 2014 — 103.125%, and 2015 — 100.000%. In addition, KCSM may redeem up
71
addition, the notes any time prior to April 1, 2012 from the proceeds of the sale of capital stock in KCSM or KCS and are redeemable, in whole but not in part, at KCSM’s option at their principal amount, plus any accrued and unpaid interest, in the event of certain changes in the Mexican withholding tax rate.
On June 4, 2010, the Company redeemed $70.0 million principal amount of the 121/2% Senior Notes pursuant to a provision which allowed KCSM to redeem up to 35% of the 12 ½% Senior Notes any time prior to April 1, 2012 at par value plus coupon from the proceeds of any sale of capital stock in KCSM or KCS. This followed KCS’s offering of 5.8 million shares of common stock for net proceeds of $214.9 million in May 2010. On November 2, 2010, pursuant to an offer to purchase, KCSM commenced a cash tender offer for its 121/2% Senior Notes and on December 20, 2010, KCSM purchased $31.9 million principal amount of the tendered 121/2% Senior Notes in accordance with the terms and conditions of the tender offer set forth in the offer to purchase using the proceeds received from the issuance of the 65/8% Senior Notes.
KCSM 8.0% Senior Notes. On January 22, 2010, KCSM issued the KCSM$300.0 million principal amount of 8.0% senior unsecured notes due February 1, 2018 (the “KCSM 8.0% Senior Notes due February 1, 2018,Notes”), which bear interest semiannually at a fixed annual rate of 8.0%. The KCSM 8.0% Senior Notes were issued at a discount to par value, resulting in a $4.3$4.3 million discount and a yield to maturity of 81/4%. KCSM used the net proceeds from the issuance of the KCSM 8.0% Senior Notes and available cash on hand to purchase $290.0$290.0 million in principal amount of the 93/8% senior unsecured notes due May 1, 2012 (the “93/8% Senior Notes”) tendered under an offer to purchase and pay all fees and expenses incurred in connection with the KCSM 8.0% Senior Notes offering and the tender offer. The KCSM 8.0% Senior Notes are redeemable at KCSM’s option, in whole or in part, on and after February 1, 2014, at the following redemption prices (expressed as percentages of principal amount) plus any accrued and unpaid interest: 2014 — 104.000%, 2015 — 102.000%, 2016 and thereafter — 100.000%. In addition, KCSM may redeem up to 35% of the KCSM 8.0% Senior Notes any time prior to February 1, 2013 at par value plus coupon from the proceeds of the sale of capital stock in KCSM or KCS and the notes are redeemable, in whole but not in part, at KCSM’s option at their principal amount, plus any accrued and unpaid interest, in the event of certain changes in the Mexican withholding tax rate.
65/8% Senior Notes. On December 20, 2010, KCSM issued the 65/8% Senior Notes due December 15, 2020, which bear interest semiannually at a fixed annual rate of 65/8%. KCSM used the net proceeds from the issuance of the 65/8% Senior Notes and available cash to purchase $142.6 million principal amount of the 75/8% Senior Notes and $31.9 million principal amount of the 121/2% Senior Notes tendered under an offer to purchase and pay all fees and expenses incurred in connection with the KCSM 8.0%65/8% Senior Notes offering and the tender offer.offers. The KCSM 8.0%65/8% Senior Notes are redeemable at KCSM’s option, in whole or in part prior to December 15, 2015, by paying the greater of either 101% of the principal amount or the principal amount plus a “make whole” premium and in whole or in part on andor after February 1, 2014,December 15, 2015, at the following redemption prices (expressed as percentages of principal amount) plus any accrued and unpaid interest: 20142015 — 104.000%103.313%, 20152016 — 102.000%102.208%, 20162017 —101.104%, 2018 and thereafter — 100.000%. In addition, KCSM may redeem up to 35% of the KCSM 8.0%65/8% Senior Notes at a redemption price equal to 106.625% any time prior to February 1,December 15, 2013 at par value plus coupon from the proceeds of the sale of capital stock in KCSM or KCS and the notes are redeemable, in whole but not in part, at KCSM’s option at their principal amount, plus any accrued and unpaid interest, in the event of certain changes in the Mexican withholding tax rate.
61/8% Senior Notes. On May 20, 2011, KCSM issued the 61/8% Senior Notes due June 15, 2021 at par, which bear interest semiannually at a fixed annual rate of 61/8%. KCSM used the proceeds from the issuance of the 61/8% Senior Notes and available cash to purchase and redeem the 75/8% Senior Notes and 73/8% Senior Notes as discussed above, and pay all fees and expenses incurred in connection with the 61/8% Senior Notes offering and the tender offers. The 61/8% Senior Notes are redeemable at KCSM’s option, in whole or in part prior to June 15, 2016, by paying the greater of either 101% of the principal amount or the principal amount plus a “make whole” premium and in whole or in part on or after June 15, 2016, at the following redemption prices (expressed as percentages of principal amount) if redeemed during the 12-month period commencing on June 15 of the following years, plus any accrued and unpaid interest to the date of redemption: 2016 — 103.063%, 2017 — 102.042%, 2018 — 101.021%, 2019 and thereafter — 100.000%. In addition, KCSM may redeem up to 35% of the 61/8% Senior Notes at a redemption price equal to 106.125% any time prior to June 15, 2014 from the proceeds of the sale of KCSM’s capital stock or the capital stock of KCS, and the notes are redeemable, in whole but not in part, at KCSM’s option at their principal amount, plus any accrued and unpaid interest in the event of certain changes in the Mexican withholding tax rate.
72
All of KCSM’s senior notes described above are denominated in dollars, and are unsecured, unsubordinated obligations, rankpari passuin right of payment with KCSM’s existing and future unsecured, unsubordinated obligations, and are senior in right of payment to KCSM’s future subordinated indebtedness. In addition, theKCSM’s senior notes include certain covenants thatwhich are customary for these types of debt instruments issued by borrowers with similar credit ratings, restrict or prohibit certain actions.actions and are similar in nature to those contained in the 2011 KCSM Credit Agreement. Certain of these covenants no longer apply if KCSM’s senior notes are assigned an investment grade rating by both Moody’s Investors Service and Standard & Poor’s Rating Services.
5.737% Financing Agreement. On February 26, 2008, KCSM entered into a financing agreement with Export Development Canada (“EDC”) for an aggregate principal amount of $72.8 million.$72.8 million. KCSM used the proceeds to finance 85%85.0% of the purchase price of forty new SD70ACe locomotives delivered and purchased by KCSM in late 2007 and early 2008. KCSM granted the lenderEDC a security interest in the locomotives to secure the loan. The financing agreement requires KCSM to make thirty equal semi-annual principal payments of approximately $2.4$2.4 million plus interest at an annual rate of 5.737%, with the final payment due and payable on February 28, 2023.2023.
6.195% Financing Agreement. On September 24, 2008, KCSM entered into a financing agreement with DVB Bank AG (“DVB”). KCSM received the loan for an aggregate principal amount under the financing agreement of
70
$52.2 million on September 26, 2008.. KCSM used the proceeds to finance approximately 80% of the purchase price of twenty-nine ES44AC locomotives delivered and purchased by KCSM in June 2008. KCSM granted DVB a security interest in the locomotives to secure the loan. The financing agreement requires KCSM to make sixty equal quarterly principal payments plus interest at an annual rate of 6.195%, with the final payment due and payable on September 29, 2023.2023.
9.310% Loan Agreements. On September 1, 2011, KCSM, as borrower, entered into five Loan Agreements (each a “Loan Agreement”, and collectively, the “Loan Agreements”) with General Electric Capital Corporation, as lender (“GE”), each with a principal amount of approximately $18.2 million. KCSM used the loan proceeds to finance approximately 88% of the purchase price of seventy-five GE AC4400 CW locomotives (the “Locomotives”) purchased by KCSM from GE on September 1, 2011. The Locomotives were previously leased by KCSM from GE pursuant to a Lease Agreement dated April 30, 1998. The Lease Agreement, which had been accounted for as an operating lease, was terminated with the purchase of the Locomotives by KCSM. To secure the loans from GE, KCSM transferred legal ownership of the Locomotives to five irrevocable trusts established by KCSM to which GE is the primary beneficiary and KCSM has a right of reversion upon satisfaction of the obligations of the Loan Agreements.
KCSM’s locomotive financing agreements contain representations, warranties and covenants typical of such equipment loan agreements. Events of default in the financing agreements include, but are not limited to, certain payment defaults, certain bankruptcy and liquidation proceedings and the failure to perform any covenants or agreements contained in the financing agreement.agreements. Any event of default could trigger acceleration of KCSM’s payment obligations under the terms of the financing agreements.
Debt Covenants Compliance
The Company was in compliance with all of its debt covenants as of December 31, 2011.
Other Debt Provisions
Other Agreements, Guarantees, Provisions and Restrictions. The Company hasCompany’s debt agreements contain provisions which are customary for these types of debt instruments and for borrowers with similar credit ratings containingincluding restrictions on subsidiary indebtedness, advances and transfers of assets, and sale and leaseback transactions, as well as requiring compliance with various financial covenants. Because of certain financial covenants contained in the debt agreements, however, maximum utilization of the Company’s available lines of credit may be restricted.
73
Change in Control Provisions. Certain loan agreements and debt instruments entered into or guaranteed by the Company and its subsidiaries provide for default in the event of a specified change in control of the Company or particular subsidiaries of the Company.
Leases and Debt Maturities
The Company leases transportation equipment, as well as office and other operating facilities, under various capital and operating leases. Rental expenses under operating leases were $139.0$120.6 million $137.1, $127.1 million, and $129.4$139.0 million for the years ended December 31, 2009, 2008,2011, 2010, and 2007,2009, respectively. Operating leases that contain scheduled rent adjustments are recognized on a straight-line basis over the term of the lease. Contingent rentals and sublease rentals were not significant. Minimum annual payments and present value thereof under existing capital leases, other debt maturities and minimum annual rental commitments under non-cancelable operating leases follow(in millions):
| Capital Leases | Operating Leases | |||||||||||||||||||||||||||||||
| Long- | Minimum | Net | ||||||||||||||||||||||||||||||
| Term | Lease | Less | Present | Total | Southern | Third | ||||||||||||||||||||||||||
Years | Debt | Payments | Interest | Value | Debt | Capital | Party | Total | ||||||||||||||||||||||||
| 2010 | $ | 65.8 | $ | 3.5 | $ | 1.2 | $ | 2.3 | $ | 68.1 | $ | 20.2 | $ | 126.4 | $ | 146.6 | ||||||||||||||||
| 2011 | 14.2 | 3.8 | 1.0 | 2.8 | 17.0 | 19.8 | 119.9 | 139.7 | ||||||||||||||||||||||||
| 2012 | 474.4 | 3.9 | 0.8 | 3.1 | 477.5 | 14.8 | 98.0 | 112.8 | ||||||||||||||||||||||||
| 2013 | 658.5 | 2.0 | 0.6 | 1.4 | 659.9 | 13.2 | 88.8 | 102.0 | ||||||||||||||||||||||||
| 2014 | 176.3 | 2.1 | 0.5 | 1.6 | 177.9 | 12.5 | 84.8 | 97.3 | ||||||||||||||||||||||||
| Thereafter | 574.8 | 5.3 | 0.5 | 4.8 | 579.6 | 69.7 | 436.1 | 505.8 | ||||||||||||||||||||||||
| Total | $ | 1,964.0 | $ | 20.6 | $ | 4.6 | $ | 16.0 | $ | 1,980.0 | $ | 150.2 | $ | 954.0 | $ | 1,104.2 | ||||||||||||||||
Long- Term Debt | Capital Leases | Total Debt | Operating Leases | ||||||||||||||||||||||||||||
| Years | Minimum Lease Payments | Less Interest | Net Present Value | Southern Capital | Third Party | Total | |||||||||||||||||||||||||
| 2012 | $ | 32.2 | $ | 5.0 | $ | 0.9 | $ | 4.1 | $ | 36.3 | $ | 15.9 | $ | 102.3 | $ | 118.2 | |||||||||||||||
| 2013 | 36.8 | 3.0 | 0.6 | 2.4 | 39.2 | 14.8 | 89.0 | 103.8 | |||||||||||||||||||||||
| 2014 | 48.8 | 2.2 | 0.5 | 1.7 | 50.5 | 14.1 | 81.0 | 95.1 | |||||||||||||||||||||||
| 2015 | 327.2 | 2.3 | 0.3 | 2.0 | 329.2 | 13.8 | 65.4 | 79.2 | |||||||||||||||||||||||
| 2016 | 208.5 | 2.3 | 0.2 | 2.1 | 210.6 | 11.8 | 51.2 | 63.0 | |||||||||||||||||||||||
| Thereafter | 972.4 | 0.9 | — | 0.9 | 973.3 | 48.9 | 272.2 | 321.1 | |||||||||||||||||||||||
| Total | $ | 1,625.9 | $ | 15.7 | $ | 2.5 | $ | 13.2 | $ | 1,639.1 | $ | 119.3 | $ | 661.1 | $ | 780.4 | |||||||||||||||
In the normal course of business, the Company enters into long-term contractual requirements for future goods and services needed for the operations of the business. Such commitments are not in excess of expected requirements and are not reasonably likely to result in performance penalties or payments that would have a material adverse effect on the Company’s liquidity.
| Note 10. Income Taxes |
Current income tax expense represents the amounts expected to be reported on the Company’s income tax returns, and deferred tax expense or benefit represents the change in net deferred tax assets and liabilities. Deferred tax assets and liabilities are determined based on the difference between the financial statement and tax basis of assets and liabilities as measured by the enacted tax rates that will be in effect when these differences reverse. Valuation allowances are recorded as appropriate to reduce deferred tax assets to the amount considered likely to be realized.
74
Tax Expense. Income tax expense (benefit) consists of the following components(in millions):
| 2009 | 2008 | 2007 | ||||||||||
Current: | ||||||||||||
| Federal | $ | (1.1 | ) | $ | 0.9 | $ | — | |||||
| State and local | 1.3 | (0.2 | ) | 0.8 | ||||||||
| Foreign | 3.0 | — | — | |||||||||
| Total current | 3.2 | 0.7 | 0.8 | |||||||||
Deferred: | ||||||||||||
| Federal | 35.4 | 40.8 | 33.2 | |||||||||
| State and local | 2.1 | 7.9 | 2.4 | |||||||||
| Foreign | (6.1 | ) | 15.1 | 30.7 | ||||||||
| Total deferred | 31.4 | 63.8 | 66.3 | |||||||||
| Total income tax expense | $ | 34.6 | $ | 64.5 | $ | 67.1 | ||||||
| 2011 | 2010 | 2009 | |||||||||
| Current: | |||||||||||
| Federal | $ | — | $ | — | $ | (1.1 | ) | ||||
| State and local | 0.7 | 1.0 | 1.3 | ||||||||
| Foreign | 1.7 | 2.0 | 3.0 | ||||||||
| Total current | 2.4 | 3.0 | 3.2 | ||||||||
| Deferred: | |||||||||||
| Federal | 78.0 | 66.4 | 35.2 | ||||||||
| State and local | 4.5 | 6.7 | 2.1 | ||||||||
| Foreign | 38.2 | 33.1 | (6.4 | ) | |||||||
| Total deferred | 120.7 | 106.2 | 30.9 | ||||||||
| Total income tax expense | $ | 123.1 | $ | 109.2 | $ | 34.1 | |||||
Income before income taxes consists of the following (in millions):
| 2011 | 2010 | 2009 | |||||||||
| Income before income taxes: | |||||||||||
| U.S. | $ | 231.0 | $ | 193.2 | $ | 98.4 | |||||
| Foreign | 224.0 | 96.0 | 3.8 | ||||||||
| Total income before income taxes | $ | 455.0 | $ | 289.2 | $ | 102.2 | |||||
The tax effects of temporary differences that give rise to significant portions of the deferred tax assets and deferred tax liabilities follow at December 31(in millions):
| 2009 | 2008 | |||||||
Liabilities: | ||||||||
| Depreciation | $ | 579.7 | $ | 545.6 | ||||
| Investments | 74.0 | 71.0 | ||||||
| Concession rights | 154.6 | 152.5 | ||||||
| Other, net | 16.7 | 8.5 | ||||||
| Gross deferred tax liabilities | 825.0 | 777.6 | ||||||
Assets: | ||||||||
| Loss carryovers | (276.5 | ) | (284.5 | ) | ||||
| Book reserves not currently deductible for tax | (124.6 | ) | (99.3 | ) | ||||
| Vacation accrual | (3.6 | ) | (3.7 | ) | ||||
| Other, net | (28.6 | ) | (19.8 | ) | ||||
| Gross deferred tax assets before valuation allowance | (433.3 | ) | (407.3 | ) | ||||
| Valuation allowance on loss carryovers | 23.7 | 22.9 | ||||||
| Gross deferred tax assets | (409.6 | ) | (384.4 | ) | ||||
| Net deferred tax liability | $ | 415.4 | $ | 393.2 | ||||
| 2011 | 2010 | ||||||
| Liabilities: | |||||||
| Depreciation and amortization | $ | 869.6 | $ | 773.0 | |||
| Investments | 75.3 | 74.1 | |||||
| Other, net | 7.5 | 22.7 | |||||
| Gross deferred tax liabilities | 952.4 | 869.8 | |||||
| Assets: | |||||||
| Loss carryovers | (189.7 | ) | (227.6 | ) | |||
| Book reserves not currently deductible for tax | (91.2 | ) | (113.4 | ) | |||
| Vacation accrual | (3.5 | ) | (3.7 | ) | |||
| Other, net | (47.1 | ) | (27.4 | ) | |||
| Gross deferred tax assets before valuation allowance | (331.5 | ) | (372.1 | ) | |||
| Valuation allowance on loss carryovers | 15.5 | 18.6 | |||||
| Net deferred tax assets | (316.0 | ) | (353.5 | ) | |||
| Net deferred tax liability | $ | 636.4 | $ | 516.3 | |||
75
Kansas City Southern
Notes to Consolidated Financial Statements — Statements-(Continued)
Tax Rates. Differences between the Company’s effective income tax ratesrate and the U.S. federal income tax statutory ratesrate of 35% follow(in millions):
| 2009 | 2008 | 2007 | ||||||||||
| Income tax expense using the statutory rate in effect | $ | 36.3 | $ | 87.0 | $ | 77.5 | ||||||
| Tax effect of: | ||||||||||||
| Permanent items | 2.2 | 3.3 | 2.1 | |||||||||
| State and local income tax provision, net | 1.8 | 2.8 | 2.1 | |||||||||
| Tax credits | (1.9 | ) | (2.5 | ) | (2.9 | ) | ||||||
| Uncertain tax positions | — | (4.3 | ) | — | ||||||||
| Difference between U.S. and foreign tax rate | (5.2 | ) | (8.5 | ) | (9.0 | ) | ||||||
| Foreign exchange and inflation adjustments | 12.2 | (27.4 | ) | (5.6 | ) | |||||||
| Change in valuation allowances | 0.8 | 14.0 | — | |||||||||
| Change in Mexican tax law | (11.1 | ) | — | — | ||||||||
| Other, net | (0.5 | ) | 0.1 | 2.9 | ||||||||
| Income tax expense | $ | 34.6 | $ | 64.5 | $ | 67.1 | ||||||
| 2011 | 2010 | 2009 | |||||||||
| Income tax expense using the statutory rate in effect | $ | 159.3 | $ | 101.2 | $ | 35.8 | |||||
| Tax effect of: | |||||||||||
| Permanent items | 1.2 | 4.0 | 2.2 | ||||||||
| State and local income tax provision, net | 7.0 | 6.6 | 1.8 | ||||||||
| Tax credits | (2.3 | ) | (2.3 | ) | (1.9 | ) | |||||
| Difference between U.S. and foreign tax rate | (14.5 | ) | (8.4 | ) | (5.2 | ) | |||||
| Foreign exchange and inflation adjustments | (23.5 | ) | 22.6 | 12.2 | |||||||
| Change in valuation allowances | (1.6 | ) | (9.9 | ) | 0.8 | ||||||
| Change in Mexican tax law | — | — | (11.1 | ) | |||||||
| Other, net | (2.5 | ) | (4.6 | ) | (0.5 | ) | |||||
| Income tax expense | $ | 123.1 | $ | 109.2 | $ | 34.1 | |||||
| Effective tax rate | 27.1 | % | 37.8 | % | 33.4 | % | |||||
Difference Attributable to Foreign Investments. At December 31, 2009,2011, the Company’s book basis exceeded the tax basis of its foreign investments by $756.4 million.$997.8 million. The Company has not provided a deferred income tax liability for the income taxes, if any, which might become payable on the realization of this basis difference because the Company intends to indefinitely reinvest in foreign investments the operating earnings which gave rise to the basis differential or remit the earnings in tax-free transactions. Moreover, the Company has no other plans to realize this basis differential by a sale of its interests in foreign investments. If the earnings were to be remitted in a taxable transaction, as of December 31, 2009,2011, the Company would incur gross federal income taxes of $264.7$349.2 million which would be partially offset by foreign tax credits.
Changes in Tax Law. On October 1, 2007 the Entrepreneurial Tax of Unique Rate (referred to by its Spanish acronym, IETU or “Flat Tax”) in Mexico was enacted. The Flat Tax law became effective on January 1, 2008 and replaced the Asset Tax law. The Flat Tax applies to a different tax base than the regular income tax and will be paid if the Flat Tax exceeds the ordinary income tax computed under existing law.
On December 28, 2009, the final provisions of Mexico’s 2010 tax reform were enacted. The income tax rate was increased to 30% from 28% for the years 2010 to 2012, 29% for 2013 and then returns to its currentprevious rate of 28% in 2014. The Company’s deferred income tax assets and liabilities werehave been revalued using the rates expected to be in effect when the underlying temporary differences are expected to reverse. This revaluation resulted in an $11.1$11.1 million benefit in the 2009 tax provision. A 1% increase to the value added tax rate was also enacted, however, this increase will not have a materialsignificant impact on the consolidated financial statements because, under Mexican law, value added tax is fully transferred to the final customer.
Tax Carryovers. In prior years, the The Company has generated both U.S. federal and state net operating losses. The losses which are carried forward 20 years for federal tax purposes and from 5 to 20 years for state.state tax purposes. Both the federal and state loss carryovers are analyzed each year to determine the likelihood of realization. The U.S. federal loss carryover at December 31, 2009 is $101.12011 was $168.6 million and if not used, would begin to expire in 2023.2022. The consolidated financial statements do not reflect $73.5 million of federal loss carryovers due to a limitation on recognizing excess tax benefits related to share-based compensation until they can be used to reduce current taxes payable at which point will be recognized as an increase to additional paid-in capital. In addition, the Company has $16.9$26.0 million of tax credits consisting primarily of $15.1$23.8 million of track maintenance credits and $0.5 million of employment credits which, if not used, will begin to expire in 2025,2024, and $1.3$1.5 million of alternative minimum tax credits which do not have an expiration period.expire.
The state loss carryovers arise from both combined and separate tax filings from as early as 1994.1997. The loss carryovers may expire as early as December 31, 20102012 and as late as December 31, 2029.2031. The state loss carryover at December 31, 2011 was $535.3 million. The Company has a deferred tax asset valuation allowance of $12.1 million related to $294.7 million of state loss carryovers.
73
76
Kansas City Southern
Notes to Consolidated Financial Statements — Statements-(Continued)
The Mexico federal loss carryovers at December 31, 2009 are $797.72011 were $457.2 million, of which $110.1$128.2 million will begin to expire in 20162015 and the remaining $687.6$329.0 million will expire in 2046. A deferred tax asset was recorded in prior periods for the expected future tax benefit of these losses which will be carried forward to reduce only ordinary Mexican income tax payable in future years. With the addition of the Flat Tax, the losses are not projected to completely eliminate future tax liabilities. A deferred tax asset is also recorded for an asset tax credit carryover in the amount of $8.1$5.4 million which beganwill begin to expire in 2008 at a rate of 10 percent per year. A2012.
The valuation allowance for deferred tax assets as of $11.9December 31, 2011 was $15.5 million has been recorded, a decrease of $3.1 million as compared to reflect$18.6 million as of December 31, 2010. The decrease reflects a release of valuation allowance related to state net operating loss carryovers and a partial expiration of the reduced expectedasset tax benefit to be derived from these carryovers.
credit carryover.
The Company believes it is more likely than not that the results of future operations will generate sufficient taxable income to realize the deferred tax assets, net of valuation allowances, related to loss carryovers and tax credits.
Uncertain Tax Positions. The accounting guidance for uncertainty in income taxes prescribes a recognition threshold and measurement attribute for the financial statement recognition and measurement of a tax position taken or expected to be taken in a tax return. The guidance requires the Company to recognize in the consolidated financial statements the benefit of a tax position only if the impact is more likely than not of being sustained on audit based on the technical merits of the position. The guidance also provides guidance on derecognition, classification, interest and penalties, accounting in interim periods and disclosure. The provisions were effective for the Company beginning January 1, 2007. A reconciliation of the beginning and ending amount of unrecognized tax benefits is as follows (in millions):
| 2009 | 2008 | |||||||
| Balance at January 1, | $ | 2.1 | $ | 32.6 | ||||
| Additions based on tax positions related to the current year | — | — | ||||||
| Additions for tax positions of prior years | — | 0.9 | ||||||
| Reductions for tax positions of prior years | — | (18.5 | ) | |||||
| Settlements | — | (12.9 | ) | |||||
| Balance at December 31, | $ | 2.1 | $ | 2.1 | ||||
| 2011 | 2010 | ||||||
| Balance at January 1, | $ | 1.7 | $ | 2.1 | |||
| Settlements | — | (0.4 | ) | ||||
| Balance at December 31, | $ | 1.7 | $ | 1.7 | |||
The remaining $2.1$1.7 million of unrecognized tax benefits would affect the effective income tax rate if recognized and is not expected to change in the next twelve months.
Interest and penalties related to uncertain tax positions are included in income before taxes on the income statement. Accrued interest and penalties on unrecognized tax benefits are $0.2 million as of December 31, 2009 and December 31, 2008. For the year ended December 31, 2009, the Company recognized less than $0.1 million in interest and penalty expense. For the years ended December 31, 2008 and 2007, the Company recognized a reduction of interest and penalty expense of $5.5 million and an increase of interest and penalty expense of $2.3 million, respectively.
all periods presented.
Tax returns filed in Mexico through 2002 are closedyears after 2007 remain open to examination by the taxing authorities in Mexico. The 2003 through 2005 MexicoIRS. State income tax returns are currently under examination. The Companygenerally remain open to examination for three to four years following the filing of the return.
During 2010, KCSM received a
74