Our mission is to beincrease shareholder value by being the leader in travel accommodations and welcoming our guests to iconic brands and vacation destinations through our signature “Count On Me!” service. We also have a strong commitment to increasing shareholder value. Our strategies to achieve these objectives are to:
Increase market share by delivering exceptional customer service;
Grow cash flow and operating margins through superior execution in all of our businesses;
Rebalance the Wyndham Worldwide portfolio to emphasize our fee-for-service business models;
Attract, retain and develop human capital across our organization; and
Support and promote Wyndham Green and Wyndham Diversity initiatives.
We strive to provide value-added productsservices and servicesproducts that are intended to both enhance the travel experience of the individual consumer and drive revenues to our business customers. The depth and breadth of our businesses across different segments of the hospitality industry provide us with the opportunity to expand our relationships with our existing individual consumers and business customers in one or more segments of our business by offering them additional or alternative productsservices and servicesproducts from our other segments. Historically, we have pursued what we believe
We expect to generate annual net cash provided by operating activities less capital expenditures, equity investments and development advances in the range of approximately $600 million to $700 million in 2012. This cash flow is expected to be financially-attractive entry pointsutilized for (i) investment in the major global hospitality markets to strengthen our portfolio of productsbusinesses including acquisitions, (ii) share repurchases and services.
Our lodging, vacation exchange and rentals and vacation ownership businesses all have both domestic and international operations. During 2009,2011, we derived 76%71% of our revenues in the United StatesU.S. and 24% internationally.29% internationally (approximately $755 million (18%) in Europe and $460 million (11%) in all other international regions). For a discussion of our segment revenues, profits, assets and geographical operations, see Note 21 to the notes to financial statements ofConsolidated Financial Statements included in this Annual Report. For additional information concerning our business, see Item 2. Properties, of this Annual Report.
History and Development
Wyndham Worldwide’s corporate history can be traced back to the 1990 formation of Hospitality Franchise Systems (which changed its name to HFS Incorporated or HFS). The companyHFS initially began as a hotel franchisor that later expanded its hospitality business and became a major real estate and car rental franchisor. In December 1997, HFS merged with CUC International, Inc., or CUC, to form Cendant Corporation (which changed its name to Avis Budget Group, Inc. in September 2006).
In October 2005, Cendant determined to separate Cendant through spin-offs into four separate companies, including a spin-off of its Hospitality Services businesses to be re-named Wyndham Worldwide Corporation. During July 2006, Cendant transferred to its subsidiary, Wyndham Worldwide Corporation, all of the assets and liabilities of Cendant’s Hospitality Services (including Timeshare Resorts) businesses and on July 31, 2006, Cendant distributed all of the shares of Wyndham Worldwide common stock to the holders of Cendant common stock issued and outstanding on July 21, 2006, the record date for the distribution. The separation was effective on July 31, 2006. On August 1, 2006, we commenced “regular way” trading on the New York Stock Exchange under the symbol “WYN.”
Each of our lodging, vacation exchange and rentals and vacation ownership businesses has a long operating history. Our lodging business began with the Howard Johnson and Ramada brands which opened their first hotels in 1954. RCI, the best known brand in our vacation exchange and rentals business, was established 3638 years ago, and ourwe have acquired and grown some of the world’s most renowned vacation rentals brands with histories starting as early as Hoseasons in 1940, Landal GreenParks in 1954 and Novasol in 1968. Our vacation ownership brands, Wyndham Vacation Resorts and Wyndham Resort Development Corporation, which operates as WorldMark by Wyndham, began vacation ownership operations in 1980 and 1989, respectively.
Our portfolio of well-known family of hospitality brands has beenwas assembled over a period of time.the past twenty years. The following is a timeline of our significant brand acquisitions:
| 1990: | Howard Johnson and Ramada (US) |
| 1993: | Super 8 | |
| 1995: | Knights Inn | |
| 1996: | Travelodge North America | |
| Resort Condominiums International (RCI) | ||
| 2001: | Cuendet | |
| Holiday Cottages Group | ||
| Fairfield Resorts (now Wyndham Vacation Resorts) | ||
| 2002: | Novasol | |
| Trendwest Resorts (now | ||
| 2004: | Ramada International | |
| Landal GreenParks | ||
| 2005: | Wyndham Hotels and Resorts | |
| 2006: | Baymont | |
| 2008: | Microtel Inns & Suites and Hawthorn Suites | |
| 2010: | Hoseasons | |
| Tryp | ||
| ResortQuest | ||
| James Villa Holidays | ||
| 2011: | The Resort Company |
The following is a description of the business of each of our three business units, Wyndham HotelsHotel Group, Wyndham Exchange & Rentals and Resorts
2
Lodging Industry
The global lodging market consists of almost 128,000over 145,000 hotels with combined annual revenues over $300$354 billion, or $2.3$2.4 million per hotel. The market is geographically concentrated with the top 20 countries accounting for 80%over 81% of global rooms.
Companies in the lodging industry operate primarily under one of the following business models:
Franchise — Under the franchise model, a company typically grants the use of a brand name to owners of hotels that the company neither owns nor manages in exchange for royalty fees that are typically equal to a percentage of room sales. Since the royalty fees are a recurring revenue stream and the cost structure is relatively low, the franchise model yields high margins and steady, predictable cash flows. During 2011, approximately 70% of the available hotel rooms in the U.S. were affiliated with a brand compared to only 41% in each of Europe and the Asia Pacific region.
Management — Under the management model, a company provides professional oversight and comprehensive operations support to lodging properties that it owns and/or lodging properties owned by a third party in exchange for management fees, that are typically equal to a percentage of hotel revenue, which may also include incentive fees based on the financial performance of the properties.
Ownership — Under the ownership model, a company owns hotel properties and benefits financially from hotel revenues, earnings and appreciation in the value of the property.
Performance in the lodging industry is measured by the following key metrics:
average daily rate, or ADR;
average occupancy rate, or occupancy;
revenue per available room, or RevPAR, which is calculated by multiplying ADR by the average occupancy rate; and
new room additions.
Demand in the global lodging industry is driven by, among other factors, business and leisure travel, both of which are significantly affected by the health of the economy. In a prosperous economy, demand is typically high, which leads to higher occupancy levels and permits increases in room rates. This cycle continues and ultimately spurs new hotel development. In a poor economy, demand deteriorates, which leads to lower occupancy levels and reduced rates. Demand outside the U.S. is also affected by demographics, airfare, trade and tourism, affluence and the freedom to travel.
The U.S. is the most dominant sector of the global lodging market with over 30% of the global room revenues. The U.S. lodging industry consists of over 52,00050,000 hotels with combined annual revenues of almost $94over $107 billion, or $1.8$2.1 million per hotel. There are approximately 4.8 million guest rooms at these hotels, of which 3.33.4 million rooms are affiliated with a hotel chain. The following table displays trends in the key performance metrics for the U.S. lodging industry over the last six years and for 20102012 (estimate):
| Change in | ||||||||||||||||
| Year | Occupancy | ADR | RevPAR | Occupancy | ADR | RevPAR | ||||||||||
| 2004 | 61.4% | $86.29 | $52.95 | 3.6 % | 4.2 % | 7.9 % | ||||||||||
| 2005 | 63.1% | 91.08 | 57.51 | 2.9 % | 5.6 % | 8.6 % | ||||||||||
| 2006 | 63.3% | 97.99 | 62.03 | 0.2 % | 7.6 % | 7.9 % | ||||||||||
| 2007 | 63.1% | 104.15 | 65.67 | (0.4)% | 6.3 % | 5.9 % | ||||||||||
| 2008 | 60.3% | 106.92 | 64.47 | (4.4)% | 2.7 % | (1.8)% | ||||||||||
| 2009 | 55.1% | 97.51 | 53.71 | (8.7)% | (8.8)% | (16.7)% | ||||||||||
| 2010E | 55.4% | 95.43 | 52.90 | 0.6 % | (2.1)% | (1.5)% | ||||||||||
| Change in | ||||||||||||||||||||||||
Year | Occupancy | ADR | RevPAR* | Occupancy | ADR | RevPAR* | ||||||||||||||||||
2006 | 63.1 | % | $ | 97.81 | $ | 61.75 | 0.2 | % | 7.4 | % | 7.7 | % | ||||||||||||
2007 | 62.8 | % | 104.31 | 65.52 | (0.5 | )% | 6.6 | % | 6.1 | % | ||||||||||||||
2008 | 59.8 | % | 107.38 | 64.22 | (4.8 | )% | 3.0 | % | (2.0 | )% | ||||||||||||||
2009 | 54.6 | % | 98.06 | 53.50 | (8.8 | )% | (8.7 | )% | (16.7 | )% | ||||||||||||||
2010 | 57.5 | % | 98.06 | 56.43 | 5.5 | % | 0.0 | % | 5.5 | % | ||||||||||||||
2011 | 60.1 | % | 101.64 | 61.06 | 4.4 | % | 3.7 | % | 8.2 | % | ||||||||||||||
2012 Estimate | 60.9 | % | 106.86 | 65.05 | 1.3 | % | 5.1 | % | 6.5 | % | ||||||||||||||
| *: | RevPAR may not recalculate by multiplying occupancy by ADR due to rounding |
Sources:Sources: Smith Travel Research Global (“STR”) (2004(2006 to 2009)2011); PricewaterhouseCoopers (2010)(“PWC”) (2012). 20102012 estimated data is as of January 25, 2010.2012.
3
| Revenues | New Rooms | Changes in | ||||||||||
| Year | ($bn) | (000s) | Revenues | New Rooms | ||||||||
| 2004 | $ | 113.6 | 81.3 | 8.0 % | 6.0 % | |||||||
| 2005 | 122.6 | 83.4 | 7.9 % | 2.6 % | ||||||||
| 2006 | 133.4 | 138.9 | 8.8 % | 66.5 % | ||||||||
| 2007 | 139.4 | 146.1 | 4.5 % | 5.2 % | ||||||||
| 2008 | 142.8 | 134.9 | 2.4 % | (7.7)% | ||||||||
| 2009 | 122.9 | 49.6 | (13.9)% | (63.2)% | ||||||||
| 2010E | 123.1 | 32.3 | 0.1% | (34.9)% | ||||||||
| Revenues ($bn) | New Rooms (000s) | Changes in | ||||||||||||||
Year | Revenues | New Rooms | ||||||||||||||
2006 | $ | 133.3 | 138.9 | 8.8 | % | 66.5 | % | |||||||||
2007 | 139.4 | 145.9 | 4.5 | % | 5.0 | % | ||||||||||
2008 | 140.3 | 132.5 | 0.7 | % | (9.4 | )% | ||||||||||
2009 | 127.2 | 47.6 | (9.4 | )% | (64.0 | )% | ||||||||||
2010 | 136.9 | 30.2 | 7.7 | % | (36.6 | )% | ||||||||||
2011 | n/a | 44.0 | n/a | 45.6 | % | |||||||||||
2012 Estimate | n/a | 55.5 | n/a | 26.1 | % | |||||||||||
Sources: *: STR (2004(2006 to 2009)2011); PricewaterhouseCoopers (2010)PWC (2012). 20102012 estimated data is as of January 25, 2010.2012.
The U.S. lodging industry experienced negativepositive RevPAR performance over the last two years, reflecting challenging economic conditions. The reductionyear primarily resulting from the ongoing recovery of demand. As the overall health of the economy improved during late 2010 and all of 2011, the lodging industry benefited from the return of corporate spending on business travel as well as increased leisure travel. Demand, as measured by room night consumption, increased 4.4% driven by a normalization of travel patterns experienced throughout 2011. ADR has continued to stabilize since rebounding in the second quarter of 2010 and, as is typical for the lodging industry, the increase in demand combined withduring 2011 stimulated ADR increases throughout the year. During 2011, ADR grew 3.7%. As a riseresult of the occupancy and ADR gains, the U.S. Lodging industry experienced RevPAR growth of 8.2% in supply have caused ADR declines during 2009.2011. According to certain industry experts,PwC’s most recent outlook on the steepest declinesHospitality and Leisure Industry, it is expected that U.S hotel demand will increase approximately 2.0% in 2012, ADR appear to have already occurred; however, expectations arewill grow over 5%, a level that ADR comparisons will remain negative in 2010 as supply growth is still expected to outpace demand. Until demandhasn’t been achieved since 2007, and occupancy rates show sustained positive growth in major markets,and ADR is unlikely to improve. Nonetheless, certain industry experts expect the beginning of a recovery in travel to result in a 2.4% increase in U.S. hotel demand in 2010, which we believegains will be predominately experienced in the luxury and upscaleacross all segments. Beyond 2010,2012, certain industry experts project RevPAR in the U.S. to grow at an 8.0%a 5.9% compounded annual growth rate (“CAGR”) over the next three years(2011-2013) (2013 – 2015).
According to PwC, supply growth still remains at low levels although new construction activity appears to be increasing over the unusually low levels of 2010.
Performance in the U.S. lodging industry is evaluated based upon chain scale segments, which are generally defined as follows:
Luxury — typically offers first class appointments and an extensive range of on-property amenities and services, including restaurants, spas, recreational facilities, business centers, concierges, room service and local transportation (shuttle service to airport and/or local attractions). ADR is normally greater than $180 for hotels in this category.
Upper Upscale — typically offers well-appointed properties that offer a full range of on-property amenities and services, including restaurants, spas, recreational facilities, business centers, concierges, room service and local transportation (shuttle service to airport and/or local attractions). ADR normally falls in the range of $120 and $180 for hotels in this category.
Upscale — typically offers a full range of on-property amenities and services, including restaurants, spas, recreational facilities, business centers, concierges, room service and local transportation (shuttle service to airport and/or local attractions). ADR normally falls in the range of $100 and $120 for hotels in this category.
Upper Midscale — typically offers restaurants, vending, selected business services, partial recreational facilities (either a pool or fitness equipment) and limited transportation (airport shuttle). ADR normally falls in the range of $85 and $100.
Midscale — typically offers restaurants (“midscale with food and beverage”) or limited breakfast service (“midscale without food and beverage”), vending, selected business services, limited recreational facilities (either a pool or fitness equipment) and limited transportation (airport shuttle). ADR normally falls in the range of $60 and $85.
Economy — typically offers basic amenities and a limited breakfast. ADR is normally less than $60.
The following table sets forth the estimated key metrics for each chain scale segment and associated subsegmentssub-segments within the U.S. for 20092011 compared to 2010 as currently defined by STR:
| Change in | |||||||||||||||||
| Room | |||||||||||||||||
| Segment | ADR | Demand | Supply | Occupancy | ADR | RevPAR | |||||||||||
| Luxury | Greater than $210 | (0.6)% | 8.9 % | (8.7)% | (16.3)% | (23.6)% | |||||||||||
| Upper upscale | $125 to $210 | (2.6)% | 4.8 % | (7.0)% | (11.5)% | (17.7)% | |||||||||||
| Upscale | $95 to $125 | 0.5 % | 9.6 % | (8.4)% | (10.3)% | (17.8)% | |||||||||||
Midscale withfood-and-beverage | $65 to $95 | (11.6)% | (1.2)% | (10.5)% | (6.1)% | (16.0)% | |||||||||||
Midscale withoutfood-and-beverage | $65 to $95 | (3.5)% | 7.0 % | (9.8)% | (5.5)% | (14.8)% | |||||||||||
| Economy | Less than $65 | (7.7)% | 1.2 % | (8.8)% | (6.8)% | (15.0)% | |||||||||||
| Total | (5.8)% | 3.2 % | (8.7)% | (8.8)% | (16.7)% | ||||||||||||
| Change in | ||||||||||||||||||||||
Segment | ADR | Demand | Room Supply | Occupancy | ADR | RevPAR | ||||||||||||||||
Luxury | Greater than $180 | 6.0 | % | 0.8 | % | 5.2 | % | 5.7 | % | 11.2 | % | |||||||||||
Upper upscale | $120 to $180 | 4.6 | % | 1.8 | % | 2.8 | % | 3.6 | % | 6.6 | % | |||||||||||
Upscale | $100 to $120 | 6.0 | % | 1.8 | % | 4.1 | % | 3.8 | % | 8.0 | % | |||||||||||
Upper Midscale | $85 to $100 | 11.0 | % | 5.5 | % | 5.2 | % | 3.3 | % | 8.6 | % | |||||||||||
Midscale | $60 to $85 | (5.5 | )% | (8.7 | )% | 3.5 | % | (0.5 | )% | 3.0 | % | |||||||||||
Economy | Less than $60 | 4.0 | % | 0.3 | % | 3.7 | % | 2.2 | % | 6.0 | % | |||||||||||
Total | 5.0 | % | 0.6 | % | 4.4 | % | 3.7 | % | 8.2 | % | ||||||||||||
Source: STR
The European lodging industry consists of almost 43,000over 52,000 hotels with combined annual revenues over $101$135 billion, or $2.4$2.6 million per hotel. There are approximately 3.34.0 million guest rooms at these hotels, of which, 1.51.6 million rooms are affiliated with a hotel chain. The Asia Pacific lodging industry consists of almost 15,000over 20,000 hotels with combined annual revenues over $54of approximately $96 billion, or $3.7$4.6 million per hotel. There are approximately 2.12.8 million guest rooms at these hotels, of which over 830 thousand1.2 million are affiliated with a hotel chain. The following table
4
| Change in | |||||||||||||||
| Room | |||||||||||||||
| Region | Demand | Supply | Occupancy | ADR | RevPAR | ||||||||||
| Europe | (6.2)% | 1.2% | (7.2)% | (15.5)% | (21.7)% | ||||||||||
| Asia Pacific | (3.5)% | 3.0% | (6.3)% | (12.6)% | (18.1)% | ||||||||||
| Change in | ||||||||||||||||||||
Region | Demand | Room Supply | Occupancy | ADR | RevPAR | |||||||||||||||
Europe | 4.2 | % | 1.0 | % | 3.1 | % | 9.4 | % | 12.7 | % | ||||||||||
Asia Pacific | 3.0 | % | 2.8 | % | 0.2 | % | 9.5 | % | 9.8 | % | ||||||||||
Source: STR
Wyndham Hotel Group Overview
Our lodging business, Wyndham Hotel Group, is the world’s largest hotel company (based on number of properties) with the industry’s largest loyalty program, Wyndham Rewards (based on number of participating hotels). Over 86%88% of itsWyndham Hotel Group’s revenues are derived from franchising activities. Wyndham Hotel Group generally does not own any hotels.hotels with the exception of its flagship resort, the Wyndham Grand Orlando Resort Bonnet Creek. Therefore, theits business model is easily adaptable to changing economic environments due to low operating cost structures, which in combination with recurring fee streams, yield high margins and predictable cash flows. Capital requirements are relatively low and mostly limited to technology expenditures to support core capabilities, and any incentives we may employ to generate new business, such as key money, and development advance notes and mezzanine or other forms of subordinated financing to assist franchisees and hotel owners in converting to one of our brands or building a new hotel branded under a Wyndham Hotel Group brand.
Wyndham Hotel Group comprises 11 widely-knownthe following 15 brands, over 7,100with 7,205 hotels representing almost 597,700over 613,000 rooms on six continents and another 950nearly 850 hotels representing 108,100approximately 111,900 rooms in the development pipeline as of December 31, 2009.2011. Wyndham Hotel Group franchises in allmost segments of the industry with the highest concentration in the economy segment, and provides management services globally for full-service hotels globally.hotels. The following describes ourthese 15 widely-known lodging brands:
Days Innis a leading global brand in the economy segment with more guest rooms than any other economy brand in the world with approximately 1,865 properties worldwide. Under its ‘A Promise As Sure As the Sun’ service culture, Days Inn hotels offer value-conscious consumers free high-speed internet, upgraded bath amenities and the Wyndham Rewards loyalty program. Most hotels also offer free Daybreak breakfast, restaurants and meeting rooms.
Super 8 Worldwideis a leading global brand in the economy segment with approximately 2,250 properties in the U.S., Canada and China, making Super 8 the largest chain of economy hotels in the world. Under its “8 point promise” service culture, Super 8 hotels offer complimentary SuperStart breakfast, free high speed internet access, upgraded bath amenities, free in-room coffee, kids under 17 stay free and free premium cable or satellite TV as well as the Wyndham Rewards loyalty program.
Microtel Inns & Suites is an award winning economy chain of 315 properties predominantly located throughout North America. Microtel is also the only prototypical, all new-construction brand in the economy segment. For guests, this means a consistent experience featuring award-winning contemporary guest rooms and public area designs. For developers, Microtel provides hotel operators low cost of construction combined with support and guidance from ground break to grand opening as well as low cost of ongoing operations. Positioned in the upper-end of the economy segment, all properties offer complimentary continental breakfast, free wired and wireless internet access, free local and long distance calls and the Wyndham Rewards loyalty program.
Howard Johnson is an iconic American hotel brand having pioneered hotel franchising in 1954. Today, Howard Johnson has over 450 hotels in North America, Latin America, Asia and other international markets. In North America, the brand operates in the midscale and economy segments while internationally the brand includes midscale and upscale hotels. The Howard Johnson brand targets families and leisure travelers, providing complimentary continental “Rise and Dine” breakfast and high-speed internet access as well as the Wyndham Rewards loyalty program.
Travelodgeis a hotel chain with 440 properties located across North America. The brand operates primarily in the economy segment in the U.S. and in the midscale segment in Canada. Using its “Sleepy Bear” brand ambassador, Travelodge targets leisure travelers with a focus on those who prefer an active lifestyle of outdoor activity and offers guests complimentary Bear Bites continental breakfast and free high-speed internet access as well as the Wyndham Rewards loyalty program.
Knights Inn is a budget economy hotel chain with approximately 350 locations across North America. Knights Inn hotels provide basic overnight accommodations and complimentary breakfast for an
5
Ramada Worldwideis a global midscale hotel chain with 845 properties located in 53 countries worldwide. Under its “You Do Your Thing, Leave the Rest to Us,” marketing foundation and supported by the “i am” service culture, most Ramada hotels feature free wireless high-speed internet access, meeting rooms, business services, fitness facilities, upgraded bath amenities and the Wyndham Rewards loyalty program. Most properties have an on-site restaurant/lounge, while other sites offer a complimentary continental breakfast with food available in the Ramada Mart.
Baymont Inn & Suitesis a midscale hotel chain with approximately 260 properties located across North America. The brand’s commitment to providing ‘hometown hospitality’ means guests are offered fresh baked cookies, complimentary breakfast and high-speed internet access as well as the Wyndham Rewards loyalty program. Most hotels also offer swimming pools and fitness centers.
Wyndham Hotels and Resortsis an upscale, full service brand of 100 properties located in key business and vacation destinations around the world. Business locations feature meeting space flexible for large and small meetings, as well as business centers and fitness centers. The brand is tiered as follows: Wyndham Grand Collection, comprised primarily of 4+Diamond hotels in resort or urban destinations, offer a unique guest experience, sophisticated design and distinct dining options; Wyndham Hotels and Resorts offers customers amenities such as golf, tennis, beautiful beaches and/or spas; and Wyndham Garden Hotels, generally located in corporate or suburban areas, provide flexible space for small to midsize meetings and relaxed dining options. Each tier offers the Wyndham Rewards loyalty program.
Wingate by Wyndham is a prototypical design hotel chain in the upper end of the midscale segment with over 160 properties in North America. Each hotel offers amenities and services that make life on the road more productive, all at a single rate. Guests enjoy oversized rooms appointed with all the comforts and conveniences of home and office. Each room is equipped with a flat screen TV, high-speed internet access, in-room microwave and refrigerator. The brand also offers complimentary hot breakfast, a 24-hour business center with free printing, copying and faxing and free access to a gym facility and the Wyndham Rewards loyalty program.
Tryp by Wyndhamis a select-service, mid-priced hotel brand comprised of over 90 hotels located predominantly throughout Europe and South America in key center city, airport and business center markets. This brand caters to both business and leisure travelers with varying accommodations suited for different travel needs and preferences. Guests enjoy free Internet in all rooms, free breakfast buffet with a special emphasis on healthy, fresh ingredients and the Wyndham Rewards loyalty program.
Hawthorn Suites by Wyndham is an extended stay brand that provides an ideal atmosphere for multi-night visits at approximately 75 properties predominantly in the U.S. We believe this brand provides a solution for longer-term travelers who typically seek accommodations at our Wyndham Hotels and Resorts or Wingate by Wyndham properties. Each hotel offers an inviting and practical environment for travelers with well appointed, spacious one and two-bedroom suites and fully-equipped kitchens. Guests enjoy free Internet in all rooms and common areas, complimentary hot breakfast buffets and evening social hours, as well as the Wyndham Rewards loyalty program.
Planet Hollywoodis a 4+Diamond, full-service, entertainment-based hotel brand that will be located in key destination cities globally. We have a 20 year affiliation relationship with Planet Hollywood Resorts International, LLC to franchise this brand and provide management services globally for branded hotels. All hotels will offer multiple food and beverage outlets, flexible meeting space, entertainment-based theming and the Wyndham Rewards loyalty program. As of December 31, 2011, we had no properties franchised or managed by us under this affiliation arrangement.
Dreamis a full-service, light-hearted brand with trend-setting design for gateway cities and resort destinations. This brand was added to our portfolio of offerings in January 2011 when we entered into a
30 year affiliation relationship with Chatwal Hotels & Resorts, LLC to franchise this brand and provide management services globally for branded hotels. The progressive service offerings emulate those of luxury hotels, but with a more relaxed point of view. All hotels also offer guests the Wyndham Rewards loyalty program. | |
6
Nightis an ‘affordably chic’ brand featuring innovative designs. This brand was added to our portfolio of offerings in January 2011 when we entered into a 30 year affiliation relationship with Chatwal Hotels & Resorts, LLC to franchise this brand and provide management services globally for branded hotels. These hotels offer unique services such as guest deejays in lounges, discounts for green motorists with hybrid and electric cars, gourmet quick-serve food and beverage options and the Wyndham Rewards loyalty program. As of December 31, 2011, we had 1 property franchised by us under this affiliation arrangement.
| Average | Average | |||||||||||||||||||||||||
| Global | Rooms | # of | # of | Occupancy | ||||||||||||||||||||||
| Brand | Segments Served (1) | Per Property | Properties | Rooms | Rate | ADR | RevPAR | |||||||||||||||||||
| Days Inn | Economy | 81 | 1,858 | 149,633 | 44.9 | % | $ | 62.24 | $ | 27.95 | ||||||||||||||||
| Super 8 | Economy | 62 | 2,137 | 132,876 | 48.5 | % | $ | 56.67 | $ | 27.48 | ||||||||||||||||
| Microtel | Economy | 71 | 314 | 22,376 | 49.0 | % | $ | 56.72 | $ | 27.79 | ||||||||||||||||
| Howard Johnson | Economy, Midscale & Upscale | 95 | 492 | 46,748 | 42.2 | % | $ | 61.22 | $ | 25.86 | ||||||||||||||||
| Travelodge | Economy & Midscale | 74 | 460 | 34,098 | 43.4 | % | $ | 61.87 | $ | 26.85 | ||||||||||||||||
| Knights Inn | Economy | 61 | 343 | 21,061 | 37.2 | % | $ | 42.46 | $ | 15.79 | ||||||||||||||||
| Ramada | Midscale | 131 | 910 | 118,880 | 47.0 | % | $ | 74.55 | $ | 35.04 | ||||||||||||||||
| Baymont | Midscale | 85 | 240 | 20,459 | 45.2 | % | $ | 62.46 | $ | 28.25 | ||||||||||||||||
| Wyndham Hotels and Resorts | Upscale | 261 | 94 | 24,517 | 52.6 | % | $ | 114.56 | $ | 60.21 | ||||||||||||||||
| Wingate by Wyndham | Midscale | 92 | 166 | 15,239 | 53.6 | % | $ | 83.16 | $ | 44.54 | ||||||||||||||||
| Hawthorne Suites by Wyndham | Midscale | 93 | 89 | 8,238 | 51.6 | % | $ | 83.55 | $ | 43.10 | ||||||||||||||||
Unmanaged, Affiliated and Managed, Non- Proprietary Hotels (2) | Luxury & Upper Upscale | 323 | 11 | 3,549 | N/A | N/A | N/A | |||||||||||||||||||
| Total | 84 | 7,114 | 597,674 | 46.3 | % | $ | 65.52 | $ | 30.34 | |||||||||||||||||
Brand | Global Segment Served(1) | Average Rooms Per Property | # of Properties | # of Rooms | Average Occupancy Rate | ADR | RevPAR * | |||||||||||||||||||
Days Inn | Economy | 81 | 1,864 | 150,436 | 47.0 | % | $ | 61.42 | $ | 28.88 | ||||||||||||||||
Super 8 | Economy | 63 | 2,249 | 142,254 | 52.1 | % | $ | 54.32 | $ | 28.29 | ||||||||||||||||
Microtel Inns and Suites | Economy | 71 | 315 | 22,441 | 52.7 | % | $ | 59.07 | $ | 31.11 | ||||||||||||||||
Howard Johnson | Economy | 100 | 451 | 45,115 | 46.7 | % | $ | 60.72 | $ | 28.33 | ||||||||||||||||
Travelodge | Economy | 75 | 440 | 33,081 | 46.7 | % | $ | 65.12 | $ | 30.41 | ||||||||||||||||
Knights Inn | Economy | 62 | 349 | 21,698 | 38.7 | % | $ | 42.32 | $ | 16.39 | ||||||||||||||||
Ramada | Midscale | 135 | 845 | 114,306 | 51.4 | % | $ | 76.40 | $ | 39.29 | ||||||||||||||||
Baymont | Midscale | 83 | 259 | 21,605 | 47.5 | % | $ | 62.00 | $ | 29.43 | ||||||||||||||||
Wyndham Hotels and Resorts | Upscale | 262 | 100 | 26,180 | 58.4 | % | $ | 108.27 | $ | 63.22 | ||||||||||||||||
Wingate by Wyndham | Midscale | 92 | 162 | 14,836 | 59.7 | % | $ | 80.61 | $ | 48.11 | ||||||||||||||||
Tryp by Wyndham | Upper Midscale | 144 | 91 | 13,076 | 60.5 | % | $ | 103.27 | $ | 62.48 | ||||||||||||||||
Hawthorn Suites by Wyndham | Midscale | 95 | 74 | 7,036 | 61.1 | % | $ | 74.76 | $ | 45.69 | ||||||||||||||||
Night | Upper Upscale | 72 | 1 | 72 | 94.0 | % | $ | 241.42 | $ | 227.05 | ||||||||||||||||
Dream | Upper Upscale | 198 | 5 | 990 | 75.6 | % | $ | 198.31 | $ | 149.88 | ||||||||||||||||
|
|
|
| |||||||||||||||||||||||
Total | 7,205 | 613,126 | 50.2 | % | $ | 66.46 | $ | 33.34 | ||||||||||||||||||
|
|
|
| |||||||||||||||||||||||
| * | RevPAR may not recalculate by multiplying average occupancy rate by ADR due to rounding. |
| (1) | The global segments served column reflects the primary chain scale segments served using the STR Global definition and | |
The following table depicts our geographic distribution and key operating metrics by region:
| # of | # of | |||||||||||||||||||
| Region | Properties | Rooms (1) | Occupancy | ADR | RevPAR | |||||||||||||||
| United States | 6,006 | 465,293 | 45.1 | % | $ | 62.31 | $ | 28.11 | ||||||||||||
| Canada | 465 | 38,174 | 51.9 | % | $ | 84.13 | $ | 43.69 | ||||||||||||
Europe/Middle East/Africa (2) | 273 | 37,000 | 52.8 | % | $ | 99.52 | $ | 52.52 | ||||||||||||
| Asia/Pacific | 264 | 42,219 | 49.0 | % | $ | 51.08 | $ | 25.01 | ||||||||||||
| Latin/South America | 106 | 14,988 | 46.8 | % | $ | 81.23 | $ | 38.05 | ||||||||||||
| Total | 7,114 | 597,674 | 46.3 | % | $ | 65.52 | $ | 30.34 | ||||||||||||
Region | # of Properties | # of Rooms(1) | Occupancy | ADR | RevPAR * | |||||||||||||||
United States | 5,821 | 450,788 | 48.4 | % | $ | 63.12 | $ | 30.57 | ||||||||||||
Canada | 476 | 38,473 | 52.5 | % | 95.99 | 50.43 | ||||||||||||||
Europe/Middle East/Africa | 322 | 42,875 | 58.5 | % | 86.29 | 50.49 | ||||||||||||||
Asia/Pacific | 490 | 68,602 | 55.2 | % | 50.91 | 28.08 | ||||||||||||||
Latin/South America | 96 | 12,388 | 52.5 | % | 92.36 | 48.52 | ||||||||||||||
|
|
|
| |||||||||||||||||
Total | 7,205 | 613,126 | 50.2 | % | 66.46 | 33.34 | ||||||||||||||
|
|
|
| |||||||||||||||||
| * | RevPAR may not recalculate by multiplying occupancy by ADR due to rounding. |
| (1) | From time to time, as a result of weather or other business interruption and ordinary wear and tear, some of the rooms at these hotels may be taken out of service for repair. | |
Our franchising business is designed to generate revenues for our hotel owners through the delivery of room night bookings to the hotel, the promotion of brand awareness among the consumer base, global sales efforts, ensuring guest satisfaction and providing outstanding customer service to hotel guests and our customers.
The sources of revenues from franchising hotels include (i) ongoing franchise fees, which are comprised of royalty, marketing and reservation fees, (ii) initial franchise fees, which relate to services provided to assist a franchised hotel to open for business under one of our brands and ongoing franchise fees, which are comprised of royalty fees, marketing, reservation and(iii) other relatedservice fees. Royalty fees are intended to cover the use of our trademarks and our operating expenses, such as expenses incurred for franchise services, including quality assurance hotel management systems and administrative support, and to provide us with operating profits. Marketing and reservation fees are intended to reimburse us for expenses associated with operating a centralan international, centralized, brand-specific reservations system, access to third-party distribution channels, such as online travel agents (“OTAs”), advertising and marketing programs, global sales efforts, operations support, training and other related services. We promote and sell our brands throughe-commerce initiatives, including online paid search and banner advertising as well as traditional media, including print and broadcast advertising. BecauseSince franchise fees generally are based on percentages of the franchised hotel’s gross room revenues, expanding our portfolio of franchised hotels and growing RevPAR at franchised hotels are important to our revenue growth.
Our management business offers hotel owners the benefits of a global brand and a full range of management, marketing and reservation services. In addition to the standard franchise services described below, our hotel management business provides full-service hotel owners with professional oversight and comprehensive operations support
7
We also earn revenues from the Wyndham Rewards loyalty program when a member stays at a participating hotel. These revenues are derived from a fee we charge based upon a percentage of room revenues generated from such stay. These loyalty fees are intended to reimburse us for expenses associated with administering and marketing the program.
Central Reservations and Internet BookingsReservation Booking Channels
In 2009,2011, hotels within our system (either franchised under one of our brands or managed) sold 8.0%7.6% or approximately 75.980 million, of the almost one billion hotel room nights sold in the U.S. and another 22.030 million hotel room nights across other parts of the world. Over 95%97% of the hotels in our system is locatedare in the economy and midscale segments of the global lodging industry. Economy and midscale hotels are typically located on highway roadsides for convenience to the business and leisure travelers. Therefore, the majority of hotel room nights sold at these hotels is to guests who seek accommodations on a walk-in basis, which we believe is attributable to the brand reputation and recognition of the brand name.
For guests who book their hotel stay in advance, we booked on behalf of hotels within our system a total of 32.742 million room nights in 2009,2011, which represents 33%38% of total bookings at these hotels and includes 17.6close to 17 million room nights booked through our Wyndham Rewards loyalty program.
Our most significant and fastest growing reservation channelsource is the Internet,online channels, which represents ourinclude proprietary websitesweb and mobile sites for each of our 11 brands and WyndhamRewards.com,for the Wyndham Rewards loyalty program, as well as online travel agents (“OTAs”)OTAs and other third-party Internet booking sources such as Travelocity.com and Expedia.com.sources. In 2009,2011, we booked 19.2 million room nights through online channels on behalf of U.S. hotels within our system, 15.5 million room nights through the Internet, which represents 15.7%representing 24% of the total bookings at these hotels. Since 2004,2006, bookings made directly by customers on our brand websitesweb and mobile sites have been increasingincreased at a five year CAGR of approximately 13.7%11%, and increased to over 8.08.2 million room nights in 2009. 2011, and bookings made through OTAs and other third-party Internet booking sources increased at a five year CAGR of approximately 17% to approximately 11 million room nights in 2011.
Therefore, a key strategy for reservation delivery is the continual investment in and optimization of our websiteseCommerce capabilities (websites, mobile and other online channels) as well as the deployment of advertising spend to drive online traffic to our proprietary websites,eCommerce channels, including through marketing agreements we have with travel related search websites and affiliate networks. Since 2004,networks, and other initiatives to drive business directly to our online channels. In addition, to ensure our franchisees receive bookings made by our brands’ customers throughfrom OTAs and other third-party Internet booking sources, increased at a five year CAGR of approximately 15.0% to over almost 7.5 million room nights in 2009. To ensure we receive these bookings, we provide direct connections between our central reservations system and somestrategic third-party Internet booking sources. DirectThese direct connections with our third party agencies allow us to deliver more accurate and consistent rates and inventory, send bookings directly to our central systems without interference or delay and reduce our franchise distribution costs.
Apart from the Internet, our call centers contributed almost 3.0over 2.7 million room nights in 2009,2011 which represents 3.0%3.4% of the total bookings at the U.S. hotels within our system. We maintain call centers in Saint John, Canada; Aberdeen, South Dakota; and Manila, Philippines that handle bookings generated through toll-free numbers for our toll-free brand numbers.
Our global distribution partners, such as Sabre and Amadeus, and global sales team also contributed a total of 2.3almost 2.8 million room nights in 2009,2011, which represents 2.4%3.5% of the total bookings at the U.S. hotels within our system. Our global distribution partners process reservations made by offline travel agents and by any OTAs that do not have the ability to directly connect with our reservation system. Our global sales team generates sales from global and meeting planners, tour operators, travel agents, government and military clients, and corporate and small business accounts, to supplement the on-property sales efforts.
Loyalty Program
The Wyndham Rewards program, which was introduced in 2003, has grown steadily to become one of the lodging industry’s largest loyalty programs.programs (based upon number of participating properties). The diversity of our 11 brands uniquely enables us to meet our members’ leisure as well as business travel needs across the greatest number of locations and a wide range of price points. The Wyndham Rewards program is offered in the U.S., Canada, U.K., Ireland, Germany, ChinaMexico, throughout Europe and most
8
Wyndham Rewards offers its members numerous ways to earn and redeem points. Members accumulate points by staying in one of almost 7,000approximately 6,500 branded hotels participating in the program or by purchasing everyday services and products using a co-branded Wyndham Rewards credit card. Members also have the option to earn points or airline miles with more than 50approximately 40 business partners, including Wyndham Vacation Resorts, American Airlines, Continental Airlines, Delta Airlines, US Airways, United Airlines, Southwest Airlines, RCI, Endless Vacation Rentals,Alamo and National Car Rental, Avis Budget Group, Amtrak, Aeromexico, Air China and BMI. When staying at one of our franchised or managed hotels, Wyndham Rewards members may elect to earn airline miles or rail points instead of Wyndham Rewards points. Wyndham Rewards members have over 400thousands of options to redeem their points. Members may redeemfor redeeming their points forincluding hotel stays, airline tickets, resort vacations, car rentals, electronics, sporting goods, movie and theme park tickets, and gift certificates.
Marketing, Sales and personalized guest amenities and services is offered exclusively at our Wyndham Hotels and Resorts brand and, in early 2010, will be offered at our Wingate by Wyndham and Hawthorn Suites by Wyndham hotels.
Our brand marketing teams develop and implement global marketing strategies for each of our 11 hotel brands, including generating consumer awareness of, and preference for each brand as well as direct response activities designed to drive bookings through our central reservation systems. We deploy a variety of marketing strategies and tactics depending on the needs of the specific brand and local market, including brand positioning, creative development, offline and online media planning and buying, promotions, sponsorships and direct marketing. While brand positioning and strategy is driven out ofgenerated from our U.S. headquarters, we have seasoned marketing professionals positioned around the globe to modify and implement these strategies on a local market level. In the U.S., all brands have a national marketing program, and some brands also have regional marketing cooperatives which foster collaboration among franchisees and leverage the national marketing plan to drive business to our properties at a local level.
Our global sales organization, strategically located throughout the world, leverages the significant size of our portfolio and the 11our hotel brands to gain a larger share of business for each of our hotels through relationship-based selling to a diverse range of customers. Because our hotel portfolio meets the needs of all types of travelers, we can find more complete solutions for a client/company who may have travel needs ranging from economy to upscale brands. We are able to accommodate travelers almost anywhere business or leisure travelers go with our selection of over 7,1007,200 hotels throughout the world. The sales team is deployed globally in key markets such as London,within Europe, Mexico, Canada, Korea, China, Singapore, the Middle East and throughout the U.S. in order to leverage multidimensional customer needs for our hotels. The global sales team also works with each hotel to identify the hotel’s individual needs and then works to find the right customers to stay with those brands and those hotels.
We offer revenue management services to help maximize revenues of our hotel owners and franchisees by improving rate and inventory management capabilities and also coordinating all recommended revenue programs delivered to our hotels in tandem withe-commerce and brand marketing strategies. Properties enrolled in our revenue management services have experienced higher production from call centers, websites and other channels, as well as stronger RevPAR index performance. As a result, the almost 2,5004,700+ properties currently enrolled in the revenue management program have experienced a 150 basis point improvement in RevPAR index.
9
We continue to support our franchisees with a team of dedicated support and service providers both field based and housed at our corporate office. This team of industry veterans collaborates with hotel owners on all aspects of their operations and creates detailed and individualized strategies for success. By providing key services, such as system integration, operations support, training, strategic sourcing, and development planning and construction, we are able to make a meaningful contribution to the operations of the hotel resulting in more profits for our hotel owners.
Our field services team, strategically dispersed worldwide, integrates new properties into our system and helps existing properties improve RevPAR performance and guest satisfaction. Our training teams provide robust educational opportunities to our hotel owners through instructor led, web-based and electronic learning vehicles for a number of relevant topics. Our strategic sourcing department helps franchisees control costs by leveraging the buying power of the entire Wyndham Worldwide organization to produce discounted prices on numerous items necessary for the successful operationsoperation of a hotel, such as linens and coffee. Our development planning and construction team provides architectural and interior design guidance to hotel owners to ensure compliance with brand standards, including construction site visits and the creation of interior design schemes.
We also provide hotel owners with property management systemssystem software that synchronizes each hotel’s inventory with our central reservations platform. These systems help hotel owners manage their rooms inventory (room nights), rates (ADR) and reservations, which leads to greater profits at the property level and better enables us to deliver reservations at the right price to our hotel owners.
Additionally, MyPortal, which is a property-focused intranet website, is the key communication vehicle and a single access point to all the information and tools available to help our hotel owners manage theirday-to-day activities.
New Development
Our development team consists of overapproximately 100 professionals dispersed throughout the world, including in the U.S., China, UKMexico, India, Europe and Mexico.the Middle East. Our development efforts typically target existing franchisees as well as hotel developers, owners of independent hotels and owners of hotels leaving competitor brands. Approximately 22%30% of the new rooms added in 20092011 were with franchisees or managed hotel owners already doing business with us.
Our hotel management business gives us access to development opportunities beyond pure play franchising deals.transactions. When a hotel owner is seeking both a brand and a manager for hisa full-service hotel, we are able to couple these services in one offering which we believe gives us a competitive advantage.
During 2009,2011, our development team generated 897760 applications for new franchiseand/or management agreements, of which 721,492, or 80%65%, resulted in new franchiseand/or management agreements. The difference is attributable to various factors such as financing and agreement on contractual terms. Once executed, about 70%94% of hotels open within the following six months,year, while 10%4% open between six12 and 1224 months due to extensive renovations, permitting and another 6% open generally within 24 months.delayed construction. The remaining 14% may never open due to various factors such as financing.
As of December 31, 2009,2011, we had 108,069approximately 850 hotels and 111,900 rooms pending opening in our development pipeline, of which 43%60% were international and 51%57% were new construction.
In North America, we generally employ a direct franchise model whereby we contract with and provide various services and reservations assistance directly to independent owner-operators of hotels. Under our direct franchise model, we principally market our lodging brands to hotel developers, owners of independent hotels and hotel owners who have the right to terminate their franchise affiliations with other lodging brands. We also market franchises to existing franchisees because many own, or may own in the future, other hotels that can be converted to one of our brands. Our standard franchise agreement grants a franchisee the right to non-exclusive use of the applicable franchise system in the operation of a single hotel at a specified location, typically for a period of 15 to 20 years, and gives the franchisor and franchisee certain rights to terminate the franchise agreement before its conclusion under certain circumstances, such as upon the lapsinglapse of a certain number of years after commencement of the agreement. Early termination options in franchise agreements give us flexibility to eliminate or re-brandterminate franchised hotels if such properties become weak performers, even if there is no contractual failure by the franchisee.business circumstances warrant. We also have the right to terminate a franchise agreement for failure by a franchisee to bring its propertiesproperty into compliance with contractual or quality standards within specified periods of time, pay required franchise fees or comply with other requirements of the franchise agreement.
Although we generally employ a direct franchise model in North America, we opened our first company-owned hotel, The Wyndham Grand Orlando Resort Bonnet Creek, in late 2011. This hotel is situated in our Bonnet Creek vacation ownership resort near the Walt Disney World resort in Florida and enables us to leverage the synergies of our company’s hotel and vacation ownership components.
In other parts of the world, we employ a direct franchise model or, where we are not yet ready to support the required infrastructure for that region, we may employ a master franchise model. Franchise agreements in regions outside of North America typicallymay carry a lower fee structure based upon the breadth of services we are
prepared to provide forin that particular region. Under our master franchise model, we principally market our lodging brands to third parties
10
We also enter into affiliation relationships whereby we provide our development, marketing and franchise services to brands owned by our affiliated partners. These relationships give us the ability to offer unique experiences to our guests and unique brand concepts to developers seeking to do business with Wyndham Hotel Group. Affiliation agreements typically carry lower royalty fees since we do not incur costs associated with owning the underlying intellectual property. Certain of these affiliated relationships contain development targets whereby our future development rights may be terminated upon failure to meet the specified targets.
Strategies
Wyndham Hotel Group is strategically focused on the following two objectives that we believe are essential to our business: increasing our system size and strengthening our customer value proposition.
To increase our system size, we intend to add new rooms and retain existing properties that meet our performance criteria.
We expect to deploy the following tactics to add new rooms:
create franchise conversion programs for our Super 8, Days Inn and Ramada brands with a goal of reducing the average age of the | |
target new construction and conversion opportunities in China, the Middle East, Latin America, United Kingdom and India for our global system. In North America, we expect to maintain our leading position in the economy segment and further expand our position in the midscale and upscale segments by:
target key markets but may seek a master franchising relationship in international marketsglobally where we are not yet ready to support the required infrastructure for that region. We also expect to use management agreements for the Wyndham brand is underrepresented and deploy a hub-and-spoke development strategy as well as offer customized financing solutions to hotel owners;
spur new construction growth in our Microtel and Wingate brands by developing a unique offering of franchisee-financing options for full-servicemulti-unit developers in North America; and
introduce the Tryp by Wyndham brand to North America with targeted development efforts in key markets and continuing to increase its existing presence in Latin America and Europe.
To execute on retaining existing properties that meet our performance criteria, we will:
continue to strengthen our value proposition; and
continue to deploy our exceptional service culture tool, “Count on Me!”, into every aspect of the business to attain optimal customer satisfaction.
Helping make our franchised and managed hotels under anyprofitable, whether through incremental revenue, cost efficiencies, operational excellence or better service, is essential in attracting new owners and retaining existing properties. This is why continually strengthening our customer value proposition is our second strategic objective. To this end, we are executing a comprehensive, multi-faceted plan to drive more business through our own direct, lowest cost channels. The launch of our new websites and improved content during 2011 were the first step in setting the foundation for these efforts. There are several other brandsinitiatives recently launched or in development to enable us to capture more business through our own online channels, including piloting ratings and reviews on our website, an umbrella, cross branded website, new mobile sites and apps, and our investment
in Room Key, which is a select basis. joint venture we invested in with 5 other major hotel companies. We have also invested in building out our eCommerce operational capabilities in the areas of online customer experience, online marketing and online retailing.
Our global strategy generally focuses on pursuing new room growth organically although we may consider the select acquisition of brands that facilitatefulfill our strategic objectives.
11
Franchise and management fees are generally higher in the second and third quarters than in the first or fourth quarters of any calendar year as a result of increased leisure travel and the related ability to charge higher ADRs during the spring and summer months.
Competition
Competition is robust among the lodging brand franchisors to grow their franchise systems and retain their existing franchisees. We believe existing and potential franchisees make decisions based principally upon the perceived value and quality of the brand and the services offered to franchisees. We further believe that the perceived value of a brand name is, to some extent, a function of the success of the existing hotels franchised under the brands. We believe that existing and prospective franchisees value a franchise based upon their views of the relationship between the costs, including costs of conversion and affiliation, to the benefits, including potential for increased revenues and profitability, and upon the reputation of the franchisor.
The ability of an individual franchisee to compete may be affected by the location and quality of its property, the number of competing properties in the vicinity, community reputation and other factors. A franchisee’s success may also be affected by general, regional and local economic conditions. The potential negative effect of these conditions on our results of operations is substantially reduced by virtue of the diverse geographical locations of our franchised hotels and by the scale of our franchisee base. Our franchise system is dispersed among almost 5,700approximately 5,600 franchisees, which reduces our exposure to any one franchisee. No one franchisee accounts for more than 2%4% of our franchised hotels and 3% of ouror total segment revenues.
WYNDHAM EXCHANGE AND& RENTALS
Vacation Exchange and Rentals IndustryIndustries
The estimated $61 billion global vacation exchange and rentals industry is largely afee-for-service business and has been a growing segment of the hospitality industry. The industry offers products and services to bothindustries offer leisure travelers and vacation property owners. For leisure travelers, the industry offers access to a range of fully-furnished vacation properties, which include privately-owned vacation homes, villas, cottages, apartments, condominiums and condominiums, vacation ownership resorts, inventory at hotels and resorts, boats and yachts. The industry offers leisure travelersas well as flexibility (subject to availability) in time of travel and choice of lodging options in regions where travelers may not typically have access to such choices. For vacation property owners, affiliations with vacation exchange companies allow owners of vacation intervals to exchange their interests in vacation properties for vacation time at other properties or for other various products and services. Additionally, affiliation with vacation rental companies provides property owners the ability to have their properties marketed and rented and, in some instances, to transfer the responsibility of managing such properties.
The vacation exchange industry provides owners of intervals flexibility through vacation exchanges.is a fee-for-service business. The industry offers services and products to timeshare (also known as “vacation ownership”) developers and consumers. To participate in a vacation exchange through an exchange company, an owner generally contributesprovides their interval to an exchange company’s network and, then indicatesin exchange, receives the particular resort or geographic area where the owner would likeopportunity to travel, the size of the unit desired and the period during which the owner would like to vacation.exchange for another interval. The exchange company then ratesvalues the owner’s contributed intervalsinterval within its network based upon a number of factors, including the location and size of the unit, or units, the qualitystart date of the resort or resortsinterval week, and amenities at the time period or periods during whichresort. Owners can then take advantage of their opportunity to exchange by selecting from other available inventory within the intervals entitle the owner to vacation. The ownerexchange company’s network. An exchange may then request an exchange for a vacation interval of equal or lesser rating compared to the interval that
12
The long-term trend in the vacation exchange industry has been growth in the number of members of vacation exchange companies. Current economic conditions have resulted in slower growth,stable membership levels, but we believe that an economic recovery will support a return to stronger growth. In 2008,2010, there were approximately 6.36.0 million members industry-wide who completed approximately 3.53.1 million exchanges. Within the broader long-term growth trend of the vacation exchange industry, there is also a trend where timeshare developers are enrolling members in private label clubs, where members have the option to exchange within the club or through external exchange channels. The club trend has a positive impact on the average number of members, but an oppositea negative effect on the number of exchange transactions per average member and revenue per member.
The over $65 billion global vacation rentalrentals industry is largely a fee-for-service business that offers vacation property owners the opportunity to rent their properties to leisure travelers for periods of time when the properties are unoccupied. The vacation rental industry is not as organized as the lodging industry in that the vacation rental industry does not have global reservation systems or brands.travelers. The industry is divided broadly into two segments. The first is the professionally managed rental segment, where the homeowner provides their property to an agent to rent, in a majority of cases, on an exclusive basis and the agent receives a commission for marketing the property, managing bookings and providing quality assurance to the renter. Additionally, the agent may offer services such as daily housekeeping, on-site check-in, in-unit maintenance, and in-room guest amenities. The other segment of the industry is the listing business, where there is no exclusive relationship and the property owner pays a fixed fee for an online listing or a directory listing with minimal additional services, typically with minimal to no direct booking ability or quality assurance services. In the listing model, this fixed fee is generally charged regardless of whether the unit is ultimately rented. Typically, professionally managed vacation rental companies collect rent in advance and, after deducting the applicable commissions, remit the net amounts due to the property ownersand/or property managers. In addition to commissions, professionally managed vacation rental companies may earn revenues from rental customers through fees that are incidental to the rental of the properties, such as fees for travel services, local transportation,on-site services and insurance or similar types of products.
The global supply of vacation rental inventory is less organized than the lodging industry and is highly fragmented with much of it being made available by individual property owners. We believe that as of December 31, 2009,2011, there were approximately 1.3 million and 1.72.7 million vacation properties available for rental in the United StatesU.S. and Europe, respectively. In the United States,U.S., the vacation properties available for rental are primarily condominiums or stand-alone houses. In Europe, the vacation properties available for rental include individual homes and apartments, campsites and vacation park bungalows. Individual owners of vacation properties in the United StatesU.S. and Europe may own their properties as investments and may sometimes use such properties for their own use for portions of the year. We believe that the overall supply of vacation rental properties has grown primarily because of the increasing desire by existing owners of second homes to gain an earnings stream evidenced by homes not previously offered for rent appearing on the market.
We believe that the overall demand for vacation rentals has been growing for the following reasons: (i) the consumer value of renting a unit for an entire family; (ii) the increased use of the Internet as a tool for facilitating vacation rental transactions; and (iii) increased consumer awareness of vacation rental options. The global demand per year for vacation rentals is approximately 54 million vacation weeks, 34 million of which are rented by leisure travelers from Europe. Demand for vacation rental properties is often regional since many leisure travelers rent properties within driving distance of their home. Some leisure travelers, however, travel relatively long distances from their homes to vacation properties in domestic or international destinations. Current economic conditions have resulted in slower growth in demand in the near term, but we believe that the long-term trends will support a return to stronger growth.
The destinations where leisure travelers from Europe and the United States, South Africa and AustraliaU.S. generally rent properties vary by country of origin of the leisure travelers. Leisure travelers from Europe generally rent properties in European holiday destinations, including the United Kingdom, Denmark, Ireland, Spain, France, the Netherlands, Germany, Italy and Portugal. Demand from European leisure travelers has recently been shifting beyond traditional Western Europe, based on political stability across Europe, increased accessibility of Eastern Europe, and the expansion of the European Union.Union and political stability across Europe. Demand from U.S. leisure travelers is focused on rentals in seaside destinations, such as
Hawaii, Florida and the Carolinas, in ski destinations such as the Rocky Mountains, and in urban centers such as Las Vegas, Nevada;Nevada and San Francisco, California; and New York City, New York.California. Demand is also growing for destinations in Mexico and the Caribbean by leisure travelers from the United States.
Wyndham Exchange and& Rentals Overview
Wyndham Exchange and& Rentals is largely afee-for-service business that provides vacation exchange productsservices and servicesproducts to developers, managers and owners of intervals of vacation ownership interests, and markets and services vacation rental properties. We are the world’s largest vacation exchange network based on the number of vacation exchange members and the world’s largest global marketer of vacation rental properties based on the number of professionally managed vacation rental properties. Our vacation exchange and rentals business primarily derives its revenues from fees whichthat generate
13
Our vacation exchange business, RCI, derives a majority of its revenues from annual membership dues and exchange fees for facilitating transactions. Our vacation exchange business also derives revenues from ancillary services including additional services provided to transacting members, programs with affiliated resorts, club servicing travel agency services and loyalty programs.
Our vacation rentals business, Wyndham Vacation Rentals, primarily derives its revenues from fees, which generally average between 20% and 45%50% of the gross booking fees for non-proprietary inventory, except for where we receive 100% of the revenues for properties that we own or operate under long-term capital leases. Our vacation rentals business also derives revenues from ancillary services deliveredon-site for owned and managed properties. The revenues generated in our vacation exchange and rentals business are substantially derived from the direct customer relationships we have with our 3.8 million vacation exchange members, our nearly 46,000 independent to property owners and the affiliated developers of over 4,000 resorts. No one external customer, customer group or developer accounts for more than 2% of our vacation exchange and rentals revenues.
Our vacation exchange and rentals business has access for specified periods, in a majority of cases on an exclusive basis, to over 65,000approximately 100,000 vacation properties, which are comprised of over 4,000 vacation ownership resorts around the world through our vacation exchange business, and approximately 61,000over 95,000 vacation rental properties that arewith approximately 88,000 properties located principally in Europe which we believe makes usand over 7,000 located in the world’s largest marketer of European vacation rental properties as measured by the number of managed properties marketed.U.S. Each year, our vacation exchange and rentals business provides more than 4.55 million leisure-bound families with vacation exchange and rentals productsservices and services.products. The properties available to leisure travelers through our vacation exchange and rentals business include vacation ownership condominiums, houses,homes, villas, cottages, bungalows, campgrounds, hotel rooms and suites, city apartments, fractional private residences, luxury destination clubs, boats and yachts. We offer leisure travelers flexibility (subject to availability) as to time of travel and a choice of lodging options in regions to which such travelers may not typically have such ease of access, and we offer property owners marketing, services,booking and quality control services andservices. Additionally, some of our brands offer property management services ranging from key-holding to full property maintenance for such properties. Our vacation exchange and rentals business has over 80150 worldwide offices. We market our services and products and services using eighteleven primary consumer brands and other related brands.
Vacation Exchange
Through our vacation exchange business, RCI, we have relationships with over 4,000 vacation ownership resorts in approximately 100 countries. We have 3.8over 3.7 million vacation exchange members and generally retain more than 85% of members each year, with the overall membership base currently stable or growingand expected to grow over time,the long term, and generate fees from members for both annual membership subscriptions and transaction based services. We acquire substantially all members of our exchange programs indirectly. In substantially all cases, an affiliated resort developer buys the initial term of an RCI membership on behalf of the
consumer when the consumer purchases a vacation ownership interval. Generally, this initial term is either 1 or 2 years and entitles the vacation ownership interval purchaser to receive periodicals published by RCI and to use the applicable exchange program for an additional fee. The vacation ownership interval purchaser generally pays for membership renewals, andor such member renewals are paid for by the developer on the purchaser’s behalf. Additionally, such purchaser generally pays any applicable fees for exchange transactions.
RCI operates three worldwide exchange programs that have a member base of vacation owners who are generally well-traveled and who want flexibility and variety in their travel plans each year. Our vacation exchange business’ three exchange programs, which serve owners of intervals at affiliated resorts, are RCI® Weeks, RCI Points® and The Registry Collection® programs.Collection. Participants in these vacation exchange programs pay annual membership dues. For additional fees, participants are entitled to exchange intervals for intervals at other properties affiliated with our vacation exchange business. In addition, certain participants may exchange intervals for other leisure-related productsservices and services.products. We refer to participants in these three exchange programs as “members.” In addition, theEndless Vacation® magazine is the official travel publication of our RCI Weeks and RCI Points exchange programs for U.S. and Canadian members, and certain members can obtain the benefits of participation in our RCI Weeks and RCI Points exchange programs only through a subscription toEndless Vacationmagazine.
The RCI Weeks exchange program is the world’s largest vacation ownership exchange network and generally provides members with the ability to tradeexchange week-long intervals in units at their resorts for week-long intervals of equal or lesser rated units at the same resorts or at comparable resorts.
The RCI Points exchange program, launched in 2000, is a global points-based exchange network, which allocates points to intervals that members cede to the exchange program. Under the RCI Points exchange program, members may redeem their points for the use of vacation properties in the exchange program or for discounts on other productsservices and servicesproducts which may change from time to time, such as airfare, car rentals, cruises, hotels and other accommodations. When points are redeemed for these other productsservices and services,products, our vacation exchange business
14
We believe that The Registry Collection exchange program is the industry’s firstlargest and largestfirst global exchange network of luxury vacation accommodations. The luxury vacation accommodations in The Registry Collection’sCollection network include higher-end vacation ownership resorts, fractional ownership resorts, condo-hotels and yachts. The Registry Collection program allows members to exchange their intervals for the use of other vacation properties within the network for a fee and also offers access to other productsservices and services,products, such as cruises, yachts, adventure travel, hotels and other accommodations. The members of The Registry Collection exchange program often own greater than two-week intervals at affiliated resorts.
Our vacation exchange business operates worldwide primarily in the following regions: North America, Europe, Latin America, the Caribbean, Southern Africa, Asia Pacific and the Middle East. We tailor our strategies and operating plans for each of the geographical environments where RCI has, or seeks to develop, a substantial member base.
Vacation Rentals
Our vacation rentals business, Wyndham Vacation Rentals, markets vacation rental properties we market are principallyincluding privately-owned villas, homes, cottages, bungalows, campgrounds, apartments and apartmentscondominiums that generally belong to independent property owners.owners in more than 500 destinations. The variety, location and caliber of properties in the Wyndham Vacation Rentals portfolio, in addition to the many benefits and services that
Wyndham Vacation Rentals offers, provides consumers the opportunity for memorable vacation experiences and gives travelers unique moments in more parts of the world than ever before. In addition to these properties, we market inventory from our vacation exchange business and from other sources. We generate fee income from marketing and renting these properties to consumers. We currently make nearly 1.4over 1.3 million vacation rental bookings a year. We market vacation rental properties under proprietary brand names, such as Landal Green Parks,GreenParks, Hoseasons, Villas4You, cottages4you, James Villa Holidays, Novasol, Dansommer, Villas4You, cottages4you, English Country Cottages,Cuendet and Canvas Holidays, Cuendet, Endlessas well as ResortQuest by Wyndham Vacation Rentals, Steamboat Resorts by Wyndham Worldwide,Vacation Rentals and The Resort Company by Wyndham Vacation Rentals. Additionally, we market vacation rental properties through select private-label arrangements. Our vacation rentals business has over 95,000 properties with approximately 88,000 properties in Europe and over 7,000 properties in the U.S. The following is a description of some of our major vacation rental brands:
The Hoseasons Group operates a number of well-recognized and established brands within the vacation rental market, including Hoseasons, cottages4you and James Villa Holidays, and offers unparalleled access to over 44,000 properties across the U.K. and Europe.
Novasol is one of continental Europe’s largest rental companies, featuring properties in more than 20 European countries including holiday homes in Denmark, Norway, Sweden, France, Italy and Croatia, with approximately 30,000 exclusive holiday homes available for rent through established brands such as Novasol, Dansommer and Cuendet.
Landal GreenParks is one of Holland’s leading holiday park companies, with over 70 holiday parks offering approximately 11,000 holiday park bungalows, villas and apartments in the Netherlands, Germany, Belgium, Austria, Switzerland and the Czech Republic. Every year more than 2 million guests visit Landal’s parks, many of which offer dining, shopping and wellness facilities.
Canvas Holidays is a specialist tour operator offering luxury camping holidays in Europe at 90 of the finest European campsites with over 2,500 accommodation units. It has a wide choice of luxury accommodations — spacious lodges, comfortable mobile homes and the unique Maxi Tent, plus an exciting range of children’s and family clubs.
ResortQuest by Wyndham Vacation Rentalsis a leading provider of full-service, wholly-owned vacation condominiums and home rentals in the U.S. With more than 20 years of experience in the industry, ResortQuest represents a portfolio of approximately 6,000 vacation rental properties, marketed through established brands, in resort destinations across the United States — such as Colorado, Utah, South Carolina, Florida and Delaware.
The Resort Companyoperates under the The Resort Company by Wyndham Vacation Rentals and Steamboat Resorts by Wyndham Vacation Rentals brands and provides full-service management through hotel-type services to owners and guests. Their portfolio of approximately 1,000 vacation properties is concentrated in the Colorado Rocky Mountains in world class resorts.
Most of the rental activity under our brands takes place in Europe and the United States and Mexico, although we have the ability to source and rent inventory in approximately 100 countries.U.S. Our vacation rentals business also has the opportunity to provide inventory to our 3.8over 3.7 million vacation exchange members.
Wyndham Vacation Rentals offers travelers exceptional vacation experiences around the world. Our vacation rentals business currently has relationships with nearly 46,000approximately 55,000 independent property owners in 2632 countries, including the Netherlands, the United Kingdom, Germany, Denmark, Sweden, France, Ireland, Belgium, Italy, Spain, Portugal, Norway, Greece, Austria, Croatia, and certain countries in Eastern Europe and the United States, the Pacific Rim and Latin America.U.S. Property owners typically enter into one year or multi-yearannual contracts with our vacation rentals subsidiaries to market the rental of their properties within our rental portfolio. Our vacation rentals business also has an ownership interest in, or capital leases under theour Landal GreenParks brand, for approximately 10%7% of the properties in our rental portfolio.
Customer Development
In our vacation exchange business, we affiliate with vacation ownership developers directly as a result of the efforts of our in-house sales teams. Affiliated developers sign long-term agreements each with aan average duration of up to 10approximately 5 years. Our members are acquired primarily through our affiliated developers as part of the vacation ownership
15
In our vacation rentals business, we primarily enter into exclusive annual rental agreements with property owners. We market rental properties online and offline to large databases of customers which generate repeat bookings. Additional customers are sourced through bookable websites and offline advertising and promotions, and through the use of third-party travel agencies, tour operators, and online distribution channels to drive additional occupancy. We have also developeda number of specific branded websites, such as cottages4you.co.ukhttp://www.cottages4you.co.uk and EVrentals.com,http://www.resortquest.com as well as a new global portal highlighting all of our vacation rental brands across product type and geography, http://www.wyndhamrentals.com, to promote, sell and inform new customers about vacation rentals. Given the diversified nature of our rental brands, there is limited dependence on a single customer group or business partner.
Loyalty Program
Our U.S. vacation exchange business’ member loyalty program is RCI Elite Rewards,®, which offers a branded credit card, the RCI Elite Rewards credit card. The card allows members to earn reward points that can be redeemed for items related to our exchange programs, including annual membership dues and exchange fees for transactions, and other services and products offered by our vacation exchange business or certain third parties, including airlines and retailers.
Internet
Given the increasing interest of our members and rental customers to transact on the Internet, we invest and will continue to invest in cutting edge and innovative online technologies to ensure that our members and rental customers have access to similar information and services online that we provide through our call centers. Through our comprehensive RCI.comhttp://www.RCI.com initiative, which began in 2008, we have launched enhanced search capabilities that greatly simplify our search process and make it easier for a member to find a desired vacation. We have also greatly expanded our online content, including multiple resort pictures and high-definition videos, to help educate members about potential vacation options. Additionally, through this initiative, we released a significant series of technology enhancements to our members. This new technology included program enhancements for our RCI Weeks members that provide complete trading power transparency, allowing members to better understand the trading power value of the timeshare interval that they deposited with RCI and the timeshare interval into which they want to exchange. Members also have the ability to combine the timeshare intervals that they have deposited with RCI for increased trading power and get a deposit credit if the trading power value of their deposited interval is greater than the interval that they have received by exchange. We also have enhanced our ability to merchandise offers through web only channels and have launched mobile technologies such as applications for the iPhone, Blackberry and Android devices to access http://www.RCI.com functionality.
In 2011, we brought even more simplicity, speed, and efficiency to the vacation exchange experience with another major technology upgrade. This included a new property information management platform, as well as a new enhanced search function for our RCI Points members. In addition, we launched an innovative recommendation engine technology where members see real-time vacation suggestions that best fit their unique travel preferences. Our RCI.com initiatives have increased our web penetration to 38% in 2011 from 13% in 2008 when we launched this initiative.
Over the last several years, we have improved our web penetration to 61% in 2011 for European rentals through enhancements that have moved the majority of bookings online. As our online distribution channels
improve, members and rental customers will shift from transacting business through our call centers to transacting business online, which we expect will generate cost savings. By offering our members and rental customers the opportunity to transact business either through our call centers or online, we offer our members and rental customers the ability to use the distribution channel with which they are most comfortable. Regardless of the distribution channel our members and rental customers use, our goal isgoals are member and rental customer satisfaction and retention.
Call Centers
Our vacation exchange and rentals business also services its members and rental customers through global call centers. The requests that we receive at our global call centers are handled by our vacation guides, who are trained to fulfill our members’ and rental customers’ requests for vacation exchanges and rentals. When our members’ and rental customers’ primary choices are unavailable in periods of high demand, our guides offer the next nearest match in order to fulfill the members’ and rental customers’ needs. Call centers are currently a significantan important distribution channel and therefore we invest resources and will continue to do so to ensure that members and rental customers continue to receive a high level of personalized customer service through our call centers.
Marketing
We market to our members and rental customers through several marketing channels including direct mail, and email, telemarketing, online distribution channels, brochures, magazines and travel agencies. Our vacation exchange business has a comprehensive social media platform including an RCI app for the iPhone, Blackberry and Android devices, a Facebook fan page, a Facebook application called RCI’s Share Your Vacation, a Twitter account, a YouTube channel, an online video content network called RCI TV, and the RCI Blog. Our vacation exchange and rentals business hasbrands have over 5085 publications involved in the marketing of the business. RCI publishesEndless Vacationmagazine, a travel publication that has a circulation of over 1.8 million. Our vacation exchange and rentals business, also publishesincluding various resort directories and other periodicals related to the vacation and vacation ownership industry and other travel-related services. We acquire rental customers through ourdirect-to-consumer marketing, internet marketing and third-party agent marketing programs. We use our publications not only for marketing, but also for member and rental customer retention.retention and loyalty. Additionally, we promote our offerings to owners of resorts and vacation homes through publications, trade shows, online and other marketing efforts.
Strategies
We intend to grow our vacation exchange and rentals business profitability by focusing on three core strategies:five strategic themes:
Inspire world-class associate engagement and “Count On Me!” service so that we will deliver better services and products, resulting in improved customer satisfaction and optimal business growth;
Invest in technology to improve the customer experience, grow market share and reduce costs;
Offer more options to our guests by expanding into new geographic markets and product lines, and by leveraging the scale of our inventory across all of our exchange and rentals brands;
Develop compelling new services and products, and maximize occupancy and yield by improving our analytic process; and
Promote the benefits of timeshare and vacation rentals to new and existing customer segments.
Our plans generally focus on pursuing these strategies organically. However, in appropriate circumstances, we will consider opportunities to acquire businesses, both domestic and international.
16
Vacation exchange transaction revenues are normally highest in the first quarter, which is generally when members of RCI plan and book their vacations for the year. Rental transaction revenues earned from booking vacation rentals to rental customers are usually
highest in the third quarter, when vacation rentals are highest. More than half of our European vacation rental customers book their reservations within 11 weeks of departure dates and more than 70%almost 75% of our European vacation rental customers book their reservations within 20 weeks of departure dates. More than half of our North American vacation rental customers book their reservations within 8 weeks of departure dates and almost 75% of our North American vacation rental customers book their reservations within 15 weeks of departure dates, reflecting recent trends of bookings closer to the travel date.
Competition
The vacation exchange and rentals business faces competition throughout the world. Our vacation exchange business competes with a third-party international exchange company, with regional and local vacation exchange companies and with Internet-only limited service exchanges. In addition, certain developers offer exchanges through internal networks of properties, which can be operated by us or by the developer, that offer owners of intervals access to exchanges other than those offered by our vacation exchange business. Our vacation rentals business faces competition from a broad variety of professional vacation rental managers andrent-by-owner channels that collectively use brokerage services, direct marketing and the Internet to market and rent vacation properties.
WYNDHAM VACATION OWNERSHIP
Vacation Ownership Industry
The global vacation ownership industry, which is also referred to as the timeshare industry, is aan important component of the domestic and international hospitality industry. The vacation ownership industry enables customers to share ownership of a fully-furnished vacation accommodation. Typically, a vacation ownership purchaser acquires either a fee simple interest in a property, which gives the purchaser title to a fraction of a unit, or a right to use a property, which gives the purchaser the right to use a property for a specific period of time. Generally, a vacation ownership purchaser’s fee simple interest in or right to use a property is referred to as a “vacation ownership interest.” For many vacation ownership interest purchasers, vacation ownership is an attractive vacation alternative to traditional lodging accommodations at hotels or owning vacation properties. Owners of vacation ownership interests are not subject to the variance in room rates to which lodging customers are subject, and vacation ownership units are, on
17
The vacation ownership concept originated in Europe during the late 1960s and spread to the United StatesU.S. shortly thereafter. The vacation ownership industry expanded slowly in the United StatesU.S. until the mid-1980s. From the mid-1980s through 2007, the vacation ownership industry grew at a double-digit CAGR, although sales slowed by approximately 8% in 2008 and experienced even greater declines in 2009 due to the global recession and a significant disruption in the credit markets. Based on researchAccording to a May 2011 report issued by the American Resort Development Association or ARDA, a trade association representing the vacation ownership and resort development industries, domestic sales of vacation ownership interests were approximately $9.7$6.4 billion in 2008 compared to $6.5 billion in 2003.2010. ARDA estimated that in 2009,2010, there were approximately 6.88.1 million households that owned one or more vacation ownership interests in the United States.
Based on published industry data, we believe that the following factors have contributed to the substantial growth,strength and stability, particularly in North America, of the vacation ownership industry over the past two decades:
inherent appeal of a timeshare vacation option as opposed to a hotel stay;
improvement in quality of resorts and resort management and servicing;
increased flexibility for owners of vacation ownership interests made possible through owners’ affiliations with vacation ownership exchange companies and vacation ownership companies’ internal exchange programs;
entry of widely-known lodging and entertainment companies into the industry; and
increased consumer confidence in the industry based on enhanced consumer protection regulation of the industry.
Demographic factors explain, in part, the growthcontinued appeal of the industry.vacation ownership. A 20082010 study of recent U.S. vacation ownership purchasers revealed that the average purchaser was 5352 years of age and had a median household income of $73,000.$78,400. The average purchaser in the United States,U.S., therefore, is a baby boomer who has disposable income and interest in purchasing vacation products. We believe that baby boomers will continue to have a positive influence on the vacation ownership industry.
According to information compiled by ARDA, the four primary reasons consumers cite for purchasing vacation ownership interests are: (i) flexibility with respect to different locations, unit sizes and times of year, (ii) the certainty of quality accommodations, (iii) credibility of the timeshare company and (iv) the opportunity to exchange into other resort locations. According to a 20082010 ARDA study, nearly 85%84% of owners of vacation ownership interests expressed a general level of satisfaction with owning timeshare. With respect to exchange opportunities, most owners of vacation ownership interests can exchange vacation ownership interests through exchange companies and through the applicable vacation ownership company’s internal network of properties.
Wyndham Vacation Ownership Overview
Wyndham Vacation Ownership, our vacation ownership business, includes marketing and sales of vacation ownership interests, consumer financing in connection with the purchase by individuals of vacation ownership interests, property management services to property owners’ associations and development and acquisition of vacation ownership resorts. We have the largest vacation ownership business in the world as measured by the number of vacation ownership resorts, vacation ownership units and owners of vacation ownership interests and by annual revenues associated with the sale of vacation ownership interests. As of December 31, 2011, we have developed or acquired over 160 vacation ownership resorts in the U.S., Canada, Mexico, the Caribbean and the South Pacific that represent approximately 20,800 individual vacation ownership units and over 813,000 owners of vacation ownership interests.
We operate our vacation ownership business through our two primary brands, Wyndham Vacation Resorts and WorldMark by Wyndham. In October 1999, WorldMark by Wyndham formed Wyndham Vacation Resorts Asia Pacific Pty. Ltd., a New South Wales corporation, or Wyndham Asia Pacific, as its direct wholly owned subsidiary for the purpose of conducting sales, marketing and resort development activities in the South Pacific. Wyndham Asia Pacific is currently the largest vacation ownership business in Australia.
During 2009,2011, Wyndham Vacation Ownership expanded its portfolio with the addition of resorts in San Francisco, California; Prince George’s County, MarylandWaikiki, Hawaii; North Myrtle Beach, South Carolina; Destin, Florida; and Sevierville, TennesseeSmugglers’ Notch, Vermont and added additional inventory at locations in Orlando, Florida; Steamboat Springs, Colorado; Wisconsin Dells, Wisconsin; Kauai, Hawaii;Australia; and New Braunfels, Texas; and Santa Fe, New Mexico.
In response to worldwide economic conditions impacting the general availability of credit on which our vacation ownership business has historically been reliant, we announced in late 2008 a plan to reduce our 2009 gross VOI sales by approximately 40% in order to reduce our need to access the asset-backed securities markets during
18
Our primary vacation ownership brands, Wyndham Vacation Resorts and WorldMark by Wyndham, operate vacation ownership programs through which vacation ownership interests can be redeemed for vacations through points- or credits-based internal reservation systems that provide owners with flexibility (subject to availability) as to resort location, length of stay, unit type and time of year. The points- orpoints-or credits-based reservation systems
offer owners redemption opportunities for other travel and leisure products that may be offered from time to time, and the opportunity for owners to use our products for one or more vacations per year based on level of ownership.year. Our vacation ownership programs allow us to market and sell our vacation ownership products in variable quantities as opposed to the fixed quantity of the traditional, fixed-week vacation ownership, which is primarily sold on a weekly interval basis, and to offer to existing owners “upgrade” sales to supplement such owners’ existing vacation ownership interests. Although we operate Wyndham Vacation Resorts and WorldMark by Wyndham as separate brands, we have integrated substantially all of the business functions of Wyndham Vacation Resorts and WorldMark by Wyndham, including consumer finance, information technology, certain staff functions, product development and certain marketing activities.
Our vacation ownership business derives a majority of its revenues from sales of vacation ownership interests and derives other revenues from consumer financing and property management. Because revenues from sales of vacation ownership interests and consumer finance in connection with such sales depend on the number of vacation ownership units in which we sell vacation ownership interests, increasing the number of such units is important toin achieving our revenue goals. Because revenues from property management depend, in part, on the number of units we manage, increasing the number of such units has a direct effect of increasing our revenues from property management.
Sales and Marketing of Vacation Ownership Interests and Property Management
Vacation Ownership Interests, Portfolio of Resorts and Maintenance Fees. The vacation ownership interests that Wyndham Vacation Resorts markets and sells consist primarily of undividedvacation ownership interests that entitlesentitle an owner to ownership and usage rightsresort accommodations that are not restricted to a particular week of the year. As of December 31, 2009,2011, over 515,000523,000 owners held interests in Wyndham Vacation Resorts resort properties. Wyndham Vacation Resorts properties are located primarily in the United StatesU.S. and, as of December 31, 2009,2011, consisted of 7476 resorts (six of which are shared with WorldMark by Wyndham) that represented approximately 12,90013,300 units. During 2009,
Wyndham Vacation Resorts opened new propertiescurrently offers two vacation ownership programs, Club Wyndham Select and Club Wyndham Access. Club Wyndham Select owners purchase an undivided interest in San Francisco, California; Prince George’s County, Marylanda select resort and Sevierville, Tennessee and addedreceive a deed to that resort, which becomes their “home” resort. Club Wyndham Access owners do not directly receive a deed, but own an interest in a perpetual club. Through Club Wyndham Plus, Club Wyndham Access owners have an advanced reservation priority access to the multiple Wyndham Vacation Resorts locations based on the amount of inventory at existing properties in Orlando, Florida; Steamboat Springs, Colorado; Wisconsin Dells, Wisconsin; and Kauai, Hawaii.
The majority of the resorts in which Wyndham Vacation Resorts develops, markets and sells vacation ownership and other real estate interests are destination resorts that are located at or near attractions such as the Walt Disney World® Resort in Florida; the Las Vegas Strip in Nevada; Myrtle Beach in South Carolina; Colonial Williamsburg® in Virginia; and the Hawaiian Islands. Most Wyndham Vacation Resorts properties are affiliated with Wyndham Worldwide’s vacation exchange business, RCI, which annually awards to the top 10%25-35% of RCI affiliated vacation ownership resorts throughout the world, designations of an RCI Gold Crown Resort winner or an RCI Silver Crown Resort winner for exceptional resort standards and service levels. Among Wyndham Vacation Resorts’ 7476 resort properties, 5382% have been awarded designations of an RCI Gold Crown Resort winner or an RCI Silver Crown Resort.
Like Wyndham Vacation Resorts, WorldMark by Wyndham and Wyndham Asia Pacific sell vacation ownership interests that entitle an owner to resort accommodations that are not restricted to a particular week of the year. After WorldMark by Wyndham or Wyndham Asia Pacific develops or acquires resorts, it conveys the resorts to WorldMark, The Club or WorldMark South Pacific Club, which we refer to collectively as the Clubs, as applicable. In exchange for the conveyances, WorldMark by Wyndham or Wyndham Asia Pacific receives the exclusive rights to sell the vacation credits associated with the conveyed resorts and to receive the proceeds from the sales of the vacation credits. Vacation ownership interests sold by WorldMark by Wyndham and Wyndham Asia Pacific represent credits in the Clubs which entitle the owner of the credits to reserve units at the resorts that
are owned and operated by the Clubs. Although vacation credits, unlike vacation ownership interests in Wyndham Vacation Resorts resort properties, do not constitute deeded interests in real estate, vacation credits are regulated in most jurisdictions by the same agency that regulates vacation ownership interests evidenced by deeded interests in real estate. As of December 31, 2009, over 305,0002011, approximately 290,000 owners held vacation credits in the Clubs.
WorldMark by Wyndham resorts are located primarily in the Western United States,U.S., Canada, Mexico and the South Pacific and, as of December 31, 2009,2011, consisted of 8892 resorts (six of which are shared with Wyndham
19
The resorts in which WorldMark by Wyndham develops, markets and sells vacation credits are primarily drive-to resorts. Most WorldMark by Wyndham resorts are affiliated with Wyndham Worldwide’s vacation exchange subsidiary, RCI. Among WorldMark by Wyndham’s 8892 resorts, 5663% have been awarded designations of an RCI Gold Crown Resort winner or an RCI Silver Crown Resort.
Owners of vacation ownership interests pay annual maintenance fees to the property owners’ associations responsible for managing the applicable resorts or to the Clubs. The annual maintenance fee associated with the average vacation ownership interest purchased ranges from approximately $400 to approximately $900. These fees generally are used to renovate and replace furnishings, pay operating, maintenance and cleaning costs, pay management fees and expenses, and cover taxes (in some states), insurance and other related costs. Wyndham Vacation Ownership, as the owner of unsold inventory at resorts or unsold interests in the Clubs, also pays maintenance fees in accordance with the legal requirements of the states or jurisdictions in which the resorts are located. In addition, at certain newly-developed resorts, Wyndham Vacation Ownership sometimes enters into subsidy agreements with the property owners’ associations to cover costs that otherwise would be covered by annual maintenance fees payable with respect to vacation ownership interests that have not yet been sold.
Club Wyndham Plus. Wyndham Vacation Resorts uses a points-based internal reservation system called Club Wyndham Plus (formerly known as FairShare Plus) to provide owners with flexibility (subject to availability) as to resort location, length of stay, unit type and time of year. With the launch of Club Wyndham Plus in 1991, Wyndham Vacation Resorts became one of the first U.S. developers of vacation ownership properties to move from traditional, fixed-week vacation ownership to a points-based program. Owners of vacation ownership interests in Wyndham Vacation Resorts properties that are eligible to participate in the program may elect, and with respect to certain resorts are obligated, to participate in Club Wyndham Plus.
Owners who participate in Club Wyndham Plus assign their rights to use fixed weeks and undivided interests, as applicable,rights to a trust in exchange for the right to reserve in the internal reservation system. The number of points that an owner receives as a result of the assignment to the trust of the owner’s right to use fixed weeks or undivided interests,rights, and the number of points required to take a particular vacation, is set forth on a published schedule and varies depending on the resort location, length of stay, unit type and time of year associated with the interests assigned to the trust or requested by the owner, as applicable. Participants in Club Wyndham Plus may choose (subject to availability) the Wyndham Vacation Resorts resort properties, length of stay, unit types and times of year, depending on the number of points to which they are entitled and the number of points required to take the vacations of their preference. Participants in the program may redeem their points not only for resort stays, but also for other travel and leisure products that may be offered from time to time. Owners of vacation points are able to borrow vacation points from the next year for use in the current year. Wyndham Vacation Resorts offers various programs that provide existing owners with the opportunity to “upgrade,” or acquire additional vacation ownership interests to increase the number of points such owners can use in Club Wyndham Plus.
WorldMark, The Club and WorldMark South Pacific Club.The Clubs provide owners of vacation credits with flexibility (subject to availability) as to resort location, length of stay, unit type and time of year. Depending on how manythe number of vacation credits an owner has purchased, the owner may use the vacation credits for one or more vacations annually. The number of vacation credits that are required for each day’s stay at a unit is listed on a published schedule and varies depending upon the resort location, unit type, time of year and the day of the week. Owners may also redeem their credits for other travel and leisure products that may be offered from time to time.
Owners of vacation credits are also able to purchase bonus time from the Clubs for use when space is available. Bonus time gives owners the opportunity to use available resorts on short notice and at a reduced rate and to obtain usage beyond owners’ allotments of vacation credits. In addition, WorldMark by Wyndham offers owners the opportunity to “upgrade,” or acquire additional vacation credits to increase the number of credits such owners can use in the Clubs.
20
Sales and Marketing
Wyndham Vacation Ownership employs a variety of marketing channels as part of Wyndham Vacation Resorts and WorldMark by Wyndham marketing programs to encourage prospective owners of vacation ownership interests to tour Wyndham Vacation Ownership properties and attend sales presentations at off-site sales offices. Our resort-based sales centers also enable us to actively solicit upgrade sales to existing owners of vacation ownership interests while such owners vacation at our resort properties. Sales of vacation ownership interests relating to upgrades represented approximately 68%, 68% and 64% of our net sales of vacation ownership interests during 2011, 2010 and 2009, respectively.
Wyndham Vacation Ownership uses a variety of marketing programs to attract prospective owners, including sponsored contests that offer vacation packages or gifts, targeted mailings, outbound and inbound telemarketing efforts, and in association with Wyndham Worldwide hotel brands, associated loyalty and other co-branded marketing programs and events. Wyndham Vacation Ownership also co-sponsors sweepstakes, giveaways and promotional programs with professional teams at major sporting events and with other third parties at other high-traffic consumer events. Where permissible under state law, Wyndham Vacation Ownership offers existing owners cash awards or other incentives for referrals of new owners. New owner acquisition is an important strategy for Wyndham Vacation Ownership in order to continue to maintain our pool of “lifetime” buyers of vacation ownership. New owners will enable Wyndham Vacation Ownership to solicit upgrade sales in the future. We added approximately 27,000 and 22,000 new owners during 2011 and 2010, respectively, to our pool of “lifetime” buyers which may ultimately become repeat buyers of vacation ownership interests as they upgrade.
Wyndham Vacation Ownership’s marketing and sales activities are often facilitated through marketing alliances with other travel, hospitality, entertainment, gaming and retail companies that provide access to such companies’ present and past customers through a variety of co-branded marketing offers. Wyndham Vacation Ownership’s resort-based sales centers, which are located in popular travel destinations throughout the U.S., generate substantial tour flow through providing local offers. The sales centers enable Wyndham Vacation Ownership to market to tourists already visiting destination areas. Wyndham Vacation Ownership’s marketing agents, which often operate on the premises of the hospitality, entertainment, gaming and retail companies with which Wyndham Vacation Ownership has alliances within these markets, solicit local tourists with offers relating to activities and entertainment in exchange for the tourists visiting the local resorts and attending sales presentations.
An example of a marketing alliance through which Wyndham Vacation Ownership markets to tourists already visiting destination areas is Wyndham Vacation Ownership’s current arrangement with Caesars Entertainment in Las Vegas, Nevada, which enables Wyndham Vacation Ownership to operate concierge-style marketing kiosks throughout select casinos and permits Wyndham Vacation Ownership to solicit patrons to attend tours and sales presentations with casino-related rewards and entertainment offers, such as gaming chips, show tickets and dining certificates. Wyndham Vacation Ownership also operates its primary Las Vegas sales center within Harrah’s Casino and regularly shuttles prospective owners targeted by such sales centers to and from Wyndham Vacation Ownership’s nearby resort property.
Wyndham Vacation Ownership offers a variety of entry-level programs and products as part of its sales strategies. One such program allows prospective owners a one-time allotment of points or credits with no further obligations; another such product is a biennial interest that provides for vacations every other year. As part of its sales strategies, Wyndham Vacation Ownership relies on its points/credits-based programs, which provide prospective owners with the flexibility to buy relatively small packages of points or credits, which can be upgraded at a later date. To facilitate upgrades among existing owners, Wyndham Vacation Ownership markets opportunities for owners to purchase additional points or credits through periodic marketing campaigns and promotions to owners while those owners vacation at Wyndham Vacation Ownership resort properties.
Wyndham Vacation Ownership’s resort-based sales centers also enable Wyndham Vacation Ownership to actively market upgrade sales to existing owners of vacation ownership interests while such owners vacation at Wyndham Vacation Ownership resort properties. In addition, we also operate a telesales program designed to market upgrade sales to existing owners of our products.
During 2011, we deployed a proprietary pre-screening program designed to better estimate the credit worthiness of consumers to whom we market and sell. The program, which is now active at approximately 75% of our off-site marketing locations, enables us to bypass consumers who do not meet our credit standards and eliminate tours that historically have proven unprofitable. We plan to deploy the program at all remaining off-site marketing locations throughout 2012.
Purchaser Financing
Wyndham Vacation Ownership offers financing to purchasers of vacation ownership interests. By offering consumer financing, we are able to reduce the initial cash required by customers to purchase vacation ownership interests, thereby enabling us to attract additional customers and generate substantial incremental revenues and profits. Wyndham Vacation Ownership funds and services loans extended by Wyndham Vacation Resorts and WorldMark by Wyndham through our consumer financing subsidiary, Wyndham Consumer Finance, a wholly owned subsidiary of Wyndham Vacation Resorts based in Las Vegas, Nevada that performs loan financing, servicing and related administrative functions.
Wyndham Vacation Ownership typically performs a credit investigation or other review or inquiry into every purchaser’s credit history before offering to finance a portion of the purchase price of the vacation ownership interest. The interest rate offered to participating purchasers is determined by an automated underwriting based upon the purchaser’s credit score, the amount of the down payment and the size of purchase. Wyndham Vacation Ownership uses a FICO score which is a branded version of a consumer credit score widely used within the U.S. by the largest banks and lending institutions. FICO scores range from 300 – 850 and are calculated based on information obtained from one or more of the three major U.S. credit reporting agencies that compile and report on a consumer’s credit history. Our weighted average FICO score on new originations for 2011, 2010 and 2009 was approximately 725, reflecting an approximate 30 point increase since the Company’s realignment in 2008. Wyndham Vacation Ownership offers purchasers an interest rate reduction if they participate in our pre-authorized checking programs, pursuant to which our consumer financing subsidiary each month debits a purchaser’s bank account or major credit card in the amount of the monthly payment by a pre-authorized fund transfer on the payment date.
During 2011, we generated new receivables of $969 million on gross vacation ownership sales, net of WAAM sales, of $1.5 billion, which amounts to 65% of vacation ownership sales being financed. However, the 65% is prior to the receipt of addenda cash. Addenda cash represents the cash received for full payment of a loan within 15 to 60 days of origination. After the application of addenda cash, approximately 55% of vacation ownership sales are financed, with the remaining 45% being cash sales.
Wyndham Vacation Ownership generally requires a minimum down payment of 10% of the purchase price on all sales of vacation ownership interests and offer consumer financing for the remaining balance for up to ten years. While the minimum is generally 10%, during 2011, our average down payment was approximately 26% for financed sales of vacation ownership interests. These loans are structured so that we receive equal monthly installments that fully amortize the principal due by the final due date.
Similar to other companies that provide consumer financing, we historically securitize a majority of the receivables originated in connection with the sales of vacation ownership interests. We initially place the financed contracts into a revolving warehouse securitization facility generally within 30 to 90 days after origination. Many of the receivables are subsequently transferred from the warehouse securitization facility and placed into term securitization facilities.
Our consumer financing subsidiary is responsible for the maintenance of contract receivables files and all customer service, billing and collection activities related to the domestic loans we extend. We assess the performance of our loan portfolio by monitoring numerous metrics including collections rates, defaults by state residency and bankruptcies. Our consumer financing subsidiary also manages the selection and processing of loans pledged or to be pledged in our warehouse and term securitization facilities. As of December 31, 2011, our loan portfolio was 95.6% current (i.e., not more than 30 days past due).
Property Management
Program, Property Management and Club Management. In exchange for management fees, Wyndham Vacation Resorts, itself or through a Wyndham Vacation Resorts affiliate, manages Club Wyndham Plus, the majority of property owners’ associations at resorts in which Wyndham Vacation Resorts develops, markets and sells vacation ownership interests, and property owners’ associations at resorts developed by third parties. On behalf of Club Wyndham Plus, Wyndham Vacation Resorts or its affiliate manages the reservation system for Club Wyndham Plus and provides owner services and billing and collections services. The term of the trust agreement of Club Wyndham Plus runs through December 31, 2025, and the term is automatically extended for successive ten year periods unless a majority of the members of the program vote to terminate the trust agreement prior to the expiration of the term then in effect. The term of the management agreement, under which Wyndham Vacation Resorts manages the Club Wyndham Plus program, is for five years and is automatically renewed annually.annually for successive terms of five years, provided the trustee under the program does not serve notice of termination to Wyndham Vacation Resorts at the end of any calendar year. On behalf of property owners’ associations, Wyndham Vacation Resorts or its affiliates generally provideday-to-day management for vacation ownership resorts, including oversight of housekeeping services, maintenance and refurbishment of the units, and provides certain accounting and administrative services to property owners’ associations.
We receive fees for such property management services which are generally based upon total costs to operate such resorts. Such fees range generallyFees for property management services typically approximate 10%. of budgeted operating expenses. Property management revenues, which are comprised of management fee revenue and reimbursable revenue, were $424 million, $405 million and $376 million, during 2011, 2010 and 2009, respectively. Management fee revenues were $198 million, $183 million and $170 million during 2011, 2010 and 2009, respectively. Reimbursable revenues, which are based upon certain reimbursable costs with no added margin, were $226 million, $222 million and $206 million, respectively, during 2011, 2010 and 2009. These reimbursable costs principally relate to the payroll costs for management of the associations, club and resort properties where we are the employer and are reflected as a component of operating expenses on the Consolidated Statements of Income. The terms of the property management agreements with the property
owners’ associations at resorts in which Wyndham Vacation Resorts develops, markets and sells vacation ownership interests vary; however, the vast majority of the agreements provide a mechanism for automatic renewal upon expiration of the terms. At some established sites, the property owners’ associations have entered into property management agreements with professional management companies other than Wyndham Vacation Resorts or its affiliates.
In exchange for management fees, WorldMark by Wyndham, itself or through a WorldMark by Wyndham affiliate, serves as the exclusive property manager and servicing agent of the Clubs and all resort units owned or operated by the Clubs. On behalf of the Clubs, WorldMark by Wyndham or its affiliate providesday-to-day management for vacation ownership resorts, including oversight of housekeeping services, maintenance and refurbishment of the units, and provides certain accounting and administrative services. WorldMark by Wyndham or its affiliate also manages the reservation system for the Clubs and provides owner services and billing and collections services.
Sales and Marketing Channels and ProgramsStrategies
Wyndham Vacation Ownership employs a varietyis strategically focused on the following objectives that we believe are essential to our business:
maximize cash flow;
further strengthening the financial profile of marketing channelsthe business through the continued development of alternative business models, such as part of Wyndham Vacation Resorts and WorldMark by Wyndham marketing programs to encourage prospective owners of vacation ownership interests to tour Wyndham Vacation Ownership properties and attendWAAM;
drive greater sales presentations at off-site sales offices. Our resort-based sales centers also enable us to actively solicit upgrade sales to existing owners of vacation ownership interests while such owners vacation at our resort properties. Sales of vacation ownership interests relating to upgrades represented approximately 64%, 51% and 44% of our net sales of vacation ownership interests during 2009, 2008 and 2007, respectively.
delivering “Count On Me!” service to our customers, partners and with other third parties at other high-traffic consumer events. Where permissible under state law, Wyndham Vacation Ownership offers existing owners cash awards or other incentives for referrals of new owners.
21
22
WAAM.We also plan to continueexpand our efforts to develop afee-for-service timeshare sales model designed to capitalize upon the large quantities of newly developed, nearly completed or recently finished condominium or hotel inventory within the current real estate market without assuming the significant cost that accompanies new construction. TheThis business model which we call the Wyndham Asset Affiliation Model (WAAM), will offeroffers turn-key solutions for developers or banks in possession of newly developed inventory, which we will sell for a fee through our extensive sales and marketing channels. This model may enableWAAM enables us to expand our resort portfolio with little or nono` capital deployment, while providing additional channels for new owner acquisition and growth for ourfee-for-service property management business.
In addition to our original WAAM business model, and in keeping with our efforts to leverage the abundance of already developed inventory while minimizing our use of capital, we are also pursuing an enhancement which we refer to as WAAM 2.0. This strategy will enable us to acquire and own completed units close to the timing of the sales of these units and will significantly reduce the period between the deployment of capital to acquire inventory and the subsequent return on investment which occurs at the time of its sale to a timeshare purchaser. Inventory will be recorded on our balance sheet at the time of registration. In connection with the sale of the VOI, we will pay for the inventory sold and offer the purchaser the option of financing with us.
WAAM 2.0 will enable us to expand our resort portfolio with minimal upfront capital investment, while providing additional channels for new owner acquisition and growth for our fee-for-service consumer financing, servicing operations and property management business.
During 2010, we commenced sales in connection with two WAAM projects — one in South Carolina and another in Florida and in early 2011, we signed two additional WAAM projects — one in Vermont and another on the Florida Gulf coast. In 2011, we had $106 million in WAAM sales which represents 7% of gross VOI sales. We expect to have WAAM sales of approximately 15% to 20% of gross VOI sales within the next several years.
Drive Greater Sales and Marketing Efficiency.Efficiency and Strengthen New Owner Channels. We plan to drive greater sales and marketing efficiencies by aggressively applying our strengthened tour qualification standards, primarily through our proprietary pre-screening program designed to estimate the usecredit worthiness of a proprietary lead screening model in orderthe consumers to whom we market and sell. We expect to thus limit our marketing activities to only the highest quality prospects both in terms of such persons’ interest in purchasing our products and their demonstrated ability to self-financeand/or qualify for our more restrictive financing terms.
We will continue to focus a large portion of our efforts on current owners, who are our most efficient and reliable marketing prospect,prospects and the most efficient from a marketing standpoint, as well as highly qualified prospect categories including certain existing Wyndham Hotel Group customers and consumers affiliated with the Wyndham Rewards loyalty programs. We are also focusing our efforts on new owner acquisition as this will continue to maintain our pool of “lifetime” buyers of vacation ownership. We believe this market is underpenetrated and Wyndham By Request loyalty programs, for example. estimate there are 53 million U.S. households which we consider as potential purchasers of vacation ownership interests. We added approximately 27,000 and 22,000 new owners during 2011 and 2010, respectively, to our pool of “lifetime” buyers who may ultimately become repeat buyers of vacation ownership interests if they upgrade.
We will also seek to develop and market mixed-use hotel and vacation ownership properties in conjunction with the Wyndham brand. The mixed-use properties would afford us access to both hotel clients in higher income demographics for the purpose of marketing vacation ownership interests and hotel inventory for use in our marketing programs.
Delivering “Count On Me!” Service.Wyndham Vacation Ownership is committed to providing exceptional customer service to its owners and guests at every interaction. We consistently monitor our progress by inviting service feedback at key customer touch points, including point of sale, post-vacation experience, and annual owner surveys, which gauge service performance in a variety of areas and identify improvement opportunities. The Company service culture also extends to associates, who are committed to be responsive, be respectful, and to deliver a great experience to owners, guests, partners, our communities and each other.
Seasonality
We rely, in part, upon tour flow to generate sales of vacation ownership interests; consequently, sales volume tends to increase in the spring and summer months as a result of greater tour flow from spring and summer travelers. Revenues from sales of vacation ownership interests therefore are generally higher in the second and third quarters than in other quarters. We cannot predict whether these seasonal trends will continue in the future.
Competition
The vacation ownership industry is highly competitive and is comprised of a number of companies specializing primarily in sales and marketing, consumer financing, property management and development of vacation ownership properties. In addition, a number of national hospitality chains develop and sell vacation ownership interests to consumers.
TrademarksTRADEMARKS
Our brand names and related trademarks, andservice marks, logos and such trademarks and logostrade names are materialvery important to the businesses that are part ofmake up our vacation ownership business.Wyndham Hotel Group, Wyndham Exchange & Rentals, and Wyndham Vacation Ownership business units. Our subsidiaries actively use theseor license for use all significant marks, and all ofwe own or have exclusive licenses to use these marks. We register the material marks are registered (or have applications pending) withthat we own in the U.S.United States Patent and Trademark Office, as well as with theother relevant authorities in major countries worldwide where these businesses have significant operations. We own the “WorldMark” trademark pursuantwe deem appropriate, and seek to an assignment agreement with WorldMark, The Club. Pursuant to the assignment agreement, WorldMark, The Club may request that the mark be reassigned to it only in the event of a termination of the WorldMark vacation ownership programs.
EMPLOYEES
As of December 31, 2009,2011, we had approximately 24,60027,800 employees, including approximately 7,8008,200 employees outside of the U.S. As of December 31, 2009,2011, our lodging business had approximately 4,2004,300 employees, our vacation exchange and rentals business had approximately 7,4009,300 employees, our vacation ownership business had approximately 13,700 employees and our vacation ownership business
23
ENVIRONMENTAL COMPLIANCE
Our compliance with laws and regulations relating to environmental protection and discharge of hazardous materials has not had a material impact on our capital expenditures, earnings or competitive position, and we do not anticipate any material impact from such compliance in the future.
| ITEM 1A. | RISK FACTORS |
Before you invest in our securities you should carefully consider each of the following risk factors and all of the other information provided in this report. We believe that the following information identifies the most significant risk factors affectingrisks that may impact us. However, the risks and uncertainties we face are not limited to those set forth in the risk factors described below. Additional risks and uncertainties not presently known to us or that we currently believe to be immaterial may also adversely affect our business. In addition, past financial performance may not be a reliable indicator of future performance and historical trends should not be used to anticipate results or trends in future periods.
The hospitality industry is highly competitive and we are subject to risks relating to competition that may adversely affect our performance.
We will be adversely impacted if we cannot compete effectively in the highly competitive hospitality industry. Our continued success depends upon our ability to compete effectively in markets that contain numerous competitors, some of which may have significantly greater financial, marketing and other resources than we have. Competition may reduce fee structures, potentially causing us to lower our fees or prices, which may adversely impact our profits. New competition or existing competition that uses a business model that is different from our business model may put pressure on us to change our model so that we can remain competitive.
Our revenues are highly dependent on the travel industry and declines in or disruptions to the travel industry, such as those caused by economic slowdown, terrorism, political strife, acts of God and war may adversely affect us.
Declines in or disruptions to the travel industry may adversely impact us. Risks affecting the travel industry include: economic slowdown and recession; economic factors, such as increased costs of living and reduced discretionary income, adversely impacting consumers’ and businesses’ decisions to use and consume travel services and products; terrorist incidents and threats (and associated heightened travel security measures); political strife; acts of God (such as earthquakes, hurricanes, fires, floods, volcanoes and other natural disasters); war; pandemics or threat of pandemics (such as the H1N1 flu); environmental disasters (such as the Gulf of Mexico oil spill); increased pricing, financial instability and capacity constraints of air carriers; airline job actions and strikes; and increases in gasoline and other fuel prices.
We are subject to operating or other risks common to the hospitality industry.
Our business is subject to numerous operating or other risks common to the hospitality industry including:
changes in operating costs, including inflation, energy, labor costs (including minimum wage increases and unionization), workers’ compensation and health-care related costs and insurance;
changes in desirability of geographic regions of the hotels or resorts in our business;
24
changes in the supply and demand for hotel rooms, vacation exchange and rental services and vacation ownership services and products;
seasonality in our businesses, which may cause fluctuations in our operating results;
geographic concentrations of our operations and customers;
increases in costs due to inflation that may not be fully offset by price and fee increases in our business;
availability of acceptable financing and cost of capital as they apply to us, our customers, current and potential hotel franchisees and developers, owners of hotels with which we have hotel management contracts, our RCI affiliates and other developers of vacation ownership resorts;
our ability to securitize the receivables that we originate in connection with sales of vacation ownership interests;
the risk that purchasers of vacation ownership interests who finance a portion of the purchase price default on their loans due to adverse macro or personal economic conditions or otherwise, which would increase loan loss reserves and adversely affect loan portfolio performance; that if such defaults occur during the early part of the loan amortization period we will not have recovered the marketing, selling, administrative and other costs associated with such vacation ownership interests; such costs will be incurred again in connection with the resale of the repossessed vacation ownership interest; and the value we recover in a default is not, in all instances, sufficient to cover the outstanding debt;
the quality of the services provided by franchisees, our vacation exchange and rentals business, resorts with units that are exchanged through our vacation exchange business and/or resorts in which we sell vacation ownership interests may adversely affect our image and reputation;
our ability to generate sufficient cash to buy from third-party suppliers the products that we need to provide to the participants in our points programs who want to redeem points for such products;
overbuilding in one or more segments of the hospitality industry and/or in one or more geographic regions;
changes in the number and occupancy and room rates of hotels operating under franchise and management agreements;
changes in the relative mix of franchised hotels in the various lodging industry price categories;
our ability to develop and maintain positive relations and contractual arrangements with current and potential franchisees, hotel owners, vacation exchange members, vacation ownership interest owners, resorts with units that are exchanged through our vacation exchange business and/or owners of vacation properties that our vacation rentals business markets for rental;
the availability of and competition for desirable sites for the development of vacation ownership properties; difficulties associated with obtaining entitlements to develop vacation ownership properties; liability under state and local laws with respect to any construction defects in the vacation ownership properties we develop; and our ability to adjust our pace of completion of resort development relative to the pace of our sales of the underlying vacation ownership interests;
our ability to adjust our business model to generate greater cash flow and require less capital expenditures;
private resale of vacation ownership interests, which could adversely affect our vacation ownership resorts and vacation exchange businesses;
revenues from our lodging business are indirectly affected by our franchisees’ pricing decisions;
organized labor activities and associated litigation;
maintenance and infringement of our intellectual property;
the bankruptcy or insolvency of any one of our customers, which could impair our ability to collect outstanding fees or other amounts due or otherwise exercise our contractual rights;
franchisees that have development advance notes with us may experience financial difficulties;
increases in the use of third-party Internet services to book online hotel reservations; and
disruptions in relationships with third parties, including marketing alliances and affiliations with e-commerce channels.
We may not be able to achieve our growth objectives.
We may not be able to achieve our growth objectives for increasing our cash flows, the number of franchisedand/or managed properties in our lodging business, the number of vacation exchange members acquired byin our vacation exchange business, the number of rental weeks sold by our vacation rentals business and the number of quality tours generated and vacation ownership interests sold by our vacation ownership business.
25
Our international operations are subject to risks not generally applicable to our domestic operations.
Our international operations are subject to numerous risks including:including exposure to local economic conditions; potential adverse changes in the diplomatic relations of foreign countries with the United States;U.S.; hostility from local populations; restrictions and taxes on the withdrawal of foreign investment and earnings; government policies against businesses owned by foreigners; investment restrictions or requirements; diminished ability to legally enforce our contractual rights in foreign countries; foreign exchange restrictions; fluctuations in foreign currency exchange rates; local laws might conflict with U.S. laws; withholding and other taxes on remittances and other payments by subsidiaries; and changes in and application of foreign taxation structures including value addedvalue-added taxes.
Any adverse outcome resulting from the financial instability within certain European economies and the related volatility on foreign exchange and interest rates could have an effect on our results of operations, financial position or cash flows.
We are subject to risks related to litigation filed by or against us.
We are subject to a number of legal actions and the risk of future litigation as described under “Legal Proceedings”. We cannot predict with certainty the ultimate outcome and related damages and costs of litigation and other proceedings filed by or against us. Adverse results in litigation and other proceedings may harm our business.
We are subject to certain risks related to our indebtedness, hedging transactions, our securitization of certain of our assets, our surety bond requirements, the cost and availability of capital and the extension of credit by us.
We are a borrower of funds under our credit facilities, credit lines, senior notes and securitization financings. We extend credit when we finance purchases of vacation ownership interests.interests and in instances when we provide key money, development advance notes and mezzanine or other forms of subordinated financing to assist franchisees and hotel owners in converting to or building a new hotel branded under one of our Wyndham Hotel Group brands. We use financial instruments to reduce or hedge our financial exposure to the effects of currency and interest rate fluctuations. We are required to post surety bonds in connection with our development activities. In connection with our debt obligations, hedging transactions, the securitization of certain of our assets, our surety bond requirements, the cost and availability of capital and the extension of credit by us, we are subject to numerous risks including:
our cash flows from operations or available lines of credit may be insufficient to meet required payments of principal and interest, which could result in a default and acceleration of the underlying debt;
if we are unable to comply with the terms of the financial covenants under our revolving credit facility, including a breach of the financial ratios or tests, such non-compliance could result in a default and acceleration of the underlying revolver debt and under other debt instruments that contain cross-default provisions;
our leverage may adversely affect our ability to obtain additional financing; our leverage may require the dedication of a significant portion of our cash flows to the payment of principal and interest thus reducing the availability of cash flows to fund working capital, capital expenditures or other operating needs; increases in interest rates; rating agency downgrades for our debt that could increase our borrowing costs; failure or non-performance of counterparties to foreign exchange and interest rate hedging transactions; we may not be able to securitize our vacation ownership contract receivables on terms acceptable to us because of, among other factors, the performance of the vacation ownership contract receivables, adverse | |
26
our securitizations contain portfolio performance triggers which, if violated, may result in a disruption or loss of cash flow from such transactions;
a reduction in commitments from surety bond providers which may impair our vacation ownership business by requiring us to escrow cash in order to meet regulatory requirements of certain states;
prohibitive cost and inadequate availability of capital could restrict the development or acquisition of vacation ownership resorts by us and the financing of purchases of vacation ownership interests;
the inability of hotel owners that have received mezzanine loans from us to pay back such loans; and
if interest rates increase significantly, we may not be able to increase the interest rate offered to finance purchases of vacation ownership interests by the same amount of the increase.
Economic conditions affecting the hospitality industry, and in the global economy generally, including ongoing disruptions in the debt and equity capitalcredit markets generally may adversely affect our business and results of operations, our ability to obtain financingand/or securitize our receivables on reasonable and acceptable terms, the performance of our loan portfolio and the market price of our common stock.
The global economy is currently undergoing a recession, and the future economic environment for the hospitality industry and the global economy may continue to be less favorable than that of recent years.challenged. The hospitality industry has experienced and may continue to experience significant downturns in connection with, or in anticipation of, declines in general economic conditions. The current economic downturneconomy has been characterized by higher unemployment, lower family income, lower corporate earnings, lower business investment and lower consumer spending, leading to lower demand for hospitality productsservices and services.products. Declines in consumer and commercial spending may adversely affect our revenues and profits. We are unable to predict the likely duration and severity of the current adverse economic conditions and disruptions in debt, equity and asset-backed securities markets
Uncertainty in the United States and other countries.
While we believe we have adequate sources of liquidity to meet our anticipated requirements for fixed incomeworking capital, debt service and asset-backed securities has experienced decreased liquidity, increased price volatility, credit downgrade events, and increased defaults. These factors andcapital expenditures for the continuing market disruption have an adverse effect on us, in part because we, like many public companies, from time to time raise capital in debt, equity and asset-backed securities markets.
Our liquidity as it relates to our vacation ownership contract receivables securitization program could be adversely affected if we were to fail to renew or replace any of the facilitiesour securitization warehouse conduit facility on theirits renewal datesdate or if a particular receivables pool were to fail to meet certain ratios, which could occur in certain instances if the default rates or other credit metrics of the underlying vacation ownership contract receivables deteriorate. Our ability to sell securities backed by our vacation ownership contract receivables depends on the continued ability and willingness of capital market participants to invest in such securities. Our ability to engage in securitization transactions on favorable terms or at all has been adversely affected by the disruptions in the capital markets and other events, including actions by rating agencies and deteriorating investor expectations. It is possible that asset-backed securities issued pursuant to our securitization programs could in the future be downgraded by credit agencies. If a downgrade occurs, our ability to complete other securitization transactions on acceptable terms or at all could be jeopardized, and we could be forced to rely on other potentially more expensive and less attractive funding sources, to the extent available, which would decrease our profitability and may require us to adjust our business operations accordingly, including reducing or suspending our financing to purchasers of vacation ownership interests.
Our businesses are subject to extensive regulation and the cost of compliance or failure to comply with such regulations may adversely affect us.
Our businesses are heavily regulated by federal, state and local governments in the countries in which our operations are conducted. In addition, domestic and foreign federal, state and local regulators may enact new laws and regulations that may reduce our revenues, cause our expenses to increaseand/or require us to modify substantially our business practices. If we are not in substantial compliance with applicable laws and regulations,
27 including,
We are subject to risks related to corporate responsibility.
Many factors influence our reputation and the value of our brands including perceptions of us held by our key stakeholders and the communities in which we do business. Businesses face increasing scrutiny of the social and environmental impact of their actions and there is a risk of damage to our reputation and the value of our brands if we fail to act responsibly or comply with regulatory requirements in a number of areas such as safety and security, sustainability, responsible tourism, environmental management, human rights and support for local communities.
We are dependent on our senior management.
We believe that our future growth depends, in part, on the continued services of our senior management team. Losing the services of any members of our senior management team could adversely affect our strategic and customer relationships and impede our ability to execute our business strategies.
Our inability to adequately protect and maintain our intellectual property could adversely affect our business.
Our inability to adequately protect and maintain our trademarks, trade dress and other intellectual property rights could adversely affect our business. We generate, maintain, utilize and enforce a substantial portfolio of trademarks, trade dress and other intellectual property that are fundamental to the brands that we use in all of our businesses. There can be no assurance that the steps we take to protect our intellectual property will be adequate. Any event that materially damages the reputation of one or more of our brands could have an adverse impact on the value of that brand and subsequent revenues from that brand. The value of any brand is influenced by a number of factors, including consumer preference and perception and our failure to ensure compliance with brand standards.
DisruptionsDisasters, disruptions and other impairment of our information technologies and systems could adversely affect our business.
Any disaster, disruption or other impairment in our technology capabilities could harm our business. Our businesses depend upon the use of sophisticated information technologies and systems, including technology and systems utilized for reservation systems, vacation exchange systems, hotel/property management, communications, procurement, member record databases, call centers, operation of our loyalty programs and administrative systems. The operation, maintenance and updating of these technologies and systems isare dependent upon internal and third-party technologies, systems and services for which there isare no assuranceassurances of uninterrupted availability or adequate protection.
Failure to maintain the security of personally identifiable and other information, non-compliance with our contractual or other legal obligations regarding such information, or a violation of the Company’s privacy and security policies with respect to such information, could adversely affect us.
In connection with our business, we and our service providers collect and retain significant volumes of certain types of personally identifiable information, including credit card numbers of our customers and other personally identifiable information ofpertaining to our customers, stockholders and employees. Our customers, stockholdersThe legal, regulatory and employees expect that we will adequately protect their personal information, and the regulatorycontractual environment surrounding information security and privacy is increasingly demanding, both
constantly evolving and the hospitality industry is under increasing attack by cyber-criminals in the United StatesU.S. and other jurisdictions in which we operate. A significant actual or potential theft, loss, fraudulent use or fraudulent usemisuse of customer, stockholder, employee or Companyour data by cybercrime or otherwise, non-compliance with our contractual or other legal obligations regarding such data or a violation of our privacy and security policies with respect to such data could adversely impact our reputation and could result in significant costs, fines, and litigation.
The market price of our shares may fluctuate.
The market price of our common stock may fluctuate depending upon many factors, some of which may be beyond our control, including:including our quarterly or annual earnings or those of other companies in our industry; actual or anticipated fluctuations in our operating results due to seasonality and other factors related to our business; changes in accounting principles or rules; announcements by us or our competitors of significant acquisitions or dispositions; the failure of securities analysts to cover our common stock; changes in earnings estimates by securities analysts or our ability to meet those estimates; the operating and stock price performance of comparable companies; overall market fluctuations; and general economic conditions. Stock markets in general have experienced volatility that has often been unrelated to the operating performance of a particular company. These broad market fluctuations may adversely affect the trading price of our common stock.
Your percentage ownership in Wyndham Worldwide may be diluted in the future.
Your percentage ownership in Wyndham Worldwide may be diluted in the future because of equity awards that we expect will be granted over time to our directors, officers and employees as well as due to the exercise of options issued.options. In addition, our Board may issue shares of our common and preferred stock, and debt securities convertible into shares of our common and preferred stock, up to certain regulatory thresholds without shareholder approval.
28
Our certificate of incorporation and by-laws and Delaware law contain provisions that are intended to deter coercive takeover practices and inadequate takeover bids by making such practices or bids unacceptably expensive and to encourage prospective acquirorsacquirers to negotiate with our Board rather than to attempt a hostile takeover. These provisions include:include a Board of Directors that is divided into three classes with staggered terms; elimination of the right of our stockholders to act by written consent; rules regarding how stockholders may present proposals or nominate directors for election at stockholder meetings; the right of our Board to issue preferred stock without stockholder approval; and limitations on the right of stockholders to remove directors. Delaware law also imposes restrictions on mergers and other business combinations between us and any holder of 15% or more of our outstanding shares of common stock.
We cannot provide assurance that we will continue to pay dividends.
There can be no assurance that we will have sufficient surplus under Delaware law to be able to continue to pay dividends. This may result from extraordinary cash expenses, actual expenses exceeding contemplated costs, funding of capital expenditures, increases in reserves or lack of available capital. Our Board of Directors may also suspend the payment of dividends if the Board deems such action to be in the best interests of the Company or stockholders. If we do not pay dividends, the price of our common stock must appreciate for you to realize a gain on your investment in Wyndham Worldwide. This appreciation may not occur and our stock may in fact depreciate in value.
We are responsible for certain of Cendant’s contingent and other corporate liabilities.
Under the separation agreement and the tax sharing agreement that we executed with Cendant (now Avis Budget Group) and former Cendant units, Realogy and Travelport, we and Realogy generally are responsible for 37.5% and 62.5%, respectively, of certain of Cendant’s contingent and other corporate liabilities and associated costs, including taxes imposed on Cendant and certain other subsidiaries and certain contingent and other corporate liabilities of Cendantand/or its subsidiaries to the extent incurred on or prior to August 23, 2006, including liabilities relating to certain of Cendant’s terminated or divested businesses, the Travelport sale, the Cendant litigation described in this report, under “Cendant Litigation,” actions with respect to the separation plan and payments under certain contracts that were not allocated to any specific party in connection with the separation. In addition, each of us, Cendant, and Realogy may be responsible for 100% of certain of Cendant’s tax liabilities that will provide the responsible party with a future, offsetting tax benefit.
If any party responsible for the liabilities described above were to default on its obligations, each non-defaulting party (including Avis Budget) would be required to pay an equal portion of the amounts in default. Accordingly, we could, under certain circumstances, be obligated to pay amounts in excess of our share of the assumed obligations related to such liabilities including associated costs. On or about April 10, 2007, Realogy Corporation was acquired by affiliates of Apollo Management VI, L.P. and its stock is no longer publicly traded. The acquisition does not negate Realogy’s obligation to satisfy 62.5% of such contingent and other corporate liabilities of Cendant or its subsidiaries pursuant to the terms of the separation agreement. As a result of the acquisition, however, Realogy has greater debt obligations and its ability to satisfy its portion of these liabilities may be adversely impacted. In accordance with the terms of the separation agreement, Realogy posted a letter of credit in April 2007 for our and Cendant’s benefit to cover its estimated share of the assumed liabilities discussed above, although there can be no assurance that such letter of credit will be sufficient to cover Realogy’s actual obligations if and when they arise.
29
Under generally accepted accounting principles, we review our intangible assets, including goodwill, for impairment at least annually or when events or changes in circumstances indicate the carrying value may not be recoverable. Factors that may be considered a change in circumstances, indicating that the carrying value of our goodwill or other intangible assets may not be recoverable, include a sustained decline in our stock price and market capitalization, reduced future cash flow estimates and slower growth rates in our industry. We may be required to record a significant non-cash impairment charge in our financial statements during the period in which any impairment of our goodwill or other intangible assets is determined, negatively impacting our results of operations and stockholders’ equity.
| ITEM 1B. | UNRESOLVED STAFF COMMENTS |
None.
| ITEM 2. | PROPERTIES |
Our corporate headquarters is located in a leased office at 22 Sylvan Way in Parsippany, New Jersey, which lease expires in 2024. We also lease another Parsippany-based office, which lease expires in 2011. We have a leased office in Virginia Beach, Virginia for our Employee Service Center, which lease expires in 2014.
Wyndham Hotel Group
The main corporate operations of our lodging business shares office space at a building leased by Corporate ServicesWyndham in Parsippany, New Jersey. Our lodging business also leases space for its reservations centersand/or data warehouses in Aberdeen, South Dakota; Phoenix, Arizona; and Saint John, New Brunswick, CanadaCanada: and Aberdeen, South Dakota pursuant to leases that expire in 2016, 2011,2012, 2013 and 2013,2016, respectively. In addition, our lodging business leases office space in Beijing, China expiring in 2012; Hong Kong, China expiring in 2010; Beijing, China expiring in 2010,2013; Shanghai, China expiring in 2010,2013; Bangkok, Thailand expiring in 2012; Singapore expiring in 2012; Gurgaon, India expiring in 2012; London,
United Kingdom expiring in 2012;2021; Dubai, UAE, expiring in 2012,2012; Miramichi, New Brunswick, Canada expiring in 2013; Mission Viejo, California expiring in 2013; Oakland Park, Florida expiring in 2015; Atlanta, Georgia expiring in 2015; Rosemont, Illinois expiring in 2015; and Dallas, Texas expiring in 2013; Mission Viejo, CA expiring in 2013; and Rosemont, Illinois expiring in 2015.2013. All leases that are due to expire in 20102012 are presently under review related to our ongoing requirements.
Wyndham Exchange and& Rentals
Our vacation exchange and rentalrentals business has its main corporate operations at a leased office in Parsippany, New Jersey, which lease expireshas been extended on a month to month basis, until such time as we move into a new leased facility which is currently under construction in 2011.Parsippany, New Jersey with estimated completion in 2013 and a lease term through 2028. Our vacation exchange business also owns five properties located in the following cities: Carmel, Indiana; Cork, Ireland; Kettering, United Kingdom; Mexico City, Mexico; and Albufeira, Portugal. Our vacation exchange business also has one other leased office located within the United StatesU.S. pursuant to a lease that expires in 2014 and 2724 additional leased spaces in various countries outside the United StatesU.S. pursuant to leases that expire generally between 1 and 3 years except for 35 leases that expire between 20132015 and 2020. Our vacation rentals business’ operations are managed in onetwenty-two owned locations (United Kingdom locations in Earby, Lowestoft and Maidstone; Denmark locations in Fano, Hvide Sande, Romo, Sondervig and Varde; an Italy location (Earby, United Kingdom)in Monteriggioni; and threeU.S. locations in Breckenridge, Colorado; Steamboat Springs, Colorado; Seacrest Beach, Florida; Santa Rosa Beach, Florida; Miramar Beach, Florida; Destin, Florida; Kissimmee, Florida; Davenport, Florida; and Hilton Head, South Carolina) and four main leased locations pursuant to leases that expire in 2015, 2012 (Hellerup, Denmark and 2010, (Leidschendam, Netherlands; Dunfermline, United Kingdom;Kingdom), 2015 (Leidschendam, Netherlands) and Hellerup, Denmark, respectively)2021 (Fort Walton Beach, Florida in the U.S.) as well as six smaller owned offices and 42111 smaller leased offices throughout Europe.Europe and the U.S. The vacation exchange and rentals business also occupies space in London, United Kingdom pursuant to a lease that expires in 2012.
Wyndham Vacation Ownership
Our vacation ownership business has its main corporate operations in Orlando, Florida pursuant to several leases, which expire beginning 2012.2012 and will be consolidated into a single new office with a lease expiring in 2025. Our vacation ownership business also owns a contact center facility in Redmond, Washington as well as leasedleases space in Springfield, Missouri and Las Vegas, Nevada and Orlando, Florida with various expiration dates for this same function. Our vacation ownership business leases space for administrative functions in Redmond, Washington expiring in 2013; various locations in Las Vegas, Nevada expiring between 2010 and 2017; and Margate, Florida expiring in 2010.2018. In addition, the vacation ownership business leases approximately 8074 marketing and sales offices, of which approximately 7166 are throughout the United StatesU.S. with various expiration dates, and 98 offices are in Australia expiring within approximately two years. All leases that are due to expirebetween 2013 and 2015, with the exception of the main corporate operations in 2010 are presently under review related to our ongoing requirements.
| ITEM 3. | LEGAL PROCEEDINGS |
We are involved in various claims and lawsuits arising in the ordinary course of business, none of which, in the opinion of management, is expected to have a material effect on our results of operations or financial condition. See Note 17 to the Consolidated Financial Statements for a description of claims and legal actions arising in the ordinary course of our business including but not limited to:and Note 23 to the Consolidated Financial Statements for our lodging business — breach of contract, fraud and bad faith claims between franchisors and franchisees in connection with franchise agreements and with owners in connection with management contracts, as
30
PART II
| ITEM 5. | MARKET FOR REGISTRANT’S COMMON EQUITY, RELATED STOCKHOLDER MATTERS AND ISSUER PURCHASES OF EQUITY SECURITIES |
Market Price of Common Stock
Our common stock is listed on the New York Stock Exchange (“NYSE”) under the symbol “WYN”. AtAs of January 31, 2010,2012, the number of stockholders of record was 6,453.7,232. The following table sets forth the quarterly high and low closing sales prices per share of WYN common stock as reported by the NYSE for the years ended December 31, 20092011 and 2008.
| 2009 | High | Low | ||||||
| First Quarter | $ | 8.71 | $ | 2.92 | ||||
| Second Quarter | 12.90 | 4.75 | ||||||
| Third Quarter | 16.32 | 10.51 | ||||||
| Fourth Quarter | 21.20 | 15.45 | ||||||
| 2008 | High | Low | ||||||
| First Quarter | $ | 24.94 | $ | 19.25 | ||||
| Second Quarter | 24.21 | 17.91 | ||||||
| Third Quarter | 20.55 | 14.88 | ||||||
| Fourth Quarter | 15.29 | 2.98 | ||||||
2011 | High | Low | ||||||
First Quarter | $ | 32.13 | $ | 28.13 | ||||
Second Quarter | 34.97 | 30.78 | ||||||
Third Quarter | 35.40 | 25.38 | ||||||
Fourth Quarter | 38.09 | 26.92 | ||||||
2010 | High | Low | ||||||
First Quarter | $ | 25.94 | $ | 20.28 | ||||
Second Quarter | 27.59 | 20.14 | ||||||
Third Quarter | 28.27 | 20.12 | ||||||
Fourth Quarter | 31.08 | 27.32 | ||||||
Dividend Policy
During 2009,2011 and 2010, we paid a quarterly dividend of $0.04$0.15 and $0.12, respectively, per share on each share of Common Stock issued and outstanding on the record date for the applicable dividend. During February 2010,2012, our Board of Directors authorized an increase of future quarterly dividends to $0.12$0.23 per share beginning with the dividend that is expected to be declared during the first quarter of 2010.2012. Our dividend payout ratio is now approximately 30% with a 2% dividend yield.32% of the midpoint of our estimated 2012 net income after certain adjustments. Our dividend policy for the future will beis to grow our dividend at least mirrorat the rate of growth of our business.earnings. The declaration and payment of future dividends to holders of our common stock will beare at the discretion of our Board of Directors and will depend upon many factors, including our financial condition, earnings, capital requirements of our business, covenants associated with certain debt obligations, legal requirements, regulatory constraints, industry practice and other factors that our Board deems relevant. There can be no assurance that a payment of a dividend will or will not occur in the future.
31
Below is a summary of our Wyndham Worldwide common stock repurchases by month for the quarter ended December 31, 2011:
| ISSUER PURCHASES OF EQUITY SECURITIES | ||||||||||||||||
| Period | Total Number of Shares Purchased | Average Price Paid per Share | Total Number of Shares Purchased as Part of Publicly Announced Plan | Approximate Dollar Value of Shares that May Yet Be Purchased Under the Publicly Announced Plan | ||||||||||||
October 1 – 31, 2011 | 1,588,753 | $ | 29.90 | 1,588,753 | $ | 544,814,120 | ||||||||||
November 1 – 30, 2011 | 2,039,937 | 33.46 | 2,039,937 | 476,564,358 | ||||||||||||
December 1 – 31, 2011(*) | 3,036,900 | 36.02 | 3,036,900 | 367,261,969 | ||||||||||||
Total | 6,665,590 | $ | 33.78 | 6,665,590 | $ | 367,261,969 | ||||||||||
| (*) | Includes 316,000 shares purchased for which the trade date occurred during December 2011 while settlement occurred during January 2012. |
We expect to generate annual net cash provided by operating activities less capital expenditures, equity investments and development advances in the range of approximately $600 million to $700 million in 2012. A portion of this cash flow is expected to be returned to our shareholders in the form of share repurchases and dividends. On August 20, 2007, our Board of Directors authorized a stock repurchase program that enablesenabled us to purchase up to $200 million of our common stock. We suspendedOn July 22, 2010, the Board increased the authorization for the stock repurchase program by $300 million and, on both April 25, 2011 and August 11, 2011, further increased the authorization by $500 million. As a result of such increases, total authorization under the program during the third quarterwas $1.5 billion as of 2008. On February 10, 2010, we announced our plan to resume repurchases of our common stock under such program.
During the period January 1, 2012 through February 16, 2012, we repurchased an additional 2 million shares at an average price of $40.04 for a cost of $79 million. We currently have $295 million remaining availability in our program. The amount and timing of specific repurchases are subject to market conditions, applicable legal requirements and other factors. Repurchases may be conducted in the open market or in privately negotiated transactions.
32
The Stock Performance Graph is not deemed filed with the Commission and shall not be deemed incorporated by reference into any of our prior or future filings made with the Commission.
The following line graph compares the cumulative total stockholder return of our common stock against the S&P 500 Index and the S&P Hotels, Resorts & Cruise Lines Index (consisting of Carnival plc, Marriott International Inc., Starwood Hotels & Resorts Worldwide, Inc. and Wyndham Worldwide Corporation) and a peer group (consisting of Marriott International Inc., Choice Hotels International, Inc. and Starwood Hotels & Resorts Worldwide, Inc.) for the period from August 1,December 31, 2006 to December 31, 2009.2011. The graph assumes that $100 was invested on August 1,December 31, 2006 and all dividends and other distributions were reinvested.
| Cumulative Total Return | ||||||||||||||||||||
| 8/06 | 12/06 | 12/07 | 12/08 | 12/09 | ||||||||||||||||
| Wyndham Worldwide Corporation | $ | 100.00 | $ | 100.53 | $ | 74.17 | $ | 20.96 | $ | 65.80 | ||||||||||
| S&P 500 Index | 100.00 | 112.05 | 118.21 | 74.47 | 94.18 | |||||||||||||||
| S&P Hotels, Resorts & Cruise Lines Index | 100.00 | 126.79 | 111.05 | 57.61 | 89.79 | |||||||||||||||
| Peer Group | 100.00 | 125.49 | 91.19 | 50.45 | 77.82 | |||||||||||||||
33
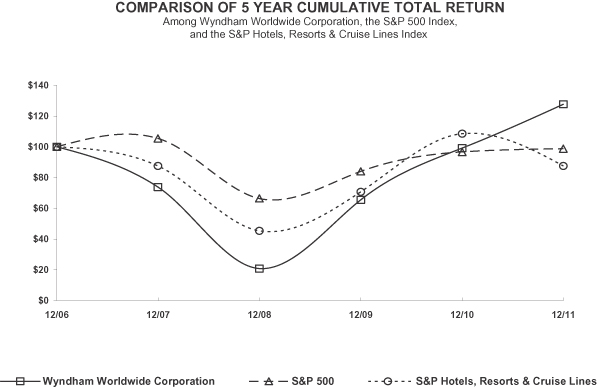
| 12/06 | 12/07 | 12/08 | 12/09 | 12/10 | 12/11 | |||||||||||||||||||
Wyndham Worldwide Corporation | $ | 100.00 | 73.78 | 20.85 | 65.45 | 99.16 | 127.59 | |||||||||||||||||
S&P 500 Index | 100.00 | 105.49 | 66.46 | 84.05 | 96.71 | 98.75 | ||||||||||||||||||
S&P Hotels, Resorts & Cruise Lines Index | 100.00 | 87.58 | 45.44 | 70.81 | 108.54 | 87.64 | ||||||||||||||||||
| ITEM 6. | SELECTED FINANCIAL DATA |
| As of or For The Year Ended December 31, | ||||||||||||||||||||
| 2009 | 2008 | 2007 | 2006 | 2005 | ||||||||||||||||
Statement of Operations Data (in millions): | ||||||||||||||||||||
| Net revenues | $ | 3,750 | $ | 4,281 | $ | 4,360 | $ | 3,842 | $ | 3,471 | ||||||||||
| Expenses: | ||||||||||||||||||||
Operating and other (a) | 2,916 | 3,422 | 3,468 | 3,018 | 2,720 | |||||||||||||||
| Goodwill and other impairments | 15 | 1,426 | — | — | — | |||||||||||||||
| Restructuring costs | 47 | 79 | — | — | — | |||||||||||||||
| Separation and related costs | — | — | 16 | 99 | — | |||||||||||||||
| Depreciation and amortization | 178 | 184 | 166 | 148 | 131 | |||||||||||||||
| Operating income/(loss) | 594 | (830 | ) | 710 | 577 | 620 | ||||||||||||||
| Other income, net | (6 | ) | (11 | ) | (7 | ) | — | — | ||||||||||||
| Interest expense | 114 | 80 | 73 | 67 | 29 | |||||||||||||||
| Interest income | (7 | ) | (12 | ) | (11 | ) | (32 | ) | (35 | ) | ||||||||||
| Income/(loss) before income taxes | 493 | (887 | ) | 655 | 542 | 626 | ||||||||||||||
Provision for income taxes (b) | 200 | 187 | 252 | 190 | 195 | |||||||||||||||
| Income/(loss) before cumulative effect of accounting change | 293 | (1,074 | ) | 403 | 352 | 431 | ||||||||||||||
| Cumulative effect of accounting change, net of tax | — | — | — | (65 | ) | — | ||||||||||||||
| Net income/(loss) | $ | 293 | $ | (1,074 | ) | $ | 403 | $ | 287 | $ | 431 | |||||||||
Earnings/(Losses) per Share (c) | ||||||||||||||||||||
Basic | ||||||||||||||||||||
| Income/(loss) before cumulative effect of accounting change | $ | 1.64 | $ | (6.05 | ) | $ | 2.22 | $ | 1.78 | $ | 2.15 | |||||||||
| Cumulative effect of accounting change, net of tax | — | — | — | (0.33 | ) | — | ||||||||||||||
| Net income/(loss) | $ | 1.64 | $ | (6.05 | ) | $ | 2.22 | $ | 1.45 | $ | 2.15 | |||||||||
Diluted | ||||||||||||||||||||
| Income/(loss) before cumulative effect of accounting change | $ | 1.61 | $ | (6.05 | ) | $ | 2.20 | $ | 1.77 | $ | 2.15 | |||||||||
| Cumulative effect of accounting change, net of tax | — | — | — | (0.33 | ) | — | ||||||||||||||
| Net income/(loss) | $ | 1.61 | $ | (6.05 | ) | $ | 2.20 | $ | 1.44 | $ | 2.15 | |||||||||
Balance Sheet Data (in millions): | ||||||||||||||||||||
Securitized assets (d) | $ | 2,755 | $ | 2,929 | $ | 2,608 | $ | 1,841 | $ | 1,496 | ||||||||||
| Total assets | 9,352 | 9,573 | 10,459 | 9,520 | 9,167 | |||||||||||||||
Securitized debt (e) | 1,507 | 1,810 | 2,081 | 1,463 | 1,135 | |||||||||||||||
| Long-term debt | 2,015 | 1,984 | 1,526 | 1,437 | 907 | |||||||||||||||
Total stockholders’/ invested equity (f) | 2,688 | 2,342 | 3,516 | 3,559 | 5,033 | |||||||||||||||
Operating Statistics: | ||||||||||||||||||||
Lodging (g) | ||||||||||||||||||||
Number of rooms (h) | 597,700 | 592,900 | 550,600 | 543,200 | 532,700 | |||||||||||||||
RevPAR (i) | $ | 30.34 | $ | 35.74 | $ | 36.48 | $ | 34.95 | $ | 31.00 | ||||||||||
Vacation Exchange and Rentals | ||||||||||||||||||||
Average number of members (in 000s) (j) | 3,782 | 3,670 | 3,526 | 3,356 | 3,209 | |||||||||||||||
Annual dues and exchange revenues per member (k) | $ | 120.22 | $ | 128.37 | $ | 135.85 | $ | 135.62 | $ | 135.76 | ||||||||||
Vacation rental transactions (in 000s) (l) | 1,356 | 1,347 | 1,376 | 1,344 | 1,300 | |||||||||||||||
Average net price per vacation rental (m) | $ | 423.04 | $ | 463.10 | $ | 422.83 | $ | 370.93 | $ | 359.27 | ||||||||||
Vacation Ownership | ||||||||||||||||||||
Gross Vacation Ownership Interest (“VOI”) sales (in 000s) (n) | $ | 1,315,000 | $ | 1,987,000 | $ | 1,993,000 | $ | 1,743,000 | $ | 1,396,000 | ||||||||||
Tours (o) | 617,000 | 1,143,000 | 1,144,000 | 1,046,000 | 934,000 | |||||||||||||||
Volume Per Guest (“VPG”) (p) | $ | 1,964 | $ | 1,602 | $ | 1,606 | $ | 1,486 | $ | 1,368 | ||||||||||
| As of or For the Year Ended December 31, | ||||||||||||||||||||
| 2011 | 2010 | 2009 | 2008 | 2007 | ||||||||||||||||
Statement of Operations Data (in millions): | ||||||||||||||||||||
Net revenues | $ | 4,254 | $ | 3,851 | $ | 3,750 | $ | 4,281 | $ | 4,360 | ||||||||||
Expenses: | ||||||||||||||||||||
Operating and other(a) | 3,246 | 2,947 | 2,916 | 3,422 | 3,468 | |||||||||||||||
Goodwill and other impairments | 57 | 4 | 15 | 1,426 | — | |||||||||||||||
Restructuring costs | 6 | 9 | 47 | 79 | — | |||||||||||||||
Separation and related costs | — | — | — | — | 16 | |||||||||||||||
Depreciation and amortization | 178 | 173 | 178 | 184 | 166 | |||||||||||||||
|
|
|
|
|
|
|
|
|
| |||||||||||
Operating income/(loss) | 767 | 718 | 594 | (830 | ) | 710 | ||||||||||||||
Other income, net(b) | (11 | ) | (7 | ) | (6 | ) | (11 | ) | (7 | ) | ||||||||||
Interest expense | 152 | 167 | 114 | 80 | 73 | |||||||||||||||
Interest income | (24 | ) | (5 | ) | (7 | ) | (12 | ) | (11 | ) | ||||||||||
|
|
|
|
|
|
|
|
|
| |||||||||||
Income/(loss) before income taxes | 650 | 563 | 493 | (887 | ) | 655 | ||||||||||||||
Provision for income taxes(c) | 233 | 184 | 200 | 187 | 252 | |||||||||||||||
|
|
|
|
|
|
|
|
|
| |||||||||||
Net income/(loss) | $ | 417 | $ | 379 | $ | 293 | $ | (1,074 | ) | $ | 403 | |||||||||
|
|
|
|
|
|
|
|
|
| |||||||||||
Per Share Data(d) | ||||||||||||||||||||
Basic | ||||||||||||||||||||
Net income/(loss) | $ | 2.57 | $ | 2.13 | $ | 1.64 | $ | (6.05 | ) | $ | 2.22 | |||||||||
Diluted | ||||||||||||||||||||
Net income/(loss) | $ | 2.51 | $ | 2.05 | $ | 1.61 | $ | (6.05 | ) | $ | 2.20 | |||||||||
Dividends | ||||||||||||||||||||
Cash dividends declared per share(e) | $ | 0.60 | $ | 0.48 | $ | 0.16 | $ | 0.16 | $ | 0.08 | ||||||||||
Balance Sheet Data (in millions): | ||||||||||||||||||||
Securitized assets(f) | $ | 2,638 | $ | 2,865 | $ | 2,755 | $ | 2,929 | $ | 2,608 | ||||||||||
Total assets | 9,023 | 9,416 | 9,352 | 9,573 | 10,459 | |||||||||||||||
Securitized debt(g) | 1,862 | 1,650 | 1,507 | 1,810 | 2,081 | |||||||||||||||
Long-term debt | 2,153 | 2,094 | 2,015 | 1,984 | 1,526 | |||||||||||||||
Total stockholders’ equity | 2,232 | 2,917 | 2,688 | 2,342 | 3,516 | |||||||||||||||
Operating Statistics: (h) | ||||||||||||||||||||
Lodging(i) | ||||||||||||||||||||
Number of rooms(j) | 613,100 | 612,700 | 597,700 | 592,900 | 550,600 | |||||||||||||||
RevPAR | $ | 33.34 | $ | 31.14 | $ | 30.34 | $ | 35.74 | $ | 36.48 | ||||||||||
Vacation Exchange and Rentals(k) | ||||||||||||||||||||
Average number of members (in 000s) | 3,750 | 3,753 | 3,782 | 3,670 | 3,526 | |||||||||||||||
Exchange revenue per member | $ | 179.59 | $ | 177.53 | $ | 176.73 | $ | 198.48 | $ | 209.80 | ||||||||||
Vacation rental transactions (in 000s) | 1,347 | 1,163 | 964 | 936 | 942 | |||||||||||||||
Average net price per vacation rental | $ | 530.78 | $ | 425.38 | $ | 477.38 | $ | 528.95 | $ | 480.32 | ||||||||||
Vacation Ownership | ||||||||||||||||||||
Gross Vacation Ownership Interest (“VOI”) sales (in 000s) | $ | 1,595,000 | $ | 1,464,000 | $ | 1,315,000 | $ | 1,987,000 | $ | 1,993,000 | ||||||||||
Tours | 685,000 | 634,000 | 617,000 | 1,143,000 | 1,144,000 | |||||||||||||||
Volume Per Guest (“VPG”) | $ | 2,229 | $ | 2,183 | $ | 1,964 | $ | 1,602 | $ | 1,606 | ||||||||||
Includes operating, cost of vacation ownership interests, consumer financing interest, marketing and reservation and general and administrative expenses. During 2011, 2010, 2009, 2008 |
| expenses include charges of $24 million |
| (b) | Includes a $4 million gain during 2011 related to the redemption of a preferred stock investment allocated to us in connection with our separation from Cendant. |
| (c) | The difference in our 2008 effective tax rate is primarily due to (i) the non-deductibility of the goodwill impairment charge recorded during 2008, (ii) charges in a tax-free zone resulting from currency conversion losses related to the transfer of cash from our Venezuelan operations at our vacation exchange and rentals business and (iii) a non-cash impairment charge related to the write-off of an investment in a non-performing joint venture at our vacation exchange and rentals business. See Note 7 — Income Taxes for |
This calculation is based on basic and diluted weighted average shares of 162 million and 166 million, respectively, during 2011, 178 million and 185 million, respectively, during 2010, 179 million and 182 million, respectively, during 2009, 178 million during 2008 and 181 million and 183 million, respectively, during 2007. |
Prior to the third quarter of 2007, we did not pay dividends. |
| (f) | Represents the portion of gross vacation ownership contract receivables, securitization restricted cash and related assets that collateralize our securitized debt. Refer to Note |
Represents debt that is securitized through bankruptcy-remote special purpose entities, the creditors of which have no recourse to us. |
See “Operating Statistics” within Item 7 — Management’s Discussion and |
34
U.S. Franchise Systems, Inc. and its Microtel Inns & Suites and Hawthorn Suites hotel brands were acquired on July 18, |
The amounts in 2009 and 2008 also included approximately 3,000 rooms |
Hoseasons Holdings Ltd. was acquired on March 1, 2010, ResortQuest International, LLC was acquired on September 30, 2010, James Villa Holdings Ltd. was acquired on November 30, 2010 and | ||
In presenting the financial data above in conformity with generally accepted accounting principles, we are required to make estimates and assumptions that affect the amounts reported. See “Management’s Discussion and Analysis of Financial Condition and Results of Operations — Financial Condition, Liquidity and Capital Resources — Critical Accounting Policies,” for a detailed discussion of the accounting policies that we believe require subjective and complex judgments that could potentially affect reported results.
Acquisitions (2005 — 2009)ACQUISITIONS (2007 – 2011)
Between January 1, 20052007 and December 31, 2009,2011, we completed the following acquisitions, the results of operations and financial position of which have been included beginning from the relevant acquisition dates:
Two vacation rentals tuck-in acquisitions (Third quarter 2011)
James Villa Holdings Ltd. (November 2010)
ResortQuest International, LLC (September 2010)
Tryp hotel brand (June 2010)
Hoseasons Holdings Ltd. (March 2010)
U.S. Franchise Systems, Inc. and its Microtel Inns & Suites and Hawthorn Suites hotel brands (July 2008)
See Note 4 to the Consolidated Financial Statements for a more detailed discussion of the acquisitions completed since January 1, 2007.
ChargesIMPAIRMENT & RESTRUCTURING CHARGES
During 2011, we recorded non-cash asset impairment charges at our lodging business which consisted of a write-down of (i) $44 million of franchise and management agreements, development advance notes and other receivables and (ii) a $13 million investment in an international joint venture. In addition, we recorded $6 million of restructuring costs primarily related to a strategic realignment initiative committed to during 2010 at our vacation exchange and rentals business.
During 2010, we recorded (i) $9 million of restructuring costs related to a strategic realignment initiative committed to during 2010 at our vacation exchange and rentals business and (ii) a charge of $4 million to reduce the value of certain vacation ownership properties and related assets that were no longer consistent with our development plans.
During 2009, we recorded (i) $47 million of restructuring costs related to various strategic realignment initiatives committed to during 2008, (ii) a charge of $9 million ($7 million, net of tax) to reduce the value of certain vacation ownership properties and related assets held for sale that arewere no longer consistent with the Company’sour development plans and (ii)(iii) a charge of $6 million ($3 million, net of tax) to reduce the value of an underperforming joint venture inat our hotel managementlodging business.
During 2008, we recorded (i) a charge of $1,342 million ($1,337 million, net of tax) to impair goodwill related to plans announced during the fourth quarter of 2008 to reduce our VOI sales pace and associated size of our vacation ownership business. In addition, during 2008, we recorded chargesbusiness, (ii) a charge of (i) $84 million ($58 million, net of tax) to reduce the carrying value of certain long-lived assets based on their revised estimated fair values and (ii) $24(iii) $79 million ($24 million, net of tax) due to currency conversion lossesrestructuring costs related to the transfer of cash from our Venezuelan operations at our vacation exchange and rentals business.
35
| ITEM 7. | MANAGEMENT’S DISCUSSION AND ANALYSIS OF FINANCIAL CONDITION AND RESULTS OF OPERATIONS |
BUSINESS AND OVERVIEW
We are a global provider of hospitality productsservices and servicesproducts and operate our business in the following three segments:
| • | Lodging—franchises hotels in the upper upscale, upscale, upper midscale, midscale, economy and extended stay segments of the lodging industry and provides hotel management services for full-service hotels globally. | ||
| • | Vacation Exchange and Rentals—provides vacation exchange | ||
| • | Vacation Ownership—develops, markets and sells VOIs to individual consumers, provides consumer financing in connection with the sale of VOIs and provides property management services at resorts. |
Separation from Cendant
On July 31, 2006, Cendant Corporation, currently known as Avis Budget Group, Inc. (or “former Parent”), distributed all of the shares of Wyndham common stock to the holders of Cendant common stock issued and outstanding on July 21, 2006, the record date for the distribution. On August 1, 2006, we commenced “regular way” trading on the New York Stock Exchange under the symbol “WYN.”
Before our separation from Cendant (“Separation”), we entered into separation, transition services and several other agreements with Cendant, Realogy and Travelport to effect the separation and distribution, govern the relationships among the parties after the separation and allocate among the parties Cendant’s assets, liabilities and obligations attributable to periods prior to the separation. Under the Separation and Distribution Agreement, we assumed 37.5% of certain contingent and other corporate liabilities of Cendant or its subsidiaries which were not primarily related to our business or the businesses of Realogy, Travelport or Avis Budget Group, and Realogy assumed 62.5% of these contingent and other corporate liabilities. These include liabilities relating to Cendant’s terminated or divested businesses, the Travelport sale on August 22, 2006, taxes of Travelport for taxable periods through the date of the Travelport sale, certain litigation matters, generally any actions relating to the separation plan and payments under certain contracts that were not allocated to any specific party in connection with the separation.
RESULTS OF OPERATIONS
Lodging
Our franchising business is designed to generate revenues for our hotel owners through the delivery of room night bookings to the hotel, the promotion of brand awareness among the consumer base, global sales efforts, ensuring guest satisfaction and providing outstanding customer service to both our customers and guests staying at hotels in our system.
We enter into agreements to franchise our lodging brands to independent hotel owners. Our standard franchise agreement typically has a term of 15 to 20 years and provides a franchisee with certain rights to terminate the franchise agreement before the term of the agreement under certain circumstances. The principal source of revenues from franchising hotels is ongoing franchise fees, which are comprised of royalty fees and other fees relating to marketing and reservation services. Ongoing franchise fees typically are based on a percentage of gross room revenues of each franchised hotel and are recordedintended to cover the use of our trademarks and our operating expenses, such as expenses incurred for franchise services, including quality assurance and administrative support, and to provide us with operating profits. These fees are recognized as revenue upon becoming due from the franchisee. An estimate of uncollectible ongoing franchise fees is charged to bad debt expense and included in operating expenses on the Consolidated Statements of Operations.Income. Lodging revenues also include initial franchise fees, which are recognized as revenues when all material services or conditions have been substantially performed, which is either when a
36
Our franchise agreements also require the payment of fees for certain services, including marketing and reservations. With suchreservation fees, we provide our franchised propertieswhich are intended to reimburse us for expenses associated with a suite of operational and administrative services, including access to (i)operating an international, centralized, brand-specific reservations system; (ii)system, access to third-party distribution channels, such as online travel agents; (iii) advertising; (iv) our loyalty program; (v)agents, advertising and marketing programs, global sales support; (vi)efforts, operations support; (vii) training; (viii) strategic sourcing;support, training and (ix) designother related services. These fees are recognized as revenue upon becoming due from the franchisee. An estimate of uncollectible ongoing marketing and construction services. reservation fees is charged to bad debt expense and included in marketing and reservation expenses on the Consolidated Statements of Income.
We are contractually obligated to expend the marketing and reservation fees we collect from franchisees in accordance with the franchise agreements; as such, revenues earned in excess of costs incurred are accrued as a liability for future marketing or reservation costs. Costs incurred in excess of revenues earned are expensed as incurred. In accordance with our franchise agreements, we include an allocation of costs required to carry out marketing and reservation activities within marketing and reservation expenses.
Other service fees we derive from providing ancillary services to franchisees are primarily recognized as revenue upon completion of services. The majority of these fees are intended to reimburse us for direct expenses associated with providing these services.
We also provide management services for hotels under management contracts, which offer all the benefits of a global brand and a full range of management, marketing and reservation services. In addition to the standard franchise services described below,above, our hotel management business provides hotel owners with professional oversight and comprehensive operations support services such as hiring, training and supervising the managers and employees that operate the hotels as well as annual budget preparation, financial analysis and extensive food and beverage services. Our standard management agreement typically has a term of up to 20 years. Our management fees are comprised of base fees, which are typically calculated, based upon a specified percentage of gross revenues from hotel operations, and incentive fees, which are typically calculated based upon a specified percentage of a hotel’s gross operating profit. Management fee revenues are recognized when earned in accordance with the terms of the contract. We incur certain reimbursable costs on behalf of managed hotel properties and reportsreport reimbursements received from managed propertieshotels as revenues and the costs incurred on their behalf as expenses. Management fee revenues are recorded as a component of franchise fee revenues and
reimbursable revenues are recorded as a component of service fees and membership revenuesfees on the Consolidated Statements of Operations.Income. The costs, which principally relate to payroll costs for operational employees who work at the managed hotels, are reflected as a component of operating expenses on the Consolidated Statements of Operations.Income. The reimbursements from hotel owners are based upon the costs incurred with no added margin; as a result, these reimbursable costs have little to no effect on our operating income. Management fee revenues and revenues related to payroll reimbursements were $7 million and $79 million, respectively, during 2011, $5 million and $77 million, respectively, during 2010 and $4 million and $85 million, respectively, during 2009, $5 million and $100 million, respectively, during 2008 and $6 million and $92 million, respectively, during 2007.
We also earn revenues from administering the Wyndham Rewards loyalty program. We charge our franchisee/managed hotel ownerprogram when a member stays at a participating hotel. These revenues are derived from a fee we charge based upon a percentage of room revenues generated from member stays at participating hotels. This fee is recordedsuch stay. These loyalty fees are intended to reimburse us for expenses associated with administering and marketing the program. These fees are recognized as revenue upon becoming due from the franchisee.
Within our Lodging segment, we measure operating performance using the following key operating statistics: (i) number of rooms, which represents the number of rooms at lodging properties at the end of the year and (ii) revenue per available room (RevPAR), which is calculated by multiplying the percentage of available rooms occupied during the year by the average rate charged for renting a lodging room for one day.
Vacation Exchange and Rentals
As a provider of vacation exchange services, we enter into affiliation agreements with developers of vacation ownership properties to allow owners of intervals to trade their intervals for certain other intervals within our vacation exchange business and, for some members, for other leisure-related productsservices and services.products. Additionally, as a marketer of vacation rental properties, generally we enter into contracts for exclusive periods of time with property owners to market the rental of such properties to rental customers. Our vacation exchange business derives a majority of its revenues from annual membership dues and exchange fees from members trading their intervals. Annual dues revenues represents the annual membership fees from members who participate in our vacation exchange business and, for additional fees, have the right to exchange their intervals for certain other intervals within our vacation exchange business and, for certain members, for other leisure-related productsservices and services.products. We recognize revenues from annual membership dues on a straight-line basis over the membership period during which delivery of publications, if applicable, and other services are provided to the members. Exchange fees are generated when members exchange their intervals for equivalent values of rights and services, which may include intervals at other properties within our vacation exchange business or for other leisure-related productsservices and services.products. Exchange fees are recognized as revenues, net of expected cancellations, when the exchange requests have been confirmed to the member. Our vacation rentals business primarily derives its revenues from fees, which generally average between 20% and 45%50% of the gross booking fees for non-proprietary inventory, except for where we receive 100% of the revenues for properties that we own ormanage, operate under long-term capital leases.leases or own. The majority of the time, we act on behalf of the owners of the rental properties to generate our fees. We provide reservation services to the independent
37
Within our Vacation Exchange and Rentals segment, we measure operating performance using the following key operating statistics: (i) average number of vacation exchange members, which represents members in our vacation exchange programs who pay annual membership dues and are entitled, for additional fees, to
exchange their intervals for intervals at other properties affiliated within our vacation exchange business and, for certain members, for other leisure-related productsservices and services;products; (ii) annual membership dues and exchange revenue per member, which represents the total annual duesrevenue from fees associated with memberships, exchange transactions, member-related rentals and exchange fees generatedother services for the year divided by the average number of vacation exchange members during the year; (iii) vacation rental transactions, which represents the number of standard one-week rental transactions that are generated in connection with customers booking their vacation rental stays through us; and (iv) average net price per vacation rental, which represents the net rental price generated from renting vacation properties to customers and other related rental servicing fees divided by the number of vacation rental transactions.
Vacation Ownership
We develop, market and sell VOIs to individual consumers, provide property management services at resorts and provide consumer financing in connection with the sale of VOIs. Our vacation ownership business derives the majority of its revenues from sales of VOIs and derives other revenues from consumer financing and property management. Our sales of VOIs are either cash sales or seller-financeddeveloper-financed sales. In order for us to recognize revenues from VOI sales under the full accrual method of accounting described in the guidance for sales of real estate for fully constructed inventory, a binding sales contract must have been executed, the statutory rescission period must have expired (after which time the purchasers are not entitled to a refund except for non-delivery by us), receivables must have been deemed collectible and the remainder of our obligations must have been substantially completed. In addition, before we recognize any revenues from VOI sales, the purchaser of the VOI must have met the initial investment criteria and, as applicable, the continuing investment criteria, by executing a legally binding financing contract. A purchaser has met the initial investment criteria when a minimum down payment of 10% is received by us. In accordance with the guidance for accounting for real estate time-sharing transactions, we must also take into consideration the fair value of certain incentives provided to the purchaser when assessing the adequacy of the purchaser’s initial investment. In those cases where financing is provided to the purchaser by us, the purchaser is obligated to remit monthly payments under financing contracts that represent the purchaser’s continuing investment. If all of the criteria for a VOI sale to qualify under the full accrual method of accounting have been met, as discussed above, except that construction of the VOI purchased is not complete, we recognize revenues using thepercentage-of-completion (“POC”) method of accounting provided that the preliminary construction phase is complete and that a minimum sales level has been met (to assure that the property will not revert to a rental property). The preliminary stage of development is deemed to be complete when the engineering and design work is complete, the construction contracts have been executed, the site has been cleared, prepared and excavated, and the building foundation is complete. The completion percentage is determined by the proportion of real estate inventory costs incurred to total estimated costs. These estimated costs are based upon historical experience and the related contractual terms. The remaining revenues and related costs of sales, including commissions and direct expenses, are deferred and recognized as the remaining costs are incurred.
We also offer consumer financing as an option to customers purchasing VOIs, which are typically collateralized by the underlying VOI. The contractual terms of seller-providedCompany-provided financing agreements require that the contractual level of annual principal payments be sufficient to amortize the loan over a customary period for the VOI being financed, which is generally ten years, and payments under the financing contracts begin within 45 days of the sale and receipt of the minimum down payment of 10%. An estimate of uncollectible amounts is recorded at the time of the sale with a charge to the provision for loan losses, which is classified as a reduction of vacation ownership interest sales on the Consolidated Statements of Operations.Income. The interest income earned from the financing arrangements is earned on the principal balance outstanding over the life of the arrangement and is recorded within consumer financing on the Consolidated Statements of Operations.
We also provideday-to-day-management services, including oversight of housekeeping services, maintenance and certain accounting and administrative services for property owners’ associations and clubs. In some cases, our employees serve as officersand/or directors of these associations and clubs in accordance with their by-laws and associated regulations. ManagementWe receive fees for such property management services which are
generally based upon total costs to operate such resorts. Fees for property management services typically approximate 10% of budgeted operating expenses. Property management fee revenues are recognized when earned in accordance with the terms of the
38
Within our Vacation Ownership segment, we measure operating performance using the following key metrics: (i) gross VOI sales (including tele-sales upgrades, which are a component of upgrade sales) before deferred sales and loan loss provisions; (ii) tours, which represents the number of tours taken by guests in our efforts to sell VOIs; and (iii) volume per guest, or VPG, which represents revenue per guest and is calculated by dividing the gross VOI sales, excluding tele-sales upgrades, which are a component of upgrade sales, by the number of tours.
Other Items
We record lodging-related marketing and reservation revenues, Wyndham Rewards revenues, as well asRCI Elite Rewards revenues and hotel/property management services revenues for both our Lodging, Vacation Ownership and Vacation OwnershipExchange and Rentals segments, in accordance with the guidance for reporting revenues gross as a principal versus net as an agent, which requires that these revenues be recorded on a gross basis.
Discussed below are our consolidated results of operations and the results of operations for each of our reportable segments. The reportable segments presented below represent our operating segments for which separate financial information is available and which is utilized on a regular basis by our chief operating decision maker to assess performance and to allocate resources. In identifying our reportable segments, we also consider the nature of services provided by our operating segments. Management evaluates the operating results of each of our reportable segments based upon revenues and “EBITDA,” which is defined as net income/(loss)income before depreciation and amortization, interest expense (excluding consumer financing interest), interest income (excluding consumer financing interest) and income taxes, each of which is presented on the Consolidated Statements of Operations.Income. We believe that EBITDA is a useful measure of performance for our industry segments which, when considered with GAAP measures, gives a more complete understanding of our operating performance. Our presentation of EBITDA may not be comparable to similarly-titled measures used by other companies.
OPERATING STATISTICS
The following table presents our operating statistics for the years ended December 31, 20092011 and 2008.2010. See Results of Operations section for a discussion as to how these operating statistics affected our business for the periods presented.
| Year Ended December 31, | ||||||||||||
| 2009 | 2008 | % Change | ||||||||||
Lodging | ||||||||||||
Number of rooms (a) | 597,700 | 592,900 | 1 | |||||||||
RevPAR (b) | $ | 30.34 | $ | 35.74 | (15 | ) | ||||||
Vacation Exchange and Rentals | ||||||||||||
Average number of members (000s) (c) | 3,782 | 3,670 | 3 | |||||||||
Annual dues and exchange revenues per member (d) | $ | 120.22 | $ | 128.37 | (6 | ) | ||||||
Vacation rental transactions (in 000s) (e) | 1,356 | 1,347 | 1 | |||||||||
Average net price per vacation rental (f) | $ | 423.04 | $ | 463.10 | (9 | ) | ||||||
Vacation Ownership | ||||||||||||
Gross VOI sales (in 000s) (g) | $ | 1,315,000 | $ | 1,987,000 | (34 | ) | ||||||
Tours (h) | 617,000 | 1,143,000 | (46 | ) | ||||||||
Volume Per Guest (“VPG”) (i) | $ | 1,964 | $ | 1,602 | 23 | |||||||
39
| Year Ended December 31, | ||||||||||||
| 2011 | 2010 | % Change | ||||||||||
Lodging | ||||||||||||
Number of rooms(a) | 613,100 | 612,700 | 0.1 | |||||||||
RevPAR(b) | $ | 33.34 | $ | 31.14 | 7.1 | |||||||
Vacation Exchange and Rentals | ||||||||||||
Average number of members (in 000s)(c) | 3,750 | 3,753 | (0.1 | ) | ||||||||
Exchange revenue per member(d) | $ | 179.59 | $ | 177.53 | 1.2 | |||||||
Vacation rental transactions (in 000s) (e) (f) | 1,347 | 1,163 | 15.8 | |||||||||
Average net price per vacation rental(f) (g) | $ | 530.78 | $ | 425.38 | 24.8 | |||||||
Vacation Ownership | ||||||||||||
Gross VOI sales (in 000s)(h) (i) | $ | 1,595,000 | $ | 1,464,000 | 8.9 | |||||||
Tours(j) | 685,000 | 634,000 | 8.0 | |||||||||
Volume Per Guest (“VPG”)(k) | $ | 2,229 | $ | 2,183 | 2.1 | |||||||
| (a) | Represents the number of rooms at lodging properties at the end of the period which are either (i) under franchise and/or management agreements and (ii) |
Represents revenue per available room and is calculated by multiplying the percentage of available rooms occupied during the period by the average rate charged for renting a lodging room for one day. Includes the impact from the acquisition of the Tryp hotel brand, which was acquired on June 30, 2010; therefore, such operating statistics for 2011 are not presented on a comparable basis to the 2010 operating statistics. |
| (c) | Represents members in our vacation exchange programs who pay annual membership dues. For additional fees, such participants are entitled to exchange intervals for intervals at other properties affiliated with our vacation exchange business. In addition, certain participants may exchange intervals for other leisure-related |
| (d) | Represents total revenue generated from |
| (e) | Represents the number of transactions that are generated in connection with customers booking their vacation rental stays through us. |
| (f) | Includes the impact from the acquisitions of Hoseasons (March 1, 2010), ResortQuest (September 30, 2010), James Villa Holidays (November 30, 2010) and two tuck-in acquisitions (third quarter 2011); therefore, such operating statistics for 2011 are not presented on a comparable basis to the 2010 operating statistics. |
| (g) | Represents the net rental price generated from renting vacation properties to customers and other related rental servicing fees divided by the number of vacation rental transactions. Excluding the impact of foreign exchange movements, the average net price per vacation rental increased |
Represents |
The following table provides a reconciliation of Gross VOI sales to Vacation ownership interest sales for the year ended December 31 (in millions): |
| 2011 | 2010 | |||||||
Gross VOI sales | $ | 1,595 | $ | 1,464 | ||||
Less: WAAM sales(1) | (106 | ) | (51 | ) | ||||
|
|
|
| |||||
Gross VOI sales, net of WAAM sales | 1,489 | 1,413 | ||||||
Less: Loan loss provision | (339 | ) | (340 | ) | ||||
|
|
|
| |||||
Vacation ownership interest sales(2) | $ | 1,150 | $ | 1,072 | ||||
|
|
|
| |||||
| (1) | Represents total sales of third party VOIs through our fee-for-service vacation ownership sales model designed to offer turn-key solutions for developers or banks in possession of newly developed inventory, which we will sell for a commission fee through our extensive sales and marketing channels. |
| (2) | Amounts may not foot due to rounding. |
| (j) | Represents the number of tours taken by guests in our efforts to sell VOIs. |
VPG is calculated by dividing Gross VOI sales (excluding tele-sales upgrades, which are |
Year Ended December 31, 20092011 vs. Year Ended December 31, 20082010
Our consolidated results comprised the following:
| Year Ended December 31, | ||||||||||||
| 2011 | 2010 | Change | ||||||||||
Net revenues | $ | 4,254 | $ | 3,851 | $ | 403 | ||||||
Expenses | 3,487 | 3,133 | 354 | |||||||||
|
|
|
|
|
| |||||||
Operating income | 767 | 718 | 49 | |||||||||
Other income, net | (11 | ) | (7 | ) | (4 | ) | ||||||
Interest expense | 152 | 167 | (15 | ) | ||||||||
Interest income | (24 | ) | (5 | ) | (19 | ) | ||||||
|
|
|
|
|
| |||||||
Income before income taxes | 650 | 563 | 87 | |||||||||
Provision for income taxes | 233 | 184 | 49 | |||||||||
|
|
|
|
|
| |||||||
Net income | $ | 417 | $ | 379 | $ | 38 | ||||||
|
|
|
|
|
| |||||||
Net revenues increased $403 million (10.5%) during 2011 compared with the same period last year primarily resulting from:
$195 million of incremental revenues primarily related to vacation rental acquisitions;
| Year Ended December 31, | ||||||||||||
| 2009 | 2008 | Change | ||||||||||
| Net revenues | $ | 3,750 | $ | 4,281 | $ | (531 | ) | |||||
| Expenses | 3,156 | 5,111 | (1,955 | ) | ||||||||
| Operating income/(loss) | 594 | (830 | ) | 1,424 | ||||||||
| Other income, net | (6 | ) | (11 | ) | 5 | |||||||
| Interest expense | 114 | 80 | 34 | |||||||||
| Interest income | (7 | ) | (12 | ) | 5 | |||||||
| Income/(loss) before income taxes | 493 | (887 | ) | 1,380 | ||||||||
| Provision for income taxes | 200 | 187 | 13 | |||||||||
| Net income/(loss) | $ | 293 | $ | (1,074 | ) | $ | 1,367 | |||||
$98 million of higher revenues from our vacation ownership business primarily due to increased VOI sales, WAAM revenues and property management fees, partially offset by the impact of a change in the reporting of fees related to incidental VOI operations;
$56 million of higher revenues in our lodging business due primarily from higher royalty, marketing and reservation revenues (including Wyndham Rewards) resulting from stronger RevPAR and the impact of a change in the classification of third-party reservation fees from marketing expenses.
$35 million of a favorable impact from foreign exchange; and
$26 million of increased revenue from our exchange and rentals business primarily due to improved yield at our vacation rentals business and the impact of a change in the classification of third-party sales commission and credit card processing fees to operating expenses.
Total expenses increased by $354 million (11.3%) during 2011 compared with the same period last year principally reflecting:
$163 million of incremental expenses primarily related to vacation rental acquisitions;
$74 million of higher operating expenses resulting from the revenue increases (excluding acquisitions);
$57 million for non-cash impairment charges at our lodging business;
$42 million of net revenues decreased $531expenses from the resolution of and adjustment to certain contingent liabilities and assets;
$34 million (12%) principally due to:of an unfavorable impact from foreign exchange; and
$13 million of increased costs for data security enhancements.
Such decreasesexpense increases were partially offset by:
40
Interest expense decreased $5$15 million during 2011 compared with the same period last year primarily as a result of a decline in net earnings from equity investments,(i) the absence of $16 million of costs incurred during 2010 resulting from the early termination of our term loan and revolving foreign credit facilities.
Interest income associated withincreased $19 million during 2011 primarily due to $16 million of interest received in the assumptionthird quarter of 2011 related to a lodging-related credit card marketing program obligation by a third party and the absencerefund of income associated with the sale of a non-strategic asset at
41
Our effective tax rate of 40.6% and 2008 effective tax rate of (21.1%) isincreased from 32.7% during 2010 to 35.8% during 2011 primarily due to the absence of impairment charges recorded during 2008, a charge recorded during 2009 for the reduction of deferred tax assets andbenefits recognized in 2011 relating to the originationutilization of deferred tax liabilities in acertain cumulative foreign tax jurisdiction and the write-off of deferred tax assets that were associated with stock-based compensation, which were in excess of our pool of excess tax benefits available to absorb tax deficiencies. We expect our effective tax rate for 2010 to be approximately 38%. SeeNote 7- Income Taxes for a detailed reconciliation of our effective tax rate.
As a result of these items, our net income increased $1,367$38 million as(10.0%) compared to 2008.
During 2010,2012, we expect:
net revenues of approximately $4.4 billion to $4.6 billion;
depreciation and amortization of approximately $185 million to $190 million; and
interest expense, net (excluding early extinguishment of debt costs) of approximately $135 million to $140 million.
Following is a discussion of the 2011 results of each of our segments other income net and interest expense/income:
| Net Revenues | EBITDA | |||||||||||||||||||||||
| % | % | |||||||||||||||||||||||
| 2009 | 2008 | Change | 2009 | 2008 | Change | |||||||||||||||||||
| Lodging | $ | 660 | $ | 753 | (12 | ) | $ | 175 | $ | 218 | (20 | ) | ||||||||||||
| Vacation Exchange and Rentals | 1,152 | 1,259 | (8 | ) | 287 | 248 | 16 | |||||||||||||||||
| Vacation Ownership | 1,945 | 2,278 | (15 | ) | 387 | (1,074 | ) | * | ||||||||||||||||
| Total Reportable Segments | 3,757 | 4,290 | (12 | ) | 849 | (608 | ) | * | ||||||||||||||||
Corporate and Other (a) | (7 | ) | (9 | ) | * | (71 | ) | (27 | ) | * | ||||||||||||||
| Total Company | $ | 3,750 | $ | 4,281 | (12 | ) | 778 | (635 | ) | * | ||||||||||||||
| Less: Depreciation and amortization | 178 | 184 | ||||||||||||||||||||||
| Interest expense | 114 | 80 | ||||||||||||||||||||||
| Interest income | (7 | ) | (12 | ) | ||||||||||||||||||||
| Income/(loss) before income taxes | $ | 493 | $ | (887 | ) | |||||||||||||||||||
| Net Revenues | EBITDA | |||||||||||||||||||||||
| 2011 | 2010 | % Change | 2011 | 2010 | % Change | |||||||||||||||||||
Lodging | $ | 749 | $ | 688 | 8.9 | $ | 157 | $ | 189 | (16.9 | ) | |||||||||||||
Vacation Exchange and Rentals | 1,444 | 1,193 | 21.0 | 368 | 293 | 25.6 | ||||||||||||||||||
Vacation Ownership | 2,077 | 1,979 | 5.0 | 515 | 440 | 17.0 | ||||||||||||||||||
|
|
|
|
|
|
|
| |||||||||||||||||
Total Reportable Segments | 4,270 | 3,860 | 10.6 | 1,040 | 922 | 12.8 | ||||||||||||||||||
Corporate and Other (a) | (16 | ) | (9 | ) | * | (84 | ) | (24 | ) | * | ||||||||||||||
|
|
|
|
|
|
|
| |||||||||||||||||
Total Company | $ | 4,254 | $ | 3,851 | 10.5 | 956 | 898 | 6.5 | ||||||||||||||||
|
|
|
| |||||||||||||||||||||
Less: Depreciation and amortization | 178 | 173 | ||||||||||||||||||||||
Interest expense | 152 | 167 | ||||||||||||||||||||||
Interest income | (24 | ) | (5 | ) | ||||||||||||||||||||
|
|
|
| |||||||||||||||||||||
Income before income taxes | $ | 650 | $ | 563 | ||||||||||||||||||||
|
|
|
| |||||||||||||||||||||
| * | Not meaningful. | |
| (a) | Includes the elimination of transactions between segments. |
Lodging
Net revenues increased by $61 million (8.9%) and EBITDA decreased by $32 million (16.9%) during the year ended December 31, 2011 compared with the same period last year. Excluding the impact of $57 million of non-cash asset impairment charges, EBITDA increased $25 million (13.2%). The impairment charges consisted of a write-down of (i) $30 million of management agreements, development advance notes and other receivables
which are primarily due to operating and cash flow difficulties at several managed properties within the Wyndham brand, (ii) $14 million of franchise and management agreements resulting from the loss of certain properties which were part of the 2005 acquisition of the Wyndham brand and (iii) a $13 million investment in an international joint venture due to an impairment of cash flows as a result of our partner’s indirect relationship with the Libyan government.
Net revenues and EBITDA decreased $93were favorably impacted by $5 million (12%) and $43$3 million, (20%), respectively, during 2009 comparedas a result of the Tryp hotel brand acquisition in the second quarter of 2010.
Excluding the impact of the Tryp acquisition, net revenues reflects a $60 million increase in royalties and marketing and reservation fees (inclusive of Wyndham Rewards) primarily due to 2008. The(i) a 6.1% increase in RevPAR resulting from stronger occupancy and daily rates, (ii) an increase in our international system size and (iii) the impact of a $28 million increase related to a change in the classification of third-party reservation fees to revenues from marketing expenses, which were misclassified as contra expenses in prior periods. This change in classification had no impact on EBITDA. Net revenue was also favorably impacted by $5 million related due to the opening of our Wyndham Grand hotel in Orlando in the fourth quarter of 2011. Such increases were partially offset by a $9 million decrease in ancillary services revenues primarily reflects a decline in worldwide RevPAR and other franchise fees. EBITDA further reflects lower marketing expenses, the absence of a non-cash impairment charge recorded during 2008 and the impact of the USFS acquisition, partially offset by higher bad debt expense.
42
As of December 31, 2009,2011, we had approximately 7,1107,210 properties and 597,700613,100 rooms in our system. Additionally, our hotel development pipeline included approximately 950850 hotels and approximately 108,100111,900 rooms, of which 43%60% were international and 51%57% were new construction as of December 31, 2009.
We expect net revenues of approximately $620$835 million to $670$875 million during 2010.2012. In addition, as compared to 2009,2011, we expect our operating statistics during 20102012 to perform as follows:
RevPAR to be up 5% to 8%; and
number of rooms to increase 1% to 3%.
Vacation Exchange and Rentals
Net revenues decreased $107 million (8%) whileand EBITDA increased $39$251 million (16%(21.0%) and $75 million (25.6%), respectively, during 20092011 compared with 2010. EBITDA was favorably impacted by a $31 million net benefit resulting from a refund of value-added taxes and $3 million of lower costs related to 2008.organizational realignment initiatives, partially offset by a loss of $4 million related to the write-off of foreign exchange translation adjustments resulting from the liquidation of a foreign entity. A strongerweaker U.S. dollar compared to other foreign currencies unfavorably impactedcontributed $35 million and $9 million in net revenues and EBITDA, by $81respectively.
During the third quarter of 2011, we completed the acquisitions of substantially all of the assets of two vacation rental businesses in Colorado and Florida. This resulted in the addition of over 1,500 units to our portfolio. Our vacation exchange and rentals business now offers its leisure travelers access to approximately 100,000 vacation properties worldwide.
Acquisitions contributed $190 million of incremental net revenues (inclusive of $25 million of ancillary revenues) and $23 million respectively. The decreaseof incremental EBITDA. EBITDA was also favorably impacted by a decline of $6 million in net revenues reflects a $50costs incurred in connection with acquisitions.
Excluding the impact of $165 million decrease in netof incremental vacation rental revenues from rental transactions and related services, a $41 million decrease in ancillary revenues and a $16 million decrease in annual dues and exchange revenues. EBITDA further reflects favorability resulting from the absence of $60 million of charges recorded during the fourth quarter of 2008, $51 million in cost savings from overhead reductions and benefits related to organizational realignment initiatives and $9 million of lower volume-related expenses, partially offset by $29 million of losses from foreign exchange transactionsacquisitions and the unfavorable impact from foreign exchange hedging contracts.
Exchange and related service revenues, which primarily consist of fees generated from memberships, exchange transactions, member-related rentals and other member servicing, increased $7 million. Excluding $7 million of a favorable impacts by our Landal Greenparks and U.K. cottage businesses, partially offset by an unfavorable impact at our Novasol and member rental businesses.
43
We expect net revenues of approximately $1.1$1.44 billion to $1.2$1.51 billion during 2010.2012. In addition, as compared to 2009,2011, we expect our operating statistics during 20102012 to perform as follows:
vacation rental transactions to increase 4% to 7%;
average net price per vacation rental to be flat to down 3% due to the negative impact of foreign currency;
average number of members to be flat to down 2%; and exchange revenue per member to be flat to up 2%. During 2011, we generated approximately $725 million of revenues from our European businesses. As such, any adverse outcome resulting from the instability in the European debt and related financial markets and the associated volatility on foreign exchange and interest rates could potentially have an impact on our 2012 results.
| |
Net revenues decreased $333 million (15%) whileand EBITDA increased $1,461$98 million (5.0%) and $75 million (17.0%), respectively, during 20092011 compared to 2008.
44
Net revenues and EBITDA generated by our WAAM increased by $34 million and $11 million, respectively, due to increased commissions earned on $55 million of accounting, a portion of the total revenues associated with the sale of a vacation ownership interest is deferred if the construction of the vacation resort has not yet been fully completed. Such revenues will be recognized in future periods as construction of the vacation resort progresses. During 2009, we completed construction on resorts wherehigher VOI sales were primarily generated during 2008, resulting in the recognition of $187 million of revenues previously deferred under the POC method of accounting compared to $75 million of deferred revenues during 2008. Accordingly,our WAAM.
Property management net revenues and EBITDA comparisonsincreased $19 million and $8 million, respectively, resulting primarily from higher reimbursement revenues and higher fees for additional services. The reimbursement revenues have no impact on EBITDA.
Net revenues were positivelyunfavorably impacted by $225$10 million (including the impact of the provision for loan losses) and $124 million, respectively, as a result of the net increase in the recognition of revenues previously deferred under the POC method of accounting. We do not anticipate any impact during 2010 on revenues due to the POC method of accounting as all such previously deferred revenues were recognized during 2009 and no additional deferred revenues are anticipated during 2010.
In addition to the items discussed above, EBITDA was positivelyunfavorably impacted by $501 million (33%) of decreased expenses, exclusive of incremental interest expense on our securitized debt and lower property managementincreased expenses primarily resulting from:
$40 million of increased marketing expenses due to increased tours for new owner generation;
$24 million of increased costs associated with maintenance fees on unsold inventory;
$14 million of increased sales costs;
$8 million of increased employee related expenses; and
$4 million of expenses related to the termination of an office building lease during 2011.
Such decreasesincreases were partially offset by:
45
$19 million of decreased litigation related costs;
$8 million of decreased costs related to our initiative to reduce our VOI sales pace.trial membership marketing program; and
the absence of a $4 million non-cash impairment charge recorded during 2010.
We expect net revenues of approximately $1.7$2.15 billion to $2.0$2.23 billion during 2010.2012. In addition, as compared to 2009,2011, we expect our operating statistics during 20102012 to perform as follows:
gross VOI sales to be $1.65 billion to $1.75 billion (including approximately $110 million to $130 million related to WAAM);
tours to increase 1% to 4%; and
VPG to increase 2% to 5%.
Corporate and Other
Corporate and Other expenses increased $46$60 million in 20092011 compared to 2008. Such2010. Corporate expenses included a $12 million and $54 million net benefit related to the resolution of and adjustment to certain contingent liabilities and assets during 2011 and 2010, respectively. Excluding the impact of these net benefits, corporate expenses increased by $18 million.
The $18 million increase in expenses were primarily includes:
Other revenues decreased by $7 million with a corresponding decrease in expenses due to the elimination of non-strategic assets at our vacation ownership business. Such amounts are included within ourthe Wyndham trademark fee charged between the Lodging segment EBITDA results.
We expect corporate expenses of approximately $93 million to $100 million during 2009 compared2012. Such expenses primarily reflect continued investment in information technology and data security enhancements in response to 2008 as a result of (i) a $25 million increase in interest incurred on our long-term debt facilities resultingthe increasingly aggressive global threat from our May 2009 debt issuances (see Note 13 — Long-Term Debt and Borrowing Arrangements) and (ii) $9 million of lower capitalized interest at our vacation ownership business due to lower development of vacation ownership inventory. We expect these trends of higher interest incurred on our long-term debt facilities and lower capitalized interest to continue into 2010 and anticipate an increase of interest expense of $25 million to $35 million in full year 2010 as compared to full year 2009 as a result of a full year effect of our May 2009 debt issuances and a continued decline in development of vacation ownership inventory. Interest income decreased $5 million during 2009 compared to 2008 due to decreased interest earned on invested cash balances as a result of lower rates earned on investments.
46
The following table presents our operating statistics for the years ended December 31, 20082010 and 2007.2009. See Results of Operations section for a discussion as to how these operating statistics affected our business for the periods presented.
| Year Ended December 31, | ||||||||||||
| 2008 | 2007 | % Change | ||||||||||
Lodging (a) | ||||||||||||
Number of rooms (b) | 592,900 | 550,600 | 8 | |||||||||
RevPAR (c) | $ | 35.74 | $ | 36.48 | (2 | ) | ||||||
Vacation Exchange and Rentals | ||||||||||||
Average number of members (000s) (d) | 3,670 | 3,526 | 4 | |||||||||
Annual dues and exchange revenues per member (e) | $ | 128.37 | $ | 135.85 | (6 | ) | ||||||
Vacation rental transactions (in 000s) (f) | 1,347 | 1,376 | (2 | ) | ||||||||
Average net price per vacation rental (g) | $ | 463.10 | $ | 422.83 | 10 | |||||||
Vacation Ownership | ||||||||||||
Gross VOI sales (in 000s) (h) | $ | 1,987,000 | $ | 1,993,000 | — | |||||||
Tours (i) | 1,143,000 | 1,144,000 | — | |||||||||
Volume Per Guest (“VPG”) (j) | $ | 1,602 | $ | 1,606 | — | |||||||
| Year Ended December 31, | ||||||||||||
| 2010 | 2009 | % Change | ||||||||||
Lodging(*) | ||||||||||||
Number of rooms(a) | 612,700 | 597,700 | 3 | |||||||||
RevPAR(b) | $ | 31.14 | $ | 30.34 | 3 | |||||||
Vacation Exchange and Rentals | ||||||||||||
Average number of members (in 000s)(c) | 3,753 | 3,782 | (1 | ) | ||||||||
Exchange revenue per member(d) | $ | 177.53 | $ | 176.73 | — | |||||||
Vacation rental transactions (in 000s) (e) (f) | 1,163 | 964 | 21 | |||||||||
Average net price per vacation rental(f) (g) | $ | 425.38 | $ | 477.38 | (11 | ) | ||||||
Vacation Ownership | ||||||||||||
Gross VOI sales (in 000s)(h) (i) | $ | 1,464,000 | $ | 1,315,000 | 11 | |||||||
Tours(j) | 634,000 | 617,000 | 3 | |||||||||
Volume Per Guest (“VPG”)(k) | $ | 2,183 | $ | 1,964 | 11 | |||||||
Includes | ||
Represents the number of rooms at lodging properties at the end of the period which are either (i) under franchise and/or management agreements, (ii) properties affiliated with the Wyndham Hotels and Resorts brand for which we | ||
Represents revenue per available room and is calculated by multiplying the percentage of available rooms occupied during the period by the average rate charged for renting a lodging room for one day. | ||
Represents members in our vacation exchange programs who pay annual membership dues. For additional fees, such participants are entitled to exchange intervals for intervals at other properties affiliated with our vacation exchange business. In addition, certain participants may exchange intervals for other leisure-related | ||
Represents total | ||
Represents the number of transactions that are generated in connection with customers booking their vacation rental stays through us. | ||
Includes the impact from the acquisitions of Hoseasons (March 1, 2010), ResortQuest (September 30, 2010) and James Villa Holidays (November 30, 2010); therefore, such operating statistics for 2010 are not presented on a comparable basis to the 2009 operating statistics. |
| (g) | Represents the net rental price generated from renting vacation properties to customers and other related rental servicing fees divided by the number of vacation rental transactions. Excluding the impact of foreign exchange movements, |
Represents |
| (i) | The following table provides a reconciliation of Gross VOI sales to Vacation ownership interest sales for the year ended December 31 (in millions): |
| 2010 | 2009 | |||||||
Gross VOI sales | $ | 1,464 | $ | 1,315 | ||||
Less: WAAM sales(1) | (51 | ) | — | |||||
|
|
|
| |||||
Gross VOI sales, net of WAAM sales | 1,413 | 1,315 | ||||||
Plus: Net effect of percentage-of-completion accounting | — | 187 | ||||||
Less: Loan loss provision | (340 | ) | (449 | ) | ||||
|
|
|
| |||||
Vacation ownership interest sales(2) | $ | 1,072 | $ | 1,053 | ||||
|
|
|
| |||||
| (1) | Represents total sales of third party VOIs through our fee-for-service vacation ownership sales model designed to offer turn-key solutions for developers or banks in possession of newly developed inventory, which we will sell for a commission fee through our extensive sales and marketing channels. |
| (2) | Amounts may not foot due to rounding. |
Represents the number of tours taken by guests in our efforts to sell VOIs. | ||
VPG is calculated by dividing Gross VOI sales (excluding tele-sales upgrades, which are |
Year Ended December 31, 20082010 vs. Year Ended December 31, 20072009
Our consolidated results comprised the following:
| Year Ended December 31, | ||||||||||||
| 2008 | 2007 | Change | ||||||||||
| Net revenues | $ | 4,281 | $ | 4,360 | $ | (79 | ) | |||||
| Expenses | 5,111 | 3,650 | 1,461 | |||||||||
| Operating income/(loss) | (830 | ) | 710 | (1,540 | ) | |||||||
| Other income, net | (11 | ) | (7 | ) | (4 | ) | ||||||
| Interest expense | 80 | 73 | 7 | |||||||||
| Interest income | (12 | ) | (11 | ) | (1 | ) | ||||||
| Income/(loss) before income taxes | (887 | ) | 655 | (1,542 | ) | |||||||
| Provision for income taxes | 187 | 252 | (65 | ) | ||||||||
| Net income/(loss) | $ | (1,074 | ) | $ | 403 | $ | (1,477 | ) | ||||
47
| Year Ended December 31, | ||||||||||||
| 2010 | 2009 | Change | ||||||||||
Net revenues | $ | 3,851 | $ | 3,750 | $ | 101 | ||||||
Expenses | 3,133 | 3,156 | (23 | ) | ||||||||
|
|
|
|
|
| |||||||
Operating income | 718 | 594 | 124 | |||||||||
Other income, net | (7 | ) | (6 | ) | (1 | ) | ||||||
Interest expense | 167 | 114 | 53 | |||||||||
Interest income | (5 | ) | (7 | ) | 2 | |||||||
|
|
|
|
|
| |||||||
Income before income taxes | 563 | 493 | 70 | |||||||||
Provision for income taxes | 184 | 200 | (16 | ) | ||||||||
|
|
|
|
|
| |||||||
Net income | $ | 379 | $ | 293 | $ | 86 | ||||||
|
|
|
|
|
| |||||||
a $109 million decrease in our provision for loan losses primarily due to improved portfolio performance and mix, partially offset by:by the impact to the provision from higher gross VOI sales;
a $97 million increase in gross sales of VOIs, net of WAAM sales, reflecting higher VPG and tour flow;
a $35 million increase in | |
$31 million principally reflecting:of commissions earned on VOI sales under our WAAM;
48$29 million of incremental property management fees within our vacation ownership business primarily as a result of growth in the number of units under management;
a $28 million increase in net revenues in our lodging business primarily due to a RevPAR increase of 3%, an increase in ancillary revenues and other franchise fees and incremental revenues contributed from the Tryp hotel brand acquisition, partially offset by a decline in reimbursable revenues; and
Such increases were partially offset by:
a decrease of $187 million as a result of the absence of the recognition of revenues previously deferred under the POC method of accounting at our vacation ownership business;
a $35 million decrease in ancillary revenues at our vacation ownership business primarily associated with a change in the classification of revenues related to incidental operations, which were misclassified on a gross basis during periods prior to the third quarter of 2010, and classified on a net basis within operating expenses commencing in the third quarter of 2010; and
a $10 million reduction in consumer financing revenues due primarily to a decline in our contract receivable portfolio. Total expenses decreased $23 million (1%) principally reflecting: a decrease of $72 million of expenses related to the absence of the recognition of revenues previously deferred at our vacation ownership business, as discussed above; a $54 million net benefit recorded during 2010 related to the resolution of and adjustment to certain contingent liabilities and assets primarily due to the settlement of the IRS examination of Cendant’s tax years 2003 through 2006 on July 15, 2010; a $43 million decrease in marketing and reservation expenses due to the change in tour mix in our vacation ownership business and lower marketing overhead costs at our lodging business; $38 million of decreased costs related to organizational realignment initiatives across our businesses (see Restructuring Plans for more details); a $34 million decrease in consumer financing interest expense primarily related to a decrease in interest rates and lower average borrowings on our securitized debt facilities; the absence of non-cash charges of $15 million in 2009 at our vacation ownership and lodging businesses to reduce the carrying value of certain assets based upon their revised estimated fair values; the favorable impact of $15 million at our vacation exchange and rentals business from foreign exchange transactions and foreign currency hedging contracts; $11 million of decreased expenses related to non-core vacation ownership businesses; a $9 million favorable impact on expenses related to foreign currency translation at our vacation exchange and rentals business; $8 million decrease in payroll costs paid on behalf of hotel owners in our lodging business; $8 million primarily associated with a change in the classification of revenue related to incidental operations, which were misclassified on a gross basis during prior periods and classified on a net basis within operating expenses during the third and fourth quarters of 2010; the absence of a $6 million net expense recorded during 2009 related to the resolution of and adjustment to certain contingent liabilities and assets; and $5 million of lower volume-related and marketing costs at our vacation exchange and rentals business. These decreases were partially offset by: $43 million of incremental costs incurred from acquisitions, of which $40 million is attributable to our vacation exchange and rentals business; $43 million of increased employee and other related expenses primarily due to higher sales commission costs resulting from increased gross VOI sales and rates; $40 million of increased cost of VOI sales related to the increase in gross VOI sales, net of WAAM sales; $25 million of increased costs at our vacation ownership business associated with maintenance fees on unsold inventory; $24 million of increased costs in our lodging business primarily associated with ancillary services provided to franchisees and to enhance the international infrastructure to support our growth strategies; $22 million of costs at our vacation ownership business related to our WAAM; $22 million of incremental property management expenses at our vacation ownership business primarily | |
$16 million of higher corporate costs primarily related to data security and (iii) income associated withinformation technology costs, employee-related fees, the salefunding of certain assets. Such increases werethe Wyndham charitable foundation and higher professional fees, partially offset by the absencefavorable impact from foreign exchange contracts;
$15 million of increased deed recording costs at our vacation ownership business;
$10 million of higher operating expenses at our lodging business related to higher employee-related costs, higher IT costs and higher bad debt expenses on franchisees that are no longer operating a pre-tax gain recorded during 2007 onhotel under one of our brands;
$10 million of increased litigation expenses primarily at our vacation ownership business;
$7 million of acquisition costs incurred in connection with our Hoseasons, Tryp hotel brand, ResortQuest and James Villa Holidays acquisitions;
$6 million of costs at our lodging business related to our strategic initiative to grow reservation contribution;
$5 million of higher operating expenses at our vacation exchange and rentals business, which includes an unfavorable impact from value-added taxes; and
a $4 million non-cash charge to impair the salevalue of certain vacation ownership properties and related assets.assets held for sale that were no longer consistent with our development plans during 2010.
Other income, net increased $1 million during 2010 compared to 2009. Interest expense increased $7$53 million during 20082010 as compared to 20072009 primarily as a result of (i) lower capitalized interest at our vacation ownership business due to lower development of vacation ownership inventory and (ii) higher interest paid on our long-term debt facilities primarily as a result of our 2010 and May 2009 debt issuances (see Note 13 – Long-Term Debt and Borrowing Arrangements), (ii) $16 million of early extinguishment costs incurred during the first quarter of 2010 primarily related to our effective termination of an interest rate swap agreement in connection with the early extinguishment of our term loan facility, which resulted in the reclassification of a $14 million unrealized loss from accumulated other comprehensive income to interest expense on our Consolidated Statement of Income and (iii) $14 million of costs incurred for the repurchase of a portion of our convertible notes during the third and fourth quarters of 2010. Interest income decreased $2 million during 2010 compared to 2009 due to an increase in our revolving credit facility balance. Interest income increased $1 million during 2008 compared to 2007.
Our effective tax rate of (21.1%) and 2007 effective tax rate of 38.5% isdeclined from 40.6% during 2009 to 32.7% in 2010 primarily due to:
As a result of these items, our net income decreased $1,477increased $86 million as compared to 2007.
49
| Net Revenues | EBITDA | |||||||||||||||||||||||
| % | % | |||||||||||||||||||||||
| 2008 | 2007 | Change | 2008 | 2007 | Change | |||||||||||||||||||
| Lodging | $ | 753 | $ | 725 | 4 | $ | 218 | $ | 223 | (2 | ) | |||||||||||||
| Vacation Exchange and Rentals | 1,259 | 1,218 | 3 | 248 | 293 | (15 | ) | |||||||||||||||||
| Vacation Ownership | 2,278 | 2,425 | (6 | ) | (1,074 | ) | 378 | * | ||||||||||||||||
| Total Reportable Segments | 4,290 | 4,368 | (2 | ) | (608 | ) | 894 | * | ||||||||||||||||
Corporate and Other (a) | (9 | ) | (8 | ) | * | (27 | ) | (11 | ) | * | ||||||||||||||
| Total Company | $ | 4,281 | $ | 4,360 | (2 | ) | (635 | ) | 883 | * | ||||||||||||||
| Less: Depreciation and amortization | 184 | 166 | ||||||||||||||||||||||
| Interest expense | 80 | 73 | ||||||||||||||||||||||
| Interest income | (12 | ) | (11 | ) | ||||||||||||||||||||
| Income/(loss) before income taxes | $ | (887 | ) | $ | 655 | |||||||||||||||||||
| Net Revenues | EBITDA | |||||||||||||||||||||||
| 2010 | 2009 | % Change | 2010 | 2009 | % Change | |||||||||||||||||||
Lodging | $ | 688 | $ | 660 | 4 | $ | 189 | $ | 175 | 8 | ||||||||||||||
Vacation Exchange and Rentals | 1,193 | 1,152 | 4 | 293 | 287 | 2 | ||||||||||||||||||
Vacation Ownership | 1,979 | 1,945 | 2 | 440 | 387 | 14 | ||||||||||||||||||
|
|
|
|
|
|
|
| |||||||||||||||||
Total Reportable Segments | 3,860 | 3,757 | 3 | 922 | 849 | 9 | ||||||||||||||||||
Corporate and Other (a) | (9 | ) | (7 | ) | * | (24 | ) | (71 | ) | * | ||||||||||||||
|
|
|
|
|
|
|
| |||||||||||||||||
Total Company | $ | 3,851 | $ | 3,750 | 3 | 898 | 778 | 15 | ||||||||||||||||
|
|
|
| |||||||||||||||||||||
Less: Depreciation and amortization | 173 | 178 | ||||||||||||||||||||||
Interest expense | 167 | 114 | ||||||||||||||||||||||
Interest income | (5 | ) | (7 | ) | ||||||||||||||||||||
|
|
|
| |||||||||||||||||||||
Income before income taxes | $ | 563 | $ | 493 | ||||||||||||||||||||
|
|
|
| |||||||||||||||||||||
| * | Not meaningful. |
| (a) | Includes the elimination of transactions between segments. |
Lodging
Net revenues and EBITDA increased $28 million (4%) and EBITDA decreased $5$14 million (2%(8%), respectively, during 2008the year ended December 31, 2010 compared to 2007 primarily reflecting higherthe same period during 2009.
On June 30, 2010, we acquired the Tryp hotel brand, which resulted in the addition of 92 hotels and approximately 13,200 rooms in Europe and South America. Such acquisition contributed incremental revenues of $5 million and EBITDA of $1 million, which includes $1 million of costs incurred in connection with the acquisition.
Excluding the impact of this acquisition, net revenues increased $23 million reflecting:
a $10 million increase in international royalty, marketing and reservation revenues incremental net revenues generated from the July 2008 acquisition of USFS, increased revenues from our Wyndham Rewards loyalty program and incremental hotel management reimbursable revenues, partially offset by lower domestic royalty, marketing and reservation revenues. Such net revenuesprimarily due to a 7% increase was more than offset in EBITDA by increased expenses, particularly associated with international rooms;
a strategic change in direction related to our Howard Johnson brand, ancillary services provided to franchisees, incremental hotel management reimbursable revenues, the acquisition of USFS and organizational realignment initiatives, partially offset by savings from cost containment initiatives.
an $18 million net within revenues. The domestic RevPAR decline was principally driven by an overall declineincrease in industry occupancy levels, while the international RevPAR growth was principally driven by priceancillary revenue primarily associated with additional services provided to franchisees.
Such increases were partially offset by a decline in occupancy levels. The $8 million of incrementallower reimbursable revenues earned by our hotel management business in 2010. Although our portfolio of managed properties increased in 2010, these incremental revenues were more than offset by the negative impact on revenues resulting from the properties under management which left the system during 2009. The reimbursable revenues recorded by our hotel management business primarily relatesrelate to payroll costs that we incur and pay on behalf of hotel owners, and for which we are entitled to be fully reimbursed by the hotel owner. As the reimbursements are made based upon cost with no added margin, the recorded revenues are offset by the associated expense and there is no resultant impact on EBITDA.
Excluding the impact of the Tryp hotel brand acquisition, EBITDA further reflects:
50$24 million of increased costs primarily associated with ancillary services provided to franchisees and to enhance the international infrastructure to support our growth strategies;
$6 million of costs incurred during 2010 relating to our strategic initiative to grow reservation contribution;
$5 million of higher employee compensation expenses compared to 2009;
$3 million of higher information technology costs; and
$2 million of higher bad debt expense primarily attributable to receivables relating to terminated franchisees.
Such cost increases were partially offset by:
a decrease of $13 million in marketing-related expenses primarily due to lower marketing overhead;
$8 million of lower payroll costs paid on behalf of hotel owners, as discussed above;
the absence of a $6 million non-cash charge in the fourth quarter of 2009 to impair the value of an underperforming joint venture in our hotel management business; and
the absence of $3 million of costs recorded during the first quarter of 2009 relating to organizational realignment initiatives (see Restructuring Plan for more details).
As of December 31, 2008,2010, we had 7,043approximately 7,210 properties and approximately 592,900612,700 rooms in our system. Additionally, our hotel development pipeline included approximately 990over 900 hotels and approximately 110,900102,700 rooms, of which 42%51% were international and 55% were new construction as of December 31, 2008.
Vacation Exchange and Rentals
Net revenues and EBITDA increased $41 million (3%(4%) and EBITDA decreased $45$6 million (15%(2%), respectively, during 20082010 compared with 2009. A stronger U.S. dollar compared to 2007. The increase inother foreign currencies unfavorably impacted net revenues primarily reflects a $42and EBITDA by $16 million increase in netand $7 million, respectively. Net revenues from rental transactions and related services and a $7increased $35 million increase inprimarily related to incremental contributions from our acquisitions and ancillary revenues which includes $5increased $8 million, of favorability related to an adjustment recorded during the second quarter of 2007 that reduced Asia Pacific consulting revenues, partially offset by an $8a $2 million decreasedecline in annual duesexchange and exchangerelated service revenues. EBITDA further reflects $36 million of non-cash charges to reduce the carrying value of certain assets based on their revised estimated fair values, $24 million of charges due to currency conversion lossesfavorable impact from foreign exchange transactions and foreign exchange hedging contracts, partially offset by incremental costs contributed from acquired businesses, an increase in costs related to the transfer of cash from our Venezuelan operations and $9 million of costs relating to organizational realignment initiatives partially offset by $16and increased operating expenses.
On November 30, 2010, we acquired James Villa Holidays, which resulted in the addition of approximately 2,300 villas and unique vacation rental properties in over 50 destinations primarily across Mediterranean locations. In addition, we acquired ResortQuest during September 2010 and Hoseasons during March 2010 which resulted in the addition of approximately 6,000 and over 15,000 vacation rental properties, respectively. Such acquisitions contributed incremental net revenues of $43 million in cost savings from overhead reductions, $16and an EBITDA loss of $3 million, which includes $6 million of favorable hedging on foreign exchange contracts and the absence of $7costs incurred in connection with these acquisitions. Such contributions include $6 million of severance-related expenses recorded during 2007. Netancillary revenues generated from ResortQuest. ResortQuest and expense increases include $16 million and $18 million, respectively, of currency translation impactJames Villa Holidays were purchased subsequent to the third quarter vacation season, which, based on historical seasonality, is the quarter in which results derived from a weaker U.S. dollar compared to other foreign currencies.
Net revenues generated from rental transactions and related services increased $42$35 million (7%(8%) during 20082010 compared to 2007.2009. Excluding the impact to net revenues from rental transactions from our acquisitions and the unfavorable impact of foreign exchange movements of $22 million, such increase was $20 million (4%) during 2010, which was driven by a 4% increase in average net price per vacation rental. Such increase resulted from (i) favorable pricing on bookings made close to arrival dates at our Landal GreenParks business,
(ii) higher pricing at our U.K. and France destinations through our U.K. cottage business, (iii) increased commissions on new properties at our U.K. cottage business and (iv) a $10 million increase primarily related to a change in the classification of third-party sales commission fees to operating expenses, which were misclassified as contra revenue in prior periods. Rental transaction volume remained relatively flat during 2010 as compared to 2009 as the favorable impact at our Novasol business was offset by lower volume at our Landal GreenParks business.
Exchange and related service revenues, which primarily consist of fees generated from memberships, exchange transactions, member-related rentals and other member servicing, decreased $2 million during 2010 compared with 2009. Excluding the favorable impact of foreign exchange movements net revenues generated from rental transactionsof $6 million, exchange and related services increased $21 million (4%) during 2008 driven by (i) the conversion of two of our Landal parks from franchised to managed, which contributed an incremental $20 million to revenues, and (ii) a 2% increase in the average net price per rental primarily resulting from increased pricing at our Landal and Novasol European vacation rentals businesses. These increases were partially offset by a 2% decline in rental transaction volume primarily driven by lower rental volume at our other European cottage businesses as well as lower member rentals, which we believe was a result of customers altering their vacation decisions primarily due to the downturn in North America and other worldwide economies. The decline in rental transaction volume was partially offset by increased rentals at our Landal business, which benefited from enhanced marketing programs.
Ancillary revenues increased $8 million during 2010 compared to enroll members in private label clubs, whereby2009. Excluding the members have the optionimpact to exchange within the club or through RCI channels. Such trends have a positive impact on the average number of members but an offsetting effect on the number of exchange transactions per average member. An increase in ancillary revenues from the acquisition of $7ResortQuest, such increase was $2 million, was driven by (i) the $5 million Asia Pacific adjustment, as discussed above, and (ii) $4 million from various sources, which include fees from additional services providedrelates to transacting members, club servicing revenues, fees from our credit card loyalty program andhigher fees generated from programs with affiliated resorts, partially offset by $2 million due toresorts.
Excluding the unfavorable translation effects of foreign exchange movements.
51the favorable impact of $15 million from foreign exchange transactions and foreign exchange hedging contracts;
the favorable impact of foreign currency translation on expenses of $9 million;
$5 million of lower volume-related and marketing costs; and
$4 million of lower bad debt expense.
Such increasesdecreases were partially offset by:
a $14 million increase in expenses primarily resulting from a change in the classification of third-party sales commission fees and credit card processing fees to operating expenses, which were misclassified as contra revenue in prior periods;
$5 million of increased operating expenses, which includes an unfavorable impact from value-added taxes; and
$3 million of higher costs related to organizational realignment initiatives (see Restructuring Plan for more details).
Vacation Ownership
Net revenues and EBITDA decreased $147increased $34 million (6%(2%) and $1,452$53 million (14%), respectively, during 2008the year ended December 31, 2010 compared to 2007.
The increase in net revenues and other intangible assetsEBITDA during the fourth quarter of 2008. We usedyear ended December 31, 2010 primarily reflects a discounted cash flow model and incorporated assumptions that we believe marketplace participants would utilize. Management concluded that an adjustment was appropriate and, as such, during 2008, we recorded a non-cash $1,342 million charge for the impairment of goodwill at our vacation ownership business to reflect reduced future cash flow estimates based on the expectation that access to the asset-backed securities market will continue to be challenging.
costs incurred in 2009 related to organizational realignment initiatives, lower consumer financing interest expense, lower marketing expenses, a decline in expenses related to our non-core businesses and non-cash impairment charges. EBITDA was further impacted by higher employee related expenses, increased costs of VOI sales, increased costs associated with maintenance fees on unsold inventory, increased property management expenses, incremental WAAM related expenses, higher deed recording costs and higher litigation expenses.
Gross sales of VOIs, net of WAAM sales, at our vacation ownership business increased $97 million (7%) during the year ended December 31, 2010 compared to the same period during 2009, driven principally by an increase of 11% in VPG and an increase of 3% in tour flow. VPG was positively impacted by (i) a favorable tour flow mix resulting from the closure of underperforming sales offices as part of the organizational realignment and (ii) a higher percentage of sales coming from upgrades to existing owners during the year ended December 31, 2010 as compared to 2007 primarily due to a higher estimate of uncollectible receivablesthe same period during 2009 as a percentageresult of changes in the mix of tours. Tour flow reflects the favorable impact of growth in our in-house sales programs, partially offset by the negative impact of the closure of over 25 sales offices during 2009 primarily related to our organizational realignment initiatives. Our provision for loan losses declined $109 million during the year ended December 31, 2010 as compared to the same period during 2009. Such decline includes (i) $83 million primarily related to improved portfolio performance and mix during the year ended December 31, 2010 as compared to the same period during 2009, partially offset by the impact to the provision from higher gross VOI sales, financed and (ii) a $34$26 million impact on our provision for loan losses from the absence of the recognition of revenue previously deferred under the POC method of accounting during the year ended December 31, 2009. Such favorability was partially offset by a $35 million decrease in ancillary revenues primarily associated with bonus points/credits that are provided as purchase incentivesa change in the classification of revenues related to incidental operations, which were misclassified on a gross basis during prior periods and classified on a net basis within operating expenses during the second half of 2010.
In addition, net revenues and EBITDA comparisons were favorably impacted by $31 million and $9 million, respectively, during the year ended December 31, 2010 due to commissions earned on VOI sales. The trendsales of higher uncollectible receivables as a percentage of VOI sales financed has continued since$51 million under our WAAM. During the fourthfirst quarter of 2007 as2010, we began our initial implementation of WAAM, which is our fee-for-service vacation ownership sales model designed to capitalize upon the strainslarge quantities of newly developed, nearly completed or recently finished condominium or hotel inventory within the overall economy appearcurrent real estate market without assuming the investment that accompanies new construction. We offer turn-key solutions for developers or banks in possession of newly developed inventory, which we will sell for a commission fee through our extensive sales and marketing channels. This model enables us to be negatively impactingexpand our resort portfolio with little or no capital deployment, while providing additional channels for new owner acquisition. In addition, WAAM may allow us to grow our fee-for-service consumer finance servicing operations and property management business. The commission revenue earned on these sales is included in service and membership fees on the borrowers in our portfolio, particularly those with lower credit scores. While the continued impactConsolidated Statement of the economy is uncertain, we have taken measures that, over time, should leave us with a smaller portfolio that has a stronger credit profile. See Critical Accounting Policies for more information regarding our allowance for loan losses.
52
Our net benefit of approximately $150 million to $200 million from the recognition of previously deferred revenues as construction of these resorts progresses, partially offset by continued sales generated from vacation resorts where construction is still in progress.
Net revenues were unfavorably impacted by $10 million and EBITDA was favorably impacted by $24 million during the year ended December 31, 2010 due to lower consumer financing revenues attributable to a
decline in our contract receivable portfolio, more than offset in EBITDA by lower interest expensescosts during 2008.the year ended December 31, 2010 as compared to the same period during 2009. We incurred interest expense of $131$105 million on our securitized debt at a weighted average interest rate of 5.2%6.7% during 2008the year ended December 31, 2010 compared to $110$139 million at a weighted average interest rate of 5.4%8.5% during 2007.the year ended December 31, 2009. Our net interest income margin increased from 68% during 2008 was 69%, unchanged as compared to 2007, due to increased securitizations completed afterthe year ended December 31, 2007, offset by 2009 to 75% during the year ended December 31, 2010 due to:
a 20179 basis point decrease in our weighted average interest rates, as described above, and a decline in advance rates (i.e., the percentage of receivables securitized).rate on our securitized borrowings;
$62 million (2%) of decreased expenses, exclusive of incremental interest expenseaverage borrowings on our securitized debt primarily resulting from:facilities; and
higher weighted average interest rates earned on our contract receivable portfolio.
In addition, EBITDA was negatively impacted by $43 million (4%) of increased expenses, exclusive of lower interest expense on our securitized debt, higher property management expenses and WAAM related expenses, primarily resulting from:
$43 million of increased employee and other related expenses primarily due to higher sales commission costs resulting from increased gross VOI sales and rates;
$40 million of increased cost of VOI sales related to the increase in gross VOI sales, net of WAAM sales;
$25 million of increased costs associated with maintenance fees on unsold inventory;
$15 million of increased deed recording costs; and
$10 million of increased litigation expenses.
Such increases were partially offset by:
the absence of an $8$37 million pre-tax gainof costs recorded during the year ended December 31, 2009 relating to organizational realignment initiatives (see Restructuring Plan for more details);
$30 million of decreased marketing expenses due to the change in tour mix;
$11 million of decreased expenses related to our non-core businesses;
$8 million primarily associated with a change in the classification of revenues related to incidental operations, which were misclassified on a gross basis during prior periods and classified on a net basis within operating expenses during the salesecond half of 2010, partially offset by increased costs related to incentives awarded to owners; and
$5 million of lower non-cash charges to impair the value of certain vacation ownership properties during 2007and related assets held for sale that were no longer consistent with our development plans. Such gain was recorded within other income, net on the Consolidated Statement of Operations.
Corporate and Other
Corporate and Other expenses increased $15decreased $49 million during 2008in 2010 compared to 2007.2009. Such increase includes $28decrease primarily resulted from:
a $54 million of a lower net benefit recorded during 2010 related to the resolution of and adjustment to certain contingent liabilities and assets partially offset by (i) primarily due to the settlement of the IRS examination of Cendant’s taxable years 2003 through 2006 on July 15, 2010;
the absence of a $6 million net expense recorded during 2009 related to the resolution of and adjustment to certain contingent liabilities and assets;
$3 million of favorable impact from foreign exchange hedging contracts;
$2 million resulting from the absence of severance recorded during 2009; and
the absence of $1 million of costs recorded during 2009 relating to organizational realignment initiatives (see Restructuring Plan for more details).
Such decreases were partially offset by:
$9 million of higher data security and information technology costs;
$6 million of employee related expenses;
$3 million of funding for the Wyndham charitable foundation; and
$3 million of higher professional fees.
RESTRUCTURING PLANS
2010 RESTRUCTURING PLAN
During 2010, we committed to a strategic realignment initiative at our vacation exchange and rentals business targeted at reducing costs, primarily impacting the operations at certain vacation exchange call centers. During 2011, we incurred $7 million of separationcosts and related costs recorded during 2007 primarily relatingreduced our liability with $9 million of cash payments. The remaining liability of $7 million is expected to consulting and legal services and (ii) abe paid in cash; $6 million decreaseof facility-related over the remaining lease term which expires in corporate costs primarily related to cost containment initiatives implemented during 2008the first quarter of 2020 and lower legal and professional fees.
53
Interest Expense/Interest Income
During 2008, we committed to various strategic realignment initiatives targeted principally at reducing costs, enhancing organizational efficiency, reducing our need to access the asset-backed securities market and consolidating and rationalizing existing processes and facilities. As a result,During 2011, we recorded $47 million and $79 million in restructuring costs during 2009 and 2008 respectively. Such strategic realignment initiatives included:
54
FINANCIAL CONDITION, LIQUIDITY AND CAPITAL RESOURCES
FINANCIAL CONDITION
| December 31, | December 31, | |||||||||||
| 2009 | 2008 | Change | ||||||||||
| Total assets | $ | 9,352 | $ | 9,573 | $ | (221 | ) | |||||
| Total liabilities | 6,664 | 7,231 | (567 | ) | ||||||||
| Total stockholders’ equity | 2,688 | 2,342 | 346 | |||||||||
| December 31, 2011 | December 31, 2010 | Change | ||||||||||
Total assets | $ | 9,023 | $ | 9,416 | $ | (393 | ) | |||||
Total liabilities | 6,791 | 6,499 | 292 | |||||||||
Total stockholders’ equity | 2,232 | 2,917 | (685 | ) | ||||||||
Total assets decreased $221$393 million from December 31, 20082010 to December 31, 20092011 primarily due to:
a $195 million decrease in other non-current assets primarily due to the settlement of a portion of our call options in connection with the repurchase of a portion of our convertible notes;
a $134 million decrease in vacation ownership contract receivables, net primarily due to principal collections exceeding net loan originations;
a $71 million decrease in inventory primarily due to VOI sales, partially offset by development spending during 2011;
a $39 million decrease in franchise agreements and other intangibles primarily due to current year amortization and the impairment of certain franchise and management agreements, partially offset by increased intangibles resulting from our acquisitions during 2011;
a $26 million decrease in deferred income taxes primarily attributable to a change in the expected timing of the resolution of our legacy tax issues; and
a decrease of $14 million in cash and cash equivalents.
Such decreases were partially offset by:
Total liabilities decreased $567increased $292 million from December 31, 2010 to December 31, 2011 primarily due to:
55a $212 million net increase in our securitized vacation ownership debt resulting from higher advance rates on our 2011 securitizations;
a net increase of $59 million in our other long-term debt primarily reflecting the issuance of our $250 million 5.625% senior unsecured notes and a $64 million net increase in outstanding borrowings on our corporate revolver, partially offset by a $138 million net decrease in our derivative liability related to the bifurcated conversion feature associated with our convertible notes, a $95 million decrease related to the repurchase of a portion of our convertible notes and net principal payments on our other long-term debt of $33 million; and
a $44 million increase in deferred income taxes primarily attributable to the utilization of alternative minimum tax credits and depreciation.
Such increases were partially offset by (i) a $30 million decrease in due to former Parent and subsidiaries resulting from the payment and settlement of certain legacy liabilities and (ii) a $23 million decrease in deferred income primarily resulting from shorter membership terms at our vacation exchange and rentals business.
Total stockholders’ equity decreased $685 million from December 31, 2010 to December 31, 2011 primarily due to:
$902 million of share repurchases;
$112 million for the repurchase of warrants;
$99 million of dividends; and
$30 million of currency translation adjustments, net of tax.
Such decreases were partially offset by:
LIQUIDITY AND CAPITAL RESOURCES
Currently, our financing needs are supported by cash generated from operations and borrowings under our revolving credit facility. In addition, certain funding requirements of our vacation ownership business are met through the utilization of our bank conduit facility and the issuance of securitized and other debt to finance vacation ownership contract receivables. We believe that our net cash from operations, cash and cash equivalents, access to our revolving credit facility and our current liquidity vehicles, as well as continued access to the securitization and debt marketsand/or other financing vehicles, will provide us with sufficient liquidity to meet our ongoing needs. If
During July 2011, we are unable to access these markets, it will negatively impactreplaced our liquidity position and may require us to further adjust our business operations. See Liquidity Risk for$980 million revolving credit facility with a discussion of the current and anticipated impact on our securitizations program from the adverse conditions present$1.0 billion five-year revolving credit facility that expires in the United States asset-backed securities and commercial paper markets.
We may, from time to time, depending on October 8, 2009. We have begun discussions with lenders to renewmarket conditions and other factors, repurchase our revolving credit facility, which expires on July 7, 2011. We expect to renewoutstanding indebtedness, whether or not such facility during the firstindebtedness trades above or second quarter of 2010.
56
During 20092011 and 2008,2010, we had a net change in cash and cash equivalents of $19($14) million and ($74)$1 million, respectively. The following table summarizes such changes:
| Year Ended December 31, | ||||||||||||
| 2009 | 2008 | Change | ||||||||||
| Cash provided by/(used in): | ||||||||||||
| Operating activities | $ | 689 | $ | 109 | $ | 580 | ||||||
| Investing activities | (109 | ) | (319 | ) | 210 | |||||||
| Financing activities | (561 | ) | 166 | (727 | ) | |||||||
| Effects of changes in exchange rate on cash and cash equivalents | — | (30 | ) | 30 | ||||||||
| Net change in cash and cash equivalents | $ | 19 | $ | (74 | ) | $ | 93 | |||||
| Year Ended December 31, | ||||||||||||
| 2011 | 2010 | Change | ||||||||||
Cash provided by/(used in): | ||||||||||||
Operating activities | $ | 1,003 | $ | 635 | $ | 1368 | ||||||
Investing activities | (256 | ) | (418 | ) | 162 | |||||||
Financing activities | (753 | ) | (219 | ) | (534 | ) | ||||||
Effects of changes in exchange rate on cash and cash equivalents | (8 | ) | 3 | (11 | ) | |||||||
|
|
|
|
|
| |||||||
Net change in cash and cash equivalents | $ | (14 | ) | $ | 1 | $ | (15 | ) | ||||
|
|
|
|
|
| |||||||
Operating Activities
During 2009,the 2011, net cash provided by operating activities increased $580$368 million as compared to 2008,2010 primarily reflecting better working capital (net change in assets and liabilities, excluding the impact of acquisitions) utilization resulting from:
the absence of a net payment of $145 million in 2010 relating to the IRS settlement, which principally reflects:was reflected within due to former Parent and subsidiaries;
$62 million of lower cash utilization resulting | |
the absence of a $51 million reduction in inventory resulted from our planaccrued liabilities recorded during the third quarter of 2010 related to reduce gross VOI sales during 2009 in orderthe resolution of and adjustment to reduce our needcertain contingent liabilities and assets.
Also contributing to access the asset-backed securities markets. Such increasesincrease in net cash provided byfrom operating activities were partially offset bywas $55 million of higher cash income which included a $402$67 million reductionrefund for value-added taxes and related interest income of deferred revenues related to VOI sales under the percentage of completion method of accounting.
Investing Activities
During 2009,2011, net cash used in investing activities decreased $210$162 million as compared to 2008,2010, principally reflecting $209 million of lower payments for acquisitions, partially offset by a $72 million increase in capital spending primarily for construction on our Wyndham Grand hotel in Orlando and information technology related initiatives.
Financing Activities
During 2011, net cash used in financing activities increased $534 million as compared to 2010, which principally reflects:
Such decreasesincreases in cash outflows were partially offset by lower escrow deposits restricted cash inflows of $33 million primarily due to lower VOI sales and timing differences between our deeding and sales processes.
Convertible Debt.During 2011, we repurchased a portion of our remaining convertible notes with carrying value of $251 million primarily resulting from the completion of a cash tender offer ($95 million for the portion of convertible notes, including the unamortized discount, and $156 million for the related bifurcated conversion feature) for $262 million. Concurrent with the repurchases, we settled (i) a portion of the call options for proceeds of $155 million, which resulted in an additional loss of $1 million, and (ii) a portion of the warrants with payments of $112 million. As a result of these transactions, we made net payments of $219 million and incurred total losses of $12 million during 2011 and reduced the number of shares related to the warrants (“Warrants”) to approximately 1 million as of December 31, 2011.
During 2010, we utilized some of our cash flow to retire a portion of our convertible notes and settle a related portion of our call options and Warrants. We repurchased approximately 50%, or $114 million face value, of our $230 million convertible notes that had a carrying value of $239 million ($101 million for the portion of convertible notes, including the unamortized discount, and $138 million for the bifurcated conversion feature) for $250 million. Concurrent with the repurchase, we settled (i) a portion of our call options for proceeds of $136 million and (ii) a portion of our Warrants with payments of $98 million. As a result of these transactions, we made net payments of $212 million and incurred total losses of $14 million during 2010. This transaction reduced the number of Warrants related to the convertible transaction by approximately 9 million and, as such, we had approximately 9 million Warrants outstanding as of December 31, 2010.
Senior Unsecured Notes. During the first quarter of 2011, we issued senior unsecured debt for net proceeds of $245 million. We utilized the proceeds from our May 2009this debt issuances, as well as operating cash,issuance to reduce our outstanding indebtedness, including the principal amountrepurchase of a portion of our outstanding convertible notes and repayment of borrowings under ourthe revolving credit facility, and other non-securitized borrowings.for general corporate purposes. For further detailed information about such borrowings, see Note 13 —– Long-Term Debt and Borrowing Arrangements. Concurrent with
Capital Deployment
We are focusing on optimizing cash flow and seeking to deploy capital for the salehighest possible returns. Ultimately, our business objective is to transform our cash and earnings profile, primarily by rebalancing our cash streams to achieve a greater proportion of the convertible notes, we entered into convertible note hedge and warrant transactions with certain counterparties that resulted in a net cash
57
During 2011, we spent $148$249 million on capital expenditures, equity investments and development advances during 2009 including $108primarily on (i) information technology enhancement projects, (ii) $46 million on the improvementfor construction of technologyour Wyndham Grand hotel in Orlando, (iii) renovations of bungalows at our Landal GreenParks business and maintenance of technological advantages and routine improvements, as well as $27 million of leasehold improvements related to the consolidation of two leased facilities into one, which we occupied during the first quarter of 2009, and $13 million of(iv) equity investments and development advances. WeDuring 2012, we anticipate spending approximately $175$195 million to $200$210 million on capital expenditures, equity investments and development advances during 2010. advances. Additionally, in an effort to support growth in the Wyndham Hotels and Resorts brand, we plan on investing approximately $200 million in mezzanine and other financing over the next several years.
In addition, we spent $189$79 million relating to vacation ownership development projects (inventory) during 2009.2011. We anticipate spending on average approximately $150 million annually from 2011 through 2015 on vacation ownership development projects (approximately $110 million to $120 million during 2012), including projects currently under development. We believe that our vacation ownership business willcurrently has adequate finished inventory on our balance sheet to support vacation ownership sales. After factoring in the anticipated additional average spending of approximately $150 million annually from 2011 through 2015, we expect to have adequate inventory through 2012 and thus we plan to sell the vacation ownership inventory that is currently on our balance sheet and complete vacation ownership projects currently under development. As a result, we anticipate spending approximately $120 million to $130 million during 2010. at least 2016.
We expect that the majority of the expenditures that will be required to pursue our capital spending programs, strategic investments and vacation ownership development projects will be financed with cash flow generated through operations. Additional expenditures are financed with general unsecured corporate borrowings, including through the use of available capacity under our $900 million revolving credit facility.
Share Repurchase Program
We expect to generate annual net cash provided by operating activities less capital expenditures, equity investments and development advances in the range of approximately $600 million to $700 million in 2012. A portion of this cash flow is expected to be returned to our shareholders in the form of share repurchases. On August 20, 2007, our Board of Directors (the “Board”) authorized a stock repurchase program that enablesenabled us to purchase up to $200 million of our common stock. We suspended suchOn July 22, 2010, the Board increased the authorization by $300 million and further increased the authorization by $500 million on both April 25, 2011 and August 11, 2011, bringing the total share authorization under our current program during the third quarter of 2008. On February 10,to $1.5 billion. From August 20, 2007 through December 31, 2010, we announced our plan to resume repurchasesrepurchased 11.4 million shares at an average price of our common$25.78 for a cost of $295 million and repurchase capacity increased $53 million from proceeds received from stock under such program.
During the period January 1, 2012 through February 16, 2012, we repurchased an additional 2 million shares at an average price of $40.04 for a cost of $79 million. We currently have $295 million remaining availability in our program. The amount and timing of specific repurchases are subject to market conditions, applicable legal requirements and other factors. Repurchases may be conducted in the open market or in privately negotiated transactions.
Contingent Tax Liabilities
On July 15, 2010, Cendant and subjectthe IRS agreed to varying interpretations. Therefore, our tax accruals reflect a series of complex judgments about future events and rely heavily on estimates and assumptions. While we believe thatsettle the estimates and assumptions supporting our tax accruals are reasonable, tax audits and any related litigation could result in tax liabilities for us that are materially different than those reflected in our historical income tax provisions and recorded assets and liabilities. The result of an audit or litigation could have a material adverse effect on our income tax provision, net income,and/or cash flows in the period or periods to which such audit or litigation relates.
58
As a result of the agreement with the IRS, we (i) reversed $190 million in net deferred tax liabilities allocated from Cendant on the Separation Date with a corresponding increase to stockholders’ equity and (ii) recognized a $55 million gain ($42 million, net of tax) with a corresponding decrease to general and administrative expenses during the third quarter of 2010. During the fourth quarter of 2010, we recorded a $2 million reduction to deferred tax assets allocated from Cendant on the Separation Date with a corresponding decrease to stockholders’ equity (see Note 23 — Separation Adjustments and Transactions with Former Parent and Subsidiaries for more information).
Financial Obligations
Our indebtedness consisted of:
| December 31, | December 31, | |||||||
| 2009 | 2008 | |||||||
Securitized vacation ownership debt (a): | ||||||||
| Term notes | $ | 1,112 | $ | 1,252 | ||||
Previous bank conduit facility (b) | — | 417 | ||||||
2008 bank conduit facility (c) | 395 | 141 | ||||||
| Total securitized vacation ownership debt | $ | 1,507 | $ | 1,810 | ||||
Long-term debt: | ||||||||
6.00% senior unsecured notes (due December 2016) (d) | $ | 797 | $ | 797 | ||||
| Term loan (due July 2011) | 300 | 300 | ||||||
Revolving credit facility (due July 2011) (e) | — | 576 | ||||||
9.875% senior unsecured notes (due May 2014) (f) | 238 | — | ||||||
3.50% convertible notes (due May 2012) (g) | 367 | — | ||||||
Vacation ownership bank borrowings (h) | 153 | 159 | ||||||
| Vacation rentals capital leases | 133 | 139 | ||||||
| Other | 27 | 13 | ||||||
| Total long-term debt | $ | 2,015 | $ | 1,984 | ||||
| December 31, 2011 | December 31, 2010 | |||||||
Securitized vacation ownership debt: (a) | ||||||||
Term notes | $ | 1,625 | $ | 1,498 | ||||
Bank conduit facility(b) | 237 | 152 | ||||||
|
|
|
| |||||
Total securitized vacation ownership debt | $ | 1,862 | $ | 1,650 | ||||
|
|
|
| |||||
Long-term debt: | ||||||||
Revolving credit facility (due July 2016)(c) | $ | 218 | $ | 154 | ||||
6.00% senior unsecured notes (due December 2016)(d) | 811 | 798 | ||||||
9.875% senior unsecured notes (due May 2014)(e) | 243 | 241 | ||||||
3.50% convertible notes (due May 2012)(f) | 36 | 266 | ||||||
7.375% senior unsecured notes (due March 2020)(g) | 247 | 247 | ||||||
5.75% senior unsecured notes (due February 2018)(h) | 247 | 247 | ||||||
5.625% senior unsecured notes (due March 2021)(i) | 245 | — | ||||||
Vacation rentals capital leases(j) | 102 | 115 | ||||||
Other | 4 | 26 | ||||||
|
|
|
| |||||
Total long-term debt | $ | 2,153 | $ | 2,094 | ||||
|
|
|
| |||||
Represents non-recourse debt that currently is securitized through 13 bankruptcy-remote special purpose entities (“SPEs”), the creditors of which have no recourse to |
| (b) | ||
Represents a |
The revolving credit facility has a total capacity of |
Represents senior unsecured notes we issued during December 2006. The balance as of December 31, 2011 represents $800 million aggregate principal less $2 million of unamortized discount, plus $13 million of unamortized gains from the settlement of a derivative. |
| (e) | Represents senior unsecured notes we issued during May 2009. |
Represents |
| December 31, 2011 | December 31, 2010 | |||||||
Debt principal | $ | 12 | $ | 116 | ||||
Unamortized discount | — | (12 | ) | |||||
|
|
|
| |||||
Debt less discount | 12 | 104 | ||||||
Fair value of bifurcated conversion feature(*) | 24 | 162 | ||||||
|
|
|
| |||||
Convertible notes | $ | 36 | $ | 266 | ||||
|
|
|
| |||||
| (*) | We also have an asset with a fair value equal to the bifurcated conversion feature, which represents cash-settled call options that we purchased concurrent with the issuance of the convertible notes. |
| (g) | Represents senior unsecured notes we issued during February 2010. The balance as of December 31, |
| (h) | Represents senior unsecured notes we issued during September 2010. The balance as of December 31, 2011 represents $250 million aggregate principal less $3 million of unamortized discount. |
| (i) | Represents senior unsecured notes we issued during March 2011. The balance as of December 31, 2011 represents $250 million aggregate principal less $5 million of unamortized discount. |
| (j) | Represents capital lease obligations with corresponding assets classified within property and equipment on our | |
20092011 Debt Issuances
During 2009, we closed five term securitizations and a secured, revolving foreign credit facility. Additionally,2011, we issued senior unsecured andnotes, closed three term securitizations, renewed our securitized bank conduit facility, repurchased a portion of our convertible notes and renewedreplaced our securitized vacation ownership bank conduitrevolving credit facility. For further detailed information about such debt, see Note 13 — Long-TermLong-term Debt and Borrowing Arrangements.
59
Capacity
| Total | Outstanding | Available | ||||||||||
| Capacity | Borrowings | Capacity | ||||||||||
Securitized vacation ownership debt: | ||||||||||||
| Term notes | $ | 1,112 | $ | 1,112 | $ | — | ||||||
| 2008 bank conduit facility | 600 | 395 | 205 | |||||||||
Total securitized vacation ownership debt (a) | $ | 1,712 | $ | 1,507 | $ | 205 | ||||||
Long-term debt: | ||||||||||||
| 6.00% senior unsecured notes (due December 2016) | $ | 797 | $ | 797 | $ | — | ||||||
| Term loan (due July 2011) | 300 | 300 | — | |||||||||
Revolving credit facility (due July 2011) (b) | 900 | — | 900 | |||||||||
| 9.875% senior unsecured notes (due May 2014) | 238 | 238 | — | |||||||||
| 3.50% convertible notes (due May 2012) | 367 | 367 | — | |||||||||
Vacation ownership bank borrowings (c) | 191 | 153 | 38 | |||||||||
Vacation rentals capital leases (d) | 133 | 133 | — | |||||||||
| Other | 53 | 27 | 26 | |||||||||
| Total long-term debt | $ | 2,979 | $ | 2,015 | 964 | |||||||
Less: Issuance of letters of credit (b) | 31 | |||||||||||
| $ | 933 | |||||||||||
| Securitized bank conduit facility (a) | Revolving credit facility | |||||||
Total capacity | $ | 600 | $ | 1,000 | ||||
Less: Outstanding borrowings | 237 | 218 | ||||||
|
|
|
| |||||
Available capacity | $ | 363 | $ | 782 | (b) | |||
|
|
|
| |||||
| (a) | The capacity of this facility is subject to our ability to provide additional assets to collateralize additional securitized borrowings. |
The capacity under our revolving credit facility includes availability for letters of credit. As of December 31, | ||
Vacation Ownership Contract ReceivablesTransfer and SecuritizationsServicing of Financial Assets
We pool qualifying vacation ownership contract receivables and sell them to bankruptcy-remote entities. Vacation ownership contract receivables qualify for securitization based primarily on the credit strength of the VOI purchaser to whom financing has been extended. Vacation ownership contract receivables currently are securitized through 13 bankruptcy-remote SPEs that are consolidated within our Consolidated Financial Statements. As a result, we do not recognize gains or losses resulting from these securitizations at the time of sale to the SPEs. IncomeInterest income is recognized when earned over the contractual life of the vacation ownership contract receivables. We continue to service the securitized vacation ownership contract receivables pursuant to servicing agreements negotiated on an arms-length basis based on market conditions. The activities of these SPEs are limited to (i) purchasing vacation ownership contract receivables from our vacation ownership subsidiaries; (ii) issuing debt securitiesand/or borrowing under a conduit facility to fund such purchases; and (iii) entering into derivatives to hedge interest rate exposure. The securitized assets of thesebankruptcy-remote SPEs are legally separate from us. The receivables held by the bankruptcy-remote SPEs are not available to pay our general obligations.creditors and legally are not our assets. Additionally, the creditors of these SPEs have no recourse to us.
The assets and debtliabilities of these vacation ownership SPEs are as follows:
| December 31, | December 31, | |||||||
| 2009 | 2008 | |||||||
| Securitized contract receivables, gross | $ | 2,591 | $ | 2,748 | ||||
| Securitized restricted cash | 133 | 155 | ||||||
| Interest receivables on securitized contract receivables | 20 | 22 | ||||||
Other assets (a) | 11 | 4 | ||||||
Total securitized assets (b) | 2,755 | 2,929 | ||||||
| Securitized term notes | 1,112 | 1,252 | ||||||
| Securitized conduit facilities | 395 | 558 | ||||||
Other liabilities (c) | 26 | 47 | ||||||
| Total securitized liabilities | 1,533 | 1,857 | ||||||
| Securitized assets in excess of securitized liabilities | $ | 1,222 | $ | 1,072 | ||||
| December 31, 2011 | December 31, 2010 | |||||||
Securitized contract receivables, gross | $ | 2,485 | $ | 2,703 | ||||
Securitized restricted cash | 132 | 138 | ||||||
Interest receivables on securitized contract receivables | 20 | 22 | ||||||
Other assets (a) | 1 | 2 | ||||||
|
|
|
| |||||
Total SPE assets(b) | 2,638 | 2,865 | ||||||
|
|
|
| |||||
Securitized term notes | 1,625 | 1,498 | ||||||
Securitized conduit facilities | 237 | 152 | ||||||
Other liabilities(c) | 11 | 22 | ||||||
|
|
|
| |||||
Total SPE liabilities | 1,873 | 1,672 | ||||||
|
|
|
| |||||
SPE assets in excess of SPE liabilities | $ | 765 | $ | 1,193 | ||||
|
|
|
| |||||
Includes interest rate derivative contracts and related assets. |
| (b) | Excludes deferred financing costs of $26 million and $22 million as of December 31, 2011 and 2010, respectively, related to securitized debt. |
| (c) | Primarily includes interest rate derivative contracts and accrued interest on securitized debt. |
60
| December 31, | December 31, | |||||||
| 2009 | 2008 | |||||||
| Securitized assets in excess of securitized liabilities | $ | 1,222 | $ | 1,072 | ||||
| Non-securitized contract receivables | 598 | 690 | ||||||
Secured contract receivables (*) | 262 | 199 | ||||||
| Allowance for loan losses | (370 | ) | (383 | ) | ||||
| Total, net | $ | 1,712 | $ | 1,578 | ||||
| ||||||||||||||||||||||||||||||||||||||||||||||||||||||||||||||||||||||||||
The revolving credit facility and unsecured term loan areis subject to covenants including the maintenance of specific financial ratios. The financial ratio covenants consist of a minimum consolidated interest coverage ratio of at least 3.0 to 1.0 as of the measurement date and a maximum consolidated leverage ratio not to exceed 3.53.75 to 1.0 onas of the measurement date. The consolidated interest coverage ratio is calculated by dividing Consolidatedconsolidated EBITDA (as defined in the credit agreement) by Consolidated Interest Expenseconsolidated interest expense (as defined in the credit agreement), both as measured on a trailing 12 month basis preceding the measurement date. As of December 31, 2009,2011, our consolidated interest coverage ratio was 8.59.2 times. Consolidated Interest Expenseinterest expense excludes, among other things, interest expense on any Securitization Indebtednesssecuritization indebtedness (as defined in the credit agreement). The consolidated leverage ratio is calculated by dividing Consolidated Total Indebtednessconsolidated total indebtedness (as defined in the credit agreement and which excludes, among other things, Securitization Indebtedness)securitization indebtedness) as of the measurement date by Consolidatedconsolidated EBITDA as measured on a trailing 12 month basis preceding the measurement date. As of December 31, 2009,2011, our consolidated leverage ratio was 2.1 times. Covenants in thesethis credit facilitiesfacility also include limitations on indebtedness of material subsidiaries; liens; mergers, consolidations, liquidations and dissolutions; sale of all or substantially all of our assets; and sale and leaseback transactions. Events of default in thesethis credit facilitiesfacility include failure to pay interest, principal and fees when due; breach of covenants;a covenant or warranty; acceleration of or failure to pay other debt in excess of $50 million (excluding securitization indebtedness); insolvency matters; and a change of control.
The 6.00% senior unsecured notes, 9.875% senior unsecured notes, 7.375% senior unsecured notes, 5.75% senior unsecured notes and 9.875%5.625% senior unsecured notes contain various covenants including limitations on liens, limitations on potential sale and leaseback transactions and change of control restrictions. In addition, there are limitations on mergers, consolidations and potential sale of all or substantially all of our assets. Events of default in the notes include failure to pay interest and principal when due, breach of a covenant or warranty, acceleration of other debt in excess of $50 million (excluding securitization indebtedness) and insolvency matters. The Convertible Notesconvertible notes do not contain affirmative or negative covenants, however, the limitations on mergers, consolidations and potential sale of all or substantially all of our assets and the events of default for our senior unsecured notes are applicable to such notes. Holders of the Convertible Notesconvertible notes have the right to require us to repurchase the Convertible Notesconvertible notes at 100% of principal plus accrued and unpaid interest in the event of a fundamental change, defined to include, among other things, a change of control, certain recapitalizations and if our common stock is no longer listed on a national securities exchange.
As of December 31, 2009,2011, we were in compliance with all of the financial covenants described above including the required financial ratios.
Each of our non-recourse, securitized term notes and the 2008 bank conduit facility containscontain various triggers relating to the performance of the applicable loan pools. If the vacation ownership contract receivables pool that collateralizes one of our securitization notes fails to perform within the parameters established by the contractual triggers (such as higher default or delinquency rates), there are provisions pursuant to which the cash flows for
that pool will be maintained in the securitization as extra collateral for the note holders or applied to amortizeaccelerate the repayment of outstanding principal held byto the noteholders.note holders. As of December 31, 2009,2011, all of our securitized loan pools were in compliance with applicable contractual triggers.
61
LIQUIDITY RISK
We believe that the 2008our bank conduit facility, with a term through October 2010June 2013 and capacity of $600 million, combined with our ability to issue term asset-backed securities, should provide sufficient liquidity for the lowerour expected sales pace and we expect to have available liquidity to finance the sale of VOIs.
Our $1.0 billion five-year revolving credit agreement, which expires in July 2016, contains a provision that is a condition of an extension of credit. The outstanding balanceprovision, which was standard market practice for issuers of our rating and industry at the time of our revolver renewal, allows the lenders to withhold an extension of credit if the representations and warranties we made at the time we executed the revolving credit facility agreement are not true and correct, in all material respects, at the time of the request of the extension of credit including if a development or event has or would reasonably be expected to have a material adverse effect on our previous bankbusiness, assets, operations or condition, financial or otherwise. The application of the material adverse effect provision contains exclusions for the impact resulting from disruptions in, or the inability of companies engaged in businesses similar to those engaged in by us and our subsidiaries to consummate financings in, the asset backed securities or conduit facility was repaid on October 8, 2009.
We closed on a facility with capacity of AUD 193 million during June 2009 and an additional bank joined the facility during July 2009, increasing the capacity to AUD 213 million (see Note 13 — Long-Term Debt and Borrowing Arrangements). This facility had a total of $153 million outstanding as of December 31, 2009 and is secured by vacation ownership contract receivables, as well as a standard Wyndham Worldwide Corporation guaranty.
Our liquidity position may also be negatively affected by unfavorable conditions in the capital markets in which we operate or if our vacation ownership contract receivables portfolios do not meet specified portfolio credit parameters. Our liquidity as it relates to our vacation ownership contract receivables securitization program could be adversely affected if we were to fail to renew or replace our conduit facility on its annual expiration date or if a particular receivables pool were to fail to meet certain ratios, which could occur in certain instances if the default rates or other credit metrics of the underlying vacation ownership contract receivables deteriorate. Our ability to sell securities backed by our vacation ownership contract receivables depends on the continued ability and willingness of capital market participants to invest in such securities.
As of December 31, 2009,2011, we had $205$363 million of availability under our asset-backed bank conduit facility. To the extent that the recent increases in funding costs in the securitization and commercial paper markets persist, they will negatively impact the cost of such borrowings. A continuedAny disruption to the asset-backed or commercial paper markets could adversely impact our ability to obtain such financings.
Our senior unsecured debt is rated BBB- with a “stable outlook” by Standard and Poor’s (“S&P”).Poor’s. During February 2010, S&P assigned a “stable outlook” to our senior unsecured debt. During April 2009,October 2011, Moody’s Investors Service (“Moody’s”) downgradedupgraded our senior unsecured debt rating to Ba2 (and our corporate family rating to Ba1)Baa3 with a “stable outlook”. A security rating is not a recommendation to buy, sell or hold securities and is subject to revision or withdrawal by the assigning rating organization. Currently, we expect no (i) material increaseReference in interest expenseand/this report to any such credit rating is intended for the limited
purpose of discussing or (ii) material reduction referring to aspects of our liquidity and of our costs of funds. Any reference to a credit rating is not intended to be any guarantee or assurance of, nor should there be any undue reliance upon, any credit rating or change in the availability of bonding capacity from the aforementioned downgradecredit rating, nor is any such reference intended as any inference concerning future performance, future liquidity or negative outlook; however, a further downgrade by Moody’sand/or S&P could impact ourany future borrowingand/or bonding costs and availability of such bonding capacity.
As a result of the sale of Realogy on April 10, 2007, Realogy’s senior debt credit rating was downgraded to below investment grade. Under the Separation Agreement, if Realogy experienced such a change of control and suffered such a ratings downgrade, it was required to post a letter of credit in an amount acceptable to us and Avis Budget Group to satisfy the fair value of Realogy’s indemnification obligations for the Cendant legacy contingent liabilities in the event Realogy does not otherwise satisfy such obligations to the extent they become due. On
62
SeasonalitySEASONALITY
We experience seasonal fluctuations in our net revenues and net income from our franchise and management fees, commission income earned from renting vacation properties, annual subscription fees or annual membership dues, as applicable, and exchange and member-related transaction fees and sales of VOIs. Revenues from franchise and management fees are generally higher in the second and third quarters than in the first or fourth quarters, because of increased leisure travel during the summer months. Revenues from rental income earned from vacation rentals are generally highest in the third quarter, when vacation rentals are highest. Revenues from vacation exchange and member-related transaction fees are generally highest in the first quarter, which is generally when members of our vacation exchange business plan and book their vacations for the year. Historically, revenuesRevenues from sales of VOIs wereare generally higher in the second and third quartersquarter than in other quarters. We expect such trend to continue during 2010. However, during 2009, as the economy continued to stabilize, revenues from sales of VOIs were highest during the third and fourth quarters. The seasonality of our business may cause fluctuations in our quarterly operating results. As we expand into new markets and geographical locations, we may experience increased or different seasonality dynamics that create fluctuations in operating results different from the fluctuations we have experienced in the past.
SEPARATION ADJUSTMENTSAND TRANSACTIONSWITH FORMER PARENTAND SUBSIDIARIES
Separation Adjustments and Transactions with Former Parent and Subsidiaries
Pursuant to the Separation and Distribution Agreement, upon the distribution of our common stock to Cendant shareholders, we entered into certain guarantee commitments with Cendant (pursuant to the assumption of certain liabilities and the obligation to indemnify Cendant, Realogy and Travelport for such liabilities) and guarantee commitments related to deferred compensation arrangements with each of Cendant and Realogy. These guarantee arrangements primarily relate to certain contingent litigation liabilities, contingent tax liabilities, and Cendant contingent and other corporate liabilities, of which we assumed and are responsible for 37.5%, while Realogy is responsible for the remaining 62.5%. The remaining amount of liabilities which we assumed in connection with the Separation was $310$49 million and $343$78 million as of December 31, 20092011 and 2008,2010, respectively. These amounts were comprised of certain Cendant corporate liabilities which were recorded on the books of Cendant as well as additional liabilities which were established for guarantees issued at the date of Separation related to certain unresolved contingent matters and certain others that could arise during the guarantee period. Regarding the guarantees, if any of the companies responsible for all or a portion of such liabilities were to default in its payment of costs or expenses related to any such liability, we would be responsible for a portion of the defaulting party or parties’ obligation. We also provided a default guarantee related to certain deferred compensation arrangements related to certain current and former senior officers and directors of Cendant,
Realogy and Travelport. These arrangements, which are discussed in more detail below, have been valued upon the Separation in accordance with the guidance for guarantees and recorded as liabilities on the Consolidated Balance Sheets. To the extent such recorded liabilities are not adequate to cover the ultimate payment amounts, such excess will be reflected as an expense to the results of operations in future periods.
As of December 31, 2011, the $49 million of Separation related liabilities is comprised of $5 million for litigation matters, $272$41 million for tax liabilities, $23$3 million for liabilities of previously sold businesses of Cendant, $8$3 million for other contingent and corporate liabilities and $2 million of liabilities where the calculated guarantee amount exceeded the contingent liability assumed at the date of Separation. In connection with these liabilities, $245$10 million is recorded in current due to former Parent and subsidiaries and $63$37 million is recorded in long-term due to former Parent and subsidiaries as of December 31, 20092011 on the Consolidated Balance Sheet. We are indemnifyingwill indemnify Cendant for these contingent liabilities and therefore any payments would be made to the third party through the former Parent. The $2 million relating to guarantees is recorded in other current liabilities as of December 31, 20092011 on the Consolidated Balance Sheet. The actual timing of payments relating to these liabilities is dependent on a variety of factors beyond our control. See Contractual Obligations for the estimated timing of such payments. In addition, as of December 31, 2009,2011, we have $5had $3 million of receivables due from former Parent and subsidiaries primarily relating to income taxes, which is recorded in other current assets on the Consolidated Balance Sheet. Such receivables totaled $3$4 million as of December 31, 2008.
63
64
CONTRACTUAL OBLIGATIONS
Transactions with Avis Budget Group, Realogy and Travelport
| 2010 | 2011 | 2012 | 2013 | 2014 | Thereafter | Total | ||||||||||||||||||||||
Securitized debt (a) | $ | 209 | $ | 505 | $ | 169 | $ | 182 | $ | 186 | $ | 256 | $ | 1,507 | ||||||||||||||
| Long-term debt | 175 | 314 | 388 | 11 | 250 | 877 | 2,015 | |||||||||||||||||||||
| Interest on securitized and long-term debt | 211 | 167 | 129 | 112 | 85 | 117 | 821 | |||||||||||||||||||||
| Operating leases | 67 | 59 | 45 | 33 | 25 | 105 | 334 | |||||||||||||||||||||
Other purchase commitments (b) | 194 | 115 | 62 | 7 | 3 | 138 | 519 | |||||||||||||||||||||
Contingent liabilities (c) | 184 | 81 | 45 | — | — | — | 310 | |||||||||||||||||||||
Total (d) | $ | 1,040 | $ | 1,241 | $ | 838 | $ | 345 | $ | 549 | $ | 1,493 | $ | 5,506 | ||||||||||||||
| 2012 | 2013 | 2014 | 2015 | 2016 | Thereafter | Total | ||||||||||||||||||||||
Securitized debt(a) | $ | 196 | $ | 249 | $ | 368 | $ | 205 | $ | 201 | $ | 643 | $ | 1,862 | ||||||||||||||
Long-term debt | 46 | 11 | 255 | 12 | 1,041 | 788 | 2,153 | |||||||||||||||||||||
Interest on debt(b) | 212 | 207 | 187 | 176 | 170 | 156 | 1,108 | |||||||||||||||||||||
Operating leases | 83 | 57 | 46 | 45 | 41 | 294 | 566 | |||||||||||||||||||||
Other purchase commitments (c) | 181 | 45 | 28 | 20 | 19 | 142 | 435 | |||||||||||||||||||||
Contingent liabilities(d) | 10 | 39 | — | — | — | — | 49 | |||||||||||||||||||||
|
|
|
|
|
|
|
|
|
|
|
|
|
| |||||||||||||||
Total (e) | $ | 728 | $ | 608 | $ | 884 | $ | 458 | $ | 1,472 | $ | 2,023 | $ | 6,173 | ||||||||||||||
|
|
|
|
|
|
|
|
|
|
|
|
|
| |||||||||||||||
Represents debt that currently is securitized through 13 bankruptcy-remote SPEs, the creditors to which have no recourse to |
Includes interest on both securitized and long-term debt; estimated using the stated interest rates on our long-term debt and the swapped interest rates on our securitized debt. |
| (c) | Primarily represents commitments |
Primarily represents certain contingent litigation liabilities, contingent tax liabilities and 37.5% of Cendant contingent and other corporate liabilities, which we assumed and are responsible for pursuant to our separation from Cendant. |
Excludes |
In addition to the above and in connection with our separation from Cendant, we entered into certain guarantee commitments with Cendant (pursuant to our assumption of certain liabilities and our obligation to indemnify Cendant, Realogy and Travelport for such liabilities) and guarantee commitments related to deferred compensation arrangements with each of Cendant and Realogy. These guarantee arrangements primarily relate to certain contingent litigation liabilities, contingent tax liabilities, and Cendant contingent and other corporate liabilities, of which we assumed and are responsible for 37.5% of these Cendant liabilities. Additionally, if any of
the companies responsible for all or a portion of such liabilities were to default in its payment of costs or expenses related to any such liability, we are responsible for a portion of the defaulting party or parties’ obligation. We also provide a default guarantee related to certain deferred compensation arrangements related to certain current and former senior officers and directors of Cendant and Realogy. These arrangements were valued upon our separation from Cendant with the assistance of third-party experts in accordance with guidance for guarantees and recorded as liabilities on our balance sheet. To the extent such recorded liabilities are not adequate to cover the ultimate payment amounts, such excess will be reflected as an expense to our results of operations in future periods. See Separation Adjustments and Transactions with former Parent and Subsidiaries discussion for details of guaranteed liabilities.
65
OTHER COMMERCIAL COMMITMENTSAND OFF-BALANCE SHEET ARRANGEMENTS
Standard Guarantees/Indemnifications.In the ordinary course of business, we enter into agreements that contain standard guarantees and indemnities whereby we indemnify another party for specified breaches of or third-party claims relating to an underlying agreement. Such underlying agreements are typically entered into by one of our subsidiaries. The various underlying agreements generally govern purchases, sales or outsourcing of assetsproducts or businesses,services, leases of real estate, licensing of trademarks,software and/or development of vacation ownership properties, access to credit facilities, derivatives and issuances of debt securities. While a majority of these guarantees and indemnifications extend only for the duration of the underlying agreement, some survive the expiration of the agreement. We are not able to estimate the maximum potential amount of future payments to be made under these guarantees and indemnifications as the triggering events are not predictable. In certain cases we maintain insurance coverage that may mitigate any potential payments.
Other Guarantees/Indemnifications.In the ordinary course of business, our vacation ownership business provides guarantees to certain owners’ associations for funds required to operate and maintain vacation ownership properties in excess of assessments collected from owners of the VOIs. We may be required to fund such excess as a result of unsold Company-owned VOIs or failure by owners to pay such assessments. In addition, from time to time, we will agree to reimburse certain owner associations up to 75% of their uncollected assessments. These guarantees extend for the duration of the underlying subsidy or similar agreement (which generally approximate one year and are renewable at our discretion on an annual basis) or until a stipulated percentage (typically 80% or higher) of related VOIs are sold. The maximum potential future payments that we could be required to make under these guarantees was approximately $360$372 million as of December 31, 2009.2011. We would only be required to pay this maximum amount if none of the owners assessed paid their assessments. Any assessments collected from the owners of the VOIs would reduce the maximum potential amount of future payments to be made by us. Additionally, should we be required to fund the deficit through the payment of any owners’ assessments under these guarantees, we would be permitted access to the property for our own use and may use that property to engage in revenue-producing activities, such as rentals. During 2009, 20082011, 2010 and 2007,2009, we made payments related to these guarantees of $10$17 million, $7$12 million and $5$10 million, respectively. As of December 31, 20092011 and 2008,2010, we maintained a liability in connection with these guarantees of $22$24 million and $37$17 million, respectively, on our Consolidated Balance Sheets.
From time to time, we may enter into a hotel management agreement that provides the hotel owner with a minimum return. Under such agreement, we would be required to compensate for any shortfall over the life of the management agreement up to a specified aggregate amount. Our exposure under these guarantees is partially mitigated by our ability to terminate any such management agreement if certain targeted operating results are not
met. Additionally, we are able to recapture a portion or all of the shortfall payments and any waived fees in the event that future operating results exceed targets. As of December 31, 2009,2011, the maximum potential amount of future payments to be made under these guarantees iswas $16 million with an annual cap of $3 million or less. As of both December 31, 20092011 and 2008,2010, we maintained a liability in connection with these guarantees of less than $1 million on our Consolidated Balance Sheets.
As part of our WAAM, we may guarantee to reimburse the developer a certain payment or to purchase from the developer inventory associated with the developer’s resort property for a percentage of the original sale price if certain future conditions exist. The maximum potential future payments that we could be required to make under these guarantees was approximately $31 million as of December 31, 2011. As of both December 31, 2011 and 2010, we had no recognized liabilities in connection with these guarantees.
Securitizations.Securitizations. We pool qualifying vacation ownership contract receivables and sell them to bankruptcy-remote entities all of which are consolidated into the accompanying Consolidated Balance Sheet as of December 31, 2009.
Letters of Credit.Credit. As of December 31, 20092011 and 2008,2010, we had $31$11 million and $33$28 million, respectively, of irrevocable standby letters of credit outstanding, which mainly support development activity at our vacation ownership business.
Critical Accounting PoliciesCRITICAL ACCOUNTING POLICIES
In presenting our financial statements in conformity with generally accepted accounting principles, we are required to make estimates and assumptions that affect the amounts reported therein. Several of the estimates and assumptions we are required to make relate to matters that are inherently uncertain as they pertain to future events. However, events that are outside of our control cannot be predicted and, as such, they cannot be contemplated in evaluating such estimates and assumptions. If there is a significant unfavorable change to current conditions, it could result in a material adverse impact to our consolidated results of operations, financial position and liquidity. We believe that the estimates and assumptions we used when preparing our financial statements were the most appropriate at that time. Presented below are those accounting policies that we believe require subjective and
66
Vacation Ownership Revenue Recognition. Our sales of VOIs are either cash sales or seller-financed sales. In order for us to recognize revenues of VOI sales under the full accrual method of accounting described in the guidance for sales of real estate for fully constructed inventory, a binding sales contract must have been executed, the statutory rescission period must have expired (after which time the purchasers are not entitled to a refund except for non-delivery by us), receivables must have been deemed collectible and the remainder of our obligations must have been substantially completed. In addition, before we recognize any revenues on VOI sales, the purchaser of the VOI must have met the initial investment criteria and, as applicable, the continuing investment criteria, by executing a legally binding financing contract. A purchaser has met the initial investment criteria when a minimum down payment of 10% is received by us. In accordance with the requirements of the guidance for real estate time-sharing transactions we must also take into consideration the fair value of certain incentives provided to the purchaser when assessing the adequacy of the purchaser’s initial investment. In those cases where financing is provided to the purchaser by us, the purchaser is obligated to remit monthly payments under financing contracts that represent the purchaser’s continuing investment. The contractual terms of seller-provided financing arrangements require that the contractual level of annual principal payments be sufficient to amortize the loan over a customary period for the VOI being financed, which is generally ten years, and payments under the financing contracts begin within 45 days of the sale and receipt of the minimum down payment of 10%.
If all of the criteria for a VOI sale to qualify under the full accrual method of accounting have been met, as discussed above, except that construction of the VOI purchased is not complete, we recognize revenues using thepercentage-of-completion POC method of accounting provided that the preliminary construction phase is complete and that a minimum sales level has been met (to assure that the property will not revert to a rental property). The preliminary stage of development is deemed to be complete when the engineering and design work is complete, the construction contracts have been executed, the site has been cleared, prepared and excavated, and the building foundation is complete. The completion percentage is determined by the proportion of real estate inventory costs incurred to total estimated costs. These estimated costs are based upon historical experience and the related contractual terms. The remaining revenues and related costs of sales, including commissions and direct expenses, are deferred and recognized as the remaining costs are incurred. Until a contract for sale qualifies for revenue recognition, all payments received are accounted for as restricted cash and deposits within other current assets and deferred income, respectively, on the Consolidated Balance Sheets. Commissions and other direct costs related to the sale are deferred until the sale is recorded. If a contract is cancelled before qualifying as a sale, non-recoverable expenses are charged to the current period as part of operating expenses on the Consolidated Statements of Operations.Income. Changes in costs could lead to adjustments to the percentage of completionPOC status of a project, which may result in differencedifferences in the timing and amount of revenues recognized from the construction of vacation ownership properties. This policy is discussed in greater detail in Note 2 to the Consolidated Financial Statements.
Allowance for Loan Losses.Losses. In our Vacation Ownership segment, we provide for estimated vacation ownership contract receivable cancellations at the time of VOI sales by recording a provision for loan losses as a reduction of VOI sales on the Consolidated Statements of Operations.Income. We assess the adequacy of the allowance for loan losses based on the historical performance of similar vacation ownership contract receivables. We use a technique referred to as static pool analysis, which tracks defaults for each year’s sales over the entire life of those contract receivables. We consider current defaults, past due aging, historical write-offs of contracts and consumer credit scores (FICO scores) in the assessment of borrower’s credit strength and expected loan performance. We also consider whether the historical economic conditions are comparable to current economic conditions. If current conditions differ from the conditions in effect when the historical experience was generated, we adjust the allowance for loan losses to reflect the expected effects of the current environment on the collectability of our vacation ownership contract receivables.
Impairment of Long-Lived Assets.With regard to the goodwill and other indefinite-lived intangible assets recorded in connection with business combinations, we annually (during the fourth quarter of each year subsequent to completing our annual forecasting process) or, more frequently if circumstances indicate impairment may have occurred that would more likely than not reduce the fair value of a reporting unit below its carrying amount, reviewsreview the reporting units’ carrying values as required by the guidance for goodwill and other intangible assets. We evaluate goodwill for impairment using the two-step process prescribed in the guidance. The first step is to compare the estimated fair value of any reporting unit within the companyCompany that havehas recorded goodwill with the recorded net book value (including the goodwill) of the reporting unit. If the estimated fair value of the reporting unit is higher than the recorded net book value, no impairment is deemed to exist and no further testing is required. If, however, the estimated fair value of the reporting unit is below the recorded net book value, then a second step must be performed to determine the goodwill impairment required, if any. In this second step, the estimated fair value from the first step is used as the purchase price in a hypothetical acquisition of the reporting unit. Purchase business
67
Quoted market prices for our reporting units are not available; therefore, management must apply judgment in determining the estimated fair value of these reporting units for purposes of performing the annual goodwill impairment test. Management uses all available information to make these fair value determinations, including
the present values of expected future cash flows using discount rates commensurate with the risks involved in the assets. Inherent in such fair value determinations are certain judgments and estimates relating to future cash flows, including our interpretation of current economic indicators and market valuations, and assumptions about our strategic plans with regard to our operations. To the extent additional information arises, market conditions change or our strategies change, it is possible that our conclusion regarding whether existing goodwill is impaired could change and result in a material effect on our consolidated financial position or results of operations. In performing our impairment analysis, we develop our estimated fair values for our reporting units using a combination of the discounted cash flow methodology and the market multiple methodology.
The discounted cash flow methodology establishes fair value by estimating the present value of the projected future cash flows to be generated from the reporting unit. The discount rate applied to the projected future cash flows to arrive at the present value is intended to reflect all risks of ownership and the associated risks of realizing the stream of projected future cash flows. The discounted cash flow methodology uses our projections of financial performance for a five-year period. The most significant assumptions used in the discounted cash flow methodology are the discount rate, the terminal value and expected future revenues, gross margins and operating margins, which vary among reporting units.
We use a market multiple methodology to estimate the terminal value of each reporting unit by comparing such reporting unit to other publicly traded companies that are similar from an operational and economic standpoint. The market multiple methodology compares each reporting unit to the comparable companies on the basis of risk characteristics in order to determine the risk profile relative to the comparable companies as a group. This analysis generally focuses on quantitative considerations, which include financial performance and other quantifiable data, and qualitative considerations, which include any factors which are expected to impact future financial performance. The most significant assumption affecting our estimate of the terminal value of each reporting unit is the multiple of the enterprise value to earnings before interest, tax, depreciation and amortization.
To support our estimate of the individual reporting unit fair values, a comparison is performed between the sum of the fair values of the reporting units and our market capitalization. We use an average of our market capitalization over a reasonable period preceding the impairment testing date as being more reflective of our stock price trend than a single day,point-in-time market price. The difference is an implied control premium, which represents the acknowledgment that the observed market prices of individual trades of a company’s stock may not be representative of the fair value of the company as a whole. Estimates of a company’s control premium are highly judgmental and depend on capital market and macro-economic conditions overall. We evaluate the implied control premium for reasonableness.
Based on the results of our impairment evaluation performed during the fourth quarter of 2009,2011, we determined that no impairment charge of goodwill was required as the fair value of goodwill at our lodging and vacation exchange and rentals reporting units was substantially in excess of the carrying value.
We continue to monitor the goodwill recorded at our lodging and vacation exchange and rentals reporting units for indicators of impairment. If economic conditions were to deteriorate more than expected, or other significant assumptions such as estimates of terminal value were to change significantly, we may be required to record an impairment of the goodwill balance at our lodging and vacation and exchange and rentals reporting units.
We determine whether the carrying value of other indefinite-lived intangible assets is impaired on an annual basis or more frequently if indicators of potential impairment exist. Application of the other indefinite-lived intangible assets impairment test requires judgment in the assumptions underlying the approach used to determine fair value. The fair value of each other indefinite-lived intangible asset is estimated using a discounted cash flow methodology. This analysis requires significant judgments, including anticipated market conditions,
operating expense trends, estimation of future cash flows, which are dependent on internal forecasts, and estimation of long-term rate of growth. The estimates used to calculate the fair value of an other indefinite-lived intangible asset change from year to year based on operating results and market conditions. Changes in these estimates and assumption could materially affect the determination of fair value and the other indefinite-lived intangible assets impairment.
We also evaluate the recoverability of our other long-lived assets, including property and equipment and amortizable intangible assets, if circumstances indicate impairment may have occurred, pursuant to guidance for
68
Business Combinations.A component of our growth strategy has been to acquire and integrate businesses that complement our existing operations. We account for business combinations in accordance with the guidance for business combinations and related literature. Accordingly, we allocate the purchase price of acquired companies to the tangible and intangible assets acquired and liabilities assumed based upon their estimated fair values at the date of purchase. The difference between the purchase price and the fair value of the net assets acquired is recorded as goodwill.
In determining the fair values of assets acquired and liabilities assumed in a business combination, we use various recognized valuation methods including present value modeling and referenced market values (where available). Further, we make assumptions within certain valuation techniques including discount rates and timing of future cash flows. Valuations are performed by management or independent valuation specialists under management’s supervision, where appropriate. We believe that the estimated fair values assigned to the assets acquired and liabilities assumed are based on reasonable assumptions that marketplace participants would use. However, such assumptions are inherently uncertain and actual results could differ from those estimates
Accounting for Restructuring Activities. During 2008, we committed to restructuring actions and activities associated with strategic realignment initiatives targeted principally at reducing costs, enhancing organizational efficiency, reducing our need to access the asset-backed securities market and consolidating and rationalizing existing processes and facilities, which are accounted for under the guidance for post employment benefits and costs associated with exit and disposal activities. Our restructuringRestructuring actions require us to make significant estimates in several areas including: (i) expenses for severance and related benefit costs; (ii) the ability to generate sublease income, as well as our ability to terminate lease obligations; and (iii) contract terminations. The amounts that we have accrued as of December 31, 20092011 represent our best estimate of the obligations that we expect to incurincurred in connection with these actions, but could be subject to change due to various factors including market conditions and the outcome of negotiations with third parties. ShouldIn the event actual amounts differ from our estimates, the amount of the restructuring charges could be materially impacted.
Income Taxes.Taxes. We recognize deferred tax assets and liabilities based on the differences between the financial statement carrying amounts and the tax basesbasis of assets and liabilities. We regularly review our deferred tax assets to assess their potential realization and establish a valuation allowance for portions of such assets that we believe will not be ultimately realized. In performing this review, we make estimates and assumptions regarding projected future taxable income, the expected timing of the reversals of existing temporary differences and the implementation of tax planning strategies. A change in these assumptions could cause anmay increase or decrease to our valuation allowance resulting in an increase or decrease in our effective tax rate, which could materially impact our results of operations.
For tax positions we have taken or expect to take in our tax return, we apply a more likely than not threshold, under which we must conclude a tax position is more likely than not to be sustained, assuming that the position will be examined by the appropriate taxing authority that has full knowledge of all relevant information, in order to recognize or continue to recognize the benefit. In determining our provision for income taxes, we use judgment, reflecting our estimates and assumptions, in applying the more likely than not threshold.
Changes inAdoption of Accounting PoliciesPronouncements
During 2009,2011, we adopted standardsthe guidance related to the following:
| ITEM 7A. | QUANTITATIVE AND QUALITATIVE DISCLOSURES ABOUT MARKET RISK |
We use various financial instruments, particularly swap contracts and interest rate caps to manage and reduce the interest rate risk related to our debt. Foreign currency forwards and options are also used to manage and reduce the foreign currency exchange rate risk associated with our foreign currency denominated receivables, payables and forecasted royalties, forecasted earnings and cash flows of foreign subsidiaries and other transactions.
We are exclusively an end user of these instruments, which are commonly referred to as derivatives. We do not engage in trading, market making or other speculative activities in the derivatives markets. More detailed
69
Our primary interest rate exposure as of December 31, 2011 was to interest rate fluctuations in the United States, specifically LIBOR and asset-backed commercial paper interest rates due to their impact on variable rate borrowings and other interest rate sensitive liabilities. In addition, interest rate movements in one country, as well as relative interest rate movements between countries can impact us. We anticipate that LIBOR and asset-backed commercial paper rates will remain a primary market risk exposure for the foreseeable future.
We have foreign currency rate exposure to exchange rate fluctuations worldwide and particularly with respect to the British pound and Euro. We anticipate that such foreign currency exchange rate risk will remain a market risk exposure for the foreseeable future. Any adverse reaction resulting from the financial instability within certain European economies could potentially have an effect on our results of operations, financial position or cash flows.
We assess our market risk based on changes in interest and foreign currency exchange rates utilizing a sensitivity analysis. The sensitivity analysis measures the potential impact in earnings, fair values and cash flows based on a hypothetical 10% change (increase and decrease) in interest and foreign currency exchange rates. We have approximately $3.5$4.0 billion of debt outstanding as of December 31, 2009.2011. Of that total, $558$456 million was issued as variable rate debt and has not been synthetically converted to fixed rate debt via an interest rate swap. A hypothetical 10% change in our effective weighted average interest rate would not generate a material change in interest expense.
The fair values of cash and cash equivalents, trade receivables, accounts payable and accrued expenses and other current liabilities approximate carrying values due to the short-term nature of these assets. We use a discounted cash flow model in determining the fair values of vacation ownership contract receivables. The primary assumptions used in determining fair value are prepayment speeds, estimated loss rates and discount rates. We use a duration-based model in determining the impact of interest rate shifts on our debt and interest rate derivatives. The primary assumption used in these models is that a 10% increase or decrease in the benchmark interest rate produces a parallel shift in the yield curve across all maturities.
We use a current market pricing model to assess the changes in the value of our foreign currency derivatives used by us to hedge underlying exposure that primarily consist of the non-functional current assets and liabilities of us and our subsidiaries. The primary assumption used in these models is a hypothetical 10% weakening or
strengthening of the U.S. dollar against all our currency exposures as of December 31, 2009.2011. The gains and losses on the hedging instruments are largely offset by the gains and losses on the underlying assets, liabilities or expected cash flows. As of December 31, 2009,2011, the absolute notional amount of our outstanding foreign exchange hedging instruments was $709$343 million. A hypothetical 10% change in the foreign currency exchange rates would result in an increase or decrease of approximately $20 millionimmaterial change in the fair value of the hedging instrument as of December 31, 2009.2011. Such a change would be largely offset by an opposite effect on the underlying assets, liabilities and expected cash flows.
Our total market risk is influenced by a wide variety of factors including the volatility present within the markets and the liquidity of the markets. There are certain limitations inherent in the sensitivity analyses presented. While probably the most meaningful analysis, these “shock tests” are constrained by several factors, including the necessity to conduct the analysis based on a single point in time and the inability to include the complex market reactions that normally would arise from the market shifts modeled.
We used December 31, 20092011 market rates on outstanding financial instruments to perform the sensitivity analysis separately for each of our market risk exposures — interest and foreign currency rate instruments. The estimates are based on the market risk sensitive portfolios described in the preceding paragraphs and assume instantaneous, parallel shifts in interest rate yield curves and exchange rates.
| ITEM 8. | FINANCIAL STATEMENTS AND SUPPLEMENTARY DATA |
See Financial Statements and Financial Statement Index commencing onpage F-1 hereof.
| ITEM 9. | CHANGE IN AND DISAGREEMENTS WITH ACCOUNTANTS ON ACCOUNTING AND FINANCIAL DISCLOSURE |
None.
| ITEM 9A. | CONTROLS AND PROCEDURES |
| (a) | Disclosure Controls and Procedures. Our management, with the participation of our Chairman and Chief Executive Officer and Chief Financial Officer, has evaluated the effectiveness of our disclosure controls and procedures (as such term is defined in Rules13a-15(e) under the Securities Exchange Act of 1934, |
70
| as amended (the “Exchange Act”)) as of the end of the period covered by this report. Based on such evaluation, our Chairman and Chief Executive Officer and Chief Financial Officer have concluded that, as of the end of such period, our disclosure controls and procedures are effective. |
| (b) | Management’s Report on Internal Control over Financial Reporting.Our management is responsible for establishing and maintaining adequate internal control over financial reporting, as defined inRule 13a-15(f) under the Exchange Act. Our management assessed the effectiveness of our internal control over financial reporting as of December 31, |
| ITEM 9B. | OTHER INFORMATION |
None.
PART III
| ITEM 10. | DIRECTORS, EXECUTIVE OFFICERS AND CORPORATE GOVERNANCE |
Identification of Directors.
Information required by this item is included in the Proxy Statement under the caption “Election of Directors” and is incorporated by reference in this report.
Identification of Executive Officers.
The following provides information for each of our executive officers.
Stephen P. Holmes, 53,55, has served as ourthe Chairman of theour Board of Directors and as our Chief Executive Officer since our separation from Cendant in July 2006. Mr. Holmes was a director since May 2003 of the already-existing, wholly owned subsidiary of Cendant that held the assets and liabilities of Cendant’s hospitality services (including timeshare resorts) businesses before our separation from Cendant and has served as a director of Wyndham WorldwideDirector since the separation in July 2006.May 2003. Mr. Holmes was Vice Chairman and Directordirector of Cendant Corporation and Chairman and Chief Executive Officer of Cendant’s Travel Content Division from December 1997 until our separation from Cendant into July 2006. Mr. Holmes was Vice Chairman of HFS Incorporated from September 1996 untilto December 1997, and was a director of HFS from June 1994 untilto December 1997. From July 1990 through September 1996, Mr. Holmes served as1997 and Executive Vice President, Treasurer and Chief Financial Officer of HFS.
Geoffrey A. Ballotti, 48,50, has served as President and Chief Executive Officer, Wyndham Exchange and& Rentals, since March 2008. Prior to joining Wyndham Exchange and Rentals, fromFrom October 2003 to March 2008, Mr. Ballotti was President, North America Division of Starwood Hotels and Resorts Worldwide. From 1989 to 2003, Mr. Ballotti held leadership positions of increasing responsibility at Starwood Hotels and Resorts Worldwide including President of Starwood North America, Executive Vice President, Operations, Senior Vice President, Southern Europe and Managing Director, Ciga Spa, Italy. Prior to Starwood Hotels and Resorts Worldwide, Mr. Ballotti was a Banking Officer in the Commercial Real Estate Group at the Bank of New England.
Eric A. Danziger, 55,57, has served as President and Chief Executive Officer, Wyndham Hotel Group, since December 2008. From August 2006 to December 2008, Mr. Danziger was Chief Executive Officer of WhiteFence, Inc., an online site for home services firm. From June 2001 to August 2006, Mr. Danziger was President and Chief Executive Officer of ZipRealty, a real estate brokerage. From April 1998 to June 2001, Mr. Danziger was President and Chief Operating Officer of Carlson Hotels Worldwide. From June 1996 to August 1998, Mr. Danziger was President and CEO of Starwood Hotels and Resorts Worldwide. From September 1990 to June 1996, Mr. Danziger was President of Wyndham Hotels and Resorts.
Franz S. Hanning, 56,58, has served as President and Chief Executive Officer, Wyndham Vacation Ownership, since our separation from Cendant in July 2006. Mr. Hanning was the Chief Executive Officer of Cendant’s Timeshare Resort Group from March 2005 until our separation from Cendant into July 2006. Mr. Hanning served as President and Chief Executive Officer of Wyndham Vacation Resorts, Inc. (formerly known as Fairfield Resorts, Inc.) from April 2001 when Cendant acquired Fairfield Resorts, Inc., to March 2005 and as President and Chief Executive Officer of Wyndham Resort Development Corporation (formerly known as Trendwest Resorts, Inc.) from August 2004 to March 2005. Mr. Hanning joined Fairfield Resorts, Inc. in 1982 and held several key leadership
71
Thomas G. Conforti, 51,53, has served as our Executive Vice President and Chief Financial Officer since September 2009. From December 2002 to September 2008, Mr. Conforti was Chief Financial Officer of DineEquity, Inc. Earlier in his career, Mr. Conforti held a number of general management, financial and strategic roles over a ten-year period in the Consumer Products Division of the Walt Disney Company. Mr. Conforti also held numerous finance and strategy roles within the College Textbook Publishing Division of CBS and the Soft Drink Division of Pepsico.
Scott G. McLester, 47,49, has served as our Executive Vice President and General Counsel since our separation from Cendant in July 2006. Mr. McLester was Senior Vice President, Legal for Cendant from April 2004 until our separation from Cendant into July 2006. Mr. McLester was2006, Group Vice President,
Legal for Cendant from March 2002 to April 2004, Vice President, Legal for Cendant from February 2001 to March 2002 and Senior Counsel for Cendant from June 2000 to February 2001. Prior to joining Cendant, Mr. McLester was a Vice President in the Law Department of Merrill Lynch in New York and a partner with the law firm of Carpenter, Bennett and Morrissey in Newark, New Jersey.
Mary R. Falvey, 49,51, has served as our Executive Vice President and Chief Human Resources Officer since our separation from Cendant in July 2006. Ms. Falvey was Executive Vice President, Global Human Resources for Cendant’s Vacation Network Group from April 2005 until our separation from Cendant into July 2006. From March 2000 to April 2005, Ms. Falvey served as Executive Vice President, Human Resources for RCI. From January 1998 to March 2000, Ms. Falvey was Vice President of Human Resources for Cendant’s Hotel Division and Corporate Contact Center group. Prior to joining Cendant, Ms. Falvey held various leadership positions in the human resources division of Nabisco Foods Company.
Thomas F. Anderson, 45,47, has served as our Executive Vice President and Chief Real Estate Development Officer since our separation from Cendant in July 2006. From April 2003 untilto July 2006, Mr. Anderson was Executive Vice President, Strategic Acquisitions and Development of Cendant’s Timeshare Resort Group. From January 2000 untilto February 2003, Mr. Anderson was Senior Vice President, Corporate Real Estate for Cendant Corporation.Cendant. From November 1998 untilto December 1999, Mr. Anderson was Vice President of Real Estate Services, Coldwell Banker Commercial. From March 1995 to October 1998, Mr. Anderson was General Manager of American Asset Corporation, a full service real estate developer based in Charlotte, North Carolina. From June 1990 untilto February 1995, Mr. Anderson was Vice President of Commercial Lending for BB&T Corporation in Charlotte, North Carolina.
Nicola Rossi, 43,45, has served as our Senior Vice President and Chief Accounting Officer since our separation from Cendant in July 2006. Mr. Rossi was Vice President and Controller of Cendant’s Hotel Group from June 2004 until our separation from Cendant into July 2006. From April 2002 to June 2004, Mr. Rossi served as Vice President, Corporate Finance for Cendant. From April 2000 to April 2002, Mr. Rossi was Corporate Controller of Jacuzzi Brands, Inc., a bath and plumbing products company, and was Assistant Corporate Controller from June 1999 to March 2000.
Compliance with Section 16(a) of the Exchange Act.
The information required by this item is included in the Proxy Statement under the caption “Section 16(a) Beneficial Ownership Reporting Compliance” and is incorporated by reference in this report.
Code of Ethics.
The information required by this item is included in the Proxy Statement under the caption “Code of Business Conduct and Ethics” and is incorporated by reference in this report.
Corporate Governance.
The information required by this item is included in the Proxy Statement under the caption “Governance of the Company” and is incorporated by reference in this report.
| ITEM 11. | EXECUTIVE COMPENSATION |
The information required by this item is included in the Proxy Statement under the captions “Compensation of Directors,” “Executive Compensation” and “Committees of the Board” and is incorporated by reference in this report.
72
| ITEM 12. | SECURITY OWNERSHIP OF CERTAIN BENEFICIAL OWNERS AND MANAGEMENT AND RELATED STOCKHOLDER MATTERS |
Securities Authorized for Issuance Under Equity Compensation Plans as of December 31, 2011
Number of securities to be issued upon exercise of | Weighted-average exercise price of outstanding options, warrants and rights | Number of securities remaining available for future issuance under equity compensation plans (excluding securities reflected in the first column) | ||||
Equity compensation plans approved by security holders | 8.9 million(a) | $28.97(b) | 15.1 million(c) | |||
Equity compensation plans not approved by security holders | None | Not applicable | Not applicable |
| (a) | Consists of shares issuable upon exercise of outstanding stock options, stock settled stock appreciation rights and restricted stock units under the 2006 Equity and Incentive Plan, as amended. |
| (b) | Consists of weighted-average exercise price of outstanding stock options and stock settled stock appreciation rights. |
| (c) | Consists of shares available for future grants under the 2006 Equity and Incentive Plan, as amended. |
The remaining information required by this item is included in the Proxy Statement under the caption “Ownership of Company Stock” and is incorporated by reference in this report.
| ITEM 13. | CERTAIN RELATIONSHIPS AND RELATED TRANSACTIONS AND DIRECTOR INDEPENDENCE |
The information required by this item is included in the Proxy Statement under the captions “Related Party Transactions” and “Governance of the Company” and is incorporated by reference in this report.
| ITEM 14. | PRINCIPAL ACCOUNTING FEES AND SERVICES |
The information required by this item is included in the Proxy Statement under the captions “Disclosure About Fees” and “Pre-Approval of Audit and Non-Audit Services” and is incorporated by reference in this report.
PART IV
| ITEM 15. | EXHIBITS AND FINANCIAL STATEMENT SCHEDULES |
ITEM 15 (A)(1) FINANCIAL STATEMENTS
See Financial Statements and Financial Statements Index commencing onpage F-1 hereof.
ITEM 15(A)(3) EXHIBITS hereof.
See Exhibit Index commencing onpage G-1 hereof.
The agreements included or incorporated by reference as exhibits to this report please be advised that the agreements are included to provide you with information regarding their terms and are not intended to provide any other factual or disclosure information about us or the other parties to the agreements. The agreements generally contain representations and warranties by each of the parties to the applicable agreement. These representations and warranties have beenwere made solely for the benefit of the other parties to the applicable agreement and:
| and (i) were not intended to be treated as categorical statements of fact, but rather as a way of allocating the risk to one of the parties if those statements prove to be inaccurate; (ii) may have been qualified in such agreement by disclosures that were made to the other party in connection with the negotiation of the applicable agreement; (iii) may apply contract standards of “materiality” that are different from “materiality” under the applicable securities laws; and (iv) were made only |
73not misleading.
| WYNDHAM WORLDWIDE CORPORATION | ||
| By: | /s/ | |
| Stephen P. Holmes | ||
| Chairman and Chief Executive Officer | ||
| Date: February 17, 2012 | ||
Pursuant to the requirements of the Securities Exchange Act of 1934, this report has been signed below by the following persons on behalf of the Registrant and in the capacities and on the dates indicated.
Name | Title | Date | ||||
/s/ Stephen P. Holmes | Chairman and Chief Executive Officer (Principal Executive Officer) | February | ||||
/s/ Thomas G. Conforti | Chief Financial Officer | February | ||||
/s/ NICOLA ROSSI
Nicola Rossi | Chief Accounting Officer | February | ||||
/s/ Myra J. Biblowit | Director | February | ||||
/s/ James E. Buckman | Director | February | ||||
/s/ GEORGE HERRERA
George Herrera | Director | February | ||||
/s/ THE RIGHT HONOURABLE BRIAN MULRONEY
| Director | February | ||||
/s/ Pauline D.E. Richards | Director | February | ||||
/s/ Michael H. Wargotz | Director | February | ||||
74
| Page | |||||||
| F-2 | |||||||
| F-4 | |||||||
Consolidated Statements of Comprehensive Income for the years ended December 31, 2011, 2010 and 2009 | F-5 | ||||||
Consolidated Balance Sheets as of December 31, 2011 and 2010 | F-6 | ||||||
F-1
To the Board of Directors and Stockholders of
Wyndham Worldwide Corporation
Parsippany, New Jersey
We have audited the accompanying consolidated balance sheets of Wyndham Worldwide Corporation and subsidiaries (the “Company”) as of December 31, 20092011 and 2008,2010, and the related consolidated statements of operations,income, comprehensive income, stockholders’ equity, and cash flows for each of the three years in the period ended December 31, 2009.2011. We also have audited the Company’s internal control over financial reporting as of December 31, 2009,2011, based on criteria established in Internal Control—Control — Integrated Framework issued by the Committee of Sponsoring Organizations of the Treadway Commission. The Company’s management is responsible for these financial statements, for maintaining effective internal control over financial reporting, and for its assessment of the effectiveness of internal control over financial reporting, included in the accompanying Management’s Annual Report on Internal Control over Financial Reporting. Our responsibility is to express an opinion on these financial statements and an opinion on the Company’s internal control over financial reporting based on our audits.
We conducted our audits in accordance with the standards of the Public Company Accounting Oversight Board (United States). Those standards require that we plan and perform the audit to obtain reasonable assurance about whether the financial statements are free of material misstatement and whether effective internal control over financial reporting was maintained in all material respects. Our audits of the financial statements included examining, on a test basis, evidence supporting the amounts and disclosures in the financial statements, assessing the accounting principles used and significant estimates made by management, and evaluating the overall financial statement presentation. Our audit of internal control over financial reporting included obtaining an understanding of internal control over financial reporting, assessing the risk that a material weakness exists, and testing and evaluating the design and operating effectiveness of internal control based on the assessed risk. Our audits also included performing such other procedures as we considered necessary in the circumstances. We believe that our audits provide a reasonable basis for our opinions.
A company’s internal control over financial reporting is a process designed by, or under the supervision of, the company’s principal executive and principal financial officers, or persons performing similar functions, and effected by the company’s board of directors, management, and other personnel to provide reasonable assurance regarding the reliability of financial reporting and the preparation of financial statements for external purposes in accordance with generally accepted accounting principles. A company’s internal control over financial reporting includes those policies and procedures that (1) pertain to the maintenance of records that, in reasonable detail, accurately and fairly reflect the transactions and dispositions of the assets of the company; (2) provide reasonable assurance that transactions are recorded as necessary to permit preparation of financial statements in accordance with generally accepted accounting principles, and that receipts and expenditures of the company are being made only in accordance with authorizations of management and directors of the company; and (3) provide reasonable assurance regarding prevention or timely detection of unauthorized acquisition, use, or disposition of the company’s assets that could have a material effect on the financial statements.
Because of the inherent limitations of internal control over financial reporting, including the possibility of collusion or improper management override of controls, material misstatements due to error or fraud may not be prevented or detected on a timely basis. Also, projections of any evaluation of the effectiveness of the internal control over financial reporting to future periods are subject to the risk that the controls may become inadequate because of changes in conditions, or that the degree of compliance with the policies or procedures may deteriorate.
In our opinion, the consolidated financial statements referred to above present fairly, in all material respects, the financial position of Wyndham Worldwide Corporation and subsidiaries as of December 31, 20092011 and 2008,2010, and
the results of their operations and their cash flows for each of the three years in the period ended December 31, 2009,2011, in conformity with accounting principles generally accepted in the United States of America. Also, in our opinion, the Company maintained, in all material respects, effective internal control over financial reporting as of December 31, 2009,2011, based on the criteria established in Internal Control—Control — Integrated Framework issued by the Committee of Sponsoring Organizations of the Treadway Commission.
As discussed in Note 2 to the financial statements, the Company has changed its method of presenting comprehensive income in 2011 due to the adoption of FASB Accounting Standards Update No. 2011-05, Presentation of Comprehensive Income. The change in presentation has been applied retrospectively to all periods presented.
/s/ Deloitte & Touche LLP
Parsippany, New Jersey
February 19, 2010
F-217, 2012
CONSOLIDATED STATEMENTS OF OPERATIONS
INCOME
(In millions, except per share data)data)
| Year Ended December 31, | ||||||||||||
| 2009 | 2008 | 2007 | ||||||||||
Net revenues | ||||||||||||
| Service fees and membership | $ | 1,613 | $ | 1,705 | $ | 1,619 | ||||||
| Vacation ownership interest sales | 1,053 | 1,463 | 1,666 | |||||||||
| Franchise fees | 440 | 514 | 523 | |||||||||
| Consumer financing | 435 | 426 | 358 | |||||||||
| Other | 209 | 173 | 194 | |||||||||
| Net revenues | 3,750 | 4,281 | 4,360 | |||||||||
Expenses | ||||||||||||
| Operating | 1,501 | 1,622 | 1,632 | |||||||||
| Cost of vacation ownership interests | 183 | 278 | 376 | |||||||||
| Consumer financing interest | 139 | 131 | 110 | |||||||||
| Marketing and reservation | 560 | 830 | 831 | |||||||||
| General and administrative | 533 | 561 | 519 | |||||||||
| Separation and related costs | — | — | 16 | |||||||||
| Goodwill and other impairments | 15 | 1,426 | — | |||||||||
| Restructuring costs | 47 | 79 | — | |||||||||
| Depreciation and amortization | 178 | 184 | 166 | |||||||||
| Total expenses | 3,156 | 5,111 | 3,650 | |||||||||
Operating income/(loss) | 594 | (830 | ) | 710 | ||||||||
| Other income, net | (6 | ) | (11 | ) | (7 | ) | ||||||
| Interest expense | 114 | 80 | 73 | |||||||||
| Interest income | (7 | ) | (12 | ) | (11 | ) | ||||||
Income/(loss) before income taxes | 493 | (887 | ) | 655 | ||||||||
| Provision for income taxes | 200 | 187 | 252 | |||||||||
Net income/(loss) | $ | 293 | $ | (1,074 | ) | $ | 403 | |||||
Earnings/(losses) per share: | ||||||||||||
| Basic | $ | 1.64 | $ | (6.05 | ) | $ | 2.22 | |||||
| Diluted | 1.61 | (6.05 | ) | 2.20 | ||||||||
| Year Ended December 31, | ||||||||||||
| 2011 | 2010 | 2009 | ||||||||||
Net revenues | ||||||||||||
Service and membership fees | $ | 2,012 | $ | 1,706 | $ | 1,613 | ||||||
Vacation ownership interest sales | 1,150 | 1,072 | 1,053 | |||||||||
Franchise fees | 522 | 461 | 440 | |||||||||
Consumer financing | 415 | 425 | 435 | |||||||||
Other | 155 | 187 | 209 | |||||||||
|
|
|
|
|
| |||||||
Net revenues | 4,254 | 3,851 | 3,750 | |||||||||
|
|
|
|
|
| |||||||
Expenses | ||||||||||||
Operating | 1,781 | 1,587 | 1,501 | |||||||||
Cost of vacation ownership interests | 152 | 184 | 183 | |||||||||
Consumer financing interest | 92 | 105 | 139 | |||||||||
Marketing and reservation | 628 | 531 | 560 | |||||||||
General and administrative | 593 | 540 | 533 | |||||||||
Asset impairments | 57 | 4 | 15 | |||||||||
Restructuring costs | 6 | 9 | 47 | |||||||||
Depreciation and amortization | 178 | 173 | 178 | |||||||||
|
|
|
|
|
| |||||||
Total expenses | 3,487 | 3,133 | 3,156 | |||||||||
|
|
|
|
|
| |||||||
Operating income | 767 | 718 | 594 | |||||||||
Other income, net | (11 | ) | (7 | ) | (6 | ) | ||||||
Interest expense | 152 | 167 | 114 | |||||||||
Interest income | (24 | ) | (5 | ) | (7 | ) | ||||||
|
|
|
|
|
| |||||||
Income before income taxes | 650 | 563 | 493 | |||||||||
Provision for income taxes | 233 | 184 | 200 | |||||||||
|
|
|
|
|
| |||||||
Net income | $ | 417 | $ | 379 | $ | 293 | ||||||
|
|
|
|
|
| |||||||
Earnings per share: | ||||||||||||
Basic | $ | 2.57 | $ | 2.13 | $ | 1.64 | ||||||
Diluted | 2.51 | 2.05 | 1.61 | |||||||||
Cash dividends declared per share | $ | 0.60 | $ | 0.48 | $ | 0.16 | ||||||
See Notes to Consolidated Financial Statements.
F-3
CONSOLIDATED STATEMENTS OF COMPREHENSIVE INCOME
(In millions)
| Year Ended December 31, | ||||||||||||
| 2011 | 2010 | 2009 | ||||||||||
Net income | $ | 417 | $ | 379 | $ | 293 | ||||||
Other comprehensive income, net of tax | ||||||||||||
Foreign currency translation adjustments | (30 | ) | 5 | 25 | ||||||||
Unrealized gain on cash flow hedges | 5 | 12 | 18 | |||||||||
Defined benefit pension plans | (2 | ) | — | (3 | ) | |||||||
|
|
|
|
|
| |||||||
Other comprehensive income/(loss), net of tax | (27 | ) | 17 | 40 | ||||||||
|
|
|
|
|
| |||||||
Comprehensive income | $ | 390 | $ | 396 | $ | 333 | ||||||
|
|
|
|
|
| |||||||
See Notes to Consolidated Financial Statements.
CONSOLIDATED BALANCE SHEETS
(In millions, except share data)
| December 31, | December 31, | |||||||
| 2009 | 2008 | |||||||
Assets | ||||||||
| Current assets: | ||||||||
| Cash and cash equivalents | $ | 155 | $ | 136 | ||||
| Trade receivables, net | 404 | 460 | ||||||
| Vacation ownership contract receivables, net | 289 | 291 | ||||||
| Inventory | 354 | 414 | ||||||
| Prepaid expenses | 116 | 151 | ||||||
| Deferred income taxes | 189 | 148 | ||||||
| Other current assets | 233 | 314 | ||||||
| Total current assets | 1,740 | 1,914 | ||||||
| Long-term vacation ownership contract receivables, net | 2,792 | 2,963 | ||||||
| Non-current inventory | 953 | 905 | ||||||
| Property and equipment, net | 953 | 1,038 | ||||||
| Goodwill | 1,386 | 1,353 | ||||||
| Trademarks, net | 660 | 661 | ||||||
| Franchise agreements and other intangibles, net | 391 | 416 | ||||||
| Other non-current assets | 477 | 323 | ||||||
Total assets | $ | 9,352 | $ | 9,573 | ||||
Liabilities and Stockholders’ Equity | ||||||||
| Current liabilities: | ||||||||
| Securitized vacation ownership debt | $ | 209 | $ | 294 | ||||
| Current portion of long-term debt | 175 | 169 | ||||||
| Accounts payable | 260 | 316 | ||||||
| Deferred income | 417 | 672 | ||||||
| Due to former Parent and subsidiaries | 245 | 80 | ||||||
| Accrued expenses and other current liabilities | 579 | 638 | ||||||
| Total current liabilities | 1,885 | 2,169 | ||||||
| Long-term securitized vacation ownership debt | 1,298 | 1,516 | ||||||
| Long-term debt | 1,840 | 1,815 | ||||||
| Deferred income taxes | 1,137 | 966 | ||||||
| Deferred income | 267 | 311 | ||||||
| Due to former Parent and subsidiaries | 63 | 265 | ||||||
| Other non-current liabilities | 174 | 189 | ||||||
| Total liabilities | 6,664 | 7,231 | ||||||
| Commitments and contingencies (Note 16) | ||||||||
| Stockholders’ equity: | ||||||||
| Preferred stock, $.01 par value, authorized 6,000,000 shares, none issued and outstanding | — | — | ||||||
| Common stock, $.01 par value, authorized 600,000,000 shares, issued 205,891,254 shares in 2009 and 204,645,505 shares in 2008 | 2 | 2 | ||||||
| Additional paid-in capital | 3,733 | 3,690 | ||||||
| Accumulated deficit | (315 | ) | (578 | ) | ||||
| Accumulated other comprehensive income | 138 | 98 | ||||||
| Treasury stock, at cost—27,284,823 shares in 2009 and 2008 | (870 | ) | (870 | ) | ||||
| Total stockholders’ equity | 2,688 | 2,342 | ||||||
Total liabilities and stockholders’ equity | $ | 9,352 | $ | 9,573 | ||||
| December 31, 2011 | December 31, 2010 | |||||||
Assets | ||||||||
Current assets: | ||||||||
Cash and cash equivalents | $ | 142 | $ | 156 | ||||
Trade receivables, net | 409 | 425 | ||||||
Vacation ownership contract receivables, net | 297 | 295 | ||||||
Inventory | 351 | 348 | ||||||
Prepaid expenses | 121 | 104 | ||||||
Deferred income taxes | 153 | 179 | ||||||
Other current assets | 257 | 245 | ||||||
|
|
|
| |||||
Total current assets | 1,730 | 1,752 | ||||||
Long-term vacation ownership contract receivables, net | 2,551 | 2,687 | ||||||
Non-current inventory | 759 | 833 | ||||||
Property and equipment, net | 1,117 | 1,041 | ||||||
Goodwill | 1,479 | 1,481 | ||||||
Trademarks, net | 730 | 731 | ||||||
Franchise agreements and other intangibles, net | 401 | 440 | ||||||
Other non-current assets | 256 | 451 | ||||||
|
|
|
| |||||
Total assets | $ | 9,023 | $ | 9,416 | ||||
|
|
|
| |||||
Liabilities and Stockholders’ Equity | ||||||||
Current liabilities: | ||||||||
Securitized vacation ownership debt | $ | 196 | $ | 223 | ||||
Current portion of long-term debt | 46 | 11 | ||||||
Accounts payable | 278 | 274 | ||||||
Deferred income | 402 | 401 | ||||||
Due to former Parent and subsidiaries | 10 | 47 | ||||||
Accrued expenses and other current liabilities | 631 | 619 | ||||||
|
|
|
| |||||
Total current liabilities | 1,563 | 1,575 | ||||||
Long-term securitized vacation ownership debt | 1,666 | 1,427 | ||||||
Long-term debt | 2,107 | 2,083 | ||||||
Deferred income taxes | 1,065 | 1,021 | ||||||
Deferred income | 182 | 206 | ||||||
Due to former Parent and subsidiaries | 37 | 30 | ||||||
Other non-current liabilities | 171 | 157 | ||||||
|
|
|
| |||||
Total liabilities | 6,791 | 6,499 | ||||||
|
|
|
| |||||
Commitments and contingencies (Note 17) | ||||||||
Stockholders’ equity: | ||||||||
Preferred stock, $.01 par value, authorized 6,000,000 shares, none issued and outstanding | — | — | ||||||
Common stock, $.01 par value, authorized 600,000,000 shares, issued 212,286,217 shares in 2011 and 209,943,159 shares in 2010 | 2 | 2 | ||||||
Treasury stock, at cost—65,228,133 shares in 2011 and 36,555,242 shares in 2010 | (2,009 | ) | (1,107 | ) | ||||
Additional paid-in capital | 3,818 | 3,892 | ||||||
Retained earnings/(accumulated deficit) | 293 | (25 | ) | |||||
Accumulated other comprehensive income | 128 | 155 | ||||||
|
|
|
| |||||
Total stockholders’ equity | 2,232 | 2,917 | ||||||
|
|
|
| |||||
Total liabilities and stockholders’ equity | $ | 9,023 | $ | 9,416 | ||||
|
|
|
| |||||
See Notes to Consolidated Financial Statements.
F-4
CONSOLIDATED STATEMENTS OF CASH FLOWS
(In millions)
| Year Ended December 31, | ||||||||||||
| 2009 | 2008 | 2007 | ||||||||||
Operating Activities | ||||||||||||
| Net income/(loss) | $ | 293 | $ | (1,074 | ) | $ | 403 | |||||
| Adjustments to reconcile net income/(loss) to net cash provided by operating activities: | ||||||||||||
| Depreciation and amortization | 178 | 184 | 166 | |||||||||
| Provision for loan losses | 449 | 450 | 305 | |||||||||
| Deferred income taxes | 90 | 110 | 156 | |||||||||
| Stock-based compensation | 37 | 35 | 26 | |||||||||
| Excess tax benefits from stock-based compensation | — | — | (8 | ) | ||||||||
| Impairment of goodwill and other assets | 15 | 1,426 | 1 | |||||||||
| Non-cash interest | 51 | 12 | 6 | |||||||||
| Non-cash restructuring | 15 | 23 | — | |||||||||
| Net change in assets and liabilities, excluding the impact of acquisitions and dispositions: | ||||||||||||
| Trade receivables | 92 | 3 | (17 | ) | ||||||||
| Vacation ownership contract receivables | (199 | ) | (786 | ) | (835 | ) | ||||||
| Inventory | (9 | ) | (147 | ) | (322 | ) | ||||||
| Prepaid expenses | 25 | 3 | (2 | ) | ||||||||
| Other current assets | 41 | (25 | ) | (5 | ) | |||||||
| Accounts payable, accrued expenses and other current liabilities | (54 | ) | (124 | ) | 146 | |||||||
| Due to former Parent and subsidiaries, net | (44 | ) | (23 | ) | (9 | ) | ||||||
| Deferred income | (315 | ) | 87 | 23 | ||||||||
| Other, net | 24 | (45 | ) | (24 | ) | |||||||
Net cash provided by operating activities | 689 | 109 | 10 | |||||||||
Investing Activities | ||||||||||||
| Property and equipment additions | (135 | ) | (187 | ) | (194 | ) | ||||||
| Net assets acquired, net of cash acquired, and acquisition-related payments | — | (135 | ) | (16 | ) | |||||||
| Equity investments and development advances | (13 | ) | (18 | ) | (50 | ) | ||||||
| Proceeds from asset sales | 5 | 9 | 30 | |||||||||
| (Increase)/decrease in securitization restricted cash | 22 | (30 | ) | (35 | ) | |||||||
| Decrease in escrow deposit restricted cash | 9 | 42 | 11 | |||||||||
| Other, net | 3 | — | (1 | ) | ||||||||
Net cash used in investing activities | (109 | ) | (319 | ) | (255 | ) | ||||||
Financing Activities | ||||||||||||
| Proceeds from securitized borrowings | 1,406 | 1,923 | 2,636 | |||||||||
| Principal payments on securitized borrowings | (1,711 | ) | (2,194 | ) | (2,018 | ) | ||||||
| Proceeds from non-securitized borrowings | 822 | 2,183 | 1,403 | |||||||||
| Principal payments on non-securitized borrowings | (1,451 | ) | (1,681 | ) | (1,339 | ) | ||||||
| Proceeds from note issuance | 460 | — | — | |||||||||
| Purchase of call options | (42 | ) | — | — | ||||||||
| Proceeds from issuance of warrants | 11 | — | — | |||||||||
| Dividends to shareholders | (29 | ) | (28 | ) | (14 | ) | ||||||
| Capital contribution from former Parent | — | 8 | 15 | |||||||||
| Repurchase of common stock | — | (15 | ) | (526 | ) | |||||||
| Proceeds from stock option exercises | — | 5 | 25 | |||||||||
| Debt issuance costs | (27 | ) | (27 | ) | (12 | ) | ||||||
| Excess tax benefits from stock-based compensation | — | — | 8 | |||||||||
| Other, net | — | (8 | ) | (1 | ) | |||||||
Net cash provided by/(used in) financing activities | (561 | ) | 166 | 177 | ||||||||
| Effect of changes in exchange rates on cash and cash equivalents | — | (30 | ) | 9 | ||||||||
| Net increase/(decrease) in cash and cash equivalents | 19 | (74 | ) | (59 | ) | |||||||
| Cash and cash equivalents, beginning of period | 136 | 210 | 269 | |||||||||
Cash and cash equivalents, end of period | $ | 155 | $ | 136 | $ | 210 | ||||||
| Year Ended December 31, | ||||||||||||
| 2011 | 2010 | 2009 | ||||||||||
Operating Activities | ||||||||||||
Net income | $ | 417 | $ | 379 | $ | 293 | ||||||
Adjustments to reconcile net income to net cash provided by operating activities: | ||||||||||||
Depreciation and amortization | 178 | 173 | 178 | |||||||||
Provision for loan losses | 339 | 340 | 449 | |||||||||
Deferred income taxes | 70 | 76 | 90 | |||||||||
Stock-based compensation | 42 | 39 | 37 | |||||||||
Excess tax benefits from stock-based compensation | (18 | ) | (14 | ) | — | |||||||
Asset impairments | 57 | 4 | 15 | |||||||||
Non-cash interest | 27 | 60 | 51 | |||||||||
Non-cash restructuring | — | — | 15 | |||||||||
Net change in assets and liabilities, excluding the impact of acquisitions: | ||||||||||||
Trade receivables | 20 | 14 | 92 | |||||||||
Vacation ownership contract receivables | (207 | ) | (202 | ) | (199 | ) | ||||||
Inventory | 79 | 54 | (9 | ) | ||||||||
Prepaid expenses | (19 | ) | 12 | 25 | ||||||||
Other current assets | 9 | (4 | ) | 41 | ||||||||
Accounts payable, accrued expenses and other current liabilities | 41 | (52 | ) | (54 | ) | |||||||
Due to former Parent and subsidiaries, net | (15 | ) | (179 | ) | (44 | ) | ||||||
Deferred income | (20 | ) | (82 | ) | (315 | ) | ||||||
Other, net | 3 | 17 | 24 | |||||||||
|
|
|
|
|
| |||||||
Net cash provided by operating activities | 1,003 | 635 | 689 | |||||||||
|
|
|
|
|
| |||||||
Investing Activities | ||||||||||||
Property and equipment additions | (239 | ) | (167 | ) | (135 | ) | ||||||
Net assets acquired, net of cash acquired | (27 | ) | (236 | ) | — | |||||||
Equity investments and development advances | (10 | ) | (10 | ) | (13 | ) | ||||||
Proceeds from asset sales | 31 | 20 | 5 | |||||||||
Decrease/(increase) in securitization restricted cash | 6 | (5 | ) | 22 | ||||||||
(Increase)/decrease in escrow deposit restricted cash | (5 | ) | (12 | ) | 9 | |||||||
Other, net | (12 | ) | (8 | ) | 3 | |||||||
|
|
|
|
|
| |||||||
Net cash used in investing activities | (256 | ) | (418 | ) | (109 | ) | ||||||
|
|
|
|
|
| |||||||
Financing Activities | ||||||||||||
Proceeds from securitized borrowings | 1,709 | 1,697 | 1,406 | |||||||||
Principal payments on securitized borrowings | (1,497 | ) | (1,554 | ) | (1,711 | ) | ||||||
Proceeds from non-securitized borrowings | 2,112 | 1,525 | 822 | |||||||||
Principal payments on non-securitized borrowings | (2,082 | ) | (1,837 | ) | (1,451 | ) | ||||||
Proceeds from note issuances | 245 | 494 | 460 | |||||||||
Repurchase of convertible notes | (262 | ) | (250 | ) | — | |||||||
Proceeds from/(purchase of) call options | 155 | 136 | (42 | ) | ||||||||
(Repurchase of)/proceeds from warrants | (112 | ) | (98 | ) | 11 | |||||||
Dividends to shareholders | (99 | ) | (86 | ) | (29 | ) | ||||||
Repurchase of common stock | (893 | ) | (235 | ) | — | |||||||
Proceeds from stock option exercises | 11 | 40 | — | |||||||||
Debt issuance costs | (27 | ) | (41 | ) | (27 | ) | ||||||
Excess tax benefits from stock-based compensation | 18 | 14 | — | |||||||||
Other, net | (31 | ) | (24 | ) | — | |||||||
|
|
|
|
|
| |||||||
Net cash used in financing activities | (753 | ) | (219 | ) | (561 | ) | ||||||
|
|
|
|
|
| |||||||
Effect of changes in exchange rates on cash and cash equivalents | (8 | ) | 3 | — | ||||||||
|
|
|
|
|
| |||||||
Net (decrease)/increase in cash and cash equivalents | (14 | ) | 1 | 19 | ||||||||
Cash and cash equivalents, beginning of period | 156 | 155 | 136 | |||||||||
|
|
|
|
|
| |||||||
Cash and cash equivalents, end of period | $ | 142 | $ | 156 | $ | 155 | ||||||
|
|
|
|
|
| |||||||
See Notes to Consolidated Financial Statements.
F-5
CONSOLIDATED STATEMENTS OF STOCKHOLDERS’ EQUITY
(In millions)
| Retained | Accumulated | |||||||||||||||||||||||||||||||
| Additional | Earnings/ | Other | Treasury | Total | ||||||||||||||||||||||||||||
| Common Stock | Paid-in | (Accumulated | Comprehensive | Stock | Stockholders’ | |||||||||||||||||||||||||||
| Shares | Amount | Capital | Deficit) | Income | Shares | Amount | Equity | |||||||||||||||||||||||||
Balance at January 1, 2007 | 202 | $ | 2 | $ | 3,566 | $ | 156 | $ | 184 | (12 | ) | $ | (349 | ) | $ | 3,559 | ||||||||||||||||
Comprehensive income | ||||||||||||||||||||||||||||||||
| Net income | — | — | — | 403 | — | — | ||||||||||||||||||||||||||
| Currency translation adjustment, net of tax of $15 | — | — | — | — | 26 | — | — | |||||||||||||||||||||||||
| Unrealized losses on cash flow hedges, net of tax benefit of $12 | — | — | — | — | (19 | ) | — | — | ||||||||||||||||||||||||
| Pension liability adjustment, net of tax of $1 | — | — | — | — | 3 | — | — | |||||||||||||||||||||||||
Total comprehensive income | 413 | |||||||||||||||||||||||||||||||
| Exercise of stock options | 1 | — | 25 | — | — | — | — | 25 | ||||||||||||||||||||||||
| Issuance of share for RSU vesting | 1 | — | — | — | — | — | — | — | ||||||||||||||||||||||||
| Change in deferred compensation | — | — | 23 | — | — | — | — | 23 | ||||||||||||||||||||||||
| Cumulative effect, adoption of guidance for uncertainty in income taxes | — | — | — | (20 | ) | — | — | (20 | ) | |||||||||||||||||||||||
| Repurchases of common stock | — | — | — | — | — | (15 | ) | (508 | ) | (508 | ) | |||||||||||||||||||||
| Cash transfer from former Parent | — | — | 15 | — | — | — | — | 15 | ||||||||||||||||||||||||
| Tax adjustment from former Parent | — | — | 16 | — | — | — | — | 16 | ||||||||||||||||||||||||
| Change in excess tax benefit on equity awards | — | — | 7 | — | — | — | — | 7 | ||||||||||||||||||||||||
| Dividends | — | — | — | (14 | ) | — | — | — | (14 | ) | ||||||||||||||||||||||
Balance as of December 31, 2007 | 204 | 2 | 3,652 | 525 | 194 | (27 | ) | (857 | ) | 3,516 | ||||||||||||||||||||||
Comprehensive loss | ||||||||||||||||||||||||||||||||
| Net loss | — | — | — | (1,074 | ) | — | — | — | ||||||||||||||||||||||||
| Currency translation adjustment, net of tax benefit of $107 | — | — | — | — | (76 | ) | — | |||||||||||||||||||||||||
| Unrealized losses on cash flow hedges, net of tax benefit of $12 | — | — | — | — | (19 | ) | — | |||||||||||||||||||||||||
| Pension liability adjustment, net of tax benefit $0 | — | — | — | — | (1 | ) | — | |||||||||||||||||||||||||
Total comprehensive loss | (1,170 | ) | ||||||||||||||||||||||||||||||
| Exercise of stock options | — | — | 5 | — | — | — | — | 5 | ||||||||||||||||||||||||
| Issuance of shares for RSU vesting | 1 | — | — | — | — | — | — | — | ||||||||||||||||||||||||
| Change in deferred compensation | — | — | 28 | — | — | — | — | 28 | ||||||||||||||||||||||||
| Repurchase of common stock | — | — | — | — | — | — | (13 | ) | (13 | ) | ||||||||||||||||||||||
| Cash transfer from former Parent | — | — | 8 | — | — | — | — | 8 | ||||||||||||||||||||||||
| Change in excess tax benefit on equity awards | — | — | (3 | ) | — | — | — | — | (3 | ) | ||||||||||||||||||||||
| Dividends | — | — | — | (29 | ) | — | — | — | (29 | ) | ||||||||||||||||||||||
| �� | ||||||||||||||||||||||||||||||||
Balance as of December 31, 2008 | 205 | 2 | 3,690 | (578 | ) | 98 | (27 | ) | (870 | ) | 2,342 | |||||||||||||||||||||
Comprehensive income | ||||||||||||||||||||||||||||||||
| Net income | — | — | — | 293 | — | — | — | |||||||||||||||||||||||||
| Currency translation adjustment, net of tax of $31 | — | — | — | — | 25 | — | — | |||||||||||||||||||||||||
| Unrealized gains on cash flow hedges, net of tax of $10 | — | — | — | — | 18 | — | — | |||||||||||||||||||||||||
| Pension liability adjustment, net of tax benefit of $1 | — | — | — | — | (3 | ) | — | — | ||||||||||||||||||||||||
Total comprehensive income | 333 | |||||||||||||||||||||||||||||||
| Issuance of warrants | — | — | 11 | — | — | — | — | 11 | ||||||||||||||||||||||||
| Issuance of shares for RSU vesting | 1 | — | — | — | — | — | — | — | ||||||||||||||||||||||||
| Change in deferred compensation | — | — | 36 | — | — | — | — | 36 | ||||||||||||||||||||||||
| Change in excess tax benefit on equity awards | — | — | (4 | ) | — | — | — | — | (4 | ) | ||||||||||||||||||||||
| Dividends | — | — | — | (30 | ) | — | — | (30 | ) | |||||||||||||||||||||||
Balance as of December 31, 2009 | 206 | $ | 2 | $ | 3,733 | $ | (315 | ) | $ | 138 | (27 | ) | $ | (870 | ) | $ | 2,688 | |||||||||||||||
| Common Stock | Treasury Stock | Additional Paid-in Capital | Retained Earnings/ (Accumulated Deficit) | Accumulated Other Comprehensive Income | Total Stockholders’ Equity | |||||||||||||||||||||||||||
| Shares | Amount | Shares | Amount | |||||||||||||||||||||||||||||
Balance as of December 31, 2008 | 205 | $ | 2 | (27) | $ | (870 | ) | $ | 3,690 | $ | (578 | ) | $ | 98 | $ | 2,342 | ||||||||||||||||
Comprehensive income | ||||||||||||||||||||||||||||||||
Net income | — | — | — | — | — | 293 | — | |||||||||||||||||||||||||
Currency translation adjustment, net of tax of $31 | — | — | — | — | — | — | 25 | |||||||||||||||||||||||||
Unrealized gains on cash flow hedges, net of tax of $10 | — | — | — | — | — | — | 18 | |||||||||||||||||||||||||
Pension liability adjustment, net of tax benefit of $1 | — | — | — | — | — | — | (3 | ) | ||||||||||||||||||||||||
Total comprehensive income | 333 | |||||||||||||||||||||||||||||||
Issuance of warrants | — | — | — | — | 11 | — | — | 11 | ||||||||||||||||||||||||
Issuance of shares for RSU vesting | 1 | — | — | — | — | — | — | — | ||||||||||||||||||||||||
Change in deferred compensation | — | — | — | — | 36 | — | — | 36 | ||||||||||||||||||||||||
Change in excess tax benefit on equity awards | — | — | — | — | (4 | ) | — | — | (4 | ) | ||||||||||||||||||||||
Dividends | — | — | — | — | — | (30 | ) | — | (30 | ) | ||||||||||||||||||||||
|
|
|
|
|
|
|
|
|
|
|
|
|
|
|
| |||||||||||||||||
Balance as of December 31, 2009 | 206 | 2 | (27 | ) | (870 | ) | 3,733 | (315 | ) | 138 | 2,688 | |||||||||||||||||||||
Comprehensive income | ||||||||||||||||||||||||||||||||
Net income | — | — | — | — | — | 379 | — | |||||||||||||||||||||||||
Currency translation adjustment, net of tax benefit of $16 | — | — | — | — | — | — | 5 | |||||||||||||||||||||||||
Reclassification of unrealized loss on cash flow hedge, net of tax benefit of $6 | — | — | — | — | — | — | 8 | |||||||||||||||||||||||||
Unrealized gains on cash flow hedges, net of tax of $2 | — | — | — | — | — | — | 4 | |||||||||||||||||||||||||
Total comprehensive income | 396 | |||||||||||||||||||||||||||||||
Exercise of stock options | 2 | — | — | — | 40 | — | — | 40 | ||||||||||||||||||||||||
Issuance of shares for RSU vesting | 2 | — | — | — | — | — | — | — | ||||||||||||||||||||||||
Change in deferred compensation | — | — | — | — | 17 | — | — | 17 | ||||||||||||||||||||||||
Reversal of net deferred tax liabilities from former Parent | — | — | — | — | 188 | — | — | 188 | ||||||||||||||||||||||||
Repurchase of warrants | — | — | — | — | (98 | ) | — | — | (98 | ) | ||||||||||||||||||||||
Repurchase of common stock | — | — | (10 | ) | (237 | ) | — | — | — | (237 | ) | |||||||||||||||||||||
Change in excess tax benefit on equity awards | — | — | — | — | 12 | — | — | 12 | ||||||||||||||||||||||||
Dividends | — | — | — | — | — | (89 | ) | — | (89 | ) | ||||||||||||||||||||||
|
|
|
|
|
|
|
|
|
|
|
|
|
|
|
| |||||||||||||||||
Balance as of December 31, 2010 | 210 | 2 | (37 | ) | (1,107 | ) | 3,892 | (25 | ) | 155 | 2,917 | |||||||||||||||||||||
Comprehensive income | ||||||||||||||||||||||||||||||||
Net income | — | — | — | — | — | 417 | — | |||||||||||||||||||||||||
Currency translation adjustment, net of tax benefit of $3 | — | — | — | — | — | — | (30 | ) | ||||||||||||||||||||||||
Unrealized gains on cash flow hedges, net of tax of $4 | — | — | — | — | — | — | 5 | |||||||||||||||||||||||||
Pension liability adjustment, net of tax benefit of $1 | — | — | — | — | — | — | (2 | ) | ||||||||||||||||||||||||
Total comprehensive income | 390 | |||||||||||||||||||||||||||||||
Exercise of stock options | — | — | — | — | 11 | — | — | 11 | ||||||||||||||||||||||||
Issuance of shares for RSU vesting | 2 | — | — | — | — | — | — | — | ||||||||||||||||||||||||
Change in deferred compensation | — | — | — | — | 9 | — | — | 9 | ||||||||||||||||||||||||
Repurchase of warrants | — | — | — | — | (112 | ) | — | — | (112 | ) | ||||||||||||||||||||||
Repurchase of common stock | — | — | (28 | ) | (902 | ) | — | — | — | (902 | ) | |||||||||||||||||||||
Change in excess tax benefit on equity awards | — | — | — | — | 18 | — | — | 18 | ||||||||||||||||||||||||
Dividends | — | — | — | — | — | (99 | ) | — | (99 | ) | ||||||||||||||||||||||
|
|
|
|
|
|
|
|
|
|
|
|
|
|
|
| |||||||||||||||||
Balance as of December 31, 2011 | 212 | $ | 2 | (65 | ) | $ | (2,009 | ) | $ | 3,818 | $ | 293 | $ | 128 | $ | 2,232 | ||||||||||||||||
|
|
|
|
|
|
|
|
|
|
|
|
|
|
|
| |||||||||||||||||
See Notes to Consolidated Financial Statements.
F-6
NOTES TO CONSOLIDATED FINANCIAL STATEMENTS
(Unless otherwise noted, all amounts are in millions, except per share amounts)
| 1. | |
| Basis of Presentation |
Wyndham Worldwide Corporation (“Wyndham” or the “Company”) is a global provider of hospitality productsservices and services.products. The accompanying Consolidated Financial Statements include the accounts and transactions of Wyndham, as well as the entities in which Wyndham directly or indirectly has a controlling financial interest. The accompanying Consolidated Financial Statements have been prepared in accordance with accounting principles generally accepted in the United States of America. All intercompany balances and transactions have been eliminated in the Consolidated Financial Statements.
In presenting the Consolidated Financial Statements, management makes estimates and assumptions that affect the amounts reported and related disclosures. Estimates, by their nature, are based on judgment and available information. Accordingly, actual results could differ from those estimates. In management’s opinion, the Consolidated Financial Statements contain all normal recurring adjustments necessary for a fair presentation of annual results reported.
Business Description
The Company operates in the following business segments:
Lodging—franchises hotels in the upper upscale, upscale, upper midscale, midscale, economy and extended stay segments of the lodging industry and provides hotel management services for full-service hotels globally. |
Vacation Exchange and Rentals—provides vacation exchange |
Vacation Ownership—develops, markets and sells VOIs to individual consumers, provides consumer financing in connection with the sale of VOIs and provides property management services at resorts. |
| 2. | |
| Summary of Significant Accounting Policies |
Principles of ConsolidationPRINCIPLESOF CONSOLIDATION
When evaluating an entity for consolidation, the Company first determines whether an entity is within the scope of the guidance for consolidation of variable interest entities (“VIE”) and if it is deemed to be a VIE. If the entity is considered to be a VIE, the Company determines whether it would be considered the entity’s primary beneficiary. The Company consolidates those VIEs for which it has determined that it is the primary beneficiary. The Company will consolidate an entity not deemed either a VIE or qualifying special purpose entity (“QSPE”) upon a determination that it has a controlling financial interest. For entities where the Company does not have a controlling financial interest, the investments in such entities are classified asavailable-for-sale securities or accounted for using the equity or cost method, as appropriate.
REVENUE RECOGNITION
Revenue Recognition
The Company’s franchising business is designed to generate revenues for its hotel owners through the delivery of room night bookings to the hotel, the promotion of brand awareness among the consumer base, global sales efforts, ensuring guest satisfaction and providing outstanding customer service to both its customers and guests staying at hotels in its system.
The Company enters into agreements to franchise its lodging brands to independent hotel owners. The Company’s standard franchise agreement typically has a term of 15 to 20 years and provides a franchisee with certain rights to terminate the franchise agreement before the term of the agreement under certain circumstances. The principal source of revenues from franchising hotels is ongoing franchise fees, which are comprised of royalty fees and other fees relating to marketing and reservation services. Ongoing franchise fees typically are based on a percentage of gross room revenues of each franchised hotel and are recordedrecognized as revenue upon becoming due from the franchisee. An estimate of uncollectible ongoing franchise fees is charged to bad debt expense and included in operating expenses on the Consolidated Statements of Operations.Income. Lodging revenues also include initial franchise fees, which are recognized as revenues when all material services or conditions have been substantially performed, which is either when a franchised hotel opens for business or when a franchise agreement is terminated after it has been determined that the franchised hotel will not open.
F-7
Other service fees the Company derives from providing ancillary services to franchisees are primarily recognized as revenue upon completion of services.
The Company also provides management services for hotels under management contracts, which offer all the benefits of a global brand and a full range of management, marketing and reservation services. In addition to the standard franchise services described below,above, the Company’s hotel management business provides hotel owners with professional oversight and comprehensive operations support services such as hiring, training and supervising the managers and employees that operate the hotels as well as annual budget preparation, financial analysis and extensive food and beverage services. The Company’s standard management agreement typically has a term of up to 20 years. The Company’s management fees are comprised of base fees, which are typically calculated based upon a specified percentage of gross revenues from hotel operations, and incentive fees, which are typically calculated based upon a specified percentage of a hotel’s gross operating profit. Management fee revenues are recognized when earned in accordance with the terms of the contract. The Company incurs certain reimbursable costs on behalf of managed hotel propertiescontract and reports reimbursements received from managed properties as revenues and the costs incurred on their behalf as expenses. Management fee revenues are recorded as a component of franchise fee revenues and reimbursable revenues are recorded as a component of service fees and membership revenues on the Consolidated Statements of Operations.Income. Management fee revenues were $7 million, $5 million and $4 million during 2011, 2010 and 2009, respectively. The costs, which principally relateCompany is also required to recognize as revenue fees relating to payroll costs for operational employees who work at certain of the Company’s managed hotels,hotels. Although these costs are funded by hotel owners, the Company is required to report these fees on a gross basis as both revenues and expenses. The revenues are recorded as a component of service and membership fees while the offsetting expenses is reflected as a component of operating expenses on the Consolidated Statements of Operations. The reimbursements from hotel owners are based upon the costs incurred with no added margin; as a result, these reimbursable costs have little toIncome. There is no effect on the Company’s operating income. Management fee revenues and revenuesRevenues related to these payroll reimbursementscosts were $4$79 million, $77 million and $85 million respectively, duringin 2011, 2010 and 2009, $5 million and $100 million, respectively, during 2008 and $6 million and $92 million, respectively, during 2007.
The Company also earns revenues from administering its Wyndham Rewards loyalty program. Theprogram when a member stays at a participating hotel. These revenues are derived from a fee the Company charges its franchisee/managed hotel owner a fee based upon a percentage of room revenues generated from member stays at participating hotels.such stay. This fee is recordedrecognized as revenue upon becoming due from the franchisee.
Vacation Exchange and Rentals
As a provider of vacation exchange services, the Company enters into affiliation agreements with developers of vacation ownership properties to allow owners of intervals to trade their intervals for certain other intervals within the Company’s vacation exchange business and, for some members, for other leisure-related productsservices and services.products. Additionally, as a marketer of vacation rental properties, generally the Company enters into contracts for exclusive periods of time with property owners to market the rental of such properties to rental customers. The Company’s vacation exchange business derives a majority of its revenues from annual membership dues and exchange fees from members trading their intervals. Annual dues revenues represent the annual membership fees from members who participate in the Company’s vacation exchange business and, for additional fees, have the right to exchange their intervals for certain other intervals within the Company’s vacation exchange business and, for certain members, for other leisure-related productsservices and services.products. The Company recognizes revenues from annual membership dues on a straight-line basis over the membership period during which delivery of publications, if applicable, and other services are provided to the members. Exchange fees are generated when members exchange their intervals for equivalent values of rights and services, which may include intervals at other properties within the Company’s vacation exchange business or for other leisure-related productsservices and services.products. Exchange fees are recognized as revenues, net of expected cancellations, when the exchange requests have been confirmed to the member. The Company’s vacation rentals business primarily derives its revenues from fees, which generally average between 20% and 45%50% of the gross booking fees for non-proprietary inventory, except for where it receives 100% of the revenues for properties that it owns ormanages, operates under long-term capital leases.leases or owns. The majority of the time, the Company acts on behalf of the owners of the rental properties to generate the Company’s fees. The Company provides reservation services to the independent property owners and receives theagreed-upon fee for the service provided. The Company remits the gross rental fee received from the renter to the independent property owner, net of the Company’sagreed-upon fee. Revenues from such fees are recognized in the period that the rental reservation is made, net of expected cancellations. Cancellations for 2009, 20082011, 2010 and 20072009 each totaled less than 5% of rental transactions booked. Upon confirmation of the rental reservation, the rental customer and property owner generally have a direct relationship for additional services to be performed. The Company also earns rental fees in connection with properties it owns ormanages, operates under long-term capital leases or owns and such fees are recognized whenratably over the rental
F-8
Vacation Ownership
The Company develops, markets and sells VOIs to individual consumers, provides property management services at resorts and provides consumer financing in connection with the sale of VOIs. The Company’s vacation ownership business derives the majority of its revenues from sales of VOIs and derives other revenues from consumer financing and property management. The Company’s sales of VOIs are either cash sales or Company-financeddeveloper-financed sales. In order for the Company to recognize revenues offrom VOI sales under the full accrual method of accounting described in the guidance for sales of real estate for fully constructed inventory, a binding sales contract must have been executed, the statutory rescission period must have expired (after which time the purchasers are not entitled to a refund except for non-delivery by the Company), receivables must have been deemed collectible and the remainder of the Company’s obligations must have been substantially completed. In addition, before the Company recognizes any revenues onfrom VOI sales, the purchaser of the VOI must have met the initial investment criteria and, as applicable, the continuing investment criteria, by executing a legally binding financing contract. A purchaser has met the initial investment criteria when a minimum down payment of 10% is received by the Company. In accordance with the guidance for accounting for real estate time-sharing transactions, the Company must also take into consideration the fair value of certain incentives provided to the purchaser when assessing the adequacy of the purchaser’s initial investment. In those cases where financing is provided to the purchaser by the Company, the purchaser is obligated to remit monthly payments under financing contracts that represent the purchaser’s continuing investment. If all of the criteria for a VOI sale to qualify under the full accrual method of accounting have been met, as discussed above, except that construction of the VOI purchased is not complete, the Company recognizes revenues using thepercentage-of-completion (“POC”)
method of accounting provided that the preliminary construction phase is complete and that a minimum sales level has been met (to assure that the property will not revert to a rental property). The preliminary stage of development is deemed to be complete when the engineering and design work is complete, the construction contracts have been executed, the site has been cleared, prepared and excavated, and the building foundation is complete. The completion percentage is determined by the proportion of real estate inventory costs incurred to total estimated costs. These estimated costs are based upon historical experience and the related contractual terms. The remaining revenues and related costs of sales, including commissions and direct expenses, are deferred and recognized as the remaining costs are incurred.
The Company also offers consumer financing as an option to customers purchasing VOIs, which are typically collateralized by the underlying VOI. The contractual terms of Company-provided financing agreements require that the contractual level of annual principal payments be sufficient to amortize the loan over a customary period for the VOI being financed, which is generally ten years, and payments under the financing contracts begin within 45 days of the sale and receipt of the minimum down payment of 10%. An estimate of uncollectible amounts is recorded at the time of the sale with a charge to the provision for loan losses, which is classified as a reduction of vacation ownership interest sales on the Consolidated Statements of Operations.Income. The interest income earned from the financing arrangements is earned on the principal balance outstanding over the life of the arrangement and is recorded within consumer financing on the Consolidated Statements of Operations.
The Company also providesday-to-day-management services, including oversight of housekeeping services, maintenance and certain accounting and administrative services for property owners’ associations and clubs. In some cases, the Company’s employees serve as officersand/or directors of these associations and clubs in accordance with their by-laws and associated regulations. ManagementThe Company receives fees for such property management services which are generally based upon total costs to operate such resorts. Fees for property management services typically approximate 10% of budgeted operating expenses. Property management fee revenues are recognized when earned in accordance with the terms of the contract and isare recorded as a component of service fees and membership fees on the Consolidated Statements of Operations. TheIncome. Property management revenues, which are comprised of management fee revenue and reimbursable revenue, were $424 million, $405 million and $376 million during 2011, 2010 and 2009, respectively. Management fee revenues were $198 million, $183 million and $170 million during 2011, 2010 and 2009, respectively. Reimbursable revenues, which are based upon certain reimbursable costs whichwith no added margin, were $226 million, $222 million and $206 million, respectively, during 2011, 2010 and 2009. These reimbursable costs principally relate to the payroll costs for management of the associations, clubsclub and the resort properties where the Company is the employer and are reflected as a component of operating expenses on the Consolidated Statements of Operations. Reimbursements are based upon the costs incurred with no added marginIncome. During each of 2011, 2010 and thus presentation of these reimbursable costs has little to no effect on the Company’s operating income. Management fee revenues and revenues related to reimbursements were $170 million and $206 million, respectively, during 2009, $159 million and $187 million, respectively, during 2008 and $146 million and $164 million, respectively, during 2007. During 2009, 2008 and 2007, one of the associations that the Company manages paid Wyndham Exchange and& Rentals $19 million $17 million and $15 million, respectively, for exchange services.
Under the percentage of completionPOC method of accounting, a portion of the total revenues from a vacation ownership contract sale is not recognized if the construction of the vacation resort has not yet been fully completed. Such deferred revenues were recognized in subsequent periods in proportion to the costs
F-9
Other Items
The Company records lodging-related marketing and reservation revenues, Wyndham Rewards revenues, as well asRCI Elite Rewards revenues and hotel/property management services revenues for the Company’sits Lodging, Vacation Ownership and Vacation OwnershipExchange and Rentals segments, in accordance with the guidance for reporting revenues gross as a principal versus net presentation,as an agent, which requires that these revenues be recorded on a gross basis.
Deferred Income
Deferred income, as of December 31, consisted of:
| 2011 | 2010 | |||||||
Membership and exchange fees | $ | 330 | $ | 370 | ||||
VOI trial and incentive fees | 118 | 120 | ||||||
Vacation rental fees | 70 | 56 | ||||||
Other fees | 66 | 61 | ||||||
|
|
|
| |||||
Total deferred income | 584 | 607 | ||||||
Less: Current deferred income | 402 | 401 | ||||||
|
|
|
| |||||
Non-current deferred income | $ | 182 | $ | 206 | ||||
|
|
|
| |||||
Deferred membership and exchange fees consist primarily of payments made in advance for annual memberships that are recognized over the term of the membership period, which is typically one to three years. Deferred VOI trial fees are payments received in advance for a trial VOI, which allows customers to utilize a VOI typically within one year of purchase. Deferred incentive fees represent payments received in advance for additional travel related products and services at the time of a VOI sale. Revenue is recognized when a customer utilizes the additional products and services, which is typically within two years of VOI sale. Deferred vacation rental fees represent payments received in advance of a rental customer’s stay that are recognized as revenue when the rental stay occurs, which is typically within six months of the confirmation date.
Income TaxesINCOME TAXES
The Company recognizes deferred tax assets and liabilities using the asset and liability method, under which deferred tax assets and liabilities are calculated based upon the temporary differences between the financial statement and income tax bases of assets and liabilities using currently enacted tax rates. These differences are based upon estimated differences between the book and tax basis of the assets and liabilities for the Company as of December 31, 20092011 and 2008.
The Company’s deferred tax assets are recorded net of a valuation allowance when, based on the weight of available evidence, it is more likely than not that some portion or all of the recorded deferred tax assets will not be realized in future periods. Decreases to the valuation allowance are recorded as reductions to the Company’s provision for income taxes and increases to the valuation allowance result in additional provision for income taxes. The realization of the Company’s deferred tax assets, net of the valuation allowance, is primarily dependent on estimated future taxable income. A change in the Company’s estimate of future taxable income may require an addition to or reduction from the valuation allowance.
For tax positions the Company has taken or expects to take in a tax return, the Company applies a more likely than not threshold, under which the Company must conclude a tax position is more likely than not to be sustained, assuming that the position will be examined by the appropriate taxing authority that has full knowledge of all relevant information, in order to recognize or continue to recognize the benefit. In determining the Company’s provision for income taxes, the Company uses judgment, reflecting its estimates and Cash Equivalentsassumptions, in applying the more likely than not threshold.
CASHAND CASH EQUIVALENTS
The Company considers highly-liquid investments purchased with an original maturity of three months or less to be cash equivalents.
Restricted CashRESTRICTED CASH
The largest portion of the Company’s restricted cash relates to securitizations. The remaining portion is comprised of cash held in escrow related to the Company’s vacation ownership business and cash held in all other escrow accounts.
Securitizations: In accordance with the contractual requirements of the Company’s various vacation ownership contract receivable securitizations, a dedicated lockbox account, subject to a blocked control agreement, is established for each securitization. At each month end, the total cash in the collection account from the previous month is analyzed and a monthly servicer report is prepared by the Company, which details how much cash should be remitted to the noteholders for principal and interest payments, and any cash remaining is transferred by the trustee back to the Company. Additionally, as required by various securitizations, the Company holds anagreed-upon percentage of the aggregate outstanding principal balances of the VOI contract receivables collateralizing the asset-backed notes in a segregated trust (or reserve) account as credit enhancement. Each time a securitization closes and the Company receives cash from the noteholders, a portion of the cash is deposited in the reserve account. Such amounts were $133$132 million and $155$138 million as of December 31, 20092011 and 2008,2010, respectively, of which $69$71 million and $80$77 million is recorded within other current assets as of December 31, 20092011 and 2008,2010, respectively, and $64$61 million and $75 million areis recorded within other non-current assets as of both December 31, 20092011 and 2008, respectively,2010 on the Consolidated Balance Sheets.
Escrow Deposits: Laws in most U.S. states require the escrow of down payments on VOI sales, with the typical requirement mandating that the funds be held in escrow until the rescission period expires. As sales transactions are consummated, down payments are collected and are subsequently placed in escrow until the rescission period has expired. Depending on the state, the rescission period can be as short as three calendar days or as long as 15 calendar days. In certain states, the escrow laws require that 100% of VOI purchaser funds (excluding interest payments, if any), be held in escrow until the deeding process is complete. Where possible, the Company utilizes surety bonds in lieu of escrow deposits. Escrow deposit amounts were $19$53 million and $30$42 million as of December 31, 20092011 and 2008,2010, respectively, of which $19 million and $28 million areis recorded within other current assets as of December 31, 2009 and 2008, respectively, and $2 million is recorded within other non-current assets as of December 31, 2008 on the Consolidated Balance Sheets.
F-10
RECEIVABLE VALUATION
The Company provides for estimated bad debts based on their assessment of the ultimate realizability of receivables, considering historical collection experience, the economic environment and specific customer information. When the Company determines that an account is not collectible, the account is written-off to the allowance for doubtful accounts. The following table illustrates the Company’s allowance for doubtful accounts activity during 2009, 2008 and 2007:
| For the Years Ended | ||||||||||||
| December 31, | ||||||||||||
| 2009 | 2008 | 2007 | ||||||||||
| Beginning balance | $ | 117 | $ | 109 | $ | 98 | ||||||
| Bad debt expense | 102 | 84 | 81 | |||||||||
| Write-offs | (72 | ) | (71 | ) | (70 | ) | ||||||
| Translation and other adjustments | 2 | (5 | ) | — | ||||||||
| Ending balance | $ | 149 | $ | 117 | $ | 109 | ||||||
| 2011 | 2010 | 2009 | ||||||||||
Beginning balance | $ | 185 | $ | 149 | $ | 117 | ||||||
Bad debt expense | 71 | 97 | 102 | |||||||||
Write-offs | (50 | ) | (63 | ) | (72 | ) | ||||||
Translation and other adjustments | 1 | 2 | 2 | |||||||||
|
|
|
|
|
| |||||||
Ending balance | $ | 207 | $ | 185 | $ | 149 | ||||||
|
|
|
|
|
| |||||||
Vacation ownership contract receivables
In the Company’s vacation ownershipVacation Ownership segment, the Company provides for estimated vacation ownership contract receivable defaults at the time of VOI sales by recording a provision for loan losses as a reduction of vacation ownership interest sales on the Consolidated Statements of Operations.Income. The Company assesses the
adequacy of the allowance for loan losses based on the historical performance of similar vacation ownership contract receivables. The Company uses a technique referred to as static pool analysis, which tracks defaults for each year’s sales over the entire life of those contract receivables. The Company considers current defaults, past due aging, historical write-offs of contracts and consumer credit scores (FICO scores) in the assessment of borrower’s credit strength and expected loan performance. The Company also considers whether the historical economic conditions are comparable to current economic conditions. If current or expected future conditions differ from the conditions in effect when the historical experience was generated, the Company adjusts the allowance for loan losses to reflect the expected effects of the current environment on the collectability of the Company’s vacation ownership contract receivables.
Loyalty ProgramsLOYALTY PROGRAMS
The Company operates a number of loyalty programs including Wyndham Rewards, RCI Elite Rewards and other programs. Wyndham Rewards members primarily accumulate points by staying in hotels franchised under one of the Company’s lodging brands. Wyndham Rewards and RCI Elite Rewards members accumulate points by purchasing everyday productsservices and servicesproducts from the various businesses that participate in the program.
Members may redeem their points for hotel stays, airline tickets, rental cars, resort vacations, electronics, sporting goods, movie and theme park tickets, gift certificates, vacation ownership maintenance fees and annual membership dues and exchange fees for transactions. The points cannot be redeemed for cash. The Company earns revenue from these programs (i) when a member stays at a participating hotel, from a fee charged by the Company to the franchisee, which is based upon a percentage of room revenues generated from such stay or (ii) based upon a percentage of the members’ spending on the credit cards and such revenues are paid to the Company by a third-party issuing bank. The Company also incurs costs to support these programs, which primarily relate to marketing expenses to promote the programs, costs to administer the programs and costs of members’ redemptions.
As members earn points through the Company’s loyalty programs, the Company records a liability of the estimated future redemption costs, which is calculated based on (i) aan estimated cost per point and (ii) an estimated redemption rate of the overall points earned, which is determined through historical experience, current trends and the use of an actuarial analysis. Revenues relating to the Company’s loyalty programs are recorded in other revenues in the Consolidated Statements of OperationsIncome and amounted to $82$80 million, $94$77 million and $87$82 million, while total expenses amounted to $68 million, $48 million and $59 million $81 millionin 2011, 2010 and $71 million in 2009, 2008 and 2007, respectively. The points liability as of December 31, 20092011 and 20082010 amounted to $44$40 million and $50$36 million, respectively, and is included in accrued expenses and other current liabilities and other non-current liabilities in the Consolidated Balance Sheets.
InventoryINVENTORY
Inventory primarily consists of real estate and development costs of completed VOIs, VOIs under construction, land held for future VOI development, vacation ownership properties and vacation credits. The Company applies the relative sales value method for relieving VOI inventory and recording the related cost of sales. Under the relative sales value method, cost of sales is calculated as a percentage of net sales using a cost-of-sales percentage ratio of total estimated development cost to total estimated VOI revenue, including estimated future revenue and incorporating factors such as changes in prices and the recovery of VOIs generally as a result of contract receivable defaults. The effect of such changes in estimates under the relative sales value method is accounted for on a retrospective basis through corresponding current-period adjustments to inventory and cost of sales. Inventory is stated at the lower of cost, including capitalized interest, property taxes and certain other carrying costs incurred during the construction process, or net realizable value. Capitalized interest was $2 million, $5 million and $10 million $19 millionin 2011, 2010 and $23 million in
F-11
Advertising ExpenseADVERTISING EXPENSE
Advertising costs are generally expensed in the period incurred. Advertising expenses, recorded primarily within marketing and reservation expenses on the Consolidated Statements of Operations,Income, were $93 million, $77 million and $74 million $110 millionin 2011, 2010 and $112 million in 2009, 2008 and 2007, respectively.
Use of Estimates and AssumptionsUSEOF ESTIMATESAND ASSUMPTIONS
The preparation of the Consolidated Financial Statements requires the Company to make estimates and assumptions that affect the reported amounts of assets, liabilities, revenues and expenses and the disclosure of contingent assets and liabilities in the Consolidated Financial Statements and accompanying notes. Although these estimates and assumptions are based on the Company’s knowledge of current events and actions the Company may undertake in the future, actual results may ultimately differ from estimates and assumptions.
Derivative InstrumentsDERIVATIVE INSTRUMENTS
The Company uses derivative instruments as part of its overall strategy to manage its exposure to market risks primarily associated with fluctuations in foreign currency exchange rates and interest rates. Additionally, the Company has a bifurcated conversion feature related to its convertible notes and cash-settled call options that are considered derivative instruments. As a matter of policy, the Company does not use derivatives for trading or speculative purposes. All derivatives are recorded at fair value either as assets or liabilities. Changes in fair value of derivatives not designated as hedging instruments and of derivatives designated as fair value hedging instruments are recognized currently in earnings and included either as a component of other revenues or net interest expense, based upon the nature of the hedged item, in the Consolidated Statements of Operations.Income. The effective portion of changes in fair value of derivatives designated as cash flow hedging instruments is recorded as a component of other comprehensive income. The ineffective portion is reported currentlyimmediately in earnings as a component of revenues or net interest expense, based upon the nature of the hedged item. Amounts included in other comprehensive income are reclassified into earnings in the same period during which the hedged item affects earnings.
Property and EquipmentPROPERTYAND EQUIPMENT
Property and equipment (including leasehold improvements) are recorded at cost, net of accumulated depreciation and amortization. Depreciation, recorded as a component of depreciation and amortization on the Consolidated Statements of Operations,Income, is computed utilizing the straight-line method over the lesser of the lease term or estimated useful lives of the related assets. Amortization of leasehold improvements, also recorded as a component of depreciation and amortization, is computed utilizing the straight-line method over the estimated benefit period of the related assets or the lease term, if shorter. Useful lives are generally 30 years for buildings, up to 20 years for leasehold improvements, from 20 to 30 years for vacation rental properties and from three to seven years for furniture, fixtures and equipment.
The Company capitalizes the costs of software developed for internal use in accordance with the guidance for accounting for costs of computer software developed or obtained for internal use. Capitalization of software developed for internal use commences during the development phase of the project. The Company generally amortizes software developed or obtained for internal use on a straight-line basis, from three to five years, commencing when such software is substantially ready for use. The net carrying value of software developed or obtained for internal use was $131$132 million and $130$133 million as of December 31, 2011 and 2010, respectively. Capitalized interest was $8 million, $2 million and $2 million in 2011, 2010 and 2009, and 2008, respectively.
Impairment of Long-Lived AssetsIMPAIRMENTOF LONG-LIVED ASSETS
The Company has goodwill and other indefinite-lived intangible assets recorded in connection with business combinations. The Company annually (during the fourth quarter of each year subsequent to completing the Company’s annual forecasting process) or, more frequently if circumstances indicate impairment may have occurred that would more likely than not reduce the fair value of a reporting unit below its carrying amount,
reviews the reporting units’ carrying values as required by the guidance for goodwill and other indefinite-lived intangible assets. The Company evaluates goodwill for impairment using the two-step process prescribed in this guidance. The first step is to compare the estimated fair value of any reporting unit within the company that have recorded goodwill with the recorded net book value (including the goodwill) of the reporting unit. If the estimated fair value of the reporting unit is higher than the recorded net book value, no impairment is deemed to exist and no further testing is required. If, however, the estimated fair value of the reporting unit is below the recorded net book value, then a second step must be performed to determine the goodwill impairment required, if any. In this second step, the estimated fair value from the first step is used as the purchase price in a hypothetical acquisition of the reporting unit. Purchase business combination accounting rules are followed to determine a hypothetical purchase price
F-12
Application of which contained goodwill prior to the 2008 annual goodwill impairment test. See Note 5 — Intangible Assets and Note 21 — Restructuring and Impairments for information regarding the goodwill impairment recorded as a resulttest requires judgment, including the identification of reporting units, assignment of assets and liabilities to reporting units and determination of the annual 2008 impairment test. Such 2008 annualfair value of each reporting unit. The fair value of each reporting unit is estimated using a discounted cash flow methodology. This analysis requires significant judgments, including estimation of future cash flows, which are dependent on internal forecasts, estimation of long-term rate of growth for the business and estimation of the useful life over which cash flows will occur. The estimates used to calculate the fair value of a reporting unit change from year to year based on operating results and market conditions. Changes in these estimates and assumptions could materially affect the determination of fair value and any potential goodwill impairment test impaired the goodwill of the Company’s vacation ownershipfor each reporting unit to $0. As of December 31, 2009 and 2008, the Company had $297 million of goodwill at its lodging reporting unit and $1,089 million and $1,056 million, respectively, of goodwill at its vacation exchange and rentals reporting unit.
The Company also evaluates the recoverability of its other long-lived assets, including property and equipment and amortizable intangible assets, if circumstances indicate impairment may have occurred, pursuant to guidance for impairment or disposal of long-lived assets. This analysis is performed by comparing the respective carrying values of the assets to the current and expected future cash flows, on an undiscounted basis, to be generated from such assets. Property and equipment is evaluated separately within each segment. If such analysis indicates that the carrying value of these assets is not recoverable, the carrying value of such assets is reduced to fair value.
Accounting for Restructuring ActivitiesACCOUNTINGFOR RESTRUCTURING ACTIVITIES
The Company’s restructuring actions require it to make significant estimates in several areas including: (i) expenses for severance and related benefit costs; (ii) the ability to generate sublease income, as well as its ability to terminate lease obligations; and (iii) contract terminations. The amounts that the Company has accrued as of December 31, 20092011 represent its best estimate of the obligations that it expects to incurincurred in connection with these actions, but could be subject to change due to various factors including market conditions and the outcome of negotiations with third parties. ShouldIn the event that actual amounts differ from the Company’s estimates, the amount of the restructuring charges could be materially impacted.
Accumulated Other Comprehensive IncomeACCUMULATED OTHER COMPREHENSIVE INCOME
Accumulated other comprehensive income (“AOCI”) consists of accumulated foreign currency translation adjustments, accumulated unrealized gains and losses on derivative instruments designated as cash flow hedges and pension related costs. Foreign currency translation adjustments exclude income taxes related to indefinite investments in foreign subsidiaries. Assets and liabilities of foreign subsidiaries havingnon-U.S.-dollar functional currencies are translated at exchange rates at the Consolidated Balance Sheet dates. Revenues and expenses are translated at average exchange rates during the periods presented. The gains or losses resulting from translating foreign currency financial statements into U.S. dollars, net of hedging gains or losses and taxes, are included in accumulated other comprehensive incomeAOCI on the Consolidated Balance Sheets. Gains or losses resulting from foreign currency transactions are included in the Consolidated Statements of Operations.
Stock-Based CompensationSTOCK-BASED COMPENSATION
In accordance with the guidance for stock-based compensation, the Company measures all employee stock-based compensation awards using a fair value method and records the related expense in its Consolidated Statements of Operations. The Company uses the modified prospective transition method, which requires that compensation cost be recognized in the financial statements for all awards granted after the date of adoption as well as for existing awards for which the requisite service has not been rendered as of the date of adoption and requires that prior periods not be restated. Because the Company was allocated stock-based compensation expense for all outstanding employee stock awards prior to the adoption of the guidance for stock-based compensation, the adoption of such guidance did not have a material impact on the Company’s results of operations.
F-13Income.
EQUITY EARNINGS AND OTHER INCOME
F-14
RECENTLY ISSUED ACCOUNTING PRONOUNCEMENTS
Testing Goodwill for Impairment. In September 2011, the FASB issued guidance on testing goodwill for impairment, which amends existing guidance by giving an entity the option to first assess qualitative factors to determine whether it is more likely than not that the fair value of a reporting unit is less than its carrying amount. If it is concluded that the fair value of a reporting unit is more likely than not less than its carrying amount, it is necessary to perform the currently evaluatingprescribed two-step goodwill impairment test. Otherwise, the impact oftwo-step goodwill impairment test is not required. This guidance is effective for interim and annual goodwill impairment tests performed for fiscal years beginning after December 15, 2011, with early adoption permitted. The Company will adopt the guidance on January 1, 2012, as required, and it believes the adoption of this guidance will not have a material impact on itsthe Consolidated Financial Statements.
Presentation of Comprehensive Income. In June 2011, the FASB issued guidance for the presentation of comprehensive income, which amends existing guidance by allowing only two options for presenting the components of net income and other comprehensive income: (i) in either a single continuous financial statement of comprehensive income or (ii) in two separate but consecutive financial statements, consisting of an income statement followed by a separate statement of comprehensive income. This guidance is effective for interim and annual reporting periods beginning after December 15, 2011, with early adoption permitted. The Company early adopted the guidance as of December 31, 2011, and has presented the Statements of Comprehensive Income as a separate financial statement.
Fair Value Measurement. In May 2011, the FASB issued guidance which generally provides a consistent definition of fair value and ensures that the fair value measurement and disclosure requirements are similar between U.S. GAAP and International Financial Reporting Standards. The guidance changes certain fair value measurement principles and enhances the disclosure requirements particularly for Level 3 fair value measurements. This guidance is effective for interim and annual reporting periods beginning after December 15, 2011 and shall be applied on a prospective basis. The Company will adopt the guidance on January 1, 2012, as required, and it believes adoption of this guidance will not have a material impact on the Consolidated Financial Statements.
| 3. | |
| Earnings per Share |
The computation of basic and diluted earnings per share (“EPS”) is based on the Company’s net income/(loss)income available to common stockholders divided by the basic weighted average number of common shares and diluted weighted average number of common shares, respectively.
The following table sets forth the computation of basic and diluted EPS (in millions, except per share data):
| Year Ended December 31, | ||||||||||||
| 2009 | 2008 | 2007 | ||||||||||
| Net income/(loss) | $ | 293 | $ | (1,074 | ) | $ | 403 | |||||
| Basic weighted average shares outstanding | 179 | 178 | 181 | |||||||||
| Stock options and restricted stock units | 3 | — | 2 | |||||||||
| Diluted weighted average shares outstanding | 182 | 178 | 183 | |||||||||
Earnings/(losses) per share: | ||||||||||||
| Basic | $ | 1.64 | $ | (6.05 | ) | $ | 2.22 | |||||
| Diluted | 1.61 | (6.05 | ) | 2.20 | ||||||||
| Year Ended December 31, | ||||||||||||
| 2011 | 2010 | 2009 | ||||||||||
Net income | $ | 417 | $ | 379 | $ | 293 | ||||||
|
|
|
|
|
| |||||||
Basic weighted average shares outstanding | 162 | 178 | 179 | |||||||||
Stock options, SSARs and RSUs(a) | 3 | 4 | 3 | |||||||||
Warrants(b) | 1 | 3 | — | |||||||||
|
|
|
|
|
| |||||||
Diluted weighted average shares outstanding | 166 | 185 | 182 | |||||||||
|
|
|
|
|
| |||||||
Earnings per share: | ||||||||||||
Basic | $ | 2.57 | $ | 2.13 | $ | 1.64 | ||||||
Diluted | 2.51 | 2.05 | 1.61 | |||||||||
| (a) | Includes unvested dilutive restricted stock units (“RSUs”) which are subject to future forfeitures. |
| (b) | Represents the dilutive effect of warrants to purchase shares of the Company’s common stock related to the May 2009 issuance of the Company’s convertible notes (see Note 13 — Long-Term Debt and Borrowing Arrangements). |
The computations of diluted EPS for the years ended December 31, 2009, 20082011, 2010 and 20072009 do not include approximately 92 million, 134 million and 109 million stock options and stock-settled stock appreciation rights (“SSARs”), respectively, as the effect of their inclusion would have been anti-dilutive. Additionally,In addition, for the year ended December 31, 2011 approximately 350,000 performance vested restricted stock units (“PSUs”) were excluded as the Company had not met the required performance metrics as of December 31, 2011 (see Note 19 — Stock-Based Compensation for further details). For the year ended December 31, 2009, the computation of diluted EPS does not include warrants to purchase approximately 18 million shares of the Company’s common stock related to the May 2009 issuance of the Company’s Convertible Notes (see Note 13 — Long-Term Debt and Borrowing Arrangements) as the effect of their inclusion would have been anti-dilutive.
Dividend Payments
During each of the quarterly periods ended March 31, June 30, September 30 and December 31, 2011, the Company paid cash dividends of $0.15 per share ($99 million in the aggregate.) During each of the quarterly periods ended March 31, June 30, September 30 and December 31, 2010, the Company paid cash dividends of $0.12 per share ($86 million in the aggregate). During each of the quarterly periods ended March 31, June 30, September 30 and December 31, 2009 and 2008 the Company paid cash dividends of $0.04 per share ($29 million and $28 million in the aggregate during 2009 and 2008, respectively). During each of the quarterly periods ended September 30 and December 31, 2007, the Company paid cash dividends of $0.04 per share ($14 million in the aggregate).
Stock Repurchase Program
On both April 25, 2011 and August 11, 2011, the Company’s Board of Directors authorized an increase of $500 million to the Company’s existing stock repurchase program. As of December 31, 2011, the total authorization of the program was $1.5 billion.
The following table summarizes stock repurchase activity under the current stock repurchase program:
| Shares | Cost | Average Price | ||||||||||
As of December 31, 2010 | 11.4 | $ | 295 | $ | 25.78 | |||||||
For the year ended December 31, 2011 | 28.7 | 902 | 31.45 | |||||||||
|
|
|
|
|
| |||||||
As of December 31, 2011 | 40.1 | $ | 1,197 | $ | 29.83 | |||||||
|
|
|
|
|
| |||||||
The Company had $367 million remaining availability in its program as of December 31, 2011. The total capacity of this program is increased by proceeds received from stock option exercises.
As of December 31, 2011, the Company has repurchased under its current and prior stock repurchase plans a total of 65.2 million shares at an average price of $30.78 for a cost of $2.0 billion since its separation from Cendant (“Separation”).
| 4. | |
| Acquisitions |
Assets acquired and liabilities assumed in business combinations were recorded on the Consolidated Balance Sheets as of the respective acquisition dates based upon their estimated fair values at such dates. The results of operations of businesses acquired by the Company have been included in the Consolidated Statements of OperationsIncome since their respective dates of acquisition. The excess of the purchase price over the estimated fair values of the underlying assets acquired and liabilities assumed was allocated to goodwill. In certain circumstances, the allocations of the excess purchase price are based upon preliminary estimates and assumptions. Accordingly, the allocations may be subject to revision when the Company receives final information, including appraisals and other analyses. Any revisions to the fair values during the allocation period which may be significant, will be recorded by the Company as further adjustments to the purchase price allocations. Although the Company has substantially integrated the operations of its acquired businesses, additional future costs relating to such integration may occur. These costs may result from integrating operating systems, relocating employees, closing facilities, reducing duplicative efforts and exiting and consolidating other activities. These costs will be recorded on the Consolidated Balance Sheets as adjustments to the purchase price or on the Consolidated Statements of OperationsIncome as expenses, as appropriate.
F-15
2011 ACQUISITIONS
During the third quarter of 2011, the Company completed the acquisitions of substantially all of the assets of two vacation rentals businesses for $27 million in cash, net of cash acquired. The preliminary purchase price allocations of these acquisitions resulted in the recognition of $11 million of goodwill, $15 million of definite-lived intangible assets with a weighted average life of 16 years and $1 million of trademarks, all of which were assigned to the Company’s Vacation Exchange and Rentals segment.
2008 Acquisition
Tryp. On June 30, 2010, the Company completed the acquisition of the Tryp hotel brand (“Tryp”) for $43 million in cash. The purchase price allocation resulted in the economy lodging segmentrecognition of $3 million of goodwill, $3 million of franchise agreements with a weighted average life of 20 years and represents the Company’s entry into the all-suites, extended stay market. The allocation$36 million of the purchase price is summarized as follows:
| Amount | ||||
| Cash consideration | $ | 131 | ||
| Transaction costs and expenses | 4 | |||
| Total purchase price | 135 | |||
| Less: Historical value of assets acquired in excess of liabilities assumed | 57 | |||
| Less: Fair value adjustments | 26 | |||
| Excess purchase price over fair value of assets acquired and liabilities assumed | $ | 52 | ||
| Amount | ||||
| Trade receivables | $ | 5 | ||
| Other current assets | 5 | |||
Trademarks(a) | 83 | |||
Franchise agreements(b) | 34 | |||
| Goodwill | 52 | |||
Total assets acquired | 179 | |||
| Total current liabilities | (6 | ) | ||
| Non-current deferred income taxes | (38 | ) | ||
Total liabilities assumed | (44 | ) | ||
Net assets acquired | $ | 135 | ||
which is deductible for tax purposes, waswere assigned to the Company’s Lodging segment. This acquisition was not significant toincreases the Company’s results of operations, financial position or cash flows.
2007 Acquisitions
James Villa Holdings Ltd. On November 30, 2010, the Company completed the acquisition of James Villa Holdings Ltd. (“James Villa Holidays”), a European vacation rentals business, for $76 million in cash, net of cash acquired. The purchase price allocation resulted in $14the recognition of $52 million of othergoodwill, $26 million of definite-lived intangible assets.
F-16
| 5. | |
| Intangible Assets |
Intangible assets consisted of:
| As of December 31, 2009 | As of December 31, 2008 | |||||||||||||||||||||||
| Gross | Net | Gross | Net | |||||||||||||||||||||
| Carrying | Accumulated | Carrying | Carrying | Accumulated | Carrying | |||||||||||||||||||
| Amount | Amortization | Amount | Amount | Amortization | Amount | |||||||||||||||||||
Unamortized Intangible Assets | ||||||||||||||||||||||||
| Goodwill | $ | 1,386 | $ | 1,353 | ||||||||||||||||||||
Trademarks(a) | $ | 660 | $ | 660 | ||||||||||||||||||||
Amortized Intangible Assets | ||||||||||||||||||||||||
Franchise agreements(b) | $ | 630 | $ | 298 | $ | 332 | $ | 630 | $ | 278 | $ | 352 | ||||||||||||
Trademarks(c) | — | — | — | 3 | 2 | 1 | ||||||||||||||||||
Other(d) | 94 | 35 | 59 | 91 | 27 | 64 | ||||||||||||||||||
| $ | 724 | $ | 333 | $ | 391 | $ | 724 | $ | 307 | $ | 417 | |||||||||||||
| As of December 31, 2011 | As of December 31, 2010 | |||||||||||||||||||||||
| Gross Carrying Amount | Accumulated Amortization | Net Carrying Amount | Gross Carrying Amount | Accumulated Amortization | Net Carrying Amount | |||||||||||||||||||
Unamortized Intangible Assets: | ||||||||||||||||||||||||
Goodwill | $ | 1,479 | $ | 1,481 | ||||||||||||||||||||
|
|
|
| |||||||||||||||||||||
Trademarks(a) | $ | 730 | $ | 731 | ||||||||||||||||||||
|
|
|
| |||||||||||||||||||||
Amortized Intangible Assets: | ||||||||||||||||||||||||
Franchise agreements(b) | $ | 595 | $ | 324 | $ | 271 | $ | 634 | $ | 318 | $ | 316 | ||||||||||||
Other(c) | 180 | 50 | 130 | 164 | 40 | 124 | ||||||||||||||||||
|
|
|
|
|
|
|
|
|
|
|
| |||||||||||||
| $ | 775 | $ | 374 | $ | 401 | $ | 798 | $ | 358 | $ | 440 | |||||||||||||
|
|
|
|
|
|
|
|
|
|
|
| |||||||||||||
| (a) | Comprised of various trade names |
| (b) | Generally amortized over a period ranging from 20 to 40 years with a weighted average life of | |
| (c) | ||
| Includes customer lists and business contracts, generally amortized over a period ranging from 7 to 20 years with a weighted average life of 16 years. |
GoodwillOther Intangible Assets
During 2011, the Company tests goodwill for potentialrecorded a $25 million non-cash impairment annually (duringcharge to write-down franchise and management agreements which is included within the fourth quarter of each year subsequent to completing the Company’s annual forecasting process) and between annual tests if an event occurs or circumstances change that would more likely than not reduce the fair value of a reporting unit below its carrying amount.
F-17
Goodwill
exchange and rentals reporting units was substantially in excess of the carrying value.
The changes in the carrying amount of goodwill are as follows:
| Balance as of | Foreign | Balance as of | ||||||||||
| January 1, 2009 | Exchange | December 31, 2009 | ||||||||||
| Lodging | $ | 297 | $ | — | $ | 297 | ||||||
| Vacation Exchange and Rentals | 1,056 | 33 | 1,089 | |||||||||
| Total Company | $ | 1,353 | $ | 33 | $ | 1,386 | ||||||
F-18
| Balance at December 31, 2010 | Goodwill Acquired During 2011 | Foreign Exchange | Balance at December 31, 2011 | |||||||||||||
Lodging | $ | 300 | $ | — | $ | — | $ | 300 | ||||||||
Vacation Exchange and Rentals | 1,181 | 11 | (*) | (13 | ) | 1,179 | ||||||||||
|
|
|
|
|
|
|
| |||||||||
Total Company | $ | 1,481 | $ | 11 | $ | (13 | ) | $ | 1,479 | |||||||
|
|
|
|
|
|
|
| |||||||||
| (*) | Relates to two tuck-in acquisitions completed during the third quarter of 2011 (see Note 4 — Acquisitions). |
| Year Ended December 31, | ||||||||||||
| 2009 | 2008 | 2007 | ||||||||||
| Franchise agreements | $ | 20 | $ | 21 | $ | 19 | ||||||
| Trademarks | 1 | 2 | 2 | |||||||||
| Other | 7 | 7 | 6 | |||||||||
Total(*) | $ | 28 | $ | 30 | $ | 27 | ||||||
| Year Ended December 31, | ||||||||||||
| 2011 | 2010 | 2009 | ||||||||||
Franchise agreements | $ | 20 | $ | 20 | $ | 20 | ||||||
Trademarks | — | — | 1 | |||||||||
Other | 12 | 8 | 7 | |||||||||
|
|
|
|
|
| |||||||
Total(*) | $ | 32 | $ | 28 | $ | 28 | ||||||
|
|
|
|
|
| |||||||
| (*) | Included as a component of depreciation and amortization on the Consolidated Statements of |
Based on the Company’s amortizable intangible assets as of December 31, 2009,2011, the Company expects related amortization expense over the next five years as follows:
| Amount | ||||
| 2010 | $ | 25 | ||
| 2011 | 25 | |||
| 2012 | 24 | |||
| 2013 | 23 | |||
| 2014 | 23 | |||
| Amount | ||||
2012 | $ | 29 | ||
2013 | 27 | |||
2014 | 27 | |||
2015 | 26 | |||
2016 | 25 | |||
| 6. | |
| Franchising and Marketing/Reservation Activities |
Franchise fee revenues of $440$522 million, $514$461 million and $523$440 million on the Consolidated Statements of OperationsIncome for 2011, 2010 and 2009, 2008 and 2007, respectively, includesinclude initial franchise fees of $10 million, $8 million and $9 million, $11 million and $8 million, respectively.
As part of ongoing franchise fees, the Company receives marketing and reservation fees from its lodging franchisees, which generally are calculated based on a specified percentage of gross room revenues. Such fees totaled $237 million, $196 million and $186 million $218 millionduring 2011, 2010 and $227 million during 2009, 2008 and 2007, respectively, and are recorded within the franchise fees line item on the Consolidated Statements of Operations. As provided for inIncome. In accordance with the franchise agreements, all of thesethe Company is contractually obligated to expend the marketing and reservation fees are to be expendedit collects from franchisees for marketing purposes or the operation of an international, centralized, brand-specific reservation system for the respective franchisees. Additionally, the Company is required to provide certain services to its franchisees, including access to an international, centralized, brand-specific reservations system, advertising, promotional and co-marketing programs, referrals, technology, training and volume purchasing.
The number of lodging properties and rooms in operation by market sector is as follows:
| (Unaudited) | ||||||||||||||||||||||||
| As of December 31, | ||||||||||||||||||||||||
| 2009 | 2008 | 2007 | ||||||||||||||||||||||
| Properties | Rooms | Properties | Rooms | Properties | Rooms | |||||||||||||||||||
Economy(a) | 5,469 | 387,357 | 5,432 | 389,697 | 5,081 | 366,205 | ||||||||||||||||||
Midscale(b) | 1,540 | 182,251 | 1,515 | 177,284 | 1,363 | 156,562 | ||||||||||||||||||
Upscale(c) | 94 | 24,517 | 82 | 21,724 | 79 | 20,953 | ||||||||||||||||||
Unmanaged, Affiliated and Managed, Non-Proprietary Hotels(d) | 11 | 3,549 | 14 | 4,175 | 21 | 6,856 | ||||||||||||||||||
| 7,114 | 597,674 | 7,043 | 592,880 | 6,544 | 550,576 | |||||||||||||||||||
| (Unaudited) As of December 31, | ||||||||||||||||||||||||
| 2011 | 2010 | 2009 | ||||||||||||||||||||||
| Properties | Rooms | Properties | Rooms | Properties | Rooms | |||||||||||||||||||
Economy(a) | 5,536 | 394,087 | 5,482 | 387,202 | 5,469 | 387,357 | ||||||||||||||||||
Midscale(b) | 1,152 | 121,372 | 1,206 | 128,627 | 1,208 | 126,467 | ||||||||||||||||||
Upper Midscale(c) | 435 | 74,404 | 434 | 71,358 | 349 | 58,640 | ||||||||||||||||||
Upscale (d) | 76 | 22,201 | 84 | 25,348 | 77 | 21,661 | ||||||||||||||||||
Upper Upscale(e) | 6 | 1,062 | — | — | — | — | ||||||||||||||||||
Unmanaged, Affiliated and Managed, Non-Proprietary Hotels(f) | — | — | 1 | 200 | 11 | 3,549 | ||||||||||||||||||
|
|
|
|
|
|
|
|
|
|
|
| |||||||||||||
| 7,205 | 613,126 | 7,207 | 612,735 | 7,114 | 597,674 | |||||||||||||||||||
|
|
|
|
|
|
|
|
|
|
|
| |||||||||||||
| (a) | Comprised of the Days Inn, Super 8, Howard Johnson Inn, Howard Johnson Express, Travelodge, Microtel Inns & Suites and Knights Inn lodging brands. | |
| (b) | Primarily includes Wingate by Wyndham, Hawthorn by Wyndham, Ramada Worldwide, Howard Johnson Plaza, Howard Johnson Hotel and Baymont | |
| (c) | Primarily includes the Ramada Plaza, Tryp by Wyndham and Wyndham Garden Hotel lodging brands. |
| (d) | Comprised of the Wyndham Hotels and Resorts lodging brand. |
Comprised of Dream and Night lodging brands. |
| (f) | Represents properties/rooms affiliated with the Wyndham Hotels and Resorts brand for which the Company |
F-19
| (Unaudited) | ||||||||||||||||||||||||
| For the Years Ended December 31, | ||||||||||||||||||||||||
| 2009 | 2008 | 2007 | ||||||||||||||||||||||
| Properties | Rooms | Properties | Rooms | Properties | Rooms | |||||||||||||||||||
| Beginning balance | 7,043 | 592,880 | 6,544 | 550,576 | 6,473 | 543,234 | ||||||||||||||||||
| Additions | 486 | 46,528 | 538 | 55,125 | 474 | 49,857 | ||||||||||||||||||
| Acquisitions | — | — | 388 | (*) | 29,547 | (*) | — | — | ||||||||||||||||
| Terminations | (415 | ) | (41,734 | ) | (427 | ) | (42,368 | ) | (403 | ) | (42,515 | ) | ||||||||||||
| Ending balance | 7,114 | 597,674 | 7,043 | 592,880 | 6,544 | 550,576 | ||||||||||||||||||
| (Unaudited) As of December 31, | ||||||||||||||||||||||||
| 2011 | 2010 | 2009 | ||||||||||||||||||||||
| Properties | Rooms | Properties | Rooms | Properties | Rooms | |||||||||||||||||||
Beginning balance | 7,207 | 612,735 | 7,114 | 597,674 | 7,043 | 592,880 | ||||||||||||||||||
Additions | 541 | 54,706 | 492 | 54,171 | 486 | 46,528 | ||||||||||||||||||
Acquisitions | — | — | 92 | (*) | 13,236 | (*) | — | — | ||||||||||||||||
Terminations | (543 | ) | (54,315 | ) | (491 | ) | (52,346 | ) | (415 | ) | (41,734 | ) | ||||||||||||
|
|
|
|
|
|
|
|
|
|
|
| |||||||||||||
Ending balance | 7,205 | 613,126 | 7,207 | 612,735 | 7,114 | 597,674 | ||||||||||||||||||
|
|
|
|
|
|
|
|
|
|
|
| |||||||||||||
Relates to |
The Company may, at its discretion, provide development advances to certain of its franchisees or hotel owners in its managed business in order to assist such franchisees/hotel owners in converting to one of the Company’s brands, building a new hotel to be flagged under one of the Company’s brands or in assisting in other franchisee expansion efforts. Provided the franchisee/hotel owner is in compliance with the terms of the franchise/management agreement, all or a portion of the development advance may be forgiven by the Company over the period of the franchise/management agreement, which typically ranges from 10 to 20 years. Otherwise, the related principal is due and payable to the Company. In certain instances, the Company may earn interest on unpaid franchisee development advances, which was not significant during 2009, 20082011, 2010 or 2007.2009. The amount of such development advances recorded on the Consolidated Balance Sheets was $53$36 million at bothand $55 million as of December 31, 20092011 and 2008.2010, respectively. These amounts are classified within the other non-current assets line item on the Consolidated Balance Sheets. During 2009, 2008each of 2011, 2010 and 2007,2009, the Company recorded $5 million $4 million and $3 million, respectively, related to the forgiveness of these advances. Such amounts are recorded as a reduction of franchise fees
on the Consolidated Statements of Operations.Income. During 2011, 2010 and 2009, the Company recorded $1 million, $2 million and $4 million, respectively, of bad debt expense relating to development advances that were due and payable within its lodging management business to reflect collectability concerns regarding development advance notes provided to three managed properties in periods prior to 2009.business. Such expense is recorded within operating expenses on the Consolidated StatementStatements of Operations.
| 7. | |
| Income Taxes |
The income tax provision consists of the following for the year ended December 31:
| 2009 | 2008 | 2007 | ||||||||||
Current | ||||||||||||
| Federal | $ | 46 | $ | 64 | $ | 69 | ||||||
| State | 19 | 2 | 3 | |||||||||
| Foreign | 45 | 11 | 24 | |||||||||
| 110 | 77 | 96 | ||||||||||
Deferred | ||||||||||||
| Federal | 100 | 89 | 133 | |||||||||
| State | (6 | ) | 25 | 23 | ||||||||
| Foreign | (4 | ) | (4 | ) | — | |||||||
| 90 | 110 | 156 | ||||||||||
Provision for income taxes | $ | 200 | $ | 187 | $ | 252 | ||||||
| 2011 | 2010 | 2009 | ||||||||||
Current | ||||||||||||
Federal | $ | 83 | $ | 55 | $ | 46 | ||||||
State | 6 | 10 | 19 | |||||||||
Foreign | 74 | 43 | 45 | |||||||||
|
|
|
|
|
| |||||||
| 163 | 108 | 110 | ||||||||||
|
|
|
|
|
| |||||||
Deferred | ||||||||||||
Federal | 57 | 77 | 100 | |||||||||
State | 2 | 1 | (6 | ) | ||||||||
Foreign | 11 | (2 | ) | (4 | ) | |||||||
|
|
|
|
|
| |||||||
| 70 | 76 | 90 | ||||||||||
|
|
|
|
|
| |||||||
Provision for income taxes | $ | 233 | $ | 184 | $ | 200 | ||||||
|
|
|
|
|
| |||||||
Pre-tax income/(loss)income for domestic and foreign operations consisted of the following for the year ended December 31:
| 2009 | 2008 | 2007 | ||||||||||
| Domestic | $ | 390 | $ | (928 | ) | $ | 567 | |||||
| Foreign | 103 | 41 | 88 | |||||||||
| Pre-tax income/(loss) | $ | 493 | $ | (887 | ) | $ | 655 | |||||
F-20
| 2011 | 2010 | 2009 | ||||||||||
Domestic | $ | 425 | $ | 443 | $ | 390 | ||||||
Foreign | 225 | 120 | 103 | |||||||||
|
|
|
|
|
| |||||||
Pre-tax income | $ | 650 | $ | 563 | $ | 493 | ||||||
|
|
|
|
|
| |||||||
| 2009 | 2008 | |||||||
Current deferred income tax assets: | ||||||||
| Accrued liabilities and deferred income | $ | 77 | $ | 133 | ||||
| Provision for doubtful accounts and vacation ownership contract receivables | 139 | 131 | ||||||
| Net operating loss carryforwards | — | 37 | ||||||
| Alternative minimum tax credit carryforward | 96 | — | ||||||
Valuation allowance (*) | (36 | ) | (24 | ) | ||||
| Other | 18 | — | ||||||
| Current deferred income tax assets | 294 | 277 | ||||||
Current deferred income tax liabilities: | ||||||||
| Prepaid expenses | 5 | 7 | ||||||
| Unamortized servicing rights | 4 | 3 | ||||||
| Installment sales of vacation ownership interests | 89 | 92 | ||||||
| Other | 7 | 27 | ||||||
| Current deferred income tax liabilities | 105 | 129 | ||||||
Current net deferred income tax asset | $ | 189 | $ | 148 | ||||
Non-current deferred income tax assets: | ||||||||
| Net operating loss carryforwards | $ | 53 | $ | 56 | ||||
| Foreign tax credit carryforward | 67 | 67 | ||||||
| Alternative minimum tax credit carryforward | 44 | 199 | ||||||
| Tax basis differences in assets of foreign subsidiaries | 79 | 86 | ||||||
| Accrued liabilities and deferred income | 18 | 29 | ||||||
| Other comprehensive income | 32 | 73 | ||||||
| Other | 19 | 37 | ||||||
| Depreciation and amortization | 17 | 10 | ||||||
Valuation allowance (*) | (50 | ) | (61 | ) | ||||
| Non-current deferred income tax assets | 279 | 496 | ||||||
Non-current deferred income tax liabilities: | ||||||||
| Depreciation and amortization | 547 | 509 | ||||||
| Installment sales of vacation ownership interests | 869 | 950 | ||||||
| Other | — | 3 | ||||||
| Non-current deferred income tax liabilities | 1,416 | 1,462 | ||||||
Non-current net deferred income tax liabilities | $ | 1,137 | $ | 966 | ||||
| December 31, 2011 | December 31, 2010 | |||||||
Current deferred income tax assets: | ||||||||
Accrued liabilities and deferred income | $ | 69 | $ | 83 | ||||
Provision for doubtful accounts and loan loss reserves for vacation ownership contract receivables | 193 | 201 | ||||||
Alternative minimum tax credit carryforward | 38 | 32 | ||||||
Valuation allowance(*) | (18 | ) | (20 | ) | ||||
Other | 7 | 2 | ||||||
|
|
|
| |||||
Current deferred income tax assets | 289 | 298 | ||||||
|
|
|
| |||||
Current deferred income tax liabilities: | ||||||||
Installment sales of vacation ownership interests | 83 | 76 | ||||||
Other | 53 | 43 | ||||||
|
|
|
| |||||
Current deferred income tax liabilities | 136 | 119 | ||||||
|
|
|
| |||||
Current net deferred income tax asset | $ | 153 | $ | 179 | ||||
|
|
|
| |||||
Non-current deferred income tax assets: | ||||||||
Net operating loss carryforward | $ | 51 | $ | 52 | ||||
Foreign tax credit carryforward | 73 | 41 | ||||||
Alternative minimum tax credit carryforward | 36 | 71 | ||||||
Tax basis differences in assets of foreign subsidiaries | 63 | 71 | ||||||
Accrued liabilities and deferred income | 31 | 27 | ||||||
Other comprehensive income | 26 | 40 | ||||||
Other | 41 | 7 | ||||||
Valuation allowance(*) | (32 | ) | (34 | ) | ||||
|
|
|
| |||||
Non-current deferred income tax assets | 289 | 275 | ||||||
|
|
|
| |||||
Non-current deferred income tax liabilities: | ||||||||
Depreciation and amortization | 616 | 585 | ||||||
Installment sales of vacation ownership interests | 724 | 703 | ||||||
Other | 14 | 8 | ||||||
|
|
|
| |||||
Non-current deferred income tax liabilities | 1,354 | 1,296 | ||||||
|
|
|
| |||||
Non-current net deferred income tax liabilities | $ | 1,065 | $ | 1,021 | ||||
|
|
|
| |||||
| (*) | Primarily relates to foreign tax credits and net operating loss carryforwards. The valuation allowance will be reduced when and if the Company determines that the deferred income tax assets are more likely than not to be realized. |
As of December 31, 2009,2011, the Company’s net operating loss carryforwards primarily relate to state net operating losses which are due to expire at various dates, but no later than 2029.2031. No provision has been made for U.S. federal deferred income taxes on $276$457 million of accumulated and undistributed earnings of certain foreign subsidiaries as of December 31, 20092011 since it is the present intention of management to reinvest the undistributed earnings indefinitely in those foreign operations. The determination of the amount of unrecognized U.S. federal deferred income tax liability for unremitted earnings is not practicable.
The Company’s effective income tax rate differs from the U.S. federal statutory rate as follows for the year ended December 31:
| 2009 | 2008 | 2007 | ||||||||||
| Federal statutory rate | 35.0 | % | 35.0 | % | 35.0 | % | ||||||
| State and local income taxes, net of federal tax benefits | 1.7 | (1.9 | ) | 2.6 | ||||||||
| Taxes on foreign operations at rates different than U.S. federal statutory rates | (0.9 | ) | 1.6 | (1.9 | ) | |||||||
| Taxes on repatriated foreign income, net of tax credits | 1.9 | (1.2 | ) | 1.1 | ||||||||
| Release of guarantee liability related to income taxes | — | — | 0.7 | |||||||||
| Other | 2.9 | (2.2 | ) | 1.0 | ||||||||
| Goodwill impairment | — | (52.4 | ) | — | ||||||||
| 40.6 | % | (21.1 | )% | 38.5 | % | |||||||
F-21
| 2011 | 2010 | 2009 | ||||
Federal statutory rate | 35.0% | 35.0% | 35.0% | |||
State and local income taxes, net of federal tax benefits | — | 1.4 | 1.9 | |||
Taxes on foreign operations at rates different than U.S. federal statutory rates | (1.2) | (1.4) | (1.3) | |||
Taxes on foreign income, net of tax credits | 0.9 | 1.0 | 1.8 | |||
Foreign tax credits | — | (3.1) | — | |||
Valuation Allowance | (1.0) | (0.2) | (0.3) | |||
IRS examination settlement | — | (1.8) | — | |||
Other | 2.1 | 1.8 | 3.5 | |||
|
|
| ||||
| 35.8% | 32.7% | 40.6% | ||||
|
|
|
The following table summarizes the activity related to the Company’s unrecognized tax benefits:
| Amount | ||||
| Balance as of January 1, 2008 | $ | 28 | ||
| Decreases related to tax positions taken during a prior period | (3 | ) | ||
| Increases related to tax positions taken during the current period | 5 | |||
| Decreases as a result of a lapse of the applicable statue of limitations | (5 | ) | ||
| Balance as of December 31, 2008 | 25 | |||
| Increases related to tax positions taken during a prior period | 1 | |||
| Increases related to tax positions taken during the current period | 2 | |||
| Decreases as a result of a lapse of the applicable statue of limitations | (3 | ) | ||
| Balance as of December 31, 2009 | $ | 25 | ||
| Amount | ||||
Balance as of December 31, 2008 | $ | 25 | ||
Increases related to tax positions taken during a prior period | 1 | |||
Increases related to tax positions taken during the current period | 2 | |||
Decreases as a result of a lapse of the applicable statute of limitations | (3 | ) | ||
|
| |||
Balance as of December 31, 2009 | 25 | |||
Increases related to tax positions taken during a prior period | 2 | |||
Increases related to tax positions taken during the current period | 5 | |||
Decreases as a result of a lapse of the applicable statute of limitations | (9 | ) | ||
Decreases related to tax positions taken during a prior period | (1 | ) | ||
|
| |||
Balance as of December 31, 2010 | 22 | |||
Increases related to tax positions taken during a prior period | 6 | |||
Increases related to tax positions taken during the current period | 3 | |||
Decreases as a result of a lapse of the applicable statute of limitations | (2 | ) | ||
|
| |||
Balance as of December 31, 2011 | $ | 29 | ||
|
| |||
The gross amount of the unrecognized tax benefits at bothas of December 31, 20092011, 2010 and 20082009 that, if recognized, would affect the Company’s effective tax rate was $29 million, $22 million and $25 million.million, respectively. The Company recorded both accrued interest and penalties related to unrecognized tax benefits of $3 million and less than $1 million as a component of provision for income taxes on the Consolidated Statements of OperationsIncome. The Company also accrued potential penalties and interest of $1 million, $1 million and $3 million related to these unrecognized tax benefits during 20092011, 2010 and 2008,2009, respectively. As of December 31, 20092011, 2010 and 2008,2009, the Company had recorded a liability for potential penalties of $3$2 million, $2 million and $2$3 million, respectively, and interest of $3 million, $4 million and $5 million, respectively, as a component of accrued expenses and $3 million, respectively,other current liabilities and other non-current liabilities on the Consolidated Balance Sheets.
The Company files U.S., state and foreign income tax returns in jurisdictions with varying statutes of limitations. The 20062008 through 20092011 tax years generally remain subject to examination by federal tax authorities. The 20052007 through 20092011 tax years generally remain subject to examination by many state tax authorities. In significant foreign jurisdictions, the 20012003 through 20092011 tax years generally remain subject to examination by
their respective tax authorities. The statute of limitations is scheduled to expire within 12 months of the reporting date in certain taxing jurisdictions and the Company believes that it is reasonably possible that the total amount of its unrecognized tax benefits could decrease by $0 to $11$3 million.
The Company made cash income tax payments, net of refunds, of $139 million, $103 million and $113 million $68 millionduring 2011, 2010 and $83 million during 2009, 2008 and 2007, respectively. Such payments exclude income tax related payments made to or refunded by former Parent.
As of December 31, 2009,2011, the Company had $67$73 million of foreign tax credits with a full valuation allowance of $67 million, which arose from the filing of pre-separation income tax returns.$27 million. The foreign tax credits primarily expire in 2015between 2016 and 2017, and the valuation allowance on these credits will be reduced when and if the Company determines that these credits are more likely than not to be realized.
During the third quarter of 2010, the Company reached a settlement agreement, along with Cendant, with the IRS has commenced an auditthat resolves and pays Cendant’s outstanding contingent tax liabilities relating to the examination of the federal income tax returns for Cendant’s taxable years 2003 through 2006, during which the Company was included in Cendant’s tax returns.
F-22
| 8. | |
| Vacation Ownership Contract Receivables |
The Company generates vacation ownership contract receivables by extending financing to the purchasers of VOIs.VOIs (see Note 14 — Transfer and Servicing of Financial Assets for further discussion). Current and long-term vacation ownership contract receivables, net as of December 31, consisted of:
| 2009 | 2008 | |||||||
Current vacation ownership contract receivables: | ||||||||
| Securitized | $ | 244 | $ | 253 | ||||
| Non-securitized | 52 | 49 | ||||||
Secured (*) | 28 | 23 | ||||||
| 324 | 325 | |||||||
| Less: Allowance for loan losses | (35 | ) | (34 | ) | ||||
| Current vacation ownership contract receivables, net | $ | 289 | $ | 291 | ||||
Long-term vacation ownership contract receivables: | ||||||||
| Securitized | $ | 2,347 | $ | 2,495 | ||||
| Non-securitized | 546 | 641 | ||||||
Secured (*) | 234 | 176 | ||||||
| 3,127 | 3,312 | |||||||
| Less: Allowance for loan losses | (335 | ) | (349 | ) | ||||
| Long-term vacation ownership contract receivables, net | $ | 2,792 | $ | 2,963 | ||||
| 2011 | 2010 | |||||||
Current vacation ownership contract receivables: | ||||||||
Securitized | $ | 262 | $ | 266 | ||||
Non-securitized | 76 | 65 | ||||||
|
|
|
| |||||
| 338 | 331 | |||||||
Less: Allowance for loan losses | (41 | ) | (36 | ) | ||||
|
|
|
| |||||
Current vacation ownership contract receivables, net | $ | 297 | $ | 295 | ||||
|
|
|
| |||||
Long-term vacation ownership contract receivables: | ||||||||
Securitized | $ | 2,223 | $ | 2,437 | ||||
Non-securitized | 681 | 576 | ||||||
|
|
|
| |||||
| 2,904 | 3,013 | |||||||
Less: Allowance for loan losses | (353 | ) | (326 | ) | ||||
|
|
|
| |||||
Long-term vacation ownership contract receivables, net | $ | 2,551 | $ | 2,687 | ||||
|
|
|
| |||||
Principal payments that are contractually due on the Company’s vacation ownership contract receivables during the next twelve months are classified as current on the Consolidated Balance Sheets. Principal payments due on the Company’s vacation ownership contract receivables during each of the five years subsequent to December 31, 20092011 and thereafter are as follows:
| Non - | ||||||||||||||||
| Securitized | Securitized | Secured | Total | |||||||||||||
| 2010 | $ | 244 | $ | 52 | $ | 28 | $ | 324 | ||||||||
| 2011 | 260 | 53 | 28 | 341 | ||||||||||||
| 2012 | 282 | 61 | 27 | 370 | ||||||||||||
| 2013 | 307 | 67 | 28 | 402 | ||||||||||||
| 2014 | 322 | 74 | 30 | 426 | ||||||||||||
| Thereafter | 1,176 | 291 | 121 | 1,588 | ||||||||||||
| $ | 2,591 | $ | 598 | $ | 262 | $ | 3,451 | |||||||||
| Securitized | Non - Securitized | Total | ||||||||||
2012 | $ | 262 | $ | 76 | $ | 338 | ||||||
2013 | 288 | 81 | 369 | |||||||||
2014 | 308 | 88 | 396 | |||||||||
2015 | 321 | 90 | 411 | |||||||||
2016 | 321 | 90 | 411 | |||||||||
Thereafter | 985 | 332 | 1,317 | |||||||||
|
|
|
|
|
| |||||||
| $ | 2,485 | $ | 757 | $ | 3,242 | |||||||
|
|
|
|
|
| |||||||
During 20092011, 2010 and 20082009 the Company’s securitized vacation ownership contract receivables generated interest income of $322 million, $336 million and $333 million, respectively.
During 2011, 2010 and $321 million, respectively.
F-23
| Amount | ||||
| Allowance for loan losses as of January 1, 2007 | $ | (278 | ) | |
| Provision for loan losses | (305 | ) | ||
| Contract receivables written-off, net | 263 | |||
| Allowance for loan losses as of December 31, 2007 | (320 | ) | ||
| Provision for loan losses | (450 | ) | ||
| Contract receivables written off, net | 387 | |||
| Allowance for loan losses as of December 31, 2008 | (383 | ) | ||
| Provision for loan losses | (449 | ) | ||
| Contract receivables written-off, net | 462 | |||
| Allowance for Loan Losses as of December 31, 2009 | $ | (370 | ) | |
| Amount | ||||
Allowance for loan losses as of December 31, 2008 | $ | (383 | ) | |
Provision for loan losses | (449 | ) | ||
Contract receivables written off, net | 462 | |||
|
| |||
Allowance for loan losses as of December 31, 2009 | (370 | ) | ||
Provision for loan losses | (340 | ) | ||
Contract receivables written-off, net | 348 | |||
|
| |||
Allowance for loan losses as of December 31, 2010 | (362 | ) | ||
Provision for loan losses | (339 | ) | ||
Contract receivables written off, net | 307 | |||
|
| |||
Allowance for loan losses as of December 31, 2011 | $ | (394 | ) | |
|
| |||
Vacation Ownership ContractCredit Quality for Financed Receivables and Securitizationsthe Allowance for Credit Losses
The basis of the differentiation within the identified class of financed VOI contract receivable is the consumer’s FICO score. A FICO score is a branded version of a consumer credit score widely used within the U.S. by the largest banks and lending institutions. FICO scores range from 300 — 850 and are calculated based on information obtained from one or more of the three major U.S. credit reporting agencies that compile and report on a consumer’s credit history. The Company pools qualifying vacation ownershipupdates its records for all active VOI contract receivables and sells themwith a balance due on a rolling monthly basis so as to bankruptcy-remote entities. Vacation ownership contract receivables qualify for securitization based primarily on the credit strength of theensure that all VOI purchaser to whom financing has been extended. Vacation ownership contract receivables are securitized through bankruptcy-remote special purpose entities (“SPEs”) thatscored at least every six months. The Company groups all VOI contract receivables into five different categories: FICO scores ranging from 700 to 850, 600 to 699, Below 600, No Score (primarily comprised of consumers for whom a score is not readily available, including consumers declining access to FICO scores and non U.S. residents) and Asia
Pacific (comprised of receivables in the Company’s Wyndham Vacation Resort Asia Pacific business for which scores are consolidated withinnot readily available). The following table details an aged analysis of financing receivables using the Consolidated Financial Statements. As a result,most recently updated FICO scores (based on the update policy described above):
| As of December 31, 2011 | ||||||||||||||||||||||||
| 700+ | 600-699 | <600 | No Score | Asia Pacific | Total | |||||||||||||||||||
Current | $ | 1,424 | $ | 985 | $ | 320 | $ | 77 | $ | 290 | $ | 3,096 | ||||||||||||
31 – 60 days | 15 | 23 | 24 | 3 | 3 | 68 | ||||||||||||||||||
61 – 90 days | 8 | 14 | 15 | 1 | 2 | 40 | ||||||||||||||||||
91 – 120 days | 8 | 11 | 17 | 1 | 1 | 38 | ||||||||||||||||||
|
|
|
|
|
|
|
|
|
|
|
| |||||||||||||
Total | $ | 1,455 | $ | 1,033 | $ | 376 | $ | 82 | $ | 296 | $ | 3,242 | ||||||||||||
|
|
|
|
|
|
|
|
|
|
|
| |||||||||||||
| As of December 31, 2010 | ||||||||||||||||||||||||
| 700+ | 600-699 | <600 | No Score | Asia Pacific | Total | |||||||||||||||||||
Current | $ | 1,415 | $ | 990 | $ | 426 | $ | 59 | $ | 297 | $ | 3,187 | ||||||||||||
31 – 60 days | 10 | 23 | 34 | 2 | 4 | 73 | ||||||||||||||||||
61 – 90 days | 7 | 14 | 22 | 1 | 3 | 47 | ||||||||||||||||||
91 – 120 days | 5 | 10 | 19 | 1 | 2 | 37 | ||||||||||||||||||
|
|
|
|
|
|
|
|
|
|
|
| |||||||||||||
Total | $ | 1,437 | $ | 1,037 | $ | 501 | $ | 63 | $ | 306 | $ | 3,344 | ||||||||||||
|
|
|
|
|
|
|
|
|
|
|
| |||||||||||||
The Company does not recognize gains or losses resulting from these securitizations atceases to accrue interest on VOI contract receivables once the time of salecontract has remained delinquent for greater than 90 days. At greater than 120 days, the VOI contract receivable is written off to the SPEs. Income is recognized when earned over the contractual life of the vacation ownership contract receivables.allowance for credit losses. The Company continues to service the securitized vacation ownershipdid not have a material number of modified VOI contract receivables pursuant to servicing agreements negotiated on an arms-length basis based on market conditions. The activitiesas of these SPEs are limited to (i) purchasing vacation ownership contract receivables from the Company’s vacation ownership subsidiaries; (ii) issuing debt securitiesand/or borrowing under a conduit facility to fund such purchases;December 31, 2011 and (iii) entering into derivatives to hedge interest rate exposure. The securitized assets of these bankruptcy-remote SPEs are not available to pay the Company’s general obligations. Additionally, the creditors of these SPEs have no recourse to the Company.
| 9. | |
| Inventory |
Inventory, as of December 31, consisted of:
| 2009 | 2008 | |||||||
| Land held for VOI development | $ | 119 | $ | 141 | ||||
| VOI construction in process | 352 | 417 | ||||||
| Completed inventory and vacation credits (*) | 836 | 761 | ||||||
| Total inventory | 1,307 | 1,319 | ||||||
| Less: Current portion | 354 | 414 | ||||||
| Non-current inventory | $ | 953 | $ | 905 | ||||
| 2011 | 2010 | |||||||
Land held for VOI development | $ | 136 | $ | 131 | ||||
VOI construction in process | 149 | 229 | ||||||
Completed inventory and vacation credits(a)(b) | 825 | 821 | ||||||
|
|
|
| |||||
Total inventory | 1,110 | 1,181 | ||||||
Less: Current portion | 351 | 348 | ||||||
|
|
|
| |||||
Non-current inventory | $ | 759 | $ | 833 | ||||
|
|
|
| |||||
Includes estimated recoveries of |
| (b) | Includes $73 million and $80 million as of December 31, 2011 and 2010, respectively, related to the Company’s vacation exchange and rentals business. |
Inventory that the Company expects to sell within the next twelve months is classified as current on the Company’s Consolidated Balance Sheets.
F-24
| 10. | |
| Property and Equipment, net |
Property and equipment, net, as of December 31, consisted of:
| 2009 | 2008 | |||||||
| Land | $ | 164 | $ | 164 | ||||
| Building and leasehold improvements | 503 | 475 | ||||||
| Capitalized software | 397 | 332 | ||||||
| Furniture, fixtures and equipment | 395 | 367 | ||||||
| Vacation rental property capital leases | 133 | 130 | ||||||
| Construction in progress | 94 | 180 | ||||||
| 1,686 | 1,648 | |||||||
| Less: Accumulated depreciation and amortization | (733 | ) | (610 | ) | ||||
| $ | 953 | $ | 1,038 | |||||
| 2011 | 2010 | |||||||
Land | $ | 162 | $ | 159 | ||||
Building and leasehold improvements | 698 | 572 | ||||||
Capitalized software | 508 | 455 | ||||||
Furniture, fixtures and equipment | 433 | 410 | ||||||
Vacation rental property capital leases | 121 | 124 | ||||||
Construction in progress | 117 | 158 | ||||||
|
|
|
| |||||
| 2,039 | 1,878 | |||||||
Less: Accumulated depreciation and amortization | (922 | ) | (837 | ) | ||||
|
|
|
| |||||
| $ | 1,117 | $ | 1,041 | |||||
|
|
|
| |||||
During 2009, 20082011, 2010 and 2007,2009, the Company recorded depreciation and amortization expense of $150$146 million, $154$145 million and $139$150 million, respectively, related to property and equipment.
| 11. | |
| Other Current Assets |
Other current assets, as of December 31, consisted of:
| 2009 | 2008 | |||||||
| Non-trade receivables, net | $ | 57 | $ | 65 | ||||
| Deferred vacation ownership costs | 27 | 99 | ||||||
| Assets held for sale | 27 | 7 | ||||||
| Securitization restricted cash | 69 | 80 | ||||||
| Escrow deposit restricted cash | 19 | 28 | ||||||
| Other | 34 | 35 | ||||||
| $ | 233 | $ | 314 | |||||
| 2011 | 2010 | |||||||
Securitization restricted cash | $ | 71 | $ | 77 | ||||
Non-trade receivables, net | 69 | 51 | ||||||
Escrow deposit restricted cash | 53 | 42 | ||||||
Deferred vacation ownership costs | 23 | 24 | ||||||
Assets held for sale | 14 | 14 | ||||||
Other | 27 | 37 | ||||||
|
|
|
| |||||
| $ | 257 | $ | 245 | |||||
|
|
|
| |||||
| 12. | |
| Accrued Expenses and Other Current Liabilities |
Accrued expenses and other current liabilities, as of December 31, consisted of:
| 2009 | 2008 | |||||||
| Accrued payroll and related | $ | 188 | $ | 169 | ||||
| Accrued taxes | 63 | 43 | ||||||
| Accrued advertising and marketing | 53 | 57 | ||||||
| Accrued other | 275 | 369 | ||||||
| $ | 579 | $ | 638 | |||||
F-25
| 2011 | 2010 | |||||||
Accrued payroll and related | $ | 237 | $ | 219 | ||||
Accrued taxes | 93 | 74 | ||||||
Accrued interest | 37 | 32 | ||||||
Accrued legal settlements | 35 | 38 | ||||||
Accrued advertising and marketing | 30 | 35 | ||||||
Accrued other | 199 | 221 | ||||||
|
|
|
| |||||
| $ | 631 | $ | 619 | |||||
|
|
|
| |||||
| 13. | |
| Long-Term Debt and Borrowing Arrangements |
The Company’s indebtedness consisted of:
| December 31, | December 31, | |||||||
| 2009 | 2008 | |||||||
Securitized vacation ownership debt:(a) | ||||||||
| Term notes | $ | 1,112 | $ | 1,252 | ||||
Previous bank conduit facility(b) | — | 417 | ||||||
2008 bank conduit facility(c) | 395 | 141 | ||||||
| Total securitized vacation ownership debt | 1,507 | 1,810 | ||||||
| Less: Current portion of securitized vacation ownership debt | 209 | 294 | ||||||
| Long-term securitized vacation ownership debt | $ | 1,298 | $ | 1,516 | ||||
Long-term debt: | ||||||||
6.00% senior unsecured notes (due December 2016)(d) | $ | 797 | $ | 797 | ||||
| Term loan (due July 2011) | 300 | 300 | ||||||
Revolving credit facility (due July 2011)(e) | — | 576 | ||||||
9.875% senior unsecured notes (due May 2014)(f) | 238 | — | ||||||
3.50% convertible notes (due May 2012)(g) | 367 | — | ||||||
Vacation ownership bank borrowings(h) | 153 | 159 | ||||||
| Vacation rentals capital leases | 133 | 139 | ||||||
| Other | 27 | 13 | ||||||
| Total long-term debt | 2,015 | 1,984 | ||||||
| Less: Current portion of long-term debt | 175 | 169 | ||||||
| Long-term debt | $ | 1,840 | $ | 1,815 | ||||
| December 31, 2011 | December 31, 2010 | |||||||
Securitized vacation ownership debt:(a) | ||||||||
Term notes | $ | 1,625 | $ | 1,498 | ||||
Bank conduit facility(b) | 237 | 152 | ||||||
|
|
|
| |||||
Total securitized vacation ownership debt | 1,862 | 1,650 | ||||||
Less: Current portion of securitized vacation ownership debt | 196 | 223 | ||||||
|
|
|
| |||||
Long-term securitized vacation ownership debt | $ | 1,666 | $ | 1,427 | ||||
|
|
|
| |||||
Long-term debt: | ||||||||
Revolving credit facility (due July 2016)(c) | $ | 218 | $ | 154 | ||||
6.00% senior unsecured notes (due December 2016)(d) | 811 | 798 | ||||||
9.875% senior unsecured notes (due May 2014)(e) | 243 | 241 | ||||||
3.50% convertible notes (due May 2012)(f) | 36 | 266 | ||||||
7.375% senior unsecured notes (due March 2020)(g) | 247 | 247 | ||||||
5.75% senior unsecured notes (due February 2018)(h) | 247 | 247 | ||||||
5.625% senior unsecured notes (due March 2021)(i) | 245 | — | ||||||
Vacation rentals capital leases(j) | 102 | 115 | ||||||
Other | 4 | 26 | ||||||
|
|
|
| |||||
Total long-term debt | 2,153 | 2,094 | ||||||
Less: Current portion of long-term debt | 46 | 11 | ||||||
|
|
|
| |||||
Long-term debt | $ | 2,107 | $ | 2,083 | ||||
|
|
|
| |||||
| (a) | Represents non-recourse debt that is securitized through | |
| (b) | ||
Represents a | ||
Total capacity of | ||
Represents senior unsecured notes issued by the Company during December 2006. The balance as of December 31, 2011 represents $800 million aggregate principal less $2 million of unamortized discount, plus $13 million of unamortized gains from the settlement of a derivative. |
| (e) | Represents senior unsecured notes issued by the Company during May 2009. | |
Represents |
| December 31, 2011 | December 31, 2010 | |||||||
Debt principal | $ | 12 | $ | 116 | ||||
Unamortized discount | — | (12 | ) | |||||
|
|
|
| |||||
Debt less discount | 12 | 104 | ||||||
Fair value of bifurcated conversion feature(*) | 24 | 162 | ||||||
|
|
|
| |||||
Convertible notes | $ | 36 | $ | 266 | ||||
|
|
|
| |||||
| ||||||||
| (*) | The Company also has an asset with a fair value equal to the bifurcated conversion feature, which represents cash-settled call options that the Company purchased concurrent with the issuance of the convertible notes (“Bifurcated Conversion Feature”). |
| (g) | Represents senior unsecured notes issued by the Company during February 2010. The balance as of December 31, |
| (h) | Represents senior unsecured notes issued by the |
| (i) | Represents senior unsecured notes issued by the Company during March 2011. The balance as of December 31, 2011 represents $250 million aggregate principal less $5 million of unamortized discount. |
| (j) | Represents capital lease obligations with corresponding assets classified within | |
Covenants
The revolving credit facility and unsecured term loan areis subject to covenants including the maintenance of specific financial ratios. The financial ratio covenants consist of a minimum consolidated interest coverage ratio of at least 3.0 to 1.0 as of the measurement date and a maximum consolidated leverage ratio not to exceed 3.5 to 1.0 on the measurement date. The consolidated interest coverage ratio is calculated by dividing Consolidated EBITDA (as defined in the credit agreement) by Consolidated Interest Expense (as defined in the credit agreement), both(both as measured on a trailing 12 month basis preceding the measurement date. As of December 31, 2009, the Company’s interest coverage ratio was 8.5 times. Consolidated Interest Expense excludes, among other things, interest expense on any Securitization Indebtedness (as defined in the credit agreement). The consolidated leverage ratio is calculated by dividing Consolidated Total Indebtedness (as defined inIn addition, the credit agreement and which excludes, among other things, Securitization Indebtedness) as of the measurement date by Consolidated EBITDA as measured on a trailing 12 month basis preceding the measurement date. As of December 31, 2009, the Company’s leverage ratio was 2.1 times. Covenants in these credit facilities also includefacility includes limitations on indebtedness of material subsidiaries; liens; mergers, consolidations, liquidations and dissolutions; sale of all or substantially all of the Company’s assets; and sale and leaseback transactions. Events of default in these credit facilities include failure to pay interest, principal and fees when due; breach of covenants; acceleration of or failure to pay other debt in excess of $50 million (excluding securitization indebtedness); insolvency matters; and a change of control.
The 6.00% senior unsecured notes and 9.875% senior unsecured notes contain various covenants including limitations on liens, limitations on potential sale and leaseback transactions and change of control restrictions. In addition, there are limitations on mergers, consolidations and potential sale of all or substantially all of the Company’s assets. Events of default in the notes include failure to pay interest and principal when due, breach of a
F-26
Each of the Company’s non-recourse, securitized term notes and the 2008 bank conduit facility containscontain various triggers relating to the performance of the applicable loan pools. If the vacation ownership contract receivables pool that collateralizes one of the Company’s securitization notes fails to perform within the parameters established by the contractual triggers (such as higher default or delinquency rates), there are provisions pursuant to which the cash flows for that pool will be maintained in the securitization as extra collateral for the note holders or applied to amortizeaccelerate the repayment of outstanding principal held byto the noteholders.note holders. As of December 31, 2009,2011, all of the Company’s securitized loan pools were in compliance with applicable contractual triggers.
Maturities and Capacity
The Company’s outstanding debt as of December 31, 20092011 matures as follows:
| Securitized | ||||||||||||
| Vacation | ||||||||||||
| Ownership | ||||||||||||
| Year | Debt | Other | Total | |||||||||
| 2010 | $ | 209 | $ | 175 | $ | 384 | ||||||
| 2011 | 505 | 314 | 819 | |||||||||
| 2012 | 169 | 388 | 557 | |||||||||
| 2013 | 182 | 11 | 193 | |||||||||
| 2014 | 186 | 250 | 436 | |||||||||
| Thereafter | 256 | 877 | 1,133 | |||||||||
| $ | 1,507 | $ | 2,015 | $ | 3,522 | |||||||
| Securitized Vacation Ownership Debt | Long-Term Debt | Total | ||||||||||
2012 | $ | 196 | $ | 46 | (*) | $ | 242 | |||||
2013 | 249 | 11 | 260 | |||||||||
2014 | 368 | 255 | 623 | |||||||||
2015 | 205 | 12 | 217 | |||||||||
2016 | 201 | 1,041 | 1,242 | |||||||||
Thereafter | 643 | 788 | 1,431 | |||||||||
|
|
|
|
|
| |||||||
| $ | 1,862 | $ | 2,153 | $ | 4,015 | |||||||
|
|
|
|
|
| |||||||
| (*) | Includes a liability of $24 million related to the Bifurcated Conversion Feature associated with the Company’s Convertible Notes. |
As debt maturities of the securitized vacation ownership debt are based on the contractual payment terms of the underlying vacation ownership contract receivables, actual maturities may differ as a result of prepayments by the vacation ownership contract receivable obligors.
F-27
| Total | Outstanding | Available | ||||||||||
| Capacity | Borrowings | Capacity | ||||||||||
Securitized vacation ownership debt: | ||||||||||||
| Term notes | $ | 1,112 | $ | 1,112 | $ | — | ||||||
| 2008 bank conduit facility | 600 | 395 | 205 | |||||||||
Total securitized vacation ownership debt(a) | $ | 1,712 | $ | 1,507 | $ | 205 | ||||||
Long-term debt: | ||||||||||||
| 6.00% senior unsecured notes (due December 2016) | $ | 797 | $ | 797 | $ | — | ||||||
| Term loan (due July 2011) | 300 | 300 | — | |||||||||
Revolving credit facility (due July 2011)(b) | 900 | — | 900 | |||||||||
| 9.875% senior unsecured notes (due May 2014) | 238 | 238 | — | |||||||||
| 3.50% convertible notes (due May 2012) | 367 | 367 | — | |||||||||
Vacation ownership bank borrowings(c) | 191 | 153 | 38 | |||||||||
Vacation rentals capital leases(d) | 133 | 133 | — | |||||||||
| Other | 53 | 27 | 26 | |||||||||
| Total long-term debt | $ | 2,979 | $ | 2,015 | 964 | |||||||
Less: Issuance of letters of credit(b) | 31 | |||||||||||
| $ | 933 | |||||||||||
| Securitized bank conduit facility (a) | Revolving credit facility | |||||||
Total capacity | $ | 600 | $ | 1,000 | ||||
Less: Outstanding borrowings | 237 | 218 | ||||||
|
|
|
| |||||
Available capacity | $ | 363 | $ | 782 | (b) | |||
|
|
|
| |||||
The capacity of this facility is subject to the Company’s ability to provide additional assets to collateralize additional securitized borrowings. | ||
| (b) | The capacity under the Company’s revolving credit facility includes availability for letters of credit. As of December 31, | |
Securitized Vacation Ownership Debt
As previously discussed in Note 8—Vacation Ownership Contract Receivables,14 — Transfer and Servicing of Financial Assets, the Company issues debt through the securitization of vacation ownership contract receivables.
2009-A, LLC. On March 13, 2009, the Company closed a term securitization transaction, Special Asset Facility2009-A, LLC, involving the issuance of $46 million of investment grade asset-backed notes which are secured by vacation ownership contract receivables. These borrowings bear interest at a coupon rate of 9.0% and were issued at a price of 95% of par. As of December 31, 2009, the Company has $10 million of outstanding borrowings under these term notes.
Sierra Timeshare 2009-B2011-2 Receivables Funding, LLC.On June 1, 2009,August 31, 2011, the Company closed a series of term securitization transaction,notes payable, Sierra Timeshare 2009-B2011-2 Receivables Funding LLC, in the initial principal amount of $50 million.$300 million at an advance rate of 92%. These borrowings bear interest at a weighted average coupon rate of 9.0%4.01% and are secured by vacation ownership contract receivables. As of December 31, 2009,2011, the Company had $30$234 million of outstanding borrowings under these term notes.
Sierra Timeshare2009-3 2011-3 Receivables Funding, LLC.On September 24, 2009,November 10, 2011, the Company closed a series of term notes payable, Sierra Timeshare2009-3 2011-3 Receivables Funding LLC, in the initial principal amount of $175 million.
$300 million at an advance rate of 94%. These borrowings bear interest at a weighted average coupon rate of 7.62%4.12% and are secured by vacation ownership contract receivables. As of December 31, 2009,2011, the Company had $140$288 million of outstanding borrowings under these term notes.
F-28
The Company’s securitized debt includes fixed and floating rate term notes for which the weighted average interest rate was 8.1%5.8%, 5.8%6.6% and 5.2%8.1% during the years ended December 31, 2011, 2010 and 2009, 2008 and 2007, respectively.
Sierra Timeshare Conduit Receivables Funding II, LLC.On November 10, 2008,June 28, 2011, the Company closed on a364-day, $943 million, non-recourse,renewed its securitized vacation ownership banktimeshare receivables conduit facility withfor a termtwo-year period through November 2009. Such facility was renewed during October 2009 through October 2010 and its capacity was reduced to $600 million. ThisJune 2013. The facility bears interest at variable rates based on commercial paper rates and LIBOR rates plus a spread.spread and has a capacity of $600 million. The previous bank conduit facility ceased operating as a revolving facility as of October 29, 2008 and was repaid on October 8, 2009. The two bank conduit facilities, on a combined basis, had a weighted average interest rate of 9.6%3.6%, 4.1%7.1% and 5.9%9.6% during the years ended December 31, 2011, 2010 and 2009, 2008 and 2007, respectively.
As of December 31, 2009,2011, the Company’s securitized vacation ownership debt of $1,507$1,862 million is collateralized by $2,755$2,638 million of underlying gross vacation ownership contract receivables and related assets. Additional usage of the capacity of the Company’s 2008 bank conduit facility is subject to the Company’s ability to provide additional assets to collateralize such facility. The combined weighted average interest rate on the Company’s total securitized vacation ownership debt was 8.5%5.5%, 5.2%6.7% and 5.4%8.5% during 2011, 2010 and 2009, 2008respectively.
Long-Term Debt
Revolving Credit Facility. On July 15, 2011, the Company replaced its $980 million revolving credit facility with a $1.0 billion five-year revolving credit facility that expires on July 15, 2016. This facility is subject to a fee of 22.5 basis points based on total capacity and 2007, respectively.
Other
9.875% Senior Unsecured Notes.Notes. On May 18, 2009, the Company issued senior unsecured notes, with face value of $250 million and bearing interest at a rate of 9.875%, for net proceeds of $236 million. Interest began accruing on May 18, 2009 and is payable semi-annually in arrears on May 1 and November 1 of each year, commencing on November 1, 2009. The notes will mature on May 1, 2014 and are redeemable at the Company’s option at any time, in whole or in part, at the stated redemption prices plus accrued interest through the redemption date. These notes rank equally in right of payment with all of the Company’s other senior unsecured indebtedness.
3.50% Convertible Notes.Notes. On May 19, 2009, the Company issued convertible notes (“Convertible Notes”) with face value of $230 million and bearing interest at a rate of 3.50%, for net proceeds of $224 million. The Company accounted for the conversion feature as a derivative instrument under the guidance for derivatives and bifurcated such conversion feature from the Convertible Notes for accounting purposes (“Bifurcated Conversion Feature”).purposes. The fair value of the Bifurcated Conversion Feature on the issuance date of the Convertible Notes was recorded as original issue discount for purposes of accounting for the debt component of the Convertible Notes. Therefore, interest expense
greater than the coupon rate of 3.50% will be recognized by the Company primarily resulting from the accretion of the discounted carrying value of the Convertible Notes to their face amount over the term of the Convertible Notes. As such, the effective interest rate over the life of the Convertible Notes is approximately 10.7%. Interest began accruing on May 19, 2009 and is payable semi-annually in arrears on May 1 and November 1 of each year, commencing on November 1, 2009. The Convertible Notes will mature on May 1, 2012. Holders may convert their notes to cash subject to (i) certain conversion provisions determined by the market price of the Company’s common stock; (ii) specified distributions to common shareholders; (iii) a fundamental change (as defined below); and (iv) certain time periods specified in the purchase agreement. The Convertible Notes havehad an initial conversion reference rate of 78.5423 shares of common stock per $1,000 principal amount (equivalent to an initial conversion price of approximately $12.73 per share of the Company’s common stock), subject to adjustment, with the principal
F-29
On May 19, 2009, concurrent with the issuance of the Convertible Notes, the Company entered into convertible note hedge and warrant transactions (“Warrants”) with certain counterparties. The Company paid $42 million to purchase cash-settled call options (“Call Options”) that are expected to reduce the Company’s exposure to potential cash payments required to be made by the Company upon the cash conversion of the Convertible Notes. Concurrent with the purchase of the Call Options, the Company received $11 million of proceeds from the issuance of warrantsWarrants to purchase shares of the Company’s common stock.
If the market price per share of the Company’s common stock at the time of cash conversion of any Convertible Notes is above the strike price of the Call Options (which strike price iswas the same as the equivalent initial conversion price of the Convertible Notes of approximately $12.73 per share of the Company’s common stock), such Call Options will entitle the Company to receive from the counterparties in the aggregate the same amount of cash as it would be required to issue to the holder of the cash converted notes in excess of the principal amount thereof.
Pursuant to the warrant transactions,Warrants, the Company sold to the counterparties warrantsWarrants to purchase in the aggregate up to approximately 18 million shares of the Company’s common stock. The warrants haveWarrants had an exercise price of $20.16 (which representsrepresented a premium of approximately 90% over the Company’s closing price per share on May 13, 2009 of $10.61) and are expected to be net share settled, meaning that the Company will issue a number of shares per warrantWarrant corresponding to the difference between the Company’s share price at each warrantWarrant expiration date and the exercise price of the warrant.Warrant. The warrantsWarrants may not be exercised prior to the maturity of the Convertible Notes.
The purchase of Call Options and the sale of warrantsWarrants are separate contracts entered into by the Company, are not part of the Convertible Notes and do not affect the rights of holders under the Convertible Notes. Holders of the Convertible Notes will not have any rights with respect to the purchased Call Options or the sold warrants. The Call Options meet the definition of derivatives under the guidance for derivatives. As such, the instruments are marked to market each period. In addition, the derivative liability associated with the Bifurcated Conversion Feature is also marked to market each period. As of December 31, 2009, the $367 million Convertible Notes consist of $191 million of debt ($230 million face amount, net of $39 million of unamortized discount) and a derivative liability with a fair value of $176 million related to the Bifurcated Conversion Feature. The Call Options are derivative assets recorded at their fair value of $176 million within other non-current assets in the Consolidated Balance Sheet as of December 31, 2009. The warrantsWarrants meet the definition of derivatives under the guidance; however, because these instruments have been determined to be indexed to the Company’s own stock, their issuance has been recorded in stockholders’ equity in the Company’s Consolidated Balance Sheet and is not subject to the fair value provisions of the guidance.
During 2010, the Company repurchased a portion of its Convertible Notes with a carrying value of $239 million ($101 million for the portion of Convertible Notes, including the unamortized discount, and $138 million for the related Bifurcated Conversion Feature) for $250 million, which resulted in a loss of $11 million during 2010. Such Convertible Notes had a face value of $114 million. Concurrent with the repurchase, the Company settled (i) a portion of the Call Options for proceeds of $136 million, which resulted in an additional loss of $3 million and warrants have(ii) a portion of the Warrants with payments of $98 million. As a result of these transactions, the Company made net payments of $212 million and incurred total losses of $14 million during 2010 and reduced the number of shares related to the Warrants to approximately 9 million as of December 31, 2010.
During 2011, the Company repurchased a portion of its remaining Convertible Notes with carrying value of $251 million primarily resulting from the completion of a cash tender offer ($95 million for the portion of Convertible Notes, including the unamortized discount, and $156 million for the related Bifurcated Conversion Feature) for $262 million. Concurrent with the repurchases, the Company settled (i) a portion of the Call Options for proceeds of $155 million, which resulted in an additional loss of $1 million, and (ii) a portion of the Warrants with payments of $112 million. As a result of these transactions, the Company made net payments of $219 million and incurred total losses of $12 million during 2011 and reduced the number of shares related to the Warrants to approximately 1 million as of December 31, 2011.
The agreements for such transactions contain anti-dilution provisions that canrequire certain adjustments to be made as a result in adjustments to: (i) the conversion rate and conversion price with respect to the Convertible Notes and (ii) the strike price and the number of options and warrants with respect to the Call Options and warrants. The anti-dilution adjustments are required for, among other things, all quarterly cash dividend increases above $0.04 per share that occur prior to the maturity date of the Convertible Notes, Call Options and warrants. These anti-dilution adjustments will mirror each other as they are made to the Convertible Notes, Call Options and warrants.
As of December 31, 2011 and 2010, the $36 million and $266 million Convertible Notes consist of $12 million and $104 million of debt ($12 million and $116 million face amount, net of $0 and $12 million of unamortized discount), respectively, and a derivative liability with a fair value of $24 million and $162 million, respectively, related to the Bifurcated Conversion Feature. The capacityCall Options are derivative assets recorded at their fair value of this facility$24 million within other current assets and $162 million within other non-current assets in the Consolidated Balance Sheets as of December 31, 2011 and 2010, respectively.
7.375% Senior Unsecured Notes. On February 25, 2010, the Company issued senior unsecured notes, with face value of $250 million and bearing interest at a rate of 7.375%, for net proceeds of $247 million. Interest began accruing on February 25, 2010 and is subject to maintaining sufficient assets to collateralize these secured obligations.
5.75% Senior Unsecured Notes. On September 20, 2010, the Company issued senior unsecured notes, with face value of $250 million and bearing interest at a rate of 5.75%, for net proceeds of $247 million. Interest began accruing on September 20, 2010 and is payable semi-annually in arrears on February 1 and August 1 of each year, commencing on February 1, 2011. The notes will mature on February 1, 2018 and are redeemable at the Company’s option at any time, in whole or in part, at the stated redemption prices plus accrued interest through the redemption date. These notes rank equally in right of payment with all of the Company’s other senior unsecured indebtedness.
5.625% Senior Unsecured Notes. On March 1, 2011, the Company issued senior unsecured notes, with face value of $250 million and bearing interest at a rate of 5.625%, for net proceeds of $245 million. Interest began accruing on March 1, 2011 and is payable semi-annually in arrears on March 1 and September 1 of each year, commencing on September 1, 2011. The notes will mature on March 1, 2021 and are redeemable at the Company’s option at any time, in whole or in part, at the stated redemption prices plus accrued interest through the redemption date. These notes rank equally in right of payment with all of the Company’s other senior unsecured indebtedness.
Vacation Rental Capital Leases.The Company leases vacation homes located in European holiday parks as part of its vacation exchange and rentals business. The majority of these leases are recorded as capital lease obligations under generally accepted accounting principles with corresponding assets classified within property, plant and equipment on the Consolidated Balance Sheets. The vacation rentals capital lease obligations had a weighted average interest rate of 4.5% during 2009, 20082011, 2010 and 2007.
Other.Other. The Company also maintains other debt facilities which arise through the ordinary course of operations. This debt primarily reflects mortgagerelates to information technology leases.
Term Loan.During March 2010, the Company fully repaid its five-year $300 million term loan facility with a portion of the proceeds from the 7.375% senior unsecured notes and borrowings under the Company’s revolving credit facility. The weighted average interest rate during 2010 and 2009 was 5.3% and 5.7%, respectively.
Vacation Ownership Bank Borrowings.During March 2010, the Company paid down and terminated its 364-day, secured, revolving foreign credit facility with a portion of the proceeds from the 7.375% senior unsecured notes. The weighted average interest rate was 9.9% and 6.8% during 2010 and 2009, respectively.
Interest Expense
During 2011, 2010 and 2009, the Company recorded $152 million, $167 million and $114 million, respectively, of interest expense as a result of long-term debt borrowings, the early extinguishment of debt and capitalized interest. Such amounts are recorded within interest expense on the Consolidated Statements of Income. Cash paid related to such interest expense was $135 million, $125 million and $99 million during 2011, 2010 and 2009, respectively, excluding cash payments related to early extinguishment of debt costs.
During 2011, 2010 and 2009, the Company incurred interest expense of $150 million, $144 million and $126 million, respectively, primarily in connection with its long-term debt borrowings. As a vacation ownership office building and borrowings used to fund property renovations at oneresult of the Company’s vacation rentals businesses.
F-30
| 14. | Transfer and Servicing of Financial Assets |
The Company pools qualifying vacation ownership contract receivables and 2007, respectively.
| December 31, 2011 | December 31, 2010 | |||||||
Securitized contract receivables, gross(a) | $ | 2,485 | $ | 2,703 | ||||
Securitized restricted cash(b) | 132 | 138 | ||||||
Interest receivables on securitized contract receivables(c) | 20 | 22 | ||||||
Other assets (d) | 1 | 2 | ||||||
|
|
|
| |||||
Total SPE assets(e) | 2,638 | 2,865 | ||||||
|
|
|
| |||||
Securitized term notes(f) | 1,625 | 1,498 | ||||||
Securitized conduit facilities(f) | 237 | 152 | ||||||
Other liabilities(g) | 11 | 22 | ||||||
|
|
|
| |||||
Total SPE liabilities | 1,873 | 1,672 | ||||||
|
|
|
| |||||
SPE assets in excess of SPE liabilities | $ | 765 | $ | 1,193 | ||||
|
|
|
| |||||
| (a) | Included in current ($262 million and $266 million as of December 31, 2011 and 2010, respectively) and non-current ($2,223 million and $2,437 million as of December 31, 2011 and 2010, respectively) vacation ownership contract receivables on the Consolidated Balance Sheets. |
| (b) | Included in other current assets ($71 million and $77 million as of December 31, 2011 and 2010, respectively) and other non-current assets ($61 million and $61 million as of both December 31, 2011 and 2010, respectively) on the Consolidated Balance Sheets. |
| (c) | Included in trade receivables, net on the Consolidated Balance Sheets. |
| (d) | Includes interest rate derivative contracts and related assets; included in other non-current assets on the Consolidated Balance Sheets. |
| (e) | Excludes deferred financing costs of $26 million and $22 million as of December 31, 2011 and 2010, respectively, related to securitized debt. |
| (f) | Included in current ($196 million and $223 million as of December 31, 2011 and 2010, respectively) and long-term ($1,666 million and $1,427 million as of December 31, 2011 and 2010, respectively) securitized vacation ownership debt on the Consolidated Balance Sheets. |
| (g) | Primarily includes interest rate derivative contracts and accrued interest on securitized debt; included in accrued expenses and other current liabilities ($2 million and $3 million as of December 31, 2011 and 2010, respectively) and other non-current liabilities ($9 million and $19 million as of December 31, 2011 and 2010, respectively) on the Consolidated Balance Sheets. |
In addition, the Company has vacation ownership contract receivables that have not been securitized through bankruptcy-remote SPEs. Such gross receivables were $757 million and $23$641 million during 2009, 2008as of December 31, 2011 and 2007,2010, respectively.
| December 31, 2011 | December 31, 2010 | |||||||
SPE assets in excess of SPE liabilities | $ | 765 | $ | 1,193 | ||||
Non-securitized contract receivables | 757 | 641 | ||||||
Allowance for loan losses | (394 | ) | (362 | ) | ||||
|
|
|
| |||||
Total, net | $ | 1,128 | $ | 1,472 | ||||
|
|
|
| |||||
| 15. | |
| Fair Value |
The guidance for fair value measurements requires additional disclosures about the Company’s assets and liabilities that are measured at fair value. The following table presents information about the Company’s financial assets and liabilities that are measured at fair value on a recurring basis as of December 31, 2009, and indicates the fair value hierarchy of the valuation techniques utilized by the Company to determine such fair values. Financial assets and liabilities carried at fair value are classified and disclosed in one of the following three categories:
Level 1: Quoted prices for identical instruments in active markets.
Level 2: Quoted prices for similar instruments in active markets; quoted prices for identical or similar instruments in markets that are not active; and model-derived valuations whose inputs are observable or whose significant value driver is observable.
Level 3: Unobservable inputs used when little or no market data is available.
In certain cases, the inputs used to measure fair value may fall into different levels of the fair value hierarchy. In such cases, the level in the fair value hierarchy within which the fair value measurement falls has been determined based on the lowest level input (closest to Level 3) that is significant to the fair value measurement. The Company’s assessment of the significance of a particular input to the fair value measurement in its entirety requires judgment, and considers factors specific to the asset or liability.
| Fair Value Measure on a | ||||||||||||
| Recurring Basis | ||||||||||||
| Significant | ||||||||||||
| Other | Significant | |||||||||||
| As of | Observable | Unobservable | ||||||||||
| December 31, | Inputs | Inputs | ||||||||||
| 2009 | (Level 2) | (Level 3) | ||||||||||
| Assets: | ||||||||||||
Derivative instruments(a) | $ | 184 | $ | 8 | $ | 176 | ||||||
Securitiesavailable-for-sale(b) | 5 | — | 5 | |||||||||
| Total assets | $ | 189 | $ | 8 | $ | 181 | ||||||
| Liabilities: | ||||||||||||
Derivative instruments(c) | $ | 223 | $ | 47 | $ | 176 | ||||||
The following table summarizes information regarding assets and liabilities that are measured at fair value on a recurring basis as of December 31:
| 2011 | 2010 | |||||||||||||||||||||||
| Fair Value | Level 2 | Level 3 | Fair Value | Level 2 | Level 3 | |||||||||||||||||||
Assets | ||||||||||||||||||||||||
Derivatives:(a) | ||||||||||||||||||||||||
Call Options | $ | 24 | $ | — | $ | 24 | $ | 162 | $ | — | $ | 162 | ||||||||||||
Interest rate contracts | 4 | 4 | — | 7 | 7 | — | ||||||||||||||||||
Foreign exchange contracts | 1 | 1 | — | 4 | 4 | — | ||||||||||||||||||
Securities available-for-sale(b) | 6 | — | 6 | 6 | — | 6 | ||||||||||||||||||
|
|
|
|
|
|
|
|
|
|
|
| |||||||||||||
Total assets | $ | 35 | $ | 5 | $ | 30 | $ | 179 | $ | 11 | $ | 168 | ||||||||||||
|
|
|
|
|
|
|
|
|
|
|
| |||||||||||||
Liabilities | ||||||||||||||||||||||||
Derivatives: | ||||||||||||||||||||||||
Bifurcated Conversion Feature (c) | $ | 24 | $ | — | $ | 24 | $ | 162 | $ | — | $ | 162 | ||||||||||||
Interest rate contracts(d) | 10 | 10 | — | 27 | 27 | �� | — | |||||||||||||||||
Foreign exchange contracts(d) | 3 | 3 | — | 12 | 12 | — | ||||||||||||||||||
|
|
|
|
|
|
|
|
|
|
|
| |||||||||||||
Total liabilities | $ | 37 | $ | 13 | $ | 24 | $ | 201 | $ | 39 | $ | 162 | ||||||||||||
|
|
|
|
|
|
|
|
|
|
|
| |||||||||||||
| (a) | Included in other current assets ($25 million and $5 million as December 31, 2011 and 2010, respectively) and other non-current assets ($4 million and $168 million as of December 31, 2011 and 2010, respectively) on the | |
Included in other non-current assets on the |
| (c) | Included in current portion of long-term debt and long-term debt on the Consolidated Balance Sheets as of December 31, 2011 and 2010, respectively. |
| (d) | Included in accrued expenses and other current liabilities ($4 million and $12 million as December 31, 2011 and 2010, respectively) and other non-current liabilities ($9 million and |
The Company’s derivative instruments primarily consist of the Call Options and Bifurcated Conversion Feature related to the Convertible Notes, pay-fixed/receive-variable interest rate swaps, interest rate caps, foreign exchange forward contracts and foreign exchange average rate forward contracts (see Note 1516 — Financial Instruments for more detail). For assets and liabilities that are measured using quoted prices in active markets, the fair value is the published market price per unit multiplied by the number of units held without consideration of transaction costs. Assets and liabilities that are measured using other significant observable inputs are valued by reference to similar assets and liabilities. For these items, a significant portion of fair value is derived by reference to quoted prices of similar assets and liabilities in active markets. For assets and liabilities that are measured using significant unobservable inputs, fair value is derived using a fair value model, such as a discounted cash flow model.
F-31
| Fair Value Measurements Using | ||||||||||||
| Significant Unobservable Inputs (Level 3) | ||||||||||||
| Derivative | ||||||||||||
| Liability- | ||||||||||||
| Derivative | Bifurcated | Securities | ||||||||||
| Asset-Call | Conversion | Available-For- | ||||||||||
| Options | Feature | Sale | ||||||||||
| Balance at January 1, 2009 | $ | — | $ | — | $ | 5 | ||||||
| Issuance of Convertible Notes | 42 | (42 | ) | — | ||||||||
| Change in fair value | 134 | (134 | ) | — | ||||||||
| Balance as of December 31, 2009 | $ | 176 | $ | (176 | ) | $ | 5 | |||||
| Fair Value Measurements Using Significant Unobservable Inputs (Level 3) | ||||||||||||
| Derivative Asset-Call Options | Derivative Liability Bifurcated Conversion Feature | Securities Available-For- Sale | ||||||||||
Balance as of December 31, 2009 | $ | 176 | $ | (176 | ) | $ | 5 | |||||
Convertible Notes activity(*) | (138 | ) | 138 | — | ||||||||
Change in fair value | 124 | (124 | ) | 1 | ||||||||
|
|
|
|
|
| |||||||
Balance as of December 31, 2010 | 162 | (162 | ) | 6 | ||||||||
Convertible Notes activity(*) | (156 | ) | 156 | — | ||||||||
Change in fair value | 18 | (18 | ) | — | ||||||||
|
|
|
|
|
| |||||||
Balance as of December 31, 2011 | $ | 24 | $ | (24 | ) | $ | 6 | |||||
|
|
|
|
|
| |||||||
| (*) | Represents the change in value related to the Company’s repurchase of a portion of its Bifurcated Conversion Feature and the settlement of a corresponding portion of the Call Options (see Note 13 — Long-Term Debt and Borrowing Arrangements). |
The fair value of financial instruments is generally determined by reference to market values resulting from trading on a national securities exchange or in anover-the-counter market. In cases where quoted market prices are not available, fair value is based on estimates using present value or other valuation techniques, as appropriate. The carrying amounts of cash and cash equivalents, restricted cash, trade receivables, accounts payable and accrued expenses and other current liabilities approximate fair value due to the short-term maturities of these assets and liabilities. The carrying amounts and estimated fair values of all other financial instruments are as follows:
| December 31, 2009 | December 31, 2008 | |||||||||||||||
| Estimated | Estimated | |||||||||||||||
| Carrying | Fair | Carrying | Fair | |||||||||||||
| Amount | Value | Amount | Value | |||||||||||||
Assets | ||||||||||||||||
| Vacation ownership contract receivables, net | $ | 3,081 | $ | 2,809 | $ | 3,254 | $ | 2,666 | ||||||||
Debt | ||||||||||||||||
Total debt (a) | 3,522 | 3,405 | 3,794 | 2,759 | ||||||||||||
Derivatives | ||||||||||||||||
Foreign exchange forwards (b) | ||||||||||||||||
| Assets | 3 | 3 | 10 | 10 | ||||||||||||
| Liabilities | (2 | ) | (2 | ) | (11 | ) | (11 | ) | ||||||||
Interest rate swaps and caps (c) | ||||||||||||||||
| Assets | 5 | 5 | 2 | 2 | ||||||||||||
| Liabilities | (45 | ) | (45 | ) | (76 | ) | (76 | ) | ||||||||
| Convertible Notes related Call Options | ||||||||||||||||
| Assets | 176 | 176 | — | — | ||||||||||||
| December 31, 2011 | December 31, 2010 | |||||||||||||||
| Carrying Amount | Estimated Fair Value | Carrying Amount | Estimated Fair Value | |||||||||||||
Assets | ||||||||||||||||
Vacation ownership contract receivables, net | $ | 2,848 | $ | 3,232 | $ | 2,982 | $ | 2,782 | ||||||||
Debt | ||||||||||||||||
Total debt(a) | 4,015 | 4,205 | 3,744 | 3,871 | ||||||||||||
Derivatives | ||||||||||||||||
Foreign exchange contracts(b) | ||||||||||||||||
Assets | 1 | 1 | 4 | 4 | ||||||||||||
Liabilities | (3 | ) | (3 | ) | (12 | ) | (12 | ) | ||||||||
Interest rate contracts(b) | ||||||||||||||||
Assets | 4 | 4 | 7 | 7 | ||||||||||||
Liabilities | (10 | ) | (10 | ) | (27 | ) | (27 | ) | ||||||||
Call Options | ||||||||||||||||
Assets | 24 | 24 | 162 | 162 | ||||||||||||
As of December 31, |
| (b) | Instruments are in | |
The weighted average interest rate on outstandingCompany estimates the fair value of its vacation ownership contract receivables was 13.0%, 12.7%using a discounted cash flow model which it believes is comparable to the model that an independent third party would use in the current market. The model uses default rates, prepayment rates, coupon rates and 12.5%loan terms for the contract receivables portfolio as key drivers of December 31, 2009, 2008risk and 2007, respectively. The estimatedrelative value that, when applied in combination with pricing parameters, determines the fair value of the vacation ownershipunderlying contract receivables as of December 31, 2009 and 2008 was approximately 91% and 82% respectively, of the carry value. receivables.
The primary reason forCompany estimates the fair value being lower thanof its securitized vacation ownership debt by obtaining indicative bids from investment banks that actively issue and facilitate the secondary market for timeshare securities. The Company estimates the fair value of its other long-term debt using indicative bids from investment banks and determines the fair value of its senior notes using quoted market prices.
In accordance with the guidance for equity method investments, during 2011, an investment in an international joint venture in the Company’s lodging business with a carrying value relatedamount of $13 million was written down due to the volatile credit marketsimpairment of cash flows resulting from the Company’s partner having an indirect relationship with the Libyan government. Such write-downs resulted in a $13 million charge during 2011. Additionally, during 2009, andthis same international joint venture was written down to its fair value which resulted in a $6 million charge. These impairment charges are included within asset impairment on the latter partConsolidated Statements of 2008. Although the outstanding vacation ownership contract receivables had weighted average interest rates of 13.0% and 12.7% as of December 31, 2009 and 2008, respectively, the estimated market rate of return for a portfolio of contract receivables of similar characteristics in market conditions for 2009 and 2008 exceeded 14% and 15%, respectively.
In accordance with the guidance for long-lived assets held for sale, during 2010 and 2009, vacation ownership properties consisting primarily of undeveloped land with an approximate carrying amount of $36 million were written down to $27 million (theirtheir estimated fair value less selling costs).costs. Such write down resulted in an impairment charge of $4 million and $9 million during 2009. In accordance with2010 and 2009, respectively.
| 16. | Financial Instruments |
The designation of a derivative instrument as a hedge and its ability to meet the guidance for equity method investments, during 2009, an investmenthedge accounting criteria determine how the change in a joint venture with a carrying amount of $19 million was written down to its fair value of $13 million. Such write down resultedthe derivative instrument will be reflected in an impairment charge of $6 million during 2009. These impairment chargesthe Consolidated Financial Statements. A derivative qualifies for hedge accounting if, at inception, the derivative is expected to be highly effective in offsetting the underlying hedged cash flows or fair value and the hedge documentation standards are included in goodwill and other impairmentsfulfilled at the time the Company enters into the derivative contract. A hedge is designated as a cash flow hedge based on the Company’s Consolidated Statements of Operations.
F-32
The Company reviews the effectiveness of its hedging instruments on an ongoing basis, recognizes current period hedge ineffectiveness immediately in earnings and discontinues hedge accounting for any hedge that it no longer considers to be highly effective. The Company recognizes changes in fair value for derivatives not designated as hedges or those not qualifying for hedge accounting in current period earnings. Upon termination of cash flow hedges, the Company releases gains and losses from AOCI based on the timing of the underlying cash flows, unless the termination results from the failure of the intended transaction to occur in the expected timeframe. Such untimely transactions require the Company to immediately recognize in earnings gains and losses previously recorded in AOCI.
Changes in interest rates and foreign exchange rates expose the Company to market risk. The Company also uses cash flow hedges as part of its overall strategy to manage its exposure to market risks associated with fluctuations in interest rates and foreign currency exchange rates. As a matter of policy, the Company only enters into transactions that it believes will be highly effective at offsetting the underlying risk, management policies:
The Company uses the following derivative instruments to mitigate its foreign currency exchange rate and interest rate risks:
Foreign Currency Risk
The Company uses freestanding foreign currency forward contracts and foreign currency forward contracts designated as cash flow hedges to manage its exposure to changes in foreign currency exchange rates associated with its foreign currency denominated receivables, forecasted earnings of foreign subsidiaries and forecasted foreign currency denominated vendor costs. The Company primarily hedges its foreign currency exposure to the British pound and Euro. The forward contracts utilized by the Company do not qualify for hedge accounting treatment under the guidance for hedging. The fluctuations in the value of these forward contracts do, however, largely offset the impact of changes in the value of the underlying risk that they are intended to hedge. The impact of these forward contracts was not material to the Company’s results of operations, financial position or cash flows during 2009, 2008 and 2007. The pre-tax amount of gains or losses reclassified from other comprehensive income to earnings resulting from ineffectiveness or from excluding a component of the forward contracts’ gain or loss from the effectiveness calculation for cash flow hedges 2009, 2008 and 2007 was not material.payments. The amount of gains or losses that the Company expects to reclassify from other comprehensive incomeAOCI to earnings overduring the next 12 months is not material.
Interest Rate Risk
A portion of the debt used to finance much of the Company’s operations is also exposed to interest rate fluctuations. The Company uses various hedging strategies and derivative financial instruments to create a desired mix of fixed and floating rate assets and liabilities. Derivative instruments currently used in these hedging strategies include swaps and interest rate caps.
In connection with its qualifying cash flow hedges,the early extinguishment of the term loan facility during 2010 (see Note 13 — Long-Term Debt and Borrowing Arrangements), the Company recordedeffectively terminated a net pre-tax gainrelated interest rate swap agreement, which resulted in the reclassification of $28a $14 million during 2009 and a net pre-taxunrealized loss of $38 million and $22 million during 2008 and 2007, respectively,from AOCI to other comprehensive income. The pre-tax amount of gains or losses reclassified from other comprehensive income to consumer financing interest or interest expense resulting from ineffectiveness or from excluding a componenton the Consolidated Statement of Income for the derivatives’ gain or loss from the effectiveness calculation for cash flow hedges was insignificant during 2009, 2008 and 2007.year ended December 31, 2010. The amount of losses that the Company expects to reclassify from other comprehensive incomeAOCI to earnings during the next 12 months is not material. The freestanding derivatives had an immaterial impact on the Company’s results of operations, financial position and cash flows during 2009, 2008 and 2007, respectively.
The following table summarizes information regarding the gain/(loss) amounts recognized in AOCI for the years ended December 31:
| 2011 | 2010 | 2009 | ||||||||||
Designated as hedging instruments | ||||||||||||
Interest rate contracts | $ | 10 | $ | 5 | $ | 27 | ||||||
Foreign exchange contracts | (1 | ) | — | — | ||||||||
|
|
|
|
|
| |||||||
Total | $ | 9 | $ | 5 | $ | 27 | ||||||
|
|
|
|
|
| |||||||
The following table summarizes information regarding the gain/(loss) recognized in income on the Company’s freestanding derivatives for the years ended December 31:
| 2011 | 2010 | 2009 | ||||||||||
Non-designated hedging instruments | ||||||||||||
Foreign exchange contracts(a) | $ | (16 | ) | $ | (19 | ) | $ | 7 | ||||
Interest rate contracts | 5 | (b) | 14 | (b) | 7 | (c) | ||||||
Call Options | 18 | 124 | 134 | |||||||||
Bifurcated Conversion Feature | (18 | ) | (124 | ) | (134 | ) | ||||||
|
|
|
|
|
| |||||||
Total | $ | (11 | ) | $ | (5 | ) | $ | 14 | ||||
|
|
|
|
|
| |||||||
| (a) | Included within operating expenses on the Consolidated Statements of Income. |
| (b) | Included within consumer financing interest and interest expense on the Consolidated Statements of Income. |
| (c) | Included within consumer financing interest expense on the Consolidated Statements of Income. |
The following table summarizes information regarding the fair value of the Company’s derivative instruments as of December 31, 2009:
| Assets | Liabilities | |||||||||||
| Balance Sheet Location | Fair Value | Balance Sheet Location | Fair Value | |||||||||
Derivatives designated as hedging instruments | ||||||||||||
| Interest rate contracts | Other non-current liabilities | $ | 39 | |||||||||
Derivatives not designated as hedging instruments | ||||||||||||
| Interest rate contracts | Other non-current assets | $ | 5 | Other non-current liabilities | $ | 6 | ||||||
| Foreign exchange contracts | Other current assets | 3 | Accrued exp. & other current liabs. | 2 | ||||||||
Convertible Notes related Call Options (*) | Other non-current assets | 176 | — | |||||||||
Bifurcated Conversion Feature (*) | — | Long-term debt | 176 | |||||||||
Total derivatives not designated as hedging instruments | $ | 184 | $ | 184 | ||||||||
Balance Sheet Location | 2011 | 2010 | ||||||||
Designated hedging instruments | ||||||||||
Liabilities | ||||||||||
Interest rate contracts | Other non-current liabilities | $ | 9 | $ | 18 | |||||
Foreign exchange contracts | Accrued expenses and other current liabilities | 1 | — | |||||||
|
|
|
| |||||||
Total | $ | 10 | $ | 18 | ||||||
|
|
|
| |||||||
Non-designated hedging instruments | ||||||||||
Assets | ||||||||||
Interest rate contracts | Other non-current assets | $ | 4 | $ | 7 | |||||
Foreign exchange contracts | Other current assets | 1 | 4 | |||||||
Call Options(*) | Other current assets | 24 | — | |||||||
| Other non-current assets | — | 162 | ||||||||
|
|
|
| |||||||
Total | $ | 29 | $ | 173 | ||||||
|
|
|
| |||||||
Liabilities | ||||||||||
Interest rate contracts | Other non-current liabilities | $ | 1 | $ | 9 | |||||
Foreign exchange contracts | Accrued expenses and other current liabilities | 2 | 12 | |||||||
Bifurcated Conversion Feature(*) | Current portion of long-term debt | 24 | — | |||||||
| Long-term debt | — | 162 | ||||||||
|
|
|
| |||||||
Total | $ | 27 | $ | 183 | ||||||
|
|
|
| |||||||
| (*) | See Note 13 — Long-Term Debt and Borrowing Arrangements for further detail. |
F-33
| Assets | Liabilities | |||||||||||
| Balance Sheet Location | Fair Value | Balance Sheet Location | Fair Value | |||||||||
Derivatives designated as hedging instruments | ||||||||||||
| Interest rate contracts | Other non-current liabilities | $ | 66 | |||||||||
Derivatives not designated as hedging instruments | ||||||||||||
| Interest rate contracts | Other non-current assets | $ | 2 | Other non-current liabilities | $ | 10 | ||||||
| Foreign exchange contracts | Other current assets | 10 | Accrued exp. & other current liabs. | 11 | ||||||||
Total derivatives not designated as hedging instruments | $ | 12 | $ | 21 | ||||||||
The Company is exposed to counterparty credit risk in the event of nonperformance by counterparties to various agreements and sales transactions. The Company manages such risk by evaluating the financial position and creditworthiness of such counterparties and by requiring collateral in instances in which financing is provided. The Company mitigates counterparty credit risk associated with its derivative contracts by monitoring the amounts at risk with each counterparty to such contracts, periodically evaluating counterparty creditworthiness and financial position, and where possible, dispersing its risk among multiple counterparties.
As of December 31, 2009,2011, there were no significant concentrations of credit risk with any individual counterparty or groups of counterparties. However, approximately 19%18% of the Company’s outstanding vacation ownership contract receivables portfolio relates to customers who reside in California. With the exception of the financing provided to customers of its vacation ownership businesses, the Company does not normally require collateral or other security to support credit sales.
Market Risk
The Company is subject to risks relating to the geographic concentrations of (i) areas in which the Company is currently developing and selling vacation ownership properties, (ii) sales offices in certain vacation areas and (iii) customers of the Company’s vacation ownership business; which in each case, may result in the Company’s results of operations being more sensitive to local and regional economic conditions and other factors, including competition, natural disasters and economic downturns, than the Company’s results of operations would be, absent such geographic concentrations. Local and regional economic conditions and other factors may differ materially from prevailing conditions in other parts of the world. Florida and Nevada are examples of areas with
concentrations of sales offices. For the twelve monthsyear ended December 31, 2009,2011, approximately 16%14%, 13% and 12%10% of the Company’s VOI sales revenues were generated in sales offices located in Florida, Nevada and Nevada,California, respectively.
Included within the Consolidated Statements of OperationsIncome is approximately 11%, 10% and 11% of net revenues generated from transactions in the state of Florida in each of 2011, 2010 and 2009, 2008 and 2007 and approximately 8%, 10% and 10% of net revenues generated from transactions in the state of California in each of 2009, 2008 and 2007, respectively.
F-34
| 17. | |
| Commitments and Contingencies |
COMMITMENTS
Commitments
The Company is committed to making rental payments under noncancelable operating leases covering various facilities and equipment. Future minimum lease payments required under noncancelable operating leases as of December 31, 20092011 are as follows:
| Noncancelable | ||||
| Operating | ||||
| Year | Leases | |||
| 2010 | $ | 67 | ||
| 2011 | 59 | |||
| 2012 | 45 | |||
| 2013 | 33 | |||
| 2014 | 25 | |||
| Thereafter | 105 | |||
| $ | 334 | |||
| Noncancelable Operating Leases | ||||
2012 | $ | 83 | ||
2013 | 57 | |||
2014 | 46 | |||
2015 | 45 | |||
2016 | 41 | |||
Thereafter | 294 | |||
|
| |||
| $ | 566 | |||
|
| |||
During 2009, 20082011, 2010 and 2007,2009, the Company incurred total rental expense of $76 million, $79 million and $77 million, $93 million and $79 million, respectively.
Purchase Commitments
In the normal course of business, the Company makes various commitments to purchase goods or services from specific suppliers, including those related to vacation ownership resort development and other capital expenditures. Purchase commitments made by the Company as of December 31, 20092011 aggregated $519$435 million. Individually, such commitments range as high as $97 million related to the development of a vacation ownership resort. The majorityApproximately $316 million of the commitments relate to the development of vacation ownership properties (aggregating $308 million; $104 million of which relates to 2010 and $69 million of which relates to 2011).
Letters of Credit
As of December 31, 20092011 and December 31, 2008,2010, the Company had $31$11 million and $33$28 million, respectively, of irrevocable letters of credit outstanding, which mainly support development activity at the Company’s vacation ownership business.
Surety Bonds
Some of the Company’s vacation ownership developments are supported by surety bonds provided by affiliates of certain insurance companies in order to meet regulatory requirements of certain states. In the ordinary course of the Company’s business, it has assembled commitments from thirteentwelve surety providers in the amount of $1.3$1.2 billion, of which the Company had $526$296 million outstanding as of December 31, 2009.2011. The
availability, terms and conditions, and pricing of such bonding capacity is dependent on, among other things, continued financial strength and stability of the insurance company affiliates providing such bonding capacity, the general availability of such capacity and the Company’s corporate credit rating. If such bonding capacity is unavailable or, alternatively, the terms and conditions and pricing of such bonding capacity may be unacceptable to the Company, the cost of development of the Company’s vacation ownership units could be negatively impacted.
LitigationLITIGATION
The Company is involved in claims, legal and regulatory proceedings and governmental inquiries related to the Company’s business. See Part I, Item 3, “Legal Proceedings” for a description of
Wyndham Worldwide Litigation
The Company is involved in claims, legal and legal actionsregulatory proceedings and governmental inquiries arising in the ordinary course of its business including but not limited to: for its lodging business — breach of contract, fraud and bad faith claims between franchisors and franchisees in connection with franchise agreements and with owners in connection with management contracts, negligence, breach of contract, fraud, consumer protection and other statutory claims asserted in connection with alleged acts or occurrences at franchised or managed properties; for its vacation exchange and rentals business — breach of contract, fraud and bad faith claims by affiliates and customers in connection with their respective agreements, negligence, breach of contract, fraud, consumer protection and other statutory claims asserted by members and guests for alleged injuries sustained at affiliated resorts and vacation rental properties; for its vacation ownership business — breach of contract, bad faith, conflict of interest, fraud, consumer protection and other statutory claims by property owners’ associations, owners and prospective owners in connection with the sale or use of VOIs or land, or the management of vacation ownership resorts, construction defect claims relating to vacation ownership units or resorts and negligence, breach of contract, fraud, consumer protection and other statutory claims by guests for alleged injuries sustained at vacation ownership units or resorts; and for each of its businesses, bankruptcy proceedings involving efforts to collect receivables from a debtor in bankruptcy, employment matters involving claims of discrimination, harassment and wage and hour claims, claims of infringement upon third parties’ intellectual property rights, claims relating to information security and data privacy, tax claims and environmental claims.
The Company records an accrual for legal contingencies when it determines, after consultation with outside counsel, that it is probable that a liability has been incurred and the amount of the loss can be reasonably estimated. In making such determinations, the Company evaluates, among other things, the degree of probability of an unfavorable outcome and, when it is probable that a liability has been incurred, the Company’s business. See also Note 22 — Separation Adjustmentsability to make a reasonable estimate of the loss. The Company reviews these accruals each reporting period and Transactionsmakes revisions based on changes in facts and circumstances including changes to its strategy in dealing with Former Parent and Subsidiaries regarding contingent litigation liabilities resulting from the Company’s separation from its former Parent (“Separation”).
The Company believes that it has adequately accrued for such matters with reserves of $25$35 million as of December 31, 2009.2011. Such amount is exclusive of matters relating to the Company’s Separation. For matters not requiring accrual, the Company believes that such matters will not have a material adverse effect on its results of operations, financial position or cash flows based on information currently available. However, litigation is inherently unpredictable and, although the Company believes that its accruals are adequateand/or that it has valid defenses in these matters, unfavorable resolutionsresults could occur. As such, an adverse outcome from such unresolved proceedings
F-35
Guarantees/Indemnifications
Under the Separation Agreement, the Company agreed to be responsible for 37.5% of certain of Cendant’s contingent and other corporate liabilities and associated costs, including certain contingent litigation. Since the Separation, Cendant settled the majority of the lawsuits pending on the date of the Separation. See also Note 23 — Separation Adjustments and Transactions with Former Parent and Subsidiaries regarding contingent litigation liabilities resulting from the Separation.
GUARANTEES/INDEMNIFICATIONS
Standard Guarantees/Indemnifications
In the ordinary course of business, the Company enters into agreements that contain standard guarantees and indemnities whereby the Company indemnifies another party for specified breaches of or third-party claims relating to an underlying agreement. Such underlying agreements are typically entered into by one of the Company’s subsidiaries. The various underlying agreements generally govern purchases, sales or outsourcing of assetsproducts or businesses,services, leases of real estate, licensing of trademarks,software and/or development of vacation ownership properties, access to credit facilities, derivatives and issuances of debt securities. While a majority of these guarantees and indemnifications extend only for the duration of the underlying agreement, some survive the expiration of the agreement. The Company is not able to estimate the maximum potential amount of future payments to be made under these guarantees and indemnifications as the triggering events are not predictable. In certain cases, the Company maintains insurance coverage that may mitigate any potential payments.
Other Guarantees/Indemnifications
In the ordinary course of business, the Company’s vacation ownership business provides guarantees to certain owners’ associations for funds required to operate and maintain vacation ownership properties in excess of assessments collected from owners of the VOIs. The Company may be required to fund such excess as a result of unsold Company-owned VOIs or failure by owners to pay such assessments. In addition, from time to time, the Company will agree to reimburse certain owner associations up to 75% of their uncollected assessments. These guarantees extend for the duration of the underlying subsidy or similar agreement (which generally approximate one year and are renewable at the discretion of the Company on an annual basis) or until a stipulated percentage (typically 80% or higher) of related VOIs are sold. The maximum potential future payments that the Company could be required to make under these guarantees was approximately $360$372 million as of December 31, 2009.2011. The Company would only be required to pay this maximum amount if none of the owners assessed paid their assessments. Any assessments collected from the owners of the VOIs would reduce the maximum potential amount of future payments to be made by the Company. Additionally, should the Company be required to fund the deficit through the payment of any owners’ assessments under these guarantees, the Company would be permitted access to the property for its own use and may use that property to engage in revenue-producing activities, such as rentals. During 2009, 20082011, 2010 and 2007,2009, the Company made payments related to these guarantees of $10$17 million, $7$12 million and $5$10 million, respectively. As of December 31, 20092011 and 2008,2010, the Company maintained a liability in connection with these guarantees of $22$24 million and $37$17 million, respectively, on its Consolidated Balance Sheets.
From time to time, the Company may enter into a hotel management agreement that provides the hotel owner with a minimum return. Under such agreement, the Company would be required to compensate for any shortfall over the life of the management agreement up to a specified aggregate amount. The Company’s exposure under these guarantees is partially mitigated by the Company’s ability to terminate any such management agreement if certain targeted operating results are not met. Additionally, the Company is able to recapture a portion or all of the shortfall payments and any waived fees in the event that future operating results exceed targets. As of December 31, 2009,2011, the maximum potential amount of future payments to be made under these guarantees is $16 million with an annual cap of $3 million or less. As of both December 31, 20092011 and 2008,2010, the Company maintained a liability in connection with these guarantees of less than $1 million on its Consolidated Balance Sheets.
As part of the Wyndham Asset Affiliation Model, the Company may guarantee to reimburse the developer a certain payment or to purchase from the developer, inventory associated with the developer’s resort property for a percentage of the original sale price if certain future conditions exist. The maximum potential future payments that the Company could be required to make under these guarantees was approximately $31 million as of December 31, 2011. As of both December 31, 2011 and 2010, the Company had no recognized liabilities in connection with these guarantees.
See Note 2223 — Separation Adjustments and Transactions with Former Parent and Subsidiaries for contingent liabilities related to the Company’s Separation.
F-36
| 18. | |
| Accumulated Other Comprehensive Income |
AOCI is comprised of the following components (net of accumulated other comprehensive income aretax) as follows:
| Unrealized | Accumulated | |||||||||||||||
| Currency | Gains/(Losses) | Pension | Other | |||||||||||||
| Translation | on Cash Flow | Liability | Comprehensive | |||||||||||||
| Adjustments | Hedges, Net | Adjustment | Income | |||||||||||||
| Balance, January 1, 2007, net of tax of $43 | $ | 191 | $ | (7 | ) | $ | — | $ | 184 | |||||||
| Period change | 26 | (19 | ) | 3 | 10 | |||||||||||
| Balance, December 31, 2007, net of tax of $47 | 217 | (26 | ) | 3 | 194 | |||||||||||
| Period change | (76 | ) | (19 | ) | (1 | ) | (96 | ) | ||||||||
| Balance, December 31, 2008, net of tax benefit of $72 | 141 | (45 | ) | 2 | 98 | |||||||||||
| Current period change | 25 | 18 | (3 | ) | 40 | |||||||||||
| Balance, December 31, 2009, net of tax benefit of $32 | $ | 166 | $ | (27 | ) | $ | (1 | ) | $ | 138 | ||||||
| 2011 | 2010 | |||||||
Foreign currency translation adjustments | $ | 141 | $ | 171 | ||||
Unrealized losses on cash flow hedges | (10 | ) | (15 | ) | ||||
Defined benefit pension plans | (3 | ) | (1 | ) | ||||
|
|
|
| |||||
Total AOCI(*) | $ | 128 | $ | 155 | ||||
|
|
|
| |||||
| (*) | Includes $40 million of tax benefit for both 2011 and 2010. |
Foreign currency translation adjustments exclude income taxes related to investments in foreign subsidiaries where the Company intends to reinvest the undistributed earnings indefinitely in those foreign operations.
| 19. | |
| Stock-Based Compensation |
The Company has a stock-based compensation plan available to grant non-qualified stock options, incentive stock options, SSARs, restricted stock, RSUs, PSUs and other stock or cash-based awards to key employees, non-employee directors, advisors and consultants. Under the Wyndham Worldwide Corporation 2006 Equity and Incentive Plan, which was amended and restated as a result of shareholders’ approval at the May 12, 2009 annual meeting of shareholders and further amended as a result of shareholders’ approval at the May 13, 2010 annual meeting of shareholders, a maximum of 36.7 million shares of common stock may be awarded. As of December 31, 2009, 13.22011, 15.1 million shares remained available.
Incentive Equity Awards Granted by the Company
The activity related to incentive equity awards granted by the Company for the year ended December 31, 20092011 consisted of the following:
| RSUs | SSARs | |||||||||||||||
| Weighted | Weighted | |||||||||||||||
| Number | Average | Number | Average | |||||||||||||
| of RSUs | Grant Price | of SSARs | Exercise Price | |||||||||||||
| Balance at January 1, 2009 | 4.1 | $ | 25.34 | 1.7 | $ | 27.40 | ||||||||||
| Granted | 6.6 | (b) | 4.15 | 0.5 | (b) | 3.69 | ||||||||||
| Vested/exercised | (1.2 | ) | 25.24 | — | — | |||||||||||
| Canceled | (1.2 | ) | 17.15 | (0.1 | ) | 30.27 | ||||||||||
Balance as of December 31, 2009 (a) | 8.3 | (c) | 9.60 | 2.1 | (d) | 21.70 | ||||||||||
| RSUs | SSARs | |||||||||||||||
| Number of RSUs | Weighted Average Grant Price | Number of SSARs | Weighted Average Exercise Price | |||||||||||||
Balance as of December 31, 2010 | 6.9 | $ | 12.35 | 2.2 | $ | 21.28 | ||||||||||
Granted | 1.5 | (b) | 30.66 | 0.1 | (b) | 30.61 | ||||||||||
Vested/exercised | (2.9 | )(c) | 11.61 | (0.1 | ) | 29.49 | ||||||||||
Canceled | (0.5 | ) | 14.95 | — | — | |||||||||||
|
|
|
| |||||||||||||
Balance as of December 31, 2011(a) | 5.0 | (d) | 18.02 | 2.2 | (e) | 21.28 | ||||||||||
|
|
|
| |||||||||||||
| (a) | Aggregate unrecognized compensation expense related to SSARs and RSUs was |
| (b) | Primarily represents awards granted by the Company on February |
| (c) | The intrinsic value of RSUs vested during 2011, 2010 and 2009 was $92 million, $73 million and $12 million, respectively. |
| (d) | Approximately |
Approximately |
During 2011, 2010 and 2009, the Company approved its annual grant ofissued incentive equity awards totaling $24$47 million, $45 million and $27 million, respectively, to the Company’s key employees and senior officers in the form of RSUs and SSARs. SuchThe 2011 and 2010 awards will vest ratably over a period of threefour years. On May 12, 2009, July 23, 2009, September 8, 2009 and November 2, 2009, the Company approved grants of incentive equity awards totaling $3 million to the Company’s newly hired key employees and senior officers in the form of RSUs. A portion of suchthe 2009 awards will vest over a period of three years and the remaining portion will vest ratably over a period of four years.
The fair value of SSARs granted by the Company on February 27,during 2011, 2010 and 2009 was estimated on the date of grant using the Black-Scholes option-pricing model with the weighted average assumptions outlined in the table below. Expected volatility is based on both historical and implied volatilities of (i) the Company’s stock and (ii) the stock of comparable companies over the estimated expected life of the SSARs. The expected life represents the period of time the SSARs are expected to be outstanding and is based on the “simplified method,” as defined in Staff Accounting Bulletin 110. The risk free interest rate is based on yields on U.S. Treasury strips with a maturity similar to the estimated expected life of the SSARs. The projected dividend yield was based on the Company’s anticipated annual dividend divided by the twelve-month target price of the Company’s stock on the date of the grant.
F-37
| SSARs Issued on | ||||||||||||
| 2/24/2011 | 2/24/2010 | 2/27/2009 | ||||||||||
Grant date fair value | $ | 11.22 | $ | 8.66 | $ | 2.02 | ||||||
Grant date strike price | $ | 30.61 | $ | 24.84 | $ | 3.69 | ||||||
Expected volatility | 50.83% | 53.0% | 81.0% | |||||||||
Expected life | 4.25 yrs. | 4.25 yrs. | 4.00 yrs. | |||||||||
Risk free interest rate | 1.85% | 2.07% | 1.95% | |||||||||
Projected dividend yield | 1.96% | 2.10% | 1.60% | |||||||||
| SSARs Issued on | ||||
| February 27, | ||||
| 2009 | ||||
| Grant date fair value | $ | 2.02 | ||
| Grant date strike price | $ | 3.69 | ||
| Expected volatility | 81.0% | |||
| Expected life | 4.00 yrs. | |||
| Risk free interest rate | 1.95% | |||
| Projected dividend yield | 1.60% | |||
The Company recorded stock-based compensation expense of $42 million, $39 million and $37 million $35 millionduring 2011, 2010 and $26 million during 2009 2008 and 2007 respectively, related to the incentive equity awards granted by the Company. The Company recognized $10$16 million, of a net tax benefit during 2009 and $14$15 million and $10 million of a tax benefit during 20082011, 2010 and 2007,2009, respectively, for stock-based compensation arrangements on the Consolidated Statements of Operations. As of January 1, 2009, the Company had a $4 million APIC Pool balance. During March 2009, the Company utilized its APIC Pool related to the vesting of RSUs, which reduced the balance to $0.Income. During May 2009, the Company recorded a $4 million charge to its provision for income taxes related to additional vesting of RSUs.
The Company withheld $31 million, $24 million and $1 million of taxes for the net share settlement of incentive equity awards during 2011, 2010 and 2009, respectively. Such amounts are included in other, net within financing activities on the Consolidated Statements of Cash Flows.
Incentive Equity Awards Conversion
Prior to August 1, 2006, all employee stock awards (stock options and RSUs) were granted by Cendant. At the time of Separation, a portion of Cendant’s outstanding equity awards were converted into equity awards of
the Company at a ratio of one share of the Company’s common stock for every five shares of Cendant’s common stock. As a result, the Company issued approximately 2 million RSUs and approximately 24 million stock options upon completion of the conversion of existing Cendant equity awards into Wyndham equity awards. On August 1, 2006, all 2 million converted RSUs vested and, as such, there are no converted RSUs outstanding as of such date. As of December 31, 2009,2011, there were 7.41.7 million converted stock options and no converted RSUs outstanding.
The activity related to the converted stock options for the year ended December 31, 20092011 consisted of the following:
| Weighted | ||||||||
| Number | Average | |||||||
| of Options | Exercise Price | |||||||
| Balance at January 1, 2009 | 11.2 | $ | 35.08 | |||||
Exercised (a) | — | — | ||||||
| Canceled | (3.8 | ) | 37.44 | |||||
Balance as of December 31, 2009 (b) | 7.4 | 33.90 | ||||||
| Number of Options | Weighted Average Exercise Price | |||||||
Balance as of December 31, 2010 | 2.6 | $ | 36.75 | |||||
Exercised(a) | (0.4 | ) | 27.66 | |||||
Canceled | (0.5 | ) | 36.16 | |||||
|
| |||||||
Balance as of December 31, 2011(b) | 1.7 | 38.92 | ||||||
|
| |||||||
| (a) | Stock options exercised during |
| (b) | As of December 31, |
The following table summarizes information regarding the outstanding and exercisable converted stock options as of December 31, 2009:
| Weighted | ||||||||
| Number | Average | |||||||
Range of Exercise Prices | of Options | Exercise Price | ||||||
| $10.00 – $19.99 | 2.3 | $ | 19.77 | |||||
| $20.00 – $29.99 | 0.7 | 27.62 | ||||||
| $30.00 – $39.99 | 0.8 | 37.46 | ||||||
| $40.00 & above | 3.6 | 43.50 | ||||||
| Total Options | 7.4 | 33.90 | ||||||
| Number of Options | Weighted Average Exercise Price | |||||||
$20.00 – $29.99 | 0.1 | $ | 27.25 | |||||
$30.00 – $39.99 | 0.4 | 39.06 | ||||||
$40.00 & above | 1.2 | 40.14 | ||||||
|
| |||||||
Total Options | 1.7 | 38.92 | ||||||
|
| |||||||
| 20. | |
| Employee Benefit Plans |
Defined Contribution Benefit Plans
Wyndham sponsors a domestic defined contribution savings plan and a domestic deferred compensation plan that provide certain eligible employees of the Company an opportunity to accumulate funds for retirement. The Company matches the contributions of participating employees on the basis specified by each plan. The Company’s cost for these plans was $24 million, $21 million and $19 million $25 millionduring 2011, 2010 and $23 million during 2009, 2008 and 2007, respectively.
F-38
Defined Benefit Pension Plans
The Company sponsors defined benefit pension plans for certain foreign subsidiaries. Under these plans, benefits are based on an employee’s years of credited service and a percentage of final average compensation or as otherwise described by the plan. As of December 31, 20092011 and 2008,2010, the Company’s net pension liability of $10$13 million and $7$11 million, respectively, is fully recognized as other non-current liabilities on the Consolidated Balance Sheets. As of December 31, 2009,2011, the Company recorded $1 million and $2$5 million, respectively, within accumulated other comprehensive incomeAOCI on the Consolidated Balance Sheet as an unrecognized prior service credit and unrecognized loss. As of
December 31, 2008,2010, the Company recorded $1 million and $2 million, respectively, within accumulated other comprehensive incomeAOCI on the Consolidated Balance Sheet as an unrecognized prior service credit and unrecognized gain.
The Company’s policy is to contribute amounts sufficient to meet minimum funding requirements as set forth in employee benefit and tax laws plus such additional amounts that the Company determines to be appropriate. TheDuring 2011, 2010 and 2009, the Company recorded pension expense of $3 million, $2 million during each of 2009, 2008 and 2007. In addition, during 2008, the Company recorded a $1 million net gain on curtailments of two defined benefit pension plans.
| 21. | |
| Segment Information |
The reportable segments presented below represent the Company’s operating segments for which separatediscrete financial information is available and which are utilized on a regular basis by its chief operating decision maker to assess performance and to allocate resources. In identifying its reportable segments, the Company also considers the nature of services provided by its operating segments. Management evaluates the operating results of each of its reportable segments based upon revenues and “EBITDA,” which is defined as net income/(loss)income before depreciation and amortization, interest expense (excluding consumer financing interest), interest income (excluding consumer financing interest) and income taxes, each of which is presented on the Consolidated Statements of Operations.Income. The Company believes that EBITDA is a useful measure of performance for the Company’s industry segments which, when considered with GAAP measures, the Company believes gives a more complete understanding of the Company’s operating performance. The Company’s presentation of EBITDA may not be comparable to similarly-titled measures used by other companies.
Year Ended or as of DecemberYEAR ENDEDORASOF DECEMBER 31, 20092011
| Vacation | Corporate | |||||||||||||||||||
| Exchange | Vacation | and | ||||||||||||||||||
| Lodging | and Rentals | Ownership | Other (b) | Total | ||||||||||||||||
Net revenues (a) | $ | 660 | $ | 1,152 | $ | 1,945 | $ | (7 | ) | $ | 3,750 | |||||||||
EBITDA (c) | 175 | (d) | 287 | 387 | (e) | (71 | )(f) | 778 | ||||||||||||
| Depreciation and amortization | 41 | 63 | 54 | 20 | 178 | |||||||||||||||
| Segment assets | 1,564 | 2,358 | 5,152 | 278 | 9,352 | |||||||||||||||
| Capital expenditures | 29 | 46 | 29 | 31 | 135 | |||||||||||||||
| Lodging | Vacation Exchange and Rentals | Vacation Ownership | Corporate and Other (b) | Total | ||||||||||||||||
Net revenues(a) | $ | 749 | $ | 1,444 | $ | 2,077 | $ | (16) | $ | 4,254 | ||||||||||
EBITDA | 157 | (c) | 368 | (d) | 515 | (e) | (84) | (f) | 956 | |||||||||||
Depreciation and amortization | 44 | 80 | 38 | 16 | 178 | |||||||||||||||
Segment assets | 1,662 | 2,619 | 4,688 | 54 | 9,023 | |||||||||||||||
Capital expenditures | 85 | 89 | 37 | 28 | 239 | |||||||||||||||
Year Ended or as of DecemberYEAR ENDEDORASOF DECEMBER 31, 20082010
| Vacation | Corporate | |||||||||||||||||||
| Exchange | Vacation | and | ||||||||||||||||||
| Lodging | and Rentals | Ownership | Other (b) | Total | ||||||||||||||||
Net revenues (a) | $ | 753 | $ | 1,259 | $ | 2,278 | $ | (9 | ) | $ | 4,281 | |||||||||
EBITDA (c) | 218 | (g) | 248 | (h) | (1,074 | )(i) | (27 | )(f) | (635 | ) | ||||||||||
| Depreciation and amortization | 38 | 72 | 58 | 16 | 184 | |||||||||||||||
| Segment assets | 1,628 | 2,331 | 5,574 | 40 | 9,573 | |||||||||||||||
| Capital expenditures | 48 | 58 | 68 | 13 | 187 | |||||||||||||||
F-39
| Lodging | Vacation Exchange and Rentals | Vacation Ownership | Corporate and Other (b) | Total | ||||||||||||||||
Net revenues(a) | $ | 688 | $ | 1,193 | $ | 1,979 | $ | (9) | $ | 3,851 | ||||||||||
EBITDA | 189 | (g) | 293 | (h) | 440 | (i) | (24) | (f) | 898 | |||||||||||
Depreciation and amortization | 42 | 68 | 46 | 17 | 173 | |||||||||||||||
Segment assets | 1,659 | 2,578 | 4,893 | 286 | 9,416 | |||||||||||||||
Capital expenditures | 35 | 92 | 31 | 9 | 167 | |||||||||||||||
YEAR ENDEDORASOF DECEMBER 31, 2009
| Lodging | Vacation Exchange and Rentals | Vacation Ownership | Corporate and Other(b) | Total | ||||||||||||||||
Net revenues(a) | $ | 660 | $ | 1,152 | $ | 1,945 | $ | (7 | ) | $ | 3,750 | |||||||||
EBITDA (j) | 175 | (k) | 287 | 387 | (i) | (71 | )(f) | 778 | ||||||||||||
Depreciation and amortization | 41 | 63 | 54 | 20 | 178 | |||||||||||||||
Segment assets | 1,564 | 2,358 | 5,152 | 278 | 9,352 | |||||||||||||||
Capital expenditures | 29 | 46 | 29 | 31 | 135 | |||||||||||||||
| Vacation | Corporate | |||||||||||||||||||
| Exchange | Vacation | and | ||||||||||||||||||
| Lodging | and Rentals | Ownership | Other(b) | Total | ||||||||||||||||
Net revenues (a) | $ | 725 | $ | 1,218 | $ | 2,425 | $ | (8 | ) | $ | 4,360 | |||||||||
EBITDA (j) | 223 | 293 | 378 | (11 | )(f) | 883 | ||||||||||||||
| Depreciation and amortization | 34 | 71 | 48 | 13 | 166 | |||||||||||||||
| Capital expenditures | 27 | 60 | 85 | 22 | 194 | |||||||||||||||
| (a) | Transactions between segments are recorded at fair value and eliminated in consolidation. Inter-segment net revenues were not significant to the net revenues of any one segment. |
| (b) | Includes the elimination of transactions between segments. |
Includes non-cash impairment charges of $44 million primarily related to the write-down of certain franchise and management agreements and development advance notes and $13 million related to a write-down of an international joint venture at the Company’s lodging business. |
| (d) | Includes (i) a $31 million net benefit resulting from a refund of value-added taxes, (ii) $7 million of restructuring costs incurred in connection with a strategic initiative commenced by the Company during 2010 and (iii) a $4 million charge related to the write-off of foreign exchange translation adjustments associated with the liquidation of a foreign entity. |
| (e) | Includes a $1 million benefit for the reversal of costs incurred as a result of various strategic initiatives commenced by the Company during 2008. |
| (f) | Includes $100 million, $78 million and $64 million of corporate costs during 2011, 2010 and 2009, respectively, and $16 million and $54 million of a net benefit and $6 million of a net expense related to the resolution of and adjustment to certain contingent liabilities and assets during 2011, 2010 and 2009, respectively. |
| (g) | Includes $1 million related to costs incurred in connection with the Company’s acquisition of the Tryp hotel brand during June 2010. |
| (h) | Includes (i) restructuring costs of $9 million and (ii) $6 million related to costs incurred in connection with the Company’s acquisitions of Hoseasons during March 2010, ResortQuest during September 2010 and James Villa Holidays during November 2010. |
| (i) | Includes a non-cash impairment charge of $4 million and $9 million during 2010 and 2009, respectively, to reduce the value of certain vacation ownership properties and related assets held for sale that are no longer consistent with the Company’s development plans. |
| (j) | Includes restructuring costs of $3 million, $6 million, $37 million and $1 million for Lodging, Vacation Exchange and Rentals, Vacation Ownership and Corporate and Other, |
Includes a non-cash impairment charge of $6 million | ||
Provided below is a reconciliation of EBITDA to income/(loss)income before income taxes.
| Year Ended December 31, | ||||||||||||
| 2009 | 2008 | 2007 | ||||||||||
| EBITDA | $ | 778 | $ | (635 | ) | $ | 883 | |||||
| Depreciation and amortization | 178 | 184 | 166 | |||||||||
| Interest expense | 114 | 80 | 73 | |||||||||
| Interest income | (7 | ) | (12 | ) | (11 | ) | ||||||
| Income/(loss) before income taxes | $ | 493 | $ | (887 | ) | $ | 655 | |||||
| Year Ended December 31, | ||||||||||||
| 2011 | 2010 | 2009 | ||||||||||
EBITDA | $ | 956 | $ | 898 | $ | 778 | ||||||
Depreciation and amortization | 178 | 173 | 178 | |||||||||
Interest expense | 152 | 167 | 114 | |||||||||
Interest income | (24 | ) | (5 | ) | (7 | ) | ||||||
|
|
|
|
|
| |||||||
Income before income taxes | $ | 650 | $ | 563 | $ | 493 | ||||||
|
|
|
|
|
| |||||||
The geographic segment information provided below is classified based on the geographic location of the Company’s subsidiaries.
| United | United | All Other | ||||||||||||||||||
| States | Netherlands | Kingdom | Countries | Total | ||||||||||||||||
| Year Ended or As of December 31, 2009 Net revenues | $ | 2,863 | $ | 209 | $ | 143 | $ | 535 | $ | 3,750 | ||||||||||
| Net long-lived assets | 2,468 | 395 | 218 | 309 | 3,390 | |||||||||||||||
| Year Ended or As of December 31, 2008 Net revenues | $ | 3,244 | $ | 297 | $ | 179 | $ | 561 | $ | 4,281 | ||||||||||
| Net long-lived assets | 2,579 | 405 | 203 | 281 | 3,468 | |||||||||||||||
| Year Ended December 31, 2007 Net revenues | $ | 3,390 | $ | 228 | $ | 206 | $ | 536 | $ | 4,360 | ||||||||||
F-40
| United States | United Kingdom | Netherlands | All Other Countries | Total | ||||||||||||||||
Year Ended or As of December 31, 2011 | ||||||||||||||||||||
Net revenues | $ | 3,037 | $ | 281 | $ | 271 | $ | 665 | $ | 4,254 | ||||||||||
Net long-lived assets | 2,654 | 420 | 339 | 314 | 3,727 | |||||||||||||||
Year Ended or As of December 31, 2010 | ||||||||||||||||||||
Net revenues | $ | 2,864 | $ | 174 | $ | 242 | $ | 571 | $ | 3,851 | ||||||||||
Net long-lived assets | 2,595 | 419 | 367 | 312 | 3,693 | |||||||||||||||
Year Ended or As of December 31, 2009 | ||||||||||||||||||||
Net revenues | $ | 2,863 | $ | 143 | $ | 209 | $ | 535 | $ | 3,750 | ||||||||||
Net long-lived assets | 2,468 | 218 | 395 | 309 | 3,390 | |||||||||||||||
| 22. | |
| Restructuring and Impairments |
2010 RESTRUCTURING PLAN
During 2010, the Company committed to a strategic realignment initiative at its vacation exchange and rentals business targeted at reducing costs, primarily impacting the operations at certain vacation exchange call centers. During 2011, the Company incurred $7 million of costs and reduced its liability with $9 million of cash payments. The remaining liability of $7 million is expected to be paid in cash; $6 million of facility-related by the first quarter of 2020 and $1 million of personnel-related by the third quarter of 2012. During 2010, the Company incurred $9 million of costs. As of December 31, 2011, the Company has incurred $16 million of expenses related to the 2010 restructuring plan.
Restructuring2008 RESTRUCTURING PLAN
During 2008, the Company committed to various strategic realignment initiatives targeted principally at reducing costs, enhancing organizational efficiency, reducing the Company’s need to access the asset-backed securities market and consolidating and rationalizing existing processes and facilities. During 2011, the Company reduced its liability with $7 million of cash payments and reversed $1 million of previously recorded facility-related expenses. The remaining liability of $3 million, all of which is facility-related, is expected to be paid in cash by December 2013. During 2010, the Company reduced its liability with $11 million in cash payments. During 2009, the Company recorded $47 million of incremental restructuring costs and reduced its liability with $50 million in cash payments and $15 million of other non-cash items. The remaining liabilityAs of $22 million is expected to be paid in cash; $3December 31, 2011, the Company has incurred $124 million of personnel-related by December 2010 and $19 million of primarily facility-related by September 2017. Duringexpenses related to the 2008 restructuring plan.
Total costs associated with the Company recorded $79 million of2008 restructuring costs ($4 million at Lodging, $9 million at Vacation Exchange and Rentals and $66 million at Vacation Ownership), of which $16 million was paid in cash.
| Personnel | Facility | Asset Write-off’s/ | Contract | |||||||||||||||||
| Related (a) | Related (b) | Impairments (c) | Termination (d) | Total | ||||||||||||||||
| Lodging | $ | 3 | $ | — | $ | — | $ | — | $ | 3 | ||||||||||
| Vacation Exchange and Rentals | 5 | 1 | — | — | 6 | |||||||||||||||
| Vacation Ownership | 1 | 21 | 14 | 1 | 37 | |||||||||||||||
| Corporate | 1 | — | — | — | 1 | |||||||||||||||
| Total | $ | 10 | $ | 22 | $ | 14 | $ | 1 | $ | 47 | ||||||||||
| Personnel Related (a) | Facility Related (b) | Asset Write- off’s/Impairments (c) | Contract Termination (d) | Total | ||||||||||||||||
Lodging | $ | 3 | $ | — | $ | — | $ | — | $ | 3 | ||||||||||
Vacation Exchange and Rentals | 5 | 1 | — | — | 6 | |||||||||||||||
Vacation Ownership | 1 | 21 | 14 | 1 | 37 | |||||||||||||||
Corporate | 1 | — | — | — | 1 | |||||||||||||||
|
|
|
|
|
|
|
|
|
| |||||||||||
Total | $ | 10 | $ | 22 | $ | 14 | $ | 1 | $ | 47 | ||||||||||
|
|
|
|
|
|
|
|
|
| |||||||||||
| (a) | Represents severance benefits resulting from reductions of approximately 370 in staff. The Company formally communicated the termination of employment to all 370 employees, representing a wide range of employee groups. As of December 31, 2009, the Company had terminated all of these employees. |
| (b) | Primarily related to the termination of leases of certain sales offices. |
| (c) | Primarily related to the write-off of assets from sales office closures and cancelled development projects. |
| (d) | Primarily represents costs incurred in connection with the termination of a property development contract. |
The activity related to costs associated with the 2008 and 2010 restructuring costsplans is summarized by segment for the year ended December 31, 2008 arecategory as follows:
| Personnel | Facility | Asset Write-off’s/ | Contract | |||||||||||||||||
| Related (a) | Related (b) | Impairments (c) | Termination (d) | Total | ||||||||||||||||
| Lodging | $ | 4 | $ | — | $ | — | $ | — | $ | 4 | ||||||||||
| Vacation Exchange and Rentals | 8 | — | — | 1 | 9 | |||||||||||||||
| Vacation Ownership | 32 | 13 | 21 | — | 66 | |||||||||||||||
| Total | $ | 44 | $ | 13 | $ | 21 | $ | 1 | $ | 79 | ||||||||||
| Liability as of December 31, 2008 | Costs Recognized | Cash Payments | Other Non-cash | Liability as of December 31, 2009 | ||||||||||||||||
Personnel-Related | $ | 27 | $ | 10 | $ | (34) | $ | — | $ | 3 | ||||||||||
Facility-Related | 13 | 22 | (16) | (1 | ) | 18 | ||||||||||||||
Asset Impairments | — | 14 | — | (14 | ) | — | ||||||||||||||
Contract Terminations | — | 1 | — | — | 1 | |||||||||||||||
|
|
|
|
|
|
|
|
|
| |||||||||||
| $ | 40 | $ | 47 | $ | (50) | $ | (15 | ) | $ | 22 | ||||||||||
|
|
|
|
|
|
|
|
|
| |||||||||||
| Liability as of December 31, 2009 | Costs Recognized | Cash Payments | Other Non-cash | Liability as of December 31, 2010 | ||||||||||||||||
Personnel-Related | $ | 3 | $ | 9 | (a) | $ | (3) | $ | — | $ | 9 | |||||||||
Facility-Related | 18 | — | (7) | — | 11 | |||||||||||||||
Contract Terminations | 1 | — | (1) | — | — | |||||||||||||||
|
|
|
|
|
|
|
|
|
| |||||||||||
| $ | 22 | $ | 9 | $ | (11) | — | $ | 20 | ||||||||||||
|
|
|
|
|
|
|
|
|
| |||||||||||
| Liability as of December 31, 2010 | Costs Recognized | Cash Payments | Other Non-cash | Liability as of December 31, 2011 | ||||||||||||||||
Personnel-Related | $ | 9 | $ | — | $ | (8) | $ | — | $ | 1 | ||||||||||
Facility-Related | 11 | 6 | (b) | (8) | — | 9 | ||||||||||||||
|
|
|
|
|
|
|
|
|
| |||||||||||
| $ | 20 | $ | 6 | $ | (16) | $ | — | $ | 10 | |||||||||||
|
|
|
|
|
|
|
|
|
| |||||||||||
Represents severance benefits resulting from |
Includes $7 million of | ||
IMPAIRMENTS
During 2011, the Company recorded non-cash charges at its lodging business for the write-down of (i) $30 million of management agreements, development advance notes and other receivables which are primarily due to operating and cash flow difficulties at several managed properties within the Wyndham Hotels and Resorts brand, (ii) $14 million of franchise and management agreements resulting from the loss of certain properties which were part of the 2005 acquisition of the Wyndham Hotels and Resorts brand and (iii) a $13 million investment in an international joint venture due to an impairment of cash flows as a result of the Company’s partner having an indirect relationship with the Libyan government. Such amounts are recorded within asset impairments on the Consolidated Statement of Income.
During 2010, the Company recorded a non-cash charge of $4 million to impair the value of certain vacation ownership properties and related toassets held for sale that are no longer consistent with the restructuring costsCompany’s development plans. Such amount is summarized by category as follows:
| Liability as of | ||||||||||||||||||||
| Opening | Costs | Cash | Other | December 31, | ||||||||||||||||
| Balance | Recognized | Payments | Non-cash | 2008 | ||||||||||||||||
| Personnel-Related | $ | — | $ | 44 | $ | (15 | ) | $ | (2 | ) | $ | 27 | ||||||||
| Facility-Related | — | 13 | — | — | 13 | |||||||||||||||
| Asset Impairments | — | 21 | — | (21 | ) | — | ||||||||||||||
| Contract Terminations | — | 1 | (1 | ) | — | — | ||||||||||||||
| $ | — | $ | 79 | $ | (16 | ) | $ | (23 | ) | $ | 40 | |||||||||
F-41
| Liability as of | Liability as of | |||||||||||||||||||
| January 1, | Costs | Cash | Other | December 31, | ||||||||||||||||
| 2009 | Recognized | Payments | Non-cash | 2009 | ||||||||||||||||
| Personnel-Related | $ | 27 | $ | 10 | $ | (34 | ) | $ | — | $ | 3 | |||||||||
| Facility-Related | 13 | 22 | (16 | ) | (1 | ) | 18 | |||||||||||||
| Asset Impairments | — | 14 | — | (14 | ) | — | ||||||||||||||
| Contract Terminations | — | 1 | — | — | 1 | |||||||||||||||
| $ | 40 | $ | 47 | $ | (50 | ) | $ | (15 | ) | $ | 22 | |||||||||
| Amount | ||||
| Goodwill | $ | 1,342 | ||
| Indefinite-lived intangible assets | 36 | |||
| Definite-lived intangible assets | 16 | |||
| Long-lived assets | 32 | |||
| $ | 1,426 | |||
| 23. | |
| Separation Adjustments and Transactions with Former Parent and Subsidiaries |
Transfer of Cendant Corporate Liabilities and Issuance of Guarantees to Cendant and Affiliates
Pursuant to the Separation and Distribution Agreement, upon the distribution of the Company’s common stock to Cendant shareholders, the Company entered into certain guarantee commitments with Cendant (pursuant to the assumption of certain liabilities and the obligation to indemnify Cendant, and Cendant’s former real estate services (“Realogy”)Realogy and travel distribution services (“Travelport”) for such liabilities) and guarantee commitments related to deferred compensation arrangements with each of Cendant and Realogy. These guarantee arrangements primarily relate to certain contingent litigation liabilities, contingent tax liabilities, and Cendant contingent and other corporate liabilities, of which the Company assumed and is responsible for 37.5% while Realogy is responsible for the remaining 62.5%. The remaining amount of liabilities which were assumed by the Company in connection with the Separation was $310$49 million and $343$78 million as of December 31, 20092011 and 2008,2010, respectively. These amounts were comprised of certain Cendant corporate liabilities which were recorded on the books of Cendant as well as additional liabilities which were established for guarantees issued at the date of Separation related to certain unresolved contingent matters and certain others that could arise during the guarantee period. Regarding the guarantees, if any of the companies responsible for all or a portion of such liabilities were to default in its payment of costs or expenses related to any such liability, the Company would be responsible for a portion of the defaulting party or parties’ obligation.obligation(s). The Company also provided a default guarantee related to certain deferred compensation arrangements related to certain current and former senior officers and directors of Cendant, Realogy and Travelport. These arrangements, which are discussed in more detail below, have been valued upon the Separation in accordance with
F-42
As a result of the sale of Realogy on April 10, 2007, Realogy’s senior debt credit rating was downgraded to below investment grade. Under the Separation Agreement, if Realogy experienced such a change of control and suffered such a ratings downgrade, it was required to post a letter of credit in an amount acceptable to the Company and Avis Budget Group to satisfy the fair value of Realogy’s indemnification obligations for the Cendant legacy contingent liabilities in the event Realogy does not otherwise satisfy such obligations to the
\extent they become due. On April 26, 2007, Realogy posted a $500 million irrevocable standby letter of credit from a major commercial bank in favor of Avis Budget Group and upon which demand may be made if Realogy does not otherwise satisfy its obligations for its share of the Cendant legacy contingent liabilities. The letter of credit can be adjusted from time to time based upon the outstanding contingent liabilities and has an expiration date of September 2013, subject to renewal and certain provisions. AsDuring December 2011, such on August 11, 2009, the letter of credit was reduced to $446$70 million. The issuanceposting of this letter of credit does not relieve or limit Realogy’s obligations for these liabilities.
As of December 31, 2011, the $49 million of Separation related liabilities is comprised of $5 million for litigation matters, $272$41 million for tax liabilities, $23$3 million for liabilities of previously sold businesses of Cendant, $8$3 million for other contingent and corporate liabilities and $2 million of liabilities where the calculated guarantee amount exceeded the contingent liability assumed at the date of Separation. In connection with these liabilities, $245$10 million is recorded in current due to former Parent and subsidiaries and $63$37 million is recorded in long-term due to former Parent and subsidiaries as of December 31, 20092011 on the Consolidated Balance Sheet. The Company is indemnifyingwill indemnify Cendant for these contingent liabilities and therefore any payments would be made to the third party through the former Parent. The $2 million relating to guarantees is recorded in other current liabilities as of December 31, 20092011 on the Consolidated Balance Sheet. The actual timing of payments relating to these liabilities is dependent on a variety of factors beyond the Company’s control. See Management’s Discussion and Analysis — Contractual Obligations for the estimated timing of such payments. In addition, as of December 31, 2009,2011, the Company has $5$3 million of receivables due from former Parent and subsidiaries primarily relating to income taxes, which is recorded in other current assets on the Consolidated Balance Sheet. Such receivables totaled $3$4 million as of December 31, 2008.
Following is a discussion of the liabilities on which the Company issued guarantees.
Contingent tax liabilitiesPrior to the Separation, the Company and Realogy were | |
On July 15, 2010, Cendant and |
F-43
During 2010, the Company received $10 million in payment from Realogy and paid $155 million for all such tax returns.liabilities including the final interest payable to Cendant, who is the taxpayer. As of December 31, 2009,2011, the Company’s accrual for outstanding Cendant contingent tax liabilities was $272 million. This liability will remain outstanding until$41 million, which relates to legacy state and foreign tax audits related to taxable years 2003 through 2006 are completed or the statutes of limitations governing such tax years have passed. Balances due to Cendant for these pre-Separation tax returns and related tax attributes were estimated as of December 31, 2006 and have since been adjusted in connection with the filing of the pre-Separation tax returns. These balances will again be adjusted after the ultimate settlement of the related tax audits of these periods. The Company believes that the accruals for tax liabilities are adequate for all open years based on an assessment of many factors including past experience and interpretations of tax law applied to the facts of each matter; however, the outcome of the tax audits is inherently uncertain. Such tax audits and any related litigation, including disputes or litigation on the allocation of tax liabilities between parties under the Tax Sharing Agreement, could result in outcomes for the Companyissues that are different from those reflectedexpected to be resolved in the Company’s historical financial statements.
| 24. | |
F-44
| Selected Quarterly Financial Data — (unaudited) |
Provided below is selected unaudited quarterly financial data for 20092011 and 2008.
| 2009 | ||||||||||||||||
| First | Second | Third | Fourth | |||||||||||||
| Net revenues | ||||||||||||||||
| Lodging | $ | 154 | $ | 174 | $ | 183 | $ | 149 | ||||||||
| Vacation Exchange and Rentals | 287 | 280 | 327 | 258 | ||||||||||||
| Vacation Ownership | 462 | 467 | 508 | 508 | ||||||||||||
Corporate and Other (a) | (2 | ) | (1 | ) | (2 | ) | (2 | ) | ||||||||
| $ | 901 | $ | 920 | $ | 1,016 | $ | 913 | |||||||||
EBITDA (b) | ||||||||||||||||
| Lodging | $ | 35 | $ | 50 | $ | 58 | $ | 32 | (c) | |||||||
| Vacation Exchange and Rentals | 76 | 56 | 107 | 48 | ||||||||||||
Vacation Ownership (d) | 44 | 107 | 104 | 132 | ||||||||||||
Corporate and Other(a)(e) | (21 | ) | (17 | ) | (15 | ) | (18 | ) | ||||||||
| 134 | 196 | 254 | 194 | |||||||||||||
| Less: Depreciation and amortization | 43 | 45 | 46 | 44 | ||||||||||||
| Interest expense | 19 | 26 | 34 | 35 | ||||||||||||
| Interest income | (2 | ) | (2 | ) | (1 | ) | (2 | ) | ||||||||
| Income before income taxes and minority interest | 74 | 127 | 175 | 117 | ||||||||||||
| Provision for income taxes | 29 | 56 | 71 | 44 | ||||||||||||
| Net income | $ | 45 | $ | 71 | $ | 104 | $ | 73 | ||||||||
Per share information | ||||||||||||||||
| Basic | $ | 0.25 | $ | 0.40 | $ | 0.58 | $ | 0.41 | ||||||||
| Diluted | 0.25 | 0.39 | 0.57 | 0.40 | ||||||||||||
| Weighted average diluted shares | 178 | 182 | 183 | 184 | ||||||||||||
| 2011 | ||||||||||||||||
| First | Second | Third | Fourth | |||||||||||||
Net revenues | ||||||||||||||||
Lodging | $ | 149 | $ | 190 | $ | 222 | $ | 188 | ||||||||
Vacation Exchange and Rentals | 356 | 361 | 436 | 291 | ||||||||||||
Vacation Ownership | 450 | 541 | 559 | 527 | ||||||||||||
Corporate and Other(a) | (3 | ) | (2 | ) | (5 | ) | (6 | ) | ||||||||
|
|
|
|
|
|
|
| |||||||||
| $ | 952 | $ | 1,090 | $ | 1,212 | $ | 1,000 | |||||||||
|
|
|
|
|
|
|
| |||||||||
EBITDA | ||||||||||||||||
Lodging | $ | 27 | (b) | $ | 66 | $ | 67 | $ | (3 | )(c) | ||||||
Vacation Exchange and Rentals | 93 | 106 | (d) | 131 | (e) | 38 | ||||||||||
Vacation Ownership | 97 | (f) | 130 | 149 | 139 | |||||||||||
Corporate and Other(a) (g) | (14 | ) | (26 | ) | (18 | ) | (26 | ) | ||||||||
|
|
|
|
|
|
|
| |||||||||
| 203 | 276 | 329 | 148 | |||||||||||||
Less: Depreciation and amortization | 45 | 45 | 43 | 45 | ||||||||||||
Interest expense(h) | 44 | 37 | (i) | 34 | 37 | |||||||||||
Interest income | (2 | ) | (2 | ) | (19 | )(j) | (1 | ) | ||||||||
|
|
|
|
|
|
|
| |||||||||
Income before income taxes | 116 | 196 | 271 | 67 | ||||||||||||
Provision for income taxes | 44 | 82 | 96 | (k) | 11 | |||||||||||
|
|
|
|
|
|
|
| |||||||||
Net income | $ | 72 | $ | 114 | $ | 175 | $ | 56 | ||||||||
|
|
|
|
|
|
|
| |||||||||
Per share information | ||||||||||||||||
Basic | $ | 0.42 | $ | 0.68 | $ | 1.10 | $ | 0.37 | ||||||||
Diluted | 0.41 | 0.67 | 1.08 | 0.37 | ||||||||||||
Weighted average diluted shares | 179 | 170 | 162 | 154 | ||||||||||||
Includes the elimination of transactions between segments. |
Includes a non-cash impairment charge $13 million related to a write-down of an international joint venture. |
| (c) | Includes non-cash impairment charges of $44 million primarily related to the write-down of certain franchise and management agreements and development advance notes. |
| (d) | Includes (i) $31 million of a net benefit resulting from a refund of value-added taxes and (ii) $7 million of restructuring costs incurred in connection with a strategic initiative commenced by the Company during 2010. |
| (e) | Includes a $4 million charge related to the write-off of |
| (f) | Includes a $1 million benefit for the reversal of costs incurred as a result of various strategic initiatives commenced by the Company during 2008. |
| (g) | Includes $11 million of a net benefit, $3 million |
| (h) | Includes $11 million and $1 million of costs incurred for the repurchase of a portion of the Company’s convertible notes during the first and second quarter |
| (i) | Includes $3 million of interest related to value-added tax accruals. |
| (j) | Includes $16 million of interest income related to a refund of value-added taxes. |
| (k) | Includes $13 million of a net benefit related to the reversal of a tax valuation allowance. |
| 2010 | ||||||||||||||||
| First | Second | Third | Fourth | |||||||||||||
Net revenues | ||||||||||||||||
Lodging | $ | 144 | $ | 178 | $ | 203 | $ | 163 | ||||||||
Vacation Exchange and Rentals | 300 | 281 | 330 | 282 | ||||||||||||
Vacation Ownership | 444 | 505 | 533 | 497 | ||||||||||||
Corporate and Other(a) | (2 | ) | (1 | ) | (1 | ) | (5 | ) | ||||||||
|
|
|
|
|
|
|
| |||||||||
| $ | 886 | $ | 963 | $ | 1,065 | $ | 937 | |||||||||
|
|
|
|
|
|
|
| |||||||||
EBITDA | ||||||||||||||||
Lodging | $ | 33 | $ | 49 | (b) | $ | 67 | $ | 40 | |||||||
Vacation Exchange and Rentals | 80 | (c) | 78 | 103 | (d) | 32 | (e) | |||||||||
Vacation Ownership | 82 | 104 | 123 | (f) | 131 | |||||||||||
Corporate and Other(a) (g) | (20 | ) | (14 | ) | 30 | (20 | ) | |||||||||
|
|
|
|
|
|
|
| |||||||||
| 175 | 217 | 323 | 183 | |||||||||||||
Less: Depreciation and amortization | 44 | 42 | 43 | 44 | ||||||||||||
Interest expense | 50 | (h) | 36 | 47 | (i) | 34 | (i) | |||||||||
Interest income | (1 | ) | (2 | ) | (2 | ) | — | |||||||||
|
|
|
|
|
|
|
| |||||||||
Income before income taxes | 82 | 141 | 235 | 105 | ||||||||||||
Provision for income taxes | 32 | 46 | 79 | 27 | ||||||||||||
|
|
|
|
|
|
|
| |||||||||
Net income | $ | 50 | $ | 95 | $ | 156 | $ | 78 | ||||||||
|
|
|
|
|
|
|
| |||||||||
Per share information | ||||||||||||||||
Basic | $ | 0.28 | $ | 0.53 | $ | 0.88 | $ | 0.45 | ||||||||
Diluted | 0.27 | 0.51 | 0.84 | 0.43 | ||||||||||||
Weighted average diluted shares | 186 | 187 | 184 | 182 | ||||||||||||
| (a) | Includes the elimination of transactions between segments. |
| (b) | Includes $1 million related to costs incurred in connection with the Company’s acquisition of the Tryp hotel brand during |
| (c) | Includes |
| (d) | Includes $1 million related to costs incurred in connection with the Company’s acquisition of ResortQuest during September 2010. |
| (e) | Includes (i) $9 million of restructuring costs and (ii) $1 million related to costs incurred in connection with the Company’s acquisition of James Villa Holidays during November 2010. |
| (f) | Includes non-cash impairment charges of |
Includes $2 million of a net expense, $1 million of a net benefit, $52 million of a net benefit and $3 million of a net benefit related to the resolution of and adjustment to certain contingent liabilities and assets |
F-45
| 2008 | ||||||||||||||||
| First | Second | Third | Fourth | |||||||||||||
| Net revenues | ||||||||||||||||
| Lodging | $ | 170 | $ | 200 | $ | 213 | $ | 170 | ||||||||
| Vacation Exchange and Rentals | 341 | 314 | 354 | 250 | ||||||||||||
| Vacation Ownership | 504 | 621 | 661 | 492 | ||||||||||||
Corporate and Other (a) | (3 | ) | (3 | ) | (2 | ) | (1 | ) | ||||||||
| $ | 1,012 | $ | 1,132 | $ | 1,226 | $ | 911 | |||||||||
EBITDA (b) | ||||||||||||||||
| Lodging | $ | 46 | $ | 62 | $ | 72 | $ | 38 | (d) | |||||||
| Vacation Exchange and Rentals | 93 | 54 | 105 | (4 | )(e) | |||||||||||
| Vacation Ownership | 7 | (c) | 112 | 128 | (1,321 | )(f) | ||||||||||
Corporate and Other(a)(g) | (16 | ) | (7 | ) | (11 | ) | 7 | |||||||||
| 130 | 221 | 294 | (1,280 | ) | ||||||||||||
| Less: Depreciation and amortization | 44 | 46 | 47 | 47 | ||||||||||||
| Interest expense | 19 | 18 | 21 | 22 | ||||||||||||
| Interest income | (3 | ) | (3 | ) | (2 | ) | (4 | ) | ||||||||
| Income/(loss) before income taxes and minority interest | 70 | 160 | 228 | (1,345 | ) | |||||||||||
| Provision for income taxes | 28 | 62 | 86 | 11 | ||||||||||||
| Net income/(loss) | $ | 42 | $ | 98 | $ | 142 | $ | (1,356 | ) | |||||||
Per share information | ||||||||||||||||
| Basic | $ | 0.24 | $ | 0.55 | $ | 0.80 | $ | (7.63 | ) | |||||||
| Diluted | 0.24 | 0.55 | 0.80 | (7.63 | ) | |||||||||||
| Weighted average diluted shares | 178 | 178 | 178 | 178 | ||||||||||||
| (h) | Includes $16 million of costs incurred for the early extinguishment of the Company’s revolving foreign credit facility and term loan facility during March 2010. |
| (i) | Includes $11 million and $3 million of costs incurred for the repurchase of a portion of the Company’s Convertible Notes during the third and fourth quarter, respectively. |
EXHIBIT INDEX
Exhibit | Description of Exhibit | |
F-46
| 2.1 | Separation and Distribution Agreement by and among Cendant Corporation, Realogy Corporation, Wyndham Worldwide Corporation and Travelport Inc., dated as of July 27, 2006 (incorporated by reference to Exhibit 2.1 to the Registrant’sForm 8-K filed July 31, 2006) | ||
| 2.2 | Amendment No. 1 to Separation and Distribution Agreement by and among Cendant Corporation, Realogy Corporation, Wyndham Worldwide Corporation and Travelport Inc., dated as of August 17, 2006 (incorporated by reference to Exhibit 2.2 to the Registrant’sForm 10-Q filed November 14, 2006) | ||
| 3.1 | Amended and Restated Certificate of Incorporation (incorporated by reference to Exhibit 3.1 to the Registrant’sForm 8-K filed July 19, 2006) | ||
| 3.2 | Certificate of Change of Location of Registered Office and Registered Agent (incorporated by reference to Exhibit 99.1 to the Registrant’s Form 8-K filed March 3, 2011) | ||
| 3.3 | Amended and Restated By-Laws (incorporated by reference to Exhibit 3.2 to the Registrant’sForm 8-K filed July 19, 2006) | ||
| 4.1 | Indenture, dated December 5, 2006, between Wyndham Worldwide Corporation and U.S. Bank National Association, as Trustee, respecting Senior Notes due 2016 (incorporated by reference to Exhibit 4.1 to the Registrant’sForm 8-K filed February 1, 2007) | ||
| 4.2 | Form of | ||
| 4.3 | Indenture, dated November 20, 2008, between Wyndham Worldwide Corporation and U.S. Bank National Association, as Trustee (incorporated by reference to Exhibit 4.2 to the Registrant’sForm S-3 filed November 25, 2008) | ||
| 4.4 | First Supplemental Indenture, dated May 18, 2009, between Wyndham Worldwide Corporation and U.S. Bank National Association, as Trustee, respecting Senior Notes due 2014 (incorporated by reference to Exhibit 4.1 to the Registrant’sForm 8-K filed May 19, 2009) | ||
| 4.5 | Form of Senior Notes due 2014 (included within Exhibit 4.4) | ||
| 4.6 | Second Supplemental Indenture, dated May 19, 2009, between Wyndham Worldwide Corporation and U.S. Bank National Association, as Trustee, respecting Convertible Notes due 2012 (incorporated by reference to Exhibit 4.3 to the Registrant’sForm 8-K filed May 19, 2009) | ||
| 4.7 | Form of Convertible Notes due 2012 (included within Exhibit 4.6) | ||
| 4.8 | Third Supplemental Indenture, dated February 25, 2010, between Wyndham Worldwide Corporation and U.S. Bank National Association, as Trustee, respecting Senior Notes due 2020 (incorporated by reference to Exhibit 4.1 to the Registrant’s Form 8-K filed February 26, 2010) | ||
| 4.9 | Form of Senior Notes due 2020 (included within Exhibit 4.8) | ||
| 4.10 | Fourth Supplemental Indenture, dated September 20, 2010, between Wyndham Worldwide Corporation and U.S. Bank National Association, as Trustee, respecting Senior Notes due 2018 (incorporated by reference to Exhibit 4.1 to the Registrant’s Form 8-K filed September 23, 2010) | ||
| 4.11 | Form of Senior Notes due 2018 (included within Exhibit 4.10) | ||
| 4.12 | Fifth Supplemental Indenture, dated March 1, 2011, between Wyndham Worldwide Corporation and U.S. Bank National Association, as Trustee, respecting Senior Notes due 2021 (incorporated by reference to Exhibit 4.1 to the Registrant’s Form 8-K filed March 3, 2011) | ||
Exhibit | Description of Exhibit | ||
| 4.13 | Form of Senior Notes due 2021 (included within Exhibit 4.12) | ||
| 10.1 | Employment Agreement with Stephen P. Holmes, dated as of July 31, 2006 (incorporated by reference to Exhibit 10.4 to the Registrant’sForm 10-12B/A filed July 7, 2006) | ||
| 10.2 | Amendment No. 1 to Employment Agreement with Stephen P. Holmes, dated December 31, 2008 (incorporated by reference to Exhibit 10.2 to the Registrant’sForm 10-K filed February 27, 2009) | ||
| Amendment No. 2 to Employment Agreement with Stephen P. Holmes, dated as of November 19, 2009 (incorporated by reference to Exhibit 10.3 to the Registrant’s Form 10-K filed February 19, 2010) | |||
| Employment Agreement with Franz S. Hanning, dated as of November 19, 2009 (incorporated by reference to Exhibit 10.4 to the Registrant’s Form 10-K filed February 19, 2010) | |||
| 10.5 | Amendment No. 1 to Employment Agreement with Franz S. Hanning, dated March 1, 2011 (incorporated by reference to Exhibit 10.3 to the Registrant’s Form 10-Q filed April 29, 2011) | ||
| 10.6 | Employment Agreement with Geoffrey A. Ballotti, dated as of March 31, 2008 (incorporated by reference to Exhibit 10.5 to the Registrant’sForm 10-K filed February 27, 2009) | ||
| Amendment No. 1 to Employment Agreement with Geoffrey A. Ballotti, dated December 31, 2008 (incorporated by reference to Exhibit 10.6 to the Registrant’sForm 10-K filed February 27, 2009) | |||
| Amendment No. 2 to Employment Agreement with Geoffrey A. Ballotti, dated December 16, 2009 (incorporated by reference to Exhibit 10.7 to the Registrant’s Form 10-K filed February 19, 2010) | |||
| 10.9 | Amendment No. 3 to Employment Agreement with Geoffrey A. Ballotti, dated March 1, 2011 (incorporated by reference to Exhibit 10.4 to the Registrant’s Form 10-Q filed April 29, 2011) | ||
| 10.10 | Employment Agreement with Eric A. Danziger, dated as of November 17, 2008 (incorporated by reference to Exhibit 10.8 to the Registrant’s Form 10-K filed February 19, 2010) | ||
| Letter Agreement with Eric A. Danziger, dated December 1, 2008 | |||
G-1
| (incorporated by reference to Exhibit 10.9 to the Registrant’s Form 10-K filed February 19, 2010) | |||
| Amendment No. 1 to Employment Agreement with Eric A. Danziger, dated December 16, 2009 (incorporated by reference to Exhibit 10.10 to the Registrant’s Form 10-K filed February 19, 2010) | |||
| 10.13 | Amendment No. 2 to Employment Agreement with Eric A. Danziger, dated March 1, 2011 (incorporated by reference to Exhibit 10.5 to the Registrant’s Form 10-Q filed April 29, 2011) | ||
| 10.14 | Employment Agreement with Thomas G. Conforti, dated as of September 8, 2009 (incorporated by reference to Exhibit 10.1 to the Registrant’sForm 10-Q filed November 5, 2009) | ||
| 10.15 | Wyndham Worldwide Corporation 2006 Equity and Incentive Plan (Amended and Restated as of May 12, 2009) (incorporated by reference to Exhibit 10.1 to the Registrant’sForm 8-K filed May 18, 2009) | ||
| 10.16 | Amendment to the Wyndham Worldwide Corporation 2006 Equity and Incentive Plan (Amended and Restated as of May 12, 2009) (incorporated by reference to Exhibit 10.1 to the Registrant’s Form 8-K filed May 18, 2010) | ||
| 10.17* | Form of Award Agreement for Restricted Stock Units | ||
| Form of Award Agreement for Stock Appreciation Rights | |||
| Form of Cash-Based Award Agreement (incorporated by reference to Exhibit 10.2 to the Registrant’sForm | |||
Exhibit | Description of Exhibit | ||
| 10.20 | Wyndham Worldwide Corporation Savings Restoration Plan (incorporated by reference to Exhibit 10.7 to the Registrant’sForm 8-K filed July 19, 2006) | ||
| Amendment Number One to Wyndham Worldwide Corporation Savings Restoration Plan, dated December 31, 2008 (incorporated by reference to Exhibit 10.17 to the Registrant’sForm 10-K filed February 27, 2009) | |||
| Wyndham Worldwide Corporation Non-Employee Directors Deferred Compensation Plan (incorporated by reference to Exhibit 10.6 to the Registrant’sForm 8-K filed July 19, 2006) | |||
| First Amendment to Wyndham Worldwide Corporation Non-Employee Directors Deferred Compensation Plan (incorporated by reference to Exhibit 10.48 to the Registrant’sForm 10-K filed March 7, 2007) | |||
| Amendment Number Two to the Wyndham Worldwide Corporation Non-Employee Directors Deferred Compensation Plan, dated December 31, 2008 (incorporated by reference to Exhibit 10.20 to the Registrant’sForm 10-K filed February 27, 2009) | |||
| Wyndham Worldwide Corporation Officer Deferred Compensation Plan (incorporated by reference to Exhibit 10.8 to the Registrant’sForm 8-K filed July 19, 2006) | |||
| Amendment Number One to Wyndham Worldwide Corporation Officer Deferred Compensation Plan, dated December 31, 2008 (incorporated by reference to Exhibit 10.22 to the Registrant’sForm 10-K filed February 27, 2009) | |||
| Transition Services Agreement among Cendant Corporation, Realogy Corporation, Wyndham Worldwide Corporation and Travelport Inc., dated as of July 27, 2006 (incorporated by reference to Exhibit 10.1 to the Registrant’sForm 8-K filed July 31, 2006) | |||
| Tax Sharing Agreement among Cendant Corporation, Realogy Corporation, Wyndham Worldwide Corporation and Travelport Inc., dated as of July 28, 2006 (incorporated by reference to Exhibit 10.2 to the Registrant’sForm 8-K filed July 31, 2006) | |||
| Amendment, executed July 8, 2008 and effective as of July 28, 2006 to Tax Sharing Agreement, entered into as of July 28, 2006, by and among Avis Budget Group, Inc., Realogy Corporation and Wyndham Worldwide Corporation (incorporated by Reference to Exhibit 10.1 to the Registrant’sForm 10-Q filed August 8, 2008) | |||
G-2
| 10.30 | Agreement, dated as of July 15, 2010, between Wyndham Worldwide Corporation and Realogy Corporation clarifying Tax Sharing Agreement, dated as of July 28, 2006, among Realogy Corporation, Cendant Corporation, Wyndham Worldwide Corporation and Travelport, Inc. (incorporated by reference to Exhibit 10.1 to the Registrant’s Form 8-K filed July 21, 2010) | ||
| Credit Agreement, dated as of July | |||
| Form of Declaration of Vacation Owner Program of WorldMark, the Club (incorporated by reference to Exhibit 10.26 to the Registrant’sForm 10-12B filed May 11, 2006) | |||
| Management Agreement, dated as of January 1, 1996, by and between Fairshare Vacation Owners Association and Fairfield Communities, Inc. (incorporated by reference to Exhibit 10.25 to the Registrant’sForm 10-12B filed May 11, 2006) | |||
Exhibit | Description of Exhibit | ||
| 10.34 | Second Amended and Restated FairShare Vacation Plan Use Management Trust Agreement, dated as of March 14, 2008 by and among Fairshare Vacation Owners Association, Wyndham Vacation Resorts, Inc., Fairfield Myrtle Beach, Inc., such other subsidiaries and affiliates of Wyndham Vacation Resorts, Inc. and such other unrelated third parties as may from time to time desire to subject property interests to this Trust Agreement (incorporated by reference to Exhibit 10.1 to the Registrant’s From10-Q filed May 8, 2008) | ||
| First Amendment to the Second Amended and Restated FairShare Vacation Plan Use Management Trust Agreement, effective as of March 16, 2009, by and between the Fairshare Vacation Owners Association and Wyndham Vacation Resorts, Inc. (incorporated by reference to Exhibit 10.3 to the Registrant’sForm 10-Q filed May 7, 2009) | |||
| 10.36 | Second Amendment to the Second Amended and Restated FairShare Vacation Plan Use Management Trust Agreement, effective as of February 15, 2010, by and between the Fairshare Vacation Owners Association and Wyndham Vacation Resorts, Inc. (incorporated by reference to Exhibit 10.1 to the Registrant’s Form 10-Q filed April 30, 2010) | ||
| 10.37 | Amended and Restated Indenture and Servicing Agreement, dated as of | ||
| 10.38 | First Amendment, dated as of June 28, 2011, to the Amended and Restated Indenture and Servicing Agreement, dated as of October 1, 2010, by and among Sierra Timeshare Conduit Receivables Funding II, LLC, as Issuer, Wyndham Consumer Finance, Inc., as Servicer, Wells Fargo Bank, National Association, as Trustee and U.S. Bank National Association, as Collateral Agent (incorporated by reference to Exhibit 10.1 to the Registrant’sForm | ||
G-3
| 12* | Computation of Ratio of Earnings to Fixed Charges | ||
| 21.1* | Subsidiaries of the Registrant | ||
| 23.1* | Consent of Independent Registered Public Accounting Firm | ||
| 31.1* | Certification of Chairman and Chief Executive Officer pursuant toRule 13(a)-14 under the Securities Exchange Act of 1934 | ||
| 31.2* | Certification of Chief Financial Officer pursuant toRule 13(a)-14 under the Securities Exchange Act of 1934 | ||
| 32* | Certification of Chairman and Chief Executive Officer and Chief Financial Officer pursuant to 18 U.S.C. Section 1350 of the United States Code | ||
| 101.INS** | XBRL Instance document | ||
| 101.SCH** | XBRL Taxonomy Extension Schema Document | ||
| 101.CAL** | XBRL Taxonomy Calculation Linkbase Document | ||
| 101.DEF** | XBRL Taxonomy Label Linkbase Document | ||
| 101.LAB** | XBRL Taxonomy Presentation Linkbase Document | ||
| 101.PRE** | XBRL Taxonomy Extension Definition Linkbase Document | ||
| * | Filed herewith |
| ** | Furnished with this report |
G-4