UNITED STATES SECURITIES AND EXCHANGE COMMISSION
Amendment No. 1
(Mark One)
| | þ | |
(Mark One) | | |
|
þ
| | ANNUAL REPORT PURSUANT TO SECTION 13 OR 15(d) OF THE SECURITIES EXCHANGE ACT OF 1934 |
For the fiscal year ended December 31, 2011
or
For the fiscal year ended December 31, 2009 |
or |
o
| | ¨ | TRANSITION REPORT PURSUANT TO SECTION 13 OR 15(d) OF THE SECURITIES EXCHANGE ACT OF 1934 |
Commission FileNo. 0-25370
(Exact name of registrant as specified in its charter)
| | |
| Delaware | | 45-0491516 |
Delaware | | 45-0491516 |
(State or other jurisdiction of
incorporation or organization) | | (I.R.S. Employer
Identification No.) |
(Address, including zip code of registrant’s
principal executive offices)
Registrant’s telephone number, including area code:972-801-1100
Securities registered pursuant to Section 12(b) of the Act:
| | |
| | Name of Exchange on Which Registered |
|
Common Stock, par value $0.01 per share | | The Nasdaq Global Select Market, Inc. |
Securities registered pursuant to Section 12(g) of the Act:None
Indicate by check mark if the registrant is a well-known seasoned issuer, as defined in Rule 405 of the Securities Act. Yes þ No o¨
Indicate by check mark if the registrant is not required to file reports pursuant to Section 13 or Section 15(d) of the Exchange Act. Yes o¨ No þ
Indicate by check mark whether the registrant (1) has filed all reports required to be filed by Section 13 or 15(d) of the Securities Exchange Act of 1934 during the preceding 12 months (or for such shorter period that the registrant was required to file such reports), and (2) has been subject to such filing requirements for the past 90 days. Yes þ No o¨
Indicate by check mark whether the registrant has submitted electronically and posted on its corporate Web site, if any, every Interactive Data File required to be submitted and posted pursuant to Rule 405 ofRegulation S-T during the preceding 12 months (or for such shorter period that the registrant was required to submit and post such files). Yes oþ No o¨
Indicate by check mark if disclosure of delinquent filers pursuant to Item 405 ofRegulation S-K is not contained herein, and will not be contained, to the best of registrant’s knowledge, in definitive proxy or information statements incorporated by reference in Part III of thisForm 10-K or any amendment to thisForm 10-K. þ
Indicate by check mark whether the registrant is a large accelerated filer, an accelerated filer, or a non-accelerated filer, or a smaller reporting company. See the definitions of “large accelerated filer,” “accelerated filer” and “smaller reporting company” inRule 12b-2 of the Exchange Act. (Check one):
| | | | | | |
Large accelerated filer þ | | Accelerated filer o¨ | | Non-accelerated filer o¨ | | Smaller reporting company o¨ |
| | (Do not check if a smaller reporting company) |
(Do not check if a smaller reporting company)
Indicate by check mark whether the registrant is a shell company (as defined inRule 12b-2 of the Exchange Act). Yes o¨ No þ
| | | | | |
| Aggregate market value of the 61,083,505 shares of Common Stock held by non-affiliates of the registrant at the closing sales price as reported on The Nasdaq Global Select Market, Inc. on June 30, 2009 | | $ | 1,089,118,894 | |
| Number of shares of Common Stock outstanding as of the close of business on February 19, 2010: | | | 65,714,715 | |
| | | | |
| Aggregate market value of the 59,889,243 shares of Common Stock held by non-affiliates of the registrant at the closing sales price as reported on The Nasdaq Global Select Market, Inc. on June 30, 2011 | | $ | 1,830,215,266 | |
| Number of shares of Common Stock outstanding as of the close of business on February 17, 2012: | | | 59,299,369 | |
Documents incorporated by reference:
Portions of the definitive proxy statement relating to the 20102012 Annual Meeting of Stockholders ofRent-A-Center, Inc. are incorporated by reference into Part III of this report.
EXPLANATORY NOTE
We are filing this Form 10-K/A Amendment No. 1 (this “Amendment”) solely to file corrected Section 906 Certifications (Exhibits 32.1 and 32.2) to our Annual Report on Form 10-K for the period ended December 31, 2011 as filed on February 28, 2012 (the “Original Filing”). The certifications previously filed as Exhibits 32.1 and 32.2 to the Original Filing erroneously referred to “Quarterly Report on Form 10-Q” rather than “Annual Report on Form 10-K.” In addition, as required by Rule 12b-15 under the Securities Exchange Act of 1934, as amended, new Section 302 Certifications by our principal executive officer and principal financial officer are filed as Exhibits 31.1 and 31.2 to this Amendment.
Except as described above, no other changes have been made to the Original Filing, and this Amendment does not otherwise amend, update or change the financial statements or disclosures in the Original Filing.CAUTIONARY NOTE REGARDING FORWARD-LOOKING STATEMENTS
This Annual Report on Form 10-K includes “forward-looking” statements within the meaning of the Private Securities Litigation Reform Act of 1995. Forward-looking statements can be identified by the fact that they do not relate strictly to historical or current facts. They often include words such as “believes,” “expects,” “anticipates,” “estimates,” “intends,” “plans,” “seeks” or words of similar meaning, or future or conditional verbs, such as “will,” “should,” “could,” “may,” “aims,” “intends,” or “projects.” A forward-looking statement is neither a prediction nor a guarantee of future events or circumstances, and those future events or circumstances may not occur. You should not place undue reliance on forward-looking statements, which speak only as of the date of this Annual Report on Form 10-K. These forward-looking statements are all based on currently available operating, financial and competitive information and are subject to various risks and uncertainties. Our actual future results and trends may differ materially depending on a variety of factors, including, but not limited to, the risks and uncertainties discussed under “Risk Factors” and “Management’s Discussion and Analysis of Financial Condition and Results of Operations.” Given these risks and uncertainties, you should not rely on forward-looking statements as a prediction of actual results. Any or all of the forward-looking statements contained in this Annual Report on Form 10-K and any other public statement made by us, including by our management, may turn out to be incorrect. We are including this cautionary note to make applicable and take advantage of the safe harbor provisions of the Private Securities Litigation Reform Act of 1995 for forward-looking statements. We expressly disclaim any obligation to update or revise any forward-looking statements, whether as a result of new information, future events or otherwise.
PART I
OverviewHistory of Rent-A-Center
Unless the context indicates otherwise, references to “we,” “us” and “our” refers to the consolidated business operations ofRent-A-Center, Inc., the parent, and any or all of its direct and indirect subsidiaries.
We are the largest rent-to-own operator in North America, focused on improving the United Statesrent-to-own industry with an approximate 35% market share based on store count. At December 31, 2009, we operated 3,007 company-owned stores nationwide and in Canada and Puerto Rico, including 39 retail installment sales stores underquality of life for our customers by providing them the names “Get It Now” and “Home Choice,” and18 rent-to-own stores located in Canada under the names“Rent-A-Centre” and “Better Living.” Our subsidiary, ColorTyme, is a national franchisoropportunity to obtain ownership ofrent-to-own stores. At December 31, 2009, ColorTyme had 210 franchisedrent-to-own stores in 33 states. These franchise stores represent an additional 2% market share based on store count.
Our stores generally offer high quality high-quality durable products, such as major consumer electronics, appliances, computers, and furniture and accessories, under flexible rental purchase agreements that generally allow the customer to obtain ownership of the merchandise at the conclusion of anagreed-upon rental period. The rental purchase transaction is a flexible alternative for consumers to obtain use and enjoyment of brand name merchandise without incurring debt. Key features of the rental purchase transaction include:
| | |
| • | convenient payment options: |
| | |
| • | weekly, semi-monthly or monthly; |
|
| • | in-store, over the phone or online; |
•with no long-term obligations;
• right to terminate without penalty;
• no requirement of a credit history;
• delivery andset-up included at no additional charge;
• product maintenance;
| | |
| • | lifetime reinstatement; and |
|
| • | flexible options to obtain ownership — 90 days same as cash, early purchase options, or payment through the term of the agreement. |
We offer well known brands such as Sony, Philips, LG, Hitachi, Toshiba and Mitsubishi home electronics, Whirlpool appliances, Toshiba, Sony, Hewlett-Packard, Dell, Acer and Compaq computers and Ashley, England, Standard, Albany and Klaussner furniture. We also offer high levels of customer service, including repair, pickup and delivery, generally at no additional charge. Our customers benefit from the ability to return merchandise at any time without further obligation and make payments that build toward ownership. We estimate that approximately 74% of our business is from repeat customers.
We also offer financial services products, such as short term secured and unsecured loans, debit cards, check cashing, tax preparation and money transfer services, in some of our existing stores under the trade names “RAC Financial Services” and “Cash AdvantEdge.” As of December 31, 2009, we offered some or all of these financial services products in 353Rent-A-Center store locations in 17 states.
obligation.We were incorporated in Delaware in 1986. From 1993 to 2006, we pursued an aggressive growth strategy in which we opened new stores and sought to acquire underperforming rent-to-own stores to which we could apply our operating model. As a result of this strategy, the number of our locations grew from 27 to over 3,400 in 2006, primarily through acquisitions. We acquired over 3,300 stores during this period, including approximately 390 of our franchised stores. These acquisitions occurred in approximately 200 separate transactions, including ten transactions in each of which we acquired in excess of 50 locations. In addition, we strategically opened or acquired stores near market areas served by our existing stores (“cannibalized”) to enhance service levels, gain incremental sales and increase market penetration.
As our U.S. store base matured, we began to focus on acquiring new customers through sources other than our existing U.S. rent-to-own store locations and to seek additional distribution channels for our products and services. One of our current growth strategies is our “RAC Acceptance” model. With this model, we operate kiosks within various traditional retailers’ locations where we generally offer the rent-to-own transaction to consumers who do not qualify for financing from such retailers. The number of RAC Acceptance locations increased by 95% from 2010 to 2011 and we intend to continue growing the RAC Acceptance segment by expanding the number of our retail partners. In addition, we are expanding our rent-to-own store operations in Canada and Mexico and seeking to identify other international markets in which we believe our products and services would be in demand.
Throughout our history, our operations have generated strong cash flow, averaging $280.2 million in operating cash flow per year since 2002. As a result, we have been able to invest in new business opportunities, execute strategic acquisitions, expand into different markets, as well as make ongoing improvements in our support infrastructure, while maintaining a strong balance sheet.
Our principal executive offices are located at 5501 Headquarters Drive, Plano, Texas 75024. Our telephone number is(972) 801-1100 and our company website is www.rentacenter.com. We do not intend for information contained on our website to be part of thisForm 10-K. We make available free of charge on or through our website our annual report onForm 10-K, our quarterly reports onForm 10-Q, our current reports onForm 8-K and amendments to those reports filed or furnished pursuant to Section 13(a) or 15(d) of the Exchange Act as soon as reasonably practicable after we electronically file such material with, or furnish it to, the Securities and Exchange
1
Commission (“SEC”). Additionally, we voluntarily will provide electronic or paper copies of our filings free of charge upon request.
Industry OverviewThe Rental Purchase Transaction
AccordingThe rental purchase transaction is a flexible alternative for consumers to obtain use and enjoyment of brand name merchandise with no long-term obligation. Key features of the rental purchase transaction include:
Brand name merchandise. We offer well known brands such as Sony, Philips, LG, Panasonic, Toshiba and Mitsubishi home electronics; Whirlpool appliances; Toshiba, Sony, Hewlett-Packard, Dell, Acer, Compaq and Apple computers; and Ashley, England, Standard, Albany and Klaussner furniture.
Convenient payment options. Our customers may make weekly, semi-monthly or monthly payments, in our stores, kiosks, online or by telephone. We accept cash and credit or debit cards. Approximately 78% of our agreements are on a weekly term.
No negative consequences. A customer may terminate a rental purchase agreement at any time without penalty.
No credit needed. Generally, we do not conduct a formal credit investigation of our customers. We verify a customer’s residence and sources of income. References provided by the customer are also contacted to verify the information contained in the rental purchase order form.
Delivery & set-up included. We generally offer same day or 24-hour delivery and installation of our merchandise at no additional cost to the Associationcustomer.
Product maintenance & replacement. We provide any required service or repair without additional charge, except for damage in excess of Progressive Rental Organizations,normal wear and tear. Repair services are provided through our network of service centers, the cost of which may be reimbursed by the vendor if the item is still under factory warranty. If the product cannot be repaired at the customer’s residence, we provide a temporary replacement while the product is being repaired. If the product cannot be repaired, we will replace it with a product of comparable quality, age and condition.
rent-to-ownLifetime reinstatement. If a customer is temporarily unable to make payments on a piece of rental merchandise and must return the merchandise, that customer generally may later re-rent the same piece of merchandise (or if unavailable, a substitute of comparable quality, age and condition) on the terms that existed at the time the merchandise was returned, and pick up payments where they left off without losing what they previously paid. We estimate that approximately 77% of our business in our Core U.S. segment (see below) is from repeat customers. industry
Flexible options to obtain ownership. Ownership of the merchandise generally transfers to the customer if the customer has continuously renewed the rental purchase agreement for a period of seven to 24 months, depending upon the product type, or exercises a specified early purchase option.
Our Operating Segments
We report four operating segments: Core U.S., RAC Acceptance, International, and ColorTyme. Additional information regarding our operating segments is presented in“Management’s Discussion and Analysis of Financial Condition and Results of Operations” contained in this report, and financial information regarding these segments is provided in Note R in the Notes to the Consolidated Financial Statements contained in this report.
Core U.S.
Our Core U.S. segment, consisting of our company-owned stores located in the United States and Canada consistsPuerto Rico, is our largest operating segment, comprising approximately 91% of approximately 8,500 storesour consolidated net revenues and serves approximately 3.2 million households. We estimate thatsubstantially all of our net earnings for the two largestrent-to-own industry participants account for approximately 4,900 of the total number of stores, and the majority of the remainder of the industry consists of operations with fewer than 50 stores. Therent-to-own industry is highly fragmented and has experienced significant consolidation. We believe this consolidation trend in the industry will continue, presenting opportunities for us to continue to acquire additional stores or customer accounts on favorable terms.
Therent-to-own industry serves a highly diverse customer base. According to the Association of Progressive Rental Organizations, approximately 76% ofrent-to-own customers have household incomes between $15,000 and $50,000 per year. Therent-to-own industry serves a wide variety of customers by allowing them to obtain merchandise that they might otherwise be unable to obtain due to insufficient cash resources or a lack of access to credit. The Association of Progressive Rental Organizations also estimates that approximately 94% of customers have high school diplomas. According to an April 2000 Federal Trade Commission study, 75% ofrent-to-own customers were satisfied with their experience withrent-to-own transactions. The study noted that customers gave a wide variety of reasons for their satisfaction, including “the ability to obtain merchandise they otherwise could not; the low payments; the lack of a credit check; the convenience and flexibility of the transaction; the quality of the merchandise; the quality of the maintenance, delivery, and other services; the friendliness and flexibility of the store employees; and the lack of any problems or hassles.”
Historical Growth
From 1993 to 2006, we pursued an aggressive growth strategy in which we sought to acquire underperformingrent-to-own stores to which we could apply our operating model as well as open new stores. Since March 1993, our company-owned store base has grown from 27 to 3,007 atyear ended December 31, 2009, primarily through acquisitions. During this period, we acquired over 3,300 stores, including approximately 400 of our franchised stores. These acquisitions occurred in approximately 270 separate transactions, including ten transactions where we acquired in excess of 50 stores. In addition, we strategically opened or acquired stores near market areas served by existing stores (“cannibalized”) to enhance service levels, gain incremental sales and increase market penetration.
The following table summarizes the store growth activity over the last three fiscal years:
| | | | | | | | | | | | | |
| | | 2009 | | | 2008 | | | 2007 | |
| |
| Stores at beginning of period | | | 3,037 | | | | 3,081 | | | | 3,406 | |
| New store openings | | | 40 | | | | 26 | | | | 27 | |
| Acquired stores remaining open | | | 1 | | | | 5 | | | | 14 | |
Closed stores(1) | | | | | | | | | | | | |
| Merged with existing stores | | | 59 | | | | 45 | | | | 363 | |
| Sold or closed with no surviving store | | | 12 | | | | 30 | | | | 3 | |
| | | | | | | | | | | | | |
| Stores at end of period | | | 3,007 | | | | 3,037 | | | | 3,081 | |
| | | | | | | | | | | | | |
| Acquired stores closed and accounts merged with existing stores | | | 26 | | | | 38 | | | | 36 | |
| Total approximate purchase price of acquisitions | | | $7.2 million | | | | $15.7 million | | | | $20.1 million | |
| | |
(1) | | Substantially all of the merged, sold or closed stores in 2007 relate to our store consolidation plans discussed below and in more detail in Note F, Restructuring, in the Notes to the Consolidated Financial Statements on page 55. |
2
Store Consolidation. We believe our aggressive store acquisition program and our planned cannibalization resulted in over penetration in some markets. We continually evaluate every market in which we operate by reviewing operating results, competitive positioning, and growth potential. As a result of such review in December 2007, we committed to a store consolidation plan pursuant to which we closed or merged 282 stores as of December 31, 2009.
Future Store Growth.2011. We continue to believe there are attractive opportunities to expand our presence in the U.S. rent-to-own industry both nationally and internationally. industry. We plan to continue opening new stores in targeted markets and acquiring existingrent-to-own stores and store account portfolios. We will focus new market penetration in adjacent areas or regions that we believe are underserved by therent-to-own industry. In addition, we intend to pursue our acquisition strategy of targeting under-performing and under-capitalizedrent-to-own stores. We also intend to continue toPeriodically, we critically evaluate the markets in which we operate and will close, sell or merge underperforming stores.
Competitive Strengths
We believeOur strategy to grow further the following competitive strengths position us wellCore U.S. segment is focused on providing compelling product values for continued growth:
Geographic Footprint.our customers through the use of strategic merchandise purchases. In addition, we seek to expand the offering ofproduct lines to appeal to more customers, thus growing our customer base. At December 31, 2009,2011, we operated 3,0072,994 company-owned stores nationwide and in CanadaPuerto Rico, including 39 retail installment sales stores under the names “Get It Now” and “Home Choice.”
RAC Acceptance
Through our RAC Acceptance segment, we generally provide an onsite rent-to-own option at a third-party retailer’s location. In the event a retail purchase credit application is declined, the customer can be introduced to an in-store RAC Acceptance representative who explains an alternative transaction for acquiring the use and ownership of the merchandise. Because we neither require nor perform a credit check for the approval of the rental purchase transaction, applicants who meet the basic criteria are generally approved. We believe our RAC Acceptance program is beneficial for both the retailer and the consumer. The retailer captures more sales because we buy the inventory item directly from it and future rental payments are generally made at the retailer’s location. We believe consumers also benefit from our RAC Acceptance program because they are able to obtain the products they want and need without the necessity of credit.
Each RAC Acceptance kiosk location typically consists of an area with a computer, desk and chairs. We occupy the space without charge by agreement with each retailer. Accordingly, start-up costs with respect to a new RAC Acceptance location are minimal. Likewise, any exit costs associated with the closure of a RAC Acceptance location would also be immaterial on an individual basis.
We rely on our third-party retail partners to deliver merchandise rented by the customer. Such third-party retail partners typically charge us a fee for delivery, which we pass on to the customer. In the event the customer returns rented merchandise, we pick it up at no additional charge. Merchandise returned from a RAC Acceptance kiosk location is offered for rent at one of our Core U.S. store locations.
We intend to grow the RAC Acceptance segment by increasing the number of our retail partners. In addition, our strategy includes expanding customer awareness of the rent-to-own transaction by implementing joint marketing efforts with our retail partners. As of December 31, 2011, we operated 750 kiosk locations inside furniture and electronics retailers located in 34 states and Puerto Rico. We expect to add approximately 200 kiosk locations during 2012.
International
Our International segment currently consists of company-owned store locations in Canada and Mexico. We are expanding our operations in Canada and Mexico and seeking to identify other international markets in which we believe our products and services would be in demand. We believe there are numerous opportunities to extend the rent-to-own transaction internationally.
In addition,Canada, we are focusing on improving operational efficiencies in our subsidiary,existing stores. At December 31, 2011, we operated 28 stores and expect to add approximately ten rent-to-own store locations in 2012.
In Mexico, our strategy includes entering complementary new market areas, while expanding our presence in currently existing market areas. At December 31, 2011, we operated 52 stores and expect to add approximately 60 rent-to-own store locations in 2012.
ColorTyme
ColorTyme is our nationwide franchisor of rent-to-own stores. At December 31, 2011, ColorTyme franchised 210216 stores in 33 states. We believeThese rent-to-own stores primarily offer high quality durable products such as consumer electronics, appliances, computers, furniture and accessories. During 2011, ten new franchise locations were added, three locations were acquired, three locations were sold (all of which we purchased) and three locations were closed.
All of the numberColorTyme franchised stores use ColorTyme’s trade names, service marks, trademarks and locationlogos. All stores operate under distinctive operating procedures and standards. ColorTyme’s primary source of revenue is the sale of rental merchandise to its franchisees who, in turn, offer the merchandise to the general public for rent or purchase under a rent-to-own transaction. Because ColorTyme franchisees generally offer a product selection similar to ours, ColorTyme is able to offer franchisees the benefit of our combined purchasing power.
As franchisor, ColorTyme receives royalties of 2.0% to 4.0% of the franchisees’ monthly gross revenue and, generally, an initial fee up to $20,000 per new location.
Some of ColorTyme’s franchisees may be in locations where they directly compete with our company-owned stores, combined withwhich could negatively impact the strengthbusiness, financial condition and operating results of our brand provides us with a unique platform from which to market additional products and services to our customer demographic. company-owned stores.
The following table shows the geographic distributionsummarizes our locations allocated among these operating segments as of December 31:
| | | | | | | | | | | | |
| | | 2011 | | | 2010 | | | 2009 | |
Core U.S. | | | 2,994 | | | | 2,985 | | | | 2,989 | |
RAC Acceptance | | | 750 | | | | 384 | | | | 82 | |
International | | | | | | | | | | | | |
Canada | | | 28 | | | | 18 | | | | 18 | |
Mexico | | | 52 | | | | 5 | | | | — | |
ColorTyme | | | 216 | | | | 209 | | | | 210 | |
| | | | | | | | | | | | |
Total locations | | | 4,040 | | | | 3,601 | | | | 3,299 | |
| | | | | | | | | | | | |
The following discussion applies generally to all of our stores:
| | | | | | | | | | | | | |
| | | Number of Stores | |
| | | Company
| | | With Financial
| | | | |
Location | | Owned | | | Services | | | Franchised | |
| |
| Alabama | | | 59 | | | | — | | | | 3 | |
| Alaska | | | 6 | | | | 5 | | | | 3 | |
| Arizona | | | 57 | | | | 6 | | | | — | |
| Arkansas | | | 39 | | | | — | | | | 1 | |
| California | | | 140 | | | | — | | | | 5 | |
| Colorado | | | 43 | | | | 12 | | | | — | |
| Connecticut | | | 40 | | | | — | | | | 1 | |
| Delaware | | | 20 | | | | — | | | | — | |
| District of Columbia | | | 4 | | | | — | | | | — | |
| Florida | | | 172 | | | | — | | | | 19 | |
| Georgia | | | 83 | | | | — | | | | 7 | |
| Hawaii | | | 11 | | | | 7 | | | | 5 | |
| Idaho | | | 12 | | | | 7 | | | | 3 | |
| Illinois | | | 110 | † | | | — | | | | 8 | |
| Indiana | | | 97 | | | | — | | | | 2 | |
| Iowa | | | 27 | | | | 13 | | | | — | |
| Kansas | | | 34 | | | | 13 | | | | 8 | |
| Kentucky | | | 65 | | | | 20 | | | | 4 | |
| Louisiana | | | 45 | | | | — | | | | 6 | |
| Maine | | | 28 | | | | — | | | | 9 | |
| Maryland | | | 63 | | | | — | | | | 11 | |
| Massachusetts | | | 69 | | | | — | | | | 1 | |
| Michigan | | | 104 | | | | — | | | | 7 | |
| Minnesota | | | 8 | * | | | — | | | | — | |
| Mississippi | | | 35 | | | | — | | | | 1 | |
| Missouri | | | 65 | | | | 16 | | | | — | |
| Montana | | | 9 | | | | 6 | | | | — | |
| Nebraska | | | 14 | | | | — | | | | — | |
| Nevada | | | 23 | | | | 3 | | | | — | |
| New Hampshire | | | 20 | | | | — | | | | 1 | |
| New Jersey | | | 44 | | | | — | | | | — | |
| New Mexico | | | 27 | | | | 10 | | | | 9 | |
| New York | | | 176 | | | | — | | | | 3 | |
| North Carolina | | | 129 | | | | — | | | | 12 | |
| North Dakota | | | 3 | | | | — | | | | — | |
| Ohio | | | 175 | | | | 54 | | | | 4 | |
| Oklahoma | | | 45 | | | | — | | | | 6 | |
| Oregon | | | 27 | | | | — | | | | 4 | |
| Pennsylvania | | | 151 | | | | — | | | | 3 | |
| Puerto Rico | | | 45 | | | | — | | | | — | |
| Rhode Island | | | 16 | | | | — | | | | 2 | |
| South Carolina | | | 64 | | | | — | | | | 4 | |
| South Dakota | | | 4 | | | | — | | | | — | |
| Tennessee | | | 90 | | | | 37 | | | | 4 | |
| Texas | | | 289 | | | | 112 | | | | 37 | |
| Utah | | | 16 | | | | 6 | | | | — | |
| Vermont | | | 9 | | | | — | | | | — | |
| Virginia | | | 68 | | | | — | | | | 12 | |
| Washington | | | 44 | | | | 26 | | | | 5 | |
| West Virginia | | | 35 | | | | — | | | | — | |
| Wisconsin | | | 23 | * | | | — | | | | — | |
| Wyoming | | | 7 | | | | — | | | | — | |
| Canada | | | 18 | | | | — | | | | — | |
| | | | | | | | | | | | | |
| TOTAL | | | 3,007 | | | | 353 | | | | 210 | |
| | |
* | | Retail installment stores |
|
† | | Includes eight retail installment stores |
3
Management Expertise. Our management team at both the corporate and operational levels is highly experienced with over 100 combined years of service with us. Our executive management team has demonstrated the ability to grow the profitability of our business through their operational leadership and strategic vision.
Financial Strength. Historically, our operations have generated strong cash flow, averaging $240.0 million in operating cash flow per year since 1999. As a result, we have been able to invest in acquisitions and new business opportunities while maintaining a strong balance sheet.
Collections. The breadth of our store locations also provides us with the operational infrastructure to support our collection efforts. The ability to timely and personally contact customers through our local field personnel is critical to our ability to collect payments or regain possession of rented merchandise. In addition, we believe we have developed lasting relationships with our customers, as well as obtained extensive knowledge of our targeted customer demographic, through our collection experience.
Integration Experience. We have gained significant experience in the acquisition and integration of otherrent-to-own operators and believe the fragmented nature of therent-to-own and financial services industries will result in ongoing consolidation opportunities. Acquired stores benefit from our improved product mix, sophisticated management information system, purchasing power and administrative network.
Strategy
We intend to capitalize on our competitive strengths and continue to build our position as a leading provider of products and services to cash and credit constrained consumers by focusing our strategic efforts on the following:
| | |
| • | enhancing the operations, revenue and profitability of our store locations; |
|
| • | seeking additional distribution channels for our products and services; |
|
| • | leveraging our financial strength; and |
|
| • | strengthening customer relationships through community involvement. |
Enhancing the Operations, Revenue and Profitability of Our Store Locations
We continually seek to improve store performance through strategies intended to produce gains in operating efficiency, revenue and profitability. For example, we continue to focus our operational personnel on prioritizing store profit growth, including increasing store revenue and managing store level operating expenses.
We believe we will achieve gains in revenues and operating margins in both existing and newly acquired stores by continuing to:
| | |
| • | focus on the customer experience, both in our store locations, as well as on our website; |
|
| • | focus on improving the operations in our existing financial services store locations; |
|
| • | use consumer focused advertising, including direct mail, television, Internet, radio and print media, which highlights the appealing features of our services to increase store traffic and expand our customer base; |
|
| • | respond to competitive pressures on a market by market basis with specifically tailored action plans; |
|
| • | acquire customer accounts; |
|
| • | create compelling product values for our customers through the use of strategic merchandise purchases; |
|
| • | expand the offering of product lines to appeal to more customers to increase the number of transactions and grow our customer base; and |
|
| • | employ strict store-level cost control. |
4
Seeking Additional Distribution Channels for Our Products and Services
We believe there are opportunities for us to obtain new customers through sources other than our existingrent-to-own stores. We are currently exploring the following alternatives:
| | |
| • | offering therent-to-own transaction to consumers who do not qualify for financing from a traditional retailer by maintaining a presence inside such retailer’s store locations; |
|
| • | making therent-to-own transaction more attractive and convenient to consumers by locating kiosks inside destination retailers such as grocers or mass merchandise retailers; |
|
| • | altering the footprint and product mix for stores in urban locations; |
|
| • | improving and expanding our financial services operations, including the addition of Internet lending; |
|
| • | expanding our retail store operations; and |
|
| • | expanding our operations in Canada and seeking to identify other international markets in which we believe our products and services would be in demand. |
There can be no assurance that we will be successful in our efforts to expand our distribution channels, or that such operations, should they be added, will prove to be profitable.
Leveraging our Financial Strength
We believe we can leverage our financial strength by investing significantly in people, processes and technology to increase revenue and reduce our cost infrastructure through our investments in the following:
| | |
| • | a new centralized purchasing system which allows us to better manage our rental merchandise at the store level while expanding availability of the most popular products; |
|
| • | centralized procurement of all non-merchandise categories of supplies and services, including the development of an on-line procurement tool and a commitment to add dedicated resources at our home office to professionally manage our expenses; and |
|
| • | an enhanced point of sale system which will provide visibility and efficiency in all aspects of our store operations. |
We believe our financial strength allows us to pursue these and other initiatives while also making strategic use of our cash.
Strengthening Customer Relationships through Community Involvement
We seek to further strengthen relationships with our customers through community involvement both at the local store level and as a company through corporate donations and initiatives. We encourage the management of each of our stores to involve themselves with their respective local communities. In addition, we participate in various programs, including the following:
| | |
| • | Since 2002, co-workers at our headquarters facility in Plano, Texas have worked to fight hunger through the North Texas Food Bank. On a national basis, we have committed $500,000 over four years in the fight to end hunger. |
|
| • | Each spring, we raise funds for Big Brothers Big Sisters of America. With a donation of $1 or more, customers and co-workers sign their name on a paper spring egg to hang in our stores. Since 2003,Rent-A-Center has given $100,000 every year to match the total amount raised by our stores during a four week campaign. To date, we have donated more than $1.5 million. |
|
| • | In 2004, we established the Make A Difference Scholarship which provides $60,000 annually to customers, their children and our co-workers’ children who are pursuing an undergraduate degree at the college or university of their choice. |
5
| | |
| • | Since 2005, we have teamed up with Boys & Girls Clubs to furnish special “RAC” Rooms to the centers that need them most. Each year, we create 20 new RAC Rooms around the country. Clubs choose the merchandise they need, including furniture, televisions, electronics and computers. |
|
| • | We pledged $800,000 over four years in grants to Junior Achievement offices in communities across the U.S. as part of our commitment to promoting financial literacy in our communities. Our program with Junior Achievement assures that financial literacy programs will be taught to children in grades K-12 in schools where at least 51% of students qualify for free or reduced lunch. |
|
| • | Random Acts of Caring brings unexpected gifts to people and organizations that serve others. Since 2008, the Random Acts of Caring program has provided unexpected donations of merchandise and funding to 47 deserving non-profit organizations. Examples include furnishing rooms in three fire stations in New York and donating $5,000 to the FDNY Foundation, and providing the Allen County Chapter of the American Red Cross in Lima, Ohio with four desktop computers and two laptops for field work. |
Rent-A-Center Store Operations
Our Core U.S. stores average approximately 4,700 square feet and are located primarily in strip centers. Because we utilize “just in time” inventory strategies in our Core U.S. stores, receiving merchandise shipments in relatively small quantities directly from vendors, we are able to dedicate approximately 75% of the store space to showroom floor, and also eliminate warehousing costs.
We continually evaluate store design in an effort to improve our customers’ in-store experience. Stores are remodeled approximately every five years.RAC Acceptance kiosks are located within the premises of third-party retailers. Each kiosk typically consists of an area with a computer, desk and chairs. We occupy the space without charge by agreement with each retailer.
Our International stores are generally similar to those in the Core U.S., although there may be differences attributable to the country in which such store is located.
Product Selection
Our Core U.S. and International stores generally offer merchandise from four basic product categories: major consumer electronics, appliances, computers, and furniture and accessories. Although we seek to maintain sufficient inventory in our stores to offer customers a wide variety of models, styles and brands, we generally limit merchandise to prescribed levels to maintain strict inventory controls. We seek to provide a wide variety of high quality merchandise to our customers, and we emphasize high-end products from name-brand manufacturers. For the year ended December 31, 2009, consumer electronic products accounted for approximately 36% of our store rental revenue, furniture and accessories for 31%, appliances for 17% and computers for 16%. Customers may request either new merchandise or previously rented merchandise. Previously rented merchandise is generally offered at the same weekly or monthly rental rate as is offered for new merchandise, but with an opportunity to obtain ownership of the merchandise after fewer rental payments.
Major consumerConsumer electronic products offered by our stores include high definition televisions, home theatre systems, video game consoles and stereos from top name-brand manufacturers such as Sony, Nintendo, Philips, LG, Hitachi,Panasonic, Toshiba, Mitsubishi and Mitsubishi.Microsoft. We offer major appliances manufactured by Whirlpool, including refrigerators, freezers, washing machines, dryers, freezers and ranges. We offer desktop, laptop and laptoptablet computers from Toshiba, Sony, Hewlett Packard,Hewlett-Packard, Dell, Acer, Compaq and Compaq.Apple. We offer a variety of furniture products, including dining room, living room and bedroom furniture featuring a number of styles, materials and colors. We offer furniture made by Ashley, England, Standard, Albany, and Klaussner and other top name-brand manufacturers. Accessories include lamps and tables and are typically rented as part of a package of items, such as a complete room of furniture. Showroom displays enable customers to visualize how the product will look in their homes and provide a showcase for accessories.
Rental Purchase Agreements
Our customers generally enter into weekly, semi-monthly or monthly rental purchase agreements, which renew automatically upon receipt of each payment. We retain titleThe merchandise assortment may vary in our International stores according to market characteristics and consumer demand unique to the particular country in which we are operating. For example, in Mexico, the appliances we offer are sourced locally, providing our customers in Mexico the look and feel to which they are accustomed in that product category.
RAC Acceptance locations offer the merchandise duringas available at the termapplicable third-party retailer.
For each of the rental purchase agreement. Ownership of the merchandise generally transfers to the customer if the customer has continuously renewed the rental purchase agreement for a period of seven to 30 months, depending upon the product type, or exercises a specified early purchase option. We do not conduct a formal credit investigation of each customer. We do require a potential customer to provide store management with sufficient personal information to allow us to verify their residence and sources of income. References listed by the customer are also contacted to
6
verify the information containedthree years in the customer’s rental purchase order form. Rental payments are generally made in the store or by telephone. We accept cashperiod ended December 31, 2011, furniture and credit or debit cards. Approximately 84%accessories accounted for approximately 34% of our agreements are on a weekly term. Depending on state regulatory requirements, we may chargeconsolidated store rental revenue, consumer electronic products for the reinstatement of terminated accounts or collect a delinquent account fee,32%, and collect loss/damage waiver fees from customers desiring product protection in case of theft or certain natural disasters. These fees are standard in the industryappliances and may be subject to government-specified limits. Please read the section entitled “— Government Regulation — Rental Purchase Transactions.”
computers for 17% each.Product Turnover
On average, a minimum rental term of 1815 months or exercising an early purchase option is generally required to obtain ownership of new merchandise. ApproximatelyA product’s initial rental period and each re-rental period is considered product turnover. On average, a product is rented (turned over) three times before a customer acquires ownership. Ownership is attained in approximately 25% of our initial rental purchase agreements are taken toin the full term of the agreement.Core U.S. segment. The average total life for each product in our system is approximately 2016 months, which includes the initial rental period, all re-rental periods and idle time in our system. To cover the relatively highhigher operating expenses generated by greater product turnover and the key features of rental purchase transactions, rental purchase agreements require higher aggregate payments than are generally charged under other types of purchase plans, such as installment purchase or credit plans.
Customer ServiceCollections
We generally offer same day or24-hour delivery and installation of our merchandise at no additional cost to the customer. We provide any required service or repair without additional charge, except for damage in excess of normal wear and tear. Repair services are provided through our national network of 24 service centers, the cost of which may be reimbursed by the vendor if the item is still under factory warranty. If the product cannot be repaired at the customer’s residence, we provide a temporary replacement while the product is being repaired. Generally, the customer is fully liable for damage, loss or destruction of the merchandise, unless the customer purchases an optional loss/damage waiver covering the particular loss. Most of the products we offer are covered by a manufacturer’s warranty for varying periods which, subject to the terms of the warranty, is transferred to the customer in the event that the customer obtains ownership.
Collections
Store managers use our management information system to track collections on a daily basis. For fiscal years 2009, 2008, and 2007, the average week ending past due percentages were 6.50%, 6.38% and 6.43%, respectively. OurGenerally, our goal wasis to have no more than 5.99% of our rental agreements past due one day or more each Saturday eveningevening. For fiscal years 2011, 2010, and 2009, the average week ending past due percentages in the three years. For the 2010 fiscal year, our goal remains the same at 5.99%.Core U.S. stores were 7.07%, 6.90% and 6.50%, respectively. If a customer fails to make a rental payment when due, store personnel will attempt to contact the customer to obtain payment and reinstate the agreement, or will terminate the account and arrange to regain possession of the merchandise. We attempt to recover the rental items as soon as possible following termination or default of a rental purchase agreement, generally by the seventh day. Collection efforts are enhanced by the personal and job-related references required of customers, the personal nature of the relationships between storeour employees and customers, and the fact that, following a period in whichavailability of lifetime reinstatement.
If a customer is temporarily unable to make payments onin a piece of rental merchandise and must return the merchandise, that customer generally may re-rent a piece of merchandise of similar type and age on the terms the customer enjoyed prior to that period.
Pursuant to the rental purchase agreements, customers who become delinquent in their rental payments and fail to return the rented merchandise are or may over time become liable for accrued rent through the date the merchandise is finally returned or the amount of the early purchase option or, if the merchandise is not returned before expiration of the original term of weeks or months to ownership under the rental purchase agreement, then the total balance of payments necessary to acquire ownership of the merchandise. If the customerCore U.S. store does not return the merchandise or make payment, the remaining book value of the rental merchandise associated with delinquent accounts is generally charged off on or before the ninetieth90th day following the time the account became past due. Charge offs in our rental stores due to customer stolen merchandise in our Core U.S. stores, expressed as a percentage of rental store revenues, were approximately 2.5% in 2011, and 2.3% in 2009, 2.5% in 2008each of 2010 and 2.8% in 2007.
72009.
Management
We organize our network of stores geographically with multiple levels of management. At the individual store level, each store manager is responsible for customer and account relations, delivery and collection of merchandise, inventory management, staffing, training store personnel and certain marketing efforts. Two times each week, store management is required to count the store’s inventory on hand and compare the count to our accounting records, with the district manager performing a similar count at least quarterly. In addition, our individual store managers track their daily store performance for revenue collected as compared to the projected performance of their store. Each store manager reports to a district manager within close proximity who typically oversees six to eight stores. Typically, a district manager focuses on developing the personnel in his or her district and ensuring all stores meet our quality, cleanliness and service standards. In addition, a district manager routinely audits numerous areas of the stores’ operations. A significant portion of a district manager’s and store manager’s compensation is dependent upon store revenues and profits.
At December 31, 2009, we had 477 district managers who, in turn, reported to 74 regional directors. Regional directors monitor the results of their entire region, with an emphasis on developing and supervising the district managers in their region. Similar to the district managers, regional directors are responsible for ascertaining whether stores are following the operational guidelines. The regional directors report to ten division vice presidents located throughout the country. The regional directors receive a significant amount of their compensation based on the revenue and profitability of the stores under their management.
Our executive management team includingaverages over 20 years of rent-to-own or similar retail experience and has demonstrated the ability to grow and manage our division vice presidents, oversees field operations, with an overallbusiness through their operational leadership and strategic focus. The executive management team directs and coordinates advertising, purchasing, financial planning and controls, employee training, personnel matters, acquisitions and new store initiatives. The centralization and coordination of such operational matters allows our store managers to focus on individual store performance. A significant portion of our executive management compensation is determined by the profits generated by us.
Management Information Systems
Through a licensing agreement with High Touch, Inc., we utilize an integrated management information and control system. Each store is equipped with a computer system utilizing point of sale software developed by High Touch. This system tracks individual components of revenue, each item in idle and rented inventory, total items on rent, delinquent accounts, items in service and other account information. We electronically gather each day’s activity report, which provides our executive management with access to all operating and financial information concerning any of our stores, markets or regions and generates management reports on a daily, weekly,month-to-date andyear-to-date basis for each store and for every rental purchase transaction. The system enables us to track all of our merchandise and rental purchase agreements, which often include more than one unit of merchandise.vision. In addition, our bank reconciliation system performsregional and district managers have long tenures with us, and we have a daily sweephistory of available fundspromoting management personnel from our stores’ depository accounts into our central operating account based on a formula that enableswithin. We believe this extensive industry and company experience will allow us to meet store operating needs while effectively utilizing excess cash. Our system also includes extensive management software, report-generating capabilitiesexecute our domestic and a virtual private network. The virtual private network allows us to communicate with the stores more effectively and efficiently. Utilizing the management information system, our executive management, division vice presidents, regional directors, district managers and store managers closely monitor the productivity of stores under their supervision according to our prescribed guidelines. We are currently investing in the development of new point of sale systems and processes to further enhance our management information system.
The integration of our management information system, developed by High Touch, with our accounting system, developed by Lawson Software, Inc., facilitates the production of our internal financial statements. These financial statements are distributed monthly to all stores, markets, regions and our executive management team for their review.
international growth strategies.Purchasing and Distribution
We recently completed the implementation ofutilize a centralized inventory management system includingthat includes automated merchandise replenishment. Our new automated replenishment system uses perpetual inventory records to
8
analyze individual store requirements, as well as other pertinent information such as delivery and return forecasts, blanket orders, predetermined inventory levels, and vendor performance, to generate recommended merchandise order information. These recommended orders are reviewed by the store manager and delivered electronically to our vendors. The stores also have online access to determine whether other stores in their market may have merchandise available. All merchandise is shipped by vendors directly to each store, where it is held for rental. We do not utilize any distribution centers. These systems and procedures allowThis centralized inventory management system allows us to retain tight control over our inventory, improve the diversity and assortment of merchandise in our stores, and assist us in having the right products available at the right time. In addition, these systems requirethis centralized inventory management system requires less involvement by our store employees resulting in more time available for customer service and sales activities.
We purchase the majority of ourAll merchandise from manufacturers, who shipis shipped by vendors directly to each store. Our largest suppliers include WhirlpoolCore U.S. and Ashley who accountedCanadian store, where it is held for rent. We do not utilize any distribution centers in the United States or Canada. In Mexico, we are using distribution centers to manage inventory flow among stores.
In our Core U.S. and International segments, we purchase our rental merchandise from a variety of manufacturers and distributors. In 2011, approximately 16.4%12.3% and 15.6%11.7%, respectively, of merchandise purchased in 2009.purchases were attributable to Ashley and Whirlpool. No other manufacturerbrand accounted for more than 10% of merchandise purchased during this period. We do not generally enter into written contracts with our suppliers that obligate us to meet certain minimum purchasing levels. Although we expect to continue relationships with our existing suppliers, we believe there are numerous sources of products available, and we do not believe the success of our operations is dependent on any one or more of our present suppliers.
In our RAC Acceptance segment, we purchase the merchandise selected by the customer from the applicable third-party retailer at the time such customer enters into a rental purchase agreement with us.
With respect to our ColorTyme segment, the franchise agreement requires the franchised stores to exclusively offer for rent or sale only those brands, types and models of products that ColorTyme has approved. The franchised stores are required to maintain an adequate mix of inventory that consists of approved products for rent as dictated by ColorTyme policy manuals. ColorTyme negotiates purchase arrangements with various suppliers it has approved. ColorTyme’s largest suppliers are Ashley and Whirlpool, which accounted for approximately 19.3% and 12.6% of merchandise purchased by ColorTyme in 2011, respectively.
Marketing
We promote theour products and services in our stores through television and radio commercials, print advertisements, Internet sites, direct response and store signage, all of which are designed to increase our name recognition among our customers and potential customers. Our advertisements emphasize such features as product and name-brand selection, prompt delivery, price match, service at no extra cost, lifetime reinstatement and the absence of initial deposits, credit investigations or long-term obligations. In addition, we promote the “RAC Worry-Free Guarantee®” to further highlight these aspects of therent-to-own transaction. We believe that as theRent-A-Center name gains familiarity and national recognition through our advertising efforts, we will continue to educate our customers and potential customers about therent-to-own alternative to merchandise purchasescredit as well as solidify our reputation as a leading provider of high quality branded merchandise and services.
Advertising expense as a percentage of store revenue for the years ended December 31, 2011, 2010 and 2009 2008 and 2007 was approximately 2.9%2.7%, 2.9% and 2.8%, respectively.2.9%. As we obtain new stores in our existing market areas, the advertising expenses of each store in the market can generally be reduced by listing all stores in the same market-wide advertisement.
ColorTyme has established national advertising funds for the franchised stores, whereby ColorTyme has the right to collect up to 3% of the monthly gross revenue from each franchisee as contributions to the fund. Currently, ColorTyme has set the monthly franchisee contribution at $250 per store per month. ColorTyme directs the advertising programs of the fund, generally consisting of advertising in print, television and radio. ColorTyme also has the right to require franchisees to expend up to 3% of their monthly gross revenue on local advertising.
Industry & Competition
Therent-to-own industry is highly competitive. According to the Association of Progressive Rental Organizations (“APRO”), the rent-to-own industry sourcesin the United States and our estimates,Canada consists of approximately 8,600 stores and serves approximately 4.1 million households. We estimate that the two largest rent-to-own industry participants account for approximately 4,900 of the8,500 total number of stores, and the majority of the remainder of the industry consists of operations with fewer than 50 stores. The rent-to-own industry is highly fragmented and has experienced significant consolidation. We believe this consolidation trend in the industry will continue, presenting opportunities for us to continue to acquire additional stores or customer accounts on favorable terms.
The rent-to-own industry serves a highly diverse customer base. According to APRO, approximately 83% of rent-to-own customers have household incomes between $15,000 and $50,000 per year. The rent-to-own industry serves a wide variety of customers by allowing them to obtain merchandise that they might otherwise be unable to obtain due to insufficient cash resources or a lack of access to credit. We believe the number of consumers lacking access to credit is increasing. According to a report issued by the Fair Isaac Corporation on July 13, 2010, consumers in the “subprime” category (those with credit scores below 650) made up 35% of the United States and Canada. We are the largest operator in thepopulation.
The rent-to-own industry with 3,007 stores and 210 franchised locations as of December 31, 2009.is highly competitive. Our stores compete with other national, regional and localrent-to-own businesses, as well as with rental stores that do not offer their customers a purchase option. With respect to customers desiring to purchase merchandise for cash or on credit, we also compete with retail stores. Competition is based primarily on store location, product selection and availability, customer service, and rental rates and terms.
Our revenue mix is moderately seasonal, with the first quarter of each fiscal year generally providing higher merchandise sales than any other quarter during a fiscal year, primarily related to federal income tax refunds. Generally, our customers will more frequently exercise the early purchase option on their existing rental purchase agreements or purchase pre-leased merchandise off the showroom floor during the first quarter of each fiscal year. We expect this trend to continue in future periods. Furthermore, we tend to experience slower growth in the number of rental purchase agreements in the third quarter of each fiscal year when compared to other quarters throughout the year. As a result, we would expect revenues for the third quarter of each fiscal year to remain relatively flat with
9
the prior quarter. We expect this trendthese trends to continue in future periods unless we add significantly to our store base during the third quarter of future fiscal years as a result of new store openings or opportunistic acquisitions.
Retail Store Operations
As of December 31, 2009, we operated 39 stores utilizing a retail model which generates installment credit sales through a retail sale transaction. Twenty-three of these stores operate under the name “Get It Now” and 16 stores under the name “Home Choice.” Our retail stores are located in Illinois, Minnesota and Wisconsin.
ColorTyme Operations
ColorTyme is our nationwide franchisor ofrent-to-own stores. At December 31, 2009, ColorTyme franchised 210 stores in 33 states. Theserent-to-own stores primarily offer high quality durable products such as home electronics, appliances, computers and furniture and accessories. During 2009, 12 new franchise locations were added, 17 were sold (all of which we purchased) and seven stores closed.
All of the ColorTyme franchised stores use ColorTyme’s trade names, service marks, trademarks and logos. All stores operate under distinctive operating procedures and standards. ColorTyme’s primary source of revenue is the sale of rental merchandise to its franchisees who, in turn, offer the merchandise to the general public for rent or purchase under arent-to-own program. As franchisor, ColorTyme receives royalties of 2.0% to 5.0% of the franchisees’ monthly gross revenue and, generally, an initial fee up to $20,000 per new location for existing franchisees and up to $25,000 per location for new franchisees.
The ColorTyme franchise agreement generally requires the franchised stores to utilize specific computer hardware and software for the purpose of recording rentals, sales and other record keeping and central functions. ColorTyme retains the right to retrieve data and information from the franchised stores’ computer systems. The franchise agreements also limit the ability of the franchisees to compete with other franchisees and provides us a right of first refusal to purchase the franchise location of a ColorTyme franchisee that wishes to exit the business.
The franchise agreement also requires the franchised stores to exclusively offer for rent or sale only those brands, types and models of products that ColorTyme has approved. The franchised stores are required to maintain an adequate mix of inventory that consists of approved products for rent as dictated by ColorTyme policy manuals. ColorTyme negotiates purchase arrangements with various suppliers it has approved. ColorTyme’s largest suppliers are Ashley and Whirlpool, which accounted for approximately 19.5% and 14.5% of merchandise purchased by ColorTyme in 2009, respectively.
ColorTyme franchisees may also offer financial services, such as short term secured and unsecured loans, in addition to traditionalrent-to-own products. In addition, some of ColorTyme’s franchised stores offer custom rims and tires for sale or rental under the trade names “RimTyme” or “ColorTyme Custom Wheels.” As of December 31, 2009, 42 ColorTyme stores operated by 15 separate franchisees offered financial services. Fourteen ColorTyme stores operated by five separate franchisees offered tires and rims exclusively.
ColorTyme is a party to an agreement with Wells Fargo Foothill, Inc. (“Wells Fargo”), who provides $35.0 million in aggregate financing to qualifying franchisees of ColorTyme generally up to five times their average monthly revenues. Under the Wells Fargo agreement, upon an event of default by the franchisee under agreements governing this financing and upon the occurrence of certain other events, Wells Fargo can assign the loans and the collateral securing such loans to ColorTyme, with ColorTyme paying the outstanding debt to Wells Fargo and then succeeding to the rights of Wells Fargo under the debt agreements, including the right to foreclose on the collateral. The Wells Fargo agreement expires on September 30, 2010. An additional $20.0 million of financing is provided by Texas Capital Bank, National Association (“Texas Capital Bank”) under an agreement similar to the Wells Fargo financing.Rent-A-Center East, Inc., a subsidiary ofRent-A-Center, guarantees the obligations of ColorTyme under each of these agreements, excluding the effects of any amounts that could be recovered under collateralization provisions, up to a maximum amount of $55.0 million, of which $19.5 million was outstanding as of December 31, 2009.
ColorTyme has established national advertising funds for the franchised stores, whereby ColorTyme has the right to collect up to 3% of the monthly gross revenue from each franchisee as contributions to the fund. Currently,
10
ColorTyme has set the monthly franchisee contribution at $250 per store per month. ColorTyme directs the advertising programs of the fund, generally consisting of advertising in print, television and radio. ColorTyme also has the right to require franchisees to expend 3% of their monthly gross revenue on local advertising.
ColorTyme licenses the use of its trademarks and service marks to its franchisees under the franchise agreement. ColorTyme owns various trademarks and service marks, including ColorTyme®, RimTyme®, and Your Hometown ColorTyme®, that are used in connection with its operations and have been registered with the United States Patent and Trademark office. The duration of these marks is unlimited, subject to periodic renewal and continued use.
Some of ColorTyme’s franchisees may be in locations where they directly compete with our company-owned stores, which could negatively impact the business, financial condition and operating results of our company-owned stores.
Financial Services Operations
We offer financial services products, such as short term secured and unsecured loans, debit cards, check cashing, tax preparation and money transfer services under the trade names “RAC Financial Services” and “Cash AdvantEdge” within certain of our existingRent-A-Center store locations. As of December 31, 2009, we offered some or all of these financial services products in 353Rent-A-Center store locations in 17 states. We continue to focus our resources on improving the operations in these existing financial services store locations and expect to have approximately 400Rent-A-Center store locations offering financial services by the end of 2010.
Stores offering financial services products in addition to traditionalrent-to-own products generally require one to two additional employees. Management of our financial services business is integrated with ourrent-to-own operations, with six financial services regional directors and 40 financial services district managers reporting to our division vice presidents.
Our financial services business operates in a highly competitive industry. Similar financial services products are offered by large regional or national entities, smaller independent outlets and pawnshops. Competitive factors include location, service, maximum loan amount, repayment options and fees.
Trademarks
We own various trademarks and service marks, including Rent-A-CenterRent-A-Center®, and RAC Worry-Free Guarantee® that are used in connection with our operations and have been registered with the United States Patent and Trademark Office. The duration of our trademarks is unlimited, subject to periodic renewal and continued use. In addition, we have obtained trademark registrations in Canada.Canada, Mexico, and certain other foreign jurisdictions. We believe we hold the necessary rights for protection of the trademarks and service marks essential to our business. The products held for rent in our stores also bear trademarks and service marks held by their respective manufacturers.
ColorTyme licenses the use of its trademarks and service marks to its franchisees under the franchise agreement. ColorTyme owns various trademarks and service marks, including ColorTyme®, RimTyme®, and Your Hometown ColorTyme®, that are used in connection with its operations and have been registered with the United States Patent and Trademark office. The duration of these marks is unlimited, subject to periodic renewal and continued use.
Employees
As of February 19, 2010,17, 2012, we had approximately 17,40019,700 employees, of whom 600694 are assigned to our headquarters and the remainder of whom are directly involved in the management and operation of our stores and service centers. The employees of the ColorTyme franchisees are not employed by us. While we have experienced limited union activity in the past, none of our employees are currently covered by a collective bargaining agreement. We believe relationships with our employees are generally good.
Core U.S. & RAC Acceptance
Rental Purchase Transactions
State Regulation
Regulation.Currently, 46 states, the District of Columbia and Puerto Rico have legislationrental purchase statutes that recognize and regulate rental purchase transactions as separate and distinct from credit sales. We believe this existing legislation is generally favorable to us, as it defines and clarifies the various disclosures, procedures and transaction structures
11
related to therent-to-own business with which we must comply. With some variations in individual states, most related state legislation requires the lessor to make prescribed disclosures to customers about the rental purchase agreement and transaction, and provides time periods during which customers may reinstate agreements despite having failed to make a timely payment. Some state rental purchase laws prescribe grace periods for non-payment, prohibit or limit certain types of collection or other practices, and limit certain fees that may be charged. Ten states limit the total rental payments that can be charged to amounts ranging from 2.0 times to 2.4 times the disclosed cash price or the retail value of the rental product.
Four states limit the cash price of merchandise to amounts ranging from 1.56 to 2.5 times our cost for each item.Although Minnesota has a rental purchase statute, the rental purchase transaction is also treated as a credit sale subject to consumer lending restrictions pursuant to judicial decision. Therefore, we offer our customers in Minnesota an opportunity to purchase our merchandise through an installment sale transaction in our Home Choice stores. We operate eight13 Home Choice stores in Minnesota.
North Carolina has no rental purchase legislation. However, the retail installment sales statute in North Carolina expressly provides that lease transactions which provide for more than a nominal purchase price at the end of the agreed rental period are not credit sales under the statute. We operate 129125 rent-to-own stores and 38 RAC Acceptance locations in North Carolina.
Courts in Wisconsin and New Jersey, which do not have rental purchase statutes, have rendered decisions which classify rental purchase transactions as credit sales subject to consumer lending restrictions. Accordingly, in Wisconsin, we offer our customers an opportunity to purchase our merchandise through an installment sale transaction in our Get It Now stores. In New Jersey, we have modified our typical rental purchase agreements to provide disclosures, grace periods, and pricing that we believe conform with the retail installment sales act. We operate 2326 Get It Now stores in Wisconsin and 44Rent-A-Center stores in New Jersey.
Legislation has been introduced in New York from time to time that would significantly amend that state’s existing rental purchase statute. Recently introduced bills would impose significant pricing restrictions in New York and, if enacted as proposed, would have a material and adverse impact on our operations in New York. While predecessors of these bills have not received widespread support from members of either body of New York’s legislature, we are unable to assure you that such adverse legislation will not be enacted in the future. We operate 176 stores in New York.
Federal LegislationRegulation.
To date, no comprehensive federal legislation has been enacted regulating or otherwise impacting the rental purchase transaction. The Dodd-Frank Wall Street Reform and Consumer Protection Act (“Dodd-Frank Act”) does not regulate leases with terms of 90 days or less. Because the rent-to-own transaction is for a term of week to week, or at most, month to month, it is not covered by the Dodd-Frank Act. Established federal law deems the term of a lease to be its minimum term regardless of extensions or renewals, if any. We do, however, comply with the Federal Trade Commission recommendations for disclosure in rental purchase transactions.
In certain states, we utilize a form of consumer lease rather than our typical rental purchase agreement. Our consumer lease differs from a rental purchase agreement primarily in that it has an initial lease term exceeding four months. As a result of this difference, our consumer lease is governed by federal and state laws and regulations other than the applicable state rental purchase statute. The federal regulations applicable to the consumer lease require certain disclosures similar to the rent-to-own statutes, but are generally less restrictive as to pricing and other charges. Since the initial term of our consumer lease exceeds 90 days, this consumer lease is subject to regulation by the Consumer Financial Protection Agency established under the Dodd-Frank Act. We currently utilize this consumer lease in two states.
From time to time, we have supported legislation introduced in Congress that would regulate the rental purchase transaction. While both beneficial and adverse legislation may be introduced in Congress in the future, any adverse federal legislation, if enacted, could have a material and adverse effect on us.
There can be no assurance as to whether new or revised rental purchase laws will be enacted or whether, if enacted, the laws would not have a material and adverse effect on us.
Financial ServicesInternational
Our financial services business is subject to regulation and supervision primarily atNo comprehensive legislation regulating the state and federal levels.rent-to-own transaction has been enacted in Canada or Mexico. We intend to offer our financial services products onlyuse substantially the same rental purchase transaction in those jurisdictions with favorable regulatory environments.
In those jurisdictions where we make consumer loans directly to consumers (currently all states in which we offer financial services other than Texas), we are a licensed lender where required and are subject to various state regulations regarding the terms of our short term consumer loans and our policies, procedures and operations relating to those loans. Typically, state regulations limit the amount that we may lend to any consumer and, in some cases, the number of loans or transactions that we may make to any consumer at one time orcountries as in the course of a year. These state regulations also typically restrict the amount of finance charges thatCore U.S. stores, but with such additional provisions as we believe may assess in connection with any loan or transaction and may limit a customer’s abilitybe necessary to renew or “rollover” a loan.
12
We operate our financial services business in Texas under the Texas Credit Services Organization law which requires that we register as a Credit Services Organization (“CSO”) with the Texas Secretary of State, pay a registration fee and post surety bonds for each location. The CSO may, for a fee, help a consumer obtain an extension of credit from an independent third-party lender. We must also comply with various disclosure requirements, which include providing the consumer with a disclosure statementsuch country’s specific laws and contract that detail the services to be performed by the CSO and the total cost of those services along with various other items. Additionally, the CSO must give a consumer the right to cancel the credit services agreement without penalty within three days after the agreement is signed.
We are subject to regulations in several jurisdictions in which we operate that require the registration or licensing of check cashing companies or regulate the fees that check cashing companies may impose. In some of these jurisdictions, we may be required to file fee schedules with the state or conspicuously post the fees charged for cashing checks at each branch. In some cases, we are required to meet minimum bond or capital levels and are subject to record-keeping requirements. We are licensed in each of the states or jurisdictions in which a license is currently required for us to operate as a check cashing company and have filed our schedule of fees with each of the states or other jurisdictions in which such a filing is required.
In addition, our financial services business is subject to federal statutes and regulations such as the USA Patriot Act, the Equal Credit Opportunity Act, the Fair Credit Reporting Act, the Truth in Lending Act, the Gramm-Leach-Bliley Act, the Fair Debt Collection Practices Act, the Anti-Money Laundering Act, and similar state laws.
Legislative activity with respect to the financial services industry at the state and federal level continues to be significant. Both favorable and adverse legislation has been introduced in a number of states as well as in Congress. There can be no assurance as to whether new or revised financial services laws will be enacted or whether, if enacted, the laws would not have a material and adverse effect on us.
customs.You should carefully consider the risks described below before making an investment decision. We believe these are all the material risks currently facing our business. Our business, financial condition or results of operations could be materially adversely affected by these risks. The trading price of our common stock could decline due to any of these risks, and you may lose all or part of your investment. You should also refer to the other information included in this report, including our consolidated financial statements and related notes.
Future revenue and earnings growth depends on our ability to identify and execute newour growth strategies.
We have a matureOur Core U.S. store base.base is mature. As a result, our same store sales have increased more slowly than in historical periods, or in some cases, decreased. Our future growth will require thatAccordingly, we successfully increase revenue inare focused on acquiring new customers through sources other than our existing U.S. rent-to-own stores, as well as seek to identifyseeking additional distribution channels for our products and services. Our primary growth strategies are our RAC Acceptance and International segments. Effectively managing growth can be challenging, particularly as we continue to expand into channels outside our traditional rent-to-own store model and expand internationally. This growth places significant demands on management and operational systems. If we are unable to identifysuccessfully execute these growth strategies, our revenue and successfully implement these strategic growth initiatives, our earnings may grow more slowly or even decrease.
If we fail to effectively manageWe are highly dependent on the growth, integration and profitabilityfinancial performance of our Core U.S. operating segment.
Our financial services business, we may not realize the economic benefitperformance is highly dependent on our Core U.S. segment, which comprised approximately 91% of our consolidated net revenues and substantially all of our net earnings for the year ended December 31, 2011. Any significant decrease in the financial investmentperformance of the Core U.S. segment may also have a material adverse impact on our ability to implement our growth strategies.
Our RAC Acceptance segment depends on the success of our third-party retail partners and our continued relationship with them.
Our RAC Acceptance segment revenues depend in part on the ability of unaffiliated third-party retailers to attract customers. In addition, in most cases, our agreements with such operations.
We face risks associatedthird-party retailers may be terminated at the retailer’s election. The failure of our third-party retail partners to maintain quality and consistency in their operations and their ability to continue to provide products and services, or the loss of the relationship with integratingany of these third-party retailers and an inability to replace them, could cause our RAC Acceptance segment to lose customers, substantially decreasing the revenues and earnings of our RAC Acceptance segment. This could adversely affect our financial services business intoresults and slow our existing operations, including further developmentoverall growth. In 2011, approximately 28.9% of information technologythe total revenue of the RAC Acceptance segment originated at our RAC Acceptance kiosks located in stores operated by a nationwide furniture retailer and financial reporting systems. In addition, a newly opened financial services location generally does not attain positive cash flow during68 of its first yearlicensees, collectively. An additional approximately 37.3% of operations. Also, the financial services industry is highly competitive and regulatedtotal revenues in the RAC Acceptance segment in 2011 was generated by federal, state and local laws.
Our expansion intoour RAC Acceptance kiosks located in stores operated by three of our other third-party retail partners. We may be unable to continue growing the
financial services business could place a significant demand on our management and our financial and operational resources. IfRAC Acceptance segment if we are unable to
effectively implementfind third-party retailers willing to partner with us or if we are unable to enter into agreements with third-party retailers acceptable to us.Our operations in Canada and Mexico are subject to political or regulatory changes and significant changes in the economic environment and other concerns.
We entered the Canadian market in 2004 and operated 28 stores in Canada as of December 31, 2011. We opened our first store in Mexico in October 2010, and operated 52 stores in Mexico as of December 31, 2011. Our growth plans include significant expansion in our International segment. Changes in the business, regulatory or political climate in Canada or Mexico could adversely affect our operations in those countries, which could negatively impact our growth plans. Mexico is also subject to other potential risks and uncertainties that are beyond our control, such as violence, social unrest, enforcement of property rights and public safety and security that could restrict or eliminate our ability to open new or operate some or all of our locations in Mexico, or significantly reduce customer traffic or demand.
A significant change in foreign currency exchange rates could adversely affect our cash flow or financial performance.
We have operations in Canada and Mexico. Our assets, investments in, earnings from and dividends from each of these must be translated to U.S. dollars from their respective functional currencies of the Canadian dollar and Mexican peso. Accordingly, we are exposed to risks associated with the fluctuations of these foreign currencies. Such foreign currency exchange rates and fluctuations may have an impact on our future costs or on future cash flows from our international operations, and could adversely affect our financial services business,performance.
Our continued expansion into international markets presents unique challenges which may subject us to risks associated with the legislative, judicial, accounting, regulatory, political, cultural and economic factors specific to the countries or regions in which we may not realizeoperate in the operational benefitsfuture, which could adversely affect our anticipated growth.
Expansion of our investmentInternational segment, including into new international markets, is one of our primary growth objectives. As these operations grow, they may require greater management and financial resources. International operations require the integration of personnel with varying cultural and business backgrounds and an understanding of the relevant differences in the cultural, legal and regulatory environments. In addition, these operations are subject to the potential risks of changing economic and financial services business that we currently expect.
13
Rent-to-ownOur transactions are regulated by law in most states.and subject to the requirements of various federal and state laws and regulations, which may require significant compliance costs and expose us to litigation. Any adversenegative change in these laws or the passage of adverseunfavorable new laws could expose us to litigation or require us to alter our business practices.
As is the case with most businesses, we are subjectpractices in a manner that may be materially adverse to
various governmental regulations, including in our case, regulations specifically regardingrent-to-ownus. transactions. Currently, 46 states, the District of Columbia and Puerto Rico have passed laws that regulate rental purchase transactions as separate and distinct from credit sales. One additional state has a retail installment sales statute that excludes leases, includingrent-to-own transactions, from its coverage if the lease provides for more than a nominal purchase price at the end of the rental period. The specific rental purchase laws generally require certain contractual and advertising disclosures. They also provide varying levels of substantive consumer protection, such as requiring a grace period for late fees and contract reinstatement rights in the event the rental purchase agreement is terminated. The rental purchase laws of ten states limit the total amount that may be charged over the life of a rental purchase agreement and the laws of four states limit the cash prices for which we may offer merchandise. Most states also regulate
Our consumer lease is governed by federal and state laws and regulations other than the applicable state rental purchase statute. The federal regulations applicable to the consumer lease require certain disclosures similar to the rent-to-own statutes, but are generally less restrictive as to pricing and other charges. Since the initial term of our consumer lease exceeds 90 days, this consumer lease is subject to regulation by the Consumer Financial Protection Agency established under the Dodd-Frank Act. We currently utilize this consumer lease in two states.
Similar to other consumer transactions, our rental purchase and consumer lease transactions are also governed by various federal and state consumer protection statutes. These consumer protection statutes, as well as other consumer transactions, under various consumer protection statutes. Thethe rental purchase statutes and other consumer protection statutesunder which we operate, provide various consumer remedies, including monetary penalties, for violations. In our history, we have been the subject of litigation alleging that we have violated some of these statutory provisions.
Although there is currently no comprehensive federal legislation regulating rental purchase transactions, adverse federal legislation may be enacted in the future. From time to time, both favorable and adverse
legislation seeking to regulate our business has been introduced in Congress. In addition, various legislatures in the states where we currently do business may adopt new legislation or amend existing legislation that could require us to alter our business practices.
Financial services transactions are regulated by federal law as well as the laws of certain states. Any adverse changes in these laws or the passage of adverse new laws with respect to the financial services business could slow our growth opportunities, expose us to litigation or alter our business practices in a manner that we may deem to be unacceptable.
Our financial services business is subject to federal statutes and regulations such as the USA Patriot Act, the Equal Credit Opportunity Act, the Fair Credit Reporting Act, the Truth in Lending Act, the Gramm-Leach-Bliley Act, the Fair Debt Collection Practices Act, the Anti-Money Laundering Act, and similar state laws. In addition, we are subject to various state regulations regarding the terms of our short term consumer loans and our policies, procedures and operations relating to those loans, including the fees we may charge, as well as fees we may charge in connection with our other financial services products. The failure to comply with such regulations may result in the imposition ofcould have a material fines, penalties, or injunctions. Congressand/or the various legislatures in the states where we currently operate or intend to offer financial services products may adopt new legislation or amend existing legislation with respect to our financial services business that could require us to alteradverse effect on our business, practices in a manner that we may deem to be unacceptable, which could slow our growth opportunities.
financial condition and results of operations.We may be subject to legal proceedings from time to time which seek material damages. The costs we incur in defending ourselves or associated with settling any of these proceedings, as well as a material final judgment or decree against us, could materially adversely affect our financial condition by requiring the payment of the settlement amount, a judgment or the posting of a bond.
In our history, we have defended class action lawsuits alleging various regulatory violations and have paid material amounts to settle such claims. Significant settlement amounts or final judgments could materially and adversely affect our liquidity. The failure to pay any material judgment would be a default under our senior credit facilities.
14
Our senior credit facilitiesoperations are dependent on effective management information systems. Failure of these systems could negatively impact our ability to manage store operations, which could have a material adverse effect on our business, financial condition and results of operations.We utilize integrated management information and control systems. The efficient operation of our business is dependent on these systems to effectively manage our financial and operational data. The failure of our information systems to perform as designed, loss of data or any interruption of our information systems for a significant period of time could disrupt our business. If the information systems sustain repeated failures, we may not be able to manage our store operations, which could have a material adverse effect on our business, financial condition and results of operations.
We are currently investing in the development of new point of sale systems and processes to further enhance our management information system. Such enhancements to or replacement of our management information system could have a significant impact on our ability to conduct our core business operations and increase our risk of loss resulting from disruptions of normal operating processes and procedures that may occur during the implementation of new technology. We can make no assurances that the costs of investments in our new point of sale systems and processes will not exceed estimates, that such systems and processes will be implemented without material disruption, or that such systems and processes will be as beneficial as predicted. If any of these events occur, our results of operations could be harmed.
If we fail to protect the integrity and security of customer and employee information, we could be exposed to litigation or regulatory enforcement and our business could be adversely impacted.
We collect and store certain personal information provided to us by our customers and employees in the ordinary course of our business. Despite instituted safeguards for the protection of such information, we cannot be certain that all of our systems are entirely free from vulnerability to attack. Computer hackers may attempt to penetrate our network security and, if successful, misappropriate confidential customer or employee information. In addition, one of our employees, contractors or other third party with whom we do business may attempt to circumvent our security measures in order to obtain such information, or inadvertently cause a breach involving such information. Loss of customer or employee information could disrupt our operations, damage our reputation, and expose us to claims from customers, employees, regulators and other persons, any of which could have an adverse effect on our business, financial condition and results of operations. In addition, the costs associated with information security, such as increased investment in technology, the costs of compliance with privacy laws, and costs incurred to prevent or remediate information security breaches, could adversely impact our business.
Our debt agreements impose restrictions on us which may limit or prohibit us from engaging in certain transactions. If a default were to occur, our lenders could accelerate the amounts of debt outstanding, and holders of our secured indebtedness could force us to sell our assets to satisfy all or a part of what is owed.
Covenants under our senior credit facilities and the indenture governing our outstanding senior unsecured notes restrict our ability to pay dividends and engage in various operational matters, as well asmatters. In addition, covenants under our senior credit facilities require us to maintain specified financial ratios. Our ability to meet these financial ratios may be affected by events beyond our control. These restrictions could limit our ability to obtain future financing, make needed capital expenditures or other investments, repurchase our outstanding debt or equity, pay dividends, withstand a future downturn in our business or in the economy, dispose of operations, engage in mergers, acquire additional stores or otherwise conduct necessary corporate activities. Various transactions that we may view as important opportunities, such as specified acquisitions, are also subject to the consent of lenders under the senior credit facilities, which may be withheld or granted subject to conditions specified at the time that may affect the attractiveness or viability of the transaction.
If a default were to occur, the lenders under our senior credit facilities could accelerate the amounts outstanding under the credit facilities. In addition, the lenders under these agreements could terminate their commitments to lend to us. If the lenders under these agreements accelerate the repayment of borrowings, we may not have sufficient liquid assets at that time to repay the amounts then outstanding under our indebtedness or be able to find additional alternative financing. Even if we could obtain additional alternative financing, the terms of the financing may not be favorable or acceptable to us.
The existing indebtedness under our senior credit facilities is secured by substantially all of our assets. Should a default or acceleration of this indebtedness occur, the holders of this indebtedness could sell the assets to satisfy all or a part of what is owed.
A change of control could accelerate our obligation to pay our outstanding indebtedness, and we may not have sufficient liquid assets at that time to repay these amounts.
Under our senior credit facilities, an event of default would result if a third party became the beneficial owner of 35.0% or more of our voting stock or upon certain changes in the constitution ofRent-A-Center’s Board of Directors. As of December 31, 2009, $711.22011, $422.5 million was outstanding under our senior debt. credit facilities.
Under the indenture governing our outstanding senior unsecured notes, in the event of a change in control, we may be required to offer to purchase all of our outstanding senior unsecured notes at 101% of their original aggregate principal amount, plus accrued interest to the date of repurchase. A change in control also would result in an event of default under our senior credit facilities, which would allow our lenders to accelerate indebtedness owed to them.
If a specified change in control occurs and the lenders under our senior credit facilitiesdebt instruments accelerate these obligations, we may not have sufficient liquid assets to repay amounts outstanding under these agreements.
Rent-A-Center’s organizational documents and our senior credit facilitiesdebt instruments contain provisions that may prevent or deter another group from paying a premium over the market price toRent-A-Center’s stockholders to acquire its stock.
Rent-A-Center’s
organizational documents contain provisions that classify its Board of Directors, authorize its Board of Directors to issue blank check preferred stock and establish advance notice requirements on its stockholders for director nominations and actions to be taken at meetings of the stockholders. In addition, as a Delaware corporation,
Rent-A-Center is subject to Section 203 of the Delaware General Corporation Law relating to business combinations. Our senior credit facilities
and the indenture governing our senior unsecured notes each contain
various change of control provisions which, in the event of a change of control, would cause a default under those provisions. These provisions and arrangements could delay, deter or prevent a merger,
consolidation, tender offer or other business combination or change of control involving us that could include a premium over the market price ofRent-A-Center’s common stock that some or a majority ofRent-A-Center’s stockholders might consider to be in their best interests.
Rent-A-Center is a holding company and is dependent on the operations and funds of its subsidiaries.
Rent-A-Center
is a holding company, with no revenue generating operations and no assets other than its ownership interests in its direct and indirect subsidiaries. Accordingly,
Rent-A-Center is dependent on the cash flow generated by its direct and indirect operating subsidiaries and must rely on dividends or other intercompany transfers from its operating subsidiaries to generate the funds necessary to meet its obligations, including the obligations under the senior credit facilities. The ability of
Rent-A-Center’s subsidiaries to pay dividends or make
15
other payments to it is subject to applicable state laws. Should one or more ofRent-A-Center’s subsidiaries be unable to pay dividends or make distributions, its ability to meet its ongoing obligations could be materially and adversely impacted.
Our stock price is volatile, and you may not be able to recover your investment if our stock price declines.
The price of our common stock has been volatile and can be expected to be significantly affected by factors such as:
our ability to meet market expectations with respect to the growth and profitability of the RAC Acceptance and International segments;
quarterly variations in our results of operations, which may be impacted by, among other things, changes in same store sales or when and how many locations we acquire or open;
| | |
| • | quarterly variations in our results of operations, which may be impacted by, among other things, changes in same store sales, when and how manyrent-to-own stores we acquire or open, and the rate at which we add financial services to our existing stores; |
|
| • | quarterly variations in our competitors’ results of operations; |
|
| • | changes in earnings estimates or buy/sell recommendations by financial analysts; and |
|
| • | the stock price performance of comparable companies. |
quarterly variations in our competitors’ results of operations;
changes in earnings estimates or buy/sell recommendations by financial analysts; and
the stock price performance of comparable companies.
In addition, the stock market as a whole has experienced extreme price and volume fluctuations that have affected the market price of many specialty retailers in ways that may have been unrelated to these companies’ operating performance.
Failure to achieve and maintain effective internal controls could have a material adverse effect on our business and stock price.
Effective internal controls are necessary for us to provide reliable financial reports. If we cannot provide reliable financial reports, our brand and operating results could be harmed. All internal control systems, no matter how well designed, have inherent limitations. Therefore, even those systems determined to be effective can provide only reasonable assurance with respect to financial statement preparation and presentation.
While we continue to evaluate and improve our internal controls, we cannot be certain that these measures will ensure that we implement and maintain adequate controls over our financial processes and reporting in the future. Any failure to implement required new or improved controls, or difficulties encountered in their implementation, could harm our operating results or cause us to fail to meet our reporting obligations.
If we fail to maintain the adequacy of our internal controls, as such standards are modified, supplemented or amended from time to time, we may not be able to ensure that we can conclude on an ongoing basis that we have effective internal control over financial reporting in accordance with Section 404 of the Sarbanes-Oxley Act. Failure to achieve and maintain an effective internal control environment could cause investors to lose confidence in our reported financial information, which could have a material adverse effect on our stock price.
| |
| Item 1B. | Unresolved Staff Comments. |
We lease space for substantially all of our Core U.S. and International stores and service center locations, as well as regional offices,certain support facilities under operating leases expiring at various times through 2019.2021. Most of our store leases are five year leases and contain renewal options for additional periods ranging from three to five years at rental rates adjusted according toagreed-upon formulas. Store sizes range from approximately 1,2001,000 to 24,000 square feet, and average approximately 4,700 square feet. Approximately 75% of each store’s space is generally used for showroom space and 25% for offices and storage space.
We own the land and building at 5501 Headquarters Drive, Plano, Texas, in which our corporate headquarters are located. The land and improvements are pledged as collateral under our senior credit facilities.
16
We believe suitable store space generally is available for lease and we would be able to relocate any of our stores without significant difficulty should we be unable to renew a particular lease. We also expect additional space is readily available at competitive rates to open new stores.
We own the land and building at 5501 Headquarters Drive, Plano, Texas, in which our corporate headquarters are located. The land and improvements are pledged as collateral under our senior credit facilities.
| |
| Item 3. | Legal Proceedings. |
From time to time, we, along with our subsidiaries, are party to various legal proceedings arising in the ordinary course of business. In our history, we have defended class action lawsuits alleging various regulatory violations and have paid material amounts to settle such claims. We accruereserve for litigation loss contingencies that are both probable and reasonably estimable. Legal fees and expenses associated with the defense of all of our litigation are expensed as such fees and expenses are incurred. As of December 31, 2009,2011, we had no accrualreserves relating to probable losses for our outstanding litigation.
We continue to monitor our litigation exposure, and will review the adequacy of our legal reserves on a quarterly basis in accordance with applicable accounting rules. Please refer to “Management’s Discussion and Analysis of Financial Condition and Results of Operations — Critical Accounting Policies Involving Critical Estimates, Uncertainties or Assessments in Our Financial Statements” regarding our process for evaluating our litigation reserves. Based on our review, we have not established any reserves for our outstanding litigation.
| |
| Item 4. | Submission of Matters to a Vote of Security Holders.Mine Safety Disclosures. |
None.
17Not applicable.
PART II
| |
| Item 5. | Market for Registrant’s Common Equity, Related Stockholder Matters and Issuer Purchases of Equity Securities.Securities. |
Our common stock has been listed on the Nasdaq Global Select Market® and its predecessors under the symbol “RCII” since January 25, 1995, the date we commenced our initial public offering. The following table sets forth, for the periods indicated, the high and low sales price per share of theour common stock as reported.
| | | | | | | | | |
2009 | | High | | | Low | |
| |
| Fourth Quarter | | $ | 20.92 | | | $ | 17.49 | |
| Third Quarter | | | 21.97 | | | | 16.55 | |
| Second Quarter | | | 23.14 | | | | 16.94 | |
| First Quarter | | | 20.17 | | | | 14.45 | |
| | | | | | | | | |
2008 | | High | | | Low | |
| |
| Fourth Quarter | | $ | 22.68 | | | $ | 9.97 | |
| Third Quarter | | | 26.00 | | | | 18.60 | |
| Second Quarter | | | 23.20 | | | | 17.07 | |
| First Quarter | | | 20.22 | | | | 11.67 | |
reported, and the quarterly cash dividend declared per share on our common stock. | | | | | | | | | | | | |
2011 | | High | | | Low | | | Cash Dividends
Declared | |
Fourth Quarter | | $ | 38.26 | | | $ | 25.82 | | | $ | 0.16 | |
Third Quarter | | | 32.22 | | | | 21.30 | | | | 0.16 | |
Second Quarter | | | 36.53 | | | | 27.66 | | | | 0.16 | |
First Quarter | | | 35.39 | | | | 28.58 | | | | 0.06 | |
| | | |
2010 | | High | | | Low | | | Cash Dividends
Declared | |
Fourth Quarter | | $ | 33.05 | | | $ | 21.97 | | | $ | 0.12 | |
Third Quarter | | | 23.44 | | | | 19.44 | | | | 0.06 | |
Second Quarter | | | 28.72 | | | | 20.25 | | | | — | |
First Quarter | | | 24.10 | | | | 17.23 | | | | — | |
As of February 19, 2009,17, 2012, there were approximately 6669 record holders of our common stock.
We have not paid anyFuture decisions to pay cash dividends on our common stock since the time of our initial public offering. Any change in our dividend policy willcontinue to be made at the discretion of our Board of Directors and will depend on a number of factors, including future earnings, capital requirements, contractual restrictions, financial condition, future prospects and any other factors our Board of Directors may deem relevant.
While cash dividend payments are subject to certain restrictions in our senior credit facilities,debt agreements, these restrictions woulddo not currently prohibit the payment of cash dividends. Please see the section entitled“Management’s Discussion and Analysis of Financial Condition and Results of Operations — Liquidity and Capital Resources — Senior Credit FacilitiesFacilities””and “— 6 5/8% Senior Notes” on pagepages 33 and 35 of this report for further discussion of such restrictions.
Under our common stock repurchase program, we are authorized to repurchase up to $500.0 million in aggregate purchase price of our common stock. As of December 31, 2009, we had repurchased a total of 19,884,850 shares ofRent-A-Center common stock for an aggregate purchase price of $466.6 million under our common stock repurchase program. For the year ended December 31, 2009, we repurchased 472,100 shares of our common stock for an aggregate purchase price of $8.8 million. In the fourth quarter of 2009, we effected the following repurchases of our common stock:
| | | | | | | | | | | | | | | | | | | | | |
| | | | | | | | | | | | Maximum Dollar
| |
| | | | | | | | | Total Number of
| | | Value that May Yet
| |
| | | | | | | | | Shares Purchased
| | | Be Purchased
| |
| | | Total Number
| | | Average Price
| | | as Part of Publicly
| | | Under the Plans
| |
| | | of Shares
| | | Paid per Share
| | | Announced Plans
| | | or Programs
| |
Period | | Purchased | | | (Including Fees) | | | or Programs | | | (Including Fees) | |
| |
| October 1 through October 31 | | | | | | | | | | | | | | | | | | | | |
| November 1 through November 30 | | | 472,100 | | | $ | 18.7357 | | | | 472,100 | | | | | | | $ | 33,392,808 | |
| December 1 through December 31 | | | | | | | | | | | | | | | | | | | | |
| | | | | | | | | | | | | | | | | | | | | |
| Total | | | 472,100 | | | $ | 18.7357 | | | | 472,100 | | | | | | | $ | 33,392,808 | |
18
Stock Performance Graph
The following chart represents a comparison of the five year total return of our common stock to the NASDAQ Market Index and a peer group index selected by us. The peer group index consistsconsisted of Aaron’s, Inc., Family Dollar Stores, Inc., 99¢ Only Stores, Dollar Tree Stores, Inc., and Dollar FinancialGeneral Corp., Advance America, Cash Advance Centers, Inc., EZCORP, Inc., and Cash America International, Inc. The graph assumes $100 was invested on December 31, 20042006 and dividends, if any, were reinvested for all years ending December 31.
19
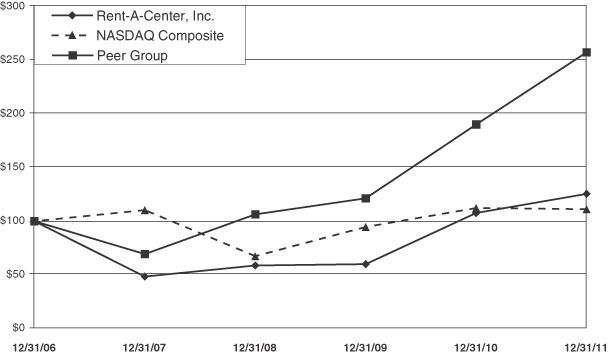
| |
| Item 6. | Selected Financial Data |
The selected financial data presented below for the five years ended December 31, 20092011 have been derived from our consolidated financial statements as audited by Grant Thornton LLP, an independent registered public accounting firm. The historical financial data are qualified in their entirety by, and should be read in conjunction with, the consolidated financial statements and the notes thereto, the section entitled“Management’s Discussion and Analysis of Financial Condition and Results of OperationsOperations”” and other financial information included in this report.
| | | | | | | | | | | | | | | | | | | | | |
| | | Year Ended December 31, | |
| | | 2009 | | | 2008 | | | 2007 | | | 2006 | | | 2005 | |
| | | (In thousands, except per share data) | |
| |
Consolidated Statements of Earnings | | | | | | | | | | | | | | | | | | | | |
| Revenues | | | | | | | | | | | | | | | | | | | | |
| Store | | | | | | | | | | | | | | | | | | | | |
| Rentals and fees | | $ | 2,346,849 | | | $ | 2,505,268 | | | $ | 2,594,061 | | | $ | 2,174,239 | (8) | | $ | 2,084,757 | |
| Merchandise sales | | | 261,631 | | | | 256,731 | | | | 208,989 | | | | 175,954 | | | | 177,292 | |
| Installment sales | | | 53,035 | | | | 41,193 | | | | 34,576 | | | | 26,877 | | | | 26,139 | |
| Other | | | 57,601 | | | | 42,759 | | | | 25,482 | | | | 15,607 | | | | 7,903 | |
| Franchise | | | | | | | | | | | | | | | | | | | | |
| Merchandise sales | | | 28,065 | | | | 33,283 | | | | 34,229 | | | | 36,377 | | | | 37,794 | |
| Royalty income and fees | | | 4,775 | | | | 4,938 | | | | 8,784 | (5) | | | 4,854 | | | | 5,222 | |
| | | | | | | | | | | | | | | | | | | | | |
| Total revenue | | | 2,751,956 | | | | 2,884,172 | | | | 2,906,121 | | | | 2,433,908 | | | | 2,339,107 | |
| Operating expenses | | | | | | | | | | | | | | | | | | | | |
| Direct store expenses | | | | | | | | | | | | | | | | | | | | |
| Cost of rentals and fees | | | 530,018 | | | | 572,900 | | | | 574,013 | | | | 476,462 | (8) | | | 452,583 | |
| Cost of merchandise sold | | | 188,433 | | | | 194,595 | | | | 156,503 | | | | 131,428 | | | | 129,624 | |
| Cost of installment sales | | | 18,687 | | | | 16,620 | | | | 13,270 | | | | 11,346 | | | | 10,889 | |
| Salaries and other expenses | | | 1,556,074 | | | | 1,651,805 | | | | 1,684,965 | | | | 1,385,437 | | | | 1,358,760 | (11) |
| Franchise cost of merchandise sold | | | 26,820 | | | | 31,705 | | | | 32,733 | | | | 34,862 | | | | 36,319 | |
| | | | | | | | | | | | | | | | | | | | | |
| | | | 2,320,032 | | | | 2,467,625 | | | | 2,461,484 | | | | 2,039,535 | | | | 1,988,175 | |
| General and administrative expenses | | | 137,626 | | | | 125,632 | | | | 123,703 | | | | 93,556 | | | | 82,290 | |
| Amortization and write-down of intangibles | | | 2,843 | | | | 16,637 | | | | 15,734 | | | | 5,573 | | | | 11,705 | (12) |
| Litigation expense (credit) | | | (4,869 | )(1) | | | (4,607 | )(2) | | | 62,250 | (6) | | | 73,300 | (9) | | | (8,000 | )(13) |
| Restructuring charge | | | — | | | | 4,497 | (3) | | | 38,713 | (7) | | | — | | | | 15,166 | (14) |
| | | | | | | | | | | | | | | | | | | | | |
| Total operating expenses | | | 2,455,632 | | | | 2,609,784 | | | | 2,701,884 | | | | 2,211,964 | | | | 2,089,336 | |
| Operating profit | | | 296,324 | | | | 274,388 | | | | 204,237 | | | | 221,944 | | | | 249,771 | |
| Finance charges from refinancing | | | — | | | | — | | | | — | | | | 4,803 | (10) | | | — | |
| Gain on extinguishment of debt | | | — | | | | (4,335 | )(4) | | | — | | | | — | | | | — | |
| Interest expense, net | | | 25,954 | | | | 57,381 | | | | 87,951 | | | | 53,003 | | | | 40,703 | |
| | | | | | | | | | | | | | | | | | | | | |
| Earnings before income taxes | | | 270,370 | | | | 221,342 | | | | 116,286 | | | | 164,138 | | | | 209,068 | |
| Income tax expense | | | 102,515 | | | | 81,718 | | | | 40,018 | | | | 61,046 | | | | 73,330 | (15) |
| | | | | | | | | | | | | | | | | | | | | |
20
| | | | | | | | | | | | | | | | | | | | |
| | | Year Ended December 31, | |
| | | 2011 | | | 2010 | | | 2009 | | | 2008 | | | 2007 | |
| | | (In thousands, except per share data) | |
Consolidated Statements of Earnings | | | | | | | | | | | | | | | | | | | | |
Revenues | | | | | | | | | | | | | | | | | | | | |
Store | | | | | | | | | | | | | | | | | | | | |
Rentals and fees | | $ | 2,496,863 | | | $ | 2,335,496 | | | $ | 2,346,849 | | | $ | 2,505,268 | | | $ | 2,594,061 | |
Merchandise sales | | | 259,796 | | | | 220,329 | | | | 261,631 | | | | 256,731 | | | | 208,989 | |
Installment sales | | | 68,617 | | | | 63,833 | | | | 53,035 | | | | 41,193 | | | | 34,576 | |
Other | | | 17,925 | | | | 76,542 | | | | 57,601 | | | | 42,759 | | | | 25,482 | |
Franchise | | | | | | | | | | | | | | | | | | | | |
Merchandise sales | | | 33,972 | | | | 30,575 | | | | 28,065 | | | | 33,283 | | | | 34,229 | |
Royalty income and fees | | | 5,011 | | | | 4,857 | | | | 4,775 | | | | 4,938 | | | | 8,784 | (10) |
| | | | | | | | | | | | | | | | | | | | |
| | | 2,882,184 | | | | 2,731,632 | | | | 2,751,956 | | | | 2,884,172 | | | | 2,906,121 | |
Cost of revenues | | | | | | | | | | | | | | | | | | | | |
Store | | | | | | | | | | | | | | | | | | | | |
Cost of rentals and fees | | | 570,493 | | | | 519,282 | | | | 530,018 | | | | 572,900 | | | | 574,013 | |
Cost of merchandise sold | | | 201,854 | | | | 164,133 | | | | 188,433 | | | | 194,595 | | | | 156,503 | |
Cost of installment sales | | | 24,834 | | | | 23,303 | | | | 18,687 | | | | 16,620 | | | | 13,270 | |
Franchise cost of merchandise sold | | | 32,487 | | | | 29,242 | | | | 26,820 | | | | 31,705 | | | | 32,733 | |
| | | | | | | | | | | | | | | | | | | | |
| | | 829,668 | | | | 735,960 | | | | 763,958 | | | | 815,820 | | | | 776,519 | |
Gross profit | | | 2,052,516 | | | | 1,995,672 | | | | 1,987,998 | | | | 2,068,352 | | | | 2,129,602 | |
Operating expenses | | | | | | | | | | | | | | | | | | | | |
Salaries and other expenses | | | 1,594,480 | | | | 1,543,391 | | | | 1,556,074 | | | | 1,651,805 | | | | 1,684,965 | |
General and administrative expenses | | | 136,141 | | | | 126,319 | | | | 137,626 | | | | 125,632 | | | | 123,703 | |
Amortization and write-down of intangibles | | | 4,675 | | | | 3,254 | | | | 2,843 | | | | 16,637 | | | | 15,734 | |
Impairment charge | | | 7,320 | (1) | | | 18,939 | (4) | | | — | | | | — | | | | — | |
Restructuring charge | | | 13,943 | (2) | | | — | | | | — | | | | 4,497 | (7) | | | 38,713 | (11) |
Litigation expense (credit) | | | 2,800 | (3) | | | — | | | | (4,869 | )(6) | | | (4,607 | )(8) | | | 62,250 | (12) |
| | | | | | | | | | | | | | | | | | | | |
| | | 1,759,359 | | | | 1,691,903 | | | | 1,691,674 | | | | 1,793,964 | | | | 1,925,365 | |
Operating profit | | | 293,157 | | | | 303,769 | | | | 296,324 | | | | 274,388 | | | | 204,237 | |
Finance charges from refinancing | | | — | | | | 3,100 | (5) | | | — | | | | — | | | | — | |
Gain on extinguishment of debt | | | — | | | | — | | | | — | | | | (4,335 | )(9) | | | — | |
Interest expense, net | | | 36,607 | | | | 25,912 | | | | 25,954 | | | | 57,381 | | | | 87,951 | |
| | | | | | | | | | | | | | | | | | | | |
Earnings before income taxes | | | 256,550 | | | | 274,757 | | | | 270,370 | | | | 221,342 | | | | 116,286 | |
Income tax expense | | | 91,913 | | | | 103,115 | | | | 102,515 | | | | 81,718 | | | | 40,018 | |
| | | | | | | | | | | | | | | | | | | | |
NET EARNINGS | | $ | 164,637 | | | $ | 171,642 | | | $ | 167,855 | | | $ | 139,624 | | | $ | 76,268 | |
| | | | | | | | | | | | | | | | | | | | |
Basic earnings per common share | | $ | 2.69 | | | $ | 2.64 | | | $ | 2.54 | | | $ | 2.10 | | | $ | 1.11 | |
| | | | | | | | | | | | | | | | | | | | |
Diluted earnings per common share | | $ | 2.66 | | | $ | 2.60 | | | $ | 2.52 | | | $ | 2.08 | | | $ | 1.10 | |
| | | | | | | | | | | | | | | | | | | | |
Cash dividends paid per common share | | $ | 0.44 | | | $ | 0.12 | | | $ | — | | | $ | — | | | $ | — | |
| | | | | | | | | | | | | | | | | | | | |
| |
| Item 6. | Selected Financial Data — Continued |
| | | | | | | | | | | | | | | | | | | | | |
| | | Year Ended December 31, | |
| | | 2009 | | | 2008 | | | 2007 | | | 2006 | | | 2005 | |
| | | (In thousands, except per share data) | |
| |
| NET EARNINGS | | $ | 167,855 | | | $ | 139,624 | | | $ | 76,268 | | | $ | 103,092 | | | $ | 135,738 | |
| | | | | | | | | | | | | | | | | | | | | |
| Basic earnings per common share | | $ | 2.54 | | | $ | 2.10 | | | $ | 1.11 | | | $ | 1.48 | | | $ | 1.86 | |
| | | | | | | | | | | | | | | | | | | | | |
| Diluted earnings per common share | | $ | 2.52 | | | $ | 2.08 | | | $ | 1.10 | | | $ | 1.46 | | | $ | 1.83 | |
| | | | | | | | | | | | | | | | | | | | | |
Consolidated Balance Sheet Data | | | | | | | | | | | | | | | | | | | | |
| Rental merchandise, net | | $ | 749,998 | | | $ | 819,054 | | | $ | 937,970 | | | $ | 1,056,233 | (16) | | $ | 750,680 | |
| Intangible assets, net | | | 1,269,457 | | | | 1,266,953 | | | | 1,269,094 | | | | 1,281,597 | | | | 929,326 | |
| Total assets | | | 2,443,997 | | | | 2,496,702 | | | | 2,626,943 | | | | 2,740,956 | (16) | | | 1,948,664 | |
| Total debt | | | 711,158 | | | | 947,087 | | | | 1,259,335 | | | | 1,293,278 | | | | 724,050 | |
| Total liabilities | | | 1,196,483 | | | | 1,417,500 | | | | 1,679,852 | | | | 1,797,997 | (16) | | | 1,125,232 | (17) |
| Stockholders’ equity | | | 1,247,514 | | | | 1,079,202 | | | | 947,091 | | | | 942,959 | (16) | | | 823,432 | |
Operating Data (Unaudited) | | | | | | | | | | | | | | | | | | | | |
| Stores open at end of period | | | 3,007 | | | | 3,037 | | | | 3,081 | | | | 3,406 | | | | 2,760 | |
Comparable store revenue growth (decrease)(18) | | | (3.5 | )% | | | 2.3 | % | | | 2.1 | % | | | 1.9 | % | | | (2.3 | )% |
| Weighted average number of stores | | | 3,021 | | | | 3,056 | | | | 3,376 | | | | 2,848 | | | | 2,844 | |
| Franchise stores open at end of period | | | 210 | | | | 222 | | | | 227 | | | | 282 | | | | 296 | |
| | | | | | | | | | | | | | | | | | | | |
| | | December 31, | |
| | | 2011 | | | 2010 | | | 2009 | | | 2008 | | | 2007 | |
| | | (Dollar amounts in thousands) | |
Consolidated Balance Sheet Data | | | | | | | | | | | | | | | | | | | | |
Rental merchandise, net | | $ | 953,193 | | | $ | 836,854 | | | $ | 749,998 | | | $ | 819,054 | | | $ | 937,970 | |
Intangible assets, net | | | 1,350,855 | | | | 1,326,091 | | | | 1,269,457 | | | | 1,266,953 | | | | 1,269,094 | |
Total assets | | | 2,801,378 | | | | 2,688,331 | | | | 2,443,997 | | | | 2,496,702 | | | | 2,626,943 | |
Total debt | | | 740,675 | | | | 701,114 | | | | 711,158 | | | | 947,087 | | | | 1,259,335 | |
Total liabilities | | | 1,442,169 | | | | 1,334,532 | | | | 1,196,483 | | | | 1,417,500 | | | | 1,679,852 | |
Stockholders’ equity | | | 1,359,209 | | | | 1,353,799 | | | | 1,247,514 | | | | 1,079,202 | | | | 947,091 | |
Operating Data (Unaudited) | | | | | | | | | | | | | | | | | | | | |
Core U.S. and International stores open at end of period | | | 3,074 | | | | 3,008 | | | | 3,007 | | | | 3,037 | | | | 3,081 | |
Same store revenue growth (decrease)(13) | | | 0.8 | % | | | (0.4 | )%(14) | | | (3.5 | )% | | | 2.3 | % | | | 2.1 | % |
Weighted average number of stores | | | 3,022 | | | | 3,003 | | | | 3,021 | | | | 3,056 | | | | 3,376 | |
RAC Acceptance locations open at end of period | | | 750 | | | | 384 | | | | 82 | | | | 56 | | | | 30 | |
Franchise stores open at end of period | | | 216 | | | | 209 | | | | 210 | | | | 222 | | | | 227 | |
| | |
| (1) | Includes the effects of a $7.3 million pre-tax impairment charge in the first quarter of 2011 related to the discontinuation of the financial services business. |
| (2) | Includes the effects of a $1.4 million pre-tax restructuring charge in the fourth quarter of 2011 in connection with the acquisition in November 2011 of 58 rent-to-own stores; a $7.6 million pre-tax restructuring charge in the third quarter of 2011 related to the closure of eight Home Choice stores in Illinois and 24 RAC Limited locations within third party grocery stores, as well as the closure of 26 core rent-to-own stores following the sale of all customer accounts at these locations; and a $4.9 million pre-tax restructuring charge in the second quarter of 2011 for lease terminations related to The Rental Store acquisition. |
| (3) | Includes the effects of a $2.8 million pre-tax litigation expense in the first quarter of 2011 related to the settlement of various California claims, including wage and hour violations. |
| (4) | Includes the effects of an $18.9 million pre-tax impairment charge in the fourth quarter of 2010 related to the discontinuation of our financial services business. |
| (5) | Includes the effects of a $3.1 million pre-tax financing expense in the fourth quarter of 2010 related to the write-off of unamortized financing costs. |
| (6) | Includes the effects of $4.9 million in pre-tax litigation credits recorded in the first quarter and second quarter of 2009 related to theHilda Perezmatter. |
|
(2)(7) | Includes the effects of a $4.5 million pre-tax restructuring expense as part of the store consolidation plan and other restructuring items announced December 3, 2007. |
| (8) | Includes the effects of $4.6 million in pre-tax litigation credits recorded in the fourth quarter of 2008 related to thePerezmatter and theShafer/Johnsonmatter. |
|
(3)(9) | | Includes the effects of a $4.5 million pre-tax restructuring expense as part of the store consolidation plan and other restructuring items announced December 3, 2007. |
|
(4) | | Includes the effects of a $4.3 million pre-tax gain on the extinguishment of debt recorded in the fourth quarter of 2008. |
|
(5)(10) | | Includes the effects of a $3.9 million pre-tax benefit recorded in the third quarter of 2007 as a result of the receipt of accelerated royalty payments from franchisees in consideration of the termination of their franchise agreements. |
|
(6)(11) | Includes the effects of a $38.7 million pre-tax restructuring expense recorded in the fourth quarter of 2007 related to the store consolidation plan and other restructuring items announced December 3, 2007. |
| (12) | Includes the effects of a $51.3 million pre-tax litigation expense recorded in the first quarter of 2007 related to thePerezmatter and the effects of an $11.0 million pre-tax litigation expense recorded in the fourth quarter of 2007 related to theShafer/Johnsonmatter. |
|
(7) | | Includes the effects of a $38.7 million pre-tax restructuring expense recorded in the fourth quarter of 2007 related to the store consolidation plan and other restructuring items announced December 3, 2007. |
|
(8) | | Includes the effects of adopting SAB 108,Considering the Effects of Prior Year Misstatements when Quantifying Misstatements in Current Year Financial Statements(“SAB 108”), of approximately $3.1 million decrease in pre-tax revenue and $738,000 decrease in pre-tax depreciation expense related to adjustments for deferred revenue. |
|
(9) | | Includes the effects of a $4.95 million pre-tax expense in the third quarter of 2006 associated with the settlement of theBurdusis/French/Corsolitigation, the effects of a $10.35 million pre-tax expense in the third quarter of 2006 associated with the settlement with the California Attorney General and the effects of a $58.0 million pre-tax expense in the fourth quarter of 2006 associated with the litigation reserve with respect to thePerezcase. |
|
(10) | | Includes the effects of a $2.2 million pre-tax expense in the third quarter of 2006 and the effects of a $2.6 million pre-tax expense in the fourth quarter of 2006 for the refinancing of our senior credit facilities. |
|
(11) | | Includes the effects of $5.2 million in charges recorded in the third and fourth quarters of 2005 as a result of Hurricanes Katrina, Rita and Wilma. These charges were primarily related to the disposal of inventory and fixed assets. |
|
(12) | | Includes the effects of $3.7 million in goodwill impairment charges recorded in the third quarter of 2005 as result of Hurricane Katrina. |
|
| (13) | | Includes the effect of a pre-tax legal reversion of $8.0 million recorded in the first quarter of 2005 associated with the settlement of a class action lawsuit in the state of California. |
21
| | |
(14) | | Includes the effects of a $15.2 million pre-tax restructuring expense as part of the store consolidation plan announced September 6, 2005. |
|
(15) | | Includes the effects of a $2.0 million tax audit reserve credit associated with the examination and favorable resolution of our 1998 and 1999 federal tax returns and a $3.3 million state tax reserve credit due to a change in estimate related to potential loss exposures. |
|
(16) | | Includes the effects of adopting SAB 108 of a $4.2 million increase in accounts receivable, an increase in accrued liabilities of $31.0 million, a decrease in accumulated depreciation of $6.4 million, an increase in deferred tax assets of $7.6 million and a decrease in retained earnings of $12.8 million related to adjustments for deferred revenue and a $1.0 million increase in prepaid expenses, a $1.9 million decrease in accrued liabilities, a decrease in deferred tax assets of $1.1 million and an increase in retained earnings of $1.8 million related to adjustments for property taxes. |
|
(17) | | Total liabilities also includes redeemable convertible voting preferred stock for the year ended December 31, 2005. |
|
(18) | | ComparableSame store revenue growth or decrease for each period presented includes revenues only of stores open throughout the full period and the comparable prior period. |
22
| (14) | Excludes financial services revenue. |
| Item 7. | Management’s Discussion and Analysis of Financial Condition and Results of Operations. |
We are the largest rent-to-own operator in North America, focused on improving the United Statesrent-to-own industry with an approximate 35% market share based on store count. At December 31, 2009, we operated 3,007 company-owned stores nationwide and in Canada and Puerto Rico, including 39 retail installment sales stores underquality of life for our customers by providing them the names “Get It Now” and “Home Choice,” and18 rent-to-own stores located in Canada under the names“Rent-A-Centre” and “Better Living.” Our subsidiary, ColorTyme, is a national franchisoropportunity to obtain ownership ofrent-to-own stores. At December 31, 2009, ColorTyme had 210 franchisedrent-to-own stores in 33 states. These franchise stores represent an additional 2% market share based on store count.
Our stores generally offer high quality high-quality durable products, such as major consumer electronics, appliances, computers, and furniture and accessories, under flexible rental purchase agreements that generally allow the customer to obtain ownership of the merchandise at the conclusion of anagreed-upon rental period. The rental purchase transaction is a flexible alternative for consumers to obtain use and enjoyment of brand name merchandise without incurring debt. Key features of the rental purchase transaction include:
| | |
| • | convenient payment options: |
| | |
| • | weekly, semi-monthly or monthly; |
|
| • | in-store, over the phone or online; |
| | |
| • | no long-term obligations; |
|
| • | right to terminate without penalty; |
|
| • | no requirement of a credit history; |
|
| • | delivery andset-up included at no additional charge; |
|
| • | product maintenance; |
|
| • | lifetime reinstatement; and |
|
| • | flexible options to obtain ownership — 90 days same as cash, early purchase options, or payment through the term of the agreement. |
Rental payments are made generally on a weekly basis and, together with applicable fees, constitute our primary revenue source.
Our expenses primarily relate to merchandise costs and the operations of our stores, including salaries and benefits for our employees, occupancy expense for our leased real estate, advertising expenses, lost, damaged, or stolen merchandise, fixed asset depreciation, and corporate and other expenses.
no long-term obligation.We were incorporated in Delaware in 1986. From 1993 to 2006, we pursued an aggressive growth strategy in which we opened new stores and sought to acquire underperformingrent-to-own stores to which we could apply our operating model as well as open new stores.model. As a result of this strategy, the number of our locations grew from 27 to over 3,400 in 2006, primarily through acquisitions. We acquired over 3,300 stores have generally experienced more significant revenue growth during the initial periods following their acquisition thanthis period, including approximately 390 of our franchised stores. These acquisitions occurred in subsequent periods. Typically, a newly openedrent-to-own store is profitable on a monthly basisapproximately 200 separate transactions, including ten transactions in the ninth to twelfth month after its initial opening. Historically, a typical store has achieved cumulative break-even profitabilityeach of which we acquired in 18 to 24 months after its initial opening. excess of 50 locations.
Total financing requirements of a typical new Core U.S. store approximate $500,000,$625,000, with roughly 75%65% of that amount relating to the purchase of rental merchandise inventory. A newly opened Core U.S. store historicallyis typically profitable on a monthly basis in the 10th to 14th month after its initial opening. Historically, a typical Core U.S. store has achieved cumulative break-even profitability in 24 to 28 months after its initial opening and has achieved results consistent with other Core U.S. stores that have been operating within the system for greater than two years by the end of its third year of operation. As a result, our quarterly earnings are impacted by how many new stores we opened during a particular quarter and the quarters preceding it. BecauseHistorically, we achieved growth in our Core U.S. segment by opening new stores and acquiring underperforming rent-to-own stores to which we could apply our operating model. As a result, the acquired stores have generally experienced more significant revenue growth during the initial periods following their acquisition than in subsequent periods. Although we continue to believe there are attractive opportunities to expand our presence in the U.S. rent-to-own industry and we intend to continue our acquisition strategy of targeting under-performing and under-capitalized rent-to-own stores, the consolidation opportunities in the U.S. rent-to-own industry are more limited than in previous periods during which we experienced significant growth since our formation,through acquisitions. Therefore, our historical results of operations andperiod-to-period period to period comparisons of such results and other financial data, including the rate of earnings growth, may not be meaningful or indicative of future results.
In addition, we strategically open or acquire stores near market areas served by existing stores (“cannibalize”) to enhance service levels, gain incremental sales and increase market penetration. This planned cannibalization may
23
negatively impact our same store revenue and cause us to grow at a slower rate. There can be no assurance we will open or acquire any newrent-to-own stores in the future, or as to the number, location or profitability thereof.
We also offer financial services products, such as short term secured and unsecured loans, debit cards, check cashing, tax preparation and money transfer services, in some ofAs our U.S. store base matured, we began to focus on acquiring new customers through sources other than our existing stores under the trade names “RAC Financial Services” and “Cash AdvantEdge.” As of December 31, 2009, we offered some or all of these financial services products in 353Rent-A-Center store locations in 17 states. We continue to focus our resources on improving the operations in these existing financial servicesU.S. rent-to-own store locations and expect to have approximately 400Rent-A-Centerseek additional distribution channels for our products and services. One of our current growth strategies is our “RAC Acceptance” model. With this model, we operate kiosks within various traditional retailers’ locations where we generally offer the rent-to-own transaction to consumers who do not qualify for financing from such retailers. The number of RAC Acceptance locations increased by 95% from 2010 to 2011 and we intend to continue growing the RAC Acceptance segment by expanding the number of our retail partners. In addition, we are expanding our rent-to-own store locations offering financialoperations in Canada and Mexico and seeking to identify other international markets in which we believe our products and services would be in demand.
The Rental Purchase Transaction
The rental purchase transaction is a flexible alternative for consumers to obtain use and enjoyment of brand name merchandise with no long-term obligation. Key features of the rental purchase transaction include:
Brand name merchandise. We offer well known brands such as Sony, Philips, LG, Panasonic, Toshiba and Mitsubishi home electronics; Whirlpool appliances; Toshiba, Sony, Hewlett-Packard, Dell, Acer, Compaq and Apple computers; and Ashley, England, Standard, Albany and Klaussner furniture.
Convenient payment options. Our customers may make weekly, semi-monthly or monthly payments, in our stores, kiosks, online or by telephone. We accept cash and credit or debit cards. Approximately 78% of our agreements are on a weekly term.
No negative consequences. A customer may terminate a rental purchase agreement at any time without penalty.
No credit needed. Generally, we do not conduct a formal credit investigation of our customers. We verify a customer’s residence and sources of income. References provided by the endcustomer are also contacted to verify the information contained in the rental purchase order form.
Delivery & set-up included. We generally offer same day or 24-hour delivery and installation of 2010. There canour merchandise at no additional cost to the customer.
Product maintenance & replacement. We provide any required service or repair without additional charge, except for damage in excess of normal wear and tear. Repair services are provided through our network of service centers, the cost of which may be no assurancereimbursed by the vendor if the item is still under factory warranty. If the product cannot be repaired at the customer’s residence, we provide a temporary replacement while the product is being repaired. If the product cannot be repaired, we will be successfulreplace it with a product of comparable quality, age and condition.
Lifetime reinstatement. If a customer is temporarily unable to make payments on a piece of rental merchandise and must return the merchandise, that customer generally may later re-rent the same piece of merchandise (or if unavailable, a substitute of comparable quality, age and condition) on the terms that existed at the time the merchandise was returned, and pick up payments where they left off without losing what they previously paid. We estimate that approximately 77% of our business in our effortsCore U.S. segment is from repeat customers.
Flexible options to improveobtain ownership. Ownership of the merchandise generally transfers to the customer if the customer has continuously renewed the rental purchase agreement for a period of seven to 24 months, depending upon the product type, or exercises a specified early purchase option.
Rental payments are generally made in advance on a weekly basis in our Core U.S. and expandInternational segments and monthly in our financial servicesRAC Acceptance segment and, together with applicable fees, constitute our primary revenue source.
Our expenses primarily relate to merchandise costs and the operations of our stores, including salaries and benefits for our employees, occupancy expense for our leased real estate, advertising expenses, lost, damaged, or that such operations, should they be added, will prove to be profitable.
stolen merchandise, fixed asset depreciation, and corporate and other expenses.The following discussion focuses on our results of operations, and issues related to our liquidity and capital resources. You should read this discussion in conjunction with the consolidated financial statements and notes thereto included elsewhere in this report.
Forward-Looking Statements
The statements, other than statements of historical facts, included in this report are forward-looking statements. Forward-looking statements generally can be identified by the use of forward-looking terminology such as “may,” “will,” “would,” “expect,” “intend,” “could,” “estimate,” “should,” “anticipate” or “believe.” We believe the expectations reflected in such forward-looking statements are accurate. However, we cannot assure you that these expectations will occur. Our actual future performance could differ materially from such statements. Factors that could cause or contribute to these differences include, but are not limited to:
| | |
| • | uncertainties regarding the ability to open newrent-to-own stores; |
|
| • | our ability to acquire additionalrent-to-own stores or customer accounts on favorable terms; |
|
| • | our ability to control costs and increase profitability; |
|
| • | our ability to successfully add financial services locations within our existing stores; |
|
| • | our ability to identify and successfully enter new lines of business offering products and services that appeal to our customer demographic; |
|
| • | our ability to enhance the performance of acquired stores; |
|
| • | our ability to retain the revenue associated with acquired customer accounts; |
|
| • | our ability to identify and successfully market products and services that appeal to our customer demographic; |
|
| • | our ability to enter into new and collect on our rental purchase agreements; |
|
| • | our ability to enter into new and collect on our short term loans; |
|
| • | the passage of legislation adversely affecting therent-to-own or financial services industries; |
|
| • | our failure to comply with statutes or regulations governing therent-to-own or financial services industries; |
|
| • | interest rates; |
|
| • | increases in the unemployment rate; |
|
| • | economic pressures, such as high fuel and utility costs, affecting the disposable income available to our targeted consumers; |
|
| • | changes in our stock price and the number of shares of common stock that we may or may not repurchase; |
|
| • | changes in estimates relating to self-insurance liabilities and income tax and litigation reserves; |
|
| • | changes in our effective tax rate; |
24uncertainties regarding the ability to open new locations;
our ability to acquire additional stores or customer accounts on favorable terms;our ability to control costs and increase profitability;
our ability to enhance the performance of acquired stores;
our ability to retain the revenue associated with acquired customer accounts;
| | |
| • | our ability to maintain an effective system of internal controls; |
|
| • | changes in the number of share-based compensation grants, methods used to value future share-based payments and changes in estimated forfeiture rates with respect to share-based compensation; |
|
| • | the resolution of our litigation; and |
|
| • | the other risks detailed from time to time in our SEC reports. |
our ability to identify and successfully market products and services that appeal to our customer demographic;
our ability to enter into new and collect on our rental or lease purchase agreements;
the passage of legislation adversely affecting the rent-to-own industry;
our failure to comply with applicable statutes or regulations governing our transactions;
changes in the unemployment rate;
economic pressures, such as high fuel costs, affecting the disposable income available to our current and potential customers;
conditions affecting consumer spending and the impact, depth, and duration of current economic conditions;
changes in our stock price, the number of shares of common stock that we may or may not repurchase, and future dividends, if any;
changes in estimates relating to self-insurance liabilities and income tax and litigation reserves;
changes in our effective tax rate;
fluctuations in foreign currency exchange rates;
our ability to maintain an effective system of internal controls;
changes in the number of share-based compensation grants, methods used to value future share-based payments and changes in estimated forfeiture rates with respect to share-based compensation;
the resolution of our litigation; and
the other risks detailed from time to time in our SEC reports.
Additional important factors that could cause our actual results to differ materially from our expectations are discussed under the section “Risk Factors” and elsewhere in this report. You should not unduly rely on these forward-looking statements, which speak only as of the date of this report. Except as required by law, we are not obligated to publicly release any revisions to these forward-looking statements to reflect events or circumstances occurring after the date of this report or to reflect the occurrence of unanticipated events.Critical Accounting Policies Involving Critical Estimates, Uncertainties or Assessments in Our Financial Statements
The preparation of our consolidated financial statements in conformity with accounting principles generally accepted in the United States of America requires us to make estimates and assumptions that affect the reported amounts of assets and liabilities, disclosure of contingent losses and liabilities at the date of the consolidated financial statements and the reported amounts of revenues and expenses during the reporting period. In applying accounting principles, we must often make individual estimates and assumptions regarding expected outcomes or uncertainties. Our estimates, judgments and assumptions are continually evaluated based on available information and experience. Because of the use of estimates inherent in the financial reporting process, actual results could differ from those estimates. We believe the following are areas where the degree of judgment and complexity in determining amounts recorded in our consolidated financial statements make the accounting policies critical.
Self-Insurance Liabilities. We have self-insured retentions with respect to losses under our workers’ compensation, general liability and autovehicle liability insurance policies. We establish reserves for our liabilities associated with these losses by obtaining forecasts for the ultimate expected losses and estimating amounts needed to pay losses within our self-insured retentions.
We continually institute procedures to manage our loss exposure and increases in health care costs associated with our insurance claims through our risk management function, including a transitional duty program for injured workers, ongoing safety and accident prevention training, and various other programs designed to minimize losses and improve our loss experience in our store locations. We make assumptions on our liabilities within our self-insured retentions using actuarial loss forecasts, company specificcompany-specific development factors, general industry loss development factors, and third partythird-party claim administrator loss estimates which are based on known facts surrounding individual claims. These assumptions incorporate expected increases in health care costs. Periodically, we reevaluate our estimate of liability within our self-insured retentions. At that time, we evaluate the adequacy of our accrualsreserves by comparing amounts accruedreserved on our balance sheet for anticipated losses to our updated actuarial loss forecasts and third party claim administrator loss estimates, and make adjustments to our accrualsreserves as needed.
As of December 31, 2009,2011, the amount accruedreserved for losses within our self-insured retentions with respect to workers’ compensation, general liability and autovehicle liability insurance was $128.8$114.2 million, as compared to $117.9$130.3 million at December 31, 2008. If2010. However, if any of the factors that contribute to the overall cost of insurance claims were to change, the actual amount incurred for our self-insurance liabilities would be directly affected. While we believe our loss prevention programs will reduce our total cost for self-insurance claims, our actual cost could be greatermore or less than the amounts currently accrued.
reserved.Litigation Reserves. We are the subject of litigation in the ordinary course of our business. Historically, our litigation has involved lawsuits alleging various regulatory violations. In preparing our financial statements at a given point in time, we accruereserve for loss contingencies that are both probable and reasonably estimable.
Each quarter, we make estimates of our probable losses, if reasonably estimable, and record such amounts in our consolidated financial statements. These amounts represent our best estimate, or may be the minimum range of probable loss when no single best estimate is determinable. We, together with our counsel, monitor developments
25
related to these legal matters and, when appropriate, adjustments are made to reflect current facts and circumstances. Legal fees and expenses associated with the defense of all of our litigation are expensed as such fees and expenses are incurred.
Our accruals At December 31, 2011, and 2010, we had no reserves relating to probable losses for our outstanding litigation follow:
| | | | | | | | | |
| | | Year Ended December 31, | |
| | | 2009 | | | 2008 | |
| | | (In millions) | |
| |
California Attorney General Settlement | | $ | — | | | $ | 9.4 | |
Shafer/Johnson Matter | | | — | | | | 1.8 | |
Other Litigation | | | — | | | | 0.1 | |
| | | | | | | | | |
| Total Accrual | | $ | — | | | $ | 11.3 | |
| | | | | | | | | |
As with most litigation, the ultimate outcome of our pending litigation is uncertain. Additional developments in our litigation or other adverse or positive developments or rulings in our litigation could affect our assumptions and, thus, our accrual. Our estimates with respect to accrual for our litigation expenses reflect our judgment as to the appropriate accounting charge at the end of a period. Factors that we consider in evaluating our litigation reserves include:
| | |
| • | the procedural status of the matter; |
|
| • | our views and the views of our counsel as to the probability of a loss in the matter; |
|
| • | the relative strength of the parties’ arguments with respect to liability and damages in the matter; |
|
| • | settlement discussions, if any, between the parties; |
|
| • | how we intend to defend ourselves in the matter; and |
|
| • | our experience. |
Significant factors that may cause us to increase or decrease our accrual with respect to a matter include:
| | |
| • | judgments or finding of liability against us in the matter by a trial court; |
|
| • | the granting of, or declining to grant, a motion for class certification in the matter; |
|
| • | definitive decisions by appellate courts in the requisite jurisdiction interpreting or otherwise providing guidance as to applicable law; |
|
| • | favorable or unfavorable decisions as the matter progresses; |
|
| • | settlements agreed to in principle by the parties in the matter, subject to court approval; and |
|
| • | final settlement of the matter. |
litigation.Income Taxes. Our annual tax rate is affected by many factors, including the mix of our earnings, legislation and acquisitions, and is based on our income, statutory tax rates and tax planning opportunities available to us in the jurisdictions in which we operate. Tax laws are complex and subject to differing
interpretations between the taxpayer and the taxing authorities. Significant judgment is required in determining our tax expense, evaluating our tax positions and evaluating uncertainties. Deferred income tax assets represent amounts available to reduce income taxes payable in future years. Such assets arise because of temporary differences between the financial reporting and tax bases of assets and liabilities, as well as from net operating loss and tax credit carryforwards. We evaluate the recoverability of these future tax deductions and credits by assessing the future expected taxable income from all sources, including reversal of taxable temporary differences, forecasted operating earnings and available tax planning strategies. These sources of income rely heavily on estimates. We use our historical experience and our short and long-range business forecasts to provide insight and assist us in determining recoverability. We recognize the financial statement benefit of a tax position only after determining that the relevant tax authority would more likely than not sustain the position following an audit. For tax positions meeting the more-likely-than not threshold, the amount recognized in the financial statements is the largest benefit that has a greater than 50 percent likelihood of being realized upon the ultimate settlement with the relevant tax authority. A number of years may elapse before a particular matter, for which we have recorded a liability, is audited and effectively settled. We review our tax positions quarterly and adjust our liability for unrecognized tax benefits in the balance as newperiod in which we determine the issue is effectively settled with the tax authorities, the statute of limitations expires for the relevant taxing authority to examine the tax position or when more information becomes available.
We record deferred taxes for temporary differences between the tax and financial reporting bases of assets and liabilities at the enacted tax rate expected to be in effect when taxes become payable. Income tax accounting
26
requires management to make estimates and apply judgments to events that will be recognized in one period under rules that apply to financial reporting in a different period in our tax returns. In particular, judgment is required when estimating the value of future tax deductions, tax credits and net operating loss carryforwards (NOLs), as represented by deferred tax assets. When it is determined the recovery of all or a portion of a deferred tax asset is not likely, a valuation allowance is established. We include NOLs in the calculation of deferred tax assets. NOLs are utilized to the extent allowable due to the provisions of the Internal Revenue Code of 1986, as amended, and relevant state statutes.
If we make changes to our accruals with respect to our self-insurance liabilities, or litigation or income tax reserves in accordance with the policies described above, our earnings would be impacted. Increases to our accrualsreserves would reduce earnings and, similarly, reductions to our accrualsreserves would increase our earnings. A pre-tax change of $1.1approximately $1.0 million in our estimates would result in a corresponding $0.01 change in our earnings per common share.
Based on an assessment of our accounting policies and the underlying judgments and uncertainties affecting the application of those policies, we believe our consolidated financial statements fairly present in all material respects the financial condition, results of operations and cash flows of our company as of, and for, the periods presented in this report. However, we do not suggest that other general risk factors, such as those discussed elsewhere in this report as well as changes in our growth objectives or performance of new or acquired stores, could not adversely impact our consolidated financial position, results of operations and cash flows in future periods.
Significant Accounting Policies
Our significant accounting policies are summarized below and in Note A to our consolidated financial statements included elsewhere in this report.
Revenue. Merchandise is rented to customers pursuant to rental purchase agreements which provide for weekly, semi-monthly or monthly rental terms with non-refundable rental payments. Generally, the customer has the right to acquire title either through a purchase option or through payment of all required rentals. Rental revenue and fees are recognized over the rental term and merchandise sales revenue is recognized when the customer exercises the purchase option and pays the cash price due. Cash received prior to the period in which it should be recognized is deferred and recognized according to the rental term. Revenue is accrued for uncollected amounts due based on historical collection experience. However, the total amount of the rental purchase agreement is not accrued because the customer can terminate the rental agreement at any time and we cannot enforce collection for non-payment of future rents.
Revenue from the sale of merchandise in our retail installment stores is recognized when the installment note is signed, the customer has taken possession of the merchandise and collectability is reasonably assured.
ThePrior to 2011, revenue from our financial services iswas recognized depending on the type of transaction. Fees collected on loans arewere recognized ratably over the term of the loan. For money orders, wire transfers, check cashing and other customer service type transactions, fee revenue iswas recognized at the time the service iswas performed.
Franchise Revenue. Revenue from the sale of rental merchandise is recognized upon shipment of the merchandise to the franchisee. Franchise royalty income and fee revenue is recognized upon completion of substantially all services and satisfaction of all material conditions required under the terms of the franchise agreement.
Depreciation of Rental Merchandise. Depreciation of rental merchandise is included in the cost of rentals and fees on our statement of earnings. Generally, we depreciate our rental merchandise using the income forecasting method. Under the income forecasting method, merchandise held for rent is not depreciated and merchandise on rent is depreciated in the proportion of rents received to total rents provided in the rental contract, which is an activity-based method similar to the units of production method. Effective July 1, 2009, weWe depreciate merchandise held for rent (except for computers)computers and tablets) that is at least 270 days old and held for rent for at least 180 consecutive days using the straight-line method for a period generally not to exceed 20 months. This change in depreciation method had no material impact on our consolidated financial statements.
27
On computers and tablets that are 24 months old or older and which have become idle, depreciation is recognized using the straight-line method for a period of at least six months, generally not to exceed an aggregate depreciation period of 30 months.
Cost of Merchandise Sold. Cost of merchandise sold represents the net book value of rental merchandise at time of sale. Cost of merchandise sold also includes the cost of services offered by us, such as prepaid telephone and electric services.
Salaries and Other Expenses. Salaries and other expenses include all salaries and wages paid to store level employees, together with district managers’ salaries, travelpayroll taxes and occupancy, including any related benefits, and taxes,travel, as well as all store level general and administrative expenses and selling, advertising, insurance, occupancy, delivery, fixed asset depreciation and other operating expenses.
General and Administrative Expenses. General and administrative expenses include all corporate overhead expenses related to our headquarters such as salaries, payroll taxes and benefits, occupancy, administrative and other operating expenses.
Stock-Based Compensation Expense. We recognize share-based payment awards to our employees and directors at the estimated fair value on the grant date. Determining the fair value of any share-based awardsaward requires information about several variables including,that could include, but are not limited to, expected stock volatility over the terms of the awards,award, expected dividend yields and the predicted employee exercise behavior. We base expected life on historical exercise and post-vesting employment-termination experience, and expected volatility on historical realized volatility trends. In addition, all stock-based compensation expense is recorded net of an estimated forfeiture rate. The forfeiture rate is based upon historical activity and is analyzed at least quarterly as actual forfeitures occur. Stock options granted during the twelve monthsyear ended December 31, 20092011, were valued using the binomial method pricing model with the following assumptions for employee options: an expected volatility of 45.30%33.42% to 66.50%50.12%, a risk-free interest rate of 0.37%0.12% to 2.04%1.78%, noan expected dividend yield of 0.70% to 2.30%, and an expected life of 5.346.05 years. Restricted stock units are valued using the last trade before the day of the grant. During the twelve monthsyear ended December 31, 2009,2011, we recognized $3.7$4.5 million in pre-tax compensation expense related to stock options and restricted stock units granted.
28
Results of Operations
The following table sets forth, for the periods indicated, historical Consolidated Statements of Earnings data as a percentage of total store and franchise revenues.
| | | | | | | | | | | | | | | | | | | | | | | | | |
| | | Year Ended December 31, | | | Year Ended December 31, | |
| | | 2009 | | | 2008 | | | 2007 | | | 2009 | | | 2008 | | | 2007 | |
| | | (Company-owned stores only) | | | (Franchise operations only) | |
| |
Revenues | | | | | | | | | | | | | | | | | | | | | | | | |
| Rentals and fees | | | 86.3 | % | | | 88.0 | % | | | 90.6 | % | | | — | % | | | — | % | | | — | % |
| Merchandise sales | | | 11.6 | | | | 10.5 | | | | 8.5 | | | | 85.5 | | | | 87.1 | | | | 79.6 | |
| Other/Royalty income and fees | | | 2.1 | | | | 1.5 | | | | 0.9 | | | | 14.5 | | | | 12.9 | | | | 20.4 | |
| | | | | | | | | | | | | | | | | | | | | | | | | |
| | | | 100.0 | % | | | 100.0 | % | | | 100.0 | % | | | 100.0 | % | | | 100.0 | % | | | 100.0 | % |
| | | | | | | | | | | | | | | | | | | | | | | | | |
Operating Expenses | | | | | | | | | | | | | | | | | | | | | | | | |
| Direct store expenses | | | | | | | | | | | | | | | | | | | | | | | | |
| Cost of rentals and fees | | | 19.5 | % | | | 20.1 | % | | | 20.0 | % | | | — | % | | | — | % | | | — | % |
| Cost of merchandise sold | | | 7.6 | | | | 7.5 | | | | 5.9 | | | | 81.7 | | | | 83.0 | | | | 76.1 | |
| Salaries and other expenses | | | 57.2 | | | | 58.0 | | | | 58.9 | | | | — | | | | — | | | | — | |
| | | | | | | | | | | | | | | | | | | | | | | | | |
| | | | 84.3 | | | | 85.6 | | | | 84.8 | | | | 81.7 | | | | 83.0 | | | | 76.1 | |
| General and administrative expenses | | | 5.1 | | | | 4.3 | | | | 4.3 | | | | 10.6 | | | | 10.3 | | | | 7.8 | |
| Amortization and write-down of intangibles | | | 0.1 | | | | 0.6 | | | | 0.5 | | | | — | | | | — | | | | — | |
| Litigation expense (credit) | | | (0.2 | ) | | | (0.2 | ) | | | 2.2 | | | | — | | | | — | | | | — | |
| Restructuring charge | | | — | | | | 0.2 | | | | 1.4 | | | | — | | | | — | | | | — | |
| | | | | | | | | | | | | | | | | | | | | | | | | |
| Total operating expenses | | | 89.3 | | | | 90.5 | | | | 93.2 | | | | 92.3 | | | | 93.3 | | | | 83.9 | |
| | | | | | | | | | | | | | | | | | | | | | | | | |
| Operating profit | | | 10.7 | | | | 9.5 | | | | 6.8 | | | | 7.7 | | | | 6.7 | | | | 16.1 | |
| Interest, net and other income | | | 1.0 | | | | 1.9 | | | | 3.1 | | | | (1.4 | ) | | | (1.6 | ) | | | (1.6 | ) |
| | | | | | | | | | | | | | | | | | | | | | | | | |
| Earnings before income taxes | | | 9.7 | % | | | 7.6 | % | | | 3.7 | % | | | 9.1 | % | | | 8.3 | % | | | 17.7 | % |
| | | | | | | | | | | | | | | | | | | | | | | | | |
2009 Overview
Highlights of our operating results for the year ended December 31, 2009 include:
| | |
| • | Increased operating profit by $21.9 million, or 8.0%. |
|
| • | Generated $330.1 million in operating cash flow. |
|
| • | Reduced outstanding indebtedness by $235.9 million, including the repurchase of all of our senior subordinated notes. |
|
| • | Repurchased 472,100 shares of our common stock for an aggregate purchase price of $8.8 million. |
Comparison of the Years ended December 31, 20092011 and 20082010
Store Revenue. Total store revenue increased by $147.0 million, or 5.5%, to $2,843.2 million in 2011 from $2,696.2 million in 2010. This increase was primarily due to the revenue growth of the RAC Acceptance segment, partially offset by a reduction in revenues related to the discontinuation of our financial services business.
Same store revenues represent those revenues earned in 2,604 locations that were operated by us for each of the entire twelve month periods ended December 31, 2011 and 2010. Same store revenues increased by $17.5 million, or 0.8%, to $2,277.0 million in 2011 as compared to $2,259.5 million in 2010. This increase was primarily due to an increase in units on rent.
Franchise Revenue. Total franchise revenue increased by $3.6 million, or 10.0%, to $39.0 million in 2011 as compared to $35.4 million in 2010. This increase was primarily attributable to an increase in the number of products sold to franchisees in 2011 as compared to 2010.
Cost of Rentals and Fees. Cost of rentals and fees consists primarily of depreciation of rental merchandise. Cost of rentals and fees for 2011 increased by $51.2 million, or 9.9%, to $570.5 million as compared to $519.3 million in 2010. This increase was primarily attributable to an increase in rental and fee revenue in 2011 as compared to 2010. Cost of rentals and fees expressed as a percentage of store rentals and fees revenue increased slightly to 22.8% in 2011 as compared to 22.2% in 2010, driven by a change in sales strategies in the Core U.S. segment and higher merchandise costs in the RAC Acceptance segment.
Cost of Merchandise Sold. Cost of merchandise sold increased by $37.8 million, or 23.0%, to $201.9 million in 2011 from $164.1 million in 2010. The increase was due primarily to the expansion of our RAC Acceptance segment. The gross margin percent of merchandise sales decreased to 22.3% in 2011 from 25.5% in 2010. This decrease was primarily the result of higher merchandise costs in the RAC Acceptance segment.
Franchise Cost of Merchandise Sold. Franchise cost of merchandise sold increased by $3.3 million, or 11.1%, to $32.5 million in 2011 as compared to $29.2 million in 2010. This increase was primarily attributable to an increase in the number of products sold to franchisees in 2011 as compared to 2010.
Gross Profit. Gross profit increased by $56.8 million, or 2.8%, to $2,052.5 million in 2011 as compared to $1,995.7 million in 2010, primarily due to increased revenue in the RAC Acceptance segment, partially offset by decreased revenue as a result of the discontinuation of the financial services business, which was reported in the Core U.S. segment. Gross profit as a percentage of total revenue decreased to 71.2% in 2011 from 73.1% for 2010 due to the discontinuation of the financial services business in the Core U.S. segment and lower margins as a percentage of revenue in the RAC Acceptance segment.
Salaries and Other Expenses. Salaries and other expenses increased by $51.1 million, or 3.3%, to $1,594.5 million in 2011 as compared to $1,543.4 million in 2010. This increase was attributable to increased expenses associated with the expansion of our RAC Acceptance and International segments. Charge offs in our rental stores due to customer stolen merchandise, expressed as a percentage of rental store revenues, were approximately 2.6% in 2011 as compared to 2.3% in 2010. Salaries and other expenses expressed as a percentage of total store revenue decreased to 56.1% in 2011 from 57.2% in 2010 due to continued efforts to decrease labor and other store-related expenses.
General and Administrative Expenses. General and administrative expenses increased by $9.8 million, or 7.8%, to $136.1 million in 2011 as compared to $126.3 million in 2010. This increase was primarily the result of an increase in expenses associated with the expansion of our RAC Acceptance and International segments. General and administrative expenses expressed as a percentage of total revenue increased slightly to 4.7% in 2011 from 4.6% in 2010.
Amortization and Write-Down of Intangibles. Amortization of intangibles increased by $1.4 million, or 43.7%, to $4.7 million in 2011 from $3.3 million in 2010. This increase was primarily attributable to an increase in amortization of vendor relationships and customer contracts recorded as a result of the 2010 acquisition of The Rental Store, Inc., partially offset by a decrease in the write-down of goodwill for stores sold or closed in 2011 as compared to 2010.
Operating Profit. Operating profit decreased by $10.6 million, or 3.5%, to $293.2 million in 2011 as compared to $303.8 million in 2010. Operating profit as a percentage of total revenue decreased to 10.2% in 2011 from 11.1% for 2010. These decreases were primarily attributable to $13.9 million of restructuring charges in 2011 for the closure of eight Home Choice stores in Illinois and 24 RAC Limited locations within third party grocery stores, the closure of 26 core rent-to-own stores following the sale of all customer accounts at those locations, post-acquisition lease terminations related to the acquisitions of The Rental Store, Inc. and 58 rent-to-own stores, and an increase in expenses associated with our 2011 expansion of the RAC Acceptance and International segments. Operating profit was favorably impacted by increased gross profit as discussed above.
Interest Expense. Interest expense increased by $10.4 million, or 39.1%, to $37.2 million in 2011 as compared to $26.8 million in 2010. This increase was primarily attributable to the interest associated with our senior notes issued in the fourth quarter of 2010 and an increase in our weighted average interest rate to 5.41% in 2011 from 4.62% in 2010 due to an increase in the Eurodollar rate in 2011 as compared to 2010, partially offset by a decrease in our senior term loans outstanding in 2011 as compared to 2010.
Income Tax Expense. Our effective income tax rate was 35.8% and 37.5% for 2011 and 2010, respectively. The 2011 provision for income taxes was less than 2010 due primarily to our evaluation of the realizability of certain deferred tax assets and adjustments to our liability for unrecognized tax benefits.
Net Earnings and Earnings per Share. Net earnings decreased by $7.0 million, or 4.1%, to $164.6 million in 2011 as compared to $171.6 million in 2010. This decrease was primarily attributable to a decrease in operating profit and an increase in interest expense, partially offset by a decrease in income tax expense in 2011 as compared to 2010. Diluted earnings per share in 2011 were $2.66 compared to $2.60 in 2010. The increase was due primarily to a decrease in the share base driven by the repurchase of approximately 5.9 million shares throughout 2011.
Comparison of the Years ended December 31, 2010 and 2009
Store Revenue. Total store revenue decreased by $126.9$22.9 million, or 4.5%0.8%, to $2,696.2 million in 2010 from $2,719.1 million in 2009 from $2,846.0 million in 2008.2009. This decrease in total store revenue was primarily the result of a 3.5% reduction in same store sales, predominantly attributable to a decreasethe November 2009 divestiture of our subsidiary engaged in the number of units per customer, together with the impact of the 2007 restructuring plan.
prepaid telecommunications and energy business, which contributed approximately $50.5 million in merchandise sales in 2009, offset by an increase in installment sales and other revenue.Same store revenues represent those revenues earned in 2,2772,627 stores that were operated by us for each of the entire twelve month periods ended December 31, 20092010 and 2008.2009. Same store revenues decreased by $71.3$9.6 million, or 3.5%0.4%, to $1,985.3$2,262.0 million in 20092010 as compared to $2,056.6$2,271.6 million in 2008.2009. This decrease in same store revenues was primarily attributable to a decreaselower average revenue per agreement in the number of units per customer in 20092010 as compared to 2008.
29
Franchise Revenue. Total franchise revenue decreasedincreased by $5.4$2.6 million, or 14.1%7.9%, to $35.4 million in 2010 as compared to $32.8 million in 2009 as compared to $38.2 million in 2008.2009. This decreaseincrease was primarily attributable to a decreasean increase in the number of products sold to franchisees in 20092010 as compared to 2008 due to fewer franchise stores in 2009.
Cost of Rentals and Fees. Cost of rentals and fees consists of depreciation of rental merchandise and the costs associated with our membership programs. Cost of rentals and fees for 20092010 decreased by $42.9$10.7 million, or 7.5%2.0%, to $530.0$519.3 million as compared to $572.9$530.0 million in 2008.2009. This decrease in cost of rentals and fees iswas primarily attributable tothe result of a decreaselower average cost per unit in the number of units on rent in 20092010 as compared to 2008.2009. Cost of rentals and fees expressed as a percentage of store rentals and fees revenue decreased slightly to 22.2% in 2010 as compared to 22.6% in 2009 as compared to 22.9% in 2008.
2009.Cost of Merchandise Sold.Cost of merchandise sold decreased by $6.2$24.3 million, or 3.2%12.9%, to $164.1 million in 2010 from $188.4 million in 2009 from $194.6 million in 2008.2009. The gross margin percent of merchandise sales increaseddecreased to 25.5% in 2010 from 28.0% in 2009. These decreases were primarily the result of the November 2009 from 24.2%divestiture of our subsidiary engaged in 2008.the prepaid telecommunications and energy business.
Franchise Cost of Merchandise Sold. Franchise cost of merchandise sold increased by $2.4 million, or 9.0%, to $29.2 million in 2010 as compared to $26.8 million in 2009. This percentage increase was primarily attributable to a higher margin on early purchase option transactions duringan increase in the 2009 period.
number of products sold to franchisees in 2010 as compared to 2009.Salaries and Other Expenses. Salaries and other expenses decreased by $95.7$12.7 million, or 5.8%0.8%, to $1,543.4 million in 2010 as compared to $1,556.1 million in 2009 as compared to $1,651.8 million in 2008.2009. This decrease was primarily attributable to a decrease in store level expenses due to our cost control initiatives, such as improvementsprimarily in the management of labor expense, delivery costs and inventory losses.expense. Charge
offs in our rental stores due to customer stolen merchandise, expressed as a percentage of rental store revenues, wereremained unchanged at approximately 2.3% in 2009 as compared to 2.5% in 2008.2010 and 2009. Salaries and other expenses expressed as a percentage of total store revenue decreased toremained unchanged at 57.2% in 2009 from 58.0% in 2008.
2010 and 2009.Franchise Cost of Merchandise Sold.General and Administrative Expenses. Franchise cost of merchandise soldGeneral and administrative expenses decreased by $4.9$11.3 million, or 15.4%8.2%, to $26.8$126.3 million in 20092010 as compared to $31.7$137.6 million in 2008.2009. This decrease was primarily attributable to a decreasethe result of the November 2009 divestiture of our subsidiary engaged in the number of products sold to franchisees in 2009 as compared to 2008 due to fewer franchise stores in 2009.
Generalprepaid telecommunications and Administrative Expenses. General and administrative expenses increased by $12.0 million, or 9.5%, to $137.6 million in 2009 as compared to $125.6 million in 2008.energy business. General and administrative expenses expressed as a percentage of total revenue increaseddecreased to 4.6% in 2010 from 5.0% in 2009 from 4.4% in 2008. These increases are primarily attributable to additional personnel and related expansion at our corporate office to support our strategic initiatives.
2009.Amortization and Write-Down of Intangibles. Amortization of intangibles decreasedincreased by $13.8$411,000, or 14.5%, to $3.3 million or 82.9%, toin 2010 from $2.8 million in 2009 from $16.6 million in 2008.2009. This decreaseincrease was due to intangible assetsthe write-down of goodwill associated with the acquisition of Rent-Way that were fully amortizedstores sold or closed in 20092010 as compared to 2008.
2009.Operating Profit. Operating profit increased by $21.9$7.5 million, or 8.0%2.5%, to $303.8 million in 2010 as compared to $296.3 million in 20092009. This increase was primarily attributable to a reduction in expenses, offset by an $18.9 million impairment charge related to the discontinuation of our financial services business in 2010 as compared to $274.4 million in 2008.2009. Operating profit as a percentage of total revenue increased to 11.1% in 2010 from 10.8% in 2009 from 9.5% for 2008. This increase was primarily attributable to a reduction in expenses and an improvement in gross margins offset by lower revenue in the 2009 period as compared to 2008.
2009.Interest Expense. Interest expense decreased by $39.4 million, or 59.6%, toremained unchanged at $26.8 million in 2009 as compared to $66.2 million in 2008. This decrease2010 and 2009. Interest expense was attributable to a decrease in our outstanding indebtedness in 2009 as compared to 2008, as well as a decreasenot impacted by the increase in our weighted average interest rate to 4.62% in 2010 from 3.37% in 2009 as compared to 6.21% in 2008 due to a decrease in the Eurodollar rateour outstanding debt in 20092010 as compared to 2008.
2009.Income Tax Expense.Expense. Income tax expense increased slightly by $20.8$600,000, or 0.6%, to $103.1 million or 25.4%,in 2010 as compared to $102.5 million in 2009 as compared to $81.7 million in 2008. This increase is attributable to an increase in earnings before taxes for 2009 as compared to 2008 and an increase in our overall effective tax rate to 37.9% for 2009 as compared to 36.9% for 2008. The 2009 increase in our overall effective tax rate is primarily attributable to an increase in our state effective tax rate as well as certain state tax benefits realized in 2008 related to audit settlements that did not recur in 2009.
Net Earnings.Net earnings increased by $28.3$3.7 million, or 20.2%2.3%, to $171.6 million in 2010 as compared to $167.9 million in 2009 as compared to $139.6 million in 2008.2009. This increase was primarily attributable to an increase in operating profit, and a decrease in interest expense, offset by an increasethe $3.1 million financing expense related to the write-off of unamortized financing costs in income tax expense in 20092010 as compared to 2008.
30
Comparison of the Years ended December 31, 2008 and 2007
Store Revenue. Total store revenue decreased by $17.1 million, or 0.6%, to $2,846.0 million in 2008 from $2,863.1 million in 2007. The decrease in total store revenue was primarily attributable to approximately 315 fewer stores in the 2008 period, principally due to the 2007 store consolidation plan, offset by an increase in same store sales of 2.3%.
Same store revenues represent those revenues earned in 2,201 stores that were operated by us for each of the entire twelve month periods ended December 31, 2008 and 2007. Same store revenues increased by $43.5 million, or 2.3%, to $1,972.4 million in 2008 as compared to $1,928.9 million in 2007. This increase in same store revenues was primarily attributable to an increase in the average price per unit on rent and an increase in merchandise sales and financial services revenue in 2008 as compared to 2007.
Franchise Revenue. Total franchise revenue decreased by $4.8 million, or 11.1%, to $38.2 million in 2008 as compared to $43.0 million in 2007. This decrease was primarily attributable to the receipt of accelerated royalty payments from five affiliated ColorTyme franchisees in consideration of the termination of their franchise agreements in 2007.
Cost of Rentals and Fees. Cost of rentals and fees consists of depreciation of rental merchandise and the costs associated with our membership programs. Cost of rentals and fees for 2008 decreased by $1.1 million, or 0.2%, to $572.9 million as compared to $574.0 million in 2007. Cost of rentals and fees expressed as a percentage of store rentals and fees revenue increased slightly to 22.9% in 2008 compared to 22.1% in 2007. This percentage increase was due to an increase in promotional activity in 2008 as compared to 2007.
Cost of Merchandise Sold. Cost of merchandise sold increased by $38.1 million, or 24.3%, to $194.6 million for 2008 from $156.5 million for 2007. The gross margin percent of merchandise sales decreased slightly to 24.2% in 2008 from 25.1% in 2007. This percentage decrease was primarily attributable to an increased volume of sales of prepaid services at a lower margin than our historical margins on merchandise sales, as well as increased promotional activity during the 2008 period.
Salaries and Other Expenses. Salaries and other expenses decreased by $33.2 million, or 2.0%, to $1,651.8 million in 2008 as compared to $1,685.0 million in 2007. The decrease was primarily the result of a decrease in expenses associated with the decrease in our store base due to our 2007 store consolidation plan and other restructuring items. Charge offs in our rental stores due to customer stolen merchandise, expressed as a percentage of rental store revenues, were approximately 2.5% in 2008 as compared to 2.8% in 2007. Salaries and other expenses expressed as a percentage of total store revenue decreased slightly to 58.0% in 2008 from 58.9% in 2007.
Franchise Cost of Merchandise Sold. Franchise cost of merchandise sold decreased by $1.0 million, or 3.1%, to $31.7 million in 2008 as compared to $32.7 million in 2007. This decrease was primarily attributable to a decrease in the number of products sold to franchisees in 2008 as compared to 2007.
General and Administrative Expenses. General and administrative expenses increased by $1.9 million, or 1.6%, to $125.6 million in 2008 as compared to $123.7 million in 2007. General and administrative expenses expressed as a percent of total revenue increased slightly to 4.4% in 2008 from 4.3% in 2007.
Amortization and Write-Down of Intangibles. Amortization of intangibles increased by approximately $900,000 or 5.7%, to $16.6 million for 2008 from $15.7 million for 2007. This increase was primarily attributable to the goodwill write-down for stores sold, offset by intangible assets that were fully amortized during 2008 as compared to 2007.
Operating Profit. Operating profit increased by $70.2 million, or 34.3%, to $274.4 million for 2008 as compared to $204.2 million in 2007. Operating profit as a percentage of total revenue increased to 9.5% for 2008 from 7.0% for 2007. This increase was primarily attributable to the litigation charge of $62.3 million recorded in the 2007 period.
Interest Expense. Interest expense decreased by $28.6 million, or 30.0%, to $66.2 million for 2008 as compared to $94.8 million in 2007. This decrease was attributable to a decrease in borrowings under our senior
31
credit facilities in 2008 as compared to 2007, a reduction in amounts outstanding under our senior term loans and subordinated notes, and a decrease in our weighted average interest rate to 6.21% in 2008 as compared to 7.68% in 2007 due to a decrease in the Eurodollar rate in 2008 as compared to 2007.
Income Tax Expense. Income tax expense increased by $41.7 million, or 104.2%, to $81.7 million in 2008 as compared to $40.0 million in 2007. This increase is attributable to an increase in earnings before taxes for 2008 as compared to 2007 and an increase in our overall effective tax rate to 36.9% for 2008 as compared to 34.4% for 2007. The 2008 increase in our overall effective tax rate is primarily attributable to a 3.7% increase in our state effective tax rate since we realized a greater benefit on our state income taxes in 2007 due to the impact of the charge related to our store consolidation plan as compared to 2008.
Net Earnings. Net earnings increased by $63.3 million, or 83.1%, to $139.6 million for 2008 as compared to $76.3 million in 2007. This increase was primarily attributable to an increase in operating profit, a gain on debt extinguishment and a decrease in interest expense, offset by an increase in income tax expense in 2008 as compared to 2007.
Quarterly Results
The following table contains certain unaudited historical financial information for the quarters indicated.
| | | | | | | | | | | | | | | | | |
| | | 1st Quarter | | 2nd Quarter | | 3rd Quarter | | 4th Quarter |
| | | (In thousands, except per share data) |
| |
Year ended December 31, 2009 | | | | | | | | | | | | | | | | |
| Revenues | | $ | 728,183 | | | $ | 679,609 | | | $ | 671,251 | | | $ | 672,913 | |
| Operating profit | | | 82,092 | | | | 75,283 | | | | 64,367 | | | | 74,582 | |
| Net earnings | | | 45,376 | | | | 41,945 | | | | 36,840 | | | | 43,694 | |
| Basic earnings per common share | | $ | 0.69 | | | $ | 0.64 | | | $ | 0.56 | | | $ | 0.66 | |
| Diluted earnings per common share | | $ | 0.68 | | | $ | 0.63 | | | $ | 0.55 | | | $ | 0.66 | |
Year ended December 31, 2008 | | | | | | | | | | | | | | | | |
| Revenues | | $ | 756,636 | | | $ | 719,031 | | | $ | 708,755 | | | $ | 699,750 | |
| Operating profit | | | 77,540 | | | | 74,434 | | | | 58,549 | | | | 63,865 | |
| Net earnings | | | 36,358 | | | | 37,741 | | | | 29,379 | | | | 36,146 | |
| Basic earnings per common share | | $ | 0.55 | | | $ | 0.57 | | | $ | 0.44 | | | $ | 0.54 | |
| Diluted earnings per common share | | $ | 0.54 | | | $ | 0.56 | | | $ | 0.44 | | | $ | 0.54 | |
Year ended December 31, 2007 | | | | | | | | | | | | | | | | |
| Revenues | | $ | 755,299 | | | $ | 724,158 | | | $ | 709,701 | | | $ | 716,963 | |
| Operating profit | | | 46,155 | | | | 87,024 | | | | 60,575 | | | | 10,483 | |
| Net earnings(loss) | | | 15,103 | | | | 41,251 | | | | 25,275 | | | | (5,361 | ) |
| Basic earnings(loss) per common share | | $ | 0.21 | | | $ | 0.59 | | | $ | 0.37 | | | $ | (0.08 | ) |
| Diluted earnings(loss) per common share | | $ | 0.21 | | | $ | 0.58 | | | $ | 0.37 | | | $ | (0.08 | ) |
32
| | | | | | | | | | | | | | | | |
| | | 1st Quarter | | | 2nd Quarter | | | 3rd Quarter | | | 4th Quarter | |
| | | (In thousands, except per share data) | |
Year Ended December 31, 2011 | | | | | | | | | | | | | | | | |
Revenues | | $ | 742,178 | | | $ | 698,253 | | | $ | 704,271 | | | $ | 737,482 | |
Gross profit | | | 523,148 | | | | 506,355 | | | | 505,724 | | | | 517,289 | |
Operating profit | | | 80,419 | | | | 73,152 | | | | 57,796 | | | | 81,790 | |
Net earnings | | | 44,230 | | | | 39,888 | | | | 31,224 | | | | 49,295 | |
Basic earnings per common share | | $ | 0.70 | | | $ | 0.64 | | | $ | 0.52 | | | $ | 0.84 | |
Diluted earnings per common share | | $ | 0.69 | | | $ | 0.63 | | | $ | 0.52 | | | $ | 0.83 | |
Cash dividends paid per common share | | $ | 0.06 | | | $ | 0.06 | | | $ | 0.16 | | | $ | 0.16 | |
Year Ended December 31, 2010 | | | | | | | | | | | | | | | | |
Revenues | | $ | 718,419 | | | $ | 671,543 | | | $ | 664,580 | | | $ | 677,090 | |
Gross profit | | | 513,000 | | | | 497,665 | | | | 490,013 | | | | 494,994 | |
Operating profit | | | 88,703 | | | | 82,831 | | | | 69,393 | | | | 62,842 | |
Net earnings | | | 51,461 | | | | 47,830 | | | | 40,497 | | | | 31,854 | |
Basic earnings per common share | | $ | 0.78 | | | $ | 0.73 | | | $ | 0.62 | | | $ | 0.50 | |
Diluted earnings per common share | | $ | 0.77 | | | $ | 0.72 | | | $ | 0.62 | | | $ | 0.49 | |
Cash dividends paid per common share | | $ | — | | | $ | — | | | $ | 0.06 | | | $ | 0.06 | |
| | | | | | | | | | | | | | | | |
| | | 1st Quarter | | | 2nd Quarter | | | 3rd Quarter | | | 4th Quarter | |
| | | (In thousands, except per share data) | |
Year Ended December 31, 2009 | | | | | | | | | | | | | | | | |
Revenues | | $ | 728,183 | | | $ | 679,609 | | | $ | 671,251 | | | $ | 672,913 | |
Gross profit | | | 515,212 | | | | 494,422 | | | | 487,239 | | | | 491,125 | |
Operating profit | | | 82,092 | | | | 75,283 | | | | 64,367 | | | | 74,582 | |
Net earnings | | | 45,376 | | | | 41,945 | | | | 36,840 | | | | 43,694 | |
Basic earnings per common share | | $ | 0.69 | | | $ | 0.64 | | | $ | 0.56 | | | $ | 0.66 | |
Diluted earnings per common share | | $ | 0.68 | | | $ | 0.63 | | | $ | 0.55 | | | $ | 0.66 | |
| | | | | | | | | | | | | | | | |
| | | 1st Quarter | | | 2nd Quarter | | | 3rd Quarter | | | 4th Quarter | |
| | | (As a percentage of revenues) | |
Year Ended December 31, 2011 | | | | | | | | | | | | | | | | |
Revenues | | | 100.0 | % | | | 100.0 | % | | | 100.0 | % | | | 100.0 | % |
Gross profit | | | 70.5 | | | | 72.5 | | | | 71.8 | | | | 70.1 | |
Operating profit | | | 10.8 | | | | 10.5 | | | | 8.2 | | | | 11.1 | |
Net earnings | | | 6.0 | | | | 5.7 | | | | 4.4 | | | | 6.7 | |
Year Ended December 31, 2010 | | | | | | | | | | | | | | | | |
Revenues | | | 100.0 | % | | | 100.0 | % | | | 100.0 | % | | | 100.0 | % |
Gross profit | | | 71.4 | | | | 74.1 | | | | 73.7 | | | | 73.1 | |
Operating profit | | | 12.3 | | | | 12.3 | | | | 10.4 | | | | 9.3 | |
Net earnings | | | 7.2 | | | | 7.1 | | | | 6.1 | | | | 4.7 | |
Year Ended December 31, 2009 | | | | | | | | | | | | | | | | |
Revenues | | | 100.0 | % | | | 100.0 | % | | | 100.0 | % | | | 100.0 | % |
Gross profit | | | 70.8 | | | | 72.8 | | | | 72.6 | | | | 73.0 | |
Operating profit | | | 11.3 | | | | 11.1 | | | | 9.6 | | | | 11.1 | |
Net earnings | | | 6.2 | | | | 6.2 | | | | 5.5 | | | | 6.5 | |
| | | | | | | | | | | | | | | | | |
| | | 1st Quarter | | 2nd Quarter | | 3rd Quarter | | 4th Quarter |
| | | (As a percentage of revenues) |
| |
Year ended December 31, 2009 | | | | | | | | | | | | | | | | |
| Revenues | | | 100.0 | % | | | 100.0 | % | | | 100.0 | % | | | 100.0 | % |
| Operating profit | | | 11.3 | | | | 11.1 | | | | 9.6 | | | | 11.1 | |
| Net earnings | | | 6.2 | | | | 6.2 | | | | 5.5 | | | | 6.5 | |
Year ended December 31, 2008 | | | | | | | | | | | | | | | | |
| Revenues | | | 100.0 | % | | | 100.0 | % | | | 100.0 | % | | | 100.0 | % |
| Operating profit | | | 10.2 | | | | 10.4 | | | | 8.3 | | | | 9.1 | |
| Net earnings | | | 4.8 | | | | 5.2 | | | | 4.1 | | | | 5.2 | |
Year ended December 31, 2007 | | | | | | | | | | | | | | | | |
| Revenues | | | 100.0 | % | | | 100.0 | % | | | 100.0 | % | | | 100.0 | % |
| Operating profit | | | 6.1 | | | | 12.0 | | | | 8.5 | | | | 1.5 | |
| Net earnings(loss) | | | 2.0 | | | | 5.7 | | | | 3.6 | | | | (0.7 | ) |
Liquidity and Capital Resources
Overview. For the year ended December 31, 2009,2011, we generated $330.1$286.6 million in operating cash flow. In addition to funding operating expenses, we used $68.8$132.7 million in cash for capital expenditures, $7.2$26.7 million for store acquisitions, $8.8$164.3 million for common stock repurchases, and $235.9 million to reduce debt.paid cash dividends of $26.9 million. We ended the year with $101.8$88.1 million in cash and cash equivalents.
Analysis of Cash Flow.Cash provided by operating activities decreasedincreased by $54.2$70.1 million to $330.1$286.6 million in 20092011 from $384.3$216.5 million in 2008.2010. This decrease isincrease was primarily attributable to the reversalreceipt of approximately $113.0 million in 2009tax refunds in 2011 that were paid in 2010 prior to the enactment of taxes deferred in 2008, resulting in the paymentSmall Business Jobs Act of higher cash tax amounts in 2009.
2010 (the “2010 Jobs Act”).Cash used in investing activities increaseddecreased by $1.4$8.0 million to $72.9$159.2 million in 20092011 from $71.5$167.2 million in 2008.
2010. This decrease in 2011 as compared to 2010 was primarily attributable to a decrease in acquisitions of businesses, partially offset by an increase in capital expenditures as discussed below.Cash used in financing activities decreasedincreased by $78.1$28.5 million to $245.1$109.8 million in 20092011 from $323.2$81.3 million in 2008.2010. This decreaseincrease in 20092011 as compared to 2008 is2010 was primarily related to the payments onincreased repurchases of our senior debtcommon stock and payment of dividends in 2008,2011, partially offset by the repurchase of our subordinated notesnet cash provided through debt refinancing and an increase in 2009.
stock option exercises in 2011.Liquidity Requirements.Requirements. Our primary liquidity requirements are for debt service, rental merchandise purchases, capital expenditures, implementation of our growth strategies, including investment in our financial services business,capital expenditures and litigation expenses, including settlements or judgments.debt service. Our primary sources of liquidity have been cash provided by operations and borrowings. In the future, to provide any additional funds necessary for the continued pursuitoperations and expansion of our operating and growth strategies,business, we may incur from time to time additional short-term or long-term bank indebtedness and may issue, in public or private transactions, equity and debt securities. The availability and attractiveness of any outside sources of financing will depend on a number of factors, some of which relate to our financial condition and performance, and some of which are beyond our control, such as prevailing interest rates and general financing and economic conditions. The global financial markets continue to experience volatility and adverse conditions and such volatilityconditions in the capital markets may affect our ability to access additional sources of financing. There can be no assurance that additional financing will be available, or if available, that it will be on terms we find acceptable.
We believe the cash flow generated from operations, together with amounts available under our senior credit facilities, will be sufficient to fund our liquidity requirements as discussed above (including mandatory principal payments) during the next twelve months. Our revolving credit facilities, including our $20.0$20 million line of credit at Intrust Bank, provide us with revolving loans in an aggregate principal amount not exceeding $370.0$520.0 million, of which $241.7$218.8 million was available at February 19, 2010.17, 2012. At February 19, 2010,17, 2012, we had $106.4$83.6 million in cash. To the extent we have available cash that is not necessary to fund the items listed above, we may repurchase additional shares of our common stock, declare and pay dividends on our common stock, or make additional payments to service our existing debt. While our operating cash flow has been strong and we expect this strength to continue, our liquidity could be negatively impacted if we do not remain as profitable as we expect.
33
A change in control would result in an event of default under our senior credit facilities which would allow our lenders to accelerate the indebtedness owed to them. In addition, if a change in control occurs, we may be required to offer to repurchase all of our outstanding senior unsecured notes at 101% of their principal amount, plus accrued interest to the date of repurchase. Our senior credit facilities restrict our ability to repurchase the senior unsecured notes, including in the event of a change in control. In the event a change in control occurs, we cannot be sure we would have enough funds to immediately pay our accelerated senior credit facility and senior note obligations or that we would be able to obtain financing to do so on favorable terms, if at all.
Litigation.In our history, we have defended class action lawsuits alleging various regulatory violations and have paid material amounts to settle such claims. Significant settlement amounts or final judgments could materially and adversely affect our liquidity.
Please refer to“Legal Proceedings” elsewhere in this report.Deferred Taxes.On February 17, 2009, President Obama signed into law the American Recovery and Reinvestment Act of 2009 (the “2009 Recovery Act”) which extendsextended the bonus depreciation provision of the 2008 Stimulus Act by continuing the bonus first-year depreciation deduction of 50% of the adjusted basis of qualified property placed in service during 2009. On September 27, 2010, President Obama signed into law the 2010 Jobs Act, which again extended the bonus depreciation provision of the 2009 Recovery Act by continuing the bonus first-year depreciation deduction of 50% of the adjusted basis of qualified property placed in service during 2010. On December 17, 2010, President Obama signed into law the Tax Relief, Unemployment Insurance Reauthorization and Job Creation Act of 2010 (the “2010 Tax Relief Act”), which enacted 100% bonus depreciation on assets purchased after September 8, 2010 and before January 1, 2012. This act also provided 50% bonus depreciation on assets purchased between January 1, 2012 and December 31, 2012.
Accordingly, our cash flow again benefited in 20092011 from having a lower cash tax obligation which, in turn, provided additional cash flow from operations. We estimate our 2009 operatingthat the tax acts discussed above resulted in a net benefit of $104.0 million, $50.0 million of which is deferred, resulting in a 2011 cash flow increased by approximately $16.0 million as a resultbenefit of the 2009 Recovery Act, net of the $59.0 million reversal associated with the 2008 Stimulus Act.$54.0 million. We estimate that the remaining tax deferral associated with the 2008 Stimulus Act and the 2009 Recovery Actthese acts approximates $92.0$266.0 million at December 31, 2009,2011, of which approximately 79%72%, or $72.0$192.0 million will reverse in 20102012 and the remainder will reverse between 20112013 and 2012.
2014.Merchandise Inventory.Inventory. A reconciliation of merchandise inventory, which includes purchases, follows:
| | | | | | | | | | | | | |
| | | December 31, | |
| | | 2009 | | | 2008 | | | 2007 | |
| | | (In thousands) | |
| |
| Beginning merchandise value | | $ | 822,487 | | | $ | 940,304 | | | $ | 1,058,587 | |
| Inventory additions through acquisitions | | | 1,813 | | | | 4,890 | | | | 5,544 | |
| Purchases | | | 719,209 | | | | 730,006 | | | | 747,251 | |
| Depreciation of rental merchandise | | | (519,103 | ) | | | (561,414 | ) | | | (561,880 | ) |
| Cost of goods sold | | | (173,951 | ) | | | (175,835 | ) | | | (169,773 | ) |
| Skips and stolens | | | (60,860 | ) | | | (71,780 | ) | | | (79,818 | ) |
Other inventory deletions(1) | | | (35,528 | ) | | | (43,684 | ) | | | (59,607 | ) |
| | | | | | | | | | | | | |
| Ending merchandise value | | $ | 754,067 | | | $ | 822,487 | | | $ | 940,304 | |
| | | | | | | | | | | | | |
| | | | | | | | | | | | |
| | | December 31, | |
| | | 2011 | | | 2010 | | | 2009 | |
| | | (In thousands) | |
Beginning merchandise value | | $ | 842,271 | | | $ | 754,067 | | | $ | 822,487 | |
Inventory additions through acquisitions | | | 6,023 | | | | 27,325 | | | | 1,813 | |
Purchases | | | 993,598 | | | | 848,004 | | | | 719,209 | |
Depreciation of rental merchandise | | | (556,945 | ) | | | (506,854 | ) | | | (519,103 | ) |
Cost of goods sold | | | (226,688 | ) | | | (187,436 | ) | | | (173,951 | ) |
Skips and stolens | | | (76,286 | ) | | | (62,983 | ) | | | (60,860 | ) |
Other inventory deletions(1) | | | (24,683 | ) | | | (29,852 | ) | | | (35,528 | ) |
| | | | | | | | | | | | |
Ending merchandise value | | $ | 957,290 | | | $ | 842,271 | | | $ | 754,067 | |
| | | | | | | | | | | | |
| | |
| (1) | | Other inventory deletions include loss/damage waiver claims and unrepairable and missing merchandise, as well as acquisition write-offs. |
Capital Expenditures.Expenditures. We make capital expenditures in order to maintain our existing operations as well as for new capital assets in new and acquired stores. We spent $68.8$132.7 million, $61.9$93.0 million and $102.0$68.8 million (which included amounts spent with respect to our new corporate headquarters location and the conversion of the acquired Rent-Way stores to theRent-A-Center brand) on capital expenditures in the years 2009, 20082011, 2010 and 2007,2009, respectively, and expect to spend approximately $83.0$105.0 million in 2010.2012. The anticipated increase in capital expenditures for 20102011 is primarily relatesrelated to our investment in the development of new point of sale systems and processes designed to further enhance our management information system.
system, our international and domestic expansion and costs associated with store reimaging.Acquisitions and New StoreLocation Openings. During 2009,2011, we used approximately $7.2$26.7 million in cash acquiring storeslocations and accounts in 2019 separate transactions.
34
The table below summarizes the store growthlocation activity for the years ended December 31, 2009, 20082011, 2010 and 2007.
| | | | | | | | | | | | | |
| | | 2009 | | | 2008 | | | 2007 | |
| |
| Stores at beginning of period | | | 3,037 | | | | 3,081 | | | | 3,406 | |
| New store openings | | | 40 | | | | 26 | | | | 27 | |
| Acquired stores remaining open | | | 1 | | | | 5 | | | | 14 | |
Closed stores(1) | | | | | | | | | | | | |
| Merged with existing stores | | | 59 | | | | 45 | | | | 363 | |
| Sold or closed with no surviving store | | | 12 | | | | 30 | | | | 3 | |
| | | | | | | | | | | | | |
| Stores at end of period | | | 3,007 | | | | 3,037 | | | | 3,081 | |
| | | | | | | | | | | | | |
| Acquired stores closed and accounts merged with existing stores | | | 26 | | | | 38 | | | | 36 | |
| Total approximate purchase price of acquisitions | | | $7.2 million | | | | $15.7 million | | | | $20.1 million | |
| | |
(1) | | Substantially all of the merged sold or closed stores in 2007 relate to our store consolidation plans discussed in more detail in Note F, Restructuring, in the Notes to the Consolidated Financial Statements on page 55. |
2009. | | | | | | | | | | | | | | | | | | | | |
| | | Year Ended December 31, 2011 | |
| | | Core U.S. | | | RAC
Acceptance | | | International | | | ColorTyme | | | Total | |
Locations at beginning of period | | | 2,985 | | | | 384 | | | | 23 | | | | 209 | | | | 3,601 | |
New location openings | | | 52 | | | | 445 | | | | 57 | | | | 10 | | | | 564 | |
Acquired locations remaining open | | | 26 | | | | 5 | | | | — | | | | 3 | | | | 34 | |
Closed locations | | | | | | | | | | | | | | | | | | | | |
Merged with existing locations | | | 28 | | | | 63 | | | | — | | | | — | | | | 91 | |
Sold or closed with no surviving location | | | 41 | | | | 21 | | | | — | | | | 6 | | | | 68 | |
| | | | | | | | | | | | | | | | | | | | |
Locations at end of period | | | 2,994 | | | | 750 | | | | 80 | | | | 216 | | | | 4,040 | |
| | | | | | | | | | | | | | | | | | | | |
Acquired locations closed and accounts merged with existing locations | | | 71 | | | | — | | | | — | | | | — | | | | — | |
Total approximate purchase price(in millions) | | $ | 26.4 | | | $ | 0.3 | | | $ | — | | | $ | — | | | $ | — | |
| | | | | | | | | | | | | | | | | | | | |
| | | Year Ended December 31, 2010 | |
| | | Core U.S. | | | RAC
Acceptance | | | International | | | ColorTyme | | | Total | |
Locations at beginning of period | | | 2,989 | | | | 82 | | | | 18 | | | | 210 | | | | 3,299 | |
New location openings | | | 29 | | | | 160 | | | | 5 | | | | 12 | | | | 206 | |
Acquired locations remaining open | | | 3 | | | | 158 | | | | — | | | | 1 | | | | 162 | |
Closed locations | | | | | | | | | | | | | | | | | | | | |
Merged with existing locations | | | 26 | | | | 1 | | | | — | | | | — | | | | 27 | |
Sold or closed with no surviving location | | | 10 | | | | 15 | | | | — | | | | 14 | | | | 39 | |
| | | | | | | | | | | | | | | | | | | | |
Locations at end of period | | | 2,985 | | | | 384 | | | | 23 | | | | 209 | | | | 3,601 | |
| | | | | | | | | | | | | | | | | | | | |
Acquired locations closed and accounts merged with existing locations | | | 14 | | | | — | | | | — | | | | — | | | | — | |
Total approximate purchase price(in millions) | | $ | 3.4 | | | $ | 71.0 | | | $ | — | | | $ | — | | | $ | — | |
| | | | | | | | | | | | | | | | | | | | |
| | | Year Ended December 31, 2009 | |
| | | Core U.S. | | | RAC
Acceptance | | | International | | | ColorTyme | | | Total | |
Locations at beginning of period | | | 3,029 | | | | 56 | | | | 8 | | | | 222 | | | | 3,315 | |
New location openings | | | 30 | | | | 38 | | | | 10 | | | | 12 | | | | 90 | |
Acquired locations remaining open | | | 1 | | | | — | | | | — | | | | — | | | | 1 | |
Closed locations | | | | | | | | | | | | | | | | | | | | |
Merged with existing locations | | | 59 | | | | — | | | | — | | | | — | | | | 59 | |
Sold or closed with no surviving location | | | 12 | | | | 12 | | | | — | | | | 24 | | | | 48 | |
| | | | | | | | | | | | | | | | | | | | |
Locations at end of period | | | 2,989 | | | | 82 | | | | 18 | | | | 210 | | | | 3,299 | |
| | | | | | | | | | | | | | | | | | | | |
Acquired locations closed and accounts merged with existing locations | | | 26 | | | | — | | | | — | | | | — | | | | — | |
Total approximate purchase price(in millions) | | $ | 7.2 | | | $ | — | | | $ | — | | | $ | — | | | $ | — | |
The profitability of our Core U.S. stores tends to grow at a slower rate approximately five years fromafter entering our system. As a result of the increasing maturity of our store base, in order for us to show improvements in our profitability, it is important for us to open stores in new locations as well as increase revenue in our existing stores. We intend to accomplish such revenue growth by offering new products and services, such as our financial services products, in our existing stores, and by acquiring customer accounts on favorable terms. There can be no assurance that we will be successful in adding financial servicesterms, and seeking additional distribution channels for our products to our existing stores, or that such operations will be as profitable as we expect, or at all.and services. We also cannot assure you that we will be able to acquire customer accounts on favorable terms, or at all, or that we will be able to maintain the revenue from any such acquired customer accounts at the rates we expect, or at all.
We also cannot assure you that we will be successful in identifying additional distribution channels for our products and services, or that such operations will be as profitable as we expect, or at all.Senior Credit Facilities. On December 2, 2009, we entered into an amendment to our existing senior credit facility to extend the maturities of a portion of the loans outstanding. The amended senior credit agreement provides for a $999Our $750.0 million senior credit facility consistingfacilities consist of a $165$250.0 million, five-year term loan with the loans being referred to by us as the “tranche A term loans,” a $484 million term loan with the loans being referred to by us as the “tranche B term loans,” and a $350$500.0 million, five-year revolving credit facility.
The tranche A term loans are divided into two equalsub-tranches of $82.5 million each, referred to by us as the “existing tranche A term loans” and the “extended tranche A term loans.” The existing tranche A term loans mature on June 30, 2011 and are repayable in six consecutive quarterly installments of (i) $2.5 million from March 31, 2010 through June 30, 2010 and (ii) $18.75 million from September 30, 2010 through June 30, 2011. The extended tranche A term loans mature on September 30, 2013 and are repayable in 15 consecutive quarterly installments of (i) $2.5 million from March 31, 2010 through September 30, 2012 and (ii) $13.125 million from December 31, 2012 through September 30, 2013. Under the amended senior credit facility, the tranche B term loans are divided into twosub-tranches of approximately $184 million and $300 million, referred to by us as the “existing tranche B term loans” and the “extended tranche B term loans,” respectively. The existing tranche B term loans mature on June 30, 2012 and are repayable in ten consecutive quarterly installments of (i) approximately $642,000 from March 31, 2010 through June 30, 2011, (ii) approximately $20.2 million on September 30, 2011, (iii) approximately $37.3 million on December 31, 2011, and (iv) approximately $61.0 million from March 31, 2012 through June 30, 2012. The extended tranche B term loans mature on March 31, 2015 and are repayable in 21 consecutive quarterly installments of (i) $750,000 from March 31, 2010 through March 31, 2014 and (ii) approximately $71.6 million from June 30, 2014 through March 31, 2015.
35
The table below shows the scheduled maturity dates of our senior term loansloan outstanding at December 31, 2009.
| | | | | |
Year Ending December 31, | | (In thousands) | |
| |
| 2010 | | $ | 58,069 | |
| 2011 | | | 109,338 | |
| 2012 | | | 145,656 | |
| 2013 | | | 94,375 | |
| 2014 | | | 215,625 | |
| Thereafter | | | 71,625 | |
| | | | | |
| | | $ | 694,688 | |
| | | | | |
Pursuant to the amended senior credit facility, the revolving facility was reduced, at our election, to $350 million from $400 million, and extended from July 13, 2011 to September 30, 2013. 2011. | | | | |
Year Ending December 31, | | (In thousands) | |
2012 | | $ | 25,000 | |
2013 | | | 25,000 | |
2014 | | | 25,000 | |
2015 | | | 25,000 | |
2016 | | | 137,500 | |
| | | | |
| | $ | 237,500 | |
| | | | |
The full amount of the revolving credit facility may be used for the issuance of letters of credit, of which $118.3$116.2 million had been utilized as of February 19, 2010.17, 2012. As of February 19, 2010, $221.717, 2012, $198.8 million was available under our revolving facility.
The revolving credit facility and the term loan expire on July 14, 2016.Borrowings under our amended senior credit facility accrue interest at varying rates equal to, at our election, either (y) the prime rate plus (i) up0.50% to 0.75% in the case of existing tranche A term loans, (ii) 1.5% to 2.0% in the case of revolving loans or extended tranche A term loans, (iii) .75% in the case of existing tranche B term loans, and (iv) 2.0% in the case of extended tranche B term loans;1.50%; or (z) the Eurodollar rate plus (i) .75%1.50% to 1.75% in the case of existing tranche A term loans, (ii) 2.5% to 3.0% in the case of revolving loans or extended tranche A term loans, (iii) 1.75% in the case of existing tranche B term loans, and (iv) 3.0% in the case of extended tranche B term loans.2.50%. Interest periods range from seven days (for borrowings under the revolving credit facility only) to one, two, three or six months, at our election. The weighted average Eurodollar rate on our outstanding debt was 0.25%0.27% at February 19, 2010.17, 2012. The margins on the Eurodollar rate and on the prime rate, for revolving loans, existing tranche A term loans,which were 2.00% and extended tranche A term loans1.00%, respectively, at December 31, 2011, may fluctuate dependent upon an increase or decrease in our consolidated leverage ratio as defined by a pricing grid included in the amended credit agreement. We have not entered into any interest rate protection agreements with respect to term loans under our senior credit facilities. A commitment fee equal to 0.5%0.30% to 0.625%0.50% of the average daily amount of the available revolving commitment is payable quarterly.
Our senior credit facilities are secured by a security interest in substantially all of our tangible and intangible assets, including intellectual property. Our senior credit facilities are also secured by a pledge of the capital stock of our wholly-owned U.S. subsidiaries (other than certain specified subsidiaries).
Our senior credit facilities contain, without limitation, covenants that generally limit our ability to:
| | |
| | • �� | | incur additional debt in excess of $300.0$250.0 million at any one time provided thatoutstanding (other than subordinated debt, which is generally permitted if the aggregate amount of indebtedness incurred by all of our subsidiaries may not exceed $50.0 million at any one time;maturity date is later than July 14, 2017); |
|
| | • | | repurchase our capital stock and 6 5/8% notes and pay cash dividends in the event the pro forma senior leverage ratio is greater than 2.50x; |
|
| • | incur liens or other encumbrances; |
|
| • | merge, consolidate or sell substantially all our property or business; |
|
| • | sell assets, other than inventory, in the ordinary course of business; |
|
| • | make investments or acquisitions unless we meet financial tests and other requirements; |
|
| • | make capital expenditures; or |
|
| • | enter into an unrelated line of business. |
36
incur liens or other encumbrances;
merge, consolidate or sell substantially all our property or business;sell assets, other than inventory, in the ordinary course of business;
make investments or acquisitions unless we meet financial tests and other requirements;
make capital expenditures; or
enter into an unrelated line of business.
Our senior credit facilities require us to comply with several financial covenants. The table below shows the required and actual ratios under our credit facilities calculated as of December 31, 2009:
| | | | | | | | | | |
| | | Required Ratio | | | Actual Ratio |
| |
Maximum consolidated leverage ratio | | No greater than | | | 3.25:1 | | | | 1.72:1.70:1 | |
Minimum fixed charge coverage ratio | | No less than | | | 1.35:1 | | | | 2.07:1.58:1 | |
These financial covenants, as well as the related components of their computation, are defined in the amended and restated credit agreement governing our senior credit facility, which is included as an exhibit to this report.our Current Report on Form 8-K dated as of July 14, 2011. In accordance with the credit agreement, the maximum consolidated leverage ratio was calculated by dividing the consolidated funded debt outstanding at December 31, 20092011 ($620.5659.5 million) by consolidated EBITDA for the twelve month period ended December 31, 20092011 ($360.1387.1 million). For purposes of the covenant calculation, (i) “consolidated funded debt” is defined as outstanding indebtedness less cash in excess of $25.0 million, and (ii) “consolidated EBITDA” is generally defined as consolidated net income (a) plus the sum of income taxes, interest expense, depreciation and amortization expense, extraordinary non-cash expenses or losses, and other non-cash charges, and (b) minus the sum of interest income, extraordinary income or gains, other non-cash income, and cash payments with respect to
extraordinary non-cash expenses or losses recorded in prior fiscal quarters. Consolidated EBITDA is a non-GAAP financial measure that is presented not as a measure of operating results, but rather as a measure used to determine covenant compliance under our senior credit facilities.
The minimum fixed charge coverage ratio was calculated pursuant to the credit agreement by dividing consolidated EBITDA for the twelve month period ended December 31, 2009,2011, as adjusted for certain capital expenditures ($474.7514.6 million), by consolidated fixed charges for the twelve month period ended December 31, 20092011 ($229.4325.1 million). For purposes of the covenant calculation, “consolidated fixed charges” is defined as the sum of interest expense, lease expense, cash dividends, and mandatory debt repayments.
Events of default under our senior credit facilities include customary events, such as a cross-acceleration provision in the event that we default on other debt. In addition, an event of default under the senior credit facility would occur if a change of control occurs. This is defined to include the case where a third party becomes the beneficial owner of 35% or more of our voting stock or certain changes inRent-A-Center’s Board of Directors occurs. An event of default would also occur if one or more judgments were entered against us of $30.0$50.0 million or more and such judgments were not satisfied or bonded pending appeal within 30 days after entry.
We utilize our revolving credit facility for the issuance of letters of credit, as well as to manage normal fluctuations in operational cash flow caused by the timing of cash receipts. In that regard, we may from time to time draw funds under the revolving credit facility for general corporate purposes. The funds drawn on individual occasions have varied in amounts of up to $98.0$100.0 million, which occurred at the date we refinanced our senior secured debt, with total amounts outstanding ranging from $2.0 million up to $108.0$186.5 million. The amountsAmounts are drawn are generally outstanding for a short periodas needed due to the timing of timecash flows and are generally paid down as cash is received fromgenerated by our operating activities.
761 5/28% Senior Subordinated Notes.Notes In May 2009,. On November 2, 2010, we repurchased $150.0issued $300.0 million in senior unsecured notes due November 2020, bearing interest at 6 5/8%, pursuant to an indenture dated November 2, 2010, among Rent-A-Center, Inc., its subsidiary guarantors and The Bank of New York Mellon Trust Company, as trustee. A portion of the proceeds of this offering were used to repay approximately $200.0 million of outstanding term debt under our subordinatedsenior credit facility. The remaining net proceeds were used to repurchase shares of our common stock.
The 2010 indenture contains covenants that limit our ability to:
sell assets or our subsidiaries;
grant liens to third parties;
pay cash dividends or repurchase stock; and
engage in a merger or sell substantially all of our assets.
Events of default under the 2010 indenture include customary events, such as a cross-acceleration provision in the event that we default in the payment of other debt due at maturity or upon acceleration for default in an amount exceeding $50.0 million, as well as in the event a judgment is entered against us in excess of $50.0 million that is not discharged, bonded or insured.
The 6 5/8% notes may be redeemed on or after November 15, 2015, at our option, in whole or in part, at a premium declining from 103.313%. The 6 5/8% notes may be redeemed on or after November 15, 2018, at our option, in whole or in part, at par. The 6 5/8% notes also require that upon the occurrence of a change of control (as defined in the 2010 indenture), the holders of the notes have the right to require us to repurchase the notes at a redemption price equal to 100%101% of the original aggregate principal amount, outstanding, plustogether with accrued and unpaid interest, if any, to the redemption date. In July 2009, we repurchaseddate of repurchase. This would trigger an event of default under our senior credit facilities. We are not required to maintain any financial ratios under the remaining $75.4 million of our subordinated notes at a redemption price equal to 100% of the principal amount outstanding, plus accrued interest to the redemption date. All of our 71/2% senior subordinated notes due May 2010 were redeemed in accordance with their terms on their respective redemption dates and are now paid in full.
indenture.Store Leases.Leases. We lease space for substantially all of our Core U.S. and International stores and service center locations, as well as regional offices,certain support facilities under operating leases expiring at various times through 2019.2021. Most of our store leases are five year leases and contain renewal options for additional periods ranging from three to five years at rental rates adjusted according to agreed-upon formulas.
agreed-upon formulas.
ColorTyme Guarantee.Guarantees. Our subsidiary, ColorTyme Finance, Inc., is a party to an agreement with Wells Fargo Foothill, Inc. (“Wells Fargo”)Citibank, N.A., whopursuant to which Citibank provides $35.0up to $25.0 million in aggregate financing to qualifying franchisees of ColorTyme generally up to five times their average monthly revenues.ColorTyme. Under the Wells FargoCitibank agreement, upon an event of default by the franchisee under agreements governing this financing and upon the occurrence of certain other events, Wells FargoCitibank can assign the loans and the collateral securing such loans to ColorTyme Finance, with ColorTyme Finance paying or causing to be paid the outstanding
37
debt to Wells FargoCitibank and then succeeding to the rights of Wells FargoCitibank under the debt agreements, including the right to foreclose on the collateral. The Wells Fargo agreement expires on September 30, 2010.Rent-A-Center and ColorTyme Finance guarantee the obligations of the franchise borrowers under the Citibank facility. An additional $20.0 million of financing is provided by Texas Capital Bank National Association (“Texas Capital Bank”) under an agreement similar to the Wells Fargo financing.Citibank financing, which is guaranteed by Rent-A-Center East, Inc., a subsidiary ofRent-A-Center, guarantees the Rent-A-Center. The maximum guarantee obligations of ColorTyme under each of these agreements, excluding the effects of any amounts that could be recovered under collateralization provisions, up to a maximum amount of $55.0is $45.0 million, of which $19.5$21.9 million was outstanding as of December 31, 2009.
2011.Contractual Cash Commitments.Commitments. The table below summarizes debt, lease and other minimum cash obligations outstanding as of December 31, 2009:
| | | | | | | | | | | | | | | | | | | | | |
| | | Payments Due by Period | |
Contractual Cash Obligations | | Total | | | 2010 | | | 2011-2012 | | | 2013-2014 | | | Thereafter | |
| | | (In thousands) | |
| |
| Senior Debt (including current portion) | | $ | 711,158 | (1) | | $ | 74,539 | | | $ | 254,994 | | | $ | 310,000 | | | $ | 71,625 | |
| Operating Leases | | | 535,631 | | | | 175,056 | | | | 248,367 | | | | 104,505 | | | | 7,703 | |
| Capital Leases | | | 2,645 | | | | 1,458 | | | | 1,187 | | | | — | | | | — | |
| | | | | | | | | | | | | | | | | | | | | |
Total(2) | | $ | 1,249,434 | | | $ | 251,053 | | | $ | 504,548 | | | $ | 414,505 | | | $ | 79,328 | |
| | | | | | | | | | | | | | | | | | | | | |
| | | | | | | | | | | | | | | | | | | | |
| | | Payments Due by Period | |
Contractual Cash Obligations | | Total | | | 2012 | | | 2013-2014 | | | 2015-2016 | | | Thereafter | |
| | | (In thousands) | |
Senior Debt (including current portion) | | $ | 440,675 | (1) | | $ | 43,175 | | | $ | 50,000 | | | $ | 347,500 | | | $ | — | |
6 5/8% Senior Notes(2) | | | 478,874 | | | | 19,876 | | | | 39,750 | | | | 39,750 | | | | 379,498 | |
Operating Leases | | | 582,308 | | | | 185,394 | | | | 267,784 | | | | 122,459 | | | | 6,671 | |
| | | | | | | | | | | | | | | | | | | | |
Total(3) | | $ | 1,501,857 | | | $ | 248,445 | | | $ | 357,534 | | | $ | 509,709 | | | $ | 386,169 | |
| | | | | | | | | | | | | | | | | | | | |
| | |
| (1) | | Includes amounts due under the Intrust line of credit. Amount referenced does not include interest payments. Our new senior credit facilities bear interest at varying rates equal to the Eurodollar rate plus .75%1.5% to 3.0%2.5% or the prime rate plus up0.5% to 2.0%1.5% at our election. The combined weighted average Eurodollar and prime rate on our outstanding debt at December 31, 20092011 was 0.29%0.38%. |
|
| (2) | Includes interest payments of $9.9 million on each of May 15 and November 15 of each year. |
| (3) | As of December 31, 2009,2011, we have $3.0$9.7 million in uncertain tax positions. Because of the uncertainty of the amounts to be ultimately paid as well as the timing of such payments, uncertain tax positions are not reflected in the contractual obligations table. |
Repurchases of Outstanding Securities. OurUnder our current common stock repurchase program, our Board of Directors has authorized a common stock repurchase program, permitting us tothe purchase, from time to time, in the open market and privately negotiated transactions, up to an aggregate of $500.0$800.0 million ofRent-A-Center common stock. As of December 31, 2009,2011, we had purchased a total of 19,884,85029,322,753 shares ofRent-A-Center common stock for an aggregate purchase price of $466.6$715.5 million under this common stock repurchase program.
Through the twelve months ended December 31, 2011, we repurchased a total of 5,852,408 shares for approximately $164.3 million in cash.Economic Conditions. Although our performance has not suffered in previous economic downturns, we cannot assure you that demand for our products, particularly in higher price ranges, will not significantly decrease in the event of a prolonged recession. Fluctuations in our targeted customers’ monthly disposable income or high levels of unemployment could adversely impact our results of operations.
Restructuring. The total amount of cash used in the store consolidation plan and other restructuring items through December 31, 2009 was approximately $22.4 million, which primarily related to lease terminations. We expect to use approximately $3.0 million of cash on hand for future payments to satisfy the lease obligations at the stores. We expect the lease obligations will be completed no later than the first quarter of 2013. Please refer to Note F, Restructuring, in the Notes to Consolidated Financial Statements on page 55 of this report for more information on our 2007 store consolidation plan.
Seasonality.Our revenue mix is moderately seasonal, with the first quarter of each fiscal year generally providing higher merchandise sales than any other quarter during a fiscal year, primarily related to federal income tax refunds. Generally, our customers will more frequently exercise theirthe early purchase option on their
existing rental purchase agreements or purchase pre-leased merchandise off the showroom floor during the first quarter of each fiscal year. We expect this trend to continue in future periods. Furthermore, we tend to experience slower growth in the number of rental purchase agreements in the third quarter of each fiscal year when compared to other quarters throughout the year. As a result, we would expect revenues for the third quarter of each fiscal year to remain relatively flat with the prior quarter. We expect this trendthese trends to continue in future periods unless we add significantly to our store base during the third quarter of future fiscal years as a result of new store openings or opportunistic acquisitions.
38
Effect of New Accounting Pronouncements
In June 2009,September 2011, the Financial Accounting Standards Board (“FASB”) issued Accounting Standards Codification 105,Update 2011-08Generally Accepted Accounting Principles, Intangibles — Goodwill and Other (Topic 350): Testing Goodwill for Impairment,(“ASC 105”ASU 2011-08”). ASC 105, which allows companies to waive comparing the fair value of a reporting unit to its carrying amount in assessing the recoverability of goodwill if, based on qualitative factors, it is not more likely than not that the single sourcefair value of authoritative nongovernmental U.S. generally accepted accounting principles (“GAAP”), superseding existing FASB, American Institute of Certified Public Accountants (“AICPA”), Emerging Issues Task Force (“EITF”), and related accounting literature. ASC 105 reorganizes the thousands of GAAP pronouncements into roughly 90 accounting topics and displays them using a consistent structure. Also includedreporting unit is relevant SEC guidance organized using the same topical structure in separate sections. ASC 105 isless than its carrying amount. ASU 2011-08 will be effective for financial statements issuedannual and interim goodwill impairment tests performed for reporting periods ending after September 15, 2009. All references to authoritative accounting literature in our financial statements issued for reporting periods ending after September 15, 2009 are referenced in accordance with ASC 105.
In June 2009, the FASB issued Accounting Standards Update2009-17,Improvements to Financial Reporting by Enterprises Involved with Variable Interest Entities(“ASU2009-17”), which changes various aspects of accounting for and disclosures of interests in variable interest entities. ASU2009-17 is effective for interim and annual periodsfiscal years beginning after NovemberDecember 15, 2009.2011, with early adoption permissible. The adoption of ASU2009-17 willthis standard is not expected to have a material effectimpact on our consolidated statement of earnings, financial condition, statement of cash flows or earnings per share.
In May 2009,June 2011, the FASB issued ASC 855,Accounting Standards Update 2011-05,Subsequent Events.ASC 855 establishes general standardsComprehensive Income (Topic 220): Presentation of Comprehensive Income (“ASU 2011-05”), which allows an entity the option to present the total of comprehensive income, the components of net income, and the components of other comprehensive income either in a single continuous statement of comprehensive income or in two separate but consecutive statements. In both choices, an entity is required to present each component of net income along with total net income, each component of other comprehensive income along with a total for other comprehensive income, and a total amount for comprehensive income. ASU 2011-05 eliminates the option to present the components of other comprehensive income as part of the statement of changes in stockholders’ equity. The amendments to the Codification in the ASU do not change the items that must be reported in other comprehensive income or when an item of other comprehensive income must be reclassified to net income and are effective for fiscal years, and interim periods within those years, beginning after December 15, 2011, with early adoption permissible. The adoption of ASU 2011-05 will not have a financial impact on our consolidated statement of earnings, financial condition, statement of cash flows or earnings per share.
In May 2011, the FASB issued Accounting Standards Update 2011-04,Fair Value Measurement (Topic 820): Amendments to Achieve Common Fair Value Measurement and Disclosure Requirements in U.S. GAAP and IFRSs (“ASU 2011-04”). The amendments in this ASU generally represent clarification of Topic 820, but also include instances where a particular principle or requirement for measuring fair value or disclosing information about fair value measurements has changed. This update results in common principles and requirements for measuring fair value and for disclosing information about fair value measurements in accordance with U.S. generally accepted accounting forprinciples (“GAAP”) and disclosure of events that occur after the balance sheet date but before financial statementsInternational Financial Reporting Standards (“IFRS”). The amendments are issued or are available to be issued. ASC 855 applies prospectively to botheffective for interim and annual financial periods endingbeginning after JuneDecember 15, 2009.2011 and are to be applied prospectively. Early application is not permitted. The adoption of ASC 855 didASU 2011-04 will not result in anyhave a material change to our policies.
In April 2009, the FASB issued ASC825-10-65,Financial Instruments. ASC825-10-65 amends FASB Statement No. 107,Disclosures about Fair Value of Financial Instruments, and Accounting Principles Board Opinion No. 28,Interim Financial Reporting, to require disclosures about fair value of financial instruments for interim periods of publicly traded companies as well as in annual financial statements. ASC825-10-65 is effective for interim reporting periods ending after June 15, 2009. The adoption of ASC825-10-65 had no material effectimpact on our disclosures in ourconsolidated statement of earnings, financial statements.
condition, statement of cash flows or earnings per share.From time to time, new accounting pronouncements are issued by the FASB or other standards setting bodies that we adopt as of the specified effective date. Unless otherwise discussed, we believe the impact of any other recently issued standards that are not yet effective are either not applicable to us at this time or will not have a material impact on our consolidated financial statements upon adoption.
| |
| Item 7A. | Quantitative and Qualitative Disclosures About Market Risk. |
Interest Rate Sensitivity
As of December 31, 2009,2011, we had $694.7$300.0 million in senior notes outstanding at a fixed interest rate of 6 5/8%, $237.5 million outstanding in term loans, $185.0 million outstanding on our revolving credit facility and $18.2 million outstanding on our Intrust line of credit at interest rates indexed to the Eurodollar and prime rates.
rate. The fair value of the 6 5/8% senior notes, based on the closing price at December 29, 2011, was $302.3 million. Carrying value approximates fair value for all other indebtedness.Market Risk
Market risk is the potential change in an instrument’s value caused by fluctuations in interest rates. Our primary market risk exposure is fluctuations in interest rates. Monitoring and managing this risk is a continual process carried out by our senior management. We manage our market risk based on an ongoing assessment of trends in interest rates and economic developments, giving consideration to possible effects on both total return and reported earnings. As a result of such assessment, we may enter into swap contracts or other interest rate protection agreements from time to time to mitigate this risk.
We hold long-term debthave senior credit facilities with variable interest rates indexed to prime or Eurodollar rates that exposes us to the risk of increased interest costs if interest rates rise. As of December 31, 2009,2011, we have not entered into any interest rate swap agreements. The credit markets continue to experiencehave experienced adverse conditions, including wide fluctuations in rates. Such continued volatility in the credit markets maycould increase the costs associated with our existing long-term debt. Based on our overall interest rate exposure at December 31, 2009,2011, a hypothetical 1.0% increase or decrease in interest rates would have the effect of causing a $7.0$4.3 million additional pre-tax charge or credit to our statement of earnings.
39
| |
| Item 8. | Financial Statements and Supplementary Data. |
INDEX TO FINANCIAL STATEMENTS
40
Report of Independent Registered Public Accounting Firm
REPORT OF INDEPENDENT REGISTERED PUBLIC ACCOUNTING FIRM
Board of Directors and Stockholders
ShareholdersRent-A-Center,
Inc. and Subsidiaries
We have audited the accompanying consolidated balance sheets ofRent-A-Center, Inc. and Subsidiaries as of December 31, 20092011 and 2008,2010, and the related consolidated statements of earnings, stockholders’ equity, and cash flows for each of the three years in the period ended December 31, 2009.2011. These financial statements are the responsibility of the Company’s management. Our responsibility is to express an opinion on these financial statements based on our audits.
We conducted our audits in accordance with the standards of the Public Company Accounting Oversight Board (United States). Those standards require that we plan and perform the audit to obtain reasonable assurance about whether the financial statements are free of material misstatement. An audit includes examining, on a test basis, evidence supporting the amounts and disclosures in the financial statements. An audit also includes assessing the accounting principles used and significant estimates made by management, as well as evaluating the overall financial statement presentation. We believe that our audits provide a reasonable basis for our opinion.
In our opinion, the consolidated financial statements referred to above present fairly, in all material respects, the financial position ofRent-A-Center, Inc. and Subsidiaries as of December 31, 20092011 and 2008,2010, and the results of their operations and their cash flows for each of the three years in the period ended December 31, 2009,2011 in conformity with accounting principles generally accepted in the United States of America.
We also have also audited, in accordance with the standards of the Public Company Accounting Oversight Board (United States),Rent-A-Center, Inc. and Subsidiaries’ internal control over financial reporting as of December 31, 2009,2011, based on criteria established inInternal Control — Integrated Frameworkissued by the Committee of Sponsoring Organizations of the Treadway Commission (COSO) (COSO)and our report dated February 26, 2010,27, 2012, expressed an unqualified opinion.
Dallas, Texas
February 26, 2010
41
|
| /s/ Grant Thornton LLP |
|
| Dallas, Texas |
| February 27, 2012 |
Report of Independent Registered Public Accounting Firm
The Board of Directors and Stockholders
ShareholdersRent-A-Center,
Inc. and Subsidiaries
We have auditedRent-A-Center, Inc. and Subsidiaries’ (the “Company”) internal control over financial reporting as of December 31, 2009,2011, based on criteria established inInternal Control — Integrated Frameworkissued by the Committee of Sponsoring Organizations of the Treadway Commission (COSO). The Company’s management is responsible for maintaining effective internal control over financial reporting and for its assessment of the effectiveness of internal control over financial reporting, included in the accompanying Management’s Annual Report on Internal Control over Financial Reporting. Our responsibility is to express an opinion on the Company’s internal control over financial reporting based on our audit.
We conducted our audit in accordance with the standards of the Public Company Accounting Oversight Board (United States). Those standards require that we plan and perform the audit to obtain reasonable assurance about whether effective internal control over financial reporting was maintained in all material respects. Our audit included obtaining an understanding of internal control over financial reporting, assessing the risk that a material weakness exists, testing and evaluating the design and operating effectiveness of internal control based on the assessed risk, and performing such other procedures as we considered necessary in the circumstances. We believe that our audit provides a reasonable basis for our opinion.
A company’s internal control over financial reporting is a process designed to provide reasonable assurance regarding the reliability of financial reporting and the preparation of financial statements for external purposes in accordance with generally accepted accounting principles. A company’s internal control over financial reporting includes those policies and procedures that (1) pertain to the maintenance of records that, in reasonable detail, accurately and fairly reflect the transactions and dispositions of the assets of the company; (2) provide reasonable assurance that transactions are recorded as necessary to permit preparation of financial statements in accordance with generally accepted accounting principles, and that receipts and expenditures of the company are being made only in accordance with authorizations of management and directors of the company; and (3) provide reasonable assurance regarding prevention or timely detection of unauthorized acquisition, use, or disposition of the company’s assets that could have a material effect on the financial statements.
Because of its inherent limitations, internal control over financial reporting may not prevent or detect misstatements. Also, projections of any evaluation of effectiveness to future periods are subject to the risk that controls may become inadequate because of changes in conditions, or that the degree of compliance with the policies or procedures may deteriorate.
In our opinion,Rent-A-Center, Inc. and Subsidiaries maintained, in all material respects, effective internal control over financial reporting as of December 31, 2009,2011, based on criteria established inInternal Control — Integrated—Integrated Framework issued by COSO.
We also have also audited, in accordance with the standards of the Public Company Accounting Oversight Board (United States), the consolidated balance sheets of the Company as of December 31, 20092011 and 2008,2010, and the related consolidated statements of earnings, stockholders’ equity, and cash flows for each of the three years in the period ended December 31, 2009,2011, and our report dated February 26, 2010,27, 2012, expressed an unqualified opinion on those financial statements.
Dallas, Texas
February 26, 2010
42
|
| /s/ Grant Thornton LLP |
| Dallas, Texas |
| February 27, 2012 |
MANAGEMENT’S ANNUAL REPORT ON INTERNAL CONTROL
OVER FINANCIAL REPORTING
Management of the Company, including the Chief Executive Officer and Chief Financial Officer, is responsible for establishing and maintaining adequate internal control over financial reporting as defined inRule 13a-15(f) under the Securities Exchange Act of 1934, as amended. The Company’s internal control system was designed to provide reasonable assurance to management and the Company’s boardBoard of directorsDirectors regarding the reliability of financial reporting and the preparation of financial statements for external purposes in accordance with generally accepted accounting principles.
All internal control systems, no matter how well designed, have inherent limitations. A system of internal control may become inadequate over time because of changes in conditions, or deterioration in the degree of compliance with the policies or procedures. Therefore, even those systems determined to be effective can provide only reasonable assurance with respect to financial statement preparation and presentation.
Management assessed the effectiveness of the Company’s internal control over financial reporting as of December 31, 20092011 using the criteria set forth by the Committee of Sponsoring Organizations of the Treadway Commission inInternal Control —Integrated Framework.Based on this assessment, management has concluded that, as of December 31, 2009,2011, the Company’s internal control over financial reporting was effective to provide reasonable assurance regarding the reliability of financial reporting and the preparation of financial statements for external purposes in accordance with generally accepted accounting principles based on such criteria.
Grant Thornton LLP, the Company’s independent registered public accounting firm, has issued an audit report on the effectiveness of the Company’s internal control over financial reporting. This report appears on page 42.
4341.
Rent-A-center, Inc. And Subsidiaries
Rent-A-Center, Inc. and Subsidiaries
| | | | | | | | | | | | | |
| | | Year Ended December 31, | |
| | | 2009 | | | 2008 | | | 2007 | |
| | | (In thousands, except per share data) | |
| |
| Revenues | | | | | | | | | | | | |
| Store | | | | | | | | | | | | |
| Rentals and fees | | $ | 2,346,849 | | | $ | 2,505,268 | | | $ | 2,594,061 | |
| Merchandise sales | | | 261,631 | | | | 256,731 | | | | 208,989 | |
| Installment sales | | | 53,035 | | | | 41,193 | | | | 34,576 | |
| Other | | | 57,601 | | | | 42,759 | | | | 25,482 | |
| Franchise | | | | | | | | | | | | |
| Merchandise sales | | | 28,065 | | | | 33,283 | | | | 34,229 | |
| Royalty income and fees | | | 4,775 | | | | 4,938 | | | | 8,784 | |
| | | | | | | | | | | | | |
| | | | 2,751,956 | | | | 2,884,172 | | | | 2,906,121 | |
| Operating expenses | | | | | | | | | | | | |
| Direct store expenses | | | | | | | | | | | | |
| Cost of rentals and fees | | | 530,018 | | | | 572,900 | | | | 574,013 | |
| Cost of merchandise sold | | | 188,433 | | | | 194,595 | | | | 156,503 | |
| Cost of installment sales | | | 18,687 | | | | 16,620 | | | | 13,270 | |
| Salaries and other expenses | | | 1,556,074 | | | | 1,651,805 | | | | 1,684,965 | |
| Franchise cost of merchandise sold | | | 26,820 | | | | 31,705 | | | | 32,733 | |
| | | | | | | | | | | | | |
| | | | 2,320,032 | | | | 2,467,625 | | | | 2,461,484 | |
| General and administrative expenses | | | 137,626 | | | | 125,632 | | | | 123,703 | |
| Amortization and write-down of intangibles | | | 2,843 | | | | 16,637 | | | | 15,734 | |
| Litigation expense (credit) | | | (4,869 | ) | | | (4,607 | ) | | | 62,250 | |
| Restructuring charge | | | — | | | | 4,497 | | | | 38,713 | |
| | | | | | | | | | | | | |
| Total operating expenses | | | 2,455,632 | | | | 2,609,784 | | | | 2,701,884 | |
| Operating profit | | | 296,324 | | | | 274,388 | | | | 204,237 | |
| Gain on extinguishment of debt | | | — | | | | (4,335 | ) | | | — | |
| Interest expense | | | 26,791 | | | | 66,241 | | | | 94,778 | |
| Interest income | | | (837 | ) | | | (8,860 | ) | | | (6,827 | ) |
| | | | | | | | | | | | | |
| Earnings before income taxes | | | 270,370 | | | | 221,342 | | | | 116,286 | |
| Income tax expense | | | 102,515 | | | | 81,718 | | | | 40,018 | |
| | | | | | | | | | | | | |
| NET EARNINGS | | $ | 167,855 | | | $ | 139,624 | | | $ | 76,268 | |
| | | | | | | | | | | | | |
| Basic earnings per common share | | $ | 2.54 | | | $ | 2.10 | | | $ | 1.11 | |
| | | | | | | | | | | | | |
| Diluted earnings per common share | | $ | 2.52 | | | $ | 2.08 | | | $ | 1.10 | |
| | | | | | | | | | | | | |
| | | | | | | | | | | | |
| | | Year Ended December 31, | |
| | | 2011 | | | 2010 | | | 2009 | |
| | | (In thousands, except per share data) | |
Revenues | | | | | | | | |
Store | | | | | | | | | | | | |
Rentals and fees | | $ | 2,496,863 | | | $ | 2,335,496 | | | $ | 2,346,849 | |
Merchandise sales | | | 259,796 | | | | 220,329 | | | | 261,631 | |
Installment sales | | | 68,617 | | | | 63,833 | | | | 53,035 | |
Other | | | 17,925 | | | | 76,542 | | | | 57,601 | |
Franchise | | | | | | | | | | | | |
Merchandise sales | | | 33,972 | | | | 30,575 | | | | 28,065 | |
Royalty income and fees | | | 5,011 | | | | 4,857 | | | | 4,775 | |
| | | | | | | | | | | | |
| | | 2,882,184 | | | | 2,731,632 | | | | 2,751,956 | |
Cost of revenues | | | | | | | | | | | | |
Store | | | | | | | | | | | | |
Cost of rentals and fees | | | 570,493 | | | | 519,282 | | | | 530,018 | |
Cost of merchandise sold | | | 201,854 | | | | 164,133 | | | | 188,433 | |
Cost of installment sales | | | 24,834 | | | | 23,303 | | | | 18,687 | |
Franchise cost of merchandise sold | | | 32,487 | | | | 29,242 | | | | 26,820 | |
| | | | | | | | | | | | |
| | | 829,668 | | | | 735,960 | | | | 763,958 | |
Gross profit | | | 2,052,516 | | | | 1,995,672 | | | | 1,987,998 | |
Operating expenses | | | | | | | | | | | | |
Salaries and other expenses | | | 1,594,480 | | | | 1,543,391 | | | | 1,556,074 | |
General and administrative expenses | | | 136,141 | | | | 126,319 | | | | 137,626 | |
Amortization and write-down of intangibles | | | 4,675 | | | | 3,254 | | | | 2,843 | |
Impairment charge | | | 7,320 | | | | 18,939 | | | | — | |
Restructuring charge | | | 13,943 | | | | — | | | | — | |
Litigation expense (credit) | | | 2,800 | | | | — | | | | (4,869 | ) |
| | | | | | | | | | | | |
| | | 1,759,359 | | | | 1,691,903 | | | | 1,691,674 | |
Operating profit | | | 293,157 | | | | 303,769 | | | | 296,324 | |
Finance charges from refinancing | | | — | | | | 3,100 | | | | — | |
Interest expense | | | 37,234 | | | | 26,766 | | | | 26,791 | |
Interest income | | | (627 | ) | | | (854 | ) | | | (837 | ) |
| | | | | | | | | | | | |
Earnings before income taxes | | | 256,550 | | | | 274,757 | | | | 270,370 | |
Income tax expense | | | 91,913 | | | | 103,115 | | | | 102,515 | |
| | | | | | | | | | | | |
NET EARNINGS | | $ | 164,637 | | | $ | 171,642 | | | $ | 167,855 | |
| | | | | | | | | | | | |
Basic earnings per common share | | $ | 2.69 | | | $ | 2.64 | | | $ | 2.54 | |
| | | | | | | | | | | | |
Diluted earnings per common share | | $ | 2.66 | | | $ | 2.60 | | | $ | 2.52 | |
| | | | | | | | | | | | |
Cash dividends paid per common share | | $ | 0.44 | | | $ | 0.12 | | | $ | — | |
| | | | | | | | | | | | |
See accompanying notes to consolidated financial statements.
44
Rent-A-center, Inc. And Subsidiaries
Rent-A-Center, Inc. and Subsidiaries
| | | | | | | | | |
| | | December 31, | |
| | | 2009 | | | 2008 | |
| | | (In thousands, except share and par value data) | |
| |
ASSETS |
| Cash and cash equivalents | | $ | 101,803 | | | $ | 87,382 | |
| Receivables, net of allowance for doubtful accounts of $9,753 in 2009 and $7,256 in 2008 | | | 63,439 | | | | 51,766 | |
| Prepaid expenses and other assets | | | 50,680 | | | | 59,217 | |
| Rental merchandise, net | | | | | | | | |
| On rent | | | 589,066 | | | | 634,946 | |
| Held for rent | | | 160,932 | | | | 184,108 | |
| Merchandise held for installment sale | | | 4,069 | | | | 3,433 | |
| Property assets, net | | | 204,551 | | | | 208,897 | |
| Goodwill, net | | | 1,268,684 | | | | 1,265,249 | |
| Other intangible assets, net | | | 773 | | | | 1,704 | |
| | | | | | | | | |
| | | $ | 2,443,997 | | | $ | 2,496,702 | |
| | | | | | | | | |
| |
| LIABILITIES |
| Accounts payable — trade | | $ | 97,159 | | | $ | 93,496 | |
| Accrued liabilities | | | 265,051 | | | | 289,701 | |
| Deferred income taxes | | | 123,115 | | | | 87,216 | |
| Senior debt | | | 711,158 | | | | 721,712 | |
| Subordinated notes payable | | | — | | | | 225,375 | |
| | | | | | | | | |
| | | | 1,196,483 | | | | 1,417,500 | |
| | | | | | | | | |
| COMMITMENTS AND CONTINGENCIES | | | | | | | | |
| |
| STOCKHOLDERS’ EQUITY |
| Common stock, $.01 par value; 250,000,000 shares authorized; 104,910,759 and 104,769,382 shares issued in 2009 and 2008, respectively | | | 1,049 | | | | 1,047 | |
| Additional paid-in capital | | | 686,592 | | | | 681,067 | |
| Retained earnings | | | 1,377,332 | | | | 1,207,623 | |
| Treasury stock, 39,259,949 and 38,787,849 shares at cost in 2009 and 2008, respectively | | | (819,754 | ) | | | (810,921 | ) |
| Cumulative translation adjustment | | | 2,295 | | | | 386 | |
| | | | | | | | | |
| | | | 1,247,514 | | | | 1,079,202 | |
| | | | | | | | | |
| | | $ | 2,443,997 | | | $ | 2,496,702 | |
| | | | | | | | | |
| | | | | | | | |
| | | December 31, | |
| | | 2011 | | | 2010 | |
| | | (In thousands, except share
and par value data) | |
| ASSETS | |
Cash and cash equivalents | | $ | 88,065 | | | $ | 70,727 | |
Receivables, net of allowance for doubtful accounts of $8,100 in 2011 and $8,673 in 2010 | | | 48,221 | | | | 53,890 | |
Prepaid expenses and other assets | | | 69,326 | | | | 170,713 | |
Rental merchandise, net | | | | | | | | |
On rent | | | 766,425 | | | | 655,248 | |
Held for rent | | | 186,768 | | | | 181,606 | |
Merchandise held for installment sale | | | 4,097 | | | | 5,417 | |
Property assets, net | | | 287,621 | | | | 224,639 | |
Goodwill, net | | | 1,339,125 | | | | 1,320,467 | |
Other intangible assets, net | | | 11,730 | | | | 5,624 | |
| | | | | | | | |
| | $ | 2,801,378 | | | $ | 2,688,331 | |
| | | | | | | | |
|
| LIABILITIES | |
Accounts payable — trade | | $ | 105,064 | | | $ | 126,051 | |
Accrued liabilities | | | 298,719 | | | | 288,415 | |
Deferred income taxes | | | 297,711 | | | | 218,952 | |
Senior debt | | | 440,675 | | | | 401,114 | |
Senior notes | | | 300,000 | | | | 300,000 | |
| | | | | | | | |
| | | 1,442,169 | | | | 1,334,532 | |
| | |
COMMITMENTS AND CONTINGENCIES | | | | | | | | |
| | |
| STOCKHOLDERS’ EQUITY | | | | | | | | |
Common stock, $.01 par value; 250,000,000 shares authorized; 107,799,899 and 105,990,704 shares issued in 2011 and 2010, respectively | | | 1,077 | | | | 1,060 | |
Additional paid-in capital | | | 757,933 | | | | 712,600 | |
Retained earnings | | | 1,669,389 | | | | 1,541,168 | |
Treasury stock, 48,697,852 and 42,845,444 shares at cost in 2011 and 2010, respectively | | | (1,068,443 | ) | | | (904,274 | ) |
Cumulative translation adjustment | | | (747 | ) | | | 3,245 | |
| | | | | | | | |
| | | 1,359,209 | | | | 1,353,799 | |
| | | | | | | | |
| | $ | 2,801,378 | | | $ | 2,688,331 | |
| | | | | | | | |
See accompanying notes to consolidated financial statements.
45
Rent-A-center, Inc. And Subsidiaries
| | | | | | | | | | | | | | | | | | | | | | | | | |
| | | | | | | | | Additional
| | | | | | | | | | |
| | | Common Stock | | | Paid-In
| | | Retained
| | | Treasury
| | | | |
| | | Shares | | | Amount | | | Capital | | | Earnings | | | Stock | | | Total | |
| |
| Balance at January 1, 2007 | | | 104,192 | | | $ | 1,042 | | | $ | 662,440 | | | $ | 993,567 | | | $ | (714,090 | ) | | $ | 942,959 | |
| Net earnings | | | — | | | | — | | | | — | | | | 76,268 | | | | — | | | | 76,268 | |
| Purchase of treasury stock (3,832 shares) | | | — | | | | — | | | | (99 | ) | | | — | | | | (83,449 | ) | | | (83,548 | ) |
| Exercise of stock options | | | 348 | | | | 3 | | | | 5,928 | | | | — | | | | — | | | | 5,931 | |
| Tax benefits related to exercise of stock options | | | — | | | | — | | | | 943 | | | | — | | | | — | | | | 943 | |
| Stock-based compensation | | | — | | | | — | | | | 5,050 | | | | — | | | | — | | | | 5,050 | |
| Other | | | — | | | | — | | | | (230 | ) | | | (282 | ) | | | — | | | | (512 | ) |
| | | | | | | | | | | | | | | | | | | | | | | | | |
| Balance at December 31, 2007 | | | 104,540 | | | | 1,045 | | | | 674,032 | | | | 1,069,553 | | | | (797,539 | ) | | | 947,091 | |
| Net earnings | | | — | | | | — | | | | — | | | | 139,624 | | | | — | | | | 139,624 | |
| Other comprehensive income: | | | | | | | | | | | | | | | | | | | | | | | | |
| Foreign currency translation adjustment | | | — | | | | — | | | | — | | | | 386 | | | | — | | | | 386 | |
| | | | | | | | | | | | | | | | | | | | | | | | | |
| Comprehensive income | | | | | | | | | | | | | | | | | | | | | | | 140,010 | |
| | | | | | | | | | | | | | | | | | | | | | | | | |
| Purchase of treasury stock (952 shares) | | | — | | | | — | | | | (24 | ) | | | — | | | | (13,382 | ) | | | (13,406 | ) |
| Exercise of stock options | | | 229 | | | | 2 | | | | 3,167 | | | | — | | | | — | | | | 3,169 | |
| Tax benefits related to exercise of stock options | | | — | | | | — | | | | 560 | | | | — | | | | — | | | | 560 | |
| Stock-based compensation | | | — | | | | — | | | | 3,341 | | | | — | | | | — | | | | 3,341 | |
| Other | | | — | | | | — | | | | (9 | ) | | | (1,554 | ) | | | — | | | | (1,563 | ) |
| | | | | | | | | | | | | | | | | | | | | | | | | |
| Balance at December 31, 2008 | | | 104,769 | | | | 1,047 | | | | 681,067 | | | | 1,208,009 | | | | (810,921 | ) | | | 1,079,202 | |
| Net earnings | | | — | | | | — | | | | — | | | | 167,855 | | | | — | | | | 167,855 | |
| Other comprehensive income: | | | | | | | | | | | | | | | | | | | | | | | | |
| Foreign currency translation adjustment | | | — | | | | — | | | | — | | | | 2,295 | | | | — | | | | 2,295 | |
| | | | | | | | | | | | | | | | | | | | | | | | | |
| Comprehensive income | | | | | | | | | | | | | | | | | | | | | | | 170,150 | |
| | | | | | | | | | | | | | | | | | | | | | | | | |
| Purchase of treasury stock (472 shares) | | | — | | | | — | | | | (13 | ) | | | — | | | | (8,833 | ) | | | (8,846 | ) |
| Exercise of stock options | | | 142 | | | | 2 | | | | 1,535 | | | | — | | | | — | | | | 1,537 | |
| Tax benefits related to exercise of stock options | | | — | | | | — | | | | 270 | | | | — | | | | — | | | | 270 | |
| Stock-based compensation | | | — | | | | — | | | | 3,731 | | | | — | | | | — | | | | 3,731 | |
| Other | | | — | | | | — | | | | 2 | | | | 1,468 | | | | — | | | | 1,470 | |
| | | | | | | | | | | | | | | | | | | | | | | | | |
| Balance at December 31, 2009 | | | 104,911 | | | $ | 1,049 | | | $ | 686,592 | | | $ | 1,379,627 | | | $ | (819,754 | ) | | $ | 1,247,514 | |
| | | | | | | | | | | | | | | | | | | | | | | | | |
| | | | | | | | | | | | | | | | | | | | | | | | |
| | | Common Stock | | | Additional
Paid-In
Capital | | | Retained
Earnings | | | Treasury
Stock | | | Total | |
| | | Shares | | | Amount | | | | | |
Balance at January 1, 2009 | | | 104,769 | | | $ | 1,047 | | | $ | 681,067 | | | $ | 1,208,009 | | | $ | (810,921 | ) | | $ | 1,079,202 | |
Net earnings | | | — | | | | — | | | | — | | | | 167,855 | | | | — | | | | 167,855 | |
Other comprehensive income: | | | | | | | | | | | | | | | | | | | | | | | | |
Foreign currency translation adjustment | | | — | | | | — | | | | — | | | | 2,295 | | | | — | | | | 2,295 | |
| | | | | | | | | | | | | | | | | | | | | | | | |
Comprehensive income | | | | | | | | | | | | | | | | | | | | | | | 170,150 | |
| | | | | | | | | | | | | | | | | | | | | | | | |
Purchase of treasury stock (472 shares) | | | — | | | | — | | | | (13 | ) | | | — | | | | (8,833 | ) | | | (8,846 | ) |
Exercise of stock options | | | 142 | | | | 2 | | | | 1,535 | | | | — | | | | — | | | | 1,537 | |
Tax benefits related to exercise of stock options | | | — | | | | — | | | | 270 | | | | — | | | | — | | | | 270 | |
Stock-based compensation | | | — | | | | — | | | | 3,731 | | | | — | | | | — | | | | 3,731 | |
Other | | | — | | | | — | | | | 2 | | | | 1,468 | | | | — | | | | 1,470 | |
| | | | | | | | | | | | | | | | | | | | | | | | |
Balance at December 31, 2009 | | | 104,911 | | | | 1,049 | | | | 686,592 | | | | 1,379,627 | | | | (819,754 | ) | | | 1,247,514 | |
Net earnings | | | — | | | | — | | | | — | | | | 171,642 | | | | — | | | | 171,642 | |
Other comprehensive income: | | | | | | | | | | | | | | | | | | | | | | | | |
Foreign currency translation adjustment | | | — | | | | — | | | | — | | | | 950 | | | | — | | | | 950 | |
| | | | | | | | | | | | | | | | | | | | | | | | |
Comprehensive income | | | | | | | | | | | | | | | | | | | | | | | 172,592 | |
| | | | | | | | | | | | | | | | | | | | | | | | |
Purchase of treasury stock (3,585 shares) | | | — | | | | — | | | | (72 | ) | | | — | | | | (84,520 | ) | | | (84,592 | ) |
Exercise of stock options | | | 1,080 | | | | 11 | | | | 19,029 | | | | — | | | | — | | | | 19,040 | |
Tax benefits related to exercise of stock options | | | — | | | | — | | | | 2,974 | | | | — | | | | — | | | | 2,974 | |
Stock-based compensation | | | — | | | | — | | | | 4,123 | | | | — | | | | — | | | | 4,123 | |
Dividends paid | | | — | | | | — | | | | — | | | | (7,804 | ) | | | — | | | | (7,804 | ) |
Other | | | — | | | | — | | | | (46 | ) | | | (2 | ) | | | — | | | | (48 | ) |
| | | | | | | | | | | | | | | | | | | | | | | | |
Balance at December 31, 2010 | | | 105,991 | | | | 1,060 | | | | 712,600 | | | | 1,544,413 | | | | (904,274 | ) | | | 1,353,799 | |
Net earnings | | | — | | | | — | | | | — | | | | 164,637 | | | | — | | | | 164,637 | |
Other comprehensive income: | | | | | | | | | | | | | | | | | | | | | | | | |
Foreign currency translation adjustment | | | — | | | | — | | | | — | | | | (3,992 | ) | | | — | | | | (3,992 | ) |
| | | | | | | | | | | | | | | | | | | | | | | | |
Comprehensive income | | | | | | | | | | | | | | | | | | | | | | | 160,645 | |
| | | | | | | | | | | | | | | | | | | | | | | | |
Purchase of treasury stock (5,852 shares) | | | — | | | | — | | | | (116 | ) | | | — | | | | (164,169 | ) | | | (164,285 | ) |
Exercise of stock options | | | 1,809 | | | | 17 | | | | 34,893 | | | | — | | | | — | | | | 34,910 | |
Tax benefits related to exercise of stock options | | | — | | | | — | | | | 7,036 | | | | — | | | | — | | | | 7,036 | |
Stock-based compensation | | | — | | | | — | | | | 4,471 | | | | — | | | | — | | | | 4,471 | |
Dividends declared | | | — | | | | — | | | | — | | | | (36,357 | ) | | | — | | | | (36,357 | ) |
Other | | | — | | | | — | | | | (951 | ) | | | (59 | ) | | | — | | | | (1,010 | ) |
| | | | | | | | | | | | | | | | | | | | | | | | |
Balance at December 31, 2011 | | | 107,800 | | | $ | 1,077 | | | $ | 757,933 | | | $ | 1,668,642 | | | $ | (1,068,443 | ) | | $ | 1,359,209 | |
| | | | | | | | | | | | | | | | | | | | | | | | |
See accompanying notes to consolidated financial statements.
46
Rent-A-center, Inc. And Subsidiaries
Rent-A-Center, Inc. and Subsidiaries
| | | | | | | | | | | | | |
| | | Year Ended December 31, | |
| | | 2009 | | | 2008 | | | 2007 | |
| | | (In thousands) | |
| |
| Cash flows from operating activities | | | | | | | | | | | | |
| Net earnings | | $ | 167,855 | | | $ | 139,624 | | | $ | 76,268 | |
| Adjustments to reconcile net earnings to net cash provided by operating activities | | | | | | | | | | | | |
| Depreciation of rental merchandise | | | 519,103 | | | | 561,414 | | | | 561,880 | |
| Bad debt expense | | | 17,395 | | | | 14,455 | | | | 10,828 | |
| Stock-based compensation expense | | | 3,731 | | | | 3,341 | | | | 5,050 | |
| Depreciation of property assets | | | 65,788 | | | | 72,683 | | | | 71,279 | |
| Loss on sale or disposal of property assets | | | 5,856 | | | | 375 | | | | 20,345 | |
| Amortization of intangibles | | | 1,291 | | | | 12,589 | | | | 15,734 | |
| Amortization of financing fees | | | 1,970 | | | | 1,703 | | | | 1,824 | |
| Deferred income taxes | | | 35,899 | | | | 77,538 | | | | 11,213 | |
| Tax benefit related to stock option exercises | | | (270 | ) | | | (560 | ) | | | (943 | ) |
| Gain on extinguishment of debt | | | — | | | | (4,335 | ) | | | — | |
| Restructuring charge | | | — | | | | 4,497 | | | | 38,713 | |
| Changes in operating assets and liabilities, net of effects of acquisitions | | | | | | | | | | | | |
| Rental merchandise | | | (449,128 | ) | | | (438,964 | ) | | | (445,920 | ) |
| Accounts receivable | | | (34,781 | ) | | | (24,572 | ) | | | (17,390 | ) |
| Prepaid expenses and other assets | | | (9,421 | ) | | | (7,056 | ) | | | (6,194 | ) |
| Accounts payable — trade | | | 16,367 | | | | (6,924 | ) | | | (18,021 | ) |
| Accrued liabilities | | | (11,534 | ) | | | (21,472 | ) | | | (84,286 | ) |
| | | | | | | | | | | | | |
| Net cash provided by operating activities | | | 330,121 | | | | 384,336 | | | | 240,380 | |
| Cash flows from investing activities | | | | | | | | | | | | |
| Purchase of property assets | | | (68,841 | ) | | | (61,931 | ) | | | (101,961 | ) |
| Proceeds from sale of property assets | | | 3,122 | | | | 6,144 | | | | 4,500 | |
| Acquisitions of businesses, net of cash acquired | | | (7,221 | ) | | | (15,700 | ) | | | (20,112 | ) |
| | | | | | | | | | | | | |
| Net cash used in investing activities | | | (72,940 | ) | | | (71,487 | ) | | | (117,573 | ) |
| Cash flows from financing activities | | | | | | | | | | | | |
| Purchase of treasury stock | | | (8,833 | ) | | | (13,382 | ) | | | (83,449 | ) |
| Exercise of stock options | | | 1,537 | | | | 3,169 | | | | 5,931 | |
| Tax benefit related to stock option exercises | | | 270 | | | | 560 | | | | 943 | |
| Payments on capital leases | | | (2,100 | ) | | | (5,662 | ) | | | (7,258 | ) |
| Proceeds from debt | | | 186,100 | | | | 213,050 | | | | 785,555 | |
| Repayments of debt | | | (196,654 | ) | | | (446,338 | ) | | | (819,498 | ) |
| Repurchase of subordinated notes | | | (225,375 | ) | | | (74,625 | ) | | | — | |
| | | | | | | | | | | | | |
| Net cash used in financing activities | | | (245,055 | ) | | | (323,228 | ) | | | (117,776 | ) |
| Effect of exchange rate changes on cash | | | 2,295 | | | | 386 | | | | — | |
| NET INCREASE (DECREASE) IN CASH AND CASH EQUIVALENTS | | | 14,421 | | | | (9,993 | ) | | | 5,031 | |
| Cash and cash equivalents at beginning of year | | | 87,382 | | | | 97,375 | | | | 92,344 | |
| | | | | | | | | | | | | |
| Cash and cash equivalents at end of year | | $ | 101,803 | | | $ | 87,382 | | | $ | 97,375 | |
| | | | | | | | | | | | | |
| Supplemental cash flow information | | | | | | | | | | | | |
| Cash paid during the year for: | | | | | | | | | | | | |
| Interest | | $ | 27,920 | | | $ | 70,688 | | | $ | 89,372 | |
| Income taxes (excludes $1,380 and $34,656 of income taxes refunded in 2009 and 2008, respectively) | | $ | 69,312 | | | $ | 20,954 | | | $ | 19,759 | |
| | | | | | | | | | | | |
| | | Year Ended December 31, | |
| | | 2011 | | | 2010 | | | 2009 | |
| | | (In thousands) | |
Cash flows from operating activities | | | | | | | | | | | | |
Net earnings | | $ | 164,637 | | | $ | 171,642 | | | $ | 167,855 | |
Adjustments to reconcile net earnings to net cash provided by operating activities | | | | | | | | | | | | |
Depreciation of rental merchandise | | | 556,945 | | | | 506,854 | | | | 519,103 | |
Bad debt expense | | | 3,407 | | | | 16,168 | | | | 17,395 | |
Stock-based compensation expense | | | 4,471 | | | | 4,123 | | | | 3,731 | |
Depreciation of property assets | | | 65,214 | | | | 63,410 | | | | 65,788 | |
Loss on sale or disposal of property assets | | | 2,237 | | | | 13,599 | | | | 5,856 | |
Amortization of intangibles | | | 4,285 | | | | 701 | | | | 1,291 | |
Amortization of financing fees | | | 2,344 | | | | 2,047 | | | | 1,970 | |
Finance charges from refinancing | | | — | | | | 3,100 | | | | — | |
Deferred income taxes | | | 78,759 | | | | 95,837 | | | | 35,899 | |
Tax benefit related to stock option exercises | | | (7,036 | ) | | | (2,974 | ) | | | (270 | ) |
Impairment charge | | | 7,320 | | | | 18,939 | | | | — | |
Restructuring charge | | | 13,943 | | | | — | | | | — | |
Changes in operating assets and liabilities, net of effects of acquisitions | | | | | | | | | | | | |
Rental merchandise | | | (670,347 | ) | | | (567,733 | ) | | | (449,128 | ) |
Receivables | | | 2,262 | | | | (6,620 | ) | | | (34,781 | ) |
Prepaid expenses and other assets | | | 99,114 | | | | (123,649 | ) | | | (9,421 | ) |
Accounts payable — trade | | | (20,987 | ) | | | 25,467 | | | | 16,367 | |
Accrued liabilities | | | (19,942 | ) | | | (4,422 | ) | | | (11,534 | ) |
| | | | | | | | | | | | |
Net cash provided by operating activities | | | 286,626 | | | | 216,489 | | | | 330,121 | |
Cash flows from investing activities | | | | | | | | | | | | |
Purchase of property assets | | | (132,710 | ) | | | (93,007 | ) | | | (68,841 | ) |
Proceeds from sale of property assets | | | 208 | | | | 203 | | | | 3,122 | |
Acquisitions of businesses, net of cash acquired | | | (26,747 | ) | | | (74,378 | ) | | | (7,221 | ) |
| | | | | | | | | | | | |
Net cash used in investing activities | | | (159,249 | ) | | | (167,182 | ) | | | (72,940 | ) |
Cash flows from financing activities | | | | | | | | | | | | |
Purchase of treasury stock | | | (164,169 | ) | | | (84,520 | ) | | | (8,833 | ) |
Exercise of stock options | | | 34,910 | | | | 19,040 | | | | 1,537 | |
Tax benefit related to stock option exercises | | | 7,036 | | | | 2,974 | | | | 270 | |
Payments on capital leases | | | (285 | ) | | | (979 | ) | | | (2,100 | ) |
Issuance of senior notes | | | — | | | | 300,000 | | | | — | |
Proceeds from debt | | | 982,825 | | | | 92,230 | | | | 186,100 | |
Repayments of debt | | | (943,264 | ) | | | (402,274 | ) | | | (196,654 | ) |
Repurchase of subordinated notes | | | — | | | | — | | | | (225,375 | ) |
Dividends paid | | | (26,891 | ) | | | (7,804 | ) | | | — | |
| | | | | | | | | | | | |
Net cash used in financing activities | | | (109,838 | ) | | | (81,333 | ) | | | (245,055 | ) |
Effect of exchange rate changes on cash | | | (201 | ) | | | 950 | | | | 2,295 | |
NET INCREASE (DECREASE) IN CASH AND CASH EQUIVALENTS | | | 17,338 | | | | (31,076 | ) | | | 14,421 | |
Cash and cash equivalents at beginning of year | | | 70,727 | | | | 101,803 | | | | 87,382 | |
| | | | | | | | | | | | |
Cash and cash equivalents at end of year | | $ | 88,065 | | | $ | 70,727 | | | $ | 101,803 | |
| | | | | | | | | | | | |
Supplemental cash flow information | | | | | | | | | | | | |
Cash paid during the year for: | | | | | | | | | | | | |
Interest | | $ | 35,609 | | | $ | 20,569 | | | $ | 27,920 | |
Income taxes (excludes $113,202, $330 and $1,380 of income taxes refunded in 2011, 2010 and 2009, respectively) | | $ | 10,522 | | | $ | 124,065 | | | $ | 69,312 | |
See accompanying notes to consolidated financial statements.
47
RENT-A-CENTER, INC. AND SUBSIDIARIES
NOTES TO CONSOLIDATED FINANCIAL STATEMENTS
| |
Note A — | Summary of Accounting Policies and Nature of Operations |
Note A — Summary of Accounting Policies and Nature of Operations
A summary of the significant accounting policies consistently applied in the preparation of the accompanying consolidated financial statements follows:
Principles of Consolidation and Nature of Operations
These financial statements include the accounts ofRent-A-Center, Inc., and its direct and indirect subsidiaries. All intercompany accounts and transactions have been eliminated. We report four operating segments: Core U.S., RAC Acceptance, International and ColorTyme. Unless the context indicates otherwise, references to“Rent-A-Center” “Rent-A-Center” refer only toRent-A-Center, Inc., the parent, and references to “we,” “us” and “our” refer to the consolidated business operations ofRent-A-Center and any or all of its direct and indirect subsidiaries.
Our primary operatingCore U.S. segment consists of leasing household durable goods to customers on arent-to-own basis. We also offer merchandise on an installment sales basis in certain of our stores. At December 31, 2009,2011, we operated 3,0072,994 company-owned stores nationwide and in Canada and Puerto Rico, including 39 retail installment sales stores under the names “Get It Now” and “Home Choice,Choice.”
Our RAC Acceptance segment generally offers the rent-to-own transaction to consumers who do not qualify for financing from the traditional retailer through kiosks located within such retailer’s store locations. At December 31, 2011, we operated 750 RAC Acceptance locations.
Our International segment consists of our company-owned store locations in Canada and18 Mexico that lease household durable goods to customers on a rent-to-own basis. At December 31, 2011, we operated 28 stores in Canada under the names“Rent-A-Centre”name “Rent-A-Centre” and “Better Living.”
We also offer an array of financial services in certain of our existing stores under the names “RAC Financial Services” and “Cash AdvantEdge.” The financial services we offer include, but are not limited to, short term secured and unsecured loans, debit cards, check cashing and money transfer services. As of December 31, 2009, we offered financial services in 353 of our existing52 stores in 17 states.
Mexico.ColorTyme, Inc., an indirect wholly-owned subsidiary ofRent-A-Center, is a nationwide franchisor ofrent-to-own stores. At December 31, 2009,2011, ColorTyme had 210216 franchised stores operating in 33 states. ColorTyme’sOur ColorTyme segment’s primary source of revenue is the sale of rental merchandise to its franchisees, who in turn offer the merchandise to the general public for rent or purchase under arent-to-own program. transaction. The balance of ColorTyme’s revenue is generated primarily from royalties based on franchisees’ monthly gross revenues.
From 2005 to 2010, we also offered an array of financial services in certain of our stores under the names “RAC Financial Services” and “Cash AdvantEdge.” The financial services we offered included, but were not limited to, short term secured and unsecured loans, debit cards, check cashing and money transfer services. These operations are reported in the Core U.S. segment.
Rental Merchandise
Rental merchandise is carried at cost, net of accumulated depreciation. Depreciation for merchandise is generally provided using the income forecasting method, which is intended to match as closely as practicable the recognition of depreciation expense with the consumption of the rental merchandise, and assumes no salvage value. The consumption of rental merchandise occurs during periods of rental and directly coincides with the receipt of rental revenue over the rental-purchaserental purchase agreement period, generally seven to 30 months.period. Under the income forecasting method, merchandise held for rent is not depreciated and merchandise on rent is depreciated in the proportion of rents received to total rents provided in the rental contract, which is an activity-based method similar to the units of production method. Effective July 1, 2009, weWe depreciate merchandise held for rent (except for computers)computers and tablets) that is at least 270 days old and held for rent for at least 180 consecutive days using the straight-line method for a period generally not to exceed 20 months. This change in depreciation method had no material impact on our consolidated financial statements.
RENT-A-CENTER, INC. AND SUBSIDIARIES
NOTES TO CONSOLIDATED FINANCIAL STATEMENTS — (Continued)
On computers and tablets that are 24 months old or older and which have become idle, depreciation is recognized using the straight-line method for a period of at least six months, generally not to exceed an aggregate depreciation period of 30 months.
Rental merchandise which is damaged and inoperable or not returned by the customer after becoming delinquent on payments, is expensed when such impairment occurs. If a customer in a Core U.S. store does not return the merchandise or make payment, the remaining book value of the rental merchandise associated with delinquent accounts is generally charged off on or before the 90th day following the time the account became past due. We maintain a reserve for these expected expenses. In addition, any minor repairs made to rental merchandise are expensed at the time of the repair.
48
RENT-A-CENTER, INC. AND SUBSIDIARIES
NOTES TO CONSOLIDATED FINANCIAL STATEMENTS — (Continued)
Cash Equivalents
Cash equivalents include all highly liquid investments with an original maturity of three months or less. We maintain cash and cash equivalents at several financial institutions, which at times may not be federally insured or may exceed federally insured limits. We have not experienced any losses in such accounts and believe we are not exposed to any significant credit risks on such accounts.
Merchandise is rented to customers pursuant to rental purchase agreements which provide for weekly, semi-monthly or monthly rental terms with non-refundable rental payments. Generally, the customer has the right to acquire title either through a purchase option or through payment of all required rentals. Rental revenue and fees are recognized over the rental term and merchandise sales revenue is recognized when the customer exercises the purchase option and pays the cash price due. Cash received prior to the period in which it should be recognized is deferred and recognized according to the rental term. Revenue is accrued for uncollected amounts due based on historical collection experience. However, the total amount of the rental purchase agreement is not accrued because the customer can terminate the rental agreement at any time and we cannot enforce collection for non-payment of future rents.
Revenue from the sale of merchandise in our retail installment stores is recognized when the installment note is signed, the customer has taken possession of the merchandise and collectability is reasonably assured.
TheRevenue from the sale of rental merchandise is recognized upon shipment of the merchandise to the franchisee. Franchise royalty income and fee revenue is recognized upon completion of substantially all services and satisfaction of all material conditions required under the terms of the franchise agreement.
Prior to 2011, revenue from our financial services iswas recognized depending on the type of transaction. Fees collected on loans arewere recognized ratably over the term of the loan. For money orders, wire transfers, check cashing and other customer service type transactions, fee revenue iswas recognized at the time the service iswas performed.
Receivables and Allowance for Doubtful Accounts
The receivable associated with the sale of merchandise at our Get It Now and Home Choice stores generally consists of the sales price of the merchandise purchased and any additional fees for services the customer has chosen, less the customer’s down payment. No interest is accrued and interest income is recognized each time a customer makes a payment, generally on a monthly basis.
OurRENT-A-CENTER, INC. AND SUBSIDIARIES
NOTES TO CONSOLIDATED FINANCIAL STATEMENTS — (Continued)
Prior to 2011, our financial services business extendsextended short term secured and unsecured loans. The amount and length of such loans may varyvaried depending on applicable state law.
We have established an allowance for doubtful accounts for our installment notes and loan receivables.receivable. Our policy for determining the allowance is based on historical loss experience, as well as the results of management’s review and analysis of the payment and collection of the installment notes and loan receivablesreceivable within the previous year. We believe our allowances are adequate to absorb any known or probable losses. Our policy is to charge off installment notes and loan receivablesreceivable that are 90 days or more past due. Charge offs are applied as a reduction to the allowance for doubtful accounts and any recoveries of previously charged off balances are applied as an increase to the allowance for doubtful accounts.
Similar procedures were followed for loan receivables until the discontinuation of our financial services business.The majority of ColorTyme’s accounts receivable relate to amounts due from franchisees. Credit is extended based on an evaluation of a franchisee’s financial condition and collateral is generally not required. Accounts receivable are due within 30 days and are stated at amounts due from franchisees net of an allowance for doubtful accounts. Accounts that are outstanding longer than the contractual payment terms are considered past due. ColorTyme determines its allowance by considering a number of factors, including the length of time trade accounts receivable are past due, ColorTyme’s previous loss history, the franchisee’s current ability to pay its obligation to ColorTyme, and the condition of the general economy and the industry as a whole. ColorTyme writes off accounts receivable that are 120 days or more past due and payments subsequently received on such receivables are credited to the allowance for doubtful accounts.
49
RENT-A-CENTER, INC. AND SUBSIDIARIES
NOTES TO CONSOLIDATED FINANCIAL STATEMENTS — (Continued)
Property Assets and Related Depreciation
Furniture, equipment and vehicles are stated at cost less accumulated depreciation. Depreciation is provided over the estimated useful lives of the respective assets (generally five years) by the straight-line method. Our building is depreciated over approximately 40 years. Leasehold improvements are amortized over the useful life of the asset or the initial term of the applicable leases by the straight-line method, whichever is shorter.
We have incurred costs to develop computer software for internal use. We capitalize the costs incurred during the application development stage, which includes designing the software configuration and interfaces, coding, installation, and testing. Costs incurred during the preliminary stages along with post-implementation stages of internally developed software are expensed as incurred. As of December 31, 2009, we have not placed in service or amortized any internally developed software. Internally developed software costs, once placed in service, will beare amortized over various periods up to ten years.
We incur repair and maintenance expenses on our vehicles and equipment. These amounts are recognized when incurred, unless such repairs significantly extend the life of the asset, in which case we amortize the cost of the repairs for the remaining life of the asset utilizing the straight-line method.
Intangible Assets and Amortization
We record goodwill when the consideration paid for an acquisition exceeds the fair value of the identifiable net tangible and identifiable intangible assets acquired. Goodwill is not subject to amortization but must be periodically evaluated for impairment. Impairment occurs when the carrying value of goodwill is not recoverable from future cash flows. We perform an assessment of goodwill for impairment at the reporting unit level annually as of December 31 of each year, or when events or circumstances indicate that impairment may have occurred. Our reporting units are generally our reportable operating segments. Factors which could necessitate an interim impairment assessment include a sustained decline in our stock price, prolonged negative industry or economic trends and significant underperformance relative to expected historical or projected future operating
RENT-A-CENTER, INC. AND SUBSIDIARIES
NOTES TO CONSOLIDATED FINANCIAL STATEMENTS — (Continued)
results. We assess recoverability using methodologies which include the present value of estimated future cash flows and comparisons of multiples of enterprise values to earnings before interest, taxes, depreciation and amortization. The analysis is based upon available information regarding expected future cash flows and discount rates. Discount rates are based upon our cost of capital. If the carrying value exceeds the discounted fair value, a second analysis is performed to measure the fair value of all assets and liabilities. If, based on the second analysis, it is determined that the fair value of the assets and liabilities is less than the carrying value, we would recognize impairment charges in an amount equal to the excess of the carrying value over fair value. There were no impairment charges recognized related to goodwill in 2009, 20082011, 2010 and 2007.
2009.Accounting for Impairment of Long-Lived Assets
We evaluate all long-lived assets, including intangible assets, excluding goodwill, for impairment whenever events or changes in circumstances indicate that the carrying amounts may not be recoverable. Impairment is recognized when the carrying amounts of such assets cannot be recovered by the undiscounted net cash flows they will generate.
Foreign Currency Translation
The functional currency of our foreign operations is predominantly the applicable local currency. Assets and liabilities denominated in a foreign currency are translated into U.S. dollars at the current rate of exchange on the last day of the reporting period. Revenues and expenses are generally translated at a daily exchange rate and equity transactions are translated using the actual rate on the day of the transaction.
50
RENT-A-CENTER, INC. AND SUBSIDIARIES
NOTES TO CONSOLIDATED FINANCIAL STATEMENTS — (Continued)
Other Comprehensive Income
Other comprehensive income is comprised exclusively of our foreign currency translation adjustment. The currency translation adjustment was approximately $2.3 million and $386,000 at December 31, 2009 and 2008, respectively.
Income tax expense is based on pretax financial accounting income. Deferred tax assets and liabilities are recognizedWe record deferred taxes for the expected tax consequences of temporary differences between the tax and financial reporting bases of assets and liabilities at the enacted tax rate expected to be in effect when taxes become payable. Income tax accounting requires management to make estimates and their reported amounts. Valuation allowances are recordedapply judgments to reduceevents that will be recognized in one period under rules that apply to financial reporting in a different period in our tax returns. In particular, judgment is required when estimating the value of future tax deductions, tax credits and net operating loss carryforwards (NOLs), as represented by deferred tax assetsassets. We evaluate the recoverability of these future tax deductions and credits by assessing the future expected taxable income from all sources, including reversal of taxable temporary differences, forecasted operating earnings and available tax planning strategies. These sources of income rely heavily on estimates. We use our historical experience and our short and long-range business forecasts to provide insight and assist us in determining recoverability. When it is determined the recovery of all or a portion of a deferred tax asset is not likely, a valuation allowance is established. We include NOLs in the calculation of deferred tax assets. NOLs are utilized to the amount that will more likely than not be realized.
extent allowable due to the provisions of the Internal Revenue Code of 1986, as amended, and relevant state statutes.We recognize the financial statement benefit of a tax position only after determining that the relevant tax authority would more likely than not sustain the position following an audit. For tax positions meeting the more-likely-than notmore-likely-than-not threshold, the amount recognized in the financial statements is the largest benefit that has a greater than 50 percent likelihood of being realized upon the ultimate settlement with the relevant tax authority. A number of years may elapse before a particular matter, for which we have recorded a liability, is audited and effectively settled. We review our tax positions quarterly and adjust the balance as new information becomes available.
We classify interest accrued related to unrecognized tax benefits as interest expense.RENT-A-CENTER, INC. AND SUBSIDIARIES
NOTES TO CONSOLIDATED FINANCIAL STATEMENTS — (Continued)
Sales Taxes
We apply the net basis for sales taxes imposed on our goods and services in our Consolidated Statements of Earnings. We are required by the applicable governmental authorities to collect and remit sales taxes. Accordingly, such amounts are charged to the customer, collected and remitted directly to the appropriate jurisdictional entity.
Earnings Per Common Share
Basic earnings per common share are based upon the weighted average number of common shares outstanding during each period presented. Diluted earnings per common share are based upon the weighted average number of common shares outstanding during the period, plus, if dilutive, the assumed exercise of stock options and the assumed conversion of convertible securities at the beginning of the year, or for the period outstanding during the year for current year issuances.
Costs incurred for producing and communicating advertising are expensed when incurred. Advertising expense was $75.9 million, $77.3 million and $78.7 million, $82.5 million,for the years ended December 31, 2011, 2010 and $79.8 million in 2009, 2008, and 2007, respectively.
We maintain long-term incentive plans for the benefit of certain employees, consultants and directors, which are described more fully in Note L.K. We recognize share-based payment awards to our employees and directors at the estimated fair value on the grant date. Determining the fair value of any share-based awardsaward requires information about several variables including,that include, but are not limited to, expected stock volatility over the terms of the awards,award, expected dividend yields and the predicted employee exercise behavior. We base expected life on historical exercise and post-vesting employment-termination experience, and expected volatility on historical realized volatility trends. In addition, all stock-based compensation expense is recorded net of an estimated forfeiture rate. The forfeiture rate is based upon historical activity and is analyzed at least quarterly as actual forfeitures occur.
Compensation costs are recognized net of estimated forfeitures over the award’s requisite service period on a straight-line basis. For the year ended December 31, 2009, 2008 and 2007, we recorded stock-based compensation expense, net of related taxes, of approximately $2.3 million, $2.1 million and $3.3 million, respectively, relatedWe issue new shares to settle stock options and restricted stock units granted.
51
RENT-A-CENTER, INC. AND SUBSIDIARIES
NOTES TO CONSOLIDATED FINANCIAL STATEMENTS — (Continued)
Use of Estimates
In preparing financial statements in conformity with accounting principles generally accepted in the United States of America, we are required to make estimates and assumptions that affect the reported amounts of assets and liabilities, the disclosure of contingent losses and liabilities at the date of the financial statements, and the reported amounts of revenues and expenses during the reporting period. In applying accounting principles, we must often make individual estimates and assumptions regarding expected outcomes or uncertainties. Our estimates, judgments and assumptions are continually evaluated based on available information and experience. Because of the use of estimates inherent in the financial reporting process, actual results could differ from those estimates. We believe self-insurance liabilities, litigation and tax reserves are areas where the degree of judgment and complexity in determining amounts recorded in our consolidated financial statements make the accounting policies critical.
New Accounting Pronouncements
In June 2009, the Financial Accounting Standards Board (“FASB”) issued Accounting Standards Codification 105,Generally Accepted Accounting Principles(“ASC 105”). ASC 105 is the single source of authoritative nongovernmental U.S. generally accepted accounting principles (“GAAP”), superseding existing FASB, American Institute of Certified Public Accountants (“AICPA”), Emerging Issues Task Force (“EITF”), and related accounting literature. ASC 105 reorganizes the thousands of GAAP pronouncements into roughly 90 accounting topics and displays them using a consistent structure. Also included is relevant SEC guidance organized using the same topical structure in separate sections. ASC 105 is effective for financial statements issued for reporting periods ending after September 15, 2009. All references to authoritative accounting literature in our financial statements issued for reporting periods ending after September 15, 2009 are referenced in accordance with ASC 105.
In June 2009,2011, the FASB issued Accounting Standards Update
2009-17, 2011-08,ImprovementsIntangibles—Goodwill and Other (Topic 350): Testing Goodwill for Impairment (“ASU 2011-08”), which allows companies to
Financial Reporting by Enterprises Involved with Variable Interest Entities(“ASU2009-17”), which changes various aspectswaive comparing the fair value of
accounting for and disclosuresa reporting unit to its carrying amount in assessing the recoverability of
interests in variable interest entities.goodwill if, based on qualitative factors, it is not more likely than not that the fair value of a reporting unit is less than itsRENT-A-CENTER, INC. AND SUBSIDIARIES
NOTES TO CONSOLIDATED FINANCIAL STATEMENTS — (Continued)
carrying amount. ASU2009-17 is 2011-08 will be effective for annual and interim and annual periodsgoodwill impairment tests performed for fiscal years beginning after NovemberDecember 15, 2009.2011, with early adoption permissible. The adoption of ASU2009-17 willthis standard is not expected to have a material effectimpact on our consolidated statement of earnings, financial condition, statement of cash flows or earnings per share.
In May 2009,June 2011, the FASB issued ASC 855,Accounting Standards Update 2011-05,Subsequent Events.ASC 855 establishes general standardsComprehensive Income (Topic 220): Presentation of accountingComprehensive Income (“ASU 2011-05”), which allows an entity the option to present the total of comprehensive income, the components of net income, and the components of other comprehensive income either in a single continuous statement of comprehensive income or in two separate but consecutive statements. In both choices, an entity is required to present each component of net income along with total net income, each component of other comprehensive income along with a total for other comprehensive income, and disclosurea total amount for comprehensive income. ASU 2011-05 eliminates the option to present the components of eventsother comprehensive income as part of the statement of changes in stockholders’ equity. The amendments to the Codification in the ASU do not change the items that occurmust be reported in other comprehensive income or when an item of other comprehensive income must be reclassified to net income and are effective for fiscal years, and interim periods within those years, beginning after December 15, 2011, with early adoption permissible. The adoption of ASU 2011-05 will not have a financial impact on our consolidated statement of earnings, financial condition, statement of cash flows or earnings per share.
In May 2011, the balance sheet dateFASB issued Accounting Standards Update 2011-04,Fair Value Measurement (Topic 820): Amendments to Achieve Common Fair Value Measurement and Disclosure Requirements in U.S. GAAP and IFRSs (“ASU 2011-04”). The amendments in this ASU generally represent clarification of Topic 820, but before financial statementsalso include instances where a particular principle or requirement for measuring fair value or disclosing information about fair value measurements has changed. This update results in common principles and requirements for measuring fair value and for disclosing information about fair value measurements in accordance with U.S. GAAP and IFRS. The amendments are issued or are available to be issued. ASC 855 applies prospectively to botheffective for interim and annual financial periods endingbeginning after JuneDecember 15, 2009.2011 and are to be applied prospectively. Early application is not permitted. The adoption of ASC 855 didASU 2011-04 will not result in anyhave a material change to our policies.
In April 2009, the FASB issued ASC825-10-65,Financial Instruments. ASC825-10-65 amends FASB Statement No. 107,Disclosures about Fair Value of Financial Instruments, and Accounting Principles Board Opinion No. 28,Interim Financial Reporting, to require disclosures about fair value of financial instruments for interim periods of publicly traded companies as well as in annual financial statements. ASC825-10-65 is effective for interim reporting periods ending after June 15, 2009. The adoption of ASC825-10-65 had no material effectimpact on our disclosures in ourconsolidated statement of earnings, financial statements.
condition, statement of cash flows or earnings per share.From time to time, new accounting pronouncements are issued by the FASB or other standards setting bodies that we adopt as of the specified effective date. Unless otherwise discussed, we believe the impact of any other recently issued standards that are not yet effective are either not applicable to us at this time or will not have a material impact on our consolidated financial statements upon adoption.
52
Note B — Receivables and Allowance for Doubtful AccountsReceivables consist of the following:
| | | | | | | | |
| | | December 31, | |
| | | 2011 | | | 2010 | |
| | | (In thousands) | |
Installment sales receivable | | $ | 46,418 | | | $ | 42,839 | |
Trade and notes receivables | | | 9,903 | | | | 7,492 | |
Financial services loans receivable | | | — | | | | 12,232 | |
| | | | | | | | |
Total | | | 56,321 | | | | 62,563 | |
Less allowance for doubtful accounts | | | (8,100 | ) | | | (8,673 | ) |
| | | | | | | | |
Net receivables | | $ | 48,221 | | | $ | 53,890 | |
| | | | | | | | |
RENT-A-CENTER, INC. AND SUBSIDIARIES
NOTES TO CONSOLIDATED FINANCIAL STATEMENTS — (Continued)
| |
Note B — | Receivables and Allowance for Doubtful Accounts |
Receivables consist of the following:
| | | | | | | | | |
| | | December 31, | |
| | | 2009 | | | 2008 | |
| | | (In thousands) | |
| |
| Installment sales receivable | | $ | 35,636 | | | $ | 29,561 | |
| Financial services loans receivable | | | 26,021 | | | | 19,327 | |
| Trade and notes receivables | | | 11,535 | | | | 10,134 | |
| | | | | | | | | |
| Total | | | 73,192 | | | | 59,022 | |
| Less allowance for doubtful accounts | | | (9,753 | ) | | | (7,256 | ) |
| | | | | | | | | |
| Net receivables | | $ | 63,439 | | | $ | 51,766 | |
| | | | | | | | | |
The allowance for doubtful accounts related to installment sales receivable was $5.8$6.4 million and $3.9$6.0 million, and trade receivables was $1.7 million and $2.1 million at December 31, 2011 and 2010, respectively. The allowance for doubtful accounts related to financial services loans receivable was $1.2 million and $800,000, and trade receivables was $2.8 million and $2.6 million$610,000 at December 31, 2009 and 2008, respectively.
2010.Changes in our allowance for doubtful accounts are as follows:
| | | | | | | | | | | | | |
| | | December 31, | |
| | | 2009 | | | 2008 | | | 2007 | |
| | | (In thousands) | |
| |
| Beginning balance | | $ | 7,256 | | | $ | 4,945 | | | $ | 4,026 | |
| Bad debt expense | | | 17,395 | | | | 14,455 | | | | 10,828 | |
| Accounts written off | | | (20,721 | ) | | | (17,843 | ) | | | (20,496 | ) |
| Recoveries | | | 5,823 | | | | 5,699 | | | | 10,587 | |
| | | | | | | | | | | | | |
| Ending balance | | $ | 9,753 | | | $ | 7,256 | | | $ | 4,945 | |
| | | | | | | | | | | | | |
| |
Note C — | Rental Merchandise |
| | | | | | | | | |
| | | December 31, | |
| | | 2009 | | | 2008 | |
| | | (In thousands) | |
| |
| On rent | | | | | | | | |
| Cost | | $ | 1,038,408 | | | $ | 1,165,084 | |
| Less accumulated depreciation | | | (449,342 | ) | | | (530,138 | ) |
| | | | | | | | | |
| Net book value, on rent | | $ | 589,066 | | | $ | 634,946 | |
| | | | | | | | | |
| Held for rent | | | | | | | | |
| Cost | | $ | 220,523 | | | $ | 260,649 | |
| Less accumulated depreciation | | | (59,591 | ) | | | (76,541 | ) |
| | | | | | | | | |
| Net book value, held for rent | | $ | 160,932 | | | $ | 184,108 | |
| | | | | | | | | |
53
| | | | | | | | | | | | |
| | | December 31, | |
| | | 2011 | | | 2010 | | | 2009 | |
| | | (In thousands) | |
Beginning balance | | $ | 8,673 | | | $ | 9,753 | | | $ | 7,256 | |
Bad debt expense | | | 3,407 | | | | 16,168 | | | | 17,395 | |
Accounts written off | | | (8,289 | ) | | | (23,107 | ) | | | (20,721 | ) |
Recoveries | | | 4,309 | | | | 5,859 | | | | 5,823 | |
| | | | | | | | | | | | |
Ending balance | | $ | 8,100 | | | $ | 8,673 | | | $ | 9,753 | |
| | | | | | | | | | | | |
Note C — Rental Merchandise
| | | | | | | | |
| | | December 31, | |
| | | 2011 | | | 2010 | |
| | | (In thousands) | |
On rent | | | | | | | | |
Cost | | $ | 1,210,612 | | | $ | 1,083,496 | |
Less accumulated depreciation | | | (444,187 | ) | | | (428,248 | ) |
| | | | | | | | |
Net book value, on rent | | $ | 766,425 | | | $ | 655,248 | |
| | | | | | | | |
Held for rent | | | | | | | | |
Cost | | $ | 250,591 | | | $ | 242,348 | |
Less accumulated depreciation | | | (63,823 | ) | | | (60,742 | ) |
| | | | | | | | |
Net book value, held for rent | | $ | 186,768 | | | $ | 181,606 | |
| | | | | | | | |
Note D — Property Assets
RENT-A-CENTER, INC. AND SUBSIDIARIES
NOTES TO CONSOLIDATED FINANCIAL STATEMENTS — (Continued)
| | | | | | | | | |
| | | December 31, | |
| | | 2009 | | | 2008 | |
| | | (In thousands) | |
| |
| Furniture and equipment | | $ | 221,117 | | | $ | 223,488 | |
| Transportation equipment | | | 16,835 | | | | 34,738 | |
| Building and leasehold improvements | | | 238,938 | | | | 224,098 | |
| Land and land improvements | | | 5,193 | | | | 5,193 | |
| Construction in progress | | | 26,919 | | | | 10,178 | |
| | | | | | | | | |
| | | | 509,002 | | | | 497,695 | |
| Less accumulated depreciation | | | (304,451 | ) | | | (288,798 | ) |
| | | | | | | | | |
| | | $ | 204,551 | | | $ | 208,897 | |
| | | | | | | | | |
| | | | | | | | |
| | | December 31, | |
| | | 2011 | | | 2010 | |
| | | (In thousands) | |
Furniture and equipment | | $ | 281,111 | | | $ | 249,392 | |
Transportation equipment | | | 16,083 | | | | 14,032 | |
Building and leasehold improvements | | | 292,028 | | | | 259,476 | |
Land and land improvements | | | 5,299 | | | | 5,299 | |
Construction in progress | | | 55,210 | | | | 42,291 | |
| | | | | | | | |
| | | 649,731 | | | | 570,490 | |
Less accumulated depreciation | | | (362,110 | ) | | | (345,851 | ) |
| | | | | | | | |
| | $ | 287,621 | | | $ | 224,639 | |
| | | | | | | | |
We had $19.0$47.8 million and $7.9$37.8 million of capitalized software costs included in construction in progress at December 31, 2011 and 2010, respectively. For the years ended December 31, 2011 and 2010, we placed in service internally developed software of approximately $16.0 million and $20.6 million, respectively. As of December 31, 2009, we had not placed in service any internally developed software.
RENT-A-CENTER, INC. AND SUBSIDIARIES
NOTES TO CONSOLIDATED FINANCIAL STATEMENTS — (Continued)
Note E — Intangible Assets and 2008, respectively.
| |
Note E — | Intangible Assets and Acquisitions |
IntangiblesAcquisitionsIntangible Assets
Amortizable intangible assets consist of the following (in thousands):
| | | | | | | | | | | | | | | | | | | | | |
| | | | | | December 31,
| | | December 31,
| |
| | | | | | 2009 | | | 2008 | |
| | | Avg.
| | | Gross
| | | | | | Gross
| | | | |
| | | Life
| | | Carrying
| | | Accumulated
| | | Carrying
| | | Accumulated
| |
| | | (years) | | | Amount | | | Amortization | | | Amount | | | Amortization | |
| |
| Amortizable intangible assets | | | | | | | | | | | | | | | | | | | | |
| Non-compete agreements | | | 3 | | | $ | 6,091 | | | $ | 6,021 | | | $ | 6,281 | | | $ | 5,957 | |
| Customer relationships | | | 2 | | | | 62,247 | | | | 61,544 | | | | 62,110 | | | | 60,950 | |
| Other intangibles | | | 3 | | | | 3,264 | | | | 3,264 | | | | 3,264 | | | | 3,044 | |
| | | | | | | | | | | | | | | | | | | | | |
| Total | | | | | | | 71,602 | | | | 70,829 | | | | 71,655 | | | | 69,951 | |
| Intangible assets not subject to amortization | | | | | | | | | | | | | | | | | | | | |
| Goodwill | | | | | | | 1,367,836 | | | | 99,152 | | | | 1,364,401 | | | | 99,152 | |
| | | | | | | | | | | | | | | | | | | | | |
| Total intangibles | | | | | | $ | 1,439,438 | | | $ | 169,981 | | | $ | 1,436,056 | | | $ | 169,103 | |
| | | | | | | | | | | | | | | | | | | | | |
| | | | | |
| Aggregate Amortization Expense | | | | |
| Year ended December 31, 2009 | | $ | 1,291 | |
| Year ended December 31, 2008 | | $ | 12,589 | |
| Year ended December 31, 2007 | | $ | 15,734 | |
| | | | | | | | | | | | | | | | | | | | |
| | | | | | December 31, 2011 | | | December 31, 2010 | |
| | | Avg.
Life
(years) | | | Gross
Carrying
Amount | | | Accumulated
Amortization | | | Gross
Carrying
Amount | | | Accumulated
Amortization | |
Non-compete agreements | | | 3 | | | $ | 6,104 | | | $ | 6,091 | | | $ | 6,094 | | | $ | 6,057 | |
Customer relationships | | | 2 | | | | 70,648 | | | | 65,901 | | | | 67,811 | | | | 62,224 | |
Vendor relationships | | | 11 | | | | 7,538 | | | | 568 | | | | — | | | | — | |
| | | | | | | | | | | | | | | | | | | | |
Total | | | | | | $ | 84,290 | | | $ | 72,560 | | | $ | 73,905 | | | $ | 68,281 | |
| | | | | | | | | | | | | | | | | | | | |
Aggregate amortization expense (in thousands):
| | | | |
Year ended December 31, 2011 | | $ | 4,285 | |
Year ended December 31, 2010 | | $ | 701 | |
Year ended December 31, 2009 | | $ | 1,291 | |
Estimated amortization expense, assuming current intangible balances and no new acquisitions, for each of the years ending December 31, is as follows:
| | | | | |
| | | Estimated
| |
| | | Amortization Expense | |
| | | (In thousands) | |
| |
| 2010 | | $ | 632 | |
| 2011 | | | 141 | |
| | | | | |
| Total | | $ | 773 | |
| | | | | |
54
| | | | |
| | | Estimated
Amortization Expense | |
| | | (In thousands) | |
2012 | | $ | 4,517 | |
2013 | | | 1,376 | |
2014 | | | 571 | |
2015 | | | 568 | |
2016 | | | 568 | |
Thereafter | | | 4,130 | |
| | | | |
Total | | $ | 11,730 | |
| | | | |
Unless otherwise noted, substantially all goodwill is recorded in the Core U.S. segment. A summary of the changes in recorded goodwill follows (in thousands):
| | | | | | | | |
| | | December 31, | |
| | | 2011 | | | 2010 | |
Gross balance as of January 1, | | $ | 1,320,467 | | | $ | 1,268,684 | |
Additions from acquisitions | | | 18,755 | | | | 55,922 | (1) |
Goodwill related to stores sold or closed | | | (390 | ) | | | (4,320 | )(2) |
Post purchase price allocation adjustments | | | 293 | | | | 181 | |
| | | | | | | | |
Balance as of the end of the period | | $ | 1,339,125 | | | $ | 1,320,467 | |
| | | | | | | | |
| (1) | Includes $53.9 million of goodwill related to the acquisition of The Rental Store, Inc., which is recorded in the RAC Acceptance segment. |
| (2) | Includes $1.8 million of goodwill impairment related to the discontinuation of our financial services business. |
RENT-A-CENTER, INC. AND SUBSIDIARIES
NOTES TO CONSOLIDATED FINANCIAL STATEMENTS — (Continued)
Changes in the carrying amount of goodwill for the years ended December 31, 2009 and 2008 are as follows:
| | | | | | | | | |
| | | 2009 | | | 2008 | |
| | | (In thousands) | |
| |
| Balance as of January 1, | | $ | 1,265,249 | | | $ | 1,255,163 | |
| Additions from acquisitions | | | 4,456 | | | | 9,692 | |
| Write-down of goodwill related to stores sold | | | (1,552 | ) | | | (4,048 | ) |
| Post purchase price allocation adjustments | | | 531 | | | | 4,442 | |
| | | | | | | | | |
| Balance as of the end of the period | | $ | 1,268,684 | | | $ | 1,265,249 | |
| | | | | | | | | |
The following table provides information concerning the acquisitions made during the years ended December 31, 2009, 20082011, 2010 and 2007.
| | | | | | | | | | | | | |
| | | Year Ended December 31, |
| | | 2009 | | 2008 | | 2007 |
| | | (Dollar amounts in thousands) |
| |
| Number of stores acquired remaining open | | | 1 | | | | 5 | | | | 12 | |
| Number of stores acquired that were merged with existing stores | | | 26 | | | | 38 | | | | 36 | |
| Number of transactions | | | 20 | | | | 20 | | | | 19 | |
| Total purchase price | | $ | 7,221 | | | $ | 15,700 | | | $ | 20,112 | |
| Amounts allocated to: | | | | | | | | | | | | |
| Goodwill | | $ | 4,456 | | | $ | 9,692 | | | $ | 13,310 | |
| Non-compete agreements | | | — | | | | 2 | | | | 10 | |
| Customer relationships | | | 554 | | | | 1,091 | | | | 1,210 | |
| Accounts receivable | | | 398 | | | | — | | | | — | |
| Property and other assets | | | — | | | | 25 | | | | 38 | |
| Rental merchandise | | | 1,813 | | | | 4,890 | | | | 5,544 | |
Acquisition purchase2009. | | | | | | | | | | | | |
| | | Year Ended December 31, | |
| | | 2011 | | | 2010 | | | 2009 | |
| | | (Dollar amounts in thousands) | |
Number of stores acquired remaining open | | | 26 | | | | 3 | | | | 1 | |
Number of stores acquired that were merged with existing stores | | | 71 | | | | 14 | | | | 26 | |
Number of kiosk locations acquired | | | 5 | | | | 158 | | | | — | |
Number of transactions | | | 19 | | | | 15 | | | | 20 | |
Total purchase price | | $ | 26,747 | | | $ | 74,378 | (1) | | $ | 7,221 | |
Amounts allocated to: | | | | | | | | | | | | |
Goodwill | | $ | 18,755 | | | $ | 55,922 | | | $ | 4,456 | |
Non-compete agreements | | | 10 | | | | — | | | | — | |
Customer relationships | | | 2,843 | | | | 5,551 | | | | 554 | |
Receivables | | | — | | | | — | | | | 398 | |
Rental merchandise | | | 6,023 | | | | 27,325 | | | | 1,813 | |
Property and other assets | | | — | | | | 1,740 | | | | — | |
Liabilities assumed | | | (884 | ) | | | (16,160 | ) | | | — | |
| (1) | Of this amount, $71.0 million, net of cash acquired, was funded in connection with the acquisition of The Rental Store, Inc. |
Purchase prices are determined by evaluating the average monthly rental income of the acquired stores and applying a multiple to the total.total for rent-to-own store acquisitions. With respect to the acquisition of The Rental Store, Inc., the purchase price was determined using a pro forma multiple of earnings. The initial accounting for the acquisition was not finalized as of December 31, 2010, due to the timing of the transaction. In the quarter ending June 30, 2011, we recorded an adjustment of $7.5 million from goodwill to vendor relationships after the analysis of acquired intangible assets was completed. Acquired customer relationships are amortized utilizing the straight-line method over a 2421 month period, non-compete agreements are amortized using the straight-line method over the life of the agreements, vendor relationships are amortized using the straight-line method over a seven or 15 year period, other intangible assets are amortized using the straight-line method over the life of the asset and goodwill associated with acquisitions is not amortized. The weighted average amortization period was 2.0approximately 8 years for intangible assets acquiredadded during the year ended December 31, 2009.2011. Additions to goodwill due to acquisitions in 20092011 were tax deductible.
All acquisitions have been accounted for as purchases, and the operating results of the acquired stores and accounts have been included in the financial statements since their date of acquisition.
Note F — Senior Debt
On December 3, 2007,July 14, 2011, we announced the completion of the refinancing of our plansenior secured debt. Our new $750.0 million senior credit facilities consist of a $250.0 million, five-year term loan and a $500.0 million, five-year revolving credit facility. On that day, we drew down $250.0 million in term loans and $100.0 million under the revolving facility and utilized the proceeds to close approximately 280 storesprepay our existing senior term debt. The revolving credit facility and incur restructuring expenses in the range of $36.0 million to $43.0 million. The decision to close these stores was basedterm loan expire on our analysis and evaluation of every market in which we operated based on operating results, competitive positioning, and growth potential. We recorded restructuring expenses in the amount of $4.5 million for the year ended December 31, 2008. All remaining costs, primarily lease related, will be charged to operating expenses as they are incurred.
55
RENT-A-CENTER, INC. AND SUBSIDIARIES
NOTES TO CONSOLIDATED FINANCIAL STATEMENTS — (Continued)
The following table presents the range of estimated charges as of December 31, 2007 and the total store consolidation plan charges and other restructuring items recorded through December 31, 2009.
| | | | | | | | | | | | | |
| | | | | | | | | Estimated Remaining
| |
| | | Closing Plan Estimate
| | | | | | Charges
| |
| | | As of December 31,
| | | Expenses Recognized
| | | As of December 31,
| |
| | | 2007 | | | Through 2009 | | | 2009 | |
| | | (In thousands) | |
| |
| Lease obligations | | $ | 26,061 - $29,223 | | | $ | 26,774 | | | $ | 2,972 | |
| Fixed asset disposals | | | 11,006 - 11,516 | | | | 11,476 | | | | — | |
| Other costs | | | 2,468 - 6,704 | | | | 6,054 | | | | — | |
| | | | | | | | | | | | | |
| Total | | $ | 39,535 - $47,443 | | | $ | 44,304 | | | $ | 2,972 | |
| | | | | | | | | | | | | |
Changes in the accrual balance, which relate to lease obligations, from December 31, 2008 to December 31, 2009 for the store consolidation plan are as follows:
| | | | | |
| | | (In thousands) | |
| |
| Balance as of December 31, 2008 | | $ | 7,357 | |
| Charges to expense | | | 1,094 | |
| Cash payments | | | (5,479 | ) |
| | | | | |
| Balance as of December 31, 2009 | | $ | 2,972 | |
| | | | | |
The total amount of cash used in the store consolidation plan through December 31, 2009 was approximately $22.4 million. We expect to use approximately $3.0 million of cash on hand for future payments to satisfy the lease obligations at the stores. We expect the lease obligations will be completed no later than the first quarter of 2013.
On December 2, 2009, we entered into an amendment to our existing senior credit facility to extend the maturities of a portion of the loans outstanding. The amended senior credit agreement provides for a $999 million senior credit facility consisting of a $165 million term loan with the loans being referred to by us as the “tranche A term loans,” a $484 million term loan with the loans being referred to by us as the “tranche B term loans,” and a $350 million revolving credit facility.
The tranche A term loans are divided into two equalsub-tranches of $82.5 million each, referred to by us as the “existing tranche A term loans” and the “extended tranche A term loans.” The existing tranche A term loans mature on June 30, 2011 and are repayable in six consecutive quarterly installments of (i) $2.5 million from March 31, 2010 through June 30, 2010 and (ii) $18.75 million from September 30, 2010 through June 30, 2011. The extended tranche A term loans mature on September 30, 2013 and are repayable in 15 consecutive quarterly installments of (i) $2.5 million from March 31, 2010 through September 30, 2012 and (ii) $13.125 million from December 31, 2012 through September 30, 2013. Under the amended senior credit facility, the tranche B term loans are divided into twosub-tranches of approximately $184 million and $300 million, referred to by us as the “existing tranche B term loans” and the “extended tranche B term loans,” respectively. The existing tranche B term loans mature on June 30, 2012 and are repayable in ten consecutive quarterly installments of (i) approximately $642,000 from March 31, 2010 through June 30, 2011, (ii) approximately $20.2 million on September 30, 2011, (iii) approximately $37.3 million on December 31, 2011, and (iv) approximately $61.0 million from March 31, 2012 through June 30, 2012. The extended tranche B term loans mature on March 31, 2015 and are repayable in 21 consecutive quarterly installments of (i) $750,000 from March 31, 2010 through March 31, 2014 and (ii) approximately $71.6 million from June 30, 2014 through March 31, 2015.
56
RENT-A-CENTER, INC. AND SUBSIDIARIES
NOTES TO CONSOLIDATED FINANCIAL STATEMENTS — (Continued)
The debt facilities as of December 31, 20092011 and 20082010 are as follows:
| | | | | | | | | | | | | | | | | | | | | | | | | | | | | |
| | | | | | 2009 | | | 2008 | |
| | | Facility
| | | Maximum
| | | Amount
| | | Amount
| | | Maximum
| | | Amount
| | | Amount
| |
| | | Maturity | | | Facility | | | Outstanding | | | Available | | | Facility | | | Outstanding | | | Available | |
| | | (In thousands) | |
| |
| Senior Credit Facilities: | | | | | | | | | | | | | | | | | | | | | | | | | | | | |
| Tranche A Term Loans Existing | | | 2011 | | | $ | 82,500 | | | $ | 80,000 | | | $ | — | | | $ | 197,500 | | | $ | 175,000 | | | $ | — | |
| Tranche A Term Loans Extended | | | 2013 | | | | 82,500 | | | | 80,000 | | | | — | | | | — | | | | — | | | | — | |
| Tranche B Term Loans Existing | | | 2012 | | | | 184,080 | | | | 183,438 | | | | — | | | | 725,000 | | | | 534,147 | | | | — | |
| Tranche B Term Loans Extended | | | 2015 | | | | 300,000 | | | | 299,250 | | | | — | | | | — | | | | — | | | | — | |
Revolving Facility(1) | | | 2013 | | | | 350,000 | | | | 52,000 | | | | 179,520 | | | | 400,000 | | | | — | | | | 269,415 | |
| | | | | | | | | | | | | | | | | | | | | | | | | | | | | |
| | | | | | | | 999,080 | | | | 694,688 | | | | 179,520 | | | | 1,322,500 | | | | 709,147 | | | | 269,415 | |
| Other Indebtedness: | | | | | | | | | | | | | | | | | | | | | | | | | | | | |
| Line of credit | | | | | | | 20,000 | | | | 16,470 | | | | 3,530 | | | | 20,000 | | | | 12,565 | | | | 7,435 | |
| | | | | | | | | | | | | | | | | | | | | | | | | | | | | |
| Total | | | | | | $ | 1,019,080 | | | $ | 711,158 | | | $ | 183,050 | | | $ | 1,342,500 | | | $ | 721,712 | | | $ | 276,850 | |
| | | | | | | | | | | | | | | | | | | | | | | | | | | | | |
| | | | | | | | | | | | | | | | | | | | | | | | | | | | |
| | | | | | December 31, 2011 | | | December 31, 2010 | |
| | | Facility
Maturity | | | Maximum
Facility | | | Amount
Outstanding | | | Amount
Available | | | Maximum
Facility | | | Amount
Outstanding | | | Amount
Available | |
| | | (In thousands) | |
Senior Credit Facilities: | | | | | | | | | | | | | | | | | | | | | | | | | | | | |
New Term Loan | | | 2016 | | | $ | 250,000 | | | $ | 237,500 | | | $ | — | | | $ | — | | | $ | — | | | $ | — | |
Tranche A Term Loans Existing | | | 2011 | | | | — | | | | — | | | | — | | | | 82,500 | | | | 18,750 | | | | — | |
Tranche A Term Loans Extended | | | 2013 | | | | — | | | | — | | | | — | | | | 82,500 | | | | 55,000 | | | | — | |
Tranche B Term Loans Existing | | | 2012 | | | | — | | | | — | | | | — | | | | 184,080 | | | | 13,334 | | | | — | |
Tranche B Term Loans Extended | | | 2015 | | | | — | | | | — | | | | — | | | | 300,000 | | | | 290,250 | | | | — | |
Revolving Facility(1) | | | 2016 | | | | 500,000 | | | | 185,000 | | | | 198,805 | | | | 375,000 | | | | 6,000 | | | | 231,629 | |
| | | | | | | | | | | | | | | | | | | | | | | | | | | | |
| | | | | | | 750,000 | | | | 422,500 | | | | 198,805 | | | | 1,024,080 | | | | 383,334 | | | | 231,629 | |
Other Indebtedness: | | | | | | | | | | | | | | | | | | | | | | | | | | | | |
Line of credit | | | | | | | 20,000 | | | | 18,175 | | | | 1,825 | | | | 20,000 | | | | 17,780 | | | | 2,220 | |
| | | | | | | | | | | | | | | | | | | | | | | | | | | | |
Total | | | | | | $ | 770,000 | | | $ | 440,675 | | | $ | 200,630 | | | $ | 1,044,080 | | | $ | 401,114 | | | $ | 233,849 | |
| | | | | | | | | | | | | | | | | | | | | | | | | | | | |
| (1) | | |
(1) | | At December 31, 20092011 and 2008,2010, the amounts available under the Revolving Facility were reduced by approximately $118.5$116.2 million and $130.6$137.4 million, respectively, for our outstanding letters of credit. |
Borrowings under our amended senior credit facility accrue interest at varying rates equal to, at our election, either (y) the prime rate plus (i) up0.50% to 0.75% in the case of existing tranche A term loans, (ii) 1.5% to 2.0% in the case of revolving loans or extended tranche A term loans, (iii) .75% in the case of existing tranche B term loans, and (iv) 2.0% in the case of extended tranche B term loans;1.50%; or (z) the Eurodollar rate plus (i) .75%1.50% to 1.75% in the case of existing tranche A term loans, (ii) 2.5% to 3.0% in the case of revolving loans or extended tranche A term loans, (iii) 1.75% in the case of existing tranche B term loans, and (iv) 3.0% in the case of extended tranche B term loans.2.50%. Interest periods range from seven days (for borrowings under the revolving credit facility only) to one, two, three or six months, at our election. The weighted average Eurodollar rate on our outstanding debt was 0.25% at February 19, 2010. The margins on the Eurodollar rate and on the prime rate, for revolving loans, existing tranche A term loans,which were 2.00% and extended tranche A term loans1.00%, respectively, at December 31, 2011, may fluctuate dependent upon an increase or decrease in our consolidated leverage ratio as defined by a pricing grid included in the amended credit agreement. We have not entered into any interest rate protection agreements with respect to term loans under our senior credit facilities. A commitment fee equal to 0.5%0.30% to 0.625%0.50% of the average daily amount of the available revolving commitment is payable quarterly.
Our senior credit facilities are secured by a security interest in substantially all of our tangible and intangible assets, including intellectual property. Our senior credit facilities are also secured by a pledge of the capital stock of our wholly-owned U.S. subsidiaries (other than certain specified subsidiaries).
Our senior credit facilities contain, without limitation, covenants that generally limit our ability to:
incur additional debt in excess of $250.0 million at any one time outstanding (other than subordinated debt, which is generally permitted if the maturity date is later than July 14, 2017);
| | |
| | • | incur additional debt in excess of $300.0 million at any one time, provided that the aggregate amount of indebtedness incurred by all of our subsidiaries may not exceed $50.0 million at any one time; |
|
| | • | repurchase our capital stock and 6 5/8% notes and pay cash dividends in the event the pro forma senior leverage ratio is greater than 2.50x; |
|
| • | incur liens or other encumbrances; |
57
incur liens or other encumbrances;
merge, consolidate or sell substantially all our property or business;sell assets, other than inventory, in the ordinary course of business;
RENT-A-CENTER, INC. AND SUBSIDIARIES
NOTES TO CONSOLIDATED FINANCIAL STATEMENTS — (Continued)
make investments or acquisitions unless we meet financial tests and other requirements;
make capital expenditures; or
enter into an unrelated line of business.
| | |
| • | merge, consolidate or sell substantially all our property or business; |
|
| • | sell assets, other than inventory, in the ordinary course of business; |
|
| • | make investments or acquisitions unless we meet financial tests and other requirements; |
|
| • | make capital expenditures; or |
|
| • | enter into an unrelated line of business. |
Our senior credit facilities require us to comply with several financial covenants. The table below shows the required and actual ratios under our credit facilities calculated as of December 31, 2009:
| | | | | | | | | | |
| | | Required Ratio | | | Actual Ratio |
| |
Maximum consolidated leverage ratio | | No greater than | | | 3.25:1 | | | | 1.72:1.70:1 | |
Minimum fixed charge coverage ratio | | No less than | | | 1.35:1 | | | | 2.07:1.58:1 | |
These financial covenants, as well as the related components of their computation, are defined in the amended and restated credit agreement governing our senior credit facility, which is included as an exhibit to this report.our Current Report on Form 8-K dated as of July 14, 2011. In accordance with the credit agreement, the maximum consolidated leverage ratio was calculated by dividing the consolidated funded debt outstanding at December 31, 20092011 ($620.5659.5 million) by consolidated EBITDA for the twelve month period ended December 31, 20092011 ($360.1387.1 million). For purposes of the covenant calculation, (i) “consolidated funded debt” is defined as outstanding indebtedness less cash in excess of $25.0 million, and (ii) “consolidated EBITDA” is generally defined as consolidated net income (a) plus the sum of income taxes, interest expense, depreciation and amortization expense, extraordinary non-cash expenses or losses, and other non-cash charges, and (b) minus the sum of interest income, extraordinary income or gains, other non-cash income, and cash payments with respect to extraordinary non-cash expenses or losses recorded in prior fiscal quarters. Consolidated EBITDA is a non-GAAP financial measure that is presented not as a measure of operating results, but rather as a measure used to determine covenant compliance under our senior credit facilities.
The minimum fixed charge coverage ratio was calculated pursuant to the credit agreement by dividing consolidated EBITDA for the twelve month period ended December 31, 2009,2011, as adjusted for certain capital expenditures ($474.7514.6 million), by consolidated fixed charges for the twelve month period ended December 31, 20092011 ($229.4325.1 million). For purposes of the covenant calculation, “consolidated fixed charges” is defined as the sum of interest expense, lease expense, cash dividends, and mandatory debt repayments.
Events of default under our senior credit facilities include customary events, such as a cross-acceleration provision in the event that we default on other debt. In addition, an event of default under the senior credit facility would occur if a change of control occurs. This is defined to include the case where a third party becomes the beneficial owner of 35% or more of our voting stock or certain changes inRent-A-Center’s Board of Directors occurs. An event of default would also occur if one or more judgments were entered against us of $30.0$50.0 million or more and such judgments were not satisfied or bonded pending appeal within 30 days after entry.
We utilize our revolving credit facility for the issuance of letters of credit, as well as to manage normal fluctuations in operational cash flow caused by the timing of cash receipts. In that regard, we may from time to time draw funds under the revolving credit facility for general corporate purposes. The funds drawn on individual occasions have varied in amounts of up to $98.0$100.0 million, which occurred at the date we refinanced our senior secured debt, with total amounts outstanding ranging from $2.0 million up to $108.0$186.5 million. The amountsAmounts are drawn are generally outstanding for a short periodas needed due to the timing of timecash flows and are generally paid down as cash is received fromgenerated by our operating activities.
58
RENT-A-CENTER, INC. AND SUBSIDIARIES
NOTES TO CONSOLIDATED FINANCIAL STATEMENTS — (Continued)
The table below shows the scheduled maturity dates of our senior debt outstanding at December 31, 2009.
| | | | | |
Year Ending December 31, | | | |
| | | (In thousands) | |
| |
| 2010 | | $ | 74,539 | |
| 2011 | | | 109,338 | |
| 2012 | | | 145,656 | |
| 2013 | | | 94,375 | |
| 2014 | | | 215,625 | |
| Thereafter | | | 71,625 | |
| | | | | |
| | | $ | 711,158 | |
| | | | | |
| |
2011. | | | | | Year Ending December 31, | | (In thousands) | | 2012 | | | 43,175 | | 2013 | | | 25,000 | | 2014 | | | 25,000 | | 2015 | | | 25,000 | | 2016 | | | 322,500 | | | | | | | | | $ | 440,675 | | | | | | |
Note G — Subsidiary Guarantors –Note H — | Subordinated Notes Payable |
71/2% Senior Subordinated Notes. In May 2009,NotesOn November 2, 2010, we repurchased $150.0issued $300.0 million in senior unsecured notes due November 2020, bearing interest at 6 5/8%, pursuant to an indenture dated November 2, 2010, among Rent-A-Center, Inc., its subsidiary guarantors and The Bank of New York Mellon Trust Company, as trustee. A portion of the proceeds of this offering were used to repay approximately $200.0 million of outstanding term debt under our subordinatedsenior credit facility. The remaining net proceeds were used to repurchase shares of our common stock.
The 2010 indenture contains covenants that limit our ability to:
sell assets or our subsidiaries;
grant liens to third parties;
pay cash dividends or repurchase stock; and
engage in a merger or sell substantially all of our assets.
Events of default under the 2010 indenture include customary events, such as a cross-acceleration provision in the event that we default in the payment of other debt due at maturity or upon acceleration for default in an amount exceeding $50.0 million, as well as in the event a judgment is entered against us in excess of $50.0 million that is not discharged, bonded or insured.
The 6 5/8% notes may be redeemed on or after November 15, 2015, at our option, in whole or in part, at a premium declining from 103.313%. The 6 5/8% notes may be redeemed on or after November 15, 2018, at our option, in whole or in part, at par. The 6 5/8% notes also require that upon the occurrence of a change of control (as defined in the 2010 indenture), the holders of the notes have the right to require us to repurchase the notes at a redemption price equal to 100%101% of the original aggregate principal amount, outstanding, plustogether with accrued and unpaid interest, if any, to the redemption date. In July 2009, we repurchaseddate of repurchase. This would trigger an event of default under our senior credit facilities. We are not required to maintain any financial ratios under the remaining $75.4 million2010 indenture.
Rent-A-Center and its subsidiary guarantors have fully, jointly and severally, and unconditionally guaranteed the obligations of our subordinated notes at a redemption price equalRent-A-Center with respect to the 6 5/8% notes. Rent-A-Center has no independent assets or operations, and each subsidiary guarantor is 100% owned directly or indirectly by Rent-A-Center. The only direct or indirect subsidiaries of Rent-A-Center that are not guarantors are minor subsidiaries. There are no restrictions on the ability of any of the principal amount outstanding, plus accrued interestsubsidiary guarantors to transfer funds to Rent-A-Center in the redemption date. Allform of our 71loans, advances or dividends, except as provided by applicable law./2% senior subordinated notes due May 2010 were redeemed in accordance with their terms on their respective redemption dates and are now paid in full.
| |
Note I — | Accrued Liabilities |
| | | | | | | | | |
| | | December 31, | |
| | | 2009 | | | 2008 | |
| | | (In thousands) | |
| |
| Accrued insurance costs | | $ | 137,824 | | | $ | 126,006 | |
| Accrued litigation costs | | | — | | | | 11,274 | |
| Accrued compensation | | | 39,122 | | | | 44,734 | |
| Deferred revenue | | | 33,476 | | | | 29,394 | |
| Taxes other than income | | | 20,357 | | | | 20,379 | |
| Accrued capital lease obligations | | | 2,348 | | | | 8,214 | |
| Accrued interest payable | | | 1,193 | | | | 4,340 | |
| Accrued restructuring costs | | | 2,972 | | | | 7,357 | |
| Accrued other | | | 27,759 | | | | 38,003 | |
| | | | | | | | | |
| | | $ | 265,051 | | | $ | 289,701 | |
| | | | | | | | | |
59
RENT-A-CENTER, INC. AND SUBSIDIARIES
NOTES TO CONSOLIDATED FINANCIAL STATEMENTS — (Continued)
Note H — Accrued Liabilities
| | | | | | | | |
| | | December 31, | |
| | | 2011 | | | 2010 | |
| | | (In thousands) | |
Accrued insurance costs | | $ | 123,649 | | | $ | 138,760 | |
Deferred revenue | | | 46,747 | | | | 36,620 | |
Accrued compensation | | | 44,967 | | | | 47,656 | |
Taxes other than income | | | 25,457 | | | | 24,244 | |
Accrued interest payable | | | 4,422 | | | | 5,245 | |
Accrued restructuring costs | | | 7,737 | | | | 1,494 | |
Accrued dividends | | | 9,466 | | | | — | |
Accrued capital lease obligations | | | 105 | | | | 816 | |
Accrued other | | | 36,169 | | | | 33,580 | |
| | | | | | | | |
| | $ | 298,719 | | | $ | 288,415 | |
| | | | | | | | |
Note I — Income Taxes
A reconciliation of income tax expense at the federal statutory rate of 35% to actual tax expense follows:
| | | | | | | | | | | | | |
| | | Year Ended December 31, | |
| | | 2009 | | | 2008 | | | 2007 | |
| |
| Tax at statutory rate | | | 35.0 | % | | | 35.0 | % | | | 35.0 | % |
| State income taxes, net of federal benefit (expense) | | | 3.1 | % | | | 2.0 | % | | | (1.7 | )% |
| Effect of foreign operations, net of foreign tax credits | | | — | % | | | — | % | | | 0.5 | % |
| Other, net | | | (0.2 | )% | | | (0.1 | )% | | | 0.6 | % |
| | | | | | | | | | | | | |
| Total | | | 37.9 | % | | | 36.9 | % | | | 34.4 | % |
| | | | | | | | | | | | | |
| | | | | | | | | | | | |
| | | Year Ended
December 31, | |
| | | 2011 | | | 2010 | | | 2009 | |
Tax at statutory rate | | | 35.0 | % | | | 35.0 | % | | | 35.0 | % |
State income taxes, net of federal benefit | | | 1.9 | % | | | 2.9 | % | | | 3.1 | % |
Effect of foreign operations, net of foreign tax credits | | | 0.3 | % | | | 0.5 | % | | | — | % |
Other, net | | | (1.4 | )% | | | (0.9 | )% | | | (0.2 | )% |
| | | | | | | | | | | | |
Total | | | 35.8 | % | | | 37.5 | % | | | 37.9 | % |
| | | | | | | | | | | | |
The components of income tax expense are as follows:
| | | | | | | | | | | | | |
| | | Year Ended December 31, | |
| | | 2009 | | | 2008 | | | 2007 | |
| | | (In thousands) | |
| |
| Current expense | | | | | | | | | | | | |
| Federal | | $ | 55,101 | | | $ | 399 | | | $ | 6,179 | |
| State | | | 10,278 | | | | 2,574 | | | | 14,437 | |
| Foreign | | | 1,288 | | | | 1,192 | | | | 1,145 | |
| | | | | | | | | | | | | |
| Total current | | | 66,667 | | | | 4,165 | | | | 21,761 | |
| | | | | | | | | | | | | |
| Deferred expense | | | | | | | | | | | | |
| Federal | | | 33,028 | | | | 73,015 | | | | 35,808 | |
| State | | | 2,820 | | | | 4,538 | | | | (17,551 | ) |
| | | | | | | | | | | | | |
| Total deferred | | | 35,848 | | | | 77,553 | | | | 18,257 | |
| | | | | | | | | | | | | |
| Total | | $ | 102,515 | | | $ | 81,718 | | | $ | 40,018 | |
| | | | | | | | | | | | | |
60
| | | | | | | | | | | | |
| | | Year Ended December 31, | |
| | | 2011 | | | 2010 | | | 2009 | |
| | | (In thousands) | |
Current expense | | | | | | | | | | | | |
Federal | | $ | 4,154 | | | $ | 749 | | | $ | 55,101 | |
State | | | 6,547 | | | | 8,656 | | | | 10,278 | |
Foreign | | | 3,762 | | | | 4,220 | | | | 1,288 | |
| | | | | | | | | | | | |
Total current | | | 14,463 | | | | 13,625 | | | | 66,667 | |
| | | | | | | | | | | | |
Deferred expense | | | | | | | | | | | | |
Federal | | | 76,936 | | | | 85,866 | | | | 33,028 | |
State | | | 1,145 | | | | 3,624 | | | | 2,820 | |
Foreign | | | (631 | ) | | | — | | | | — | |
| | | | | | | | | | | | |
Total deferred | | | 77,450 | | | | 89,490 | | | | 35,848 | |
| | | | | | | | | | | | |
Total | | $ | 91,913 | | | $ | 103,115 | | | $ | 102,515 | |
| | | | | | | | | | | | |
RENT-A-CENTER, INC. AND SUBSIDIARIES
NOTES TO CONSOLIDATED FINANCIAL STATEMENTS — (Continued)
Deferred tax assets (liabilities) consist of the following:
| | | | | | | | | |
| | | Year Ended December 31, | |
| | | 2009 | | | 2008 | |
| | | (In thousands) | |
| |
| Deferred tax assets | | | | | | | | |
| Federal net operating loss carryforwards | | $ | 32,067 | | | $ | 47,656 | |
| State net operating loss carryforwards | | | 17,018 | | | | 30,225 | |
| Accrued liabilities | | | 47,957 | | | | 39,240 | |
| Property assets | | | 15,014 | | | | 20,462 | |
| Other assets including credits | | | 1,701 | | | | 1,174 | |
| Foreign tax credit carryforwards | | | 1,218 | | | | 2,325 | |
| | | | | | | | | |
| | | | 114,975 | | | | 141,082 | |
| Valuation allowance | | | (7,968 | ) | | | (10,232 | ) |
| Deferred tax liabilities | | | | | | | | |
| Rental merchandise | | | (181,533 | ) | | | (188,152 | ) |
| Intangible assets | | | (48,589 | ) | | | (29,914 | ) |
| | | | | | | | | |
| | | | (230,122 | ) | | | (218,066 | ) |
| | | | | | | | | |
| Net deferred taxes | | $ | (123,115 | ) | | $ | (87,216 | ) |
| | | | | | | | | |
| | | | | | | | |
| | | December 31, | |
| | | 2011 | | | 2010 | |
| | | (In thousands) | |
Deferred tax assets | | | | | | | | |
Federal net operating loss carryforwards | | $ | 63,057 | | | $ | 24,612 | |
State net operating loss carryforwards | | | 16,506 | | | | 12,318 | |
Foreign net operating loss carryforwards | | | 2,989 | | | | 595 | |
Accrued liabilities | | | 48,928 | | | | 53,777 | |
Property assets | | | — | | | | 1,141 | |
Other assets including credits | | | 65 | | | | 1,261 | |
Foreign tax credit carryforwards | | | 4,434 | | | | 2,207 | |
| | | | | | | | |
| | | 135,979 | | | | 95,911 | |
Valuation allowance | | | (930 | ) | | | (5,951 | ) |
Deferred tax liabilities | | | | | | | | |
Rental merchandise | | | (327,222 | ) | | | (244,662 | ) |
Property assets | | | (25,508 | ) | | | — | |
Intangible assets | | | (80,030 | ) | | | (64,250 | ) |
| | | | | | | | |
| | | (432,760 | ) | | | (308,912 | ) |
| | | | | | | | |
Net deferred taxes | | $ | (297,711 | ) | | $ | (218,952 | ) |
| | | | | | | | |
At December 31, 2009,2011, we had approximately $91.6$180.2 million of federal net operating loss (“NOL”) carryforwards available to offset future taxable income which expireexpiring between 20182020 and 20252023 and approximately $388.0$345.8 million of state NOL carryforwards that expireexpiring between 20102012 and 2026. All2030. Approximately one third of our federalthe total remaining carryforward represents acquired NOLs. Utilization of these NOLs and approximately $160.0 million of our state NOLs represent acquired NOLs and their utilization is subject to applicable annual limitations for U.S. state and U.S. federal tax purposes, including Section 382 of the Internal Revenue Code of 1986, as amended. In addition, at December 31, 2011, we had approximately $10.0 million of foreign NOLs and approximately $4.4 million in foreign tax credit (“FTC”) carryforwards expiring between 2020 and 2021. We establish a valuation allowance to the extent we consider it more likely than not that the deferred tax assets attributable to our acquired state NOLs or foreign tax creditsFTCs will not be recovered.
We are subject to federal, state, local and foreign income taxes. Along with our U.S. subsidiaries, we file a U.S. federal consolidated income tax return. WeWith few exceptions, we are no longer subject to U.S. federal, state, foreign and local income tax examinations by tax authorities for years before 2001.2007. The IRS has concluded its examinationAppeals process with the Internal Revenue Service (IRS) Office of our federal income tax returnsAppeals for the years 2001 through 2007. Through the appeals process, we2007 has been completed. We reached agreement on all issues except one issue with respect to the 2003 tax year, an issue which also recursoccurs in each of the 2004 2005, 2006 andthrough 2007 taxable years.years as well. We believe the position and supporting case law applied by the IRS to this matter are incorrectly applied to our situation and that our fact pattern is distinguishable from the IRS’ position. We intend to vigorously defend our position on the issue and, accordingly, we filed in April 2009 a petition for the issue to beissue. This matter was heard inby the United States Tax Court. TheCourt at trial during November 2011, and a decision is currently scheduled to commence in June 2010.expected during the latter part of 2012. Currently, we are also under examination in various states. We do not anticipate that adjustments, if any, regarding the 2003 through 2007 disputed issue or state examinations will result in a material change to our consolidated statement of earnings, financial condition, statement of cash flows or earnings per share.
61
RENT-A-CENTER, INC. AND SUBSIDIARIES
NOTES TO CONSOLIDATED FINANCIAL STATEMENTS — (Continued)
A reconciliation of the beginning and ending amount of unrecognized tax benefits follows:
| | | | | |
| | | (In thousands) | |
| |
| Balance at January 1, 2008 | | $ | 7,631 | |
| Additions based on tax positions related to current year | | | — | |
| Additions for tax positions of prior years | | | 701 | |
| Reductions for tax positions of prior years | | | (817 | ) |
| Settlements | | | (5,458 | ) |
| | | | | |
| Balance at January 1, 2009 | | | 2,057 | |
| Additions based on tax positions related to current year | | | — | |
| Additions for tax positions of prior years | | | 1,744 | |
| Reductions for tax positions of prior years | | | — | |
| Settlements | | | (771 | ) |
| | | | | |
| Balance at December 31, 2009 | | $ | 3,030 | |
| | | | | |
| | | | |
| | | (In thousands) | |
Balance at January 1, 2010 | | $ | 3,030 | |
Additions based on tax positions related to current year | | | 958 | |
Additions for tax positions of prior years | | | 2,928 | �� |
Reductions for tax positions of prior years | | | (241 | ) |
| | | | |
Balance at January 1, 2011 | | | 6,675 | |
Additions based on tax positions related to current year | | | 800 | |
Additions for tax positions of prior years | | | 2,650 | |
Reductions for tax positions of prior years | | | (152 | ) |
Settlements | | | (317 | ) |
| | | | |
Balance at December 31, 2011 | | $ | 9,656 | |
| | | | |
Included in the balance of unrecognized tax benefits at December 31, 20092011 is $2.1$6.9 million, net of federal benefit, which, if ultimately recognized, will reduceaffect our annual effective tax rate.
We classify interest accrued related to unrecognized tax benefits as interest expense and penalties related to unrecognized tax benefits as operating expenses. We recorded interest expense of approximately $120,000 for the year ended December 31, 2009. As of December 31, 2009,2011, we have accrued approximately $500,000$1.3 million for the payment of interest and penalties.
| |
| recorded interest expense of approximately $490,000 for the year then ended, which are excluded from the reconciliation of unrecognized tax benefits presented above. Note J — Commitments and Contingencies Note K —
| Commitments and Contingencies |
Leases
We lease space for substantially all of our service centerCore U.S. and storeInternational stores, certain support facilities and mostthe majority of our delivery vehicles.vehicles under operating leases expiring at various times through 2021. Certain of the store leases contain escalation clauses for increased taxes and operating expenses. Rental expense was $230.3 million, $221.9 million and $219.0 million $215.8 millionfor the years ended December 31, 2011, 2010 and $230.4 million for 2009, 2008 and 2007, respectively. Capital leases include certain transportation equipment. Future minimum rental payments under operating/capitaloperating leases with remaining lease terms in excess of one year at December 31, 20092011 are as follows:
| | | | | | | | | |
Year Ending December 31, | | Operating Leases | | | Capital Leases | |
| | | (In thousands) | | | (In thousands) | |
| |
| 2010 | | $ | 175,056 | | | $ | 1,458 | |
| 2011 | | | 141,264 | | | | 884 | |
| 2012 | | | 107,103 | | | | 303 | |
| 2013 | | | 73,384 | | | | — | |
| 2014 | | | 31,121 | | | | — | |
| Thereafter | | | 7,703 | | | | — | |
| | | | | | | | | |
| | | | 535,631 | | | | 2,645 | |
| Less amount representing interest obligations under capital lease | | | — | | | | (297 | ) |
| | | | | | | | | |
| | | $ | 535,631 | | | $ | 2,348 | |
| | | | | | | | | |
62
| | | | |
Year Ending December 31, | | Operating Leases | |
| | | (In thousands) | |
2012 | | $ | 185,394 | |
2013 | | | 150,744 | |
2014 | | | 117,040 | |
2015 | | | 81,439 | |
2016 | | | 41,020 | |
Thereafter | | | 6,671 | |
| | | | |
| | $ | 582,308 | |
| | | | |
RENT-A-CENTER, INC. AND SUBSIDIARIES
NOTES TO CONSOLIDATED FINANCIAL STATEMENTS — (Continued)
Our investment in equipment under capital leases are as follows:
| | | | | | | | | |
| | | Year Ended December 31, | |
| | | 2009 | | | 2008 | |
| | | (In thousands) | |
| |
| Equipment under capital lease | | $ | 7,714 | | | $ | 25,261 | |
| Less accumulated amortization | | | (5,257 | ) | | | (17,074 | ) |
| | | | | | | | | |
| Equipment under capital lease, net | | $ | 2,457 | | | $ | 8,187 | |
| | | | | | | | | |
| | | | | | | | |
| | | December 31, | |
| | | 2011 | | | 2010 | |
| | | (In thousands) | |
Equipment under capital lease | | $ | 2,773 | | | $ | 4,656 | |
Less accumulated amortization | | | (2,689 | ) | | | (3,803 | ) |
| | | | | | | | |
Equipment under capital lease, net | | $ | 84 | | | $ | 853 | |
| | | | | | | | |
Litigation
From time to time, we, along with our subsidiaries, are party to various legal proceedings arising in the ordinary course of business. We accruereserve for losseslitigation loss contingencies that are both probable and reasonably estimable. Legal fees and expenses associated with the defense of all of our litigation are expensed as such fees and expensedexpenses are incurred.
Our accruals As of December 31, 2011 and 2010, we had no reserve relating to probable losses for our outstanding litigation follow:
| | | | | | | | | |
| | | Year Ended December 31, | |
| | | 2009 | | | 2008 | |
| | | (In millions) | |
| |
California Attorney General Settlement | | $ | — | | | $ | 9.4 | |
Shafer/Johnson Matter | | | — | | | | 1.8 | |
Other Litigation | | | — | | | | 0.1 | |
| | | | | | | | | |
| Total Accrual | | $ | — | | | $ | 11.3 | |
| | | | | | | | | |
In January 2009, we paid $9.4 million in accordance with the settlement with the California Attorney General. During the first quarter of 2009, we paid the remaining $1.8 million in aggregate settlement payments pursuant to the settlement of theEric Shafer, et al. v.Rent-A-Center, Inc.andVictor E. Johnson et al. v.Rent-A-Center, Inc. coordinated matters pending in state court in Los Angeles, California. As of December 31, 2009, we had no accrual relating to probable losses for our outstanding litigation.
We continue to monitor our litigation exposure, and will review the adequacy of our legal reserves on a quarterly basis.
In our history, we have defended class action lawsuits alleging various regulatory violations and have paid material amounts to settle such claims. We cannot assure you that we will not be the subject of similar lawsuits in the future.
ColorTyme Guarantee.Guarantees. Our subsidiary, ColorTyme Finance, Inc., is a party to an agreement with Wells Fargo Foothill, Inc. (“Wells Fargo”)Citibank, N.A., whopursuant to which Citibank provides $35.0up to $25.0 million in aggregate financing to qualifying franchisees of ColorTyme generally up to five times their average monthly revenues.ColorTyme. Under the Wells FargoCitibank agreement, upon an event of default by the franchisee under agreements governing this financing and upon the occurrence of certain other events, Wells FargoCitibank can assign the loans and the collateral securing such loans to ColorTyme Finance, with ColorTyme Finance paying or causing to be paid the outstanding debt to Wells FargoCitibank and then succeeding to the rights of Wells FargoCitibank under the debt agreements, including the right to foreclose on the collateral. The Wells Fargo agreement expires on September 30, 2010.Rent-A-Center and ColorTyme Finance guarantee the obligations of the franchise borrowers under the Citibank facility. An additional $20.0 million of financing is provided by Texas Capital Bank National Association (“Texas Capital Bank”) under an agreement similar to the Wells Fargo financing.Citibank financing, which is guaranteed by Rent-A-Center East, Inc., a subsidiary ofRent-A-Center, guarantees the Rent-A-Center. The maximum guarantee obligations of ColorTyme under each of these agreements, excluding the effects of any amounts that could be recovered under collateralization provisions, up to a maximum amount of $55.0is $45.0 million, of which $19.5$21.9 million was outstanding as of December 31, 2009.
63
Note K — Stock-Based CompensationRENT-A-CENTER, INC. AND SUBSIDIARIES
NOTES TO CONSOLIDATED FINANCIAL STATEMENTS — (Continued)
| |
Note L — | Stock-Based Compensation |
We maintain long-term incentive plans for the benefit of certain employees, consultants and directors. Our plans consist of theRent-A-Center, Inc. Amended and Restated Long-Term Incentive Plan (the “Prior Plan”), theRent-A-Center, Inc. 2006 Long-Term Incentive Plan (the “2006 Plan”), and theRent-A-Center, Inc. 2006 Equity Incentive Plan (the “Equity Incentive Plan”), which are collectively known as the “Plans.”
The 2006 Plan authorizes the issuance of 7,000,000 shares ofRent-A-Center’s common stock that may be issued pursuant to awards granted under the 2006 Plan, of which no more than 3,500,000 shares may be issued in the form of restricted stock, deferred stock or similar forms of stock awards which have value without regard to future appreciation in value of or dividends declared on the underlying shares of common stock. In applying these limitations, the following shares will be deemed not to have been issued: (1) shares covered by the unexercised portion of an option that terminates, expires, or is canceled or settled in cash, and (2) shares that are forfeited or subject to awards that are forfeited, canceled, terminated or settled in cash. At December 31, 20092011 and 2008,2010, there were 1,838,1551,610,262 and 1,589,9231,796,575 shares, respectively, allocated to equity awards outstanding in the 2006 Plan.
RENT-A-CENTER, INC. AND SUBSIDIARIES
NOTES TO CONSOLIDATED FINANCIAL STATEMENTS — (Continued)
We acquired the Equity Incentive Plan (formerly known as the Rent-Way, Inc. 2006 Equity Incentive Plan) in conjunction with our acquisition of Rent-Way in 2006. There were 2,468,461 shares of our common stock reserved for issuance under the Equity Incentive Plan. There were 558,437852,076 and 476,783726,539 shares allocated to equity awards outstanding in the Equity Incentive Plan at December 31, 20092011 and 2008,2010, respectively.
Under the Prior Plan, 14,562,865 shares ofRent-A-Center’s common stock were reserved for issuance under stock options, stock appreciation rights or restricted stock grants. There were no grants of stock appreciation rights and all equity awards were granted with fixed prices. At December 31, 2011 and 2010, there were 427,651 and 1,607,525 shares, respectively, allocated to equity awards outstanding under the Prior Plan. The Prior Plan was terminated on May 19, 2006, upon the approval by our stockholders of the 2006 Plan.
Options granted to our employees under the Prior Plan generally become exercisable over a period of one to four years from the date of grant and may be exercised up to a maximum of ten years from the date of grant. Options granted to directors were immediately exercisable. There were no grants
We grant restricted stock units to certain employees that vest after a three-year service requirement has been met. We recognize expense for these awards using the straight-line method over the requisite service period based on the number of awards expected to vest. We also grant performance-based restricted stock appreciation rightsunits that vest between 0% and all equity150% depending on our achievement of performance metrics that are established at the date of grant for the subsequent three-year period. We record expense for these awards were granted with fixed prices. Atover the requisite service period using an estimate of the number of awards that will vest, based on our performance against the established metrics, and net of the expected forfeiture rate, since the employee must maintain employment to vest in the award.
For the years ended December 31, 2011, 2010 and 2009, we recorded stock based compensation expense of approximately $4.5 million ($2.8 million net of tax), $4.1 million ($2.6 million net of tax) and 2008, there were 2,525,027$3.7 million ($2.3 million net of tax), respectively, related to stock options and 2,747,016 shares, respectively, allocated to equity awards outstanding under the Prior Plan. The Prior Plan was terminated on May 19, 2006, upon the approval by our stockholders of the 2006 Plan.
restricted stock units granted.Information with respect to stock option activity related to the Plans follows. The information for the Plans is combined because the characteristics of the awards are similar.
| | | | | | | | | | | | | | | | | |
| | | | | | Weighted
| | | Weighted
| | | | |
| | | | | | Average
| | | Average
| | | Aggregate
| |
| | | Equity Awards
| | | Exercise
| | | Remaining
| | | Intrinsic
| |
| | | Outstanding | | | Price | | | Contractual Life | | | Value | |
| | | | | | | | | | | | (In thousands) | |
| |
| Balance outstanding at January 1, 2009 | | | 4,813,722 | | | $ | 20.73 | | | | 6.01 years | | | $ | 9,204 | |
| Granted | | | 678,370 | | | | 17.31 | | | | | | | | | |
| Exercised | | | (141,364 | ) | | | 12.00 | | | | | | | $ | 1,039 | |
| Forfeited | | | (429,109 | ) | | | 23.54 | | | | | | | | | |
| | | | | | | | | | | | | | | | | |
| Balance outstanding at December 31, 2009 | | | 4,921,619 | | | $ | 20.43 | | | | 5.44 years | | | $ | 8,584 | |
| | | | | | | | | | | | | | | | | |
| Exercisable at December 31, 2009 | | | 3,504,412 | | | $ | 20.52 | | | | 4.28 years | | | $ | 7,635 | |
| | | | | | | | | | | | | | | | |
| | | Equity Awards
Outstanding | | | Weighted
Average
Exercise
Price | | | Weighted
Average
Remaining
Contractual
Life | | | Aggregate
Intrinsic
Value | |
| | | | | | | | | | | | (In thousands) | |
Balance outstanding at January 1, 2011 . | | | 3,707,142 | | | $ | 20.78 | | | | | | | | | |
Granted | | | 770,245 | | | | 30.60 | | | | | | | | | |
Exercised | | | (1,754,697 | ) | | | 19.35 | | | | | | | | | |
Forfeited | | | (291,510 | ) | | | 22.72 | | | | | | | | | |
| | | | | | | | | | | | | | | | |
Balance outstanding at December 31, 2011 | | | 2,431,180 | | | $ | 24.72 | | | | 6.71 years | | | $ | 29,898 | |
| | | | | | | | | | | | | | | | |
Exercisable at December 31, 2011 | | | 1,127,188 | | | $ | 24.01 | | | | 4.53 years | | | $ | 14,685 | |
The intrinsic value of options exercised during the years ended December 31, 20082011, 2010 and 20072009 was $1.7$24.1 million, $9.1 million and $2.5$1.0 million, respectively.
respectively, resulting in tax benefits of $7.0 million, $3.0 million and $270,000, respectively, which are reflected as an outflow from operating activities and an inflow from financing activities in the Consolidated Statements of Cash Flows.RENT-A-CENTER, INC. AND SUBSIDIARIES
NOTES TO CONSOLIDATED FINANCIAL STATEMENTS — (Continued)
The fair value of unvested options that we expect to result in compensation expense was approximately $4.6$7.3 million with a weighted average number of years to vesting of 2.311.65 years at December 31, 2009. The total number of unvested options was 1,417,207 and 1,561,188, with intrinsic values of $946,000 and $1.1 million at December 31, 2009 and 2008, respectively. There were 194,128 and 58,860 restricted stock units outstanding as of December 31, 2009 and 2008, respectively.
64
RENT-A-CENTER, INC. AND SUBSIDIARIES
NOTES TO CONSOLIDATED FINANCIAL STATEMENTS — (Continued)
The weighted average fair value of unvested options at December 31, 2009 and 2008 was $3.21 and $3.55, respectively. The weighted average fair value of options forfeited duringDuring the year ended December 31, 2009 was $6.64.
The total number2011, the weighted average fair values of
the options
vested duringgranted under the Plans were calculated using the binomial method with the following assumptions: | | |
Employee options: | | |
Risk free interest rate (0.12% to 1.78%) | | Weighted average 0.71% |
Expected dividend yield (0.70% to 2.30%) | | Weighted average 1.31% |
Expected life | | 6.05 years |
Expected volatility (33.42% to 50.12%) . | | Weighted average 42.48% |
Forfeiture rate (7.55% to 13.41%) | | Weighted average 9.48% |
Employee stock options granted | | 770,245 |
Weighted average grant date fair value | | $7.50 |
During the year ended December 31, 2009 was 604,661, with a2010, the weighted average fair valuevalues of $4.96. The total fair value ofthe options vested duringgranted under the years ended December 31, 2009, 2008 and 2007, was $3.0 million, $4.3 million and $5.9 million, respectively.
Plans were calculated using the binomial method with the following assumptions: | | |
Employee options: | | |
Risk free interest rate (0.26% to 2.16%) | | Weighted average 1.01% |
Expected dividend yield | | 0.80% |
Expected life | | 5.48 years |
Expected volatility (34.95% to 56.30%) | | Weighted average 47.87% |
Forfeiture rate (5.00% to 15.43%) | | Weighted average 10.18% |
Employee stock options granted | | 796,345 |
Weighted average grant date fair value | | $6.00 |
During the twelve monthsyear ended December 31, 2009, the weighted average fair values of the options granted under the Plans were calculated using the binomial method with the following assumptions:
| | |
Employee options: | | |
Employee options: | | |
|
Risk free interest rate (0.37% to 2.04%) | | Weighted average 1.10% |
Expected dividend yield | | — |
Expected life | | 5.34 years |
Expected volatility (45.30% to 66.50%) | | .WeightedWeighted average 55.08% |
Forfeiture rate (3.64% to 24.80%) | | Weighted average 11.23% |
Employee stock options granted | | 678,370 |
Weighted average grant date fair value | | $5.72 |
During the twelve months ended December 31, 2008, the weighted average fair values of the options granted under the Plans were calculated using the binomial methodInformation with the following assumptions:
| | |
Employee options: | | |
|
Risk free interest rate (1.62% to 3.17%) | | Weighted average 2.43% |
Expected dividend yield | | — |
Expected life | | 4.20 years |
Expected volatility (33.85% to 53.58%) | | Weighted average 42.08% |
Forfeiture rate (4.20% to 19.60%) | | Weighted average 10.08% |
Employee stock options granted | | 732,995 |
Weighted average grant date fair value | | $4.66 |
Non-employee director options:
| | |
Risk free interest rate | | 3.54% |
Expected dividend yield | | — |
Expected life | | 6.90 years |
Expected volatility | | 41.26% |
Forfeiture rate | | 0.00% |
Non-employee director stock options granted | | 24,000 |
Weighted average grant date fair value | | $7.02 |
65
| | | | | | | | |
| | | Restricted Awards
Outstanding | | | Weighted Average
Grant Date Fair Value | |
Balance outstanding at January 1, 2011 | | | 423,497 | | | $ | 17.52 | |
Granted | | | 128,126 | | | | 30.08 | |
Vested | | | (40,578 | ) | | | 16.89 | |
Forfeited | | | (52,236 | ) | | | 17.42 | |
| | | | | | | | |
Balance outstanding at December 31, 2011 | | | 458,809 | | | $ | 21.09 | |
| | | | | | | | |
RENT-A-CENTER, INC. AND SUBSIDIARIES
NOTES TO CONSOLIDATED FINANCIAL STATEMENTS — (Continued)
DuringRestricted stock units are valued using the twelve months endedlast trade before the day of the grant. Unrecognized compensation expense for unvested restricted stock units at December 31, 2007, the2011, was approximately $2.4 million, expected to be recognized over a weighted average fair valuesperiod of the options granted under the Plans were calculated using the binomial method with the following assumptions:
| | |
Employee options: | | |
|
Risk free interest rate (4.66% to 4.80%) | | Weighted average 4.73% |
Expected dividend yield | | — |
Expected life | | 4.20 years |
Expected volatility (30.36% to 37.90%) | | Weighted average 32.79% |
Forfeiture rate (3.50% to 25.10%) | | Weighted average 12.05% |
Employee stock options granted | | 1,581,040 |
Weighted average grant date fair value | | $5.17 |
Non-employee director options:
| | |
Risk free interest rate | | 4.66% |
Expected dividend yield | | — |
Expected life | | 7.44 years |
Expected volatility | | 47.32% |
Forfeiture rate | | 0.00% |
Non-employee director stock options granted | | 34,000 |
Weighted average grant date fair value | | $16.79 |
Tax benefits from stock option exercises of $270,000, $560,000 and $943,000, respectively, for the twelve months ended December 31, 2009, 2008 and 2007 were reflected as an outflow from operating activities and an inflow from financing activities in the Consolidated Statement of Cash Flows.
| |
Note M — | Deferred Compensation Plan |
1.02 years.Note L — Deferred Compensation Plan
TheRent-A-Center, Inc. Deferred Compensation Plan (the “Deferred Compensation Plan”) is an unfunded, nonqualified deferred compensation plan for a select group of our key management personnel and highly compensated employees. The Deferred Compensation Plan first became available to eligible employees in July 2007, with deferral elections taking effect as of August 3, 2007.
The Deferred Compensation Plan allows participants to defer up to 50% of their base compensation and up to 100% of any bonus compensation. Participants may invest the amounts deferred in measurement funds that are the same funds offered as the investment options in theRent-A-Center, Inc. 401(k) Retirement Savings Plan. We may make discretionary contributions to the Deferred Compensation Plan, which are subject to a five-year graded vesting schedule based on the participant’s years of service with us. We are obligated to pay the deferred compensation amounts in the future in accordance with the terms of the Deferred Compensation Plan. Assets and associated liabilities of the Deferred Compensation Plan are included in prepaid and other assets and accrued liabilities in our consolidated balance sheets. The deferred compensation plan liability was approximately $1.3$2.9 million and $564,000$2.0 million as of December 31, 20092011 and 2008,2010, respectively.
| |
Note N — | Employee Benefit Plan |
No discretionary contributions were made for the years ended December 31, 2011, 2010 and 2009.Note M — Employee Benefit Plan
We sponsor a defined contribution pension plan under Section 401(k) of the Internal Revenue Code for all employees who have completed at least three months of service. Employees may elect to contribute up to 50% of their eligible compensation on a pre-tax basis, subject to limitations. We may make discretionary matching contributions to the 401(k) plan. DuringFor the years ended December 31, 2011, 2010 and 2009, 2008 and 2007, we made matching cash contributions of $5.6$5.9 million, $5.3$5.8 million and $5.3$5.6 million, respectively, which represents 50% of the employees’ contributions to the 401(k) plan up to an amount not to exceed 4% of each employee’s respective compensation. Employees are permitted to
66
RENT-A-CENTER, INC. AND SUBSIDIARIES
NOTES TO CONSOLIDATED FINANCIAL STATEMENTS — (Continued)
elect to purchase our common stock as part of their 401(k) plan. As of December 31, 2011, 2010 and 2009, 2008 and 2007, 9.0%12.0%, 12.0%, and 7.0%9.0%, respectively, of the total plan assets consisted of our common stock.
| |
Note O — | Fair Value of Financial Instruments |
Note N — Fair Value
We use a three-tier fair value hierarchy, which classifies the inputs used in measuring fair values, in determining the fair value of our non-financial assets and non-financial liabilities, which consist primarily of goodwill. These tiers include: Level 1, defined as observable inputs such as quoted prices for identical instruments in active markets; Level 2, defined as inputs other than quoted prices in active markets that are either directly or indirectly observable; and Level 3, defined as unobservable inputs in which little or no market data exists, therefore requiring an entity to develop its own assumptions. There were no changes in the methods and assumptions used in measuring fair value during the period.
At December 31, 2009,2011, our financial instruments include cash and cash equivalents, receivables, payables, and senior debt and at December 31, 2008, also included subordinated notes payable.senior notes. The carrying amount of cash and cash equivalents, receivables and payables approximates fair value at December 31, 20092011 and 2008,2010, because of the short maturities of these instruments. Our senior debt is variable rate debt that re-prices frequently and entails no significant change in credit risk and, as a result, fair value approximates carrying value. The fair value of the subordinatedour senior notes payable was estimatedis based on discounted cash flow analysis using interest rates offered for loans with similar terms to borrowers of similar credit quality using unobservable inputs based on management’s own assumptions. Level 1 inputs.
RENT-A-CENTER, INC. AND SUBSIDIARIES
NOTES TO CONSOLIDATED FINANCIAL STATEMENTS — (Continued)
At December 31, 2008,2011, the fair value of the subordinatedour senior notes was $206.2$302.3 million, which was $19.2approximately $2.3 million above their carrying value of $300.0 million. At December 31, 2010, the fair value of our senior notes was $299.8 million, which was approximately $200,000 below their carrying value of $225.4$300.0 million.
| |
Note P — | Stock Repurchase Plan |
Note O — Impairment Charge
Our impairment charge consists of the following (in thousands):
| | | | | | | | |
| | | Year Ended December 31, | |
| | | 2011 | | | 2010 | |
Loan write-down | | $ | 2,569 | | | $ | 2,059 | |
Fixed asset disposal | | | 1,172 | | | | 11,753 | |
Other | | | 3,579 | | | | 5,127 | |
| | | | | | | | |
Total | | $ | 7,320 | | | $ | 18,939 | |
| | | | | | | | |
During the fourth quarter of 2010, we recorded a pre-tax impairment charge of $18.9 million, which primarily related to fixed asset disposals, goodwill impairment, loan write-downs, and other miscellaneous items as a result of the discontinuation of our financial services business. During the first quarter of 2011, we recorded a pre-tax impairment charge of approximately $7.3 million related to additional loan write-downs, fixed asset disposals (store reconstruction), and other miscellaneous items. The impairment charges were based on the amount that the carrying value exceeded the estimated fair value of the assets. The fair value was based on our historical experience with store acquisitions and divestitures, which are Level 3 inputs.
Note P — Restructuring Charges
During the fourth quarter of 2011, we recorded a pre-tax restructuring charge of $1.4 million in connection with the November 2011 acquisition of 58 rent-to-own stores, primarily related to post-acquisition lease terminations. As of December 31, 2011, we expect to use approximately $1.1 million of cash on hand for future payments, which primarily relate to lease obligations. We expect the lease obligations will be substantially completed in 18 to 24 months, with total completion no later than the second quarter of 2017.
During the third quarter of 2011, we recorded a pre-tax restructuring charge of $7.6 million related to the closure of eight Home Choice stores in Illinois and 24 RAC Limited locations within third party grocery stores, all of which had been operated on a test basis, as well as the closure of 26 core rent-to-own stores following the sale of all customer accounts at those locations. The charge with respect to these closings related primarily to lease terminations, fixed asset disposals, and other miscellaneous items. As of December 31, 2011, we expect to use approximately $3.8 million of cash on hand for future payments, which primarily relate to lease obligations. We expect the lease obligations will be substantially completed in 18 to 24 months, with total completion no later than the second quarter of 2016.
During the second quarter of 2011, we recorded a pre-tax restructuring charge of approximately $4.9 million in connection with the December 2010 acquisition of The Rental Store, Inc. This charge related to post-acquisition lease terminations. As of December 31, 2011, we expect to use approximately $2.1 million of cash on hand for future payments. We expect the lease obligations will be substantially completed in 18 to 24 months, with total completion no later than the fourth quarter of 2017.
Note Q — Stock Repurchase Plan
Under our current common stock repurchase program, our Board of Directors has authorized a common stock repurchase program, permitting us tothe purchase, from time to time, in the open market and privately negotiated transactions, up to an aggregate of $500.0$800.0 million
RENT-A-CENTER, INC. AND SUBSIDIARIES
NOTES TO CONSOLIDATED FINANCIAL STATEMENTS — (Continued)
ofRent-A-Center common stock. We had purchasedhave repurchased a total of 19,884,85029,322,753 shares and 19,412,75023,470,345 shares ofRent-A-Center common stock for an aggregate purchase price of $466.6$715.5 million and $457.8$551.2 million as of December 31, 20092011 and 2008,2010, respectively, under this common stock repurchase program. We repurchased 472,100 shares for $8.8 million in the fourth quarter of 2009, which represented the total shares repurchased duringDuring the year ended December 31, 2009. A2011, we repurchased a total of 951,8005,852,408 shares were repurchased for $13.4approximately $164.3 million duringin cash.
Note R — Segment Information
Through September 30, 2011, we reported the results of our operations under one segment as only one of our operating segments met the quantitative thresholds of a reportable segment under Topic 280,Segment Reporting. Because of the aggressive growth strategies in our RAC Acceptance and international operations, our chief operating decision makers now analyze the results of these operations on an individual basis, and we believe that future period operating results in those segments may meet the quantitative thresholds for a reportable segment as early as 2012. Therefore, segment information for the year ended December 31, 2008.
The operating segments reported below are the segments for which separate financial information is available and for which segment results are evaluated by the chief operating decision makers. Our operating segments are organized based on factors including, but not limited to, type of business transactions, geographic location and store ownership. All operating segments offer merchandise from four basic product categories including consumer electronics, appliances, computers, furniture and accessories. Reportable segments and their respective operations are defined as follows.
Our Core U.S. segment primarily operates rent-to-own stores in the United States and Puerto Rico whose customers enter into weekly, semi-monthly or monthly rental purchase agreements, which renew automatically upon receipt of each payment. We retain the title to the merchandise during the term of the rental purchase agreement and ownership passes to the customer if the customer has continuously renewed the rental purchase agreement through the end of the term or exercises a specified early purchase option. This segment also includes the 39 stores operating in two states that utilize a retail model which generates installment credit sales through a retail sale transaction. Segment assets include cash, receivables, rental merchandise, property assets, goodwill and other intangible assets. Reported amounts also include our financial services business, which ceased operations in December 2010, and our prepaid telecommunications and energy business, which was divested in November 2009. Impairment charges related to the discontinuation of our financial services business and restructuring charges (with the exception of the $4.9 million restructuring charge associated with the December 2010 acquisition of The Rental Store, Inc.) are recorded in the Core U.S. segment.
Our RAC Acceptance segment operates kiosks within various traditional retailers’ locations where we generally offer the rent-to-own transaction to consumers who do not qualify for financing from the traditional retailer. The transaction offered is generally similar to that of the Core U.S. segment; however, the majority of the customers in this segment enter into monthly rather than weekly agreements. Segment assets include cash, rental merchandise, property assets, goodwill and other intangible assets. The $4.9 million restructuring charge associated with the December 2010 acquisition of The Rental Store, Inc. was recorded in this segment in 2011.
Our International segment consists of our company-owned store locations in Canada and Mexico, which is expanding its rent-to-own operations. The nature of this segment’s operations and assets are the same as our Core U.S. segment.
ColorTyme is a national franchisor of rent-to-own stores that use ColorTyme’s trade names, service marks, trademarks and logos, and operate under distinctive operating procedures and standards. ColorTyme’s primary
RENT-A-CENTER, INC. AND SUBSIDIARIES
NOTES TO CONSOLIDATED FINANCIAL STATEMENTS — (Continued)
source of revenue is the sale of rental merchandise to its franchisees who, in turn, offer the merchandise to the general public for rent or purchase under a rent-to-own program. As franchisor, ColorTyme receives royalties of 2.0% to 4.0% of the franchisees’ monthly gross revenue and initial fees for new locations. Segment assets include cash, franchise fee receivables, property assets and intangible assets.
We incur costs at our corporate headquarters that benefit our Core U.S., RAC Acceptance and International operating segments. Accordingly, we allocate such costs among these segments based on segment revenue to determine segment operating profit. Likewise, certain corporate assets used to support these operating segments, including the land and building in which the corporate headquarters are located and related property assets, cash and prepaid expenses are allocated to these operating segments also based on segment revenue. Because our ColorTyme segment maintains a separate, independent corporate office, no additional corporate costs or assets are allocated to that segment.
Segment information as of and for the years ended December 31, 2011, 2010 and 2009 is as follows (in thousands, except location count):
| | | | | | | | | | | | | | | | | | | | |
| | | Year Ended December 31, 2011 | |
| | | Core U.S. | | | RAC Acceptance | | | International | | | ColorTyme | | | Total | |
| | | | | | | | | | | | | | | | | | | | |
Revenue | | $ | 2,631,416 | | | $ | 193,295 | | | $ | 18,490 | | | $ | 38,983 | | | $ | 2,882,184 | |
Gross profit | | | 1,918,781 | | | | 114,228 | | | | 13,011 | | | | 6,496 | | | | 2,052,516 | |
Operating profit | | | 317,473 | | | | (13,985 | ) | | | (13,551 | ) | | | 3,220 | | | | 293,157 | |
Depreciation | | | 60,558 | | | | 2,229 | | | | 2,295 | | | | 132 | | | | 65,214 | |
Amortization | | | 1,092 | | | | 3,583 | | | | — | | | | — | | | | 4,675 | |
Capital expenditures | | | 108,553 | | | | 5,881 | | | | 18,276 | | | | — | | | | 132,710 | |
Rental merchandise, net | | | | | | | | | | | | | | | | | | | | |
On rent | | | 619,189 | | | | 139,340 | | | | 7,896 | | | | — | | | | 766,425 | |
Held for rent | | | 177,625 | | | | 1,274 | | | | 7,869 | | | | — | | | | 186,768 | |
Total assets | | | 2,536,115 | | | | 217,157 | | | | 44,535 | | | | 3,571 | | | | 2,801,378 | |
| | | | | | | | | | | | | | | | | | | | |
| | | | | | | | | | | | | | | | | | | | |
| | | Year Ended December 31, 2010 | |
| | | Core U.S. | | | RAC Acceptance | | | International | | | ColorTyme | | | Total | |
| | | | | | | | | | | | | | | | | | | | |
Revenue | | $ | 2,667,943 | (1) | | $ | 18,203 | | | $ | 10,054 | | | $ | 35,432 | | | $ | 2,731,632 | |
Gross profit | | | 1,970,280 | (1) | | | 12,074 | | | | 7,128 | | | | 6,190 | | | | 1,995,672 | |
Operating profit | | | 311,501 | (1) | | | (5,372 | ) | | | (5,226 | ) | | | 2,866 | | | | 303,769 | |
Depreciation | | | 61,879 | | | | 395 | | | | 989 | | | | 147 | | | | 63,410 | |
Amortization | | | 3,254 | | | | — | | | | — | | | | — | | | | 3,254 | |
Capital expenditures | | | 90,866 | | | | 1,450 | | | | 691 | | | | — | | | | 93,007 | |
Rental merchandise, net | | | | | | | | | | | | | | | | | | | | |
On rent | | | 606,121 | | | | 44,293 | | | | 4,834 | | | | — | | | | 655,248 | |
Held for rent | | | 177,621 | | | | 2,809 | | | | 1,176 | | | | — | | | | 181,606 | |
Total assets | | | 2,554,980 | | | | 114,382 | | | | 15,179 | | | | 3,790 | | | | 2,688,331 | |
RENT-A-CENTER, INC. AND SUBSIDIARIES
NOTES TO CONSOLIDATED FINANCIAL STATEMENTS — (Continued)
| | | | | | | | | | | | | | | | | | | | |
| |
| | | Year Ended December 31, 2009 | |
| | | Core U.S. | | | RAC Acceptance | | | International | | | ColorTyme | | | Total | |
| | | | | | | | | | | | | | | | | | | | |
Revenue | | $ | 2,709,786 | (2) | | $ | 3,213 | | | $ | 6,117 | | | $ | 32,840 | | | $ | 2,751,956 | |
Gross profit | | | 1,974,930 | (2) | | | 2,615 | | | | 4,433 | | | | 6,020 | | | | 1,987,998 | |
Operating profit | | | 299,053 | (2) | | | (1,902 | ) | | | (3,365 | ) | | | 2,538 | | | | 296,324 | |
Depreciation | | | 65,105 | | | | 66 | | | | 512 | | | | 105 | | | | 65,788 | |
Amortization | | | 2,843 | | | | — | | | | — | | | | — | | | | 2,843 | |
Capital expenditures | | | 65,757 | | | | 239 | | | | 2,845 | | | | — | | | | 68,841 | |
Rental merchandise, net | | | | | | | | | | | | | | | | | | | | |
On rent | | | 585,233 | | | | 1,399 | | | | 2,434 | | | | — | | | | 589,066 | |
Held for rent | | | 159,286 | | | | 125 | | | | 1,521 | | | | — | | | | 160,932 | |
Total assets | | | 2,428,944 | | | | 1,984 | | | | 10,209 | | | | 2,860 | | | | 2,443,997 | |
| |
| | | Location Count at December 31, | |
| | | Core U.S. | | | RAC Acceptance | | | International | | | ColorTyme | | | Total | |
2011 | | | 2,994 | | | | 750 | | | | 80 | | | | 216 | | | | 4,040 | |
2010 | | | 2,985 | | | | 384 | | | | 23 | | | | 209 | | | | 3,601 | |
2009 | | | 2,989 | | | | 82 | | | | 18 | | | | 210 | | | | 3,299 | |
| (1) | |
Note Q — | Earnings Per Common ShareIncludes revenue, gross profit and operating profit of $56.2 million, $56.2 million and $(12.8) million, respectively, related to our financial services business. |
| (2) | Includes revenue, gross profit and operating profit of $51.5 million, $51.5 million and $5.2 million, respectively, related to our financial services business and $50.5 million, $17.3 million and $0.5 million, respectively, related to our prepaid telecommunications and energy business. |
Note S — Earnings Per Common Share
Summarized basic and diluted earnings per common share were calculated as follows:
| | | | | | | | | | | | | |
| | | | | | Weighted Average
| | | | |
| | | Net Earnings | | | Shares | | | Per Share | |
| | | (In thousands, except per share data) | |
| |
Year ended December 31, 2009 | | | | | | | | | | | | |
| Basic earnings per common share | | $ | 167,855 | | | | 65,986 | | | $ | 2.54 | |
| Effect of dilutive stock options | | | — | | | | 581 | | | | | |
| | | | | | | | | | | | | |
| Diluted earnings per common share | | $ | 167,855 | | | | 66,567 | | | $ | 2.52 | |
| | | | | | | | | | | | | |
Year ended December 31, 2008 | | | | | | | | | | | | |
| Basic earnings per common share | | $ | 139,624 | | | | 66,606 | | | $ | 2.10 | |
| Effect of dilutive stock options | | | — | | | | 585 | | | | | |
| | | | | | | | | | | | | |
| Diluted earnings per common share | | $ | 139,624 | | | | 67,191 | | | $ | 2.08 | |
| | | | | | | | | | | | | |
Year ended December 31, 2007 | | | | | | | | | | | | |
| Basic earnings per common share | | $ | 76,268 | | | | 68,706 | | | $ | 1.11 | |
| Effect of dilutive stock options | | | — | | | | 769 | | | | | |
| | | | | | | | | | | | | |
| Diluted earnings per common share | | $ | 76,268 | | | | 69,475 | | | $ | 1.10 | |
| | | | | | | | | | | | | |
| | | | | | | | | | | | |
| | | Net Earnings | | | Weighted Average
Shares | | | Per Share | |
| | | (In thousands, except per share data) | |
Year Ended December 31, 2011 | | | | | | | | | | | | |
Basic earnings per common share | | $ | 164,637 | | | | 61,188 | | | $ | 2.69 | |
Effect of dilutive stock options | | | — | | | | 701 | | | | | |
| | | | | | | | | | | | |
Diluted earnings per common share | | $ | 164,637 | | | | 61,889 | | | $ | 2.66 | |
| | | | | | | | | | | | |
Year Ended December 31, 2010 | | | | | | | | | | | | |
Basic earnings per common share | | $ | 171,642 | | | | 65,104 | | | $ | 2.64 | |
Effect of dilutive stock options | | | — | | | | 799 | | | | | |
| | | | | | | | | | | | |
Diluted earnings per common share | | $ | 171,642 | | | | 65,903 | | | $ | 2.60 | |
| | | | | | | | | | | | |
Year Ended December 31, 2009 | | | | | | | | | | | | |
Basic earnings per common share | | $ | 167,855 | | | | 65,986 | | | $ | 2.54 | |
Effect of dilutive stock options | | | — | | | | 581 | | | | | |
| | | | | | | | | | | | |
Diluted earnings per common share | | $ | 167,855 | | | | 66,567 | | | $ | 2.52 | |
| | | | | | | | | | | | |
RENT-A-CENTER, INC. AND SUBSIDIARIES
NOTES TO CONSOLIDATED FINANCIAL STATEMENTS — (Continued)
For 2009, 2008,2011, 2010, and 2007,2009, the number of stock options that were outstanding but not included in the computation of diluted earnings per common share because their exercise price was greater than the average market price of the common stock and, therefore anti-dilutive, waswere 744,640, 1,839,225, and 2,964,778, 3,100,825, and 2,813,529, respectively.
67
Note T — Unaudited Quarterly DataRENT-A-CENTER, INC. AND SUBSIDIARIES
NOTES TO CONSOLIDATED FINANCIAL STATEMENTS — (Continued)
| |
Note R — | Unaudited Quarterly Data |
Summarized quarterly financial data for 2009, 20082011, 2010 and 20072009 is as follows:
| | | | | | | | | | | | | | | | | |
| | | 1st Quarter | | 2nd Quarter | | 3rd Quarter | | 4th Quarter |
| | | (In thousands, except per share data) |
| |
Year ended December 31, 2009 | | | | | | | | | | | | | | | | |
| Revenues | | $ | 728,183 | | | $ | 679,609 | | | $ | 671,251 | | | $ | 672,913 | |
| Gross profit | | | 515,212 | | | | 494,422 | | | | 487,239 | | | | 491,125 | |
| Operating profit | | | 82,092 | | | | 75,283 | | | | 64,367 | | | | 74,582 | |
| Net earnings | | | 45,376 | | | | 41,945 | | | | 36,840 | | | | 43,694 | |
| Basic earnings per common share | | $ | 0.69 | | | $ | 0.64 | | | $ | 0.56 | | | $ | 0.66 | |
| Diluted earnings per common share | | $ | 0.68 | | | $ | 0.63 | | | $ | 0.55 | | | $ | 0.66 | |
Year ended December 31, 2008 | | | | | | | | | | | | | | | | |
| Revenues | | $ | 756,636 | | | $ | 719,031 | | | $ | 708,755 | | | $ | 699,750 | |
| Gross profit | | | 533,733 | | | | 517,329 | | | | 510,022 | | | | 507,268 | |
| Operating profit | | | 77,540 | | | | 74,434 | | | | 58,549 | | | | 63,865 | |
| Net earnings | | | 36,358 | | | | 37,741 | | | | 29,379 | | | | 36,146 | |
| Basic earnings per common share | | $ | 0.55 | | | $ | 0.57 | | | $ | 0.44 | | | $ | 0.54 | |
| Diluted earnings per common share | | $ | 0.54 | | | $ | 0.56 | | | $ | 0.44 | | | $ | 0.54 | |
Year ended December 31, 2007 | | | | | | | | | | | | | | | | |
| Revenues | | $ | 755,299 | | | $ | 724,158 | | | $ | 709,701 | | | $ | 716,963 | |
| Gross profit | | | 553,168 | | | | 538,491 | | | | 518,523 | | | | 519,420 | |
| Operating profit | | | 46,155 | | | | 87,024 | | | | 60,575 | | | | 10,483 | |
| Net earnings(loss) | | | 15,103 | | | | 41,251 | | | | 25,275 | | | | (5,361 | ) |
| Basic earnings(loss) per common share | | $ | 0.21 | | | $ | 0.59 | | | $ | 0.37 | | | $ | (0.08 | ) |
| Diluted earnings(loss) per common share | | $ | 0.21 | | | $ | 0.58 | | | $ | 0.37 | | | $ | (0.08 | ) |
| | | | | | | | | | | | | | | | |
| | | 1st Quarter | | | 2nd Quarter | | | 3rd Quarter | | | 4th Quarter | |
| | | (In thousands, except per share data) | |
Year Ended December 31, 2011 | | | | | | | | | | | | | | | | |
Revenues | | $ | 742,178 | | | $ | 698,253 | | | $ | 704,271 | | | $ | 737,482 | |
Gross profit | | | 523,148 | | | | 506,355 | | | | 505,724 | | | | 517,289 | |
Operating profit | | | 80,419 | | | | 73,152 | | | | 57,796 | | | | 81,790 | |
Net earnings | | | 44,230 | | | | 39,888 | | | | 31,224 | | | | 49,295 | |
Basic earnings per common share | | $ | 0.70 | | | $ | 0.64 | | | $ | 0.52 | | | $ | 0.84 | |
Diluted earnings per common share | | $ | 0.69 | | | $ | 0.63 | | | $ | 0.52 | | | $ | 0.83 | |
Cash dividends paid per common share | | $ | 0.06 | | | $ | 0.06 | | | $ | 0.16 | | | $ | 0.16 | |
| | | | |
Year Ended December 31, 2010 | | | | | | | | | | | | | | | | |
Revenues | | $ | 718,419 | | | $ | 671,543 | | | $ | 664,580 | | | $ | 677,090 | |
Gross profit | | | 513,000 | | | | 497,665 | | | | 490,013 | | | | 494,994 | |
Operating profit | | | 88,703 | | | | 82,831 | | | | 69,393 | | | | 62,842 | |
Net earnings | | | 51,461 | | | | 47,830 | | | | 40,497 | | | | 31,854 | |
Basic earnings per common share | | $ | 0.78 | | | $ | 0.73 | | | $ | 0.62 | | | $ | 0.50 | |
Diluted earnings per common share | | $ | 0.77 | | | $ | 0.72 | | | $ | 0.62 | | | $ | 0.49 | |
Cash dividends paid per common share | | $ | — | | | $ | — | | | $ | 0.06 | | | $ | 0.06 | |
| | | | |
Year Ended December 31, 2009 | | | | | | | | | | | | | | | | |
Revenues | | $ | 728,183 | | | $ | 679,609 | | | $ | 671,251 | | | $ | 672,913 | |
Gross profit | | | 515,212 | | | | 494,422 | | | | 487,239 | | | | 491,125 | |
Operating profit | | | 82,092 | | | | 75,283 | | | | 64,367 | | | | 74,582 | |
Net earnings | | | 45,376 | | | | 41,945 | | | | 36,840 | | | | 43,694 | |
Basic earnings per common share | | $ | 0.69 | | | $ | 0.64 | | | $ | 0.56 | | | $ | 0.66 | |
Diluted earnings per common share | | $ | 0.68 | | | $ | 0.63 | | | $ | 0.55 | | | $ | 0.66 | |
| |
Note S — | Subsequent Events |
We have evaluated events occurring subsequent to the date of our financial statements. We have recognized the effects of all subsequent events that provide additional evidence about conditions that existed at our balance sheet date of December 31, 2009, including estimates inherent in the process of preparing our financial statements.
68
| |
| Item 9. | Changes in and Disagreements with Accountants on Accounting and Financial Disclosure. |
| |
| Item 9A. | Controls and Procedures. |
Disclosure Controls and Procedures
An evaluation was performed under the supervision and with the participation of our management, including our Chief Executive Officer and Chief Financial Officer, of the effectiveness of the design and operation of our disclosure controls and procedures (as defined in Rules 13a — 15(e) and 15d — 15(e) under the Securities Exchange Act of 1934) as of the end of the period covered by this annual report. Based on this evaluation, our management, including our Chief Executive Officer and our Chief Financial Officer, concluded that, as of December 31, 2009,2011, our disclosure controls and procedures were effective as defined in Rules 13a — 15(e) and 15d — 15(e) under the Securities Exchange Act of 1934.
Management’s Annual Report on Internal Control over Financial Reporting
Please refer to Management’s Annual Report on Internal Control over Financial Reporting on page 4342 of this report.
Changes in Internal Control over Financial Reporting
For the quarter ended December 31, 2009,2011, there have been no changes in our internal control over financial reporting (as defined inRule 13a-15(f) under the Securities Exchange Act of 1934) that have materially affected, or are reasonably likely to materially affect, our internal control over financial reporting.
| |
| Item 9B. | Other Information. |
| |
| Item 10. | Directors, Executive Officers and Corporate Governance.(*) |
| |
| Item 11. | Executive Compensation.(*) |
| |
| Item 12. | Security Ownership of Certain Beneficial Owners and Management and Related Stockholder Matters.(*) |
| |
| Item 13. | Certain Relationships and Related Transactions, and Director Independence.(*) |
| |
| Item 14. | Principal Accountant Fees and Services.(*) |
| | |
| * | | The information required by Items 10, 11, 12, 13 and 14 is or will be set forth in the definitive proxy statement relating to the 20102012 Annual Meeting of Stockholders ofRent-A-Center, Inc., which is to be filed with the SEC pursuant to Regulation 14A under the Securities Exchange Act of 1934, as amended. This definitive proxy statement relates to a meeting of stockholders involving the election of directors and the portions therefrom required to be set forth in thisForm 10-K by Items 10, 11, 12, 13 and 14 are incorporated herein by reference pursuant to General Instruction G(3) toForm 10-K. |
69
PART IV
| |
| Item 15. | Exhibits and Financial Statement Schedules. |
Financial Statement Schedules
The financial statements included in this report are listed in the Index to Financial Statements on page 4039 of this report. Schedules for which provision is made in the applicable accounting regulations of the SEC are either not required under the related instructions or inapplicable.
The exhibits required to be furnished pursuant to Item 15 are listed in the Exhibit Index filed herewith, which Exhibit Index is incorporated herein by reference.
70
SIGNATURES
Pursuant to the requirements of Section 13 or 15(d) of the Securities Exchange Act of 1934, the registrant has duly caused this report to be signed on its behalf by the undersigned duly authorized.
RENT-A-CENTER, INC.
| | |
| RENT-A-CENTER, INC. |
| By: | /s/ Robert D. Davis
|
Robert D. Davis
Executive Vice President — Finance,
Treasurer and Chief Financial Officer
Date: February 26, 2010
Pursuant to the requirements of the Securities Exchange Act of 1934, this report has been signed by the following persons on behalf of the registrant and in the capacities and on the date indicated.
| By: | | /S/ ROBERT D. DAVIS |
| | | | |
Signature
| | Title
| | Date
|
|
| | | | |
/s/ Mark E. Speese
Mark E. Speese | | Chairman of the Board
and Chief Executive Officer
(Principal Executive Officer) | | February 26, 2010 |
| | | | |
/s/ Mitchell E. Fadel
Mitchell E. Fadel | | President, Chief Operating Officer and Director | | February 26, 2010 |
| | | | |
/s/ Robert D. Davis
Robert D. Davis |
| | Executive Vice President — Finance,
Treasurer and Chief Financial Officer
(Principal Financial and
Accounting Officer) | | February 26, 2010 |
| | | | |
/s/ Michael J. Gade
Michael J. Gade | | Director | | February 26, 2010 |
| | | | |
/s/ Jeffery M. Jackson
Jeffery M. Jackson | | Director | | February 26, 2010 |
| | | | |
/s/ Kerney Laday
Kerney Laday | | Director | | February 26, 2010 |
| | | | |
/s/ J. V. Lentell
J. V. Lentell | | Director | | February 26, 2010 |
| | | | |
/s/ Leonard H. Roberts
Leonard H. Roberts | | Director | | February 26, 2010 |
| | | | |
/s/ Paula Stern
Paula Stern | | Director | | February 26, 2010 |
71
INDEX TO EXHIBITS
| | | | | |
Exhibit No. | | Description |
| |
| | 3 | .1 | | Certificate of Incorporation ofRent-A-Center, Inc., as amended (Incorporated herein by reference to Exhibit 3.1 to the registrant’s Current Report onForm 8-K dated as of December 31, 2002.) |
| | 3 | .2 | | Certificate of Amendment to the Certificate of Incorporation ofRent-A-Center, Inc., dated May 19, 2004 (Incorporated herein by reference to Exhibit 3.2 to the registrant’s Quarterly Report onForm 10-Q for the quarter ended June 30, 2004.) |
| | 3 | .3 | | Amended and Restated Bylaws ofRent-A-Center, Inc. (Incorporated herein by reference to Exhibit 3.1 to the registrant’s Current Report onForm 8-K dated as of December 11, 2008.) |
| | 4 | .1 | | Form of Certificate evidencing Common Stock (Incorporated herein by reference to Exhibit 4.1 to the registrant’s Registration Statement onForm S-4/A filed on January 13, 1999.) |
| | 10 | .1† | | Amended and RestatedRent-A-Center, Inc. Long-Term Incentive Plan (Incorporated herein by reference to Exhibit 10.1 to the registrant’s Quarterly Report onForm 10-Q for the quarter ended September 30, 2003.) |
| | 10 | .2 | | Amended and Restated Guarantee and Collateral Agreement, dated as of May 28, 2003, as amended and restated as of July 14, 2004, made byRent-A-Center, Inc. and certain of its Subsidiaries in favor of JPMorgan Chase Bank, as Administrative Agent (Incorporated herein by reference to Exhibit 10.2 to the registrant’s Current Report onForm 8-K dated July 15, 2004.) |
| | 10 | .3 | | Franchisee Financing Agreement, dated April 30, 2002, but effective as of June 28, 2002, by and between Texas Capital Bank, National Association, ColorTyme, Inc. andRent-A-Center, Inc. (Incorporated herein by reference to Exhibit 10.14 to the registrant’s Quarterly Report onForm 10-Q for the quarter ended June 30, 2002.) |
| | 10 | .4 | | Supplemental Letter Agreement to Franchisee Financing Agreement, dated May 26, 2003, by and between Texas Capital Bank, National Association, ColorTyme, Inc. andRent-A-Center, Inc. (Incorporated herein by reference to Exhibit 10.23 to the registrant’s Registration Statement onForm S-4 filed July 11, 2003.) |
| | 10 | .5 | | First Amendment to Franchisee Financing Agreement, dated August 30, 2005, by and among Texas Capital Bank, National Association, ColorTyme, Inc. andRent-A-Center East, Inc. (Incorporated herein by reference to Exhibit 10.7 to the registrant’s Quarterly Report onForm 10-Q for the quarter ended September 30, 2005.) |
| | 10 | .6 | | Amended and Restated Franchise Financing Agreement, dated October 1, 2003, by and among Wells Fargo Foothill, Inc., ColorTyme, Inc. andRent-A-Center East, Inc. (Incorporated herein by reference to Exhibit 10.22 to the registrant’s Quarterly Report onForm 10-Q for the quarter ended September 30, 2003.) |
| | 10 | .7 | | First Amendment to Amended and Restated Franchisee Financing Agreement, dated December 15, 2003, by and among Wells Fargo Foothill, Inc., ColorTyme, Inc. andRent-A-Center East, Inc. (Incorporated herein by reference to Exhibit 10.23 to the registrant’s Annual Report onForm 10-K/A for the year ended December 31, 2003.) |
| | 10 | .8 | | Second Amendment to Amended and Restated Franchisee Financing Agreement, dated as of March 1, 2004, by and among Wells Fargo Foothill, Inc., ColorTyme, Inc. andRent-A-Center East, Inc. (Incorporated herein by reference to Exhibit 10.24 to the registrant’s Quarterly Report onForm 10-Q for the quarter ended March 31, 2004.) |
| | 10 | .9 | | Third Amendment to Amended and Restated Franchisee Financing Agreement, dated as of September 29, 2006, by and among Wells Fargo Foothill, Inc., ColorTyme, Inc. andRent-A-Center East, Inc. (Incorporated herein by reference to Exhibit 10.10 to the registrant’s Quarterly Report onForm 10-Q for the quarter ended September 30, 2006.) |
| | 10 | .10 | | Fourth Amendment to Amended and Restated Franchisee Financing Agreement, dated as of December 19, 2006, by and among Wells Fargo Foothill, Inc., ColorTyme, Inc. andRent-A-Center East, Inc. (Incorporated herein by reference to Exhibit 10.10 to the registrant’s Annual Report onForm 10-K for the year ended December 31, 2006.) |
| | 10 | .11† | | Form of Stock Option Agreement issuable to Directors pursuant to the Amended and RestatedRent-A-Center, Inc. Long-Term Incentive Plan (Incorporated herein by reference to Exhibit 10.20 to the registrant’s Annual Report onForm 10-K for the year ended December 31, 2004.) |
72
| | |
Exhibit No. | | Description |
| |
| 3.1 | | Certificate of Incorporation of Rent-A-Center, Inc., as amended (Incorporated herein by reference to Exhibit 3.1 to the registrant’s Current Report on Form 8-K dated as of December 31, 2002.) |
Exhibit No.
| |
| 3.2 | | Description
Certificate of Amendment to the Certificate of Incorporation of Rent-A-Center, Inc., dated May 19, 2004 (Incorporated herein by reference to Exhibit 3.2 to the registrant’s Quarterly Report on Form 10-Q for the quarter ended June 30, 2004.) |
| |
| 10 | .12†3.3 | | Amended and Restated Bylaws of Rent-A-Center, Inc. (Incorporated herein by reference to Exhibit 3.1 to the registrant’s Current Report on Form 8-K dated as of September 28, 2011.) |
| |
| 4.1 | | Form of Certificate evidencing Common Stock (Incorporated herein by reference to Exhibit 4.1 to the registrant’s Registration Statement on Form S-4/A filed on January 13, 1999.) |
| |
| 4.2 | | Indenture, dated as of November 2, 2010, by and among Rent-A-Center, Inc., as Issuer, the Guarantors named therein, as Guarantors, and The Bank of New York Mellon Trust Company, N.A., as Trustee (Incorporated herein by reference to Exhibit 4.1 to the registrant’s Current Report on Form 8-K dated as of November 2, 2010.) |
| |
| 4.3 | | Registration Rights Agreement relating to the 6.625% Senior Notes due 2020, dated as of November 2, 2010, among Rent-A-Center, Inc., the subsidiary guarantors party thereto and J.P. Morgan Securities LLC, as representative for the initial purchasers named therein (Incorporated herein by reference to Exhibit 4.1 to the registrant’s Current Report on Form 8-K dated as of November 2, 2010.) |
| |
| 4.4 | | Supplemental Indenture, dated as of December 21, 2010, among Diamondback Merger Sub, Inc., Rent-A-Center, Inc., and The Bank of New York Mellon Trust Company, N.A., as Trustee (Incorporated herein by reference to Exhibit 4.4 to the registrant’s Annual Report on Form 10-K for the year ended December 31, 2010.) |
| |
| 4.5 | | Supplemental Indenture, dated as of December 21, 2010, among The Rental Store, Inc., Rent-A-Center, Inc., and The Bank of New York Mellon Trust Company, N.A., as Trustee (Incorporated herein by reference to Exhibit 4.5 to the registrant’s Annual Report on Form 10-K for the year ended December 31, 2010.) |
| |
| 10.1† | | Amended and Restated Rent-A-Center, Inc. Long-Term Incentive Plan (Incorporated herein by reference to Exhibit 10.1 to the registrant’s Quarterly Report on Form 10-Q for the quarter ended September 30, 2003.) |
| |
| 10.2 | | Amended and Restated Guarantee and Collateral Agreement, dated as of May 28, 2003, as amended and restated as of July 14, 2004, made by Rent-A-Center, Inc. and certain of its Subsidiaries in favor of JPMorgan Chase Bank, as Administrative Agent (Incorporated herein by reference to Exhibit 10.2 to the registrant’s Current Report on Form 8-K dated July 15, 2004.) |
| |
| 10.3 | | Franchisee Financing Agreement, dated April 30, 2002, but effective as of June 28, 2002, by and between Texas Capital Bank, National Association, ColorTyme, Inc. and Rent-A-Center, Inc. (Incorporated herein by reference to Exhibit 10.14 to the registrant’s Quarterly Report on Form 10-Q for the quarter ended June 30, 2002.) |
| |
| 10.4 | | Supplemental Letter Agreement to Franchisee Financing Agreement, dated May 26, 2003, by and between Texas Capital Bank, National Association, ColorTyme, Inc. and Rent-A-Center, Inc. (Incorporated herein by reference to Exhibit 10.23 to the registrant’s Registration Statement on Form S-4 filed July 11, 2003.) |
| |
| 10.5 | | First Amendment to Franchisee Financing Agreement, dated August 30, 2005, by and among Texas Capital Bank, National Association, ColorTyme, Inc. and Rent-A-Center East, Inc. (Incorporated herein by reference to Exhibit 10.7 to the registrant’s Quarterly Report on Form 10-Q for the quarter ended September 30, 2005.) |
INDEX TO EXHIBITS
| | |
Exhibit No. | | Description |
| |
| 10.6 | | Franchise Financing Agreement, dated as of August 2, 2010, between ColorTyme, Inc. and Citibank, N.A. (Incorporated herein by reference to Exhibit 10.1 to the registrant’s Current Report on Form 8-K dated as of August 2, 2010.) |
| |
| 10.7 | | Unconditional Guaranty of Rent-A-Center, Inc., dated as of August 2, 2010, executed by Rent-A-Center, Inc. in favor of Citibank, N.A. (Incorporated herein by reference to Exhibit 10.1 to the registrant’s Current Report on Form 8-K dated as of August 2, 2010.) |
| |
| 10.8 | | Unconditional Guaranty of Rent-A-Center, Inc., dated as of August 2, 2010, executed by ColorTyme Finance, Inc. in favor of Citibank, N.A. (Incorporated herein by reference to Exhibit 10.1 to the registrant’s Current Report on Form 8-K dated as of August 2, 2010.) |
| |
| 10.9† | | Form of Stock Option Agreement issuable to Directors pursuant to the Amended and Restated Rent-A-Center, Inc. Long-Term Incentive Plan (Incorporated herein by reference to Exhibit 10.20 to the registrant’s Annual Report on Form 10-K for the year ended December 31, 2004.) |
| |
| 10.10† | | Form of Stock Option Agreement issuable to management pursuant to the Amended and RestatedRent-A-Center, Inc. Long-Term Incentive Plan (Incorporated herein by reference to Exhibit 10.21 to the registrant’s Annual Report onForm 10-K for the year ended December 31, 2004.) |
| 10 |
.13†10.11†* | | Summary of Director Compensation (Incorporated herein by reference to Exhibit 10.13 to the registrant’s Annual Report onForm 10-K for the year ended December 31, 2008.) |
| 10 |
.14†10.12† | | Form of Stock Compensation Agreement issuable to management pursuant to the Amended and RestatedRent-A-Center, Inc. Long-Term Incentive Plan (Incorporated herein by reference to Exhibit 10.15 to the registrant’s Quarterly Report onForm 10-Q for the quarter ended March 31, 2006.) |
| 10 |
.15†10.13† | | Form of Long-Term Incentive Cash Award issuable to management pursuant to the Amended and RestatedRent-A-Center, Inc. Long-Term Incentive Plan (Incorporated herein by reference to Exhibit 10.16 to the registrant’s Quarterly Report onForm 10-Q for the quarter ended March 31, 2006.) |
| 10 |
.16†10.14† | | Form of Loyalty and Confidentiality Agreement entered into with management (Incorporated herein by reference to Exhibit 10.17 to the registrant’s Quarterly Report onForm 10-Q for the quarter ended March 31, 2006.) |
| 10 |
.17†10.15† | | Rent-A-Center, Inc. 2006 Long-Term Incentive Plan (Incorporated herein by reference to Exhibit 10.17 to the registrant’s Quarterly Report onForm 10-Q for the quarter ended June 30, 2006.) |
| 10 |
.18†10.16† | | Form of Stock Option Agreement issuable to management pursuant to theRent-A-Center, Inc. 2006 Long-Term Incentive Plan (Incorporated herein by reference to Exhibit 10.18 to the registrant’s Quarterly Report onForm 10-Q for the quarter ended June 30, 2006.) |
| 10 |
.19†10.17† | | Form of Stock Compensation Agreement issuable to management pursuant to theRent-A-Center, Inc. 2006 Equity Incentive Plan (Incorporated herein by reference to Exhibit 10.19 to the registrant’s Annual Report onForm 10-K for the year ended December 31, 2006.) |
| 10 |
.20†10.18† | | Form of Long-Term Incentive Cash Award issuable to management pursuant to theRent-A-Center, Inc. 2006 Long-Term Incentive Plan (Incorporated herein by reference to Exhibit 10.20 to the registrant’s Annual Report onForm 10-K for the year ended December 31, 2006.) |
| 10 |
.21†10.19† | | Rent-A-Center, Inc. 2006 Equity Incentive Plan and Amendment (Incorporated herein by reference to Exhibit 4.5 to the registrant’s Registration Statement onForm S-8 filed with the SEC on January 4, 2007)2007.) |
| 10 |
.22†10.20† | | Form of Stock Option Agreement issuable to management pursuant to theRent-A-Center, Inc. 2006 Equity Incentive Plan (Incorporated herein by reference to Exhibit 10.22 to the registrant’s Annual Report onForm 10-K for the year ended December 31, 2006.) |
INDEX TO EXHIBITS
| | |
| 10 | .23†Exhibit No. | | Description |
| |
| 10.21† | | Form of Stock Compensation Agreement issuable to management pursuant to theRent-A-Center, Inc. 2006 Long-Term Incentive Plan (Incorporated herein by reference to Exhibit 10.23 to the registrant’s Annual Report onForm 10-K for the year ended December 31, 2006.) |
| 10 |
.24†10.22† | | Form of Stock Option Agreement issuable to Directors pursuant to theRent-A-Center, Inc. 2006 Long-Term Incentive Plan (Incorporated herein by reference to Exhibit 10.24 to the registrant’s Annual Report onForm 10-K for the year ended December 31, 2006.) |
| 10 |
.25†10.23† | | Form of Deferred Stock Unit Award Agreement issuable to Directors pursuant to theRent-A-Center, Inc. 2006 Long-Term Incentive Plan (Incorporated herein by reference to Exhibit 10.2510.23 to the registrant’s Annual Report onForm 10-K for the year ended December 31, 2008.2010.) |
| 10 |
.26†10.24† | | Form of Executive Transition Agreement entered into with management (Incorporated herein by reference to Exhibit 10.21 to the registrant’s Quarterly Report onForm 10-Q for the quarter ended September 30, 2006.) |
| 10 |
.27†10.25† | | Employment Agreement, dated October 2, 2006, betweenRent-A-Center, Inc. and Mark E. Speese (Incorporated herein by reference to Exhibit 10.22 to the registrant’s Quarterly Report onForm 10-Q for the quarter ended September 30, 2006.) |
| 10 |
.28†10.26† | | Non-Qualified Stock Option Agreement, dated October 2, 2006, betweenRent-A-Center, Inc. and Mark E. Speese (Incorporated herein by reference to Exhibit 10.23 to the registrant’s Quarterly Report onForm 10-Q for the quarter ended September 30, 2006.) |
| 10 |
.29†10.27† | | Rent-A-Center, Inc. Non-Qualified Deferred Compensation Plan (Incorporated herein by reference to Exhibit 10.28 to the registrant’s Quarterly Report onForm 10-Q for the quarter ended June 30, 2007.) |
| |
| 10.28† | | Rent-A-Center, Inc. 401-K Plan (Incorporated herein by reference to Exhibit 10.30 to the registrant’s Annual Report on Form 10-K for the year ended December 31, 2008.) |
| |
| 10.29 | | Fourth Amended and Restated Credit Agreement, dated as of May 28, 2003, as amended and restated as of July 14, 2011, among Rent-A-Center, Inc., the several banks and other financial institutions or entities from time to time parties thereto, Bank of America, N.A., Compass Bank and Wells Fargo Bank, N.A., as syndication agents, and JPMorgan Chase Bank, N.A., as administrative agent (Incorporated herein by reference to Exhibit 10.1 to the registrant’s Current Report on Form 8-K dated as of July 14, 2011.) |
| |
| 10.30 | | Rent-A-Center East, Inc. Retirement Savings Plan for Puerto Rico Employees (Incorporated herein by reference to Exhibit 99.1 to the registrant’s Registration Statement on Form S-8 filed January 28, 2011.) |
| |
| 21.1* | | Subsidiaries of Rent-A-Center, Inc. |
| |
| 23.1* | | Consent of Grant Thornton LLP |
| |
| 31.1* | | Certification pursuant to Rule 13a-14(a) of the Securities Exchange Act of 1934 implementing Section 302 of the Sarbanes-Oxley Act of 2002 by Mark E. Speese |
| |
| 31.2* | | Certification pursuant to Rule 13a-14(a) of the Securities Exchange Act of 1934 implementing Section 302 of the Sarbanes-Oxley Act of 2002 by Robert D. Davis |
| |
| 32.1* | | Certification pursuant to 18 U.S.C. Section 1350 as adopted pursuant to Section 906 of the Sarbanes-Oxley Act of 2002 by Mark E. Speese |
| |
| 32.2* | | Certification pursuant to 18 U.S.C. Section 1350 as adopted pursuant to Section 906 of the Sarbanes-Oxley Act of 2002 by Robert D. Davis |
73
INDEX TO EXHIBITS
| | | | | |
Exhibit No. | | Description |
| |
| | 10 | .30† | | Rent-A-Center, Inc.401-K Plan (Incorporated herein by reference to Exhibit 10.30 to the registrant’s Annual Report onForm 10-K for the year ended December 31, 2008.) |
| | 10 | .31 | | Third Amended and Restated Credit Agreement, dated as of November 15, 2006, amongRent-A-Center, Inc., the several banks and other financial institutions or entities from time to time parties thereto, Union Bank of California, N.A., as documentation agent, Lehman Commercial Paper Inc., as syndication agent, and JPMorgan Chase Bank, N.A., as administrative agent (Incorporated herein by reference to Exhibit 10.1 to the registrant’s Current Report onForm 8-K dated November 15, 2006.) |
| | 10 | .32 | | First Amendment, dated as of December 2, 2009, to Third Amended and Restated Credit Agreement, amongRent-A-Center, Inc., the several banks and other financial institutions or entities from time to time parties thereto, JPMorgan Chase Bank, N.A., as administrative agent, and the other agent parties thereto (Incorporated herein by reference to Exhibit 10.1 to the registrant’s Current Report onForm 8-K dated December 2, 2009). |
| | 21 | .1* | | Subsidiaries ofRent-A-Center, Inc. |
| | 23 | .1* | | Consent of Grant Thornton LLP |
| | 31 | .1* | | Certification pursuant toRule 13a-14(a) of the Securities Exchange Act of 1934 implementing Section 302 of the Sarbanes-Oxley Act of 2002 by Mark E. Speese |
| | 31 | .2* | | Certification pursuant toRule 13a-14(a) of the Securities Exchange Act of 1934 implementing Section 302 of the Sarbanes-Oxley Act of 2002 by Robert D. Davis |
| | 32 | .1* | | Certification pursuant to 18 U.S.C. Section 1350 as adopted pursuant to Section 906 of the Sarbanes-Oxley Act of 2002 by Mark E. Speese |
| | 32 | .2* | | Certification pursuant to 18 U.S.C. Section 1350 as adopted pursuant to Section 906 of the Sarbanes-Oxley Act of 2002 by Robert D. Davis |
| | |
Exhibit No. | | Description |
| |
| 101.INS** | | XBRL Instance Document |
| |
| 101.SCH** | | XBRL Taxonomy Extension Schema Document |
| |
| 101.CAL** | | XBRL Taxonomy Extension Calculation Linkbase Document |
| |
| 101.DEF** | | XBRL Taxonomy Extension Definition Linkbase Document |
| |
| 101.LAB** | | XBRL Taxonomy Extension Label Linkbase Document |
| |
| 101.PRE** | | XBRL Taxonomy Extension Presentation Linkbase Document |
| † | | Management contract or compensatory plan or arrangementarrangement. |
|
| ** | The XBRL-related information in Exhibit No. 101 to this Annual Report on Form 10-K is furnished and not filed for purposes of Sections 11 and 12 of the Securities Act of 1933 and Section 18 of the Securities Exchange Act of 1934. |
74
77