FORWARD LOOKING INFORMATION
Statements in this Annual Report on Form 10-K that are based on other than historical data are forward-looking within the meaning of the Private Securities Litigation Reform Act of 1995. Forward-looking statements provide current expectations or forecasts of future events and include, among others:
statements with respect to the beliefs, plans, objectives, goals, guidelines, expectations, anticipations, and future financial condition, results of operations and performance of Financial Institutions, Inc. (“the parent” or “FII”) and its subsidiaries (collectively “the Company,” “we,” “our,” “us”); and
statements preceded by, followed by or that include the words “may,” “could,” “should,” “would,” “believe,” “anticipate,” “estimate,” “expect,” “intend,” “plan,” “projects,” or similar expressions.
These forward-looking statements are not guarantees of future performance, nor should they be relied upon as representing management’s views as of any subsequent date. Forward-looking statements involve significant risks and uncertainties and actual results may differ materially from those presented, either expressed or implied, in this Annual Report on Form 10-K, including, but not limited to, those presented in the Management’s Discussion and Analysis.Analysis of Financial Condition and Results of Operations. Factors that might cause such differences include, but are not limited to:
If we experience greater credit losses than anticipated, earnings may be adversely impacted;
Geographic concentration may unfavorably impact our operations;
We depend on the Company’s abilityaccuracy and completeness of information about or from customers and counterparties;
We are subject to successfully execute its business plans, manage its risks,environmental liability risk associated with our lending activities;
We are highly regulated and achieve its objectives;
Ongoing financial reform legislation may result in new regulations that could require us to maintain higher capital levels and/or increase our costs of operations or limit certain activities or lines of business;
New or changing tax, accounting, and regulatory rules and interpretations could significantly impact our strategic initiatives, results of operations, cash flows, and financial condition;
Changes in New York State banking regulations or other laws could adversely affect us;
If our security systems, or those of merchants, merchant acquirers or other third parties containing information about customers, are compromised, we may be subject to liability and damage to our reputation;
We could be subject to losses if we fail to properly safeguard sensitive and confidential information;
Our information systems may experience an interruption or breach in security;
We rely on other companies to provide key components of our business infrastructure;
We may not be able to attract and retain skilled people;
The potential for business interruption exists throughout our organization;
Our expansion efforts, particularly through new and acquired branches, may not be successful if we fail to manage our growth effectively;
We may fail to realize any benefits and may incur unanticipated losses related to the assets we acquire and liabilities we assume from current or future acquisitions;
We are subject to interest rate risk;
Our business may be adversely affected by conditions in the financial markets and economic conditions includinggenerally;
Our earnings are significantly affected by the politicalfiscal and economic effects of the current economic crisis and other major developments, including wars, military actions and terrorist attacks;
The soundness of Treasury (the “Treasury”) and the Federal Reserve Board (“FRB”);
Our market value could result in an impairment of goodwill;
We operate in a highly competitive industry and market area;Liquidity is essential to our businesses;
We may need to raise additional capital in the impactfuture and such capital may not be available on acceptable terms or at all;
We rely on dividends from our subsidiaries for most of the executive compensation limitsour revenue;
The market price for our common stock varies, and you should purchase common stock for long-term investment only;
We may issue debt and equity securities or securities convertible into equity securities, any of these acts, which may impactbe senior to our common stock as to distributions and in liquidation, which could negatively affect the abilityvalue of the Company and other American financial institutions to retain and recruit executives and other personnel necessary for their businesses and competitiveness;
- 3 -We may not pay dividends on our common stock; and
We caution readers not to place undue reliance on any forward-looking statements, which speak only as of the date made, and advisesadvise readers that various factors, including those described above, could affect the Company’sour financial performance and could cause the Company’sour actual results or circumstances for future periods to differ materially from those anticipated or projected. See also Item 1A, Risk Factors, in this Form 10-K.
- 4 -
| ITEM 1. | BUSINESS |
GENERAL
We conduct our business primarily through our banking subsidiary, Five Star Bank, which adopted its current name in 2005 when the Companywe merged three of itsour bank subsidiaries, Wyoming County Bank, National Bank of Geneva and Bath National Bank into itsour New York chartered bank subsidiary, First Tier Bank & Trust, which was then renamed Five Star Bank. In addition, our business operations include a wholly-owned broker-dealer and investment adviser subsidiary, Five Star Investment Services, Inc. (100% owned) (“FSIS”).
Our Business Strategy
Our business strategy has been to maintain a community bank philosophy, which consists of focusing on and understanding the FISI Statutory Trust I (the “Trust”) was formedindividualized banking needs of the businesses, professionals and other residents of the local communities surrounding our banking centers. We believe this focus allows us to facilitate the private placementbe more responsive to our customers’ needs and provide a high level of $16.2 millionpersonal service that differentiates us from larger competitors, resulting in capital securities. FII capitalized the Trustlong-standing and broad based banking relationships. Our core customers are primarily comprised of small- to medium-sized businesses, professionals and community organizations who prefer to build a banking relationship with a $502 thousand investmentcommunity bank that offers and combines high quality, competitively-priced banking products and services with personalized service. Because of our identity and origin as a locally operated bank, we believe that our level of personal service provides a competitive advantage over larger banks, which tend to consolidate decision-making authority outside local communities.
A key aspect of our current business strategy is to foster a community-oriented culture where our customers and employees establish long-standing and mutually beneficial relationships. We believe that we are well-positioned to be a strong competitor within our market area because of our focus on community banking needs and customer service, our comprehensive suite of deposit and loan products typically found at larger banks, our highly experienced management team and our strategically located banking centers. A central part of our strategy is generating core deposits to support growth of a diversified and high-quality loan portfolio.
MARKET AREAS AND COMPETITION
We provide a wide range of consumer and commercial banking and financial services to individuals, municipalities and businesses through a network of over 50 offices and more than 70 ATMs in fourteen contiguous counties of Western and Central New York: Allegany, Cattaraugus, Cayuga, Chautauqua, Chemung, Erie, Genesee, Livingston, Monroe, Ontario, Seneca, Steuben, Wyoming and Yates Counties. Our banking activities, though concentrated in the Trust’s common securities. The Trustcommunities where we maintain branches, also extend into neighboring counties. In addition, we have expanded our consumer indirect lending presence to the Capital District of New York and Northern Pennsylvania.
Our market area is accounted foreconomically diversified in that we serve both rural markets and the larger more affluent markets of suburban Rochester and suburban Buffalo. Rochester and Buffalo are the two largest metropolitan areas in New York outside of New York City, with a combined metropolitan area of over two million people. We anticipate increasing our presence in and around these metropolitan statistical areas in the coming years.
We face significant competition in both making loans and attracting deposits, as an unconsolidated subsidiary. Therefore, the Company’s consolidated statementsboth Western and Central New York have a high density of financial position reflectinstitutions. Our competition for loans comes principally from commercial banks, savings banks, savings and loan associations, mortgage banking companies, credit unions, insurance companies and other financial service companies. Our most direct competition for deposits has historically come from commercial banks, savings banks and credit unions. We face additional competition for deposits from non-depository competitors such as the $16.7 millionmutual fund industry, securities and brokerage firms and insurance companies. We generally compete with other financial service providers on factors such as: level of customer service, responsiveness to customer needs, availability and pricing of products, and geographic location.
4
INVESTMENT ACTIVITIES
Our investment policy is contained within our overall Asset-Liability Management and Investment Policy. This policy dictates that investment decisions will be made based on the safety of the investment, liquidity requirements, potential returns, cash flow targets, need for collateral and desired risk parameters. In pursuing these objectives, we consider the ability of an investment to provide earnings consistent with factors of quality, maturity, marketability, pledgeable nature and risk diversification. Our Treasurer, guided by our Asset-Liability Committee (“ALCO”), is responsible for investment portfolio decisions within the established policies.
Our investment securities strategy centers on providing liquidity to meet loan demand and redeeming liabilities, meeting pledging requirements, managing credit risks, managing overall interest rate risks and maximizing portfolio yield. Our current policy generally limits security purchases to the following:
U.S. treasury securities;
U.S. government agency securities, which are securities issued by official Federal government bodies (e.g. the Government National Mortgage Association (“GNMA”)) and U.S. government-sponsored enterprise (“GSE”) securities, which are securities issued by independent organizations that are in junior subordinated debentures as a liabilitypart sponsored by the federal government (e.g., the Federal Home Loan Bank (“FHLB”) system, the Federal National Mortgage Association (“FNMA”), the Federal Home Loan Mortgage Corporation (“FHLMC”), the Small Business Administration (“SBA”) and the $502 thousand investmentFederal Farm Credit Bureau);
Mortgage-backed securities (“MBS”) include mortgage-backed pass-through securities (“pass-throughs”) and collateralized mortgage obligations (“CMO”) issued by GNMA, FNMA and FHLMC;
Investment grade municipal securities, including revenue, tax and bond anticipation notes, statutory installment notes and general obligation bonds;
Certain creditworthy un-rated securities issued by municipalities;
Certificates of deposit;
Equity securities at the holding company level; and
Limited partnership investments in Small Business Investment Companies.
5
LENDING ACTIVITIES
General
We offer a broad range of loans including commercial business and revolving lines of credit, commercial mortgages, equipment loans, residential mortgage loans and home equity loans and lines of credit, home improvement loans, automobile loans and personal loans. Newly originated and refinanced fixed rate residential mortgage loans are either retained in our portfolio or sold to the Trust’ssecondary market with servicing rights retained.
We continually evaluate and update our lending policy. The key elements of our lending philosophy include the following:
To ensure consistent underwriting, employees must share a common securitiesview of the risks inherent in lending activities as well as the standards to be applied in underwriting and managing credit risk;
Pricing of credit products should be risk-based;
The loan portfolio must be diversified to limit the potential impact of negative events; and
Careful, timely exposure monitoring through dynamic use of our risk rating system is includedrequired to provide early warning and assure proactive management of potential problems.
Commercial Business and Commercial Mortgage Lending
We originate commercial business loans in our primary market areas and underwrite them based on the borrower’s ability to service the loan from operating income. We offer a broad range of commercial lending products, including term loans and lines of credit. Short and medium-term commercial loans, primarily collateralized, are made available to businesses for working capital (including inventory and receivables), business expansion (including acquisition of real estate, expansion and improvements) and the purchase of equipment. Commercial business loans are offered to the agricultural industry for short-term crop production, farm equipment and livestock financing. As a general practice, where possible, a collateral lien is placed on any available real estate, equipment or other assets.
We also offer commercial mortgage loans to finance the purchase of real property, which generally consists of real estate with completed structures and, to a smaller extent, agricultural real estate financing. Commercial mortgage loans are secured by first liens on the real estate and are typically amortized over a 10 to 20 year period. The underwriting analysis includes credit verification, appraisals and a review of the borrower’s financial condition and repayment capacity. As of December 31, 2011, $122.1 million, or 31%, of the aggregate commercial mortgage portfolio were at fixed rates, while $271.1 million, or 69%, were at variable rates.
We utilize government loan guarantee programs where available and appropriate.
Government Guarantee Programs
We participate in government loan guarantee programs offered by the SBA, U.S. Department of Agriculture, Rural Economic and Community Development and Farm Service Agency, among others. As of December 31, 2011, we had loans with an aggregate principal balance of $60.1 million that were covered by guarantees under these programs. The guarantees typically only cover a certain percentage of these loans. By participating in these programs, we are able to broaden our base of borrowers while minimizing credit risk.
Residential Mortgage Lending
We originate fixed and variable rate one-to-four family residential mortgages collateralized by owner-occupied properties located in our market areas. We offer a variety of real estate loan products, which are generally amortized over periods of up to 30 years. Loans collateralized by one-to-four family residential real estate generally have been originated in amounts of no more than 80% of appraised value or have mortgage insurance. Mortgage title insurance and hazard insurance are normally required. We sell certain one-to-four family residential mortgages to the secondary mortgage market and typically retain the right to service the mortgages. To assure maximum salability of the residential loan products for possible resale, we have formally adopted the underwriting, appraisal, and servicing guidelines of the FHLMC as part of our standard loan policy. As of December 31, 2011, the annual report,residential mortgage servicing portfolio totaled $297.8 million, the majority of which has been sold to FHLMC. As of December 31, 2011, our residential mortgage loan portfolio totaled $113.9 million, or 8% of our total loan portfolio. We do not engage in sub-prime or other high-risk residential mortgage lending as a line-of-business.
6
Consumer Lending
We offer a variety of loan products to our consumer customers, including home equity loans and lines of credit, automobile loans, secured installment loans and various other types of secured and unsecured personal loans. At December 31, 2011, outstanding consumer loan balances were concentrated in indirect automobile loans and home equity products.
We selectively originate a mix of new and used indirect consumer loans through franchised new car dealers. The consumer indirect loan portfolio is primarily comprised of loans with terms that typically range from 36 to 84 months. We have expanded our relationships with franchised new car dealers in Western, Central and the Capital District of New York, and most recently, Northern Pennsylvania. As of December 31, 2011, the consumer indirect portfolio totaled $487.7 million, or 33% of our total loan portfolio.
We also originate, independently of the indirect loans described above, consumer automobile loans, recreational vehicle loans, boat loans, home improvement loans, closed-end home equity loans, home equity lines of credit, personal loans (collateralized and uncollateralized) and deposit account collateralized loans. The terms of these loans typically range from 12 to 180 months and vary based upon the nature of the collateral and the size of loan. The majority of the consumer lending program is underwritten on a secured basis using the customer’s home or the financed automobile, mobile home, boat or recreational vehicle as collateral. As of December 31, 2011, $117.6 million, or 51%, of the home equity portfolio was at fixed rates, while $114.2 million, or 49%, was at variable rates. Approximately 69% of the loans in the home equity portfolio are first lien positions at December 31, 2011. The other consumer portfolio totaled $24.3 million as of December 31, 2011, all of which were fixed rate loans.
Credit Administration
Our loan policy establishes standardized underwriting guidelines, as well as the loan approval process and the committee structures necessary to facilitate and ensure the highest possible loan quality decision-making in a timely and businesslike manner. The policy establishes requirements for extending credit based on the size, risk rating and type of credit involved. The policy also sets limits on individual loan officer lending authority and various forms of joint lending authority, while designating which loans are required to be approved at the committee level.
Our credit objectives are as follows:
Compete effectively and service the legitimate credit needs of our target market;
Enhance our reputation for superior quality and timely delivery of products and services;
Provide pricing that reflects the entire relationship and is commensurate with the risk profiles of our borrowers;
Retain, develop and acquire profitable, multi-product, value added relationships with high quality borrowers;
Focus on government guaranteed lending and establish a specialization in this area to meet the needs of the small businesses in our communities; and
Comply with the relevant laws and regulations.
Our policy includes loan reviews, under the supervision of the Audit and Risk Oversight committees of the Board of Directors and directed by our Chief Risk Officer, in order to render an independent and objective evaluation of our asset quality and credit administration process.
Risk ratings are assigned to loans in the commercial business and commercial mortgage portfolios. The risk ratings are specifically used as follows:
Profile the risk and exposure in the loan portfolio and identify developing trends and relative levels of risk;
Identify deteriorating credits;
Reflect the probability that a given customer may default on its obligations; and
Assist with risk-based pricing.
Through the loan approval process, loan administration and loan review program, management seeks to continuously monitor our credit risk profile and assesses the overall quality of the loan portfolio and adequacy of the allowance for loan losses.
We have several procedures in place to assist in maintaining the overall quality of our loan portfolio. Delinquent loan reports are monitored by credit administration to identify adverse levels and trends. Loans, including impaired loans, are generally classified as non-accruing if they are past due as to maturity or payment of principal or interest for a period of more than 90 days, unless such loans are well-collateralized and in the process of collection. Loans that are on a current payment status or past due less than 90 days may also be classified as non-accruing if repayment in full of principal and/or interest is uncertain.
7
Allowance for Loan Losses
The allowance for loan losses is established through charges to earnings in the form of a provision for loan losses. The allowance reflects management’s estimate of the amount of probable loan losses in the portfolio, based on factors such as:
Specific allocations for individually analyzed credits;
Risk assessment process;
Historical net charge-off experience;
Evaluation of the loan portfolio with loan reviews;
Levels and trends in delinquent and non-accruing loans;
Trends in volume and terms;
Effects of changes in lending policy;
Experience, ability and depth of management;
National and local economic trends and conditions;
Concentrations of credit;
Interest rate environment;
Customer leverage;
Information (availability of timely financial information); and
Collateral values.
Our methodology in the estimation of the allowance for loan losses includes the following broad areas:
| 1. | Impaired commercial business and commercial mortgage loans, generally in excess of $50 thousand are reviewed individually and assigned a specific loss allowance, if considered necessary, in accordance with U.S. generally accepted accounting principles (“GAAP”). |
| 2. | The remaining portfolios of commercial business and commercial mortgage loans are segmented by risk rating into the following loan classification categories: uncriticized or pass, special mention, substandard and doubtful. Uncriticized loans, special mention loans, substandard loans and all doubtful loans not assigned a specific loss allowance are assigned allowance allocations based on historical net loan charge-off experience for each of the respective loan categories, supplemented with additional reserve amounts, if considered necessary, based upon qualitative factors. These qualitative factors include the levels and trends in delinquencies and non-accruing loans, trends in volume and terms of loans, effects of changes in lending policy, experience, ability, and depth of management, national and local economic conditions, concentrations of credit, interest rate environment, customer leverage, information (availability of timely financial information), and collateral values, among others. |
| 3. | The retail loan portfolio is segmented into the following types of loans: residential real estate, home equity (home equity loans and lines of credit), consumer indirect and other consumer. Allowance allocations for the real estate related loan portfolios (residential and home equity) are based on the average loss experience for the previous eight quarters, supplemented with qualitative factors similar to the elements described above. Allowance allocations for the consumer indirect and other consumer portfolios are based on vintage analyses performed with historical loss experience at 36 months and 24 months aging, respectively. The allocations on these portfolios are also supplemented with qualitative factors. |
Management presents a quarterly review of the adequacy of the allowance for loan losses to our Board of Directors based on the methodology described above. See also the section titled “Allowance for Loan Losses” in Part II, Item 7, “Management’s Discussion and Analysis of Financial Condition and Results of Operations”.
8
SOURCES OF FUNDS
Our primary sources of funds are deposits, borrowed funds, scheduled amortization and prepayments of principal from loans and mortgage-backed securities, maturities and calls of investment securities and funds provided by operations.
Deposits
We maintain a full range of deposit products and accounts to meet the needs of the residents and businesses in our primary service area. Products include an array of checking and savings account programs for individuals and small businesses, including money market accounts, certificates of deposit, sweep investment capabilities as well as Individual Retirement Accounts and other qualified plan accounts. We rely primarily on competitive pricing of our deposit products, customer service and long-standing relationships with customers to attract and retain these deposits and seek to make our services convenient to the community by offering 24-hour ATM access at some of our facilities, access to other ATM networks available at other local financial institutions and retail establishments, and telephone banking services including account inquiry and balance transfers. We also take advantage of the use of technology by allowing our customers banking access via the Internet and various advanced systems for cash management for our business customers.
We had no traditional brokered deposits at December 31, 2011; however, we do participate in the Certificate of Deposit Account Registry Service (“CDARS”) program, which enables depositors to receive FDIC insurance coverage for deposits otherwise exceeding the maximum insurable amount. Through the CDARS program, deposits in excess of the maximum insurable amount are placed with multiple participating financial institutions. Reciprocal CDARS deposits totaled $46.5 million at December 31, 2011.
Borrowings
We have access to a variety of borrowing sources and use both short-term and long-term borrowings to support our asset base. Borrowings from time-to-time include federal funds purchased, securities sold under agreements to repurchase and FHLB advances. We also offer customers a deposit account that sweeps balances in excess of an agreed upon target amount into overnight repurchase agreements.
OPERATING SEGMENTS
Our primary operating segment is our subsidiary bank, FSB. Our brokerage subsidiary, FSIS, is also deemed an operating segment; however, it does not meet the applicable thresholds for separate disclosure requirements.
OTHER INFORMATION
All of the reports we file with the SEC, including this Annual Report on Form 10-K, Quarterly Reports on Form 10-Q and Current Reports on Form 8-K, as well as any amendments thereto may be inspectedread at the public reference facility maintained by the SEC at its public reference room at 100 F. Street, N.E., Room 1580, Washington, DC 20549 and copies of all or any part thereof may be obtained from that office upon payment of the prescribed fees. You may call the SEC at 1-800-SEC-0330 for further information on the operation of the public reference room and you can request copies of the documents upon payment of a duplicating fee, by writing to the SEC. In addition, the SEC maintains a website that contains reports, proxy and information statements and other information regarding registrants, including us, that file electronically with the SEC which can be accessed at www.sec.gov.
We also makesmake available, free of charge, through itsour website, atwww.fiiwarsaw.com, all reports filed with the SEC, including our Annual Report on Form 10-K, Quarterly Reports on Form 10-Q and Current Reports on Form 8-K, as well as any amendments to those reports, as soon as reasonably practicable after those documents are filed with, or furnished to, the SEC. These filings may be viewed by accessing theCompany Filingssubsection of theSEC Filings section under theInvestor Relations tab on our website (www.fiiwarsaw.com). Information available on our website is not a part of, and is not incorporated into, this annual reportAnnual Report on Form 10-K.
- 5 -
- 6 -
- 7 -
- 8 -
- 9 -
The Company and FSBour subsidiaries are subject to an extensive federal and statesystem of laws and regulations that impose restrictions on, and provide for regulatory oversight of, FII’s and FSB’s operations. These laws and regulations are generally intended to protect depositors and not shareholders. Any change in any applicable statute or regulation could have a material effect on FII’s and FSB’s business.
Holding Company is in compliance in all material respects with these lawsRegulation. As a bank holding company and regulations. Changes in the laws, regulations or policies that impact the Company cannot necessarily be predicted, but they may have a material effect on the Company’s consolidated financial position, consolidated results of operations, or liquidity.
Acquiring, directly or indirectly, ownership or control of any voting shares of another bank or bank holding company if, after such acquisition, it would own or control more than 5% of such shares (unless it already owns or controls the majority of such shares);
Acquiring all or substantially all of the assets of another bank or bank holding company, or
Merging or consolidating with another bank holding company.
The Bank Holding Company Act generally prohibits a bank holding company from acquiring direct or indirect ownership or control of more than 5% of the voting shares of any company which is not a bank or bank holding company, or from engaging directly or indirectly in activities other than those of banking, managing or controlling banks, or providing services for its subsidiaries. The principal exceptions to these prohibitions involve certain circumstances couldnon-bank activities which, by statute or by FRB regulation or order, have been identified as activities closely related to the business of banking or managing or controlling banks. The list of activities permitted by the FRB includes, among other things: lending; operating a savings institution, mortgage company, finance company, credit card company or factoring company; performing certain data processing operations; providing certain investment and financial advice; underwriting and acting as an insurance agent for certain types of credit related insurance; leasing property on a full-payout, non-operating basis; selling money orders, travelers’ checks and United States Savings Bonds; real estate and personal property appraising; providing tax planning and preparation services; and, subject to certain limitations, providing securities brokerage services for customers. These activities may also be requiredaffected by federal legislation.
The Gramm-Leach-Bliley Act amended portions of the Bank Holding Company Act to guarantee the capital plan of an undercapitalized banking subsidiary.
Depository Institution Regulation.Our bank subsidiary is subject to regulation by the Federal Deposit Insurance Corporation (“FDIC”). This regulatory structure includes:
Real estate lending standards, which provide guidelines concerning loan-to-value ratios for various types of real estate loans;
Risk-based capital rules, including accounting for interest rate risk, concentration of credit risk and the risks posed by non-traditional activities;
Rules requiring depository institutions to develop and implement internal procedures to evaluate and control credit and settlement exposure to their correspondent banks;
Rules restricting types and amounts of equity investments; and
Rules addressing various safety and soundness issues, including operations and managerial standards, standards for asset quality, earnings and compensation standards.
10
Capital Adequacy Requirements.The FRB may oppose the transaction if it believes that the transaction would constitute an unsafe or unsound practice or would violate any law or regulation. Depending upon the circumstances, the FRB could take the position that paying a dividend would constitute an unsafe or unsound banking practice.
The FRB’s risk-based guidelines establish a comprehensive synthesis of prior opinions and interpretations under Sections 23A and 23B of the Federal Reserve Act. Regulation W contains an extensive discussion of tying arrangements, which could impact the way banks and bank holding companies transact business with affiliates.
- 10 -
Risk-based capital ratios are calculated by dividing Tier 1 and total capital by risk-weighted assets. Assets and off-balance sheet exposures are assigned to total risk-weighted assets was 11.95%one of four categories of risk-weights, based primarily on relative credit risk. For bank holding companies, generally the minimum Tier 1 risk-based capital ratio is 4% and the minimum total risk-based capital ratio is 8%. Our Tier 1 and total risk-based capital ratios under these guidelines at December 31, 2011 were 12.20% and 13.45%, respectively.
The FRB’s leverage capital guidelines establish a minimum leverage ratio determined by dividing Tier 1 capital by adjusted average total assets. The minimum leverage ratio is 3% for bank holding companies that meet certain specified criteria, including having the highest regulatory rating. All other bank holding companies generally are required to maintain a leverage ratio of total capital to total risk-weighted assets was 13.21%at least 4%. At December 31, 2011, we had a leverage ratio of 8.63%. See also the section titled “Capital Resources” in Part II, Item 7, “Management’s Discussion and Analysis of Financial Condition and Results of Operations” and Note 10, Regulatory Matters, of the notes to consolidated financial statements.
The federal regulatory authorities’ risk-based capital guidelines are based upon the FRB uses a leverage ratio as an additional tool to evaluate1988 capital accord (“Basel I”) of the capital adequacy of bank holding companies.Basel Committee on Banking Supervision (the “Basel Committee”). The leverage ratioBasel Committee is a company’s Tier 1committee of central banks and bank supervisors/regulators from the major industrialized countries that develops broad policy guidelines for use by each country’s supervisors in determining the supervisory policies and regulations to which they apply. Actions of the Committee have no direct effect on banks in participating countries. In 2004, the Basel Committee published a new capital divided by quarterly average consolidated assets. Certain highly rated bank holding companies may maintainaccord (“Basel II”) to replace Basel I. Basel II provides two approaches for setting capital standards for credit risk – an internal ratings-based approach tailored to individual institutions’ circumstances and a minimum leverage ratio of 3.0%, but other bank holding companies may be requiredstandardized approach that bases risk weightings on external credit assessments to maintain a leverage ratio of up to 200 basis points above the regulatory minimum. As of December 31, 2009, the Company’s leverage ratio was 7.96%.
A final rule implementing the advanced approaches of Basel II in the United States would apply only to certain large or internationally active banking organizations, or “core banks” – defined as those with consolidated total assets of $250 billion or more or consolidated on-balance sheet foreign exposures of $10 billion or more, became effective as of April 1, 2008. Certain other U.S. banking organizations would have the option to adopt the requirements of this rule. We are not required to comply with the advanced approaches of Basel II.
On September 3, 2009, the United States Department of Treasury (the “Treasury”) issued a particularpolicy statement (the “Treasury Policy Statement”) entitled “Principles for Reforming the U.S. and International Regulatory Capital Framework for Banking Firms,” which contemplates changes to the existing regulatory capital regime involving substantial revisions to major parts of the Basel I and Basel II capital frameworks and affecting all regulated banking organizationorganizations and other systemically important institutions. The Treasury Policy Statement calls for, among other things, higher and stronger capital requirements for all banking firms, with changes to the regulatory capital framework to be phased in over a period of several years.
On December 17, 2009, the Basel Committee issued a set of proposals (the “2009 Capital Proposals”) that would significantly revise the definitions of Tier 1 capital and Tier 2 capital. Among other things, the 2009 Capital Proposals would re-emphasize that common equity is the predominant component of Tier 1 capital. Concurrently with the release of the 2009 Capital Proposals, the Basel Committee also released a set of proposals related to liquidity risk exposure (the “2009 Liquidity Proposals”). The 2009 Liquidity Proposals include the implementation of (i) a “liquidity coverage ratio” or LCR, designed to ensure that a bank maintains an adequate level of unencumbered, high-quality assets sufficient to meet the bank’s liquidity needs over a 30-day time horizon under an acute liquidity stress scenario and (ii) a “net stable funding ratio” or NSFR, designed to promote more medium and long-term funding of the assets and activities of banks over a one-year time horizon.
11
The Dodd-Frank Act includes certain provisions concerning the capital regulations of the U.S. banking regulators, which are often referred to as the “Collins Amendment.” These provisions are intended to subject bank holding companies to the same capital requirements as their bank subsidiaries and to eliminate or significantly reduce the use of hybrid capital instruments, especially trust preferred securities, as regulatory capital. Under the Collins Amendment, trust preferred securities issued by a company with total consolidated assets of less than $15 billion before May 19, 2010 and treated as regulatory capital are grandfathered, but any such securities issued later are not eligible as regulatory capital. The banking regulators developed regulations setting minimum risk-based and leverage capital requirements for holding companies and banks on a consolidated basis that are higherno less stringent than the minimum ratios when circumstances warrant.generally applicable requirements in effect for depository institutions under the prompt corrective action regulations discussed below. The FRB guidelines also provideadopted final regulations effective July 28, 2011, which established a capital floor and amended advanced risk-based capital adequacy standards. The rule mandated that banking organizations experiencing internal growth or making acquisitions will be expected to maintain strongthe capital positions substantially above the minimum supervisory levels, without significant reliance on intangible assets.
The banking regulators also must seek to make capital declines below certain levels. standards countercyclical so that the required levels of capital increase in times of economic expansion and decrease in times of economic contraction. The FRB has not yet issued proposed rules for these countercyclical capital standards.
In December 2010 and January 2011, the eventBasel Committee published the final texts of reforms on capital and liquidity generally referred to as “Basel III.” Although Basel III is intended to be implemented by participating countries for large, internationally active banks, its provisions are likely to be considered by U.S. banking regulators in developing new regulations applicable to other banks in the United States, including Five Star Bank.
For banks in the United States, among the most significant provisions of Basel III concerning capital are the following:
A minimum ratio of common equity to risk-weighted assets reaching 4.5%, plus an institution becomes “undercapitalized,” it must submitadditional 2.5% as a capital restoration plan. The capital restoration plan will not be acceptedconservation buffer, by the regulators unless each company having control of the undercapitalized institution guarantees the subsidiary’s compliance with the capital restoration plan up to2019 after a certain specified amount. Any such guarantee from a depository institution holding company is entitled to a priority of payment in bankruptcy.
- 11 -
A minimum ratio of total capital to total risk-weighted assets, plus the additional 2.5% capital conservation buffer, reaching 10.5% by 2019 after a phase -in period.
An additional countercyclical capital buffer to be imposed by applicable national banking regulators periodically at their discretion, with advance notice.
Restrictions on capital distributions and discretionary bonuses applicable when capital ratios fall within the buffer zone.
Deduction from common equity of 8.0%.deferred tax assets that depend on future profitability to be realized.
Increased capital requirements for counterparty credit risk relating to OTC derivatives, repos and securities financing activities.
For capital instruments issued on or after January 13, 2013 (other than common equity), a loss-absorbency requirement such that the instrument must be written off or converted to common equity if a trigger event occurs, either pursuant to applicable law or at the direction of the banking regulator. A trigger event is an event under which the banking entity would become nonviable without the write-off or conversion, or without an injection of capital from the public sector. The issuer must maintain authorization to issue the requisite shares of common equity if conversion were required.
The Basel III provisions on liquidity include complex criteria establishing the LCR and NSFR. The purpose of the LCR is to ensure that a bank maintains adequate unencumbered, high quality liquid assets to meet its liquidity needs for 30 days under a severe liquidity stress scenario. The purpose of the NSFR is to promote more medium and long-term funding of assets and activities, using a one-year horizon. Although Basel III is described as a “final text,” it is subject to the resolution of certain issues and to further guidance and modification, as well as to adoption by U.S. banking regulators, including decisions as to whether and to what extent it will apply to U.S. banks that are not large, internationally active banks.
12
Prompt Corrective Action.The Federal Deposit Insurance Corporation Improvement Act of 1991, among other things, identifies five capital categories havefor insured depository institutions (well capitalized, adequately capitalized, undercapitalized, significantly undercapitalized and critically undercapitalized) and requires the same definitionsrespective federal bank regulatory agencies to implement systems for the Company. As of December 31, 2009, the ratio of Tier 1 capital to total risk-weighted assets for the Bank was 11.33% and the ratio of total capital to total risk-weighted assets was 12.58%. The FDIC’s leverage guidelines require banks to maintain Tier 1 capital of no less than 4.0% of average total assets, except in the case of certain highly rated banks for which the requirement is 3.0% of average total assets. As of December 31, 2009, the ratio of Tier 1 capital to quarterly average total assets (leverage ratio) was 7.53% for FSB. For further discussion, see Note 10, Regulatory Matters, of the notes to consolidated financial statements included in Item 8 of this Annual Report on Form 10-K.
- 12 -
The various federal bank regulatory agencies have adopted substantially similar regulations that define for eachthe five capital category,categories identified by the levels at which institutions are “well-capitalized,” “adequately capitalized,” “undercapitalized,” “significantly undercapitalized” and “critically undercapitalized.” A “well-capitalized” bank has aFederal Deposit Insurance Corporation Improvement Act, using the total risk-based capital, ratioTier 1 risk-based capital and leverage capital ratios as the relevant capital measures. These regulations establish various degrees of 10.0% or higher;corrective action to be taken when an institution is considered undercapitalized. Under the regulations, a “well capitalized” institution must have a Tier 1 risk-based capital ratio of 6.0% or higher; a leverage ratio of 5.0% or higher; and is not subject to any written agreement, order or directive requiring it to maintain a specific capital level for any capital measure. An “adequately capitalized” bank hasat least 6%, a total risk-based capital ratio of 8.0%at least 10% and a leverage ratio of at least 5% and not be subject to a capital directive or higher;order. An institution is “adequately capitalized” if it has a Tier 1 risk-based capital ratio of 4.0% or higher;at least 4%, a total risk-based capital ratio of at least 8% and a leverage ratio of 4.0% or higher (3.0% or higher if the bank was rated a composite 1at least 4% (3% in its most recent examination report and is not experiencing significant growth); and does not meet the criteria for a well-capitalized bank. A bankcertain circumstances). An institution is “undercapitalized” if it fails to meet any onehas a Tier 1 risk-based capital ratio of the “adequately capitalized” ratios.
As of December 31, 2011, our subsidiary bank met the requirements to be classified as “well-capitalized”.
Dividends.The FRB policy is that a bank holding company should pay cash dividends only to the extent that its net income for the past year is sufficient to cover both the cash dividends and a rate of earnings retention that is consistent with the holding company’s capital needs, asset quality and overall financial condition, and that it is inappropriate for a bank holding company experiencing serious financial problems to borrow funds to pay dividends. Furthermore, a bank that is classified under the prompt corrective action regulations as “undercapitalized” will be prohibited from paying management feesany dividends.
In December 2008, under the Treasury’s Troubled Asset Relief Program (“TARP”) Capital Purchase Program, we entered into a Securities Purchase Agreement—Standard Terms with the Treasury pursuant to control persons ifwhich, among other things, we sold to the institution would be undercapitalized afterTreasury for an aggregate purchase price of $37.5 million, 7,503 shares of fixed rate cumulative perpetual preferred stock, Series A (“Series A” preferred stock) and a warrant to purchase up to 378,175 shares of our common stock, par value $0.01 per share, at an exercise price of $14.88 per share (the “Warrant”).
Pursuant to the terms of the Purchase Agreement, our ability to declare or pay dividends on any such distributionof our shares was limited. Specifically, we were prohibited from paying any dividend with respect to shares of common stock, other junior securities or payment.
We fully redeemed the Series A preferred stock during the first quarter of 2011 and repurchased the Warrant in the following quarter. The complete redemption of the Series A preferred stock removed the TARP restrictions pertaining to our ability to declare and pay dividends and repurchase our common stock, as well as certain restrictions associated with executive compensation.
Our primary source for cash dividends is the dividends we receive from our subsidiary bank. Our bank is subject to mandatedvarious regulatory policies and requirements relating to the payment of dividends, including requirements to maintain capital raising activities, restrictionsabove regulatory minimums. Approval of the New York State Department of Financial Services is required prior to paying a dividend if the dividend declared by the Bank exceeds the sum of the Bank’s net profits for that year and its retained net profits for the preceding two calendar years.
13
Federal Deposit Insurance Assessments.The Bank’s deposits are insured to the maximum extent permitted by the Deposit Insurance Fund (“DIF”). Upon enactment of the Emergency Economic Stabilization Act of 2008 on interest rates paidOctober 3, 2008, federal deposit insurance coverage levels under the DIF temporarily increased from $100,000 to $250,000 per deposit category, per depositor, per institution, through December 31, 2009. On May 20, 2009, the Helping Families Save Their Homes Act extended the temporary increase through December 31, 2013. The Dodd-Frank Act permanently increases the maximum amount of deposit insurance to $250,000 per deposit category, per depositor, per institution retroactive to January 1, 2008, and transactions with affiliates, removalnoninterest-bearing transaction accounts have unlimited deposit insurance through December 31, 2013.
As the insurer, the FDIC is authorized to conduct examinations of, management and other restrictions.to require reporting by, FDIC-insured institutions. The FDIC also may prohibit any FDIC-insured institution from engaging in any activity the FDIC determines by regulation or order to pose a serious threat to the DIF. The FDIC also has only very limited discretionthe authority to initiate enforcement actions against banks. Insurance of deposits may be terminated by the FDIC upon a finding that the institution has engaged or is engaging in dealingunsafe and unsound practices, is in an unsafe or unsound condition to continue operations or has violated any applicable law, regulation, rule, order or condition imposed by the FDIC or written agreement entered into with a critically undercapitalized institution and is virtually requiredthe FDIC. The management of the Bank does not know of any practice, condition or violation that might lead to appoint a receiver or conservator.
The FDIC maintains the DIF by assessing depository institutions an insurance premium on a quarterly basis.basis under a risk-based assessment system. The amount of the assessment is a function of the institution’s risk category, of which there are four, and assessment base. An institution’s risk category is determined according to its supervisory ratings and capital levels and is used to determine the institution’s assessment rate. The assessment rate for risk categories are calculated according to a formula, which relies on supervisory ratings and either certain financial ratios or long-term debt ratings. An insured bank’s assessment base is currently determined by the balanceits level of its insured deposits. Because the system is risk-based, it allows banks to pay lower assessments to the FDIC as their capital level and supervisory ratings improve. By the same token, if these indicators deteriorate, the institution will have to pay higher assessments to the FDIC.
Under the Federal Deposit Insurance Act, the FDIC Board has the authority to set the annual assessment rate range for the various risk categories within certain regulatory limits and to impose special assessments upon insured depository institutions when deemed necessary by the FDIC’s Board. As part of the Deposit Insurance Fund Restoration Plan adopted by the FDIC in October 2008, on February 27, 2009, the FDIC adopted the final rule modifying the risk-based assessment system, which set initial base assessment rates between 12 and 45 basis points, beginning April 1, 2009. The FDIC imposed an emergency special assessment on June 30, 2009, which totaled $923 thousand and was collected in September 2009.for our Bank. In addition, in September 2009, the FDIC extended the Restoration Plan period to eight years. OnIn November 12, 2009, the FDIC adopted a final rule requiring prepayment of 13 quarters of FDIC premiums. The Bank’s required prepayment amounted to $9.9 million and was collected in December 2009.
In October 2010, the FDIC adopted a Financing Corporation (“FICO”)new Restoration Plan for the DIF to ensure that the fund reserve ratio reaches 1.35% by September 30, 2020, as required by the Dodd-Frank Act. Under the Restoration Plan, the FDIC did not institute the uniform three-basis point increase in assessment in orderrates scheduled to fundtake place on January 1, 2011 and maintained the interest on bondscurrent schedule of assessment rates for all depository institutions. At least semi-annually, the FDIC will update its loss and income projections for the DIF and, if needed, will increase or decrease assessment rates, following notice-and-comment rulemaking, if required.
In November 2010, the FDIC issued ina notice of proposed rulemaking to change the 1980s in connection withdeposit insurance assessment base from total domestic deposits to average total assets minus average tangible equity, as required by the failures in the thrift industry. For the fourth quarter of 2009, the FICO assessment is equal to 1.06 basis points for each $100 in domestic deposits. These assessments will continue until the bonds mature in 2019.Dodd-Frank Act, effective April 1, 2011. The FDIC bills and collects thisalso issued a notice of proposed rulemaking to revise the deposit insurance assessment on behalf of FICO.
On February 9, 2011, the FDIC adopted a final rule which redefines the deposit insurance assessment base as required by the Dodd-Frank Act. The final rule sets the deposit insurance assessment base as average consolidated total assets minus average tangible equity. It also sets a new assessment rate schedule which reflects assessment rate adjustments including potentially reduced rates tied to unsecured debt and potentially increased rates for brokered deposits. The final rule became effective on April 1, 2011. Under the new rule, our FDIC insurance premiums decreased $994 thousand to $1.5 million in 2011 compared to $2.5 million in 2010.
Transactions with Affiliates.FII and FSB are affiliates within the meaning of the Federal Reserve Act. The Federal Reserve Act imposes limitations on a bank with respect to extensions of credit to, investments in, and certain other transactions with, its parent bank holding company and the FRB have broad enforcement powers, including the powerholding company’s other subsidiaries. Furthermore, bank loans and extensions of credit to terminate deposit insurance, impose substantial fines and other civil and criminal penalties and appoint a conservator or receiver. Failureaffiliates also are subject to comply with applicable laws, regulations and supervisory agreements could subject the Company or the Bank, as well as the officers, directors and other institution-affiliated parties of these organizations, to administrative sanctions and potentially substantial civil money penalties.
- 13 -
As of its last Community Reinvestment Act of 1989 requires federal banking agencies to make publicexamination, Five Star Bank received a rating of a bank’s performance under the CRA. In the case“outstanding.”
Interstate Banking and Branching.The FRB may approve an application of a bank holding company the CRA performance record of the banks involved in the transaction are reviewed in connection with the filing of an application to acquire ownership or control of, shares or acquire all or substantially all of the assets of, a bank located in a state other than the bank holding company’s home state, without regard to whether the transaction is prohibited by the laws of any state. The FRB may not approve the acquisition of a bank that has not been in existence for the minimum time period (not exceeding five years) specified by the law of the target bank’s home state. The FRB also may not approve an application if the bank holding company (and its bank affiliates) controls or would control more than ten percent of the insured deposits in the U.S. or, generally, 30% or more of the deposits in the target bank’s home state or in any state in which the target bank maintains a branch. Individual states may waive the 30% statewide concentration limit. Each state may limit the percentage of total insured deposits in the state that may be held or controlled by a bank or bank holding company to mergethe extent the limitation does not discriminate against out-of-state banks or bank holding companies.
The federal banking agencies are authorized to approve interstate bank merger transactions without regard to whether these transactions are prohibited by the law of any state, unless the home state of one of the banks opted out of interstate mergers prior to June 1, 1997. Interstate acquisitions of branches are permitted only if the law of the state in which the branch is located permits these acquisitions. Interstate mergers and branch acquisitions are subject to the nationwide and statewide-insured deposit concentration limits described above.
Privacy Rules.Federal banking regulators, as required under the Gramm-Leach-Bliley Act, have adopted rules limiting the ability of banks and other financial institutions to disclose nonpublic information about consumers to non-affiliated third parties. The rules require disclosure of privacy policies to consumers and, in some circumstances, allow consumers to prevent disclosure of certain personal information to non-affiliated third parties. The privacy provisions of the Gramm-Leach-Bliley Act affect how consumer information is transmitted through diversified financial services companies and conveyed to outside vendors.
International Money Laundering Abatement and Financial Anti-Terrorism Act of 2001.The President signed the USA Patriot Act of 2001 into law in October 2001. This act contains the International Money Laundering Abatement and Financial Anti-Terrorism Act of 2001 (the “IMLAFA”). The IMLAFA substantially broadens existing anti-money laundering legislation and the extraterritorial jurisdiction of the U.S., imposes new compliance and due diligence obligations, creates new crimes and penalties, compels the production of documents located both inside and outside the U.S., including those of foreign institutions that have a correspondent relationship in the U.S., and clarifies the safe harbor from civil liability to customers. The Treasury Department has issued a number of regulations implementing the USA Patriot Act that apply certain of its requirements to financial institutions such as our banking and broker-dealer subsidiaries. The regulations impose obligations on financial institutions to maintain appropriate policies, procedures and controls to detect, prevent and report money laundering and terrorist financing. The increased obligations of financial institutions, including us, to identify their customers, watch for and report suspicious transactions, respond to requests for information by regulatory authorities and law enforcement agencies, and share information with other financial institutions, requires the implementation and maintenance of internal procedures, practices and controls which have increased, and may continue to increase, our costs and may subject us to liability.
As noted above, enforcement and compliance-related activity by government agencies has increased. Money laundering and anti-terrorism compliance is among the areas receiving a high level of focus in the present environment.
15
Regulatory Reform.On July 21, 2010, the Dodd-Frank Act was signed into law. The Dodd-Frank Act (as amended) implements far-reaching changes across the financial regulatory landscape, including provisions that, among other things, has or will:
Centralized responsibility for consumer financial protection by creating a new agency, the Bureau of Consumer Financial Protection, with broad rulemaking, supervision and enforcement authority for a wide range of consumer protection laws that apply to all banks and certain others, including the examination and enforcement powers with respect to any bank with more than $10 billion in assets.
Require new capital rules and apply the same leverage and risk-based capital requirements that apply to insured depository institutions to most bank holding companies.
Changed the assessment base for federal deposit insurance from the amount of insured deposits to consolidated average assets less tangible capital. As a result, this change generally imposes more deposit insurance cost on institutions with assets of $10 billion or more.
Increase the minimum ratio of net worth to insured deposits of the Deposit Insurance Fund from 1.15% to 1.35% and require the FDIC, in setting assessments, to offset the effect of the increase on institutions with assets of less than $10 billion.
Provide for new disclosure and other requirements relating to executive compensation and corporate governance, including guidelines or regulations on incentive-based compensation and a prohibition on compensation arrangements that encourage inappropriate risks or that could provide excessive compensation.
Made permanent the $250 thousand limit for federal deposit insurance and provided unlimited federal deposit insurance until December 31, 2012 for non-interest bearing demand transaction accounts and IOLTA accounts at all insured depository institutions.
Repealed the federal prohibitions on the payment of interest on commercial demand deposits, thereby permitting depository institutions to pay interest on business transaction and other accounts.
Allow de novo interstate branching by banks.
Increased the authority of the FRB to examine us and our non-bank subsidiary.
Required all bank holding companies to serve as a source of financial strength to their depository institution subsidiaries in the event such subsidiaries suffer from financial distress.
| • | Restrict proprietary trading by banks, bank holding companies and others, and their acquisition and retention of ownership interests in and sponsorship of hedge funds and private equity funds. This restriction is commonly referred to as the “Volcker Rule.” There is an exception in the Volcker Rule to allow a bank to organize and offer hedge funds and private equity funds to customers if certain conditions are met. These conditions include, among others, requirements that the bank providesbona fideinvestment advisory services; the funds are organized only in connection with such services and to customers of such services; the bank does not have more than ade minimisinterest in the funds, limited to a 3% ownership interest in any single fund and an aggregated investment in all funds of 3% of Tier 1 capital; the bank does not guarantee the obligations or performance of the funds; and no director or employee of the bank has an ownership interest in the fund unless he or she provides services directly to the funds. The FRB issued proposed rules in November 2011. |
Many aspects of the Dodd-Frank Act are subject to rulemaking and will take effect over several years, making it difficult to anticipate the overall financial impact on us and the financial services industry more generally. Provisions in the legislation may require us to maintain higher capital levels and/or increase our cost of operations and limit certain activities or lines of business.
TARP-Related Compensation and Corporate Governance Requirements.The Emergency Economic Stabilization Act of 2008 (“EESA”) was signed into law on October 3, 2008 and authorized the Treasury to provide funds to be used to restore liquidity and stability to the U.S. financial system pursuant to the TARP. Under the authority of EESA, Treasury instituted the TARP Capital Purchase Program to encourage U.S. financial institutions to build capital to increase the flow of financing to U.S. businesses and consumers and to support the U.S. economy. As noted above, on December 23, 2008, we participated in this program by issuing 7,503 shares of our Series A preferred stock to the Treasury for a purchase price of $37.5 million in cash and issued the Warrant to the Treasury.
Participation in the TARP Capital Purchase Program included certain requirements and restrictions regarding payment of dividends and compensation that were expanded significantly by the American Recovery and Reinvestment Act of 2009 (“ARRA”), as implemented by the Treasury’s Interim Final Rule on TARP Standards for Compensation and Corporate Governance. Our redemption of the Series A preferred stock during the first quarter of 2011, as described under “Dividends”, effectively ended these requirements and restrictions.
16
Incentive Compensation.On April 14, 2011, the Federal Reserve issued a proposed regulation on incentive compensation policies (the “Incentive Compensation Proposal”) intended to ensure that the incentive compensation policies of banking organizations do not undermine the safety and soundness of such organizations by encouraging excessive risk-taking. The Incentive Compensation Proposal, which covers all employees that have the ability to materially affect the risk profile of an organization, either individually or as part of a group, is based upon the key principles that a banking organization’s incentive compensation arrangements should (i) provide incentives that do not encourage risk-taking beyond the organization’s ability to effectively identify and manage risks, (ii) be compatible with effective internal controls and risk management, and (iii) be supported by strong corporate governance, including active and effective oversight by the organization’s board of directors. Banking organizations were instructed to begin an immediate review of their incentive compensation policies to ensure that they do not encourage excessive risk-taking and implement corrective programs as needed. Where there are deficiencies in the incentive compensation arrangements, they must be immediately addressed.
Additionally, the Incentive Compensation Proposal will require the Federal Reserve to review, as part of the regular, risk-focused examination process, the incentive compensation arrangements of banking organizations, such as us, that are not “large, complex banking organizations.” These reviews will be tailored to each organization based on the scope and complexity of the organization’s activities and the prevalence of incentive compensation arrangements. The findings of the supervisory initiatives will be included in reports of examination. Deficiencies will be incorporated into the organization’s supervisory ratings, which can affect the organization’s ability to make acquisitions and take other actions. Enforcement actions may be taken against a banking organization if its incentive compensation arrangements, or related risk-management control or governance processes, pose a risk to the organization’s safety and soundness and the organization is not taking prompt and effective measures to correct the deficiencies.
The scope and content of the U.S. banking regulators’ policies on executive compensation are continuing to develop and are likely to continue evolving in the near future. It cannot be determined at this time whether compliance with such policies will adversely affect our ability to hire, retain and motivate our key employees.
Sarbanes-Oxley Act of 2002.The Sarbanes-Oxley Act of 2002 implemented a broad range of corporate governance, accounting and reporting measures for companies that have securities registered under the Exchange Act, including publicly-held bank holding companies such as Financial Institutions. Specifically, the Sarbanes-Oxley Act of 2002 and the various regulations promulgated thereunder, established, among other things: (i) requirements for audit committees, including independence, expertise, and responsibilities; (ii) responsibilities regarding financial statements for the Chief Executive Officer and Chief Financial Officer of the reporting company; (iii) the forfeiture of bonuses or other incentive-based compensation and profits from the sale of the reporting company’s securities by the Chief Executive Officer and Chief Financial Officer in the twelve-month period following the initial publication of any financial statements that later require restatement; (iv) the creation of an independent accounting oversight board; (v) standards for auditors and regulation of audits, including independence provisions that restrict non-audit services that accountants may provide to their audit clients; (vi) disclosure and reporting obligations for the reporting company and their directors and executive officers, including accelerated reporting of stock transactions and a prohibition on trading during pension blackout periods; (vii) a prohibition on personal loans to directors and officers, except certain loans made by insured financial institutions on non-preferential terms and in compliance with other bank holding company. An unsatisfactory record can substantially delay or blockregulatory requirements; and (viii) a range of civil and criminal penalties for fraud and other violations of the transaction. FSB received a rating of “outstanding” as of its most recent CRA performance evaluation.
Consumer Laws and Regulations.In addition to the laws and regulations discussed herein, the Bank is also subject to certain consumer laws and regulations that are designed to protect consumers in transactions with banks. While the list set forth herein is not exhaustive, these laws and regulations include, among others, the Truth in Lending Act, the Truth in Savings Act, the Electronic Funds Transfer Act, the Expedited Funds Availability Act, the Equal Credit Opportunity Act, the Fair Housing Act, the Home Mortgage Disclosure Act and the Real Estate Settlement Procedures Act. These laws and regulations mandate certain disclosure requirements and regulate the manner in which financial institutions must deal with customers when taking deposits or making loans to such customers. The Bank must comply with the applicable provisions of these consumer protection laws and regulations as part of theirits ongoing customer relations. The Check Clearing for the 21st Century Act (“Check(the “Check 21 Act” or “the Act”), which became effective on October 28, 2004, creates a new negotiable instrument, called a “substitute check”, which banks are required to accept as the legal equivalent of a paper check if it meets the requirements of the Check 21 Act. The Check 21 Act is designed to facilitate check truncation, to foster innovation in the check payment system, and to improve the payment system by shortening processing times and reducing the volume of paper checks.
- 14 -
- 15 -
our business.
- 16 -
Our financial statements included herein have been prepared in accordance with GAAP, which requires the Companyus to measure financial position and operating results principally using historic dollars. Changes in the relative value of money due to inflation or recession are generally not considered. The primary effect of inflation on theour operations of the Company is reflected in increased operating costs. In the Company’sour view, changes in interest rates affect the financial condition of a financial institution to a far greater degree than changes in the inflation rate. While interest rates are generally influenced by changes in the inflation rate, they do not necessarily change at the same rate or in the same magnitude. Interest rates are sensitive to many factors that are beyond theour control, of the Company, including changes in the expected rate of inflation, general and local economic conditions and the monetary and fiscal policies of the United States government, its agencies and various other governmental regulatory authorities.
- 17 -
Our business and earnings are affected by general and local economic conditions and by the monetary and fiscal policies of the U.S. government, its agencies and various other governmental regulatory authorities. The FRB regulates the supply of money in order to influence general economic conditions. Among the instruments of monetary policy available to the FRB are (i) conducting open market operations in U.S. government obligations, (ii) changing the discount rate on financial institution borrowings, (iii) imposing or changing reserve requirements against financial institution deposits, and (iv) restricting certain borrowings and imposing or changing reserve requirements against certain borrowings by financial institutions and their affiliates. These methods are used in varying degrees and combinations to directly affect the availability of bank loans and deposits, as well as the interest rates charged on loans and paid on deposits. For that reason, the policies of the FRB could have a material effect on the earnings of the Company.
EMPLOYEES
At December 31, 2009, the Company2011, we had 513 full-time and 107 part-time613 employees. None of the employees are subject to a collective bargaining agreement and management believes its relations with employees are good.
18
EXECUTIVE OFFICERS OF REGISTRANT
The following table sets forth current information regarding the Company’sour executive officers and certain other significant employees (ages are as of May 9, 2012, the 2010date of the 2012 Annual Meeting)Meeting of Shareholders).
| Starting | ||||||||||
| Name | Age | In | Positions/Offices | |||||||
| Peter G. Humphrey | 55 | 1977 | President and Chief Executive Officer of FII and Five Star Bank. | |||||||
| Karl F. Krebs | 54 | 2009 | Executive Vice President and Chief Financial Officer of FII and Five Star Bank. Senior Financial Specialist at West Valley Environmental Services, LLC prior to joining FII in 2009. President of Robar General Funding Corp. from 2006 to 2008. Senior Vice President and Line-of-Business Finance Director at Five Star Bank from 2005 to 2006 and Senior Vice President at Wyoming County Bank from 2004 to 2005. | |||||||
| Martin K. Birmingham | 43 | 2005 | Executive Vice President and Regional President / Commercial Banking Executive Officer of Five Star Bank. Senior Team Leader and Regional President of the Rochester Market at Bank of America (formally Fleet Boston Financial) from 2000 to 2005. | |||||||
| George D. Hagi | 57 | 2006 | Executive Vice President and Chief Risk Officer of FII and Five Star Bank. Senior Vice President and Director of Risk Management at First National Bankshares of Florida and FNB Corp. from 1997 to 2005. | |||||||
| Richard J. Harrison | 64 | 2003 | Executive Vice President and Senior Retail Lending Administrator of Five Star Bank. Executive Vice President and Chief Credit Officer at Savings Bank of the Finger Lakes from 2000 to 2003. | |||||||
| Kevin B. Klotzbach | 57 | 2001 | Senior Vice President and Treasurer of Five Star Bank. | |||||||
| R. Mitchell McLaughlin | 52 | 1981 | Executive Vice President and Chief Information Officer of Five Star Bank. | |||||||
| Matthew T. Murtha | 55 | 2000 | Senior Vice President and Director of Sales and Marketing of Five Star Bank. | |||||||
| Bruce H. Nagle | 61 | 2006 | Senior Vice President and Director of Human Resources of FII and Five Star Bank. Vice President of Human Resources at University of Pittsburgh Medical Center from 2000 to 2006. | |||||||
| John L. Rizzo | 60 | 2010 | Senior Vice President and Corporate Secretary of FII and Five Star Bank. Counsel (in-house) for FII and Five Star Bank from 2007 to 2010. Genesee County (New York) Attorney from 1976 to 2010. | |||||||
| John J. Witkowski | 47 | 2005 | Executive Vice President and Regional President / Retail Banking Executive Officer of Five Star Bank. Senior Vice President and Director of Sales for Business Banking / Client Development Group at Bank of America from 1993 to 2005. | |||||||
Name | Age | Started In | Positions/Offices | |||||||
Peter G. Humphrey | 57 | 1977 | President and Chief Executive Officer of the Company and the Bank since 1994. | |||||||
Karl F. Krebs | 56 | 2009 | Executive Vice President and Chief Financial Officer of the Company and the Bank since 2009. Senior Financial Specialist at West Valley Environmental Services, LLC, prior to joining FII in 2009. President of Robar General Funding Corp., a mortgage and construction loan broker, from 2006 to 2008. Senior Vice President and Line-of-Business Finance Director at Five Star Bank from 2005 to 2006 and Senior Vice President at Wyoming County Bank from 2004 to 2005. | |||||||
Rita M. Bartol | 51 | 2010 | Senior Vice President and Director of Human Resources of the Company and the Bank since late 2010. Senior Vice President and Director of Human Resources at Cardinal Financial Corporation, a financial holding company, in 2010 and Vice President and Director of Human Resources at Union Bankshares Corporation from 2006 to 2010. Vice President and Human Resources and Organizational Development Manager at M & T Bank Corporation from 1998 to 2005. | |||||||
Martin K. Birmingham | 45 | 2005 | Executive Vice President and Regional President / Commercial Banking Executive Officer of the Bank since 2009. Senior Vice President and Regional President of the Bank since 2005. Senior Team Leader and Regional President of the Rochester Market at Bank of America (formally Fleet Boston Financial) from 2000 to 2005. | |||||||
George D. Hagi | 59 | 2006 | Executive Vice President and Chief Risk Officer of the Company and the Bank since 2006. Senior Vice President and Director of Risk Management at First National Bankshares of Florida and FNB Corp. from 1997 to 2005. | |||||||
Richard J. Harrison | 66 | 2003 | Executive Vice President and Senior Retail Lending Administrator of the Bank since 2009. Senior Vice President and Senior Retail Lending Administrator of the Bank since 2003. Executive Vice President and Chief Credit Officer at Savings Bank of the Finger Lakes from 2001 to 2003. | |||||||
Kevin B. Klotzbach | 59 | 2001 | Senior Vice President and Treasurer of the Bank since 2001. | |||||||
R. Mitchell McLaughlin | 54 | 1981 | Executive Vice President and Chief Information Officer of the Bank since 2009. Senior Vice President and Chief Information Officer of the Bank since 2006. | |||||||
John L. Rizzo | 62 | 2010 | Senior Vice President and Corporate Secretary of the Company and the Bank since 2010. General counsel for the Company and the Bank since 2007. Genesee County (New York) Attorney from 1976 to 2010. | |||||||
- 18 -
| ITEM 1A. | RISK FACTORS |
If any of the Company.
CREDIT RISKS
If we experience greater credit losses than anticipated, earnings may be adversely impacted.
As a lender, we are exposed to the risk that customers will be unable to repay their loans according to their terms and that any collateral securing the payment of their loans may not be sufficient to assure repayment. Credit losses are inherent in the business of making loans and could have a material adverse impact on our results of operations.
We make various assumptions and judgments about the collectability of our loan portfolio, including the creditworthiness of our borrowers and the value of the real estate and other assets serving as collateral, and we provide an allowance for estimated loan losses based on a number of factors. We believe that the allowance for loan losses is adequate. However, if our assumptions or judgments are wrong, the allowance for loan losses may not be sufficient to cover the actual credit losses. We may have to increase the allowance in the future in response to the request of one of our primary banking regulators, to adjust for changing conditions and assumptions, or as a result of any deterioration in the quality of our loan portfolio. The Company’sactual amount of future provisions for credit losses may vary from the amount of past provisions.
Geographic concentration may unfavorably impact our operations.
Substantially all of our business and operations are concentrated in the Western and Central New York region. As a result of this geographic concentration, our results depend largely on economic conditions in these and surrounding areas. Deterioration in economic conditions in our market could:
increase loan delinquencies;
increase problem assets and foreclosures;
increase claims and lawsuits;
decrease the demand for our products and services; and
decrease the value of collateral for loans, especially real estate, in turn reducing customers’ borrowing power, the value of assets associated with non-performing loans and collateral coverage.
Generally, we make loans to small to mid-sized businesses whose success depends on the regional economy. These businesses generally have fewer financial resources in terms of capital or borrowing capacity than larger entities. Adverse economic and business conditions in our market areas could reduce our growth rate, affect our borrowers’ ability to repay their loans and, consequently, adversely affect our business, financial condition and performance. For example, we place substantial reliance on real estate as collateral for our loan portfolio. A sharp downturn in real estate values in our market area could leave many of these loans inadequately collateralized. If we are required to liquidate the collateral securing a loan to satisfy the debt during a period of reduced real estate values, the impact on our results of operations could be materially adverse.
We depend on the accuracy and completeness of information about or from customers and counterparties.
In deciding whether to extend credit or enter into other transactions, we may rely on information furnished by or on behalf of customers and counterparties, including financial statements, credit reports, and other financial information. We may also rely on representations of those customers, counterparties, or other third parties, such as independent auditors, as to the accuracy and completeness of that information. Reliance on inaccurate or misleading financial statements, credit reports, or other financial information could cause us to enter into unfavorable transactions, which could have a material adverse effect on our financial condition and results of operations.
20
We are subject to environmental liability risk associated with our lending activities.
A significant portion of our loan portfolio is secured by real property. During the ordinary course of business, we may foreclose on and take title to properties securing certain loans. In doing so, there is a risk that hazardous or toxic substances could be found on these properties. If hazardous or toxic substances are found, we may be liable for remediation costs, as well as for personal injury and property damage. Environmental laws may require us to incur substantial expenses and may materially reduce the affected property’s value or limit our ability to use or sell the affected property. In addition, future laws or more stringent interpretations or enforcement policies with respect to existing laws may increase our exposure to environmental liability. Although we have policies and procedures to perform an environmental review before initiating any foreclosure action on real property, these reviews may not be sufficient to detect all potential environmental hazards. The remediation costs and any other financial liabilities associated with an environmental hazard could have a material adverse effect on our financial condition and results of operations.
REGULATORY/LEGAL/COMPLIANCE RISKS
We are highly regulated and may be adversely affected by changes in banking laws, regulations and regulatory practices.
We are subject to extensive supervision, regulation and examination. This regulatory structure gives the regulatory authorities extensive discretion in connection with their supervisory and enforcement activities and examination policies to address not only compliance with applicable laws and regulations (including laws and regulations governing consumer credit, and anti-money laundering and anti-terrorism laws), but also capital adequacy, asset quality and risk, management ability and performance, earnings, liquidity, and various other factors. As part of this regulatory structure, we are subject to policies and other guidance developed by the regulatory agencies with respect to capital levels, the timing and amount of dividend payments, the classification of assets and the establishment of adequate loan loss reserves for regulatory purposes. Under this structure the regulatory agencies have broad discretion to impose restrictions and limitations on our operations if they determine, among other things, that our operations are unsafe or unsound, fail to comply with applicable law or are otherwise inconsistent with laws and regulations or with the supervisory policies of these agencies.
This supervisory framework could materially impact the conduct, growth and profitability of our operations. Any failure on our part to comply with current laws, regulations, other regulatory requirements or safe and sound banking practices or concerns about our financial condition, or any related regulatory sanctions or adverse actions against us, could increase our costs or restrict our ability to expand our business and result in damage to our reputation.
Ongoing financial reform legislation may result in new regulations that could require us to maintain higher capital levels and/or increase our costs of operations or limit certain activities or lines of business.
On July 21, 2010, President Obama signed the Dodd-Frank Act into law. This new law has significantly changed the current bank regulatory structure and affects the lending, deposit, investment, trading and operating activities of financial institutions and their holding companies. The Dodd-Frank Act requires various federal agencies to adopt a broad range of new implementing rules and regulations, and to prepare numerous studies and reports for Congress. The federal agencies are given significant discretion in drafting the implementing rules and regulations, and consequently, many of the details and much of the rulemaking of the Dodd-Frank Act will not be known for many months or years, making it difficult to anticipate the overall financial impact on us. However, compliance with this new law and its implementing regulations are expected to result in additional operating costs that could have a material adverse effect on our financial condition and results of operations.
New or changing tax, accounting, and regulatory rules and interpretations could significantly impact our strategic initiatives, results of operations, cash flows, and financial condition.
The financial services industry is extensively regulated. Federal and state banking regulations are designed primarily to protect the deposit insurance funds and consumers, not to benefit a company’s stockholders. These regulations may sometimes impose significant limitations on operations. The significant federal and state banking regulations that affect us are described in the section captioned “Supervision and Regulation” included in Part I, Item 1, “Business”. These regulations, along with the currently existing tax, accounting, securities, insurance, and monetary laws, regulations, rules, standards, policies, and interpretations control the methods by which financial institutions conduct business, implement strategic initiatives and tax compliance, and govern financial reporting and disclosures. These laws, regulations, rules, standards, policies, and interpretations are constantly evolving and may change significantly over time.
21
Changes in New York State banking regulations or other laws could adversely affect us.
As of October 3, 2011 the NYS Banking Department and the NYS Insurance Department merged into a single Department of Financial Services, or DFS. Beginning April 1, 2012, the Superintendent of the DFS may assess expenses in such proportion as he or she deems just and reasonable against banks and insurers. The DFS is authorized to create a special account called the “consumer protection account,” which will consist of fees and penalties received by the department of state and DFS, as well as other monies received in the form of penalties. These monies will be available to the DFS to pay for costs related to its consumer and investor protection activities. If the consumer protection account is insufficient to cover those costs, the balance would be recoverable through assessments against the industry.
The bill makes New York’s “wild card” authority (that was set to expire September 10, 2011) permanent. Under this authority, the Banking Board has the power to grant to New York chartered banking organizations, as well as licensed foreign bank branches and agencies, powers possessed by a counterpart federally-chartered banking institution.
In recent years, credit unions and savings institutions have lobbied in the State of New York to allow local government entities such as cities, towns, counties, public schools, fire districts and public libraries the option of depositing public funds in local credit unions or community savings institutions, a line of business currently serviced primarily by commercial banks, including our Bank.
These changes or the possibility of these changes could adversely affect us.
OPERATIONAL RISKS
If our security systems, or those of merchants, merchant acquirers or other third parties containing information about customers, are compromised, we may be subject to liability and damage to our reputation.
As part of our business, we collect, process and retain sensitive and confidential client and customer information on our behalf and on behalf of other third parties. Customer data also may be stored on systems of third-party service providers and merchants that may have inadequate security systems. Third-party carriers regularly transport customer data, and may lose sensitive customer information. Unauthorized access to our networks or any of our other information systems potentially could jeopardize the security of confidential information stored in our computer systems or transmitted by our customers or others. If our security systems or those of merchants, processors or other third-party service providers are compromised such that this confidential information is disclosed to unauthorized parties, we may be subject to liability. For example, in the event of a security breach, we may incur losses related to fraudulent use of debit cards issued by us as well as the operational costs associated with reissuing cards. Although we take preventive measures to address these factors, such measures are costly and may become more costly in the future. Moreover, these measures may not protect us from liability, which may not be adequately covered by insurance, or from damage to our reputation.
We could be subject to losses if we fail to properly safeguard sensitive and confidential information.
As part of our normal operations, we maintain and transmit confidential information about our clients as well as proprietary information relating to our business operations. We maintain a system of internal controls designed to provide reasonable assurance that fraudulent activity, including misappropriation of assets, fraudulent financial reporting, and unauthorized access to sensitive or confidential data is either prevented or timely detected. Our systems or our third-party service providers’ systems could be victimized by unauthorized users or corrupted by computer viruses or other malicious software code, or authorized persons could inadvertently or intentionally release confidential or proprietary information. Such disclosure could, among other things:
seriously damage our reputation,
allow competitors access to our proprietary business information,
subject us to liability for a failure to safeguard client data,
result in the loss of our existing customers,
subject us to regulatory action, and
require significant capital and operating expenditures to investigate and remediate the breach.
22
Our information systems may experience an interruption or breach in security.
We rely heavily on communications and information systems to conduct our business. Any failure, interruption or breach in security of these systems could result in failures or disruptions in our customer relationship management, general ledger, deposit, loan and other systems. While we have policies and procedures designed to prevent or limit the effect of the failure, interruption or security breach of our information systems, there can be no assurance that any such failures, interruptions or security breaches will not occur or, if they do occur, that they will be adequately addressed. The occurrence of any failures, interruptions or security breaches of our information systems could damage our reputation, result in a loss of customer business, subject us to additional regulatory scrutiny, or expose us to civil litigation and possible financial liability, any of which could have a material adverse effect on our financial condition and results of operations.
We rely on other companies to provide key components of our business infrastructure.
Third party vendors provide key components of our business infrastructure such as internet connections, network access and core application processing. While we have selected these third party vendors carefully, we do not control their actions. Any problems caused by these third parties, including as a result of their not providing us their services for any reason or their performing their services poorly, could adversely affect our ability to deliver products and services to our customers or otherwise conduct our business efficiently and effectively. Replacing these third party vendors could also entail significant delay and expense.
We may not be able to attract and retain skilled people.
Our success depends, in large part, on our ability to attract and retain skilled people. Competition for the best people in most activities engaged in by us can be intense, and we may not be able to hire sufficiently skilled people or to retain them. Further, the rural location of our principal executive offices and many of our bank branches make it difficult for us to attract skilled people to such locations. The unexpected loss of services of one or more of our key personnel could have a material adverse impact on our business because of their skills, knowledge of our markets, years of industry experience, and the difficulty of promptly finding qualified replacement personnel.
The potential for business interruption exists throughout our organization.
Integral to our performance is the continued efficacy of our technical systems, operational infrastructure, relationships with third parties and the vast array of associates and key executives in our day-to-day and ongoing operations. Failure by any or all of these resources subjects us to risks that may vary in size, scale and scope. This includes, but is not limited to, operational or technical failures, ineffectiveness or exposure due to interruption in third party support as expected, as well as the loss of key individuals or failure on the part of key individuals to perform properly. Although management has established policies and procedures, including implementation and testing of a comprehensive contingency plan, to address such failures, the occurrence of any such event could have a material adverse effect on our business, which, in turn, could have a material adverse effect on our financial condition and results of operations.
Our expansion efforts, particularly through new and acquired branches, may not be successful if we fail to manage our growth effectively.
A key component of our strategy to grow and improve profitability is to expand our branch network into communities within or adjacent to markets where we currently conduct business. We intend to continue to pursue a growth strategy for our business. Operating branches outside of our current market areas may subject us to additional risk, including the local risks related to the new market areas, management of employees from a distance, additional credit risks, logistical operational issues and management time constraints.
We regularly evaluate potential acquisitions and expansion opportunities, and, if appropriate opportunities present themselves, we expect to engage in selected acquisitions of financial institutions in the future, branch acquisitions, or other business growth initiatives or undertakings. There can be no assurance that we will successfully identify appropriate opportunities, that we will be able to negotiate or finance such activities or that such activities, if undertaken, will be successful. While we believe we have the executive management resources and internal systems in place to successfully manage our future growth, we can provide no assurance that we will be able to manage the costs and implementation risks associated with this strategy so that expansion of our branch network will be profitable.
We may fail to realize any benefits and may incur unanticipated losses related to the assets we acquire and liabilities we assume from current or future acquisitions.
On January 19, 2012, Five Star Bank entered into an agreement to acquire four retail banking branches currently owned by HSBC Bank USA, N.A. and four retail banking branches currently owned by First Niagara Bank, N.A. The transactions are subject to customary closing conditions, including regulatory approvals, and are expected to close by the end of the third quarter of 2012.
23
The success of this acquisition and future acquisitions will depend, in part, on our ability to successfully combine the businesses and assets we acquired with our business, and our ability to successfully manage the loan portfolios that were acquired. As with any acquisition involving a financial institution, there may also be business and service changes and disruptions that result in the loss of customers or cause customers to close their accounts and move their business to competing financial institutions. It is possible that the integration process could result in the loss of key employees, the disruption of ongoing business, or inconsistencies in standards, controls, procedures and policies that adversely affect our ability to maintain relationships with clients, customers, depositors and employees, or to achieve the anticipated benefits of the transactions. The loss of some of our key employees or those of the branches being acquired could adversely affect our ability to successfully conduct business in the markets in which those branches operated, which could adversely affect our financial results. Integration efforts will also divert attention and resources from our management. In addition, general market and economic conditions or governmental actions affecting the financial industry generally may inhibit our ability to successfully integrate these operations. If we experience difficulties with the integration process, the anticipated benefits of the transactions may not be realized fully, or at all, or may take longer to realize than expected. Finally, any cost savings that are realized may be offset by losses in revenues or other charges to earnings.
EXTERNAL RISKS
We are subject to interest rate risk.
Our earnings and cash flows are largely dependent upon our net interest income. Interest rates are highly sensitive to many factors that are beyond our control, including general economic conditions and policies of various governmental and regulatory agencies and, in particular, the Federal Reserve. Changes in monetary policy, including changes in interest rates, could influence not only the interest we receive on loans and investments and the amount of interest we pay on deposits and borrowings, but such changes could also affect (i) our ability to originate loans and obtain deposits; (ii) the fair value of our financial assets and liabilities; and (iii) the average duration of our mortgage-backed securities portfolio and other interest-earning assets. If the interest rates paid on deposits and other borrowings increase at a faster rate than the interest rates received on loans and other investments, our net interest income, and therefore earnings, could be adversely affected. Earnings could also be adversely affected if the interest rates received on loans and other investments fall more quickly than the interest rates paid on deposits and other borrowings.
Although management believes it has implemented effective asset and liability management strategies to reduce the potential effects of changes in interest rates on our results of operations, any substantial, unexpected or prolonged change in market interest rates could have a material adverse effect on our financial condition and results of operations. Also, our interest rate risk modeling techniques and assumptions likely may not fully predict or capture the impact of actual interest rate changes on our balance sheet.
Our business may be adversely impactedaffected by adverse conditions in the financial markets and economic conditions generally.
From December 2007 through June 2009, the markets have produced downward pressure on stock prices and credit availability for certain issuers without regard to those issuers’ underlying financial strength. As a consequence of the recession that the United States now finds itselfU.S. economy was in businessrecession. Business activity across a wide range of industries faceand regions in the U.S. was greatly reduced. Although economic conditions have begun to improve, certain sectors, such as real estate, remain weak and unemployment remains high. Local governments and many businesses are still in serious difficultiesdifficulty due to the lack oflower consumer spending and reduced tax collections.
Market conditions also led to the extreme lackfailure or merger of liquidity inseveral prominent financial institutions and numerous regional and community-based financial institutions. These failures, as well as projected future failures, have had a significant negative impact on the global credit markets. Unemployment has also increased significantly.
Our financial performance generally, and in particular the ability of borrowers to pay interest on and repay principal of outstanding loans and the Company’s business, financial condition and resultsvalue of operations:
Overall, during 2010 and 2011, the business environment has been adverse for many households and businesses in the number of clientsUnited States and counterparties who become delinquent, file for protection under bankruptcy laws or default on their loans or other obligations to the Company. An increaseworldwide. While economic conditions in the number of delinquencies, bankruptcies or defaultsNew York, the United States and worldwide have begun to improve, there can be no assurance that this improvement will continue. Such conditions could result in a higher level of non-performing assets, net charge-offs, provision for loan losses, and valuation adjustments on loans held for sale.
- 19 -
Our earnings are significantly affected by the recent budgetary crisisfiscal and monetary policies of the federal government and its agencies.
The policies of the Federal Reserve impact us significantly. The Federal Reserve regulates the supply of money and credit in the United States. Its policies directly and indirectly influence the rate of interest earned on loans and paid on borrowings and interest-bearing deposits and can also affect the value of financial instruments we hold. Those policies determine to a possible ratings downgradesignificant extent our cost of funds for lending and investing. Changes in those policies are beyond our control and are difficult to predict. Federal Reserve policies can also affect our borrowers, potentially increasing the risk that they may fail to repay their loans. For example, a tightening of the money supply by the Federal Reserve could reduce the demand for a borrower’s products and services. This could adversely affect the value of New York’s obligations, which could result in a material adverse impact on the Company’s business, financial condition, results of operations or liquidity.
operations.
- 20 -
Financial services institutions are interrelated as a result of trading, clearing, counterparty, or other relationships. We have exposure to many different industries and counterparties, and we routinely execute transactions with counterparties in the market pricefinancial services industry, including commercial banks, brokers and dealers, investment banks, and other institutional clients. Many of these transactions expose us to credit risk in the event of a default by our counterparty or client. In addition, our credit risk may be exacerbated when the collateral held by us cannot be realized or is liquidated at prices not sufficient to recover the full amount of the Company’s common stock. The current restrictions, as well as any possible future restrictions, associated with participation in the CPPcredit or derivative exposure due us. Any such losses could have a material adverse impacteffect on the Company’s business, financial condition, results of operations.
operations.
- 21 -
- 22 -
Our goodwill is evaluated for impairment on an annual basis or when triggering events or circumstances indicate impairment may exist. Significant and sustained declines in the Company’sour stock price and market capitalization, significant declines in the Company’sour expected future cash flows, significant adverse changes in the business climate or slower growth rates could result in impairment of goodwill. At December 31, 2011, we had goodwill of $37.4 million, representing approximately 16% of shareholders’ equity. If impairment of goodwill was determined to exist, the Companywe would be required to write down itsour goodwill as a charge to earnings, which could have a material adverse impact on the Company’sour results of operations or financial condition. For further discussion, see Note 1, Summary of Significant Accounting Policies, and Note 6, Goodwill and Other Intangible Assets, to the Consolidated Financial Statements included in Item 8 of this Annual Report on Form 10-K.
25
We operate in interest ratesa highly competitive industry and market area.
We face substantial competition in all areas of our operations from a variety of different competitors, many of which are larger and may have more financial resources. Such competitors primarily include national, regional and internet banks within the various markets in which we operate. We also face competition from many other types of financial institutions, including, without limitation, savings and loan associations, credit unions, finance companies, brokerage firms, insurance companies and other financial intermediaries. The financial services industry could become even more competitive as a result of legislative, regulatory and technological changes and continued consolidation. Banks, securities firms and insurance companies can merge under the umbrella of a financial holding company, which can offer virtually any type of financial service, including banking, securities underwriting, insurance (both agency and underwriting), and merchant banking. Also, technology has lowered barriers to entry and made it possible for nonbanks to offer products and services traditionally provided by banks, such as automatic transfer and automatic payment systems. Many of our competitors have fewer regulatory constraints and may have lower cost structures. Additionally, due to their size, many competitors may be able to achieve economies of scale and, as a result, may offer a broader range of products and services as well as better pricing for those products and services than we can.
Our ability to compete successfully depends on a number of factors, including, among other things:
the ability to develop, maintain and build upon long-term customer relationships based on top quality service, high ethical standards and safe, sound assets;
the ability to expand our market position;
the scope, relevance and pricing of products and services offered to meet customer needs and demands;
the rate at which we introduce new products and services relative to our competitors;
customer satisfaction with our level of service; and
industry and general economic trends.
Failure to perform in any of these areas could significantly weaken our competitive position, which could adversely impact the Company’saffect our growth and profitability, which, in turn, could have a material adverse effect on our financial condition and results of operationsoperations.
LIQUIDITY RISKS
Liquidity is essential to our businesses.
Our liquidity could be impaired by an inability to access the capital markets or unforeseen outflows of cash. This situation may arise due to circumstances that we may be unable to control, such as a general market disruption or an operational problem that affects third parties or us. Our efforts to monitor and financial condition.
We may need to raise additional capital in the future and borrowings. This relationship, knownsuch capital may not be available on acceptable terms or at all.
We may need to raise additional capital in the future to provide sufficient capital resources and liquidity to meet our commitments and business needs. Our ability to raise additional capital, if needed, will depend on, among other things, conditions in the capital markets at that time, which are outside of our control, and our financial performance.
In addition, we are highly regulated, and our regulators could require us to raise additional common equity in the future. We and our regulators perform a variety of analyses of our assets, including the preparation of stress case scenarios, and as the interest rate spread, is subjecta result of those assessments we could determine, or our regulators could require us, to fluctuation and is affected by economic and competitive factors which influence interest rates, the volume and mix of interest-earning assets and interest-bearing liabilities and the level of non-performing assets. Fluctuations in interest rates affect the demand of customers for the Company’s products and services. The Bank is subject to interest rate riskraise additional capital.
We cannot assure that such capital will be available on acceptable terms or at all. Any occurrence that may limit our access to the degree that interest-bearing liabilities re-pricecapital markets, such as a decline in the confidence of debt purchasers, depositors of the Bank or mature more slowlycounterparties participating in the capital markets, or more rapidly ora downgrade of our debt rating, may adversely affect our capital costs and ability to raise capital and, in turn, our liquidity. An inability to raise additional capital on a different basis than interest-earning assets. Significant fluctuations in interest ratesacceptable terms when needed could have a material adverse impact on the Company’sour business, financial condition, results of operations or liquidity. For additional information regarding
We rely on dividends from our subsidiaries for most of our revenue.
We are a separate and distinct legal entity from our subsidiaries. A substantial portion of our revenue comes from dividends from our Bank subsidiary. These dividends are the principal source of funds we use to pay dividends on our common and preferred stock, and to pay interest rate risk, see Part II, Item 7A, “Quantitative and Qualitative Disclosures About Market Risk”principal on our debt. Various federal and/or state laws and regulations limit the amount of this Annual Report on Form 10-K.
- 23 -
- 24 -
RISKS RELATED TO AN INVESTMENT IN OUR COMMON STOCK
The market price for our common stock varies, and you should purchase common stock for long-term investment only.
We may issue debt and equity securities or securities convertible into equity securities, any of which may be senior to our common stock as to distributions and in liquidation, which could negatively affect the value of our common stock.
In the future, we may attempt to increase our capital resources by entering into debt or debt-like financing that is unsecured or secured by all or up to all of our assets, or by issuing additional debt or equity securities, which could include issuances of secured or unsecured commercial paper, medium-term notes, senior notes, subordinated notes, preferred stock or securities convertible into or exchangeable for equity securities. In the event of our liquidation, our lenders and holders of our debt and preferred securities would receive a distribution of our available assets before distributions to the holders of our common stock. Because our decision to incur debt and issue securities in our future offerings will depend on market conditions and other factors beyond our control, we cannot predict or estimate the amount, timing or nature of our future offerings and debt financings. Further, market conditions could require us to accept less favorable terms for the issuance of our securities in the future.
We may not pay dividends on our common stock.
Holders of our common stock are only entitled to receive such dividends as our Board of Directors may declare out of funds legally available for such payments. Although we have historically declared cash dividends on our common stock, we are not required to do so and may reduce or eliminate our common stock dividend in the future. This could adversely affect the market price of our common stock.
Our certificate of incorporation, our bylaws, and certain banking laws may have an anti-takeover effect.
Provisions of our certificate of incorporation, our bylaws, and federal and state banking laws, including regulatory approval requirements, could make it more difficult for a third party to acquire us, even if doing so would be perceived to be beneficial to our shareholders. The Company believescombination of these provisions may discourage others from initiating a potential merger, takeover or other change of control transaction, which, in turn, could adversely affect the market price of our common stock.
27
| ITEM��1B. | UNRESOLVED STAFF COMMENTS |
None.
| ITEM 2. | PROPERTIES |
We own a 27,400 square foot building in Warsaw, New York that itsserves as our headquarters, and principal executive and administrative offices. Additionally, we are obligated under a lease commitment through 2017 for a 17,750 square foot regional administrative facility in Pittsford, New York.
We are engaged in the banking business through 50 branch offices, of which 33 are owned and 17 are leased, in fourteen contiguous counties of Western and Central New York: Allegany, Cattaraugus, Cayuga, Chautauqua, Chemung, Erie, Genesee, Livingston, Monroe, Ontario, Seneca, Steuben, Wyoming and Yates Counties. The operating leases for our branch offices expire at various dates through the year 2036 and generally include options to renew.
We believe that our properties have been adequately maintained, are in good operating condition and are suitable for itsour business as presently conducted. The Company conducts banking operations atconducted, including meeting the following locations.
- 25 -
| ITEM 4. | MINE SAFETY DISCLOSURES |
Not applicable.
- 26 -
| ITEM 5. | MARKET FOR REGISTRANT’S COMMON EQUITY, RELATED SHAREHOLDER MATTERS AND ISSUER PURCHASES OF EQUITY SECURITIES |
Our common stock is traded on the NASDAQ Global Select Market under the ticker symbol “FISI.” At December 31, 2009, 10,820,2682011, 13,803,116 shares of the Company’sour common stock were outstanding and held by approximately 1,1001,400 shareholders of record. During 2009,2011, the high sales price of our common stock was $15.99$20.36 and the low sales price was $3.27.$12.18. The closing price per share of common stock on December 31, 2009,2011, the last trading day of the Company’sour fiscal year, was $11.78. The Company$16.14. We declared dividends of $0.40$0.47 per common share during the year ended December 31, 2009.2011. See additional information regarding the market price and dividends paid filed herewith in Part II, Item 6, “Selected Financial Data.”
We have paid regular quarterly cash dividends on itsour common stock and itsour Board of Directors presently intends to continue this practice, subject to our results of operations and the need for those funds for debt service and other purposes. However, the payment of dividends by the Company is subject to continued compliance with minimum regulatory capital requirements and CPP restrictions. See the discussions in the section captioned “Supervision and Regulation” included in Part I, Item 1, “Business”, in the section captioned “Liquidity and Capital Resources” included in Part II, Item 7, in “Management’s Discussion and Analysis of Financial Condition and Results of Operations” and in Note 10, Regulatory Matters, in the accompanying financial statements included in Part II, Item 8, “Financial Statements and Supplementary Data”, all of which are included elsewhere in this report and incorporated herein by reference thereto.
Equity Compensation Plan Information
The following table sets forth, as of December 31, 2009,2011, information about our equity compensation plans that have been approved by our shareholders, including the number of shares of our common stock exercisable under all outstanding options, warrants and rights, the weighted average exercise price of all outstanding options, warrants and rights and the number of shares available for future issuance under our equity compensation plans. We have no equity compensation plans that have not been approved by our shareholders.
| Number of securities | ||||||||||||
| Weighted average | remaining for future | |||||||||||
| Number of securities to | exercise price | issuance under equity | ||||||||||
| be issued upon exercise | of outstanding | compensation plans | ||||||||||
| of outstanding options, | options, warrants | (excluding securities | ||||||||||
| Plan Category | warrants and rights | and rights | reflected in column (a)) | |||||||||
| Equity compensation plans approved by shareholders | 536,506 | (1) | $ | 20.30 | (1) | 923,646 | (2) | |||||
| Equity compensation plans not approved by shareholders | — | $ | — | — | ||||||||
| September 30, | September 30, | September 30, | ||||||||||
Plan Category | Number of securities to be issued upon exercise of outstanding options, warrants and rights (a) | Weighted average exercise price of outstanding options, warrants and rights (b) | Number of securities remaining for future issuance under equity compensation plans (excluding securities reflected in column (a)) (c) | |||||||||
Equity compensation plans approved by shareholders | 534,712 | (1) | $ | 20.70 | (1) | 664,350 | (2) | |||||
Equity compensation plans not approved by shareholders | — | $ | — | |||||||||
| (1) | Includes |
| (2) | Represents the 940,000 aggregate shares approved for issuance under |
- 27 -
The stock performance graph below compares (a) the cumulative total return on the Company’sour common stock for the period beginning December 31, 20042006 as reported by the NASDAQ Global Select Market, through December 31, 2009,2011, (b) the cumulative total return on stocks included in the NASDAQ Composite Index over the same period, and (c) the cumulative total return, as compiled by SNL Financial L.C., of Major Exchange (NYSE, AMEX and NASDAQ) Banks with $1 billion to $5 billion in assets over the same period. Cumulative return assumes the reinvestment of dividends. The graph was prepared by SNL Financial, LC and is expressed in dollars based on an assumed investment of $100.
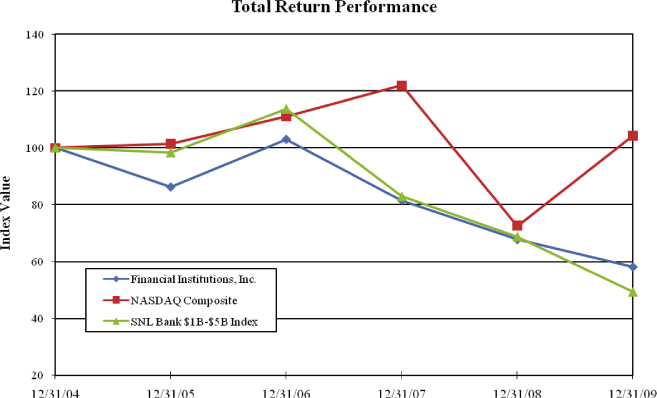
| Period Ending | ||||||||||||||||||||||||
| Index | 12/31/04 | 12/31/05 | 12/31/06 | 12/31/07 | 12/31/08 | 12/31/09 | ||||||||||||||||||
| Financial Institutions, Inc. | 100.00 | 86.17 | 102.86 | 81.43 | 67.72 | 58.08 | ||||||||||||||||||
| NASDAQ Composite | 100.00 | 101.37 | 111.03 | 121.92 | 72.49 | 104.31 | ||||||||||||||||||
| SNL Bank $1B-$5B Index | 100.00 | 98.29 | 113.74 | 82.85 | 68.72 | 49.26 | ||||||||||||||||||
- 28 -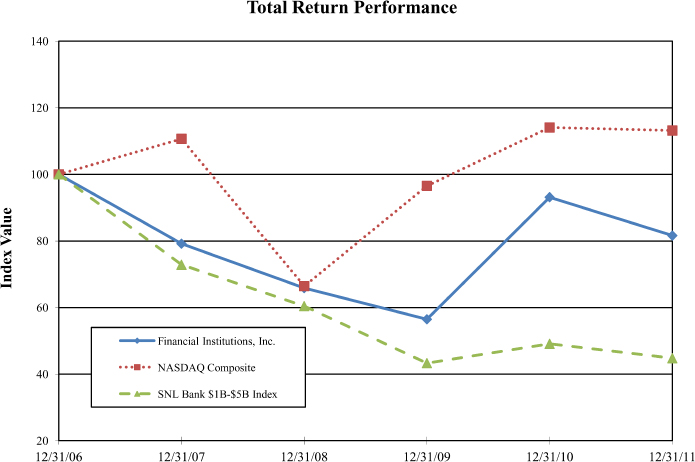
| September 30, | September 30, | September 30, | September 30, | September 30, | September 30, | |||||||||||||||||||
| Period Ending | ||||||||||||||||||||||||
Index | 12/31/06 | 12/31/07 | 12/31/08 | 12/31/09 | 12/31/10 | 12/31/11 | ||||||||||||||||||
Financial Institutions, Inc. | 100.00 | 79.17 | 65.84 | 56.47 | 93.13 | 81.59 | ||||||||||||||||||
NASDAQ Composite | 100.00 | 110.66 | 66.42 | 96.54 | 114.06 | 113.16 | ||||||||||||||||||
SNL Bank $1B-$5B Index | 100.00 | 72.84 | 60.42 | 43.31 | 49.09 | 44.77 | ||||||||||||||||||
30
| At or for the year ended December 31, | ||||||||||||||||||||
| (Dollars in thousands, except per share data) | 2009 | 2008 | 2007 | 2006 | 2005 | |||||||||||||||
Selected financial condition data: | ||||||||||||||||||||
| Total assets | $ | 2,062,389 | $ | 1,916,919 | $ | 1,857,876 | $ | 1,907,552 | $ | 2,022,392 | ||||||||||
| Loans, net | 1,243,265 | 1,102,330 | 948,652 | 909,434 | 972,090 | |||||||||||||||
| Investment securities | 620,074 | 606,038 | 754,720 | 775,536 | 833,448 | |||||||||||||||
| Deposits | 1,742,955 | 1,633,263 | 1,575,971 | 1,617,695 | 1,717,261 | |||||||||||||||
| Borrowings | 106,390 | 70,820 | 68,210 | 87,199 | 115,199 | |||||||||||||||
| Shareholders’ equity | 198,294 | 190,300 | 195,322 | 182,388 | 171,757 | |||||||||||||||
Common shareholders’ equity(1) | 144,876 | 137,226 | 177,741 | 164,765 | 154,123 | |||||||||||||||
Tangible common shareholders’ equity(2) | 107,507 | 99,577 | 139,786 | 126,502 | 115,440 | |||||||||||||||
Selected operations data: | ||||||||||||||||||||
| Interest income | $ | 94,482 | $ | 98,948 | $ | 105,212 | $ | 103,070 | $ | 103,887 | ||||||||||
| Interest expense | 22,217 | 33,617 | 47,139 | 43,604 | 36,395 | |||||||||||||||
| Net interest income | 72,265 | 65,331 | 58,073 | 59,466 | 67,492 | |||||||||||||||
| Provision (credit) for loan losses | 7,702 | 6,551 | 116 | (1,842 | ) | 28,532 | ||||||||||||||
| Net interest income after provision (credit) for loan losses | 64,563 | 58,780 | 57,957 | 61,308 | 38,960 | |||||||||||||||
Noninterest income (loss)(3) | 18,795 | (48,778 | ) | 20,680 | 21,911 | 29,384 | ||||||||||||||
| Noninterest expense | 62,777 | 57,461 | 57,428 | 59,612 | 65,492 | |||||||||||||||
| Income (loss) from continuing operations before income taxes | 20,581 | (47,459 | ) | 21,209 | 23,607 | 2,852 | ||||||||||||||
| Income tax expense (benefit) from continuing operations | 6,140 | (21,301 | ) | 4,800 | 6,245 | (1,766 | ) | |||||||||||||
| Income (loss) from continuing operations | 14,441 | (26,158 | ) | 16,409 | 17,362 | 4,618 | ||||||||||||||
| Loss on discontinued operations, net of tax | — | — | — | — | 2,452 | |||||||||||||||
| Net income (loss) | $ | 14,441 | $ | (26,158 | ) | $ | 16,409 | $ | 17,362 | $ | 2,166 | |||||||||
| Preferred stock dividends and accretion | �� | 3,697 | 1,538 | 1,483 | 1,486 | 1,488 | ||||||||||||||
| Net income (loss) applicable to common shareholders | $ | 10,744 | $ | (27,696 | ) | $ | 14,926 | $ | 15,876 | $ | 678 | |||||||||
Stock and related per share data: | ||||||||||||||||||||
| Earnings (loss) from continuing operations per common share: | ||||||||||||||||||||
| Basic | $ | 0.99 | $ | (2.54 | ) | $ | 1.34 | $ | 1.40 | $ | 0.28 | |||||||||
| Diluted | 0.99 | (2.54 | ) | 1.33 | 1.40 | 0.28 | ||||||||||||||
| Earnings (loss) per common share: | ||||||||||||||||||||
| Basic | 0.99 | (2.54 | ) | 1.34 | 1.40 | 0.06 | ||||||||||||||
| Diluted | 0.99 | (2.54 | ) | 1.33 | 1.40 | 0.06 | ||||||||||||||
| Cash dividends declared on common stock | 0.40 | 0.54 | 0.46 | 0.34 | 0.40 | |||||||||||||||
Common book value per share(1) | 13.39 | 12.71 | 16.14 | 14.53 | 13.60 | |||||||||||||||
Tangible common book value per share(2) | 9.94 | 9.22 | 12.69 | 11.15 | 10.19 | |||||||||||||||
| Market price (NASDAQ: FISI): | ||||||||||||||||||||
| High | 15.99 | 22.50 | 23.71 | 25.38 | 24.93 | |||||||||||||||
| Low | 3.27 | 10.06 | 16.18 | 17.43 | 15.52 | |||||||||||||||
| Close | 11.78 | 14.35 | 17.82 | 23.05 | 19.62 | |||||||||||||||
| ITEM 6. | SELECTED FINANCIAL DATA |
| September 30, | September 30, | September 30, | September 30, | September 30, | ||||||||||||||||
| At or for the year ended December 31, | ||||||||||||||||||||
(Dollars in thousands, except selected ratios and per share data) | 2011 | 2010 | 2009 | 2008 | 2007 | |||||||||||||||
Selected financial condition data: | ||||||||||||||||||||
Total assets | $ | 2,336,353 | $ | 2,214,307 | $ | 2,062,389 | $ | 1,916,919 | $ | 1,857,876 | ||||||||||
Loans, net | 1,461,516 | 1,325,524 | 1,243,265 | 1,102,330 | 948,652 | |||||||||||||||
Investment securities | 650,815 | 694,530 | 620,074 | 606,038 | 754,720 | |||||||||||||||
Deposits | 1,931,599 | 1,882,890 | 1,742,955 | 1,633,263 | 1,575,971 | |||||||||||||||
Borrowings | 150,698 | 103,877 | 106,390 | 70,820 | 68,210 | |||||||||||||||
Shareholders’ equity | 237,194 | 212,144 | 198,294 | 190,300 | 195,322 | |||||||||||||||
Common shareholders’ equity(1) | 219,721 | 158,359 | 144,876 | 137,226 | 177,741 | |||||||||||||||
Tangible common shareholders’ equity(2) | 182,352 | 120,990 | 107,507 | 99,577 | 139,786 | |||||||||||||||
Selected operations data: | ||||||||||||||||||||
Interest income | $ | 95,118 | $ | 96,509 | $ | 94,482 | $ | 98,948 | $ | 105,212 | ||||||||||
Interest expense | 13,255 | 17,720 | 22,217 | 33,617 | 47,139 | |||||||||||||||
|
|
|
|
|
|
|
|
|
| |||||||||||
Net interest income | 81,863 | 78,789 | 72,265 | 65,331 | 58,073 | |||||||||||||||
Provision for loan losses | 7,780 | 6,687 | 7,702 | 6,551 | 116 | |||||||||||||||
|
|
|
|
|
|
|
|
|
| |||||||||||
Net interest income after provision for loan losses | 74,083 | 72,102 | 64,563 | 58,780 | 57,957 | |||||||||||||||
Noninterest income (loss)(3) | 23,925 | 19,454 | 18,795 | (48,778 | ) | 20,680 | ||||||||||||||
Noninterest expense | 63,794 | 60,917 | 62,777 | 57,461 | 57,428 | |||||||||||||||
|
|
|
|
|
|
|
|
|
| |||||||||||
Income (loss) before income taxes | 34,214 | 30,639 | 20,581 | (47,459 | ) | 21,209 | ||||||||||||||
Income tax expense (benefit) | 11,415 | 9,352 | 6,140 | (21,301 | ) | 4,800 | ||||||||||||||
|
|
|
|
|
|
|
|
|
| |||||||||||
Net income (loss) | $ | 22,799 | $ | 21,287 | $ | 14,441 | $ | (26,158 | ) | $ | 16,409 | |||||||||
|
|
|
|
|
|
|
|
|
| |||||||||||
Preferred stock dividends and accretion | 3,182 | 3,725 | 3,697 | 1,538 | 1,483 | |||||||||||||||
|
|
|
|
|
|
|
|
|
| |||||||||||
Net income (loss) applicable to common shareholders | $ | 19,617 | $ | 17,562 | $ | 10,744 | $ | (27,696 | ) | $ | 14,926 | |||||||||
|
|
|
|
|
|
|
|
|
| |||||||||||
Stock and related per share data: | ||||||||||||||||||||
Earnings (loss) per common share: | ||||||||||||||||||||
Basic | $ | 1.50 | $ | 1.62 | $ | 0.99 | $ | (2.54 | ) | $ | 1.34 | |||||||||
Diluted | 1.49 | 1.61 | 0.99 | (2.54 | ) | 1.33 | ||||||||||||||
Cash dividends declared on common stock | 0.47 | 0.40 | 0.40 | 0.54 | 0.46 | |||||||||||||||
Common book value per share(1) | 15.92 | 14.48 | 13.39 | 12.71 | 16.14 | |||||||||||||||
Tangible common book value per share(2) | 13.21 | 11.06 | 9.94 | 9.22 | 12.69 | |||||||||||||||
Market price (NASDAQ: FISI): | ||||||||||||||||||||
High | 20.36 | 20.74 | 15.99 | 22.50 | 23.71 | |||||||||||||||
Low | 12.18 | 10.91 | 3.27 | 10.06 | 16.18 | |||||||||||||||
Close | 16.14 | 18.97 | 11.78 | 14.35 | 17.82 | |||||||||||||||
| (1) | Excludes preferred shareholders’ equity. |
| (2) | Excludes preferred shareholders’ equity, goodwill and other intangible assets. |
| (3) | The 2011, 2010, 2009 and 2008 figures include |
- 29 -
| September 30, | September 30, | September 30, | September 30, | September 30, | ||||||||||||||||
| At or for the year ended December 31, | ||||||||||||||||||||
(Dollars in thousands, except per share data) | 2011 | 2010 | 2009 | 2008 | 2007 | |||||||||||||||
Selected financial ratios and other data: | ||||||||||||||||||||
Performance ratios: | ||||||||||||||||||||
Net income (loss), returns on: | ||||||||||||||||||||
Average assets | 1.00 | % | 0.98 | % | 0.71 | % | -1.37 | % | 0.86 | % | ||||||||||
Average equity | 9.82 | 10.07 | 7.43 | -14.30 | 8.84 | |||||||||||||||
Average common equity(1) | 9.47 | 11.14 | 7.61 | -16.84 | 8.89 | |||||||||||||||
Average tangible common equity(2) | 11.55 | 14.59 | 10.37 | -21.87 | 11.50 | |||||||||||||||
Common dividend payout ratio(3) | 31.33 | 24.69 | 40.40 | NA | 34.33 | |||||||||||||||
Net interest margin (fully tax-equivalent) | 4.04 | 4.07 | 4.04 | 3.93 | 3.53 | |||||||||||||||
Efficiency ratio(4) | 60.55 | % | 60.36 | % | 65.52 | % | 64.07 | % | 68.77 | % | ||||||||||
Capital ratios: | ||||||||||||||||||||
Leverage ratio | 8.63 | % | 8.31 | % | 7.96 | % | 8.05 | % | 9.35 | % | ||||||||||
Tier 1 risk-based capital | 12.20 | 12.34 | 11.95 | 11.83 | 15.74 | |||||||||||||||
Total risk-based capital | 13.45 | 13.60 | 13.21 | 13.08 | 16.99 | |||||||||||||||
Equity to assets(5) | 10.20 | 9.75 | 9.55 | 9.60 | 9.73 | |||||||||||||||
Common equity to assets(1) (5) | 9.10 | 7.28 | 6.94 | 8.63 | 8.81 | |||||||||||||||
Tangible common equity to tangible assets(2)(5) | 7.58 | % | 5.65 | % | 5.19 | % | 6.78 | % | 6.95 | % | ||||||||||
Asset quality: | ||||||||||||||||||||
Non-performing loans | $ | 7,076 | $ | 7,582 | $ | 8,681 | $ | 8,196 | $ | 8,077 | ||||||||||
Non-performing assets | 9,187 | 8,895 | 10,442 | 9,252 | 9,498 | |||||||||||||||
Allowance for loan losses | 23,260 | 20,466 | 20,741 | 18,749 | 15,521 | |||||||||||||||
Net loan charge-offs | $ | 4,986 | $ | 6,962 | $ | 5,710 | $ | 3,323 | $ | 1,643 | ||||||||||
Non-performing loans to total loans | 0.48 | % | 0.56 | % | 0.69 | % | 0.73 | % | 0.84 | % | ||||||||||
Non-performing assets to total assets | 0.39 | 0.40 | 0.51 | 0.48 | 0.51 | |||||||||||||||
Net charge-offs to average loans | 0.36 | 0.54 | 0.47 | 0.32 | 0.18 | |||||||||||||||
Allowance for loan losses to total loans | 1.57 | 1.52 | 1.64 | 1.67 | 1.61 | |||||||||||||||
Allowance for loan losses to non-performing loans | 329 | % | 270 | % | 239 | % | 229 | % | 192 | % | ||||||||||
Other data: | ||||||||||||||||||||
Number of branches | 50 | 50 | 50 | 51 | 50 | |||||||||||||||
Full time equivalent employees | 575 | 577 | 572 | 600 | 621 | |||||||||||||||
| At or for the year ended December 31, | ||||||||||||||||||||
| (Dollars in thousands, except per share data) | 2009 | 2008 | 2007 | 2006 | 2005 | |||||||||||||||
Selected financial ratios and other data: | ||||||||||||||||||||
Performance ratios: | ||||||||||||||||||||
| Net income (loss) (returns on): | ||||||||||||||||||||
| Average assets | 0.71 | % | -1.37 | % | 0.86 | % | 0.90 | % | 0.10 | % | ||||||||||
| Average equity | 7.43 | -14.30 | 8.84 | 9.86 | 1.22 | |||||||||||||||
Average common equity(1) | 7.61 | -16.84 | 8.89 | 10.02 | 0.43 | |||||||||||||||
Average tangible common equity(2) | 10.37 | -21.87 | 11.50 | 13.23 | 0.56 | |||||||||||||||
Common dividend payout ratio(3) | 40.40 | NA | 34.33 | 24.29 | 666.67 | |||||||||||||||
| Net interest margin (fully tax-equivalent) | 4.04 | 3.93 | 3.53 | 3.55 | 3.65 | |||||||||||||||
Efficiency ratio(4) | 65.52 | % | 64.07 | % | 68.77 | % | 69.78 | % | 70.18 | % | ||||||||||
Capital ratios: | ||||||||||||||||||||
| Leverage ratio | 7.96 | % | 8.05 | % | 9.35 | % | 8.91 | % | 7.60 | % | ||||||||||
| Tier 1 risk-based capital | 11.95 | 11.83 | 15.74 | 15.85 | 13.75 | |||||||||||||||
| Total risk-based capital | 13.21 | 13.08 | 16.99 | 17.10 | 15.01 | |||||||||||||||
Equity to assets(5) | 9.55 | 9.60 | 9.73 | 9.08 | 8.37 | |||||||||||||||
Common equity to assets(1) (5) | 6.94 | 8.63 | 8.81 | 8.17 | 7.54 | |||||||||||||||
Tangible common equity to tangible assets(2)(5) | 5.19 | % | 6.78 | % | 6.95 | % | 6.32 | % | 5.80 | % | ||||||||||
Asset quality (6): | ||||||||||||||||||||
| Non-performing loans | $ | 8,681 | $ | 8,196 | $ | 8,077 | $ | 15,840 | $ | 18,037 | ||||||||||
| Non-performing assets | 10,442 | 9,252 | 9,498 | 17,043 | 19,713 | |||||||||||||||
| Allowance for loan losses | 20,741 | 18,749 | 15,521 | 17,048 | 20,231 | |||||||||||||||
| Net loan charge-offs | $ | 5,710 | $ | 3,323 | $ | 1,643 | $ | 1,341 | $ | 47,487 | ||||||||||
| Total non-performing loans to total loans | 0.69 | % | 0.73 | % | 0.84 | % | 1.71 | % | 1.82 | % | ||||||||||
| Total non-performing assets to total assets | 0.51 | 0.48 | 0.51 | 0.89 | 0.97 | |||||||||||||||
| Net charge-offs to average loans | 0.47 | 0.32 | 0.18 | 0.14 | 4.27 | |||||||||||||||
| Allowance for loan losses to total loans | 1.64 | 1.67 | 1.61 | 1.84 | 2.04 | |||||||||||||||
| Allowance for loan losses to non-performing loans | 239 | % | 229 | % | 192 | % | 108 | % | 112 | % | ||||||||||
Other data: | ||||||||||||||||||||
| Number of branches | 51 | 52 | 50 | 50 | 50 | |||||||||||||||
| Full time equivalent employees | 572 | 600 | 621 | 640 | 700 | |||||||||||||||
| (1) | Excludes preferred shareholders’ equity. |
| (2) | Excludes preferred shareholders’ equity, goodwill and other intangible assets. |
| (3) | Common dividend payout ratio equals dividends declared during the year divided by earnings per share for the year. There is no ratio shown for years where |
| (4) | Efficiency ratio equals noninterest expense less other real estate expense and amortization of intangible assets as a percentage of net revenue, defined as the sum of tax-equivalent net interest income and noninterest income before net gains and impairment charges on investment securities and proceeds from company owned life insurance included in income |
| (5) | Ratios calculated using average balances for the periods shown. | |
- 30 -
| 2009 | ||||||||||||||||
| Fourth | Third | Second | First | |||||||||||||
| (Dollars in thousands, except per share data) | Quarter | Quarter | Quarter | Quarter | ||||||||||||
| Interest income | $ | 24,390 | $ | 23,697 | $ | 23,302 | $ | 23,093 | ||||||||
| Interest expense | 5,175 | 5,619 | 5,657 | 5,766 | ||||||||||||
| Net interest income | 19,215 | 18,078 | 17,645 | 17,327 | ||||||||||||
| Provision for loan losses | 1,088 | 2,620 | 2,088 | 1,906 | ||||||||||||
| Net interest income, after provision for loan losses | 18,127 | 15,458 | 15,557 | 15,421 | ||||||||||||
| Noninterest income | 5,183 | 4,406 | 4,515 | 4,691 | ||||||||||||
| Noninterest expense | 15,117 | 15,142 | 16,440 | 16,078 | ||||||||||||
| Income before income taxes | 8,193 | 4,722 | 3,632 | 4,034 | ||||||||||||
| Income tax expense | 2,756 | 1,313 | 1,004 | 1,067 | ||||||||||||
| Net income | $ | 5,437 | $ | 3,409 | $ | 2,628 | $ | 2,967 | ||||||||
| Preferred stock dividends | 927 | 927 | 925 | 918 | ||||||||||||
| Net income applicable to common shareholders | $ | 4,510 | $ | 2,482 | $ | 1,703 | $ | 2,049 | ||||||||
Earnings per common share(1): | ||||||||||||||||
| Basic | $ | 0.42 | $ | 0.23 | $ | 0.16 | $ | 0.19 | ||||||||
| Diluted | 0.42 | 0.23 | 0.16 | 0.19 | ||||||||||||
| Market price (NASDAQ: FISI): | ||||||||||||||||
| High | $ | 12.25 | $ | 15.00 | $ | 15.99 | $ | 14.95 | ||||||||
| Low | 9.71 | 9.90 | 6.98 | 3.27 | ||||||||||||
| Close | 11.78 | 9.97 | 13.66 | 7.62 | ||||||||||||
| Dividends declared | $ | 0.10 | $ | 0.10 | $ | 0.10 | $ | 0.10 | ||||||||
| 2008 | ||||||||||||||||
| Fourth | Third | Second | First | |||||||||||||
| (Dollars in thousands, except per share data) | Quarter | Quarter | Quarter | Quarter | ||||||||||||
| Interest income | $ | 24,582 | $ | 24,558 | $ | 24,536 | $ | 25,272 | ||||||||
| Interest expense | 7,269 | 7,812 | 8,349 | 10,187 | ||||||||||||
| Net interest income | 17,313 | 16,746 | 16,187 | 15,085 | ||||||||||||
| Provision for loan losses | 2,586 | 1,891 | 1,358 | 716 | ||||||||||||
| Net interest income, after provision for loan losses | 14,727 | 14,855 | 14,829 | 14,369 | ||||||||||||
| Noninterest (loss) income | (25,106 | ) | (29,348 | ) | 932 | 4,744 | ||||||||||
| Noninterest expense | 15,394 | 13,409 | 14,385 | 14,273 | ||||||||||||
| (Loss) income before income taxes | (25,773 | ) | (27,902 | ) | 1,376 | 4,840 | ||||||||||
| Income tax (benefit) expense | (22,631 | ) | 524 | (255 | ) | 1,061 | ||||||||||
| Net (loss) income | $ | (3,142 | ) | $ | (28,426 | ) | $ | 1,631 | $ | 3,779 | ||||||
| Preferred stock dividends | 426 | 371 | 370 | 371 | ||||||||||||
| Net (loss) income applicable to common shareholders | $ | (3,568 | ) | $ | (28,797 | ) | $ | 1,261 | $ | 3,408 | ||||||
(Loss) earnings per common share(1): | ||||||||||||||||
| Basic | $ | (0.33 | ) | $ | (2.68 | ) | $ | 0.12 | $ | 0.31 | ||||||
| Diluted | (0.33 | ) | (2.68 | ) | 0.12 | 0.31 | ||||||||||
| Market price (NASDAQ: FISI): | ||||||||||||||||
| High | $ | 20.27 | $ | 22.50 | $ | 20.00 | $ | 20.78 | ||||||||
| Low | 10.06 | 14.82 | 15.25 | 15.10 | ||||||||||||
| Close | 14.35 | 20.01 | 16.06 | 18.95 | ||||||||||||
| Dividends declared | $ | 0.10 | $ | 0.15 | $ | 0.15 | $ | 0.14 | ||||||||
| September 30, | September 30, | September 30, | September 30, | |||||||||||||
| 2011 | ||||||||||||||||
Fourth | Third | Second | First | |||||||||||||
(Dollars in thousands, except per share data) | Quarter | Quarter | Quarter | Quarter | ||||||||||||
Interest income | $ | 23,875 | $ | 23,774 | $ | 23,830 | $ | 23,639 | ||||||||
Interest expense | 2,721 | 3,156 | 3,577 | 3,801 | ||||||||||||
|
|
|
|
|
|
|
| |||||||||
Net interest income | 21,154 | 20,618 | 20,253 | 19,838 | ||||||||||||
Provision for loan losses | 2,162 | 3,480 | 1,328 | 810 | ||||||||||||
|
|
|
|
|
|
|
| |||||||||
Net interest income, after provision for loan losses | 18,992 | 17,138 | 18,925 | 19,028 | ||||||||||||
Noninterest income | 5,767 | 8,036 | 4,974 | 5,148 | ||||||||||||
Noninterest expense | 16,279 | 17,012 | 15,153 | 15,350 | ||||||||||||
|
|
|
|
|
|
|
| |||||||||
Income before income taxes | 8,480 | 8,162 | 8,746 | 8,826 | ||||||||||||
Income tax expense | 2,718 | 2,664 | 3,027 | 3,006 | ||||||||||||
|
|
|
|
|
|
|
| |||||||||
Net income | $ | 5,762 | $ | 5,498 | $ | 5,719 | $ | 5,820 | ||||||||
|
|
|
|
|
|
|
| |||||||||
Preferred stock dividends | 369 | 368 | 370 | 2,075 | ||||||||||||
|
|
|
|
|
|
|
| |||||||||
Net income applicable to common shareholders | $ | 5,393 | $ | 5,130 | $ | 5,349 | $ | 3,745 | ||||||||
|
|
|
|
|
|
|
| |||||||||
Earnings per common share(1): | ||||||||||||||||
Basic | $ | 0.39 | $ | 0.38 | $ | 0.39 | $ | 0.33 | ||||||||
Diluted | 0.39 | 0.37 | 0.39 | 0.33 | ||||||||||||
Market price (NASDAQ: FISI): | ||||||||||||||||
High | $ | 17.26 | $ | 17.98 | $ | 17.93 | $ | 20.36 | ||||||||
Low | 12.18 | 13.63 | 15.20 | 16.40 | ||||||||||||
Close | 16.14 | 14.26 | 16.42 | 17.52 | ||||||||||||
Dividends declared | $ | 0.13 | $ | 0.12 | $ | 0.12 | $ | 0.10 | ||||||||
| September 30, | September 30, | September 30, | September 30, | |||||||||||||
| 2010 | ||||||||||||||||
| Fourth | Third | Second | First | |||||||||||||
(Dollars in thousands, except per share data) | Quarter | Quarter | Quarter | Quarter | ||||||||||||
Interest income | $ | 24,297 | $ | 24,186 | $ | 24,202 | $ | 23,824 | ||||||||
Interest expense | 4,229 | 4,393 | 4,526 | 4,572 | ||||||||||||
|
|
|
|
|
|
|
| |||||||||
Net interest income | 20,068 | 19,793 | 19,676 | 19,252 | ||||||||||||
Provision for loan losses | 1,980 | 2,184 | 2,105 | 418 | ||||||||||||
|
|
|
|
|
|
|
| |||||||||
Net interest income, after provision for loan losses | 18,088 | 17,609 | 17,571 | 18,834 | ||||||||||||
Noninterest income | 5,274 | 5,131 | 4,966 | 4,083 | ||||||||||||
Noninterest expense | 16,373 | 14,936 | 14,870 | 14,738 | ||||||||||||
|
|
|
|
|
|
|
| |||||||||
Income before income taxes | 6,989 | 7,804 | 7,667 | 8,179 | ||||||||||||
Income tax expense | 1,891 | 2,141 | 2,469 | 2,851 | ||||||||||||
|
|
|
|
|
|
|
| |||||||||
Net income | $ | 5,098 | $ | 5,663 | $ | 5,198 | $ | 5,328 | ||||||||
|
|
|
|
|
|
|
| |||||||||
Preferred stock dividends | 933 | 932 | 931 | 929 | ||||||||||||
|
|
|
|
|
|
|
| |||||||||
Net income applicable to common shareholders | $ | 4,165 | $ | 4,731 | $ | 4,267 | $ | 4,399 | ||||||||
|
|
|
|
|
|
|
| |||||||||
Earnings per common share(1): | ||||||||||||||||
Basic | $ | 0.38 | $ | 0.44 | $ | 0.39 | $ | 0.41 | ||||||||
Diluted | 0.38 | 0.43 | 0.39 | 0.40 | ||||||||||||
Market price (NASDAQ: FISI): | ||||||||||||||||
High | $ | 20.74 | $ | 19.94 | $ | 19.48 | $ | 15.40 | ||||||||
Low | 16.80 | 14.14 | 14.07 | 10.91 | ||||||||||||
Close | 18.97 | 17.66 | 17.76 | 14.62 | ||||||||||||
Dividends declared | $ | 0.10 | $ | 0.10 | $ | 0.10 | $ | 0.10 | ||||||||
| (1) | Earnings |
-33
2011 FOURTH QUARTER RESULTS
Net income was $5.8 million for the fourth quarter of 2011 compared with $5.1 million for the fourth quarter of 2010. After preferred dividends, fourth quarter diluted earnings per share for 2011 was $0.39 compared with $0.38 per share for the fourth quarter of 2010.
Net interest income totaled $21.2 million for the three months ended December 31, -2011, an increase of $1.1 million or 5% over the fourth quarter of 2010. Average earning assets increased $77.0 million during the fourth quarter 2011 compared to the same quarter last year, as a $127.4 million increase in average loans was partially offset by a $50.4 million decrease in investment securities and interest earning deposits.
The net interest margin on a tax-equivalent basis was 4.07% in the fourth quarter of 2011, compared with 4.01% in the fourth quarter of 2010. Our yield on earning-assets decreased 25 basis points in the fourth quarter of 2011 compared with the same quarter last year. This was due to the effect of reinvesting cash flows in the low interest rate environment. The cost of interest-bearing liabilities decreased 38 basis points compared with the fourth quarter of 2010, primarily a result of the redemption of our 10.20% junior subordinated debentures and the continued re-pricing of the our certificates of deposit.
The provision for loan losses was $2.2 million for the fourth quarter of 2011 compared with $2.0 million for the fourth quarter of 2010. Net charge-offs were $1.9 million, or 0.51% annualized, of average loans, up from $1.2 million, or 0.37% annualized, of average loans in the fourth quarter of 2010. Net charge-offs for the fourth quarter of 2011 includes $905 thousand for the charge-off of a commercial business relationship. See the sections “Allowance for Loan Losses” and “Non-performing Assets and Potential Problem Loans” for additional information on net charge-offs and non-performing loans.
Noninterest income totaled $5.8 million for the fourth quarter of 2011, a 9% increase over the fourth quarter of 2010. The majority of the increase related to higher pre-tax net gains from the sale of investment securities of $656 thousand during the fourth of quarter 2011 compared with $30 thousand during the fourth quarter of 2010.
Noninterest expense was $16.3 million for the fourth quarter of 2011, a decrease of $94 thousand million or 1% from the fourth quarter of 2010.
Income tax expense for the fourth quarter of 2011 was $2.7 million compared to $1.9 million for the fourth quarter of 2010. The change in income tax expense was primarily due to a $1.5 million increase in pretax income between the years.
34
The following is a discussion is management’sand analysis to assist in the understanding and evaluation of the consolidatedour financial conditionposition and results of operations of the Company. Itand should be read in conjunction with the information set forth under Part I, Item 1A, “Risks Factors”, and our consolidated financial statements and related notes filed herewith inthereto appearing under Part II, Item 8, “Financial Statements and Supplementary Data” and the description of the business filed herewith in Part I, Item 1, “Business.”
OVERVIEW
Business Overview
Financial Institutions, Inc. is a financial holding company headquartered in New York State, providing banking and nonbanking financial services to individuals and businesses primarily in itsour Western and Central and Western New York footprint. The Company, principally through itsWe have also expanded our indirect lending network to include relationships with franchised automobile dealers in the Capital District of New York and Northern Pennsylvania. Through our wholly-owned banking subsidiary, providesFive Star Bank, we provide a wide range of services, including business and consumer loan and depository services, as well as other traditional banking services. Through itsour nonbanking subsidiary, the Company providesFive Star Investment Services, we provide brokerage and investment advisory services to supplement theour banking business.
Our primary sources of revenue, through its banking subsidiary, are net interest income (predominantly from interest earned on our loans and securities, net of interest paid on deposits and also from investment securities and other funding sources), and noninterest income, particularly fees and other revenue from financial services provided to customers or ancillary services tied to loans and deposits. Business volumes and pricing drive revenue potential, and tend to be influenced by overall economic factors, including market interest rates, business spending, consumer confidence, economic growth, and competitive conditions within the marketplace.
Recent Developments
On January 19, 2012, Five Star Bank entered into an agreement to acquire four retail banking branches currently owned by HSBC Bank USA, N.A. located in Elmira, Elmira Heights, Horseheads and Albion, New York and four retail banking branches currently owned by First Niagara Bank, N.A located in Medina, Waterloo, Batavia and Brockport, New York. The deposits associated with these branches total approximately $376 million, while loans total approximately $94 million. The transactions are subject to customary closing conditions, including regulatory approvals, and are expected to close by the end of the third quarter of this year.
2011 Significant Events
Common Stock Offering.In March 2011, we completed the sale of 2,813,475 shares of our common shareholders for 2009stock through an underwritten public offering at a price of $16.35 per share in an effort to restructure our capital position and improve the quality of our capital. The net proceeds of the offering, after deducting underwriting discounts and commissions and offering expenses, amounted to $43.1 million. A portion of the proceeds from this offering was $10.7used to redeem our Series A preferred stock and the junior subordinated debentures.
Redemption of Series A Preferred Stock.In March 2011, we completed the full redemption of our $37.5 million (compared to net loss allocated to shareholdersSeries A preferred stock issued in connection with the TARP Capital Purchase Program. The redemption resulted in a one-time, non-cash redemption charge of $27.7$1.2 million, in 2008),reflecting the accelerated accretion of the remaining discount on the preferred stock, which reduced 2011 diluted earnings per common share were $0.99 (versusby $0.09.
The complete redemption of the Series A preferred stock removed the TARP restrictions pertaining to our ability to declare and pay dividends and repurchase our common stock, as well as certain restrictions associated with executive compensation.
In May 2011, we repurchased the warrant to purchase up to 378,175 shares of our common stock at an exercise price of $14.88 per share issued to the Treasury. The repurchase price of $2.1 million was recorded as a reduction of additional paid-in capital.
Redemption of Junior Subordinated Debentures.In August 2011, we redeemed all of the 10.20% junior subordinated debentures at a redemption price equaling 105.1% of the principal amount redeemed, plus all accrued and unpaid interest. As a result of the redemption, we recognized a loss on extinguishment of debt of $1.1 million, consisting of the redemption premium of $852 thousand and a write-off of the remaining unamortized issuance costs of $231 thousand, which reduced 2011 diluted lossearnings per common share of $2.54 for 2008),by $0.05.
35
MANAGEMENT’S DISCUSSION AND ANALYSIS
2011 Performance Summary
Our net interest income was $72.3$22.8 million onfor the year ended December 31, 2011, compared to a marginnet income of 4.04% (compared$21.3 million for the year ended December 31, 2010. For 2011, net income available to $65.3common shareholders was $19.6 million, onor $1.49 per diluted common share. Net income available to common shareholders was $17.6 million for 2010, or $1.61 per diluted common share. Cash dividends of $0.47 and $0.40 per common share were declared in 2011 and 2010, respectively.
We had total assets of $2.336 billion at December 31, 2011 compared to $2.214 billion at December 31, 2010. At December 31, 2011, shareholders’ equity totaled $237.2 million with book value per common share at $15.92, compared to $212.1 million with book value per common share at $14.48 at the end of 2010. Tangible common equity to tangible common assets improved to 7.58% during 2011 from 5.65% in 2010. The Tier 1 capital ratio was 12.20% as of December 31, 2011 compared to 12.34% at December 31, 2010.
Key factors behind these results are discussed below.
At December 31, 2011, loans were $1.485 billion, up 10% from year-end 2010, primarily in commercial and consumer indirect loans, as we have focused our business development efforts in these areas in accordance with our strategic objectives. Total deposits at December 31, 2011, were $1.932 billion, up 3% from year-end 2010, primarily attributable to a margin$40.7 million increase in retail deposits. Our deposit mix remains favorably weighted in lower cost demand, savings and money market accounts, which comprised 64% of 3.93% for 2008),total deposits at the end of 2011.
Nonperforming loans were $7.1 million at December 31, 2011, compared to $7.6 million at December 31, 2010, as our loan portfolio continues to benefit from responsible underwriting and thelending practices.
The provision for loan losses was $7.7 million with net charge offs to average loans of 0.47% (compared to a provision of $6.6$7.8 million and a net charge off ratio$6.7 million, respectively, for 2011 and 2010. Net charge-offs were $5.0 million in 2011 (or 0.36% of 0.32%average loans) compared to $7.0 million in 2010 (or 0.54% of average loans).
At year-end 2011, the allowance for 2008).
Taxable equivalent net interest income and the quality of earningswas $83.9 million for 2011 or 4% higher than $80.7 million in 2010. Competition for deposits remains high.Taxable equivalent interest income decreased $1.2 million, while interest expense decreased by $4.5 million. The changesincrease in FDIC insurance have been beneficial to deposit growth. Future deposit levels could be affected by changes in these programs. For example, deposits could be affected by the termination of the TAG Program at June 30, 2010 (see Part I, Item 1, Section “Emergency Economic Stabilization Act of 2008” for a detailed discussion of the TAG Program).
The net interest margin for 2011 was 4.04%, 3 basis points lower than 4.07% in net core2010.
Noninterest income was $23.9 million for 2011 compared to $19.5 million for 2010. Core fee-based revenue categories (down $571 thousand, and definedrevenues (defined as service charges on deposit accounts, ATM and debit fees, and broker-dealer fees and commissions). totaled $14.9 million, unchanged from 2010. Net mortgage banking income was $1.7 million for 2011, a slight decrease from $1.8 million in 2010.
Net investment securities gains (defined as net gain on sales and calls of investment securities and impairment charges on investment securities) were $3.0 million for 2011, compared to net investment securities losses of $425 thousand for 2010. During 2011 we recognized an additional $2.8 million in gains from the sale of investment securities and $576 thousand less in impairment charges than in 2010. The increase was primarily attributable to the net gain we experienced in 2011 in sales and calls of investment securities that included a gain of $2.3 million achieved on the sale of four pooled trust preferred securities that had previously been written down.
Noninterest expense for 2011 was $63.8 million, an increase of $62.8 million grew $5.3$2.9 million or 9%5% over 2008.2010. Salaries and employee benefits were $33.6increased $2.6 million, up $2.2professional services increased by $420 thousand and we recognized a loss on extinguishment of debt of $1.1 million or 7% versus 2008,as a result of which $2.1redeeming our 10.20% junior subordinated debentures. FDIC assessments decreased by $1.0 million and other noninterest expense decreased by $404 thousand. As previously disclosed, other noninterest expense for 2010 includes $1.0 million of losses relating to irregular instances of fraudulent debit card activity.
The efficiency ratio was fringe benefits expense. On average, full time equivalent employees decreased 4% between 200960.55% for 2011 and 2008 (from 61060.36% for 20082010.
Income tax expense for 2011 was $11.4 million compared to 586$9.4 million for 2009). Non-personnel noninterest expenses on an aggregate basis were up $3.1 million or 12% over 2008,2010. The change in income tax expense was primarily due to higher FDIC insurance assessments.a $3.6 million increase in pretax income between the years.
36
MANAGEMENTS DISCUSSION AND ANALYSIS
RESULTS OF OPERATIONS FOR THE YEARS ENDED
DECEMBER 31, 2011 AND DECEMBER 31, 2010
Net Interest Income and Net Interest Margin
Net interest income is the primary source of our revenue. Net interest income is the difference between interest income on interest-earning assets, such as loans and investment securities, and the interest expense on interest-bearing deposits and other borrowings used to fund interest-earning and other assets or activities. Net interest income is affected by changes in interest rates and by the amount and composition of earning assets and interest-bearing liabilities, as well as the sensitivity of the balance sheet to changes in interest rates, including characteristics such as the fixed or variable nature of the financial instruments, contractual maturities and repricing frequencies.
Interest rate spread and net interest margin are utilized to measure and explain changes in net interest income. Interest rate spread is the difference between the yield on earning assets and the rate paid for interest-bearing liabilities that fund those assets. The Company’s salenet interest margin is expressed as the percentage of preferred shares undernet interest income to average earning assets. The net interest margin exceeds the Treasury’s TARP in December 2008 increased shareholders’interest rate spread because noninterest-bearing sources of funds (“net free funds”), principally noninterest-bearing demand deposits and stockholders’ equity, by $37.5 million. also support earning assets. To compare tax-exempt asset yields to taxable yields, the yield on tax-exempt investment securities is computed on a taxable equivalent basis. Net interest income, interest rate spread, and net interest margin are discussed on a taxable equivalent basis.
The Company is evaluating repayment alternatives relativefollowing table reconciles interest income per the consolidated statements of income to the TARP fundsinterest income adjusted to determine the most economically beneficial optiona fully taxable equivalent basis for the Company and shareholders.
- 32 -
| September 30, | September 30, | September 30, | ||||||||||
| 2011 | 2010 | 2009 | ||||||||||
Interest income per consolidated statements of income | $ | 95,118 | $ | 96,509 | $ | 94,482 | ||||||
Adjustment to fully taxable equivalent basis | 2,062 | 1,895 | 2,692 | |||||||||
|
|
|
|
|
| |||||||
Interest income adjusted to a fully taxable equivalent basis | 97,180 | 98,404 | 97,174 | |||||||||
Interest expense per consolidated statement of income | 13,255 | 17,720 | 22,217 | |||||||||
|
|
|
|
|
| |||||||
Net interest income on a taxable equivalent basis | $ | 83,925 | $ | 80,684 | $ | 74,957 | ||||||
|
|
|
|
|
| |||||||
Taxable equivalent net interest income was $75.0of $83.9 million for 20092011 was $3.2 million or 4% higher than 2010. The impact of a decline in average yields on our assets was diminished by a 5% increase in interest-earning assets. The average balance of loans rose $98.4 million or 8% higher than $69.6to $1.394 billion, reflecting growth in the commercial and consumer indirect loan portfolios, and the average balance of interest-earning assets rose $98.6 million to $2.080 billion. Consistent with our strategic plan, we continue to pursue loan development efforts in 2008. Taxable equivalent interest income decreased $6.1 million, while interest expense decreased by $11.4 million. the commercial and consumer indirect lending portfolios in accordance with prudent underwriting standards.
The increase in taxable equivalent net interest income was a function of botha favorable volume variances (increasingvariance (as balance sheet changes in both volume and mix increased taxable equivalent net interest income by $2.6$7.8 million) and, partially offset by an unfavorable rate variances (increasingvariance (decreasing taxable equivalent net interest income by $2.7$4.5 million). See also section, “Net Interest Income”The change in mix and volume of earning assets increased taxable equivalent interest income by $6.3 million, while the change in volume and composition of interest-bearing liabilities decreased interest expense by $1.5 million, for additional informationa net favorable volume impact of $7.8 million on taxable equivalent net interest income. Rate changes on earning assets reduced interest income andby $7.4 million, while changes in rates on interest-bearing liabilities lowered interest expense by $2.9 million, for a net interest margin.
The net interest margin for 20092011 was 4.04%, 11 basis points higher than 3.93% compared to 4.07% in 2008. 2010.
The increaseslight decrease in net interest margin was attributable to a 30 basis point increase in interest rate spread (the net of a 90 basis point decrease in the cost of interest-bearing liabilities and a 60 basis decrease in the yield on earning assets), partially offset by a 193 basis point lower contribution from net free funds (primarily attributable to lower rates on interest-bearing liabilities reducing the value of noninterest-bearing deposits and other net free funds).
The Federal Reserve left the Federal funds rate unchanged at 0.25% during 2011 and 2010. During 2011, the Federal Reserve disclosed that short-term interest rates would be held near zero through at least the middle of 2013, in anticipation of low growth and little risk of inflation. In January 2012, the Federal Reserve further announced that it is unlikely that the short-term interest rates will increase until at least 2014.
37
MANAGEMENTS DISCUSSION AND ANALYSIS
For 2011, the yield on average earning assets of 4.67% was 30 basis points lower than 2010. Loan yields decreased 33 basis points to 5.53%. Commercial mortgage and consumer indirect loans in particular, down 31 and 66 basis points, respectively, continued to experience lower yields given the competitive pricing pressures and re-pricing of loans in a low interest rate environment. The yield on investment securities dropped 38 basis points to 2.93%, also impacted by the lower interest rate environment and prepayments of mortgage-related investment securities. Overall, earning asset rate changes reduced interest income by $7.5 million.
The cost of average interest-bearing liabilities of 0.80% in 2011 was $18.830 basis points lower than 2010. The average cost of interest-bearing deposits was 0.74% in 2011, 23 basis points lower than 2010, reflecting the low-rate environment, mitigated by a focus on product pricing to retain balances. The cost of borrowings decreased 175 basis points to 1.58% for 2011, primarily a result of the redemption of the 10.20% junior subordinated debentures. The interest-bearing liability rate changes reduced interest expense by $2.9 million.
Average interest-earning assets of $2.080 billion in 2011 were $98.6 million or 5% higher than 2010. Average investment securities increased $5.0 million while average loans increased $98.4 million or 8%. Commercial loans increased $42.1 million and consumer loans increased $73.5 million, offset by a $17.2 million decrease in residential mortgage loans.
Average interest-bearing liabilities of $1.662 billion in 2011 were up $51.6 million or 3% versus 2010. The impacts of the recent recession have positively impacted our deposit balances, as consumers tend to save more when consumer confidence is low. On average, interest-bearing deposits grew $22.8 million, while average noninterest-bearing demand deposits (a principal component of net free funds) increased by $38.4 million. Average borrowings increased $28.9 million, representing a $50.0 million increase and $21.1 million decrease in short-term and long-term borrowings, respectively.
38
MANAGEMENTS DISCUSSION AND ANALYSIS
The following tables present, for the periods indicated, information regarding: (i) the average balance sheet; (ii) the amount of interest income from interest-earning assets and the resulting annualized yields (tax-exempt yields have been adjusted to a tax-equivalent basis using the applicable Federal tax rate in each year); (iii) the amount of interest expense on interest-bearing liabilities and the resulting annualized rates; (iv) net interest income; (v) net interest rate spread; (vi) net interest income as a percentage of average interest-earning assets (“net interest margin”); and (vii) the ratio of average interest-earning assets to average interest-bearing liabilities. Investment securities are at amortized cost for both held to maturity and available for sale securities. Loans include net unearned income, net deferred loan fees and costs and non-accruing loans. Dollar amounts are shown in thousands.
| XXXXX | XXXXX | XXXXX | XXXXX | XXXXX | XXXXX | XXXXX | XXXXX | XXXXX | ||||||||||||||||||||||||||||
| Years ended December 31, | ||||||||||||||||||||||||||||||||||||
| 2011 | 2010 | 2009 | ||||||||||||||||||||||||||||||||||
| Average | Average | Average | Average | Average | Average | |||||||||||||||||||||||||||||||
| Balance | Interest | Rate | Balance | Interest | Rate | Balance | Interest | Rate | ||||||||||||||||||||||||||||
Interest-earning assets: | ||||||||||||||||||||||||||||||||||||
Federal funds sold and other interest-earning deposits | $ | 140 | $ | — | 0.20 | % | $ | 5,034 | $ | 10 | 0.21 | % | $ | 37,214 | $ | 82 | 0.22 | % | ||||||||||||||||||
Investment securities: | ||||||||||||||||||||||||||||||||||||
Taxable | 545,112 | 14,185 | 2.60 | 571,856 | 17,101 | 2.99 | 454,552 | 16,466 | 3.62 | |||||||||||||||||||||||||||
Tax-exempt | 140,657 | 5,890 | 4.19 | 108,900 | 5,416 | 4.97 | 155,054 | 7,920 | 5.11 | |||||||||||||||||||||||||||
|
|
|
|
|
|
|
|
|
|
|
|
|
|
|
|
|
| |||||||||||||||||||
Total investment securities | 685,769 | 20,075 | 2.93 | 680,756 | 22,517 | 3.31 | 609,606 | 24,386 | 4.00 | |||||||||||||||||||||||||||
Loans: | ||||||||||||||||||||||||||||||||||||
Commercial business | 215,598 | 10,311 | 4.78 | 206,167 | 9,939 | 4.82 | 204,235 | 9,612 | 4.71 | |||||||||||||||||||||||||||
Commercial mortgage | 370,843 | 21,216 | 5.72 | 338,149 | 20,389 | 6.03 | 306,763 | 19,309 | 6.29 | |||||||||||||||||||||||||||
Residential mortgage | 121,742 | 6,868 | 5.64 | 138,954 | 8,157 | 5.87 | 161,055 | 9,701 | 6.02 | |||||||||||||||||||||||||||
Home equity | 216,428 | 9,572 | 4.42 | 202,189 | 9,224 | 4.56 | 193,929 | 9,121 | 4.70 | |||||||||||||||||||||||||||
Consumer indirect | 444,527 | 26,549 | 5.97 | 382,977 | 25,379 | 6.63 | 313,239 | 21,838 | 6.97 | |||||||||||||||||||||||||||
Other consumer | 24,686 | 2,589 | 10.49 | 26,950 | 2,789 | 10.35 | 30,791 | 3,125 | 10.15 | |||||||||||||||||||||||||||
|
|
|
|
|
|
|
|
|
|
|
|
|
|
|
|
|
| |||||||||||||||||||
Total loans | 1,393,824 | 77,105 | 5.53 | 1,295,386 | 75,877 | 5.86 | 1,210,012 | 72,706 | 6.01 | |||||||||||||||||||||||||||
|
|
|
|
|
|
|
|
|
|
|
|
|
|
|
|
|
| |||||||||||||||||||
Total interest-earning assets | 2,079,733 | 97,180 | 4.67 | 1,981,176 | 98,404 | 4.97 | 1,856,832 | 97,174 | 5.23 | |||||||||||||||||||||||||||
|
|
|
|
|
|
|
|
|
|
|
| |||||||||||||||||||||||||
Less: Allowance for loan losses | 21,567 | 20,883 | 20,355 | |||||||||||||||||||||||||||||||||
Other noninterest-earning assets | 218,983 | 206,303 | 197,439 | |||||||||||||||||||||||||||||||||
|
|
|
|
|
| |||||||||||||||||||||||||||||||
Total assets | $ | 2,277,149 | $ | 2,166,596 | $ | 2,033,916 | ||||||||||||||||||||||||||||||
|
|
|
|
|
| |||||||||||||||||||||||||||||||
Interest-bearing liabilities: | ||||||||||||||||||||||||||||||||||||
Deposits: | ||||||||||||||||||||||||||||||||||||
Interest-bearing demand | $ | 383,122 | 614 | 0.16 | $ | 382,517 | 705 | 0.18 | $ | 365,873 | 772 | 0.21 | ||||||||||||||||||||||||
Savings and money market | 451,030 | 1,056 | 0.23 | 414,953 | 1,133 | 0.27 | 383,697 | 1,090 | 0.28 | |||||||||||||||||||||||||||
Certificates of deposit | 712,411 | 9,764 | 1.37 | 726,330 | 13,015 | 1.79 | 685,259 | 17,228 | 2.51 | |||||||||||||||||||||||||||
|
|
|
|
|
|
|
|
|
|
|
|
|
|
|
|
|
| |||||||||||||||||||
Total interest-bearing deposits | 1,546,563 | 11,434 | 0.74 | 1,523,800 | 14,853 | 0.97 | 1,434,829 | 19,090 | 1.33 | |||||||||||||||||||||||||||
Short-term borrowings | 99,122 | 500 | 0.50 | 49,104 | 365 | 0.74 | 43,092 | 270 | 0.63 | |||||||||||||||||||||||||||
Long-term borrowings | 15,905 | 1,321 | 8.31 | 37,043 | 2,502 | 6.75 | 46,913 | 2,857 | 6.09 | |||||||||||||||||||||||||||
|
|
|
|
|
|
|
|
|
|
|
|
|
|
|
|
|
| |||||||||||||||||||
Total borrowings | 115,027 | 1,821 | 1.58 | 86,147 | 2,867 | 3.33 | 90,005 | 3,127 | 3.47 | |||||||||||||||||||||||||||
|
|
|
|
|
|
|
|
|
|
|
|
|
|
|
|
|
| |||||||||||||||||||
Total interest-bearing liabilities | 1,661,590 | 13,255 | 0.80 | 1,609,947 | 17,720 | 1.10 | 1,524,834 | 22,217 | 1.46 | |||||||||||||||||||||||||||
|
|
|
|
|
|
|
|
|
|
|
| |||||||||||||||||||||||||
Noninterest-bearing deposits | 368,268 | 329,853 | 293,852 | |||||||||||||||||||||||||||||||||
Other liabilities | 15,041 | 15,485 | 20,890 | |||||||||||||||||||||||||||||||||
Shareholders’ equity | 232,250 | 211,311 | 194,340 | |||||||||||||||||||||||||||||||||
|
|
|
|
|
| |||||||||||||||||||||||||||||||
Total liabilities and shareholders’ equity | $ | 2,277,149 | $ | 2,166,596 | $ | 2,033,916 | ||||||||||||||||||||||||||||||
|
|
|
|
|
| |||||||||||||||||||||||||||||||
Net interest income (tax-equivalent) | $ | 83,925 | $ | 80,684 | $ | 74,957 | ||||||||||||||||||||||||||||||
|
|
|
|
|
| |||||||||||||||||||||||||||||||
Interest rate spread | 3.87 | % | 3.87 | % | 3.77 | % | ||||||||||||||||||||||||||||||
|
|
|
|
|
| |||||||||||||||||||||||||||||||
Net earning assets | $ | 418,143 | $ | 371,229 | $ | 331,998 | ||||||||||||||||||||||||||||||
|
|
|
|
|
| |||||||||||||||||||||||||||||||
Net interest margin (tax-equivalent) | 4.04 | % | 4.07 | % | 4.04 | % | ||||||||||||||||||||||||||||||
|
|
|
|
|
| |||||||||||||||||||||||||||||||
Ratio of average interest-earning assets to average interest-bearing liabilities | 125.17 | % | 123.06 | % | 121.77 | % | ||||||||||||||||||||||||||||||
|
|
|
|
|
| |||||||||||||||||||||||||||||||
39
MANAGEMENTS DISCUSSION AND ANALYSIS
Rate /Volume Analysis
The following table presents, on a tax-equivalent basis, the relative contribution of changes in volumes and changes in rates to changes in net interest income for the periods indicated. The change in interest not solely due to changes in volume or rate has been allocated in proportion to the absolute dollar amounts of the change in each (in thousands):
| September 30, | September 30, | September 30, | September 30, | September 30, | September 30, | |||||||||||||||||||
| Change from 2011 to 2010 | Change from 2010 to 2009 | |||||||||||||||||||||||
| Volume | Rate | Total | Volume | Rate | Total | |||||||||||||||||||
Increase (decrease) in: | ||||||||||||||||||||||||
Interest income: | ||||||||||||||||||||||||
Federal funds sold and other interest-earning deposits | $ | (5 | ) | $ | (5 | ) | $ | (10 | ) | $ | (65 | ) | $ | (7 | ) | $ | (72 | ) | ||||||
Investment securities: | ||||||||||||||||||||||||
Taxable | (772 | ) | (2,144 | ) | (2,916 | ) | 3,807 | (3,172 | ) | 635 | ||||||||||||||
Tax-exempt | 1,418 | (944 | ) | 474 | (2,300 | ) | (204 | ) | (2,504 | ) | ||||||||||||||
|
|
|
|
|
|
|
|
|
|
|
| |||||||||||||
Total investment securities | 646 | (3,088 | ) | (2,442 | ) | 1,507 | (3,376 | ) | (1,869 | ) | ||||||||||||||
Loans: | ||||||||||||||||||||||||
Commercial business | 452 | (80 | ) | 372 | 92 | 235 | 327 | |||||||||||||||||
Commercial mortgage | 1,905 | (1,078 | ) | 827 | 1,916 | (836 | ) | 1,080 | ||||||||||||||||
Residential mortgage | (980 | ) | (309 | ) | (1,289 | ) | (1,302 | ) | (242 | ) | (1,544 | ) | ||||||||||||
Home equity | 636 | (288 | ) | 348 | 382 | (279 | ) | 103 | ||||||||||||||||
Consumer indirect | 3,829 | (2,659 | ) | 1,170 | 4,665 | (1,124 | ) | 3,541 | ||||||||||||||||
Other consumer | (237 | ) | 37 | (200 | ) | (396 | ) | 60 | (336 | ) | ||||||||||||||
|
|
|
|
|
|
|
|
|
|
|
| |||||||||||||
Total loans | 5,605 | (4,377 | ) | 1,228 | 5,357 | (2,186 | ) | 3,171 | ||||||||||||||||
|
|
|
|
|
|
|
|
|
|
|
| |||||||||||||
Total interest income | 6,246 | (7,470 | ) | (1,224 | ) | 6,799 | (5,569 | ) | 1,230 | |||||||||||||||
|
|
|
|
|
|
|
|
|
|
|
| |||||||||||||
Interest expense: | ||||||||||||||||||||||||
Deposits: | ||||||||||||||||||||||||
Interest-bearing demand | 1 | (92 | ) | (91 | ) | 34 | (101 | ) | (67 | ) | ||||||||||||||
Savings and money market | 93 | (170 | ) | (77 | ) | 86 | (43 | ) | 43 | |||||||||||||||
Certificates of deposit | (245 | ) | (3,006 | ) | (3,251 | ) | 982 | (5,195 | ) | (4,213 | ) | |||||||||||||
|
|
|
|
|
|
|
|
|
|
|
| |||||||||||||
Total interest-bearing deposits | (151 | ) | (3,268 | ) | (3,419 | ) | 1,102 | (5,339 | ) | (4,237 | ) | |||||||||||||
Short-term borrowings | 281 | (146 | ) | 135 | 41 | 54 | 95 | |||||||||||||||||
Long-term borrowings | (1,662 | ) | 481 | (1,181 | ) | (644 | ) | 289 | (355 | ) | ||||||||||||||
|
|
|
|
|
|
|
|
|
|
|
| |||||||||||||
Total borrowings | (1,381 | ) | 335 | (1,046 | ) | (603 | ) | 343 | (260 | ) | ||||||||||||||
|
|
|
|
|
|
|
|
|
|
|
| |||||||||||||
Total interest expense | (1,532 | ) | (2,933 | ) | (4,465 | ) | 499 | (4,996 | ) | (4,497 | ) | |||||||||||||
|
|
|
|
|
|
|
|
|
|
|
| |||||||||||||
Net interest income | $ | 7,778 | $ | (4,537 | ) | $ | 3,241 | $ | 6,300 | $ | (573 | ) | $ | 5,727 | ||||||||||
|
|
|
|
|
|
|
|
|
|
|
| |||||||||||||
40
MANAGEMENTS DISCUSSION AND ANALYSIS
Provision for Loan Losses
The provision for loan losses is based upon credit loss experience, growth or contraction of specific segments of the loan portfolio, and the estimate of losses inherent in the current loan portfolio. The provision for loan losses was $7.8 million for 2009. Core fee-based revenues (definedthe year ended December 31, 2011 compared with $6.7 million for 2010. See the “Allowance for Loan Losses” section of this Management’s Discussion and Analysis for further discussion.
Noninterest Income
The following table summarizes our noninterest income for the years ended December 31 (in thousands):
| September 30, | September 30, | September 30, | ||||||||||
| 2011 | 2010 | 2009 | ||||||||||
Service charges on deposits | $ | 8,679 | $ | 9,585 | $ | 10,065 | ||||||
ATM and debit card | 4,359 | 3,995 | 3,610 | |||||||||
Broker-dealer fees and commissions | 1,829 | 1,283 | 1,022 | |||||||||
Company owned life insurance | 1,424 | 1,107 | 1,096 | |||||||||
Loan servicing | 835 | 1,124 | 1,308 | |||||||||
Net gain on sale of loans held for sale | 880 | 650 | 699 | |||||||||
Net gain on sales and calls of investment securities | 3,003 | 169 | 3,429 | |||||||||
Impairment charges on investment securities | (18 | ) | (594 | ) | (4,666 | ) | ||||||
Net gain (loss) on sale and disposal of other assets | 67 | (203 | ) | 180 | ||||||||
Other | 2,867 | 2,338 | 2,052 | |||||||||
|
|
|
|
|
| |||||||
Total noninterest income | $ | 23,925 | $ | 19,454 | $ | 18,795 | ||||||
|
|
|
|
|
| |||||||
The components of noninterest income fluctuated as servicediscussed below.
Service charges on deposit accounts, deposits were $8.7 million in 2011, which was $906 thousand or 9% lower than 2010. The decrease was primarily due to changes in customer behavior and recent regulatory changes that include requirements for customers to opt in for overdraft coverage for certain types of electronic banking activities.
ATM and debit card income was $4.4 million for 2011, an increase of $364 thousand or 9%, compared to 2010. The increased popularity of electronic banking and transaction processing has resulted in higher ATM and debit card point-of-sale usage income.
Broker-dealer fees and broker-dealercommissions were up $546 thousand or 43%, compared to 2010. Broker-dealer fees and commissions) totaled $14.7commissions fluctuate mainly due to sales volume, which increased during 2011 as a result of improving market and economic conditions and our renewed focus on this line of business.
Company owned life insurance income was up $317 thousand or 29% for the year ended December 31, 2011 compared to the same period in 2010. The increase was the result of an additional $18.0 million investment in company owned life insurance during the third quarter of 2011.
Loan servicing income represents fees earned for servicing mortgage and indirect auto loans sold to third parties, net of amortization expense and impairment losses, if any, associated with capitalized loan servicing assets. Loan servicing income was down $289 thousand or 26% the year ended December 31, 2011 compared to 2010. Loan servicing income decreased as a result of more rapid amortization of servicing rights due to loans paying off, lower fees collected due to a decrease in the sold and serviced portfolio and write-downs on capitalized mortgage servicing assets.
Net gain on loans held for sale was $880 thousand in 2011, an increase of $230 thousand or 35%, compared to 2010, mainly due to the $153 thousand gain relating to the servicing retained sale of $13.0 million of indirect auto loans during the third quarter of 2011.
Net gains from the sales of investment securities were $3.0 million for 2009,the year ended December 31, 2011, compared to $169 thousand in 2010. The current year includes net gains of $2.3 million from the sale of four pooled trust-preferred securities that had been written down $571in prior periods and included in non-performing assets. We continue to monitor the market for the trust-preferred securities and evaluate the potential for future dispositions. Net gains of $730 thousand from the sale of eight mortgage-backed securities were also recognized during 2011. The amount and timing of our sale of investments securities is dependent on a number of factors, including our prudent efforts to realize gains while managing duration, premium and credit risk.
Other noninterest income increased $529 thousand or 4%23% for the year ended December 31, 2011, compared to 2010. Other noninterest income for 2011 includes $152 thousand related to insurance proceeds received for losses relating to an irregular instance of fraudulent debit card activity recorded in the fourth quarter of 2010. Merchant services fees paid by customers for account management and electronic processing of transactions and income from $15.3our capital investment in several limited partnerships also contributed to the 2011 increases.
41
MANAGEMENTS DISCUSSION AND ANALYSIS
Noninterest Expense
The following table summarizes our noninterest expense for the years ended December 31 (in thousands):
| September 30, | September 30, | September 30, | ||||||||||
| 2011 | 2010 | 2009 | ||||||||||
Salaries and employee benefits | $ | 35,439 | $ | 32,811 | $ | 33,634 | ||||||
Occupancy and equipment | 10,868 | 10,818 | 11,062 | |||||||||
Computer and data processing | 2,437 | 2,487 | 2,340 | |||||||||
Professional services | 2,617 | 2,197 | 2,524 | |||||||||
Supplies and postage | 1,778 | 1,772 | 1,846 | |||||||||
FDIC assessments | 1,513 | 2,507 | 3,651 | |||||||||
Advertising and promotions | 1,259 | 1,121 | 949 | |||||||||
Loss on extinguishment of debt | 1,083 | — | — | |||||||||
Other | 6,800 | 7,204 | 6,771 | |||||||||
|
|
|
|
|
| |||||||
Total noninterest expense | $ | 63,794 | $ | 60,917 | $ | 62,777 | ||||||
|
|
|
|
|
| |||||||
The components of noninterest expense fluctuated as discussed below.
Salaries and employee benefits (which includes salary-related expenses and fringe benefit expenses) was $35.4 million for 2008. Net mortgage banking income was2011, up $2.6 million or 8% from 2010. Average full-time equivalent employees (“FTEs”) were 576 for 2011, about the same as 577 for last year. Salary-related expenses increased $2.0 million for 2009,the year ended December 31, 2011, compared to $1.0 million in 2008,2010, reflecting an increase of $1.0 million from 2008,in estimated incentive compensation, which was previously limited under the TARP Capital Purchase Program. Fringe benefit expenses increased $672 thousand or 9%, primarily attributable to higher secondary mortgage production experienced during 2009medical expenses.
Professional services expense of $2.6 million in 2011 increased $420 thousand or 19% from 2010. Professional fees increased primarily due to legal and shareholder expenses related to our common stock offering and redemption of both our Series A preferred stock and junior subordinated debentures.
FDIC assessments decreased $1.0 million for the low interest rate environmentyear ended December 31, 2011, compared to 2010, primarily a result of changes implemented by the FDIC in the method of calculating assessment rates which became effective in the second quarter of 2011.
Advertising and promotions expenses were $138 thousand or 12% higher in 2011 compared to 2010 due to increases in business development expenses and the favorable impactopening of a new branch in suburban Rochester in the third quarter of 2011.
We redeemed all of the 10.20% junior subordinated debentures during 2011. As a result of the redemption, we recognized a loss on refinanceextinguishment of debt of $1.1 million, consisting of a redemption premium of $852 thousand and a write-off of the remaining unamortized issuance costs of $231 thousand.
Other noninterest expense decreased $404 thousand or 6% during 2011 compared to 2010. The 2010 expense includes a loss of approximately $1.0 million relating to irregular instances of fraudulent debit card activity. For additional discussion concerning
The efficiency ratio for the year ended December 31, 2011 was 60.55% compared with 60.36% for 2010. The efficiency ratio is a supplemental financial measure utilized in management’s internal evaluations and is not defined under generally accepted accounting principles. The efficiency ratio is calculated by dividing total noninterest expense, excluding other real estate expense, by net revenue, defined as the sum of tax-equivalent net interest income and noninterest income see section, “Noninterest Income.”
Income Taxes
We recognized income tax expense of $11.4 million for 2011 compared to $9.4 million for 2010. The change was due in part to a $3.6 million increase in pretax income between the years. In addition, during 2010, we recorded non-recurring tax benefits of $1.2 million related to valuation of our deferred tax assets as a result of the NYS repeal of the experience method for determining bad debts and forre-valuing at the highest Federal statutory rate of 35%. Our effective tax rates were 33.4% in 2011 and 30.5% in 2010. Effective tax rates are affected by income and expense items that are not subject to Federal or state taxation. Our income tax provision reflects the impact of such items, including tax-exempt interest income from municipal securities, tax-exempt earnings on bank-owned life insurance and the effect of certain state tax credits.
42
MANAGEMENTS DISCUSSION AND ANALYSIS
RESULTS OF OPERATIONS FOR THE YEARS ENDED
DECEMBER 31, 2010 AND DECEMBER 31, 2009
Net Interest Income and Net Interest Margin
Net interest income in the consolidated statements of income (which excludes the taxable equivalent adjustment) was $78.8 million in 2010, compared to $72.3 million in 2009. The taxable equivalent adjustments (the adjustments to bring tax-exempt interest to a level that would yield the same after-tax income had that income been subject to a taxation using a tax rate of 35% for 2010 and 34% for 2009) of $1.9 million and $2.7 million for 2010 and 2009, respectively, resulted in fully taxable equivalent net interest income of $80.7 million in 2010 and $75.0 million in 2009.
Taxable equivalent net interest income of $80.7 million for 2010 was $5.7 million or 8% higher than 2009. While the average yields on our loans and assets declined, the impact was far exceeded by the benefit of substantial loan production and asset growth. The average balance of loans rose $85.4 million to $1.295 billion, reflecting growth in the commercial and consumer indirect loan portfolios, as we have focused business development efforts in those areas, and the average balance of interest-earning assets rose $124.3 million to $1.981 billion, both increases of 7%.
The increase in taxable equivalent net interest income was a function of a favorable volume variance (because balance sheet changes in both volume and mix increased taxable equivalent net interest income by $6.3 million), partially offset by an unfavorable rate variance (decreasing taxable equivalent net interest income by $573 thousand). The change in mix and volume of earning assets increased taxable equivalent interest income by $6.8 million, while the change in volume and composition of interest-bearing liabilities increased interest expense by $499 thousand, for a net favorable volume impact of $6.3 million on taxable equivalent net interest income. Rate changes on earning assets reduced interest income by $5.6 million, while changes in rates on interest-bearing liabilities lowered interest expense by $5.0 million, for a net unfavorable rate impact of $573 thousand.
The net interest margin for 2010 was 4.07% compared to 4.04% in 2009. The 3 basis point improvement in net interest margin was attributable to a 10 basis point increase in interest rate spread (the net of a 36 basis point decrease in the cost of interest-bearing liabilities and a 26 basis decrease in the yield on earning assets), partially offset by a 7 basis point lower contribution from net free funds (primarily attributable to lower rates on interest-bearing liabilities reducing the relative value of noninterest-bearing deposits and other net free funds).
The Federal Reserve left the Federal funds rate unchanged at 0.25% during 2010 and 2009.
For 2010, the yield on average earning assets of 4.97% was 26 basis points lower than 2009. Loan yields decreased 15 basis points to 5.86%. Commercial mortgage and consumer indirect loans in particular, down 26 and 34 basis points, respectively, experienced lower yields given the competitive pricing pressures in a low interest rate environment. The yield on investment securities dropped 69 basis points to 3.31%, also impacted by the lower interest rate environment and prepayments of mortgage-related investment securities. Overall, earning asset rate changes reduced interest income by $5.6 million.
The cost of average interest-bearing liabilities of 1.10% in 2010 was 36 basis points lower than 2009. The average cost of interest-bearing deposits was 0.97% in 2010, 36 basis points lower than 2009, reflecting the lower rate environment, mitigated by a focus on product pricing to retain balances. The cost of wholesale funding (comprised of short-term borrowings and long-term borrowings) decreased 14 basis points to 3.33% for 2010. The interest-bearing liability rate changes resulted in $5.0 million lower interest expense.
Average interest-earning assets of $1.981 billion in 2010 were $124.3 million or 7% higher than 2009. Average investment securities increased $71.2 million, mostly in high quality U.S. Government agency securities. Average loans increased $85.4 million or 7%, with a $33.3 million increase in commercial loans and a $74.2 million increase in consumer loans, offset by a $22.1 million decrease in residential mortgage loans.
Average interest-bearing liabilities of $1.610 billion in 2010 were up $85.1 million or 6% versus 2009, mainly attributable to higher average retail deposit balances. The impacts of the recent recession have had a positive impact on our deposit balances, as consumers tend to save more conservatively when consumer confidence is low. On average, interest-bearing deposits grew $89.0 million, while average noninterest-bearing demand deposits (a principal component of net free funds) increased by $36.0 million. Average borrowings decreased $3.9 million, net of the $6.0 million increase and $9.9 million decrease in short-term and long-term borrowings, respectively.
Provision for Loan Losses
The provision for loan losses of $67.9was $6.7 million for 2008,the year ended December 31, 2010 compared with $7.7 million for 2009.
43
MANAGEMENTS DISCUSSION AND ANALYSIS
Noninterest Income
Service charges on deposits were $9.6 million in 2010, which was $480 thousand or 5% lower than 2009. The decrease was primarily attributable to other-than-temporary write-downslower nonsufficient funds fees in 2010, which were down $407 thousand to $7.9 million. In November 2009, the FRB issued a final rule that, effective July 1, 2010, prohibited financial institutions from charging consumers fees for paying overdrafts on investment securities.
ATM and debit card income was $62.8$4.0 million for 2010, an increase of $5.3$385 thousand or 11%, compared to 2009, due to higher interchange fees resulting from an increase in the number of cardholders and an increase in customer transactions.
Broker-dealer fees and commissions were up $261 thousand or 26%, compared to 2009. Broker-dealer fees and commissions fluctuate mainly due to sales volume, which increased during 2010 as a result of improving market and economic conditions.
Loan servicing income decreased $184 thousand for the year ended December 31, 2010 compared to 2009, mainly as a result of more rapid amortization of servicing rights due to loans paying off prior to maturity and lower fees collected due to a decrease in the sold and serviced portfolio.
We recognized $425 thousand in net losses on investment securities during the year ended December 31, 2010 as compared to $1.2 million or 9% over 2008. FDIC assessments increased $3.0of net losses during the same period in 2009. The investment security net losses for 2010 resulted from other-than-temporary impairment charges of $594 thousand, partly offset by $169 thousand of gains from sales and calls of investment securities. The 2010 OTTI charges primarily related to pooled trust preferred securities that were designated as impaired in the first quarter of that year due to credit quality. The $1.2 million salariesof investment security losses for 2009 are a result of $4.7 million of other-than-temporary impairment charges, partly offset by $3.4 million of gains on the sale of securities.
Noninterest Expense
Salaries and employee benefits increasedwas $32.8 million for 2010, down $823 thousand or 2% from 2009. Average full-time equivalent employees (“FTEs”) were 577 for 2010, down 2% from 586 for 2009. Salary-related expenses were relatively unchanged at $25.3 million for 2010 and $25.2 million for 2009. Fringe benefit expenses decreased $876 thousand or 10%, primarily attributable to lower pension costs.
FDIC assessments, comprised mostly of deposit insurance paid to the FDIC, decreased $1.1 million for the year ended December 31, 2010, due primarily to the one-time special assessment of $923 thousand incurred in the second quarter of 2009. FDIC assessment rates have also declined as a result of our improved financial ratios, upon which the assessment rate is based.
Professional services expense of $2.2 million in 2010 decreased $327 thousand or 13% from 2009, primarily due to lower legal costs associated with loan workouts and collectively all remainingother corporate activities.
Advertising and promotions expenses were $172 thousand or 18% higher in 2010 compared to 2009 due to increases in business development expenses.
Other noninterest expense categories were up $142increased $433 thousand or 6% during 2010 compared to 2008. 2009. This increase was primarily due to a loss of approximately $1.0 million relating to irregular instances of fraudulent debit card activity that we recorded in the fourth quarter of 2010.
The efficiency ratio (as defined under Part II, Item 6, “Selected Financial Data”) wasfor the year ended December 31, 2010 improved to 60.36% compared with 65.52% for 2009 and 64.07% for 2008. For additional discussion regarding noninterest expense see section, “Noninterest Expense.”
Income Taxes
We recognized income tax expense of $9.4 million for 2009 was2010 compared to $6.1 million compared to income tax benefit of $21.3 million for 2008.2009. The change in income tax expense was primarily due to thea $10.1 million increase toin pretax income from a pretax loss between the years. For additional discussion concerning incomeWe also recorded non-recurring tax see section, “Income Taxes.”
- 33 -
ANALYSIS OF FINANCIAL CONDITION
OVERVIEW
At December 31, 2009, the Company2011, we had total assets of $2.062$2.336 billion, an increase of 8%6% from $1.917$2.214 billion as of December 31, 2008,2010, primarily a result of the continued growth of its core business ofgrowth in both loans and deposits. Loans totaled $1.264Net loans were $1.462 billion as of December 31, 2009,2011, up $142.9$136.0 million, or 13%10%, when compared to $1.121$1.326 billion as of December 31, 2008.2010. The increase in net loans was primarily attributed to the continued expansion of the indirect lending program in existing and new markets and commercial business development efforts. NonperformingNon-performing assets totaled $10.4$9.2 million as of December 31, 2009,2011, up $1.2 million$292 thousand from a year ago, primarily due to the addition ofago. An increase in non-performing investment securities for which the Company haswe have stopped accruing interest.interest was partly offset by a decrease in non-performing loans and a decrease in foreclosed assets. Total deposits amounted to $1.743$1.932 billion and $1.633$1.883 billion as of December 31, 20092011 and 2008,2010, respectively. As of December 31, 2009, total2011, borrowed funds were $106.4totaled $150.7 million, comparablecompared to $70.8$103.9 million as of December 31, 2008.2010. Book value per common share was $13.39$15.92 and $12.71$14.48 as of December 31, 20092011 and 2008,2010, respectively. As of December 31, 2009 the Company’s2011 our total shareholders’ equity was $198.3$237.2 million compared to $190.3$212.1 million a year earlier.
INVESTING ACTIVITIES
The following table summarizes the composition of the available for sale and held to maturity security portfolios (in thousands).
| Investment Securities Portfolio Composition | ||||||||||||||||||||||||
| At December 31, | ||||||||||||||||||||||||
| 2009 | 2008 | 2007 | ||||||||||||||||||||||
| Amortized | Fair | Amortized | Fair | Amortized | Fair | |||||||||||||||||||
| Cost | Value | Cost | Value | Cost | Value | |||||||||||||||||||
Securities available for sale: | ||||||||||||||||||||||||
| U.S. Government agency and government-sponsored enterprise securities | $ | 134,564 | $ | 134,105 | $ | 67,871 | $ | 68,173 | $ | 158,920 | $ | 158,940 | ||||||||||||
| State and political subdivisions | 80,812 | 83,659 | 129,572 | 131,711 | 171,294 | 172,601 | ||||||||||||||||||
| Mortgage-backed securities: | ||||||||||||||||||||||||
| Agency mortgage-backed securities | 356,044 | 356,355 | 297,278 | 303,105 | 239,427 | 238,101 | ||||||||||||||||||
| Non-Agency mortgage-backed securities | 5,087 | 5,160 | 42,296 | 39,447 | 58,371 | 57,771 | ||||||||||||||||||
| Asset-backed securities | 1,295 | 1,222 | 3,918 | 3,918 | 34,115 | 33,198 | ||||||||||||||||||
| Equity securities | — | — | 923 | 1,152 | 33,930 | 34,630 | ||||||||||||||||||
| Total available for sale securities | 577,802 | 580,501 | 541,858 | 547,506 | 696,057 | 695,241 | ||||||||||||||||||
Securities held to maturity: | ||||||||||||||||||||||||
| State and political subdivisions | 39,573 | 40,629 | 58,532 | 59,147 | 59,479 | 59,902 | ||||||||||||||||||
| Total investment securities | $ | 617,375 | $ | 621,130 | $ | 600,390 | $ | 606,653 | $ | 755,536 | $ | 755,143 | ||||||||||||
| September 30, | September 30, | September 30, | September 30, | September 30, | September 30, | |||||||||||||||||||
| Investment Securities Portfolio Composition | ||||||||||||||||||||||||
| At December 31, | ||||||||||||||||||||||||
| 2011 | 2010 | 2009 | ||||||||||||||||||||||
| Amortized | Fair | Amortized | Fair | Amortized | Fair | |||||||||||||||||||
| Cost | Value | Cost | Value | Cost | Value | |||||||||||||||||||
Securities available for sale: | ||||||||||||||||||||||||
U.S. Government agency and government-sponsored enterprise securities | $ | 94,947 | $ | 97,712 | $ | 141,591 | $ | 140,784 | $ | 134,564 | $ | 134,105 | ||||||||||||
State and political subdivisions | 119,099 | 124,424 | 105,622 | 105,666 | 80,812 | 83,659 | ||||||||||||||||||
Mortgage-backed securities: | ||||||||||||||||||||||||
Agency mortgage-backed securities | 390,375 | 401,596 | 414,502 | 417,709 | 356,044 | 356,355 | ||||||||||||||||||
Non-Agency mortgage-backed securities | 327 | 2,089 | 981 | 1,572 | 5,087 | 5,160 | ||||||||||||||||||
Asset-backed securities | 297 | 1,697 | 564 | 637 | 1,295 | 1,222 | ||||||||||||||||||
|
|
|
|
|
|
|
|
|
|
|
| |||||||||||||
Total available for sale securities | 605,045 | 627,518 | 663,260 | 666,368 | 577,802 | 580,501 | ||||||||||||||||||
Securities held to maturity: | ||||||||||||||||||||||||
State and political subdivisions | 23,297 | 23,964 | 28,162 | 28,849 | 39,573 | 40,629 | ||||||||||||||||||
|
|
|
|
|
|
|
|
|
|
|
| |||||||||||||
Total investment securities | $ | 628,342 | $ | 651,482 | $ | 691,422 | $ | 695,217 | $ | 617,375 | $ | 621,130 | ||||||||||||
|
|
|
|
|
|
|
|
|
|
|
| |||||||||||||
- 34 -
We review investment securities on an ongoing basis for the presence of other-than-temporary-impairment (“OTTI”)OTTI with formal reviews performed quarterly. Declines in the fair value of held-to-maturity and available-for-sale securities below their cost that are deemed to be other than temporary are reflected in earnings as realized losses to the extent the impairment is related to credit losses or the security is no longer intended to be held until the recovery of amortized cost.sold or will be required to be sold. The amount of the impairment related to othernon-credit related factors is recognized in other comprehensive income. Evaluating whether the impairment of a debt security is other than temporary involves assessing i.) the intent to sell the debt security or ii.) the likelihood of being required to sell the security before the recovery of its amortized cost basis. In determining whether the other-than temporaryother-than-temporary impairment includes a credit loss, the Company uses itswe use our best estimate of the present value of cash flows expected to be collected from the debt security considering factors such as: a.) the length of time and the extent to which the fair value has been less than the amortized cost basis, b.) adverse conditions specifically related to the security, an industry, or a geographic area, c.) the historical and implied volatility of the fair value of the security, d.) the payment structure of the debt security and the likelihood of the issuer being able to make payments that increase in the future, e.) failure of the issuer of the security to make scheduled interest or principal payments, f.) any changes to the rating of the security by a rating agency, and g.) recoveries or additional declines in fair value subsequent to the balance sheet date.
45
MANAGEMENTS DISCUSSION AND ANALYSIS
As of December 31, 2009,2011, management does not have the intent to sell any of the securities in a loss position and believes that it is not likely that it will not be required to sell any such securities before the anticipated recovery of amortized cost. The unrealized losses are largely due to increases in market interest rates over the yields available at the time the underlying securities were purchased. The fair value is expected to recover as the bonds approach their maturity date, or repricing date or if market yields for such investments decline. Management does not believe any of the securities in a loss position are impaired due to reasons of credit quality. Accordingly, as of December 31, 2009,2011, management has concluded that unrealized losses on its investment securities are temporary and no further impairment loss has been realized in the Company’sour consolidated statements of operations.income. The following discussion provides further details of the Company’sour assessment of the securities portfolio by investment category.
The table below summarizes unrealized losses in each category of the securities portfolio at the end of the periods indicated (in thousands).
| Unrealized Losses on Investment Securities | ||||||||||||||||||||||||
| At December 31, | ||||||||||||||||||||||||
| 2009 | 2008 | 2007 | ||||||||||||||||||||||
| Unrealized | % of | Unrealized | % of | Unrealized | % of | |||||||||||||||||||
| Losses | Total | Losses | Total | Losses | Total | |||||||||||||||||||
Securities available for sale: | ||||||||||||||||||||||||
| U.S. Government agency and government-sponsored enterprise securities | $ | 545 | 19.8 | % | $ | 307 | 7.3 | % | $ | 324 | 7.5 | % | ||||||||||||
| State and political subdivisions | 3 | 0.1 | 42 | 1.0 | 261 | 6.0 | ||||||||||||||||||
| Mortgage-backed securities: | ||||||||||||||||||||||||
| Agency mortgage-backed securities | 1,638 | 59.3 | 981 | 23.1 | 1,868 | 43.2 | ||||||||||||||||||
| Non-Agency mortgage-backed securities | 330 | 12.0 | 2,854 | 67.3 | 890 | 20.6 | ||||||||||||||||||
| Asset-backed securities | 244 | 8.8 | — | — | 972 | 22.5 | ||||||||||||||||||
| Equity securities | — | — | 52 | 1.2 | — | — | ||||||||||||||||||
| Total available for sale securities | 2,760 | 100.0 | 4,236 | 99.9 | 4,315 | 99.8 | ||||||||||||||||||
Securities held to maturity: | ||||||||||||||||||||||||
| State and political subdivisions | — | — | 4 | 0.1 | 8 | 0.2 | ||||||||||||||||||
| Total investment securities | $ | 2,760 | 100.0 | % | $ | 4,240 | 100.0 | % | $ | 4,323 | 100.0 | % | ||||||||||||
| September 30, | September 30, | September 30, | September 30, | September 30, | September 30, | |||||||||||||||||||
| Unrealized Losses on Investment Securities | ||||||||||||||||||||||||
| At December 31, | ||||||||||||||||||||||||
| 2011 | 2010 | 2009 | ||||||||||||||||||||||
| Unrealized | % of | Unrealized | % of | Unrealized | % of | |||||||||||||||||||
| Losses | Total | Losses | Total | Losses | Total | |||||||||||||||||||
Securities available for sale: | ||||||||||||||||||||||||
U.S. Government agency and government-sponsored enterprise securities | $ | 5 | 11.9 | % | $ | 1,965 | 31.6 | % | $ | 545 | 19.8 | % | ||||||||||||
State and political subdivisions | 11 | 26.2 | 1,472 | 23.6 | 3 | 0.1 | ||||||||||||||||||
Mortgage-backed securities: | ||||||||||||||||||||||||
Agency mortgage-backed securities | 26 | 61.9 | 2,655 | 42.7 | 1,638 | 59.3 | ||||||||||||||||||
Non-Agency mortgage-backed securities | — | — | — | — | 330 | 12.0 | ||||||||||||||||||
Asset-backed securities | — | — | 131 | 2.1 | 244 | 8.8 | ||||||||||||||||||
|
|
|
|
|
|
|
|
|
|
|
| |||||||||||||
Total investment securities | $ | 42 | 100.0 | % | $ | 6,223 | 100.0 | % | $ | 2,760 | 100.0 | % | ||||||||||||
|
|
|
|
|
|
|
|
|
|
|
| |||||||||||||
There were no unrealized losses on investment securities classified as held to maturity as of December 31, 2011, 2010 and 2009.
U.S. Government Agencies and Government Sponsored Enterprises (“GSE”).As of December 31, 2009,2011, there were 30five securities in the U.S. Government agencies and GSE portfolio that were in an unrealized loss position. These securities had an aggregate amortized cost of $94.0 million andwith unrealized losses of $545totaling $5 thousand. Of the securities in an unrealized loss position, 8 securities with a total amortized cost of $10.0 million and unrealized losses of $185 thousandthese, four were in an unrealized loss position for 12 months or longer. longer and had an aggregate amortized cost of $5.3 million and unrealized losses of $4 thousand. The decline in fair value is attributable to changes in interest rates, and not credit quality, and because we do not have the intent to sell these securities and it is likely that we will not be required to sell the securities before their anticipated recovery, we do not consider these securities to be other-than-temporarily impaired at December 31, 2011.
State and Political Subdivisions.As of December 31, 2011, the state and political subdivisions (“municipals”) portfolio totaled $147.7 million, of which $124.4 million was classified as available for sale. As of that date, $23.3 million was classified as held to maturity with a fair value of $24.0 million. As of December 31, 2011, there were three municipals in an unrealized loss position, all of which were available for sale. Of these, one was in an unrealized loss position for 12 months or longer, and had an aggregate amortized cost of $655 thousand and an unrealized loss of $9 thousand.
Although there has been a considerable amount of negative information regarding municipal entities in certain states in the U.S., our portfolio is concentrated in municipalities within our geographic footprint and there is currently no indication that the underlying credit issuers (counties, towns, villages, cities, schools, etc.) are likely to default on their debt. Additionally, most of the available for sale bonds are General Obligation issues that require the taxing authority to increase taxes as needed to repay the bond holders.
Because the decline in fair value is attributable to changes in interest rates, and illiquidity, and not credit quality, and because the Company doeswe do not have the intent to sell these securities and it is not likely that itwe will not be required to sell the securities before their anticipated recovery, the Company doeswe do not consider these securities to be other-than-temporarily impaired at December 31, 2009.
2011.
- 35 -
46
MANAGEMENTS DISCUSSION AND ANALYSIS
As of December 31, 2011, there were six securities within the U.S. Government agencies and GSE portfolio that were in an unrealized loss position. Of these, only four were in an unrealized loss position for 12 months or longer and had an aggregate amortized cost totaling $152.9of $2.2 million during the year ended December 31, 2009, and realized a gainunrealized losses of $5.9 million on those sales.
Non-Agency Mortgage-backed Securities.The Company’sOur non-Agency MBS portfolio consists of positions in fivethree privately issued whole loan collateralized mortgage obligations with a fair value of $5.2$2.1 million and net unrealized gains of approximately $70 thousand at$1.8 million as of December 31, 2009.2011. As of that date, there were two non-Agency MBS with an aggregate amortized costeach of $3.3 million and unrealized losses of $330 thousand that have been in an unrealized loss position for 12 months or longer.
Asset-backed Securities (“ABS”).As of December 31, 2009,2011, the carryingfair value of the ABS portfolio totaled $1.3$1.7 million and consisted of positions in 15eleven securities, the majority of which are pooled trust preferred securities (“TPS”) collateralized by preferred debt issued primarily by financial institutions and, to a lesser extent, insurance companies located throughout the United States. As a result of some issuers defaulting and others electing to defer interest payments, on the preferred debt which collateralize the securities, the Companywe considered the TPS to be non-performing and stopped accruing interest on the investments during 2009.
Since the second quarter of 2008, the Company haswe have written down each of the securities in the ABS portfolio, resulting in aggregate OTTI charges totaling $32.3of $22.5 million through December 31, 2009. The Company expects2011. We expect to recover the remaining carrying valueamortized cost of $1.3 million, representing the Company’s maximum exposure to future OTTI charges$297 thousand on the current ABS portfolio.securities. As of December 31, 2009,2011, each of the securities in the ABS portfolio was rated below investment grade. There were 9 ABS securities in a loss position with an aggregate amortized cost of $522 thousand and unrealized losses totaling $244 thousand as of December 31, 2009. EachNone of these securities has beenwere in an unrealized loss positionposition.
The market for less than 12 months.
Other Investments.Recently, credit concern surrounding the Federal Home Loan Bank system has been widespread. As a member of the FHLB the Bank is required to hold FHLB stock. The amount of required FHLB stock is based on the Bank’s asset size and the amount of borrowings from the FHLB. The Company hasWe have assessed the ultimate recoverability of itsour FHLB stock and believesbelieve that no impairment currently exists. The Company’s ownership of FHLB stock, which totaled $3.3 million at December 31, 2009, is included in other assets and recorded at cost.
- 36 -
| As of December 31, 2009 | OTTI losses recognized in earnings | |||||||||||||||||||||||||||||||
| Number | Unrealized | For the year ended | ||||||||||||||||||||||||||||||
| Current | of | Par | Amortized | Fair | Gains | December 31, | Total | |||||||||||||||||||||||||
| Rating(1) | Cusips | Value | Cost | Value | (Losses) | 2008 | 2009 | to Date | ||||||||||||||||||||||||
Securities with unrealized gains: | ||||||||||||||||||||||||||||||||
| Non-Agency MBS: | ||||||||||||||||||||||||||||||||
| Ba1/CCC | 1 | $ | 1,404 | $ | 609 | $ | 646 | $ | 37 | $ | 626 | $ | 166 | $ | 792 | |||||||||||||||||
CC/B(2) | 1 | 2,411 | 672 | 672 | — | 1,240 | 494 | 1,734 | ||||||||||||||||||||||||
CC(3) | 1 | 3,814 | 492 | 859 | 367 | 3,513 | — | 3,513 | ||||||||||||||||||||||||
| 3 | 7,629 | 1,773 | 2,177 | 404 | 5,379 | 660 | 6,039 | |||||||||||||||||||||||||
| Asset-backed securities: | ||||||||||||||||||||||||||||||||
Baa3/CC(4) | 1 | 661 | 68 | 206 | 138 | 545 | 50 | 595 | ||||||||||||||||||||||||
Caa2/CCC(5) | 1 | 1,996 | 36 | 36 | — | 1,615 | 313 | 1,928 | ||||||||||||||||||||||||
Caa3/CC(6) | 1 | 3,000 | 59 | 70 | 11 | 2,860 | — | 2,860 | ||||||||||||||||||||||||
Ca/CCC(5) | 1 | 2,977 | 37 | 56 | 19 | 2,435 | 476 | 2,911 | ||||||||||||||||||||||||
Ca/CC(6) | 2 | 9,050 | 573 | 576 | 3 | 7,773 | 495 | 8,268 | ||||||||||||||||||||||||
| 6 | 17,684 | 773 | 944 | 171 | 15,228 | 1,334 | 16,562 | |||||||||||||||||||||||||
| Total securities with unrealized gains | 9 | 25,313 | 2,546 | 3,121 | 575 | 20,607 | 1,994 | 22,601 | ||||||||||||||||||||||||
Securities with unrealized losses: | ||||||||||||||||||||||||||||||||
| Asset-backed securities: | ||||||||||||||||||||||||||||||||
Ca/CC(6) | 4 | 6,392 | 337 | 166 | (171 | ) | 5,481 | 437 | 5,918 | |||||||||||||||||||||||
| Ca/C | 2 | 3,144 | 45 | 28 | (17 | ) | 2,826 | 147 | 2,973 | |||||||||||||||||||||||
C/CC(6) | 2 | 5,029 | 80 | 65 | (15 | ) | 4,570 | 388 | 4,958 | |||||||||||||||||||||||
| Ca/D | 1 | 2,000 | 60 | 18 | (42 | ) | 1,868 | 8 | 1,876 | |||||||||||||||||||||||
| Total securities with unrealized losses | 9 | 16,565 | 522 | 277 | (245 | ) | 14,745 | 980 | 15,725 | |||||||||||||||||||||||
| 18 | $ | 41,878 | $ | 3,068 | $ | 3,398 | $ | 330 | $ | 35,352 | $ | 2,974 | $ | 38,326 | ||||||||||||||||||
LENDING ACTIVITIES
Total loans were rated below investment grade. At the time of sale, the securities had a combined adjusted carrying value of $4.1 million. The adjusted carrying value reflects impairment charges of $1.7 million and $539 thousand taken against the securities during the years ended$1.485 billion at December 31, 20092011, an increase of $138.8 million or 10% from December 31, 2010. Commercial loans increased $63.1 million or 11% and 2008, respectively.
- 37 -
| Loan Portfolio Composition | ||||||||||||||||||||||||||||||||||||||||
| At December 31, | ||||||||||||||||||||||||||||||||||||||||
| 2009 | 2008 | 2007 | 2006 | 2005 | ||||||||||||||||||||||||||||||||||||
| Amount | Percent | Amount | Percent | Amount | Percent | Amount | Percent | Amount | Percent | |||||||||||||||||||||||||||||||
| Commercial | $ | 186,386 | 14.8 | % | $ | 158,543 | 14.1 | % | $ | 136,780 | 14.2 | % | $ | 105,806 | 11.4 | % | $ | 116,444 | 11.7 | % | ||||||||||||||||||||
| Commercial real estate | 308,873 | 24.4 | 262,234 | 23.4 | 245,797 | 25.5 | 243,966 | 26.4 | 264,727 | 26.7 | ||||||||||||||||||||||||||||||
| Agricultural | 41,872 | 3.3 | 44,706 | 4.0 | 47,367 | 4.9 | 56,808 | 6.1 | 75,018 | 7.5 | ||||||||||||||||||||||||||||||
| Residential real estate | 144,215 | 11.4 | 177,683 | 15.8 | 166,863 | 17.3 | 163,243 | 17.6 | 168,498 | 17.0 | ||||||||||||||||||||||||||||||
| Consumer indirect | 352,611 | 27.9 | 255,054 | 22.8 | 134,977 | 14.0 | 106,443 | 11.5 | 85,237 | 8.6 | ||||||||||||||||||||||||||||||
| Consumer direct and home equity | 230,049 | 18.2 | 222,859 | 19.9 | 232,389 | 24.1 | 250,216 | 27.0 | 282,397 | 28.5 | ||||||||||||||||||||||||||||||
| Total loans | 1,264,006 | 100.0 | % | 1,121,079 | 100.0 | % | 964,173 | 100.0 | % | 926,482 | 100.0 | % | 992,321 | 100.0 | % | |||||||||||||||||||||||||
| Allowance for loan losses | 20,741 | 18,749 | 15,521 | 17,048 | 20,231 | |||||||||||||||||||||||||||||||||||
| Total loans, net | $ | 1,243,265 | $ | 1,102,330 | $ | 948,652 | $ | 909,434 | $ | 972,090 | ||||||||||||||||||||||||||||||
| XXXXX | XXXXX | XXXXX | XXXXX | XXXXX | XXXXX | XXXXX | XXXXX | XXXXX | XXXXX | |||||||||||||||||||||||||||||||
| Loan Portfolio Composition | ||||||||||||||||||||||||||||||||||||||||
| At December 31, | ||||||||||||||||||||||||||||||||||||||||
| 2011 | 2010 | 2009 | 2008 | 2007 | ||||||||||||||||||||||||||||||||||||
| Amount | Percent | Amount | Percent | Amount | Percent | Amount | Percent | Amount | Percent | |||||||||||||||||||||||||||||||
Commercial business | $ | 233,836 | 15.7 | % | $ | 211,031 | 15.7 | % | $ | 206,383 | 16.3 | % | $ | 180,100 | 16.1 | % | $ | 157,550 | 16.3 | % | ||||||||||||||||||||
Commercial mortgage | 393,244 | 26.5 | 352,930 | 26.2 | 330,748 | 26.2 | 285,383 | 25.5 | 272,394 | 28.3 | ||||||||||||||||||||||||||||||
|
|
|
|
|
|
|
|
|
|
|
|
|
|
|
|
|
|
|
| |||||||||||||||||||||
Total commercial | 627,080 | 42.2 | 563,961 | 41.9 | 537,131 | 42.5 | 465,483 | 41.6 | 429,944 | 44.6 | ||||||||||||||||||||||||||||||
Residential mortgage | 113,911 | 7.7 | 129,580 | 9.6 | 144,215 | 11.4 | 177,683 | 15.8 | 166,863 | 17.3 | ||||||||||||||||||||||||||||||
Home equity | 231,766 | 15.6 | 208,327 | 15.5 | 200,684 | 15.9 | 189,794 | 16.9 | 194,144 | 20.1 | ||||||||||||||||||||||||||||||
Consumer indirect | 487,713 | 32.9 | 418,016 | 31.1 | 352,611 | 27.9 | 255,054 | 22.8 | 134,977 | 14.0 | ||||||||||||||||||||||||||||||
Other consumer | 24,306 | 1.6 | 26,106 | 1.9 | 29,365 | 2.3 | 33,065 | 2.9 | 38,245 | 4.0 | ||||||||||||||||||||||||||||||
�� |
|
|
|
|
|
|
|
|
|
|
|
|
|
|
|
|
|
|
| |||||||||||||||||||||
Total consumer | 743,785 | 50.1 | 652,449 | 48.5 | 582,660 | 46.1 | 477,913 | 42.6 | 367,366 | 38.1 | ||||||||||||||||||||||||||||||
|
|
|
|
|
|
|
|
|
|
|
|
|
|
|
|
|
|
|
| |||||||||||||||||||||
Total loans | 1,484,776 | 100.0 | % | 1,345,990 | 100.0 | % | 1,264,006 | 100.0 | % | 1,121,079 | 100.0 | % | 964,173 | 100.0 | % | |||||||||||||||||||||||||
Allowance for loan losses | 23,260 | 20,466 | 20,741 | 18,749 | 15,521 | |||||||||||||||||||||||||||||||||||
|
|
|
|
|
|
|
|
|
| |||||||||||||||||||||||||||||||
Total loans, net | $ | 1,461,516 | $ | 1,325,524 | $ | 1,243,265 | $ | 1,102,330 | $ | 948,652 | ||||||||||||||||||||||||||||||
|
|
|
|
|
|
|
|
|
| |||||||||||||||||||||||||||||||
The decrease in residential mortgage loans from $144.2 million to $129.6 million to $113.9 million for the periods ending December 31, 2009, 2010 and 2011, respectively, and the increase in consumer indirect loans from $352.6 million to $418.0 million to $487.7 million for the same periods reflects a strategic shift to increase our consumer indirect loan portfolio, while placing less emphasis on expanding our residential mortgage loan portfolio, coupled with our practice of selling the majority of our fixed-rate residential mortgages in the secondary market with servicing rights retained.
Commercial loans are generally viewed as having more inherent risk of default than residential mortgage or consumer loans. Also, the commercial loan balance per borrower is typically larger than that for residential mortgage and consumer loans, inferring higher potential losses on an individual customer basis. Commercial loans increased 13%,during 2011 as we continued our commercial business development efforts. The credit risk related to commercial loans is largely influenced by general economic conditions and the resulting impact on a borrower’s operations or $142.9on the value of underlying collateral, if any.
The Company participates in various lending programs in which guarantees are supplied by U.S. government agencies, such as the SBA, U.S. Department of Agriculture, Rural Economic and Community Development and Farm Service Agency, among others. As of December 31, 2011, the principal balance of such loans (included in commercial loans) was $60.1 million and the guaranteed portion amounted to $1.264 billion$42.5 million. Most of these loans were guaranteed by the SBA.
Commercial business loans were $233.8 million at the end of 2011, up $22.8 million or 11% since year-end 2010, and comprised 15.7% of total loans outstanding at December 31, 2011 and 2010. We typically originate business loans of up to $15.0 million for small to mid-sized businesses in our market area for working capital, equipment financing, inventory financing, accounts receivable financing, or other general business purposes. Loans of this type are in a diverse range of industries. Within the commercial business classification, loans to finance agricultural production totaled approximately 1% of commercial business loans as of December 31, 2009 from $1.121 billion as2011. As of December 31, 2008, primarily attributed2011, commercial business SBA loans accounted for a total of $32.9 million or 14% of our commercial business loan portfolio.
Commercial mortgage loans totaled $393.2 million at December 31, 2011, up $40.3 million or 11% from December 31, 2010, and comprised 26.5% of total loans, compared to the expansion26.2% at December 31, 2010. Commercial mortgage includes both owner occupied and non-owner occupied commercial real estate loans. Approximately 45% and 51% of the indirect lending programcommercial mortgage portfolio at December 31, 2011 and 2010, respectively, was owner occupied commercial business development efforts, offset by a reduction in agricultural and residential real estate loans.
48
MANAGEMENTS DISCUSSION AND ANALYSIS
Our current lending standards for commercial real estate and real estate construction lending are determined by property type and specifically address many criteria, including: maximum loan amounts, maximum loan-to-value (“LTV”), requirements for pre-leasing and / or pre-sales, minimum debt-service coverage ratios, minimum borrower equity, and maximum loan to cost. Currently, the maximum standard for LTV is 85%, with lower limits established for certain higher risk types, such as raw land which has a 65% LTV maximum. Our LTV guidelines are in compliance with regulatory supervisory limits.
Residential mortgage loans totaled $113.9 million at the end of 2011, down $15.7 million or 12% from $420.8 million asthe prior year and comprised 7.7% of total loans outstanding at December 31, 2008, a result of the Company’s continued focus on commercial business development programs. Agricultural loans decreased $2.8 million, to $41.9 million as of2011 and 9.6% at December 31, 2009 from $44.7 million as2010. Residential mortgage loans include conventional first lien home mortgages and we generally limit the maximum loan to 85% of December 31, 2008. Competitioncollateral value without credit enhancement (e.g. PMI insurance). As part of management’s historical practice of originating and adherence to strict credit standards has led to payments outpacing new loan originationsservicing residential mortgage loans, the majority of our fixed-rate residential mortgage loans are sold in the agricultural portfolio.
Our underwriting guidelines for consumer-related real estate loans decreased $33.5include a combination of borrower FICO (credit score), the LTV of the property securing the loan and evidence of the borrower having sufficient income to repay the loan. Currently, for home equity products, the maximum acceptable LTV is 90%. The average FICO score for new home equity production in 2011 was 755 comparable to 759 in 2010. Residential mortgage products continue to be underwritten using FHLMC and FNMA secondary marketing guidelines.
Consumer loans totaled $743.8 million to $144.2 million as ofat December 31, 20092011, up $91.3 million or 14% compared to 2010, and represented 50.1% of the 2011 year-end loan portfolio versus 48.5% at year-end 2010. Loans in comparisonthis classification include indirect consumer, home equity and other consumer installment loans. Credit risk for these types of loans is generally influenced by general economic conditions, the characteristics of individual borrowers, and the nature of the loan collateral. Risks of loss are generally on smaller average balances per loan spread over many borrowers. Once charged off, there is usually less opportunity for recovery on these smaller retail loans. Credit risk is primarily controlled by reviewing the creditworthiness of the borrowers, monitoring payment histories, and taking appropriate collateral and guaranty positions.
Consumer indirect loans amounted to $177.7$487.7 million as ofat December 31, 2008. This category of loans decreased as the majority of newly originated2011 up $69.7 million or 17% compared to 2010, and refinanced residential mortgages were sold to the secondary market. In addition, the Company securitized and sold $16.0 million in residential real estate loans during the second quarter of 2009. The Company does not engage in sub-prime or other high-risk residential mortgage lending as a line-of-business.
Home equity consists of home equity lines, as well as home equity loans, some of which are first lien positions. Home equities amounted to $231.8 million at December 31, 2011 up $23.4 million or 11% compared to 2010, and represented 15.6% of the 2011 year-end loan portfolio versus 15.5% at year-end 2010. The portfolio had a weighted average LTV at origination of approximately 53% and 52% at December 31, 2011 and 2010, respectively. Approximately 69% of the loans in the home equity portfolio are first lien positions at December 31, 2011, compared to 63% at December 31, 2010.
Other consumer loans during economic downturns as increased unemploymenttotaled $24.3 million at December 31, 2011, down $1.8 million or 7% compared to 2010, and inflationary costs may make it more difficult for some borrowers to repay their loans. While the asset quality of these portfolios is currently good, deterioration in the economyrepresented 1.6% of the regions where these2011 year-end loan portfolio versus 1.9% at year-end 2010. Other consumer consists of personal loans were extended could have(collateralized and uncollateralized) and deposit account collateralized loans.
Factors that are important to managing overall credit quality are sound loan underwriting and administration, systematic monitoring of existing loans and commitments, effective loan review on an adverse impactongoing basis, early identification of potential problems, an appropriate allowance for loan losses, and sound nonaccrual and charge off policies.
An active credit risk management process is used for commercial loans to further ensure that sound and consistent credit decisions are made. Credit risk is controlled by detailed underwriting procedures, comprehensive loan administration, and periodic review of borrowers’ outstanding loans and commitments. Borrower relationships are formally reviewed and graded on the amountan ongoing basis for early identification of credit losses the Company experiencespotential problems. Further analyses by customer, industry, and geographic location are performed to monitor trends, financial performance, and concentrations.
The loan portfolio is widely diversified by types of borrowers, industry groups, and market areas within our core footprint. Significant loan concentrations are considered to exist for a financial institution when there are amounts loaned to numerous borrowers engaged in the future.
49
MANAGEMENTS DISCUSSION AND ANALYSIS
Loans Held for Sale and MortgageLoan Servicing Rights.Loans held for sale (not included in the loan portfolio composition table) were entirely comprised of residential real estate mortgages and totaled $421 thousand$2.4 million and $1.0$3.1 million as of December 31, 20092011 and 2008, respectively, all of which were residential real estate loans.
We sell certain qualifying newly originated andor refinanced residential real estate mortgages on the secondary market. The sold and serviced residentialResidential real estate loan portfolio increasedmortgages serviced for others, which are not included in the consolidated statements of financial condition, amounted to $349.8$297.8 million and $328.9 million as of December 31, 20092011 and 2010, respectively.
During 2011, we sold $13.0 million of indirect auto loans, recognizing a gain of $153 thousand. The loans were reclassified from $315.7 million as of December 31, 2008. The increase in the sold and serviced portfolio resulted from an increase in residential loan origination and refinancing volumes, complemented by the Company’s securitization andto loans held for sale of $16.0 million in residential real estate loans during the second quarter of 2009.
2011. As of December 31, 2011, a loan servicing asset for the sold and serviced indirect auto loans of $574 thousand is included in other assets in the consolidated statements of financial condition.
- 38 -
The following table summarizes the activity in the allowance for loan losses (in thousands).
| Loan Loss Analysis | ||||||||||||||||||||
| Year Ended December 31, | ||||||||||||||||||||
| 2009 | 2008 | 2007 | 2006 | 2005 | ||||||||||||||||
| Allowance for loan losses, beginning of year | $ | 18,749 | $ | 15,521 | $ | 17,048 | $ | 20,231 | $ | 39,186 | ||||||||||
Charge-offs(1): | ||||||||||||||||||||
| Commercial | 2,317 | 675 | 562 | 1,195 | 12,980 | |||||||||||||||
| Commercial real estate | 355 | 1,190 | 439 | 501 | 15,397 | |||||||||||||||
| Agricultural | 43 | 47 | 56 | 379 | 18,543 | |||||||||||||||
| Residential real estate | 225 | 320 | 319 | 278 | 56 | |||||||||||||||
| Consumer indirect | 3,637 | 2,011 | 988 | 532 | 775 | |||||||||||||||
| Consumer direct and home equity | 1,253 | 1,216 | 1,531 | 1,314 | 1,535 | |||||||||||||||
| Total charge-offs | 7,830 | 5,459 | 3,895 | 4,199 | 49,286 | |||||||||||||||
| Recoveries: | ||||||||||||||||||||
| Commercial | 407 | 664 | 972 | 1,417 | 864 | |||||||||||||||
| Commercial real estate | 130 | 280 | 216 | 132 | 280 | |||||||||||||||
| Agricultural | 41 | 55 | 168 | 389 | 57 | |||||||||||||||
| Residential real estate | 12 | 26 | 50 | 71 | 5 | |||||||||||||||
| Consumer indirect | 1,030 | 548 | 235 | 224 | 261 | |||||||||||||||
| Consumer direct and home equity | 500 | 563 | 611 | 625 | 332 | |||||||||||||||
| Total recoveries | 2,120 | 2,136 | 2,252 | 2,858 | 1,799 | |||||||||||||||
| Net charge-offs | 5,710 | 3,323 | 1,643 | 1,341 | 47,487 | |||||||||||||||
| Provision (credit) for loan losses | 7,702 | 6,551 | 116 | (1,842 | ) | 28,532 | ||||||||||||||
| Allowance for loan losses, end of year | $ | 20,741 | $ | 18,749 | $ | 15,521 | $ | 17,048 | $ | 20,231 | ||||||||||
| Net charge-offs to average loans | 0.47 | % | 0.32 | % | 0.18 | % | 0.14 | % | 4.27 | % | ||||||||||
| Allowance to end of period loans | 1.64 | % | 1.67 | % | 1.61 | % | 1.84 | % | 2.04 | % | ||||||||||
| Allowance to end of period non-performing loans | 239 | % | 229 | % | 192 | % | 108 | % | 112 | % | ||||||||||
| September 30, | September 30, | September 30, | September 30, | September 30, | ||||||||||||||||
| Loan Loss Analysis | ||||||||||||||||||||
| Year Ended December 31, | ||||||||||||||||||||
| 2011 | 2010 | 2009 | 2008 | 2007 | ||||||||||||||||
Allowance for loan losses, beginning of year | $ | 20,466 | $ | 20,741 | $ | 18,749 | $ | 15,521 | $ | 17,048 | ||||||||||
Charge-offs: | ||||||||||||||||||||
Commercial business | 1,346 | 3,426 | 2,360 | 720 | 618 | |||||||||||||||
Commercial mortgage | 751 | 263 | 355 | 1,192 | 439 | |||||||||||||||
Residential mortgage | 152 | 290 | 225 | 320 | 319 | |||||||||||||||
Home equity | 449 | 259 | 195 | 110 | 255 | |||||||||||||||
Consumer indirect | 4,713 | 4,669 | 3,637 | 2,011 | 988 | |||||||||||||||
Other consumer | 877 | 909 | 1,058 | 1,106 | 1,276 | |||||||||||||||
|
|
|
|
|
|
|
|
|
| |||||||||||
Total charge-offs | 8,288 | 9,816 | 7,830 | 5,459 | 3,895 | |||||||||||||||
Recoveries: | ||||||||||||||||||||
Commercial business | 401 | 326 | 428 | 684 | 1,140 | |||||||||||||||
Commercial mortgage | 245 | 501 | 150 | 315 | 216 | |||||||||||||||
Residential mortgage | 90 | 21 | 12 | 26 | 50 | |||||||||||||||
Home equity | 44 | 36 | 20 | 19 | 12 | |||||||||||||||
Consumer indirect | 2,066 | 1,485 | 1,030 | 548 | 235 | |||||||||||||||
Other consumer | 456 | 485 | 480 | 544 | 599 | |||||||||||||||
|
|
|
|
|
|
|
|
|
| |||||||||||
Total recoveries | 3,302 | 2,854 | 2,120 | 2,136 | 2,252 | |||||||||||||||
| �� |
|
|
|
|
|
|
|
| |||||||||||
Net charge-offs | 4,986 | 6,962 | 5,710 | 3,323 | 1,643 | |||||||||||||||
Provision for loan losses | 7,780 | 6,687 | 7,702 | 6,551 | 116 | |||||||||||||||
|
|
|
|
|
|
|
|
|
| |||||||||||
Allowance for loan losses, end of year | $ | 23,260 | $ | 20,466 | $ | 20,741 | $ | 18,749 | $ | 15,521 | ||||||||||
|
|
|
|
|
|
|
|
|
| |||||||||||
Net charge-offs to average loans | 0.36 | % | 0.54 | % | 0.47 | % | 0.32 | % | 0.18 | % | ||||||||||
Allowance to end of period loans | 1.57 | % | 1.52 | % | 1.64 | % | 1.67 | % | 1.61 | % | ||||||||||
Allowance to end of period non-performing loans | 329 | % | 270 | % | 239 | % | 229 | % | 192 | % | ||||||||||
- 39 -
The following table sets forth the allocation of the allowance for loan losses by loan category as of the dates indicated. The allocation is made for analytical purposes and is not necessarily indicative of the categories in which actual losses may occur. The total allowance is available to absorb losses from any segment of the loan portfolio (in thousands).
| Allowance for Loan Losses by Loan Category | ||||||||||||||||||||||||||||||||||||||||
| At December 31, | ||||||||||||||||||||||||||||||||||||||||
| 2009 | 2008 | 2007 | 2006 | 2005 | ||||||||||||||||||||||||||||||||||||
| Percentage | Percentage | Percentage | Percentage | Percentage | ||||||||||||||||||||||||||||||||||||
| Loan | of loans by | Loan | of loans by | Loan | of loans by | Loan | of loans by | Loan | of loans by | |||||||||||||||||||||||||||||||
| Loss | category to | Loss | category to | Loss | category to | Loss | category to | Loss | category to | |||||||||||||||||||||||||||||||
| Allowance | total loans | Allowance | total loans | Allowance | total loans | Allowance | total loans | Allowance | total loans | |||||||||||||||||||||||||||||||
| Commercial | $ | 4,060 | 14.8 | % | $ | 2,871 | 14.1 | % | $ | 1,878 | 14.2 | % | $ | 2,443 | 11.4 | % | $ | 4,098 | 11.7 | % | ||||||||||||||||||||
| Commercial real estate | 5,991 | 24.4 | 4,052 | 23.4 | 3,751 | 25.5 | 4,458 | 26.4 | 6,564 | 26.7 | ||||||||||||||||||||||||||||||
| Agricultural | 994 | 3.3 | 1,012 | 4.0 | 1,516 | 4.9 | 1,887 | 6.1 | 2,187 | 7.5 | ||||||||||||||||||||||||||||||
| Residential real estate | 1,251 | 11.4 | 2,516 | 15.8 | 1,763 | 17.3 | 1,748 | 17.6 | 1,252 | 17.0 | ||||||||||||||||||||||||||||||
| Consumer indirect | 6,837 | 27.9 | 5,152 | 22.8 | 2,284 | 14.0 | 1,749 | 11.5 | 1,032 | 8.6 | ||||||||||||||||||||||||||||||
| Consumer direct and home equity | 1,608 | 18.2 | 3,146 | 19.9 | 2,667 | 24.1 | 2,833 | 27.0 | 2,504 | 28.5 | ||||||||||||||||||||||||||||||
Unallocated(1) | — | — | — | — | 1,662 | — | 1,930 | — | 2,594 | — | ||||||||||||||||||||||||||||||
| Total | $ | 20,741 | 100.0 | % | $ | 18,749 | 100.0 | % | $ | 15,521 | 100.0 | % | $ | 17,048 | 100.0 | % | $ | 20,231 | 100.0 | % | ||||||||||||||||||||
| XXXXX | XXXXX | XXXXX | XXXXX | XXXXX | XXXXX | XXXXX | XXXXX | XXXXX | XXXXX | |||||||||||||||||||||||||||||||
| Allowance for Loan Losses by Loan Category | ||||||||||||||||||||||||||||||||||||||||
| At December 31, | ||||||||||||||||||||||||||||||||||||||||
| 2011 | 2010 | 2009 | 2008 | 2007 | ||||||||||||||||||||||||||||||||||||
| Percentage | Percentage | Percentage | Percentage | Percentage | ||||||||||||||||||||||||||||||||||||
| Loan | of loans by | Loan | of loans by | Loan | of loans by | Loan | of loans by | Loan | of loans by | |||||||||||||||||||||||||||||||
| Loss | category to | Loss | category to | Loss | category to | Loss | category to | Loss | category to | |||||||||||||||||||||||||||||||
| Allowance | total loans | Allowance | total loans | Allowance | total loans | Allowance | total loans | Allowance | total loans | |||||||||||||||||||||||||||||||
Commercial business | $ | 4,036 | 15.7 | % | $ | 3,712 | 15.7 | % | $ | 4,407 | 16.3 | % | $ | 3,300 | 16.1 | % | $ | 2,505 | 16.3 | % | ||||||||||||||||||||
Commercial mortgage | 6,418 | 26.5 | 6,431 | 26.2 | 6,638 | 26.2 | 4,635 | 25.5 | 4,640 | 28.3 | ||||||||||||||||||||||||||||||
Residential mortgage | 858 | 7.7 | 1,013 | 9.6 | 1,251 | 11.4 | 2,516 | 15.8 | 1,763 | 17.3 | ||||||||||||||||||||||||||||||
Home equity | 1,242 | 15.6 | 972 | 15.5 | 1,043 | 15.9 | 2,374 | 16.9 | 1,869 | 20.1 | ||||||||||||||||||||||||||||||
Consumer indirect | 10,189 | 32.9 | 7,754 | 31.1 | 6,837 | 27.9 | 5,152 | 22.8 | 2,284 | 14.0 | ||||||||||||||||||||||||||||||
Other consumer | 517 | 1.6 | 584 | 1.9 | 565 | 2.3 | 772 | 2.9 | 798 | 4.0 | ||||||||||||||||||||||||||||||
Unallocated(1) | — | — | — | — | — | — | — | — | 1,662 | — | ||||||||||||||||||||||||||||||
|
|
|
|
|
|
|
|
|
|
|
|
|
|
|
|
|
|
|
| |||||||||||||||||||||
Total | $ | 23,260 | 100.0 | % | $ | 20,466 | 100.0 | % | $ | 20,741 | 100.0 | % | $ | 18,749 | 100.0 | % | $ | 15,521 | 100.0 | % | ||||||||||||||||||||
|
|
|
|
|
|
|
|
|
|
|
|
|
|
|
|
|
|
|
| |||||||||||||||||||||
| (1) | During 2008, management revised estimation techniques related to allocation of the allowance to specific loan segments. The result was the elimination of the unallocated portion of the allowance for loan losses and allocation of the entire balance to specific loan segments. |
Management believes that the allowance for loan losses at December 31, 20092011 is adequate to cover probable losses in the loan portfolio at that date. Factors beyond the Company’sour control, however, such as general national and local economic conditions, can adversely impact the adequacy of the allowance for loan losses. As a result, no assurance can be given that adverse economic conditions or other circumstances will not result in increased losses in the portfolio or that the allowance for loan losses will be sufficient to meet actual loan losses.
Non-performing Assets and Potential Problem Loans
The following table sets forth information regarding non-performing assets (in thousands):
| Delinquent and Non-performing Assets | ||||||||||||||||||||
| At December 31, | ||||||||||||||||||||
| 2009 | 2008 | 2007 | 2006 | 2005 | ||||||||||||||||
| Non-accruing loans: | ||||||||||||||||||||
| Commercial | $ | 650 | $ | 510 | $ | 827 | $ | 2,205 | $ | 4,389 | ||||||||||
| Commercial real estate | 1,872 | 2,360 | 2,825 | 4,661 | 6,985 | |||||||||||||||
| Agricultural | 416 | 310 | 481 | 4,836 | 2,786 | |||||||||||||||
| Residential real estate | 2,376 | 3,365 | 2,987 | 3,127 | 2,615 | |||||||||||||||
| Consumer indirect | 621 | 445 | 278 | 166 | 63 | |||||||||||||||
| Consumer direct and home equity | 887 | 1,199 | 677 | 842 | 923 | |||||||||||||||
| Total non-accruing loans | 6,822 | 8,189 | 8,075 | 15,837 | 17,761 | |||||||||||||||
| Restructured loans | — | — | — | — | — | |||||||||||||||
| Accruing loans contractually past due over 90 days | 1,859 | 7 | 2 | 3 | 276 | |||||||||||||||
| Total non-performing loans | 8,681 | 8,196 | 8,077 | 15,840 | 18,037 | |||||||||||||||
| Foreclosed assets | 746 | 1,007 | 1,421 | 1,203 | 1,099 | |||||||||||||||
| Non-accruing commercial-related loans held for sale | — | — | — | — | 577 | |||||||||||||||
| Non-performing investment securities | 1,015 | 49 | — | — | — | |||||||||||||||
| Total non-performing assets | $ | 10,442 | $ | 9,252 | $ | 9,498 | $ | 17,043 | $ | 19,713 | ||||||||||
| Non-performing loans to total loans | 0.69 | % | 0.73 | % | 0.84 | % | 1.71 | % | 1.82 | % | ||||||||||
| Non-performing assets to total assets | 0.51 | % | 0.48 | % | 0.51 | % | 0.89 | % | 0.97 | % | ||||||||||
| September 30, | September 30, | September 30, | September 30, | September 30, | ||||||||||||||||
| Non-performing Assets | ||||||||||||||||||||
| At December 31, | ||||||||||||||||||||
| 2011 | 2010 | 2009 | 2008 | 2007 | ||||||||||||||||
Non-accruing loans: | ||||||||||||||||||||
Commercial business | $ | 1,259 | $ | 947 | $ | 650 | $ | 510 | $ | 839 | ||||||||||
Commercial mortgage | 2,928 | 3,100 | 2,288 | 2,670 | 3,294 | |||||||||||||||
Residential mortgage | 1,644 | 2,102 | 2,376 | 3,365 | 2,987 | |||||||||||||||
Home equity | 682 | 875 | 880 | 1,143 | 661 | |||||||||||||||
Consumer indirect | 558 | 514 | 621 | 445 | 278 | |||||||||||||||
Other consumer | — | 41 | 7 | 56 | 16 | |||||||||||||||
|
|
|
|
|
|
|
|
|
| |||||||||||
Total non-accruing loans | 7,071 | 7,579 | 6,822 | 8,189 | 8,075 | |||||||||||||||
Restructured accruing loans | — | — | — | — | — | |||||||||||||||
Accruing loans contractually past due over 90 days | 5 | 3 | 1,859 | 7 | 2 | |||||||||||||||
|
|
|
|
|
|
|
|
|
| |||||||||||
Total non-performing loans | 7,076 | 7,582 | 8,681 | 8,196 | 8,077 | |||||||||||||||
Foreclosed assets | 475 | 741 | 746 | 1,007 | 1,421 | |||||||||||||||
Non-performing investment securities | 1,636 | 572 | 1,015 | 49 | — | |||||||||||||||
|
|
|
|
|
|
|
|
|
| |||||||||||
Total non-performing assets | $ | 9,187 | $ | 8,895 | $ | 10,442 | $ | 9,252 | $ | 9,498 | ||||||||||
|
|
|
|
|
|
|
|
|
| |||||||||||
Non-performing loans to total loans | 0.48 | % | 0.56 | % | 0.69 | % | 0.73 | % | 0.84 | % | ||||||||||
Non-performing assets to total assets | 0.39 | % | 0.40 | % | 0.51 | % | 0.48 | % | 0.51 | % | ||||||||||
- 40 -
Non-performing assets include non-performing loans, foreclosed assets and non-performing investment securities. Non-performing assets at December 31, 2011 were $9.2 million, an increase of $292 thousand from the $8.9 million balance at December 31, 2010. The primary component of non-performing assets is non-performing loans, which were $7.1 million at December 31, 2011, a decrease of $508 thousand from the $7.6 million balance at December 31, 2010.
Approximately $3.0$3.1 million, or 44.5%44%, of the $6.8$7.1 million in non-accruingnon-performing loans as of December 31, 20092011 were current with respect to payment of principal and interest, but were classified as non-accruing because repayment in full of principal and/or interest was uncertain. For non-accruing loans outstanding as of December 31, 2009,2011, the amount of interest income forgone totaled $388$438 thousand.
The ratio of non-performing loans included one commercial relationship totaling $1.9 millionto total loans was 0.48% at December 31, 2011, compared to 0.56% at December 31, 2010. This ratio continues to compare favorably to the average of our peer group, which was past due3.26% of total loans at September 30, 2011, the most recent period for which information is available (Source: Federal Financial Institutions Examination Council—Bank Holding Company Performance Report as of September 30, 2011—Top-tier bank holding companies having consolidated assets between $1 billion and $3 billion).
Foreclosed assets consist of real property formerly pledged as collateral to loans, which we have acquired through foreclosure proceedings or acceptance of a deed in excesslieu of 90 days but continuedforeclosure. Foreclosed asset holdings represented 8 properties totaling $475 thousand at December 31, 2011 and 13 properties totaling $741 thousand at December 31, 2010.
Non-performing investment securities for which we have stopped accruing interest were $1.6 million at December 31, 2011, compared to accrue interest. During$572 thousand at December 31, 2010. Non-performing investment securities are included in non-performing assets at fair value and represent pooled trust preferred securities. The market for these securities began to improve during the second quarter of 2011, resulting in substantial increases to their fair value since the beginning of the year. There have been no securities transferred to non-performing status since the first quarter of 20102009. During 2011, we recognized gains of $2.3 million from the Company received payments for substantially allsale of four of the principal and interest due for this relationship and expects to receive the remaining amounts in the near term.
Potential problem loans are loans that are currently performing, but information known about possible credit problems of the borrowers causes management to have concern as to the ability of such borrowers to comply with the present loan payment terms and may result in disclosure of such loans as nonperforming at some time in the future. These loans remain in a performing status due to a variety of factors, including payment history, the value of collateral supporting the credits, and/or personal or government guarantees. Management considers loans classified as substandard, which continue to accrue interest, to be potential problem loans. The CompanyWe identified $18.4$8.6 million and $20.5$11.5 million in loans that continued to accrue interest which were classified as substandard as of December 31, 20092011 and 2008,2010, respectively.
52
MANAGEMENTS DISCUSSION AND ANALYSIS
FUNDING ACTIVITIES
Deposits
The following table summarizes the composition of the Company’sour deposits (dollars in thousands).
| At December 31, | ||||||||||||||||||||||||
| 2009 | 2008 | 2007 | ||||||||||||||||||||||
| Amount | Percent | Amount | Percent | Amount | Percent | |||||||||||||||||||
| Noninterest-bearing demand | $ | 324,303 | 18.6 | % | $ | 292,586 | 17.9 | % | $ | 286,362 | 18.2 | % | ||||||||||||
| Interest-bearing demand | 363,698 | 20.9 | 344,616 | 21.1 | 335,314 | 21.3 | ||||||||||||||||||
| Savings and money market | 368,603 | 21.1 | 348,594 | 21.3 | 346,639 | 22.0 | ||||||||||||||||||
| Certificates of deposit < $100,000 | 512,969 | 29.5 | 482,863 | 29.6 | 453,140 | 28.7 | ||||||||||||||||||
| Certificates of deposit of $100,000 or more | 173,382 | 9.9 | 164,604 | 10.1 | 154,516 | 9.8 | ||||||||||||||||||
| $ | 1,742,955 | 100.0 | % | $ | 1,633,263 | 100.0 | % | $ | 1,575,971 | 100.0 | % | |||||||||||||
| September 30, | September 30, | September 30, | September 30, | September 30, | September 30, | |||||||||||||||||||
| At December 31, | ||||||||||||||||||||||||
| 2011 | 2010 | 2009 | ||||||||||||||||||||||
| Amount | Percent | Amount | Percent | Amount | Percent | |||||||||||||||||||
Noninterest-bearing demand | $ | 393,421 | 20.3 | % | $ | 350,877 | 18.6 | % | $ | 324,303 | 18.6 | % | ||||||||||||
Interest-bearing demand | 362,555 | 18.8 | 374,900 | 19.9 | 363,698 | 20.9 | ||||||||||||||||||
Savings and money market | 474,947 | 24.6 | 417,359 | 22.2 | 368,603 | 21.1 | ||||||||||||||||||
Certificates of deposit < $100,000 | 486,496 | 25.2 | 555,840 | 29.5 | 512,969 | 29.5 | ||||||||||||||||||
Certificates of deposit of $100,000 or more | 214,180 | 11.1 | 183,914 | 9.8 | 173,382 | 9.9 | ||||||||||||||||||
|
|
|
|
|
|
|
|
|
|
|
| |||||||||||||
Total deposits | $ | 1,931,599 | 100.0 | % | $ | 1,882,890 | 100.0 | % | $ | 1,742,955 | 100.0 | % | ||||||||||||
|
|
|
|
|
|
|
|
|
|
|
| |||||||||||||
We offer a variety of deposit products designed to attract and retain customers, with the primary focus on building and expanding long-term relationships. At December 31, 2009,2011, total deposits were $1.743$1.932 billion, representing an increase of $109.7$48.7 million for the year. Certificates of deposit were 39.4%approximately 36% and 39.7%39% of total deposits at December 31, 20092011 and 2008,2010, respectively.
Nonpublic deposits, represent the largest component of the Company’sour funding sources, represented 80% of total deposits and totaled $1.387$1.541 billion and $1.280$1.501 billion as of December 31, 20092011 and 2008,2010, respectively. The Company hasWe have managed this segment of funding through a strategy of competitive pricing that minimizes the number of customer relationships that have only a single service high cost deposit account. Nonpublic deposit levels were positively impacted by the expansion of the Company’s branch network in the greater Rochester area, where de novo branches were added in Henrietta and Greece during the third and fourth quarters of 2008, respectively. The Company
We had no traditional brokered deposits outstanding at December 31, 20092011 or 2008.
As an additional source of funding, the Company offerswe offer a variety of public deposit products to the many towns, villages, counties and school districts within our market. Public deposits generally range from 20% to 25% of the Company’sour total deposits. There is a high degree of seasonality in this component of funding, asbecause the level of deposits varies with the seasonal cash flows for these public customers. The Company maintainsWe maintain the necessary levels of short-term liquid assets to accommodate the seasonality associated with public deposits. As of December 31, 2009,2011, total public deposits were $355.9$390.2 million or 20% of total deposits, compared to $352.8$382.2 million or 20% of total deposits, as of December 31, 2008.2010. In general, the number of public relationships remained stable in comparison to the prior year.
Borrowings
Outstanding borrowings fromare summarized as follows as of December 31 (in thousands):
| September 30, | September 30, | |||||||
| 2011 | 2010 | |||||||
Short-term borrowings: | ||||||||
Federal funds purchased | $ | 11,597 | $ | 38,200 | ||||
Repurchase agreements | 36,301 | 38,910 | ||||||
Short-term FHLB borrowings | 102,800 | — | ||||||
|
|
|
| |||||
Total short-term borrowings | 150,698 | 77,110 | ||||||
|
|
|
| |||||
Long-term borrowings: | ||||||||
FHLB advances and repurchase agreements | — | 10,065 | ||||||
Junior subordinated debentures | — | 16,702 | ||||||
|
|
|
| |||||
Total long-term borrowings | — | 26,767 | ||||||
|
|
|
| |||||
Total borrowings | $ | 150,698 | $ | 103,877 | ||||
|
|
|
| |||||
We classify borrowings as short-term or long-term in accordance with the original terms of the agreement.
53
MANAGEMENTS DISCUSSION AND ANALYSIS
We have credit capacity with the FHLB and can borrow through facilities that include amortizing and term advances or repurchase agreements. We had approximately $36 million of immediate credit capacity with FHLB as of December 31, 2011. We had approximately $387 million in secured borrowing capacity at the Federal Reserve Bank (“FRB”) Discount Window, none of which was outstanding at December 31, 2011. The FHLB and FRB credit capacity are used to satisfy funding requirements resultingcollateralized by securities from daily fluctuations in deposit, loanour investment portfolio and investment activities. FHLBcertain qualifying loans. We had approximately $107 million of credit available under unsecured federal funds purchased lines with various banks as of December 31, 2011.
Funds are borrowed on an overnight basis through retail repurchase agreements with bank customers and federal funds purchased from other financial institutions. Retail repurchase agreement borrowings are collateralized by certain investment securities FHLB stock owned by the Company and certain qualifying loans. At December 31, 2009, short-term borrowings consisted of U.S. Government agencies. Federal funds purchased of $9.4are short-term borrowings that typically mature within one to ninety days. Federal funds purchased totaled $11.6 million $35.1and $38.2 million ofat December 31, 2011 and 2010, respectively. Repurchase agreements are secured overnight borrowings with customers. These short-term repurchase agreements amounted to $36.3 million and a $15.0$38.9 million advance from the Federal Reserve’s Term Auction Facility. Atas of December 31, 2008, short-term2011 and 2010, respectively. Short-term FHLB borrowings have original maturities of less than one year and include overnight borrowings which we typically utilizes to address short term funding needs as they arise. Short-term FHLB borrowings at December 31, 2011 consisted of $65.0 million in overnight repurchase agreements of $23.5 million.
borrowings and $37.8 million in short-term advances.
- 41 -
| At or for the Year Ended December 31, | ||||||||||||
| 2009 | 2008 | 2007 | ||||||||||
| Year-end balance | $ | 59,543 | $ | 23,465 | $ | 25,643 | ||||||
| Year-end weighted average interest rate | 0.59 | % | 0.48 | % | 2.71 | % | ||||||
| Maximum outstanding at any month-end | $ | 85,912 | $ | 56,861 | $ | 44,944 | ||||||
| Average balance during the year | $ | 43,092 | $ | 38,028 | $ | 29,048 | ||||||
| Average interest rate for the year | 0.63 | % | 1.90 | % | 2.97 | % | ||||||
| September 30, | September 30, | September 30, | ||||||||||
| At or for the Year Ended December 31, | ||||||||||||
| 2011 | 2010 | 2009 | ||||||||||
Year-end balance | $ | 150,698 | $ | 77,110 | $ | 59,543 | ||||||
Year-end weighted average interest rate | 0.39 | % | 0.21 | % | 0.59 | % | ||||||
Maximum outstanding at any month-end | $ | 188,355 | $ | 77,110 | $ | 85,912 | ||||||
Average balance during the year | $ | 99,122 | $ | 49,104 | $ | 43,092 | ||||||
Average interest rate for the year | 0.50 | % | 0.74 | % | 0.63 | % | ||||||
Long-term borrowings totaled $46.8$26.8 million at December 31, 20092010 and consisted of $30.0$10.0 million in FHLB repurchase agreements, entered into during 2008, $145$65 thousand of FHLB amortizing advances and $16.7 million in 10.20% junior subordinated debentures.
Shareholders’ Equity
Total shareholders’ equity increased by $8.0 million in 2009 to $198.3was $237.2 million at December 31, 2009, primarily due2011, an increase of $25.1 million from $212.1 million at December 31, 2010. During February 2011, we redeemed $12.5 million of Series A preferred stock issued to the U.S. Treasury. During March 2011, we successfully completed a follow-on common equity offering, issuing 2,813,475 shares of common stock at a price of $16.35 per share before associated offering expenses. After deducting underwriting and other offering costs, we received net incomeproceeds of $14.4approximately $43.1 million. Prior to the end of the first quarter of 2011, we utilized a portion of the net proceeds to redeem the remaining $25.0 million partially offset by commonin Series A preferred stock. The warrant issued to the Treasury was repurchased for $2.1 million during the second quarter of 2011 and preferred dividendsrecorded as a reduction of $8.0 million.additional paid-in capital. For detailed information on shareholders’ equity, see Note 11, Shareholders’ Equity, of the notes to consolidated financial statements.
The Company and Bank are subject to various regulatory capital requirements. At December 31, 2009,2011, both the Company and the Bank exceeded all regulatory requirements. For detailed information on regulatory capital, see Note 10, Regulatory Matters, of the notes to consolidated financial statements.
GOODWILL
The carrying amount of goodwill totaled $37.4 million as of December 31, 20092011 and 2008.2010. The goodwill relates to the Company’sour primary subsidiary and reporting unit, Five Star Bank. The Company performsWe perform a goodwill impairment test on an annual basis or more frequently if events and circumstances warrant.
- 42 -
Declines in the market value of the Company’sour publicly traded stock price or declines in the Company’sour ability to generate future cash flows may increase the potential that goodwill recorded on the Company’sour consolidated statementstatements of financial condition be designated as impaired and that the Companywe may incur a goodwill write-down in the future.
- 43 -
- 44 -
| Years ended December 31, | ||||||||||||||||||||||||||||||||||||
| 2009 | 2008 | 2007 | ||||||||||||||||||||||||||||||||||
| Average | Average | Average | Average | Average | Average | |||||||||||||||||||||||||||||||
| Balance | Interest | Rate | Balance | Interest | Rate | Balance | Interest | Rate | ||||||||||||||||||||||||||||
Interest-earning assets: | ||||||||||||||||||||||||||||||||||||
| Federal funds sold and other interest-earning deposits | $ | 37,214 | $ | 82 | 0.22 | % | $ | 26,568 | $ | 619 | 2.33 | % | $ | 31,756 | $ | 1,662 | 5.23 | % | ||||||||||||||||||
| Investment securities: | ||||||||||||||||||||||||||||||||||||
| Taxable | 454,552 | 16,466 | 3.62 | 487,687 | 21,882 | 4.49 | 557,035 | 25,414 | 4.56 | |||||||||||||||||||||||||||
| Tax-exempt | 155,054 | 7,920 | 5.11 | 233,864 | 13,065 | 5.59 | 254,083 | 14,343 | 5.65 | |||||||||||||||||||||||||||
| Total investment securities | 609,606 | 24,386 | 4.00 | 721,551 | 34,947 | 4.84 | 811,118 | 39,757 | 4.90 | |||||||||||||||||||||||||||
| Loans held for sale | 1,899 | 95 | 5.00 | 821 | 51 | 6.23 | 770 | 54 | 6.99 | |||||||||||||||||||||||||||
| Loans: | ||||||||||||||||||||||||||||||||||||
| Commercial | 184,269 | 8,667 | 4.70 | 147,015 | 9,141 | 6.22 | 117,784 | 9,728 | 8.26 | |||||||||||||||||||||||||||
| Commercial real estate | 284,603 | 17,882 | 6.28 | 250,387 | 17,086 | 6.82 | 246,396 | 18,230 | 7.40 | |||||||||||||||||||||||||||
| Agricultural | 42,126 | 2,373 | 5.63 | 45,035 | 3,126 | 6.94 | 53,356 | 4,351 | 8.16 | |||||||||||||||||||||||||||
| Residential real estate | 159,156 | 9,605 | 6.04 | 171,262 | 10,710 | 6.25 | 165,226 | 10,815 | 6.55 | |||||||||||||||||||||||||||
| Consumer indirect | 313,239 | 21,838 | 6.97 | 185,197 | 13,098 | 7.07 | 118,152 | 8,067 | 6.83 | |||||||||||||||||||||||||||
| Consumer direct and home equity | 224,720 | 12,246 | 5.45 | 224,343 | 14,462 | 6.45 | 236,910 | 17,315 | 7.31 | |||||||||||||||||||||||||||
| Total loans | 1,208,113 | 72,611 | 6.01 | 1,023,239 | 67,623 | 6.61 | 937,824 | 68,506 | 7.30 | |||||||||||||||||||||||||||
| Total interest-earning assets | 1,856,832 | 97,174 | 5.23 | 1,772,179 | 103,240 | 5.83 | 1,781,468 | 109,979 | 6.17 | |||||||||||||||||||||||||||
| Less: Allowance for loan losses | 20,355 | 16,287 | 16,587 | |||||||||||||||||||||||||||||||||
| Other noninterest-earning assets | 197,439 | 149,453 | 142,156 | |||||||||||||||||||||||||||||||||
| Total assets | $ | 2,033,916 | $ | 1,905,345 | $ | 1,907,037 | ||||||||||||||||||||||||||||||
Interest-bearing liabilities: | ||||||||||||||||||||||||||||||||||||
| Deposits: | ||||||||||||||||||||||||||||||||||||
| Interest-bearing demand | $ | 365,873 | 772 | 0.21 | $ | 347,702 | 3,246 | 0.93 | $ | 338,326 | 5,760 | 1.70 | ||||||||||||||||||||||||
| Savings and money market | 383,697 | 1,090 | 0.28 | 369,926 | 3,773 | 1.02 | 346,131 | 5,863 | 1.69 | |||||||||||||||||||||||||||
| Certificates of deposit | 685,259 | 17,228 | 2.51 | 617,381 | 22,330 | 3.62 | 672,239 | 31,091 | 4.63 | |||||||||||||||||||||||||||
| Total interest-bearing deposits | 1,434,829 | 19,090 | 1.33 | 1,335,009 | 29,349 | 2.20 | 1,356,696 | 42,714 | 3.15 | |||||||||||||||||||||||||||
| Short-term borrowings | 43,092 | 270 | 0.63 | 38,028 | 721 | 1.90 | 29,048 | 864 | 2.97 | |||||||||||||||||||||||||||
| Long-term borrowings | 46,913 | 2,857 | 6.09 | 53,687 | 3,547 | 6.61 | 51,561 | 3,561 | 6.91 | |||||||||||||||||||||||||||
| Total interest-bearing liabilities | 1,524,834 | 22,217 | 1.46 | 1,426,724 | 33,617 | 2.36 | 1,437,305 | 47,139 | 3.28 | |||||||||||||||||||||||||||
| Noninterest-bearing deposits | 293,852 | 280,467 | 266,239 | |||||||||||||||||||||||||||||||||
| Other liabilities | 20,890 | 15,249 | 17,966 | |||||||||||||||||||||||||||||||||
| Shareholders’ equity | 194,340 | 182,905 | 185,527 | |||||||||||||||||||||||||||||||||
| Total liabilities and shareholders’ equity | $ | 2,033,916 | $ | 1,905,345 | $ | 1,907,037 | ||||||||||||||||||||||||||||||
| Net interest income (tax-equivalent) | $ | 74,957 | $ | 69,623 | $ | 62,840 | ||||||||||||||||||||||||||||||
| Interest rate spread | 3.77 | % | 3.47 | % | 2.89 | % | ||||||||||||||||||||||||||||||
| Net earning assets | $ | 331,998 | $ | 345,455 | $ | 344,163 | ||||||||||||||||||||||||||||||
| Net interest margin (tax-equivalent) | 4.04 | % | 3.93 | % | 3.53 | % | ||||||||||||||||||||||||||||||
| Ratio of average interest-earning assets to average interest-bearing liabilities | 121.77 | % | 124.21 | % | 123.95 | % | ||||||||||||||||||||||||||||||
- 45 -
| December 31, 2009 vs. 2008 | December 31, 2008 vs. 2007 | |||||||||||||||||||||||
| Increase/(Decrease) | Increase/(Decrease) | |||||||||||||||||||||||
| Due to Change in | Total Net | Due to Change in | Total Net | |||||||||||||||||||||
| Average | Average | Increase | Average | Average | Increase | |||||||||||||||||||
| Volume | Rate | (Decrease) | Volume | Rate | (Decrease) | |||||||||||||||||||
Interest-earning assets: | ||||||||||||||||||||||||
| Federal funds sold and other interest-earning deposits | $ | 179 | $ | (716 | ) | $ | (537 | ) | $ | (238 | ) | $ | (805 | ) | $ | (1,043 | ) | |||||||
| Investment securities: | ||||||||||||||||||||||||
| Taxable | (1,412 | ) | (4,004 | ) | (5,416 | ) | (3,118 | ) | (414 | ) | (3,532 | ) | ||||||||||||
| Tax-exempt | (4,102 | ) | (1,043 | ) | (5,145 | ) | (1,131 | ) | (147 | ) | (1,278 | ) | ||||||||||||
| Total investment securities | (4,977 | ) | (5,584 | ) | (10,561 | ) | (4,343 | ) | (467 | ) | (4,810 | ) | ||||||||||||
| Loans held for sale | 56 | (12 | ) | 44 | 4 | (7 | ) | (3 | ) | |||||||||||||||
| Loans: | ||||||||||||||||||||||||
| Commercial | 2,028 | (2,502 | ) | (474 | ) | 2,115 | (2,702 | ) | (587 | ) | ||||||||||||||
| Commercial real estate | 2,218 | (1,422 | ) | 796 | 291 | (1,435 | ) | (1,144 | ) | |||||||||||||||
| Agricultural | (192 | ) | (561 | ) | (753 | ) | (627 | ) | (598 | ) | (1,225 | ) | ||||||||||||
| Residential real estate | (740 | ) | (365 | ) | (1,105 | ) | 387 | (492 | ) | (105 | ) | |||||||||||||
| Consumer indirect | 8,930 | (190 | ) | 8,740 | 4,732 | 299 | 5,031 | |||||||||||||||||
| Consumer direct and home equity | 24 | (2,240 | ) | (2,216 | ) | (885 | ) | (1,968 | ) | (2,853 | ) | |||||||||||||
| Total loans | 11,481 | (6,493 | ) | 4,988 | 5,949 | (6,832 | ) | (883 | ) | |||||||||||||||
| Total interest-earning assets | 4,772 | (10,838 | ) | (6,066 | ) | (570 | ) | (6,169 | ) | (6,739 | ) | |||||||||||||
Interest-bearing liabilities: | ||||||||||||||||||||||||
| Deposits: | ||||||||||||||||||||||||
| Interest-bearing demand | 162 | (2,636 | ) | (2,474 | ) | 156 | (2,670 | ) | (2,514 | ) | ||||||||||||||
| Savings and money market | 135 | (2,818 | ) | (2,683 | ) | 379 | (2,469 | ) | (2,090 | ) | ||||||||||||||
| Certificates of deposit | 2,257 | (7,359 | ) | (5,102 | ) | (2,386 | ) | (6,375 | ) | (8,761 | ) | |||||||||||||
| Total interest-bearing deposits | 2,056 | (12,315 | ) | (10,259 | ) | (673 | ) | (12,692 | ) | (13,365 | ) | |||||||||||||
| Short-term borrowings | 85 | (536 | ) | (451 | ) | 222 | (365 | ) | (143 | ) | ||||||||||||||
| Long-term borrowings | (426 | ) | (264 | ) | (690 | ) | 144 | (158 | ) | (14 | ) | |||||||||||||
| Total interest-bearing liabilities | 2,177 | (13,577 | ) | (11,400 | ) | (345 | ) | (13,177 | ) | (13,522 | ) | |||||||||||||
| Change in net interest income | $ | 2,595 | $ | 2,739 | $ | 5,334 | $ | (225 | ) | $ | 7,008 | $ | 6,783 | |||||||||||
- 46 -
| 2009 | 2008 | 2007 | ||||||||||
| Service charges on deposits | $ | 10,065 | $ | 10,497 | $ | 10,932 | ||||||
| ATM and debit card | 3,610 | 3,313 | 2,883 | |||||||||
| Loan servicing | 1,308 | 664 | 928 | |||||||||
| Company owned life insurance | 1,096 | 563 | 1,255 | |||||||||
| Broker-dealer fees and commissions | 1,022 | 1,458 | 1,396 | |||||||||
| Net gain on sale of loans held for sale | 699 | 339 | 779 | |||||||||
| Net gain on disposal of investment securities | 3,429 | 288 | 207 | |||||||||
| Impairment charges on investment securities | (4,666 | ) | (68,215 | ) | — | |||||||
| Net gain on sale of other assets | 180 | 305 | 102 | |||||||||
| Other | 2,052 | 2,010 | 2,198 | |||||||||
| Total noninterest income (loss) | $ | 18,795 | $ | (48,778 | ) | $ | 20,680 | |||||
- 47 -
| 2009 | 2008 | 2007 | ||||||||||
| Salaries and employee benefits | $ | 33,634 | $ | 31,437 | $ | 33,175 | ||||||
| Occupancy and equipment | 11,062 | 10,502 | 9,903 | |||||||||
| FDIC assessments | 3,651 | 674 | 289 | |||||||||
| Professional services | 2,524 | 2,141 | 2,080 | |||||||||
| Computer and data processing | 2,340 | 2,433 | 2,126 | |||||||||
| Supplies and postage | 1,846 | 1,800 | 1,662 | |||||||||
| Advertising and promotions | 949 | 1,453 | 1,402 | |||||||||
| Other | 6,771 | 7,021 | 6,791 | |||||||||
| Total noninterest expense | $ | 62,777 | $ | 57,461 | $ | 57,428 | ||||||
- 48 -
- 49 -
- 50 -
- 51 -
The objective of maintaining adequate liquidity is to assure the ability of the Company tothat we meet itsour financial obligations. These obligations include the withdrawal of deposits on demand or at their contractual maturity, the repayment of matured borrowings, the ability to fund new and existing loan commitments and the ability to take advantage of new business opportunities. The Company achievesWe achieve liquidity by maintaining a strong base of core customer funds, maturing short-term assets, itsour ability to sell or pledge securities, lines-of-credit, and access to the financial and capital markets.
Liquidity for the Bank is managed through the monitoring of anticipated changes in loans, the investment portfolio, core deposits and wholesale funds. The strength of the Bank’s liquidity position is a result of its base of core customer deposits. These core deposits are supplemented by wholesale funding sources that include credit lines with the other banking institutions, the FHLB and the FRB.
The primary sources of liquidity for FII are dividends from the Bank and access to financial and capital markets. Dividends from the Bank are limited by various regulatory requirements related to capital adequacy and earnings trends. The Bank relies on cash flows from operations, core deposits, borrowings and short-term liquid assets. FSIS relies on cash flows from operations and funds from FII when necessary.
Our cash and cash equivalents were $43.0$57.6 million as of December 31, 2009, down2011, up from $55.2$39.1 million as of December 31, 2008. The Company’s2010. Our net cash provided by operating activities totaled $22.3$32.0 million and the principal source of operating activity cash flow was net income adjusted for noncash income and expense items and changes in other assets and other liabilities.items. Net cash used in investing activities totaled $172.2$104.9 million, which included outflows for net loan origination funding of $165.7$157.1 million and inflows from net securities transactions of $6.2$60.3 million. Net cash provided by financing activities of $137.7$91.4 million was attributed to the $109.7 million and $36.1a $48.7 million increase in deposits, a $73.6 million increase in short-term borrowings and borrowings, respectively, partially$43.1 million in net proceeds from the issuance of common stock, partly offset by $7.5the $37.5 million payment to redeem the Series A preferred stock, $26.8 million of long-term debt repayments and $7.6 million in cash paid for dividends.
Contractual Obligations and Other Commitments
The following table summarizes the maturities of various contractual obligations and other commitments (in thousands):
| At December 31, 2009 | ||||||||||||||||||||
| Within 1 | Over 1 to 3 | Over 3 to 5 | Over 5 | |||||||||||||||||
| year | years | Years | years | Total | ||||||||||||||||
Certificates of deposit (1) | $ | 526,549 | $ | 140,489 | $ | 18,968 | $ | 345 | $ | 686,351 | ||||||||||
| Long-term borrowings | 20,080 | 10,065 | — | 16,702 | 46,847 | |||||||||||||||
| Operating leases | 1,135 | 2,098 | 1,757 | 4,386 | 9,376 | |||||||||||||||
| Supplemental executive retirement plans | 92 | 282 | 282 | 754 | 1,410 | |||||||||||||||
Limited partnership investments(2) | 772 | 1,543 | 772 | — | 3,087 | |||||||||||||||
Commitments to extend credit(3) | 316,688 | — | — | — | 316,688 | |||||||||||||||
Standby letters of credit(3) | 6,887 | — | — | — | 6,887 | |||||||||||||||
| September 30, | September 30, | September 30, | September 30, | September 30, | ||||||||||||||||
| At December 31, 2011 | ||||||||||||||||||||
| Within 1 | Over 1 to 3 | Over 3 to 5 | Over 5 | |||||||||||||||||
| year | years | Years | years | Total | ||||||||||||||||
On-Balance sheet: | ||||||||||||||||||||
Certificates of deposit (1) | $ | 547,874 | $ | 102,661 | $ | 50,000 | $ | 141 | $ | 700,676 | ||||||||||
Supplemental executive retirement plans | 159 | 318 | 318 | 549 | 1,344 | |||||||||||||||
Off-Balance sheet: | ||||||||||||||||||||
Limited partnership investments(2) | $ | 594 | $ | 1,187 | $ | 593 | $ | — | $ | 2,374 | ||||||||||
Commitments to extend credit(3) | 374,266 | — | — | — | 374,266 | |||||||||||||||
Standby letters of credit(3) | 5,488 | 2,512 | 855 | — | 8,855 | |||||||||||||||
Operating leases | 1,242 | 2,066 | 1,889 | 4,963 | 10,160 | |||||||||||||||
| (1) | Includes the maturity of certificates of deposit amounting to $100 thousand or more as follows: |
| (2) | We have committed to capital investments in several limited partnerships of up to |
We do not expect all of the commitments to extend credit and standby letters of credit to be funded. Thus, the total commitment amounts do not necessarily represent |
Off-Balance Sheet Arrangements
With the exception of the Company’s obligations in connection with its trust preferred securities and in connection with itsour irrevocable loan commitments, the Companyoperating leases and limited partnership investments, we had no other off-balance sheet arrangements that have or are reasonably likely to have a current or future effect on itsour financial condition, changes in financial condition, revenues or expenses, results of operations, liquidity, capital expenditures or capital resources that is material to investors. For additional information on off-balance sheet arrangements, see Note 1, Summary of Significant Accounting Policies and Note 9, Commitments and Contingencies, in the notes to the accompanying consolidated financial statements.
- 52 -
Security Yields and Maturities Schedule
The following table sets forth certain information regarding the amortized cost (“Cost”), weighted average yields (“Yield”) and contractual maturities of the Company’sour debt securities portfolio as of December 31, 2009.2011. Mortgage-backed securities are included in maturity categories based on their stated maturity date. Actual maturities may differ from the contractual maturities presented because borrowers may have the right to call or prepay certain investments. We have stopped accruing interest on our asset-backed securities. No tax-equivalent adjustments were made to the weighted average yields (in thousands).
| Due after five | ||||||||||||||||||||||||||||||||||||||||
| Due in one year | Due from one to | years through | Due after ten | |||||||||||||||||||||||||||||||||||||
| or less | five years | ten years | years | Total | ||||||||||||||||||||||||||||||||||||
| Cost | Yield | Cost | Yield | Cost | Yield | Cost | Yield | Cost | Yield | |||||||||||||||||||||||||||||||
Available for sale debt securities: | ||||||||||||||||||||||||||||||||||||||||
| U.S. Government agencies and government-sponsored enterprises | $ | — | — | % | $ | 84,017 | 2.02 | % | $ | 30,935 | 1.62 | % | $ | 19,612 | 0.85 | % | $ | 134,564 | 1.76 | % | ||||||||||||||||||||
| State and political subdivisions | 23,537 | 3.51 | 49,856 | 3.61 | 7,419 | 3.36 | — | — | 80,812 | 3.56 | ||||||||||||||||||||||||||||||
| Mortgage-backed securities | 29,004 | 3.79 | 36,060 | 4.11 | 13,799 | 3.79 | 282,268 | 3.67 | 361,131 | 3.73 | ||||||||||||||||||||||||||||||
| Asset-backed securities | — | — | — | — | — | — | 1,295 | 1.86 | 1,295 | 1.86 | ||||||||||||||||||||||||||||||
| 52,541 | 3.66 | 169,933 | 2.93 | 52,153 | 2.44 | 303,175 | 3.66 | 577,802 | 3.33 | |||||||||||||||||||||||||||||||
Held to maturity debt securities: | ||||||||||||||||||||||||||||||||||||||||
| State and political subdivisions | 30,238 | 2.56 | 7,361 | 4.09 | 1,542 | 4.85 | 432 | 5.42 | 39,573 | 2.97 | ||||||||||||||||||||||||||||||
| $ | 82,779 | 3.26 | % | $ | 177,294 | 2.98 | % | $ | 53,695 | 2.51 | % | $ | 303,607 | 3.66 | % | $ | 617,375 | 3.31 | % | |||||||||||||||||||||
| XXXXX | XXXXX | XXXXX | XXXXX | XXXXX | XXXXX | XXXXX | XXXXX | XXXXX | XXXXX | |||||||||||||||||||||||||||||||
| Due in one year or less | Due from one to five years | Due after five years through ten years | Due after ten years | Total | ||||||||||||||||||||||||||||||||||||
| Cost | Yield | Cost | Yield | Cost | Yield | Cost | Yield | Cost | Yield | |||||||||||||||||||||||||||||||
Available for sale debt securities: | ||||||||||||||||||||||||||||||||||||||||
U.S. Government agencies and government-sponsored enterprises | $ | 13,574 | 1.42 | % | $ | 32,137 | 2.21 | % | $ | 34,289 | 2.32 | % | $ | 14,947 | 0.86 | % | $ | 94,947 | 1.93 | % | ||||||||||||||||||||
State and political subdivisions | 9,573 | 3.57 | 43,534 | 2.67 | 65,992 | 2.44 | — | — | 119,099 | 2.62 | ||||||||||||||||||||||||||||||
Mortgage-backed securities | 878 | 4.52 | 5,812 | 3.82 | 83,358 | 1.77 | 300,654 | 3.49 | 390,702 | 3.13 | ||||||||||||||||||||||||||||||
Asset-backed securities | — | — | — | — | — | — | 297 | — | 297 | — | ||||||||||||||||||||||||||||||
|
|
|
|
|
|
|
|
|
| |||||||||||||||||||||||||||||||
| 24,025 | 2.39 | 81,483 | 2.57 | 183,639 | 2.11 | 315,898 | 3.49 | 605,045 | 2.91 | |||||||||||||||||||||||||||||||
Held to maturity debt securities: | ||||||||||||||||||||||||||||||||||||||||
State and political subdivisions | 18,496 | 2.35 | 3,763 | 4.26 | 905 | 4.90 | 133 | 5.53 | 23,297 | 2.77 | ||||||||||||||||||||||||||||||
|
|
|
|
|
|
|
|
|
| |||||||||||||||||||||||||||||||
| $ | 42,521 | 2.37 | % | $ | 85,246 | 2.64 | % | $ | 184,544 | 2.13 | % | $ | 316,031 | 3.49 | % | $ | 628,342 | 2.90 | % | |||||||||||||||||||||
|
|
|
|
|
|
|
|
|
| |||||||||||||||||||||||||||||||
Contractual Loan Maturity Schedule
The following table summarizes the contractual maturities of the Company’sour loan portfolio at December 31, 2009.2011. Loans, net of deferred loan origination costs, include principal amortization and non-accruing loans. Demand loans having no stated schedule of repayment or maturity and overdrafts are reported as due in one year or less (in thousands).
| Due in less | Due from one | Due after five | ||||||||||||||
| than one year | to five years | years | Total | |||||||||||||
| Commercial | $ | 135,251 | $ | 48,741 | $ | 2,394 | $ | 186,386 | ||||||||
| Commercial real estate | 82,474 | 150,377 | 76,022 | 308,873 | ||||||||||||
| Agricultural | 21,002 | 15,826 | 5,044 | 41,872 | ||||||||||||
| Residential real estate | 32,201 | 68,027 | 43,987 | 144,215 | ||||||||||||
| Consumer indirect | 123,829 | 220,453 | 8,329 | 352,611 | ||||||||||||
| Consumer direct and home equity | 63,931 | 119,031 | 47,087 | 230,049 | ||||||||||||
| Total loans | $ | 458,688 | $ | 622,455 | $ | 182,863 | $ | 1,264,006 | ||||||||
| Loans maturing after one year: | ||||||||||||||||
| With a predetermined interest rate | $ | 399,133 | $ | 70,498 | $ | 469,631 | ||||||||||
| With a floating or adjustable rate | 223,322 | 112,365 | 335,687 | |||||||||||||
| Total loans maturing after one year | $ | 622,455 | $ | 182,863 | $ | 805,318 | ||||||||||
| September 30, | September 30, | September 30, | September 30, | |||||||||||||
| Due in less than one year | Due from one to five years | Due after five years | Total | |||||||||||||
Commercial business | $ | 135,627 | $ | 82,926 | $ | 15,283 | $ | 233,836 | ||||||||
Commercial mortgage | 109,782 | 187,205 | 96,257 | 393,244 | ||||||||||||
Residential mortgage | 28,673 | 56,585 | 28,653 | 113,911 | ||||||||||||
Home equity | 46,468 | 105,726 | 79,572 | 231,766 | ||||||||||||
Consumer indirect | 161,053 | 310,214 | 16,446 | 487,713 | ||||||||||||
Other consumer | 10,375 | 12,509 | 1,422 | 24,306 | ||||||||||||
|
|
|
|
|
|
|
| |||||||||
Total loans | $ | 491,978 | $ | 755,165 | $ | 237,633 | $ | 1,484,776 | ||||||||
|
|
|
|
|
|
|
| |||||||||
Loans maturing after one year: | ||||||||||||||||
With a predetermined interest rate | $ | 225,553 | $ | 157,596 | $ | 383,149 | ||||||||||
With a floating or adjustable rate | 529,612 | 80,037 | 609,649 | |||||||||||||
|
|
|
|
|
| |||||||||||
Total loans maturing after one year | $ | 755,165 | $ | 237,633 | $ | 992,798 | ||||||||||
|
|
|
|
|
| |||||||||||
- 53 -
Capital Resources
The FRB has adopted a system using risk-based capital guidelines to evaluate the capital adequacy of bank holding companies on a consolidated basis. The guidelines require a minimum Tier 1 leverage ratio of 4.00%, a minimum Tier 1 capital ratio of 4.00% and a minimum total risk-based capital ratio of 8.00%. The following table reflects the ratios and their components (in thousands):
| 2009 | 2008 | |||||||
| Total shareholders’ equity | $ | 198,294 | $ | 190,300 | ||||
| Less: Unrealized gain (loss) on securities available for sale, net of tax | 1,655 | 3,463 | ||||||
| Unrecognized net periodic pension & postretirement benefits (costs), net of tax | (5,357 | ) | (7,476 | ) | ||||
| Disallowed goodwill and other intangible assets | 37,369 | 37,650 | ||||||
| Disallowed deferred tax assets | 17,214 | 22,437 | ||||||
| Plus: Qualifying trust preferred securities | 16,200 | 16,200 | ||||||
| Tier 1 capital | $ | 163,613 | $ | 150,426 | ||||
| Adjusted average total assets (for leverage capital purposes) | $ | 2,054,699 | $ | 1,869,111 | ||||
| Tier 1 leverage ratio (Tier 1 capital to adjusted average total assets) | 7.96 | % | 8.05 | % | ||||
| Total Tier 1 capital | $ | 163,613 | $ | 150,426 | ||||
| Plus: Qualifying allowance for loan losses | 17,153 | 15,936 | ||||||
| Total risk-based capital | $ | 180,766 | $ | 166,362 | ||||
| Net risk-weighted assets | $ | 1,368,653 | $ | 1,272,028 | ||||
| Tier 1 capital ratio (Tier 1 capital to net risk-weighted assets) | 11.95 | % | 11.83 | % | ||||
| Total risk-based capital ratio (Total risk-based capital to net risk-weighted assets) | 13.21 | % | 13.08 | % | ||||
| September 30, | September 30, | |||||||
| 2011 | 2010 | |||||||
Total shareholders’ equity | $ | 237,194 | $ | 212,144 | ||||
Less: Unrealized gain on securities available for sale, net of tax | 13,570 | 1,877 | ||||||
Unrecognized net periodic pension & postretirement benefits (costs), net of tax | (12,625 | ) | (6,599 | ) | ||||
Disallowed goodwill and other intangible assets | 37,369 | 37,369 | ||||||
Disallowed deferred tax assets | 1,794 | 14,608 | ||||||
Plus: Qualifying trust preferred securities | — | 16,200 | ||||||
|
|
|
| |||||
Tier 1 capital | $ | 197,086 | $ | 181,089 | ||||
|
|
|
| |||||
Adjusted average total assets (for leverage capital purposes) | $ | 2,282,755 | $ | 2,177,911 | ||||
|
|
|
| |||||
Tier 1 leverage ratio (Tier 1 capital to adjusted average total assets) | 8.63 | % | 8.31 | % | ||||
Total Tier 1 capital | $ | 197,086 | $ | 181,089 | ||||
Plus: Qualifying allowance for loan losses | 20,239 | 18,363 | ||||||
|
|
|
| |||||
Total risk-based capital | $ | 217,325 | $ | 199,452 | ||||
|
|
|
| |||||
Net risk-weighted assets | $ | 1,616,119 | $ | 1,466,957 | ||||
|
|
|
| |||||
Tier 1 capital ratio (Tier 1 capital to net risk-weighted assets) | 12.20 | % | 12.34 | % | ||||
Total risk-based capital ratio (Total risk-based capital to net risk-weighted assets) | 13.45 | % | 13.60 | % | ||||
CRITICAL ACCOUNTING ESTIMATES
Our consolidated financial statements are prepared in accordance with GAAP and are consistent with predominant practices in the financial services industry. Application of critical accounting policies, which are those policies that management believes are the most important to the Company’sour financial position and results, requires management to make estimates, assumptions, and judgments that affect the amounts reported in the consolidated financial statements and accompanying notes and are based on information available as of the date of the financial statements. Future changes in information may affect these estimates, assumptions and judgments, which, in turn, may affect amounts reported in the financial statements.
We have numerous accounting policies, of which the most significant are presented in Note 1, Summary of Significant Accounting Policies, of the notes to consolidated financial statements. These policies, along with the disclosures presented in the other financial statement notes and in this discussion, provide information on how significant assets, liabilities, revenues and expenses are reported in the consolidated financial statements and how those reported amounts are determined. Based on the sensitivity of financial statement amounts to the methods, assumptions, and estimates underlying those amounts, management has determined that the accounting policies with respect to the allowance for loan losses, valuation of goodwill and deferred tax assets, the valuation of securities and determination of OTTI, and accounting for defined benefit plans require particularly subjective or complex judgments important to the Company’sour financial position and results of operations, and, as such, are considered to be critical accounting policies as discussed below. These estimates and assumptions are based on management’s best estimates and judgment and are evaluated on an ongoing basis using historical experience and other factors, including the current economic environment. The Company adjustsWe adjust these estimates and assumptions when facts and circumstances dictate. Illiquid credit markets and volatile equity have combined with declines in consumer spending to increase the uncertainty inherent in these estimates and assumptions. As future events cannot be determined with precision, actual results could differ significantly from the Company’sour estimates.
57
MANAGEMENTS DISCUSSION AND ANALYSIS
Adequacy of the Allowance for Loan Losses
The allowance for loan losses represents management’s estimate of probable credit losses inherent in the loan portfolio. Determining the amount of the allowance for loan losses is considered a critical accounting estimate because it requires significant judgment and the use of subjective measurements including management’s assessment of the internal risk classifications of loans, changes in the nature of the loan portfolio, industry concentrations, existing economic conditions, the fair value of underlying collateral, and other qualitative and quantitative factors which could affect probable credit losses. Because current economic conditions can change and future events are inherently difficult to predict, the impactanticipated amount of current local, regionalestimated loan losses, and national economic factors ontherefore the qualityappropriateness of the allowance for loan portfolio. Changeslosses, could change significantly. As an integral part of their examination process, various regulatory agencies also review the allowance for loan losses. Such agencies may require additions to the allowance for loan losses or may require that certain loan balances be charged off or downgraded into criticized loan categories when their credit evaluations differ from those of management, based on their judgments about information available to them at the time of their examination. We believe the level of the allowance for loan losses is appropriate as recorded in these estimates and assumptions are reasonably possible and may have a material impact on the Company’s consolidated financial statements, results of operations or liquidity.
statements.
- 54 -
Valuation of Goodwill
Goodwill represents the excess of costthe purchase price over the fair value of the net assets of businesses acquired. Goodwill and intangible assets acquired in aaccordance with the purchase method of accounting for business combination and determinedcombinations. Goodwill is not amortized but, instead, is subject to have an indefinite useful life are not amortized. Instead, these assets are subject toimpairment tests on at least an annual impairment review andbasis or more frequently if certainan event occurs or circumstances change that reduce the fair value of a reporting unit below its carrying amount. We complete our annual goodwill impairment indicators are in evidence. Goodwilltest as of September 30 of each year. The impairment testing process is performed at the segment (or “reporting unit”) level.conducted by assigning net assets and goodwill to each reporting unit. Currently, the Company’sour goodwill is evaluated at the entity level as there is only one material reporting unit. FairThe fair value of each reporting unit is compared to the recorded book value “step one”. If the fair value of the reporting unit exceeds its carrying value, goodwill is not considered based on total market capitalization or discounted cash flow projections using various estimatesimpaired and assumptions, including discount rate, tangible equity ratio and change in control premium. Changes in“step two” is not considered necessary. If the estimates and assumptions are reasonably possible and may havecarrying value of a material impact onreporting unit exceeds its fair value, the Company’s consolidated financial statements, resultsimpairment test continues (“step two”) by comparing the carrying value of operations or liquidity. For additional discussion relatedthe reporting unit’s goodwill to the Company’s accounting policy for goodwillimplied fair value of goodwill. The implied fair value is computed by adjusting all assets and other intangible assets, see Note 1, Summary of Significant Accounting Policies,liabilities of the notesreporting unit to consolidated financial statements.
Valuation of Deferred Tax Assets
The determination of deferred tax expense or benefit is based on changes in the carrying amounts of assets and liabilities that generate temporary differences. The carrying value of the Company’sour net deferred tax assets assumes that the Companywe will be able to generate sufficient future taxable income based on estimates and assumptions (after consideration of historical taxable income as well as tax planning strategies). If these estimates and related assumptions change, the Companywe may be required to record valuation allowances against itsour deferred tax assets resulting in additional income tax expense in the consolidated statements of operations.income. Management evaluates its deferred tax assets on a quarterly basis and assesses the need for a valuation allowance, if any. A valuation allowance is established when management believes that it is more likely than not that some portion of its deferred tax assets will not be realized. Changes in valuation allowance from period to period are included in the Company’sour tax provision in the period of change. For additional discussion related to the Company’sour accounting policy for income taxes see Note 14, Income Taxes, of the notes to consolidated financial statements.
58
MANAGEMENTS DISCUSSION AND ANALYSIS
Valuation and Other Than Temporary Impairment of Securities
We record all of itsour securities that are classified as available for sale at fair value. The fair value of equity securities are determined using public quotations, when available. Where quoted market prices are not available, fair values are estimated based on dealer quotes, pricing models, discounted cash flow methodologies, or similar techniques for which the determination of fair value may require significant judgment or estimation. Fair values of public bonds and those private securities that are actively traded in the secondary market have been determined through the use of third-party pricing services using market observable inputs. Private placement securities and other corporate fixed maturities where the Company doesfor which we do not receive a public quotation are valued using a variety of acceptable valuation methods. Market rates used are applicable to the yield, credit quality and average maturity of each security. Private equity securities may also utilize internal valuation methodologies appropriate for the specific asset. Fair values might also be determined using broker quotes or through the use of internal models or analysis.
Securities are evaluated quarterly to determine whether a decline in their fair value is other than temporary. Management utilizes criteria such as, the current intent or requirement to hold or sell the security, the magnitude and duration of the decline and, when appropriate, consideration of negative changes in expected cash flows, creditworthiness, near term prospects of issuers, the level of credit subordination, estimated loss severity, and delinquencies, to determine whether a loss in value is other than temporary. The term “other than temporary” is not intended to indicate that the decline is permanent, but indicates that the prospect for a near-term recovery of value is not necessarily favorable. Declines in the fair value of investment securities below their cost that are deemed to be other than temporary are reflected in earnings as realized losses to the extent the impairment is related to credit issues or concerns, or the security is intended to be sold. The amount of impairment related to non-credit related factors on securities not intended to be sold is recognized in other comprehensive income.
- 55 -
Management is required to make various assumptions in valuing its defined benefit pension plan assets and liabilities. These assumptions include, but are not limited to, the expected long-term rate of return on plan assets, the weighted average discount rate used to value certain liabilities and the rate of compensation increase. The Company usesWe use a third-party specialist to assist in making these estimates and assumptions. Changes in these estimates and assumptions are reasonably possible and may have a material impact on the Company’sour consolidated financial statements, results of operationsincome or liquidity.
RECENT ACCOUNTING PRONOUNCEMENTS
See Note 1, Summary of Significant Accounting Policies — Policies—Recent Accounting Pronouncements, in the notes to consolidated financial statements for a discussion of recent accounting pronouncements.
- 56 -
| ITEM 7A. | QUANTITATIVE AND QUALITATIVE DISCLOSURES ABOUT MARKET RISK |
Asset-Liability Management
Net Interest Income at Risk Analysis
The primary tool the Company useswe use to manage interest rate risk is a “rate shock” simulation to measure the rate sensitivity of the statement of financial condition. Rate shock simulation is a modeling technique used to estimate the impact of changes in rates on net interest income and economic value of equity. The following table sets forth the results of the modeling analysis as of December 31, 20092011 (dollars in thousands):
| Net Interest Income | Economic Value of Equity | |||||||||||||||||||||||
| Changes ininterest rate | Amount | Change | Amount | Change | ||||||||||||||||||||
| + 300 basis points | $ | 77,667 | $ | 1,887 | 2.49 | % | $ | 382,072 | $ | (17,550 | ) | (4.39 | )% | |||||||||||
| + 200 basis points | 77,038 | 1,258 | 1.66 | 389,616 | (10,006 | ) | (2.50 | ) | ||||||||||||||||
| + 100 basis points | 76,405 | 624 | 0.82 | 397,666 | (1,956 | ) | (0.49 | ) | ||||||||||||||||
| - 100 basis points | 72,533 | (3,248 | ) | (4.29 | ) | 390,784 | (8,838 | ) | (2.21 | ) | ||||||||||||||
| September 30, | September 30, | September 30, | September 30, | September 30, | September 30, | |||||||||||||||||||
| Changes in | Net Interest Income | Economic Value of Equity | ||||||||||||||||||||||
interest rate | Amount | Change | Amount | Change | ||||||||||||||||||||
+ 300 basis points | $ | 85,243 | $ | 2,621 | 3.17 | % | $ | 343,691 | $ | (19,853 | ) | (5.46 | )% | |||||||||||
+ 200 basis points | 84,298 | 1,676 | 2.03 | 354,626 | (8,918 | ) | (2.45 | ) | ||||||||||||||||
+ 100 basis points | 83,050 | 429 | 0.52 | 361,887 | (1,656 | ) | (0.46 | ) | ||||||||||||||||
- 100 basis points | 80,484 | (2,138 | ) | (2.59 | ) | 385,220 | 21,677 | 5.96 | ||||||||||||||||
We measure net interest income at risk by estimating the changes in net interest income resulting from instantaneous and sustained parallel shifts in interest rates of different magnitudes over a period of 12 months. As of December 31, 2009,2011, a 100 basis point increase in rates would increase net interest income by $624$429 thousand, or 0.8%0.5%, over the next twelve-month period. A 100 basis point decrease in rates would decrease net interest income by $3.2$2.1 million, or 4.3%2.6%, over a twelve-month period. As of December 31, 2009,2011, a 100 basis point increase in rates would decrease the economic value of equity by $2.0$1.7 million, or 0.5%, over the next twelve-month period. A 100 basis point decrease in rates would decreaseincrease the economic value of equity by $8.8$21.7 million, or 2.2%6.0%, over a twelve-month period. This simulation is based on management’s assumption as to the effect of interest rate changes on assets and liabilities and assumes a parallel shift of the yield curve. It also includes certain assumptions about the future pricing of loans and deposits in response to changes in interest rates. Further, it assumes that delinquency rates would not change as a result of changes in interest rates, although there can be no assurance that this will be the case. While this simulation is a useful measure as to net interest income at risk due to a change in interest rates, it is not a forecast of the future results and is based on many assumptions that, if changed, could cause a different outcome.
In addition to the changes in interest rate scenarios listed above, the Companywe typically runsrun other scenarios to measure interest rate risk, which vary depending on the economic and interest rate environments.
- 57 -
| At December 31, 2009 | ||||||||||||||||||||
| Over Three | Over | |||||||||||||||||||
| Three | Months | One Year | ||||||||||||||||||
| Months | Through | Through | Over | |||||||||||||||||
| or Less | One Year | Five Years | Five Years | Total | ||||||||||||||||
| INTEREST-EARNING ASSETS: | ||||||||||||||||||||
| Federal funds sold and interest-earning deposits in other banks | $ | 85 | $ | — | $ | — | $ | — | $ | 85 | ||||||||||
| Investment securities | 114,564 | 153,068 | 241,123 | 108,620 | 617,375 | |||||||||||||||
| Loans | 425,288 | 220,328 | 533,766 | 85,045 | 1,264,427 | |||||||||||||||
| Total interest-earning assets | $ | 539,937 | $ | 373,396 | $ | 774,889 | $ | 193,665 | 1,881,887 | |||||||||||
| Cash and due from banks | 42,874 | |||||||||||||||||||
Other assets(1) | 137,628 | |||||||||||||||||||
| Total assets | $ | 2,062,389 | ||||||||||||||||||
| INTEREST-BEARING LIABILITIES: | ||||||||||||||||||||
| Interest-bearing demand, savings and money market | $ | 732,301 | $ | — | $ | — | $ | — | $ | 732,301 | ||||||||||
| Certificates of deposit | 192,100 | 334,449 | 159,457 | 345 | 686,351 | |||||||||||||||
| Borrowings | 59,543 | 20,080 | 10,065 | 16,702 | 106,390 | |||||||||||||||
| Total interest-bearing liabilities | $ | 983,944 | $ | 354,529 | $ | 169,522 | $ | 17,047 | 1,525,042 | |||||||||||
| Noninterest-bearing deposits | 324,303 | |||||||||||||||||||
| Other liabilities | 14,750 | |||||||||||||||||||
| Total liabilities | 1,864,095 | |||||||||||||||||||
| Shareholders’ equity | 198,294 | |||||||||||||||||||
| Total liabilities and shareholders’ equity | $ | 2,062,389 | ||||||||||||||||||
| Interest sensitivity gap | $ | (444,007 | ) | $ | 18,867 | $ | 605,367 | $ | 176,618 | $ | 356,845 | |||||||||
| Cumulative gap | $ | (444,007 | ) | $ | (425,140 | ) | $ | 180,227 | $ | 356,845 | ||||||||||
Cumulative gap ratio(2) | 54.9 | % | 68.2 | % | 112.0 | % | 123.4 | % | ||||||||||||
| Cumulative gap as a percentage of total assets | (21.5 | )% | (20.6 | )% | 8.7 | % | 17.3 | % | ||||||||||||
| September 30, | September 30, | September 30, | September 30, | September 30, | ||||||||||||||||
| At December 31, 2011 | ||||||||||||||||||||
| Over Three | Over | |||||||||||||||||||
| Three | Months | One Year | ||||||||||||||||||
| Months | Through | Through | Over | |||||||||||||||||
| or Less | One Year | Five Years | Five Years | Total | ||||||||||||||||
INTEREST-EARNING ASSETS: | ||||||||||||||||||||
Federal funds sold and interest-earning deposits in other banks | $ | — | $ | 94 | $ | — | $ | — | $ | 94 | ||||||||||
Investment securities | 117,520 | 144,472 | 254,640 | 111,710 | 628,342 | |||||||||||||||
Loans | 469,602 | 257,217 | 667,411 | 92,956 | 1,487,186 | |||||||||||||||
|
|
|
|
|
|
|
|
|
| |||||||||||
Total interest-earning assets | $ | 587,122 | $ | 401,783 | $ | 922,051 | $ | 204,666 | 2,115,622 | |||||||||||
|
|
|
|
|
|
|
| |||||||||||||
Cash and due from banks | 57,489 | |||||||||||||||||||
Other assets(1) | 163,242 | |||||||||||||||||||
|
| |||||||||||||||||||
Total assets | $ | 2,336,353 | ||||||||||||||||||
|
| |||||||||||||||||||
INTEREST-BEARING LIABILITIES: | ||||||||||||||||||||
Interest-bearing demand, savings and money market | $ | 837,502 | $ | — | $ | — | $ | — | $ | 837,502 | ||||||||||
Certificates of deposit | 183,321 | 364,553 | 152,661 | 141 | 700,676 | |||||||||||||||
Borrowings | 130,698 | 20,000 | — | — | 150,698 | |||||||||||||||
|
|
|
|
|
|
|
|
|
| |||||||||||
Total interest-bearing liabilities | $ | 1,151,521 | $ | 384,553 | $ | 152,661 | $ | 141 | 1,688,876 | |||||||||||
|
|
|
|
|
|
|
| |||||||||||||
Noninterest-bearing deposits | 393,421 | |||||||||||||||||||
Other liabilities | 16,862 | |||||||||||||||||||
|
| |||||||||||||||||||
Total liabilities | 2,099,159 | |||||||||||||||||||
Shareholders’ equity | 237,194 | |||||||||||||||||||
|
| |||||||||||||||||||
Total liabilities and shareholders’ equity | $ | 2,336,353 | ||||||||||||||||||
|
| |||||||||||||||||||
Interest sensitivity gap | $ | (564,399 | ) | $ | 17,230 | $ | 769,390 | $ | 204,525 | $ | 426,746 | |||||||||
|
|
|
|
|
|
|
|
|
| |||||||||||
Cumulative gap | $ | (564,399 | ) | $ | (547,169 | ) | $ | 222,221 | $ | 426,746 | ||||||||||
|
|
|
|
|
|
|
| |||||||||||||
Cumulative gap ratio(2) | 51.0 | % | 64.4 | % | 113.2 | % | 125.3 | % | ||||||||||||
Cumulative gap as a percentage of total assets | (24.2 | )% | (23.4 | )% | 9.5 | % | 18.3 | % | ||||||||||||
| (1) | ||
| Includes net unrealized gain on securities available for sale and allowance for loan losses. |
| (2) | Cumulative total interest-earning assets divided by cumulative total interest-bearing liabilities. |
For purposes of interest rate risk management, the Company directswe direct more attention on simulation modeling, such as “net interest income at risk” as previously discussed, rather than gap analysis. The net interest income at risk simulation modeling is considered by management to be more informative in forecasting future income at risk.
- 58 -
| ITEM 8. | FINANCIAL STATEMENTS AND SUPPLEMENTARY DATA |
Index to Consolidated Financial Statements
| September 30, | |||||||
| Page | |||||||
- 59 -
Management is responsible for establishing and maintaining adequate internal control over financial reporting for Financial Institutions, Inc. and its subsidiaries (the “Company”), as such term is defined in Exchange Act Rules 13a-15(f). The Company’s system of internal control over financial reporting has been designed to provide reasonable assurance to the Company’s management and board of directors regarding the reliability of financial reporting and the preparation and fair presentation of financial statements for external purposes in accordance with accounting principlesU.S. generally accepted in the United States of America.
Any system of internal control over financial reporting, no matter how well designed, has inherent limitations, including the possibility that a control can be circumvented or overridden and misstatements due to error or fraud may occur and not be detected. Also, because of changes in conditions, internal control effectiveness may vary over time. Accordingly, even an effective system of internal control will provide only reasonable assurance with respect to financial statement preparation and presentation.
The Company’s management has assessed the effectiveness of the Company’s internal control over financial reporting as of December 31, 2009.2011. To make this assessment, we used the criteria for effective internal control over financial reporting described inInternal Control — Control—Integrated Framework, issued by the Committee of Sponsoring Organizations of the Treadway Commission. Based on our assessment and based on such criteria, we believe that, as of December 31, 2009,2011, the Company’s internal control over financial reporting was effective.
The Company’s independent registered public accounting firm that audited the Company’s consolidated financial statements has issued an attestation report on internal control over financial reporting as of December 31, 2009.2011. That report appears herein.
/s/ Peter G. Humphrey | /s/ Karl F. Krebs | |||||||||
President and Chief Executive Officer | Executive Vice President and Chief Financial Officer | |||||||||
March 9, 2012 | March 9, 2012 | |||||||||
- 60 -
The Board of Directors and Shareholders
Financial Institutions, Inc.:
We have audited Financial Institutions, Inc. and subsidiaries’ (the Company) internal control over financial reporting as of December 31, 2009,2011, based on criteria established inInternal Control—Integrated Frameworkissued by the Committee of Sponsoring Organizations of the Treadway Commission (COSO). The Company’s management is responsible for maintaining effective internal control over financial reporting and for its assessment of the effectiveness of internal control over financial reporting, included in the accompanying Management Report.Management’s Report on Internal Control over Financial Reporting. Our responsibility is to express an opinion on the Company’s internal control over financial reporting based on our audit.
We conducted our audit in accordance with the standards of the Public Company Accounting Oversight Board (United States). Those standards require that we plan and perform the audit to obtain reasonable assurance about whether effective internal control over financial reporting was maintained in all material respects. Our audit included obtaining an understanding of internal control over financial reporting, assessing the risk that a material weakness exists, and testing and evaluating the design and operating effectiveness of internal control based on the assessed risk. Our audit also includes performing such other procedures as we considered necessary in the circumstances. We believe that our audit provides a reasonable basis for our opinion.
A company’s internal control over financial reporting is a process designed to provide reasonable assurance regarding the reliability of financial reporting and the preparation of financial statements for external purposes in accordance with generally accepted accounting principles. A company’s internal control over financial reporting includes those policies and procedures that (1) pertain to the maintenance of records that, in reasonable detail, accurately and fairly reflect the transactions and dispositions of the assets of the company; (2) provide reasonable assurance that transactions are recorded as necessary to permit preparation of financial statements in accordance with generally accepted accounting principles, and that receipts and expenditures of the company are being made only in accordance with authorizations of management and directors of the company; and (3) provide reasonable assurance regarding prevention or timely detection of unauthorized acquisition, use, or disposition of the company’s assets that could have a material effect on the financial statements.
Because of its inherent limitations, internal control over financial reporting may not prevent or detect misstatements. Also, projections of any evaluation of effectiveness to future periods are subject to the risk that controls may become inadequate because of changes in conditions, or that the degree of compliance with the policies or procedures may deteriorate.
In our opinion, the Company maintained, in all material respects, effective internal control over financial reporting as of December 31, 2009,2011, based on criteria established inInternal Control—Integrated Frameworkissued by the Committee of Sponsoring Organizations of the Treadway Commission (COSO).
We also have audited, in accordance with the standards of the Public Company Accounting Oversight Board (United States), the consolidated statements of financial condition of the Company as of December 31, 20092011 and 2008,2010, and the related consolidated statements of operations,income, changes in shareholders’ equity, and cash flows for each of the years in the three-year period ended December 31, 2009,2011, and our report dated March 12, 20109, 2012 expressed an unqualified opinion on those consolidated financial statements.
/s/ KPMG LLP
Rochester, New York
March 12, 2010
- 61 -
The Board of Directors and Shareholders
Financial Institutions, Inc.:
We have audited the accompanying consolidated statements of financial condition of Financial Institutions, Inc. and subsidiaries (the Company) as of December 31, 20092011 and 2008,2010, and the related consolidated statements of operations,income, changes in shareholders’ equity, and cash flows for each of the years in the three-year period ended December 31, 2009.2011. These consolidated financial statements are the responsibility of the Company’s management. Our responsibility is to express an opinion on these consolidated financial statements based on our audits.
We conducted our audits in accordance with the standards of the Public Company Accounting Oversight Board (United States). Those standards require that we plan and perform the audit to obtain reasonable assurance about whether the financial statements are free of material misstatement. An audit includes examining, on a test basis, evidence supporting the amounts and disclosures in the financial statements. An audit also includes assessing the accounting principles used and significant estimates made by management, as well as evaluating the overall financial statement presentation. We believe that our audits provide a reasonable basis for our opinion.
In our opinion, the consolidated financial statements referred to above present fairly, in all material respects, the consolidated financial position of the Company as of December 31, 20092011 and 2008,2010, and the results of their operations and their cash flows for each of the years in the three-year period ended December 31, 2009,2011, in conformity with U.S. generally accepted accounting principles.
We also have audited, in accordance with the standards of the Public Company Accounting Oversight Board (United States), the Company’s internal control over financial reporting as of December 31, 2009,2011, based on criteria established inInternal Control — Control—Integrated Frameworkissued by the Committee of Sponsoring Organizations of the Treadway Commission (COSO), and our report dated March 12, 20109, 2012 expressed an unqualified opinion on the effectiveness of the Company’s internal control over financial reporting.
/s/ KPMG LLP
Rochester, New York
March 12, 2010
- 62 -
| December 31, | ||||||||
| (Dollars in thousands, except share and per share data) | 2009 | 2008 | ||||||
ASSETS | ||||||||
| Cash and cash equivalents: | ||||||||
| Cash and due from banks | $ | 42,874 | $ | 34,528 | ||||
| Federal funds sold and interest-bearing deposits in other banks | 85 | 20,659 | ||||||
| Total cash and cash equivalents | 42,959 | 55,187 | ||||||
| Securities available for sale, at fair value | 580,501 | 547,506 | ||||||
| Securities held to maturity, at amortized cost (fair value of $40,629 and $59,147, respectively) | 39,573 | 58,532 | ||||||
| Loans held for sale | 421 | 1,013 | ||||||
| Loans | 1,264,006 | 1,121,079 | ||||||
| Less: Allowance for loan losses | 20,741 | 18,749 | ||||||
| Loans, net | 1,243,265 | 1,102,330 | ||||||
| Company owned life insurance | 24,867 | 23,692 | ||||||
| Premises and equipment, net | 34,783 | 36,712 | ||||||
| Goodwill | 37,369 | 37,369 | ||||||
| Other assets | 58,651 | 54,578 | ||||||
| Total assets | $ | 2,062,389 | $ | 1,916,919 | ||||
LIABILITIES AND SHAREHOLDERS’ EQUITY | ||||||||
| Deposits: | ||||||||
| Noninterest-bearing demand | $ | 324,303 | $ | 292,586 | ||||
| Interest-bearing demand | 363,698 | 344,616 | ||||||
| Savings and money market | 368,603 | 348,594 | ||||||
| Certificates of deposit | 686,351 | 647,467 | ||||||
| Total deposits | 1,742,955 | 1,633,263 | ||||||
| Short-term borrowings | 59,543 | 23,465 | ||||||
| Long-term borrowings | 46,847 | 47,355 | ||||||
| Other liabilities | 14,750 | 22,536 | ||||||
| Total liabilities | 1,864,095 | 1,726,619 | ||||||
| Commitments and contingencies (Note 9) | ||||||||
| Shareholders’ equity: | ||||||||
| Series A 3% Preferred Stock, $100 par value; 1,533 shares authorized and issued | 153 | 153 | ||||||
| Series A Preferred Stock, $100 par value; 7,503 shares authorized and issued; aggregate liquidation preference $37,515; net of $1,672 and $2,016 discount, respectively | 35,843 | 35,499 | ||||||
| Series B-1 8.48% Preferred Stock, $100 par value, 200,000 shares authorized, 174,223 shares issued | 17,422 | 17,422 | ||||||
| Total preferred equity | 53,418 | 53,074 | ||||||
| Common stock, $0.01 par value, 50,000,000 shares authorized, 11,348,122 shares issued | 113 | 113 | ||||||
| Additional paid-in capital | 26,940 | 26,397 | ||||||
| Retained earnings | 131,371 | 124,952 | ||||||
| Accumulated other comprehensive loss | (3,702 | ) | (4,013 | ) | ||||
| Treasury stock, at cost — 527,854 and 550,103 shares, respectively | (9,846 | ) | (10,223 | ) | ||||
| Total shareholders’ equity | 198,294 | 190,300 | ||||||
| Total liabilities and shareholders’ equity | $ | 2,062,389 | $ | 1,916,919 | ||||
| September 30, | September 30, | |||||||
| December 31, | ||||||||
(Dollars in thousands, except share and per share data) | 2011 | 2010 | ||||||
ASSETS | ||||||||
Cash and cash equivalents: | ||||||||
Cash and due from banks | $ | 57,489 | $ | 38,964 | ||||
Federal funds sold and interest-bearing deposits in other banks | 94 | 94 | ||||||
|
|
|
| |||||
Total cash and cash equivalents | 57,583 | 39,058 | ||||||
Securities available for sale, at fair value | 627,518 | 666,368 | ||||||
Securities held to maturity, at amortized cost (fair value of $23,964 and $28,849, respectively) | 23,297 | 28,162 | ||||||
Loans held for sale | 2,410 | 3,138 | ||||||
Loans (net of allowance for loan losses of $23,260 and $20,466, respectively) | 1,461,516 | 1,325,524 | ||||||
Company owned life insurance | 45,556 | 26,053 | ||||||
Premises and equipment, net | 33,085 | 33,263 | ||||||
Goodwill | 37,369 | 37,369 | ||||||
Other assets | 48,019 | 55,372 | ||||||
|
|
|
| |||||
Total assets | $ | 2,336,353 | $ | 2,214,307 | ||||
|
|
|
| |||||
LIABILITIES AND SHAREHOLDERS’ EQUITY | ||||||||
Deposits: | ||||||||
Noninterest-bearing demand | $ | 393,421 | $ | 350,877 | ||||
Interest-bearing demand | 362,555 | 374,900 | ||||||
Savings and money market | 474,947 | 417,359 | ||||||
Certificates of deposit | 700,676 | 739,754 | ||||||
|
|
|
| |||||
Total deposits | 1,931,599 | 1,882,890 | ||||||
Short-term borrowings | 150,698 | 77,110 | ||||||
Long-term borrowings | — | 26,767 | ||||||
Other liabilities | 16,862 | 15,396 | ||||||
|
|
|
| |||||
Total liabilities | 2,099,159 | 2,002,163 | ||||||
|
|
|
| |||||
Commitments and contingencies (Note 9) | ||||||||
Shareholders’ equity: | ||||||||
Series A 3% preferred stock, $100 par value; 1,533 shares authorized; 1,500 and 1,533 shares issued, respectively | 150 | 153 | ||||||
Series A preferred stock, $5,000 liquidation preference per share, 7,503 shares authorized; 7,503 shares issued at December 31, 2010 | — | 36,210 | ||||||
Series B-1 8.48% preferred stock, $100 par value, 200,000 shares authorized; 173,235 and 174,223 shares issued, respectively | 17,323 | 17,422 | ||||||
|
|
|
| |||||
Total preferred equity | 17,473 | 53,785 | ||||||
Common stock, $0.01 par value, 50,000,000 shares authorized; 14,161,597 and 11,348,122 shares issued, respectively | 142 | 113 | ||||||
Additional paid-in capital | 67,247 | 26,029 | ||||||
Retained earnings | 158,079 | 144,599 | ||||||
Accumulated other comprehensive income (loss) | 945 | (4,722 | ) | |||||
Treasury stock, at cost – 358,481 and 410,616 shares, respectively | (6,692 | ) | (7,660 | ) | ||||
|
|
|
| |||||
Total shareholders’ equity | 237,194 | 212,144 | ||||||
|
|
|
| |||||
Total liabilities and shareholders’ equity | $ | 2,336,353 | $ | 2,214,307 | ||||
|
|
|
| |||||
See accompanying notes to the consolidated financial statements.
- 63 -
| Years ended December 31, | ||||||||||||
| (Dollars in thousands, except per share amounts) | 2009 | 2008 | 2007 | |||||||||
| Interest income: | ||||||||||||
| Interest and fees on loans | $ | 72,706 | $ | 67,674 | $ | 68,560 | ||||||
| Interest and dividends on investment securities | 21,694 | 30,655 | 34,990 | |||||||||
| Other interest income | 82 | 619 | 1,662 | |||||||||
| Total interest income | 94,482 | 98,948 | 105,212 | |||||||||
| Interest expense: | ||||||||||||
| Deposits | 19,090 | 29,349 | 42,714 | |||||||||
| Short-term borrowings | 270 | 721 | 864 | |||||||||
| Long-term borrowings | 2,857 | 3,547 | 3,561 | |||||||||
| Total interest expense | 22,217 | 33,617 | 47,139 | |||||||||
| Net interest income | 72,265 | 65,331 | 58,073 | |||||||||
| Provision for loan losses | 7,702 | 6,551 | 116 | |||||||||
| Net interest income after provision for loan losses | 64,563 | 58,780 | 57,957 | |||||||||
| Noninterest income (loss): | ||||||||||||
| Service charges on deposits | 10,065 | 10,497 | 10,932 | |||||||||
| ATM and debit card | 3,610 | 3,313 | 2,883 | |||||||||
| Loan servicing | 1,308 | 664 | 928 | |||||||||
| Company owned life insurance | 1,096 | 563 | 1,255 | |||||||||
| Broker-dealer fees and commissions | 1,022 | 1,458 | 1,396 | |||||||||
| Net gain on sale of loans held for sale | 699 | 339 | 779 | |||||||||
| Net gain on disposal of investment securities | 3,429 | 288 | 207 | |||||||||
| Impairment charges on investment securities | (4,666 | ) | (68,215 | ) | — | |||||||
| Net gain on sale and disposal of other assets | 180 | 305 | 102 | |||||||||
| Other | 2,052 | 2,010 | 2,198 | |||||||||
| Total noninterest income (loss) | 18,795 | (48,778 | ) | 20,680 | ||||||||
| Noninterest expense: | ||||||||||||
| Salaries and employee benefits | 33,634 | 31,437 | 33,175 | |||||||||
| Occupancy and equipment | 11,062 | 10,502 | 9,903 | |||||||||
| FDIC assessments | 3,651 | 674 | 289 | |||||||||
| Professional services | 2,524 | 2,141 | 2,080 | |||||||||
| Computer and data processing | 2,340 | 2,433 | 2,126 | |||||||||
| Supplies and postage | 1,846 | 1,800 | 1,662 | |||||||||
| Advertising and promotions | 949 | 1,453 | 1,402 | |||||||||
| Other | 6,771 | 7,021 | 6,791 | |||||||||
| Total noninterest expense | 62,777 | 57,461 | 57,428 | |||||||||
| Income (loss) before income taxes | 20,581 | (47,459 | ) | 21,209 | ||||||||
| Income tax expense (benefit) | 6,140 | (21,301 | ) | 4,800 | ||||||||
| Net income (loss) | $ | 14,441 | $ | (26,158 | ) | $ | 16,409 | |||||
| Preferred stock dividends, net of accretion | 3,697 | 1,538 | 1,483 | |||||||||
| Net income (loss) allocated to common shareholders | $ | 10,744 | $ | (27,696 | ) | $ | 14,926 | |||||
| Earnings (loss) per common share (Note 15): | ||||||||||||
| Basic | $ | 0.99 | $ | (2.54 | ) | $ | 1.34 | |||||
| Diluted | $ | 0.99 | $ | (2.54 | ) | $ | 1.33 | |||||
| September 30, | September 30, | September 30, | ||||||||||
| Years ended December 31, | ||||||||||||
(Dollars in thousands, except per share amounts) | 2011 | 2010 | 2009 | |||||||||
Interest income: | ||||||||||||
Interest and fees on loans | $ | 77,105 | $ | 75,877 | $ | 72,706 | ||||||
Interest and dividends on investment securities | 18,013 | 20,622 | 21,694 | |||||||||
Other interest income | — | 10 | 82 | |||||||||
|
|
|
|
|
| |||||||
Total interest income | 95,118 | 96,509 | 94,482 | |||||||||
|
|
|
|
|
| |||||||
Interest expense: | ||||||||||||
Deposits | 11,434 | 14,853 | 19,090 | |||||||||
Short-term borrowings | 500 | 365 | 270 | |||||||||
Long-term borrowings | 1,321 | 2,502 | 2,857 | |||||||||
|
|
|
|
|
| |||||||
Total interest expense | 13,255 | 17,720 | 22,217 | |||||||||
|
|
|
|
|
| |||||||
Net interest income | 81,863 | 78,789 | 72,265 | |||||||||
Provision for loan losses | 7,780 | 6,687 | 7,702 | |||||||||
|
|
|
|
|
| |||||||
Net interest income after provision for loan losses | 74,083 | 72,102 | 64,563 | |||||||||
|
|
|
|
|
| |||||||
Noninterest income: | ||||||||||||
Service charges on deposits | 8,679 | 9,585 | 10,065 | |||||||||
ATM and debit card | 4,359 | 3,995 | 3,610 | |||||||||
Broker-dealer fees and commissions | 1,829 | 1,283 | 1,022 | |||||||||
Company owned life insurance | 1,424 | 1,107 | 1,096 | |||||||||
Loan servicing | 835 | 1,124 | 1,308 | |||||||||
Net gain on sale of loans held for sale | 880 | 650 | 699 | |||||||||
Net gain on sales and calls of investment securities | 3,003 | 169 | 3,429 | |||||||||
Impairment charges on investment securities | (18 | ) | (594 | ) | (4,666 | ) | ||||||
Net gain (loss) on sale and disposal of other assets | 67 | (203 | ) | 180 | ||||||||
Other | 2,867 | 2,338 | 2,052 | |||||||||
|
|
|
|
|
| |||||||
Total noninterest income | 23,925 | 19,454 | 18,795 | |||||||||
|
|
|
|
|
| |||||||
Noninterest expense: | ||||||||||||
Salaries and employee benefits | 35,439 | 32,811 | 33,634 | |||||||||
Occupancy and equipment | 10,868 | 10,818 | 11,062 | |||||||||
Computer and data processing | 2,437 | 2,487 | 2,340 | |||||||||
Professional services | 2,617 | 2,197 | 2,524 | |||||||||
Supplies and postage | 1,778 | 1,772 | 1,846 | |||||||||
FDIC assessments | 1,513 | 2,507 | 3,651 | |||||||||
Advertising and promotions | 1,259 | 1,121 | 949 | |||||||||
Loss on extinguishment of debt | 1,083 | — | — | |||||||||
Other | 6,800 | 7,204 | 6,771 | |||||||||
|
|
|
|
|
| |||||||
Total noninterest expense | 63,794 | 60,917 | 62,777 | |||||||||
|
|
|
|
|
| |||||||
Income before income taxes | 34,214 | 30,639 | 20,581 | |||||||||
Income tax expense | 11,415 | 9,352 | 6,140 | |||||||||
|
|
|
|
|
| |||||||
Net income | $ | 22,799 | $ | 21,287 | $ | 14,441 | ||||||
|
|
|
|
|
| |||||||
Preferred stock dividends | 1,877 | 3,358 | 3,160 | |||||||||
Accretion of discount on Series A preferred stock | 1,305 | �� | 367 | 537 | ||||||||
|
|
|
|
|
| |||||||
Net income available to common shareholders | $ | 19,617 | $ | 17,562 | $ | 10,744 | ||||||
|
|
|
|
|
| |||||||
Earnings per common share (Note 15): | ||||||||||||
Basic | $ | 1.50 | $ | 1.62 | $ | 0.99 | ||||||
Diluted | $ | 1.49 | $ | 1.61 | $ | 0.99 | ||||||
Cash dividends declared per common share | $ | 0.47 | $ | 0.40 | $ | 0.40 | ||||||
Weighted average common shares outstanding: | ||||||||||||
Basic | 13,067 | 10,767 | 10,730 | |||||||||
Diluted | 13,157 | 10,845 | 10,769 | |||||||||
See accompanying notes to the consolidated financial statements.
- 64 -
Years ended December 31, 2009, 20082011, 2010 and 2007
| Accumulated | ||||||||||||||||||||||||||||
| Additional | Other | Total | ||||||||||||||||||||||||||
| (Dollars in thousands, | Preferred | Common | Paid-in | Retained | Comprehensive | Treasury | Shareholders’ | |||||||||||||||||||||
| except per share data) | Equity | Stock | Capital | Earnings | Income (Loss) | Stock | Equity | |||||||||||||||||||||
Balance at January 1, 2007 | $ | 17,623 | $ | 113 | $ | 24,222 | $ | 148,947 | $ | (8,404 | ) | $ | (113 | ) | $ | 182,388 | ||||||||||||
| Comprehensive income: | ||||||||||||||||||||||||||||
| Net income | — | — | — | 16,409 | — | — | 16,409 | |||||||||||||||||||||
| Other comprehensive income, net of tax | — | — | — | — | 9,071 | — | 9,071 | |||||||||||||||||||||
| Total comprehensive income | 25,480 | |||||||||||||||||||||||||||
| Repurchase of common shares | — | — | — | — | — | (7,203 | ) | (7,203 | ) | |||||||||||||||||||
| Repurchase of Series B-1 8.48% Preferred Stock | (42 | ) | — | — | — | — | — | (42 | ) | |||||||||||||||||||
| Share-based compensation plans: | ||||||||||||||||||||||||||||
| Share-based compensation | — | — | 955 | — | — | — | 955 | |||||||||||||||||||||
| Stock options exercised | — | — | (53 | ) | — | — | 304 | 251 | ||||||||||||||||||||
| Restricted stock awards issued | — | — | (344 | ) | — | — | 344 | — | ||||||||||||||||||||
| Directors’ retainer | — | — | (2 | ) | — | — | 107 | 105 | ||||||||||||||||||||
| Cash dividends declared: | ||||||||||||||||||||||||||||
| Series A 3% Preferred-$3.00 per share | — | — | — | (5 | ) | — | — | (5 | ) | |||||||||||||||||||
| Series B-1 8.48% Preferred-$8.48 per share | — | — | — | (1,478 | ) | — | — | (1,478 | ) | |||||||||||||||||||
| Common-$0.46 per share | — | — | — | (5,129 | ) | — | — | (5,129 | ) | |||||||||||||||||||
Balance at December 31, 2007 | $ | 17,581 | $ | 113 | $ | 24,778 | $ | 158,744 | $ | 667 | $ | (6,561 | ) | $ | 195,322 | |||||||||||||
| Comprehensive income: | ||||||||||||||||||||||||||||
| Net loss | — | — | — | (26,158 | ) | — | — | (26,158 | ) | |||||||||||||||||||
| Other comprehensive loss, net of tax | — | — | — | — | (4,680 | ) | — | (4,680 | ) | |||||||||||||||||||
| Total comprehensive loss | (30,838 | ) | ||||||||||||||||||||||||||
| Cumulative effect of adoption of new accounting pronouncements | — | — | — | (241 | ) | — | — | (241 | ) | |||||||||||||||||||
| Repurchase of common shares | — | — | — | — | — | (4,818 | ) | (4,818 | ) | |||||||||||||||||||
| Repurchase of Series A 3% preferred stock | (6 | ) | — | 3 | — | — | — | (3 | ) | |||||||||||||||||||
| Warrant issued in connection with Series A Preferred Stock | — | — | 2,025 | — | — | — | 2,025 | |||||||||||||||||||||
| Issue shares of Series A Preferred Stock | 37,515 | — | — | — | — | — | 37,515 | |||||||||||||||||||||
| Discount on Series A Preferred Stock | (2,025 | ) | — | — | — | — | — | (2,025 | ) | |||||||||||||||||||
| Share-based compensation plans: | ||||||||||||||||||||||||||||
| Share-based compensation | — | — | 603 | 30 | — | — | 633 | |||||||||||||||||||||
| Stock options exercised | — | — | (12 | ) | — | — | 44 | 32 | ||||||||||||||||||||
| Restricted stock awards issued | — | — | (998 | ) | — | — | 998 | — | ||||||||||||||||||||
| Directors’ retainer | — | — | (2 | ) | — | — | 114 | 112 | ||||||||||||||||||||
| Accrued undeclared cumulative dividend on Series A Preferred Stock, net of amortization | 9 | — | — | (56 | ) | — | — | (47 | ) | |||||||||||||||||||
| Cash dividends declared: | ||||||||||||||||||||||||||||
| Series A 3% Preferred-$3.00 per share | — | — | — | (5 | ) | — | — | (5 | ) | |||||||||||||||||||
| Series B-1 8.48% Preferred-$8.48 per share | — | — | — | (1,477 | ) | — | — | (1,477 | ) | |||||||||||||||||||
| Common-$0.54 per share | — | — | — | (5,885 | ) | — | — | (5,885 | ) | |||||||||||||||||||
Balance at December 31, 2008 | $ | 53,074 | $ | 113 | $ | 26,397 | $ | 124,952 | $ | (4,013 | ) | $ | (10,223 | ) | $ | 190,300 | ||||||||||||
| September 30, | September 30, | September 30, | September 30, | September 30, | September 30, | September 30, | ||||||||||||||||||||||
(Dollars in thousands, except per share data) | Preferred Equity | Common Stock | Additional Paid-in Capital | Retained Earnings | Accumulated Other Comprehensive Income (Loss) | Treasury Stock | Total Shareholders’ Equity | |||||||||||||||||||||
Balance at January 1, 2009 | $ | 53,074 | $ | 113 | $ | 26,397 | $ | 124,952 | $ | (4,013 | ) | $ | (10,223 | ) | $ | 190,300 | ||||||||||||
Comprehensive income: | ||||||||||||||||||||||||||||
Net income | — | — | — | 14,441 | — | — | 14,441 | |||||||||||||||||||||
Other comprehensive income, net of tax | — | — | — | — | 311 | — | 311 | |||||||||||||||||||||
|
| |||||||||||||||||||||||||||
Total comprehensive income | 14,752 | |||||||||||||||||||||||||||
Issuance costs of Series A preferred stock | — | — | (68 | ) | — | — | — | (68 | ) | |||||||||||||||||||
Share-based compensation plans: | ||||||||||||||||||||||||||||
Share-based compensation | — | — | 852 | 2 | — | — | 854 | |||||||||||||||||||||
Stock options exercised | — | — | (4 | ) | — | — | 19 | 15 | ||||||||||||||||||||
Restricted stock awards issued, net | — | — | (207 | ) | — | — | 207 | — | ||||||||||||||||||||
Directors’ retainer | — | — | (30 | ) | — | — | 151 | 121 | ||||||||||||||||||||
Accrued undeclared cumulative dividend on Series A preferred stock, net of accretion | 344 | — | — | (537 | ) | — | — | (193 | ) | |||||||||||||||||||
Cash dividends declared: | ||||||||||||||||||||||||||||
Series A 3% preferred-$3.00 per share | — | — | — | (5 | ) | — | — | (5 | ) | |||||||||||||||||||
Series A preferred-$223.61 per share | — | — | — | (1,678 | ) | — | — | (1,678 | ) | |||||||||||||||||||
Series B-1 8.48% preferred-$8.48 per share | — | — | — | (1,477 | ) | — | — | (1,477 | ) | |||||||||||||||||||
Common-$0.40 per share | — | — | — | (4,327 | ) | — | — | (4,327 | ) | |||||||||||||||||||
|
|
|
|
|
|
|
|
|
|
|
|
|
| |||||||||||||||
Balance at December 31, 2009 | $ | 53,418 | $ | 113 | $ | 26,940 | $ | 131,371 | $ | (3,702 | ) | $ | (9,846 | ) | $ | 198,294 | ||||||||||||
Comprehensive income: | ||||||||||||||||||||||||||||
Net income | — | — | — | 21,287 | — | — | 21,287 | |||||||||||||||||||||
Other comprehensive loss, net of tax | — | — | — | — | (1,020 | ) | — | (1,020 | ) | |||||||||||||||||||
|
| |||||||||||||||||||||||||||
Total comprehensive income | 20,267 | |||||||||||||||||||||||||||
Purchases of treasury stock | — | — | — | — | — | (69 | ) | (69 | ) | |||||||||||||||||||
Share-based compensation plans: | ||||||||||||||||||||||||||||
Share-based compensation | — | — | 1,031 | — | — | — | 1,031 | |||||||||||||||||||||
Stock options exercised | — | — | (74 | ) | — | — | 290 | 216 | ||||||||||||||||||||
Restricted stock awards issued, net | — | — | (1,853 | ) | — | — | 1,853 | — | ||||||||||||||||||||
Directors’ retainer | — | — | (15 | ) | — | — | 112 | 97 | ||||||||||||||||||||
Accrued undeclared cumulative dividend on Series A preferred stock, net of accretion | 367 | — | — | (367 | ) | — | — | — | ||||||||||||||||||||
Cash dividends declared: | ||||||||||||||||||||||||||||
Series A 3% preferred-$3.00 per share | — | — | — | (5 | ) | — | — | (5 | ) | |||||||||||||||||||
Series A preferred-$250.00 per share | — | — | — | (1,876 | ) | — | — | (1,876 | ) | |||||||||||||||||||
Series B-1 8.48% preferred-$8.48 per share | — | — | — | (1,477 | ) | — | — | (1,477 | ) | |||||||||||||||||||
Common-$0.40 per share | — | — | — | (4,334 | ) | — | — | (4,334 | ) | |||||||||||||||||||
|
|
|
|
|
|
|
|
|
|
|
|
|
| |||||||||||||||
Balance at December 31, 2010 | $ | 53,785 | $ | 113 | $ | 26,029 | $ | 144,599 | $ | (4,722 | ) | $ | (7,660 | ) | $ | 212,144 | ||||||||||||
|
|
|
|
|
|
|
|
|
|
|
|
|
| |||||||||||||||
Continued on next page | ||||||||||||||||||||||||||||
See accompanying notes to the consolidated financial statements.
- 65 -
Consolidated Statements of Changes in Shareholders’ Equity (Continued)
Years ended December 31, 2009, 20082011, 2010 and 2007
| Accumulated | ||||||||||||||||||||||||||||
| Additional | Other | Total | ||||||||||||||||||||||||||
| (Dollars in thousands, | Preferred | Common | Paid-in | Retained | Comprehensive | Treasury | Shareholders’ | |||||||||||||||||||||
| except per share data) | Equity | Stock | Capital | Earnings | Income (Loss) | Stock | Equity | |||||||||||||||||||||
Balance at December 31, 2008 | $ | 53,074 | $ | 113 | $ | 26,397 | $ | 124,952 | $ | (4,013 | ) | $ | (10,223 | ) | $ | 190,300 | ||||||||||||
Balance carried forward | ||||||||||||||||||||||||||||
| Comprehensive income: | ||||||||||||||||||||||||||||
| Net income | — | — | — | 14,441 | — | — | 14,441 | |||||||||||||||||||||
| Other comprehensive income, net of tax | — | — | — | — | 311 | — | 311 | |||||||||||||||||||||
| Total comprehensive income | 14,752 | |||||||||||||||||||||||||||
| Issuance costs of Series A Preferred Stock | — | — | (68 | ) | — | — | — | (68 | ) | |||||||||||||||||||
| Share-based compensation plans: | ||||||||||||||||||||||||||||
| Share-based compensation | — | — | 852 | 2 | — | — | 854 | |||||||||||||||||||||
| Stock options exercised | — | — | (4 | ) | — | — | 19 | 15 | ||||||||||||||||||||
| Restricted stock awards issued, net | — | — | (207 | ) | — | — | 207 | — | ||||||||||||||||||||
| Directors’ retainer | (30 | ) | 151 | 121 | ||||||||||||||||||||||||
| Accrued undeclared cumulative dividend on Series A Preferred Stock, net of amortization | 344 | — | — | (537 | ) | — | — | (193 | ) | |||||||||||||||||||
| Cash dividends declared: | ||||||||||||||||||||||||||||
| Series A 3% Preferred-$3.00 per share | — | — | — | (5 | ) | — | — | (5 | ) | |||||||||||||||||||
| Series A Preferred-$223.61 per share | — | — | — | (1,678 | ) | — | — | (1,678 | ) | |||||||||||||||||||
| Series B-1 8.48% Preferred-$8.48 per share | — | — | — | (1,477 | ) | — | — | (1,477 | ) | |||||||||||||||||||
| Common-$0.40 per share | — | — | — | (4,327 | ) | — | — | (4,327 | ) | |||||||||||||||||||
Balance at December 31, 2009 | $ | 53,418 | $ | 113 | $ | 26,940 | $ | 131,371 | $ | (3,702 | ) | $ | (9,846 | ) | $ | 198,294 | ||||||||||||
| September 30, | September 30, | September 30, | September 30, | September 30, | September 30, | September 30, | ||||||||||||||||||||||
(Dollars in thousands, except per share data) | Preferred Equity | Common Stock | Additional Paid-in Capital | Retained Earnings | Accumulated Other Comprehensive Income (Loss) | Treasury Stock | Total Shareholders’ Equity | |||||||||||||||||||||
Balance at December 31, 2010 | $ | 53,785 | $ | 113 | $ | 26,029 | $ | 144,599 | $ | (4,722 | ) | $ | (7,660 | ) | $ | 212,144 | ||||||||||||
Balance carried forward | ||||||||||||||||||||||||||||
Comprehensive income: | ||||||||||||||||||||||||||||
Net income | — | — | — | 22,799 | — | — | 22,799 | |||||||||||||||||||||
Other comprehensive income, net of tax | — | — | — | — | 5,667 | — | 5,667 | |||||||||||||||||||||
|
| |||||||||||||||||||||||||||
Total comprehensive income | 28,466 | |||||||||||||||||||||||||||
Issuance of common stock | — | 29 | 43,098 | — | — | — | 43,127 | |||||||||||||||||||||
Purchases of treasury stock | — | — | — | — | — | (215 | ) | (215 | ) | |||||||||||||||||||
Repurchase of Series A 3% preferred stock | (3 | ) | — | — | — | — | — | (3 | ) | |||||||||||||||||||
Repurchase of warrant issued to U.S. Treasury | — | — | (2,080 | ) | — | — | — | (2,080 | ) | |||||||||||||||||||
Redemption of Series A preferred stock | (37,515 | ) | — | 68 | — | — | — | (37,447 | ) | |||||||||||||||||||
Repurchase of Series B-1 8.48% preferred stock | (99 | ) | — | — | — | — | — | (99 | ) | |||||||||||||||||||
Share-based compensation plans: | ||||||||||||||||||||||||||||
Share-based compensation | — | — | 1,105 | — | — | — | 1,105 | |||||||||||||||||||||
Stock options exercised | — | — | (28 | ) | — | — | 119 | 91 | ||||||||||||||||||||
Restricted stock awards issued, net | — | — | (954 | ) | — | — | 954 | — | ||||||||||||||||||||
Excess tax benefit on share-based compensation | — | — | 21 | — | — | — | 21 | |||||||||||||||||||||
Directors’ retainer | — | — | (12 | ) | 110 | 98 | ||||||||||||||||||||||
Accretion of discount on Series A preferred stock | 1,305 | — | — | (1,305 | ) | — | — | — | ||||||||||||||||||||
Cash dividends declared: | ||||||||||||||||||||||||||||
Series A 3% preferred-$3.00 per share | — | — | — | (5 | ) | — | — | (5 | ) | |||||||||||||||||||
Series A preferred-$53.24 per share | — | — | — | (399 | ) | — | — | (399 | ) | |||||||||||||||||||
Series B-1 8.48% preferred-$8.48 per share | — | — | — | (1,473 | ) | — | — | (1,473 | ) | |||||||||||||||||||
Common-$0.47 per share | — | — | — | (6,137 | ) | — | — | (6,137 | ) | |||||||||||||||||||
|
|
|
|
|
|
|
|
|
|
|
|
|
| |||||||||||||||
Balance at December 31, 2011 | $ | 17,473 | $ | 142 | $ | 67,247 | $ | 158,079 | $ | 945 | $ | (6,692 | ) | $ | 237,194 | |||||||||||||
|
|
|
|
|
|
|
|
|
|
|
|
|
| |||||||||||||||
See accompanying notes to the consolidated financial statements.
- 66 -
| Years ended December 31, | ||||||||||||
| (Dollars in thousands) | 2009 | 2008 | 2007 | |||||||||
| Cash flows from operating activities: | ||||||||||||
| Net income (loss) | $ | 14,441 | $ | (26,158 | ) | $ | 16,409 | |||||
| Adjustments to reconcile net income (loss) to net cash provided by operating activities: | ||||||||||||
| Depreciation and amortization | 4,067 | 3,959 | 3,991 | |||||||||
| Net amortization (accretion) of premiums and discounts on securities | 2,587 | 390 | (185 | ) | ||||||||
| Provision for loan losses | 7,702 | 6,551 | 116 | |||||||||
| Share-based compensation | 854 | 633 | 955 | |||||||||
| Deferred income tax expense (benefit) | 7,470 | (23,848 | ) | 715 | ||||||||
| Proceeds from sale of loans held for sale | 90,290 | 28,685 | 48,048 | |||||||||
| Originations of loans held for sale | (88,999 | ) | (28,453 | ) | (47,183 | ) | ||||||
| Increase in company owned life insurance | (1,096 | ) | (563 | ) | (111 | ) | ||||||
| Net gain on sale of loans held for sale | (699 | ) | (339 | ) | (779 | ) | ||||||
| Net gain on disposal of investment securities | (3,429 | ) | (288 | ) | (207 | ) | ||||||
| Impairment charge on investment securities | 4,666 | 68,215 | — | |||||||||
| Net gain on sale and disposal of other assets | (180 | ) | (305 | ) | (102 | ) | ||||||
| (Increase) decrease in other assets | (8,773 | ) | (1,322 | ) | 3,510 | |||||||
| Decrease in other liabilities | (6,633 | ) | (5,866 | ) | (2,406 | ) | ||||||
| Net cash provided by operating activities | 22,268 | 21,291 | 22,771 | |||||||||
| Cash flows from investing activities: | ||||||||||||
| Purchases of investment securities: | ||||||||||||
| Available for sale | (602,259 | ) | (310,191 | ) | (307,049 | ) | ||||||
| Held to maturity | (29,280 | ) | (54,925 | ) | (54,926 | ) | ||||||
| Proceeds from principal payments, maturities and calls on investment securities: | ||||||||||||
| Available for sale | 353,545 | 337,704 | 308,323 | |||||||||
| Held to maturity | 46,891 | 57,325 | 36,169 | |||||||||
| Proceeds from sale of securities available for sale | 224,928 | 58,368 | 49,350 | |||||||||
| Net loan originations | (165,716 | ) | (161,414 | ) | (41,778 | ) | ||||||
| Purchases of company owned life insurance | (79 | ) | (20,112 | ) | (58 | ) | ||||||
| Proceeds from sales of other assets | 1,709 | 1,783 | 1,307 | |||||||||
| Purchases of premises and equipment | (1,959 | ) | (6,333 | ) | (3,407 | ) | ||||||
| Net cash used in investing activities | (172,220 | ) | (97,795 | ) | (12,069 | ) | ||||||
| Cash flows from financing activities: | ||||||||||||
| Net increase (decrease) in deposits | 109,692 | 57,292 | (41,724 | ) | ||||||||
| Net increase (decrease) in short-term borrowings | 36,078 | (2,178 | ) | (6,668 | ) | |||||||
| Proceeds from long-term borrowings | — | 30,000 | — | |||||||||
| Repayments of long-term borrowings | (508 | ) | (25,212 | ) | (12,321 | ) | ||||||
| Purchases of preferred and common shares | — | (4,821 | ) | (7,245 | ) | |||||||
| Proceeds from issuance of preferred and common shares, net of issuance costs | (68 | ) | 35,602 | 105 | ||||||||
| Proceeds from issuance of common stock warrant | — | 2,025 | — | |||||||||
| Proceeds from stock options exercised | 15 | 32 | 251 | |||||||||
| Cash dividends paid to preferred shareholders | (3,160 | ) | (1,482 | ) | (1,483 | ) | ||||||
| Cash dividends paid to common shareholders | (4,325 | ) | (6,240 | ) | (4,716 | ) | ||||||
| Net cash provided by (used in) financing activities | 137,724 | 85,018 | (73,801 | ) | ||||||||
| Net (decrease) increase in cash and cash equivalents | (12,228 | ) | 8,514 | (63,099 | ) | |||||||
| Cash and cash equivalents, beginning of period | 55,187 | 46,673 | 109,772 | |||||||||
| Cash and cash equivalents, end of period | $ | 42,959 | $ | 55,187 | $ | 46,673 | ||||||
| September 30, | September 30, | September 30, | ||||||||||
| Years ended December 31, | ||||||||||||
(Dollars in thousands) | 2011 | 2010 | 2009 | |||||||||
Cash flows from operating activities: | ||||||||||||
Net income | $ | 22,799 | $ | 21,287 | $ | 14,441 | ||||||
Adjustments to reconcile net income to net cash provided by operating activities: | ||||||||||||
Depreciation and amortization | 3,466 | 3,537 | 4,067 | |||||||||
Net amortization of premiums on securities | 5,722 | 3,005 | 2,587 | |||||||||
Provision for loan losses | 7,780 | 6,687 | 7,702 | |||||||||
Share-based compensation | 1,105 | 1,031 | 854 | |||||||||
Deferred income tax expense | 6,510 | 2,468 | 7,470 | |||||||||
Proceeds from sale of loans held for sale | 32,839 | 42,195 | 90,290 | |||||||||
Originations of loans held for sale | (31,231 | ) | (44,262 | ) | (88,999 | ) | ||||||
Net gain on sale of loans held for sale | (880 | ) | (650 | ) | (699 | ) | ||||||
Increase in company owned life insurance | (1,424 | ) | (1,107 | ) | (1,096 | ) | ||||||
Net gain on sales and calls of investment securities | (3,003 | ) | (169 | ) | (3,429 | ) | ||||||
Impairment charges on investment securities | 18 | 594 | 4,666 | |||||||||
Net (gain) loss on sale and disposal of other assets | (67 | ) | 203 | (180 | ) | |||||||
Loss on extinguishment of debt | 1,083 | — | — | |||||||||
Increase in other assets | (7,756 | ) | (353 | ) | (8,773 | ) | ||||||
(Decrease) increase in other liabilities | (4,943 | ) | 961 | (6,633 | ) | |||||||
|
|
|
|
|
| |||||||
Net cash provided by operating activities | 32,018 | 35,427 | 22,268 | |||||||||
|
|
|
|
|
| |||||||
Cash flows from investing activities: | ||||||||||||
Purchases of investment securities: | ||||||||||||
Available for sale | (158,013 | ) | (430,952 | ) | (602,259 | ) | ||||||
Held to maturity | (17,188 | ) | (19,791 | ) | (29,280 | ) | ||||||
Proceeds from principal payments, maturities and calls on investment securities: | ||||||||||||
Available for sale | 168,976 | 219,974 | 353,545 | |||||||||
Held to maturity | 21,986 | 30,885 | 46,891 | |||||||||
Proceeds from sales and calls of securities available for sale | 44,514 | 122,090 | 224,928 | |||||||||
Net increase in loans, excluding sales | (157,110 | ) | (89,507 | ) | (165,716 | ) | ||||||
Loans sold | 13,033 | — | — | |||||||||
Purchases of company owned life insurance | (18,079 | ) | (79 | ) | (79 | ) | ||||||
Proceeds from sales of other assets | 705 | 611 | 1,709 | |||||||||
Purchases of premises and equipment | (3,678 | ) | (2,438 | ) | (1,959 | ) | ||||||
|
|
|
|
|
| |||||||
Net cash used in investing activities | (104,854 | ) | (169,207 | ) | (172,220 | ) | ||||||
|
|
|
|
|
| |||||||
Cash flows from financing activities: | ||||||||||||
Net increase in deposits | 48,709 | 139,935 | 109,692 | |||||||||
Net increase in short-term borrowings | 73,588 | 17,567 | 36,078 | |||||||||
Repayments of long-term borrowings | (26,767 | ) | (20,080 | ) | (508 | ) | ||||||
Proceeds from issuance of common stock, net of issuance costs | 43,127 | — | — | |||||||||
Purchases of common stock for treasury | (215 | ) | (69 | ) | — | |||||||
Repurchase of Series A 3% preferred stock | (3 | ) | — | — | ||||||||
Issuance costs of Series A preferred stock | — | — | (68 | ) | ||||||||
Repurchase of warrant issued to U.S. Treasury | (2,080 | ) | — | — | ||||||||
Redemption of Series A preferred stock | (37,447 | ) | — | — | ||||||||
Repurchase of Series B-1 8.48% preferred stock | (99 | ) | — | — | ||||||||
Proceeds from stock options exercised | 91 | 216 | 15 | |||||||||
Excess tax benefit on share-based compensation | 21 | — | — | |||||||||
Cash dividends paid to preferred shareholders | (2,118 | ) | (3,358 | ) | (3,160 | ) | ||||||
Cash dividends paid to common shareholders | (5,446 | ) | (4,332 | ) | (4,325 | ) | ||||||
|
|
|
|
|
| |||||||
Net cash provided by financing activities | 91,361 | 129,879 | 137,724 | |||||||||
|
|
|
|
|
| |||||||
Net increase (decrease) in cash and cash equivalents | 18,525 | (3,901 | ) | (12,228 | ) | |||||||
Cash and cash equivalents, beginning of period | 39,058 | 42,959 | 55,187 | |||||||||
|
|
|
|
|
| |||||||
Cash and cash equivalents, end of period | $ | 57,583 | $ | 39,058 | $ | 42,959 | ||||||
|
|
|
|
|
| |||||||
See accompanying notes to the consolidated financial statements.
- 67 -
December 31, 2009, 20082011, 2010 and 2007
(1.) SUMMARY OF SIGNIFICANT ACCOUNTING POLICIES
Financial Institutions, Inc., a financial holding company organized under the laws of New York State (“New York” or “NYS”), and its subsidiaries provide deposit, lending and other financial services to individuals and businesses in Central and Western New York. The Company has also expanded its indirect lending network to include relationships with franchised automobile dealers in the Capital District of New York and Northern Pennsylvania. The Company owns all of the capital stock of Five Star Bank, a New York State chartered bank, and Five Star Investment Services, Inc., a broker-dealer and investment advisor subsidiary offering noninsured investment products. The Company also owns 100% of FISI Statutory Trust I (the “Trust”), which was formed in February 2001 for the purpose of issuing trust preferred securities. References to “the Company” mean the consolidated reporting entities and references to “the Bank” mean Five Star Bank.
The accounting and reporting policies conform to general practices within the banking industry and to U.S. generally accepted accounting principles (“GAAP”). Prior years’ consolidated financial statements are re-classified whenever necessary to conform to the current year’s presentation.
The Financial Accounting Standards Board’s (“FASB”) Accounting Standards Codification (“ASC”) became effective on July 1, 2009. At that date,Company has evaluated events and transactions for potential recognition or disclosure through the ASC became FASB’s officially recognized source of authoritative GAAP applicable to all public and non-public non-governmental entities, superseding existing FASB, American Institute of Certified Public Accountants, Emerging Issues Task Force and related literature. Rules and interpretive releases ofday the Securities and Exchange Commission (“SEC”) under the authority of federal securities laws are also sources of authoritative GAAP for SEC registrants. All other accounting literature is considered non-authoritative. The switch to the ASC affects the way companies refer to GAAP in financial statements and accounting policies. Citing particular content in the ASC involves specifying the unique numeric path to the content through the Topic, Subtopic, Section and Paragraph structure.
The following is a description of the Company’s significant accounting policies.
(a.) Principles of Consolidation
The consolidated financial statements include the accounts of the Company and its subsidiaries. The Trust is not included in the consolidated financial statements of the Company. All significant intercompany accounts and transactions have been eliminated in consolidation.
(b.) Use of Estimates
In preparing the consolidated financial statements in conformity with GAAP, management is required to make estimates and assumptions that affect the reported amount of assets and liabilities as of the date of the statement of financial condition and reported amounts of revenue and expenses during the reporting period. Material estimates relate to the determination of the allowance for loan losses, assumptions used in the defined benefit pension plan accounting, the carrying value of goodwill and deferred tax assets, and the valuation and other than temporary impairment (“OTTI”) considerations related to the securities portfolio.portfolio, and assumptions used in the defined benefit pension plan accounting,. These estimates and assumptions are based on management’s best estimates and judgment and are evaluated on an ongoing basis using historical experience and other factors, including the current economic environment. The Company adjusts these estimates and assumptions when facts and circumstances dictate. Illiquid credit markets and volatile equity have combined with declines in consumer spending to increase the uncertainty inherent in these estimates and assumptions. As future events cannot be determined with precision, actual results could differ significantly from the Company’s estimates.
(c.) Cash Flow Reporting
Cash and cash equivalents include cash and due from banks, federal funds sold and interest-bearing deposits in other banks. Net cash flows are reported for loans, deposit transactions and short-term borrowings.
Supplemental cash flow information is summarized as follows for the years ended December 31 (in thousands):
| 2009 | 2008 | 2007 | ||||||||||
| Cash paid during the year for: | ||||||||||||
| Interest expense | $ | 21,682 | $ | 37,160 | $ | 49,687 | ||||||
| Income taxes, net of income tax refunds | (1,312 | ) | 3,797 | 4,031 | ||||||||
| Non-cash activity: | ||||||||||||
| Real estate and other assets acquired in settlement of loans | $ | 1,096 | $ | 1,185 | $ | 2,443 | ||||||
| Dividends declared and unpaid | 1,692 | 1,497 | 1,805 | |||||||||
| (Decrease) increase in net unsettled security purchases | (1,348 | ) | 1,453 | 336 | ||||||||
| Loans securitized and sold | 15,983 | — | — | |||||||||
| September 30, | September 30, | September 30, | ||||||||||
| 2011 | 2010 | 2009 | ||||||||||
Cash paid (received) during the year for: | ||||||||||||
Interest expense | $ | 15,668 | $ | 17,676 | $ | 21,682 | ||||||
Income taxes, net of income tax refunds | 5,191 | 6,923 | (1,312 | ) | ||||||||
Non-cash activity: | ||||||||||||
Real estate and other assets acquired in settlement of loans | $ | 305 | $ | 561 | $ | 1,096 | ||||||
Dividends declared and unpaid | 2,144 | 1,694 | 1,692 | |||||||||
Decrease in net unsettled security purchases | (67 | ) | (317 | ) | (1,348 | ) | ||||||
Loans securitized | — | — | 15,983 | |||||||||
- 68 -
NOTES TO CONSOLIDATED FINANCIAL STATEMENTS
December 31, 2009, 20082011, 2010 and 2007
(1.) SUMMARY OF SIGNIFICANT ACCOUNTING POLICIES (Continued)
(d.) Investment Securities
Investment securities are classified as either available for sale or held to maturity. Debt securities that management has the positive intent and ability to hold to maturity are classified as held to maturity and are recorded at amortized cost. Other investment securities are classified as available for sale and recorded at fair value, with unrealized gains and losses excluded from earnings and reported as a component of shareholders’ equity.
Purchase premiums and discounts are recognized in interest income using the interest method over the terms of the securities. Securities are evaluated periodically to determine whether a decline in their fair value is other than temporary. Management utilizes criteria such as, the current intent to hold or sell the security, the magnitude and duration of the decline and, when appropriate, consideration of negative changes in expected cash flows, creditworthiness, near term prospects of issuers, the level of credit subordination, estimated loss severity, and delinquencies, to determine whether a loss in value is other than temporary. The term “other than temporary” is not intended to indicate that the decline is permanent, but indicates that the prospect for a near-term recovery of value is not necessarily favorable. Declines in the fair value of investment securities below their cost that are deemed to be other than temporary are reflected in earnings as realized losses to the extent the impairment is related to credit issues or concerns, or the security is intended to be sold. The amount of impairment related to non-credit related factors is recognized in other comprehensive income. Gains and losses on the sale of securities are recorded on the trade date and are determined using the specific identification method.
(e.) Loans Held for Sale and Mortgage Servicing Rights
The Company generally makes the determination of whether to identify a mortgage as held for sale at the time the loan is closed based on the Company’s intent and ability to hold the loan. Loans held for sale are recorded at the lower of aggregated cost or fair value. If necessary,market computed on the aggregate portfolio basis. The amount, by which cost exceeds market value, if any, is accounted for as a valuation allowance is recorded by a charge to incomewith changes included in the determination of results of operations for unrealized losses attributable to changesthe period in market interest rates. Subsequent increases in fair valuewhich the change occurs. The amount of loan origination cost and fees are adjusted through the valuation allowance, but only to the extentdeferred at origination of the valuation allowance. Gainsloans and lossesrecognized as part of the gain and loss on sale of the disposition of loans, held for sale are determined onusing the specific identification method. Loan servicing fees are recognized on an accrual basis.
The Company originates and sells certain residential real estate loans in the secondary market. The Company typically retains the right to service the mortgages upon sale. The Company makesMortgage-servicing rights (“MSRs”) represent the determinationcost of whether or notacquiring the contractual rights to identify the mortgage as a loan heldservice loans for sale at the time the application is received from the borrower based on the Company’s intent and ability to hold the loan.
Mortgage loan servicing includes collecting monthly mortgagor payments, forwarding payments and 2008. The mortgage forward sale commitments are primarily with Federal Home Loan Mortgage Corporation (“FHLMC”), Staterelated accounting reports to investors, collecting escrow deposits for the payment of New York Mortgage Agency (“SONYMA”) or Federal Housing Agency (“FHA”).
72
FINANCIAL INSTITUTIONS, INC. AND SUBSIDIARIES
NOTES TO CONSOLIDATED FINANCIAL STATEMENTS
December 31, 2011, 2010 and 2009
(1.) SUMMARY OF SIGNIFICANT ACCOUNTING POLICIES (Continued)
(f.) Loans
Loans are statedclassified as held for investment when management has both the intent and ability to hold the loan for the foreseeable future, or until maturity or payoff. Loans are carried at the principal amount outstanding, net of any unearned income and unamortized deferred fees and costs on originated loans. Loan origination fees and certain direct loan origination feescosts are deferred, and costs, which are accretedthe net amount is amortized into net interest income over the contractual life of the related loans or amortized to interestover the commitment period as an adjustment of yield. Interest income on loans is based on the principal balance outstanding computed using the effective interest method. Accrual
A loan is considered delinquent when a payment has not been received in accordance with the contractual terms. The accrual of interest onincome for commercial loans is suspended and all unpaid accrueddiscontinued when there is a clear indication that the borrower’s cash flow may not be sufficient to meet payments as they become due, while the accrual of interest income for retail loans is reverseddiscontinued when management believes that reasonable doubt exists with respect to the collectibility of principal or interest.
- 69 -
The Company’s loan policy dictates the guidelines to be followed in determining when a loan is charged-off. All charge offs are approved by the Bank’s senior loan officers or loan committees, depending on the amount of the charge off, and are reported in aggregate to the Bank’s Board of Directors. Commercial business and commercial mortgage loans are charged-off when a determination is made that the financial condition of the borrower indicates that the loan will not be collectible in the ordinary course of business. Residential mortgage loans and home equities are generally charged-off or written down when the credit becomes severely delinquent and the balance exceeds the fair value of the property less costs to sell. Indirect and other consumer loans, both secured and unsecured, are generally charged-off in full during the month in which the loan becomes 120 days past due, unless the collateral is in the process of repossession in accordance with the contractual terms of the loan.
A loan is classifiedaccounted for as non-accruing, payments received are generally used to reduce the principal balance. When the future collectibility of the recorded loan balance is expected, interest income may be recognized on a cash basis. In the case where a non-accruing loan had been partially charged-off, recognition of interest on a cash basis is limited to that which would have been recognized on the recorded loan balance at the contractual interest rate. Interest collections in excess of that amount are recorded as recoveries to the allowance for loan losses until prior charge-offs have been fully recovered.
(g.) Off-Balance Sheet Financial Instruments
In the ordinary course of business, the Company enters into off-balance sheet financial instruments consisting of commitments to extend credit, standby letters of credit and financial guarantees. Such financial instruments are recorded in the consolidated financial statements when they are funded or when related fees are incurred or received. The Company periodically evaluates the credit risks inherent in these commitments and establishes loss allowances for such risks if and when these are deemed necessary.
The Company recognizes as liabilities the fair value of the collateral, ifobligations undertaken in issuing the loan is collateral dependent. The majorityguarantees under the standby letters of credit, net of the Company’s impairedrelated amortization at inception. The fair value approximates the unamortized fees received from the customers for issuing the standby letters of credit. The fees are deferred and recognized on a straight-line basis over the commitment period. Standby letters of credit outstanding at December 31, 2011 had original terms ranging from one to five years.
73
FINANCIAL INSTITUTIONS, INC. AND SUBSIDIARIES
NOTES TO CONSOLIDATED FINANCIAL STATEMENTS
December 31, 2011, 2010 and 2009
(1.) SUMMARY OF SIGNIFICANT ACCOUNTING POLICIES (Continued)
Fees received for providing loan commitments and letters of credit that result in loans are collateral dependent.
(g.(h.) Allowance for Loan Losses
The allowance for loan losses is established through charges to earnings in the form of a provision for loan losses. When a loan or portion of a loan is determined to be uncollectible, the portion deemed uncollectible is charged against the allowance and subsequent recoveries, if any, are credited to the allowance.
The allowance for loan losses is evaluated on a regular basis and is based upon periodic review of the collectability of the loans in light of historical experience, the nature and volume of the loan portfolio, adverse situations that may affect the borrower’s ability to repay, estimated value of any underlying collateral, and prevailing economic conditions. This evaluation is inherently subjective as it requires estimates that are susceptible to significant revision as more information becomes available.
The allowance consists of specific and general components. Specific allowances are established for smaller balanceimpaired loans. Impaired commercial business and commercial mortgage loans are individually evaluated and measured for impairment based on the present value of expected future cash flows discounted at the loan’s effective interest rate, a loan’s observable market price, or the fair value of the collateral if the loan is collateral dependent. Regardless of the measurement method, impairment is based on the fair value of the collateral when foreclosure is probable. If the recorded investment in impaired loans exceeds the measure of estimated fair value, a specific allowance is established as a component of the allowance for loan losses. Interest payments on impaired loans are typically applied to principal unless collectability of the principal amount is reasonably assured, in which case interest is recognized on a cash basis. Impaired loans, or portions thereof, are charged off when deemed uncollectible.
A loan is considered impaired when, based on current information and events, it is probable that the Company will be unable to collect the scheduled payments of principal or interest when due according to the contractual terms of the loan agreement. Factors considered in determining impairment include payment status and the probability of collecting scheduled principal and interest payments when due. Loans that experience insignificant payment delays and payment shortfalls generally are not classified as impaired. The Company determines the significance of payment delays and payment shortfalls on a case-by-case basis, taking into consideration all of the circumstances surrounding the loan and the borrower, including the length of the delay, the reasons for the delay, the borrower’s prior payment record, and the amount of the shortfall in relation to the principal and interest owed. Impairment is measured on a loan by loan basis by either the present value of expected future cash flows discounted at the loan’s effective interest rate, the loans obtainable market price, or the fair value of the collateral if the loan is collateral dependent. Large groups of homogeneous loans are collectively evaluated for impairment. Accordingly, the Company does not separately identify individual consumer and residential loans for impairment disclosures unless the loan has been subject to a troubled debt restructure.
General allowances are established for loan losses on a portfolio basis for loans that do not meet the definition of impaired. The portfolio is grouped into similar risk characteristics, primarily loan type. The Company applies an estimated loss rate to each loan group. The loss rate is based on historical charge-off experience and as a result can differ from actual losses incurred in the future. The historical loss rate is adjusted for qualitative factors such as levels and trends of delinquent and non-accruing loans, trends in volume and terms, effects of changes in lending policy, the experience, ability and depth of management, national and local economic trends and conditions, and concentrations of credit risk, interest rates, highly leveraged borrowers, information risk and collateral risk.
While management evaluates currently available information in establishing the allowance for loan losses, future adjustments to the allowance may be necessary if conditions differ substantially from the assumptions used in making the evaluations. In addition, various regulatory agencies, as an integral part of their examination process, periodically review a financial institution’s allowance for loan losses. Such agencies may require the financial institution to recognize additions to the allowance based on their judgments about information available to them at the time of their examination.
74
FINANCIAL INSTITUTIONS, INC. AND SUBSIDIARIES
NOTES TO CONSOLIDATED FINANCIAL STATEMENTS
December 31, 2011, 2010 and 2009
(1.) SUMMARY OF SIGNIFICANT ACCOUNTING POLICIES (Continued)
(h.(i.) Other Real Estate Owned
Other real estate owned consists of properties acquired through foreclosure or by acceptance of a deed in lieu of foreclosure. These assets are recorded at the lower of fair value of the asset acquired less estimated costs to sell or “cost” (defined as the fair value at initial foreclosure). At the time of foreclosure, or when foreclosure occurs in-substance, the excess, if any, of the loan over the fair market value of the assets received, less estimated selling costs, is charged to the allowance for loan losses and any subsequent valuation write-downs are charged to other expense. In connection with the determination of the allowance for loan losses and the valuation of other real estate owned, management obtains appraisals for properties. Operating costs associated with the properties are charged to expense as incurred. Gains on the sale of other real estate owned are included in income when title has passed and the sale has met the minimum down payment requirements prescribed by GAAP. The balance of other real estate owned at December 31, 2011 was $475 thousand.
(j.) Company Owned Life Insurance
The Company holds life insurance policies on certain current and former employees. The Company is the owner and beneficiary of the policies. The cash surrender value of these policies is included as an asset on the consolidated statements of financial condition, and any increase in cash surrender value is recorded as noninterest income on the consolidated statements of operations.income. In the event of the death of an insured individual under these policies, the Company would receive a death benefit which would be recorded as noninterest income.
- 70 -
Premises and equipment are stated at cost, less accumulated depreciation and amortization. Depreciation is computed on the straight-line method over the estimated useful lives of the assets. The Company generally amortizes buildings and building improvements over a period of 15 to 39 years and software, furniture and equipment over a period of 3 to 10 years. Leasehold improvements are amortized over the shorter of the lease term or the useful life of the improvements. Premises and equipment are periodically reviewed for impairment or when circumstances present indicators of impairment.
(j.(l.) Goodwill and Other Intangible Assets
Goodwill represents the excess of the purchase price over the fair value of net assets acquired in accordance with the purchase method of accounting for business combinations. Goodwill is not being amortized but, instead, is requiredsubject to be tested for impairment annuallytests on at least an annual basis or more oftenfrequently if certain events occur. Goodwillan event occurs or circumstances change that reduce the fair value of a reporting unit below its carrying amount. The Company completes the annual goodwill impairment test as of September 30 of each year. The impairment testing process is performed at the segment (or “reporting unit”) level.conducted by assigning net assets and goodwill to each reporting unit. Currently, the Company’s goodwill is evaluated at the entity level as there is only one reporting unit. GoodwillThe fair value of each reporting unit is assignedcompared to reporting units at the date it is initially recorded. Once goodwill has been assigned to reporting units, it no longer retains its association with a particular acquisition, and allrecorded book value “step one”. If the fair value of the activities withinreporting unit exceeds its carrying value, goodwill is not considered impaired and “step two” is not considered necessary. If the carrying value of a reporting unit whether acquired or organically grown, are available to supportexceeds its fair value, the impairment test continues (“step two”) by comparing the carrying value of the reporting unit’s goodwill to the implied fair value of goodwill.
The company had other intangible assets, are beingconsisting entirely of core deposit intangibles, which were fully amortized onas of December 31, 2009. Amortization expense for these other intangible assets for the year ended December 31, 2009 was $280 thousand. Amortization of other intangible assets was computed using the straight-line method over the expected periods to be benefited. Other intangible assets are periodically reviewed for impairment or when events or changed circumstances may affect the underlying basisestimated lives of the assets.
75
FINANCIAL INSTITUTIONS, INC. AND SUBSIDIARIES
NOTES TO CONSOLIDATED FINANCIAL STATEMENTS
December 31, 2011, 2010 and 2009
(1.) SUMMARY OF SIGNIFICANT ACCOUNTING POLICIES (Continued)
(k.(m.) Federal Home Loan Bank (“FHLB”) and Federal Reserve Bank (“FRB”) Stock
The non-marketable investments in FHLB and FRB stock are included in other assets in the consolidated statements of financial condition at par value or cost and are periodically reviewed for impairment. The dividends received relative to these investments are included in other noninterest income in the consolidated statements of operations.
As a member of the FHLB system, the Company is required to maintain a specified investment in FHLB of New York (“FHLBNY”) stock in proportion to theits volume of certain transactions with the FHLB. FHLBNY stock totaled $3.3$6.8 million and $3.2$2.5 million as of December 31, 20092011 and 2008,2010, respectively. Deterioration in the soundness of the FHLB System may increase the potential that the investments in FHLB stock recorded on the Company’s consolidated statements of financial condition be designated as impaired and that the Company may incur a write-down in the future.
As a member of the FRB system, the Company is required to maintain a specified investment in FRB stock based on a ratio relative to the Company’s capital. FRB stock totaled $3.9 million and $2.8 million as of December 31, 20092011 and 2008, respectively.
(l.(n.) Equity Method Investments
The Company has investments in limited partnerships and accounts for these investments under the equity method. These investments are included in other assets in the consolidated statements of financial condition and totaled $2.7$4.0 million and $2.4$3.6 million as of December 31, 20092011 and 2008,2010, respectively.
(m.) Other Real Estate Owned
Acquisitions of treasury stock are recorded at cost. The reissuance of shares in treasury is recorded at weighted-average cost.
- 71 -
The Company participates in a non-contributory defined benefit pension plan for certain employees who previously met participation requirements. The Company also provides post-retirement benefits, principally health and dental care, to employees of a previously acquired entity. The Company has closed the pension and post-retirement plans to new participants. The actuarially determined pension benefit is based on years of service and the employee’s highest average compensation during five consecutive years of employment. The Company’s policy is to at least fund the minimum amount required by the Employment Retirement Income Security Act of 1974 (“ERISA”).1974. The cost of the pension and post-retirement plans are based on actuarial computations of current and future benefits for employees, and is charged to noninterest expense in the consolidated statements of operations.
The Company recognizes an asset or a liability for a plans’ overfunded status or underfunded status, respectively, in the consolidated financial statements and reports changes in the funded status as a component of other comprehensive income, net of applicable taxes, in the year in which changes occur. Prior to 2008, the assets and obligations that determine future funded status were measured as of September 30 of each year. Beginning in 2008, the measurement date was changed to December 31 to coincide with the end of the Company’s fiscal year. The effect of changing the measurement date resulted in a $43 thousand increase to retained earnings.
(p.(q.) Share-Based Compensation Plans
Compensation expense for stock options and restricted stock awards is based on the fair value of the award on the measurement date, which, for the Company, is the date of grant and is recognized ratably over the service period of the award. The fair value of stock options is estimated using the Black-Scholes option-pricing model. The fair value of restricted stock awards is generally the market price of the Company’s stock on the date of grant.
Share-based compensation expense is included in the consolidated statements of operationsincome under salaries and employee benefits for awards granted to management and in other noninterest expense for awards granted to directors.
(q.(r.) Income Taxes
Income taxes are accounted for using the asset and liability method. Deferred tax assets and liabilities are recognized for the future tax consequences attributable to differences between the financial statement carrying amounts of existing assets and liabilities and their respective tax bases. Deferred tax assets and liabilities are measured using enacted tax rates in effect for the year in which those temporary differences are expected to be recovered or settled. The effect of a change in tax rates on deferred tax assets and liabilities is recognized in income in the period that includes the enactment date. A valuation allowance is recognized on deferred tax assets if, based upon the weight of available evidence, it is more likely than not that some or all of the assets may not be realized. The Company recognizes interest and/or penalties related to income tax matters in income tax expense.
76
FINANCIAL INSTITUTIONS, INC. AND SUBSIDIARIES
NOTES TO CONSOLIDATED FINANCIAL STATEMENTS
December 31, 2011, 2010 and 2009
(1.) SUMMARY OF SIGNIFICANT ACCOUNTING POLICIES (Continued)
(r.(s.) Earnings (Loss) Per Common Share
The Company calculates earnings per common share (“EPS”) using the Company adopted new authoritative accounting guidance under ASCtwo-class method in accordance with Financial Accounting Standards Board (“FASB”) Accounting Standards Codification (“ASC”) Topic 260, “Earnings Per Share,” which provides thatShare”. The two-class method requires the Company to present EPS as if all of the earnings for the period are distributed to common shareholders and any participating securities, regardless of whether any actual dividends or distributions are made. All outstanding unvested share-based payment awards that contain nonforfeitable rights to nonforfeitable dividends or dividend equivalents (whether paid or unpaid) are considered participating securities and shall be included insecurities. Certain of the computation of earnings per share pursuantrestricted shares issued under the Company’s share-based compensation plan are entitled to dividends at the two-class method.same rate as common stock. The Company has determined that itsthese outstanding non-vested stock awards arequalify as participating securities. Accordingly, effective January 1, 2009, earnings per common share is computed using the two-class method prescribed under FASB ASC Topic 260. All previously reported earnings per common share data has been retrospectively adjusted to conform to the new computation method. The adoption and resulting adjustments to conform to the new guidance did not have a material impact on the Company’s consolidated financial statements.
Basic EPS is computed by dividing netdistributed and undistributed earnings allocatedavailable to common stockshareholders by the weighted-averageweighted average number of common shares outstanding duringfor the applicable period, excluding outstandingperiod. Distributed and undistributed earnings available to common shareholders represent net income reduced by preferred stock dividends and distributed and undistributed earnings available to participating securities. Common shares outstanding include common stock and vested restricted stock awards. Diluted earnings per common share is computed usingEPS reflects the weighted-average numberassumed conversion of shares determined for the basic earnings per common share computation plus theall potential dilutive effect of stock compensation using the treasury stock method.securities. A reconciliation of the weighted-average shares used in calculating basic earnings per common share and the weighted average common shares used in calculating diluted earnings per common share for the reported periods is provided in Note 15—Earnings Per Common Share.
(t.) Recent Accounting Pronouncements
In December 2011, the Financial Accounting Standard Board (“FASB”) issued Accounting Standards Update (“ASU”) 2011-12 “Comprehensive Income (Topic 220)—Deferral of the Effective Date for Amendments to the Presentation of Reclassifications of Items Out of Accumulated Other Comprehensive Income in Accounting Standards Update No. 2011-05.”ASU 2011-12 defers changes in ASU No. 2011-05 that relate to the presentation of reclassification adjustments to allow the FASB time to reconsider whether to require presentation of such adjustments on the face of the financial statements to show the effects of reclassifications out of accumulated other comprehensive income on the components of net income and other comprehensive income. ASU 2011-12 allows entities to continue to report reclassifications out of accumulated other comprehensive income consistent with the presentation requirements in effect before ASU No. 2011-05. All other requirements in ASU No. 2011-05 are not affected by ASU No. 2011-12. ASU 2011-12 is effective for annual and interim periods beginning after December 15, - Earnings (Loss) Per Share.
In November 2011, the FASB issued ASU 2011-11“Balance Sheet (Topic 210)—“Disclosures about Offsetting Assets and Liabilities.”ASU 2011-11 amends Topic 210,“Balance Sheet,” to require an entity to disclose both gross and net information about financial instruments, such as sales and repurchase agreements and reverse sale and repurchase agreements and securities borrowing/lending arrangements, and derivative instruments that are eligible for offset in the statement of financial position and/or subject to a master netting arrangement or similar agreement. ASU 2011-11 is effective for annual and interim periods beginning on January 1, 2013, and is not expected to have a material impact on the Company’s consolidated financial statements.
In September 2011, the FASB issued ASU No. 2011-08“Testing Goodwill for Impairment.” The provisions of ASU 2011-08 permit an entity the option to first perform a qualitative assessment to determine whether it is more likely than not that the fair value of a reporting unit is less than its carrying amount. If an entity believes, as a result of its qualitative assessment, that it is more likely than not that the fair value of a reporting unit is less than its carrying amount, the quantitative impairment test is required. Otherwise, no further impairment testing is required. ASU No. 2011-08 includes examples of events and circumstances that may indicate that a reporting unit’s fair value is less than its carrying amount. The provisions of ASU No. 2011-08 are effective for annual and interim goodwill impairment tests performed for fiscal years beginning after December 15, 2011. Early adoption is permitted provided that the entity has not yet performed its annual impairment test for goodwill. The Company performs its annual impairment test for goodwill as of September 30 of each year. The adoption of ASU No. 2011-08 is not expected to have a material impact on the Company’s consolidated financial statements.
- 72 -
NOTES TO CONSOLIDATED FINANCIAL STATEMENTS
December 31, 2009, 20082011, 2010 and 2007
(1.) SUMMARY OF SIGNIFICANT ACCOUNTING POLICIES (Continued)
In June 2011, the FASB issued ASU 2011-05(s.) Financial Instruments with Off-Balance Sheet Risk“Comprehensive Income (Topic 220)—Presentation of Comprehensive Income.”
In May 2011, the FASB ASC 810-10-25,issued ASU 2011-04“Fair Value Measurement (Topic 820)—Amendments to Achieve Common Fair Value Measurement and Disclosure Requirements in U.S. GAAP and IFRSs.” ASU 2011-04 changes the consolidation guidance related to variable interest entities (“VIEs”), was amended to modify the approachwording used to evaluate VIEsdescribe many of the requirements in GAAP for measuring fair value and addfor disclosing information about fair value measurements. Consequently, the amendments in this update result in common fair value measurement and disclosure requirements about an enterprise’s involvement with VIEs. These provisions arein GAAP and IFRSs (International Financial Reporting Standards). ASU 2011-04 is effective at theprospectively during interim and annual periods beginning of an entity’s annual reporting period that beginson or after NovemberDecember 15, 2009 and for interim periods within that period.2011. Early adoption by public entities is not permitted. The Company does not expect the adoption of this consolidation guidanceASU 2011-04 is not expected to have a material effect on its consolidated financial statements.
In April 2011, the FASB ASC 715-20-65 “Compensation issued ASU 2011-03“Transfers and Servicing (Topic 860)— Retirement Benefits” expandsReconsideration of Effective Control for Repurchase Agreement.” ASU 2011-03 removes from the disclosure requirements for planassessment of effective control the criterion relating to the transferor’s ability to repurchase or redeem financial assets on substantially the agreed terms, even in the event of defined benefit pensions or other postretirement plans. For plans subject to this statement, entities are required to provide more detailed information about (1) investment policies and strategies, (2) categories of plan assets, (3) fair value measurements of plan assets, and (4) significant concentrations of risk. FASB ASC 715-20-65default by the transferee. ASU 2011-03 is effective for fiscal years endingthe first interim or annual period beginning on or after December 15, 2009.2011. The provisionsguidance should be applied prospectively to transactions or modifications of this FASB ASC were adopted forexisting transactions that occur on or after the reporting period ending December 31, 2009 and the required disclosures are reported in Note 16 — Employee Benefit Plans. Additional new authoritative accounting guidance under ASC Topic 715, “Compensation—Retirement Benefits,” requires the recognitioneffective date. Early adoption is not permitted. The adoption of a liability and related compensation expense for endorsement split-dollar life insurance policies that provide a benefitASU 2011-03 is not expected to an employee that extends to post-retirement periods. Under ASC Topic 715, life insurance policies purchased for the purpose of providing such benefits do not effectively settle an entity’s obligation to the employee. Accordingly, the entity must recognize a liability and related compensation expense during the employee’s active service period based on the future cost of insurance to be incurred during the employee’s retirement. The Company adopted the new authoritative accounting guidance under ASC Topic 715 on January 1, 2008 as a change in accounting principle through a cumulative-effect adjustment to retained earnings totaling $284 thousand.
- 73 -
In April 2011, the FASB issued ASU 2011-02“A Creditor’s Determination of Whether a Restructuring is a Troubled Debt Restructuring”, which clarifies when creditors should classify loan modifications as troubled debt restructurings. The guidance is effective for interim and annual periods beginning on or after June 15, 2011, and applies retrospectively to restructurings occurring on or after the beginning of the year. The guidance on measuring the impairment of a receivable restructured in a troubled debt restructuring, as clarified, is effective on a prospective basis. A provision in ASU No. 2011-02 also ends the FASB’s deferral of the additional disclosures related to troubled debt restructurings as required by ASU No. 2010-20. The Company adopted the provisions of ASU No. 2010-20 retrospectively to all modifications and restructuring activities that have occurred from January 1, 2011. See Note 4 to the Consolidated Financial Statements for the disclosures required by ASU No. 2010-20.
78
FINANCIAL INSTITUTIONS, INC. AND SUBSIDIARIES
NOTES TO CONSOLIDATED FINANCIAL STATEMENTS
December 31, 2011, 2010 and 2009
(2.) INVESTMENT SECURITIES
The amortized cost and estimated fair value of investment securities are summarized below (in thousands).
| December 31, 2009 | ||||||||||||||||
| Amortized | Unrealized | Unrealized | Fair | |||||||||||||
| Cost | Gains | Losses | Value | |||||||||||||
Securities available for sale: | ||||||||||||||||
| U.S. Government agencies and government sponsored enterprises | $ | 134,564 | $ | 86 | $ | 545 | $ | 134,105 | ||||||||
| State and political subdivisions | 80,812 | 2,850 | 3 | 83,659 | ||||||||||||
| Mortgage-backed securities: | ||||||||||||||||
| Federal National Mortgage Association | 75,108 | 629 | 259 | 75,478 | ||||||||||||
| Federal Home Loan Mortgage Corporation | 37,321 | 413 | 56 | 37,678 | ||||||||||||
| Government National Mortgage Association | 110,576 | 97 | 342 | 110,331 | ||||||||||||
| Collateralized mortgage obligations: | ||||||||||||||||
| Federal National Mortgage Association | 16,274 | 250 | 94 | 16,430 | ||||||||||||
| Federal Home Loan Mortgage Corporation | 20,879 | 504 | 14 | 21,369 | ||||||||||||
| Government National Mortgage Association | 95,886 | 56 | 873 | 95,069 | ||||||||||||
| Privately issued | 5,087 | 403 | 330 | 5,160 | ||||||||||||
| Total collateralized mortgage obligations | 138,126 | 1,213 | 1,311 | 138,028 | ||||||||||||
| Total mortgage-backed securities | 361,131 | 2,352 | 1,968 | 361,515 | ||||||||||||
| Asset-backed securities | 1,295 | 171 | 244 | 1,222 | ||||||||||||
| Total available for sale securities | $ | 577,802 | $ | 5,459 | $ | 2,760 | $ | 580,501 | ||||||||
Securities held to maturity: | ||||||||||||||||
| State and political subdivisions | $ | 39,573 | $ | 1,056 | $ | — | $ | 40,629 | ||||||||
| September 30, | September 30, | September 30, | September 30, | |||||||||||||
| December 31, 2011 | ||||||||||||||||
| Amortized | Unrealized | Unrealized | Fair | |||||||||||||
| Cost | Gains | Losses | Value | |||||||||||||
Securities available for sale: | ||||||||||||||||
U.S. Government agencies and government sponsored enterprises | $ | 94,947 | $ | 2,770 | $ | 5 | $ | 97,712 | ||||||||
State and political subdivisions | 119,099 | 5,336 | 11 | 124,424 | ||||||||||||
Mortgage-backed securities: | ||||||||||||||||
Federal National Mortgage Association | 98,679 | 2,944 | — | 101,623 | ||||||||||||
Federal Home Loan Mortgage Corporation | 63,838 | 1,017 | — | 64,855 | ||||||||||||
Government National Mortgage Association | 73,226 | 3,376 | — | 76,602 | ||||||||||||
Collateralized mortgage obligations: | ||||||||||||||||
Federal National Mortgage Association | 28,339 | 581 | 7 | 28,913 | ||||||||||||
Federal Home Loan Mortgage Corporation | 22,318 | 675 | 1 | 22,992 | ||||||||||||
Government National Mortgage Association | 103,975 | 2,654 | 18 | 106,611 | ||||||||||||
Privately issued | 327 | 1,762 | — | 2,089 | ||||||||||||
|
|
|
|
|
|
|
| |||||||||
Total collateralized mortgage obligations | 154,959 | 5,672 | 26 | 160,605 | ||||||||||||
|
|
|
|
|
|
|
| |||||||||
Total mortgage-backed securities | 390,702 | 13,009 | 26 | 403,685 | ||||||||||||
Asset-backed securities | 297 | 1,400 | — | 1,697 | ||||||||||||
|
|
|
|
|
|
|
| |||||||||
Total available for sale securities | $ | 605,045 | $ | 22,515 | $ | 42 | $ | 627,518 | ||||||||
|
|
|
|
|
|
|
| |||||||||
Securities held to maturity: | ||||||||||||||||
State and political subdivisions | $ | 23,297 | $ | 667 | $ | — | $ | 23,964 | ||||||||
|
|
|
|
|
|
|
| |||||||||
| September 30, | September 30, | September 30, | September 30, | |||||||||||||
| December 31, 2010 | ||||||||||||||||
| Amortized | Unrealized | Unrealized | Fair | |||||||||||||
| Cost | Gains | Losses | Value | |||||||||||||
Securities available for sale: | ||||||||||||||||
U.S. Government agencies and government sponsored enterprises | $ | 141,591 | $ | 1,158 | $ | 1,965 | $ | 140,784 | ||||||||
State and political subdivisions | 105,622 | 1,516 | 1,472 | 105,666 | ||||||||||||
Mortgage-backed securities: | ||||||||||||||||
Federal National Mortgage Association | 96,300 | 798 | 1,030 | 96,068 | ||||||||||||
Federal Home Loan Mortgage Corporation | 83,745 | 321 | 1,317 | 82,749 | ||||||||||||
Government National Mortgage Association | 102,633 | 2,422 | 7 | 105,048 | ||||||||||||
Collateralized mortgage obligations: | ||||||||||||||||
Federal National Mortgage Association | 8,938 | 231 | 11 | 9,158 | ||||||||||||
Federal Home Loan Mortgage Corporation | 15,917 | 329 | 1 | 16,245 | ||||||||||||
Government National Mortgage Association | 106,969 | 1,761 | 289 | 108,441 | ||||||||||||
Privately issued | 981 | 591 | — | 1,572 | ||||||||||||
|
|
|
|
|
|
|
| |||||||||
Total collateralized mortgage obligations | 132,805 | 2,912 | 301 | 135,416 | ||||||||||||
|
|
|
|
|
|
|
| |||||||||
Total mortgage-backed securities | 415,483 | 6,453 | 2,655 | 419,281 | ||||||||||||
Asset-backed securities | 564 | 204 | 131 | 637 | ||||||||||||
|
|
|
|
|
|
|
| |||||||||
Total available for sale securities | $ | 663,260 | $ | 9,331 | $ | 6,223 | $ | 666,368 | ||||||||
|
|
|
|
|
|
|
| |||||||||
Securities held to maturity: | ||||||||||||||||
State and political subdivisions | $ | 28,162 | $ | 687 | $ | — | $ | 28,849 | ||||||||
|
|
|
|
|
|
|
| |||||||||
- 74 -
NOTES TO CONSOLIDATED FINANCIAL STATEMENTS
December 31, 2009, 20082011, 2010 and 2007
(2.) INVESTMENT SECURITIES (Continued)
| December 31, 2008 | ||||||||||||||||
| Amortized | Unrealized | Unrealized | Fair | |||||||||||||
| Cost | Gains | Losses | Value | |||||||||||||
Securities available for sale: | ||||||||||||||||
| U.S. Government agencies and government sponsored enterprises | $ | 67,871 | $ | 609 | $ | 307 | $ | 68,173 | ||||||||
| State and political subdivisions | 129,572 | 2,181 | 42 | 131,711 | ||||||||||||
| Mortgage-backed securities: | ||||||||||||||||
| Federal National Mortgage Association | 136,348 | 3,725 | 86 | 139,987 | ||||||||||||
| Federal Home Loan Mortgage Corporation | 94,960 | 2,649 | 14 | 97,595 | ||||||||||||
| Government National Mortgage Association | 1,926 | 17 | 25 | 1,918 | ||||||||||||
| Collateralized mortgage obligations: | ||||||||||||||||
| Federal National Mortgage Association | 17,856 | 74 | 642 | 17,288 | ||||||||||||
| Federal Home Loan Mortgage Corporation | 44,838 | 334 | 214 | 44,958 | ||||||||||||
| Government National Mortgage Association | 1,350 | 9 | — | 1,359 | ||||||||||||
| Privately issued | 42,296 | 5 | 2,854 | 39,447 | ||||||||||||
| Total collateralized mortgage obligations | 106,340 | 422 | 3,710 | 103,052 | ||||||||||||
| Total mortgage-backed securities | 339,574 | 6,813 | 3,835 | 342,552 | ||||||||||||
| Asset-backed securities | 3,918 | — | — | 3,918 | ||||||||||||
| Equity securities | 923 | 281 | 52 | 1,152 | ||||||||||||
| Total available for sale securities | $ | 541,858 | $ | 9,884 | $ | 4,236 | $ | 547,506 | ||||||||
Securities held to maturity: | ||||||||||||||||
| State and political subdivisions | $ | 58,532 | $ | 619 | $ | 4 | $ | 59,147 | ||||||||
Interest and dividends on securities for the years ended December 31 2009, 2008 and 2007 isare summarized as follows (in thousands):
| 2009 | 2008 | 2007 | ||||||||||
| Taxable interest | $ | 16,466 | $ | 21,882 | $ | 25,414 | ||||||
| Tax-exempt interest | 5,228 | 8,773 | 9,576 | |||||||||
| Total interest and dividends on securities | $ | 21,694 | $ | 30,655 | $ | 34,990 | ||||||
| September 30, | September 30, | September 30, | ||||||||||
| 2011 | 2010 | 2009 | ||||||||||
Taxable interest and dividends | $ | 14,185 | $ | 17,101 | $ | 16,466 | ||||||
Tax-exempt interest and dividends | 3,828 | 3,521 | 5,228 | |||||||||
|
|
|
|
|
| |||||||
Total interest and dividends on securities | $ | 18,013 | $ | 20,622 | $ | 21,694 | ||||||
|
|
|
|
|
| |||||||
Sales and calls of securities available for sale for the years ended December 31 were as follows (in thousands):
| 2009 | 2008 | 2007 | ||||||||||
| Proceeds from sales | $ | 224,928 | $ | 58,368 | $ | 49,350 | ||||||
| Gross realized gains | 6,826 | 291 | 209 | |||||||||
| Gross realized losses | 3,397 | 3 | 2 | |||||||||
| September 30, | September 30, | September 30, | ||||||||||
| 2011 | 2010 | 2009 | ||||||||||
Proceeds from sales and calls | $ | 44,514 | $ | 122,090 | $ | 224,928 | ||||||
Gross realized gains | 3,051 | 173 | 6,826 | |||||||||
Gross realized losses | 48 | 4 | 3,397 | |||||||||
- 75 -
| Amortized | Fair | |||||||
| Cost | Value | |||||||
Debt securities available for sale: | ||||||||
| Due in one year or less | $ | 52,541 | $ | 53,081 | ||||
| Due from one to five years | 169,933 | 172,584 | ||||||
| Due after five years through ten years | 52,153 | 52,685 | ||||||
| Due after ten years | 303,175 | 302,151 | ||||||
| $ | 577,802 | $ | 580,501 | |||||
Debt securities held to maturity: | ||||||||
| Due in one year or less | $ | 30,238 | $ | 30,474 | ||||
| Due from one to five years | 7,361 | 7,877 | ||||||
| Due after five years through ten years | 1,542 | 1,763 | ||||||
| Due after ten years | 432 | 515 | ||||||
| $ | 39,573 | $ | 40,629 | |||||
| September 30, | September 30, | |||||||
| Amortized | Fair | |||||||
| Cost | Value | |||||||
Debt securities available for sale: | ||||||||
Due in one year or less | $ | 24,025 | $ | 24,166 | ||||
Due from one to five years | 81,483 | 84,008 | ||||||
Due after five years through ten years | 183,639 | 190,461 | ||||||
Due after ten years | 315,898 | 328,883 | ||||||
|
|
|
| |||||
| $ | 605,045 | $ | 627,518 | |||||
|
|
|
| |||||
Debt securities held to maturity: | ||||||||
Due in one year or less | $ | 18,496 | $ | 18,631 | ||||
Due from one to five years | 3,763 | 4,062 | ||||||
Due after five years through ten years | 905 | 1,096 | ||||||
Due after ten years | 133 | 175 | ||||||
|
|
|
| |||||
| $ | 23,297 | $ | 23,964 | |||||
|
|
|
| |||||
80
FINANCIAL INSTITUTIONS, INC. AND SUBSIDIARIES
NOTES TO CONSOLIDATED FINANCIAL STATEMENTS
December 31, 2011, 2010 and 2009
(2.) INVESTMENT SECURITIES (Continued)
There were no unrealized losses (excluding unrealizedin held to maturity securities at December 31, 2011 or December 31, 2010. Unrealized losses that have been written down throughon investment securities available for sale and the consolidated statementsfair value of operations) and fair value,the related securities, aggregated by investment category and length of time that individual securities have been in a continuous unrealized loss position atas of December 31 2009 and 2008are summarized as follows (in thousands).
| December 31, 2009 | ||||||||||||||||||||||||
| Less than 12 months | 12 months or longer | Total | ||||||||||||||||||||||
| Fair | Unrealized | Fair | Unrealized | Fair | Unrealized | |||||||||||||||||||
| Value | Losses | Value | Losses | Value | Losses | |||||||||||||||||||
Securities available for sale: | ||||||||||||||||||||||||
| U.S. Government agencies and government sponsored enterprises | $ | 83,480 | $ | 360 | $ | 10,003 | $ | 185 | $ | 93,483 | $ | 545 | ||||||||||||
| State and political subdivisions | — | — | 150 | 3 | 150 | 3 | ||||||||||||||||||
| Mortgage-backed securities: | ||||||||||||||||||||||||
| Federal National Mortgage Association | 24,964 | 258 | 643 | 1 | 25,607 | 259 | ||||||||||||||||||
| Federal Home Loan Mortgage Corporation | 5,627 | 56 | — | — | 5,627 | 56 | ||||||||||||||||||
| Government National Mortgage Association | 55,304 | 342 | — | — | 55,304 | 342 | ||||||||||||||||||
| Collateralized mortgage obligations: | ||||||||||||||||||||||||
| Federal National Mortgage Association | 353 | 2 | 5,384 | 92 | 5,737 | 94 | ||||||||||||||||||
| Federal Home Loan Mortgage Corporation | 490 | 1 | 814 | 13 | 1,304 | 14 | ||||||||||||||||||
| Government National Mortgage Association | 79,645 | 873 | — | — | 79,645 | 873 | ||||||||||||||||||
| Privately issued | — | — | 2,985 | 330 | 2,985 | 330 | ||||||||||||||||||
| Total collateralized mortgage obligations | 80,488 | 876 | 9,183 | 435 | 89,671 | 1,311 | ||||||||||||||||||
| Total mortgage-backed securities | 166,383 | 1,532 | 9,826 | 436 | 176,209 | 1,968 | ||||||||||||||||||
| Asset-backed securities | 278 | 244 | — | — | 278 | 244 | ||||||||||||||||||
Total temporarily impaired securities | $ | 250,141 | $ | 2,136 | $ | 19,979 | $ | 624 | $ | 270,120 | $ | 2,760 | ||||||||||||
| September 30, | September 30, | September 30, | September 30, | September 30, | September 30, | |||||||||||||||||||
| December 31, 2011 | ||||||||||||||||||||||||
| Less than 12 months | 12 months or longer | Total | ||||||||||||||||||||||
| Fair | Unrealized | Fair | Unrealized | Fair | Unrealized | |||||||||||||||||||
| Value | Losses | Value | Losses | Value | Losses | |||||||||||||||||||
Securities available for sale: | ||||||||||||||||||||||||
U.S. Government agencies and government sponsored enterprises | $ | 2,177 | $ | 1 | $ | 5,246 | $ | 4 | $ | 7,423 | $ | 5 | ||||||||||||
State and political subdivisions | 452 | 2 | 646 | 9 | 1,098 | 11 | ||||||||||||||||||
Mortgage-backed securities: | ||||||||||||||||||||||||
Collateralized mortgage obligations: | ||||||||||||||||||||||||
Federal National Mortgage Association | — | — | 1,817 | 7 | 1,817 | 7 | ||||||||||||||||||
Federal Home Loan Mortgage Corporation | — | — | 388 | 1 | 388 | 1 | ||||||||||||||||||
Government National Mortgage Association | 6,138 | 18 | — | — | 6,138 | 18 | ||||||||||||||||||
|
|
|
|
|
|
|
|
|
|
|
| |||||||||||||
Total collateralized mortgage obligations | 6,138 | 18 | 2,205 | 8 | 8,343 | 26 | ||||||||||||||||||
|
|
|
|
|
|
|
|
|
|
|
| |||||||||||||
Total mortgage-backed securities | 6,138 | 18 | 2,205 | 8 | 8,343 | 26 | ||||||||||||||||||
|
|
|
|
|
|
|
|
|
|
|
| |||||||||||||
Total temporarily impaired securities | $ | 8,767 | $ | 21 | $ | 8,097 | $ | 21 | $ | 16,864 | $ | 42 | ||||||||||||
|
|
|
|
|
|
|
|
|
|
|
| |||||||||||||
| September 30, | September 30, | September 30, | September 30, | September 30, | September 30, | |||||||||||||||||||
| December 31, 2010 | ||||||||||||||||||||||||
| Less than 12 months | 12 months or longer | Total | ||||||||||||||||||||||
| Fair | Unrealized | Fair | Unrealized | Fair | Unrealized | |||||||||||||||||||
| Value | Losses | Value | Losses | Value | Losses | |||||||||||||||||||
Securities available for sale: | ||||||||||||||||||||||||
U.S. Government agencies and government sponsored enterprises | $ | 47,752 | $ | 1,911 | $ | 8,821 | $ | 54 | $ | 56,573 | $ | 1,965 | ||||||||||||
State and political subdivisions | 38,398 | 1,472 | — | — | 38,398 | 1,472 | ||||||||||||||||||
Mortgage-backed securities: | ||||||||||||||||||||||||
Federal National Mortgage Association | 46,777 | 1,030 | — | — | 46,777 | 1,030 | ||||||||||||||||||
Federal Home Loan Mortgage Corporation | 60,707 | 1,317 | — | — | 60,707 | 1,317 | ||||||||||||||||||
Government National Mortgage Association | 5,135 | 7 | — | — | 5,135 | 7 | ||||||||||||||||||
Collateralized mortgage obligations: | ||||||||||||||||||||||||
Federal National Mortgage Association | — | — | 2,332 | 11 | 2,332 | 11 | ||||||||||||||||||
Federal Home Loan Mortgage Corporation | 612 | 1 | — | — | 612 | 1 | ||||||||||||||||||
Government National Mortgage Association | 17,798 | 289 | — | — | 17,798 | 289 | ||||||||||||||||||
|
|
|
|
|
|
|
|
|
|
|
| |||||||||||||
Total collateralized mortgage obligations | 18,410 | 290 | 2,332 | 11 | 20,742 | 301 | ||||||||||||||||||
|
|
|
|
|
|
|
|
|
|
|
| |||||||||||||
Total mortgage-backed securities | 131,029 | 2,644 | 2,332 | 11 | 133,361 | 2,655 | ||||||||||||||||||
Asset-backed securities | 111 | 61 | 96 | 70 | 207 | 131 | ||||||||||||||||||
|
|
|
|
|
|
|
|
|
|
|
| |||||||||||||
Total temporarily impaired securities | $ | 217,290 | $ | 6,088 | $ | 11,249 | $ | 135 | $ | 228,539 | $ | 6,223 | ||||||||||||
|
|
|
|
|
|
|
|
|
|
|
| |||||||||||||
- 76 -
NOTES TO CONSOLIDATED FINANCIAL STATEMENTS
December 31, 2009, 20082011, 2010 and 2007
(2.) INVESTMENT SECURITIES (Continued)
| December 31, 2008 | ||||||||||||||||||||||||
| Less than 12 months | 12 months or longer | Total | ||||||||||||||||||||||
| Fair | Unrealized | Fair | Unrealized | Fair | Unrealized | |||||||||||||||||||
| Value | Losses | Value | Losses | Value | Losses | |||||||||||||||||||
Securities available for sale: | ||||||||||||||||||||||||
| U.S. Government agencies and government sponsored enterprises | $ | 50 | $ | 1 | $ | 11,704 | $ | 306 | $ | 11,754 | $ | 307 | ||||||||||||
| State and political subdivisions | 6,191 | 41 | 84 | 1 | 6,275 | 42 | ||||||||||||||||||
| Mortgage-backed securities: | ||||||||||||||||||||||||
| Federal National Mortgage Association | 10,432 | 65 | 484 | 21 | 10,916 | 86 | ||||||||||||||||||
| Federal Home Loan Mortgage Corporation | 5,533 | 14 | — | — | 5,533 | 14 | ||||||||||||||||||
| Government National Mortgage Association | 227 | 3 | 1,059 | 22 | 1,286 | 25 | ||||||||||||||||||
| Collateralized mortgage obligations: | ||||||||||||||||||||||||
| Federal National Mortgage Association | 828 | 1 | 7,181 | 641 | 8,009 | 642 | ||||||||||||||||||
| Federal Home Loan Mortgage Corporation | — | — | 7,224 | 214 | 7,224 | 214 | ||||||||||||||||||
| Privately issued | 24,425 | 2,045 | 10,975 | 809 | 35,400 | 2,854 | ||||||||||||||||||
| Total collateralized mortgage obligations | 25,253 | 2,046 | 25,380 | 1,664 | 50,633 | 3,710 | ||||||||||||||||||
| Total mortgage-backed securities | 41,445 | 2,128 | 26,923 | 1,707 | 68,368 | 3,835 | ||||||||||||||||||
| Equity securities | 310 | 52 | — | — | 310 | 52 | ||||||||||||||||||
| Total available for sale securities | 47,996 | 2,222 | 38,711 | 2,014 | 86,707 | 4,236 | ||||||||||||||||||
Securities held to maturity: | ||||||||||||||||||||||||
| State and political subdivisions | 554 | 4 | — | — | 554 | 4 | ||||||||||||||||||
Total temporarily impaired securities | $ | 48,550 | $ | 2,226 | $ | 38,711 | $ | 2,014 | $ | 87,261 | $ | 4,240 | ||||||||||||
The following summarizes the amounts of OTTI recognized during the years ended December 31 by investment category (in thousands).
| September 30, | September 30, | September 30, | ||||||||||
| 2011 | 2010 | 2009 | ||||||||||
Mortgage-backed securities—Privately issued whole loan CMOs | $ | 18 | $ | — | $ | 2,353 | ||||||
Asset-backed securities—Trust preferred securities | — | 526 | 1,787 | |||||||||
Asset-backed securities—Other | — | 68 | 526 | |||||||||
|
|
|
|
|
| |||||||
Total OTTI | $ | 18 | $ | 594 | $ | 4,666 | ||||||
|
|
|
|
|
| |||||||
The Company reviews investment securities on an ongoing basis for the presence of other-than-temporary-impairment (“OTTI”)OTTI with formal reviews performed quarterly. Declines in the fair value of held-to-maturity and available-for-saleWhen evaluating debt securities below their cost that are deemed to be other than temporary are reflected in earnings as realized losses to the extent the impairment is related to credit issues or concerns, or the security is intended to be sold. The amount of the impairment related to non-credit relatedfor OTTI, management considers many factors, is recognized in other comprehensive income. Evaluating whether the impairment of a debt security is other than temporary involves assessing i.) the intent to sell the debt security or ii.) the likelihood of being required to sell the security before the recovery of its amortized cost basis. In determining whether the other-than temporary impairment includes a credit loss, the Company uses its best estimate of the present value of cash flows expected to be collected from the debt security considering factors such as: a.)including: (1) the length of time and the extent to which the fair value has been less than cost, (2) the financial condition and near-term prospects of the issuer, (3) whether the market decline was affected by macroeconomic conditions, and (4) whether the Company has the intention to sell the debt security or whether it is more likely than not that it will be required to sell the debt security before its anticipated recovery. The assessment of whether OTTI exists involves a high degree of subjectivity and judgment and is based on the information available to management at a point in time.
The total number of security positions in the investment portfolio in an unrealized loss position at December 31, 2011 was 14 compared to 156 at December 31, 2010. At December 31, 2011, the Company had positions in 9 investment securities with an amortized cost basis, b.) adverse conditions specifically relatedof $8.1 million and an unrealized loss of $21 thousand that have been in a continuous unrealized loss position for more than 12 months. There were a total of 5 securities positions in the Company’s investment portfolio, with an amortized cost of $8.8 million and a total unrealized loss of $21 thousand at December 31, 2011, that have been in a continuous unrealized loss position for less than 12 months. The unrealized loss on these investment securities was predominantly caused by changes in market interest rates, average life or credit spreads subsequent to the security, an industry, or a geographic area, c.) the historical and implied volatility of thepurchase. The fair value of the security, d.) the payment structuremost of the debt securityinvestment securities in the Company’s portfolio fluctuates as market interest rates change.
Based on management’s review and the likelihoodevaluation of the issuer being able to make payments that increase in the future, e.) failureCompany’s debt securities as of the issuer of the security to make scheduled interest or principal payments, f.) any changes to the rating of the security by a rating agency, and g.) recoveries or additional declines in fair value subsequent to the balance sheet date.
| 2009 | 2008 | |||||||
| Mortgage-backed securities — Privately issued whole loan CMOs | $ | 2,353 | $ | 5,918 | ||||
| Asset-backed securities — Trust preferred securities | 2,313 | 29,974 | ||||||
| Equity securities — Auction rate securities | — | 32,323 | ||||||
| $ | 4,666 | $ | 68,215 | |||||
- 77 -
82
FINANCIAL INSTITUTIONS, INC. AND SUBSIDIARIES
NOTES TO CONSOLIDATED FINANCIAL STATEMENTS
December 31, 2011, 2010 and may increase the potential that certain unrealized losses will be designated as other than temporary in future periods and that the Company will incur additional write-downs in the future.
(3.) LOANS HELD FOR SALE AND MORTGAGELOAN SERVICING RIGHTS
Loans held for sale were entirely comprised of residential real estate mortgages and totaled $421 thousand$2.4 million and $1.0$3.1 million as of December 31, 20092011 and 2008,2010, respectively.
The Company sells certain qualifying newly originated or refinanced residential real estate mortgages on the secondary market. Residential real estate mortgages serviced for others, which are not included in the consolidated statements of financial condition, amounted to $349.8$297.8 million and $315.7$328.9 million as of December 31, 20092011 and 2008,2010, respectively. In connection with these mortgage-servicing activities, the Company administered escrow and other custodial funds which amounted to approximately $5.9 million and $6.2 million as of December 31, 2011 and 2010, respectively.
The activity in capitalized mortgage servicing assets included in other assets in the consolidated statements of financial condition, is summarized as follows for the years ended December 31 (in thousands):
| 2009 | 2008 | 2007 | ||||||||||
| Mortgage servicing assets, beginning of year | $ | 925 | $ | 1,000 | $ | 1,165 | ||||||
| Originations | 952 | 230 | 307 | |||||||||
| Amortization | (343 | ) | (305 | ) | (472 | ) | ||||||
| Mortgage servicing assets, end of year | 1,534 | 925 | 1,000 | |||||||||
| Valuation allowance | (185 | ) | (362 | ) | (19 | ) | ||||||
| Mortgage servicing assets, net, end of year | $ | 1,349 | $ | 563 | $ | 981 | ||||||
| September 30, | September 30, | September 30, | ||||||||||
| 2011 | 2010 | 2009 | ||||||||||
Mortgage servicing assets, beginning of year | $ | 1,642 | $ | 1,534 | $ | 925 | ||||||
Originations | 319 | 408 | 952 | |||||||||
Amortization | (352 | ) | (300 | ) | (343 | ) | ||||||
|
|
|
|
|
| |||||||
Mortgage servicing assets, end of year | 1,609 | 1,642 | 1,534 | |||||||||
Valuation allowance | (210 | ) | (175 | ) | (185 | ) | ||||||
|
|
|
|
|
| |||||||
Mortgage servicing assets, net, end of year | $ | 1,399 | $ | 1,467 | $ | 1,349 | ||||||
|
|
|
|
|
| |||||||
The Company did not securitize any residential mortgage loans in 2011 or 2010. During 2009, the Company pooled $16.0 million of one-to-four family residential mortgage loans and converted the loans to FHLMC securities. The Company retained servicing responsibilities for this securitization. The mortgage-backed securities received in exchange for the loans were classified as available-for-sale and subsequently sold. The $564 thousand gain recognized on the sale of the securities is included in the consolidated statements of operationsincome under net gain on disposalsales and calls of investment securities.
Automobile loan servicing rights are accounted for using the amortization method. A servicing asset is established at fair value at the time of the sale. The servicing asset is reported in other assets in the consolidated statements of financial position and amortized to noninterest income in the consolidated statements of income in proportion to and over the period of estimated net servicing income. Impairment, if any, is recognized when carrying value exceeds the fair value as determined by calculating the present value of expected net future cash flows. The primary risk characteristic for measuring servicing assets is payoff rates of the underlying loan pools. Valuation calculations rely on the predicted payoff assumption and, if actual payoff is quicker than expected, then future value would be impaired.
During 2011, the Company did not securitize anysold $13.0 million of indirect auto loans under a 90%/10% participation agreement, recognizing a gain of $153 thousand. The loans were reclassified from portfolio to loans held for sale during the second quarter of 2011. As of December 31, 2011, a loan servicing asset for these loans of $574 thousand is included in 2008 or 2007.
83
FINANCIAL INSTITUTIONS, INC. AND SUBSIDIARIES
NOTES TO CONSOLIDATED FINANCIAL STATEMENTS
December 31, 2008, respectively, are summarized as follows2011, 2010 and 2009
(4.) LOANS
The Company’s loan portfolio consisted of the following at December 31 (in thousands):
| 2009 | 2008 | |||||||
| Commercial | $ | 186,386 | $ | 158,543 | ||||
| Commercial real estate | 308,873 | 262,234 | ||||||
| Agricultural | 41,872 | 44,706 | ||||||
| Residential real estate | 144,215 | 177,683 | ||||||
| Consumer indirect | 352,611 | 255,054 | ||||||
| Consumer direct and home equity | 230,049 | 222,859 | ||||||
| Total loans | 1,264,006 | 1,121,079 | ||||||
| Less: Allowance for loan losses | 20,741 | 18,749 | ||||||
| Total loans, net | $ | 1,243,265 | $ | 1,102,330 | ||||
| September 30, | September 30, | September 30, | ||||||||||
| Loans, Gross | Net Deferred Loan (Fees) Costs | Loans, Net | ||||||||||
2011 | ||||||||||||
Commercial business | $ | 233,727 | $ | 109 | $ | 233,836 | ||||||
Commercial mortgage | 394,034 | (790 | ) | 393,244 | ||||||||
Residential mortgage | 113,865 | 46 | 113,911 | |||||||||
Home equity | 227,853 | 3,913 | 231,766 | |||||||||
Consumer indirect | 465,807 | 21,906 | 487,713 | |||||||||
Other consumer | 24,138 | 168 | 24,306 | |||||||||
|
|
|
|
|
| |||||||
Total | $ | 1,459,424 | $ | 25,352 | 1,484,776 | |||||||
|
|
|
| |||||||||
Allowance for loan losses | (23,260 | ) | ||||||||||
|
| |||||||||||
Total loans, net | $ | 1,461,516 | ||||||||||
|
| |||||||||||
2010 | ||||||||||||
Commercial business | $ | 210,948 | $ | 83 | $ | 211,031 | ||||||
Commercial mortgage | 353,537 | (607 | ) | 352,930 | ||||||||
Residential mortgage | 129,553 | 27 | 129,580 | |||||||||
Home equity | 205,070 | 3,257 | 208,327 | |||||||||
Consumer indirect | 400,221 | 17,795 | 418,016 | |||||||||
Other consumer | 25,937 | 169 | 26,106 | |||||||||
|
|
|
|
|
| |||||||
Total | $ | 1,325,266 | $ | 20,724 | 1,345,990 | |||||||
|
|
|
| |||||||||
Allowance for loan losses | (20,466 | ) | ||||||||||
|
| |||||||||||
Total loans, net | $ | 1,325,524 | ||||||||||
|
| |||||||||||
The Company’s significant concentrations of credit risk in the loan portfolio relate to a geographic concentration in the communities that the Company serves.
Certain executive officers, directors and their business interests are customers of the Company. Transactions with these parties are based on substantially the same terms as similar transactions with unrelated third parties and do not carry more than normal credit risk. Borrowings by these related parties amounted to $378 thousand and $609 thousand at December 31, 2011 and 2010, respectively. During 2011, new borrowings amounted to $4 thousand (including borrowings of executive officers and directors that were outstanding at the time of their election), and repayments and other reductions were $235 thousand.
- 78 -
NOTES TO CONSOLIDATED FINANCIAL STATEMENTS
December 31, 2009, 20082011, 2010 and 2007
(4.) LOANS (Continued)
Past Due Loans Aging
The following table below details additional information onprovides an analysis, by loan class, of the loan portfolioCompany’s delinquent and nonaccrual loans as of December 31 of the year indicated (in thousands):
| 2009 | 2008 | 2007 | ||||||||||
| Non-accruing loans | $ | 6,822 | $ | 8,189 | $ | 8,075 | ||||||
| Interest income that would have been recorded if loans had been performing in accordance with original terms | 388 | 546 | 713 | |||||||||
| Accruing loans 90 days or more delinquent | 1,859 | 7 | 2 | |||||||||
| Balance of impaired loans, end of period | 2,938 | 3,180 | 4,132 | |||||||||
| Balance of impaired loans requiring a specific allowance, end of period | 1,932 | 599 | 1,572 | |||||||||
| Allowance relating to impaired loans included in allowance for loan losses | 854 | 142 | 454 | |||||||||
| Average balance of impaired loans | 3,785 | 3,088 | 6,446 | |||||||||
| Interest income recognized on impaired loans | 69 | — | — | |||||||||
| September 30, | September 30, | September 30, | September 30, | September 30, | September 30, | September 30, | ||||||||||||||||||||||
| 30-59 Days Past Due | 60-89 Days Past Due | Greater Than 90 Days | Total Past Due | Nonaccrual | Current | Total Loans | ||||||||||||||||||||||
2011 | ||||||||||||||||||||||||||||
Commercial business | $ | 35 | $ | — | $ | — | $ | 35 | $ | 1,259 | $ | 232,433 | $ | 233,727 | ||||||||||||||
Commercial mortgage | 165 | — | — | 165 | 2,928 | 390,941 | 394,034 | |||||||||||||||||||||
Residential mortgage | 517 | — | — | 517 | 1,644 | 111,704 | 113,865 | |||||||||||||||||||||
Home equity | 749 | 68 | — | 817 | 682 | 226,354 | 227,853 | |||||||||||||||||||||
Consumer indirect | 984 | 92 | — | 1,076 | 558 | 464,173 | 465,807 | |||||||||||||||||||||
Other consumer | 106 | 10 | 5 | 121 | — | 24,017 | 24,138 | |||||||||||||||||||||
|
|
|
|
|
|
|
|
|
|
|
|
|
| |||||||||||||||
Total loans, gross | $ | 2,556 | $ | 170 | $ | 5 | $ | 2,731 | $ | 7,071 | $ | 1,449,622 | $ | 1,459,424 | ||||||||||||||
|
|
|
|
|
|
|
|
|
|
|
|
|
| |||||||||||||||
2010 | ||||||||||||||||||||||||||||
Commercial business | $ | 172 | $ | 92 | $ | — | $ | 264 | $ | 947 | $ | 209,737 | $ | 210,948 | ||||||||||||||
Commercial mortgage | 163 | — | — | 163 | 3,100 | 350,274 | 353,537 | |||||||||||||||||||||
Residential mortgage | 492 | 6 | — | 498 | 2,102 | 126,953 | 129,553 | |||||||||||||||||||||
Home equity | 428 | 47 | — | 475 | 875 | 203,720 | 205,070 | |||||||||||||||||||||
Consumer indirect | 656 | 107 | — | 763 | 514 | 398,944 | 400,221 | |||||||||||||||||||||
Other consumer | 82 | 1 | 3 | 86 | 41 | 25,810 | 25,937 | |||||||||||||||||||||
|
|
|
|
|
|
|
|
|
|
|
|
|
| |||||||||||||||
Total loans, gross | $ | 1,993 | $ | 253 | $ | 3 | $ | 2,249 | $ | 7,579 | $ | 1,315,438 | $ | 1,325,266 | ||||||||||||||
|
|
|
|
|
|
|
|
|
|
|
|
|
| |||||||||||||||
There were no loans past due greater than 90 days and still accruing interest as of December 31, 2011 and December 31, 2010. There were $5 thousand and $3 thousand in consumer overdrafts which were past due greater than 90 days as of December 31, 2011 and December 31, 2010, respectively. Consumer overdrafts are overdrawn deposit accounts which have been reclassified as loans but by their terms do not accrue interest.
Interest income on nonaccrual loans, if recognized, is recorded using the cash basis method of accounting. There was no interest income recognized on nonaccrual loans during the years ended December 31, 2011, 2010 and 2009. For the years ended December 31, 2011, 2010 and 2009, estimated interest income of $438 thousand, $474 thousand, and $388 thousand, respectively, would have been recorded if all such loans had been accruing interest according to their original contractual terms.
Troubled Debt Restructurings
A modification of a loan constitutes a troubled debt restructuring (“TDR”) when a borrower is experiencing financial difficulty and the modification constitutes a concession. The Company offers various types of concessions when modifying loans, however, forgiveness of principal is rarely granted. Commercial loans modified in a TDR may involve temporary interest-only payments, term extensions, reducing the interest rate for the remaining term of the loan, extending the maturity date at an interest rate lower than the current market rate for new debt with similar risk, requesting additional collateral, releasing collateral for consideration, or substituting or adding a new borrower or guarantor. The following presents, by loan class, information related to loans modified in a TDR during the year ended December 31, 2011 (in thousands).
| September 30, | September 30, | September 30, | ||||||||||
| Number of Contracts | Pre- Modification Outstanding Recorded Investment | Post- Modification Outstanding Recorded Investment | ||||||||||
Commercial business | 6 | $ | 142 | $ | 142 | |||||||
Commercial mortgage | 1 | 280 | 280 | |||||||||
|
|
|
|
|
| |||||||
Total | 7 | $ | 422 | $ | 422 | |||||||
|
|
|
|
|
| |||||||
85
FINANCIAL INSTITUTIONS, INC. AND SUBSIDIARIES
NOTES TO CONSOLIDATED FINANCIAL STATEMENTS
December 31, 2011, 2010 and 2009
(4.) LOANS (Continued)
All of the loans identified as TDRs by the Company were previously on nonaccrual status and reported as impaired loans prior to restructuring. The modifications primarily related to extending the amortization periods of the loans. All loans restructured during the year ended December 31, 2011 are on nonaccrual status as of December 31, 2011. Nonaccrual loans outstandingthat are restructured remain on nonaccrual status, but may move to accrual status after they have performed according to the restructured terms for a period of time. The TDR classification did not have a material impact on the Company’s determination of the allowance for loan losses because the modified loans were impaired and evaluated for a specific reserve both before and after restructuring.
For purposes of this disclosure, a loan modified as a TDR is considered to have defaulted when the borrower becomes 90 days past due. As of December 31, 2011, one commercial real estate loan restructured in 2011 with a balance of $261 thousand at December 31, 2011 was in default. This default did not significantly impact the Company’s determination of the allowance for loan losses.
Impaired Loans
Management has determined that specific commercial loans on nonaccrual status and all loans that have had their terms restructured in a troubled debt restructuring are impaired loans. The following table presents data on impaired loans at December 31 (in thousands):
| September 30, | September 30, | September 30, | September 30, | September 30, | ||||||||||||||||
| Recorded Investment | Unpaid Principal Balance | Related Allowance | Average Recorded Investment | Interest Income Recognized | ||||||||||||||||
2011 | ||||||||||||||||||||
With no related allowance recorded: | ||||||||||||||||||||
Commercial business | $ | 342 | $ | 1,266 | $ | — | $ | 361 | $ | — | ||||||||||
Commercial mortgage | 605 | 696 | — | 583 | — | |||||||||||||||
|
|
|
|
|
|
|
|
|
| |||||||||||
| 947 | 1,962 | — | 944 | — | ||||||||||||||||
With an allowance recorded: | ||||||||||||||||||||
Commercial business | 917 | 917 | 436 | 1,033 | — | |||||||||||||||
Commercial mortgage | 2,323 | 2,323 | 644 | 2,172 | — | |||||||||||||||
|
|
|
|
|
|
|
|
|
| |||||||||||
| 3,240 | 3,240 | 1,080 | 3,205 | — | ||||||||||||||||
|
|
|
|
|
|
|
|
|
| |||||||||||
| $ | 4,187 | $ | 5,202 | $ | 1,080 | $ | 4,149 | $ | — | |||||||||||
|
|
|
|
|
|
|
|
|
| |||||||||||
2010 | ||||||||||||||||||||
With no related allowance recorded: | ||||||||||||||||||||
Commercial business | $ | 372 | $ | 524 | $ | — | $ | 275 | $ | — | ||||||||||
Commercial mortgage | 187 | 187 | — | 481 | — | |||||||||||||||
|
|
|
|
|
|
|
|
|
| |||||||||||
| 559 | 711 | — | 756 | — | ||||||||||||||||
With an allowance recorded: | ||||||||||||||||||||
Commercial business | 576 | 576 | 149 | 1,828 | — | |||||||||||||||
Commercial mortgage | 2,913 | 2,921 | 883 | 1,897 | — | |||||||||||||||
|
|
|
|
|
|
|
|
|
| |||||||||||
| 3,489 | 3,497 | 1,032 | 3,725 | — | ||||||||||||||||
|
|
|
|
|
|
|
|
|
| |||||||||||
| $ | 4,048 | $ | 4,208 | $ | 1,032 | $ | 4,481 | $ | — | |||||||||||
|
|
|
|
|
|
|
|
|
| |||||||||||
During the year ended December 31, 2009, the Company’s average investment in impaired loans was $3.8 million. The Company recognized $69 thousand of interest income on impaired loans during the year ended December 31, 2009. At December 31, 2011, there were no commitments to lend additional funds to those borrowers whose loans were classified as impaired.
86
FINANCIAL INSTITUTIONS, INC. AND SUBSIDIARIES
NOTES TO CONSOLIDATED FINANCIAL STATEMENTS
December 31, 2011, 2010 and 2009
(4.) LOANS (Continued)
Credit Quality Indicators
The Company categorizes loans into risk categories based on relevant information about the ability of borrowers to service their debt such as: current financial information, historical payment experience, credit documentation, public information, and current economic trends, among other factors such as the fair value of collateral. The Company analyzes commercial business and commercial mortgage loans individually by classifying the loans as to credit risk. Risk ratings are updated any time the situation warrants. The Company uses the following definitions for risk ratings:
Special Mention:Loans classified as special mention have a potential weakness that deserves management’s close attention. If left uncorrected, these potential weaknesses may result in deterioration of the repayment prospects for the loan or 2008.
Substandard:Loans classified as substandard are inadequately protected by the current net worth and paying capacity of the obligor or of the collateral pledged, if any. Loans so classified have a well-defined weakness or weaknesses that jeopardize the liquidation of the debt. They are characterized by the distinct possibility that the Company will sustain some loss if the deficiencies are not corrected.
Doubtful:Loans classified as doubtful have all the weaknesses inherent in those classified as Substandard, with the added characteristic that the weaknesses make collection or liquidation in full, on the basis of currently existing facts, conditions, and values, highly questionable and improbable.
Loans not meeting the criteria above that are analyzed individually as part of the process described above are considered “Uncriticized” or pass-rated loans and are included in groups of homogeneous loans with similar risk and loss characteristics.
The following table sets forth the Company’s commercial loan portfolio, categorized by internally assigned asset classification, as of December 31 (in thousands):
| September 30, | September 30, | |||||||
| Commercial Business | Commercial Mortgage | |||||||
2011 | ||||||||
Uncriticized | $ | 221,477 | $ | 383,700 | ||||
Special mention | 7,445 | 2,388 | ||||||
Substandard | 4,805 | 7,946 | ||||||
Doubtful | — | — | ||||||
|
|
|
| |||||
Total | $ | 233,727 | $ | 394,034 | ||||
|
|
|
| |||||
2010 | ||||||||
Uncriticized | $ | 194,510 | $ | 338,061 | ||||
Special mention | 11,479 | 4,931 | ||||||
Substandard | 4,959 | 10,545 | ||||||
Doubtful | — | — | ||||||
|
|
|
| |||||
Total | $ | 210,948 | $ | 353,537 | ||||
|
|
|
| |||||
87
FINANCIAL INSTITUTIONS, INC. AND SUBSIDIARIES
NOTES TO CONSOLIDATED FINANCIAL STATEMENTS
December 31, 2011, 2010 and 2009
(4.) LOANS (Continued)
The Company utilizes payment status as a means of identifying and reporting problem and potential problem retail loans. The Company considers nonaccrual loans and loans past due greater than 90 days and still accruing interest to be non-performing. The following table sets forth the Company’s retail loan portfolio, categorized by payment status, as of December 31 (in thousands):
| September 30, | September 30, | September 30, | September 30, | |||||||||||||
| Residential Mortgage | Home Equity | Consumer Indirect | Other Consumer | |||||||||||||
2011 | ||||||||||||||||
Performing | $ | 112,221 | $ | 227,171 | $ | 465,249 | $ | 24,138 | ||||||||
Non-performing | 1,644 | 682 | 558 | — | ||||||||||||
|
|
|
|
|
|
|
| |||||||||
Total | $ | 113,865 | $ | 227,853 | $ | 465,807 | $ | 24,138 | ||||||||
|
|
|
|
|
|
|
| |||||||||
2010 | ||||||||||||||||
Performing | $ | 127,451 | $ | 204,195 | $ | 399,707 | $ | 25,896 | ||||||||
Non-performing | 2,102 | 875 | 514 | 41 | ||||||||||||
|
|
|
|
|
|
|
| |||||||||
Total | $ | 129,553 | $ | 205,070 | $ | 400,221 | $ | 25,937 | ||||||||
|
|
|
|
|
|
|
| |||||||||
Allowance for Loan Losses
The following tables set forth the changes in the allowance for loan losses for the years ended December 31 (in thousands):
| 2009 | 2008 | 2007 | ||||||||||
| Allowance for loan losses, beginning of year | $ | 18,749 | $ | 15,521 | $ | 17,048 | ||||||
| Charge-offs | 7,830 | 5,459 | 3,895 | |||||||||
| Recoveries | 2,120 | 2,136 | 2,252 | |||||||||
| Net charge-offs | 5,710 | 3,323 | 1,643 | |||||||||
| Provision for loan losses | 7,702 | 6,551 | 116 | |||||||||
| Allowance for loan losses, end of year | $ | 20,741 | $ | 18,749 | $ | 15,521 | ||||||
| September 30, | September 30, | September 30, | September 30, | September 30, | September 30, | September 30, | ||||||||||||||||||||||
| Commercial | Commercial Mortgage | Residential Mortgage | Home Equity | Consumer Indirect | Other Consumer | Total | ||||||||||||||||||||||
2011 | ||||||||||||||||||||||||||||
Allowance for loan losses: | ||||||||||||||||||||||||||||
Beginning balance | $ | 3,712 | $ | 6,431 | $ | 1,013 | $ | 972 | $ | 7,754 | $ | 584 | $ | 20,466 | ||||||||||||||
Charge-offs | (1,346 | ) | (751 | ) | (152 | ) | (449 | ) | (4,713 | ) | (877 | ) | (8,288 | ) | ||||||||||||||
Recoveries | 401 | 245 | 90 | 44 | 2,066 | 456 | 3,302 | |||||||||||||||||||||
Provision (credit) | 1,269 | 493 | (93 | ) | 675 | 5,082 | 354 | 7,780 | ||||||||||||||||||||
|
|
|
|
|
|
|
|
|
|
|
|
|
| |||||||||||||||
Ending balance | $ | 4,036 | $ | 6,418 | $ | 858 | $ | 1,242 | $ | 10,189 | $ | 517 | $ | 23,260 | ||||||||||||||
|
|
|
|
|
|
|
|
|
|
|
|
|
| |||||||||||||||
Evaluated for impairment: | ||||||||||||||||||||||||||||
Individually | $ | 436 | $ | 644 | $ | — | $ | — | $ | — | $ | — | $ | 1,080 | ||||||||||||||
|
|
|
|
|
|
|
|
|
|
|
|
|
| |||||||||||||||
Collectively | $ | 3,600 | $ | 5,774 | $ | 858 | $ | 1,242 | $ | 10,189 | $ | 517 | $ | 22,180 | ||||||||||||||
|
|
|
|
|
|
|
|
|
|
|
|
|
| |||||||||||||||
Loans: | ||||||||||||||||||||||||||||
Ending balance | $ | 233,727 | $ | 394,034 | $ | 113,865 | $ | 227,853 | $ | 465,807 | $ | 24,138 | $ | 1,459,424 | ||||||||||||||
|
|
|
|
|
|
|
|
|
|
|
|
|
| |||||||||||||||
Evaluated for impairment: | ||||||||||||||||||||||||||||
Individually | $ | 1,259 | $ | 2,928 | $ | — | $ | — | $ | — | $ | — | $ | 4,187 | ||||||||||||||
|
|
|
|
|
|
|
|
|
|
|
|
|
| |||||||||||||||
Collectively | $ | 232,468 | $ | 391,106 | $ | 113,865 | $ | 227,853 | $ | 465,807 | $ | 24,138 | $ | 1,455,237 | ||||||||||||||
|
|
|
|
|
|
|
|
|
|
|
|
|
| |||||||||||||||
88
FINANCIAL INSTITUTIONS, INC. AND SUBSIDIARIES
NOTES TO CONSOLIDATED FINANCIAL STATEMENTS
December 31, 2011, 2010 and 2009
(4.) LOANS (Continued)
| September 30, | September 30, | September 30, | September 30, | September 30, | September 30, | September 30, | ||||||||||||||||||||||
| Commercial | Commercial Mortgage | Residential Mortgage | Home Equity | Consumer Indirect | Other Consumer | Total | ||||||||||||||||||||||
2010 | ||||||||||||||||||||||||||||
Allowance for loan losses: | ||||||||||||||||||||||||||||
Beginning balance | $ | 4,407 | $ | 6,638 | $ | 1,251 | $ | 1,043 | $ | 6,837 | $ | 565 | $ | 20,741 | ||||||||||||||
Charge-offs | (3,426 | ) | (263 | ) | (290 | ) | (259 | ) | (4,669 | ) | (909 | ) | (9,816 | ) | ||||||||||||||
Recoveries | 326 | 501 | 21 | 36 | 1,485 | 485 | 2,854 | |||||||||||||||||||||
Provision (credit) | 2,405 | (445 | ) | 31 | 152 | 4,101 | 443 | 6,687 | ||||||||||||||||||||
|
|
|
|
|
|
|
|
|
|
|
|
|
| |||||||||||||||
Ending balance | $ | 3,712 | $ | 6,431 | $ | 1,013 | $ | 972 | $ | 7,754 | $ | 584 | $ | 20,466 | ||||||||||||||
|
|
|
|
|
|
|
|
|
|
|
|
|
| |||||||||||||||
Evaluated for impairment: | ||||||||||||||||||||||||||||
Individually | $ | 149 | $ | 883 | $ | — | $ | — | $ | — | $ | — | $ | 1,032 | ||||||||||||||
|
|
|
|
|
|
|
|
|
|
|
|
|
| |||||||||||||||
Collectively | $ | 3,563 | $ | 5,548 | $ | 1,013 | $ | 972 | $ | 7,754 | $ | 584 | $ | 19,434 | ||||||||||||||
|
|
|
|
|
|
|
|
|
|
|
|
|
| |||||||||||||||
Loans: | ||||||||||||||||||||||||||||
Ending balance | $ | 210,948 | $ | 353,537 | $ | 129,553 | $ | 205,070 | $ | 400,221 | $ | 25,937 | $ | 1,325,266 | ||||||||||||||
|
|
|
|
|
|
|
|
|
|
|
|
|
| |||||||||||||||
Evaluated for impairment: | ||||||||||||||||||||||||||||
Individually | $ | 948 | $ | 3,100 | $ | — | $ | — | $ | — | $ | — | $ | 4,048 | ||||||||||||||
|
|
|
|
|
|
|
|
|
|
|
|
|
| |||||||||||||||
Collectively | $ | 210,000 | $ | 350,437 | $ | 129,553 | $ | 205,070 | $ | 400,221 | $ | 25,937 | $ | 1,321,218 | ||||||||||||||
|
|
|
|
|
|
|
|
|
|
|
|
|
| |||||||||||||||
| September 30, | ||||
2009 | Total | |||
Allowance for loan losses: | ||||
Beginning balance | $ | 18,749 | ||
Charge-offs | (7,830 | ) | ||
Recoveries | 2,120 | |||
Provision | 7,702 | |||
|
| |||
Ending balance | $ | 20,741 | ||
|
| |||
Risk Characteristics
Commercial business loans primarily consist of loans to small to mid-sized businesses in our market area in a diverse range of industries. These loans are of higher risk and typically are made on the basis of the borrower’s ability to make repayment from the cash flow of the borrower’s business. Further, the collateral securing the loans may depreciate over time, may be difficult to appraise and may fluctuate in value. The credit risk related to commercial loans is largely influenced by general economic conditions and the resulting impact on a borrower’s operations or on the value of underlying collateral, if any.
Commercial mortgage loans generally have larger balances and involve a greater degree of risk than residential mortgage loans, inferring higher potential losses on an individual customer basis. Loan repayment is often dependent on the successful operation and management of the properties, as well as on the collateral securing the loan. Economic events or conditions in the real estate market could have an adverse impact on the cash flows generated by properties securing the Company’s commercial real estate loans and on the value of such properties.
Residential mortgage loans and home equities (comprised of home equity loans and home equity lines) are generally made on the basis of the borrower’s ability to make repayment from his or her employment and other income, but are secured by real property whose value tends to be more easily ascertainable. Credit risk for these types of loans is generally influenced by general economic conditions, the characteristics of individual borrowers, and the nature of the loan collateral.
Consumer indirect and other consumer loans may entail greater credit risk than residential mortgage loans and home equities, particularly in the case of other consumer loans which are unsecured or, in the case of indirect consumer loans, secured by depreciable assets, such as automobiles or boats. In such cases, any repossessed collateral for a defaulted consumer loan may not provide an adequate source of repayment of the outstanding loan balance. In addition, consumer loan collections are dependent on the borrower’s continuing financial stability, thus are more likely to be affected by adverse personal circumstances such as job loss, illness or personal bankruptcy. Furthermore, the application of various federal and state laws, including bankruptcy and insolvency laws, may limit the amount which can be recovered on such loans.
89
FINANCIAL INSTITUTIONS, INC. AND SUBSIDIARIES
NOTES TO CONSOLIDATED FINANCIAL STATEMENTS
December 31, 2011, 2010 and 2009
(5.) PREMISES AND EQUIPMENT, NET
Major classes of premises and equipment at December 31 2009 and 2008 are summarized as follows (in thousands):
| 2009 | 2008 | |||||||
| Land and land improvements | $ | 4,334 | $ | 4,334 | ||||
| Buildings and leasehold improvements | 39,553 | 39,298 | ||||||
| Furniture, fixtures, equipment and vehicles | 23,771 | 24,480 | ||||||
| Premises and equipment | 67,658 | 68,112 | ||||||
| Accumulated depreciation and amortization | (32,875 | ) | (31,400 | ) | ||||
| Premises and equipment, net | $ | 34,783 | $ | 36,712 | ||||
| September 30, | September 30, | |||||||
| 2011 | 2010 | |||||||
Land and land improvements | $ | 4,330 | $ | 4,335 | ||||
Buildings and leasehold improvements | 40,590 | 39,215 | ||||||
Furniture, fixtures, equipment and vehicles | 23,414 | 23,645 | ||||||
|
|
|
| |||||
Premises and equipment | 68,334 | 67,195 | ||||||
Accumulated depreciation and amortization | (35,249 | ) | (33,932 | ) | ||||
|
|
|
| |||||
Premises and equipment, net | $ | 33,085 | $ | 33,263 | ||||
|
|
|
| |||||
Depreciation and amortization expense, included in occupancy and equipment expense in the consolidated statements of operations,income, amounted to $3.5 million for the years ended December 31, 2011 and 2010, and $3.8 million for the year ended December 31, 2009 and $3.7 million for each of the years ended December 31, 2008 and 2007.
2009.
- 79 -
The carrying amount of goodwill totaled $37.4 million as of December 31, 20092011 and 2008.2010. The goodwill relates to the Company’s primary subsidiary and reporting unit, Five Star Bank. The Company performs a goodwill impairment test on an annual basis or more frequently if events and circumstances warrant.
Declines in the market value of the Company’s publicly traded stock price or declines in the Company’s ability to generate future cash flows may increase the potential that goodwill recorded on the Company’s consolidated statement of financial condition be designated as impaired and that the Company may incur a goodwill write-down in the future.
(7.) DEPOSITS
A summary of financial condition, consist entirely of core deposit intangibles and are summarized as followsdeposits as of December 31 (in thousands):
| 2009 | 2008 | |||||||
| Other intangible assets | $ | 11,263 | $ | 11,263 | ||||
| Accumulated amortization | (11,263 | ) | (10,983 | ) | ||||
| Other intangible assets, net | $ | — | $ | 280 | ||||
- 80 -
| 2009 | 2008 | |||||||
| Noninterest-bearing demand | $ | 324,303 | $ | 292,586 | ||||
| Interest-bearing demand | 363,698 | 344,616 | ||||||
| Savings and money market | 368,603 | 348,594 | ||||||
| Certificates of deposit, due: | ||||||||
| Within one year | 526,549 | 546,266 | ||||||
| One to two years | 132,289 | 78,963 | ||||||
| Two to three years | 8,200 | 7,625 | ||||||
| Three to five years | 18,968 | 14,102 | ||||||
| Thereafter | 345 | 511 | ||||||
| Total certificates of deposits | 686,351 | 647,467 | ||||||
| Total deposits | $ | 1,742,955 | $ | 1,633,263 | ||||
| September 30, | September 30, | |||||||
| 2011 | 2010 | |||||||
Noninterest-bearing demand | $ | 393,421 | $ | 350,877 | ||||
Interest-bearing demand | 362,555 | 374,900 | ||||||
Savings and money market | 474,947 | 417,359 | ||||||
Certificates of deposit, due: | ||||||||
Within one year | 547,874 | 554,104 | ||||||
One to two years | 84,687 | 126,955 | ||||||
Two to three years | 17,974 | 14,653 | ||||||
Three to five years | 50,000 | 43,888 | ||||||
Thereafter | 141 | 154 | ||||||
|
|
|
| |||||
Total certificates of deposit | 700,676 | 739,754 | ||||||
|
|
|
| |||||
Total deposits | $ | 1,931,599 | $ | 1,882,890 | ||||
|
|
|
| |||||
Certificates of deposit in denominations of $100,000 or more at December 31, 2009, 20082011, 2010 and 20072009 amounted to $214.2 million, $183.9 million and $173.4 million, $164.6 million and $154.5 million, respectively. Interest expense on those certificates totaled $3.2 million, $5.7 million and $9.5 million in 2009, 2008 and 2007, respectively.
Interest expense by deposit type for the years ended December 31 2009, 2008 and 2007 is summarized as follows (in(in thousands):
| September 30, | September 30, | September 30, | ||||||||||
| 2011 | 2010 | 2009 | ||||||||||
Interest-bearing demand | $ | 614 | $ | 705 | $ | 772 | ||||||
Savings and money market | 1,056 | 1,133 | 1,090 | |||||||||
Certificates of deposit | 9,764 | 13,015 | 17,228 | |||||||||
|
|
|
|
|
| |||||||
Total interest expense on deposits | �� | $ | 11,434 | $ | 14,853 | $ | 19,090 | |||||
|
|
|
|
|
| |||||||
90
FINANCIAL INSTITUTIONS, INC. AND SUBSIDIARIES
| 2009 | 2008 | 2007 | ||||||||||
| Interest-bearing demand | $ | 772 | $ | 3,246 | $ | 5,760 | ||||||
| Savings and money market | 1,090 | 3,773 | 5,863 | |||||||||
| Certificates of deposit | 17,228 | 22,330 | 31,091 | |||||||||
| Total interest expense on deposits | $ | 19,090 | $ | 29,349 | $ | 42,714 | ||||||
NOTES TO CONSOLIDATED FINANCIAL STATEMENTS
December 31, 2011, 2010 and 2009
(8.) BORROWINGS
Outstanding borrowings are summarized as follows as of December 31 (in thousands):
| 2009 | 2008 | |||||||
| Short-term borrowings: | ||||||||
| Federal funds purchased | $ | 9,419 | $ | — | ||||
| Repurchase agreements | 35,124 | 23,465 | ||||||
| Other short-term borrowings | 15,000 | — | ||||||
| Total short-term borrowings | 59,543 | 23,465 | ||||||
| Long-term borrowings: | ||||||||
| FHLB advances and repurchase agreements | 30,145 | 30,653 | ||||||
| Junior subordinated debentures | 16,702 | 16,702 | ||||||
| Total long-term borrowings | 46,847 | 47,355 | ||||||
| Total borrowings | $ | 106,390 | $ | 70,820 | ||||
| September 30, | September 30, | |||||||
| 2011 | 2010 | |||||||
Short-term borrowings: | ||||||||
Federal funds purchased | $ | 11,597 | $ | 38,200 | ||||
Repurchase agreements | 36,301 | 38,910 | ||||||
Short-term FHLB borrowings | 102,800 | — | ||||||
|
|
|
| |||||
Total short-term borrowings | 150,698 | 77,110 | ||||||
|
|
|
| |||||
Long-term borrowings: | ||||||||
FHLB advances and repurchase agreements | — | 10,065 | ||||||
Junior subordinated debentures | — | 16,702 | ||||||
|
|
|
| |||||
Total long-term borrowings | — | 26,767 | ||||||
|
|
|
| |||||
Total borrowings | $ | 150,698 | $ | 103,877 | ||||
|
|
|
| |||||
The Company classifies borrowings as short-term or long-term in accordance with the original terms of the agreement. At December 31, 2009,2011, the Company’s short-term and long-term borrowings had a weighted average ratesrate of 0.59% and 6.01%, respectively.
Short-term Borrowings
Federal funds purchased are short-term borrowings that typically mature within one to ninety days. Federal funds purchased totaled $9.4$11.6 million and $38.2 million at December 31, 2009. There were no federal funds purchased outstanding at December 31, 2008.2011 and 2010, respectively. Repurchase agreements are secured overnight borrowings with customers. These short-term repurchase agreements amounted to $35.1$36.3 million and $23.5$38.9 million as of December 31, 20092011 and 2008,2010, respectively. Other short-termShort-term FHLB borrowings have original maturities of less than one year and include overnight borrowings which the Company typically utilizes to address short term funding needs as they arise. Short-term FHLB borrowings at December 31, 20092011 consisted of an advance from the Federal Reserve’s Term Auction Facility.
$65.0 million in overnight borrowings and $37.8 million in short-term advances.
- 81 -
The Company has credit capacity with the FHLB and can borrow through facilities that include an overnight line of credit, amortizing and term advances, and repurchase agreements. The FHLB credit capacity is collateralized by securities from the Company’s investment portfolio and certain qualifying loans. FHLB advances totaled $145 thousand and $653$65 thousand as of December 31, 2009 and 2008, respectively. The advances mature on various dates through 2011 and had a weighted average rate of 6.92% and 6.03% at December 31, 2009 and 2008, respectively.2010. FHLB repurchase agreements are stated at the amount of cash received in connection with the transaction. The Company may be required to provide additional collateral based on the fair value of the underlying securities. FHLB repurchase agreements totaled $30.0$10.0 million at bothas of December 31, 2009 and 2008.2010. The FHLB repurchase agreements mature on various dates through 2011 and bear fixed interest rates ranging from 3.48% to 3.98% with a weighted average rate$10.1 million of 3.67% at December 31, 2009.
| 2010 | $ | 20,080 | ||
| 2011 | 10,065 | |||
| $ | 30,145 | |||
In February 2001, the Company formed Financial Institutions Statutory Trust I (the “Trust”) for the sole purpose of issuing trust preferred securities. The Company’s $502 thousand investment in the common equity of the Trust iswas classified in the consolidated statements of financial condition as other assets and $16.7 million of related 10.20% junior subordinated debentures arewere classified as long-term borrowings. In 2001, the Company incurred costs relating to the issuance of the debentures totaling $487 thousand. These costs, which arewere included in other assets on the consolidated statements of financial condition, were deferred and arewere being amortized to interest expense using the straight-line method over a twenty year period.
In August 2011, the Company through the Trust, issued 16,200 fixed rate pooled trust preferred securities with a liquidation preference of $1,000 per security. The trust preferred securities represent an interest in the related subordinated debenturesredeemed all of the Company, which were purchased by the Trust and have substantially the same payment terms as these trust preferred securities. The subordinated debentures are the only assets of the Trust and interest payments from the debentures finance the distributions paid on the trust preferred securities. Distributions on the debentures are payable semi-annually at a fixed interest rate of 10.20%. The trust preferred securities are subject to mandatory redemption at the liquidation preference, in whole or in part, upon repayment of the junior subordinated debentures at maturity or their earlier redemption. The subordinated debentures are redeemable prior to the maturity date of February 1, 2031, at the optiona redemption price equaling 105.1% of the Company on or after February 1, 2011, in whole at any time thereafter or in part from time to time thereafter. The subordinated debentures are also redeemable at any time, in whole, but not in part, uponprincipal amount redeemed, plus all accrued and unpaid interest. As a result of the occurrence of specific events defined within the trust indenture. The Company has the option to defer distributions on the subordinated debentures from time to time for a period not to exceed 20 consecutive quarters, howeverredemption, the Company has not opted to defer any payments to date.
Interest expense on borrowings for the years ended December 31 2009, 2008 and 2007 is summarized as follows (in thousands):
| 2009 | 2008 | 2007 | ||||||||||
| Short-term borrowings | $ | 270 | $ | 721 | $ | 864 | ||||||
| Long-term borrowings | 2,857 | 3,547 | 3,561 | |||||||||
| Total interest expense on borrowings | $ | 3,127 | $ | 4,268 | $ | 4,425 | ||||||
| September 30, | September 30, | September 30, | ||||||||||
| 2011 | 2010 | 2009 | ||||||||||
Short-term borrowings | $ | 500 | $ | 365 | $ | 270 | ||||||
Long-term borrowings | 1,321 | 2,502 | 2,857 | |||||||||
|
|
|
|
|
| |||||||
Total interest expense on borrowings | $ | 1,821 | $ | 2,867 | $ | 3,127 | ||||||
|
|
|
|
|
| |||||||
- 82 -
NOTES TO CONSOLIDATED FINANCIAL STATEMENTS
December 31, 2009, 20082011, 2010 and 2007
(9.) COMMITMENTS AND CONTINGENCIES
Financial Instruments with Off-Balance Sheet Risk
The Company has financial instruments with off-balance sheet risk established in the normal course of business to meet the financing needs of its customers. These financial instruments include commitments to extend credit and standby letters of credit. These instruments involve, to varying degrees, elements of credit and interest rate risk extending beyond amounts recognized in the financial statements.
The Company’s exposure to credit loss in the event of nonperformance by the other party to the financial instrument for commitments to extend credit and standby letters of credit is essentially the same as that involved with extending loans to customers. The Company uses the same credit underwriting policies in making commitments and conditional obligations as for on-balance sheet instruments.
Off-balance sheet commitments as of December 31 2009 and 2008, the off-balance sheet commitments consist of the following (in thousands):
| 2009 | 2008 | |||||||
| Commitments to extend credit | $ | 316,688 | $ | 339,454 | ||||
| Standby letters of credit | 6,887 | 7,902 | ||||||
| September 30, | September 30, | |||||||
| 2011 | 2010 | |||||||
Commitments to extend credit | $ | 374,266 | $ | 357,240 | ||||
Standby letters of credit | 8,855 | 6,524 | ||||||
Commitments to extend credit are agreements to lend to a customer as long as there is no violation of any condition established in the contract. Commitments generally have fixed expiration dates or other termination clauses and may require payment of a fee. Commitments may expire without being drawn upon; therefore the total commitment amounts do not necessarily represent future cash requirements. Each customer’s creditworthiness is evaluated on a case-by-case basis. The amount of collateral obtained, if any, is based on management’s credit evaluation of the borrower. Standby letters of credit are conditional lending commitments issued by the Company to guarantee the performance of a customer to a third party. These standby letters of credit are primarily issued to support private borrowing arrangements. The credit risk involved in issuing standby letters of credit is essentially the same as that involved in extending loan facilities to customers.
The Company also extends rate lock agreements to borrowers related to the origination of residential mortgage loans. To mitigate the interest rate risk inherent in these rate lock agreements when the Company intends to sell the related loan, once originated, as well as closed residential mortgage loans held for sale, the Company enters into forward commitments to sell individual residential mortgages. Rate lock agreements and forward commitments are considered derivatives and are recorded at fair value. As ofForward sales commitments totaled $2.9 million and $8.0 million at December 31, 20092011 and 2008, the total notional amount of these derivatives held by the Company amounted to $9.4 million and $21.3 million,2010, respectively. The fair value of these derivatives in a gain position were recorded as other assets, while the fair value of these derivatives in a loss position were recorded as other liabilities in the consolidated statements of financial condition. In addition, the net change in the fair values of these derivatives was recognized as other noninterest income or other noninterest expense in the consolidated statements of operations. These fair values and changes in fair values were not significant as of or for the years ended December 31, 2009 and 2008.
Lease Obligations
The Company is obligated under a number of noncancellable operating lease agreements for land, buildings and equipment. Certain of these leases provide for escalation clauses and contain renewal options calling for increased rentals if the lease is renewed. Future minimum payments by year and in the aggregate, under the noncancellable leases with initial or remaining terms of one year or more, are as follows at December 31, 20092011 (in thousands):
| 2010 | $ | 1,135 | ||
| 2011 | 1,065 | |||
| 2012 | 1,033 | |||
| 2013 | 894 | |||
| 2014 | 863 | |||
| Thereafter | 4,386 | |||
| $ | 9,376 | |||
| September 30, | ||||
2012 | $ | 1,242 | ||
2013 | 1,049 | |||
2014 | 1,017 | |||
2015 | 962 | |||
2016 | 927 | |||
Thereafter | 4,963 | |||
|
| |||
| $ | 10,160 | |||
|
|
Rent expense relating to these operating leases, included in occupancy and equipment expense in the statements of operations,income, was $1.5 million, $1.1$1.4 million and $970 thousand$1.5 million in 2011, 2010 and 2009, 2008 and 2007, respectively.
Contingent Liabilities
In the ordinary course of business there are various threatened and pending legal proceedings against the Company. Based on consultation with outside legal counsel, management believes that the aggregate liability, if any, arising from such litigation would not have a material adverse effect on the Company’s consolidated financial statements.
- 83 -
NOTES TO CONSOLIDATED FINANCIAL STATEMENTS
December 31, 2009, 20082011, 2010 and 2007
(10.) REGULATORY MATTERS
General
The supervision and regulation of financial and bank holding companies and their subsidiaries is intended primarily for the protection of depositors, the deposit insurance funds regulated by the FDIC and the banking system as a whole, and not for the protection of shareholders or creditors of bank holding companies. The various bank regulatory agencies have broad enforcement power over financial holding companies and banks, including the power to impose substantial fines, operational restrictions and other penalties for violations of laws and regulations and for safety and soundness considerations.
Capital
Banks and financial holding companies are subject to various regulatory capital requirements administered by state and federal banking agencies. Failure to meet minimum capital requirements can initiate certain mandatory and possibly additional discretionary, actions by regulators that, if undertaken, could have a direct material impact on the Company’s consolidated financial statements. Capital adequacy guidelines and, additionally for banks, prompt corrective action regulations, involve quantitative measures of assets, liabilities, and certain off-balance sheet items calculated under regulatory accounting practices. Capital amounts and classifications are also subject to qualitative judgments by regulators about components, risk weighting and other factors.
Quantitative measures established by regulation to ensure capital adequacy require the Company and the Bank to maintain minimum amounts and ratios of Total and Tier 1 capital to risk-weighted assets and of Tier 1 capital to average assets (all as defined in the regulations). These minimum amounts and ratios are included in the table below.
The Company’s and the Bank’s Tier 1 capital consists of shareholders’ equity excluding unrealized gains and losses on securities available for sale (except for unrealized losses which have been determined to be other than temporary and recognized as expense in the consolidated statements of operations)income), goodwill and other intangible assets and disallowed portions of deferred tax assets. As of December 31, 2011, Tier 1 capital for the Company includes, subject to limitation, $17.5 million of preferred stock. As of December 31, 2010, Tier 1 capital for the Company also includes, subject to limitation, $16.7 million of trust preferred securities issued by FISI Statutory Trust I (see Note 8, Borrowings) and $37.5 million of preferred stock issued to the U.S. Department of Treasury (the “Treasury”) through the Treasury’s Troubled Asset Relief Program (“TARP”) (see Note 11, Shareholders’ Equity). The Company and the Bank’s total capital are comprised of Tier 1 capital for each entity plus a permissible portion of the allowance for loan losses.
- 84 -
93
FINANCIAL INSTITUTIONS, INC. AND SUBSIDIARIES
NOTES TO CONSOLIDATED FINANCIAL STATEMENTS
December 31, 2011, 2010 and 2009
(10.) REGULATORY MATTERS (Continued)
The Company’s and the Bank’s actual and required regulatory capital ratios were as follows (in thousands):
| September 30, | September 30, | September 30, | September 30, | September 30, | September 30, | September 30, | ||||||||||||||||||||
| Actual | For Capital Adequacy Purposes | Well Capitalized | ||||||||||||||||||||||||
| Amount | Ratio | Amount | Ratio | Amount | Ratio | |||||||||||||||||||||
December 31, 2011: | ||||||||||||||||||||||||||
Tier 1 leverage: | Company | $ | 197,086 | 8.63 | % | $ | 91,310 | 4.00 | % | $ | 114,138 | 5.00 | % | |||||||||||||
| Bank | 184,639 | 8.10 | 91,192 | 4.00 | 113,990 | 5.00 | ||||||||||||||||||||
Tier 1 capital: | Company | 197,086 | 12.20 | 64,645 | 4.00 | 96,967 | 6.00 | |||||||||||||||||||
| Bank | 184,639 | 11.46 | 64,445 | 4.00 | 96,667 | 6.00 | ||||||||||||||||||||
Total risk-based capital: | Company | 217,325 | 13.45 | 129,290 | 8.00 | 161,612 | 10.00 | |||||||||||||||||||
| Bank | 204,817 | 12.71 | 128,890 | 8.00 | 161,112 | 10.00 | ||||||||||||||||||||
December 31, 2010: | ||||||||||||||||||||||||||
Tier 1 leverage: | Company | $ | 181,089 | 8.31 | % | $ | 87,116 | 4.00 | % | $ | 108,896 | 5.00 | % | |||||||||||||
| Bank | 156,957 | 7.22 | 86,958 | 4.00 | 108,697 | 5.00 | ||||||||||||||||||||
Tier 1 capital: | Company | 181,089 | 12.34 | 58,678 | 4.00 | 88,017 | 6.00 | |||||||||||||||||||
| Bank | 156,957 | 10.74 | 58,450 | 4.00 | 87,674 | 6.00 | ||||||||||||||||||||
Total risk-based capital: | Company | 199,452 | 13.60 | 117,357 | 8.00 | 146,696 | 10.00 | |||||||||||||||||||
| Bank | 175,250 | 11.99 | 116,899 | 8.00 | 146,124 | 10.00 | ||||||||||||||||||||
As of December 31, 20092011, the Company and 2008Bank were as follows (dollars in thousands):
| For Capital | ||||||||||||||||||||||||
| Actual | Adequacy Purposes | Well Capitalized | ||||||||||||||||||||||
| Amount | Ratio | Amount | Ratio | Amount | Ratio | |||||||||||||||||||
December 31, 2009: | ||||||||||||||||||||||||
| Tier 1 leverage: | ||||||||||||||||||||||||
| Company | $ | 163,613 | 7.96 | % | $ | 82,188 | 4.00 | % | $ | 102,735 | 5.00 | % | ||||||||||||
| Bank (FSB) | 154,316 | 7.53 | 82,018 | 4.00 | 102,522 | 5.00 | ||||||||||||||||||
| Tier 1 capital (to risk-weighted assets): | ||||||||||||||||||||||||
| Company | 163,613 | 11.95 | 54,746 | 4.00 | 82,119 | 6.00 | ||||||||||||||||||
| Bank (FSB) | 154,316 | 11.33 | 54,475 | 4.00 | 81,712 | 6.00 | ||||||||||||||||||
| Total risk-based capital (to risk-weighted assets): | ||||||||||||||||||||||||
| Company | 180,766 | 13.21 | 109,492 | 8.00 | 136,865 | 10.00 | ||||||||||||||||||
| Bank (FSB) | 171,385 | 12.58 | 108,949 | 8.00 | 136,186 | 10.00 | ||||||||||||||||||
December 31, 2008: | ||||||||||||||||||||||||
| Tier 1 leverage: | ||||||||||||||||||||||||
| Company | $ | 150,426 | 8.05 | % | $ | 74,764 | 4.00 | % | $ | 93,456 | 5.00 | % | ||||||||||||
| Bank (FSB) | 120,484 | 6.46 | 74,586 | 4.00 | 93,232 | 5.00 | ||||||||||||||||||
| Tier 1 capital (to risk-weighted assets): | ||||||||||||||||||||||||
| Company | 150,426 | 11.83 | 50,881 | 4.00 | 76,322 | 6.00 | ||||||||||||||||||
| Bank (FSB) | 120,484 | 9.52 | 50,624 | 4.00 | 75,936 | 6.00 | ||||||||||||||||||
| Total risk-based capital (to risk-weighted assets): | ||||||||||||||||||||||||
| Company | 166,362 | 13.08 | 101,762 | 8.00 | 127,203 | 10.00 | ||||||||||||||||||
| Bank (FSB) | 136,340 | 10.77 | 101,248 | 8.00 | 126,560 | 10.00 | ||||||||||||||||||
Federal Reserve Requirements
The Bank is required to maintain a reserve balance at the Federal Reserve BankFRB of New York. The reserve requirement for the Bank totaled $1.0 million as of December 31, 20092011 and 2008.
Dividend Restrictions
In the ordinary course of business, the Company is dependent upon dividends from Five Star Bank to provide funds for the payment of interest expense on the junior subordinated debentures, dividends to shareholders and to provide for other cash requirements. Banking regulations may limit the amount of dividends that may be paid. Approval by regulatory authorities is required if the effect of dividends declared would cause the regulatory capital of the Bank to fall below specified minimum levels. Approval is also required if dividends declared exceed the net profits for that year combined with the retained net profits for the preceding two years. The BankCompany is currently requiredno longer subject to obtain approval from the NYS Banking Department for dividends payments.
- 85 -
NOTES TO CONSOLIDATED FINANCIAL STATEMENTS
December 31, 2009, 20082011, 2010 and 2007
(11.) SHAREHOLDERS’ EQUITY
The Company’s authorized capital stock consists of 50,210,000 shares of capital stock, 50,000,000 of which are common stock, par value $0.01 per share, and 210,000 of which are preferred stock, par value $100.00$100 per share, which is designated into two classes, Class A of which 10,000 shares are authorized, and Class B of which 200,000 shares are authorized. There are two series of Class A Preferred Stock;preferred stock: Series A 3% Preferred Stockpreferred stock and the Series A Preferred Stock.preferred stock. There is one series of Class B Preferred Stock;preferred stock: Series B-1 8.48% Preferred Stock. As of December 31, 2009, therepreferred stock. There were 174,735 shares and 183,259 shares of preferred stock issued and outstanding.
Common Stock
The following table sets forth the changes in the number of shares of common stock outstanding were as follows for the years ended December 31:
| 2009 | 2008 | |||||||
| Shares outstanding at beginning of period | 10,798,019 | 11,011,151 | ||||||
| Restricted stock awards issued | 13,172 | 51,500 | ||||||
| Stock options exercised | 1,010 | 2,317 | ||||||
| Directors’ retainer | 8,067 | 5,912 | ||||||
| Treasury stock purchases | — | (272,861 | ) | |||||
| Shares outstanding at end of period | 10,820,268 | 10,798,019 | ||||||
| September 30, | September 30, | September 30, | ||||||||||
| Outstanding | Treasury | Issued | ||||||||||
2011 | ||||||||||||
Shares outstanding at beginning of year | 10,937,506 | 410,616 | 11,348,122 | |||||||||
Shares issued in common stock offering | 2,813,475 | — | 2,813,475 | |||||||||
Restricted stock awards issued, net of forfeitures | 51,070 | (51,070 | ) | — | ||||||||
Stock options exercised | 6,357 | (6,357 | ) | — | ||||||||
Treasury stock purchases | (11,181 | ) | 11,181 | — | ||||||||
Directors’ retainer | 5,889 | (5,889 | ) | — | ||||||||
|
|
|
|
|
| |||||||
Shares outstanding at end of year | 13,803,116 | 358,481 | 14,161,597 | |||||||||
|
|
|
|
|
| |||||||
2010 | ||||||||||||
Shares outstanding at beginning of year | 10,820,268 | 527,854 | 11,348,122 | |||||||||
Restricted stock awards issued, net of forfeitures | 99,324 | (99,324 | ) | — | ||||||||
Stock options exercised | 15,563 | (15,563 | ) | — | ||||||||
Treasury stock purchases | (3,658 | ) | 3,658 | — | ||||||||
Directors’ retainer | 6,009 | (6,009 | ) | — | ||||||||
|
|
|
|
|
| |||||||
Shares outstanding at end of year | 10,937,506 | 410,616 | 11,348,122 | |||||||||
|
|
|
|
|
| |||||||
Issuance of Common Stock
In March 2011, the Company completed the sale of the Company’s stock during 2009. The Company repurchased 272,8612,813,475 shares of its common stock in open market transactionsthrough an underwritten public offering at an aggregate costa price of $4.8 million during$16.35 per share. The net proceeds of the year ended December 31, 2008.
Preferred Stock and Warrant
Series A 3% Preferred Stock.As of December 31, 2009, thereThere were 1,500 shares and 1,533 shares of Series A 3% Preferred Stockpreferred stock issued and outstanding.outstanding as of December 31, 2011 and 2010, respectively. Holders of Series A 3% Preferred Stockpreferred stock are entitled to receive an annual dividend of $3.00 per share, which is cumulative and payable quarterly. Holders of Series A 3% Preferred Stockpreferred stock have no pre-emptive right in, or right to purchase or subscribe for, any additional shares of the Company’s capital stock and have no voting rights. Dividend or dissolution payments to the Class A shareholders must be declared and paid, or set apart for payment, before any dividends or dissolution payments can be declared and paid, or set apart for payment, to the holders of Class B Preferred Stockpreferred stock or Common Stock.common stock. The Series A 3% Preferred Stockpreferred stock is not convertible into any other of the Company’s securities.
- 86 -
- 87 -
NOTES TO CONSOLIDATED FINANCIAL STATEMENTS
December 31, 2011, 2010 and 2009
(11.) SHAREHOLDERS’ EQUITY (Continued)
Redemption of Series A Preferred Stock and Warrant
In December 2008, under the Treasury’s TARP Capital Purchase Program, the Company entered into a Securities Purchase Agreement—Standard Terms with the Treasury pursuant to which, among other things, the Company sold to the Treasury for an aggregate purchase price of $37.5 million, 7,503 shares of fixed rate cumulative perpetual preferred stock, Series A (“Series A” preferred stock) and 2007
Pursuant to the terms of the Purchase Agreement, the Company’s ability to declare or pay dividends on any of its shares was limited. Specifically, the Company was prohibited from paying any dividend with respect to shares of common stock, other junior securities or preferred stock rankingpari passu with the Series A preferred stock or repurchasing or redeeming any shares of the Company’s common stock, other junior securities or preferred stock rankingpari passu with the Series A preferred stock in any quarter unless all accrued and unpaid dividends were paid on the Series A preferred stock for all past dividend periods (including the latest completed dividend period), subject to certain limited exceptions.
The $37.5 million in proceeds was allocated to the Series A preferred stock and the Warrant based on their relative fair values at issuance ($35.5 million was allocated to the Series A preferred stock and $2.0 million to the Warrant). The resulting discount for the Series A preferred stock was to be accreted over five years through retained earnings as a preferred stock dividend. The Warrant was to remain in additional paid-in-capital at its initial book value until it was exercised or expired.
In February 2011, the Company redeemed one-third, or $12.5 million, of the Series A preferred stock. In March 2011, the remaining $25.0 million of the Series A preferred stock was redeemed. The unamortized discount related to the Series A preferred stock was charged to retained earnings upon redemption. The complete redemption of the Series A preferred stock removed the TARP restrictions pertaining to the Company’s ability to declare and pay dividends and repurchase its common stock, as well as certain restrictions associated with executive compensation.
In May 2011, the Company repurchased the Warrant issued to the Treasury. The repurchase price of $2.1 million was recorded as a reduction of additional paid-in capital.
96
FINANCIAL INSTITUTIONS, INC. AND SUBSIDIARIES
NOTES TO CONSOLIDATED FINANCIAL STATEMENTS
December 31, 2011, 2010 and 2009
(12.) COMPREHENSIVE INCOME (LOSS)
Total comprehensive income (loss) is reported in the accompanying consolidated statements of changes in shareholders’ equity. Information related to comprehensive income (loss) for the years ended December 31 was as follows (in thousands):
| Pre-tax Amount | Tax Expense (Benefit) | Net-of-tax Amount | ||||||||||
2009 | ||||||||||||
| Securities available for sale: | ||||||||||||
| Change in net unrealized gain/loss during the period | $ | (4,186 | ) | $ | (1,619 | ) | $ | (2,567 | ) | |||
| Reclassification adjustment for gains included in income | (3,429 | ) | (1,327 | ) | (2,102 | ) | ||||||
| Reclassification adjustment for impairment charges included in income | 4,666 | 1,805 | 2,861 | |||||||||
| (2,949 | ) | (1,141 | ) | (1,808 | ) | |||||||
| Change in net actuarial gain/loss and prior service benefit (cost) on defined benefit pension and post-retirement plans | 3,457 | 1,338 | 2,119 | |||||||||
| Other comprehensive income | $ | 508 | $ | 197 | 311 | |||||||
| Net income | 14,441 | |||||||||||
| Comprehensive income | $ | 14,752 | ||||||||||
2008 | ||||||||||||
| Securities available for sale: | ||||||||||||
| Change in net unrealized gain/loss during the period | $ | (61,464 | ) | $ | (23,778 | ) | $ | (37,686 | ) | |||
| Reclassification adjustment for gains included in income | (288 | ) | (111 | ) | (177 | ) | ||||||
| Reclassification adjustment for impairment charges included in income | 68,215 | 26,389 | 41,826 | |||||||||
| 6,463 | 2,500 | 3,963 | ||||||||||
| Change in net actuarial gain/loss and prior service benefit (cost) on defined benefit pension and post-retirement plans | (14,098 | ) | (5,455 | ) | (8,643 | ) | ||||||
| Other comprehensive loss | $ | (7,635 | ) | $ | (2,955 | ) | (4,680 | ) | ||||
| Net loss | (26,158 | ) | ||||||||||
| Comprehensive loss | $ | (30,838 | ) | |||||||||
2007 | ||||||||||||
| Securities available for sale: | ||||||||||||
| Change in net unrealized gain/loss during the period | $ | 10,530 | $ | 4,103 | $ | 6,427 | ||||||
| Reclassification adjustment for gains included in income | (207 | ) | (80 | ) | (127 | ) | ||||||
| 10,323 | 4,023 | 6,300 | ||||||||||
| Change in net actuarial gain/loss and prior service benefit (cost) on defined benefit pension and post-retirement plans | 4,531 | 1,760 | 2,771 | |||||||||
| Other comprehensive income | $ | 14,854 | $ | 5,783 | 9,071 | |||||||
| Net income | 16,409 | |||||||||||
| Comprehensive income | $ | 25,480 | ||||||||||
| September 30, | September 30, | September 30, | ||||||||||
| Pre-tax Amount | Tax Expense (Benefit) | Net-of-tax Amount | ||||||||||
2011 | ||||||||||||
Securities available for sale: | ||||||||||||
Change in net unrealized gain/loss during the period | $ | 22,350 | $ | 8,855 | $ | 13,495 | ||||||
Reclassification adjustment for gains included in income | (3,003 | ) | (1,190 | ) | (1,813 | ) | ||||||
Reclassification adjustment for impairment charges included in income | 18 | 7 | 11 | |||||||||
|
|
|
|
|
| |||||||
| 19,365 | 7,672 | 11,693 | ||||||||||
Change in net actuarial gain/loss and prior service benefit (cost) on defined benefit pension and post-retirement plans | (9,979 | ) | (3,953 | ) | (6,026 | ) | ||||||
|
|
|
|
|
| |||||||
Other comprehensive income | $ | 9,386 | $ | 3,719 | 5,667 | |||||||
|
|
|
| |||||||||
Net income | 22,799 | |||||||||||
|
| |||||||||||
Comprehensive income | $ | 28,466 | ||||||||||
|
| |||||||||||
2010 | ||||||||||||
Securities available for sale: | ||||||||||||
Change in net unrealized gain/loss during the period | $ | (16 | ) | $ | 19 | $ | (35 | ) | ||||
Reclassification adjustment for gains included in income | (169 | ) | (67 | ) | (102 | ) | ||||||
Reclassification adjustment for impairment charges included in income | 594 | 235 | 359 | |||||||||
|
|
|
|
|
| |||||||
| 409 | 187 | 222 | ||||||||||
Change in net actuarial gain/loss and prior service benefit (cost) on defined benefit pension and post-retirement plans | (2,192 | ) | (950 | ) | (1,242 | ) | ||||||
|
|
|
|
|
| |||||||
Other comprehensive loss | $ | (1,783 | ) | $ | (763 | ) | (1,020 | ) | ||||
|
|
|
| |||||||||
Net income | 21,287 | |||||||||||
|
| |||||||||||
Comprehensive income | $ | 20,267 | ||||||||||
|
| |||||||||||
2009 | ||||||||||||
Securities available for sale: | ||||||||||||
Change in net unrealized gain/loss during the period | $ | (4,186 | ) | $ | (1,619 | ) | $ | (2,567 | ) | |||
Reclassification adjustment for gains included in income | (3,429 | ) | (1,327 | ) | (2,102 | ) | ||||||
Reclassification adjustment for impairment charges included in income | 4,666 | 1,805 | 2,861 | |||||||||
|
|
|
|
|
| |||||||
| (2,949 | ) | (1,141 | ) | (1,808 | ) | |||||||
Change in net actuarial gain/loss and prior service benefit (cost) on defined benefit pension and post-retirement plans | 3,457 | 1,338 | 2,119 | |||||||||
|
|
|
|
|
| |||||||
Other comprehensive income | $ | 508 | $ | 197 | 311 | |||||||
|
|
|
| |||||||||
Net income | 14,441 | |||||||||||
|
| |||||||||||
Comprehensive income | $ | 14,752 | ||||||||||
|
| |||||||||||
The components of accumulated other comprehensive income (loss), net of tax, as of December 31 were as follows (in(in thousands):
| 2009 | 2008 | |||||||
| Net actuarial loss and prior service cost on defined benefit pension and post-retirement plans | $ | (5,357 | ) | $ | (7,476 | ) | ||
| Net unrealized gain on securities available for sale | 1,655 | 3,463 | ||||||
| $ | (3,702 | ) | $ | (4,013 | ) | |||
| September 30, | September 30, | |||||||
| 2011 | 2010 | |||||||
Net actuarial loss and prior service cost on defined benefit pension and post-retirement plans | $ | (12,625 | ) | $ | (6,599 | ) | ||
Net unrealized gain on securities available for sale | 13,570 | 1,877 | ||||||
|
|
|
| |||||
| $ | 945 | $ | (4,722 | ) | ||||
|
|
|
| |||||
- 88 -
NOTES TO CONSOLIDATED FINANCIAL STATEMENTS
December 31, 2009, 20082011, 2010 and 2007
(13.) SHARE-BASED COMPENSATION
The Company maintains certain stock-based compensation plans, approved by the Company’s shareholders that are administered by the Board, or the Management Development and Compensation Committee of the Board. OnIn May 6, 2009, the shareholders of the Company approved two share-based compensation plans, the 2009 Management Stock Incentive Plan (“Management Plan”) and the 2009 Directors’ Stock Incentive Plan (“Director’s Plan”). An aggregate of 690,000 shares has been reserved for issuance by the Company under the terms of the Management Plan pursuant to the grant of incentive stock options (not to exceed 500,000 shares), non-qualified stock options and restricted stock grants, all which are defined in the plan. An aggregate of 250,000 shares has been reserved for issuance by the Company under the terms of the Director’s Plan pursuant to the grant of non-qualified stock options and restricted stock grants, all which are defined in the plan. Under both plans, for purposes of calculating the number of shares of common stock available for issuance, each share of common stock granted pursuant to a restricted stock grant shall count as 1.64 shares of common stock. As of December 31, 2009,2011, there were approximately 237,000213,000 and 687,000451,000 shares available for grant under the Director’s Plan and Management Plan, respectively, of which 61% were available for issuance as restricted stock grants.
Under the Management Plan and the Director’s Plan (the “Plans”), the Board (or the Compensation Committee) may establish and prescribe grant guidelines including various terms and conditions for the granting of stock-based compensation. For stock options, the exercise price of each option equals the market price of the Company’s stock on the date of the grant. All options expire after a period of ten years from the date of grant and generally become fully exercisable over a period of 3 to 5 years from the grant date. When option recipients exercise their options, the Company issues shares from treasury stock and records the proceeds as additions to capital. For restricted stock, shares generally vestsvest over 2 to 3 years from the grant date. Vesting of the shares may be based on years of service, established performance measures or both. If restricted stock grants are forfeited before they vest, the shares are reacquired into treasury stock.
The share-based compensation plans were established to allow for the granting of compensation awards to attract, motivate and retain employees, executive officers and non-employee directors who contribute to the success and profitability of the Company and to give such persons a proprietary interest in the Company, thereby enhancing their personal interest in the Company’s success.
The share-based compensation expense for the years ended December 31 2009, 2008 and 2007 was as follows (in thousands):
| 2009 | 2008 | 2007 | ||||||||||
| Stock options: | ||||||||||||
| Management Stock Incentive Plan | $ | 222 | $ | 378 | $ | 571 | ||||||
| Director Stock Incentive Plan | 46 | 40 | 220 | |||||||||
| Total stock option expense | 268 | 418 | 791 | |||||||||
| Restricted stock awards: | ||||||||||||
| Management Stock Incentive Plan | 488 | 215 | 164 | |||||||||
| Director Stock Incentive Plan | 98 | — | — | |||||||||
| Total restricted stock award expense | 586 | 215 | 164 | |||||||||
| Total share-based compensation | $ | 854 | $ | 633 | $ | 955 | ||||||
| September 30, | September 30, | September 30, | ||||||||||
| 2011 | 2010 | 2009 | ||||||||||
Stock options: | ||||||||||||
Management Stock Incentive Plan | $ | 55 | $ | 110 | $ | 222 | ||||||
Director Stock Incentive Plan | 14 | 43 | 46 | |||||||||
|
|
|
|
|
| |||||||
Total stock option expense | 69 | 153 | 268 | |||||||||
Restricted stock awards: | ||||||||||||
Management Stock Incentive Plan | 917 | 761 | 488 | |||||||||
Director Stock Incentive Plan | 119 | 117 | 98 | |||||||||
|
|
|
|
|
| |||||||
Total restricted stock award expense | 1,036 | 878 | 586 | |||||||||
|
|
|
|
|
| |||||||
Total share-based compensation | $ | 1,105 | $ | 1,031 | $ | 854 | ||||||
|
|
|
|
|
| |||||||
The restrictedCompany uses the Black-Scholes valuation method to estimate the fair value of its stock award expense for 2009 and 2008 included $2 thousand and $30 thousand, respectively, of dividends for unearned shares in the restrictedoption awards. There were no stock plan which is accounted for as compensation expense.
| Weighted | ||||||||||||||||
| Weighted | Average | |||||||||||||||
| Average | Remaining | Aggregate | ||||||||||||||
| Number of | Exercise | Contractual | Intrinsic | |||||||||||||
| Options | Price | Term | Value | |||||||||||||
| Outstanding at beginning of year | 582,885 | $ | 19.14 | |||||||||||||
| Granted | — | — | ||||||||||||||
| Exercised | (1,010 | ) | 14.00 | |||||||||||||
| Forfeited | (8,500 | ) | 18.48 | |||||||||||||
| Expired | (114,641 | ) | 14.61 | |||||||||||||
| Outstanding at end of year | 458,734 | 20.30 | 5.25 years | $ | — | |||||||||||
| Exercisable at end of year | 369,004 | 20.76 | 4.64 years | $ | — | |||||||||||
| September 30, | September 30, | September 30, | September 30, | |||||||||||
| Number of | Weighted Average Exercise | Weighted Average Remaining Contractual | Aggregate Intrinsic | |||||||||||
| Options | Price | Term | Value | |||||||||||
Outstanding at beginning of year | 409,893 | $ | 20.64 | |||||||||||
Granted | — | — | ||||||||||||
Exercised | (6,357 | ) | 14.26 | |||||||||||
Forfeited | (550 | ) | 15.85 | |||||||||||
Expired | (34,928 | ) | 21.28 | |||||||||||
|
| |||||||||||||
Outstanding at end of year | 368,058 | $ | 20.70 | 3.65 years | $ | 9 | ||||||||
Exercisable at end of year | 361,033 | $ | 20.79 | 3.60 years | $ | 7 | ||||||||
- 89 -
NOTES TO CONSOLIDATED FINANCIAL STATEMENTS
December 31, 2009, 20082011, 2010 and 2007
(13.) SHARE-BASED COMPENSATION (Continued)
As of December 31, 2009,2011, there was $196$13 thousand of unrecognized compensation expense related to unvested stock options, thatall of which is expected to be recognized over a weighted average period of 1.59 years.
The aggregate intrinsic value (the amount by which the market price of the stock on the date of exercise exceeded the market price of the stock on the date of grant) of option exercises for the years ended December 31, 2011, 2010 and 2009 2008 and 2007 was $1$31 thousand, $10$59 thousand, and $52$1 thousand, respectively. The total cash received as a result of option exercises under stock compensation plans for the years ended December 31, 2011, 2010 and 2009 2008 and 2007 was $14$91 thousand, $32$216 thousand, and $251$14 thousand, respectively. The tax benefits realized in connection with these stock option exercises were not significant.
| 2008 | 2007 | |||||||
| Options granted | 61,100 | 90,700 | ||||||
| Grant date weighted average fair value per share | $ | 5.09 | $ | 7.09 | ||||
| Grant date weighted average share price | $ | 16.98 | $ | 19.49 | ||||
| Risk-free interest rate | 3.40 | % | 4.76 | % | ||||
| Expected dividend yield | 3.48 | % | 2.21 | % | ||||
| Expected stock price volatility | 38.60 | % | 39.36 | % | ||||
| Expected life (in years) | 6.19 | 5.94 | ||||||
The following is a summary of restricted stock award activity for the year ended December 31, 2009:
| Weighted | ||||||||
| Average | ||||||||
| Market | ||||||||
| Number of | Price at | |||||||
| Shares | Grant Date | |||||||
| Outstanding at beginning of year | 81,800 | $ | 19.35 | |||||
| Granted | 58,472 | 13.33 | ||||||
| Vested | (17,200 | ) | 18.61 | |||||
| Forfeited | (45,300 | ) | 19.23 | |||||
| Outstanding at end of year | 77,772 | $ | 15.05 | |||||
| September 30, | September 30, | |||||||
| Number of | Weighted Average Market Price at | |||||||
| Shares | Grant Date | |||||||
Outstanding at beginning of year | 150,796 | $ | 12.76 | |||||
Granted | 53,070 | 18.88 | ||||||
Vested | (35,212 | ) | 14.38 | |||||
Forfeited | (2,000 | ) | 15.44 | |||||
|
| |||||||
Outstanding at end of year | 166,654 | $ | 14.34 | |||||
|
| |||||||
As of December 31, 2009,2011, there was $399$804 thousand of unrecognized compensation expense related to unvested restricted stock awards that is expected to be recognized over a weighted average period of 1.361.48 years.
- 90 -
Total income tax expense (benefit) was allocated as follows for the years ended December 31 (in thousands):
| 2009 | 2008 | 2007 | ||||||||||
| Income tax expense (benefit) | $ | 6,140 | $ | (21,301 | ) | $ | 4,800 | |||||
| Shareholder’s equity | 197 | (2,955 | ) | 5,783 | ||||||||
| September 30, | September 30, | September 30, | ||||||||||
| 2011 | 2010 | 2009 | ||||||||||
Income tax expense | $ | 11,415 | $ | 9,352 | $ | 6,140 | ||||||
Shareholder’s equity | 3,718 | (763 | ) | 197 | ||||||||
The income tax provisionexpense (benefit) for the years ended December 31 2009, 2008 and 2007 consisted of the following (in(in thousands):
| September 30, | September 30, | September 30, | ||||||||||
| 2011 | 2010 | 2009 | ||||||||||
Current tax expense (benefit): | ||||||||||||
Federal | $ | 3,747 | $ | 5,781 | $ | (1,355 | ) | |||||
State | 1,158 | 1,103 | 25 | |||||||||
|
|
|
|
|
| |||||||
Total current tax expense (benefit) | 4,905 | 6,884 | (1,330 | ) | ||||||||
|
|
|
|
|
| |||||||
Deferred tax expense (benefit): | ||||||||||||
Federal | 5,584 | 2,852 | 6,189 | |||||||||
State | 926 | (384 | ) | 1,281 | ||||||||
|
|
|
|
|
| |||||||
Total deferred tax expense | 6,510 | 2,468 | 7,470 | |||||||||
|
|
|
|
|
| |||||||
Total income tax expense | $ | 11,415 | $ | 9,352 | $ | 6,140 | ||||||
|
|
|
|
|
| |||||||
99
FINANCIAL INSTITUTIONS, INC. AND SUBSIDIARIES
| 2009 | 2008 | 2007 | ||||||||||
| Current tax (benefit) expense: | ||||||||||||
| Federal | $ | (1,355 | ) | $ | 2,043 | $ | 3,572 | |||||
| State | 25 | 504 | 513 | |||||||||
| Total current tax (benefit) expense | (1,330 | ) | 2,547 | 4,085 | ||||||||
| Deferred tax expense (benefit): | ||||||||||||
| Federal | 6,189 | (19,640 | ) | 126 | ||||||||
| State | 1,281 | (4,208 | ) | 589 | ||||||||
| Total deferred tax expense (benefit) | 7,470 | (23,848 | ) | 715 | ||||||||
| Total income tax expense (benefit): | $ | 6,140 | $ | (21,301 | ) | $ | 4,800 | |||||
NOTES TO CONSOLIDATED FINANCIAL STATEMENTS
December 31, 2011, 2010 and 2009
(14.) INCOME TAXES (Continued)
Income tax expense (benefit) differed from the statutory federal income tax rate as follows:
| 2009 | 2008 | 2007 | ||||||||||
| Statutory federal tax rate | 34.0 | % | (34.0 | )% | 34.0 | % | ||||||
| Increase (decrease) resulting from: | ||||||||||||
| Tax exempt interest income | (8.6 | ) | (5.2 | ) | (13.6 | ) | ||||||
| Non-taxable earnings on company owned life insurance | (1.8 | ) | (0.4 | ) | (2.0 | ) | ||||||
| Dividend received deduction | (0.1 | ) | (0.8 | ) | (1.5 | ) | ||||||
| State taxes, net of federal tax benefit | 4.2 | (5.2 | ) | 3.4 | ||||||||
| Nondeductible expenses | 1.0 | 0.2 | 0.4 | |||||||||
| Disallowed interest expense | 0.5 | 0.5 | 1.8 | |||||||||
| Other, net | 0.6 | — | 0.1 | |||||||||
| Effective tax rate | 29.8 | % | (44.9 | )% | 22.6 | % | ||||||
- 91 -
for the years ended December 31
| September 30, | September 30, | September 30, | ||||||||||
| 2011 | 2010 | 2009 | ||||||||||
Statutory federal tax rate | 35.0 | % | 35.0 | % | 34.0 | % | ||||||
Increase (decrease) resulting from: | ||||||||||||
Tax exempt interest income | (4.3 | ) | (4.2 | ) | (8.6 | ) | ||||||
Non-taxable earnings on company owned life insurance | (1.5 | ) | (1.3 | ) | (1.8 | ) | ||||||
State taxes, net of federal tax benefit | 4.0 | 1.5 | 4.2 | |||||||||
Nondeductible expenses | 0.4 | 0.6 | 1.0 | |||||||||
Disallowed interest expense | 0.2 | 0.2 | 0.5 | |||||||||
Other, net | (0.4 | ) | (1.3 | ) | 0.5 | |||||||
|
|
|
|
|
| |||||||
Effective tax rate | 33.4 | % | 30.5 | % | 29.8 | % | ||||||
|
|
|
|
|
| |||||||
The Company’s net deferred tax asset is included in other assets in the Consolidated Statements of Condition. The tax effects of temporary differences that give rise to the deferred tax assets and deferred tax liabilities are as follows at December 31 2009 and 2008 are as follows (in thousands):
| 2009 | 2008 | |||||||
| Deferred tax assets: | ||||||||
| Other than temporary impairment of investment securities | $ | 14,827 | $ | 26,389 | ||||
| Allowance for loan losses | 7,418 | 6,619 | ||||||
| Tax attribute carryforward benefits | 5,559 | 2,689 | ||||||
| Share-based compensation | 1,033 | 794 | ||||||
| Interest on non-accruing loans | 788 | 595 | ||||||
| Core deposit intangible | 258 | 332 | ||||||
| Accrued pension costs | 92 | 2,494 | ||||||
| Other | 580 | 374 | ||||||
| Gross deferred tax assets | 30,555 | 40,286 | ||||||
| Deferred tax liabilities: | ||||||||
| Deferred loan origination costs | 3,290 | 4,458 | ||||||
| Net unrealized gain on securities available for sale | 1,044 | 2,185 | ||||||
| Depreciation and amortization | 1,283 | 1,342 | ||||||
| Loan servicing assets | 522 | 218 | ||||||
| Other | 1 | 2 | ||||||
| Gross deferred tax liabilities | 6,140 | 8,205 | ||||||
| Net deferred tax asset | $ | 24,415 | $ | 32,081 | ||||
| September 30, | September 30, | |||||||
| 2011 | 2010 | |||||||
Deferred tax assets: | ||||||||
Other than temporary impairment of investment securities | $ | 11,326 | $ | 15,418 | ||||
Allowance for loan losses | 9,106 | 8,108 | ||||||
Share-based compensation | 1,437 | 1,250 | ||||||
Interest on non-accruing loans | 716 | 781 | ||||||
Accrued pension costs | 538 | — | ||||||
Tax attribute carryforward benefits | 463 | 2,033 | ||||||
Core deposit intangible | 79 | 158 | ||||||
Other | 1,172 | 665 | ||||||
|
|
|
| |||||
Gross deferred tax assets | 24,837 | 28,413 | ||||||
Deferred tax liabilities: | ||||||||
Net unrealized gain on securities available for sale | 8,903 | 1,231 | ||||||
Depreciation and amortization | 1,741 | 1,489 | ||||||
Deferred loan origination costs | 930 | 2,263 | ||||||
Loan servicing assets | 781 | 581 | ||||||
Prepaid pension costs | — | 139 | ||||||
|
|
|
| |||||
Gross deferred tax liabilities | 12,355 | 5,703 | ||||||
|
|
|
| |||||
Net deferred tax asset | $ | 12,482 | $ | 22,710 | ||||
|
|
|
| |||||
The Company recognizes deferred income taxes for the estimated future tax effects of differences between the tax and financial statement bases of assets and liabilities considering enacted tax laws. These differences result in deferred tax assets and liabilities, which are included in other assets in the Company’s consolidated statements of condition. The Company also assesses the likelihood that deferred tax assets will be realizable based on, among other considerations, future taxable income and establishes, if necessary, a valuation allowance for those deferred tax assets determined to not likely be realizable. A deferred tax asset valuation allowance is recognized if, based on the weight of available evidence (both positive and negative), it is more likely than not that some portion or all of the deferred tax assets will not be realized. The future realization of deferred tax benefits depends upon the existence of sufficient taxable income within the carry-back and carry-forward periods. ManagementManagement’s judgment is required in determining the appropriate recognition of deferred tax assets and liabilities, including projections of future taxable income.
Based upon the Company’s historical and projected future levels of pre-tax and taxable income, the scheduled reversals of taxable temporary differences to offset future deductible amounts, and prudent and feasible tax planning strategies, management believes it is more likely than not that the deferred tax assets will be realized. As such, no valuation allowance has been recorded as of December 31, 20092011 or 2008.
The Company and its subsidiaries are subject to federal and New York State (“NYS”) income taxes. The federal income tax years currently open for auditaudits are 2007 through 2009.2011. The NYS income tax years currently open for auditaudits are 20062009 through 2009.
100
FINANCIAL INSTITUTIONS, INC. AND SUBSIDIARIES
NOTES TO CONSOLIDATED FINANCIAL STATEMENTS
December 31, 2011, 2010 and 2009
(14.) INCOME TAXES (Continued)
At December 31, 2009,2011, the Company hashad no federal andor NYS net operating loss carryforwards of approximately $58 thousand and $7.9 million, respectively. The federal and NYS net operating loss carryforwards begin to expire in 2021.carryforwards. The Company also has federal and NYS tax credits of approximately $5.2 million and $53$463 thousand respectively, which have an unlimited carryforward period. The federal and NYS net operating loss carryforwards are subject to annual limitations imposed by the Internal Revenue Code (“IRC”). The Company believes the limitations will not prevent the carryforward benefits from being utilized.
The Company’s unrecognized tax benefits and changes in unrecognized tax benefits were not significant as of or for the years ended December 31, 20092011 and 2008.2010. There were no interest or penalties recorded in the income statement in income tax expense for the year ended December 31, 2009.2011. As of December 31, 2009,2011, there were no amounts accrued for interest or penalties related to uncertain tax positions.
- 92 -
The following table presents a reconciliation of the earnings and shares used in calculating basic and diluted EPS for each of the years ended December 31 2009, 2008 and 2007 (in thousands, except per share amounts).
| 2009 | 2008 | 2007 | ||||||||||
| Net income (loss) allocated to common shareholders | $ | 10,744 | $ | (27,696 | ) | $ | 14,926 | |||||
| Less: Earnings (loss) allocated to participating securities | 87 | (230 | ) | — | ||||||||
| Earnings (loss) allocated to common shares outstanding | $ | 10,657 | $ | (27,466 | ) | $ | 14,926 | |||||
| Weighted average common shares used to calculate basic EPS | 10,730 | 10,818 | 11,154 | |||||||||
| Add: Effect of common stock equivalents | 39 | — | 30 | |||||||||
| Weighted average common shares used to calculate diluted EPS | 10,769 | 10,818 | 11,184 | |||||||||
| Earnings (loss) per common share: | ||||||||||||
| Basic | $ | 0.99 | $ | (2.54 | ) | $ | 1.34 | |||||
| Diluted | $ | 0.99 | $ | (2.54 | ) | $ | 1.33 | |||||
| Shares subject to the following securities, outstanding as of December 31 of the respective year, were excluded from the computation of diluted EPS because the effect would be antidilutive: | ||||||||||||
| Stock options | 459 | 583 | 381 | |||||||||
| Restricted stock awards | — | 82 | 30 | |||||||||
| Warrant | 378 | 378 | — | |||||||||
| 837 | 1,043 | 411 | ||||||||||
| September 30, | September 30, | September 30, | ||||||||||
| 2011 | 2010 | 2009 | ||||||||||
Net income available to common shareholders | $ | 19,617 | $ | 17,562 | $ | 10,744 | ||||||
Less: Earnings allocated to participating securities | 38 | 105 | 87 | |||||||||
|
|
|
|
|
| |||||||
Net income available to common shareholders for EPS | $ | 19,579 | $ | 17,457 | $ | 10,657 | ||||||
|
|
|
|
|
| |||||||
Weighted average common shares outstanding: | ||||||||||||
Total shares issued | 13,599 | 11,348 | 11,348 | |||||||||
Unvested restricted stock awards | (166 | ) | (154 | ) | (92 | ) | ||||||
Treasury shares | (366 | ) | (427 | ) | (526 | ) | ||||||
|
|
|
|
|
| |||||||
Total basic weighted average common shares outstanding | 13,067 | 10,767 | 10,730 | |||||||||
Incremental shares from assumed: | ||||||||||||
Exercise of stock options | 3 | 6 | — | |||||||||
Vesting of restricted stock awards | 65 | 27 | 39 | |||||||||
Exercise of warrant | 22 | 45 | — | |||||||||
|
|
|
|
|
| |||||||
Total diluted weighted average common shares outstanding | 13,157 | 10,845 | 10,769 | |||||||||
Basic earnings per common share | $ | 1.50 | $ | 1.62 | $ | 0.99 | ||||||
|
|
|
|
|
| |||||||
Diluted earnings per common share | $ | 1.49 | $ | 1.61 | $ | 0.99 | ||||||
|
|
|
|
|
| |||||||
For each of the periods presented, average shares subject to the following instruments were excluded from the computation of diluted EPS because the effect would be antidilutive:
| September 30, | September 30, | September 30, | ||||||||||
Stock options | 339 | 353 | 459 | |||||||||
Restricted stock awards | — | — | — | |||||||||
Warrant | — | — | 378 | |||||||||
|
|
|
|
|
| |||||||
| 339 | 353 | 837 | ||||||||||
|
|
|
|
|
|
101
FINANCIAL INSTITUTIONS, INC. AND SUBSIDIARIES
NOTES TO CONSOLIDATED FINANCIAL STATEMENTS
December 31, 2011, 2010 and 2009
(16.) EMPLOYEE BENEFIT PLANS
Defined Benefit Pension Plan
The Company participates in The New York State Bankers Retirement System (the “Plan”), which is a defined benefit pension plan covering substantially all employees, subject to the limitations related to the plan closure effective December 31, 2006. The benefits are based on years of service and the employee’s highest average compensation during five consecutive years of employment. The defined benefit plan was closed to new participants effective December 31, 2006. Only employees hired on or before December 31, 2006 and who met participation requirements on or before January 1, 2008 are eligible to receive benefits.
The following table provides a reconciliation of the changes in the plan’s benefit obligations, fair value of assets and a statement of the funded status at their respective measurement datesas of and for the year ended December 31 (in thousands):
| December 31, | December 31, | |||||||
| 2009 | 2008(a) | |||||||
| Change in projected benefit obligation: | ||||||||
| Projected benefit obligation at beginning of period | $ | (30,878 | ) | $ | (25,102 | ) | ||
| Service cost | (1,689 | ) | (1,820 | ) | ||||
| Interest cost | (1,826 | ) | (1,953 | ) | ||||
| Actuarial loss | (489 | ) | (3,767 | ) | ||||
| Benefits paid and plan expenses | 1,441 | 1,764 | ||||||
| Projected benefit obligation at end of period | (33,441 | ) | (30,878 | ) | ||||
| Change in plan assets: | ||||||||
| Fair value of plan assets at beginning of period | 24,431 | 28,431 | ||||||
| Actual return (loss) on plan assets | 5,132 | (7,436 | ) | |||||
| Employer contributions | 5,081 | 5,200 | ||||||
| Benefits paid and plan expenses | (1,441 | ) | (1,764 | ) | ||||
| Fair value of plan assets as of end of period | 33,203 | 24,431 | ||||||
| Unfunded status at end of period | $ | (238 | ) | $ | (6,447 | ) | ||
| September 30, | September 30, | |||||||
| 2011 | 2010 | |||||||
Change in projected benefit obligation: | ||||||||
Projected benefit obligation at beginning of period | $ | 38,381 | $ | 33,441 | ||||
Service cost | 1,756 | 1,633 | ||||||
Interest cost | 2,027 | 1,933 | ||||||
Actuarial loss | 7,939 | 2,969 | ||||||
Benefits paid and plan expenses | (1,800 | ) | (1,595 | ) | ||||
|
|
|
| |||||
Projected benefit obligation at end of period | 48,303 | 38,381 | ||||||
|
|
|
| |||||
Change in plan assets: | ||||||||
Fair value of plan assets at beginning of period | 38,731 | 33,203 | ||||||
Actual return on plan assets | 12 | 2,823 | ||||||
Employer contributions | 10,000 | 4,300 | ||||||
Benefits paid and plan expenses | (1,800 | ) | (1,595 | ) | ||||
|
|
|
| |||||
Fair value of plan assets at end of period | 46,943 | 38,731 | ||||||
|
|
|
| |||||
Funded (unfunded) status at end of period | $ | (1,360 | ) | $ | 350 | |||
|
|
|
| |||||
- 93 -
The Company’s funding policy is to contribute, at a minimum, an actuarially determined amount that will satisfy the minimum funding requirements determined under the appropriate sections of Internal Revenue Code. The Company satisfied the minimum required contribution to its pension plan of $1.5$1.7 million for the 20102012 fiscal year by contributing $10.0 million prior to December 31, 2009.
Estimated benefit payments under the pension plan over the next ten years at December 31, 20092011 are as follows (in thousands):
| 2010 | $ | 1,264 | ||
| 2011 | 1,357 | |||
| 2012 | 1,465 | |||
| 2013 | 1,538 | |||
| 2014 | 1,657 | |||
| 2015 – 2019 | 10,886 |
| September 30, | ||||
2012 | $ | 1,553 | ||
2013 | 1,623 | |||
2014 | 1,733 | |||
2015 | 1,876 | |||
2016 | 2,101 | |||
2017 - 2021 | 12,782 |
Net periodic pension cost consists of the following components for the years ended December 31 (in thousands):
| 2009 | 2008 | 2007 | ||||||||||
| Service cost | $ | 1,689 | $ | 1,456 | $ | 1,498 | ||||||
| Interest cost on projected benefit obligation | 1,826 | 1,562 | 1,473 | |||||||||
| Expected return on plan assets | (1,848 | ) | (2,094 | ) | (1,907 | ) | ||||||
| Amortization of unrecognized loss | 728 | — | 31 | |||||||||
| Amortization of unrecognized prior service cost | 11 | 11 | 11 | |||||||||
| Net periodic pension cost | $ | 2,406 | $ | 935 | $ | 1,106 | ||||||
| September 30, | September 30, | September 30, | ||||||||||
| 2011 | 2010 | 2009 | ||||||||||
Service cost | $ | 1,756 | $ | 1,633 | $ | 1,689 | ||||||
Interest cost on projected benefit obligation | 2,027 | 1,933 | 1,826 | |||||||||
Expected return on plan assets | (2,653 | ) | (2,444 | ) | (1,848 | ) | ||||||
Amortization of unrecognized loss | 608 | 458 | 728 | |||||||||
Amortization of unrecognized prior service cost | 19 | 11 | 11 | |||||||||
|
|
|
|
|
| |||||||
Net periodic pension cost | $ | 1,757 | $ | 1,591 | $ | 2,406 | ||||||
|
|
|
|
|
| |||||||
102
FINANCIAL INSTITUTIONS, INC. AND SUBSIDIARIES
NOTES TO CONSOLIDATED FINANCIAL STATEMENTS
December 31, 2011, 2010 and 2009
(16.) EMPLOYEE BENEFIT PLANS (Continued)
The actuarial assumptions used to determine the net periodic pension cost were as follows:
| 2009 | 2008 | 2007 | ||||||||||
| Weighted average discount rate | 6.03 | % | 6.35 | % | 5.82 | % | ||||||
| Rate of compensation increase | 3.50 | % | 3.50 | % | 3.50 | % | ||||||
| Expected long-term rate of return | 7.50 | % | 7.50 | % | 7.50 | % | ||||||
| The actuarial assumptions used to determine the projected benefit obligation were as follows: | ||||||||||||
| 2009 | 2008 | 2007 | ||||||||||
| Weighted average discount rate | 5.89 | % | 6.03 | % | 6.35 | % | ||||||
| Rate of compensation increase | 3.50 | % | 3.50 | % | 3.50 | % | ||||||
| September 30, | September 30, | September 30, | ||||||||||
| 2011 | 2010 | 2009 | ||||||||||
Weighted average discount rate | 5.38 | % | 5.89 | % | 6.03 | % | ||||||
Rate of compensation increase | 3.00 | % | 3.50 | % | 3.50 | % | ||||||
Expected long-term rate of return | 7.00 | % | 7.50 | % | 7.50 | % | ||||||
The actuarial assumptions used to determine the projected benefit obligation were as follows:
| September 30, | September 30, | September 30, | ||||||||||
| 2011 | 2010 | 2009 | ||||||||||
Weighted average discount rate | 4.27 | % | 5.38 | % | 5.89 | % | ||||||
Rate of compensation increase | 3.00 | % | 3.00 | % | 3.50 | % | ||||||
The weighted average discount rate was based upon the projected benefit cash flows and the market yields of high grade corporate bonds that are available to pay such cash flows.
- 94 -
Equity securities | Dividend discount model, the smoothed earnings yield model and the equity risk premium model | ||
Fixed income securities | Current yield-to-maturity and forecasts of future yields | ||
Other financial instruments | Comparison of the specific investment’s risk to that of fixed income and equity instruments and using judgment | ||
The long term rate of return considers historical returns. Adjustments were made to historical returns in order to reflect expectations of future returns. These adjustments were due to factor forecasts by economists and long-term U.S. Treasury yields to forecast long-term inflation. In addition forecasts by economists and others for long-term GDP growth were factored into the development of assumptions for earnings growth and per capital income. The Plan’s overall investment strategy is to achieve a mix of approximately 97% of investments for long-term growth and 3% for near-term benefit payments with a wide diversification of asset types, fund strategies, and fund managers. The target allocations for Plan assets are shown in the table below. Cash equivalents consist primarily of short term investment funds. Equity securities primarily include investments in common stock and depository receipts. Fixed income securities include corporate bonds, government issues and mortgage backed securities. Other financial instruments primarily include rights and warrants.
103
FINANCIAL INSTITUTIONS, INC. AND SUBSIDIARIES
NOTES TO CONSOLIDATED FINANCIAL STATEMENTS
December 31, 2011, 2010 and 2009
(16.) EMPLOYEE BENEFIT PLANS (Continued)
Effective March 2009,September 2011, the Plan revised its investment guidelines. The Plan currently prohibits its investment managers from purchasing any security greater than 5% of the portfolio at the time of purchase or greater than 8% at market value in any one issuer. In addition, the following investments;
Equity securities | Short sales Unregistered securities Margin purchases | ||
Fixed income securities | |||
Mortgage backed derivatives that have an inverse floating rate Any ABS that is not issued by the U.S. Government Generally securities of less than Baa2/BBB quality may not be purchased Securities of less than A-quality may not in the aggregate exceed 10% of the investment manager’s portfolio | |||
Other financial instruments | Unhedged currency exposure in countries not defined as “high income economies” by the World Bank | ||
Prior to September 2011 investments in emerging countries as defined by the Morgan Stanley Emerging Markets Index and structured notes were prohibited.
All other investments not prohibited by the Plan are permitted. At December 31, 20092011, the Plan holds certain investments which are no longer deemed acceptable to acquire. These positions will be liquidated when the investment managers deem that such liquidation is in the best interest of the Plan.
| Weighted | ||||||||||||||||
| Average | ||||||||||||||||
| Target | Percentage of Plan Assets | Expected | ||||||||||||||
| Allocation | at December 31, | Long-term | ||||||||||||||
| 2010 | 2009 | 2008 | Rate of Return | |||||||||||||
| Asset category: | ||||||||||||||||
| Cash equivalents | 0 – 20 | % | 13.6 | % | 10.0 | % | — | |||||||||
| Equity securities | 40 – 60 | 45.9 | 48.0 | 4.60 | % | |||||||||||
| Fixed income securities | 40 – 60 | 40.5 | 41.4 | 2.10 | ||||||||||||
| Other financial instruments | 0 – 5 | — | 0.6 | — | ||||||||||||
| September 30, | September 30, | September 30, | September 30, | |||||||||||||
2012 Target | Percentage of Plan Assets at December 31, | Weighted Average Expected Long-term | ||||||||||||||
| Allocation | 2011 | 2010 | Rate of Return | |||||||||||||
Asset category: | ||||||||||||||||
Cash equivalents | 0 – 20 | % | 10.6 | % | 11.2 | % | 0.39 | % | ||||||||
Equity securities | 40 – 60 | 47.9 | 48.2 | 4.62 | ||||||||||||
Fixed income securities | 40 – 60 | 41.5 | 40.6 | 1.85 | ||||||||||||
Other financial instruments | 0 – 5 | — | — | — | ||||||||||||
- 95 -
NOTES TO CONSOLIDATED FINANCIAL STATEMENTS
December 31, 2009, 20082011, 2010 and 2007
(16.) EMPLOYEE BENEFIT PLANS (Continued)
Assets are segregated by the following table (rounded tolevel of the nearest thousands) representsvaluation inputs within the Plan’s fair value hierarchy for its financialestablished by ASC Topic 820 utilized to measure fair value (see Note 17—Fair Value Measurements). There were no assets (investments)classified as Level 3 assets during the years ended December 31, 2011 and 2010. The major categories of Plan assets measured at fair value on a recurring basis as of are presented in the following table (in thousands).
| September 30, | September 30, | September 30, | September 30, | |||||||||||||
| Level 1 | Level 2 | Level 3 | Total | |||||||||||||
| Inputs | Inputs | Inputs | Fair Value | |||||||||||||
December 31, 2011: | ||||||||||||||||
Cash equivalents: | ||||||||||||||||
Foreign currencies | $ | 81 | $ | — | $ | — | $ | 81 | ||||||||
Short term investment funds | — | 4,901 | — | 4,901 | ||||||||||||
|
|
|
|
|
|
|
| |||||||||
Total cash equivalents | 81 | 4,901 | — | 4,982 | ||||||||||||
Equity securities: | ||||||||||||||||
U.S. Large Cap | 13,993 | — | — | 13,993 | ||||||||||||
U.S. Mid Cap | 1,903 | — | — | 1,903 | ||||||||||||
U.S. Small Cap | 44 | — | — | 44 | ||||||||||||
International | 6,553 | — | — | 6,553 | ||||||||||||
|
|
|
|
|
|
|
| |||||||||
Total equity securities | 22,493 | — | — | 22,493 | ||||||||||||
Fixed income securities: | ||||||||||||||||
Corporate bonds: | ||||||||||||||||
Rated single A or higher by S&P | — | 1,949 | — | 1,949 | ||||||||||||
Rated below single A by S&P | — | 2,281 | — | 2,281 | ||||||||||||
Government issues | — | 10,651 | — | 10,651 | ||||||||||||
Collateralized mortgage obligations: | ||||||||||||||||
Rated single A or higher by S&P | — | 4,233 | — | 4,233 | ||||||||||||
Rated below single A by S&P | — | 354 | — | 354 | ||||||||||||
|
|
|
|
|
|
|
| |||||||||
Total fixed income securities | — | 19,468 | — | 19,468 | ||||||||||||
|
|
|
|
|
|
|
| |||||||||
Total Plan investments | $ | 22,574 | $ | 24,369 | $ | — | $ | 46,943 | ||||||||
|
|
|
|
|
|
|
| |||||||||
December 31, 2010: | ||||||||||||||||
Cash equivalents: | ||||||||||||||||
Foreign currencies | $ | 84 | $ | — | $ | — | $ | 84 | ||||||||
Short term investment funds | — | 4,266 | — | 4,266 | ||||||||||||
|
|
|
|
|
|
|
| |||||||||
Total cash equivalents | 84 | 4,266 | — | 4,350 | ||||||||||||
Equity securities: | ||||||||||||||||
U.S. Large Cap | 10,800 | — | — | 10,800 | ||||||||||||
U.S. Mid Cap | 1,103 | — | — | 1,103 | ||||||||||||
U.S. Small Cap | 82 | — | — | 82 | ||||||||||||
International | 6,698 | — | — | 6,698 | ||||||||||||
|
|
|
|
|
|
|
| |||||||||
Total equity securities | 18,683 | — | — | 18,683 | ||||||||||||
Fixed income securities: | ||||||||||||||||
Corporate bonds: | ||||||||||||||||
Rated single A or higher by S&P | — | 2,113 | — | 2,113 | ||||||||||||
Rated below single A by S&P | — | 1,483 | — | 1,483 | ||||||||||||
Government issues | — | 11,259 | — | 11,259 | ||||||||||||
Collateralized mortgage obligations: | ||||||||||||||||
Rated single A or higher by S&P | — | 582 | — | 582 | ||||||||||||
Rated below single A by S&P | — | 261 | — | 261 | ||||||||||||
|
|
|
|
|
|
|
| |||||||||
Total fixed income securities | — | 15,698 | — | 15,698 | ||||||||||||
|
|
|
|
|
|
|
| |||||||||
Total Plan investments | $ | 18,767 | $ | 19,964 | $ | — | $ | 38,731 | ||||||||
|
|
|
|
|
|
|
| |||||||||
105
FINANCIAL INSTITUTIONS, INC. AND SUBSIDIARIES
NOTES TO CONSOLIDATED FINANCIAL STATEMENTS
December 31, 2011, 2010 and 2009 (in thousands):
| Level 1 | Level 2 | Level 3 | Total | |||||||||||||
| Inputs | Inputs | Inputs | Fair Value | |||||||||||||
| Cash equivalents: | ||||||||||||||||
| Short term investment funds | $ | — | $ | 4,197 | $ | — | $ | 4,197 | ||||||||
| Equity securities: | ||||||||||||||||
| Common stock | 15,016 | — | — | 15,016 | ||||||||||||
| Depository receipts | 210 | — | — | 210 | ||||||||||||
| Other equities | 166 | — | — | 166 | ||||||||||||
| Total equities | 15,392 | — | — | 15,392 | ||||||||||||
| Fixed income securities: | ||||||||||||||||
| Corporate bonds | — | 3,200 | — | 3,200 | ||||||||||||
| Government issues | — | 5,590 | — | 5,590 | ||||||||||||
| Collateralized mortgage obligations | — | 813 | — | 813 | ||||||||||||
| FHLMC | — | 1,359 | — | 1,359 | ||||||||||||
| FNMA | — | 2,094 | — | 2,094 | ||||||||||||
| GNMA I | — | 369 | — | 369 | ||||||||||||
| Other fixed income securities | — | 189 | — | 189 | ||||||||||||
| Total fixed income securities | — | 13,614 | — | 13,614 | ||||||||||||
| Total Plan investments | $ | 15,392 | $ | 17,811 | $ | — | $ | 33,203 | ||||||||
(16.) EMPLOYEE BENEFIT PLANS (Continued)
At December 31, 2011 the portfolio was managed by two investment firms, with control of Level 3 assets for which significant unobservable inputs were used to determine fair value (the portfolio split approximately 46% and 52% under the control of the investment managers with the remaining 2% under the direct control of the Plan. A portfolio concentration in thousands):
| Balance at beginning of year | $ | 132 | ||
| Change in unrealized appreciation (depreciation) | 54 | |||
| Realized loss | (58 | ) | ||
| Sale proceeds | (128 | ) | ||
| Balance at end of year | $ | — | ||
Postretirement Benefit Plan
An entity acquired by the Company provided health and dental care benefits to retired employees who met specified age and service requirements through a postretirement health and dental care plan in which both the acquired entity and the retirees shared the cost. The plan provided for substantially the same medical insurance coverage as for active employees until their death and was integrated with Medicare for those retirees aged 65 or older. In 2001, the plan’s eligibility requirements were amended to curtail eligible benefit payments to only retired employees and active participants who were fully vested under the Plan. In 2003, retirees under age 65 began contributing to health coverage at the same cost-sharing level as that of active employees. The retirees aged 65 or older were offered new Medicare supplemental plans as alternatives to the plan historically offered. The cost sharing of medical coverage was standardized throughout the group of retirees aged 65 or older. In addition, to be consistent with the administration of the Company’s dental plan for active employees, all retirees who continued dental coverage began paying the full monthly premium. The accrued liability included in other liabilities in the consolidated statements of financial condition related to this plan amounted to $155$122 thousand and $144$162 thousand as of December 31, 20092011 and 2008,2010, respectively. The postretirement expense for the plan that was included in salaries and employee benefits in the consolidated statements of operationsincome was not significant for the years ended December 31, 2009, 20082011, 2010 and 2007.2009. The plan is not funded.
- 96 -
| 2009 | 2008 | |||||||
Defined benefit plan: | ||||||||
| Net actuarial loss | $ | (9,056 | ) | $ | (12,579 | ) | ||
| Prior service cost | (143 | ) | (155 | ) | ||||
| (9,199 | ) | (12,734 | ) | |||||
Postretirement benefit plan: | ||||||||
| Net actuarial loss | (248 | ) | (238 | ) | ||||
| Prior service credit | 710 | 778 | ||||||
| 462 | 540 | |||||||
| Total recognized in accumulated other comprehensive loss | $ | (8,737 | ) | $ | (12,194 | ) | ||
| September 30, | September 30, | |||||||
| 2011 | 2010 | |||||||
Defined benefit plan: | ||||||||
Net actuarial loss | $ | (21,160 | ) | $ | (11,188 | ) | ||
Prior service cost | (113 | ) | (132 | ) | ||||
|
|
|
| |||||
| (21,273 | ) | (11,320 | ) | |||||
|
|
|
| |||||
Postretirement benefit plan: | ||||||||
Net actuarial loss | (210 | ) | (252 | ) | ||||
Prior service credit | 575 | 643 | ||||||
|
|
|
| |||||
| 365 | 391 | |||||||
|
|
|
| |||||
Total recognized in accumulated other comprehensive loss | $ | (20,908 | ) | $ | (10,929 | ) | ||
|
|
|
| |||||
Changes in plan assets and benefit obligations recognized in other comprehensive income (loss) on a pre-tax basis during the years ended December 31 are as follows (in thousands):
| 2009 | 2008 | |||||||
Defined benefit plan: | ||||||||
| Net actuarial gain (loss) | $ | 2,795 | $ | (14,097 | ) | |||
| Amortization of net loss | 728 | — | ||||||
| Amortization of prior service cost | 12 | 14 | ||||||
| 3,535 | (14,083 | ) | ||||||
Postretirement benefit plan: | ||||||||
| Net actuarial gain (loss) | (10 | ) | 70 | |||||
| Amortization of prior service credit | (68 | ) | (85 | ) | ||||
| (78 | ) | (15 | ) | |||||
| Total recognized in other comprehensive income (loss) | $ | 3,457 | $ | (14,098 | ) | |||
| September 30, | September 30, | |||||||
| 2011 | 2010 | |||||||
Defined benefit plan: | ||||||||
Net actuarial loss | $ | (10,580 | ) | $ | (2,590 | ) | ||
Amortization of net loss | 608 | 458 | ||||||
Amortization of prior service cost | 19 | 11 | ||||||
|
|
|
| |||||
| (9,953 | ) | (2,121 | ) | |||||
|
|
|
| |||||
Postretirement benefit plan: | ||||||||
Net actuarial gain (loss) | 42 | (4 | ) | |||||
Amortization of prior service credit | (68 | ) | (67 | ) | ||||
|
|
|
| |||||
| (26 | ) | (71 | ) | |||||
|
|
|
| |||||
Total recognized in other comprehensive income (loss) | $ | (9,979 | ) | $ | (2,192 | ) | ||
|
|
|
| |||||
For the year ending December 31, 2010,2012, the estimated net loss and prior service cost for the plan that will be amortized from accumulated other comprehensive income into net periodic benefit cost is $458$1.4 million and $20 thousand, respectively.
106
FINANCIAL INSTITUTIONS, INC. AND SUBSIDIARIES
NOTES TO CONSOLIDATED FINANCIAL STATEMENTS
December 31, 2011, 2010 and $12 thousand, respectively.
(16.) EMPLOYEE BENEFIT PLANS (Continued)
Defined Contribution Plan
Employees that meet certain age and service requirements are eligible to participate in the Company sponsored 401(k) plan. Under the plan, participants may make contributions, in the form of salary deferrals, up to the maximum Internal Revenue Code limit. The Company matches a participant’s contributions up to 4.5% of compensation, calculated as 100% of the first 3% of compensation and 50% of the next 3% of compensation deferred by the participant. The Company may also make additional discretionary matching contributions, although no such additional discretionary contributions were made in 2009, 20082011, 2010 or 2007.2009. The expense included in salaries and employee benefits in the consolidated statements of operationsincome for this plan amounted to $1.0 million, $936 thousand and $914 thousand $993 thousandin 2011, 2010 and $869 thousand in 2009, 2008 and 2007, respectively.
Supplemental Executive Retirement Plans
The Company has accrued a liability, all of which is unfunded, of $957 thousand as ofnon-qualified Supplemental Executive Retirement Plan (“SERP”) covering three former executives. At December 31, 2009. The Company recorded2011, there was a $1.0 million unfunded pension liability related to the SERP. SERP expense ofwas $67 thousand, $262 thousand, and $648 thousand for 2011, 2010 and $309 thousand in connection with these SERPs during the years ended December 31, 2009, and 2008, respectively. There were no amounts recorded for these SERPs prior to 2008.
| (17.) | FAIR VALUE MEASUREMENTS |
- 97 -
Valuation Hierarchy
The fair value of an asset or liability is the price that would be received to sell that asset or paid to transfer that liability in an orderly transaction occurring in the principal market (or most advantageous market in the absence of a principal market) for such asset or liability. ASC Topic 820, “Fair Value Measurements and Disclosures,” establishes a fair value hierarchy for valuation inputs that gives the highest priority to quoted prices in active markets for identical assets or liabilities and the lowest priority to unobservable inputs. The fair value hierarchy is as follows:
Level 1—Unadjusted quoted prices in active markets for identical assets or liabilities that the reporting entity has the ability to access at the measurement date.
Level 2—Inputs other than quoted prices included in Level 1 that are observable for the asset or liability, either directly or indirectly. These might include quoted prices for similar assets or liabilities in active markets, quoted prices for identical or similar assets or liabilities in markets that are not active, inputs other than quoted prices that are observable for the asset or liability (such as interest rates, volatilities, prepayment speeds, credit risks, etc.) or inputs that are derived principally from or corroborated by market data by correlation or other means.
Level 3—Unobservable inputs for determining the fair values of assets or liabilities that reflect an entity’s own assumptions about the assumptions that market participants would use in pricing the assets or liabilities.
In general, fair value is based upon quoted market prices, where available. If such quoted market prices are not available, fair value is based upon internally developed models that primarily use, as inputs, observable market-based parameters. Valuation adjustments may be made to ensure that financial instruments are recorded at fair value. These adjustments may include amounts to reflect counterparty credit quality and the company’s creditworthiness, among other things, as well as unobservable parameters. Any such valuation adjustments are applied consistently over time. The Company’s valuation methodologies may produce a fair value calculation that may not be indicative of net realizable value or reflective of future fair values. While management believes the Company’s valuation methodologies are appropriate and consistent with other market participants, the use of different methodologies or assumptions to determine the fair value of certain financial instruments could result in a different estimate of fair value at the reporting date. Furthermore, the reported fair value amounts have not been comprehensively revalued since the presentation dates, and therefore, estimates of fair value after the balance sheet date may differ significantly from the amounts presented herein. A more detailed description of the valuation methodologies used for assets and liabilities measured at fair value, as well as the general classification of such instruments pursuant to the valuation hierarchy, is set forth below.
107
FINANCIAL INSTITUTIONS, INC. AND SUBSIDIARIES
NOTES TO CONSOLIDATED FINANCIAL STATEMENTS
December 31, 2011, 2010 and 2009
(17.) FAIR VALUE MEASUREMENTS (Continued)
Investment Securities.Publicly traded equity securities (stocks) are reported at fair value utilizing Level 1 inputs. available for sale:Pooled trust preferred securities are reported at fair value utilizing Level 3 inputs. Fair values for these securities are determined through the use of internal valuation methodologies appropriate for the specific asset, which may include the use of a discounted expected cash flow analysis or the use of broker quotes. Other securities classified as available for sale are reported at fair value utilizing Level 2 inputs. For these securities, the Company obtains fair value measurements from an independent pricing service. The fair value measurements consider observable data that may include dealer quotes, market spreads, cash flows, the U.S. Treasury yield curve, live trading levels, trade execution data, market consensus prepayment speeds, credit information and the bond’s terms and conditions, among other things.
- 98 -
Collateral dependent impaired loans: The fair value of impaired loans with specific allocations of the allowance for loan losses is generally based on recent real estate appraisals. These appraisals may utilize a single valuation approach or a combination of approaches including comparable sales and the income approach. Adjustments are routinely made in the appraisal process by the appraisers to adjust for differences between the comparable sales and income data available. Such adjustments are typically significant and result in a Level 3 classification of the inputs for determining fair value.
Other real estate owned (Foreclosed assets): Nonrecurring adjustments to certain commercial and residential real estate properties classified as other real estate owned are measured at the lower of carrying amount or fair value, less costs to sell. Fair values are generally based on third party appraisals of the property, resulting in a Level 3 classification. In cases where the carrying amount exceeds the fair value, less costs to sell, an impairment loss is recognized.
Assets Measured at Fair Value on a Recurring Basis
The following table presents for each of the fair-value hierarchy levels the Company’s assets that are measured and recorded at fair value on a recurring and non-recurring basis as of December 31, 20092011 (in thousands).
| September 30, | September 30, | September 30, | September 30, | |||||||||||||
| Level 1 | Level 2 | Level 3 | Total | |||||||||||||
| Inputs | Inputs | Inputs | Fair Value | |||||||||||||
Measured on a recurring basis: | ||||||||||||||||
Securities available for sale: | ||||||||||||||||
U.S. Government agencies and government sponsored enterprises | $ | — | $ | 97,712 | $ | — | $ | 97,712 | ||||||||
State and political subdivisions | — | 124,424 | — | 124,424 | ||||||||||||
Mortgage-backed securities | — | 403,685 | — | 403,685 | ||||||||||||
Asset-backed securities: | ||||||||||||||||
Trust preferred securities | — | — | 1,636 | 1,636 | ||||||||||||
Other | — | 61 | — | 61 | ||||||||||||
|
|
|
|
|
|
|
| |||||||||
| $ | — | $ | 625,882 | $ | 1,636 | $ | 627,518 | |||||||||
|
|
|
|
|
|
|
| |||||||||
Measured on a nonrecurring basis: | ||||||||||||||||
Loans: | ||||||||||||||||
Loans held for sale | $ | — | $ | 2,410 | $ | — | $ | 2,410 | ||||||||
Collateral dependent impaired loans | — | — | 2,160 | 2,160 | ||||||||||||
Other assets: | ||||||||||||||||
Mortgage servicing rights | — | — | 1,973 | 1,973 | ||||||||||||
Other real estate owned | — | — | 475 | 475 | ||||||||||||
|
|
|
|
|
|
|
| |||||||||
| $ | — | $ | 2,410 | $ | 4,608 | $ | 7,018 | |||||||||
|
|
|
|
|
|
|
| |||||||||
108
FINANCIAL INSTITUTIONS, INC. AND SUBSIDIARIES
NOTES TO CONSOLIDATED FINANCIAL STATEMENTS
December 31, 2011, 2010 and 20082009
(17.) FAIR VALUE MEASUREMENTS (Continued)
The following table presents for each of the fair-value hierarchy levels the Company’s assets that are measured at fair value on a recurring and non-recurring basis as of December 31, 2010 (in thousands).
| September 30, | September 30, | September 30, | September 30, | |||||||||||||
| Level 1 | Level 2 | Level 3 | Total | |||||||||||||
| Inputs | Inputs | Inputs | Fair Value | |||||||||||||
Measured on a recurring basis: | ||||||||||||||||
Securities available for sale: | ||||||||||||||||
U.S. Government agencies and government sponsored enterprises | $ | — | $ | 140,784 | $ | — | $ | 140,784 | ||||||||
State and political subdivisions | — | 105,666 | — | 105,666 | ||||||||||||
Mortgage-backed securities | — | 419,281 | — | 419,281 | ||||||||||||
Asset-backed securities: | ||||||||||||||||
Trust preferred securities | — | — | 572 | 572 | ||||||||||||
Other | — | 65 | — | 65 | ||||||||||||
|
|
|
|
|
|
|
| |||||||||
| $ | — | $ | 665,796 | $ | 572 | $ | 666,368 | |||||||||
|
|
|
|
|
|
|
| |||||||||
Measured on a nonrecurring basis: | ||||||||||||||||
Loans: | ||||||||||||||||
Loans held for sale | $ | — | $ | 3,138 | $ | — | $ | 3,138 | ||||||||
Collateral dependent impaired loans | — | — | 2,457 | 2,457 | ||||||||||||
Other assets: | ||||||||||||||||
Mortgage servicing rights | — | — | 1,467 | 1,467 | ||||||||||||
Other real estate owned | — | — | 741 | 741 | ||||||||||||
|
|
|
|
|
|
|
| |||||||||
| $ | — | $ | 3,138 | $ | 4,665 | $ | 7,803 | |||||||||
|
|
|
|
|
|
|
| |||||||||
There were as follows no liabilities measured at fair value on a recurring or nonrecurring basis during the years ended December 31, 2011 and 2010.
(in thousands):
| Level 1 | Level 2 | Level 3 | Total | |||||||||||||
| Inputs | Inputs | Inputs | Fair Value | |||||||||||||
December 31, 2009: | ||||||||||||||||
| Securities available for sale: | ||||||||||||||||
| U.S. Government agencies and government sponsored enterprises | $ | — | $ | 134,105 | $ | — | $ | 134,105 | ||||||||
| State and political subdivisions | — | 83,659 | — | 83,659 | ||||||||||||
| Mortgage-backed securities | — | 361,515 | — | 361,515 | ||||||||||||
| Asset-backed securities: | ||||||||||||||||
| Trust preferred securities | — | — | 1,015 | 1,015 | ||||||||||||
| Other | — | 207 | — | 207 | ||||||||||||
| $ | — | $ | 579,486 | $ | 1,015 | $ | 580,501 | |||||||||
December 31, 2008: | ||||||||||||||||
| Securities available for sale: | ||||||||||||||||
| U.S. Government agencies and government sponsored enterprises | $ | — | $ | 68,173 | $ | — | $ | 68,173 | ||||||||
| State and political subdivisions | — | 131,711 | — | 131,711 | ||||||||||||
| Mortgage-backed securities | — | 342,552 | — | 342,552 | ||||||||||||
| Asset-backed securities: | ||||||||||||||||
| Trust preferred securities | — | — | 3,772 | 3,772 | ||||||||||||
| Other | — | 146 | — | 146 | ||||||||||||
| Equity securities | 624 | 528 | — | 1,152 | ||||||||||||
| $ | 624 | $ | 543,110 | $ | 3,772 | $ | 547,506 | |||||||||
The reconciliation for all assets measured at fair value on a recurring basis using significant unobservable inputs (Level 3) for the years ended December 31 2009 and 2008, is as follows (in thousands):
| 2009 | 2008 | |||||||
| Securities available for sale (Level 3), beginning of year | $ | 3,772 | $ | — | ||||
| Transfers into Level 3 | — | 33,307 | ||||||
| Capitalized interest | 296 | — | ||||||
| Principal paydowns and amortization of premiums | (9 | ) | (106 | ) | ||||
| Coupon payments applied to principal | (273 | ) | — | |||||
| Total losses (realized/unrealized): | ||||||||
| Included in earnings | (2,263 | ) | (29,429 | ) | ||||
| Included in other comprehensive income | (508 | ) | — | |||||
| Securities available for sale (Level 3), end of year | $ | 1,015 | $ | 3,772 | ||||
| September 30, | September 30, | |||||||
| 2011 | 2010 | |||||||
Securities available for sale (Level 3), beginning of year | $ | 572 | $ | 1,015 | ||||
Transfers into Level 3 | — | — | ||||||
Sales | (2,478 | ) | — | |||||
Principal paydowns and other | (53 | ) | 263 | |||||
Total gains (losses) realized/unrealized: | ||||||||
Included in earnings | 2,263 | (526 | ) | |||||
Included in other comprehensive income | 1,332 | (180 | ) | |||||
|
|
|
| |||||
Securities available for sale (Level 3), end of year | $ | 1,636 | $ | 572 | ||||
|
|
|
| |||||
- 99 -
NOTES TO CONSOLIDATED FINANCIAL STATEMENTS
December 31, 2009, 20082011, 2010 and 2007
(17.) FAIR VALUE MEASUREMENTS (Continued)
Fair Value of Financial Instruments
The Fair Value of Financial Instruments Subsection of the ASC requires disclosure of the fair value of financial assets and financial liabilities, including those financial assets and financial liabilities that are not measured and reported at fair value on a recurring basis or non-recurring basis.
The following discussion describes the valuation methodologies used for assets and liabilities measured or disclosed at fair value. The techniques utilized in estimating the fair values of financial instruments are reliant on the assumptions used, including discount rates and estimates of the amount and timing of future cash flows. Care should be exercised in deriving conclusions about our business, its value or financial position based on the fair value information of financial instruments presented below.
Fair value estimates are made at a specific point in time, based on available market information and judgments about the financial instrument, including estimates of timing, amount of expected future cash flows and the credit standing of the issuer. Such estimates do not consider the tax impact of the realization of unrealized gains or losses. In some cases, the fair value estimates cannot be substantiated by comparison to independent markets. In addition, the disclosed fair value may not be realized in the immediate settlement of the financial instrument.
- 100 -
Loans held for sale.The fair value is based on estimates, quoted market prices and investor commitments.
Loans.For variable rate loans that re-price frequently, fair value approximates carrying amount. The fair value for fixed rate loans is estimated through discounted cash flow analysis using interest rates currently being offered on loans with similar terms and credit quality. For criticized and classified loans, fair value is estimated by discounting expected cash flows at a rate commensurate with the risk associated with the estimated cash flows, or estimates of fair value discounts based on observable market information.
Deposits.The fair values for demand accounts, money market and savings deposits are equal to their carrying amounts. The fair values of certificates of deposit are estimated using a discounted cash flow approach that applies prevailing market interest rates for similar maturity instruments.
Long-term borrowings (excluding junior subordinated debentures).The fair value for long-term borrowings is estimated using a discounted cash flow approach that applies prevailing market interest rates for similar maturity instruments.
Junior subordinated debentures.The fair value for the junior subordinated debentures is estimated using a discounted cash flow approach that applies prevailing market interest rates for similar maturity instruments.
The fair value of a financial instrument is the current amount that would be exchanged between willing parties, other than in a forced liquidation. Fair value is best determined based upon quoted market prices. However, in many instances, there are no quoted market prices for the Company’s various financial instruments. In cases where quoted market prices are not available, fair values are based on estimates using present value or other valuation techniques. Those techniques are significantly affected by the assumptions used, including the discount rate and estimates of future cash flows. Accordingly, the fair value estimates may not be realized in an immediate settlement of the instrument. The accounting guidelines exclude certain financial instruments and all non-financial instruments from its disclosure requirements. Accordingly, the aggregate fair value amounts presented at December 31, 20092011 and December 31, 20082010 may not necessarily represent the underlying fair value of the Company.
110
FINANCIAL INSTITUTIONS, INC. AND SUBSIDIARIES
NOTES TO CONSOLIDATED FINANCIAL STATEMENTS
December 31, 2011, 2010 and 2009
(17.) FAIR VALUE MEASUREMENTS (Continued)
The carrying values and fair values of financial instruments atas of December 31 2009 and 2008 are as follows (in thousands):
| December 31, 2009 | December 31, 2008 | |||||||||||||||
| Estimated | Estimated | |||||||||||||||
| Carrying | Fair | Carrying | Fair | |||||||||||||
| Amount | Value | Amount | Value | |||||||||||||
Financial assets: | ||||||||||||||||
| Cash and cash equivalents | $ | 42,959 | $ | 42,959 | $ | 55,187 | $ | 55,187 | ||||||||
| Securities available for sale | 580,501 | 580,501 | 547,506 | 547,506 | ||||||||||||
| Securities held to maturity | 39,573 | 40,629 | 58,532 | 59,147 | ||||||||||||
| Loans held for sale | 421 | 421 | 1,013 | 1,032 | ||||||||||||
| Loans | 1,243,265 | 1,290,136 | 1,102,330 | 1,169,660 | ||||||||||||
| Company owned life insurance | 24,867 | 24,867 | 23,692 | 23,692 | ||||||||||||
| Accrued interest receivable | 7,386 | 7,386 | 7,556 | 7,556 | ||||||||||||
| FHLB and FRB stock | 7,185 | 7,185 | 6,035 | 6,035 | ||||||||||||
Financial liabilities: | ||||||||||||||||
| Demand, savings and money market deposits | 1,056,604 | 1,056,604 | 985,796 | 985,796 | ||||||||||||
| Certificate of deposit | 686,351 | 692,429 | 647,467 | 654,334 | ||||||||||||
| Short-term borrowings | 59,543 | 59,543 | 23,465 | 23,465 | ||||||||||||
| Long-term borrowings (excluding junior subordinated debentures) | 30,145 | 30,886 | 30,653 | 32,005 | ||||||||||||
| Junior subordinated debentures | 16,702 | 10,741 | 16,702 | 12,232 | ||||||||||||
| Accrued interest payable | 7,576 | 7,576 | 7,041 | 7,041 | ||||||||||||
| September 30, | September 30, | September 30, | September 30, | |||||||||||||
| December 31, 2011 | December 31, 2010 | |||||||||||||||
| Estimated | Estimated | |||||||||||||||
| Carrying | Fair | Carrying | Fair | |||||||||||||
| Amount | Value | Amount | Value | |||||||||||||
Financial assets: | ||||||||||||||||
Cash and cash equivalents | $ | 57,583 | $ | 57,583 | $ | 39,058 | $ | 39,058 | ||||||||
Securities available for sale | 627,518 | 627,518 | 666,368 | 666,368 | ||||||||||||
Securities held to maturity | 23,297 | 23,964 | 28,162 | 28,849 | ||||||||||||
Loans held for sale | 2,410 | 2,442 | 3,138 | 3,138 | ||||||||||||
Loans | 1,461,516 | 1,493,159 | 1,325,524 | 1,388,787 | ||||||||||||
Accrued interest receivable | 7,655 | 7,655 | 7,613 | 7,613 | ||||||||||||
FHLB and FRB stock | 10,674 | 10,674 | 6,353 | 6,353 | ||||||||||||
Financial liabilities: | ||||||||||||||||
Demand, savings and money market deposits | 1,230,923 | 1,230,923 | 1,143,136 | 1,143,136 | ||||||||||||
Certificate of deposit | 700,676 | 702,720 | 739,754 | 740,440 | ||||||||||||
Short-term borrowings | 150,698 | 150,698 | 77,110 | 77,110 | ||||||||||||
Long-term borrowings (excluding junior subordinated debentures) | — | — | 10,065 | 10,244 | ||||||||||||
Junior subordinated debentures | — | — | 16,702 | 10,564 | ||||||||||||
Accrued interest payable | 5,207 | 5,207 | 7,620 | 7,620 | ||||||||||||
- 101 -
Condensed financial statements of condition ofpertaining only to the Parent asare presented below (in thousands).
Condensed Statements of December 31, 2009 and 2008 and the related condensed statements of operations and cash flows for 2009, 2008 and 2007 should be read in conjunction with consolidated financial statements and related notes (in thousands):
| Condensed Statements of Condition | 2009 | 2008 | ||||||
| Assets: | ||||||||
| Cash and due from subsidiaries | $ | 7,727 | $ | 27,163 | ||||
| Securities available for sale, at fair value | — | 624 | ||||||
| Investment in and receivables due from subsidiaries | 203,986 | 176,780 | ||||||
| Other assets | 5,698 | 4,885 | ||||||
| Total assets | $ | 217,411 | $ | 209,452 | ||||
| Liabilities and shareholders’ equity: | ||||||||
| Junior subordinated debentures | $ | 16,702 | $ | 16,702 | ||||
| Other liabilities | 2,415 | 2,450 | ||||||
| Shareholders’ equity | 198,294 | 190,300 | ||||||
| Total liabilities and shareholders’ equity | $ | 217,411 | $ | 209,452 | ||||
| Condensed Statements of Operations | 2009 | 2008 | 2007 | |||||||||
| Dividends from subsidiaries and associated companies | $ | 5,051 | $ | 11,251 | $ | 14,151 | ||||||
| Management and service fees from subsidiaries | 603 | 418 | 631 | |||||||||
| Other income | 182 | 74 | 94 | |||||||||
| Total income | 5,836 | 11,743 | 14,876 | |||||||||
| Operating expenses | 4,436 | 4,363 | 4,684 | |||||||||
| Income before income tax benefit and equity in undistributed earnings (distributions in excess of earnings) of subsidiaries | 1,400 | 7,380 | 10,192 | |||||||||
| Income tax benefit | 1,286 | 1,499 | 1,491 | |||||||||
| Income before equity in undistributed earnings (distributions in excess of earnings) of subsidiaries | 2,686 | 8,879 | 11,683 | |||||||||
| Equity in undistributed earnings (distributions in excess of earnings) of subsidiaries | 11,755 | (35,037 | ) | 4,726 | ||||||||
| Net income (loss) | $ | 14,441 | $ | (26,158 | ) | $ | 16,409 | |||||
| September 30, | September 30, | |||||||
| December 31, | ||||||||
| 2011 | 2010 | |||||||
Assets: | ||||||||
Cash and due from subsidiary | $ | 11,621 | $ | 23,894 | ||||
Investment in and receivables due from subsidiary | 223,577 | 202,754 | ||||||
Other assets | 4,337 | 4,623 | ||||||
|
|
|
| |||||
Total assets | $ | 239,535 | $ | 231,271 | ||||
|
|
|
| |||||
Liabilities and shareholders’ equity: | ||||||||
Junior subordinated debentures | $ | — | $ | 16,702 | ||||
Other liabilities | 2,341 | 2,425 | ||||||
Shareholders’ equity | 237,194 | 212,144 | ||||||
|
|
|
| |||||
Total liabilities and shareholders’ equity | $ | 239,535 | $ | 231,271 | ||||
|
|
|
| |||||
- 102 -
NOTES TO CONSOLIDATED FINANCIAL STATEMENTS
December 31, 2009, 20082011, 2010 and 2007
| Condensed Statements of Cash Flows | 2009 | 2008 | 2007 | |||||||||
| Cash flows from operating activities: | ||||||||||||
| Net income (loss) | $ | 14,441 | $ | (26,158 | ) | $ | 16,409 | |||||
| Adjustments to reconcile net income (loss) to net cash provided by operating activities: | ||||||||||||
| (Equity in undistributed earnings) distributions in excess of earnings of subsidiaries | (11,755 | ) | 35,037 | (4,726 | ) | |||||||
| Depreciation and amortization | 318 | 427 | 521 | |||||||||
| Share-based compensation | 854 | 633 | 955 | |||||||||
| Decrease (increase) in other assets | 797 | (763 | ) | (242 | ) | |||||||
| (Decrease) increase in other liabilities | (230 | ) | (258 | ) | (2,421 | ) | ||||||
| Net cash provided by operating activities | 4,425 | 8,918 | 10,496 | |||||||||
| Cash flows from investing activities: | ||||||||||||
| Purchase of investment assets, net of disposals | (1,323 | ) | (99 | ) | 189 | |||||||
| Capital investment in subsidiary bank | (15,000 | ) | (20,000 | ) | — | |||||||
| Net cash (used in) provided by investing activities | (16,323 | ) | (20,099 | ) | 189 | |||||||
| Cash flows from financing activities: | ||||||||||||
| Purchase of preferred and common shares | — | (4,821 | ) | (7,245 | ) | |||||||
| Proceeds from issuance of preferred and common shares, net of issuance costs | (68 | ) | 35,602 | 105 | ||||||||
| Proceeds from issuance of common stock warrant | — | 2,025 | — | |||||||||
| Proceeds from stock options exercised | 15 | 32 | 251 | |||||||||
| Dividends paid | (7,485 | ) | (7,722 | ) | (6,199 | ) | ||||||
| Net cash (used in) provided by financing activities | (7,538 | ) | 25,116 | (13,088 | ) | |||||||
| Net (decrease) increase in cash and cash equivalents | (19,436 | ) | 13,935 | (2,403 | ) | |||||||
| Cash and cash equivalents as of beginning of year | 27,163 | 13,228 | 15,631 | |||||||||
| Cash and cash equivalents as of end of the year | $ | 7,727 | $ | 27,163 | $ | 13,228 | ||||||
- 103 -(18.) PARENT COMPANY FINANCIAL INFORMATION (Continued)
Condensed Statements of Income
| September 30, | September 30, | September 30, | ||||||||||
| Years ended December 31, | ||||||||||||
| 2011 | 2010 | 2009 | ||||||||||
Dividends from subsidiary and associated companies | $ | 9,233 | $ | 23,151 | $ | 5,051 | ||||||
Management and service fees from subsidiary | 1,161 | 1,163 | 603 | |||||||||
Other income (loss) | 78 | (134 | ) | 182 | ||||||||
|
|
|
|
|
| |||||||
Total income | 10,472 | 24,180 | 5,836 | |||||||||
|
|
|
|
|
| |||||||
Operating expenses | 3,787 | 4,005 | 4,436 | |||||||||
Loss on extinguishment of debt | 1,083 | — | — | |||||||||
|
|
|
|
|
| |||||||
Total expenses | 4,870 | 4,005 | 4,436 | |||||||||
|
|
|
|
|
| |||||||
Income before income tax benefit and equity in undistributed earnings(excess distributions) of subsidiary | 5,602 | 20,175 | 1,400 | |||||||||
Income tax benefit | 1,539 | 1,323 | 1,286 | |||||||||
|
|
|
|
|
| |||||||
Income before equity in undistributed earnings (excess distributions) of subsidiary | 7,141 | 21,498 | 2,686 | |||||||||
Equity in undistributed earnings (excess distributions) of subsidiary | 15,658 | (211 | ) | 11,755 | ||||||||
|
|
|
|
|
| |||||||
Net income | $ | 22,799 | $ | 21,287 | $ | 14,441 | ||||||
|
|
|
|
|
| |||||||
Condensed Statements of Cash Flows
| September 30, | September 30, | September 30, | ||||||||||
| Years ended December 31, | ||||||||||||
| 2011 | 2010 | 2009 | ||||||||||
Cash flows from operating activities: | ||||||||||||
Net income | $ | 22,799 | $ | 21,287 | $ | 14,441 | ||||||
Adjustments to reconcile net income to net cash provided by operating activities: | ||||||||||||
Equity in (undistributed earnings) excess distributions of subsidiary | (15,658 | ) | 211 | (11,755 | ) | |||||||
Depreciation and amortization | 116 | 193 | 318 | |||||||||
Share-based compensation | 1,105 | 1,031 | 854 | |||||||||
Decrease in other assets | 771 | 980 | 797 | |||||||||
(Decrease) increase in other liabilities | (534 | ) | 8 | (230 | ) | |||||||
|
|
|
|
|
| |||||||
Net cash provided by operating activities | 8,599 | 23,710 | 4,425 | |||||||||
Cash flows from investing activities: | ||||||||||||
Purchase of investment assets, net of disposals | — | — | (1,323 | ) | ||||||||
Capital investment in subsidiary | — | — | (15,000 | ) | ||||||||
|
|
|
|
|
| |||||||
Net cash used in investing activities | — | — | (16,323 | ) | ||||||||
Cash flows from financing activities: | ||||||||||||
Redemption of junior subordinated debentures | (16,702 | ) | — | — | ||||||||
Proceeds from issuance of preferred and common shares, net of issuance costs | 43,127 | — | (68 | ) | ||||||||
Purchase of preferred and common shares | (37,764 | ) | (69 | ) | — | |||||||
Proceeds from issuance of common stock warrant | (2,080 | ) | — | — | ||||||||
Proceeds from stock options exercised | 91 | 216 | 15 | |||||||||
Dividends paid | (7,564 | ) | (7,690 | ) | (7,485 | ) | ||||||
Other | 20 | — | — | |||||||||
|
|
|
|
|
| |||||||
Net cash used in financing activities | (20,872 | ) | (7,543 | ) | (7,538 | ) | ||||||
|
|
|
|
|
| |||||||
Net (decrease) increase in cash and cash equivalents | (12,273 | ) | 16,167 | (19,436 | ) | |||||||
Cash and cash equivalents as of beginning of year | 23,894 | 7,727 | 27,163 | |||||||||
|
|
|
|
|
| |||||||
Cash and cash equivalents as of end of the year | $ | 11,621 | $ | 23,894 | $ | 7,727 | ||||||
|
|
|
|
|
| |||||||
112
FINANCIAL INSTITUTIONS, INC. AND SUBSIDIARIES
NOTES TO CONSOLIDATED FINANCIAL STATEMENTS
(19.) SUBSEQUENT EVENT (Unaudited)
On January 19, 2012, Five Star Bank entered into an agreement to acquire four retail banking branches currently owned by HSBC Bank USA, N.A. and four retail banking branches currently owned by First Niagara Bank, N.A. The deposits associated with these branches total approximately $376 million, while loans total approximately $94 million. The transactions are subject to customary closing conditions, including regulatory approvals, and are expected to close by the end of the third quarter of 2012.
113
| ITEM 9. | CHANGES IN AND DISAGREEMENTS WITH ACCOUNTANTS ON ACCOUNTING AND FINANCIAL DISCLOSURE |
None.
As of the end of the period covered by this report, the Company carried out an evaluation, under the supervision and with the participation of the Company’s management, including the Company’s Chief Executive Officer (Principal Executive Officer) and Chief Financial Officer (Principal Accounting Officer), of the effectiveness of the design and operation of the Company’s disclosure controls and procedures pursuant to Rule 13a-15(b), as adopted by the Securities and Exchange Commission (“SEC”) under the Securities Exchange Act of 1934 (“Exchange Act”). Based upon that evaluation, the Chief Executive Officer and Chief Financial Officer concluded that the Company’s disclosure controls and procedures were effective as of the end of the period covered by this annual report.
Disclosure controls and procedures are the controls and other procedures that are designed to ensure that information required to be disclosed in the reports that the Company files or submits under the Exchange Act is recorded, processed, summarized and reported within the time periods specified in the SEC’s rules and forms. Disclosure controls and procedures include, without limitation, controls and procedures designed to ensure that information required to be disclosed in the reports that the Company files or submits under the Exchange Act is accumulated and communicated to management, including the Chief Executive Officer and Chief Financial Officer, as appropriate, to allow timely decisions regarding required disclosure.
All internal control systems, no matter how well designed, have inherent limitations. Therefore, even those systems determined effective can provide only reasonable assurance with respect to financial statement preparation and presentation.
Management Report on Internal Control over Financial Reporting and Attestation Report of Independent Registered Public Accounting Firm
Management of Financial Institutions, Inc. (the Company) is responsible for establishing and maintaining adequate internal control over financial reporting. Management assessed the Company’s internal control over financial reporting based on criteria established in the Internal Control—Integrated Framework issued by the Committee of Sponsoring Organizations of the Treadway Commission (COSO). Based on this assessment, management has concluded that, as of December 31, 2009,2011, the Company maintained effective internal control over financial reporting. Management’s Report on Internal Control over Financial Reporting is included under Item 8 “Financial Statements and Supplementary Data” in Part II of this Form 10-K.
KPMG LLP, aan independent registered public accounting firm, has audited the consolidated financial statements included in the annual report,this Annual Report on Form 10-K, and has issued an attestation report on the effectiveness of the Company’s internal control over financial reporting. The Report of Independent Registered Public Accounting Firm that attests the effectiveness of internal control over financial reporting is included under Item 8 “Financial Statements and Supplementary Data” in Part II of this Form 10-K.
Changes in Internal Control over Financial Reporting
There were no changes in the Company’s internal control over financial reporting that occurred during the quarter ended December 31, 20092011 that have materially affected, or are reasonably likely to materially affect, the Company’s internal control over financial reporting.
- 104 -
| ITEM 10. | DIRECTORS, EXECUTIVE OFFICERS AND CORPORATE GOVERNANCE |
In response to this Item, the information set forth in the Company’s Proxy Statement for its 20102012 Annual Meeting of Shareholders (the “2010“2012 Proxy Statement”) to be filed within 120 days following the end of the Company’s fiscal year, under the headings “Election of Directors,” “Business Experience and Information with Respect to BoardQualification of Directors,” and “Section 16(a) Beneficial Ownership Reporting Compliance” is incorporated herein by reference.
The information under the heading “Executive Officers of the Registrant” in Part I, Item 1 of this Form 10-K is also incorporated herein by reference.
Information concerning the Company’s Audit Committee and the Audit Committee’s financial expert is set forth under the caption “Corporate Governance Information” in the 20102012 Proxy Statement and is incorporated herein by reference.
The Company has adopted a Code of Business Conduct and Ethics that applies to its principal executive officer, principal financial officer, principal accounting officer or controller, or persons performing similar functions. The Code of Business Conduct and Ethics is posted on the Company’s internet website at www.fiiwarsaw.com.www.fiiwarsaw.com under the Corporate Overview/Governance Documents tabs if the Investor Relations drop down menu. In addition, the Company will provide a copy of the Code of Business Conduct and Ethics to anyone, without charge, upon request addressed to Director of Human Resources at Financial Institutions, Inc., 220 Liberty Street, Warsaw, NY 14569. The Company intends to disclose any amendment to, or waiver from, a provision of its Code of Business Conduct and Ethics that applies to the Company’s principal executive officer, principal financial officer, principal accounting officer or controller, or persons performing similar functions, and that relates to any element of the Code of Business Conduct and Ethics, by posting such information on the Company’s website.
| ITEM 11. | EXECUTIVE COMPENSATION |
In response to this Item, the information set forth in the 20102012 Proxy Statement under the heading “Executive“Elements of Executive Compensation” is incorporated herein by reference.
| ITEM 12. | SECURITY OWNERSHIP OF CERTAIN BENEFICIAL OWNERS AND MANAGEMENT AND RELATED STOCKHOLDER MATTERS |
In response to this Item, the information set forth in the 20102012 Proxy Statement under the heading “Stock Ownership”“Beneficial Ownership of Common Stock” is incorporated herein by reference. The information under the heading “Equity Compensation Plan Information” in Part II, Item 5 of this Form 10-K is also incorporated herein by reference.
| ITEM 13. | CERTAIN RELATIONSHIPS AND RELATED TRANSACTIONS, AND DIRECTOR INDEPENDENCE |
In response to this Item, the information set forth in the 20102012 Proxy Statement under the headings “Certain Relationships and Related Party Transactions” and “Corporate Governance Information” is incorporated herein by reference.
| ITEM 14. | PRINCIPAL ACCOUNTANT FEES AND SERVICES |
In response to this Item, the information set forth in the 20102012 Proxy Statement under the headings “Audit Committee Report” and “Independent Auditors”Registered Public Accounting Firm” is incorporated herein by reference.
- 105 -
Reference is made to the Index to Consolidated Financial Statements of Financial Institutions, Inc. and Subsidiaries under Item 8 “Financial Statements and Supplementary Data” in Part II of this Form 10-K.
(b) | EXHIBITS |
The following is a list of all exhibits filed or incorporated by reference as part of this Report.
Exhibit | Description | Location | ||||||
| 3.1 | Amended and Restated Certificate of Incorporation of the Company | Incorporated by reference to | ||||||
| 3.2 | Amended and Restated Bylaws of the Company | Incorporated by reference to Exhibit 3.4 of the Form 10-K for the year ended December 31, 2008, dated March 12, 2009 | ||||||
| 4.1 | Warrant to Purchase Common Stock, dated December 23, 2008 issued by the Registrant to the United States Department of the Treasury | Incorporated by reference to Exhibit 4.2 of the Form 8-K, dated December | ||||||
| 10.1 | 1999 Management Stock Incentive Plan | Incorporated by reference to Exhibit 10.1 of the S-1 Registration Statement | ||||||
| 10.2 | Amendment Number One to the FII 1999 Management Stock Incentive Plan | Incorporated by reference to Exhibit | ||||||
| 10.3 | Form of Non-Qualified Stock Option Agreement Pursuant to the FII 1999 Management Stock Incentive Plan | Incorporated by reference to Exhibit 10.2 of the Form 8-K, dated July 28, 2006 | ||||||
| 10.4 | Form of Restricted Stock Award Agreement Pursuant to the FII 1999 Management Stock Incentive Plan | Incorporated by reference to Exhibit 10.3 of the Form 8-K, dated July 28, 2006 | ||||||
| 10.5 | Form of Restricted Stock Award Agreement Pursuant to the FII 1999 Management Stock Incentive Plan | Incorporated by reference to Exhibit 10.1 of the Form 8-K, dated January 23, 2008 | ||||||
| 10.6 | 1999 Directors Stock Incentive Plan | Incorporated by reference to Exhibit 10.2 of the S-1 Registration Statement | ||||||
| 10.7 | Amendment to the 1999 Director Stock Incentive Plan | Incorporated by reference to Exhibit 10.7 of the Form 10-K for the year ended December 31, 2008, dated March 12, 2009 | ||||||
| 10.8 | 2009 Management Stock Incentive Plan | Incorporated by reference to Exhibit 10.8 of the Form 10-Q for the quarterly period ended June 30, 2009, dated August 5, 2009 | ||||||
| 10.9 | 2009 Directors’ Stock Incentive Plan | Incorporated by reference to Exhibit 10.9 of the Form 10-Q for the quarterly period ended June 30, 2009, dated August 5, 2009 | ||||||
| 10.10 | Form of Restricted Stock Award Agreement Pursuant to the FII 2009 Management Stock Incentive Plan (Special, one-time Award) | Incorporated by reference to Exhibit 10.1 of the Form 8-K, dated January 19, 2010 | ||||||
| 10.11 | Form of Restricted Stock Award Agreement Pursuant to the FII 2009 Management Stock Incentive Plan | |||||||
| Incorporated by reference to Exhibit 10.2 of the Form 8-K, dated March 1, 2010 | ||||||||
| 10.12 | Form of “Service Based” Restricted Stock Award Agreement Pursuant to the FII 2009 Management Stock Incentive Plan | Filed Herewith | ||||||
116
Exhibit | Description | Location | ||
| 10.13 | Form of 2012 Performance Program Master Agreement | Filed Herewith | ||
| 10.14 | Form of 2012 Performance Program Award Certificate | Filed Herewith | ||
| 10.15 | Amended Stock Ownership Requirements, dated December 14, 2005 | Incorporated by reference to Exhibit 10.19 of the Form 10-K for the year ended December 31, 2005, dated March 15, 2006 | ||
- 106 -
| 10.16 | Executive Agreement with Peter G. Humphrey | Incorporated by reference to Exhibit 10.1 of the Form 8-K, dated June 30, 2005 | ||||||
| 10.17 | Executive Agreement with Martin K. Birmingham | Incorporated by reference to Exhibit 10.4 of the Form 8-K, dated June 30, 2005 | ||||||
| 10.18 | ||||||||
| Executive Agreement with John J. Witkowski | Incorporated by reference to Exhibit 10.7 of the Form 8-K, dated September 14, 2005 | |||||||
| 10.19 | Executive Agreement with George D. Hagi | Incorporated by reference to Exhibit 10.7 of the Form 8-K, dated February 2, 2006 | ||||||
| 10.20 | Voluntary Retirement Agreement with Ronald A. Miller | Incorporated by reference to Exhibit 10.2 of the Form 8-K, dated September | ||||||
| 10.21 | Amendment to Voluntary Retirement Agreement with Ronald A. Miller | Incorporated by reference to Exhibit 10.1 of the Form 8-K, dated March 3, 2010 | ||||||
| 10.22 | Letter Agreement, dated December 23, 2008, including the Securities Purchase Agreement-Standard Terms attached thereto, by and between the Company and the United States Department of the Treasury | Incorporated by reference to Exhibit 10.1 of the Form 8-K, dated December | ||||||
| 10.23 | Underwriting Agreement dated March 9, 2011 between Financial Institutions, Inc. and Keefe, Bruyette & Woods, Inc., as representative of the underwriters | Incorporated by reference to Exhibit 1.1 of the Form 8-K, dated March 9, 2011 | ||||||
| 10.24 | Assignment, Purchase and Assumption Agreement dated January 19, 2012 between First Niagara Bank, National Association and Five Star Bank | Filed Herewith | ||||||
| 10.25 | Purchase and Assumption Agreement dated January 19, 2012 between First Niagara Bank, National Association and Five Star Bank | Filed Herewith | ||||||
| 11.1 | Statement of Computation of Per Share Earnings | Incorporated by reference to Note 15 of the Registrant’s audited consolidated financial statements under Item 8 filed herewith. | ||||||
| 21 | Subsidiaries of Financial Institutions, Inc. | Filed Herewith | ||||||
| 23 | Consent of Independent Registered Public Accounting Firm | Filed Herewith | ||||||
| 31.1 | Certification pursuant to Section 302 of the Sarbanes-Oxley Act of 2002 | Filed Herewith | ||||||
| 31.2 | Certification pursuant to Section 302 of the Sarbanes-Oxley Act of 2002 | Filed Herewith | ||||||
| 32 | Certification pursuant to18 U.S.C. Section 1350, as adopted pursuant to Section 906 of the Sarbanes-Oxley Act of 2002 | Filed Herewith | ||||||
| 99.1 | Certification of Chief Executive Officer pursuant to Section 111(b)(4) of the Emergency Economic Stabilization Act | Filed Herewith | ||||||
| 99.2 | Certification of Chief Financial Officer pursuant to Section 111(b)(4) of the Emergency Economic Stabilization Act | Filed Herewith | ||||||
- 107 -
Exhibit | Description | Location | ||
| *101.INS | XBRL Instance Document | |||
| *101.SCH | XBRL Taxonomy Extension Schema Document | |||
| *101.CAL | XBRL Taxonomy Extension Calculation Linkbase Document | |||
| *101.LAB | XBRL Taxonomy Extension Label Linkbase Document | |||
| *101.PRE | XBRL Taxonomy Extension Presentation Linkbase Document | |||
| *101.DEF | XBRL Taxonomy Extension Definition Linkbase Document | |||
| * | Pursuant to Rule 406T of Regulation S-T, the information in this exhibit shall not be deemed to be “filed” for purposes of Section 18 of the Securities Exchange Act of 1934, or otherwise subject to the liability of that section, and shall not be incorporated by reference into any registration statement, prospectus or other document filed under the Securities Act of 1933, or the Securities Exchange Act of 1934, except as shall be expressly set forth by specific reference in such filings. |
Pursuant to the requirements of Section 13 or 15(d) of the Exchange Act, the registrant caused this report to be signed on its behalf by the undersigned, thereunto duly authorized.
| FINANCIAL INSTITUTIONS, INC. | ||||||
March 9, 2012 | ||||||
By: | /s/ Peter G. Humphrey | |||||
Peter G. Humphrey | ||||||
President & Chief Executive Officer | ||||||
Pursuant to the requirements of the Securities Exchange Act of 1934, this report has been signed below by the following persons on behalf of the registrant and in the capacities and on the dates indicated.
Signatures | Title | Date | ||||
/s/ Peter G. Humphrey | Director, President and Chief Executive Officer | March 9, 2012 | ||||
Peter G. Humphrey | (Principal Executive Officer) | |||||
/s/ Karl F. Krebs | Executive Vice President and Chief Financial Officer | March 9, 2012 | ||||
| Karl F. Krebs | (Principal Financial and Accounting Officer) | |||||
/s/ Karl V. Anderson, Jr. | Director | March 9, 2012 | ||||
| Karl V. Anderson, Jr. | ||||||
/s/ John E. Benjamin | Director, Chairman | March | ||||
| John E. Benjamin | ||||||
/s/ Barton P. Dambra | Director | March | ||||
| Barton P. Dambra | ||||||
/s/ Samuel M. Gullo | Director | March | ||||
| Samuel M. Gullo | ||||||
/s/ Susan R. Holliday | Director | March | ||||
| Susan R. Holliday | ||||||
/s/ Erland E. Kailbourne | Director | March | ||||
| Erland E. Kailbourne | ||||||
/s/ Robert N. Latella | Director | March | ||||
| Robert N. Latella | ||||||
/s/ James L. Robinson | Director | March | ||||
| James L. Robinson | ||||||
/s/ James H. Wyckoff | Director | March | ||||
| James H. Wyckoff | ||||||
- 108 -119