| x | ANNUAL REPORT PURSUANT TO SECTION 13 OR 15(d) OF THE SECURITIES EXCHANGE ACT OF 1934 |
For the fiscal year ended December 31, 20092012
or
| o | TRANSITION REPORT PURSUANT TO SECTION 13 OR 15(d) OF THE SECURITIES EXCHANGE ACT OF 1934 |
For the transition period fromto
Commission File Number:Numbers: 001-33909, 001-33908
GREENHAVEN CONTINUOUS COMMODITY INDEX FUND
(Exact name of registrant as specified in its charter)
GREENHAVEN CONTINUOUS COMMODITY INDEX MASTER FUND
(Exact name of Co-registrant as specified in its charter)
| Delaware | 26-0151234 | |
(State or Other Jurisdiction of Incorporation or Organization) | (I.R.S. Employer Identification No.) |
c/o GreenHaven Commodity Services, LLC | ||
3340 Peachtree Rd, Suite 1910 | ||
Atlanta, Georgia | 30326 | |
| (Address of Principal Executive Offices) | (Zip Code) |
Registrant’s telephone number, including area code: (404) 239-7938239-7942
Securities registered pursuant to Section 12(b) of the Act:
| Title of Each Class | Name of Each Exchange on Which Registered | |
| Common Units of Beneficial Interest |
Securities registered pursuant to Section 12(g) of the Act: None
Indicate by check mark if the registrant is a well-known seasoned issuer, as defined in Rule 405 of the Securities Act. Yes Yesox Noþ¨
Indicate by check mark if the registrant is not required to file reports pursuant to Section 13 or Section 15(d) of the Act. Yes Yeso¨ Noþx
Indicate by check mark whether the registrant: (1) has filed all reports required to be filed by Section 13 or 15(d) of the Securities Exchange Act of 1934 during the preceding 12 months (or for such shorter period that the registrant was required to file such reports), and (2) has been subject to such filing requirements for the past 90 days. Yes Yesþx Noo¨
Indicate by check mark whether the registrant has submitted electronically and posted to its web site, if any, every Interactive Data File required to be submitted and posted pursuant to Rule 405 of Regulation S-T during the preceding 12 months (or for such shorter period that the registrant was required to post such files). Yesox Noo£
Indicate by check mark if disclosure of delinquent filers pursuant to Item 405 of Regulation S-K is not contained herein, and will not be contained, to the best of registrant’s knowledge, in definitive proxy or information statements incorporated by reference in Part III of this Form 10-K or any amendment to this Form 10-K.þx
Indicate by check mark whether the registrant is a large accelerated filer, an accelerated filer, a non-accelerated filer or a smaller reporting company. See definition of “large accelerated filer”, “accelerated filer”, and “smaller reporting company” in Rule12b-2 of the Exchange Act. (Check One).
Large accelerated filer x Accelerated Filer ¨ Non-Accelerated Filer ¨ Smaller Reporting Company ¨
Indicate by check mark whether the registrant is a shell company (as defined in Rule 12b-2 of the Exchange Act). Yeso¨ Noþx
The market value of the voting and non-voting common equity held by non-affiliates calculated based on the closing sale share price of $22.88$28.36 as reported on the New York Stock Exchange Arca (“NYSE”) on June 30, 20092012 was $144,144,000.$510,480,000.
Number of Common Units of Beneficial Interest outstanding as of December 31, 2009: 8,750,000.2012: 16,450,000.
TABLE OF CONTENTS
| 5 | ||||||||
| 5 | ||||||||
| 26 | ||||||||
| 33 | ||||||||
| 34 | ||||||||
| 34 | ||||||||
| 34 | ||||||||
| 35 | ||||||||
| 35 | ||||||||
| 37 | ||||||||
| 37 | ||||||||
| 46 | ||||||||
| 47 | ||||||||
| 75 | ||||||||
| 75 | ||||||||
| 78 | ||||||||
| 79 | ||||||||
| 79 | ||||||||
| 80 | ||||||||
| 81 | ||||||||
| 81 | ||||||||
| 81 | ||||||||
2
3
CAUTIONARY STATEMENT CONCERNING FORWARD-LOOKING INFORMATION
This report includes forward-looking statements within the meaning of Section 27A of the Securities Act of 1933, as amended (the “Securities Act”), and Section 21E of the Securities Exchange Act of 1934, as amended (the “Exchange Act”), that involve substantial risks and uncertainties. These forward-looking statements are based on the registrant’s current expectations, estimates and projections about the registrant’s business and industry and its beliefs and assumptions about future events. These forward-looking statements are subject to known and unknown risks, uncertainties and assumptions about the registrant that may cause our actual results, levels of activity, performance or achievements to be materially different from any future results, levels of activity, performance or achievements expressed or implied by such forward-looking statements. In some cases, investors can identify forward-looking statements by terminology such as “may,” “should,” “could,” “would,” “expect,” “plan,” “anticipate,” “believe,” “estimate,” “continue,” or the negative of such terms or other similar expressions. Factors that might cause or contribute to such a discrepancy include, but are not limited to, those described in this report, including in “Item 1A. Risk Factors”.
3
Organization
THE FUND AND MASTER FUND
The GreenHaven Continuous Commodity Index Fund (or the “Fund”), was formed as a Delaware statutory trust on October 27, 2006. The Fund issues common units of beneficial interest, (or “Shares”), which represent units of fractional undivided beneficial interest in and ownership of the Fund. The term of the Fund is perpetual (unless terminated earlier in certain circumstances).
The GreenHaven Continuous Commodity Index Master Fund (or the “Master Fund”, and together with the Fund, the “Funds”), was formed as a Delaware statutory trust on October 27, 2006. The Master Fund issues common units of beneficial interest or (“Master Fund Units”), which represent units of fractional undivided beneficial interest in and ownership of the Master Fund. The term of the Master Fund is perpetual (unless terminated earlier in certain circumstances).
The principal offices of the Fund and the Master Fund are located at c/o GreenHaven Commodity Services LLC, 3340 Peachtree Road, Suite 1910, Atlanta, Georgia 30326, and its telephone number is (404) 239-7938.
The Fund invests substantially all of its assets in the Master Fund in a master-feeder structure. The Fund holds no investment assets other than Master Fund Units. The Master Fund is wholly-owned by the Fund and the Managing Owner. Each Share issued by the Fund correlates with a Master Fund Unit issued by the Master Fund and held by the Fund.
Under the Trust Declaration of the Fund and the Master Fund, CSC Trust Company of Delaware, the Trustee of the Fund and the Master Fund, has delegated to the Managing Owner certain of the powerpowers and authority to manage the business and affairs of the Fund and the Master Fund and has duties and liabilities to the Fund and the Master Fund.
THE INDEX
Index Description
The original Commodity Research Bureau Index (the “CRB Index”) iswas widely viewed as a broad measure of overall commodity price trends because of the diverse nature of its constituent commodities. In 2005, the CRB Index was revised for a tenth time, and is currently known as the Thomson Reuters/Jeffries CRB Index. The ninth revision formula continued to be calculated and was renamed the Continuous Commodity Index (the “CCI Index”). The Continuous CommodityOn January 7, 2013, the CCI Index is notwas revised for a tenth time to include Soybean oil and remove ICE Frozen Concentrated Orange Juice at an equivalent allocation. Additionally, the Thomson Reuters/Jefferies CRB Index. Index methodology was changed from geometric averaging to arithmetic averaging and a five-day roll period replaced the former one-day period. Thomson Reuters America LLC is the owner, publisher, and custodian of the Continuous Commodity Index -Total Return (the “Index”) which represents a total return version of the CCI Index. ThePrior to the tenth revision, the Index iswas calculated to produce an un-weightedequal-weighted geometric mean of the individual commodity price relatives, i.e., a ratio of the current price to the base year average price. The base year of the Continuous Commodity Index (CCI) is 1967 with a starting value of 100.
The Funds are based on the total return version Continuous Commodity Index, called the Continuous Commodity Index —– Total Return (the “CCI-TR”). The base year for the CCI-TR is 1982, with a starting value of 100. The Continuous Commodity Index is materially different from the CRB Index.
The CCI-TR is calculated to offer investors a representation of the investable returns that an investor should expect to receive by attempting to replicate the CCI index by buying the respective commodity futures and collateralizing their investment with United States Government securities, (i.e., 90 day T-Bills). The CCI-TR takes into account the economics of rolling listed commodity futures forward to avoid delivery and maintain exposure in liquid contracts. The Index is notionally composed of commodity futures contracts on physical commodities. Unlike equities, which typically entitle the holder to a continuing stake in a corporation, commodity futures contracts normally specify a certain date for the delivery of the underlying physical commodity. In order to avoid the delivery process and maintain a long futures position, contracts nearing a delivery date must be sold and contracts that have not yet reached delivery must be purchased. This process is known as “rolling” a futures position. An index, such as the CCI-TR, is commonly known as a “rolling index” because it replaces futures contracts as they approach maturity by notionally selling and purchasing offsetting contracts to avoid delivery and maintain exposure in liquid contracts.
4
5
The CCI-TR is an equal weight commodity index. By its very structure an evenly-weighted index will provide broader exposure than one that is not evenly-weighted. To the extent that an index is over-weighted in a particular commodity class, such as energy, that index will reflect the energy sector more than it will the broad commodity universe. The table below indicates the constituent commodities, the allowed contracts, their index weighting and the sector weighting within the Index.
| Commodity Allowed | Contracts | Exchanges* | Index Weight | Sector Weight | ||||||||
| Crude Oil | All 12 calendar months | CME | 5.88% | Energy 17.65% | ||||||||
| Heating Oil | All 12 calendar months | CME | 5.88% | |||||||||
| Natural Gas | All 12 calendar months | CME | 5.88% | |||||||||
| Mar, May, Jul, Sep, Dec | 5.88% | Grains 23.53% | ||||||||||
| Wheat | Mar, May, Jul, Sep, Dec | |||||||||||
| Jan, Mar, May, Jul, Aug, Nov | ||||||||||||
| 5.88% | ||||||||||||
| Jan, Mar, May, Jul, Aug, Sep, | CME | 5.88% | ||||||||||
| Oct Dec | ||||||||||||
| Live Cattle | Feb, Apr, Jun, Aug, Oct, Dec | CME | 5.88% | Livestock 11.76% | ||||||||
| CME | ||||||||||||
| 5.88% | ||||||||||||
| Sugar | March, May, July, October | ICE | 5.88% | Softs 23.53% | ||||||||
| Cotton | March, May, July, December | ICE | 5.88% | |||||||||
| Mar, May, Jul, Sep, Dec | ICE | 5.88% | ||||||||||
| Mar, May, Jul, Sep, Dec | ICE | |||||||||||
| 5.88% | ||||||||||||
| Gold | Feb, Apr, Jun, Aug, Dec | CME | 5.88% | Metals 23.53% | ||||||||
| Silver | Mar, May, Jul, Sep, Dec | CME | 5.88% | |||||||||
| Jan, Apr, Jul, Oct | CME | 5.88% | ||||||||||
| Copper | Mar, May, Jul, Sep, Dec | CME | ||||||||||
| 5.88% | ||||||||||||
*This column of the chart refers to the exchanges in which the standard futures contracts trade. The column is not intended to be an exhaustive list of all the exchanges in which a standard futures contract is traded, including foreign exchanges. Each of the constituent commodities may trade as standard futures contracts on other exchanges, including foreign exchanges; however, the Master Fund does not engage in the purchase or sale of any standard constituent commodity traded on a foreign exchange. The Fund and the Master Fund do not engage in the purchase of any forward, swap or other non-exchange traded instruments.
Values of the underlying Index are computed by Thomson Reuters America, LLC, and disseminated by the NYSE every fifteen (15) seconds during the trading day. Only settlement and last-sale prices are used in the Index’s calculation, bids and offers are not recognized —– including limit-bid and limit-offer price quotes. WhereIn the event where no last-sale price exists, typically in the more deferred contract months, the previous days’ settlement price is used. This means that the underlying Index may lag its theoretical value. This tendency to lag is evident at the end of the day when the
Index value is based on the settlement prices of the component commodities, and explains why the underlying Index often closes at or near the high or low for the day.Methodology
Thomson Reuters America LLC is the owner, custodian, and calculating agent for the CCI-TR. The CCI-TRdaily return is calculated using the following three variables:
5
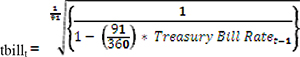
The formulas used to calculate the return would beindividual commodity contributions are calculated as follows: CCI Total Return Index = 100 x (1+ Continuous Daily Return + T-Bill return for one day); beginning January 1, 1982 the Continuous Daily return = {CCI Continuous Contract Index / CCI Continuous Contract Indext-1} — 1; T-Bill return for one day = {[1/(1-(91/360) x T-Bill Rate t-1)]^(l/91)}-1
6
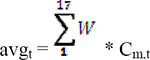
Where Cm,t represents the sum across the included contracts beyondfor each of the six month window, if necessary). Furthermore, there shall be a maximum17 commodities , so
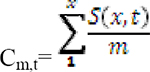
| Where, | |
| S | is the price of a given contract month |
| W | is the equal weight of 5.88% (1/17th) for each constituent commodity |
avgt | is the daily average of settlement prices |
| m | represents each commodity |
| t | is each trading day for which updated settlement prices are available |
2. The current day’s value of five contract monthsthe average price of the 17 commodities is then used with the prior day’s corresponding value to derive the applicable fair value index (“CRBCC”):
CRBCCt = CRBCCt-1 * (avgt / avgt-1 )
The CRBCC defines the actively considered set of futures contracts for each commodity (dropas described further in the most deferred6 roll schedules listed on the Thomson Reuters website and in the methodology document located at:
http://thomsonreuters.com/products_services/financial/thomson_reuters_indices/indices/commodity_indices/#tab2
3. Total Return:
CCITRT = CCITRT-1 * (avgt / avgt-1 + tbillt)
Where,
CCITRis the index level, set at 100 on Jan 1st, 1981
tbill is the US Treasury Bill return for the given day, calculated as:
CCITRis the index level, set at 100 on Jan 1st, 1981
tbill is the US Treasury Bill return for the given day, calculated as:
Note that for example after a weekend, 3 days of returns are due to be added to the index.
Contract Roll
The roll periods take place during the week leading up to the second Friday of the same six months (Jan, Feb, Apr, June, Aug, and Nov) every year. The roll implies a change from the pre-roll basket of contracts to remainthe post-roll basket according to the following pattern:
At the close of Day 1: 20% post-roll basket + 80% pre-roll basket
Intraday of Day 2: 20% post-roll basket + 80% pre-roll basket
At the close of Day 2: 40% post-roll basket + 60% pre-roll basket
Intraday of Day 3: 40% post-roll basket + 60% pre-roll basket
7
At the close of Day 3: 60% post-roll basket + 40% pre-roll basket
Intraday of Day 4: 60% post-roll basket + 40% pre-roll basket
At the close of Day 4: 80% post-roll basket + 20% pre-roll basket
Intraday of Day 5: 80% post-roll basket + 20% pre-roll basket
At the close of Day 5: 100% post-roll basket
Good Friday can fall on the second Friday in April (e.g. 2017). In this case, the open on the following Monday shows the final 40% of the roll rather than the final 20%. If no trading takes place during the roll for other reasons, reallocation between contracts without a price change is implemented for such days.
The Index is calculated 5:00am - 6:00pm ET (Thomson Reuters) , 8:00am – 8:22pm ET (disseminated on NYSE Arca). The Index settles on a final value at five, if necessary).approximately 3:15pm ET.
6
Interruption of Index Calculation
Calculation of the Index may not be possible or feasible under certain events or circumstances, including, without limitation, a systems failure, natural or man-made disaster, act of God, armed conflict, act of terrorism, riot or labor disruption or any similar intervening circumstance, that is beyond the reasonable control of Thomson Reuters or the Managing Owner. Additionally, calculation of the Index may also be disrupted by an event that would require Thomson Reuters to calculate the closing price in respect of the relevant commodity on an alternative basis.
INVESTMENT OBJECTIVE
The investment objective of the Fund and the Master Fund is to reflect the performance of the Index, over time, less the expenses of the operations of the Fund and the Master Fund.
The Fund pursues its investment objective by investing substantially all of its assets in the Master Fund. The Master Fund pursues its investment objective by investing in a portfolio of exchange-traded futures on the commodities comprising the Index, or the Index Commodities.
The Master Fund holds a portfolio of futures contracts on the Index Commodities as well as cash, and United States Treasury securities, and other high credit quality short-term fixed income securities for deposit with the Master Fund’s Commodity BrokersBroker as margin and other high credit quality short-term fixed income securities.margin. The Master Fund’s portfolio is traded with a view to reflecting the performance of the Index over time, whether the Index is rising, falling or flat over any particular period. The Master Fund is not “managed” by traditional methods, which typically involve effecting changes in the composition of the Master Fund’sa given portfolio on the basis of judgments relating to economic, financial and market considerations with a view to obtaining positive results under all market conditions. To maintain the correspondence between the composition and weightings of the Index Commodities comprising the Index, the Managing Owner may adjust or rebalance the Portfolio on a daily basis to conform to periodic changes in the identity and/or relative weighting of the Index Commodities. The Managing Owner aggregates certain of the adjustments and makes changes to the portfolio in the case of significant changes to the Index.
There can be no assurance that either the Fund or the Master Fund will achieve its investment objective or avoid substantial losses. The Master Fund has limiteda trading and performance history.history of approximately five years. The value of the Shares is expected to fluctuate generally in relation to changes in the value of the Master Fund Units.
Who May Subscribe
Baskets may be created or redeemed only by “Authorized Participants.” Each Authorized Participant must (1) be a registered broker-dealer or other securities market participant such as a bank or other financial institution which is not required to register as a broker-dealer to engage in securities transactions, (2) be a participant in DTC, and (3) have entered into an agreement with the Fund and the Managing Owner (a Participant Agreement). The Participant Agreement sets forth the procedures for the creation and redemption of Baskets of Shares and for the delivery of cash required for such creations or redemptions. A list of the current Authorized Participants can be obtained from the Administrator. A similar agreement between the Fund and the Master Fund sets forth the procedures for the creation and redemption of Master Unit Baskets by the Fund. See “Creation and Redemption of Shares” for more details.
8
Creation and Redemption of Shares
The Fund creates and redeems Shares from time-to-time,time to time, but only in one or more Baskets. A “Basket” is a block of 50,000 Shares. Baskets may be created or redeemed only by Authorized Participants. Authorized Participants pay a transaction fee of $500 in connection with each order to create or redeem a Basket of Shares. Authorized Participants may sell the Shares included in the Baskets they purchase from the Fund to other investors.
The Master Fund creates and redeems Master Fund Units from time-to-time, but only in one or more Master Unit Baskets. A “Master Unit Basket” is a block of 50,000 Master Fund Units. Master Unit Baskets may be created or redeemed only by the Fund. Each Share issued by the Fund will correlate with a Master Fund Unit issued by the Master Fund and held by the Fund.
7
Authorized Participants are the only persons that may place orders to create and redeem Baskets. Investors are not permitted to purchase Baskets from Authorized Participants. To become an Authorized Participant, a person must enter into a Participant Agreement with the Fund and the Managing Owner. The Participant Agreement sets forth the procedures for the creation and redemption of Baskets and for the payment of cash required for such creations and redemptions. The Participant Agreement and the related procedures attached thereto may be amended by the Managing Owner and the DistributorALPS Distributors, Inc (the “Distributor”) without the consent of any Shareholder or Authorized Participant. To compensate the AdministratorBank of New York Mellon (the “Administrator”) for services in processing the creation and redemption of Baskets, an Authorized Participant is required to pay a transaction fee to the Fund of $500 per order to create or redeem Baskets. In turn, the Fund pays this transaction fee to the Master Fund, which then pays such fee to the Administrator. Authorized Participants who purchase Baskets receive no fees, commissions or other form of compensation or inducement of any kind from either the Managing Owner or the Fund, and no such person has any obligation or responsibility to the Managing Owner or the Fund to effecteffectuate any sale or resale of Shares.
Authorized Participants are cautioned that some of their activities will result in their being deemed participants in a distribution in a manner which would render them statutory underwriters and subject them to the prospectus-delivery and liability provisions of the Securities Act.
Each Authorized Participant must be registered as a broker-dealer under the Securities Exchange Act of 1934 (the “Exchange Act”) and regulated by the NASD,Financial Industry Regulatory Authority (“FINRA”), or will be exempt from being or otherwise will not be required to be so regulated or registered, and willmust be qualified to act as a broker or dealer in the states or other jurisdictions where the nature of its business so requires. Certain Authorized Participants may be regulated under federal and state banking laws and regulations. Each Authorized Participant has its own set of rules and procedures, internal controls and information barriers as it determines is appropriate in light of its own regulatory regime.
Authorized Participants may act for their own accounts or as agents for broker-dealers, custodians and other securities market participants that wish to create or redeem Baskets.
Under the Participant Agreements, the Managing Owner has agreed to indemnify the Authorized Participants against certain liabilities, including liabilities under the Securities Act, and to contribute to the payments the Authorized Participants may be required to make in respect of those liabilities. The Administrator has agreed to reimburse the Authorized Participants, solely from and to the extent of the Master Fund’s assets, for indemnification and contribution amounts due from the Managing Owner in respect of such liabilities to the extent the Managing Owner has not paid such amounts when due.
The following description of the procedures for the creation and redemption of Baskets is only a summary and an investor should refer to the relevant provisions of the Fund’s Trust Declaration and the form of Participant Agreement for more detail.
Creation Procedures
On any business day, an Authorized Participant may place an order with the Distributor to create one or more Baskets. For purposes of processing both purchase and redemption orders, a “business day” means any day other than a day when banks in New York City are required or permitted to be closed. Purchase orders must be placed by 10:00 a.m., New York time. The day on which the Distributor receives a valid purchase order is the purchase order date. Purchase orders are irrevocable. By placing a purchase order, and prior to delivery of such Baskets, an Authorized Participant’s DTC account will be charged the non-refundable transaction fee due for the purchase order.
9
Determination of required payment
The total payment required to create each Basket is the Net Asset Value (as defined below) of 50,000 Shares as of the closing time of NYSE-ARCA or the last to close of the exchanges on which the Index Commodities are traded, whichever is later, on the purchase order date. Baskets will be issued as of 12:00pm, New York time, on the Business Day immediately following the purchase order date at Net Asset Value per Share as of the closing time of NYSE-ARCA or the last to close of the exchanges on which the Index Commodities are traded, whichever is later, on the purchase order date during the continuous offering period, but only if the required payment has been timely received.
Because orders to purchase Baskets must be placed by 10:00 a.m., New York time, but the total payment required to create a Basket during the continuous offering period will not be determined until 4:00 p.m., New York time, on the date the purchase order is received, Authorized Participants will not know the total amount of the payment required to create a Basket at the time they submit an irrevocable purchase order for the Basket. The Fund’s Net Asset Value and the total amount of the payment required to create a Basket could rise or fall substantially between the time an irrevocable purchase order is submitted and the time the amount of the purchase price in respect thereof is determined.
8
Rejection of purchase orders
The Administrator may reject a purchase order if:
| (i) | it determines that the purchase order is not in proper form; | ||
| (ii) | the Managing Owner believes that the purchase order would have adverse tax consequences to the Fund or its Shareholders; or | ||
| (iii) | circumstances outside the control of the Managing Owner or the Distributor make it, for all practical purposes, not feasible to process creations of Baskets. |
The Distributor and the Managing Owner will not be liable for the rejection of any purchase order.
Redemption Procedures
The procedures by which an Authorized Participant can redeem one or more Baskets mirror the procedures for the creation of Baskets. On any business day, an Authorized Participant may place an order with the Distributor to redeem one or more Baskets. Redemption orders must be placed by 10:00 a.m., New York time. The day on which the Distributor receives a valid redemption order is the redemption order date. Redemption orders are irrevocable. Individual Shareholders may not redeem directly from the Fund.
By placing a redemption order, an Authorized Participant agrees to deliver the Baskets to be redeemed through DTC’s book-entry system to the Fund not later than 12:00pm, New York time, on the business day immediately following the redemption order date. By placing a redemption order, and prior to receipt of the redemption proceeds, an Authorized Participant’s DTC account will be charged the non-refundable transaction fee due for the redemption order.
Determination of redemption proceeds
The redemption proceeds from the Fund consist of the cash redemption amount equal to the net asset value of the number of Basket(s) requested in the Authorized Participant’s redemption order as of the closing time of the NYSE-ARCA or the last to close of the exchanges on which the Index Commodities are traded, whichever is later, on the redemption order date. The Managing Owner will distribute the cash redemption amount at 12:00pm, New York time, on the business day immediately following the redemption order date through DTC to the account of the Authorized Participant as recorded on DTC’s book entry system.
10
Delivery of redemption proceeds
The redemption proceeds due from the Fund isare delivered to the Authorized Participant at 12:00pm, New York time, on the business day immediately following the redemption order date if, by such time, the Fund’s DTC account has been credited with the Baskets to be redeemed. If the Fund’s DTC account has not been credited with all of the Baskets to be redeemed by such time, the redemption distribution is delivered to the extent of whole Baskets received. Any remainder of the redemption distribution is delivered on the next business day to the extent of remaining whole Baskets received if the Distributor receives the fee applicable to the extension of the redemption distribution date which the Distributor may, from time-to-time, determine and the remaining Baskets to be redeemed are credited to the Fund’s DTC account by 12:00pm, New York time, on such next business day. Any further outstanding amount of the redemption order shall be cancelled. The Distributor is also authorized to deliver the redemption distribution notwithstanding that the Baskets to be redeemed are not credited to the Fund’s DTC account by 12:00pm, New York time, on the business day immediately following the redemption order date if the Authorized Participant has collateralized its obligation to deliver the Baskets through DTC’s book entry system on such terms as the Distributor and the Managing Owner may from time-to-time agree upon.
9
Suspension or rejection of redemption orders
The Distributor may, in its discretion, and will when directed by the Managing Owner, suspend the right of redemption, or postpone the redemption settlement date, (1) for any period during which an emergency exists as a result of which the redemption distribution is not reasonably practicable, or (2) for such other period as the Managing Owner determines to be necessary for the protection of the Shareholders. Neither the Distributor nor the Managing Owner will be liable to any person or in any way for any loss or damages that may result from any such suspension or postponement.
The Distributor will reject a redemption order if the order is not in proper form as described in the Participant Agreement or if the fulfillment of the order, in the opinion of its counsel, might be unlawful.
Creation and Redemption Transaction Fee
To compensate the Administrator for services in processing the creation and redemption of Baskets, an Authorized Participant is required to pay a transaction fee to the Fund of $500 per order to create or redeem Baskets. In turn, the Fund pays this transaction fee to the Master Fund, which then pays such fee to the Administrator. An order may include multiple Baskets. The transaction fee may be reduced, increased or otherwise changed by the Administrator with consent from the Managing Owner. The Administrator must notify DTC of any agreement to change the transaction fee and will not implement any increase in the fee for the redemption of Baskets until thirty (30) days after the date of the notice.
There can be no assurance that the Fund or the Master Fund will achieve its investment objective or avoid substantial losses. The value of the Shares is expected to fluctuate generally in relation to changes in the value of the Master Fund Units.
The Trustee
CSC Trust Company of Delaware, a Delaware corporation, is the sole Trustee of the Fund and Master Fund. The Trustee’s principal offices are located at 2711 Centerville Road, Suite 210, Wilmington, DE 19808. The Trustee is unaffiliated with the Managing Owner. The Trustee’s duties and liabilities with respect to the offering of the Shares and the management of the Fund and Master Fund are limited to its express obligations under the Trust Declarations.
The rights and duties of the Trustee, the Managing Owner and the Shareholders are governed by the provisions of the Delaware Statutory Trust Act and by the applicable Trust Declaration.
The Trustee serves as the sole trustee of the Fund and the Master Fund in the State of Delaware. The Trustee will accept service of legal process on the Fund and the Master Fund in the State of Delaware and will make certain filings under the Delaware Statutory Trust Act. The Trustee does not owe any other duties to the Fund or the Master Fund, the Managing Owner or the Shareholders. The Trustee is permitted to resign upon at least sixty (60) days’ notice to the Fund and the Master Fund,provided, that any such resignation will not be effective until a successor Trustee is appointed by the Managing Owner. Each of the Trust Declarations provides that the Trustee is compensated by the Fund or the Master Fund, as appropriate, and is indemnified by the Fund or Master Fund, as appropriate, against any expenses it incurs relating to or arising out of the formation, operation or termination of the Fund or Master Fund, as appropriate, or the performance of its duties pursuant to the Trust Declarations, except to the extent that such expenses result from the gross negligence or willful misconduct of the Trustee. The Managing Owner has the discretion to replace the Trustee.
11
Under each Trust Declaration, the Trustee has delegated to the Managing Owner the exclusive management and control of all aspects of the business of the Fund and Master Fund. The Trustee will have no duty or liability to supervise or monitor the performance of the Managing Owner, nor will the Trustee have any liability for the acts or omissions of the Managing Owner. The Shareholders have no voice in the day-to-day management of the business and operations of the Fund or the Master Fund, other than certain limited voting rights as set forth in each Trust Declaration. In the course of its management of the business and affairs of the Fund and the Master Fund, the Managing Owner may, in its sole and absolute discretion, appoint an affiliate or affiliates of the Managing Owner as additional managing owners (except where the Managing Owner has been notified by the Shareholders that it is to be replaced as the managing owner) and retain such persons, including affiliates of the Managing Owner, as it deems necessary for the efficient operation of the Fund or Master Fund, as appropriate.
10
Because the Trustee has delegated substantially all of its authority over the operation of the Fund and the Master Fund to the Managing Owner, the Trustee itself is not registered in any capacity with the CFTC.
The Managing Owner
Background and Principal.GreenHaven Commodity Services LLC, a Delaware limited liability company, is the Managing Owner of the Fund and the Master Fund. The Managing Owner serves as both commodity pool operator and commodity trading advisor of the Fund and Master Fund. The Managing Owner is registered with the CFTC as a Commodity Pool Operator (“CPO”) and Commodity Trading Advisor (“CTA”) and was approved as a Member of the NFANational Futures Association (the “NFA”) as of November 15, 2006. Its principal place of business is 3340 Peachtree Road, Suite 1910, Atlanta, Georgia 30326, telephone: (404) 239-7938. The registration of the Managing Owner with the CFTC and its membership in the NFA must not be taken as an indication that either the CFTC or the NFA has recommended or approved the Managing Owner, the Fund or the Master Fund.
In its capacity as a commodity pool operator, the Managing Owner is an organization which operates or solicits funds for a commodity pool; that is, an enterprise in which funds contributed by a number of persons are combined for the purpose of trading futures contracts. In its capacity as a commodity trading advisor, the Managing Owner is an organization which, for compensation or profit, advises others as to the value of or the advisability of buying or selling futures contracts.
Principals and Key Employees.Ashmead Pringle and Thomas FernandesCooper Anderson serve as the chief decision makers of the Managing Owner. The biographies and further information of the key employees and officers of the Managing Owner can be found starting on page 7282 of this Form 10-k.10-K.
Role of Managing Owner
The Managing Owner serves as the commodity pool operator and commodity trading advisor of the Fund and the Master Fund.
Specifically, with respect to the Fund and the Master Fund, the Managing Owner:
| (i) | selects the Trustee, administrator, distributor and auditor; | ||
| (ii) | negotiates various agreements and fees; and | ||
| (iii) | performs such other services as the Managing Owner believes that the Fund and the Master Fund may from |
Specifically, with respect to the Master Fund, the Managing Owner:
| (i) | selects the Commodity Broker; and | ||
| (ii) | monitors the performance results of the Master Fund’s portfolio and reallocates assets within the portfolio with a view to causing the performance of the Master Fund’s portfolio to track that of the Index over time. |
Prior to the commencement of trading in the Fund and Master Fund on January 24, 2008, neither the Managing Owner nor any of its trading participants had ever before operated a commodity pool.
12
The Managing Owner and its trading principals have a limited history operating a commodity pool or managedmanaging a commodity trading account. The Managing Owner is registered as a commodity pool operator and commodity trading advisor with the CFTC and was approved as a member of the NFA as of November 15, 2006.
The principal office of the Managing Owner is located at 3340 Peachtree Road, Suite 1910, Atlanta, Georgia 30326. The telephone number of the Managing Owner is (404) 239-7938.
Fiduciary Obligations of the Managing Owner.As managing owner of the Fund and the Master Fund, the Managing Owner effectively is subject to the duties and restrictions imposed on “fiduciaries” under both statutory and common law. The Managing Owner has a fiduciary responsibility to the Shareholders to exercise good faith, fairness and loyalty in all dealings affecting the Fund and the Master Fund, consistent with the terms of the Trust Declarations. The general fiduciary duties which would otherwise be imposed on the Managing Owner (which would make the operation of the Fund and the Master Fund as described herein impracticable due to the strict prohibition imposed by such duties on, for example, conflicts of interest on behalf of a fiduciary in its dealings with its beneficiaries), are defined and limited in scope by the disclosure of the business terms of the Fund and the Master Fund, as set forth herein and in the Trust Declarations (to which terms all Shareholders, by subscribing to the Shares, are deemed to consent).
11
The Trust Declarations provide that the Managing Owner and its affiliates shall have no liability to the Fund or the Master Fund or to any Shareholder for any loss suffered by the Fund or the Master Fund arising out of any action or inaction of the Managing Owner or its affiliates or their respective directors, officers, shareholders, partners, members, managers or employees (the “Managing Owner Related Parties”) if the Managing Owner Related Parties, in good faith, determined that such course of conduct was in the best interests of the Fund or the Master Fund, as applicable, and such course of conduct did not constitute gross negligence or misconduct by the Managing Owner Related Parties. The Fund and the Master Fund have agreed to indemnify the Managing Owner Related Parties against claims, losses or liabilities based on their conduct relating to the Fund and the Master Fund, provided that the conduct resulting in the claims, losses or liabilities for which indemnity is sought did not constitute gross negligence or misconduct and was done in good faith and in a manner reasonably believed to be in the best interests of the Fund or the Master Fund, as applicable.
Fiduciary and Regulatory Duties of the Managing Owner
Investors should be aware that the Managing Owner has a fiduciary responsibility to the Shareholders to exercise good faith and fairness in all dealings affecting the Fund and the Master Fund.
Under Delaware law, a beneficial owner of a business trust (such as a Shareholder of the Fund) may, under certain circumstances, institute legal action on behalf of himself and all other similarly situated beneficial owners (a “class action”) to recover damages from a managing owner of such business trust for violations of fiduciary duties, or on behalf of a business trust (a “derivative action”) to recover damages from a third party where a managing owner has failed or refused to institute proceedings to recover such damages. In addition, beneficial owners may have the right, subject to certain legal requirements, to bring class actions in federal court to enforce their rights under the federal securities laws and the rules and regulations promulgated thereunder by the Securities and Exchange Commission (“SEC”). Beneficial owners who have suffered losses in connection with the purchase or sale of their beneficial interests may be able to recover such losses from a managing owner where the losses result from a violation by the managing owner of the anti-fraud provisions of the federal securities laws.
Under certain circumstances, Shareholders also have the right to institute a reparations proceeding before the CFTC against the Managing Owner (a registered commodity pool operator and commodity trading advisor), the Commodity Broker (registered futures commission merchant), as well as those of their respective employees who are required to be registered under the Commodity Exchange Act, as amended, and the rules and regulations promulgated thereunder. Private rights of action are conferred by the Commodity Exchange Act. Investors in commodities and in commodity pools may, therefore, invoke the protections provided thereunder.
There are substantial and inherent conflicts of interest in the structure of the Fund and the Master Fund which are, on their face, inconsistent with the Managing Owner’s fiduciary duties. One of the purposes underlying the disclosures set forth in this Form 10-K is to disclose to all prospective Shareholders these conflicts of interest so that The Managing Owner currently intends to raise such disclosures and consent as a defense in any proceeding brought seeking relief based on the existence of such conflicts of interest.
The foregoing summary describing in general terms the remedies available to Shareholders under federal law is based on statutes, rules and decisions as of the date of this Form 10-K. This is a rapidly developing and changing area of the law. Therefore, Shareholders who believe that they may have a legal cause of action against any of the foregoing parties should consult their own counsel as to their evaluation of the status of the applicable law at such time.
13
Ownership or Beneficial Interest in the Fund and Master Fund
Management; Voting by Shareholders
The Shareholders take no part in the management or control, and have no voice in the operations or the business of the Fund or the Master Fund. Shareholders, may, however, remove and replace the Managing Owner as the managing owner of the Fund, and may amend the Trust Declaration of the Fund, except in certain limited respects, by the affirmative vote of a majorityseventy-five percent (75%) of the outstanding Shares then owned by Shareholders (as opposed to by the Managing Owner and its affiliates). The owners of a majorityseventy-five percent (75%) of the outstanding Shares then owned by Shareholders may also compel dissolution of the Fund. The owners of ten percent (10%) of the outstanding Shares then owned by Shareholders have the right to bring a matter before a vote of the Shareholders. The Managing Owner has no power under the Trust Declaration to restrict any of the Shareholders’ voting rights. Any Shares purchased by the Managing Owner or its affiliates, as well as the Managing Owner’s general liability interest in the Fund or Master Fund, are non-voting.
12
The Managing Owner has the right unilaterally to amend the Trust Declaration provided that any such amendment is for the benefit of and not adverse to the Shareholders or the Trustee and also in certain unusual circumstances — for example, if doing so is necessary to comply with certain regulatory requirements.
Recognition of the Fund and the Master Fund in Certain States
A number of states do not have “business trust” statutes such as that under which the Fund and the Master Fund have been formed in the State of Delaware. It is possible, although unlikely, that a court in such a state could hold that, due to the absence of any statutory provision to the contrary in such jurisdiction, the Shareholders, although entitled under Delaware law to the same limitation on personal liability as stockholders in a private corporation for profit organized under the laws of the State of Delaware, are not so entitled in such state. To protect Shareholders against any loss of limited liability, the Trust Declarations provide that no written obligation may be undertaken by the Fund or Master Fund unless such obligation is explicitly limited so as not to be enforceable against any Shareholder personally. Furthermore, each of the Fund and Master Fund itself indemnifies all its Shareholders against any liability that such Shareholders might incur in addition to that of a beneficial owner. The Managing Owner is itself generally liable for all obligations of the Fund and the Master Fund and will use its assets to satisfy any such liability before such liability would be enforced against any Shareholder individually.
Possible Repayment of Distributions Received by Shareholders; Indemnification by Shareholders
The Shares are limited liability investments; investors may not lose more than the amount that they invest plus any profits recognized on their investment. However, Shareholders could be required, as a matter of bankruptcy law, to return to the estate of the Fund any distribution they received at a time when the Fund was in fact insolvent or in violation of its Trust Declaration. In addition, although the Managing Owner is not aware of this provision ever having been invoked in the case of any public futures fund, Shareholders agree in the Trust Declaration that they will indemnify the Fund for any harm suffered by it as a result of (i) Shareholders’ actions unrelated to the business of the Fund, or (ii) taxes imposed on the Shares by the states or municipalities in which such investors reside.
The foregoing repayment of distributions and indemnity provisions (other than the provision for Shareholders indemnifying the Fund for taxes imposed upon it by the state or municipality in which particular Shareholders reside, which is included only as a formality due to the fact that many states do not have business trust statutes so that the tax status of the Fund in such states might, theoretically, be challenged — although the Managing Owner is unaware of any instance in which this has actually occurred) are commonplace in statutory trusts and limited partnerships.
Shares Freely Transferable
The Shares currently trade on NYSE-ARCA and provide institutional and retail investors with direct access to the Fund. The Fund holds no investment assets other than Master Fund Units. The Master Fund trades with a view to tracking the Index over time, less expenses. The Fund’s Shares may be bought and sold on NYSE-ARCA like any other exchange-listed security.
14
Book-Entry Form
Individual certificates are not issued for the Shares. Instead, global certificates are deposited by the Trustee with DTC and registered in the name of Cede & Co., as nominee for DTC. The global certificates evidence all of the Shares outstanding at any time. Under the Fund’s Trust Declaration, Shareholders are limited to (1) participants in DTC such as banks, brokers, dealers and trust companies (“DTC Participants”), (2) those who maintain, either directly or indirectly, a custodial relationship with a DTC Participant (Indirect Participants), and (3) those banks, brokers, dealers, trust companies and others who hold interests in the Shares through DTC Participants or Indirect Participants. The Shares are only transferable through the book-entry system of DTC. Shareholders who are not DTC Participants may transfer their Shares through DTC by instructing the DTC Participant holding their Shares (or by instructing the Indirect Participant or other entity through which their Shares are held) to transfer the Shares. Transfers are made in accordance with standard securities industry practice.
13
Reports to Shareholders
The Managing Owner furnishes Investors with annual reports as required by the rules and regulations of the SEC as well as with those reports required by the CFTC and the NFA, including, but not limited to, an annual audited financial statement certified by independent registered public accountants and any other reports required by any other governmental authority that has jurisdiction over the activities of the Fund and the Master Fund. YouInvestors also will be provided with appropriate information to permit youthem (on a timely basis) to file yourtheir United States federal and state income tax returns with respect to yourtheir Shares.
The Managing Owner will notify Shareholders of any change in the fees paid by the Fund and the Master Fund or of any material changes to the Fund or the Master Fund. Any such notification shall include a description of Shareholders’ voting rights.
Net Asset Value
“Net Asset Value” means the total assets of the Master Fund including, but not limited to, all cash and cash equivalents or other debt securities less total liabilities of the Master Fund, each determined on the basis of generally accepted accounting principles in the United States, consistently applied under the accrual method of accounting. In particular, Net Asset Value includes any unrealized profit or loss on open commodity futures contracts, and any other credit or debit accruing to the Master Fund but unpaid or not received by the Master Fund. All open commodity futures contracts traded on a United States exchange will be calculated at their then current market value, which will be based upon the settlement price for that particular commodity futures contract traded on the applicable United States exchange on the date with respect to which Net Asset Value is being determined; provided, that if a commodity futures contract traded on a United States exchange could not be liquidated on such day, due to the operation of daily limits or other rules of the exchange upon which that position is traded or otherwise, the settlement price on the most recent day on which the position could have been liquidated shall be the basis for determining the market value of such position for such day.
The current market value of all open commodity futures contracts traded on a non-United States exchange shall be based upon the settlement price for that particular commodity futures contract traded on the applicable non-United States exchange on the date with respect to which net asset value is being determined; provided further, that if a commodity futures contract traded on a non-United States exchange could not be liquidated on such day, due to the operation of daily limits (if applicable) or other rules of the exchange upon which that position is traded or otherwise, the settlement price on the most recent day on which the position could have been liquidated shall be the basis for determining the market value of such position for such day.
The Managing Owner may in its discretion (and under extraordinaryunusual circumstances, including, but not limited to, periods during which a settlement price of a futures contract is not available due to exchange limit orders or force majeure type events such as systems failure, natural or man-made disaster, act of God, armed conflict, act of terrorism, riot or labor disruption or any similar intervening circumstance) value any asset of the Master Fund pursuant to such other principles as the Managing Owner deems fair and equitable so long as such principles are consistent with normal industry standards. Interest earned on the Master Fund’s commodity brokerage account will be accrued at least monthly. The amount of any distribution will be a liability of the Master Fund from the day when the distribution is declared until it is paid.
Net Asset Value per Master Fund Unit is the Net Asset Value of the Master Fund divided by the number of outstanding Master Fund Units. Because there will be a one-to-one correlation between Shares and Master Fund Units, the Net Asset Value per Share and the Net Asset Value per Master Fund Unit will be equal.
14
15
Termination Events
The Commodity Broker
A variety of executing brokers may execute futures transactions on behalf of the Master Fund. The Managing Owner, on behalf of the Fund, designated Morgan Stanley & Co. Incorporated, LLC (“MS&Co.”) as the Master Fund’s Commodity Broker, and may in the future designate other firms that are registered with the CFTC as a futures commission merchant and are members of the NFA in such capacity to replace or supplement the Commodity Broker. The Commodity Broker(s) executes and clears each of the Master Fund’s futures transactions and performs certain administrative services for the Master Fund. The Master Fund pays to the Commodity Broker all brokerage commissions, including applicable exchange fees, NFA fees, give-up fees, pit brokerage fees and other transaction related fees and expenses charged in connection with trading activities. On average, total charges paid to the Commodity Broker are expected to be less than $20 per round-turn trade, although the Commodity Broker’s brokerage commissions and trading fees are determined on a contract-by-contract basis. The Managing Owner does not expect brokerage commissions and fees to exceed 0.24%0.20% of the average daily net asset value of the Master Fund in any year, although the actual amount of brokerage commissions and fees in any year may be greater due to changes in transaction volume and volatility.
15
16
17
18
The Administrator
The Managing Owner, on behalf of the Fund and the Master Fund has appointed The Bank of New York as the administrator (the “Administrator”) of the Fund and the Master Fund and has entered into an Administration Agreement in connection therewith. The Bank of New York, N.A. serves as custodian (the “Custodian”) of the Fund and has entered into a Global Custody Agreement (the “Custody Agreement”) in connection therewith. The Bank of New York serves as the transfer agent (the “Transfer Agent”) of the Fund and has entered into a Transfer Agency and Service Agreement in connection therewith.
The Bank of New York, a banking corporation organized under the laws of the State of New York with trust powers, has an office at One Wall Street, New York, New York 10286. The Bank of New York is subject to supervision by the New York State Banking Department and the Board of Governors of the Federal Reserve System. Information regarding the net asset value of the Fund, creation and redemption transaction fees and the names of the parties that have executed a participant agreement may be obtained from the Administrator by calling the following number: (718) 315-4412. A copy of the Administration Agreement is available for inspection at the Fund’s trust office identified above.
Pursuant to the Administration Agreement, the Administrator performs or supervises the performance of services necessary for the operation and administration of the Fund and the Master Fund (other than making investment decisions), including net asset value calculations, accounting and other fund administrative services. The Administrator retains certain financial books and records, including: fund accounting records, ledgers with respect to assets, liabilities, capital, income and expenses, the registrar, transfer journals and related details and trading and related documents received from futures commission merchants. The Administration Agreement continues in effect from the commencement of trading operations unless terminated on at least ninety (90) days’ prior written notice by either party to the other party. Notwithstanding the foregoing, the Administrator may terminate the Administration Agreement upon thirty (30) days prior written notice if the Fund and/or Master Fund have materially failed to perform its obligations under the Administration Agreement.
The Administration Agreement provides for the exculpation and indemnification of the Administrator from and against any costs, expenses, damages, liabilities or claims (other than those resulting from the Administrator’s own bad faith, negligence or willful misconduct) which may be imposed on, incurred by or asserted against the Administrator in performing its obligations or duties under the Administration Agreement. Key terms of the Administration Agreement are summarized under the heading “Material Contracts.” The Administrator and any of its affiliates may from time-to-time purchase or sell Shares for their own account, as agent for their customers and for accounts over which they exercise investment discretion. The Administrator also receives a transaction processing fee in connection with orders from Authorized Participants to create or redeem share baskets consisting of 50,000 shares (“Baskets”) in the amount of $500 per order. These transaction processing fees are paid directly by the Authorized Participants and not by the Fund or the Master Fund. An Authorized Participant must (1) be a registered broker-dealer or other securities market participant such as a bank or other financial institution which is not required to register as a broker-dealer to engage in securities transactions, (2) be a participant in the Depository Trust Company, and (3) have entered into an agreement with the Fund and the Managing Owner (a Participant Agreement).The. The Managing Owner and the Administrator retain the services of one or more additional service providers to assist the Fund and/or the Master Fund with certain income tax reporting requirements of the Fund and its Shareholders.
19
16
The Distributor
The Managing Owner, on behalf of the Fund and the Master Fund, has appointed ALPS Distributor,Distributors, Inc., or the Distributor, (the “Distributor”) to assist the Managing Owner and the Administrator with certain functions and duties relating to the creation and redemption of Baskets, including receiving and processing orders from Authorized Participants to create and redeem Baskets, coordinating the processing of such orders and related functions and duties. The Distributor retains all marketing materials and Basket creation and redemption books and records at c/o ALPS Distributor,Distributors, Inc., 1290 Broadway, Suite 1100, Denver, CO 80203; Telephone number (303) 623-2577. Investors may contact the Distributor toll-free in the U.S. at (800) 320-2577. The Fund has entered into a Distribution Services Agreement with the Distributor.
The Distributor is affiliated with ALPS Mutual Fund Services, Inc., a Denver-based service provider of administration, fund accounting, transfer agency and shareholder services for mutual funds, closed-end funds and exchange-traded funds, with over 100,000 shareholder accounts and approximately $10 billion in client mutual fund assets under administration. The Distributor provides distribution services and has approximately $120 billion in client assets under distribution.funds.
The Marketing Agent
The Managing Owner, on behalf of the Fund and Master Fund, has appointed ALPS Distributors, Inc., or ALPS Fund Services, an affiliate of the Distributor, as a marketing agent (the “Marketing Agent”) to the Fund and Master Fund. ALPS Distributors, Inc.The Marketing Agent provides assistance to the Managing Owner with certain function and duties such as providing various educational and marketing activities regarding the Fund, primarily in the secondary trading market, which activities include, but are not limited to, communicating the Fund’s name, characteristics, uses, benefits, and risks, consistent with the prospectus, providing support to national account manager’smanagers’ and wholesalerswholesalers’ filed activities, and assisting national account managers in implementing sales strategy. ALPS Distributors, Inc.The Marketing Agent does not open or maintain customer accounts or handle orders for the Fund. ALPS Distributors, Inc.The Marketing Agent engages in public seminars, road shows, conferences, media interviews, fields incoming telephone “800”number calls and distributes sales literature and other communications (including electronic media) regarding the Fund. Investors may contact ALPS Distributors, Inc.the Marketing Agent toll-free in the U.S. at (800) 320-2577.
The Fund and the Master Fund have no employees. Management functions are performed by the Managing Owner and requisite administrative services are provided on a contractual basis by various entities.
Available Information
The Fund files with or submits to the SEC annual, quarterly and current reports and other information meeting the informational requirements of the Exchange Act. These reports are available, free of charge, on the Managing Owner’s website athttp://www.greenhavenfunds.com. Investors may also inspect and copy these reports, proxy statements and other information, and related exhibits and schedules, at the Public Reference Room of the SEC at 100 F Street, NE, Washington, D.C. 20549. Investors may obtain information on the operation of the Public Reference Room by calling the SEC at 1-800-SEC-0330. In addition, the SEC maintains an Internet site that contains reports, proxy and information statements and other information filed electronically by us with the SEC, which are available on the SEC’s Internet site athttp://www.sec.gov.
20
The Fund also posts quarterly performance reports and its annual report, as required by the Commodity Futures Trading Commission, on the Managing Owner’s website, free of charge, at the Internet address listed above.
CONFLICTS OF INTEREST
General
The Managing Owner has not established formal procedures to resolve all potential conflicts of interest. Consequently, investors may be dependent on the good faith of the respective parties subject to such conflicts to resolve them equitably. Although the Managing Owner attempts to monitor these conflicts, it is extremely difficult, if not impossible, for the Managing Owner to ensure that these conflicts do not, in fact, result in adverse consequences to the Fund. Investors should be aware that the Managing Owner presently intends to assert that Shareholders have, by subscribing for Shares of the Fund, consented to the following conflicts of interest in the event of any proceeding alleging that such conflicts violated any duty owed by the Managing Owner to investors:
17
The Managing Owner
The Managing Owner has a conflict of interest in allocating its own limited resources among different clients and potential future business ventures, to each of which it owes fiduciary duties. Additionally, the professional staff of the Managing Owner also services other affiliates of the Managing Owner and their respective clients. Although the Managing Owner and its professional staff cannot and will not devote all of its or their respective time or resources to the management of the business and affairs of the Fund and the Master Fund, the Managing Owner intends to devote, and to cause its professional staff to devote, sufficient time and resources properly to manage the business and affairs of the Fund and the Master Fund consistent with its or their respective fiduciary duties to the Fund and the Master Fund and others.
The Commodity BrokersBroker
The Commodity Broker may act from time to time as a commodity brokersbroker for other accounts with which it is affiliated or in which it or one of its affiliates has a financial interest. The compensation received by the Commodity BrokersBroker from such accounts may be more or less than the compensation received for brokerage services provided to the Master Fund. In addition, various accounts traded through the Commodity BrokersBroker (and over which theirits personnel may have discretionary trading authority) may take positions in the futures markets opposite to those of the Master Fund or may compete with the Master Fund for the same positions. The Commodity BrokersBroker may have a conflict of interest in theirits execution of trades for the Master Fund and for other customers. The Managing Owner will, however, not retain any commodity broker for the Master Fund which the Managing Owner has reason to believe would knowingly or deliberately favor any other customer over the Master Fund with respect to the execution of commodity trades.
The Commodity BrokersBroker will benefit from executing orders for other clients, whereas the Master Fund may be harmed to the extent that the Commodity Brokers haveBroker has fewer resources to allocate to the Master Fund’s accounts due to the existence of such other clients.
Certain officers or employees of the Commodity BrokersBroker may be members of United States commodities exchanges and/or serve on the governing bodies and standing committees of such exchanges, their clearing houses and/or various other industry organizations. In such capacities, these officers or employees may have a fiduciary duty to the exchanges, their clearing houses and/or such various other industry organizations which could compel such employees to act in the best interests of these entities, perhaps to the detriment of the Master Fund.
Proprietary Trading/Other Clients
The Managing Owner, the Commodity BrokersBroker and their respective principals and affiliates may trade in the commodity markets for their own accounts and for the accounts of their clients, and in doing so may take positions opposite to those held by the Master Fund or may compete with the Master Fund for positions in the marketplace. Such trading may create conflicts of interest on behalf of one or more such persons in respect of their obligations to the Master Fund. Records of proprietary trading and trading on behalf of other clients will not be available for inspection by Shareholders.
Because the Managing Owner, the Commodity BrokersBroker and their respective principals and affiliates may trade for their own accounts at the same time that they are managing the account of the Master Fund, prospective investors should be aware that — as a result of a neutral allocation system, testing a new trading system, trading their proprietary accounts more aggressively or other activities not constituting a breach of fiduciary duty — such persons may from time-to-time take positions in their proprietary accounts which are opposite, or ahead of, the positions taken for the Master Fund.
21
No Distributions
The Managing Owner has discretionary authority over all distributions made by the Fund. In view of the Fund’s objective of seeking significant capital appreciation, the Managing Owner currently does not intend to make any distributions, but, has the sole discretion to do so from time-to-time. Greater management fees will be generated to the benefit of the Managing Owner if the Fund’s assets are not reduced by distributions to the Shareholders.
USE OF PROCEEDS
A substantial amount of proceeds of the offering of Shares has and will be used by the Fund, through the Master Fund, to engage in the trading of exchange-traded futures on the Index Commodities with a view to reflecting the performance of the Index over time, less the expenses of the operations of the Fund and the Master Fund. The Master Fund’s portfolio also includeincludes United States Treasury securities and other high credit quality short-term fixed income securities for deposit with the Master Fund’s Commodity BrokersBroker as margin and other high credit quality short-term fixed income securities.margin.
18
To the extent that the Master Fund trades in futures contracts on United States exchanges, the assets deposited by the Master Fund with its Commodity BrokersBroker as margin must be segregated pursuant to the regulations of the CFTC. Such segregated funds may be invested only in a limited range of instruments — principally U.S. government obligations.instruments.
Although the percentages set forth below may vary substantially over time, as of the date of this Form 10-K, the Master Fund estimates:
| (i) | up to approximately 10% of the net asset value of the Master Fund has and will be placed in segregated accounts in the name of the Master Fund with the Commodity |
| (ii) | approximately 90% of the net asset value of the Master Fund will be maintained in segregated accounts in the name of the Master Fund in bank deposits or United States Treasury and United States Government Agencies issues. |
The Managing Owner, a registered commodity pool operator and commodity trading advisor, will beis responsible for the cash management activities of the Master Fund, including investing in United States Treasury and United States Government Agencies issues.
In addition, assets of the Master Fund not required to margin positions may be maintained in United States bank accounts opened in the name of the Master Fund and may be held in United States Treasury bills (or other securities approved by the CFTC for investment of customer funds).
The Master Fund receives 100% of the interest income earned on its interest income assets.
FEES AND CHARGES
Upfront Selling Commissions
No upfront selling commissions are charged to Shareholders, although investors are expected to be charged a customary commission by their brokers in connection with purchases of Shares that will vary from investor to investor. Investors are encouraged to review the terms of their brokerage accounts for details on applicable charges. Also, the excess, if any, of the price at which an Authorized Participant sells a Share over the price paid by such Authorized Participant in connection with the creation of such Share in a Basket may be deemed to be underwriting compensation.
Management Fee
The Master Fund will paypays the Managing Owner a Management Fee, monthly in arrears, in an amount equal to 0.85% per annum of the average amount of daily net assets of the Master Fund during the Calendar year. No separate fee will beis paid by the Fund.
22
Organization and Offering Expenses
Expenses incurred in connection with organizing the Fund and the Master Fund and the offering of Shares will beis paid by GreenHaven, LLC, a limited liability company organized in the State of Georgia, which is the sole member of the Managing Owner. Neither GreenHaven, LLC nor the Managing Owner will beis reimbursed in connection with the payment of the organizational and offering expenses.
Organization and offering expenses relating to both the Master Fund and the Fund, as applicable, means those expenses incurred in connection with their formation, the qualification and registration of the Shares and in offering, distributing and processing the Shares under applicable federal law, and any other expenses actually incurred and, directly or indirectly, related to the organization of the Fund and Master Fund or the offering of the Shares, including, but not limited to, expenses such as:
| (i) | initial and ongoing registration fees, filing fees, escrow fees and taxes; | ||
| (ii) | costs of preparing, printing (including typesetting), amending, supplementing, mailing and distributing the Registration Statement, the exhibits thereto and the Prospectus of the Fund; | ||
19
| (iii) | the costs of qualifying, printing, (including typesetting), amending, supplementing, mailing and distributing sales materials used in connection with the offering and issuance of the Shares; | ||
| (iv) | travel, telephone and other expenses in connection with the offering and issuance of the Shares. |
Brokerage Commissions and Fees
Routine Operational, Administrative and Other Ordinary Expenses
During the continuous offering period the Managing Owner paid all of the routine operational, administrative and other ordinary expenses of the Index Fund and the Master Fund, including, but not limited to, accounting and computer services, the fees and expenses of the Trustee, legal fees and expenses, tax preparation expenses, filing fees, fees in connection with fund administration, and printing, mailing and duplication costs. The Managing Owner may be reimbursed for routine operational, administrative and other ordinary expenses. See above Section “Brokerage Commissions and Fees” for details of the Fund’s brokerage commissions and fees and routine operational, administrative and other ordinary expenses accrual policy.
Unusual Fees and Expenses
The Master Fund pays all its extraordinaryunusual fees and expenses, if any, of the Fund and Master Fund generally, if any, as determined by the Managing Owner. ExtraordinaryUnusual fees and expenses are fees and expenses which are non-recurring and unusual in nature, such as legal claims and liabilities and litigation costs and any permitted indemnification payments related thereto. ExtraordinaryUnusual fees and expenses shall also include material expenses which are not currently anticipated obligations of the Fund or Master Fund or of managed futures funds in general. Routine operational, administrative and other ordinary expenses will not be deemed extraordinaryunusual expenses.
Management Fee and Ongoing Expenses to be Paid First out of Interest Income
The Management Fee and ordinary ongoing expenses of the Fund and the Master Fund will be paid first out of interest income from the Master Fund’s holdings of U.S. Treasury bills and other high credit quality short-term fixed income securities on deposit with the Commodity Broker as margin or otherwise. It is expected that, at current interest rates, such interest income will not be sufficient to cover all or a significant portion of the Management Fee and ordinary ongoing expenses of the Fund and the Master Fund.
23
MATERIAL CONTRACTS
License Agreement
Thomson Reuters America, LLC entered into a License Agreement with the Managing Owner granting the Managing Owner an exclusive, non-transferable right to use the Index in connection with the development and creation of U.S. exchange traded funds in the U.S. theThe Managing Owner is responsible for paying the fees associated with the licensing fee, and the Fund and Master Fund will not be required to pay any additional amount to Thomson Reuters America, LLC.
The current term of the License Agreement runs until October 1, 20102013 (subject to the right of Thomson Reuters America, LLC to terminate the exclusivity at any time in the event of certain limited circumstances related to specified asset investment thresholds). On the date of filing this Form 10-K, the Managing Owner is in compliance with these thresholds.
Brokerage Agreement
The Commodity BrokersBroker and the Master Fund entered into brokerage agreements, or (“Brokerage Agreements”). As a result, the Commodity Brokers:Broker:
20
| (i) | |||
| (ii) | |||
| (iii) |
As clearing brokersbroker for the Master Fund, the Commodity Brokers receiveBroker receives orders for trades from the Managing Owner.
Confirmations of all executed trades are given to the Master Fund by the Commodity Brokers.Broker. The Brokerage Agreement incorporates the Commodity Brokers’Broker’s standard customer agreements and related documents, which generally include provisions that:
| (i) | all | ||
| (ii) | the margins required to initiate or maintain open positions will be as from time-to-time established by the Commodity | ||
| (iii) | the Commodity |
As custodian of the Master Fund’s assets, the Commodity Brokers areBroker is responsible, among other things, for providing periodic accountings of all dealings and actions taken by the Master Fund during the reporting period, together with an accounting of all securities, cash or other indebtedness or obligations held by it or its nominees for or on behalf of the Master Fund.
Administrative functions provided by the Commodity BrokersBroker to the Master Fund include, but are not limited to, preparing and transmitting daily confirmations of transactions and monthly statements of account, calculating equity balances and margin requirements.
As long as the Brokerage Agreements between the Commodity BrokersBroker and the Master Fund are in effect, the Commodity BrokersBroker will not charge the Master Fund a fee for any of the services they haveit has agreed to perform, except for the agreed-upon brokerage fee.
The Brokerage Agreements are not exclusive and run for successive one-year terms to be renewed automatically each year unless terminated. Each Brokerage Agreement is terminable by the Master Fund or the respective Commodity Broker without penalty upon thirty (30) days’ prior written notice (unless where certain events of default occur or there is a material adverse change to the Master Fund’s financial position, in which case only prior written notice is required to terminate the Brokerage Agreements).
24
The Brokerage Agreements provideAgreement provides that neither the Commodity BrokersBroker nor any of theirits respective managing directors, officers, employees or affiliates shall be liable for any costs, losses, penalties, fines, taxes and damages sustained or incurred by the Master Fund other than as a result of the respective Commodity Broker’s gross negligence or reckless or willful intentional misconduct or breach of such agreement.
Administration Agreement
Pursuant to the Administration Agreement among the Fund, the Master Fund and the Administrator, the Administrator will perform or supervise the performance of services necessary for the operation and administration of the Fund and the Master Fund (other than making investment decisions), including net asset value calculations, accounting and other fund administrative services.
The Administration Agreement will continue in effect from the commencement of trading operations unless terminated on at least ninety (90) days’ prior written notice by either party to the other party. Notwithstanding the foregoing, the Administrator may terminate the Administration Agreement upon thirty (30) days’ prior written notice if the Fund and/or Master Fund has materially failed to perform its obligations under the Administration Agreement or upon termination of the Global Custody Agreement.
21
The Administrator is both exculpated and indemnified under the Administration Agreement.
Except as otherwise provided in the Administration Agreement, the Administrator shall not be liable for any costs, expenses, damages, liabilities or claims (including attorneys’ and accountants’ fees) incurred by either the Fund or Master Fund, except those costs, expenses, damages, liabilities or claims arising out of the Administrator’s own gross negligence or willful misconduct. In no event shall the Administrator be liable to the Fund, Master Fund or any third party for special, indirect or consequential damages, or lost profits or loss of business, arising under or in connection with the Administration Agreement, even if previously informed of the possibility of such damages and regardless of the form of action. The Administrator shall not be liable for any loss, damage or expense, including counsel fees and other costs and expenses of a defense against any claim or liability, resulting from, arising out of, or in connection with its performance under the Administration Agreement, including its actions or omissions, the incompleteness or inaccuracy of any Proper Instructions (as defined therein), or for delays caused by circumstances beyond the Administrator’s control, unless such loss, damage or expense arises out of the gross negligence or willful misconduct of the Administrator.
Both the Fund and Master Fund shall indemnify and hold harmless the Administrator from and against any and all costs, expenses, damages, liabilities and claims (including claims asserted by either the Fund or Master Fund), and reasonable attorneys’ and accountants’ fees relating thereto, which are sustained or incurred or which may be asserted against the Administrator by reason of or as a result of any action taken or omitted to be taken by the Administrator in good faith under the Administration Agreement or in reliance upon (i) any law, act, regulation or interpretation of the same even though the same may thereafter have been altered, changed, amended or repealed, (ii) the Fund’s Registration Statements or Prospectuses, (iii) any Proper Instructions, or (iv) any opinion of legal counsel for the Fund or Master Fund, or arising out of transactions or other activities of the Fund or Master Fund which occurred prior to the commencement of the Administration Agreement; provided, that neither the Fund nor Master Fund shall indemnify the Administrator for costs, expenses, damages, liabilities or claims for which the Administrator is liable under the preceding paragraph. This indemnity shall be a continuing obligation of both the Fund and Master Fund, their successors and assigns, notwithstanding the termination of the Administration Agreement. Without limiting the generality of the foregoing, each of the Fund or Master Fund shall indemnify the Administrator against and save the Administrator harmless from any loss, damage or expense, including counsel fees and other costs and expenses of a defense against any claim or liability, arising from any one or more of the following: (i) errors in records or instructions, explanations, information, specifications or documentation of any kind, as the case may be, supplied to the Administrator by any third party described above or by or on behalf of the Fund or Master Fund; (ii) action or inaction taken or omitted to be taken by the Administrator pursuant to Proper Instructions of the Fund or Master Fund or otherwise without gross negligence or willful misconduct; (iii) any action taken or omitted to be taken by the Administrator in good faith in accordance with the advice or opinion of counsel for the Fund or Master Fund or its own counsel; (iv) any improper use by the Fund or Master Fund or their agents, distributor or investment advisor of any valuations or computations supplied by the Administrator pursuant to the Administration Agreement; (v) the method of valuation and the method of computing net asset value; or (vi) any valuations or net asset value provided by the Fund or Master Fund.
25
Actions taken or omitted in reliance on Proper Instructions, or upon any information, order, indenture, stock certificate, power of attorney, assignment, affidavit or other instrument believed by the Administrator to be genuine or bearing the signature of a person or persons believed to be authorized to sign, countersign or execute the same, or upon the opinion of legal counsel for the Fund or Master Fund or its own counsel, shall be conclusively presumed to have been taken or omitted in good faith.
Notwithstanding any other provision contained in the Administration Agreement, the Administrator shall have no duty or obligation with respect to, including, without limitation, any duty or obligation to determine, or advise or notify the Fund or Master Fund of: (a) the taxable nature of any distribution or amount received or deemed received by, or payable to the Fund or Master Fund; (b) the taxable nature or effect on the Fund or Master Fund or their shareholders of any corporate actions, class actions, tax reclaims, tax refunds, or similar events; (c) the taxable nature or taxable amount of any distribution or dividend paid, payable or deemed paid by the Fund or Master Fund to their shareholders; or (d) the effect under any federal, state, or foreign income tax laws of the Fund or Master Fund making or not making any distribution or dividend payment, or any election with respect thereto.
Global Custody Agreement
The Bank of New York, N.A. will serve as the Fund’s custodian, or Custodian. Pursuant to the Global Custody Agreement between the Fund and the Custodian, or Custody Agreement, the Custodian serves as custodian of all the Fund’s securities and cash at any time delivered to Custodian during the term of the Custody Agreement and the Fund has authorized the Custodian to hold its securities in registered form in its name or the name of its nominees. The Custodian has established and will maintain one or more securities accounts and cash accounts pursuant to the Custody Agreement. The Custodian shall maintain books and records segregating the assets.
22
Either party may terminate the Custody Agreement by giving to the other party a notice in writing specifying the date of such termination, which shall be not less than ninety (90) days after the date of such notice. Upon termination thereof, the Fund shall pay to the Custodian such compensation as may be due to the Custodian, and shall likewise reimburse the Custodian for other amounts payable or reimbursable to the Custodian thereunder. The Custodian shall follow such reasonable oral or written instructions concerning the transfer of custody of records, securities and other items as the Fund shall give; provided, that (a) the Custodian shall have no liability for shipping and insurance costs associated therewith, and (b) full payment shall have been made to Custodian of its compensation, costs, expenses and other amounts to which it is entitled hereunder. If any securities or cash remain in any account, Custodian may deliver to the Fund such securities and cash. Except as otherwise provided herein, all obligations of the parties to each other hereunder shall cease upon termination of the Custody Agreement.
The Custodian is both exculpated and indemnified under the Custody Agreement.
Except as otherwise expressly provided in the Custody Agreement, the Custodian shall not be liable for any costs, expenses, damages, liabilities or claims, including attorneys’ and accountants’ fees, or losses, incurred by or asserted against the Fund, except those losses arising out of the gross negligence or willful misconduct of the Custodian. The Custodian shall have no liability whatsoever for the action or inaction of any depository. Subject to the Custodian’s delegation of its duties to its affiliates, the Custodian’s responsibility with respect to any securities or cash held by a subcustodiansub-custodian is limited to the failure on the part of the Custodian to exercise reasonable care in the selection or retention of such subcustodiansub-custodian in light of prevailing settlement and securities handling practices, procedures and controls in the relevant market. With respect to any losses incurred by the Fund as a result of the acts or the failure to act by any subcustodiansub-custodian (other than an affiliate of the Custodian), the Custodian shall take appropriate action to recover such losses from such subcustodian;sub-custodian; and the Custodian’s sole responsibility and liability to the Fund shall be limited to amounts so received from such subcustodiansub-custodian (exclusive of costs and expenses incurred by the Custodian). In no event shall the Custodian be liable to the Fund or any third party for special, indirect or consequential damages, or lost profits or loss of business, arising in connection with the Custody Agreement.
The Fund shall indemnify the Custodian and each subcustodiansub-custodian for the amount of any tax that the Custodian, any such subcustodiansub-custodian or any other withholding agent is required under applicable laws (whether by assessment or otherwise) to pay on behalf of, or in respect of income earned by or payments or distributions made to or for the account of the Fund (including any payment of tax required by reason of an earlier failure to withhold). The Custodian shall, or shall instruct the applicable subcustodiansub-custodian or other withholding agent to, withhold the amount of any tax which is required to be withheld under applicable law upon collection of any dividend, interest or other distribution made with respect to any security and any proceeds or income from the sale, loan or other transfer of any security. In the event that the Custodian or any subcustodiansub-custodian is required under applicable law to pay any tax on behalf of Fund, the Custodian is hereby authorized to withdraw cash from any cash account in the amount required to pay such tax and to use such cash, or to remit such cash to the appropriate subcustodian,sub-custodian, for the timely payment of such tax in the manner required by applicable law.
26
The Fund will indemnify the Custodian and hold the Custodian harmless from and against any and all losses sustained or incurred by or asserted against the Custodian by reason of or as a result of any action or inaction, or arising out of the Custodian’s performance under the Custody Agreement, including reasonable fees and expenses of counsel incurred by the Custodian in a successful defense of claims by the Fund; provided however, that the Fund shall not indemnify the Custodian for those losses arising out of the Custodian’s gross negligence or willful misconduct. This indemnity shall be a continuing obligation of Fund, its successors and assigns, notwithstanding the termination of the Custody Agreement.
Transfer Agency and Service Agreement
The Bank of New York Mellon, N.A. will serve as the Fund’s transfer agent, or Transfer Agent. Pursuant to the Transfer Agency and Service Agreement between the Fund and the Transfer Agent, the Transfer Agent will serve as the Fund’s transfer agent, dividend disbursing agent, and agent in connection with certain other activities as provided under the Transfer Agency and Service Agreement.
23
The term of the Transfer Agency and Service Agreement is one (1) year from the effective date and shall automatically renew for additional one year terms unless either party provides written notice of termination at least ninety (90) days’ prior to the end of any one year term or, unless earlier terminated as provided below:
| (i) | Either party terminates prior to the expiration of the initial term in the event the other party breaches any material provision of the Transfer Agency and Service Agreement, including, without limitation in the case of the Fund, its obligations to compensate the Transfer Agent, provided that the non-breaching party gives written notice of such breach to the breaching party and the breaching party does not cure such violation within ninety (90) days of receipt of such notice. |
| (ii) | The Fund may terminate the Transfer Agency and Service Agreement prior to the expiration of the initial term upon ninety (90) days’ prior written notice in the event that the Managing Owner determines to liquidate the Fund and terminate its registration with the Securities and Exchange Commission other than in connection with a merger or acquisition of the Fund. |
The Transfer Agent shall have no responsibility and shall not be liable for any loss or damage unless such loss or damage is caused by its own gross negligence or willful misconduct or that of its employees, or its breach of any of its representations. In no event shall the Transfer Agent be liable for special, indirect or consequential damages regardless of the form of action and even if the same were foreseeable.
Pursuant to the Transfer Agency and Service Agreement, the Transfer Agent shall not be responsible for, and the Fund shall indemnify and hold the Transfer Agent harmless from and against, any and all losses, damages, costs, charges, counsel fees, payments, expenses and liability, or Losses, arising out of or attributable to:
| (i) | All actions of the Transfer Agent or its agents or |
| (ii) | The Fund’s gross negligence or willful misconduct; |
| (iii) | The breach of any representation or warranty of the Fund thereunder; |
| (iv) | The conclusive reliance on or use by the Transfer Agent or its agents or subcontractors of information, records, documents or services which (i) are received by the Transfer Agent or its agents or subcontractors, and (ii) have been prepared, maintained or performed by the Fund or any other person or firm on behalf of the Fund including but not limited to any previous transfer agent or registrar; |
27
| (v) | The conclusive reliance on, or the carrying out by the Transfer Agent or its agents or subcontractors of any instructions or requests of the Fund on behalf of the Fund; |
| (vi) | The offer or sale of Shares in violation of any requirement under the federal securities laws or regulations or the securities laws; or |
| (vii) | Regulations of any state that such Shares be registered in such state or in violation of any stop order or other determination or ruling by any federal agency or any state with respect to the offer or sale of such Shares in such state. |
Distribution Services Agreement
The Distributor will provide certain distribution services to the Fund. Pursuant to the Distribution Services Agreement between the Fund and the Distributor, the Distributor will assist the Managing Owner and the Administrator with certain functions and duties relating to the creation and redemption of Baskets.
The Distribution Services Agreement, originally dated January 16, 2007 (as amended on May 15, 2009)2009 and January 7, 2011) shall continue until two years from such date and thereafter shall continue automatically for successive annual periods, provided that such continuance is specifically approved at least annually by the Fund’s Managing Owner or otherwise as provided under the Distribution Services Agreement. The Distribution Services Agreement is terminable without penalty on sixty (60) days’ written notice by the Fund’s Managing Owner or by the Distributor. In accordance with the terms of the Distribution Services Agreement, the Managing Owner has informed the Distributor that instead of automatically renewing it intends to meet with the Distributor to review the terms of the agreement. The terms of the present agreement remains in effect until amended. The Distribution Services Agreement shall automatically terminate in the event of its assignment.
24
Pursuant to the Distribution Services Agreement, the Fund indemnifies and holds harmless the Distributor and each of its directors and officers and each person, if any, who controls the Distributor within the meaning of Section 15 of the 1933 Act, against any loss, liability, claim, damages or expenses (including the reasonable cost of investigating or defending any alleged loss, liability, claim, damages or expense and reasonable counsel fees incurred in connection therewith) arising by reason of any person acquiring any Shares, based upon the ground that the registration statement, prospectus, statement of additional information, shareholder reports or other information filed or made public by the Fund (as from time-to-time amended) included an untrue statement of a material fact or omitted to state a material fact required to be stated or necessary in order to make the statements not misleading under the 1933 Act or any other statute or the common law. However, the Fund does not indemnify the Distributor or hold it harmless to the extent that the statement or omission was made in reliance upon, and in conformity with, information furnished to the Fund by or on behalf of the Distributor. In no case (i) is the indemnity of the Fund in favor of the Distributor or any person indemnified to be deemed to protect the Distributor or any person against any liability to the Fund or its security holders to which the Distributor or such person would otherwise be subject by reason of willful misfeasance, bad faith or negligence in the performance of its duties or by reason of its reckless disregard of its obligations and duties under this Agreement, or (ii) is the Fund to be liable under its indemnity agreement contained in this paragraph with respect to any claim made against the Distributor or any person indemnified unless the Distributor or person, as the case may be, shall have notified the Fund in writing of the claim promptly after the summons or other first written notification giving information of the nature of the claims shall have been served upon the Distributor or any such person (or after the Distributor or such person shall have received notice of service on any designated agent).
However, failure to notify the Fund of any claim shall not relieve the Fund from any liability which it may have to any person against whom such action is brought otherwise than on account of its indemnity agreement contained in this paragraph. The Fund shall be entitled to participate at its own expense in the defense, or, if it so elects, to assume the defense of any suit brought to enforce any claims, and if the Fund elects to assume the defense, the defense shall be conducted by counsel chosen by the Fund. In the event the Fund elects to assume the defense of any suit and retain counsel, the Distributor, officers or directors or controlling person(s), defendant(s) in the suit, shall bear the fees and expenses of any additional counsel retained by them. If the Fund does not elect to assume the defense of any suit, it will reimburse the Distributor, officers or directors or controlling person(s) or defendant(s) in the suit for the reasonable fees and expenses of any counsel retained by them. The Fund has agreed to notify the Distributor promptly of the commencement of any litigation or proceeding against it or any of its officers in connection with the issuance or sale of any of the Shares.
28
Marketing Services Agreement
The Marketing Agent provides certain marketing services to the Fund. Pursuant to the Marketing Agreement, as amended from time-to-time,time to time, between the Managing Owner, on behalf of the Fund and Master Fund, and the Marketing Agent, the Marketing Agent assists the Managing Owner with certain functions and duties such as providing various educational and marketing activities regarding the Fund, primarily in the secondary trading market, which activities include, but are not limited to, communicating the Fund’s name, characteristics, uses, benefits, and risks, consistent with the prospectus, providing support to an extensive broker database and a network of internal and external wholesalers. The Marketing Agent will not open or maintain customer accounts or handle orders for the Fund. The Marketing Agent will engage in public seminars, road shows, conferences, media interviews, field incoming telephone “800” number calls and distribute sales literature and other communications (including electronic media) regarding the Fund.
The date of the Marketing Services Agreement is(dated January 14, 2008 (asas amended, including on April 30, 2009, and May 15, 2009) will continue until2009, and August 16, 2010) had an original term of two years from January 14, 2008, and thereafter will continuecontinuing automatically for successive annual periods, unless a party provides notice to the other party within 60 days of the termination of the then current term.
Pursuant to the Marketing Agreement, each party will indemnify and hold harmless the other party against all losses, costs and expenses (including reasonable attorney’s fees) that an indemnified party incurs by reason or result of or arising from the breach of any terms, provisions, covenants, warranties or representations contained in the Marketing Agreement.
29
You could lose money investing in the Shares. You should consider carefully the risks described below and elsewhere in this Form 10K before making an investment decision.
The Value of the Shares Relates Directly to the Value of the Commodity Futures and Other Assets Held by the Master Fund and Fluctuations in the Price of These Assets Could Materially Adversely Affect an Investment in the Shares.
The Shares are designed to reflect, as closely as possible, the performance of the Index through the Master Fund’s portfolio of exchange-traded futures on the Index Commodities. The value of the Shares relate directly to the value of the portfolio, less the liabilities (including estimated accrued but unpaid expenses) of the Fund and the Master Fund. The price of the Index Commodities may fluctuate widely based on many factors. Some of those factors are:
changing supply and demand relationships;
general economic activities and conditions;
| • | weather and other environmental conditions; |
| • | acts of God; |
| • | agricultural, fiscal, monetary and exchange control programs and policies of governments; |
| • | national and international political and economic events and policies; |
| • | changes in rates of inflation; or |
| • | the general emotions and psychology of the marketplace, which at times can be volatile and unrelated to other more tangible factors. |
In addition to the factors set forth above, each commodity has risks that are inherent in the investment in such commodity.
Metals Commodities: Price movements in futures contracts held by the Master Fund, in metals commodities such as gold, silver, platinum and copper are affected by many specific other factors. Some of these metal specific factors include, but are not limited to:
| • | A change in economic conditions, such as a recession, can adversely affect the price of both industrial and precious metals. An economic downturn may have a negative impact on the usage and demand of metals which may result in a loss for the Master Fund. |
| • | A sudden shift in political conditions of the world’s leading metal producers may have a negative effect on the global pricing of metals. |
| • | An increase in the hedging of precious metals may result in the price of precious metals to decline. |
| • | Changes in global supply and demand for industrial and precious metals. |
| • | The price and quantity of imports and exports of industrial and precious metals. |
| • | Technological advances in the processing and mining of industrial and precious metals. |
Agricultural Commodities: Price movements in futures contracts held by the Master Fund in agricultural commodities, such as wheat, corn and soybeans, are affected by many factors. Some of these agricultural specific factors include, but are not limited to:
30
| • | Farmer planting decisions, general economic, market and regulatory factors all influence the price of agricultural commodities. |
| • | Weather conditions, including hurricanes, tornadoes, storms and droughts, may have a material adverse effect on crops, live cattle, live hogs and lumber, which may result in significant fluctuations in prices in such commodities. |
| • | Changes in global supply and demand for agriculture products. |
| • | The price and quantity of imports and exports of agricultural commodities. |
26
| • | Political conditions, including embargoes and war, in or affecting agricultural production, imports and exports. |
| • | Technological advances in agricultural production. | ||
The price and availability of alternative agricultural commodities.
Energy Commodities: Price movements in futures contracts held by the Master Fund in energy commodities, such as crude oil, heating oil and natural gas, are subject to risks due to frequent and often substantial fluctuations in energy commodity prices. In the past, the prices of natural gas and crude oil have been extremely volatile, and the Managing Owner expects this volatility to continue. The markets and prices for energy commodities are affected by many factors. Some of those factors include, but are not limited to:
| • | Changes in global supply and demand for oil and natural gas. | ||
| • | The price and quantity of imports and exports of oil and natural gas. |
| • | Political conditions, including embargoes and war, in or affecting other oil producing activities. |
| • | The level of global oil and natural gas exploration and production. |
| • | The level of global oil and natural gas inventories, production or pricing. |
| • | Weather conditions. | |
| • | Technological advances effecting energy consumption. | ||
| • | The price and availability of alternative fuels. |
None of these factors can be controlled by the Managing Owner. Even if current and correct information as to substantially all factors are known or thought to be known, prices still will not always react as predicted. The profitability of the Fund and the Master Fund will depend on whether the Master Fund’s commodities portfolio increases in value over time. If the value increases, the Fund will only be profitable if such increases exceed the fees and expenses of the Fund. If these values do not increase, the Fund will not be profitable and will incur losses.
Net Asset Value May Not Always Correspond to Market Price and, as a Result, Baskets may be Created or Redeemed at a Value that Differs from the Market Price of the Shares.
The net asset value per share of the Shares will change as fluctuations occur in the market value of the Master Fund’s portfolio. Investors should be aware that the public trading price of a Basket of Shares may be different from the net asset value of a Basket of Shares (i.e., Shares may trade at a premium over, or a discount to, the net asset value of a Basket of Shares) and similarly the public trading market price per Share may be different from the net asset value per Share. Consequently, an Authorized Participant may be able to create or redeem a Basket of Shares at a discount or a premium to net asset value. This price difference may be due, in large part, to the fact that supply and demand forces are at work in the secondary trading market for Shares that is closely related to, but not identical to, the same forces influencing the prices of the Index Commodities trading individually or in the aggregate at any point in time.
Investors also should note that the size of the Fund in terms of total assets held may change substantially over time and from time-to-timetime to time as Baskets are created and redeemed. Authorized Participants or their clients or customers may have an opportunity to realize a riskless profit if they can purchase a Creation Basket at a discount to the public trading price of the Shares or can redeem a Redemption Basket at a premium over the public trading price of the Shares. The Managing Owner expects that the exploitation of such arbitrage opportunities by Authorized Participants and their clients and customers will tend to cause the public trading price to track net asset value per Share closely over time.
Your investment could suffer in the event that Thomson Reuters America LLC decides to terminate the license agreement between itself and the Managing Owner.
Thomson Reuters America LLC entered into a License Agreement with the Managing Owner on October 11, 2006 whereby the Managing Owner was granted an exclusive license with respect to the development and creation of U.S. exchange traded funds. The License Agreementamended license agreement granted to the Managing Owner (as subsequently amended on September 18, 2007, July 7, 2008, and September 30, 2010), among other things, to extend the exclusivity period of the license tohas a term ending October 1st, 20101, 2013 and may be terminated under certain circumstances which could cause your investment to decline significantly in value. In addition to that, because the license granted is an exclusive license with respect to a limited type of investment product, a different product could be created, which could also cause your investment to decline in value. If the license expires and is not renewed or is terminated, or a competitive product is created, then the Managing Owner wouldcould seek shareholder approval to either (i) liquidate the Master Fund and the Fund or (ii) approve a different index to track for comparison purposes.
31
27
Your investment could suffer in the event that the Managing Owner creates another product under its exclusive license agreement which directly competes with the Fund and Master Fund.
The License Agreement is between Thomson Reuters America LLC and the Managing Owner and not between Thomson Reuters America LLC and the Fund or Master Fund. Therefore, it is possible that the Managing Owner could create and manage another investment product that is substantially similar to the Fund and the Master Fund. If this were to happen, then your investment could suffer.
Regulatory and Exchange Position Limits and Other Rules May Restrict the Creation of Baskets and the Operation of the Master Fund.
In the past the CFTC and the commodity exchange rules imposehave imposed speculative position limits in certain agricultural commodities on market participants classed as “speculative”, which could includeincluded the Master Fund, trading in certain agricultural commodities. These position limits prohibitprohibited any person from holding a position of more than a specific number of such futures contracts. As part of the Dodd-Frank Wall Street Reform and Consumer Protection Act, these limits are being revised and expanded, and their final form is not yet known. The Managing Owner anticipates that thesesuch position limits, as well as accountability limits currently in place on exchanges, will not become more of an issue whenuntil the Master Fund reaches close to US$1 billion ofa net asset value in excess of US$2.1 billion, at which point the Managing Owner may either prevent the issuance of additional creation units or may apply to the CFTC for relief from certain position limits.
If the Master Fund applies and is unable to obtain such relief, the Fund’s ability to issue new Baskets, or the Master Fund’s ability to reinvest income in these additional futures contracts, may be limited to the extent these activities would cause the Master Fund to exceed applicable position limits. Limiting the size of the Fund may affect the correlation between the price of the Shares, as traded on the NYSE, and the net asset value of the Fund. That is, the inability to create additional Baskets could result in Shares trading at a premium or discount to the net asset value of the Fund.
The Fund May Not Always Be Able Exactly to Replicate the Performance of the Index.
It is possible that the Fund may not fully replicate the performance of the Index due to disruptions in the markets for the Index Commodities or due to other extraordinary circumstances. In addition, the Fund is not able to replicate exactly the performance of the Index because the total return generated by the Master Fund is reduced by expenses and transaction costs, including those incurred in connection with the Master Fund’s trading activities, and increased by interest income from the Master Fund’s holdings of short-term high quality fixed income securities. Tracking the Index requires rebalancing of the Master Fund’s portfolio and is dependent upon the skills of the Managing Owner and its trading principals, among other factors.
If the Managing Owner permits the Fund to control commodity positions in excess of the value of the Fund’s assets, you could lose all or substantially all of your investment.
Commodity pools’ trading positions in futures contracts or other commodity interests are typically required to be secured by the deposit of margin funds that represent only a small percentage of a futures contract’s (or other commodity interests’) entire market value. This feature permits commodity pools to increase their exposure to assets by purchasing or selling futures contracts (or other commodity interests) with an aggregate value in excess of the commodity pool’s assets. While these actions can increase the pool’s profits, relatively small adverse movements in the price of the pool’s futures contracts can cause significant or complete losses to the pool. While the Managing Owner has not and does not intend to have exposure to futures contracts in excess of the Fund’s collateral, the Fund is dependent upon the trading and management skills of the Managing Owner to maintain the proper position sizes.
The Master Fund Is Not Actively Managed and Will Track the Index During Periods in which the Index Is Flat or Declining as well as when the Index Is Rising.
The Master Fund is not actively managed by traditional methods. Therefore, if positions in any one or more of the Index Commodities are declining in value, the Master Fund will not close out such positions, except in connection with a change in the composition or weighting of the Index. The Managing Owner will seek to cause the net asset value to track the Index during periods in which the Index is flat or declining as well as when the Index is rising.
32
28
The Exchange May Halt Trading in the Shares Which Would Adversely Impact Your Ability to Sell Shares.
The Shares are listed for trading on the NYSE Arca platform under the market symbol “GCC.” Trading in Shares may be halted due to market conditions or, in light of NYSE rules and procedures, for reasons that, in the view of the NYSE, make trading in Shares inadvisable. In addition, trading is subject to trading halts caused by extraordinary market volatility pursuant to “circuit breaker” rules that require trading to be halted for a specified period based on a specified market decline in the equity markets. There can be no assurance that the requirements necessary to maintain the listing of the Shares will continue to be met or will remain unchanged. The Fund and the Master Fund will be terminated if the Shares are de-listed.
The Lack of an Active Trading Market for the Shares May Result in Losses on Your Investment at the Time of Disposition of Your Shares.
Although the Shares are listed and traded on the NYSE Arca platform, there can be no guarantee that an active trading market for the Shares will be maintained. If you need to sell your Shares at a time when no active market for them exists, the price you receive for your Shares, assuming that you are able to sell them, will likely be lower than the price you would have received if an active market did exist.
The Shares Are a New Securities Product and theirShares’ Value Could Decrease if Unanticipated Operational or Trading Problems Arise.
The mechanisms and procedures governing the creation, redemption and offering of the Shares are recently developed securities products. Consequently, there may be unanticipated problems or issues with respect to the mechanics of the operations and the trading of the Shares that could have a material adverse effect on an investment in the Shares. In addition, although the Master Fund is not actively “managed” by traditional methods, to the extent that unanticipated operational or trading problems or issues arise, the Managing Owner’s past experience and qualifications may not be suitable for solving these problems or issues.
As the Managing Owner and its Principals have no prior History ofOnly Been Operating an Investment Vehicle like the Fund orand the Master Fund Since January 2008, their Experience may be Inadequate or Unsuitable to Manage the Fund or the Master Fund.
The Managing Owner was formed expressly to be the managing owner of the Fund and the Master Fund and has no history of past performance apart from the history of the Fund and the Master Fund. The past performances of the Managing Owner’s management in other positions are no indication of its ability to manage an investment vehicle such as the Fund or the Master Fund. If the experience of the Managing Owner and its principals is not adequate or suitable to manage an investment vehicle such as the Fund and the Master Fund, the operations of the Fund and the Master Fund may be adversely affected.
You Should Not Rely on Past Performance in Deciding Whether to Buy Shares.
The past performance of the Index is not necessarily indicative of the future performance of the Index, or of the Fund or the Master Fund.
Price Volatility May Possibly Cause the Total Loss of Your Investment.
Futures contracts have a high degree of price variability and are subject to occasional rapid and substantial changes. Consequently, you could lose all or substantially all of your investment in the Fund.
Fees are Charged Regardless of Profitability and May Result in Depletion of Assets.
The Fund indirectly is subject to the fees and expenses described herein which are payable irrespective of profitability. Such fees and expenses include asset-based fees of up to 0.85% per annum. Additional charges include brokerage fees expected to be approximately 0.24%0.20% per annum in the aggregate. The Fund is expected to earn interest income at an annual rate of .08%.07% per annum, based upon the current yield on a three month U.S. Treasury bill. Consequently, it is expected that interest income will not exceed fees unless short-term Treasury rates rise. If interest rates remain below 1.09%1.05% as they are as of this filing, the Fund will need to have positive performance in order to break-even (net of fees and expenses). Consequently, the expenses of the Master Fund, could, over time, could result in significant losses to your investment in the Shares. You may never achieve profits, significant or otherwise.
33
29
Possible Illiquid Markets May Exacerbate Losses.
Futures positions cannot always be liquidated at the desired price. It is difficult to execute a trade at a specific price when there is a relatively small volume of buy and sell orders in a market. A market disruption, such as when foreign governments may take or be subject to political actions which disrupt the markets in their currency or major exports, can also make it difficult to liquidate a position. Such periods of illiquidity and the events that trigger them are difficult to predict and there can be no assurance that the Managing Owner will be able to do so. There can be no assurance that market illiquidity will not cause losses for the Fund. The large size of the positions which the Master Fund may acquire on behalf of the Fund increases the risk of illiquidity by both making its positions more difficult to liquidate and increasing the losses incurred while trying to do so.
You May Be Adversely Affected by Redemption Orders that Are Subject To Postponement, Suspension Or Rejection Under Certain Circumstances.
The Distributor may, in its discretion, and will when directed by the Managing Owner, suspend the right of redemption or postpone the redemption settlement date, (1) for any period during which an emergency exists as a result of which the redemption distribution is not reasonably practicable, or (2) for such other period as the Managing Owner determines to be necessary for the protection of the Shareholders. In addition, the Distributor will reject a redemption order if the order is not in proper form as described in the Participant Agreement or if the fulfillment of the order, in the opinion of its counsel, might be unlawful. Any such postponement, suspension or rejection could adversely affect a redeeming Authorized Participant. For example, the resulting delay may adversely affect the value of the Authorized Participant’s redemption proceeds if the net asset value of the Fund declines during the period of the delay. Under the Distribution Services Agreement, the Managing Owner and the Distributor may disclaim any liability for any loss or damage that may result from any such suspension or postponement.
Because the Master Fund will not Acquire Any Asset with Intrinsic Value, the Positive Performance of Your Investment Is Wholly Dependent Upon an Equal and Offsetting Loss Borne by Unrelated Participants in the Futures Market.
Futures trading is a risk transfer economic activity. For every gain there is an equal and offsetting loss rather than an opportunity to participate over time in general economic growth. Unlike most alternative investments, an investment in Shares does not involve acquiring any asset with intrinsic value. Overall stock and bond prices could rise significantly and the economy as a whole could prosper while the Shares may trade below levels which are profitable to your holdings.
Shareholders Will Not Have the Protections Associated With Ownership of Shares in an Investment Company Registered Under the Investment Company Act of 1940.
Neither the Fund nor the Master Fund is registered as an investment company under the Investment Company Act of 1940 and is not required to register under such act. Consequently, Shareholders will not have the regulatory protections provided to investors in investment companies.
Various Actual and Potential Conflicts of Interest May Be Detrimental to Shareholders.
The Managing Owner’s officers, directors or employees do not devote their time exclusively to managing the Index Fund and Master Fund. These persons are directors, officers or employees of other entities that may compete with the Funds for their services. They could have a conflict between their responsibilities to the Funds and to those other entities. In addition, the Managing Owner’s principals, officers, directors or employees may trade futures and related contracts for their own or others’ accounts.
34
Shareholders Will Be Subject to Taxation on Their Share of the Master Fund’s Taxable Income, Whether or Not They Receive Cash Distributions.
Shareholders will be subject to United States federal income taxation and, in some cases, state, local, or foreign income taxation on their share of the Master Fund’s taxable income, whether or not they receive cash distributions from the Fund. Shareholders may not receive cash distributions equal to their share of the Master Fund’s taxable income or even the tax liability that results from such income.
30
Items of Income, Gain, Deduction, Loss and Credit with respect to Fund Shares could be Reallocated if the IRS does not Accept the Assumptions or Conventions Used by the Master Fund in Allocating Master Fund Tax Items.
U.S. federal income tax rules applicable to partnerships are complex and often difficult to apply to publicly traded partnerships. The Master Fund will apply certain assumptions and conventions in an attempt to comply with applicable rules and to report income, gain, deduction, loss and credit to the Fund’s Shareholders in a manner that reflects the Shareholders’ beneficial shares of partnership items, but these assumptions and conventions may not be in compliance with all aspects of applicable tax requirements. It is possible that the IRS will successfully assert that the conventions and assumptions used by the Master Fund do not satisfy the technical requirements of the Internal Revenue Code and/or Treasury regulations and could require that items of income, gain, deduction, loss or credit be adjusted or reallocated in a manner that adversely affects you.
PROSPECTIVE INVESTORS ARE STRONGLY URGED TO CONSULT THEIR OWN TAX ADVISERS AND COUNSEL WITH RESPECT TO THE POSSIBLE TAX CONSEQUENCES TO THEM OF AN INVESTMENT IN ANY SHARES; SUCH TAX CONSEQUENCES MAY DIFFER IN RESPECT OF DIFFERENT INVESTORS.
Failure or Lack of Segregation of Assets May Increase Losses.
The Commodity Exchange Act requires a clearing broker to segregate all funds received from customers from such broker’s proprietary assets. If the Commodity Broker fails to do so, the assets of the Master Fund might not be fully protected in the event of the Commodity Broker’s bankruptcy. Furthermore, in the event of the Commodity Broker’s bankruptcy, any Master Fund Units could be limited to recovering only apro ratashare of all available funds segregated on behalf of the Commodity Broker’s combined customer accounts, even though certain property specifically traceable to the Master Fund was held by the Commodity Broker. In addition to that, it is possible that in the event of a clearing broker’s bankruptcy, investors experience a loss of all their moneys, which would therefore imply that none of the investments may be recovered, not just apro ratashare. The Commodity Broker may, from time-to-time, have been the subject of certain regulatory and private causes of action. Such material actions, if any, are described under “The Commodity Broker.” In the event of a bankruptcy or insolvency of any exchange or a clearing house, the Master Fund could experience a loss of the funds deposited through its Commodity Broker as margin with the exchange or clearing house, a loss of any profits on its open positions on the exchange, and the loss of unrealized profits on its closed positions on the exchange.
Regulatory Changes or Actions May Alter the Nature of an Investment in the Fund.
Considerable regulatory attention has been focused on non-traditional investment pools which are publicly distributed in the United States. There is a possibility of future regulatory changes altering, perhaps to a material extent, the nature of an investment in the Fund or the ability of the Fund to continue to implement its investment strategy. The futures markets are subject to comprehensive statutes, regulations, and margin requirements. In addition, the CFTC and the exchanges are authorized to take extraordinary actions in the event of a market emergency, including, for example, the retroactive implementation of speculative position limits or higher margin requirements, the establishment of daily price limits and the suspension of trading. The regulation of futures transactions in the United States is a rapidly changing area of law and is subject to modification by government and judicial action. The effect of any future regulatory change on the Fund is impossible to predict, but could be substantial and adverse.
Lack of Independent Experts Representing Investors.
The Managing Owner has consulted with counsel, accountants and other experts regarding the formation and operation of the Fund and the Master Fund. No counsel has been appointed to represent you in connection with your ownership of the Shares. Accordingly, you should consult your own legal, tax and financial advisers regarding the desirability of the Shares and making investments in Shares.
35
31
Possibility of Termination of the Fund May Adversely Affect Your Portfolio.
The Managing Owner may withdraw from the Fund upon 120 days’ notice, which would cause the Fund and the Master Fund to terminate unless a substitute managing owner were obtained. You cannot be assured that the Managing Owner will be willing or able to continue to service the Fund for any length of time. If the Managing Owner discontinues its activities on behalf of the Fund, the Fund may be adversely affected. In addition, owners of 75% of the Shares have the power to terminate the Trust. If that right is exercised, investors who wished to continue to invest in the Index through the vehicle of the Trust would have to find another vehicle, and might not be able to find another vehicle that offers the same features as the Trust. Such detrimental developments could cause you to liquidate your investments and upset the overall maturity and timing of your investment portfolio. If the registrations with the CFTC or memberships in the NFA of the Managing Owner or the Commodity Broker were revoked or suspended, such entity would no longer be able to provide services to the Fund and the Master Fund.
Shareholders Do Not Have the Rights Enjoyed by Investors in Certain Other Vehicles.
As interests in an investment trust, the Shares have none of the statutory rights normally associated with the ownership of common stock of a corporation (including, for example, the right to bring “oppression” or “derivative” actions). In addition, the Shares have limited voting and distribution rights (for example, Shareholders do not have the right to elect directors and the Fund is not required to pay regular dividends, although the Fund may pay dividends at the discretion of the Managing Owner).
An Investment in the Shares May Be Adversely Affected by Competition From Other Methods of Investing in Commodities.
The Fund and the Master Fund constitute a new, and thus untested, type of investment vehicle. They compete with other financial vehicles, including other commodity pools, hedge funds, traditional debt and equity securities issued by companies in the commodities industry, other securities backed by or linked to such commodities, and direct investments in the underlying commodities or commodity futures contracts. Market and financial conditions, and other conditions that are beyond the Managing Owner’s control, may make it more attractive to invest in other financial vehicles or to invest in such commodities directly, which could limit the market for the Shares and reduce the liquidity of the Shares.
Competing Claims Over Ownership of Intellectual Property Rights Related to the Fund Could Adversely Affect the Fund and an Investment in the Shares.
While the Managing Owner believes that all intellectual property rights needed to operate the Fund are either owned by or licensed to the Managing Owner or have been obtained, third parties may allege or assert ownership of intellectual property rights which may be related to the design, structure and operations of the Fund. To the extent any claims of such ownership are brought or any proceedings are instituted to assert such claims, the negotiation, litigation or settlement of such claims, or the ultimate disposition of such claims in a court of law if a suit is brought, may adversely affect the Fund and an investment in the Shares, resulting in expenses or damages or the termination of the Fund.
An Absence of “Backwardation” in the Prices of Certain Commodities, or the Presence of “Contango” in the Prices of Certain Commodities, May Decrease the Price of Your Shares.
As the futures contracts that underlie the Index near expiration, they are replaced by contracts that have a later expiration. Thus, for example, a contract purchased and held in November 20102013 may specify a January 20112014 expiration. As that contract nears expiration, it may be replaced by selling the January 20112014 contract and purchasing the contract expiring in March 2011.2014. This process is referred to as “rolling.” Historically,At times, the prices of crude oil and heating oil have frequently been higher for contracts with shorter-term expirations are higher than for contracts with longer-term expirations, which is referred toa condition known as “backwardation.” In these circumstances, absent other factors, the sale of thea January 20112014 contract would take place at a price that is higher than the price at which thea March 2011contract2014 contract is purchased, thereby creating a gain in connection with rolling. While crude oil and heating oilsome commodities have historically exhibited consistent periods of backwardation, backwardation will likely not exist in these markets at all times. The absence of backwardation in any of the commodities comprising the Index could adversely affect the value of the Index and, accordingly, decrease the value of your Shares.
36
Conversely, gold, corn, soybeans and wheatsome other commodities such as precious metals contracts have historically tended to exhibit “contango” markets rather than backwardation. Contango markets are those in which the prices of contracts are higher in the distant delivery months than in the nearer delivery months due to the costs of long-term storage of a physical commodity prior to delivery or other factors. Although gold, corn, soybeans and wheatsome commodities have historically exhibited consistent periods of contango, contango will likelymay not exist in these markets at all times. The persistence of contango in any of the commodities comprising the Index could adversely affect the value of the Index and, accordingly, decrease the value of your Shares.
32
The Value of the Shares Will be Adversely Affected if the Fund or the Master Fund is Required to Indemnify the Trustee or the Managing Owner.
Under the Trust Declarations, the Trustee and the Managing Owner have the right to be indemnified for any liability or expense it incurs without negligence or misconduct. That means the Managing Owner may require the assets of the Master Fund to be sold in order to cover losses or liability suffered by it or by the Trustee. Any sale of that kind would reduce the net asset value of the Master Fund and the value of the Shares.
Regulatory Reporting and Compliance
The Fund is subject to changing regulation of corporate governance and public disclosure that have increased both ourthe costs and the risk of noncompliance.
Because ourthe Fund’s common shares are publicly traded, we areit is subject to certain rules and regulations of federal, state and financial market exchange entities charged with the protection of investors and the oversight of companies whose securities are publicly traded. These entities, including the SEC and NYSE Arca, have in recent years issued new requirements and regulations. From time to time, these authorities have continued to develop additional regulations or interpretations of existing regulations. OurThe Fund’s ongoing efforts to comply with these regulations and interpretations have resulted in, and are likely to continue resulting in, increased general and administrative expenses and diversion of management time and attention from revenue-generating activities to compliance activities.
The Fund is responsible for establishing and maintaining adequate internal control over financial reporting. OurThe Fund’s internal control system is designed to provide reasonable assurance to its management and its board of directors regarding the preparation and fair presentation of published financial statements. All internal control systems, no matter how well designed, have inherent limitations. Therefore, even those systems determined to be effective can provide only reasonable assurance with respect to financial statement preparation and presentation.
The Fund assessed the effectiveness of ourits internal control over financial reporting as of December 31, 2009.2012. Based on itsthat assessment, we believethe Fund believes that, as of December 31, 2009,2012, internal control over financial reporting is effective.
The Net Asset Value Calculation of the Master Fund May Be Overstated or Understated Due to the Valuation Method Employed When a Settlement Price is not Available on the Date of Net Asset Value Calculation.
Calculating the net asset value of the Master Fund (and, in turn, the Fund) includes, in part, any unrealized profits or losses on open commodity futures contracts. Under normal circumstances, the net asset value of the Master Fund reflects the settlement price of open commodity futures contracts on the date when the net asset value is being calculated. However, if a commodity futures contract traded on an exchange (both U.S. and non-U.S. exchanges) could not be liquidated on such day (due to the operation of daily limits or other rules of the exchange upon which that position is traded or otherwise), the settlement price on the most recent day on which the position could have been liquidated shall be the basis for determining the market value of such position for such day. In such a situation, there is a risk that the calculation of the net asset value of the Master Fund on such day will not accurately reflect the realizable market value of such commodity futures contract. For example, daily limits are generally triggered in the event of a significant change in market price of a commodity futures contract. Therefore, as a result of the daily limit, the current settlement price is unavailable. Because the settlement price on the most recent day on which the position could have been liquidated would be used in lieu of the actual settlement price on the date of determination, there is a risk that the resulting calculation of the net asset value of the Master Fund (and, in turn, the Fund) could be under or overstated, perhaps to a significant degree.
37
| UNRESOLVED STAFF COMMENTS |
None.
33
| PROPERTIES |
The Fund and the Master Fund do not own or use physical properties in the conduct of itstheir business. ItsTheir assets consist of futures contracts, cash, United States Treasury obligations and other high credit quality short-term fixed income securities. The Managing Owner’s headquarters are located at 3340 Peachtree Road, Suite 1910, Atlanta, Georgia 30326. Any value attributable to an implied or imputed use or sharing of the Managing Owner’s facilities is deemed to be included in other fees paid by the Fund to the Managing Owner.
| LEGAL PROCEEDINGS |
None.
38
| MINE SAFETY DISCLOSURES |
None.
34
| MARKET FOR REGISTRANT’S COMMON EQUITY, RELATED STOCKHOLDER MATTERS AND ISSUER PURCHASES OF EQUITY SECURITIES |
Market Information
The Limited Shares of the Fund trade on the New York Stock Exchange under the symbol “GCC.”
| 2012 Monthly Stock Price Data for GCC | ||||||||
| Date | Open | High | Low | Close | ||||
| December | 30.02 | 30.12 | 28.67 | 28.83 | ||||
| November | 29.60 | 30.12 | 29.09 | 29.85 | ||||
| October | 30.67 | 30.80 | 29.43 | 29.49 | ||||
| September | 30.78 | 31.61 | 29.97 | 30.50 | ||||
| August | 29.40 | 30.42 | 29.06 | 30.37 | ||||
| July | 29.29 | 29.99 | 28.32 | 29.61 | ||||
| June | 26.66 | 28.44 | 26.53 | 28.36 | ||||
| May | 29.48 | 29.61 | 26.88 | 26.93 | ||||
| April | 30.22 | 30.64 | 29.00 | 29.47 | ||||
| March | 31.75 | 32.36 | 29.90 | 30.28 | ||||
| February | 31.20 | 32.14 | 30.92 | 31.69 | ||||
| January | 30.37 | 31.90 | 30.09 | 31.29 | ||||
| 2011 Monthly Stock Price Data for GCC | ||||||||
| Date | Open | High | Low | Close | ||||
| December | 31.05 | 31.31 | 28.98 | 29.96 | ||||
| November | 31.39 | 32.69 | 30.42 | 31.18 | ||||
| October | 30.15 | 32.80 | 29.84 | 32.21 | ||||
| September | 35.19 | 35.22 | 30.28 | 30.34 | ||||
| August | 34.66 | 35.30 | 32.66 | 35.23 | ||||
| July | 33.50 | 35.13 | 33.20 | 34.47 | ||||
| June | 34.80 | 35.18 | 32.90 | 33.50 | ||||
| May | 36.45 | 36.46 | 33.10 | 34.90 | ||||
| April | 35.15 | 36.51 | 35.03 | 36.40 | ||||
| March | 35.57 | 36.19 | 32.82 | 35.23 | ||||
| February | 34.08 | 36.00 | 33.98 | 35.33 | ||||
| January | 33.49 | 34.25 | 32.08 | 34.03 | ||||
| 2010 Monthly Stock Price Data for GCC | ||||||||
| Date | Open | High | Low | Close | ||||
| December | 29.99 | 33.51 | 29.98 | 32.95 | ||||
| November | 30.04 | 33.53 | 29.02 | 29.69 | ||||
| October | 28.23 | 30.01 | 27.56 | 29.79 | ||||
| September | 26.45 | 28.55 | 26.40 | 28.16 | ||||
| August | 26.73 | 27.13 | 25.68 | 26.20 | ||||
| July | 24.81 | 26.43 | 24.56 | 26.41 | ||||
| June | 24.39 | 25.57 | 23.83 | 24.93 | ||||
| May | 25.83 | 25.86 | 23.88 | 24.54 | ||||
| April | 25.22 | 25.96 | 25.15 | 25.79 | ||||
| March | 25.79 | 25.94 | 24.68 | 25.08 | ||||
| February | 25.21 | 25.88 | 24.27 | 25.72 | ||||
| January | 26.93 | 27.30 | 25.05 | 25.06 | ||||
35
Price Data for GCCRange of Units
| Date | High | Low | Close | Open | ||||||||||||
| December | 26.58 | 25.33 | 26.32 | 26.31 | ||||||||||||
| November | 26.20 | 24.89 | 26.11 | 25.05 | ||||||||||||
| October | 26.20 | 23.30 | 25.01 | 23.93 | ||||||||||||
| September | 24.28 | 22.73 | 23.97 | 23.10 | ||||||||||||
| August | 24.41 | 22.80 | 23.08 | 23.95 | ||||||||||||
| July | 23.55 | 21.31 | 23.52 | 23.00 | ||||||||||||
| June | 25.79 | 22.39 | 22.88 | 24.85 | ||||||||||||
| May | 24.50 | 21.92 | 24.34 | 21.99 | ||||||||||||
| April | 23.99 | 21.00 | 21.79 | 21.83 | ||||||||||||
| March | 23.60 | 19.01 | 21.95 | 20.43 | ||||||||||||
| February | 22.81 | 20.42 | 20.82 | 21.55 | ||||||||||||
| January | 22.99 | 20.79 | 21.80 | 22.12 | ||||||||||||
| Fiscal Year 2012 | High | Low | ||
| 1st Quarter | 32.36 | 29.90 | ||
| 2nd Quarter | 30.64 | 26.53 | ||
| 3rd Quarter | 31.61 | 28.32 | ||
| 4th Quarter | 30.80 | 28.67 | ||
| Fiscal Year 2011 | High | Low | ||
| 1st Quarter | 36.19 | 32.08 | ||
| 2nd Quarter | 36.51 | 32.90 | ||
| 3rd Quarter | 35.30 | 30.28 | ||
| 4th Quarter | 32.80 | 28.98 |
| Date | High | Low | Close | Open | ||||||||||||
| December | 23.95 | 19.51 | 21.92 | 21.49 | ||||||||||||
| November | 24.3 | 18.94 | 21.78 | 22.78 | ||||||||||||
| October | 27.9 | 18.71 | 22.7 | 27.67 | ||||||||||||
| September | 30.84 | 26.04 | 27.62 | 30.77 | ||||||||||||
| August | 33.9 | 28.5 | 31.71 | 33.33 | ||||||||||||
| July | 37.99 | 30.26 | 33.75 | 36.83 | ||||||||||||
| June | 37.52 | 33.33 | 36.88 | 34.16 | ||||||||||||
| May | 34.82 | 28 | 33.74 | 33.22 | ||||||||||||
| April | 35.78 | 31.67 | 33.53 | 32.4 | ||||||||||||
| March | 37 | 30.55 | 32.34 | 35.99 | ||||||||||||
| February | 35.85 | 31.5 | 35.35 | 31.94 | ||||||||||||
| January | 31.9 | 30.45 | 31.7 | 30.45 | ||||||||||||
As of December 31, 2009,2012, the Fund had 8,750,00016,450,000 of its Limited Shares outstanding.
As of December 31, 2008,2011, the Fund had 800,00019,400,000 of its Limited Shares outstanding.
As of December 31, 2010, the Fund had 16,250,000 of its Limited Shares outstanding.
Distributions
There were no distributions during 2009, 2008,2012, 2011, or 2007.2010.
Holders
As of December 31, 2012, there were 29,554 holders of the Fund’s Shares.
Sales and Redemptions
(a) There have been no unregistered sales of the Fund’s securities. No Fund securities are authorized for issuance by the Fund under equity compensation plans.
(b) The Fund filed with the SEC a Registration Statement on Form S-1 (Registration No.: 333-138424), which was declared effective on December 5, 2007 (the “2007 Registration Statement”), and a Post-Effective Amendment 1 to that Registrant’s Registration Statement which was declared effective on April 14, 2009. Under the 2007 Registration Statement, the Fund registered 4,000,000 Shares with the SEC.
39
The Fund filed a second Registration Statement on Form S-1 (Registration No.: 333-158421), which was declared effective on April 24, 2009 (the “2009 Registration Statement”). Under the 2009 Registration Statement, the Fund registered an additional 21,000,000 Shares with the SEC.
The Fund filed a Registration Statement on Form S-3 (Registration No.: 333-170917) on December 2, 2010, which was declared effective on January 14, 2011 (the “2011 Registration Statement”). Under the 2011 Registration Statement, the Fund registered an additional 20,000,000 shares with the SEC.
The Shares began trading on the American Stock Exchange on January 24, 2008 and are now traded on the NYSE ArcaNYSE-Arca as of November 25, 2008.
The proceeds from the sale of the Shares are used to purchase Master Fund Limited Units. The Master Fund uses the proceeds from the sale of the Master Fund Limited Units for general corporate purposes in accordance with its investment objectives and policies.
During the year ended December 31, 2009, 11,000,0002012, 3,250,000 Shares were created for $260,518,098$101,149,075 and 3,050,0006,200,000 Shares were redeemed for $74,556,681.$180,296,699. For the three months ended December 31, 2009, 2,450,0002012, 450,000 Shares were created for $63,002,500$13,215,767 and 2,050,000900,000 Shares were redeemed for $52,322,500.$26,709,067. On December 31, 2009, 8,750,0002012, 16,450,000 Shares of the Fund were outstanding for a market capitalization of $230,300,000.$474,253,500.
36
During the Year Endedyear ended December 31, 2008, 1,550,0002011, 11,200,000 Shares were created for $49,787,546$383,075,174 and 750,0008,050,000 Shares were redeemed for $25,248,052.$262,514,288. For the three months ended December 31, 2008, 100,0002011, 1,500,000 Shares were created for $2,119,500$47,686,315 and 50,0002,400,000 Shares were redeemed for $1,273,500.$72,318,659. On December 31, 2008, 800,0002011, 19,400,000 Shares of the Fund were outstanding for a market capitalization of $17,536,000.$581,224,000.
During the year ended December 31, 2010, 9,200,000 Shares were created for $262,051,675 and 1,700,000 Shares were redeemed for $43,750,891. For the three months ended December 31, 2010, 5,150,000 Shares were created for $155,161,842 and 0 Shares were redeemed. On December 31, 2010, 16,250,000 Shares of the Fund commenced investment operations on January 23, 2008. Prior to that date there were no sales or redemptions.outstanding for a market capitalization of $535,437,500.
Dividends
The Fund has not made and does not intend to make cash distributions to its unitholders.shareholders.
| SELECTED FINANCIAL DATA |
| Year Ended | Period Ended | |||||||
| December 31, 2009 | December 31, 2008(i) | |||||||
| Total assets | $ | 229,623,343 | $ | 17,550,900 | ||||
| Net realized and unrealized gain (loss) on futures transactions and investments, inclusive of commissions | $ | 27,112,878 | $ | (7,095,792 | ) | |||
| Net income (loss) | $ | 25,933,097 | $ | (7,001,170 | ) | |||
| Cash held by broker | $ | 97,250,587 | $ | 13,331,630 | ||||
| Total assets per share | $ | 26.24 | $ | 21.94 | ||||
| Cash and cash equivalents per share at end of year/period | $ | 11.11 | $ | 16.66 | ||||
| Year Ended December 31, 2012 | Year Ended December 31, 2011 | Year Ended December 31, 2010 | Year Ended December 31, 2009 | Period Ended December 31, 2008 (i) | ||||||||||||||||
| Revenues (interest income) | $ | 331,044 | $ | 335,677 | $ | 301,808 | $ | 126,329 | $ | 338,455 | ||||||||||
| Total assets | $ | 479,691,588 | $ | 584,077,695 | $ | 535,067,061 | $ | 229,623,343 | $ | 17,550,900 | ||||||||||
| Net realized and unrealized gain (loss) on futures transactions and investments, inclusive of commissions | $ | (22,718,144 | ) | $ | (66,905,929 | ) | $ | 89,562,608 | $ | 27,112,878 | $ | (7,095,792 | ) | |||||||
| Net gain (loss) | $ | (27,402,292 | ) | $ | (73,765,925 | ) | $ | 86,627,933 | $ | 25,933,097 | $ | (7,001,170 | ) | |||||||
| Net gain (loss) per share | $ | (1.67 | ) | $ | (3.80 | ) | $ | 5.33 | $ | 2.96 | $ | (8.75 | ) | |||||||
| (i) | The Fund commenced investment operations on January 23, | ||||||||||||||||||
Selected Quarterly Financial Data (Unaudited)
| For the Three | For the Three | For the Three | For the Three | |||||||||||||
| Months Ended | Months Ended | Months Ended | Months Ended | |||||||||||||
| March 31, 2012 | June 30, 2012 | September 30, 2012 | December 31, 2012 | |||||||||||||
| Interest Income | $ | 30,714 | $ | 90,769 | $ | 96,791 | $ | 112,770 | ||||||||
| Net Investment Income (Loss) | $ | (1,368,267 | ) | $ | (1,106,011 | ) | $ | (1,010,723 | ) | $ | (1,199,146 | ) | ||||
| Net Realized and Unrealized Gain (Loss) on Investments and Futures Contracts | $ | 6,579,006 | $ | (39,652,985 | ) | $ | 37,730,430 | $ | (27,374,596 | ) | ||||||
| Net Gain (Loss) | $ | 5,210,739 | $ | (40,758,996 | ) | $ | 36,719,707 | $ | (28,573,742 | ) | ||||||
| Increase (Decrease) in Net Asset Value | $ | 63,710,745 | $ | (133,156,182 | ) | $ | 4,962,563 | $ | (42,067,042 | ) | ||||||
| Net Gain (Loss) per Share | $ | 0.39 | $ | (1.92 | ) | $ | 2.14 | $ | (1.72 | ) | ||||||
| For the Three | For the Three | For the Three | For the Three | |||||||||||||
| Months Ended | Months Ended | Months Ended | Months Ended | |||||||||||||
| March 31, 2011 | June 30, 2011 | September 30, 2011 | December 31, 2011 | |||||||||||||
| Interest Income | $ | 187,623 | $ | 119,476 | $ | 8,112 | $ | 20,465 | ||||||||
| Net Investment Income (Loss) | $ | (1,551,905 | ) | $ | (2,037,214 | ) | $ | (1,910,989 | ) | $ | (1,359,888 | ) | ||||
| Net Realized and Unrealized Gain (Loss) on Investments and Futures Contracts | $ | 44,819,207 | $ | (35,767,596 | ) | $ | (64,715,733 | ) | $ | (11,241,807 | ) | |||||
| Net Gain (Loss) | $ | 43,267,302 | $ | (37,804,810 | ) | $ | (66,626,722 | ) | $ | (12,601,695 | ) | |||||
| Increase (Decrease) in Net Asset Value | $ | 283,986,486 | $ | (84,481,829 | ) | $ | (115,475,657 | ) | $ | (37,234,039 | ) | |||||
| Net Gain (Loss) per Share | $ | 2.32 | $ | (1.61 | ) | $ | (3.13 | ) | $ | (0.50 | ) | |||||
| MANAGEMENT’S DISCUSSION AND ANALYSIS OF FINANCIAL CONDITION AND RESULTS OF OPERATIONS |
The following discussion should be read in conjunction with the consolidated financial statements and the notes thereto of the Fund included elsewhere in this annual report on Form 10-K.
Forward-Looking Information
This annual report on Form 10-K, including this “Management’s Discussion and Analysis of Financial Condition and Results of Operations,” contains forward-looking statements regarding the plans and objectives of management for future operations. This information may involve known and unknown risks, uncertainties and other factors that may cause the Fund’s actual results, performance or achievements to be materially different from future results, performance or achievements expressed or implied by any forward-looking statements. Forward-looking statements, which involve assumptions and describe the Fund’s future plans, strategies and expectations, are generally identifiable by use of the words “may,” “will,” “should,” “expect,” “anticipate,” “estimate,” “believe,” “intend” or “project,” the negative of these words, other variations on these words or comparable terminology. These forward-looking statements are based on assumptions that may be incorrect, and the Fund cannot assure investors that these projections included in these forward-looking statements will come to pass. The Fund’s actual results could differ materially from those expressed or implied by the forward-looking statements as a result of various factors.
40
The Fund has based the forward-looking statements included in this annual report on Form 10-K on information available to it as close to the filing date of this annual report on Form 10-K as reasonably practicable, and the Fund assumes no obligation to update any such forward-looking statements except as required by the federal securities laws. Investors are advised to review any additional disclosures that the Fund may make directly to them or through reports that the Fund in the future files with the SEC, including annual reports on Form 10-K, quarterly reports on Form 10-Q and current reports on Form 8-K.
Overview / Introduction
The Fund and the Master Fund seek to track changes, whether positive or negative, in the level of the Thomson Reuters Continuous Commodity Index Total Return (the “Index”) over time, plus the excess, if any, of the Master Fund’s interest income from its holdings of United States Treasury Obligations and other high credit quality short-term fixed income securities over the expenses of the Fund and the Master Fund. The Shares are designed for investors who want a cost-effective and convenient way to invest in aan equal weight portfolio of commodity futures.
37
The Fund pursues its investment objective by investing substantially all of its assets in the Master Fund. The Master Fund pursues its investment objective by investing in a portfolio of exchange-traded futures contracts on the commodities comprising the Index (the “Index Commodities”). TheThrough January 6, 2013 the Index Commodities arewere wheat, corn, soybeans, live cattle, lean hogs, gold, silver, platinum, copper, cotton, coffee, cocoa, orange juice, sugar, crude oil, heating oil, and natural gas. Following the tenth revision on January 7, 2013, orange juice was removed and soybean oil was added at an equivalent allocation.
The Index is composed of notional amounts of each of the Index Commodities. The notional amounts of each Index Commodity included in the Index are in equal weight proportion to the Index Commodities or 1/17 weighting per index commodity rebalanced daily. The Master Fund’s portfolio also includes United States Treasury Obligations and other high credit quality short-term fixed income securities for deposit with the Master Fund’s Commodity Broker. The Commodity Broker as margin.currently applies part of the total value of the cash and/or Treasury Obligations on deposit towards satisfying any margin requirements related to the futures contracts in the Master Fund’s futures account. The sponsor of the Index is Thompson Reuters (the “Index Sponsor”). Thomson Reuters is not an affiliate of the Fund, the Master Fund or the Managing Owner.
Under the Trust Agreements of each of the Fund and the Master Fund, CSC Trust, the Trustee of the Fund and the Master Fund, has delegated to the Managing Owner the exclusive management and control of all aspects of the business of the Fund and the Master Fund. The Trustee will have no duty or liability to supervise or monitor the performance of the Managing Owner, nor will the Trustee have any liability for the acts or omissions of the Managing Owner.
The Index Sponsor obtains information for inclusion in, or for use in the calculation of, the Index from sources the Index Sponsor considers reliable. None of the Index Sponsor, the Managing Owner, the Fund, the Master Fund or any of their respective affiliates accepts responsibility for or guarantees the accuracy and/or completeness of the Index or any data included in the Index.
The Shares are intended to provide investment results that generally correspond to the changes, positive or negative, in the levels of the Index over time. The value of the Shares is expected to fluctuate in relation to changes in the value of the Master Fund’s portfolio. The market price of the Shares may not be identical to the net asset value per Share, but these two valuations are expected to be very close.
The ticker symbol of the Fund is GCC.
Management’s Discussion of Results of Operations
Results of Operations.As of December 31, 2009,2012, the net unrealized loss on Futures Contracts owned or held on that day was $12,514,458 and the Fund had total assets of $479,691,588. The ending per unit NAV on December 31, 2012 was $28.85.
As of December 31, 2011, the net unrealized loss on Futures Contracts owned or held on that day was $45,001,789 and the Fund had total assets of $584,077,695. The ending per unit NAV on December 31, 2011 was $29.96.
As of December 31, 2010, the net unrealized gain on Futures Contracts owned or held on that day was $12,380,231$58,639,682 and the Fund had total assets of $229,623,343.$535,067,061. The ending per unit NAV on December 31, 20092010 was $26.22.$32.88.
41
Portfolio Expenses. The Fund’s expenses consist of investment management fees, and brokerage fees. The Fund pays the Managing Owner a management fee of 0.85% of NAV on its net assets.
The Fund pays for all brokerage fees. The Managing Owner pays for all taxes and other expenses, including licensing fees for the use of intellectual property, ongoing registration or other fees paid to the SEC, FINRA and any other regulatory agency in connection with offers and sales of its units subsequent to the initial offering and all legal, accounting, printing and other expenses associated therewith. Since inception, the Fund incurredpaid $0 in ongoing registration fees and other offering expenses. The Managing Owner is responsible for paying the fees and expenses, including directors’ and officers’ liability insurance, of the independent directors of the Managing Owner who are also its audit committee members.
38
The Fund also incurs commissions to brokers for the purchase and sale of Futures Contracts and Treasuries. During 2009, totalTotal commissions and fees paid amounted to $287,584. During 2008 total commissions$377,195, $1,300,472, and fees paid amounted to $54,945. The Managing Owner has estimated its annual level of such commissions to be approximately 0.24% of total net assets. However, there can be no assurance that commission costs$712,620 for the years ended December 31, 2012, December 31, 2011, and portfolio turnover will not cause commission expenses to rise in the future.2010, respectively.
Interest Income. Unlike some alternative investment funds, theThe Fund does not borrow money in order to obtain leverage, so the Fund does not incur any interest expense. Rather, the Fund’s margin deposits are maintained in Treasuries and short term investments and interest is earned on the Fund’s available assets. The Fund earned total interest income for the calendar year of $126,329$331,044, $335,677, and $338,455$301,808, for the years ended December 31, 20092012, 2011, and 2008,2010, respectively.
42
39
Performance Summary
| NAV | Total Shares | Extended Value | 1 Month | 3 Months | Year to Date | Since Inception | ||||||||||||||||||||||
| 1/23/2008 | $ | 30.00 | 350,050 | $ | 10,501,500.00 | — | — | — | — | |||||||||||||||||||
| 1/31/2008 | $ | 31.65 | 350,050 | $ | 11,079,082.50 | 5.50 | % | — | 5.50 | % | 5.50 | % | ||||||||||||||||
| 2/29/2008 | $ | 35.41 | 900,050 | $ | 31,870,770.50 | 11.88 | % | — | 18.03 | % | 18.03 | % | ||||||||||||||||
| 3/31/2008 | $ | 32.46 | 900,050 | $ | 29,215,623.00 | -8.33 | % | — | 8.20 | % | 8.20 | % | ||||||||||||||||
| 4/30/2008 | $ | 33.49 | 900,050 | $ | 30,142,674.50 | 3.17 | % | 5.81 | % | 11.63 | % | 11.63 | % | |||||||||||||||
| 5/31/2008 | $ | 33.77 | 950,050 | $ | 32,083,188.50 | 0.84 | % | -4.63 | % | 12.57 | % | 12.57 | % | |||||||||||||||
| 6/30/2008 | $ | 36.83 | 800,050 | $ | 29,465,841.50 | 9.06 | % | 13.46 | % | 22.77 | % | 22.77 | % | |||||||||||||||
| 7/31/2008 | $ | 33.71 | 750,050 | $ | 25,284,185.50 | -8.47 | % | 0.66 | % | 12.37 | % | 12.37 | % | |||||||||||||||
| 8/31/2008 | $ | 31.65 | 800,050 | $ | 25,321,582.50 | -6.11 | % | -6.28 | % | 5.50 | % | 5.50 | % | |||||||||||||||
| 9/30/2008 | $ | 27.74 | 750,050 | $ | 20,806,387.00 | -12.35 | % | -24.68 | % | -7.53 | % | -7.53 | % | |||||||||||||||
| 10/31/2008 | $ | 22.68 | 700,050 | $ | 15,877,134.00 | -18.24 | % | -32.72 | % | -24.40 | % | -24.40 | % | |||||||||||||||
| 11/28/2008 | $ | 22.03 | 700,050 | $ | 15,422,101.50 | -2.87 | % | -30.39 | % | -26.57 | % | -26.57 | % | |||||||||||||||
| 12/31/2008 | $ | 21.92 | 800,050 | $ | 17,537,096.00 | -0.50 | % | -20.98 | % | -26.93 | % | -26.93 | % | |||||||||||||||
| 1/31/2009 | $ | 21.80 | 900,050 | $ | 19,621,090.00 | -0.55 | % | -3.88 | % | -0.55 | % | -27.33 | % | |||||||||||||||
| 2/28/2009 | $ | 20.87 | 950,050 | $ | 19,827,543.50 | -4.27 | % | -5.27 | % | -4.79 | % | -30.43 | % | |||||||||||||||
| 3/31/2009 | $ | 21.73 | 3,950,050 | $ | 85,834,586.50 | 4.12 | % | -0.87 | % | -0.87 | % | -27.57 | % | |||||||||||||||
| 4/30/2009 | $ | 21.69 | 3,950,050 | $ | 85,676,584.50 | -0.18 | % | -0.50 | % | -1.05 | % | -27.70 | % | |||||||||||||||
| 5/30/2009 | $ | 24.21 | 5,000,050 | $ | 121,051,210.50 | 11.62 | % | 16.00 | % | 10.45 | % | -19.30 | % | |||||||||||||||
| 6/30/2009 | $ | 22.73 | 6,300,050 | $ | 143,200,136.50 | -6.11 | % | 4.60 | % | 3.70 | % | -24.23 | % | |||||||||||||||
| 7/31/2009 | $ | 23.44 | 5,550,000 | $ | 130,092,000.00 | 3.12 | % | 8.07 | % | 6.93 | % | -21.87 | % | |||||||||||||||
| 8/31/2009 | $ | 23.19 | 6,100,050 | $ | 141,460,159.50 | -1.07 | % | -4.21 | % | 5.79 | % | -22.70 | % | |||||||||||||||
| 9/30/2009 | $ | 23.89 | 8,350,050 | $ | 199,482,694.50 | 3.02 | % | 5.10 | % | 8.99 | % | -20.37 | % | |||||||||||||||
| 10/31/2009 | $ | 24.94 | 8,850,050 | $ | 220,720,247.00 | 4.40 | % | 6.40 | % | 13.78 | % | -16.87 | % | |||||||||||||||
| 11/30/2009 | $ | 26.09 | 7,550,050 | $ | 196,980,804.50 | 4.61 | % | 12.51 | % | 19.02 | % | -13.03 | % | |||||||||||||||
| 12/31/2009 | $ | 26.22 | 8,750,050 | $ | 229,426,311.00 | 0.50 | % | 9.75 | % | 19.62 | % | -12.60 | % | |||||||||||||||
| Date | NAV | Total Shares | Net Assets | 1 Month | 3 Months | Year to Date | Since Inception | |||||||
| 1/23/2008 | $30.00 | 350,050 | $10,501,500 | - | - | - | - | |||||||
| 1/31/2008 | $31.65 | 350,050 | $11,079,083 | 5.50% | - | 5.50% | 5.50% | |||||||
| 2/29/2008 | $35.41 | 900,050 | $31,870,771 | 11.88% | - | 18.03% | 18.03% | |||||||
| 3/31/2008 | $32.46 | 900,050 | $29,215,623 | -8.33% | - | 8.20% | 8.20% | |||||||
| 4/30/2008 | $33.49 | 900,050 | $30,142,675 | 3.17% | 5.81% | 11.63% | 11.63% | |||||||
| 5/31/2008 | $33.77 | 950,050 | $32,083,189 | 0.84% | -4.63% | 12.57% | 12.57% | |||||||
| 6/30/2008 | $36.83 | 800,050 | $29,465,842 | 9.06% | 13.46% | 22.77% | 22.77% | |||||||
| 7/31/2008 | $33.71 | 750,050 | $25,284,186 | -8.47% | 0.66% | 12.37% | 12.37% | |||||||
| 8/31/2008 | $31.65 | 800,050 | $25,321,583 | -6.11% | -6.28% | 5.50% | 5.50% | |||||||
| 9/30/2008 | $27.74 | 750,050 | $20,806,387 | -12.35% | -24.68% | -7.53% | -7.53% | |||||||
| 10/31/2008 | $22.68 | 700,050 | $15,877,134 | -18.24% | -32.72% | -24.40% | -24.40% | |||||||
| 11/28/2008 | $22.03 | 700,050 | $15,422,102 | -2.87% | -30.39% | -26.57% | -26.57% | |||||||
| 12/31/2008 | $21.92 | 800,050 | $17,537,096 | -0.50% | -20.98% | -26.93% | -26.93% | |||||||
| 1/31/2009 | $21.80 | 900,050 | $19,621,090 | -0.55% | -3.88% | -0.55% | -27.33% | |||||||
| 2/28/2009 | $20.87 | 950,050 | $19,827,544 | -4.27% | -5.27% | -4.79% | -30.43% | |||||||
| 3/31/2009 | $21.73 | 3,950,050 | $85,834,587 | 4.12% | -0.87% | -0.87% | -27.57% | |||||||
| 4/30/2009 | $21.69 | 3,950,050 | $85,676,585 | -0.18% | -0.50% | -1.05% | -27.70% | |||||||
| 5/30/2009 | $24.21 | 5,000,050 | $121,051,211 | 11.62% | 16.00% | 10.45% | -19.30% | |||||||
| 6/30/2009 | $22.73 | 6,300,050 | $143,200,137 | -6.11% | 4.60% | 3.70% | -24.23% | |||||||
| 7/31/2009 | $23.44 | 5,550,000 | $130,092,000 | 3.12% | 8.07% | 6.93% | -21.87% | |||||||
| 8/31/2009 | $23.19 | 6,100,050 | $141,460,160 | -1.07% | -4.21% | 5.79% | -22.70% | |||||||
| 9/30/2009 | $23.89 | 8,350,050 | $199,482,695 | 3.02% | 5.10% | 8.99% | -20.37% | |||||||
| 10/31/2009 | $24.94 | 8,850,050 | $220,720,247 | 4.40% | 6.40% | 13.78% | -16.87% | |||||||
| 11/30/2009 | $26.09 | 7,550,050 | $196,980,805 | 4.61% | 12.51% | 19.02% | -13.03% | |||||||
| 12/31/2009 | $26.22 | 8,750,050 | $229,426,311 | 0.50% | 9.75% | 19.62% | -12.60% | |||||||
| 1/31/2010 | $25.09 | 9,850,050 | $247,137,755 | -4.31% | 0.60% | -4.31% | -16.37% | |||||||
| 2/28/2010 | $25.67 | 9,400,050 | $241,299,284 | 2.31% | -1.61% | -2.10% | -14.43% | |||||||
| 3/31/2010 | $25.07 | 9,550,050 | $239,419,754 | -2.34% | -4.39% | -4.39% | -16.43% | |||||||
| 4/30/2010 | $25.76 | 9,650,050 | $248,585,288 | 2.75% | 2.67% | -1.75% | -14.13% | |||||||
| 5/31/2010 | $24.50 | 9,650,050 | $236,426,225 | -4.89% | -4.56% | -6.56% | -18.33% | |||||||
| 6/30/2010 | $24.92 | 9,750,050 | $242,971,246 | 1.71% | -0.60% | -4.96% | -16.93% | |||||||
| 7/31/2010 | $26.42 | 10,200,050 | $269,485,321 | 6.02% | 2.56% | 0.76% | -11.93% | |||||||
| 8/31/2010 | $26.21 | 11,250,050 | $294,863,811 | -0.79% | 6.98% | -0.04% | -12.63% | |||||||
| 9/30/2010 | $28.14 | 11,100,050 | $312,355,407 | 7.36% | 12.92% | 7.32% | -6.20% | |||||||
| 10/31/2010 | $29.76 | 13,000,050 | $386,881,488 | 5.76% | 12.64% | 13.50% | -0.80% | |||||||
| 11/30/2010 | $29.67 | 14,900,050 | $442,084,484 | -0.30% | 13.20% | 13.16% | -1.10% | |||||||
| 12/31/2010 | $32.88 | 16,250,050 | $534,301,644 | 10.82% | 16.84% | 25.40% | 9.60% | |||||||
| 1/31/2011 | $34.01 | 17,650,050 | $600,278,201 | 3.44% | 14.28% | 3.44% | 13.37% | |||||||
| 2/28/2011 | $35.16 | 19,600,050 | $689,137,758 | 3.38% | 18.50% | 6.93% | 17.20% | |||||||
| 3/31/2011 | $35.20 | 23,250,050 | $818,401,760 | 0.11% | 7.06% | 7.06% | 17.33% | |||||||
| 4/30/2011 | $36.34 | 23,800,050 | $864,893,817 | 3.24% | 6.85% | 10.52% | 21.13% | |||||||
| 5/31/2011 | $34.87 | 22,000,050 | $767,141,744 | -4.05% | -0.82% | 6.05% | 16.23% | |||||||
| 6/30/2011 | $33.59 | 21,850,050 | $733,943,180 | -3.67% | -4.57% | 2.16% | 11.97% | |||||||
| 7/31/2011 | $34.48 | 21,000,050 | $724,081,724 | 2.65% | -5.12% | 4.87% | 14.93% | |||||||
| 8/31/2011 | $35.23 | 20,700,050 | $729,262,762 | 2.18% | 1.03% | 7.15% | 17.43% | |||||||
| 9/30/2011 | $30.46 | 20,600,050 | $627,498,123 | -13.54% | -9.32% | -7.36% | 1.54% | |||||||
| 10/31/2011 | $32.21 | 19,200,050 | $618,433,611 | 5.74% | -6.58% | -2.04% | 7.37% | |||||||
| 11/30/2011 | $31.12 | 20,300,050 | $631,737,556 | -3.38% | -11.67% | -5.35% | 3.73% | |||||||
| 12/31/2011 | $29.96 | 19,400,050 | $581,225,498 | -3.73% | -1.64% | -8.88% | -0.13% | |||||||
| 1/31/2012 | $31.29 | 19,550,050 | $611,721,065 | 4.44% | -2.86% | 4.44% | 4.30% | |||||||
| 2/29/2012 | $31.70 | 21,350,050 | $676,796,585 | 1.31% | 1.86% | 5.81% | 5.67% | |||||||
| 3/31/2012 | $30.35 | 21,250,050 | $644,939,018 | -4.26% | 1.30% | 1.30% | 1.17% | |||||||
| 4/30/2012 | $29.51 | 20,550,050 | $606,431,976 | -2.77% | -5.69% | -1.50% | -1.63% | |||||||
| 5/31/2012 | $26.95 | 18,300,050 | $493,186,348 | -8.68% | -14.98% | -10.05% | -10.17% | |||||||
| 6/30/2012 | $28.43 | 18,000,050 | $511,741,422 | 5.49% | -6.33% | -5.11% | -5.23% | |||||||
| 7/31/2012 | $29.65 | 17,100,050 | $507,016,483 | 4.29% | 0.47% | -1.03% | -1.17% | |||||||
| 8/31/2012 | $30.35 | 16,650,050 | $505,329,018 | 2.36% | 12.62% | 1.30% | 1.17% | |||||||
| 9/30/2012 | $30.57 | 16,900,050 | $516,634,529 | 0.72% | 7.53% | 2.04% | 1.90% | |||||||
| 10/31/2012 | $29.56 | 16,600,050 | $490,697,478 | -3.30% | -0.30% | -1.34% | -1.47% | |||||||
| 11/30/2012 | $29.83 | 16,750,050 | $499,653,992 | 0.91% | -1.71% | -0.43% | -0.57% | |||||||
| 12/31/2012 | $28.85 | 16,450,050 | $474,583,943 | -3.29% | -5.63% | -3.70% | -3.83% |
40
Comparison of the CCI-TR Index and the Greenhaven Continuous Commodity Fund Net Asset Value (“GCC NAV”) for the Years
Ended December 31,20092012, 2011, and 20082010 and For the Three Months Ended December 31, 20092012, 2011, and 20082010
Ended December 31,
43
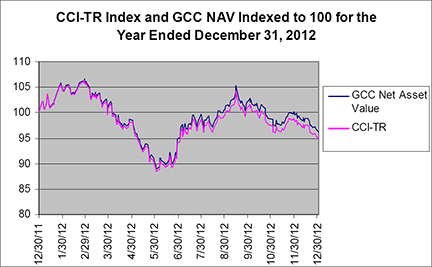
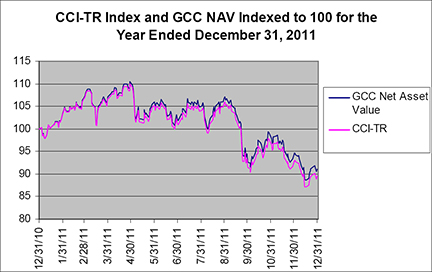
44
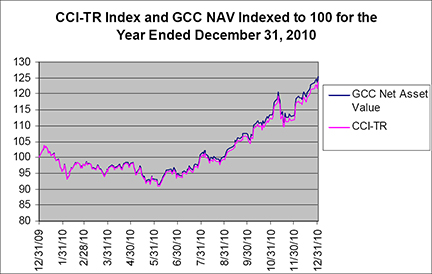
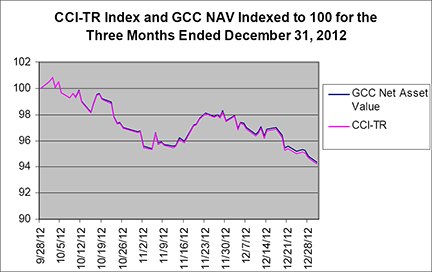
42
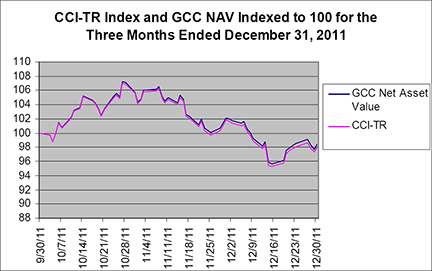
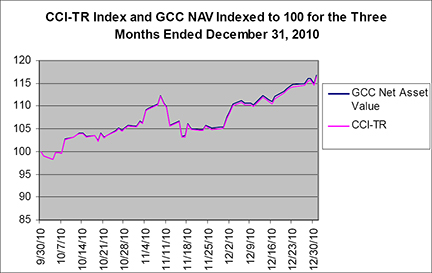
43
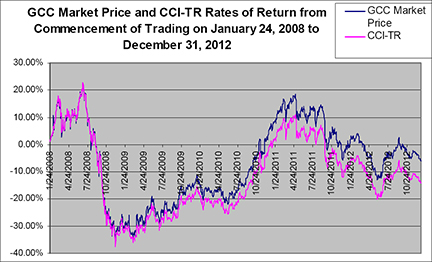
The Fund and the Master Fund seek to track changes in the Thomson Reuters Continuous Commodity Index —– Total Return, or the Index, over time. The Fund’s Net Asset Value outperformedexceeded the Index by 2.82%1.30%, 1.61%, and 1.94%1.68% net of fees for the years ended December, 31 20092012, 2011, and 2008,2010, respectively. The Fund’s Net Asset Value outperformedexceeded the Index by .97%0.14%, 0.43%, and .43%0.45% for the three months ended December 31, 20092012, 2011, and 2010, respectively. Since the fund commenced trading on January 24, 2008 respectively.
The Fund hadregistered 4,000,000 shares publicly registered. As a result, the Managing Owner ceased issuance of 50,000 share creation units until the Fund could register additional shares for issuance with the appropriate regulatory bodies.
on December 5, 2007 and commenced investment operations on January 23, 2008. An additional 21,000,000 shares were publicly registered on May 14, 2009.2009 and an additional 20,000,000 shares were publicly registered on January 14, 2011 using Form S-3. As of December 31, 2009,2012, the Fund had 8,750,00016,450,000 Limited Shares outstanding.
Net Asset Value
The Administrator daily calculates a Net Asset Value per share of the Fund daily, based on closing prices of the underlying futures contracts. The first such calculation was as of market close on January 24, 2008, the first day of trading. Values of the underlying Index are computed by Thomson Reuters America, LLC, and disseminated by NYSE Arca every fifteen (15) seconds during the trading day. Only settlement and last-sale prices are used in the Index’s calculation, bids and offers are not recognized —– including limit-bid and limit-offer price quotes. Where no last-sale price exists, typically in the more deferred contract months, the previous days’ settlement price is used. This means that the underlying Index may lag its theoretical value. This tendency to lag is evident at the end of the day when the Index value is based on the settlement prices of the component commodities, and explains why the underlying Index often closes at or near the high or low for the day.
Critical Accounting Policies and Estimates
Critical accounting policies for the Fund and Master Fund are as follows:
Preparation of the financial statements and related disclosures in conformity with U.S. generally accepted accounting principles requires the application of appropriate accounting rules and guidance, as well as the use of estimates, and requires the Managing Owner to make estimates and assumptions that affect the reported amounts of assets and liabilities, revenue and expense and related disclosure of contingent assets and liabilities during the reporting period of the consolidated financial statements and accompanying notes. Both the Fund and the Master Fund apply these policies that involve judgments and actual results may differ from the estimates used.
45
The Master Fund holds a significant portion of its assets in futures contracts and United States Treasury Obligations, both of which are recorded on a trade date basis and at fair value in the consolidated financial statements, with changes in fair value reported in the consolidated statement of income and expenses. The use of fair value to measure financial instruments, with related unrealized gains or losses recognized in earnings in each period is fundamental to the Fund’s financial statements. The fair value of a financial instrument is the amount that would be received to sell an asset or paid to transfer a liability in an orderly transaction between market participants at the measurement date (the exit price).
44
When market closing prices are not available, the Managing Owner may value an asset of the Master Fund pursuant to policies the Managing Owner has adopted, which are consistent with normal industry standards.
Interest income on United States Treasury Obligations is recognized on an accrual basis when earned. Premiums and discounts are amortized or accreted over the life of the United States Treasury Obligations.
Realized gains (losses) and changes in unrealized gain (loss) on open positions are determined on a specific identification basis and recognized in the consolidated statement of income and expenses in the period in which the contract is closed or the changes occur, respectively.
Asset Valuation
The Fund records its futures contracts and United States Treasury Obligations on a trade date basis and at fair value in the consolidated financial statements, with changes in fair value reported in the consolidated statement of income and expenses.
In determining fair value of United States Treasury Obligations and commodity futures contracts, the Fund uses unadjusted quoted market prices in active markets. Accounting Standard Codification (“ASC”) 820, “Fair Value Measurements” (“ASC 820”), establishesmarkets and a fair value hierarchy that prioritizes the inputs to valuation techniques used to measure fair value. The objective of a fair value measurement is to determine the price that would be received to sell an asset or paid to transfer a liability in an orderly transaction between market participants at the measurement date (an exit price). The hierarchy gives the highest priority to unadjusted quoted prices for identical assets or liabilities (Level 1 measurements) and the lowest priority to unobservable inputs (Level 3 measurements). Assets and liabilities are classified in their entirety based on the lowest level of input that is significant to the fair value measurement. See Note 4 within the financial statements in Item 8 for further information regarding this accounting policy.
Market Risk
See section 1A —– Risk Factors and Section 7A —– Quantitative and Qualitative Disclosures About Market Risk for a complete discussion of market risk.risk
46
Credit Risk
The Master Fund holds two types of investments. The first is long positions in futures contracts on the seventeen commodities in the Index. Since the Index allocates equally among the components and is rebalanced daily, performance risk of the futures contracts is divided equally among the components. Each of the component commodities is traded on a particular exchange, as follows:the CME Group or ICE exchanges.
The CME Corp
Group and ICE
The Master Fund will also hold significant cash balances representing the excess of invested funds above the margin requirements for its futures positions. To the extent practical, the Fund will hold this excess cash in short-term obligations of the United States Treasury. Hence, management assigns no counterparty risk to such holdings.
Liquidity
The Exchange May Halt Trading in the Shares Which Would Adversely Impact Your Ability to Sell Shares.
Trading in Shares may be halted due to market conditions or, in light of NYSE rules and procedures, for reasons that, in the view of the NYSE, make trading in Shares inadvisable. In addition, trading is subject to trading halts caused by extraordinary market volatility pursuant to “circuit breaker”breake” rules that require trading to be halted for a specified period based on a specified market decline in the equity markets. There can be no assurance that the requirements necessary to maintain the listing of the Shares will continue to be met or will remain unchanged. The Fund and the Master Fund will be terminated if the Shares are de-listed.
45
The Lack Of An Active Trading Market for the Shares May Result in Losses on Your Investment at the Time of Disposition of Your Shares.
Possible Illiquid Markets May Exacerbate Losses.
Contractual Obligations
The Fund and Master Fund’s contractual obligations are with the Managing Owner and the Commodity Broker. Management Fee payments made to the Managing Owner are calculated as a fixed percentage of the Master Fund’s Net Asset Value. Commission paymentspaid by the Fund to the Commodity Broker are on a contract-by-contract, or round-turn,per contract half-turn basis. As such, the Managing Owner cannot anticipate the amount of payments and commissions related to half turns or round turns that will be required under these arrangements for future periods as net asset values are not known until a future date.
47
Off-Balance Sheet Risk
In the normal course of its business, the Fund is party to financial instruments with off-balance sheet risk. The term “off-balance sheet risk”risk” refers to an unrecorded potential liability that, even though it does not appear on the balance sheet, may result in a future obligation or loss. The financial instruments used by the Fund are standardized commodity futures contracts traded on regulated exchanges and are recognized on the balance sheet at fair value pursuant to the accounting standards for derivatives and hedging activities, “Accounting for Derivative Instruments and Hedging Activities”. As of the balance sheet date, therefore, the Fund has no unrecorded liabilities relating to futures contracts. However, until these contracts are closed, they will fluctuate in value with changing commodity prices.
| QUANTITATIVE AND QUALITATIVE DISCLOSURES ABOUT MARKET RISK |
INTRODUCTION
The Fund is designed to replicate a commodity index. The market-sensitive instruments held by it are subject to the risk of trading loss. Unlike an operating company, the risk of market-sensitive instruments is integral, not incidental, to the Fund’s main line of business.
Market movements can produce frequent changes in the fair market value of the Fund’s open positions and, consequently, in its earnings and cash flow. The Fund’s market risk is primarily influenced by changes in the price of commodities.
QUALITATIVE DISCLOSURES REGARDING NON-TRADING RISK EXPOSURE
General
The Fund is unaware of any (i) anticipated known demands, commitments or capital expenditures; (ii) material trends, favorable or unfavorable, in its capital resources; or (iii) trends or uncertainties that will have a material effect on operations.
QUALITATIVE DISCLOSURES REGARDING MEANS OF MANAGING RISK EXPOSURE
Under ordinary circumstances, the Managing Owner’sOwner’s discretionary power is limited to determining whether the Fund will make a distribution. Under emergency or extraordinary circumstances, the Managing Owner’s discretionary powers increase, but remain circumscribed. These special circumstances, for example, include the unavailability of the Index or certain natural or man-made disasters. The Managing Owner does not apply risk management techniques. The Fund initiates positions only on the “long” side of the market and does not employ “stop-loss” techniques.
Accordingly, tabular presentations of Market Risk or Sensitivity or Value-at-Risk analyses thereof are not applicable.
48
46
Index to Financial Statements
GreenHaven Continuous Commodity Index Fund and GreenHaven Continuous Commodity Index Master Fund |
| 48 | |||||
| 49 | |||||
| 50 | |||||
| 50 | |||||
| 51 | |||||
| 52 | |||||
| 53 | |||||
| 54 | |||||
| 55 | |||||
| 56 | |||||
| 57 | |||||
| 58 | |||||
| 58 | |||||
| 59 | |||||
| 60 | |||||
| 61 | |||||
| 62 | |||||
| 63 | |||||
| 64 | |||||
| 65 | |||||
| 66 |
49
Board of Managers and Shareholders of
GreenHaven Continuous Commodity Index Fund:
We have audited the accompanying consolidated statements of financial condition of GreenHaven Continuous Commodity Index Fund (the Fund)and subsidiary as of December 31, 20092012 and 2008,2011, the consolidated scheduleschedules of investments as of December 31, 20092012 and 2008,2011, and the related consolidated statements of income and expenses, changes in shareholders’ equity, and cash flows for each of the three years in the three-year period ended December 31, 2009.2012. These financial statements are the responsibility of the GreenHaven Continuous Commodity Index Fund’s management. Our responsibility is to express an opinion on these financial statements based on our audits.
We conducted our audits in accordance with the standards of the Public Company Accounting Oversight Board (United States). Those standards require that we plan and perform the audit to obtain reasonable assurance about whether the financial statements are free of material misstatement. An audit includes examining, on a test basis, evidence supporting the amounts and disclosures in the financial statements. An audit also includes assessing the accounting principles used and significant estimates made by management, as well as evaluating the overall financial statement presentation. We believe that our audits provide a reasonable basis for our opinion.
In our opinion, the consolidated financial statements referred to above present fairly, in all material respects, the financial position of GreenHaven Continuous Commodity Index Fund and subsidiary as of December 31, 2012 and 2011, and the results of their operations and their cash flows for each of the three years in the period ended December 31, 2012 in conformity with accounting principles generally accepted in the United States of America.
We also have audited, in accordance with the standards of the Public Company Accounting Oversight Board (United States), the GreenHaven Continuous Commodity Index Fund’s internal control over financial reporting as of December 31, 2012, based on criteria established in Internal Control—Integrated Framework issued by the Committee of Sponsoring Organizations of the Treadway Commission (COSO), and our report dated February 26, 2013 expressed an unqualified opinion thereon.
/s/ Grant Thornton LLP
Atlanta, Georgia
February 26, 2013
48
REPORT OF INDEPENDENT REGISTERED PUBLIC ACCOUNTING FIRM
Board of Managers and Shareholders of
GreenHaven Continuous Commodity Index Master Fund:
We have audited the accompanying statements of financial condition of GreenHaven Continuous Commodity Index Master Fund as of December 31, 2012 and 2011, the schedules of investments as of December 31, 2012 and 2011, and the related statements of income and expenses, changes in shareholders’ equity, and cash flows for each of the three years in the period ended December 31, 2012. These financial statements are the responsibility of the GreenHaven Continuous Commodity Index Master Fund’s management. Our responsibility is to express an opinion on these financial statements based on our audits.
We conducted our audits in accordance with the standards of the Public Company Accounting Oversight Board (United States). Those standards require that we plan and perform the audit to obtain reasonable assurance about whether the financial statements are free of material misstatement. An audit includes examining, on a test basis, evidence supporting the amounts and disclosures in the financial statements. An audit also includes assessing the accounting principles used and significant estimates made by management, as well as evaluating the overall financial statement presentation. We believe that our audits provide a reasonable basis for our opinion.
In our opinion, the financial statements referred to above present fairly, in all material respects, the financial position of theGreenHaven Continuous Commodity Index Master Fund as of December 31, 20092012 and 2008,2011, and the results of its operations and its cash flows for each of the three years in the three-year period ended December 31, 2009,2012 in conformity with accounting principles generally accepted in the United States of America.
We also have audited, in accordance with the standards of the Public Company Accounting Oversight Board (United States), Greenhaventhe GreenHaven Continuous Commodity Index Master Fund’s internal control over financial reporting as of December 31, 2009,2012, based on criteria established inInternal Control-IntegratedControl—Integrated Frameworkissued by the Committee of Sponsoring Organizations of the Treadway Commission (COSO), and our report dated March 15, 2010February 26, 2013 expressed an unqualified opinion thereon.
/s/ GRANT THORNTONGrant Thornton LLP
Atlanta, Georgia
March 15, 2010
50
February 26, 2013
49
December 31, 20092012 and 20082011
| 2009 | 2008 | 2012 | 2011 | |||||||||||||
Assets | ||||||||||||||||
| Equity in broker trading accounts: | ||||||||||||||||
| Short-term investments (cost $119,990,308 and $4,998,396 as of 2009 and 2008, respectively) | $ | 119,992,525 | $ | 4,999,865 | ||||||||||||
| U.S. Treasury Obligations (cost $469,979,439 and $9,999,989 as of 2012 and 2011, respectively) | $ | 469,995,420 | $ | 9,999,990 | ||||||||||||
| Cash held by broker | 97,250,587 | 13,331,630 | 22,210,626 | 619,079,494 | ||||||||||||
| Net unrealized appreciation (depreciation) on futures contracts | 12,380,231 | (1,880,290 | ) | |||||||||||||
| Total equity in broker trading accounts | 229,623,343 | 16,451,205 | ||||||||||||||
| Capital shares receivable | — | 1,096,170 | ||||||||||||||
| Other assets and prepaid fee to broker | — | 3,525 | ||||||||||||||
| Net unrealized depreciation on futures contracts | (12,514,458 | ) | (45,001,789 | ) | ||||||||||||
| Total assets | $ | 229,623,343 | $ | 17,550,900 | $ | 479,691,588 | $ | 584,077,695 | ||||||||
Liabilities and shareholders’ equity | ||||||||||||||||
| Capital shares payable | $ | 4,327,722 | $ | 1,497,826 | ||||||||||||
| Management fee payable to related party | $ | 149,819 | $ | 11,076 | 354,469 | 438,205 | ||||||||||
| Broker fee payable | 39,186 | — | ||||||||||||||
| Accrued brokerage fees and expenses payable | 401,297 | 983,648 | ||||||||||||||
| Total liabilities | 189,005 | 11,076 | 5,083,488 | 2,919,679 | ||||||||||||
Shareholders’ equity | ||||||||||||||||
| General Units: | ||||||||||||||||
| Paid in capital — 50 units issued | 1,500 | 1,500 | ||||||||||||||
| Retained earnings (deficit) | (189 | ) | (404 | ) | ||||||||||||
| Paid in capital - 50 units issued | 1,500 | 1,500 | ||||||||||||||
| Accumulated deficit | (57 | ) | (2 | ) | ||||||||||||
| Total General Units | 1,443 | 1,498 | ||||||||||||||
| Limited Units: | ||||||||||||||||
| Total General Units | 1,311 | 1,096 | ||||||||||||||
| Limited Units: | ||||||||||||||||
| Paid in capital — 8,750,000 and 800,000 redeemable units issued and outstanding as of 2009 and 2008, respectively | 210,500,911 | 24,539,494 | ||||||||||||||
| Retained earnings (deficit) | 18,932,116 | (7,000,766 | ) | |||||||||||||
Paid in capital - 16,450,000 and 19,400,000 redeemable units issued and outstanding as of 2012 and 2011, respectively | 470,214,957 | 549,362,581 | ||||||||||||||
| Retained earnings | 4,391,700 | 31,793,937 | ||||||||||||||
| Total Limited Units | 229,433,027 | 17,538,728 | 474,606,657 | 581,156,518 | ||||||||||||
| Total shareholders’ equity | 229,434,338 | 17,539,824 | 474,608,100 | 581,158,016 | ||||||||||||
| Total liabilities and shareholders’ equity | $ | 229,623,343 | $ | 17,550,900 | ||||||||||||
Total liabilities and shareholders’ equity | $ | 479,691,588 | $ | 584,077,695 | ||||||||||||
| Net asset value per share | ||||||||||||||||
| General Units | $ | 26.22 | $ | 21.92 | $ | 28.86 | $ | 29.96 | ||||||||
| Limited Units | $ | 26.22 | $ | 21.92 | $ | 28.85 | $ | 29.96 | ||||||||
See accompanying notes to consolidated financial statements.statements
51
50
GreenHaven Continuous Commodity Index Fund
Consolidated Schedule of Investments
December 31,
| Percentage of | Fair | Face | ||||||||||
| Description | Net Assets | Value | Value | |||||||||
| U.S. Treasury Obligations | ||||||||||||
| U.S. Treasury Bills, 0.01% due January 21, 2010 | 23.97 | % | $ | 54,999,285 | $ | 55,000,000 | ||||||
| U.S. Treasury Bills, 0.07% due March 25, 2010 | 28.33 | 64,993,240 | 65,000,000 | |||||||||
| Total United States Treasury Obligations (cost $119,990,308) | 52.30 | % | $ | 119,992,525 | $ | 120,000,000 | ||||||
| Percentage of | Fair | Notional | ||||||||||
| Description | Net Assets | Value | Value | |||||||||
| Unrealized Appreciation/(Depreciation) on Futures Contracts | ||||||||||||
| Cocoa (136 contracts, settlement date March 16, 2010) | 0.07 | % | $ | 161,180 | $ | 4,473,040 | ||||||
| Cocoa (137 contracts, settlement date May 13, 2010) | 0.08 | 182,110 | 4,534,700 | |||||||||
| Cocoa (137 contracts, settlement date July 15, 2010) | 0.07 | 154,330 | 4,530,590 | |||||||||
| Coffee (87 contracts, settlement date March 19, 2010) | (0.02 | ) | (54,712 | ) | 4,435,369 | |||||||
| Coffee (87 contracts, settlement date May 18, 2010) | (0.02 | ) | (44,550 | ) | 4,489,200 | |||||||
| Coffee (87 contracts, settlement date July 20, 2010) | (0.00) | * | 5,700 | 4,536,506 | ||||||||
| Copper (54 contracts, settlement date March 29, 2010) | 0.24 | 548,875 | 4,517,775 | |||||||||
| Copper (54 contracts, settlement date May 26, 2010) | 0.25 | 581,925 | 4,536,675 | |||||||||
| Copper (53 contracts, settlement date July 28, 2010) | 0.20 | 449,350 | 4,465,912 | |||||||||
| Corn (212 contracts, settlement date March 12, 2010) | 0.21 | 486,987 | 4,393,700 | |||||||||
| Corn (212 contracts, settlement date May 14, 2010) | 0.22 | 503,862 | 4,497,050 | |||||||||
| Corn (212 contracts, settlement date July 14, 2010) | 0.04 | 97,962 | 4,589,800 | |||||||||
| Cotton (118 contracts, settlement date March 09, 2010) | 0.21 | 491,955 | 4,460,400 | |||||||||
| Cotton (117 contracts, settlement date May 06, 2010) | 0.21 | 479,775 | 4,480,515 | |||||||||
| Cotton (118 contracts, settlement date July 08, 2010) | 0.07 | 163,925 | 4,541,820 | |||||||||
| Florida Orange Juice (233 contracts, settlement date March 11, 2010) | 0.13 | 292,253 | 4,510,298 | |||||||||
| Florida Orange Juice (236 contracts, settlement date May 10, 2010) | 0.29 | 673,343 | 4,699,350 | |||||||||
| Florida Orange Juice (208 contracts, settlement date July 12, 2010) | 0.10 | 220,958 | 4,235,400 | |||||||||
| Gold (41 contracts, settlement date February 24, 2010) | 0.11 | 247,040 | 4,494,420 | |||||||||
| Gold (41 contracts, settlement date April 28, 2010) | 0.12 | 285,440 | 4,500,160 | |||||||||
| Gold (41 contracts, settlement date June 28, 2010) | (0.03 | ) | (73,280 | ) | 4,505,080 | |||||||
| Heating Oil (31 contracts, settlement date January 29, 2010) | 0.08 | 171,121 | 2,754,511 | |||||||||
| Heating Oil (30 contracts, settlement date February 26, 2010) | 0.07 | 167,378 | 2,673,594 | |||||||||
| Heating Oil (30 contracts, settlement date March 31, 2010) | 0.07 | 174,531 | 2,679,138 | |||||||||
| Heating Oil (30 contracts, settlement date April 30, 2010) | 0.03 | 79,624 | 2,686,194 | |||||||||
| Heating Oil (30 contracts, settlement date May 28, 2010) | 0.03 | 76,679 | 2,694,132 | |||||||||
| Lean Hogs (117 contracts, settlement date February 12, 2010) | 0.12 | 279,190 | 3,070,080 | |||||||||
| Lean Hogs (117 contracts, settlement date April 15, 2010) | 0.10 | 236,150 | 3,270,150 | |||||||||
| Lean Hogs (116 contracts, settlement date June 14, 2010) | 0.03 | 81,640 | 3,585,560 | |||||||||
| Lean Hogs (117 contracts, settlement date July 15, 2010) | 0.02 | 42,930 | 3,561,480 | |||||||||
| Light, Sweet Crude Oil (34 contracts, settlement date January 20, 2010) | 0.07 | 165,770 | 2,698,240 | |||||||||
| Light, Sweet Crude Oil (34 contracts, settlement date February 22, 2010) | 0.07 | 163,510 | 2,720,680 | |||||||||
| Light, Sweet Crude Oil (33 contracts, settlement date March 22, 2010) | 0.07 | 153,050 | 2,660,790 | |||||||||
| Light, Sweet Crude Oil (33 contracts, settlement date April 20, 2010) | 0.02 | 35,750 | 2,676,630 | |||||||||
| Light, Sweet Crude Oil (33 contracts, settlement date May 20, 2010) | 0.02 | 35,980 | 2,692,470 | |||||||||
| Live Cattle (128 contracts, settlement date February 26, 2010) | (0.00) | * | (2,580 | ) | 4,412,160 | |||||||
| Live Cattle (128 contracts, settlement date April 30, 2010) | 0.03 | 62,390 | 4,597,760 | |||||||||
| Live Cattle (128 contracts, settlement date June 30, 2010) | 0.07 | 153,590 | 4,491,520 | |||||||||
| Natural Gas (49 contracts, settlement date January 27, 2010) | 0.04 | 103,110 | 2,730,280 | |||||||||
| Natural Gas (49 contracts, settlement date February 24, 2010) | 0.03 | 71,960 | 2,710,680 | |||||||||
| Natural Gas (48 contracts, settlement date March 29, 2010) | 0.03 | 66,120 | 2,642,400 | |||||||||
| Natural Gas (48 contracts, settlement date April 28, 2010) | 0.11 | 249,020 | 2,661,600 | |||||||||
| Natural Gas (48 contracts, settlement date May 26, 2010) | 0.11 | 240,580 | 2,695,200 | |||||||||
| Platinum (91 contracts, settlement date April 28, 2010) | 0.24 | 545,890 | 6,693,050 | |||||||||
| Platinum (92 contracts, settlement date July 28, 2010) | 0.17 | 385,155 | 6,785,000 | |||||||||
| Silver (53 contracts, settlement date March 29, 2010) | (0.01 | ) | (24,685 | ) | 4,463,925 | |||||||
| Silver (53 contracts, settlement date May 26, 2010) | 0.02 | 55,010 | 4,469,490 | |||||||||
| Silver (54 contracts, settlement date July 28, 2010) | (0.06 | ) | (130,355 | ) | 4,559,220 | |||||||
| Soybean (85 contracts, settlement date March 12, 2010) | 0.13 | 303,288 | 4,456,125 | |||||||||
| Soybean (85 contracts, settlement date May 14, 2010) | 0.15 | 340,100 | 4,478,438 | |||||||||
| Soybean (86 contracts, settlement date July 14, 2010) | 0.09 | 198,900 | 4,554,775 | |||||||||
| Sugar (160 contracts, settlement date February 26, 2010) | 0.28 | 638,098 | 4,829,440 | |||||||||
| Sugar (161 contracts, settlement date April 30, 2010) | 0.23 | 522,222 | 4,549,474 | |||||||||
| Sugar (161 contracts, settlement date June 30, 2010) | 0.19 | 423,725 | 4,150,966 | |||||||||
| Wheat (162 contracts, settlement date March 12, 2010) | 0.12 | 268,175 | 4,386,150 | |||||||||
| Wheat (162 contracts, settlement date May 14, 2010) | 0.11 | 263,200 | 4,495,500 | |||||||||
| Wheat (162 contracts, settlement date July 14, 2010) | (0.03 | ) | (70,413 | ) | 4,584,600 | |||||||
| Net Unrealized Appreciation on Futures Contracts | 5.40 | % | $ | 12,380,231 | $ | 229,249,162 | ||||||
| Percentage of | Fair | Face | ||||||||||
| Description | Net Assets | Value | Value | |||||||||
| U.S. Treasury Obligations | ||||||||||||
| U.S. Treasury Bills, 0.06% due January 03, 2013 | 37.93 | % | $ | 180,000,000 | $ | 180,000,000 | ||||||
| U.S. Treasury Bills, 0.05% due January 10, 2013 | 6.32 | 29,999,820 | 30,000,000 | |||||||||
| U.S. Treasury Bills, 0.05% due January 24, 2013 | 40.03 | 189,997,910 | 190,000,000 | |||||||||
| U.S. Treasury Bills, 0.11% due February 14, 2013 | 14.75 | 69,997,690 | 70,000,000 | |||||||||
| Total U.S. Treasury Obligations (cost $469,979,439) | 99.03 | % | $ | 469,995,420 | $ | 470,000,000 | ||||||
| Percentage of | Fair | Notional | ||||||||||
| Description | Net Assets | Value | Value | |||||||||
| Unrealized Appreciation/(Depreciation) on Futures Contracts | ||||||||||||
| Cocoa (414 contracts, settlement date March 13, 2013) | (0.20 | )% | $ | (948,620 | ) | $ | 9,257,040 | |||||
| Cocoa (415 contracts, settlement date May 15, 2013) | (0.20 | ) | (932,590 | ) | 9,320,900 | |||||||
| Cocoa (414 contracts, settlement date July 16, 2013) | (0.10 | ) | (485,050 | ) | 9,331,560 | |||||||
| Coffee (168 contracts, settlement date March 18, 2013) | (0.28 | ) | (1,303,556 | ) | 9,059,400 | |||||||
| Coffee (170 contracts, settlement date May 20, 2013) | (0.28 | ) | (1,324,350 | ) | 9,352,125 | |||||||
| Coffee (169 contracts, settlement date July 19, 2013) | (0.14 | ) | (671,381 | ) | 9,477,731 | |||||||
| Copper (102 contracts, settlement date March 26, 2013) | 0.12 | 554,000 | 9,313,875 | |||||||||
| Copper (102 contracts, settlement date May 29, 2013) | 0.11 | 544,763 | 9,338,100 | |||||||||
| Copper (101 contracts, settlement date July 29, 2013) | 0.11 | 529,500 | 9,271,800 | |||||||||
| Corn (267 contracts, settlement date March 14, 2013) | (0.25 | ) | (1,180,150 | ) | 9,321,637 | |||||||
| Corn (266 contracts, settlement date May 14, 2013) | (0.23 | ) | (1,104,225 | ) | 9,313,325 | |||||||
| Corn (266 contracts, settlement date July 12, 2013) | (0.08 | ) | (389,100 | ) | 9,273,425 | |||||||
| Cotton (246 contracts, settlement date March 06, 2013) | 0.08 | 361,630 | 9,242,220 | |||||||||
| Cotton (244 contracts, settlement date May 08, 2013) | 0.02 | 99,440 | 9,254,920 | |||||||||
| Cotton (245 contracts, settlement date July 09, 2013) | 0.10 | 489,040 | 9,416,575 | |||||||||
| FCOJ-A (838 contracts, settlement date March 08, 2013) | (0.06 | ) | (301,343 | ) | 14,750,895 | |||||||
| FCOJ-A (435 contracts, settlement date May 10, 2013) | 0.03 | 133,620 | 7,777,800 | |||||||||
| FCOJ-A (285 contracts, settlement date July 11, 2013) | (0.01 | ) | (61,987 | ) | 5,185,575 | |||||||
| Gold (56 contracts, settlement date February 26, 2013) | 0.07 | 312,270 | 9,384,480 | |||||||||
| Gold (55 contracts, settlement date April 26, 2013) | 0.05 | 236,130 | 9,229,000 | |||||||||
| Gold (55 contracts, settlement date June 26, 2013) | (0.07 | ) | (317,080 | ) | 9,240,000 | |||||||
| Heating Oil (44 contracts, settlement date January 31, 2013) | 0.00 | * | (14,960 | ) | 5,602,766 | |||||||
| Heating Oil (44 contracts, settlement date February 28, 2013) | 0.00 | * | (10,185 | ) | 5,575,046 | |||||||
| Heating Oil (44 contracts, settlement date March 28, 2013) | 0.00 | * | (1,571 | ) | 5,535,869 | |||||||
| Heating Oil (44 contracts, settlement date April 30, 2013) | 0.02 | 85,352 | 5,587,982 | |||||||||
| Heating Oil (44 contracts, settlement date May 31, 2013) | 0.02 | 90,959 | 5,558,045 | |||||||||
| Lean Hogs (189 contracts, settlement date February 14, 2013) | 0.07 | 323,420 | 6,480,810 | |||||||||
| Lean Hogs (189 contracts, settlement date April 12, 2013) | 0.01 | 24,060 | 6,707,610 | |||||||||
| Lean Hogs (188 contracts, settlement date June 14, 2013) | (0.04 | ) | (163,170 | ) | 7,358,320 | |||||||
| Lean Hogs (188 contracts, settlement date July 15, 2013) | (0.04 | ) | (193,660 | ) | 7,322,600 | |||||||
| Light, Sweet Crude Oil (60 contracts, settlement date January 22, 2013) | (0.01 | ) | (45,010 | ) | 5,509,200 | |||||||
| Light, Sweet Crude Oil (61 contracts, settlement date February 20, 2013) | (0.01 | ) | (57,300 | ) | 5,628,470 | |||||||
| Light, Sweet Crude Oil (60 contracts, settlement date March 20, 2013) | (0.01 | ) | (38,330 | ) | 5,563,800 | |||||||
| Light, Sweet Crude Oil (60 contracts, settlement date April 22, 2013) | 0.06 | 279,100 | 5,589,600 | |||||||||
| Light, Sweet Crude Oil (60 contracts, settlement date May 21, 2013) | 0.06 | 274,100 | 5,609,400 | |||||||||
| Live Cattle (175 contracts, settlement date February 28, 2013) | 0.03 | 163,800 | 9,261,000 | |||||||||
| Live Cattle (174 contracts, settlement date April 30, 2013) | 0.02 | 106,530 | 9,491,700 | |||||||||
| Live Cattle (175 contracts, settlement date June 28, 2013) | 0.02 | 96,290 | 9,152,500 | |||||||||
| Natural Gas (163 contracts, settlement date January 29, 2013) | (0.06 | ) | (298,990 | ) | 5,462,130 | |||||||
| Natural Gas (163 contracts, settlement date Februay 26, 2013) | (0.05 | ) | (251,910 | ) | 5,484,950 | |||||||
| Natural Gas (163 contracts, settlement date March 26, 2013) | (0.04 | ) | (189,680 | ) | 5,546,890 | |||||||
| Natural Gas (163 contracts, settlement date April 26, 2013) | (0.07 | ) | (316,420 | ) | 5,628,390 | |||||||
| Natural Gas (163 contracts, settlement date May 29, 2013) | (0.06 | ) | (298,280 | ) | 5,718,040 | |||||||
| Platinum (181 contracts, settlement date April 26, 2013) | (0.06 | ) | (267,470 | ) | 13,958,720 | |||||||
| Platinum (180 contracts, settlement date July 29, 2013) | (0.07 | ) | (329,455 | ) | 13,911,300 | |||||||
| Silver (62 contracts, settlement date March 26, 2013) | 0.01 | 58,585 | 9,370,370 | |||||||||
| Silver (61 contracts, settlement date May 29, 2013) | 0.03 | 143,405 | 9,235,095 | |||||||||
| Silver (61 contracts, settlement date July 29, 2013) | (0.14 | ) | (680,860 | ) | 9,249,125 | |||||||
| Soybean (133 contracts, settlement date March 14, 2013) | (0.16 | ) | (772,287 | ) | 9,373,175 | |||||||
| Soybean (132 contracts, settlement date May 14, 2013) | (0.10 | ) | (461,563 | ) | 9,235,050 | |||||||
| Soybean (133 contracts, settlement date July 12, 2013) | (0.01 | ) | (61,712 | ) | 9,278,413 | |||||||
| Sugar (424 contracts, settlement date February 28, 2013) | (0.10 | ) | (456,109 | ) | 9,264,909 | |||||||
| Sugar (424 contracts, settlement date April 30, 2013) | (0.07 | ) | (317,901 | ) | 9,307,648 | |||||||
| Sugar (423 contracts, settlement date June 28, 2013) | 0.06 | 278,678 | 9,352,022 | |||||||||
| Wheat (237 contracts, settlement date March 14, 2013) | (0.28 | ) | (1,303,087 | ) | 9,219,300 | |||||||
| Wheat (237 contracts, settlement date May 14, 2013) | (0.24 | ) | (1,134,200 | ) | 9,334,838 | |||||||
| Wheat (235 contracts, settlement date July 12, 2013) | (0.22 | ) | (1,015,588 | ) | 9,326,563 | |||||||
| Net Unrealized Depreciation on Futures Contracts | (2.64 | )% | $ | (12,514,458 | ) | $ | 473,904,029 | |||||
| * | Denotes greater than |
See accompanying notes to consolidated financial statements.statements
52
51
GreenHaven Continuous Commodity Index Fund
Consolidated Schedule of Investments
December 31,
| Percentage of | Fair | Face | ||||||||||
| Description | Net Assets | Value | Value | |||||||||
| U.S. Treasury Obligations | ||||||||||||
| U.S. Treasury Bill, 0.53% due February 5, 2009 (cost $4,998,396) | 28.51 | % | $ | 4,999,865 | $ | 5,000,000 | ||||||
| Percentage of | Fair | Notional | ||||||||||
| Description | Net Assets | Value | Value | |||||||||
| Unrealized Appreciation (Depreciation) on Futures Contracts | ||||||||||||
| Cocoa (13 contracts, settlement date March 16, 2009) | 0.29 | % | $ | 51,140 | $ | 346,450 | ||||||
| Cocoa (13 contracts, settlement date May 13, 2009) | 0.01 | 1,640 | 345,410 | |||||||||
| Cocoa (13 contracts, settlement date July 16, 2009) | 0.47 | 82,790 | 343,980 | |||||||||
| Coffee (8 contracts, settlement date March 19, 2009) | (0.40 | ) | (71,119 | ) | 336,150 | |||||||
| Coffee (8 contracts, settlement date May 18, 2009) | (0.46 | ) | (81,356 | ) | 342,900 | |||||||
| Coffee (8 contracts, settlement date July 21, 2009) | (0.06 | ) | (9,900 | ) | 349,500 | |||||||
| Copper (10 contracts, settlement date March 27, 2009) | (0.22 | ) | (38,538 | ) | 352,500 | |||||||
| Copper (10 contracts, settlement date May 27, 2009) | (1.15 | ) | (200,963 | ) | 355,125 | |||||||
| Copper (9 contracts, settlement date July 29, 2009) | (0.34 | ) | (59,513 | ) | 321,075 | |||||||
| Corn (17 contracts, settlement date March 13, 2009) | (0.11 | ) | (19,950 | ) | 345,950 | |||||||
| Corn (16 contracts, settlement date May 14, 2009) | (0.37 | ) | (64,500 | ) | 334,200 | |||||||
| Corn (16 contracts, settlement date July 14, 2009) | 0.08 | 14,663 | 342,400 | |||||||||
| Cotton (14 contracts, settlement date March 09, 2009) | 0.02 | 3,505 | 343,140 | |||||||||
| Cotton (14 contracts, settlement date May 06, 2009) | (0.65 | ) | (113,810 | ) | 345,170 | |||||||
| Cotton (13 contracts, settlement date July 09, 2009) | 0.20 | 34,965 | 328,965 | |||||||||
| Florida Orange Juice (31 contracts, settlement date March 11, 2009) | (0.46 | ) | (80,873 | ) | 315,735 | |||||||
| Florida Orange Juice (32 contracts, settlement date May 08, 2009) | (0.64 | ) | (111,968 | ) | 345,360 | |||||||
| Florida Orange Juice (31 contracts, settlement date July 13, 2009) | (0.36 | ) | (63,195 | ) | 352,703 | |||||||
| Gold (4 contracts, settlement date February 25, 2009) | 0.16 | 28,270 | 353,720 | |||||||||
| Gold (4 contracts, settlement date April 28, 2009) | 0.03 | 4,730 | 354,120 | |||||||||
| Gold (4 contracts, settlement date June 26, 2009) | 0.31 | 54,980 | 354,480 | |||||||||
| Heating Oil (4 contracts, settlement date January 30, 2009) | (0.51 | ) | (89,321 | ) | 242,273 | |||||||
| Heating Oil (4 contracts, settlement date February 27, 2009) | (0.86 | ) | (150,263 | ) | 246,557 | |||||||
| Heating Oil (3 contracts, settlement date March 31, 2009) | (0.87 | ) | (152,141 | ) | 187,689 | |||||||
| Heating Oil (3 contracts, settlement date April 30, 2009) | (0.29 | ) | (50,518 | ) | 190,461 | |||||||
| Heating Oil (3 contracts, settlement date May 29, 2009) | (0.19 | ) | (33,835 | ) | 193,296 | |||||||
| Lean Hogs (9 contracts, settlement date February 13, 2009) | (0.13 | ) | (22,780 | ) | 219,150 | |||||||
| Lean Hogs (9 contracts, settlement date April 15, 2009) | (0.19 | ) | (33,680 | ) | 247,320 | |||||||
| Lean Hogs (9 contracts, settlement date June 12, 2009) | (0.01 | ) | (990 | ) | 287,640 | |||||||
| Lean Hogs (9 contracts, settlement date July 15, 2009) | 0.01 | 1,510 | 286,830 | |||||||||
| Light, Sweet Crude Oil (5 contracts, settlement date January 20, 2009) | (0.47 | ) | (81,800 | ) | 223,000 | |||||||
| Light, Sweet Crude Oil (4 contracts, settlement date February 20, 2009) | (0.79 | ) | (139,260 | ) | 194,360 | |||||||
| Light, Sweet Crude Oil (4 contracts, settlement date March 20, 2009) | (0.40 | ) | (69,720 | ) | 202,280 | |||||||
| Light, Sweet Crude Oil (4 contracts, settlement date April 21, 2009) | (0.16 | ) | (27,460 | ) | 207,840 | |||||||
| Light, Sweet Crude Oil (4 contracts, settlement date May 19, 2009) | (0.14 | ) | (25,390 | ) | 212,640 | |||||||
| Live Cattle (10 contracts, settlement date February 27, 2009) | (0.17 | ) | (30,520 | ) | 344,200 | |||||||
| Live Cattle (10 contracts, settlement date April 30, 2009) | (0.24 | ) | (42,410 | ) | 356,400 | |||||||
| Live Cattle (9 contracts, settlement date June 30, 2009) | (0.05 | ) | (9,700 | ) | 310,320 | |||||||
| Natural Gas (4 contracts, settlement date January 28, 2009) | (0.02 | ) | (4,090 | ) | 224,880 | |||||||
| Natural Gas (4 contracts, settlement date February 25, 2009) | (0.42 | ) | (74,570 | ) | 226,280 | |||||||
| Natural Gas (4 contracts, settlement date March 27, 2009) | (0.53 | ) | (93,420 | ) | 229,000 | |||||||
| Natural Gas (3 contracts, settlement date April 28, 2009) | (0.11 | ) | (20,160 | ) | 173,850 | |||||||
| Natural Gas (3 contracts, settlement date May 27, 2009) | (0.08 | ) | (13,380 | ) | 177,120 | |||||||
| Platinum (11 contracts, settlement date April 28, 2009) | 0.26 | 46,325 | 517,825 | |||||||||
| Platinum (10 contracts, settlement date July 29, 2009) | 0.27 | 46,800 | 473,250 | |||||||||
| Silver (6 contracts, settlement date March 27, 2009) | 0.18 | 31,825 | 338,850 | |||||||||
| Silver (6 contracts, settlement date May 27, 2009) | (0.43 | ) | (74,830 | ) | 339,210 | |||||||
| Silver (6 contracts, settlement date July 29, 2009) | 0.28 | 49,770 | 339,450 | |||||||||
| Soybean (7 contracts, settlement date March 13, 2009) | (0.11 | ) | (18,838 | ) | 343,000 | |||||||
| Soybean (7 contracts, settlement date May 14, 2009) | (0.50 | ) | (87,738 | ) | 347,025 | |||||||
| Soybean (7 contracts, settlement date July 14, 2009) | 0.21 | 35,788 | 350,963 | |||||||||
| Sugar (26 contracts, settlement date February 27, 2009) | (0.04 | ) | (7,806 | ) | 343,907 | |||||||
| Sugar (25 contracts, settlement date April 30, 2009) | (0.24 | ) | (41,742 | ) | 344,400 | |||||||
| Sugar (24 contracts, settlement date June 30, 2009) | 0.08 | 14,605 | 340,301 | |||||||||
| Wheat (11 contracts, settlement date March 13, 2009) | (0.14 | ) | (24,412 | ) | 335,913 | |||||||
| Wheat (11 contracts, settlement date May 14, 2009) | (0.44 | ) | (77,575 | ) | 342,925 | |||||||
| Wheat (11 contracts, settlement date July 14, 2009) | 0.17 | 30,438 | 348,700 | |||||||||
| Net Unrealized Depreciation on Futures Contracts | (10.72 | )% | $ | (1,880,290 | ) | $ | 17,498,138 | |||||
| Percentage of | Fair | Face | ||||||||||
| Description | Net Assets | Value | Value | |||||||||
| U.S. Treasury Obligations | ||||||||||||
| U.S. Treasury Bill, 0.00% due January 05, 2012 (cost $9,999,989) | 1.72 | % | $ | 9,999,990 | $ | 10,000,000 | ||||||
| Percentage of | Fair | Notional | ||||||||||
| Description | Net Assets | Value | Value | |||||||||
| Unrealized Appreciation/(Depreciation) on Futures Contracts | ||||||||||||
| Cocoa (535 contracts, settlement date March 15, 2012) | (0.55 | )% | $ | (3,205,990 | ) | $ | 11,283,150 | |||||
| Cocoa (536 contracts, settlement date May 15, 2012) | (0.53 | ) | (3,093,380 | ) | 11,422,160 | |||||||
| Cocoa (536 contracts, settlement date July 16, 2012) | (0.33 | ) | (1,932,240 | ) | 11,513,280 | |||||||
| Coffee (133 contracts, settlement date March 20, 2012) | (0.15 | ) | (896,456 | ) | 11,314,144 | |||||||
| Coffee (132 contracts, settlement date May 18, 2012) | (0.16 | ) | (919,744 | ) | 11,367,675 | |||||||
| Coffee (132 contracts, settlement date July 19, 2012) | (0.06 | ) | (352,538 | ) | 11,493,900 | |||||||
| Copper (133 contracts, settlement date March 28, 2012) | (0.10 | ) | (592,150 | ) | 11,424,700 | |||||||
| Copper (132 contracts, settlement date May 29, 2012) | (0.11 | ) | (608,013 | ) | 11,376,750 | |||||||
| Copper (132 contracts, settlement date July 27, 2012) | 0.01 | 51,438 | 11,401,500 | |||||||||
| Corn (349 contracts, settlement date March 14, 2012) | (0.15 | ) | (862,200 | ) | 11,281,425 | |||||||
| Corn (349 contracts, settlement date May 14, 2012) | (0.15 | ) | (839,875 | ) | 11,425,387 | |||||||
| Corn (348 contracts, settlement date July 13, 2012) | 0.01 | 33,125 | 11,505,750 | |||||||||
| Cotton (249 contracts, settlement date March 08, 2012) | (0.13 | ) | (726,570 | ) | 11,429,100 | |||||||
| Cotton (248 contracts, settlement date May 08, 2012) | (0.15 | ) | (851,265 | ) | 11,368,320 | |||||||
| Cotton (248 contracts, settlement date July 09, 2012) | (0.12 | ) | (721,380 | ) | 11,322,440 | |||||||
| FCOJ-A (561 contracts, settlement date March 12, 2012) | 0.04 | 257,978 | 14,221,350 | |||||||||
| FCOJ-A (486 contracts, settlement date May 10, 2012) | 0.15 | 856,470 | 12,261,780 | |||||||||
| FCOJ-A (306 contracts, settlement date July 11, 2012) | (0.01 | ) | (32,880 | ) | 7,738,740 | |||||||
| Gold (72 contracts, settlement date February 27, 2012) | (0.09 | ) | (527,380 | ) | 11,280,960 | |||||||
| Gold (72 contracts, settlement date April 26, 2012) | (0.21 | ) | (1,233,460 | ) | 11,299,680 | |||||||
| Gold (73 contracts, settlement date June 27, 2012) | (0.25 | ) | (1,434,620 | ) | 11,472,680 | |||||||
| Heating Oil (57 contracts, settlement date January 31, 2012) | (0.02 | ) | (109,389 | ) | 6,976,595 | |||||||
| Heating Oil (56 contracts, settlement date February 29, 2012) | (0.02 | ) | (101,056 | ) | 6,834,677 | |||||||
| Heating Oil (56 contracts, settlement date March 30, 2012) | (0.02 | ) | (111,661 | ) | 6,789,283 | |||||||
| Heating Oil (56 contracts, settlement date April 30, 2012) | (0.09 | ) | (493,088 | ) | 6,734,482 | |||||||
| Heating Oil (56 contracts, settlement date May 31, 2012) | (0.08 | ) | (488,053 | ) | 6,693,557 | |||||||
| Lean Hogs (236 contracts, settlement date February 14, 2012) | (0.07 | ) | (384,030 | ) | 7,957,920 | |||||||
| Lean Hogs (236 contracts, settlement date April 16, 2012) | (0.06 | ) | (325,560 | ) | 8,278,880 | |||||||
| Lean Hogs (235 contracts, settlement date June 14, 2012) | (0.05 | ) | (275,680 | ) | 8,977,000 | |||||||
| Lean Hogs (236 contracts, settlement date July 16, 2012) | (0.04 | ) | (210,990 | ) | 8,951,480 | |||||||
| Light, Sweet Crude Oil (69 contracts, settlement date January 20, 2012) | 0.13 | 727,240 | 6,819,270 | |||||||||
| Light, Sweet Crude Oil (69 contracts, settlement date February 21, 2012) | 0.13 | 746,950 | 6,831,000 | |||||||||
| Light, Sweet Crude Oil (69 contracts, settlement date March 20, 2012) | 0.13 | 746,560 | 6,845,490 | |||||||||
| Light, Sweet Crude Oil (69 contracts, settlement date April 20, 2012) | 0.01 | 82,600 | 6,859,290 | |||||||||
| Light, Sweet Crude Oil (68 contracts, settlement date May 22, 2012) | 0.02 | 113,320 | 6,764,640 | |||||||||
| Live Cattle (229 contracts, settlement date February 29, 2012) | 0.00 | * | 2,380 | 11,124,820 | ||||||||
| Live Cattle (230 contracts, settlement date April 30, 2012) | (0.02 | ) | (131,730 | ) | 11,541,400 | |||||||
| Live Cattle (230 contracts, settlement date June 29, 2012) | (0.02 | ) | (122,410 | ) | 11,460,900 | |||||||
| Natural Gas (224 contracts, settlement date January 27, 2012) | (0.40 | ) | (2,315,920 | ) | 6,695,360 | |||||||
| Natural Gas (224 contracts, settlement date February 27, 2012) | (0.38 | ) | (2,204,450 | ) | 6,755,840 | |||||||
| Natural Gas (220 contracts, settlement date March 28, 2012) | (0.36 | ) | (2,067,940 | ) | 6,773,800 | |||||||
| Natural Gas (220 contracts, settlement date April 26, 2012) | (0.20 | ) | (1,188,850 | ) | 6,888,200 | |||||||
| Natural Gas (219 contracts, settlement date May 29, 2012) | (0.20 | ) | (1,169,040 | ) | 6,968,580 | |||||||
| Platinum (243 contracts, settlement date April 26, 2012) | (0.43 | ) | (2,468,450 | ) | 17,069,535 | |||||||
| Platinum (243 contracts, settlement date July 27, 2012) | (0.44 | ) | (2,566,290 | ) | 17,124,210 | |||||||
| Silver (82 contracts, settlement date March 28, 2012) | (0.35 | ) | (2,055,925 | ) | 11,445,150 | |||||||
| Silver (81 contracts, settlement date May 29, 2012) | (0.38 | ) | (2,222,650 | ) | 11,323,800 | |||||||
| Silver (81 contracts, settlement date July 27, 2012) | (0.33 | ) | (1,944,665 | ) | 11,338,785 | |||||||
| Soybean (186 contracts, settlement date March 14, 2012) | (0.17 | ) | (1,016,225 | ) | 11,232,075 | |||||||
| Soybean (187 contracts, settlement date May 14, 2012) | (0.16 | ) | (954,425 | ) | 11,383,625 | |||||||
| Soybean (187 contracts, settlement date July 13, 2012) | 0.05 | 264,900 | 11,472,450 | |||||||||
| Sugar (444 contracts, settlement date February 29, 2012) | (0.24 | ) | (1,406,339 | ) | 11,586,624 | |||||||
| Sugar (444 contracts, settlement date April 30, 2012) | (0.20 | ) | (1,152,122 | ) | 11,412,576 | |||||||
| Sugar (444 contracts, settlement date June 29, 2012) | (0.09 | ) | (545,496 | ) | 11,218,637 | |||||||
| Wheat (343 contracts, settlement date March 14, 2012) | (0.20 | ) | (1,133,987 | ) | 11,194,662 | |||||||
| Wheat (340 contracts, settlement date May 14, 2012) | (0.19 | ) | (1,118,513 | ) | 11,411,250 | |||||||
| Wheat (340 contracts, settlement date July 13, 2012) | 0.04 | 230,325 | 11,666,250 | |||||||||
| Net Unrealized Depreciation on Futures Contracts | (7.74 | )% | $ | (45,001,789 | ) | $ | 580,606,964 | |||||
| * | Denotes greater than 0.000% yet less than 0.005% |
See accompanying notes to consolidated financial statements.statements
53
52
GreenHaven Continuous Commodity Index Fund
Consolidated Statements of Income and Expenses
For the Years Ended December 31,
| 2009 | 2008 | |||||||
Income | ||||||||
| Interest Income | $ | 126,329 | $ | 338,455 | ||||
Expenses | ||||||||
| Management fee to related party | 1,018,526 | 188,888 | ||||||
| Brokerage commissions and fees | 287,584 | 54,945 | ||||||
| Total expenses | 1,306,110 | 243,833 | ||||||
Net Investment Income (Loss) | (1,179,781 | ) | 94,622 | |||||
Realized and Net Change in Unrealized Gain (Loss) on Investments and Futures Contracts | ||||||||
Realized Gain (Loss) on | ||||||||
| Investments | 397 | 2,725 | ||||||
| Futures Contracts | 12,851,212 | (5,219,696 | ) | |||||
Net Realized Gain (Loss) | 12,851,609 | (5,216,971 | ) | |||||
Net Change in Unrealized Gain (Loss) on | ||||||||
| Investments | 748 | 1,469 | ||||||
| Futures Contracts | 14,260,521 | (1,880,290 | ) | |||||
Net Change in Unrealized Gain (Loss) | 14,261,269 | (1,878,821 | ) | |||||
Net Realized and Unrealized Gain (Loss) on Investments and Future Contracts | 27,112,878 | (7,095,792 | ) | |||||
Net Income (Loss) | $ | 25,933,097 | $ | (7,001,170 | ) | |||
| 2012 | 2011 | 2010 | ||||||||||
| Income | ||||||||||||
| Interest Income | $ | 331,044 | $ | 335,677 | $ | 301,808 | ||||||
| Expenses | ||||||||||||
| Management fee to related party | 4,637,997 | 5,895,201 | 2,523,863 | |||||||||
| Brokerage fees and expenses | 377,195 | 1,300,472 | 712,620 | |||||||||
| Total expenses | 5,015,192 | 7,195,673 | 3,236,483 | |||||||||
| Net Investment Loss | (4,684,148 | ) | (6,859,996 | ) | (2,934,675 | ) | ||||||
Realized and Net Change in Unrealized Gain (Loss) on Investments and Futures Contracts | ||||||||||||
| Realized Gain (Loss) on | ||||||||||||
| Investments | 1,429 | 451 | (403 | ) | ||||||||
| Futures Contracts | (55,222,884 | ) | 36,755,383 | 43,285,484 | ||||||||
| Net Realized Gain (Loss) | (55,221,455 | ) | 36,755,834 | 43,285,081 | ||||||||
| Net Change in Unrealized Gain (Loss) on | ||||||||||||
| Investments | 15,980 | (20,292 | ) | 18,076 | ||||||||
| Futures Contracts | 32,487,331 | (103,641,471 | ) | 46,259,451 | ||||||||
| Net Change in Unrealized Gain (Loss) | 32,503,311 | (103,661,763 | ) | 46,277,527 | ||||||||
Net Realized and Unrealized Gain (Loss) on Investments and Future Contracts | (22,718,144 | ) | (66,905,929 | ) | 89,562,608 | |||||||
| Net Gain (Loss) | $ | (27,402,292 | ) | $ | (73,765,925 | ) | $ | 86,627,933 | ||||
See accompanying notes to consolidated financial statements.statements
54
53
Consolidated
For the Year Ended December 31,
| General Units | Limited Units | Total | ||||||||||||||||||||||||||||||||||
| Total | Total | |||||||||||||||||||||||||||||||||||
| General | Limited | Total | ||||||||||||||||||||||||||||||||||
| General Units | Accumulated | Shareholders’ | Limited Units | Accumulated | Shareholders’ | Shareholders’ | ||||||||||||||||||||||||||||||
| Units | Amount | Defecit | Equity | Units | Amount | Earnings | Equity | Equity | ||||||||||||||||||||||||||||
Balance at January 1, 2009 | 50 | $ | 1,500 | $ | (404 | ) | $ | 1,096 | 800,000 | $ | 24,539,494 | $ | (7,000,766 | ) | $ | 17,538,728 | $ | 17,539,824 | ||||||||||||||||||
| Sale of Units | — | — | — | — | 11,000,000 | 260,518,098 | — | 260,518,098 | 260,518,098 | |||||||||||||||||||||||||||
| Redemption of Limited Units | — | — | — | — | (3,050,000 | ) | (74,556,681 | ) | — | (74,556,681 | ) | (74,556,681 | ) | |||||||||||||||||||||||
| Net gain: | ||||||||||||||||||||||||||||||||||||
| Net investment loss | — | — | (14 | ) | (14 | ) | — | — | (1,179,767 | ) | (1,179,767 | ) | (1,179,781 | ) | ||||||||||||||||||||||
| Net realized gain (loss) on Investments and Futures Contracts | — | — | (2 | ) | (2 | ) | — | — | 12,851,611 | 12,851,611 | 12,851,609 | |||||||||||||||||||||||||
| Net change in unrealized gain on Investments and Futures Contracts | — | — | 231 | 231 | — | — | 14,261,038 | 14,261,038 | 14,261,269 | |||||||||||||||||||||||||||
| Net gain | — | — | 215 | 215 | — | — | 25,932,882 | 25,932,882 | 25,933,097 | |||||||||||||||||||||||||||
Balance at December 31, 2009 | 50 | $ | 1,500 | $ | (189 | ) | $ | 1,311 | 8,750,000 | $ | 210,500,911 | $ | 18,932,116 | $ | 229,433,027 | $ | 229,434,338 | |||||||||||||||||||
| General Units | Limited Units | Total | ||||||||||||||||||||||||||||||||||
| Total | Total | |||||||||||||||||||||||||||||||||||
| General | Limited | Total | ||||||||||||||||||||||||||||||||||
| General Units | Accumulated | Shareholders’ | Limited Units | Accumulated | Shareholders’ | Shareholders’ | ||||||||||||||||||||||||||||||
| Units | Amount | Deficit | Equity | Units | Amount | Earnings | Equity | Equity | ||||||||||||||||||||||||||||
| Balance at January 1, 2012 | 50 | $ | 1,500 | $ | (2 | ) | $ | 1,498 | 19,400,000 | $ | 549,362,581 | $ | 31,793,937 | $ | 581,156,518 | $ | 581,158,016 | |||||||||||||||||||
| Creation of Limited Units | - | - | - | - | 3,250,000 | 101,149,075 | - | 101,149,075 | 101,149,075 | |||||||||||||||||||||||||||
| Redemption of Limited Units | - | - | - | - | (6,200,000 | ) | (180,296,699 | ) | - | (180,296,699 | ) | (180,296,699 | ) | |||||||||||||||||||||||
| Net loss: | ||||||||||||||||||||||||||||||||||||
| Net investment loss | - | - | (13 | ) | (13 | ) | - | - | (4,684,135 | ) | (4,684,135 | ) | (4,684,148 | ) | ||||||||||||||||||||||
Net realized loss on Investments and Futures Contracts | - | - | (135 | ) | (135 | ) | - | - | (55,221,320 | ) | (55,221,320 | ) | (55,221,455 | ) | ||||||||||||||||||||||
Net change in unrealized gain on Investments and Futures Contracts | - | - | 93 | 93 | - | - | 32,503,218 | 32,503,218 | 32,503,311 | |||||||||||||||||||||||||||
| Net loss | - | - | (55 | ) | (55 | ) | - | - | (27,402,237 | ) | (27,402,237 | ) | (27,402,292 | ) | ||||||||||||||||||||||
| Balance at December 31, 2012 | 50 | $ | 1,500 | $ | (57 | ) | $ | 1,443 | 16,450,000 | $ | 470,214,957 | $ | 4,391,700 | $ | 474,606,657 | $ | 474,608,100 | |||||||||||||||||||
See accompanying notes to consolidated financial statements.statements
55
54
Consolidated
For the Year Ended December 31,
| General Units | Limited Units | Total | ||||||||||||||||||||||||||||||||||||||
| Total | Total | |||||||||||||||||||||||||||||||||||||||
| General | Limited | Total | ||||||||||||||||||||||||||||||||||||||
| General Units | Accumulated | Subscription | Shareholders’ | Limited Units | Accumulated | Shareholders’ | Shareholders’ | |||||||||||||||||||||||||||||||||
| Units | Amount | Deficit | Receivable | Equity | Units | Amount | Deficit | Equity | Equity | |||||||||||||||||||||||||||||||
Balance at January 1, 2008 | 50 | $ | 1,500 | $ | — | $ | (1,500 | ) | $ | — | — | $ | — | $ | — | $ | — | $ | — | |||||||||||||||||||||
| Collection of Subscription receivable | 1,500 | 1,500 | ||||||||||||||||||||||||||||||||||||||
| Sale of Units | — | — | — | — | — | 1,550,000 | 49,787,546 | — | 49,787,546 | 49,787,546 | ||||||||||||||||||||||||||||||
| Redemption of Limited Units | — | — | — | — | — | (750,000 | ) | (25,248,052 | ) | — | (25,248,052 | ) | (25,248,052 | ) | ||||||||||||||||||||||||||
| Net loss: | ||||||||||||||||||||||||||||||||||||||||
| Net investment income | — | — | 6 | — | 6 | — | — | 94,616 | 94,616 | 94,622 | ||||||||||||||||||||||||||||||
| Net realized loss on Investments and Futures Contracts | — | — | (359 | ) | — | (359 | ) | — | — | (5,216,612 | ) | (5,216,612 | ) | (5,216,971 | ) | |||||||||||||||||||||||||
| Net change in unrealized loss on Investments and Futures Contracts | — | — | (51 | ) | — | (51 | ) | — | — | (1,878,770 | ) | (1,878,770 | ) | (1,878,821 | ) | |||||||||||||||||||||||||
| Net loss: | — | — | (404 | ) | — | (404 | ) | — | — | (7,000,766 | ) | (7,000,766 | ) | (7,001,170 | ) | |||||||||||||||||||||||||
Balance at December 31, 2008 | 50 | $ | 1,500 | $ | (404 | ) | $ | — | $ | 1,096 | 800,000 | $ | 24,539,494 | $ | (7,000,766 | ) | $ | 17,538,728 | $ | 17,539,824 | ||||||||||||||||||||
| General Units | Limited Units | Total | ||||||||||||||||||||||||||||||||||
| Total | Total | |||||||||||||||||||||||||||||||||||
| General | Limited | Total | ||||||||||||||||||||||||||||||||||
| General Units | Accumulated | Shareholders’ | Limited Units | Accumulated | Shareholders’ | Shareholders’ | ||||||||||||||||||||||||||||||
| Units | Amount | Deficit | Equity | Units | Amount | Earnings | Equity | Equity | ||||||||||||||||||||||||||||
| Balance at January 1, 2011 | 50 | $ | 1,500 | $ | 144 | $ | 1,644 | 16,250,000 | $ | 428,801,695 | $ | 105,559,716 | $ | 534,361,411 | $ | 534,363,055 | ||||||||||||||||||||
| Creation of Limited Units | - | - | - | - | 11,200,000 | 383,075,174 | - | 383,075,174 | 383,075,174 | |||||||||||||||||||||||||||
| Redemption of Limited Units | - | - | - | - | (8,050,000 | ) | (262,514,288 | ) | - | (262,514,288 | ) | (262,514,288 | ) | |||||||||||||||||||||||
| Net loss: | ||||||||||||||||||||||||||||||||||||
| Net investment loss | - | - | (17 | ) | (17 | ) | - | - | (6,859,979 | ) | (6,859,979 | ) | (6,859,996 | ) | ||||||||||||||||||||||
Net realized gain on Investments and Futures Contracts | - | - | 88 | 88 | - | - | 36,755,746 | 36,755,746 | 36,755,834 | |||||||||||||||||||||||||||
Net change in unrealized loss on Investments and Futures Contracts | - | - | (217 | ) | (217 | ) | - | - | (103,661,546 | ) | (103,661,546 | ) | (103,661,763 | ) | ||||||||||||||||||||||
| Net loss | - | - | (146 | ) | (146 | ) | - | - | (73,765,779 | ) | (73,765,779 | ) | (73,765,925 | ) | ||||||||||||||||||||||
| Balance at December 31, 2011 | 50 | $ | 1,500 | $ | (2 | ) | $ | 1,498 | 19,400,000 | $ | 549,362,581 | $ | 31,793,937 | $ | 581,156,518 | $ | 581,158,016 | |||||||||||||||||||
See accompanying notes to consolidated financial statements.statements
56
55
GreenHaven ContinuousContinous Commodity Index Fund
| General Units | Limited Units | Total | ||||||||||||||||||||||||||||||||||||||
| Total | Total | |||||||||||||||||||||||||||||||||||||||
| General | Limited | Total | ||||||||||||||||||||||||||||||||||||||
| General Units | Accumulated | Subscription | Shareholders’ | Limited Units | Accumulated | Shareholders’ | Shareholders’ | |||||||||||||||||||||||||||||||||
| Units | Amount | Earnings | Receivable | Equity | Units | Amount | Earnings | Equity | Equity | |||||||||||||||||||||||||||||||
Balance at January 1, 2007 | 50 | $ | 1,500 | $ | — | $ | (1,500 | ) | $ | — | $ | — | $ | — | $ | — | $ | — | $ | — | ||||||||||||||||||||
| Activity for 2007 | — | — | — | — | — | — | — | — | — | — | ||||||||||||||||||||||||||||||
Balance at December 31, 2007 | 50 | $ | 1,500 | $ | (1,500 | ) | $ | — | $ | — | $ | — | $ | — | $ | — | $ | — | ||||||||||||||||||||||
| General Units | Limited Units | Total | ||||||||||||||||||||||||||||||||||
| Total | Total | |||||||||||||||||||||||||||||||||||
| General | Limited | Total | ||||||||||||||||||||||||||||||||||
| General Units | Accumulated | Shareholders’ | Limited Units | Accumulated | Shareholders’ | Shareholders’ | ||||||||||||||||||||||||||||||
| Units | Amount | Earnings | Equity | Units | Amount | Earnings | Equity | Equity | ||||||||||||||||||||||||||||
| Balance at January 1, 2010 | 50 | $ | 1,500 | $ | (189 | ) | $ | 1,311 | 8,750,000 | $ | 210,500,911 | $ | 18,932,116 | $ | 229,433,027 | $ | 229,434,338 | |||||||||||||||||||
| Creation of Limited Units | - | - | - | - | 9,200,000 | 262,051,675 | - | 262,051,675 | 262,051,675 | |||||||||||||||||||||||||||
| Redemption of Limited Units | - | - | - | - | (1,700,000 | ) | (43,750,891 | ) | - | (43,750,891 | ) | (43,750,891 | ) | |||||||||||||||||||||||
| Net gain: | ||||||||||||||||||||||||||||||||||||
| Net investment loss | - | - | (15 | ) | (15 | ) | - | - | (2,934,660 | ) | (2,934,660 | ) | (2,934,675 | ) | ||||||||||||||||||||||
Net realized gain on Investments and Futures Contracts | - | - | 165 | 165 | - | - | 43,284,916 | 43,284,916 | 43,285,081 | |||||||||||||||||||||||||||
Net change in unrealized gain on Investments and Futures Contracts | - | - | 183 | 183 | - | - | 46,277,344 | 46,277,344 | 46,277,527 | |||||||||||||||||||||||||||
| Net gain | - | - | 333 | 333 | - | - | 86,627,600 | 86,627,600 | 86,627,933 | |||||||||||||||||||||||||||
| Balance at December 31, 2010 | 50 | $ | 1,500 | $ | 144 | $ | 1,644 | 16,250,000 | $ | 428,801,695 | $ | 105,559,716 | $ | 534,361,411 | $ | 534,363,055 | ||||||||||||||||||||
See accompanying notes to consolidated financial statements | ||||||||||||||||||||||||||||||||||||
56
GreenHaven Continuous Commodity Index Fund
For the Years Ended December 31, 2012, 2011, and 2010
| 2012 | 2011 | 2010 | ||||||||||
| Cash flow from operating activities: | ||||||||||||
| Net gain (loss) | $ | (27,402,292 | ) | $ | (73,765,925 | ) | $ | 86,627,933 | ||||
| Adjustments to reconcile net gain (loss) to net cash used for operating activities: | ||||||||||||
| Purchase of investment securities | (2,089,638,671 | ) | (1,594,743,929 | ) | (1,159,625,357 | ) | ||||||
| Proceeds from sales of investment securities | 1,629,991,694 | 2,054,999,635 | 809,997,503 | |||||||||
| Net accretion of discount | (331,044 | ) | (335,677 | ) | (301,808 | ) | ||||||
| Net realized loss (gain) on investment securities | (1,429 | ) | (451 | ) | 403 | |||||||
| Unrealized depreciation (appreciation) on investments | (32,503,311 | ) | 103,661,763 | (46,277,527 | ) | |||||||
| Increase in payable - capital shares | 2,829,896 | 1,497,826 | - | |||||||||
| Increase (decrease) in accrued expenses | (666,087 | ) | 717,847 | 515,001 | ||||||||
| Net cash provided by (used for) operating activities | (517,721,244 | ) | 492,031,089 | (309,063,852 | ) | |||||||
| Cash flows from financing activities: | ||||||||||||
| Proceeds from creation of Limited Units | 101,149,075 | 383,075,174 | 262,051,675 | |||||||||
| Redemption of Limited Units | (180,296,699 | ) | (262,514,288 | ) | (43,750,891 | ) | ||||||
| Net cash provided by (used for) financing activities | (79,147,624 | ) | 120,560,886 | 218,300,784 | ||||||||
| Net change in cash | (596,868,868 | ) | 612,591,975 | (90,763,068 | ) | |||||||
| Cash held by broker at beginning of year | 619,079,494 | 6,487,519 | 97,250,587 | |||||||||
| Cash held by broker at end of year | $ | 22,210,626 | $ | 619,079,494 | $ | 6,487,519 | ||||||
See accompanying notes to consolidated financial statements | ||||||||||||
57
December 31, 2012 and 2011
| 2012 | 2011 | |||||||
| Assets | ||||||||
| Equity in broker trading accounts: | ||||||||
| U.S. Treasury Obligations (cost $469,979,439 and $9,999,989 as of 2012 and 2011, respectively) | $ | 469,995,420 | $ | 9,999,990 | ||||
| Cash held by broker | 22,210,626 | 619,079,494 | ||||||
| Net unrealized depreciation on futures contracts | (12,514,458 | ) | (45,001,789 | ) | ||||
| Total assets | $ | 479,691,588 | $ | 584,077,695 | ||||
| Liabilities and shareholders’ equity | ||||||||
| Capital shares payable | $ | 4,327,722 | $ | 1,497,826 | ||||
| Management fee payable to related party | 354,469 | 438,205 | ||||||
| Accrued brokerage fees and expenses payable | 401,297 | 983,648 | ||||||
| Total liabilities | 5,083,488 | 2,919,679 | ||||||
| Shareholders’ equity | ||||||||
| General Units: | ||||||||
| Paid in capital - 50 units issued | 1,500 | 1,500 | ||||||
| Accumulated deficit | (57 | ) | (2 | ) | ||||
| Total General Units | 1,443 | 1,498 | ||||||
| Limited Units: | ||||||||
| Paid in capital - 16,450,000 and 19,400,000 redeemable units | ||||||||
issued and outstanding as of 2012 and 2011, respectively | 470,214,957 | 549,362,581 | ||||||
| Retained earnings | 4,391,700 | 31,793,937 | ||||||
| Total Limited Units | 474,606,657 | 581,156,518 | ||||||
| Total shareholders’ equity | 474,608,100 | 581,158,016 | ||||||
| Total liabilities and shareholders’ equity | $ | 479,691,588 | $ | 584,077,695 | ||||
| Net asset value per share | ||||||||
| General Units | $ | 28.86 | $ | 29.96 | ||||
| Limited Units | $ | 28.85 | $ | 29.96 | ||||
See accompanying notes to consolidated financial statements | ||||||||
58
| Percentage of | Fair | Face | ||||||||||
| Description | Net Assets | Value | Value | |||||||||
| U.S. Treasury Obligations | ||||||||||||
| U.S. Treasury Bills, 0.06% due January 03, 2013 | 37.93 | % | $ | 180,000,000 | $ | 180,000,000 | ||||||
| U.S. Treasury Bills, 0.05% due January 10, 2013 | 6.32 | 29,999,820 | 30,000,000 | |||||||||
| U.S. Treasury Bills, 0.05% due January 24, 2013 | 40.03 | 189,997,910 | 190,000,000 | |||||||||
| U.S. Treasury Bills, 0.11% due February 14, 2013 | 14.75 | 69,997,690 | 70,000,000 | |||||||||
| Total U.S. Treasury Obligations (cost $469,979,439) | 99.03 | % | $ | 469,995,420 | $ | 470,000,000 | ||||||
| Percentage of | Fair | Notional | ||||||||||
| Description | Net Assets | Value | Value | |||||||||
| Unrealized Appreciation/(Depreciation) on Futures Contracts | ||||||||||||
| Cocoa (414 contracts, settlement date March 13, 2013) | (0.20 | )% | $ | (948,620 | ) | $ | 9,257,040 | |||||
| Cocoa (415 contracts, settlement date May 15, 2013) | (0.20 | ) | (932,590 | ) | 9,320,900 | |||||||
| Cocoa (414 contracts, settlement date July 16, 2013) | (0.10 | ) | (485,050 | ) | 9,331,560 | |||||||
| Coffee (168 contracts, settlement date March 18, 2013) | (0.28 | ) | (1,303,556 | ) | 9,059,400 | |||||||
| Coffee (170 contracts, settlement date May 20, 2013) | (0.28 | ) | (1,324,350 | ) | 9,352,125 | |||||||
| Coffee (169 contracts, settlement date July 19, 2013) | (0.14 | ) | (671,381 | ) | 9,477,731 | |||||||
| Copper (102 contracts, settlement date March 26, 2013) | 0.12 | 554,000 | 9,313,875 | |||||||||
| Copper (102 contracts, settlement date May 29, 2013) | 0.11 | 544,763 | 9,338,100 | |||||||||
| Copper (101 contracts, settlement date July 29, 2013) | 0.11 | 529,500 | 9,271,800 | |||||||||
| Corn (267 contracts, settlement date March 14, 2013) | (0.25 | ) | (1,180,150 | ) | 9,321,637 | |||||||
| Corn (266 contracts, settlement date May 14, 2013) | (0.23 | ) | (1,104,225 | ) | 9,313,325 | |||||||
| Corn (266 contracts, settlement date July 12, 2013) | (0.08 | ) | (389,100 | ) | 9,273,425 | |||||||
| Cotton (246 contracts, settlement date March 06, 2013) | 0.08 | 361,630 | 9,242,220 | |||||||||
| Cotton (244 contracts, settlement date May 08, 2013) | 0.02 | 99,440 | 9,254,920 | |||||||||
| Cotton (245 contracts, settlement date July 09, 2013) | 0.10 | 489,040 | 9,416,575 | |||||||||
| FCOJ-A (838 contracts, settlement date March 08, 2013) | (0.06 | ) | (301,343 | ) | 14,750,895 | |||||||
| FCOJ-A (435 contracts, settlement date May 10, 2013) | 0.03 | 133,620 | 7,777,800 | |||||||||
| FCOJ-A (285 contracts, settlement date July 11, 2013) | (0.01 | ) | (61,987 | ) | 5,185,575 | |||||||
| Gold (56 contracts, settlement date February 26, 2013) | 0.07 | 312,270 | 9,384,480 | |||||||||
| Gold (55 contracts, settlement date April 26, 2013) | 0.05 | 236,130 | 9,229,000 | |||||||||
| Gold (55 contracts, settlement date June 26, 2013) | (0.07 | ) | (317,080 | ) | 9,240,000 | |||||||
| Heating Oil (44 contracts, settlement date January 31, 2013) | 0.00 | * | (14,960 | ) | 5,602,766 | |||||||
| Heating Oil (44 contracts, settlement date February 28, 2013) | 0.00 | * | (10,185 | ) | 5,575,046 | |||||||
| Heating Oil (44 contracts, settlement date March 28, 2013) | 0.00 | * | (1,571 | ) | 5,535,869 | |||||||
| Heating Oil (44 contracts, settlement date April 30, 2013) | 0.02 | 85,352 | 5,587,982 | |||||||||
| Heating Oil (44 contracts, settlement date May 31, 2013) | 0.02 | 90,959 | 5,558,045 | |||||||||
| Lean Hogs (189 contracts, settlement date February 14, 2013) | 0.07 | 323,420 | 6,480,810 | |||||||||
| Lean Hogs (189 contracts, settlement date April 12, 2013) | 0.01 | 24,060 | 6,707,610 | |||||||||
| Lean Hogs (188 contracts, settlement date June 14, 2013) | (0.04 | ) | (163,170 | ) | 7,358,320 | |||||||
| Lean Hogs (188 contracts, settlement date July 15, 2013) | (0.04 | ) | (193,660 | ) | 7,322,600 | |||||||
| Light, Sweet Crude Oil (60 contracts, settlement date January 22, 2013) | (0.01 | ) | (45,010 | ) | 5,509,200 | |||||||
| Light, Sweet Crude Oil (61 contracts, settlement date February 20, 2013) | (0.01 | ) | (57,300 | ) | 5,628,470 | |||||||
| Light, Sweet Crude Oil (60 contracts, settlement date March 20, 2013) | (0.01 | ) | (38,330 | ) | 5,563,800 | |||||||
| Light, Sweet Crude Oil (60 contracts, settlement date April 22, 2013) | 0.06 | 279,100 | 5,589,600 | |||||||||
| Light, Sweet Crude Oil (60 contracts, settlement date May 21, 2013) | 0.06 | 274,100 | 5,609,400 | |||||||||
| Live Cattle (175 contracts, settlement date February 28, 2013) | 0.03 | 163,800 | 9,261,000 | |||||||||
| Live Cattle (174 contracts, settlement date April 30, 2013) | 0.02 | 106,530 | 9,491,700 | |||||||||
| Live Cattle (175 contracts, settlement date June 28, 2013) | 0.02 | 96,290 | 9,152,500 | |||||||||
| Natural Gas (163 contracts, settlement date January 29, 2013) | (0.06 | ) | (298,990 | ) | 5,462,130 | |||||||
| Natural Gas (163 contracts, settlement date Februay 26, 2013) | (0.05 | ) | (251,910 | ) | 5,484,950 | |||||||
| Natural Gas (163 contracts, settlement date March 26, 2013) | (0.04 | ) | (189,680 | ) | 5,546,890 | |||||||
| Natural Gas (163 contracts, settlement date April 26, 2013) | (0.07 | ) | (316,420 | ) | 5,628,390 | |||||||
| Natural Gas (163 contracts, settlement date May 29, 2013) | (0.06 | ) | (298,280 | ) | 5,718,040 | |||||||
| Platinum (181 contracts, settlement date April 26, 2013) | (0.06 | ) | (267,470 | ) | 13,958,720 | |||||||
| Platinum (180 contracts, settlement date July 29, 2013) | (0.07 | ) | (329,455 | ) | 13,911,300 | |||||||
| Silver (62 contracts, settlement date March 26, 2013) | 0.01 | 58,585 | 9,370,370 | |||||||||
| Silver (61 contracts, settlement date May 29, 2013) | 0.03 | 143,405 | 9,235,095 | |||||||||
| Silver (61 contracts, settlement date July 29, 2013) | (0.14 | ) | (680,860 | ) | 9,249,125 | |||||||
| Soybean (133 contracts, settlement date March 14, 2013) | (0.16 | ) | (772,287 | ) | 9,373,175 | |||||||
| Soybean (132 contracts, settlement date May 14, 2013) | (0.10 | ) | (461,563 | ) | 9,235,050 | |||||||
| Soybean (133 contracts, settlement date July 12, 2013) | (0.01 | ) | (61,712 | ) | 9,278,413 | |||||||
| Sugar (424 contracts, settlement date February 28, 2013) | (0.10 | ) | (456,109 | ) | 9,264,909 | |||||||
| Sugar (424 contracts, settlement date April 30, 2013) | (0.07 | ) | (317,901 | ) | 9,307,648 | |||||||
| Sugar (423 contracts, settlement date June 28, 2013) | 0.06 | 278,678 | 9,352,022 | |||||||||
| Wheat (237 contracts, settlement date March 14, 2013) | (0.28 | ) | (1,303,087 | ) | 9,219,300 | |||||||
| Wheat (237 contracts, settlement date May 14, 2013) | (0.24 | ) | (1,134,200 | ) | 9,334,838 | |||||||
| Wheat (235 contracts, settlement date July 12, 2013) | (0.22 | ) | (1,015,588 | ) | 9,326,563 | |||||||
| Net Unrealized Depreciation on Futures Contracts | (2.64 | )% | $ | (12,514,458 | ) | $ | 473,904,029 | |||||
* Denotes greater than 0.000% yet less than 0.005% | ||||||||||||
See accompanying notes to consolidated financial statements.statements
57
59
| Percentage of | Fair | Face | ||||||||||
| Description | Net Assets | Value | Value | |||||||||
| U.S. Treasury Obligations | ||||||||||||
| U.S. Treasury Bill, 0.00% due January 05, 2012 (cost $9,999,989) | 1.72 | % | $ | 9,999,990 | $ | 10,000,000 | ||||||
| Percentage of | Fair | Notional | ||||||||||
| Description | Net Assets | Value | Value | |||||||||
| Unrealized Appreciation/(Depreciation) on Futures Contracts | ||||||||||||
| Cocoa (535 contracts, settlement date March 15, 2012) | (0.55 | ) % | $ | (3,205,990 | ) | $ | 11,283,150 | |||||
| Cocoa (536 contracts, settlement date May 15, 2012) | (0.53 | ) | (3,093,380 | ) | 11,422,160 | |||||||
| Cocoa (536 contracts, settlement date July 16, 2012) | (0.33 | ) | (1,932,240 | ) | 11,513,280 | |||||||
| Coffee (133 contracts, settlement date March 20, 2012) | (0.15 | ) | (896,456 | ) | 11,314,144 | |||||||
| Coffee (132 contracts, settlement date May 18, 2012) | (0.16 | ) | (919,744 | ) | 11,367,675 | |||||||
| Coffee (132 contracts, settlement date July 19, 2012) | (0.06 | ) | (352,538 | ) | 11,493,900 | |||||||
| Copper (133 contracts, settlement date March 28, 2012) | (0.10 | ) | (592,150 | ) | 11,424,700 | |||||||
| Copper (132 contracts, settlement date May 29, 2012) | (0.11 | ) | (608,013 | ) | 11,376,750 | |||||||
| Copper (132 contracts, settlement date July 27, 2012) | 0.01 | 51,438 | 11,401,500 | |||||||||
| Corn (349 contracts, settlement date March 14, 2012) | (0.15 | ) | (862,200 | ) | 11,281,425 | |||||||
| Corn (349 contracts, settlement date May 14, 2012) | (0.15 | ) | (839,875 | ) | 11,425,387 | |||||||
| Corn (348 contracts, settlement date July 13, 2012) | 0.01 | 33,125 | 11,505,750 | |||||||||
| Cotton (249 contracts, settlement date March 08, 2012) | (0.13 | ) | (726,570 | ) | 11,429,100 | |||||||
| Cotton (248 contracts, settlement date May 08, 2012) | (0.15 | ) | (851,265 | ) | 11,368,320 | |||||||
| Cotton (248 contracts, settlement date July 09, 2012) | (0.12 | ) | (721,380 | ) | 11,322,440 | |||||||
| FCOJ-A (561 contracts, settlement date March 12, 2012) | 0.04 | 257,978 | 14,221,350 | |||||||||
| FCOJ-A (486 contracts, settlement date May 10, 2012) | 0.15 | 856,470 | 12,261,780 | |||||||||
| FCOJ-A (306 contracts, settlement date July 11, 2012) | (0.01 | ) | (32,880 | ) | 7,738,740 | |||||||
| Gold (72 contracts, settlement date February 27, 2012) | (0.09 | ) | (527,380 | ) | 11,280,960 | |||||||
| Gold (72 contracts, settlement date April 26, 2012) | (0.21 | ) | (1,233,460 | ) | 11,299,680 | |||||||
| Gold (73 contracts, settlement date June 27, 2012) | (0.25 | ) | (1,434,620 | ) | 11,472,680 | |||||||
| Heating Oil (57 contracts, settlement date January 31, 2012) | (0.02 | ) | (109,389 | ) | 6,976,595 | |||||||
| Heating Oil (56 contracts, settlement date February 29, 2012) | (0.02 | ) | (101,056 | ) | 6,834,677 | |||||||
| Heating Oil (56 contracts, settlement date March 30, 2012) | (0.02 | ) | (111,661 | ) | 6,789,283 | |||||||
| Heating Oil (56 contracts, settlement date April 30, 2012) | (0.09 | ) | (493,088 | ) | 6,734,482 | |||||||
| Heating Oil (56 contracts, settlement date May 31, 2012) | (0.08 | ) | (488,053 | ) | 6,693,557 | |||||||
| Lean Hogs (236 contracts, settlement date February 14, 2012) | (0.07 | ) | (384,030 | ) | 7,957,920 | |||||||
| Lean Hogs (236 contracts, settlement date April 16, 2012) | (0.06 | ) | (325,560 | ) | 8,278,880 | |||||||
| Lean Hogs (235 contracts, settlement date June 14, 2012) | �� | (0.05 | ) | (275,680 | ) | 8,977,000 | ||||||
| Lean Hogs (236 contracts, settlement date July 16, 2012) | (0.04 | ) | (210,990 | ) | 8,951,480 | |||||||
| Light, Sweet Crude Oil (69 contracts, settlement date January 20, 2012) | 0.13 | 727,240 | 6,819,270 | |||||||||
| Light, Sweet Crude Oil (69 contracts, settlement date February 21, 2012) | 0.13 | 746,950 | 6,831,000 | |||||||||
| Light, Sweet Crude Oil (69 contracts, settlement date March 20, 2012) | 0.13 | 746,560 | 6,845,490 | |||||||||
| Light, Sweet Crude Oil (69 contracts, settlement date April 20, 2012) | 0.01 | 82,600 | 6,859,290 | |||||||||
| Light, Sweet Crude Oil (68 contracts, settlement date May 22, 2012) | 0.02 | 113,320 | 6,764,640 | |||||||||
| Live Cattle (229 contracts, settlement date February 29, 2012) | 0.00 | * | 2,380 | 11,124,820 | ||||||||
| Live Cattle (230 contracts, settlement date April 30, 2012) | (0.02 | ) | (131,730 | ) | 11,541,400 | |||||||
| Live Cattle (230 contracts, settlement date June 29, 2012) | (0.02 | ) | (122,410 | ) | 11,460,900 | |||||||
| Natural Gas (224 contracts, settlement date January 27, 2012) | (0.40 | ) | (2,315,920 | ) | 6,695,360 | |||||||
| Natural Gas (224 contracts, settlement date February 27, 2012) | (0.38 | ) | (2,204,450 | ) | 6,755,840 | |||||||
| Natural Gas (220 contracts, settlement date March 28, 2012) | (0.36 | ) | (2,067,940 | ) | 6,773,800 | |||||||
| Natural Gas (220 contracts, settlement date April 26, 2012) | (0.20 | ) | (1,188,850 | ) | 6,888,200 | |||||||
| Natural Gas (219 contracts, settlement date May 29, 2012) | (0.20 | ) | (1,169,040 | ) | 6,968,580 | |||||||
| Platinum (243 contracts, settlement date April 26, 2012) | (0.43 | ) | (2,468,450 | ) | 17,069,535 | |||||||
| Platinum (243 contracts, settlement date July 27, 2012) | (0.44 | ) | (2,566,290 | ) | 17,124,210 | |||||||
| Silver (82 contracts, settlement date March 28, 2012) | (0.35 | ) | (2,055,925 | ) | 11,445,150 | |||||||
| Silver (81 contracts, settlement date May 29, 2012) | (0.38 | ) | (2,222,650 | ) | 11,323,800 | |||||||
| Silver (81 contracts, settlement date July 27, 2012) | (0.33 | ) | (1,944,665 | ) | 11,338,785 | |||||||
| Soybean (186 contracts, settlement date March 14, 2012) | (0.17 | ) | (1,016,225 | ) | 11,232,075 | |||||||
| Soybean (187 contracts, settlement date May 14, 2012) | (0.16 | ) | (954,425 | ) | 11,383,625 | |||||||
| Soybean (187 contracts, settlement date July 13, 2012) | 0.05 | 264,900 | 11,472,450 | |||||||||
| Sugar (444 contracts, settlement date February 29, 2012) | (0.24 | ) | (1,406,339 | ) | 11,586,624 | |||||||
| Sugar (444 contracts, settlement date April 30, 2012) | (0.20 | ) | (1,152,122 | ) | 11,412,576 | |||||||
| Sugar (444 contracts, settlement date June 29, 2012) | (0.09 | ) | (545,496 | ) | 11,218,637 | |||||||
| Wheat (343 contracts, settlement date March 14, 2012) | (0.20 | ) | (1,133,987 | ) | 11,194,662 | |||||||
| Wheat (340 contracts, settlement date May 14, 2012) | (0.19 | ) | (1,118,513 | ) | 11,411,250 | |||||||
| Wheat (340 contracts, settlement date July 13, 2012) | 0.04 | 230,325 | 11,666,250 | |||||||||
| Net Unrealized Depreciation on Futures Contracts | (7.74 | )% | $ | (45,001,789 | ) | $ | 580,606,964 | |||||
* Denotes greater than 0.000% yet less than 0.005% | ||||||||||||
See accompanying notes to consolidated financial statements
60
GreenHaven Continuous Commodity Index Master Fund
Income and Expenses
For the Years Ended December 31,2009, 2008,2012, 2011, and 2007(i)2010
For the Years Ended December 31,
| 2009 | 2008 | |||||||
| Cash flow from operating activities: | ||||||||
| Net Gain/Loss | $ | 25,933,097 | $ | (7,001,170 | ) | |||
| Adjustments to reconcile net gain to net cash used for operating activities: | ||||||||
| Purchase of investment securities | (604,867,964 | ) | (101,741,449 | ) | ||||
| Proceeds from sale of investment securities | 489,996,097 | 97,065,528 | ||||||
| Net accretion of discount and amortization of premium | (119,648 | ) | (319,750 | ) | ||||
| Net realized gain on investment securities | (397 | ) | (2,725 | ) | ||||
| Unrealized (appreciation) depreciation on investments | (14,261,269 | ) | 1,878,821 | |||||
| (Increase) decrease in capital shares receivable and other assets | 1,099,695 | (1,099,695 | ) | |||||
| Increase in accrued expenses | 177,929 | 11,076 | ||||||
| Net cash used for operating activities | (102,042,460 | ) | (11,209,364 | ) | ||||
| Cash flows from financing activities: | ||||||||
| Collection of subscription receivable | — | 1,500 | ||||||
| Proceeds from sale of Limited Units | 260,518,098 | 49,787,546 | ||||||
| Redemption of Limited Units | (74,556,681 | ) | (25,248,052 | ) | ||||
| Net cash provided by financing activities | 185,961,417 | 24,540,994 | ||||||
| Net change in cash | 83,918,957 | 13,331,630 | ||||||
| Cash held by broker at beginning of period | 13,331,630 | — | ||||||
| Cash held by broker at end of period | $ | 97,250,587 | $ | 13,331,630 | ||||
| 2012 | 2011 | 2010 | ||||||||||
| Income | ||||||||||||
| Interest Income | $ | 331,044 | $ | 335,677 | $ | 301,808 | ||||||
| Expenses | ||||||||||||
| Management fee to related party | 4,637,997 | 5,895,201 | 2,523,863 | |||||||||
| Brokerage fees and expenses | 377,195 | 1,300,472 | 712,620 | |||||||||
| Total expenses | 5,015,192 | 7,195,673 | 3,236,483 | |||||||||
| Net Investment Loss | (4,684,148 | ) | (6,859,996 | ) | (2,934,675 | ) | ||||||
Realized and Net Change in Unrealized Gain (Loss) on Investments and Futures Contracts | ||||||||||||
| Realized Gain (Loss) on | ||||||||||||
| Investments | 1,429 | 451 | (403 | ) | ||||||||
| Futures Contracts | (55,222,884 | ) | 36,755,383 | 43,285,484 | ||||||||
| Net Realized Gain (Loss) | (55,221,455 | ) | 36,755,834 | 43,285,081 | ||||||||
| Net Change in Unrealized Gain (Loss) on | ||||||||||||
| Investments | 15,980 | (20,292 | ) | 18,076 | ||||||||
| Futures Contracts | 32,487,331 | (103,641,471 | ) | 46,259,451 | ||||||||
| Net Change in Unrealized Gain (Loss) | 32,503,311 | (103,661,763 | ) | 46,277,527 | ||||||||
Net Realized and Unrealized Gain (Loss) on Investments and Future Contracts | (22,718,144 | ) | (66,905,929 | ) | 89,562,608 | |||||||
| Net Gain (Loss) | $ | (27,402,292 | ) | $ | (73,765,925 | ) | $ | 86,627,933 | ||||
See accompanying notes to consolidated financial statements.statements
58
61
GreenHaven Continuous Commodity Index Master Fund
For the Year Ended December 31, 2012
| General Units | Limited Units | Total | ||||||||||||||||||||||||||||||||||
| Total | Total | |||||||||||||||||||||||||||||||||||
| General | Limited | Total | ||||||||||||||||||||||||||||||||||
| General Units | Accumulated | Shareholders’ | Limited Units | Accumulated | Shareholders’ | Shareholders’ | ||||||||||||||||||||||||||||||
| Units | Amount | Deficit | Equity | Units | Amount | Earnings | Equity | Equity | ||||||||||||||||||||||||||||
| Balance at January 1, 2012 | 50 | $ | 1,500 | $ | (2 | ) | $ | 1,498 | 19,400,000 | $ | 549,362,581 | $ | 31,793,937 | $ | 581,156,518 | $ | 581,158,016 | |||||||||||||||||||
| Creation of Limited Units | - | - | - | - | 3,250,000 | 101,149,075 | - | 101,149,075 | 101,149,075 | |||||||||||||||||||||||||||
| Redemption of Limited Units | - | - | - | - | (6,200,000 | ) | (180,296,699 | ) | - | (180,296,699 | ) | (180,296,699 | ) | |||||||||||||||||||||||
| Net loss: | ||||||||||||||||||||||||||||||||||||
| Net investment loss | - | - | (13 | ) | (13 | ) | - | - | (4,684,135 | ) | (4,684,135 | ) | (4,684,148 | ) | ||||||||||||||||||||||
| Net realized loss on Investments | ||||||||||||||||||||||||||||||||||||
| and Futures Contracts | - | - | (135 | ) | (135 | ) | - | - | (55,221,320 | ) | (55,221,320 | ) | (55,221,455 | ) | ||||||||||||||||||||||
| Net change in unrealized gain on | ||||||||||||||||||||||||||||||||||||
| Investments and | ||||||||||||||||||||||||||||||||||||
| Futures Contracts | - | - | 93 | 93 | - | - | 32,503,218 | 32,503,218 | 32,503,311 | |||||||||||||||||||||||||||
| Net loss | - | - | (55 | ) | (55 | ) | - | - | (27,402,237 | ) | (27,402,237 | ) | (27,402,292 | ) | ||||||||||||||||||||||
| Balance at December 31, 2012 | 50 | $ | 1,500 | $ | (57 | ) | $ | 1,443 | 16,450,000 | $ | 470,214,957 | $ | 4,391,700 | $ | 474,606,657 | $ | 474,608,100 | |||||||||||||||||||
See accompanying notes to consolidated financial statements
62
GreenHaven Continous Commodity Index Master Fund
Statements of Changes in Shareholders’ Equity
For the Year Ended December 31, 2011
Statements of Changes in Shareholders’ Equity
For the Year Ended December 31, 2011
| General Units | Limited Units | Total | ||||||||||||||||||||||||||||||||||
| Total | Total | |||||||||||||||||||||||||||||||||||
| General | Limited | Total | ||||||||||||||||||||||||||||||||||
| General Units | Accumulated | Shareholders’ | Limited Units | Accumulated | Shareholders’ | Shareholders’ | ||||||||||||||||||||||||||||||
| Units | Amount | Deficit | Equity | Units | Amount | Earnings | Equity | Equity | ||||||||||||||||||||||||||||
| Balance at January 1, 2011 | 50 | $ | 1,500 | $ | 144 | $ | 1,644 | 16,250,000 | $ | 428,801,695 | $ | 105,559,716 | $ | 534,361,411 | $ | 534,363,055 | ||||||||||||||||||||
| Creation of Limited Units | - | - | - | - | 11,200,000 | 383,075,174 | - | 383,075,174 | 383,075,174 | |||||||||||||||||||||||||||
| Redemption of Limited Units | - | - | - | - | (8,050,000 | ) | (262,514,288 | ) | - | (262,514,288 | ) | (262,514,288 | ) | |||||||||||||||||||||||
| Net loss: | ||||||||||||||||||||||||||||||||||||
| Net investment loss | - | - | (17 | ) | (17 | ) | - | - | (6,859,979 | ) | (6,859,979 | ) | (6,859,996 | ) | ||||||||||||||||||||||
| Net realized gain on Investments | ||||||||||||||||||||||||||||||||||||
| and Futures Contracts | - | - | 88 | 88 | - | - | 36,755,746 | 36,755,746 | 36,755,834 | |||||||||||||||||||||||||||
| Net change in unrealized loss on | ||||||||||||||||||||||||||||||||||||
| Investments and | ||||||||||||||||||||||||||||||||||||
| Futures Contracts | - | - | (217 | ) | (217 | ) | - | - | (103,661,546 | ) | (103,661,546 | ) | (103,661,763 | ) | ||||||||||||||||||||||
| Net loss | - | - | (146 | ) | (146 | ) | - | - | (73,765,779 | ) | (73,765,779 | ) | (73,765,925 | ) | ||||||||||||||||||||||
| Balance at December 31, 2011 | 50 | $ | 1,500 | $ | (2 | ) | $ | 1,498 | 19,400,000 | $ | 549,362,581 | $ | 31,793,937 | $ | 581,156,518 | $ | 581,158,016 | |||||||||||||||||||
See accompanying notes to consolidated financial statements
63
GreenHaven Continous Commodity Index Master Fund
Statements of Changes in Shareholders' Equity
For the Year Ended December 31, 2010
Statements of Changes in Shareholders' Equity
For the Year Ended December 31, 2010
| General Units | Limited Units | Total | ||||||||||||||||||||||||||||||||||
| Total | Total | |||||||||||||||||||||||||||||||||||
| General | Limited | Total | ||||||||||||||||||||||||||||||||||
| General Units | Accumulated | Shareholders’ | Limited Units | Accumulated | Shareholders’ | Shareholders’ | ||||||||||||||||||||||||||||||
| Units | Amount | Earnings | Equity | Units | Amount | Earnings | Equity | Equity | ||||||||||||||||||||||||||||
| Balance at January 1, 2010 | 50 | $ | 1,500 | $ | (189 | ) | $ | 1,311 | 8,750,000 | $ | 210,500,911 | $ | 18,932,116 | $ | 229,433,027 | $ | 229,434,338 | |||||||||||||||||||
| Creation of Limited Units | - | - | - | - | 9,200,000 | 262,051,675 | - | 262,051,675 | 262,051,675 | |||||||||||||||||||||||||||
| Redemption of Limited Units | - | - | - | - | (1,700,000 | ) | (43,750,891 | ) | - | (43,750,891 | ) | (43,750,891 | ) | |||||||||||||||||||||||
| Net gain: | ||||||||||||||||||||||||||||||||||||
| Net investment loss | - | - | (15 | ) | (15 | ) | - | - | (2,934,660 | ) | (2,934,660 | ) | (2,934,675 | ) | ||||||||||||||||||||||
| Net realized gain on Investments | ||||||||||||||||||||||||||||||||||||
| and Futures Contracts | - | - | 165 | 165 | - | - | 43,284,916 | 43,284,916 | 43,285,081 | |||||||||||||||||||||||||||
| Net change in unrealized gain on | ||||||||||||||||||||||||||||||||||||
| Investments and | ||||||||||||||||||||||||||||||||||||
| Futures Contracts | - | - | 183 | 183 | - | - | 46,277,344 | 46,277,344 | 46,277,527 | |||||||||||||||||||||||||||
| Net gain | - | - | 333 | 333 | - | - | 86,627,600 | 86,627,600 | 86,627,933 | |||||||||||||||||||||||||||
| Balance at December 31, 2010 | 50 | $ | 1,500 | $ | 144 | $ | 1,644 | 16,250,000 | $ | 428,801,695 | $ | 105,559,716 | $ | 534,361,411 | $ | 534,363,055 | ||||||||||||||||||||
See accompanying notes to consolidated financial statements
64
GreenHaven Continuous Commodity Index Master Fund
Statements of Cash Flows
For the Years Ended December 31, 2012, 2011, and 2010
Statements of Cash Flows
For the Years Ended December 31, 2012, 2011, and 2010
| 2012 | 2011 | 2010 | ||||||||||
| Cash flow from operating activities: | ||||||||||||
| Net gain (loss) | $ | (27,402,292 | ) | $ | (73,765,925 | ) | $ | 86,627,933 | ||||
| Adjustments to reconcile net gain (loss) to net cash used for operating activities: | ||||||||||||
| Purchase of investment securities | (2,089,638,671 | ) | (1,594,743,929 | ) | (1,159,625,357 | ) | ||||||
| Proceeds from sales of investment securities | 1,629,991,694 | 2,054,999,635 | 809,997,503 | |||||||||
| Net accretion of discount | (331,044 | ) | (335,677 | ) | (301,808 | ) | ||||||
| Net realized loss (gain) on investment securities | (1,429 | ) | (451 | ) | 403 | |||||||
| Unrealized depreciation (appreciation) on investments | (32,503,311 | ) | 103,661,763 | (46,277,527 | ) | |||||||
| Increase in payable - capital shares | 2,829,896 | 1,497,826 | - | |||||||||
| Increase (decrease) in accrued expenses | (666,087 | ) | 717,847 | 515,001 | ||||||||
| Net cash provided by (used for) operating activities | (517,721,244 | ) | 492,031,089 | (309,063,852 | ) | |||||||
| Cash flows from financing activities: | ||||||||||||
| Proceeds from creation of Limited Units | 101,149,075 | 383,075,174 | 262,051,675 | |||||||||
| Redemption of Limited Units | (180,296,699 | ) | (262,514,288 | ) | (43,750,891 | ) | ||||||
| Net cash provided by (used for) financing activities | (79,147,624 | ) | 120,560,886 | 218,300,784 | ||||||||
| Net change in cash | (596,868,868 | ) | 612,591,975 | (90,763,068 | ) | |||||||
| Cash held by broker at beginning of year | 619,079,494 | 6,487,519 | 97,250,587 | |||||||||
| Cash held by broker at end of year | $ | 22,210,626 | $ | 619,079,494 | $ | 6,487,519 | ||||||
See accompanying notes to consolidated financial statements
65
GreenHaven Continuous Commodity Index Fund
Years Ended December 31, 2009, 2008,2012, 2011, and 20072010
(1) Organization
The GreenHaven Continuous Commodity Index Fund (the “Fund”) was formed as a Delaware statutory trust on October 27, 2006, and GreenHaven Continuous Commodity Master Index Fund (the “Master Fund”, and together with the Fund, the “Funds”), was formed as a Delaware statutory trust on October 27, 2006. The Fund offers common units of beneficial interest (the “Shares”). Upon inception of the Fund, 50 General Units of the Fund were issued to GreenHaven Commodity Services, LLC (the “Managing Owner”) in exchange for a capital contribution of $1,500. The Managing Owner serves the Fund as commodity pool operator, commodity trading advisor, and managing owner.
Shares are purchased from the Fund only by Authorized Participants in one or more blocks of 50,000 Shares, called a Basket. The proceeds from the offering of Shares are invested in the Master Fund. The Master Fund actively trades exchange traded futures onin the commodities comprising the Reuters Continuous Commodity Index (“the Index”), with a view to tracking the performance of the Index over time. The Master Fund’s portfolio also includes United States Treasury securities and other high credit quality short term fixed income securities for deposit with the Master Fund’s commodities brokers as margin and other high credit quality short term fixed income securities.margin. The Fund wholly owns the Master Fund.
The Fund commenced trading on the American Stock Exchange (the AMEX) on January 24, 2008. On November 24, 2008 the Fund de-listed from the AMEX and on November 25, 2008 the Fund listed on NYSE Arca. On May 14, 2009 the Fund registered an additional 21,000,000 units. Prior to January 23, 2008, the only activity in the Fund was the subscription in 2006 by the Managing Owner for the General Units and the related payment for them in January 2008. Accordingly, Statements of Income and Expenses and Cash Flows are inapplicable for the year ended December 31, 2007.
The Index is intended to reflect the performance of certain commodities. TheThrough January 6, 2013 the commodities comprising the Index (the “Index Commodities”) are:were: corn, soybeans, wheat, live cattle, lean hogs, gold, silver, copper, cocoa, coffee, sugar, cotton, orange juice, platinum, crude oil, heating oil, and natural gas. The Index was revised on January 7, 2013 to include soybean oil and remove orange juice.
The Managing Owner and the Shareholders share in any profits and losses of the Fund attributable to the Fund in proportion to the percentage interest owned by each.
The Managing Owner, the Fund, and the Master Fund retainsretain the services of third party service providers to operate the ongoing operations of the Fund and the Master Fund.Fund (See Note (2)).
(2) Service Providers and Related Party Agreements
(a) “The Trustee” —– CSC Trust is the trustee for the Fund and Master Fund. CSC Trust is headquartered in Wilmington, DE.
(b) “The Managing Owner” —– GreenHaven Commodity Services, LLC is the managing owner of the Fund and Master Fund and is responsible for the day to day operations of both entities. The Managing Owner charges the Fund a management fee for its services. GreenHaven Commodity Services, LLC is a Delaware limited liability company with operations in Atlanta, GA.
59
(c) “The Administrator” —– The Bank of New York Mellon Corporation has been appointed by the Managing Owner as the administrator, custodian and transfer agent of the Fund and the Master Fund, and has entered into separate administrative, custodian, transfer agency and service agreements (collectively referred to as the “Administration Agreement”). Pursuant to the Administration Agreement, the Administrator performs or supervises the services necessary for the operation and administration of the Fund and the Master Fund (other than making investment decisions), including receiving net asset value calculations, accounting and other fund administrative services. As the Fund’s transfer agent, the Administrator will process additionscreations and redemptions of Shares. These transactions will be processed on Depository Trust Company’s (“DTC’s”) book entry system. The Administrator retains certain financial books and records, including: Basket creation and redemption books and records, fund accounting records, ledgers with respect to assets, liabilities, capital, income and expenses, the registrar, transfer journals and related details and trading and related documents received from futures commission merchants. The Bank of New York Mellon Corporation is based in New York, New York.
66
(d) “The Commodity Broker” —– Morgan Stanley & Co. Incorporated (“MS&Co.”) is the Master Fund’s Commodity Broker. In its capacity as the Commodity Broker, it executes and clears each of the Master Fund’s futures transactions and performs certain administrative services for the Master Fund. MS&Co. is based in New York, New York.
(e) “The Distributor” —– The Managing Owner, on behalf of the Fund and the Master Fund, has appointed ALPS Distributors, Inc., or the Distributor, to assist the Managing Owner and the Administrator with certain functions and duties relating to the creation and redemption of Baskets, including receiving and processing orders from Authorized Participants to create and redeem Baskets, coordinating the processing of such orders and related functions and duties. The Distributor retains all marketing materials and Basket creation and redemption books and records at c/o ALPS Distributors, Inc., 1290 Broadway, Suite 1100, Denver, CO 80203; Telephone number (303) 623-2577. Investors may contact the Distributor toll-free in the U.S. at (800) 320-2577. The Fund has entered into a Distribution Services Agreement with the Distributor.
The Distributor is affiliated with ALPS Mutual Fund Services, Inc., a Denver-based service provider of administration, fund accounting, transfer agency and shareholder services for mutual funds, closed-end funds and exchange-traded funds, with over 100,000 shareholder accounts and approximately $10 billion in client mutual fund assets under administration. The Distributor provides distribution services and has approximately $120 billion in client assets under distribution.funds.
(f) “The Authorized Participant” — Authorized Participants may create or redeem shares of the Master Fund. Each Authorized Participant must (1) be a registered broker-dealer or other securities market participant such as a bank or other financial institution which is not required to register as a broker-dealer to engage in securities transactions, (2) be a participant in the Depository Trust Company, or DTC, and (3) have entered into a participant agreement with the Fund and the Managing Owner, or a Participant Agreement. The Participant Agreement sets forth the procedures for the creation and redemption of Baskets of Shares and for the delivery of cash required for such creations or redemptions. A list of the current Authorized Participants can be obtained from the Administrator. A similar agreement between the Fund and the Master Fund sets forth the procedures for the creation and redemption of Master Unit Baskets by the Fund.
(3) Summary of Significant Accounting Policies
(a) Use of Estimates
The preparation of the financial statements in conformity with accounting principles generally accepted in the United States of America requires management to make estimates and assumptions that affect the reported amounts of assets and liabilities and disclosure of contingent assets and liabilities at the date of the financial statements and the reported amounts of revenue and expenses during the period. Actual results could differ from those estimates.
(b) Cash Held by Broker
The Fund defines cash held by broker to be cash and highly liquid investments with originalremaining maturities of three months or less when acquired. MS&Co. allows the Fund to apply its Treasury Bill portfolio towards its initial margin requirement for the Fund’s futures positions, hence all cash held by broker is unrestricted cash. The cash and Treasury bill positions are held in segregated accounts at MS&Co and are not insured by the Federal Deposit Insurance Corporation.
60
(c) United States Treasury Obligations
The Master Fund records purchases and sales of United States Treasury Obligations on a trade date basis. These holdings are marked to market based on quoted market closing prices. The Master Fund holds United States Treasury Obligations for deposit with the Master Fund’s commodity brokersbroker as margin and for trading and heldholding against initial margin of the open futures contracts. Interest income is recognized on an accrual basis when earned. Premiums and discounts are amortized or accreted over the life of the United States Treasury Obligations.
(d) Income Taxes
The Fund and Master Fund are classified as a grantor trust and a partnership respectively, for U.S. federal income tax purposes. Accordingly, neither the Fund nor the Master Fund is subject to U.S. federal, state, or local income taxes. Accordingly, no provision for federal, state, and local income taxes has been made in the accompanying consolidated financial statements, as investors are individually liable for income taxes, if any, on their allocable share of the Fund’s share of the Master Fund’s income, gain, loss, deductions and other items.
67
The Fund accounts for uncertainty in income taxes pursuant to the applicable accounting standard, which provides measurement, presentation and disclosure guidance related to uncertain tax positions. The guidance addresses how tax benefits claimed or expected to be claimed on a tax return should be recorded in the financial statements. Under this topic, the Fund must recognize the tax benefit from an uncertain tax position only if it is more likely than not that the tax position will be sustained on examination by the taxing authorities based on the technical merits of the position. The tax benefits recognized in the financial statements from such a position are measured based on the largest benefit that has a greater than fifty percent likelihood of being realized upon ultimate resolution. The Fund’s reassessment of its tax positions did not have a material impact on the Fund’s financial condition, results of operations or liquidity.
(e) Futures Contracts
The Master Fund purchases and holds commodity futures contracts for investment purposes. These contracts are recorded on a trade date basis and open contracts are valued daily at settlement prices provided by the relevant exchanges. In the consolidated statement of financial condition, futures contracts are presented at their published settlement prices on the last business day of the period, in accord with the fair value accounting standard. Since these contracts are actively traded in markets that are directly observable and which provide readily available price quotes, their market value is deemed to be their fair value under the fair value accounting standard. (see(See Note 4 —– Fair Value Measurements)
However, when market closing prices are not available, the Managing Owner may value an asset of the Master Fund pursuant to such other principles as the Managing Owner deems fair and equitable so long asprovided such principles are consistent with the fair value accounting standard. Realized gains (losses) and changes in unrealized appreciation (depreciation) on open positions are determined on a specific identification basis and recognized in the consolidated statement of income and expenses in the period in which the contract is closed or the changes occur, respectively.
(f) Basis of Presentation and Consolidation
Upon the initial offering of the limited shares of the Fund, 100% of the capital raised by the Fund was used to purchase common units of beneficial interest of the Master Fund. The financial statement balances of the Master Fund were consolidated with the Fund’s financial statement balances beginning with the first reporting period subsequent to the initial offering, and all significant inter-company balances and transactions were eliminated. Separate financial statements of the Master Fund are presented to comply with SEC reporting requirements as the Master Fund is a separate SEC registrant.
(g) Recently Issued Accounting Pronouncements
The FASB has issued additionalFund is required to follow recent disclosure guidance clarifying existingwhich includes common requirements for measurement of and disclosure requirements, about fair value. The new guidance requires reporting entities to disclose the following information for fair value measurements. The additional requirements include disclosure regardingmeasurements categorized within Level 3 of the fair value hierarchy: Quantitative information about the unobservable inputs used in the fair value measurement, the valuation processes used by the reporting entity and a narrative description of the sensitivity of the fair value measurement to changes in unobservable inputs and the interrelationships between those unobservable inputs. It also requires reporting entities to make disclosures about amounts and reasons for significantall transfers in and out of Level 1 and Level 2 of the fair value hierarchymeasurements. Previously issued guidance continues to require the same information regarding transfers in and also separate presentationout of purchases, sales, issuances and settlementsLevel 3. The disclosures required by this guidance are reflected in Note (4).
In December 2011, additional disclosure guidance was issued requiring financial statements prepared under principles generally accepted in the United States of items measured using significant unobservable inputs (i.e. Level 3).America to be more comparable to those prepared under International Financial Reporting Standards. The guidance clarifies existingnew disclosure requirements regardingmandate that entities disclose both gross and net information about instruments and transactions eligible for offset in the inputsstatement of assets and valuation techniques usedliabilities as well as instruments and transactions subject to measure fair valuean agreement similar to a master netting arrangement. In addition, disclosure of collateral received and posted in connection with master netting agreements or similar arrangements is required. New disclosures are required for measurements that fall in either Level 2 or Level 3 of the hierarchy. The requirements are effective for interim and annual reporting periods beginning on or after December 15, 2009, except for the disclosures about purchases, sales, issuances January 1, 2013,and settlements which are effective for fiscal years beginning after December 15, 2010 and for interim periods within those fiscal years. The Fundannual periods. Management is evaluating the impact of this newadditional disclosure guidance will have on itsthe financial statements.statements and disclosures.
61
68
(h) Recently Adopted Accounting StandardsSubsequent Events
For purposes of authoritative literature for U.S. accounting and reporting standards. The Codification is not meant to change existing GAAP but rather provide a single source for all literature. The Fund adopted the standard during the quarter ended September 30, 2009, which required changing certain disclosuresdisclosure in the financial statements, to reflect Codification or “Plain English” references rather than references to FASB Statements, Staff Positions or Emerging Issues Task Force Abstracts. The adoption of this requirement is reflected in certain disclosures inthe Fund has evaluated events occurring between the year ending December 31, 2012 and when the financial statements butwere issued.
400,000 Limited Shares created and 350,000 Limited Shares redeemed resulting in 16,500,000 Limited Shares outstanding.
In accordance with the terms of the Distribution Services Agreement which would have renewed on January 7, 2013, the Managing Owner has informed the Distributor that instead of automatically renewing it intends to meet with the Distributor to review the terms of the agreement. The terms of the present agreement remains in effect until amended.
Other than these events, the evaluation did not have an impact on the Fund’s financial position, results of operations, or cash flows.
(4) Fair Value Measurements
The FASB has issued guidance allowing entities determining the fair value of a liability to use the perspective of an investor that holds the related obligation as an asset. The guidance was effective for interim and annual periods beginning after August 27, 2009 and applied to all fair value measurements of liabilities. This accounting standards update did not have a material impact onestablishes the Fund’s financial statements.
Level 1 — quotedQuoted prices (unadjusted) in active markets for identical securitiesassets or liabilities that the reporting entity can access at the measurement date.
Level 2 — Inputs other significant observable inputs (includingthan quoted prices included within Level 1 that are observable for similar securities, interest rates, prepayment speeds, credit risk, etc.)the asset or liability, either directly or indirectly.
Level 3 — significant unobservableUnobservable inputs (includingfor the Fund’s own assumptions in determining the fair value of investments)asset or liability.
62
The inputs or methodology used for valuing securities are not necessarily an indication of the risk associated with investing in those securities. The assets of the Fund are either exchange-traded securities or government securities that are valued using dealer and broker quotations or other inputs that are observable or can be corroborated by observable market data. A summary of the Fund’s assets and liabilities at fair value as of December 31, 2009,2012, classified according to the levels used to value them, are as follows:
| Other | ||||||||||||||||
| Quoted Prices in | Significant | Significant | ||||||||||||||
| Active Market | Observable | Unobservable | ||||||||||||||
| Assets | (Level 1) | Inputs (Level 2) | Inputs (Level 3) | Totals | ||||||||||||
U.S. Treasuries | $ | — | $ | 119,992,525 | $ | — | $ | 119,992,525 | ||||||||
Futures Contracts | 12,380,231 | — | — | 12,380,231 | ||||||||||||
Total | $ | 12,380,231 | $ | 119,992,525 | $ | — | $ | 132,372,756 | ||||||||
| Assets | Quoted Prices in Active Market (Level 1) | Other Significant Observable Inputs (Level 2) | Significant Unobservable Inputs (Level 3) | Totals | |||||||||
| U.S. Treasuries | $ | - | $ | 469,995,420 | $ | - | $ | 469,995,420 | |||||
| Futures Contracts | (12,514,458 | ) | - | - | (12,514,458 | ) | |||||||
| Total | $ | (12,514,458 | ) | $ | 469,995,420 | $ | - | $ | 457,480,962 | ||||
There were no transfers between Level 1 and Level 2 for the Fund during the year ended December 31, 2012. The Fund did not hold any Level 3 securities during the year ended December 31, 2012.
A summary of the Fund’s assets and liabilities at fair value as of December 31, 2008,2011, classified according to the levels used to value them, are as follows:
| Other | |||||||||||||||||||||||||||||
| Quoted Prices in | Significant | Significant | |||||||||||||||||||||||||||
| Active Market | Observable | Unobservable | |||||||||||||||||||||||||||
| Assets | (Level 1) | Inputs (Level 2) | Inputs (Level 3) | Totals | Quoted Prices in Active Market (Level 1) | Other Significant Observable Inputs (Level 2) | Significant Unobservable Inputs (Level 3) | Totals | |||||||||||||||||||||
U.S. Treasuries | $ | — | $ | 4,999,865 | $ | — | $ | 4,999,865 | $ | - | $ | 9,999,990 | $ | - | $ | 9,999,990 | |||||||||||||
Futures Contracts | (1,880,290 | ) | — | — | (1,880,290 | ) | (45,001,789 | ) | - | - | (45,001,789 | ) | |||||||||||||||||
Total | $ | (1,880,290 | ) | $ | 4,999,865 | $ | — | $ | 3,119,575 | $ | (45,001,789 | ) | $ | 9,999,990 | $ | - | $ | (35,001,799 | ) | ||||||||||
69
There were no transfers between Level 1 and Level 2 for the Fund during the year ended December 31, 2011. The Fund did not hold any Level 3 securities during the year ended December 31, 2011.
(5) Derivative Instruments and Hedging Activities
The Fund uses derivative instruments as part of its principal investment strategy to achieve its investment objective. As of December 31, 2009,2012, the Funds were invested in futures contracts.
At December 31, 2009,2012, the fair value of derivative instruments were as follows:
| Derivative Instruments | Asset Derivatives* | Liability Derivatives* | Net Derivatives* | |||||||||
| Futures Contracts | $ | 12,380,231 | $ | — | $ | 12,380,231 | ||||||
63
| Derivative Instruments | Asset Derivatives | Liability Derivatives | Net Derivatives | |||||||||
| Futures Contracts | $ | (12,514,458 | ) | $ | - | $ | (12,514,458 | ) | ||||
The following is a summary of the realized and unrealized gains of the derivative instruments utilized by the Fund, categorized by risk exposure, for the year ended December 31, 2009:
| Realized Gain on | Net Change in Unrealized Gain | |||||||
| Derivative Instruments | Derivative Instruments | on Derivative Instruments | ||||||
| Futures Contracts | $ | 12,851,212 | $ | 14,260,521 | ||||
| Derivative Instruments | Asset Derivatives* | Liability Derivatives* | Net Derivatives* | |||||||||
| Futures Contracts | $ | (1,880,290 | ) | $ | — | $ | (1,880,290 | ) | ||||
| Realized Loss on | Net Change in Unrealized Gain | |||||||
| Derivative Instruments | Derivative Instruments | on Derivative Instruments | ||||||
| Futures Contracts | $ | (5,219,696 | ) | $ | (1,880,290 | ) | ||
| Derivative Instruments | Net Realized Loss on Derivative Instruments | Net Change in Unrealized Gain on Derivative Instruments | ||||||
| Futures Contracts | $ | (55,222,884 | ) | $ | 32,487,331 | |||
At December 31, 2011, the fair value of derivative instruments were as follows:
| Derivative Instruments | Asset Derivatives | Liability Derivatives | Net Derivatives | |||||||||
| Futures Contracts | $ | (45,001,789 | ) | $ | - | $ | (45,001,789 | ) | ||||
The following is a summary of the realized and unrealized gains and losses of the derivative instruments utilized by the Fund, categorized by risk exposure, for the year ended December 31, 2011:
Derivative Instruments | Net Realized Gain on Derivative Instruments | Net Change in Unrealized Loss on Derivative Instruments | ||||||
| Futures Contracts | $ | 36,755,383 | $ | (103,641,471 | ) | |||
The following is a summary of the realized and unrealized gains and losses of the derivative instruments utilized by the Fund, categorized by risk exposure, for the year ended December 31, 2010:
| Derivative Instruments | Net Realized Gain on Derivative Instruments | Net Change in Unrealized Gain on Derivative Instruments | ||||||
| Futures Contracts | $ | 43,285,484 | $ | 46,259,451 | ||||
(6) Financial Instrument Risk
In the normal course of its business, the Fund is party to financial instruments with off-balance sheet risk. The term “off-balance sheet risk” refers to an unrecorded potential liability that, even though it does not appear on the balance sheet, may result in a future obligation or loss. The financial instruments used by the Fund are commodity futures, whose values are based upon an underlying asset and generally represent future commitments tothat have a reasonable possibility to be settled in cash or through physical delivery. These instruments are traded on an exchange and are standardized contracts.
Market risk is the potential for changes in the value of the financial instruments traded by the Fund due to market changes, including fluctuations in commodity prices. In entering into these contracts, there exists a market risk that such contracts may be significantly influenced by conditions, resulting in such contracts being less valuable. If the markets should move against all of the futures interest positions at the same time, and the Managing Owner was unable to offset such positions, the Fund could experience substantial losses.
Credit risk is the possibility that a loss may occur due to the failure of an exchange clearinghouse to perform according to the terms of a contract. Credit risk with respect to exchange-traded instruments is reduced to the extent that an exchange or clearing organization acts as counterparty to the transactions. The Fund’s risk of loss in the event of counterparty default is typically limited to the amounts recognized in the statement of assets and liabilities and not represented by the contract or notional amounts of the instruments.
70
The Fund and the Master Fund have not utilized, nor do they expect to utilize in the future, special purpose entities to facilitate off-balance sheet financing arrangements and have no loan guarantee arrangements or off-balance sheet arrangements of any kind other than agreements entered into in the normal course of business.
64
(7) Share PurchasesCreations and Redemptions
(a) PurchasesCreation of shares
The Fund will issue Shares in Basketsbaskets of 50,000 Shares (“Baskets”) only to Authorized Participants continuously as of noon, New York time, on the business day immediately following the date on which a valid order to create a Basket is accepted by the Fund, at the net asset value of 50,000 SharesFund. The Baskets will be valued as of the closing time of the NYSE Arca or the last to close of the exchanges on which the Index Commodities are traded, whichever is later, on the date that a valid order to create a Basket is accepted by the Fund.
The total payment required to create each Basket is the value of the Fund’s Net Asset Value per Share for 50,000 Shares as of the closing time of NYSE Arca or the last to close of the exchanges on which the Index Commodities are traded, whichever is later, on the purchase order date. Baskets will be issued as of 12:00 p.m., New York time, on the Business Day immediately following the creation order date at Net Asset Value per Share as of the closing time of NYSE Arca or the last to close of the exchanges on which the Index Commodities are traded, whichever is later, on the purchase order date during the continuous offering period, but only if the required payment has been timely received.
Because orders to create Baskets must be placed by 10:00 a.m., New York time, but the total payment required to create a Basket during the continuous offering period will not be determined until 4:00 p.m., New York time, on the date the creation order is received, Authorized Participants will not know the total amount of the payment required to create a Basket at the time they submit an irrevocable purchase order for the Basket. The Fund’s Net Asset Value and the total amount of the payment required to create a Basket could rise or fall substantially between the time an irrevocable creation order is submitted and the time the amount of the creation price in respect thereof is determined.
On any business day, an Authorized Participant may place an order with the Distributor to create one or more Baskets. Creation orders must be placed by 10:00 a.m., New York time. The day on which the Distributor receives a valid creation order is the creation order date.
The Administrator may reject a creation order if:
| (i) | it determines that the creation order is not in proper form; | |
| (ii) | the Managing Owner believes that the creation order would have adverse tax consequences to the Fund or its Shareholders; or | |
| (iii) | circumstances outside the control of the Managing Owner or the Distributor make it, for all practical purposes, not feasible to process creations of Baskets. |
The Distributor and the Managing Owner will not be liable for the rejection of any creation order.
(b) RedemptionsRedemption of Shares
The procedures by which an Authorized Participant can redeem one or more Baskets mirror the procedures for the creation of Baskets. On any business day, an Authorized Participant may place an order with the Distributor to redeem one or more Baskets. Redemption orders must be placed by 10:00 a.m., New York time. The day on which the Distributor receives a valid redemption order is the redemption order date. The redemption procedures allow only Authorized Participants to purchase and redeem Baskets. Individual Shareholders may not redeem Shares directly from the Fund.
By placing a redemption order, an Authorized Participant agrees to deliver the Baskets to be redeemed through DTC’s book-entry system to the Fund not later than noon, New York time, on the business day immediately following the redemption order date. By placing a redemption order, and prior to receipt of the redemption distribution, an Authorized Participant’s DTC account will be charged the non-refundable transaction fee due for the redemption order.
71
The redemption distribution from the Fund consists of the cash redemption amount. The cash redemption amount is equal to the net asset valueNet Asset Value of the number of Basket(s) requested in the Authorized Participant’s redemption order as of the closing time of the NYSE Arca or the last to close of the exchanges on which the Index Commodities are traded, whichever is later, on the redemption order date. The Fund will distribute the cash redemption amount at noon, New York time, on the business day immediately following the redemption order date through DTC to the account of the Authorized Participant as recorded on DTC’s book entry system.
The redemption distribution due from the Fund is delivered to the Authorized Participant at noon, New York time, on the business day immediately following the redemption order date if, by such time on such business day immediately following the redemption order date, the Fund’s DTC account has been credited with the Baskets to be redeemed. If the Fund’s DTC account has not been credited with all of the Baskets to be redeemed by such time, the redemption distribution is delivered to the extent of whole Baskets received. Any remainder of the redemption distribution is delivered on the next business day to the extent of remaining whole Baskets received if the Administrator receives the fee applicable to the extension of the redemption distribution date which the Managing Owner may, from time to time, determine and the remaining Baskets to be redeemed are credited to the Fund’s DTC account by noon, New York time, on such next business day. Any further outstanding amount of the redemption order shall be canceled. The Administrator is also authorized to deliver the redemption distribution notwithstanding that the Baskets to be redeemed are not credited to the Fund’s DTC account by noon, New York time, on the business day immediately following the redemption order date if the Authorized Participant has collateralized its obligation to deliver the Baskets through DTC’s book entry system on such terms as the Administrator and the Managing Owner may from time to time agree upon.
The Distributor may, in its discretion, and will when directed by the Managing Owner, suspend the right of redemption or postpone the redemption settlement date, (1) for any period during which an emergency exists as a result of which the redemption distribution is not reasonably practicable, or (2) for such other period as the Managing Owner determines to be necessary for the protection of the Shareholders. In addition, the Distributor will reject a redemption order if the order is not in proper form as described in the Participant Agreement or if the fulfillment of the order, in the opinion of its counsel, might be unlawful. Any such postponement, suspension or rejection could adversely affect a redeeming Authorized Participant. For example, the resulting delay may adversely affect the value of the Authorized Participant’s redemption proceeds if the net asset value of the Fund declines during the period of the delay. Under the Distribution Services Agreement, the Managing Owner and the Distributor may disclaim any liability for any loss or damage that may result from any such suspension or postponement.
65
(8) Operating Expenses
(a) Management Fee
The Master Fund pays the Managing Owner a management fee (the “Management Fee”) monthly in arrears, in an amount equal to 0.85% per annum of the net asset value of the Master Fund. No separate management fee will be paid by the Master Fund. The Management Fee will be paid in consideration of the use of the license for the Thomson Reuters Continuous Commodity Index held by GreenHaven, LLC, a Georgia limited liability company formed in August 2005, and its subsidiary GreenHaven Commodity Services, LLC, as well as for commodity futures trading advisory services. The management feefees incurred for the years ended December 31, 20092012, 2011 and 2008 was $1,018,5262010 were $4,637,997, $5,895,201 and $188,888,$2,523,863, respectively. The management fee wasManagement Fees were charged to the Master Fund and paid to the Managing Owner. The Fund did not commence investment operations until January 23, 2008 so there were no management fees incurred for the year ended December 31, 2007.
| (b) | Organization and Offering Expenses |
Expenses incurred in connection with organizing the Fund and the Master Fund and the offering of the Shares will bewere paid by GreenHaven, LLC. GreenHaven, LLC is the sole member of the Managing Owner. The Fund and the Master Fund do not have an obligation to reimburse GreenHaven, LLC or its affiliates for organization and offering expenses paid on their behalf.
(c) Brokerage Commissions and Fees
The Managing Owner currently does not expect brokerage commissions and fees as well as routine operational, administrative and other ordinary expenses for which the Funds are responsible, including, but not limited to, the fees and expenses of the Trustee, legal and accounting fees and expenses, tax preparation expenses, filing fees, and printing, mailing and duplication costs, to exceed 0.24%0.20% of the net asset value of the Master Fund in any year. year, although the actual amount of such fees and expenses in any year may be greater. The Fund’s brokerage commissions and fees and routine operational, administrative and other ordinary expenses are accrued at a rate of 0.20% per annum in the aggregate. Of the amounts so accrued, the Master Fund first pays brokerage fees, and secondly from the remainder of the amounts so accrued, reimburses the Managing Owner for the Fund’s and Master Fund’s routine operational, administrative, and other ordinary expenses paid by the Managing Owner.
72
Brokerage commissions and fees will beare charged against the Master Fund’s Assets on a per transaction basis on the date of the transaction. The brokerage commissions and trading fees incurred for the years ended December 31, 20092012, 2011 and 20082010 were $287,584$377,195, $1,300,472 and $54,945,$712,620, respectively. The Fund did not commence investment operations until January 23, 2008 so there were no brokerage commissions or fees incurred for the year ended December 31, 2007. These fees were charged to the Fund and paid to the Commodity Broker. Brokerage commissions and trading fees are typically charged by the Commodity Broker to the Fund on a half-turn basis, i.e. half is charged when a contract is opened and half is charged when a position is closed. Currently, the Fund accrues monthly an amount equal to 0.02% of the net asset value of the Master Fund.
(d) ExtraordinaryUnusual Fees and Expenses
The Master Fund will pay all the extraordinaryunusual fees and expenses, if any, of the Fund and the Master Fund. Such extraordinaryunusual fees and expenses, by their nature, are unpredictable in terms of timing and amount. There have been no extraordinaryunusual fees and expenses since the Fund commenced investment operations on January 23, 2008.
(e) Routine Operational, Administrative and Other Ordinary Expenses
During the Continuous Offering Periodcontinuous offering period the Managing Owner payspaid all of the routine operational, administrative and other ordinary expenses of the Index Fund and the Master Fund, including, but not limited to, accounting and computer services, the fees and expenses of the Trustee, legal fees and expenses, tax preparation expenses, filing fees, fees in connection with fund administration, and printing, mailing and duplication costs. The Managing Owner may be reimbursed for routine operational, administrative and other ordinary expenses. See Note 8 (c) for details of the Fund’s brokerage commissions and fees and routine operational, administrative and other ordinary expenses accrual policy.
66
(9) Termination
The term of the Fund is perpetual, unless terminated in certain circumstances as set forth below.
The Fund will dissolve at any time upon the happening of any of the following events:
| (i) | The filing of a certificate of dissolution or revocation of the Managing Owner’s charter (and the expiration of ninety (90) days after the date of notice to the Managing Owner of revocation without a reinstatement of its charter) or upon the withdrawal, removal, adjudication or admission of bankruptcy or insolvency of the Managing Owner, or an event of withdrawal unless (i) at the time there is at least one remaining Managing Owner and that remaining Managing Owner carries on the business of the Fund or (ii) within ninety (90) days of such event of withdrawal all the remaining Shareholders agree in writing to continue the business of the Fund and to select, effective as of the date of such event, one or more successor Managing Owners. If the Fund is terminated as the result of an event of withdrawal and a failure of all remaining Shareholders to continue the business of the Fund and to appoint a successor Managing Owner as provided above within one hundred and twenty (120) days of such event of withdrawal, Shareholders holding Shares representing at least seventy-five percent (75%) of the net asset value (not including Shares held by the Managing Owner and its affiliates) may elect to continue the business of the Fund by forming a new statutory trust, or reconstituted trust, on the same terms and provisions as set forth in the Trust Declaration. Any such election must also provide for the election of a Managing Owner to the reconstituted trust. If such an election is made, all Shareholders of the Fund shall be bound thereby and continue as Shareholders of the reconstituted trust. |
| (ii) | The occurrence of any event which would make unlawful the continued existence of the Fund. |
| (iii) | In the event of the suspension, revocation or termination of the Managing Owner’s registration as a commodity pool operator, or membership as a commodity pool operator with the NFA (if, in either case, such registration is required at such time unless at the time there is at least one remaining Managing Owner whose registration or membership has not been suspended, revoked or terminated). |
| (iv) | The Fund becomes insolvent or bankrupt. |
| (v) | The Shareholders holding Shares representing at least seventy-five percent (75%) of the Net Asset Value (which excludes the Shares of the Managing Owner) vote to dissolve the Fund, notice of which is sent to the Managing Owner not less than ninety (90) Business Days prior to the effective date of termination. |
73
| (vi) | The determination of the Managing Owner that the aggregate net assets of the Fund in relation to the operating expenses of the Fund make it unreasonable or imprudent to continue the business of the Fund. |
| (vii) | The Fund becoming required to be registered as an investment company under the Investment Company Act of 1940. |
| (viii) | DTC is unable or unwilling to continue to perform its functions, and a comparable replacement is unavailable. |
(10) Profit and Loss Allocations and Distributions
The Managing Owner and the Shareholders share in any profits and losses of the Fund attributable to the Fund in proportion to the percentage interest owned by each. Distributions may be made at the sole discretion of the Managing Owner on a pro rata basis in accordance with the respective capital balances of the shareholders.
67
(11) Net Asset Value and Financial Highlights
The Fund is presenting the following net asset value and financial highlights related to investment performance and operations for a Share outstanding for the periodsyears ended December 31, 20092012, 2011 and December 31, 2008.2010. The net investment incomeloss and total expense ratios have been annualized. The total return is based on the change in net asset value of the Shares during the period. An individual investor’s return and ratios may vary based on the timing of capital transactions.
| Year Ended | Year Ended | |||||||
| December 31, 2009 | December 31, 2008 (iii) | |||||||
Net Asset Value | ||||||||
| Net asset value per Limited Share, beginning of period | $ | 21.92 | $ | 30.00 | ||||
| Net realized and unrealized gain (loss) from investments and futures contracts | 4.53 | (8.20 | ) | |||||
| Net investment income (loss) | (0.23 | ) | 0.12 | |||||
| Net increase (decrease) in net assets from operations | 4.30 | (8.08 | ) | |||||
| Net asset value per Limited Share, end of period | 26.22 | 21.92 | ||||||
| Market value per Limted Share, beginning of period | 21.92 | 30.00 | ||||||
| Market value per Limted Share, end of period | $ | 26.32 | $ | 21.92 | ||||
Ratio to average net assets (i) | ||||||||
| Net investment income (loss) | (0.98 | )% | 0.43 | % | ||||
| Total expenses | 1.08 | % | 1.10 | % | ||||
Total Return, at net asset value (ii) | 19.62 | % | (26.90 | )% (iv) | ||||
Total Return, at market value (ii) | 20.07 | % | (26.90 | )% (iv) | ||||
| Year | Year | Year | ||||||||||
| Ended | Ended | Ended | ||||||||||
| December 31, 2012 | December 31, 2011 | December 31, 2010 | ||||||||||
| Net Asset Value | ||||||||||||
| Net asset value per Limited Share, beginning of year | $ | 29.96 | $ | 32.88 | $ | 26.22 | ||||||
| Net realized and change in unrealized gain (loss) from investments | (0.85 | ) | (2.59 | ) | 6.93 | |||||||
| Net investment loss | (0.26 | ) | (0.33 | ) | (0.27 | ) | ||||||
| Net increase (decrease) in net assets from operations | (1.11 | ) | (2.92 | ) | 6.66 | |||||||
| Net asset value per Limited Share, end of year | $ | 28.85 | $ | 29.96 | $ | 32.88 | ||||||
| Market value per Limited Share, beginning of year | $ | 29.96 | $ | 32.95 | $ | 26.32 | ||||||
| Market value per Limited Share, end of year | $ | 28.85 | $ | 29.96 | $ | 32.95 | ||||||
| Ratio to average net assets (i) | ||||||||||||
| Net investment loss | (0.86 | )% | (0.99 | )% | (0.98 | )% | ||||||
| Total expenses | 0.92 | % | 1.04 | % | 1.09 | % | ||||||
| Total Return, at net asset value (ii) | (3.70 | )% | (8.88 | )% | 25.40 | % | ||||||
| Total Return, at market value (ii) | (3.77 | )% | (9.07 | )% | 25.19 | % | ||||||
| (i) Percentages are annualized. | ||||||||||||
(ii) Percentages are not annualized. | ||||||||||||
68
74
None.
Disclosure controls and procedures
For purposes of this Item 9A, references to the “Fund” and “our” include both the Fund and the Master Fund. Under the supervision and with the participation of the management of the Managing Owner, including its chief executive officer and principal financial officer, the Fund carried out an evaluation of the effectiveness of the design and operation of its disclosure controls and procedures (as defined in Rule 13a-15(f)) of the Securities Exchange Act of 1934). Based upon that evaluation, the chief executive officer and principal financial officer concluded that the Fund’s disclosure controls and procedures with respect to the Fund were effective as of the end of the period covered by this annual report.
Internal control over financial reporting
The Managing Owner assessed the effectiveness of the Fund’s internal control over financial reporting as of December 31, 2009.2012. In making this assessment, wethe Managing Owner used the criteria set forth by the Committee of Sponsoring Organizations of the Treadway Commission onInternal Control Integrated Framework. Based on our assessment, we believeManagement believes that, as of December 31, 2009, our2012, its internal control over financial reporting is effective.
Grant Thornton LLP, the independent registered public accounting firm that audited the Fund’s consolidated financial statements included in this Annual Report on Form 10-K, has issued an attestation report on the Fund’s internal control over financial reporting, which appears on page 70pages 76 and 77 of this Annual Report on Form 10-K.
Management evaluated whether there was a change in the Fund’s internal control over financial reporting during the three months ended December 31, 20092012 that has materially affected, or is reasonably likely to materially affect, the Fund’s internal control over financial reporting. Based on ourthis evaluation, we believeManagement believes that there was no such change during the three months ended December 31, 2009.2012.
69
75
REPORT OF INDEPENDENT REGISTERED PUBLIC ACCOUNTING FIRM
Board of Managers and Shareholders of
GreenHaven Continuous Commodity Index Fund:
We have audited GreenHaven Continuous Commodity Index Fund’sthe internal control over financial reporting of GreenHaven Continuous Commodity Index Fund and subsidiary as of December 31, 2009,2012, based on criteria established inInternal Control — Control—Integrated Frameworkissued by the Committee of Sponsoring Organizations of the Treadway Commission (COSO). GreenHaven Continuous Commodity Index Fund’s management is responsible for maintaining effective internal control over financial reporting and for its assessment of the effectiveness of internal control over financial reporting, included in the accompanying Management’s Report on Internal Control Over Financial Reporting. Our responsibility is to express an opinion on the GreenHaven Continuous Commodity Index Fund’s internal control over financial reporting based on our audit.
We conducted our audit in accordance with the standards of the Public Company Accounting Oversight Board (United States). Those standards require that we plan and perform the audit to obtain reasonable assurance about whether effective internal control over financial reporting was maintained in all material respects. Our audit included obtaining an understanding of internal control over financial reporting, assessing the risk that a material weakness exists, testing and evaluating the design and operating effectiveness of internal control based on the assessed risk, and performing such other procedures as we considered necessary in the circumstances. We believe that our audit provides a reasonable basis for our opinion.
A company’s internal control over financial reporting is a process designed to provide reasonable assurance regarding the reliability of financial reporting and the preparation of financial statements for external purposes in accordance with generally accepted accounting principles. A company’s internal control over financial reporting includes those policies and procedures that (1) pertain to the maintenance of records that, in reasonable detail, accurately and fairly reflect the transactions and dispositions of the assets of the company; (2) provide reasonable assurance that transactions are recorded as necessary to permit preparation of financial statements in accordance with generally accepted accounting principles, and that receipts and expenditures of the company are being made only in accordance with authorizations of management and directors of the company; and (3) provide reasonable assurance regarding prevention or timely detection of unauthorized acquisition, use, or disposition of the company’s assets that could have a material effect on the financial statements.
Because of its inherent limitations, internal control over financial reporting may not prevent or detect misstatements. Also, projections of any evaluation of effectiveness to future periods are subject to the risk that controls may become inadequate because of changes in conditions, or that the degree of compliance with the policies or procedures may deteriorate.
In our opinion, GreenHaven Continuous Commodity Index Fund maintained, in all material respects, effective internal control over financial reporting as of December 31, 2009,2012, based on criteria established inInternal Control — Control—Integrated Frameworkissued by COSO.
70
We also have audited, in accordance with the standards of the Public Company Accounting Oversight Board (United States), the consolidated statementfinancial statements of financial condition, including the consolidated schedule of investments, of GreenHaven Continuous Commodity Index Fund as of December 31, 2009 and 2008, andfor the related consolidated statements of income and expenses, changes in shareholders’ equity, and cash flows for each of the three-years in the periodyear ended December 31, 20092012, and our report dated March 15, 2010February 26, 2013 expressed an unqualified opinion on those financial statements.
/s/ Grant Thornton LLP
Atlanta, Georgia
February 26, 2013
76
REPORT OF INDEPENDENT REGISTERED PUBLIC ACCOUNTING FIRM
Board of Managers and Shareholders of
GreenHaven Continuous Commodity Index Master Fund:
We have audited the internal control over financial reporting of GreenHaven Continuous Commodity Index Master Fund as of December 31, 2012, based on criteria established in Internal Control—Integrated Framework issued by the Committee of Sponsoring Organizations of the Treadway Commission (COSO). GreenHaven Continuous Commodity Index Master Fund’s management is responsible for maintaining effective internal control over financial reporting and for its assessment of the effectiveness of internal control over financial reporting, included in the accompanying Management’s Report on Internal Control Over Financial Reporting. Our responsibility is to express an opinion on the GreenHaven Continuous Commodity Index Master Fund’s internal control over financial reporting based on our audit.
We conducted our audit in accordance with the standards of the Public Company Accounting Oversight Board (United States). Those standards require that we plan and perform the audit to obtain reasonable assurance about whether effective internal control over financial reporting was maintained in all material respects. Our audit included obtaining an understanding of internal control over financial reporting, assessing the risk that a material weakness exists, testing and evaluating the design and operating effectiveness of internal control based on the assessed risk, and performing such other procedures as we considered necessary in the circumstances. We believe that our audit provides a reasonable basis for our opinion.
A company’s internal control over financial reporting is a process designed to provide reasonable assurance regarding the reliability of financial reporting and the preparation of financial statements for external purposes in accordance with generally accepted accounting principles. A company’s internal control over financial reporting includes those policies and procedures that (1) pertain to the maintenance of records that, in reasonable detail, accurately and fairly reflect the transactions and dispositions of the assets of the company; (2) provide reasonable assurance that transactions are recorded as necessary to permit preparation of financial statements in accordance with generally accepted accounting principles, and that receipts and expenditures of the company are being made only in accordance with authorizations of management and directors of the company; and (3) provide reasonable assurance regarding prevention or timely detection of unauthorized acquisition, use, or disposition of the company’s assets that could have a material effect on the financial statements.
Because of its inherent limitations, internal control over financial reporting may not prevent or detect misstatements. Also, projections of any evaluation of effectiveness to future periods are subject to the risk that controls may become inadequate because of changes in conditions, or that the degree of compliance with the policies or procedures may deteriorate.
In our opinion, GreenHaven Continuous Commodity Index Master Fund maintained, in all material respects, effective internal control over financial reporting as of December 31, 2012, based on criteria established in Internal Control—Integrated Framework issued by COSO.
We also have audited, in accordance with the standards of the Public Company Accounting Oversight Board (United States), the financial statements of the GreenHaven Continuous Commodity Index Master Fund as of and for the year ended December 31, 2012, and our report dated February 26, 2013 expressed an unqualified opinion on those financial statements.
/s/ GRANT THORNTONGrant Thornton LLP
Atlanta, Georgia
March 15, 2010
77
None.
71
The Fund has no directors or executive officers and also does not have any employees. It is managed
by the Managing Owner.
by the Managing Owner.
The current board of directors and executive officers of the Managing Owner are as follows:
| Name | ||||||
| Age | Position | |||||
| Ashmead Pringle | Chief Executive Officer and Member of the Board of Directors | |||||
| Chief Financial Officer and Member of the Board of Directors | ||||||
| Independent Director, Audit Committee Member | ||||||
| Independent Director, Audit Committee Member | ||||||
| Independent Director, Audit Committee Member | ||||||
Mr. Ashmead Pringle and Mr. Thomas FernandesCooper Anderson serve as executive officers of the Managing Owner. Mr. Michael LoungoTJ Mangold is the Audit Committee Chair. The Fund has no executive officers. Its affairs are generally managed by the Managing Owner. The following individuals serve as Management & Directors of the Managing Owner.
Principals and Key Employees.Ashmead Pringle and Thomas FernandesCooper Anderson serve as the chief decision makers of the Managing Owner.
Ashmead Pringle, 63, President66, Chief Executive Officer
Mr. Pringle founded the Managing Owner and has served as the President since October of 2006. Since 1984, Mr. Pringle founded and has acted as the President of Grain Service Corporation (GSC), a commodity research and trading company. Mr. Pringle has conducted hundreds of seminars on hedging, risk management, and basis trading in energy and agriculture, and is a recognized expert in commodity risk management. Mr. Pringle became a registered Associated Person and listed Principal of the Managing Owner on November 15, 2006. He became a listed Principal of GreenHaven, LLC on November 15, 2006 and a registered Associated Person of GreenHaven, LLC on September 18, 2006. GreenHaven LLC is a Georgia LLC, registered as a CTA on September 14, 2006, which focuses on the development of private and public commodity investments. He became a listed Principal of Grain Service Corporation, Inc. on June 12, 1985 and a registered Associated Person of Grain Service Corporation, Inc. on October 31, 1985.
Cooper Anderson, 33, Chief Financial Officer and Manager of Operations
Mr. Anderson is a traderthe Manager of Operations for the Managing Owner and is responsible for daily futures trading, cash flow management, treasury portfolio management, and quantitative analysis for the GreenHaven Continuous Commodity Index Fund. Prior to joining GreenHaven LLC, in April of 2007, Mr. Anderson worked from December of 2002 until March of 2006 as an analyst in Institutional Equity Sales and Trading for Credit Suisse Securities USA LLC, a securities broker dealer and investment bank based in Zurich, Switzerland. Mr. Anderson’s duties atAt Credit Suisse Securities USA LLC, Mr. Anderson served as a brokerage sales person covering the major financial institutions in the Southeastern USUnited States and the Caribbean. Between the March of 2006 and April of 2007, Mr. Anderson took time off from work. He has passed the Level 3 CFA®CFA® exam and has a B.B.A. in Finance from the University of Georgia. Mr. Anderson became a registered Associated Person on May 29, 2007 with GreenHaven LLC and registered Associated Person and as listed Principal of the Managing Owner on November 30, 2009. The registration associated with GreenHaven, LLC became inactive as of February 2, 2011.
72
Scott Glasing, 47,50, Trader
Mr. Glasing is a trader for the Managing Owner and is responsible for daily futures trading. Mr. Glasing has held this position since November of 2006. Mr. Glasing has an expertise, concentrated in trading, back office operations and compliance. A native of Chicago, he has interest in finance, economics, and hedging. Mr. Glasing has worked for Grain Service Corporation, Inc. since 1998. Mr. Glasing became a registered Associated Person on November 15, 2006 and listed Principal of the Managing Owner on November 30, 2009. He became a registered Associated Person of GreenHaven, LLC on September 14, 2006. He became an Associated Person of Grain Service Corporation, Inc. on February 9, 1998 and was listed as a principal of Grain Service Corporation, Inc. on March 26, 1998.
None of Mr. Pringle, Mr. Fernandes, Mr. Anderson, or Mr. Glasing receives a salary directly from the Master Fund or the Fund as a result of serving in any capacity. However, a portion the Management Fee that is received for the services provided by the Managing Owner may be used for payment of compensation to such individuals.
79
The following individuals serve as Independent Directors of the Managing Owner.
Thomas J Mangold spent thirty seven years in public accounting with PricewaterhouseCoopers LLP (PwC), serving national and international public and private clients. He has beenextensive experience in providing financial reporting, accounting, internal control and mergers and acquisitions expertise. He also served in various leadership roles for PwC including leading its Information and Communication practice and as a member of the firm’s U.S. Extended Leadership Team. Mr. Mangold is a certified public accountant and holds a bachelor’s degree in accounting from the University of Cincinnati.
Stephen O’Grady has more than thirty nine years experience in the financial services sector, most recently as part of GFI Group where he helped start the company’s ETF division. Prior to GFI, Mr. O’Grady spent 7 years as a partner at Kellogg Capital Group, and for six years served as a Senior Vice President and Floor Manager for ABN-AMRO on the American Stock Exchange. Mr. O’Grady was also President for SOG, Inc, a New York Stock Exchange options brokerage firm. He was co-founder and President of Labranche Futures, and a partner at the New York Futures Exchange. Mr. O’Grady started his career in the municipal bond markets, serving as Vice President and Head of Municipal Bond Trading and Underwriting at Chemical Bank, and as an Independentemployee in the Municipal Bond Department of Bankers Trust Company. Mr. O'Grady holds a Masters of Business Administration from Harvard Business School and a Bachelors of Arts Degree in Economics from Williams College.
Cengiz Searfoss is a Senior Director of theCorporate Finance at Aetna Inc. He serves as Managing Owner since January 2, 2008Director of DCS Capital, a US hedge fund, and as such, serves on the board of directors of the Managing Owner, which acts on behalf of the Fund. Mr. Loungo is an analyst for Liberum Capital Limited,previously was a London-based investment banking firm. Mr. Loungo was formerly a portfolio manager for TQA Investors LLC, and senior research analystPartner at West Broadway Partners.Partners, a multi-strategy hedge fund. Prior to his position at West Broadway Partners, he was a Manager for PricewaterhouseCoopersFinancial Analyst at Goldman, Sachs and Company, and began his career as an Auditor at KPMG Peat Marwick, where he qualified as a Certified Public Accountant. He received his BBA in New York, Philadelphia, and several of PricewaterhouseCooper’s Latin American offices. Michael is a graduate ofAccountancy from the University of Notre Dame, earned his CPA qualification, and holds a Spanish Language degree from the Ministry of Education and Science of Spain.Dame.
The Managing Owner has an audit committee which is made up of the three independent directors, Michael Loungo, Marcus Bensman,TJ Mangold, Stephen O’Grady, and Edward O’Neil.Cengiz Searfoss. Mr. LoungoMangold is the Chair of the Audit Committee. The audit committee is governed by an audit committee charter that is posted on the Fund’s website. The Board has not made a determination as to whether any of the members of the audit committee may be consideredconsiders TJ Mangold to be an “Audit Committee Financial Expert” as such term is definedreferenced in Item 407(d)(5) of Regulation S-K. However, theThe Board also believes that Messrs, Loungo, BensmanO’Grady and O’NeilSearfoss are able to read and understand financial statements and meet the financial sophistication requirements of the NYSE Arca and applicable FINRA rules as they relate to audit committees. As such, given the limited scope of the Fund’s activities and the qualifications and experience of all of the members of the audit committee, the board of directors does not believe it is necessary to designate a member of the audit committee as an “Audit Committee Financial Expert.”
73
As of December 31, 2009,2012, none of either Mr. Pringle, Mr. Fernandes, Mr. Anderson, Mr. Glasing or any Director owned any Shares, and the Managing Owner owned fifty (50) Shares.
Other Committees
Since the individuals who perform work on behalf of the Managing Owner are not compensated by the Fund, but instead by the Managing Owner, the Fund does not have a compensation committee. Similarly, since the Directors noted above serve on the board of directors of the Managing Owner, there is no nominating committee of the board of directors that acts on behalf of the Fund.
Code of Ethics
The Fund has no officers or employees and is managed by GreenHaven Commodity Services LLC (the “Managing Owner”). The Managing Owner has adopted the code of ethics of ALPS, Inc (the “Distributor”), which applies to all of its directors. Ethics training and annual review applies to all officers of the Managing Owner. A copy of the Policy and Procedure Manual of the Managing Owner, which includes ethics training and review, can be obtained on the Managing Owner’s website: www.greenhavenfunds.com.
Executive Compensation
The Fund has no employees, officers or directors and is managed by GreenHaven Commodity Services LLC. None of the directors or officers of GreenHaven Commodity Services LLC receive compensation from the Fund. GreenHaven Commodity Services LLC receives a monthly management fee of 1/12 of 0.85% (0.85% annually) of the average daily net assets of the Fund during the preceding month. During 2009,2012, 2011, and 2010 the Fund incurred management fees of $1,018,526$4,637,997, $5,895,201, and brokerage commission expenses of $287,584. During 2008, the Fund incurred management fees of $188,888 and brokerage commission expenses of $54,945. Since the Fund commenced investment operations on January 23, 2008, the Fund did not incur any management fees or brokerage commission expenses during 2007.
$2,523,863, respectively.
$2,523,863, respectively.
80
The Fund has no officers or directors. The following table sets forth certain information regarding beneficial ownership of our General Shares and Limited Shares as of December 31, 2009,2010, by management. No person is known by us to own beneficially more than 5% of the outstanding shares of such class.
Title of Class | Name and Address of Beneficial Owner | Amount and Nature of Beneficial Ownership | Percent of Class | |||||||
| General Shares | GreenHaven Commodity Services LLC c/o GreenHaven Commodity Services LLC 3340 Peachtree Rd, Suite 1910 Atlanta, GA 30326 | 50 shares | 100 | % | ||||||
The Fund has no securities authorized for issuance under equity compensation plans.
74
The following table sets forth compensation earned from the Managing Owner during the year ended December 31, 2009,2012, by the Directors of the Managing Owner.
| Change in | ||||||||||||||||||||||||||||
| Pension | ||||||||||||||||||||||||||||
| Value and | ||||||||||||||||||||||||||||
| Fees | Nonqualified | |||||||||||||||||||||||||||
| Earned or | Non-Equity | Deferred | ||||||||||||||||||||||||||
| Paid in | Stock | Option | Incentive Plan | Compensation | All Other | |||||||||||||||||||||||
| Name | Cash | Awards | Awards | Compensation | Plan | Compensation(1) | Total | |||||||||||||||||||||
Independent Directors | ||||||||||||||||||||||||||||
| Michael Loungo | $ | 3,375 | NA | NA | NA | $ | NA | $ | NA | $ | 3,375 | |||||||||||||||||
| Edward O’Neil | $ | 1,875 | NA | NA | NA | $ | NA | $ | NA | $ | 1,875 | |||||||||||||||||
| Marcus Bensman | $ | 1,875 | NA | NA | NA | $ | NA | $ | NA | $ | 1,875 | |||||||||||||||||
| Change in | |||||||||||||||||||||
| Pension | |||||||||||||||||||||
| Value and | |||||||||||||||||||||
| Fees | Nonqualified | ||||||||||||||||||||
| Earned or | Non-Equity | Deferred | |||||||||||||||||||
| Paid in | Stock | Option | Incentive Plan | Compensation | All Other | ||||||||||||||||
| Name | Cash | Awards | Awards | Compensation | Plan | Compensation(1) | Total | ||||||||||||||
| Independent Directors | |||||||||||||||||||||
| Michael Loungo | $ | 21,000 | NA | NA | NA | $ | NA | $ | NA | $ | 21,000 | ||||||||||
| Edward O’Neil | $ | 15,000 | NA | NA | NA | $ | NA | $ | NA | $ | 15,000 | ||||||||||
| Marcus Bensman | $ | 15,000 | NA | NA | NA | $ | NA | $ | NA | $ | 15,000 | ||||||||||
| Cengiz Searfoss | $ | 10,000 | NA | NA | NA | $ | NA | $ | NA | $ | 10,000 | ||||||||||
| Thomas Mangold | $ | 0 | NA | NA | NA | $ | NA | $ | NA | $ | 0 | ||||||||||
| Stephen O’Grady | $ | 0 | NA | NA | NA | $ | NA | $ | NA | $ | 0 | ||||||||||
Audit and Non-Audit Fees
The following table sets forth the fees for professional services rendered by Grant Thornton, the Fund’s independent registered public accounting firm.
| Fiscal Year Ended | Fiscal Year Ended | Fiscal Year Ended | ||||||||||
| December 31, 2009 | December 31, 2008 | December 31, 2007 | ||||||||||
| Audit Fees | $ | 152,810 | $ | 130,218 | $ | 85,612 | ||||||
| Audit-Related Fees | ||||||||||||
| Tax Fees | ||||||||||||
| All Other Fees | ||||||||||||
| Total | $ | 152,810 | $ | 130,218 | $ | 85,612 | ||||||
Fiscal Year Ended December 31, 2012 | Fiscal Year Ended December 31, 2011 | |||||||
| Audit Fees | $ | 151,000 | $ | 151,000 | ||||
| Audit-Related Fees | ||||||||
| Tax Fees | ||||||||
| All Other Fees | ||||||||
| Total | $ | 151,000 | $ | 151,000 | ||||
81
Approval of Independent Registered Public Accounting Firm Services and Fees
The Audit Committee of the Managing Owner approved 100% of the services provided by Grant Thornton to the Fund described above. The Audit Committee of the Managing Owner pre-approves all audit and allowed non-audit services of the Fund’s independent registered public accounting firm, including all engagement fees and terms.
(a)(1) Financial Statements
See financial statements commencing on page 50 hereof.
(a)(2) Financial Statement Schedules
No financial statement schedules are filed herewith because (i) such schedules are not required or (ii) the information required has been presented in the aforementioned financial statements.
75
(a)(3) Exhibits
| EXHIBIT NO. | DESCRIPTION | |||
| 4.1 | Amended Declaration of Trust and Trust Agreement of the | |||
| 4.2 | Amended Declaration of Trust and Trust Agreement of the | |||
| 4.3 | Form of Participant Agreement2 | |||
| 10.1 | Form of Escrow Agreement3 | |||
| 10.2 | Form of | |||
| 10.3 | Form of Administration Agreement4 | |||
| 10.4 | Form of Transfer Agency and Service | |||
| 10.5 | Form of Distribution Services Agreement4 | |||
10.6 10.7 10.9 10.10 10.11 10.12 10.13 10.14 10.15 | ||||
Marketing Agreement with ALPS Distributors, | ||||
| Inc4 License | ||||
| Agreement1 Addendum to License Addendum to License Agreement6 Addendum to License Agreement7 Addendum to License Agreement8 Amendment to Marketing Services Agreement9 Amendment to Marketing Services Agreement10 Amendment to Marketing Services Agreement11 |
1 Previously filed as an exhibit to Form S-1 on November 3, 2006 and incorporated herein by reference.
2 Previously filed as an exhibit to Pre-Effective Amendment No. 3 to Form S-1 on October 2, 2007 and incorporated herein by reference.
3 Previously filed as an exhibit to Pre-Effective Amendment No. 2 to Form S-1 on August 1, 2007 and incorporated herein by reference.
4 Previously filed as an exhibit to Form 8-K on January 14, 2008 and incorporated herein by reference.
5 Previously filed as an exhibit to Form 8-K on March 6, 2009 and incorporated herein by reference.
6 Previously filed as an exhibit to Form 8-K on October 1, 2009 and incorporated herein by reference.
7 Previously filed as an exhibit to Form 8-K on October 14, 2010 and incorporated herein by reference.
8 Previously filed as an exhibit to Form 8-K on October 6, 2011 and incorporated herein by reference.
9 Previously filed as an exhibit to Form 8-K on May 1, 2009 and incorporated herein by reference.
10 Previously filed as an exhibit to Form 8-K on May 19, 2009 and incorporated herein by reference.
82
| 10.16 | Amendment to Distribution Agreement9 | |||
| 10.17 | Addendum to License Agreement12 | |||
| 23.1 | Consent of Independent Registered Public Accounting Firm | |||
| 31.1 | Certificate Pursuant to Rule 13a-14(a) under the Securities Exchange Act of 1934 (filed herewith) | |||
| 31.2 | Certificate Pursuant to Rule 13a-14(a) under the Securities Exhange Act of 1934 (filed herewith) | |||
| 31.3 | Certificate Pursuant to Rule 13a-14(a) under the Securities Exchange Act of 1934 (filed herewith) | |||
| 31.4 | Certificate Pursuant to Rule 13a-14(a) under the Securities Exchange Act of 1934 (filed herewith) | |||
| 32.1 | Certificate Pursuant to 18 U.S.C. Section 1350, As Adopted Pursuant to Section 906 of the Sarbanes-Oxley Act of 2002 (furnished herewith) | |||
| 32.2 | Certificate Pursuant to 18 U.S.C. Section 1350, As Adopted Pursuant to Section 906 of the Sarbanes-Oxley Act of 2002 (furnished herewith) | |||
| 32.3 | Certificate Pursuant to 18 U.S.C. Section 1350, As Adopted Pursuant to Section 906 of the Sarbanes-Oxley Act of 2002 (furnished herewith) | |||
| 32.4 | Certificate Pursuant to 18 U.S.C. Section 1350, As Adopted Pursuant to Section 906 of the Sarbanes-Oxley Act of 2002 (furnished herewith) |
| 99.1 | Prospectus filed by the registrant on |
11 Previously filed as an exhibit to Form 8-K on August 16, 2010 and incorporated herein by reference.
12 Previously filed as an exhibit to Form 8-K on March 3, 2012, and incorporated herein by reference.
83
76
Pursuant to the requirements of the Securities Exchange Act of 1934, the Registrant has duly caused this report to be signed on its behalf by the undersigned, thereunto duly authorized.
| GreenHaven Continuous Commodity Index Fund | ||||||
| By: | GreenHaven | Services LLC, | ||||
| its Managing Owner | ||||||
| By: | ||||||
| Ashmead Pringle | ||||||
| Title: | Director and Chief Executive Officer | |||||
Dated: February 26, 2013 | /s/ Cooper Anderson | |||||
| Name: | Cooper Anderson | |||||
| Title: | Chief Operating Officer (principal financial officer) | |||||
| GreenHaven Continuous Commodity Index Master Fund | ||||||||
| By: | GreenHaven Commodity Services LLC, | |||||||
| its Managing Owner | ||||||||
| By: | /s/ Ashmead Pringle | |||||||
| Name: | Ashmead Pringle | |||||||
| Title: | Director and Chief Executive Officer | |||||||
Dated: February 26, 2013 | /s/ Cooper Anderson | |||||||
| Name: | ||||||||
| Cooper Anderson | ||||||||
| Title: | Chief Operating Officer (principal financial officer) | |||||||
77
84