UNITED STATES SECURITIES AND EXCHANGE COMMISSION
Washington, D.C. 20549
Form 10-K
ANNUAL REPORT PURSUANT TO SECTION 13 OR 15(d)
OF THE SECURITIES EXCHANGE ACT OF 1934
For the fiscal year ended April 3, 2010March 31, 2012
Commission file number 1-14041
HAEMONETICS CORPORATION
(Exact name of registrant as specified in its charter)
| Massachusetts | 04-2882273 | |
(State or other jurisdiction of incorporation or organization) | (I.R.S. Employer Identification No.) | |
400 Wood Road, Braintree, Massachusetts02184-9114 (Address of principal executive offices) | (781) 848-7100 (Registrant’s telephone | |
Securities registered pursuant to Section 12(b) of the Act:
| (Title of Each | (Name of | |||
| Registered) | ||||
| Common stock, $.01 par value per share | New York Stock Exchange | |||
Securities registered pursuant to Section 12(g) of the Act:
None
Indicate by check mark whether the registrant is a well-known seasoned issuer, as defined in Rule 405 of the Securities Act. Yes þ No o
Indicate by check mark whether the registrant is not required to file reports pursuant to Section 13 or 15(d) of the Act. Yes o No þ
Indicate by check mark whether the registrant (1)(1.) has filed all reports required to be filed by Section 13 or 15(d) of the Securities Exchange Act of 1934 during the preceding twelve12 months (or for such shorter period that the registrant was required to file such reports), and (2) (2.) has been subject to suchthe filing requirements for at least the past 90 days. Yes þ No o
Indicate by check mark whether the registrant has submitted electronically and posted on its corporate Website,Web site, if any, every Interactive Data File required to be submitted and posted pursuant to Rule 405 ofRegulation S-T (§ 232.405 of this chapter) during the preceding 12 months (or for such shorter period that the registrant was required to submit and post such files). Yes oþ No o
Indicate by check mark if disclosure of delinquent filers pursuant to Item 405 ofRegulation S-K is not contained herein, and will not be contained, to the best of registrant’s knowledge, in definitive proxy or information statements incorporated by reference in Part III of thisForm 10-K or any amendment to thisform 10-K. þ
Indicate by check mark whether the registrant is a large accelerated filer, an accelerated filer, a non-accelerated filer, or a smaller reporting company. See the definitions of “large accelerated filer,” “accelerated filer” and “smaller reporting company” in Rule12b-2 of the Exchange Act. (Check one):
Large accelerated filer þ | Accelerated filer o | Non-accelerated filer o | Smaller reporting company o | |||||
(Do not check if a smaller reporting company) | ||||||||
Indicate by check mark whether the registrant is a shell Companycompany (as defined inRule 12b-2 of the Act)Exchange Act.). Yes o No þ
The aggregate market value of the voting and non-voting common equity held by non-affiliates of the Registrantregistrant (assuming for these purposes that all executive officers and Directorsdirectors are “affiliates” of the Registrant)registrant) as of September 26, 2009,October 1, 2011, the last business day of the registrant’s most recently completed second fiscal quarter was $1,338,071,042 (based$1,387,470,924(based on the closing sale price of the Registrant’s Common Stockregistrant’s common stock on that date as reported on the New York Stock Exchange).
The number of shares of the registrant’s common stock, $.01 par value common stock outstanding as of April 30, 20102012 was 25,528,179.25,340,448.
Documents Incorporated By Reference
Portions of the Company’s Proxy Statementdefinitive proxy statement for theour Annual Meeting of Shareholders to be held on July 29, 2010,27, 2012 are incorporated by reference in Part III.III of this report.
TABLE OF CONTENTS
Page Number | ||||||||
| Item 1. | ||||||||
| Item 1A. | ||||||||
| Item 1B. | ||||||||
| Item 2. | ||||||||
| Item 3. | ||||||||
| Item 4. | ||||||||
| Item 5. | ||||||||
| Item 6. | ||||||||
| Item 7. | ||||||||
| Item 7A. | ||||||||
| Item 8. | ||||||||
| Item 9. | ||||||||
| Item 9A. | ||||||||
| Item 9B. | ||||||||
| Item 10. | ||||||||
| Item 11. | ||||||||
| Item 12. | ||||||||
| Item 13. | ||||||||
| Item 14. | ||||||||
| Item 15. | ||||||||
| EX-23.1 | ||||||||
| EX-31.1 | ||||||||
| EX-31.2 | ||||||||
| EX-32.1 | ||||||||
| EX-32.2 | ||||||||
ITEM 1. BUSINESS
Company Overview
Haemonetics is a global healthcare company dedicated to providing innovative blood management solutions to our customers. Our comprehensive portfolio of integrated devices, information management, and consulting services offers blood management solutions for each facet of the BusinessOur Company was founded in 1971 and became publicly owned for the first time in 1979. In 1983, American Hospital Supply Corporation (“AHS”) acquired us. When Baxter Travenol Laboratories, Inc. (“Baxter”) acquired AHS in 1985, Baxter divested the Haemonetics business to address antitrust concerns related to the AHS acquisition. As a result, in December 1985, a group of investors that included E. I. du Pont de Nemours and Company and present and former Haemonetics employees purchased us. We were incorporated in Massachusetts in 1985. In May 1991, we completed an initial public offering.Historically, Haemonetics has been a medical device company — a pioneer and market leader in developing and manufacturing automated blood component collection devices and surgical blood salvage devices. Our systems help ensure a safe and adequate blood supply chain, helping improve clinical outcomes and assist blood banks and hospitals in their efforts to operate efficiently and in compliance with regulatory requirements. Our customers arereduce costs for blood and plasma collectors, hospitals, and hospital service providers.patients around the world. We believe that through proper blood management, our products and services help prevent a transfusion to a patient who does not need one and provide the right blood product, at the right time, in the right dose to the patient who does.Several years ago, we recognized that there wasBlood and its components (plasma, platelets, and red cells) have several vital — and frequently life-saving — clinical applications. Plasma is manufactured into pharmaceuticals to treat a need for better managementvariety of illnesses and hereditary disorders such as hemophilia. Red cells treat trauma patients or patients undergoing surgery with high blood loss, such as open heart surgery or organ transplant. Platelets treat cancer patients undergoing chemotherapy. Haemonetics is committed to deliver improved qualityhelping our customers create and clinical outcomes, as well as reduced costs, to hospitalsmaintain a safe and their patients receiving blood transfusions. We identified specific gaps to be addressed, including the need for information technology platforms that spanned theefficient blood supply chain from blood donation to transfusion, devices that could be integrated with information technology platforms, consulting services that could identify and implement best practices in blood management, and transfusion tracking systems to better assess demand and supply. As a result, Haemonetics set a vision to be the global leader in blood management to address our customers’ needs for better blood management. As the blood supply chain is an integral part of healthcare systems globally and impacts both patient care and healthcare costs, under our blood management solutions vision, our customers are better able to achieve their goal to provide the best patient care at optimal costs. While we continue to be a market leader for blood management devices, our more comprehensive vision for blood management solutions, which incorporates information management and services, is both timely and relevant.To achieve our vision, we embarked on a strategy to expand our markets and product portfolio to offer more comprehensive blood management solutions to our customers. Through internal product development and acquisition, we have significantly expanded our product offerings. We now offer devices and related consumables, information technology platforms, and consulting services. Our product portfolio helps hospitals determine blood demand and individual patient treatments, and then implement best practices for blood usage and distribution which are cost effective. For blood and plasma collectors, our product portfolio supports increasing blood supplies, automating manual business processes, and improving efficiencies. Our devices use single-use, proprietary consumables, and these consumable sales represent 87% of our total revenues. By leveraging information technology platforms and consulting services to better understand our customers’ needs, we plan to drive increased utilization of our devices and consumables, creating a significant, recurring revenue stream.Over the next several years, we will continue to add to our value proposition in blood management to ultimately link the blood supply chain from the donor to the patient.Based on our broadened product portfolio and to give clarity to investors on the results of our business, we report revenues for multiple product lines under four global product families: plasma, blood bank, hospital, and software solutions. “Plasma” markets plasma collection devices and consumables. “Blood bank” markets blood collection and processing devices and consumables. “Hospital” markets surgical blood salvage and blood demand diagnostic devices and consumables, and blood distribution systems. The “software solutions” product family consists of information technology platforms and consulting services for blood and plasma collectors and hospitals.Each of our products, platforms, and services can be marketed individually. However, as our blood management solutions vision is to offer integrated solutions for blood supply chain management, our software solutions — that is, information technology platforms and consulting services — can be integrated with the
1
2
Haemonetics was founded in 1971 as a medical device company — a pioneer and market leader in developing and manufacturing automated blood component collection devices and surgical blood salvage devices. In May 1991, we completed an initial public offering and to this day remain an independent company. Several years ago, we embarked on a strategy to expand our markets and product portfolio to offer more comprehensive blood management solutions to our customers. Through internal product development and external acquisitions, we have significantly expanded our product offerings. Our most recent notable completed acquisition was Global Med, which was acquired in fiscal 2010, and significantly expanded our software solution offerings.
In April 2012, we announced two acquisitions that will provide us with a commercial presence in all aspects of the whole blood collection market, consulting servicesa market in which historically we have not meaningfully participated. We entered into a definitive agreement to support best practicesacquire the business assets of the blood collection, filtration and processing product lines of Pall Corporation for $551 million. The blood processing systems and equipment to be acquired are for use in transfusion medicine and include Pall's manufacturing facilities in Covina, California; Tijuana, Mexico; Ascoli, Italy and a portion of Pall's assets in Fajardo, Puerto Rico. Approximately 1,300 employees will be transferred to Haemonetics. We also entered into a definitive agreement to acquire the business assets of Hemerus Medical, LLC, a Minnesota-based company that develops innovative technologies for the collection of whole blood, management.
Today, we offer devices and related consumables, information technology software platforms, and consulting services. By better understanding our customers’ needs, we are creating comprehensive blood management solutions for blood collectors and healthcare systems in more than 97 countries around the Business, weworld.
Industry Segments
We serve three market segments: Plasma fractionators (bio-pharma), Blood Collectors, and Hospitals. We report revenues for multiple product lines:lines under four global product categories: Plasma, Blood Center, Hospital, and Software Solutions. “Plasma” includes plasma collection devices and consumables. “Blood Center” includes blood bank, hospital,collection and software solutions. However, ourprocessing devices and consumables. “Hospital” includes surgical blood salvage and blood demand diagnostic devices and consumables. “Software Solutions” includes information technology platforms and consulting services provided to all three market segments. Although we address our customers' needs through multiple product lines, we manage our business as one operating segment: the design, manufacture, implementation, support and marketing of blood management solutions. Our chief operating decision-maker uses consolidated financial results to make operating and strategic decisions. Design and manufacturing processes, as well as economic characteristics and the regulatory environment in which we operate, are usedlargely the same for all product lines.
The financial information required for the operating segment is included herein in conjunction with our plasma, blood bank,Note 15 of the financial statements, entitled Segment, Geographic and hospital devices. Therefore, to give better clarity to our markets, the following descriptionCustomer Information.
1
Plasma
The Plasma Collection Market for Fractionation
3
We offer “one stop shopping” to our plasma collection customers, enabling them to source from us the full range of products necessary for their plasma collection operations. To that end, in addition to marketing ourand storage, including PCS® brand plasma collection equipment and consumables, we offer plasma collection containers, and intravenous solutions, and tubing sealers necessary for plasma collection and storage. In fiscal year 2010, we introduced an Express protocol for our PCS system that speeds up the donation process, allowing our customers to improve device utilization.
solutions. We also offer a robust portfolio of integrated information technology platforms for plasma customers to manage their donors, operations, and supply chain. eQue® Automated Interview and Assessment automatesOur products automate the donor interview and qualification process. eLynx® Workflow Optimization streamlinesprocess; streamline the workflow process in the plasma center. DMS Donor Management System provides plasma collection centers withcenter; provide the controls necessary to continually assess and evaluate donor suitability,suitability; determine the release-ability ofability to release units collected,collected; and manage unit distribution. The Cash Payment System (CaPS) is ane-commerce application that provides accurate and secure cash dispensation and control for plasma collection centers which pay a fee to their donors. LOGIC is an integrated solution for the warehousing and disposition of plasma products. With our information technology platforms,software solutions, plasma collectors are better able tocan manage processes across the plasma supply chain, react quickly to business dynamics,changes, and identify increased opportunities to reduce costs.
Our plasma disposables product line represented 35.5%, 33.6%, and 36.0% of our total revenue in fiscal 2012, 2011 and 2010, respectively.
The Blood Collection Market for Transfusion
— There are millions of blood donations throughout the world every year that produce blood products for transfusion to surgical, trauma, or chronically ill patients. InPatients typically receive only the U.S. alone, approximately 15 million unitsblood components necessary to treat a particular clinical condition: for example, red cells to surgical patients, platelets to cancer patients, and plasma to trauma victims.
Platelet therapy is frequently used to alleviate the effects of chemotherapy and help patients with bleeding disorders. Red cells are frequently transfused to patients to replace blood lost during surgery. Red cells are collected each year. also transfused to patients with blood disorders, such as sickle cell anemia or aplastic anemia. Plasma, in addition to its role in creating life-saving pharmaceuticals, is frequently transfused to trauma victims and to replace blood volume lost during surgery.
Worldwide demand for blood continuesis expected to continue to rise modestly as the population ages and more patients have need for and access to medical therapies that require blood transfusions. Furthermore, many of the highly populated emerging markets countries are advancing their healthcare coverage, and as greater numbers of people gain access to more advanced medical treatment, additional demand for blood components, plasma derivedplasma-derived drugs, and surgical procedures increases directly. This increasing demand for blood is partially offset by the development of less invasive, lower blood loss procedures. Thus,
Haemonetics is a leader in automated component blood collections. While this worldwide market for blood components is growing modestly insmaller than the low single digits. Over several years tighter donor eligibility requirements to improve blood safety have decreased the number of donors willing or able to donate blood.
4
2
separation process is automated and occurs in “real-time” while a person is donating blood. In this separation method, only the specific blood component targeted is collected, and the remaining components are returned to the blood donor. Among other things, automatedAutomated blood component collection allows significantly more of the targeted blood component to be collected during a donation event. Anevent, especially red cells where our automated system supports collection system comprises an electromechanical device which is fitted for each collection with a consumable, which is a single-use sterile set of chambers and tubing commonly referred to as a “disposable.’’two units from eligible donors.
However, most donations worldwide are non-automated procedures, also referred to as manual or whole blood donations. In this process, whole blood is collected from the donor and then transported to a central laboratory where it is separated into its components: red cells, platelets and plasma. Through the end of fiscal 2012, Haemonetics had not meaningfully participated in this market. The acquisitions announced in April 2012 will accelerate Haemonetics' entry into the whole blood collection market.
Haemonetics’ Automated Blood Collection SystemsCenter Products (reported as “blood bank”center” product line)
We market the MCS® (Multicomponent Collection System) brand system for the automation of platelet collection, including improved platelet yields and patient safety. Our MCS brand systemapheresis equipment which is an apheresis system meaning that it hasdesigned to collect specific blood component collection objectives, returns to the donor the unwanted blood components and replacesreturn the volume of fluids collected with a saline return benefitingunwanted components to the donor. OurThe MCS® automated platelet collection systems collectsystem collects one or more therapeutic “doses” of platelets during a single donation by a volunteer blood donor. As noted above, platelets derived from a non-automated donation of whole blood (also called a manual collection) must be “pooled” together with platelets from 4-7 other donor’s platelets to make a single therapeutically useful dose because platelets are only a very small portion of whole blood volume.
5
Our blood center disposables product line represented 29.7%, 30.0%, and 30.8% of our total revenue in fiscal 2012, 2011 and 2010, respectively.
6
The Transfusion Market for Hospitals
— Loss of blood is common in open heart, trauma, transplant, vascular, and orthopedic procedures, and the need for transfusion of oxygen-carrying red cells to make up for lost blood volume is routine. Prior to the introduction of our technology, patients were exclusively transfused withPatients commonly receive donor blood, from volunteer donors. Donor blood (also referred to as “allogeneic blood”), which carries various potential risks including (1) risk of transfusion with the wrong blood type (the most common cause of transfusion-related death), (2)type; risk of transfusion reactions including death, but more commonly chills, fevers or other side effects that can prolong a patient’s recovery,recovery; and (3) risk of transfusion of blood with a blood-borne disease or infectious agent.
Surgical blood salvage involves the collection of a patient’s own blood during and after surgery, for reinfusion to that patient. In surgical blood salvage, bloodBlood is suctioned from a woundthe surgical site, processed and washed through a centrifuge-based system whichthat yields concentrated red cells available for transfusion back to the patient. This process occurs in a sterile, closed-circuit, single-use consumable set whichthat is fitted into an electromechanical device. We market our surgical blood salvage products to hospital-based medical specialists, primarily cardiovascular, orthopedic, and trauma surgeons, orand to surgical suite service providers.
Haemonetics’ Hospital Products — Haemonetics offers a range of blood management solutions that significantly
3
improve a hospital's systems for acquiring blood, storing it in the hospital, and dispensing it efficiently and correctly. Over the last few years, hospitals have become increasingly important in hospital management as administrators strivemore aware of their need to provide the bestcontrol costs and improve patient care at optimal costs. Despite this trend, there are limitedsafety by managing blood more effectively. Our products and integrated solution platforms which help hospitals assessoptimize performance of blood acquisition, storage, and improve blood management practices, track blood within their own hospital systems, or manage the costs of blood. Likewise, there are limited platforms to help hospitals predict demand for their blood suppliers, the blood collection agencies, and link the blood supply chain from donor to patient. As regulations continue to increase and as hospitals struggle with increasing costs, information technology for blood supply chain management will play an important role in hospital administration.distribution.
The newer cardioPAT brand® system is a surgical blood salvage system targeted to open heart surgeries when there is less blood loss andduring surgery, but where the blood loss continues post-surgery. The OrthoPAT® surgical blood salvage system is targeted to procedures, such as orthopedic, that involve slower, lower volume blood loss that often occurs well after surgery. These systems are designed to remain with the patient following surgery, to recover blood and produce a washed red cell product for
7
autotransfusion. We have recently introduced theTheir Quick-Connect cardioPAT feature whichfeatures permits customers to utilize the blood processing set selectively, depending on the patient’s need.
Our hospital disposables product line represented 16.6%, 18.0%, and 19.2% of our total revenue in fiscal 2012, 2011 and 2010, respectively.
Software Solutions
We offer a range of software consulting services that the blood supply chain is linked from donor to patient.
Integrated Blood Management Solutions — When combining our software solutions with our devices, we meet our goal is to give customers powerful tools for improving blood management while driving growth of our consumables. For example, a hospital may use our consulting services to analyze its blood management practices and recommend changes in practice. Then, the hospital can leverage our devicessystems and services to predictanalyze blood demand,utilization, manage
4
blood inventory, and potentially reduce demand for donated blood. Finally, the hospital can use our newly-released IMPACT®tm Online blood management business intelligence portal to monitor the results of its new blood management practices. The positive patient impact and reduced costs from this integrated blood management approach can be significant. Likewise, by understanding best practices, blood demand, and discreet patient needs, hospitals can more frequently deploy our devices for hemostasis diagnosis and cell salvage to ensure best patient care.
8
While each of our products, platforms, and services can be marketed individually, our blood management solutions vision is to offer integrated closed-loop solutions for blood supply chain management. Our software solutions offerings are described more fully in the— information technology platforms and consulting services — can be combined with our devices and sold through our plasma, blood bank,center, and hospital sales forces.
Our software solutions product family discussions above.
| Marketing/Sales/Distribution |
We market and sell our products to commercial plasma collectors, blood systems and independent blood banks,centers, hospitals and hospital service providers, and national health organizations through our own direct sales force (including full-time sales representatives and clinical specialists) as well as independent distributors. Sales representatives target the primary decision-makers within each of those organizations.
United States
In fiscal year 2010, for the tenth consecutive year, we received the Omega NorthFace ScoreBoard Award for exemplary service to customers. This award is presented to the highest-ranked organizations based on customer ratings of performance against customer expectations in areas such as phone support,on-site2012 operations, technical services,, 2011, and training.
| Outside the United States |
In fiscal year2012, 2011, and 2010 approximately 51.6%, 53.1%, and 52.9%, respectively, of consolidated net revenues were generated through sales tonon-U.S. customers. Our direct sales force in Europe and Asiaoutside the United States includes full-time sales representatives and clinical specialists based in the United Kingdom, Germany, France, Sweden, the Netherlands, Italy, Austria, Hong Kong, Canada, Japan, Switzerland, Czech Republic, China,Europe, Taiwan and Belgium.China. We also use various distributors to market our products in parts of:of Europe, including Russia, South America, the Middle East,
9
Africa, and the Far East. WeAdditionally, we have recently established offices with marketing personnel who work with our distributors in Russia, Lebanon, India and Brazil.
| Research and Development |
Our research and development and engineering (“RD&E”R&D”) centers in the United States and Switzerland ensure that protocol variations are incorporated to closely match local customer requirements. In addition, our Haemonetics Software Solutions also maintains development operations in El Dorado Hills, California; Edmonton, Alberta, CanadaCanada; and Illinois, USA. In April 2010, as part of the integration of the Global Med Technologies, Inc. acquisition, we decided to cease operations in Illinois and move U.S. software solutions development to Global Med’s headquarters in California, USA. With this acquisition we also acquired a software development operation in Limonest, France.
Customer collaboration is also an important part of our technical strength and competitive advantage. These collaboration customers and transfusion experts provide us with ideas for new products and applications, enhanced protocols, and potential test sites as well as objective evaluations and expert opinions regarding technical and performance issues.
The development of blood component separation products and extracorporeal blood typing and screening systems has required us to maintain technical expertise in various engineering disciplines, including mechanical, electrical, software, and biomedical engineering and material science. Innovations resulting from these various engineering efforts enable us to develop systems that are faster, smaller, and more user-friendly, or that incorporate additional features important to our customer base.
Our expenditures for RD&ER&D were $26.4$36.8 million for fiscal year 2010 (4.1%2012 (5.1% of sales) and $23.9net revenues), $32.7 million for fiscal year 2009 (4.0%2011 (4.8% of sales). With the exceptionnet revenues) and $26.4 million (4.1% of the capitalization of software development costs (see Note 17), all RD&Enet revenues) for fiscal 2010. All R&D costs are expensed as incurred. Weincurred and we expect to continue to invest resources in RD&E.
R&D.
In fiscal year 2010, RD&E2012, R&D resources were allocated to supporting a next generation surgical blood salvageorthopedic perioperative autotransfusion device, an automated whole blood collection system, and several other projects to enhance our current product portfolio. We also allocated resources to our Arryx subsidiary for on-going research into nanotechnology applications in the blood typing and screening field. At the end of fiscal year 2010, based on a review of ongoing development plans for our next generation platelet apheresis products (Portico), we have abandoned and written off $12.2 million associated with previously capitalized software development costs. Additionally, in connection with the acquisition of Global Med we elected to no longer market the Symphony blood bank donation management system in favor of Global Med’s El Dorado application. As a result we wrote off the carrying value of the Symphony asset totaling approximately $3.5 million.
| Manufacturing |
Our principal manufacturing operations (equipment, disposables, and solutions) are located in Braintree, Massachusetts; Leetsdale, Pennsylvania; Union, South Carolina; Draper, Utah; Niles, Illinois; and Bothwell, Scotland; and Niles, Illinois. We are also in the process of building additional plasma disposables manufacturing capabilities at our Draper, Utah facility and expect to be validated for manufacturing late in fiscal year 2011.
Scotland.
In general, our production activities occur in controlled settings or “clean room” environments. Each step of the manufacturing and assembly process is quality checked, qualified, and validated. Critical process steps and materials are documented to ensure that every unit is produced consistently and meets performance requirements.
5
Plastics are the principal component of our disposable products. Contracts with our suppliers help mitigate some of the short-term effects of price volatility in this market, however,market. However, increases in the price of petroleum derivatives could result in corresponding increases in our costs to procure plastic raw materials.
Some componentcomponent-sets manufacturing is performed by outside contractors according to our specifications. We maintain important relationships with two Japanese manufacturers that produce finished consumables in Singapore, Japan, and Thailand. Certain parts and components are purchased from various single sources. If
10
necessary, we believe that, in most cases, alternative sources of supply are available, and could be identified and developedsecured within a relatively short period of time. Nevertheless, an interruption in supply could temporarily interfere with production schedules and affect our operations. All of our other equipment and disposable manufacturing sites are certified to the ISO 13485 standard and to the Medical Device Directive allowing placement of the CE mark of conformity.
Each blood processing machine is designed in-house and assembled from components that are either manufactured by us or by others to our specifications. The completed instruments are programmed, calibrated, and tested to ensure compliance with our engineering and quality assurance specifications. Inspection checks are conducted throughout the manufacturing process to verify proper assembly and functionality. When mechanical and electronic components are sourced from outside vendors, those vendors must meet detailed qualification and process control requirements.
| Intellectual Property |
We consider our intellectual property rights to be important to our business. We rely on patent, trademark, copyright, and trade secret laws, as well as provisions in our agreements with third parties to protect our intellectual property rights. We hold patents in the United States and many international jurisdictions on some of our machines, processes, disposables and related technologies. These patents cover certain elements of our systems, including protocols employed in our equipment and certain aspects of our processing chambers and disposables. Our patents may cover current products, products in markets we plan to enter, or products in markets we plan to license, or the patents may be defensive in that they are directed to technologies not currently embodied in our current products. We also license patent rights from third parties that cover technologies that we use or plan to use in our business. To maintain our competitive position, we rely on the technical expertise and know-how of our personnel and on our patent rights. We pursue an active and formal program of invention disclosure and patent application in both the United States and foreign jurisdictions. We own various trademarks that have been registered in the United States and certain other countries.
Our policy is to obtain patent and trademark rights in the U.S. and foreign countries where such rights are available and we believe it is commercially advantageous to do so. However, the standards for international protection of intellectual property vary widely. We cannot assure that pending patent and trademark applications will result in issued patents and registered trademarks, that patents issued to or licensed by us will not be challenged or circumvented by competitors, or that our patents will not be found to be invalid.
| Competition |
We created our technologies and have established a record of innovation and market leadership in each of the areas in which we compete. Although we compete directly with others in individual areas of our business, no other company offers the complete range of integrated solutions designed to meet customers’customers' needs across the entire blood supply chain.
To remain competitive, we must continue to develop and acquire cost-effective new products, information technology platforms, and business services. We believe that our ability to maintain a competitive advantage will continue to depend on a combination of factors. Some factors are largely within our control such as reputation, regulatory approvals, patents, unpatented proprietary know-how in several technological areas, product quality, safety and cost effectiveness and continual and rigorous documentation of clinical performance. Other factors are outside of our control, including regulatory standards, medical standards and the practice of medicine.
In the automated plasma collection markets,market, we principally compete with Fenwal, Inc. on the basis of quality, reliability, ease of use, services and technical features of systems, and on the long-term cost-effectiveness of equipment and disposables. Fenwal, Inc. is an independent company founded in March 2007 when Texas Pacific Group and Maverick Capital, Ltd. acquired the Transfusion Therapies division of Baxter Healthcare Group. In China, the market is populated by local producers of a product that is intended to be similar to ours. Recently, those competitors have expanded to markets beyond China, including Cubainto European and Iran.South American countries.
11
In April 2011, Terumo Medical Corporation, a global competitor in the automated plasma and platelet collection markets, acquired Caridian BCT (formerly Gambro BCT). The resulting entity, Terumo BCT, is one of our major competitors in automated platelet collection. Another major competitor in this area is Fenwal. In the automated platelet collection business, competition is based on continual performance improvement, as measured by the time and efficiency of platelet collection and the quality of the platelets collected. Our major competitors in automated platelet collection are Caridian BCT (formerly Gambro BCT) and Fenwal. Each of these companies has taken a different technological approach in designing their systems for automated platelet collection. In the platelet collection market, we also compete with whole blood collections from which pooled platelets are derived.
6
Caridian BCT and platelet collection markets, weFenwal are also compete against a local company, Terumo Medical Corporation.
In the cell processing market, competition is based on level of automation, labor-intensiveness, and system type (open versus closed). Open systems may be weaker in good manufacturing process compliance. Moreover, blood processed through open systems has a 24 hour24-hour shelf life. We have an open system cell processor as well as a closed system cell processor which gives blood processed through it a 14 day14-day shelf life. We compete with Caridian BCT’sBCT's open systems.
systems in this market.
Within our hospital business, in the diagnostics market, the TEG Thrombelastograph Hemostasis Analyzer is used primarily in the surgical arena. There is oneapplications. One direct competitor, Rotem, with whom we currently compete withROTEM, is a competitor in Europe and beginning in fiscal year 2011 in the United States. Rotem recently received 510k clearance for its device and selected reagents in the U.S. Other competitive technologies include standard coagulation tests thatand platelet function testing. The TEG competes with other laboratory tests based on its ability to provide a complete picture of a patient's hemostasis at a single point in time, and the ability to measure various aspects of hemostasis.
the clinically relevant platelet function for an individual patient.
In the high blood lossintraoperative surgical blood salvage market, competition is based on reliability, ease of use, service, support, and price. Each manufacturer’sFor high-volume platforms, each manufacturer's technology is similar, and our Cell Saver technology competes principally with Medtronic, Fresenius, and Sorin Biomedica. Our newly introducedportfolio includes cardioPAT system is the only washed surgical blood salvage device designed to recover red cellsand OrthoPAT, which can be used intraoperatively for transfusion wherecases in which a relatively low volume of blood loss continues post operatively in heart surgery.
is expected.
In the orthopedic“perioperative” surgical blood salvage market, weour OrthoPAT and cardioPAT systems compete primarily against non-automated processing systems whose end product is an unwashed red blood cell unit for transfusion to the patient. The OrthoPAT system isand cardioPAT systems are the only systemsystems designed for portability and post-operative use that washeswash and concentrate the red cells prior to infusion. A significant portion of a patients' total blood loss can occur postoperatively, especially in total joint replacement surgery, and operates preoperatively. It is designed specifically for use in orthopedic surgeries where a patient often bleeds more slowly, bleeds less, and continues to bleed long after surgery.
this drives the value proposition of the “PAT” systems.
In the software market, we compete with MAK Systems, Mediware, and “home grown” applications. These companies provide software to blood and plasma collectors and to hospitals for managing donors, collections, and blood units. None of these companies competes in other Haemonetics markets.
Our technical staff is highly skilled, but many competitors have substantially greater financial resources and larger technical staffs at their disposal. There can be no assurance that competitors will not direct substantial efforts and resources toward the development and marketing of products competitive with those of Haemonetics.
Significant Customers
12
The JapanJapanese Red Cross Society (JRC) is a significant customer that represented 14.3%13.7% and 14.2% of our net revenues in fiscal year 2010.2012 and 2011, respectively. Additionally, a global healthcare customer ("Customer B") represented approximately 11.0% of our net revenues in fiscal 2012.
| Government Regulation |
The products we manufacture and market are subject to regulation by the Center of Biologics Evaluation and Research (“CBER”) and the Center of Devices and Radiological Health (“CDRH”) of the United States Food and Drug Administration (“FDA”), and othernon-United States regulatory bodies.
All medical devices introduced to the United States market since 1976 are required by the FDA, as a condition of marketing, to secure either a 510(k) pre-market notification clearance or an approved Pre-market Approval Application (“PMA”). In the United States, software used to automate blood center operations and blood collections and to track those components through the system are considered by FDA to be medical devices, subject to 510(k) pre-market notification. Intravenous solutions (blood anticoagulants and solutions for storage of red blood cells) marketed by us for use with our automated systems requires us to obtain from CBER an approved New Drug Application (“NDA”) or Abbreviated New Drug Application (“ANDA”). A 510(k) pre-market clearance indicates FDA’s agreement with an applicant’s determination that the product for which clearance is sought is substantially equivalent to another legally marketed medical device. The process of obtaining a 510(k) clearance involvesmay involve the submission of clinical data and supporting information. The process of obtaining NDA approval for solutions is likely to take much longer than 510(k) approvalsclearances because the FDA review process is more complicated.
The FDA’s Quality System regulations set forth standards for our product design and manufacturing processes, require the maintenance of certain records and provide for inspections of our facilities. There are also certain requirements of state, local
7
and foreign governments that must be complied with in the manufacturing and marketing of our products. We maintain customer complaint files, record all lot numbers of disposable products, and conduct periodic audits to assure compliance with FDA regulations. We place special emphasis on customer training and advise all customers that device operation should be undertaken only by qualified personnel.
The FDA can ban certain medical devices; detain or seize adulterated or misbranded medical devices; order repair, replacement or refund of these devices; and require notification of health professionals and others with regard to medical devices that present unreasonable risks of substantial harm to the public health. The FDA may also enjoin and restrain certain violations of the Food, Drug and Cosmetic Act and the Safe Medical Devices Act pertaining to medical devices, or initiate action for criminal prosecution of such violations.
We are also subject to regulation in the countries outside the United States in which we market our products. ManyThe member states of the European Union (EU) have adopted the European Medical Device Directives, which create a single set of medical device regulations for all EU member countries. These regulations require companies that wish to manufacture and distribute medical devices in EU member countries to obtain CE Marking for their products. Outside of the EU, many of the regulations applicable to our products in such countries are similar to those of the FDA. However, the national health or social security organizations of certain countries require our products to be registered by those countries before they can be marketed in those countries.
We have complied with these regulations and have obtained such registrations.
registrations where we market our products. Federal, state and foreign regulations regarding the manufacture and sale of products such as ours are subject to change. We cannot predict what impact, if any, such changes might have on our business.
We are also subject to various environmental, health and general safety laws, directives and regulations both in the U.S. and abroad. Our operations, like those of other medical device companies, involve the use of substances regulated under environmental laws, primarily in manufacturing and sterilization processes. We believe that sound environmental, health and safety performance contributes to our competitive strength while benefiting our customers, shareholders and employees.
Failure to comply with international, federal and local environmental protection laws or regulations could have an adverse impact upon our business or could require material capital expenditures. We continue to monitor changes in U.S. and international environmental regulations that may present a significant risk to the business, including laws or regulations relating to the manufacture or sale of products using plastics. Action plans are developed to mitigate identified risks.
| Employees |
As of April 3, 2010,March 31, 2012, we employed the full-time equivalent of 2,3272,337 persons assigned to the following functional areas: manufacturing, 913;932; sales and marketing, 405;463; general and administrative, 374;439; research and development, and engineering, 417;237; and quality control and field service, 218.266. We consider our employee relations to be satisfactory.
| Availability of Reports and Other Information |
All of our corporate governance materials, including the Principles of Corporate Governance, the Business Conduct Policy and the charters of the Audit, Compensation, and Nominating and Governance Committees are published on the Investor Relations section of our website at
13
http://www.haemonetics.com/site/content/investor/corp_gov.asp.phx.corporate-ir.net/phoenix.zhtml?c=72118&p=irol-IRHome. On this web site the public can also access, free of charge, our annual, quarterly and current reports and other documents filed or furnished to the Securities and Exchange Commission, or SEC, as soon as reasonably practicable after we electronically file such material with, or furnish it to, the SEC.
8
Financial Information about Foreign and Domestic Operations and Export Sales |
The financial information required by this item is included herein in Note 15 of the financial statements, entitledSegment, Geographic and Customer Information. Sales to the Japanese Red Cross and Customer B accounted for 14.3%13.7% and 11.0% of net revenues in fiscal year 2010.2012, respectively. No other customer accounted for more than 10% of our net revenues. For more information concerning significant customers, see the subheading of Note 2 of the financial statements entitled,Concentration of Credit Risk and Significant Customers.
Cautionary Statement
Regarding Forward-Looking Information
Statements contained in this report, as well as oral statements we make which are prefaced with the words “may,” “will,” “expect,” “anticipate,” “continue,” “estimate,” “project,” “intend,” “designed,” and similar expressions, are intended to identify forward looking statements regarding events, conditions, and financial trends that may affect our future plans of operations, business strategy, results of operations, and financial position. These statements are based on our current expectations and estimates as to prospective events and circumstances about which we can give no firm assurance. Further, any forward-looking statement speaks only as of the date on which such statement is made, and we undertake no obligation to update any forward-looking statement to reflect events or circumstances after the date on which such statement is made. As it is not possible to predict every new factor that may emerge, forward-looking statements should not be relied upon as a prediction of our actual future financial condition or results. These forward-looking statements, like any forward-looking statements, involve risks and uncertainties that could cause actual results to differ materially from those projected or anticipated. Such risks and uncertainties include technological advances in the medical field and our standards for transfusion medicine and our ability to successfully implement products that incorporate such advances and standards, product demand and market acceptance of our products, regulatory uncertainties, the effect of economic and political conditions, the impact of competitive products and pricing, the impact of industry consolidation, foreign currency exchange rates, changes in customers’ ordering patterns, the effect of industry consolidation as seen in the plasma market, the effect of communicable diseases, and the effect of uncertainties in markets outside the U.S. (including Europe and Asia) in which we operate.operate and such other risks described under Item 1A. Risk Factors included in this report. The foregoing list should not be construed as exhaustive.
9
ITEM 1A. RISK FACTORS
Set forth below are the risks that we believe are material to our investors. This section contains forward-looking statements. You should refer to the explanation of the qualifications and limitations on forward-looking statements beginning on page 159 and 46.38.
If we are unable to successfully expand our business,product lines through internal research & development and acquisitions, our business may be materially and adversely affected.
Continued growth of our business depends on our maintaining a pipeline of profitable new products and successful improvements to our existing products. This requires accurate market analysis and carefully targeted application of intellectual and financial resources toward technological innovation or acquisition of new products. The creation and adoption of technological advances is only one step. We must also efficiently develop the technology into a product which confers a competitive advantage, represents a cost effective solution or provides improved clinical outcomes. The risks of missteps and set backs are an inherent part of the innovation and development processes in the medical device industry.
If we are unable to successfully grow our business through marketing partnerships and acquisitions, our business may be materially and adversely affected.
Promising partnerships and acquisitions may not be completed for reasons such as competition among prospective partners or buyers, our inability to reach satisfactory terms, or the need for regulatory approvals. Any acquisition that we complete may be dilutive to earnings and require that we invest significant resources. We may not be able to integrate any acquired businesses successfully into our existing business, make such businesses profitable, or realize anticipated market growth or cost savings. The current economic environment may constrain the company’sour ability to access the capital that may be needed for acquisitions and other capital investments.
Failure to integrate acquired businesses into our operations successfully could adversely affect our business.
The implementation of healthcare reform in the United States may adversely affect us.
The Patient Protection and Affordable Health Care Act was enacted into law in the U.S. in March 2010. This legislation includes a provision that imposes a 2.3% excise tax on the sale of certain medical devices by a manufacturer, producer or importer of such devices in the United States starting after December 31, 2012. While we are waiting for further regulations to be established, we continue to evaluate the potential impact that this tax may have on our overall business. U.S. net sales represented approximately 48.4% of our worldwide sales in fiscal 2012 and, therefore, this tax burden may have a material impact on our results of operations.
An interruption in our ability to manufacture our products or an inability to obtain key components or raw materials may adversely affect our business.
Certain key products are manufactured at single locations, with limited alternate facilities. If an event occurs that results in damage to one or more of our facilities, we may be unable to successfully keep pace with technological advancesmanufacture the relevant products at previous levels or at all. In addition, for reasons of quality assurance or cost effectiveness, we purchase certain components and raw materials from sole suppliers. Due to the stringent regulations and requirements of the FDA and other similar non-U.S. regulatory agencies regarding the manufacture of our products, we may not be able to quickly establish additional or replacement sources for certain components or materials. A reduction or interruption in the medical field and the standards for transfusion medicine,manufacturing, or an inability to secure alternative sources of raw materials or components, could have a material adverse effect on our business, results of operations, financial condition and results of operationcash flows.
We may incur significant debt in the future which could be adversely affected.affect our financial health and may result in restrictions on our operations.
We may need to incur debt in the future, for example, to acquire complementary businesses. Our indebtedness would increase certain risks, including but not limited to the inability to satisfy our obligations with respect to our debt instruments, our inability to adjust to adverse economic conditions, our inability to fund future working capital, capital expenditures, acquisitions and other general corporate requirements, and our inability to generate sufficient funds to cover required interest payments. The successterms of our products will depend upon debt agreements may include covenants which could impose restrictions on our operations and limit
10
our ability to anticipate and meet the needs of the medical field, particularly those who practice transfusion medicine. Additionally, we must be able to
14
As a medical device manufacturer we are subject to a number of existing laws and regulations. Non-compliance with those laws or regulations could adversely affect our financial condition and results of operations.
The manufacture, distribution and marketing of our products are subject to regulation by the FDA and othernon-United States regulatory bodies. Some regulatory authorities outside the United States may have a bias in favor of locally produced goods that could delay or prevent our achieving regulatory approval to market our products in such geographies. We must obtain specific regulatory clearance prior to selling any new product or service, a process which is costly and ourtime consuming. Our operations are also subject to continuous review and monitoring by the FDA and other regulatory authorities. The process of obtaining approvalFailure to market and distributesubstantially comply with applicable regulations could subject our products is costlyto recall or seizure by government authorities, or an order to suspend manufacturing activities. As well, if our products were determined to have design or manufacturing flaws, this could result in their recall or seizure. Either of these situations could also result in the imposition of fines.
As a majority of our revenue comes from outside the United States, we are subject to export and time-consuming. import restrictions, local regulatory authorities and the laws and medical practices in foreign jurisdictions.
Export of U.S. technology or goods manufactured in the United States to some jurisdictions requires special U.S. export authorization or local market controls that may be influenced by factors, including political dynamics, outside our control. Changes in privacy regulations and other developments in human subjects clinical trials could make it more difficult and more expensiveRegulations relating to conduct clinical trials necessary for product approval. Regulations about the use of certain materials in the manufacture of our products could also require us to convert our production to alternate material(s), which may be more costly or less effective. The number of eligible blood donors is influenced by government regulations (including travel restrictions, health history, etc.) and other economic and sociological factors. Changes in donation related regulations could have significant immediate effects on the population of eligible donors.
Many of our competitors have significantly greater financial and other resources. Their greater financial resources may allow them to more rapidly develop new technologies and more quickly address changes in customer requirements.
Although no one company competes with us across our full line of products, we face competition in each of our product lines. Our ability to remain competitive depends on a combination of factors. Certain factors including thoseare within our control (reputation,such as reputation, regulatory approvals, patents, unpatented proprietary know-how in several technological areas, product quality, safety, cost effectiveness and continued rigorous documentation of clinical performance) as well asperformance. Other factors are outside of our control (regulatorysuch as regulatory standards, medical standards, reimbursement policies and practices, and the practice of medicine). Also, salesmedicine.
Loss of unauthorized copiesa significant customer could adversely affect our business.
The Japanese Red Cross Society (JRC) is a significant customer that represented 13.7% of our products by local competitorsrevenues in Chinafiscal 2012. Additionally, a global healthcare customer ("Customer B") represented approximately 11.0% of our net revenues in fiscal 2012. Because of the size of these relationships we could experience a significant reduction in revenue if the JRC or Customer B decided to significantly reduce its purchases from us for any reason including a desire to rebalance its purchases between vendors, or if we are unable to obtain and maintain necessary regulatory approvals in Japan. We also have a concentration of credit risk due to our outstanding accounts receivable balances with the JRC and Customer B.
Current or worsening economic conditions may adversely affect our business and financial condition.
A portion of our trade accounts receivable outside the demandUnited States include sales to government-owned or supported healthcare systems in several countries, which are subject to payment delays. Payment is dependent upon the financial stability and price paidcreditworthiness of those countries’ national economies. We have not incurred significant losses on government receivables. We continually evaluate all government receivables for potential collection risks associated with the availability of government funding and reimbursement practices. If the financial condition of customers or the countries’ healthcare systems deteriorate such that their ability to make payments is uncertain, allowances may be required in future periods.
Deteriorating credit and economic conditions in parts of Western Europe, particularly in Italy where our products.net accounts receivable is $21.0 million as of March 31, 2012, may increase the average length of time it takes us to collect our accounts receivable in certain regions within these countries.
As a global corporation, we are exposed to fluctuations in currency exchange rates, which could adversely affect our cash flows and results of operations.
International revenues and expenses account for a substantial portion of our revenues,operations and we intend to continue expanding our presence in international markets. In fiscal year 2010,2012, our international revenues accounted for 52.9%51.6% of our total revenues. The exposure to fluctuations in currency exchange rates takes different forms. Reported revenues for sales, madeas well as manufacturing and operational costs, denominated in foreign currencies by our international businesses, when translated into U.S. dollars for financial reporting purposes, fluctuate due to exchange rate movement. Fluctuations in exchange rates could adversely affect our profitability in U.S. dollars of products and services sold by us into international markets, where payment for our products and services and related manufacturing and operational costs is made in local currencies.
15
We are subject to the risks associated with communicable diseases. A significant outbreak of a disease could reduce the
11
demand for our products and affect our ability to provide our customers with products and services.
An eligible donor’s willingness to donate is affected by concerns about their personal health and safety. Concerns about communicable diseases (such as pandemic flu, SARS, or HIV) could reduce the number of donors, and accordingly reduce the demand for our products for a period of time. A significant outbreak of a disease could also affect our employees’ ability to work, which could limit our ability to produce product and service our customers.
There is a risk that the Company’s intellectual property may be subject to misappropriation in some countries.
Certain countries, particularly China, do not enforce compliance with laws that protect intellectual property (“IP”) rights with the same degree of vigor as is available under the U.S. and European systems of justice. Further, certain of the Company’s IP rights are not registered in China, or if they were, have since expired. This may permit others to produce copies of products in China that are not covered by currently valid patent registrations. There is also a risk that such products may be exported from China to other countries.
In order to aggressively protect our intellectual property throughout the world, we have a program of patent disclosures and filings in markets where we conduct significant business. While we believe this program is reasonable and adequate, the risk of loss is inherent in litigation as different legal systems offer different levels of protection to intellectual property, and it is still possible that even patented technologies may not be protected absolutely from infringement.
Pending and future intellectual property litigation could be costly and disruptive to us.
We operate in an industry that is susceptible to significant intellectual property litigation. We are currently pursuing intellectual property infringement claims described in more detail under Item 3. Legal Proceedings and Note 10- Commitments and Contingencies to our fiscal 2012 consolidated financial statements included in Item 8 of this Annual Report. Intellectual property litigation is expensive, complex and lengthy and its outcome is difficult to predict. Patent litigation may result in adverse outcomes and could significantly divert the attention of our technical and management personnel.
We sell our products in certain emerging economies.
Emerging economies, such as Brazil, Russia, India and China, have less mature product regulatory systems, and can have more volatile financial markets. In addition, government controlled health care systems’ willingness or ability to invest in our products and systems may abruptly change due to changing government priorities or funding capacity. Our ability to sell products in these economies is dependent upon our ability to hire qualified employees or agents to represent our products locally, and our ability to obtain the necessary regulatory approvals in a less mature regulatory environment. If we are unable to retain qualified representatives or maintain the necessary regulatory approvals, we will not be able to continue to sell products in these markets. We are exposed to a higher degree of financial risk, if we extend credit to customers in these economies.
In many of the international markets in which we do business, including certain parts of Europe, South America, the Middle East, Russia and Asia, our employees, agents or distributors offer to sell our products in response to public tenders issued by various governmental agencies. Selling
There is additional risk in selling our products through agents or distributors, particularly in public tenders, can expose the Company to a higher degree of risk. Our agents and distributors are third parties who we retain to work in developing markets. We retain these agents or distributors after completing due diligence on their capabilities and background. However, agents and distributors are independent third parties.tenders. If they misrepresent our products, do not provide appropriate service and delivery, or commit a violation of local or U.S. law, our reputation could be harmed, and we could be subject to fines, sanctions or both. We also conduct diligent examinations of businesses we have targeted for acquisition or other business combinations. However, confidentiality obligations and compressed timeframes for completing these examinations may constrain our ability to fully discover and resolve all risks attendant to the operation of the target’s business until after closing of the transaction.
We have a complex international supply chain.
Any disruption to one or more of our suppliers’ production or delivery of sufficient volumes of subcomponents conforming to our specifications could disrupt or delay our ability to deliver finished products to our customers. For example, we purchase components in Asia for use in manufacturing in the United States and Scotland. We also regularly ship finished goods from Scotland to Europe and Asia.
Plastics are the principal component of our disposables, which are the main source of our revenues.
16
The technologies that cover our products are the subject of active patent prosecution.
There is a risk that one or more of our products may be determined to infringe a patent held by another party. If this were to occur we may be subject to an injunction or to payment of royalties, or both, which may adversely affect our ability to market the affected product(s). In addition, competitors may patent technological advances which may give them a competitive advantage or create barriers to entry.
12
Our products are made with materials which are subject to regulation by governmental agencies.
Environmental regulations may prohibit the use of certain compounds in products we market and sell into regulated markets. If we are unable to substitute suitable materials into our processes, our manufacturing operations may be disrupted. In addition, we may be obligated to disclose the origin of certain materials used in our products, including but not limited to metals mined from locations which have been the site of human rights violations.
We are entrusted with sensitive personal information relating to surgical patients, blood donors, employees and other persons in the course of operating our business and serving our customers,customers.
Government agencies require that we implement measures to ensure the integrity and security of such personal data and, in the event of a breach of protocol, that we inform affected individuals. If our systems were not properly designed or implemented, or should suffer a breach of security or an intrusion (e.g., “hacking”) by unauthorized persons, the Company’s reputation could be harmed, and it could incur costs and liabilities to affected persons and enforcement agencies.
17
claims.
Our products are relied upon by medical personnel in connection with the treatment of patients and the collection of blood from donors. In the event that patients or donors sustain injury or death in connection with their condition or treatment, we, along with others, may be sued, and whether or not we are ultimately determined to be liable, we may incur significant legal expenses. These claims may be brought by individuals seeking relief on their own behalf or purporting to represent a class. In addition, product liability claims may be asserted against us in the future based on events we are not aware of at the present time.
In addition, such litigation could damage our reputation and, therefore, impair our ability to market our products or to obtain professional or product liability insurance or cause the premiums for such insurances to increase. We carry product liability coverage. While we believe that the aggregate current coverage is sufficient, there can be no assurance that such coverage will be adequate to cover liabilities which may be incurred. Moreover, we may in the future be unable to obtain product and professional liability coverage in amounts and on terms that we find acceptable, if at all.
Consolidation in the healthcare industry could lead to increased demands for price concessions or the exclusion of some suppliers from certain of our significant market segments, which could have an adverse effect on our business, financial condition and results of operations.
13
ITEM 1B. UNRESOLVED STAFF COMMENTS
None.
ITEM 2. PROPERTIES
Our main facility, which the Company owns, is located on 14 acres in Braintree, Massachusetts. This facility is located in a light industrial park and was constructed in the 1970s. The building is approximately 180,000 square feet, of which 70,000 square feet are devoted to manufacturing and quality control operations, 35,000 square feet to warehousing, 72,000 square feet for administrative and research, development and engineering activities and 3,000 square feet available for expansion. See Note 8 to the financial statements for details of our mortgage on the Braintree facility.
On property throughoutadjacent to the world,Braintree facility the Company leases 43,708 square feet of additional office space. This facility is used for sales, marketing, finance, legal, and other administrative services. Annual lease expense for this facility is $579,131.
The Company leases an 81,929 square foot facility in Leetsdale, Pennsylvania. This facility is used for warehousing, distribution and manufacturing operations supporting our plasma business. Annual lease expense is $365,482 for this facility.
The Company leases 99,931 square feet in Draper, Utah. This facility is used for the manufacturing and distribution of plasma disposable products. Annual lease expense is $483,426.
The Company owns a facility in Union, South Carolina. This facility is used for manufacture of sterile solutions to support our blood center and plasma businesses. The facility is approximately 69,300 square feet.
The company leases a facility in Niles, Illinois, which performs research and manufacturing for the Company. This facility is 16,478 square feet of office and manufacturing space. Annual lease expense is $142,358.
The Company owns a facility in Bothwell, Scotland used to manufacture disposable components for European customers. This facility is approximately 40,200 square feet.
The Company leases 26,264 square feet of office space in Signy, Switzerland. This facility is used for sales, marketing, finance and other administrative services. Annual lease expense for this space is approximately $884,924.
The Company leases 6,214 square feet of space in Tokyo, Japan for sales, marketing, finance and other administrative offices. Annual lease expense is approximately $601,638.
The Company also leases sales, marketing, service, and distribution facilities in locations around the world.
ITEM 3. LEGAL PROCEEDINGS
We are presently engaged in various legal actions, and although our ultimate liability cannot be determined at the present time, we believe that any such liability will not materially affect our consolidated financial position or our results of operations.
Fenwal Patent Infringement
For the past five years, we have a program ofpursued patent disclosures and filings in markets where we conduct significant business. While we believe this program is reasonable and adequate, the risk of loss is inherent in litigation as different legal systems offer different levels of protection to intellectual property, and it is still possible that even patented technologies may not be protected absolutely from infringement.
Currently, we are pursuing a jury found that the Fenwal ALYX system infringed Haemonetics’ patent and awarded us $15.7 millioninfringement action in damages for past infringement. On June 2, 2009, the court ruled that, in addition to paying the damages awarded by the jury, Fenwal must stop selling the ALYX consumable by December 1, 2010 and must pay Haemonetics a 10% royalty on ALYX consumable net sales from January 30, 2009 until December 1, 2010 when the injunction takes effect. In addition, the court awarded pre-judgment interest at 5% on the unpaid damages awarded. On August 19, 2009, an amended judgment was issued under which Haemonetics was awarded $11.3 million for
18
Haemonetics Italia Matter
In April 2008, our subsidiary Haemonetics Italia, Srl. and two of its employees were found guilty by a court in Milan, Italy of charges arising from allegedly improper payments made under a consulting contract with a local physician and in pricing products supplied under a tender from a public hospital. The two employees found guilty in this matter are no longer employed by the Company. On June 14, 2011, the final level appeals court affirmed these verdicts. There are no further appeals available and the convictions are now final. In parallel proceedings concluded contemporaneously in Genoa, Italy,connection with this conviction, our Italian subsidiary is liable to pay a fine of €147,500 and a proportionate share of the same parties were entirely exoneratedcost of all charges. Both matters involved several other individuals and companies and arose in 2004 and 2005, respectively. the proceedings. The final amount has not yet been determined.
14
When the mattersthis matter first arose, our Board of Directors commissioned independent legal counsel to conduct investigations on its behalf. Based upon its evaluation of counsel’scounsel's report, the Board concluded that no disciplinary action was warranted in either case. All Haemonetics parties appealedNeither the guilty verdicts. On March 3, 2010 the first-level appeals court affirmed these verdicts. We are evaluating this decision and considering our options for further appeal. The Milanoriginal ruling andnor its final affirmation has not impacted the Company’sCompany's business in Italy to date. A third proceeding was referred by the Milan court for hearing in Bergamo, Italy. There have been evidentiary hearings, but no material developments in that case.
ITEM 4. REMOVED AND RESERVED
Executive Officers of the Registrant
The information concerning our Executive Officers is as follows. Executive officers are elected by and serve at the discretion of our Board of Directors. There are no family relationships between any director or executive officer and any other director or executive officer of Haemonetics Corporation.
PETER ALLEN(age 51) (age 53) joined our Company in 2003 as President, Donor Division. Mr. Allen was appointed Chief Marketing Officer for Haemonetics in 2008. In October 2011, Mr. Allen was promoted to President, Global Plasma. Prior to joining Haemonetics, Mr. Allen was Vice President of The Aethena Group, a private equity firm providing services to the global healthcare industry. From 1998 to 2001, he held various positions including Vice President of Sales and the Oncology Business at Syncor International, a provider of radiopharmaceutical and comprehensive medical imaging services. Previously, he held executive level positions in sales, marketing and operations in DataMedic, Inc., Enterprise Systems, Inc./HBOC, and Robertson Lowstuter, Inc. Mr. Allen has also worked in sales and marketing at American Hospital Supply Corporation and Baxter International, Inc.
BRIAN CONCANNON(age 52) (age 54) joined our Company in 2003 as President, Patient Division and was promoted to President, Global Markets, in 2006. In 2007, Mr. Concannon was promoted to Chief Operating Officer. In April 2009, Mr. Concannon was promoted to President and Chief Executive Officer and elected to the Haemonetics Board of Directors. Immediately prior to joining the Company, Mr. Concannon was President,
19
Northeast Region, Cardinal Health Medical Products and Services where he was employed since 1998. From 1985 to 1998, he was employed by American Hospital Supply Corporation, Baxter Healthcare Corp. and Allegiance Healthcare in a series of sales and operations management positions of increasing responsibility.
JOSEPH FORISH(age 57) (age 59) joined our Company in 2005 as Vice President, Human Resources. Prior to joining Haemonetics, Mr. Forish held various global human resources leadership roles, including Vice President, Corporate Human Resources for Rohm and Haas Company. Prior to that, Mr. Forish was Vice President, Human Resources for the ConvaTec Division of Bristol-Myers Squibb Company.
MIKAEL GORDON(age 55) (age 56) joined our Company in 2007 as President, Europe and was promoted to President, Global Markets in February 2009. Prior to joining Haemonetics, Mr. Gordon was Regional Executive Manager North & West Europe for GE Healthcare Clinical Systems. From 1997 to 2007 he held various executive positions as Vice President IT, VP Laboratory Products, VP Strategic Planning and VP Global Sales within Amersham Biosciences until the company was acquired by General Electric in 2004. Mr. Gordon has broad international business experience in the healthcare environment and has lived several years outside his home country. Mr. Gordon has a B.Sc. from the Stockholm School of Economics and is a Swedish national. In April 2012, Mr. Gordon informed the Company that he will resign effective June 2012 to accept a senior leadership position at another company.
SUSAN HANLON(age 42) (age 45) joined our Company in 2002 as Vice President and Corporate Controller. In 2004, she was promoted to Vice President Planning and Control, and in 2008, Ms. Hanlon was promoted to Vice President Finance. She presently has responsibility for Controllership, Financial Planning, Tax, and Treasury. Prior to joining Haemonetics, Ms. Hanlon was a partner with Arthur Andersen LLP in BostonBoston.
DAVID HELSEL (age 49) joined our Company as Vice President, Global Manufacturing, in March 2012, and is responsible for worldwide oversight of the Company's manufacturing and supply chain organizations. Mr. Helsel was previously with Covidien, Ltd. for 16 years, where he most recently was Vice President of Operations for the Surgical Solutions global business unit. During his tenure with Covidien, Mr. Helsel's previous roles included Vice President of Operations for the Medical Supplies segment and Global Director of Operational Excellence - Manufacturing. Mr. Helsel holds a BS in Mechanical Engineering from LeTourneau University.
SANDRA JESSE (age 59) joined our Company as Vice President, Chief Legal Officer in September 2011, and is responsible for the company's world-wide Legal, Compliance, Corporate Audit and Controls, and Environmental Health and Safety groups. Ms. Jesse was previously the Executive Vice President and Chief Legal Officer of Blue Cross Blue Shield of Massachusetts, a Partner in the Boston law firm of Choate, Hall and Stewart, and Press Secretary for United States Congressman, Lee Hamilton. She has served on a number of boards and is presently the Chair of the New England Foundation. Ms. Jesse is a former President of the Boston Bar Foundation.
15
MICHAEL KELLY (age 48) joined Haemonetics in July of 2010 as President, North America & Global Plasma. In 2011, his responsibilities were expanded to include the Software and Global Marketing functions, and his title changed to President of North America. Prior to joining Haemonetics, Mr. Kelly was Senior Vice President and General Manager, Infection Prevention, for CareFusion Corporation from 2008 to 2010. From 1999 to 2008, Mr. Kelly served at Cardinal Health in a variety of General Management, Marketing, Business Development, and Sales positions. In 1991, he began his career with Baxter Healthcare as a sales representative. Mr. Kelly graduated from The Ohio State University, Columbus, OH with a Bachelor of Science in Business Administration and an MBA.
CHRISTOPHER LINDOP(age 52) (age 54) joined our Company in January of 2007 as Vice President and Chief Financial Officer. In 2007, Mr. Lindop also assumed responsibility for business development. Mr. Lindop is also responsible for our Software Solutions and Arryx businesses. Prior to joining Haemonetics, Mr. Lindop was Chief Financial Officer at Inverness Medical Innovations, a rapidly growing global developer of advanced consumer and professional diagnostic products from 2003 to 2006. Prior to this, he was Partner in the Boston offices of Ernst & Young LLP and Arthur Andersen LLP and was engagement partner to the Haemonetics account at both firms. Mr. Lindop has no continuing relationship with Ernst & Young that would preclude its continued service as our independent auditor. Additionally, there was a sufficient interval between Mr. Lindop’s work for the Company as our engagement partner and his appointment as CFO to comply with all applicable SEC rules and regulations.LLP.
DR. JONATHAN WHITE(age 50) (age 52) joined our Company in 2008 as Vice President, Research and Development. Dr. White joined Haemonetics from Pfizer, where he held a number of roles including Chief Information Officer, and where he was employed from 1998 to 2008. From 1992 to 1998, he was a
20
management consultant at McKinsey and Company in New York. Dr. White is a Fellow of the Royal College of Surgery in England. He completed his qualifications as a neurosurgeon and worked in both clinical and academic medical settings. In addition, he holds a Masters degree in Computer Science from Cambridge in England, and a Masters degree in Business Administration from INSEAD in France.
16
PART II
ITEM 5. MARKET FOR THE REGISTRANT's COMMON EQUITY, RELATED STOCKHOLDER MATTERS AND ISSUER PURCHASES OF EQUITY SECURITIES
Our common stock is listed on the New York Stock Exchange under the symbol HAE. The following table sets forth for the periods indicated the high and low sales prices of such common stock, which represent actual transactions as reported by the New York Stock Exchange.
| First | Second | Third | Fourth | |||||||||||||
| Quarter | Quarter | Quarter | Quarter | |||||||||||||
Fiscal year ended April 3, 2010: | ||||||||||||||||
| Market price of Common Stock: | ||||||||||||||||
| High | $ | 58.92 | $ | 60.23 | $ | 57.60 | $ | 59.57 | ||||||||
| Low | $ | 46.89 | $ | 52.01 | $ | 51.40 | $ | 52.40 | ||||||||
Fiscal year ended March 28, 2009: | ||||||||||||||||
| Market price of Common Stock: | ||||||||||||||||
| High | $ | 61.29 | $ | 66.97 | $ | 63.27 | $ | 65.33 | ||||||||
| Low | $ | 51.72 | $ | 51.18 | $ | 48.79 | $ | 50.32 | ||||||||
| First Quarter | Second Quarter | Third Quarter | Fourth Quarter | ||||||||||||
| Fiscal year ended March 31, 2012: | |||||||||||||||
| Market price of Common Stock: | |||||||||||||||
| High | $ | 70.20 | $ | 69.18 | $ | 64.58 | $ | 70.32 | |||||||
| Low | $ | 62.42 | $ | 56.03 | $ | 55.01 | $ | 61.85 | |||||||
| Fiscal year ended April 2, 2011: | |||||||||||||||
| Market price of Common Stock: | |||||||||||||||
| High | $ | 60.65 | $ | 59.01 | $ | 64.83 | $ | 66.70 | |||||||
| Low | $ | 52.58 | $ | 50.50 | $ | 53.11 | $ | 57.73 | |||||||
There were approximately 327287 holders of record of the Company’s common stock as of April 3, 2010.March 31, 2012. The Company has never paid cash dividends on shares of its common stock and does not expect to pay cash dividends in the foreseeable future.
17
The following graph compares the cumulative5-year total return provided to shareholders on Haemonetics Corporation’s common stock relative to the cumulative total returns of the S & P&P 500 index and the S & P&P Health Care Equipment index. An investment of $100 (with reinvestment of all dividends) is assumed to have been made in our common stock and in each of the indexes on3/31/20052007 and its relative performance is tracked through3/31/2010.2012.
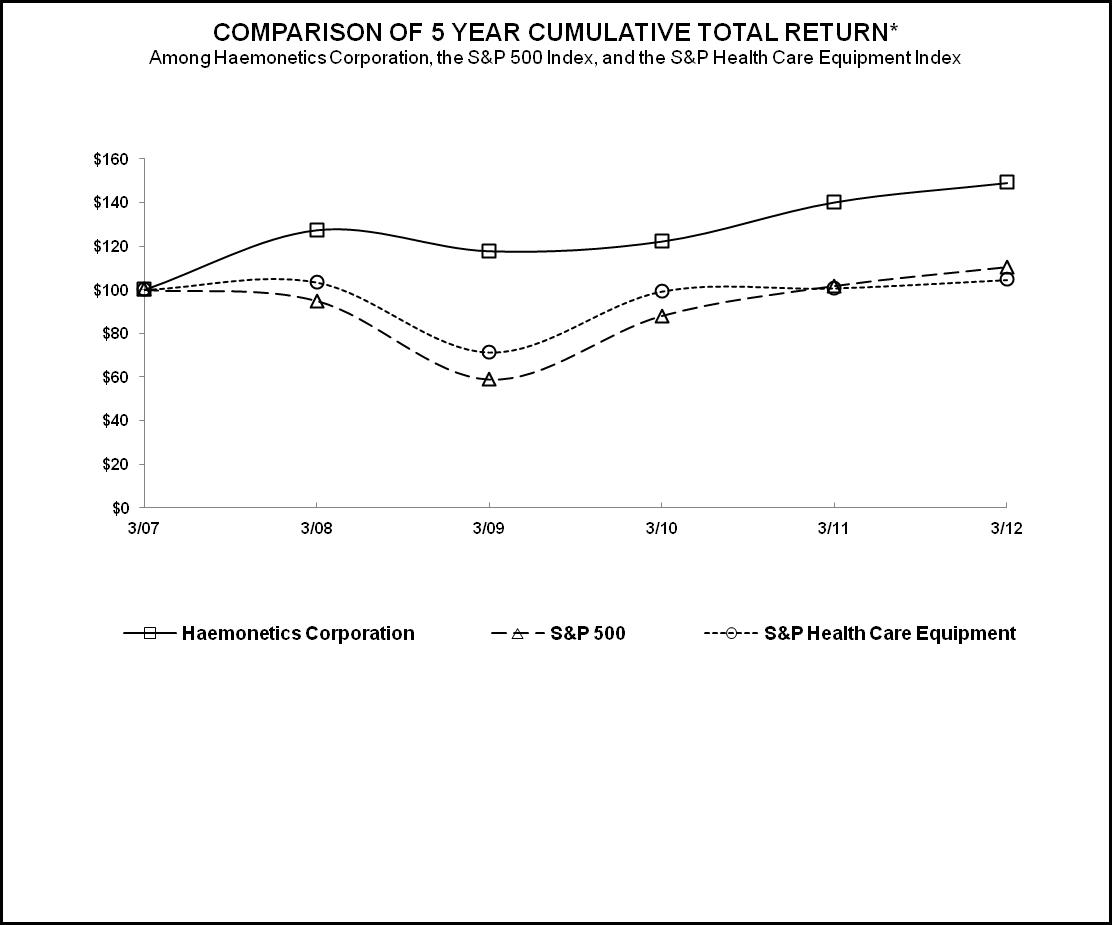

| * | $100 invested on3/31/ Fiscal year | |
Copyright© | ||
| 3/05 | 3/06 | 3/07 | 3/08 | 3/09 | 3/10 | |||||||||||||||||||||||||
Haemonetics Corporation | 100.00 | 120.42 | 110.89 | 141.32 | 130.65 | 135.56 | ||||||||||||||||||||||||
S&P 500 | 100.00 | 111.73 | 124.95 | 118.60 | 73.43 | 109.97 | ||||||||||||||||||||||||
S&P Health Care Equipment | 100.00 | 102.82 | 111.66 | 115.55 | 79.41 | 110.86 | ||||||||||||||||||||||||
| 3/07 | 3/08 | 3/09 | 3/10 | 3/11 | 3/12 | |||||||||||||
| Haemonetics Corporation | 100.00 | 127.44 | 117.82 | 122.25 | 140.19 | 149.05 | ||||||||||||
| S&P 500 | 100.00 | 94.92 | 58.77 | 88.02 | 101.79 | 110.48 | ||||||||||||
| S&P Health Care Equipment | 100.00 | 103.48 | 71.12 | 99.28 | 100.73 | 104.60 | ||||||||||||
The stock price performance included in this graph is not necessarily indicative of future stock price performance.
22
18
ITEM 6. SELECTED FINANCIAL DATA
Haemonetics Corporation and Subsidiaries Five-Year Review
| 2010 | 2009 | 2008 | 2007 | 2006(a) | ||||||||||||||||
| (In thousands, except share and employee data) | ||||||||||||||||||||
| Summary of Operations | ||||||||||||||||||||
| Net revenues | $ | 645,430 | $ | 597,879 | $ | 516,440 | $ | 449,607 | $ | 419,733 | ||||||||||
| Cost of goods sold | $ | 307,949 | $ | 289,709 | $ | 258,715 | $ | 222,307 | $ | 199,198 | ||||||||||
| Gross profit | $ | 337,481 | $ | 308,170 | $ | 257,725 | $ | 227,300 | $ | 220,535 | ||||||||||
| Operating expenses: | ||||||||||||||||||||
| Research, development and engineering | $ | 26,376 | $ | 23,859 | $ | 24,322 | $ | 23,884 | $ | 26,516 | ||||||||||
| Selling, general and administrative | $ | 214,483 | $ | 198,744 | $ | 163,116 | $ | 137,073 | $ | 121,351 | ||||||||||
| Contingent consideration income | $ | (2,345 | ) | — | — | — | — | |||||||||||||
| Asset impairments | $ | 15,686 | — | — | — | — | ||||||||||||||
| Cost to Equity | — | — | — | $ | 225 | $ | 680 | |||||||||||||
| In process research and development | — | — | — | $ | 9,073 | — | ||||||||||||||
| Arbitration & Settlement Income | — | — | — | $ | (5,700 | ) | $ | (26,350 | ) | |||||||||||
| Total operating expenses | $ | 254,200 | $ | 222,603 | $ | 187,438 | $ | 164,555 | $ | 122,197 | ||||||||||
| Operating income | $ | 83,281 | $ | 85,567 | $ | 70,287 | $ | 62,745 | $ | 98,338 | ||||||||||
| Other income (expense), net | $ | (2,011 | ) | $ | (565 | ) | $ | 7,015 | $ | 9,591 | $ | 7,864 | ||||||||
| Income before provision for income taxes | $ | 81,270 | $ | 85,002 | $ | 77,302 | $ | 72,336 | $ | 106,202 | ||||||||||
| Provision for income taxes | $ | 22,900 | $ | 25,698 | $ | 25,322 | $ | 23,227 | $ | 37,806 | ||||||||||
| Net income | $ | 58,370 | $ | 59,304 | $ | 51,980 | $ | 49,109 | $ | 68,396 | ||||||||||
| Income per share: | ||||||||||||||||||||
| Basic | $ | 2.29 | $ | 2.34 | $ | 2.01 | $ | 1.84 | $ | 2.58 | ||||||||||
| Diluted | $ | 2.24 | $ | 2.27 | $ | 1.94 | $ | 1.78 | $ | 2.49 | ||||||||||
| Weighted average number of shares | 25,451 | 25,389 | 25,824 | 26,746 | 26,478 | |||||||||||||||
| Common stock equivalents | 612 | 784 | 922 | 903 | 996 | |||||||||||||||
| Weighted average number of common and common equivalent shares | 26,063 | 26,173 | 26,746 | 27,649 | 27,474 | |||||||||||||||
| (In thousands, except per share and employee data) | 2012 | 2011 | 2010 | 2009 | 2008 | ||||||||||||||
| Summary of Operations | |||||||||||||||||||
| Net revenues | $ | 727,844 | $ | 676,694 | $ | 645,430 | $ | 597,879 | $ | 516,440 | |||||||||
| Cost of goods sold | 358,604 | 321,485 | 307,949 | 289,709 | 258,715 | ||||||||||||||
| Gross profit | 369,240 | 355,209 | 337,481 | 308,170 | 257,725 | ||||||||||||||
| Operating expenses: | |||||||||||||||||||
| Research and development | 36,801 | 32,656 | 26,376 | 23,859 | 24,322 | ||||||||||||||
| Selling, general and administrative | 245,261 | 213,899 | 214,483 | 198,744 | 163,116 | ||||||||||||||
| Contingent consideration income | (1,580 | ) | (1,894 | ) | (2,345 | ) | — | — | |||||||||||
| Asset impairments | — | — | 15,686 | — | — | ||||||||||||||
| Total operating expenses | 280,482 | 244,661 | 254,200 | 222,603 | 187,438 | ||||||||||||||
| Operating income | 88,758 | 110,548 | 83,281 | 85,567 | 70,287 | ||||||||||||||
| Other income (expense), net | 740 | (467 | ) | (2,010 | ) | (565 | ) | 7,015 | |||||||||||
| Income before provision for income taxes | 89,498 | 110,081 | 81,271 | 85,002 | 77,302 | ||||||||||||||
| Provision for income taxes | 22,612 | 30,101 | 22,901 | 25,698 | 25,322 | ||||||||||||||
| Net income | 66,886 | 79,980 | 58,370 | 59,304 | 51,980 | ||||||||||||||
| Income per share: | |||||||||||||||||||
| Basic | $ | 2.64 | $ | 3.19 | $ | 2.29 | $ | 2.34 | $ | 2.01 | |||||||||
| Diluted | $ | 2.59 | $ | 3.12 | $ | 2.24 | $ | 2.27 | $ | 1.94 | |||||||||
| Weighted average number of shares | 25,364 | 25,077 | 25,451 | 25,389 | 25,824 | ||||||||||||||
| Common stock equivalents | 431 | 519 | 612 | 784 | 922 | ||||||||||||||
| Weighted average number of common and common equivalent shares | 25,795 | 25,596 | 26,063 | 26,173 | 26,746 | ||||||||||||||
| 2010 | 2009 | 2008 | 2007 | 2006 | ||||||||||||||||
| Financial and Statistical Data: | ||||||||||||||||||||
| Working capital | $ | 249,646 | $ | 289,530 | $ | 261,757 | $ | 321,654 | $ | 330,288 | ||||||||||
| Current ratio | 2.8 | 4.1 | 3.7 | 4.9 | 4.7 | |||||||||||||||
| Property, plant and equipment, net | $ | 153,298 | $ | 137,807 | $ | 116,484 | $ | 90,775 | $ | 75,266 | ||||||||||
| Capital expenditures | $ | 56,304 | $ | 56,379 | $ | 57,790 | $ | 40,438 | $ | 33,774 | ||||||||||
| Depreciation and amortization | $ | 43,236 | $ | 36,462 | $ | 31,197 | $ | 27,504 | $ | 25,150 | ||||||||||
| Total assets | $ | 760,660 | $ | 649,693 | $ | 608,950 | $ | 572,735 | $ | 545,457 | ||||||||||
| Total debt | $ | 20,651 | $ | 6,038 | $ | 12,363 | $ | 28,876 | $ | 39,153 | ||||||||||
| Stockholders’ equity | $ | 593,124 | $ | 539,884 | $ | 494,188 | $ | 479,648 | $ | 440,564 | ||||||||||
| Return on average equity | 10.30 | % | 11.47 | % | 10.52 | % | 10.67 | % | 17.19 | % | ||||||||||
| Debt as a % of stockholders’ equity | 3.48 | % | 1.12 | % | 2.50 | % | 6.02 | % | 8.89 | % | ||||||||||
| Employees(b) | 2,327 | 2,016 | 1,875 | 1,826 | 1,661 | |||||||||||||||
| Net revenues per employee | $ | 277 | $ | 297 | $ | 275 | $ | 246 | $ | 254 | ||||||||||
| 2012 | 2011 | 2010 | 2009 | 2008 | |||||||||||||||
| Financial and Statistical Data: | |||||||||||||||||||
| Working capital | $ | 396,385 | $ | 340,160 | $ | 250,888 | $ | 289,530 | $ | 261,757 | |||||||||
| Current ratio | 4.0 | 4.1 | 2.9 | 4.1 | 3.7 | ||||||||||||||
| Property, plant and equipment, net | $ | 161,657 | $ | 155,528 | $ | 154,313 | $ | 137,807 | $ | 116,484 | |||||||||
| Capital expenditures | $ | 53,198 | $ | 46,669 | $ | 56,304 | $ | 56,379 | $ | 57,790 | |||||||||
| Depreciation and amortization | $ | 49,966 | $ | 48,145 | $ | 43,236 | $ | 36,462 | $ | 31,197 | |||||||||
| Total assets | $ | 911,135 | $ | 833,264 | $ | 760,928 | $ | 649,693 | $ | 608,950 | |||||||||
| Total debt | $ | 3,771 | $ | 4,879 | $ | 20,520 | $ | 6,038 | $ | 12,363 | |||||||||
| Stockholders’ equity | $ | 732,631 | $ | 686,136 | $ | 593,124 | $ | 539,884 | $ | 494,188 | |||||||||
| Return on average equity | 9.4 | % | 12.5 | % | 10.3 | % | 11.5 | % | 10.5 | % | |||||||||
| Debt as a % of stockholders’ equity | 0.5 | % | 0.7 | % | 3.5 | % | 1.1 | % | 2.5 | % | |||||||||
| Employees | 2,337 | 2,201 | 2,327 | 2,016 | 1,875 | ||||||||||||||
| Net revenues per employee | $ | 311 | $ | 307 | $ | 277 | $ | 297 | $ | 275 | |||||||||
23
19
ITEM 7. MANAGEMENT's DISCUSSION AND ANALYSIS OF FINANCIAL CONDITION AND RESULTS OF OPERATIONS
Our Business
Haemonetics is a blood management solutions company. Anchored by our medical device systems, we also provide information technology platforms and value added services to provide customers with business solutions which support improved clinical outcomes for patients and efficiency in the blood supply chain.
Our medical device systems automate the collection and processing of donated blood;blood components, assess likelihood for blood loss;loss, salvage and process surgical patient blood;blood from surgery patients, and dispense and track blood inventory in the hospital. These systems include devices and single-use, proprietary disposable sets (“disposables”) that operate only with our specialized devices. Specifically, our plasma and blood bankcenter systems allow users to collect and process only the blood component(s) they target — plasma, platelets, or red blood cells — increasing donor and patient safety as well as collection efficiencies. Our blood diagnostics system assesses hemostasis (a patient’s clotting ability) to aid clinicians in assessing the likelihoodcause of a patient’sbleeding resulting in overall reductions in blood loss.product usage. Our surgical blood salvage systems allow surgeons to collect the blood lost by a patient in surgery, cleanse the blood, and make it available for transfusion back to the patient. Our blood tracking systems automate the distribution of blood products in the hospital.
Our business services products include consulting,blood management, Six Sigma, and LEAN manufacturing offerings thatconsulting, which support our customers’ needs for regulatory compliance and operational efficiency in the blood supply chain.
We either sell our devices to customers (resulting in equipment revenue) or place our devices with customers subject to certain conditions. When the device remains our property, the customer has the right to use it for a period of time as long as the customer meets certain conditions we have established, which, among other things, generally include one or more of the following:
| Purchase and consumption of a minimum level of disposables products; | ||
Payment of monthly rental fees; and
An asset utilization performance metric, such as performing a minimum level of procedures per month per device.
Our disposabledisposables revenue stream, (includingwhich includes the sales of disposables and fees for the use of our equipment)equipment, accounted for approximately 86.8%81.7% , 81.5% and 86.0% of our total revenuesrevenue for fiscal year2012, 2011 and 2010, 86.7%respectively.
In April 2012, we announced two acquisitions that will provide us with a commercial presence in all aspects of our total revenuesthe whole blood collection market, a market in which historically we have not meaningfully participated. We entered into a definitive agreement to acquire the business assets of the blood collection, filtration and processing product lines of Pall Corporation for fiscal year 2009,$551 million. The blood processing systems and 86.0%equipment to be acquired are for use in transfusion medicine and include Pall's manufacturing facilities in Covina, California; Tijuana, Mexico; Ascoli, Italy and a portion of our total revenuesPall's assets in Fajardo, Puerto Rico. Approximately 1,300 employees will be transferred to Haemonetics. We also entered into a definitive agreement to acquire the business assets of Hemerus Medical, LLC, a Minnesota-based company that develops innovative technologies for fiscal year 2008.
24
Market Trends
Plasma was the first transfusion market we entered with information technology platforms. As a result, we have a robust portfolio of information technology platforms for plasma customers. Our plasma information technology platforms span the plasma supply chain and include products that manage donor processing, laboratory processing, back office functions, supply chain management, and distribution. Our products include: eQue® Automated Interview and Assessment, eLynx® Workflow Optimization, DMS Donor Management System, CaPS Cash Payment System, LOGIC, and a business intelligence dashboard. With our information technology platforms, plasma collectors are better able to manage processes across the plasma supply chain, react quickly to business dynamics, and identify increased opportunities to reduce costs. For consulting services, we offer customers business solutions to support process excellence, donor recruitment, and business design.Market
25
26
| For the Year Ended | % Increase/ | % Increase/ | ||||||||||||||||||
| April 3, | March 28, | March 29, | (Decrease) | (Decrease) | ||||||||||||||||
| 2010 | 2009 | 2008 | 10 vs. 09 | 09 vs. 08 | ||||||||||||||||
| (In thousands) | ||||||||||||||||||||
| Net revenues | $ | 645,430 | $ | 597,879 | $ | 516,440 | 8.0 | % | 15.8 | % | ||||||||||
| Gross profit | $ | 337,481 | $ | 308,170 | $ | 257,725 | 9.5 | % | 19.6 | % | ||||||||||
% of net revenues | 52.3 | % | 51.5 | % | 49.9 | % | ||||||||||||||
| Operating income | $ | 83,281 | $ | 85,567 | $ | 70,287 | (2.7 | )% | 21.7 | % | ||||||||||
% of net revenues | 12.9 | % | 14.3 | % | 13.6 | % | ||||||||||||||
| Interest expense | $ | (742 | ) | $ | (64 | ) | $ | (377 | ) | >100 | % | (83.0 | )% | |||||||
| Interest income | $ | 399 | $ | 1,968 | $ | 5,418 | (79.7 | )% | (63.7 | )% | ||||||||||
| Other income/(expense), net | $ | (1,668 | ) | $ | (2,469 | ) | $ | 1,974 | (32.4 | )% | >(100 | )% | ||||||||
| Income before taxes | $ | 81,270 | $ | 85,002 | $ | 77,302 | (4.4 | )% | 10.0 | % | ||||||||||
| Provision for income tax | $ | 22,900 | $ | 25,698 | $ | 25,322 | (10.9 | )% | 1.5 | % | ||||||||||
% of pre-tax income | 28.2 | % | 30.2 | % | 32.8 | % | ||||||||||||||
| Net income | $ | 58,370 | $ | 59,304 | $ | 51,980 | (1.6 | )% | 14.1 | % | ||||||||||
% of net revenues | 9.0 | % | 9.9 | % | 10.1 | % | ||||||||||||||
27
Industry consolidation continues among plasma collectors and fractionators. Industry consolidation impacts us when a collector changes the total number of its collection centers, the total number of collections performed per center or changes the plasma collection system (either Haemonetics or a competitive technology) used to perform some or all of those collections.
The newer plasma fractionation facilities are more efficient in their production processes, utilizing less plasma to make similar quantities of pharmaceuticals and vaccines.
Reimbursement guidelines affect the supplydemand for end product pharmaceuticals, although a high off-label use of
20
pharmaceuticals occurs.
Newly approved indications and diagnosis of new patients requiring plasma derived therapies increase the demand balancefor plasma, along with longer lifespans and a growing aging patient population requiring therapy, and bio-pharmaceutical geographical expansion.
Demand for plasma in fiscal 2012 was particularly strong in North America where approximately two-thirds of commercial plasma is collected. While global markets for plasmapheresis have been relatively flat, the U.S. and Europe were relatively stable, with slight over-collection earlymarket in the fiscal year offset by slightly lower collections in the second half of the year. In Japan supply and demand remain in balance. However, the Japanhas declined. The Japanese Red Cross Society will migratehas shifted some of its plasma collections in calendar 2010for fractionation from plasmapheresis to source thatrecovered plasma from plasma recovered from whole blood collections. This change will modestly reducehas reduced demand for automated plasma collections. In Asia, supply and demand remains balanced. Currently, demand for plasma-derived therapies is driving plasma collectionmid-single digit growth of about 4-6% per year.plasma collection.
Blood BankCenter Market
In the blood bankcenter market, we sell products used in the collection of platelets and red cells.
28
Despite modest increases in the demand for platelets in our major markets,Europe and Japan, improved collection efficiencies that increase the yield of platelets per collection and more efficient use of collected platelets have resulted in a flat market for automated collections and related disposables in these related disposables.
countries. With changes in healthcare and social security systems in emerging markets, a larger number of people get access to state of the art medical treatments, which drives the demand for platelet transfusions and represent a faster growing market.
After several years of modest increases in demand for red cell transfusions and a general shortage of volunteer donors, the market in fiscal year 2010 includedrecent years has experienced lower demand for red cells due to slow growth in elective procedures coupled with more available donors due to both changes in regulation and economic conditions.increased focus on better blood management practices. The reduced demand for red cells experienced in fiscal year 2010 adversely impacted our red cell business. WhileAs the baby-boomer population ages, we expect a return to modest increases in demand for red cell business did not grow in fiscal year 2010, we believe thatcells. Furthermore, as blood collectors’ imperativecollectors are forced to improve operating efficiency, reduce costs and maintain regulatory compliance, coupled with an expected return of donor shortages,there will continue to providebe modest growth opportunities for our red cell technology in the future.
Hospital Market
In the hospital market, we sell cardiovascular surgical blood salvage systems, orthopedic surgical blood salvage systems, and a blood diagnostics instrument.
Our Cell Saver brand surgical blood salvage system is aimed atwas designed as a solution for rapid, high volume blood loss procedures, such as cardiovascular procedures.surgeries. This part of the surgical blood salvage market is declining and will probablylikely continue to decline due to improved surgical techniques which minimize blood loss and a decrease in the number of open-heart bypass surgeries performed.less invasive procedures. The cardioPAT system, a surgical blood salvage system targeted at open heart surgeriescardiovascular procedures when there is less blood loss, is designed to meet the market needs created by these improved surgical techniques. The cardioPAT can be used intra-operatively as well as post-operatively when blood loss continues while the patient is in recovery.
Software Market
Our software solutions portfolio addresses many of the critical data collection and data management needs within the plasma, blood center, and hospital markets and is also a key component of our blood management solutions today. In fiscal 2012, the pressures to improve efficiencies, reduce cost, and improve patient outcomes continued to be key drivers in all three market segments.
Demand for our plasma software solution remained steady in fiscal 2012 although we anticipate a sub-segment of this market will continue to migrate towards homegrown proprietary software solutions in an effort to gain unique competitive advantages.
21
In fiscal 2012, within the blood center market, we saw a modest increase in demand for our El Dorado Software Solution Suite even with the continued pricing pressures and trend towards consolidation amongst blood centers in the United States. Interest and demand for our newest product El Dorado Donor continues to grow globally as customers look to upgrade their systems of record to a modern, more flexible, comprehensive platform. Interest and demand remains steady for our Hemasphere, eDonor, and Donor Doc software solutions as centers look for ways to continue to optimize efficiencies within the planning, scheduling, donor recruitment, and data collection process steps associated with a blood drive.
The demand for our flagship blood banking solution, SafeTrace TX, continues to grow steadily within the hospital market. In fiscal 2012 we continued to see demand for reliable, proven safety systems within blood banks even though many hospitals IT organizations were largely focused on meaningful use initiatives. Further growth in this area will be partly dependent on the continued ability for hospitals to leverage our existing full service capabilities to help them effectively and efficiently complete implementations. Interest and demand also continues to grow globally for our remote allocation and point of care transfusion systems, as care providers look for ways to improve efficiencies and meet compliance guidelines for tracking and dispositioning of blood components to patients.
22
Financial Summary
| (In thousands, except per share data) | March 31, 2012 | April 2, 2011 | April 3, 2010 | % Increase/(Decrease) 12 vs. 11 | % Increase/(Decrease) 11 vs. 10 | ||||||||||||
| Net revenues | $ | 727,844 | $ | 676,694 | $ | 645,430 | 7.6 | % | 4.8 | % | |||||||
| Gross profit | $ | 369,240 | $ | 355,209 | $ | 337,481 | 4.0 | % | 5.3 | % | |||||||
| % of net revenues | 50.7 | % | 52.5 | % | 52.3 | % | |||||||||||
| Operating expenses | $ | 280,482 | $ | 244,661 | $ | 254,200 | 14.6 | % | (3.8 | )% | |||||||
| Operating income | $ | 88,758 | $ | 110,548 | $ | 83,281 | (19.7 | )% | 32.7 | % | |||||||
| % of net revenues | 12.2 | % | 16.3 | % | 12.9 | % | |||||||||||
| Other income (expense), net | $ | 740 | $ | (467 | ) | $ | (2,010 | ) | (258.5 | )% | (76.8 | )% | |||||
| Income before taxes | $ | 89,498 | $ | 110,081 | $ | 81,271 | (18.7 | )% | 35.4 | % | |||||||
| Provision for income tax | $ | 22,612 | $ | 30,101 | $ | 22,901 | (24.9 | )% | 31.4 | % | |||||||
| % of pre-tax income | 25.3 | % | 27.3 | % | 28.2 | % | |||||||||||
| Net income | $ | 66,886 | $ | 79,980 | $ | 58,370 | (16.4 | )% | 37.0 | % | |||||||
| % of net revenues | 9.2 | % | 11.8 | % | 9.0 | % | |||||||||||
| Earnings per share-diluted | $ | 2.59 | $ | 3.12 | $ | 2.24 | (17.0 | )% | 39.3 | % | |||||||
Our fiscal year ends on the Saturday closest to the last day of March. Fiscal 2012 and 2011 each includes 52 weeks with each quarter having 13 weeks. Fiscal 2010 includes 53 weeks with each of the first three quarters having 13 weeks and the fourth quarter having 14 weeks. For fiscal 2011, net revenue increased 4.8%. Excluding the effect of the extra week in fiscal 2010, net revenue for fiscal 2011 increased 6.7%.
Net revenue for fiscal 2012 increased 7.6% over fiscal 2011. Without the effects of foreign exchange, net revenue increased 5.6% over fiscal 2011. The increase reflects strong revenue growth from our plasma, blood center, diagnostics businesses and increased equipment and software sales, offset by declines due to a recall of certain of our OrthoPAT devices. Fiscal 2012 revenue growth also benefited from purchases by the Japanese Red Cross in March 2012 to avoid future supply disruptions in anticipation of an internal business system conversion.
Net revenue for fiscal 2011 increased 4.8% over fiscal 2010. Without the effects of foreign exchange, net revenue increased 4.6% over fiscal 2010. The increase noted reflects the positive impact of acquisitions, which contributed 5.3% to revenue growth for fiscal year 2011, as well as strong revenue growth from emerging markets, notably Russia and Asia.
Our gross profit amount increased 4.0% during fiscal 2012. Without the effects of foreign exchange, gross profit increased 1.5% over fiscal 2011. Our gross profit margin percentage decreased by 180 basis points for fiscal 2012 as compared to fiscal 2011. The decrease was primarily due to increased product quality costs and lower overall margin associated with lower sales of higher-margin hospital products and higher sales of lower-margin plasma disposables.
Our gross profit amount increased 5.3% during fiscal 2011. Without the effects of foreign exchange, gross profit increased 5.4%, which was largely driven by higher software sales as a result of the Global Med acquisition and cost improvements in our manufacturing operations. Our gross profit margin percentage improved 20 basis points for fiscal 2011 as compared to fiscal 2010. Increased software sales positively impacted gross margin percentage. These increases were partly offset by increased inventory reserves during fiscal 2011.
Operating expenses increased 14.6% during fiscal 2012 over fiscal 2011. Without the effects of foreign exchange, operating expenses increased 11.2% during fiscal 2012. Higher operating expenses include $3.1 million of expenses, net of insurance recovery, associated with European customer claims arising from a quality matter with our High Separation Core Bowl ("HS Core"), $3.0 million of transaction costs related to the definitive purchase agreements announced in April 2012 with Pall Corporation and Hemerus Medical, LLC, increased restructuring costs, increased investment in research and development and sales and marketing and higher bonus expense.
Operating expenses decreased 3.8% during fiscal 2011 over fiscal 2010. Without the effects of foreign exchange, operating expenses decreased 3.7% during fiscal 2011. Fiscal 2010 included asset write downs totaling $15.7 million related to the abandonment of our next generation platelet apheresis platform and a blood center donation management software product. No similar write downs were experienced in fiscal 2011. The decreases for fiscal 2011 also included a reduction in the expense associated with cash bonus incentive compensation. The decreases were offset by higher operating expenses associated with the
23
Global Med acquisition.
During fiscal 2012, operating income decreased 19.7% compared to fiscal 2011. Without the effects of foreign currency, operating income decreased 20.4% compared to fiscal 2011 as increases in operating expenses more than offset gross profit associated with revenue growth due to higher costs of quality, relatively higher sales of our lower-margin products, expenses associated with European customer claims arising from a quality matter with HS Core, and transaction costs.
During fiscal 2011, operating income increased 32.7% compared to fiscal 2010. Without the effects of foreign currency, operating income increased 32.6% over fiscal 2010. The growth in revenue from our emerging markets, the acquisition of Global Med and lower cash bonus incentive compensation were significant contributors to the improvement in operating income. Additionally, we incurred significant costs in fiscal 2010 related to asset write downs, positively impacting operating income growth as no similar costs were incurred in fiscal 2011.
Net income decreased 16.4% during fiscal 2012. Without the effects of foreign exchange, net income decreased 18.1% for fiscal 2011. The decrease in net income was attributable to the decline in operating income described above.
Net income increased 37.0% during fiscal 2011. Without the effects of foreign exchange, net income increased 36.3% for fiscal 2011. The increases in operating income and lower foreign exchange losses were the principal reasons for the improvement in net income.
24
RESULTS OF OPERATIONS
Net Revenues by Geography
| April 3, | March 28, | March 29, | % Increase | % Increase | ||||||||||||||||
| 2010 | 2009 | 2008 | 10 vs. 09 | 09 vs. 08 | ||||||||||||||||
| (In thousands) | ||||||||||||||||||||
| United States | $ | 303,682 | $ | 279,029 | $ | 232,865 | 8.8 | % | 19.8 | % | ||||||||||
| International | 341,748 | 318,850 | 283,575 | 7.2 | % | 12.4 | % | |||||||||||||
Net revenues | $ | 645,430 | $ | 597,879 | $ | 516,440 | 8.0 | % | 15.8 | % | ||||||||||
| (In thousands) | March 31, 2012 | April 2, 2011 | April 3, 2010 | % Increase/(Decrease) 12 vs. 11 | % Increase/(Decrease) 11 vs. 10 | ||||||||||||
| United States | $ | 352,160 | $ | 317,355 | $ | 303,965 | 11.0 | % | 4.4 | % | |||||||
| International | 375,684 | 359,339 | 341,465 | 4.5 | % | 5.2 | % | ||||||||||
| Net revenues | $ | 727,844 | $ | 676,694 | $ | 645,430 | 7.6 | % | 4.8 | % | |||||||
International Operations and the Impact of Foreign Exchange
Our principal operations are in the U.S., Europe, Japan and other parts of Asia. Our products are marketed in more than 8097 countries around the world viathrough a combination of our direct sales force as well asand independent distributors.distributors and agents.
29
Europe comprisedaccounted for approximately 28.0%25.2%, 29.5%27.6%, and 30.1%28.0% of our total revenues,revenue for fiscal 2012, 2011, and 2010, respectively. TheseInternational sales are primarilygenerally conducted in local currencies, specificallyprimarily the Japanese Yen and the Euro. Accordingly, ourOur results of operations are significantly affectedimpacted by changes in the value of the Yen and the Euro relative to the U.S. dollar. Dollar.
For fiscal year 20102012 as compared to fiscal year 2009,2011, the favorableeffects of foreign exchange resulted in a 2.0% increase in sales. For fiscal 2011 as compared to fiscal 2010, the effects of foreign exchange accounted for a 1.9%0.2% increase in sales. For fiscal year 2009 as compared to fiscal year 2008, the favorable effects of foreign exchange resulted in a 2.8% increase in sales.
Please see section entitled “Foreign Exchange” in management’sthis discussion for a more complete discussionexplanation of how foreign currency affects our business and our strategy to managefor managing this exposure.
Net Revenues by Product Type
| April 3, | March 28, | March 29, | % Increase | % Increase | ||||||||||||||||
| 2010 | 2009 | 2008 | 10 vs. 09 | 09 vs. 08 | ||||||||||||||||
| (In thousands) | ||||||||||||||||||||
| Disposables | $ | 560,318 | $ | 518,101 | $ | 444,130 | 8.1 | % | 16.7 | % | ||||||||||
| Software solutions | 35,919 | 31,605 | 24,173 | 13.7 | % | 30.7 | % | |||||||||||||
| Equipment and other | 49,193 | 48,173 | 48,137 | 2.1 | % | 0.1 | % | |||||||||||||
Net revenues | $ | 645,430 | $ | 597,879 | $ | 516,440 | 8.0 | % | 15.8 | % | ||||||||||
| (In thousands) | March 31, 2012 | April 2, 2011 | April 3, 2010 | % Increase/(Decrease) 12 vs. 11 | % Increase/(Decrease) 11 vs. 10 | ||||||||||||
| Disposables | $ | 594,933 | $ | 551,836 | $ | 555,226 | 7.8 | % | (0.6 | )% | |||||||
| Software solutions | 70,557 | 66,876 | 35,919 | 5.5 | % | 86.2 | % | ||||||||||
| Equipment & other | 62,354 | 57,982 | 54,285 | 7.5 | % | 6.8 | % | ||||||||||
| Net revenues | $ | 727,844 | $ | 676,694 | $ | 645,430 | 7.6 | % | 4.8 | % | |||||||
Disposables RevenueRevenues by Product LineType
| April 3, | March 28, | March 29, | % Increase | % Increase | ||||||||||||||||
| 2010 | 2009 | 2008 | 10 vs. 09 | 09 vs. 08 | ||||||||||||||||
| (In thousands) | ||||||||||||||||||||
| Plasma disposables | $ | 232,378 | $ | 202,176 | $ | 155,219 | 14.9 | % | 30.3 | % | ||||||||||
| Blood bank disposables | ||||||||||||||||||||
| Platelet | 151,026 | 143,420 | 136,148 | 5.3 | % | 5.3 | % | |||||||||||||
| Red Cell | 48,031 | 49,508 | 46,377 | (3.0 | )% | 6.8 | % | |||||||||||||
| Subtotal | 199,057 | 192,928 | 182,525 | 3.2 | % | 5.7 | % | |||||||||||||
| Hospital disposables | ||||||||||||||||||||
| Surgical | 69,942 | 67,697 | 66,250 | 3.3 | % | 2.2 | % | |||||||||||||
| OrthoPAT | 37,079 | 35,419 | 34,301 | 4.7 | % | 3.3 | % | |||||||||||||
| Diagnostic | 21,862 | 19,881 | 5,835 | 10.0 | % | >100 | % | |||||||||||||
| 128,883 | 122,997 | 106,386 | 4.8 | % | 15.6 | % | ||||||||||||||
Total disposables revenue | $ | 560,318 | $ | 518,101 | $ | 444,130 | 8.1 | % | 16.7 | % | ||||||||||
| (In thousands) | March 31, 2012 | April 2, 2011 | April 3, 2010 | % Increase/(Decrease) 12 vs. 11 | % Increase/(Decrease) 11 vs. 10 | ||||||||||||
| Plasma disposables | $ | 258,061 | $ | 227,209 | $ | 232,378 | 13.6 | % | (2.2 | )% | |||||||
| Blood center disposables | |||||||||||||||||
| Platelet | 167,946 | 156,251 | 151,026 | 7.5 | % | 3.5 | % | ||||||||||
| Red cell | 48,034 | 46,828 | 48,031 | 2.6 | % | (2.5 | )% | ||||||||||
| 215,980 | 203,079 | 199,057 | 6.4 | % | 2.0 | % | |||||||||||
| Hospital disposables | |||||||||||||||||
| Surgical | 66,619 | 66,503 | 69,942 | 0.2 | % | (4.9 | )% | ||||||||||
| OrthoPAT | 31,186 | 35,631 | 37,079 | (12.5 | )% | (3.9 | )% | ||||||||||
| Diagnostics | 23,087 | 19,414 | 16,770 | 18.9 | % | 15.8 | % | ||||||||||
| 120,892 | 121,548 | 123,791 | (0.5 | )% | (1.8 | )% | |||||||||||
| Total disposables revenue | $ | 594,933 | $ | 551,836 | $ | 555,226 | 7.8 | % | (0.6 | )% | |||||||
25
Disposables Revenue
Plasma
Plasma disposables revenue increased 13.6% during fiscal 2012. Without the effects of foreign exchange, plasma disposables revenue increased 12.7% during fiscal 2012, primarily due to unitincreased plasma collections by our commercial fractionation customers in North America. We expect collection growth rates to moderate in fiscal 2013. Also, recent contract renewals for the majority of the current commercial plasma business included price decreases which we expect will adversely affect the revenue growth rate for fiscal 2013.
Plasma disposables revenue decreased 2.2% during fiscal 2011. Without the effects of foreign exchange, plasma disposables revenue decreased 1.3% during fiscal 2011. This decrease was driven by lower apheresis plasma collection volume increases resultingin Japan as more plasma was sourced by the Japanese Red Cross as a byproduct from bothits whole blood collections. Additionally, one of our significant customers removed one of its products from the market, and share increases as well as price increases. The market increase is due to the demand for plasma derived pharmaceuticals. Demand for source plasma to make pharmaceuticals grew strongly earlierwhich negatively affected our sales in the yearU.S. and moderated atEurope. Finally, our commercial plasma customers slowed their growth and in some cases reduced collections in the endfirst half of the year.fiscal 2011 following several years of significant growth.
Blood Center
Platelet
Platelet disposables revenue increased 30.3%7.5% during fiscal 2012. ForeignWithout the effect of foreign exchange, resulted in a 1.9% increase over fiscal year 2008. The main reason for the remaining 28.4% increase was unit volume increases resulting from both market and share increases as well as modest price increases.
30
Platelet disposables revenue increased 3.5% during fiscal 2011. Without the effect of market share in Europe.
Red Cell
Red cell disposables revenue increased 2.6% during fiscal year 2008.2012. Without the effecteffects of currency, plateletforeign exchange, red cell disposables revenue increased 2.6% during fiscal 2012, driven primarily by increased account penetration at existing customers for red cells in North America.
Red cell disposables revenue decreased 0.3%2.5% during fiscal 2011. This decrease was due to share loss in both Europe and Japan, as well as challenges in South Korea associated withWithout the significant devaluationeffects of South Korea’s currency, the Won.foreign exchange, red cell disposables revenue decreased 2.0% during fiscal 2011. The decrease was partially offset by strength in North American and China and other emerging markets.
Hospital
Hospital consists of Surgical, OrthoPAT, and regulatory compliance, coupled with an expected return of donor shortages, will continue to provide important growth opportunities for our red cell technology in the future.
Diagnostics products. The hospital product line includes the following brand platforms: the Cell Saver brand, the TEG brand, the OrthoPAT brand and the cardioPAT brand, and the SmartSuction Harmony products. During fiscal year 2010, hospital disposables revenue increased 4.8% compared to fiscal year 2009. Foreign exchange resulted in a 2.2% increase over fiscal year 2009. The remaining increase of 2.6% was the result of increases in each of the product lines as discussed below.brand.
Surgical
during fiscal 2012, due to competitive pressures and a decrease in demand across our European and North American markets associated with lower surgical volumes. During fiscal year 2010, OrthoPAT2012, we introduced the Cell Saver Elite, our next generation surgical device, first in North America and then across all geographies. Based on results observed for the fourth quarter of fiscal 2012, this new device is gaining traction in the marketplace and should positively impact fiscal 2013 surgical disposables
26
revenue increased 4.7% overresults.
Revenue from our surgical disposables decreased 4.9% during fiscal year 2009. Foreign exchange resulted in a 0.7% increase in OrthoPAT revenue.2011. Without the effect of currency,foreign exchange, surgical disposables revenue decreased 4.8% for the fiscal year due to a decrease in demand across our European and North American markets, driven by both competitive pressures and market conditions resulting in fewer surgeries. This decrease was partly offset by strong sales in our emerging markets.
OrthoPAT
Revenue from our OrthoPAT disposables revenue increased 4.0%. Presently North America and Europe are the largest markets for the
31
Diagnostics
Diagnostics product revenue consists of the TEG product lineproducts. TEG revenues increased 18.9% during fiscal year 2008.2012. Without the effect of foreign exchange, diagnostic product revenue increased by 19.2%. The revenue increase is due to continued adoption of our TEG analyzer, including expansion with North American hospitals and sales growth in China.
Revenue from our diagnostics products increased 15.8% during fiscal 2011. Without the effect of foreign exchange, diagnostic product line had salesrevenue increased by 15.7%. The revenue increase is due to new adoption of $19.8 million in fiscal year 2009 as compared to $5.8 million in fiscal year 2008. The TEGthis product, line was added through its acquisition from Haemoscope Corporationparticularly in the third quarter of fiscal year 2008. In the first quarter of fiscal year 2009, Medicell (previously, Haemoscope’s UK distributor) was acquired.United States.
Other Revenues
| April 3, | March 28, | March 29, | % Increase | % Increase | ||||||||||||||||
| 2010 | 2009 | 2008 | 10 vs. 09 | 09 vs. 08 | ||||||||||||||||
| (In thousands) | ||||||||||||||||||||
| Software solutions | $ | 35,919 | $ | 31,605 | $ | 24,173 | 13.7 | % | 30.7 | % | ||||||||||
| Equipment and other | 49,193 | 48,173 | 48,137 | 2.1 | % | 0.1 | % | |||||||||||||
Net revenues | $ | 85,112 | $ | 79,778 | $ | 72,310 | 6.7 | % | 10.3 | % | ||||||||||
| (In thousands) | March 31, 2012 | April 2, 2011 | April 3, 2010 | % Increase/(Decrease) 12 vs. 11 | % Increase/(Decrease) 11 vs. 10 | ||||||||||||
| Software solutions | $ | 70,557 | $ | 66,876 | $ | 35,919 | 5.5 | % | 86.2 | % | |||||||
| Equipment and other | 62,354 | 57,982 | 54,285 | 7.5 | % | 6.8 | % | ||||||||||
| Net other revenues | $ | 132,911 | $ | 124,858 | $ | 90,204 | 6.4 | % | 38.4 | % | |||||||
Software Solutions
Our software solutions revenuesrevenue includes sales of our information technology software platforms and consulting services.
Software solutions revenue increased 5.5% during fiscal 2012. Without the effects of foreign exchange, software solutions revenue increased 4.7% during fiscal 2012. The increase is primarily due to installed base growth in our SafeTraceTX and BloodTrack products.
Software solutions revenue increased 86.2% during fiscal 2011. Without the effects of foreign exchange, software solutions revenue increased 83.3% during fiscal 2011 driven primarily by software revenue associated with the acquisition of Global Med on March 31, 2010 and increased sales of our BloodTrack products.
Equipment & Other
Our equipment & other revenue include revenue from softwareequipment sales, which includes per collection or monthly subscription fees for the license and support of the software as well as hosting services. Equipment and other revenue includes revenues from sales of our devices and services revenues from repairs performed under preventive maintenance contracts or emergency service visits, spare part sales, and various servicesservice and training programs, and licensed technology.
Equipment and other revenue increased 7.5% during fiscal 2012. Without the effect of currency exchange, equipment and other revenue increased 5.2% primarily driven by higher equipment sales in Europe, Asia and Japan, and the launch of the Cell Saver Elite device.
Equipment and other revenue increased 6.8% during fiscal 2011. Without the effect of currency exchange, equipment and other revenue increase 7.6% driven by acquisition related growth from the SEBRA products, which we acquired in September 2009, and growth in our emerging markets.
27
Gross Profit
| (In thousands) | March 31, 2012 | April 2, 2011 | April 3, 2010 | % Increase/(Decrease) 12 vs. 11 | % Increase/(Decrease) 11 vs. 10 | ||||||||||||
| Gross profit | $ | 369,240 | $ | 355,209 | $ | 337,481 | 4.0 | % | 5.3 | % | |||||||
| % of net revenues | 50.7 | % | 52.5 | % | 52.3 | % | |||||||||||
Our gross profit amount increased 4.0% during fiscal year 2010.
Our gross profit amount increased 5.3% during fiscal year 20092011. Without the effects of foreign exchange, gross profit increased 5.4%, which was largely driven by three factors: (1) increasedhigher software sales to commercial plasma customers, (2) increase sales to the U.S. Department of Defense, and (3) the recognition of $2.0 million of revenue, that would otherwise not have been recognizable until fiscal year 2010, in the fourth quarter of fiscal year 2009 as a result of a customer’s decision to forego the option year on a software development contract.
32
| April 3, | March 28, | March 29, | % Increase | % Increase | ||||||||||||||||
| 2010 | 2009 | 2008 | 10 vs. 09 | 09 vs. 08 | ||||||||||||||||
| (In thousands) | ||||||||||||||||||||
| Gross profit | $ | 337,481 | $ | 308,170 | $ | 257,725 | 9.5 | % | 19.6 | % | ||||||||||
Operating Expenses
| (In thousands) | March 31, 2012 | April 2, 2011 | April 3, 2010 | % Increase/(Decrease) 12 vs. 11 | % Increase/(Decrease) 11 vs. 10 | ||||||||||||
| Research and development | $ | 36,801 | $ | 32,656 | $ | 26,376 | 12.7 | % | 23.8 | % | |||||||
| % of net revenues | 5.1 | % | 4.8 | % | 4.1 | % | |||||||||||
| Selling, general and administrative | $ | 245,261 | $ | 213,899 | $ | 214,483 | 14.7 | % | (0.3 | )% | |||||||
| % of net revenues | 33.7 | % | 31.6 | % | 33.2 | % | |||||||||||
| Contingent consideration income | $ | (1,580 | ) | $ | (1,894 | ) | $ | (2,345 | ) | (16.6 | )% | (19.2 | )% | ||||
| % of net revenues | (0.2 | )% | (0.3 | )% | (0.4 | )% | |||||||||||
| Asset writedowns | $ | — | $ | — | $ | 15,686 | — | % | (100.0 | )% | |||||||
| % of net revenues | — | % | — | % | 2.4 | % | |||||||||||
| Total operating expenses | $ | 280,482 | $ | 244,661 | $ | 254,200 | 14.6 | % | (3.8 | )% | |||||||
| % of net revenues | 38.5 | % | 36.2 | % | 39.4 | % | |||||||||||
Research and Development
Research and development increased 12.7% during fiscal 2012, with an immaterial effect of foreign exchange. The increase was primarily related to fiscal year 2009. Major factors impacting the gross margin percent improvement of 80 basis points included foreign exchange, manufacturing efficiencies, and fixed cost leverage. These improvements were partly offset by changes in product mix driven by higher sales of lower gross margin plasma products and aforementionedgeneral increase in spending ondevelopment programs in support of long-term product plans and near-term quality initiatives.improvements.
| % (Decrease) | ||||||||||||||||||||
| April 3, | March 28, | March 29, | % Increase | /Increase | ||||||||||||||||
| 2010 | 2009 | 2008 | 10 vs. 09 | 09 vs. 08 | ||||||||||||||||
| (In thousands) | ||||||||||||||||||||
| Research, development and engineering | $ | 26,376 | $ | 23,859 | $ | 24,322 | 10.5 | % | (1.9 | )% | ||||||||||
% of net revenues | 4.1 | % | 4.0 | % | 4.7 | % | ||||||||||||||
| Selling, general and administrative | $ | 227,824 | $ | 198,744 | $ | 163,116 | 14.6 | % | 21.8 | % | ||||||||||
% of net revenues | 35.3 | % | 33.2 | % | 31.6 | % | ||||||||||||||
| Total operating expense | $ | 254,200 | $ | 222,603 | $ | 187,438 | 14.2 | % | 18.8 | % | ||||||||||
% of net revenues | 39.4 | % | 37.2 | % | 36.3 | % | ||||||||||||||
Selling, General and Administrative
During fiscal year 2010,2012, selling, general and administrative expenses increased 14.6%14.7%. The effect of foreign exchange accounted for an increase of 0.4%. ExcludingWithout the impacteffects of foreign exchange, selling, general and administrative expenseexpenses increased 14.2% for11.8% during fiscal year 2010 as compared to fiscal year 2009.2012. The increase was due largelyattributable to several factors identified below:
33
During the first quarter of fiscal 2012, we received customer complaints in Europe regarding a quality issue with HS Core.
28
Certain of these customers have also made claims regarding financial losses alleged to have been incurred as a result of this matter. As of March 31, 2012, our current best estimate of the liability associated with this matter is $10.0 million. To date, we have recovered approximately $3.7 million of claims paid from our insurance company, and we also determined that an additional $3.2 million is recoverable under our insurance policies and recorded a corresponding insurance receivable within current assets as of March 31, 2012. Receivables for insurance recoveries for product liability claims are recorded as assets, on an undiscounted basis, when it is probable that a recovery will be realized on a claim by claim basis. We have recorded $3.1 million of expenses, net of insurance recovery, within selling, general and administrative expenses for fiscal 2012.
We are also continuing to determine the extent to which the remaining $3.1 million may be recoverable under our insurance policies and will record additional insurance receivables when we determine that recoverability of these claims is probable.
During fiscal 2011, selling, general and administrative expenses decreased 0.3%. The effect of foreign exchange accounted for an increase of 1.5%. ExcludingWithout the impacteffects of foreign exchange, selling, general and administrative expense increased 20.3% forexpenses decreased 3.9% during fiscal 2011. The decrease was attributable to a reduction in cash bonus incentive compensation this fiscal year 2009 as compared to fiscal year 2008. The increasethe Company’s financial results were lower than the financial targets established at the beginning of the year. This decrease was due largely to several factors identified below:offset by expenses associated with newly acquired businesses, SEBRA and Global Med.
Contingent Consideration Income
Under newthe accounting rules for business combinations, (specifically, ASC Topic 805,Business Combinations(formerly known as Statement No. 141(R),Business Combinations)), we established a liability for payments that we might make in the future to former shareholders of the L’Attitude Medical SystemsNeoteric that are tied to the performance of the Blood TrackBloodTrack business for the first three years post acquisition, beginning with fiscal year 2010. During fiscal year2012, 2011 and 2010, this business did not meetachieve the necessary thresholds of performancerevenue growth milestones for the former shareholders to receive additional performance payments andpayments. As such, we recorded an adjustment to the fair value ofreduced the contingent considerationliability by $1.6 million, $1.9 million and $2.3 million during fiscal 2012, 2011 and 2010, respectively, and recorded the adjustments as contingent consideration income in the consolidated statements of $2.3 million.income.
In September 2011, we entered into an agreement to release the Company from the contingent consideration due to the former shareholders of Neoteric. Under the terms of the agreement, the former shareholders of Neoteric received $0.7 million in exchange for releasing the Company from any future claims for contingent consideration. The Company paid the $0.7 million settlement amount during September 2011 and has recorded the associated expense in the selling, general and administrative line item in the accompanying consolidated statements of income.
Asset ImpairmentsWrite Downs
34
| April 3, | March 28, | March 29, | % Decrease | % Increase | ||||||||||||||||
| 2010 | 2009 | 2008 | 10 vs. 09 | 09 vs. 08 | ||||||||||||||||
| (In thousands) | ||||||||||||||||||||
| Operating Income | $ | 83,281 | $ | 85,567 | $ | 70,287 | (2.7 | )% | 21.7 | % | ||||||||||
% of net sales | 12.9 | % | 14.3 | % | 13.6 | % | ||||||||||||||
Other income (expense), net, increased during fiscal 2012 primarily due to lower foreign exchange transaction losses on foreign currency denominated assets.
| % Increase | ||||||||||||||||||||
| April 3, | March 28, | March 29, | /Decrease | % Decrease | ||||||||||||||||
| 2010 | 2009 | 2008 | 10 vs. 09 | 09 vs. 08 | ||||||||||||||||
| (In thousands) | ||||||||||||||||||||
| Interest expense | $ | (742 | ) | $ | (64 | ) | $ | (377 | ) | >100 | % | (83.0 | )% | |||||||
| Interest income | $ | 399 | $ | 1,968 | $ | 5,418 | (79.7 | )% | (63.7 | )% | ||||||||||
| Other (expense)/income, net | $ | (1,668 | ) | $ | (2,469 | ) | $ | 1,974 | (32.4 | )% | >(100 | )% | ||||||||
Total other (expense)/income, net | $ | (2,011 | ) | $ | (565 | ) | $ | 7,015 | >100 | % | >(100 | )% | ||||||||
Taxes
35
| March 31, 2012 | April 2, 2011 | April 3, 2010 | % Increase/(Decrease) 12 vs. 11 | % Increase/(Decrease) 11 vs. 10 | ||||||||||
| Reported income tax rate | 25.3 | % | 27.3 | % | 28.2 | % | (2.0 | )% | (0.9 | )% | ||||
| Tax Rate | Tax Rate | |||||||||||||||||||
| April 3, | March 28, | March 29, | Decrease | Decrease | ||||||||||||||||
| 2010 | 2009 | 2008 | 10 vs. 09 | 09 vs. 08 | ||||||||||||||||
Reported Tax Rate | 28.2 | % | 30.2 | % | 32.8 | % | (2.0 | )% | (2.6 | )% | ||||||||||
Our reported tax rate includes two principal components: an expected annualis lower than the federal statutory tax rate in all reported periods primarily due to lower foreign taxes, including tax benefits associated with our Swiss operations.
29
The effective annual rate of 25.3% for fiscal 2012 reflects tax benefits and discrete items resultingexpenses from foreign taxes, domestic manufacturing deduction, state provisions, and stock compensation not deductible in all jurisdictions. In addition, we recognized a benefit in finalizing our prior year return and adjusting the realizability of certain deferred tax assets. There was an increase due to additional tax reserves for unrecognized tax benefits in various tax matters.
The effective annual rate of 27.3% for fiscal 2011 reflects tax benefits and expenses from foreign taxes, domestic manufacturing deduction, state provisions, or benefits that are recordedand stock compensation not deductible in all jurisdictions. In addition, we recognized a benefit due to the remittance of European dividends, and for the expiration of foreign and federal statutes. There was an increase for potential foreign and federal tax assessments recognized in the quarter that an event arises. Events or items that give rise to discrete recognition include finalizing audit examinations for open tax years, a statute of limitation’s expiration, or a stock acquisition.year.
Critical Accounting Policies
Our significant accounting policies are summarized in Note 2 of our consolidated financial statements. While all of these significant accounting policies impact our financial condition and results of operations, we view certain of these policies as critical. Policies determined to be critical are those policies that have the most significant impact on our financial statements and require management to use a greater degree of judgmentand/or estimates. Actual results may differ from those estimates.
The accounting policies identified as critical are as follows:
Revenue Recognition
36
delivery, including customer acceptance, has occurred or services have been rendered, the price is fixed or determinable and collectibilitycollectability is reasonably assured. When more than one element such as equipment, disposables and services are contained in a single arrangement, we allocate revenue between the elements based on each element’s relative fair value,selling price, provided that each element meets the criteria for treatment as a separate unit of accounting. An item is considered a separate unit of accounting if it has value to the customer on a stand alone basis and there is objective and reliable evidence of the fair value of the undelivered items.stand-alone basis. The fair valueselling price of the undelivered elements is determined by the price charged when the element is sold separately, which constitutes vendor specific objective evidence as defined under under ASC Topic985-605, or in cases when the item is not sold separately, by otherthird-party evidence of selling price or by management's best estimate of selling price. For our software arrangements accounted for under the provisions of ASC 985-605, Software, we establish fair value of undelivered elements based upon vendor specific objective evidence as defined in ASC Topic 605.
evidence.
We generally do not allow our customers to return products. We offer sales rebates and discounts to certain customers. We treat sales rebates and discounts as a reduction of revenue and classify the corresponding liability as current. We estimate rebates for products where there is sufficient historical information available to predict the volume of expected future rebates. If we are unable to estimate the expected rebates reasonably, we record a liability for the maximum potential rebate or discount that could be earned.
We generally recognize revenue from the sale of perpetual licenses on a percentage-of-completion basis which requires us to make reasonable estimates of the extent of progress toward completion of the contract. These arrangements most often include providing customized implementation services to our customer. We also provide other services, including in some instances hosting, technical support, and maintenance, for the payment of periodic, monthly, or quarterly fees. We recognize these fees and charges as earned, typically as these services are provided during the contract period.
Inventories
Inventories are stated at the lower of the actual cost to purchaseand/or manufacture or the current estimated market value of the inventory. On a quarterly basis, inventory quantities on hand are reviewed and an analysis of the provision for excess and obsolete inventory is performed based primarily on our estimates of product demand and production requirements for the next twenty-four months. A change in the estimated timing or amount of demand for our products could result in additional provisions for excess inventory quantities on hand. Any significant unanticipated changes in demand could have a significant impact on the value of our inventory and reported operating results.
Goodwill and Other Intangible Assets
Intangible assets acquired in a business combination, including licensed technology, are recorded under the purchase method of accounting at their estimated fair values at the date of acquisition. Goodwill represents the excess purchase price over the fair value of the net tangible and other identifiable intangible assets acquired. We amortize our other intangible assets over their useful lives using the estimated economic benefit method, as applicable.
Goodwill and certain other intangible assets, determined to have an indefinite life, areis not amortized. Instead these assets aregoodwill is reviewed for impairment at least annually in accordance with ASC Topic 350,
30
Intangibles — Goodwill and Other(formerly known as Statement No. 142,Goodwill and Other Intangible Assets). We perform our annual impairment test on the first day of ourthe fiscal fourth quarter. We have threequarter for each of our reporting units. The test is based on a discounted cash flow analysis for each reporting unit. The test showed no evidence of impairment to our goodwill and other indefinite lived assets for either fiscal year2012, 2011 or 2010 or 2009 and demonstrated that the fair value of each reporting unit significantly exceeded the reporting unit’s carrying value in each period.
We review our intangible assets, subject to amortization, and their related useful lives at least once a yearperiodically to determine if any adverse conditions exist that would indicate the carrying value of these assets may not be recoverable. We conduct more frequent impairment assessments ifOur review includes examination of whether certain conditions exist, including: a change in the competitive landscape, any internal decisions to pursue new or different technology strategies, a loss of a significant customer, or a significant change in the market place including changes in the prices paid for our products or changes in the size of the market for our products.
An impairment loss results if the carrying value of the asset exceeds the estimated fair value of the asset. Fair value is determined using different methodologies depending upon the nature of the underlying asset. If the estimate of an intangible asset’s remaining useful life is changed, the remaining carrying amount of the intangible asset is amortized prospectively over the revised remaining useful life.
37
Property, Plant and Equipment
Property, plant and equipment are depreciated over their useful lives. Useful lives are based on our estimate of the period that the assets will generate revenue. Any change in conditions that would cause us to change our estimate as to the useful lives of a group or class of assets may significantly impact our depreciation expense on a prospective basis. Haemonetics’ equipment includes devices that we have placed at our customers under contractual arrangements that allow them to use the device in exchange for rental payments or the purchase of disposables. In addition to periodically reviewing the useful lives of these devices, we also periodically perform reviews to determine if a group of these devices is impaired. To conduct these reviews we must estimate the future amount and timing of demand for these devices. Changes in expected demand can result in additional depreciation expense, which is classified as cost of goods sold. Any significant unanticipated changes in demand could have a significant impact on the value of equipment and our reported operating results.
Consistent with the impairment tests noted above for intangible assets subject to amortization, we review our property, plant, and equipment assets, subject to depreciation, and their related useful lives at least once a year, or more frequently if certain conditions arise, to determine if any adverse conditions exist that would indicate the carrying value of these assets may not be recoverable. There were no indicators of impairment in either fiscal year 2010 or 2009.
Capitalized Software Costs
Software development costs have been capitalized in accordance with ASC Topic 985-20, 985-20,SoftwareSoftware (formerly known as SFAS No. 86,Accounting for the Cost of Computer Software to be Sold, Leased, or Otherwise Marketed), which specifies that costs incurred internally in researching and developing a computer software product should be charged to expense until technological feasibility has been established for the product. Technological feasibility is established when we have a detailed program design of the software and when research and development activities on the underlying device, if applicable, are completed. Once technological feasibility is established, all software costs should be capitalized until the product is available for general release to customers. We review the net realizable value of capitalized software assets periodically to assess the recoverability of amounts capitalized. In the future, the net realizable value may be adversely affected by the loss of a significant customer or a significant change in the market place, which could result in an impairment being recorded.
Income Taxes
The income tax provision is calculated for all jurisdictions in which we operate. This process involves estimating actual current taxes due plus assessing temporary differences arising from differing treatment for tax and accounting purposes that are recorded as deferred tax assets and liabilities. Deferred tax assets are periodically evaluated to determine their recoverability and a valuation allowance is established with a corresponding additional income tax provision recorded in our consolidated statements of income if their recovery is not considered likely. The provision for income taxes could also be materially impacted if actual taxes due differ from our earlier estimates.
We record a liability for uncertain tax positions taken or expected to be taken in income tax returns. Uncertain tax positions are unrecognized tax benefits for which reserves have been established. Our financial statements reflect expected future tax consequences of such positions presuming the taxing authorities’ full knowledge of the position and all relevant facts.
We file income tax returns in all jurisdictions in which we operate. We establish reserves to provide for additional income taxes that may be due in future years as these previously filed tax returns are audited. These reserves have been established based on management’s assessment as to the potential exposure attributable to
38
permanent differences and interest applicable to both permanent and temporary differences. All tax reserves are analyzed periodically and adjustments are made as events occur that warrant modification.
31
Stock-Based Compensation
We use the Black-Scholes option-pricing model to calculate the grant-date fair value of our stock options. The following assumptions, which involve the use of judgment by management, are used in the computation of the grant-date fair value of our stock options:
Expected Volatility — We have principally used our historical volatility as a basis to estimate expected volatility in our valuation of stock options.
Expected Term — We estimate the expected term of our options using historical exercise and forfeiture data. We believe that this historical data is currently the best estimate of the expected term of our new option grants.
Additionally, after determining the fair value of our stock options, we use judgment in establishing an estimated forfeiture rate, to determine the amount of stock based compensation to record each period:
Estimated Forfeiture Rate — We have applied, based on an analysis of our historical forfeitures, an annual forfeiture rate of 8% to all unvested stock options as of April 3, 2010,March 31, 2012, which represents the portion that we expect will be forfeited each year over the vesting period. We reevaluate this analysis periodically and adjust the forfeiture rate as necessary. Ultimately, we will only recognize expense for those shares that vest.
Valuation of Acquisitions
We allocate the amounts we pay for each acquisition to the assets we acquire and liabilities we assume based on their estimated fair values at the dates of acquisition, including acquired identifiable intangible assets, and purchased research and development. We base the estimated fair value of identifiable intangible assets on detailed valuations that use historical and forecasted information and market assumptions based upon the assumptions of a market participant. We allocate any excess purchase price over the fair value of the net tangible and intangible assets acquired to goodwill. The use of alternative valuation assumptions, including estimated cash flows and discount rates, and alternative estimated useful life assumptions could result in different purchase price allocations and intangible asset amortization expense in current and future periods.
In certain acquisitions, we have earn outearn-out arrangements or contingent consideration to provide potential future payments to the seller for achieving certainagreed-upon financial targets. We record the contingent consideration at its fair value at the acquisition date. Generally, we have entered into arrangements with contingent consideration that require payments in cash. As such, each quarter, we periodically revalue the contingent consideration obligations associated with certain acquisitions to their then fair value and record the change in the fair value as contingent consideration income or expense. Increases or decreases in the fair value of the contingent consideration obligations can result from changes in assumed discount periods and rates, changes in the assumed timing and amount of revenue and expense estimates, and changes in assumed probability adjustments with respect to regulatory approval. Significant judgment is employed in determining the appropriateness of these assumptions as of the acquisition date and for each subsequent period. Accordingly, future business and economic conditions, as well as changes in any of the assumptions described above, can materially impact the amount of contingent consideration income or expense we record in any given period.
Contingencies
We may become involved in various legal proceedings that arise in the ordinary course of business, including, without limitation, patent infringement, product liability and environmental matters. Accruals recorded for various contingencies including legal proceedings, self-insurance and other claims are based on judgment, the probability of losses and, where applicable, the consideration of opinions of internal and/or external legal counsel and actuarially determined estimates. When a range is established but a best estimate cannot be made, we record the minimum loss contingency amount. These estimates are often initially developed substantially earlier than the ultimate loss is known, and the estimates are reevaluated each accounting period, as additional information is available. When we are initially unable to develop a best estimate of loss, we record the minimum amount of loss, which could be zero. As information becomes known, additional loss provision is recorded when either a best estimate can be made or the minimum loss amount is increased. When events result in an expectation of a more favorable outcome than previously expected, our best estimate is changed to a lower amount. We record receivables from third party insurers when we have determined that existing insurance policies will provide reimbursement. In making this determination, we consider applicable deductibles, policy limits and the historical payment experience of the insurance carriers.
32
Liquidity and Capital Resources
The following table contains certain key performance indicators thatwe believe depict our liquidity and cash flow position:
| April 3, | March 28, | March 29, | ||||||||||
| 2010 | 2009 | 2008 | ||||||||||
| (Dollars in thousands) | ||||||||||||
| Cash & cash equivalents | $ | 141,562 | $ | 156,721 | $ | 133,553 | ||||||
| Working capital | $ | 249,646 | $ | 289,530 | $ | 261,757 | ||||||
| Current ratio | 2.8 | 4.1 | 3.7 | |||||||||
| Net cash position(1) | $ | 120,911 | $ | 150,683 | $ | 121,190 | ||||||
| Days sales outstanding (DSO) | 59 | 67 | 78 | |||||||||
| Disposables finished goods inventory turnover | 5.4 | 7.1 | 6.9 | |||||||||
| (Dollars in thousands) | March 31, 2012 | April 2, 2011 | |||||
| Cash & cash equivalents | $ | 228,861 | $ | 196,707 | |||
| Working capital | $ | 396,385 | $ | 340,160 | |||
| Current ratio | 4.0 | 4.1 | |||||
| Net cash position(1) | $ | 225,090 | $ | 191,828 | |||
| Days sales outstanding (DSO) | 66 | 68 | |||||
| Disposables finished goods inventory turnover | 5.7 | 6.1 | |||||
| (1) | Net cash position is the sum of cash and cash equivalents less total debt. |
| $ Increase/ | $ Increase/ | |||||||||||||||||||
| April 3, | March 28, | March 29, | (Decrease) | (Decrease) | ||||||||||||||||
| 2010 | 2009 | 2008 | 10 vs 09 | 09 vs 08 | ||||||||||||||||
| (In thousands) | ||||||||||||||||||||
| Net cash provided by (used in): | ||||||||||||||||||||
| Operating activities | $ | 130,668 | $ | 116,364 | $ | 77,669 | $ | 14,304 | $ | 38,695 | ||||||||||
| Investing activities | (132,335 | ) | (60,000 | ) | (102,847 | ) | 72,335 | (42,847 | ) | |||||||||||
| Financing activities | (13,970 | ) | (30,737 | ) | (73,228 | ) | (16,767 | ) | (42,491 | ) | ||||||||||
| Effect of exchange rate changes on cash | 478 | (2,459 | ) | 2,732 | 2,937 | (5,191 | ) | |||||||||||||
| Net increase/(decrease) in cash and cash equivalents: | $ | (15,159 | ) | $ | 23,168 | $ | (95,674 | ) | $ | (38,327 | ) | $ | 118,842 | |||||||
| (In thousands) | March 31, 2012 | April 2, 2011 | April 3, 2010 | Increase/(Decrease) 12 vs. 11 | Increase/(Decrease) 11 vs. 10 | ||||||||||||||
| Net cash provided by (used in): | |||||||||||||||||||
| Operating activities | $ | 115,318 | $ | 123,455 | $ | 130,668 | $ | (8,137 | ) | $ | (7,213 | ) | |||||||
| Investing activities | (52,196 | ) | (51,558 | ) | (132,335 | ) | (638 | ) | 80,777 | ||||||||||
| Financing activities | (30,470 | ) | (18,084 | ) | (13,970 | ) | (12,386 | ) | (4,114 | ) | |||||||||
| Effect of exchange rate changes on cash and cash equivalents(1) | (498 | ) | 1,332 | 478 | (1,830 | ) | 854 | ||||||||||||
| Net increase/(decrease) in cash and cash equivalents | $ | 32,154 | $ | 55,145 | $ | (15,159 | ) | $ | (22,991 | ) | $ | 70,304 | |||||||
| (1) | The balance sheet is affected by spot exchange rates used to translate local currency amounts into U.S. dollars. In accordance with GAAP, we have removed the effect of foreign currency throughout our cash flow statement, except for its effect on our cash and cash equivalents. |
Cash Flow Overview:
The balance sheet is affected by spot exchange rates used to translate local currency amounts into U.S. dollars. In comparing spot exchange rates at March 31, 2012 versus April 2, 2011 and at April 2, 2011 versus April 3, 2010 versus March 28, 2009 and at March 28, 2009 versus March 29, 2008,, (i) the European currencies, primarily the Euro, strengthened and weakened respectively, against the U.S. dollar during both comparison periods and (ii) the Yen strengthened against the U.S. dollar during both comparison periods.
In fiscal year2012, the Company repurchased approximately 0.9 million shares of its common stock for an aggregate purchase price of $50.0 million. This completed a $50.0 million share repurchase program that was announced in May 2011.
In fiscal 2011, the Company repurchased approximately 0.9 million shares of its common stock for an aggregate purchase price of $50.0 million. This completed a $50.0 million share repurchase program that was announced in April 2010.
33
In fiscal 2010, the Company repurchased approximately 0.7 million shares of its common stock for an aggregate purchase price of $40.0 million. This completed a $40.0 million share repurchase program that was announced in May 2009.
40
FISCAL YEAR 20102012 AS COMPARED TO FISCAL YEAR 20092011
Operating Activities:
Net cash provided by operating activities increased $14.3was $115.3 million in 2010 during fiscal 2012, a decrease of $8.1 million as compared to 2009 due primarily to:fiscal 2011. Cash provided by operating was negatively impacted by higher accounts receivable, higher inventory levels to support plasma growth, the launch of our next generation surgical device, the Cell Saver Elite, the replacement of OrthoPAT devices and lower net income, offset by lower bonus payments and lower tax payments.
Investing Activities:
Net cash used in investing activities increased $72.3by $0.6 million in 2010 during fiscal 2012 as compared to 2009fiscal year 2011 due to a $6.5 million increase in capital expenditures on property, plant and equipment, offset by the benefit of no acquisition-related payments. The increase in capital expenditures is the net effect of higher placements of company-owned equipment, primarily in support of increased plasma disposables demand, and the replacement of OrthoPAT devices, offset by lower manufacturing capital investments due to completion of construction of our Salt Lake City facility.
Financing Activities:
Net cash used in financing activities increased by $12.4 million during fiscal 2012 due primarily to a $25.4 million decrease in cash flow from the $71.8exercise of stock options offset by a $14.9 million cash used for acquisitions during the fiscal year which was $77.8 milliondecrease in fiscal year 2010 compared to the $6.0 million in fiscal year 2009.
net payments under short-term credit arrangements. Net cash used by financing activities decreased by $16.8to fund share repurchases under common stock repurchase programs was $50.0 million due to:during fiscal 2012 and 2011, respectively.
FISCAL YEAR 20092011 AS COMPARED TO FISCAL YEAR 20082010
Operating Activities:
Net cash provided by operating activities increased $38.7was $123.5 million in 2009 million during fiscal 2011, a decrease of $7.2 million as compared to 2008 duefiscal 2010. The decrease noted is driven by an increase in cash payments related to integration, restructuring and other exit costs primarily to:
41
Investing Activities:
Net cash used in investing activities decreased $42.8by $80.8 million in 2009 during fiscal 2011 as compared to 2008fiscal 2010. The cash paid to acquire businesses in fiscal year 2010 totaled $77.8 million due primarily to $58.1 million paid for the $40.9Global Med acquisition. In fiscal year 2011, we completed one acquisition for which we paid $6.2 million decreased investmentfor ACCS, a distributor of our TEG product. We also reduced capital expenditures in acquisitionsfiscal 2011 versus the prior year by $9.6 million, consistent with our capital plan.
Financing Activities:
During fiscal year 2011, cash used in financing activities include:
$50.0 million in cash paid out relating to stock repurchases — compared to the $40.0 million paid out during the prior year,
$47.7 million in proceeds from stock options, related excess tax benefits from stock option exercises, and the $1.4 million decrease in capital expenditures on property, plant and equipment.
$7.7 million in repayment of debt assumed from our acquisition of Global Med.
$7.5 million in repayment of outstanding unsecured debt.
34
Contractual Obligations and Contingencies
A summary of our contractual and commercial commitments as of April 3, 2010,March 31, 2012, is as follows (for more information concerning our debt see Note 8 to the consolidated financial statements and for our operating lease obligations see Note 10):follows:
| Payments Due by Period | ||||||||||||||||||||
| Total | Less Than 1 Year | 1-3 Years | 4-5 Years | After 5 Years | ||||||||||||||||
| (In thousands) | ||||||||||||||||||||
| Debt | $ | 20,651 | $ | 16,062 | $ | 1,713 | $ | 2,025 | $ | 851 | ||||||||||
| Operating leases | $ | 21,711 | $ | 6,930 | $ | 8,510 | $ | 2,784 | $ | 3,487 | ||||||||||
| Purchase commitments* | $ | 84,331 | $ | 84,331 | — | — | — | |||||||||||||
| Total contractual obligations | $ | 126,693 | $ | 107,323 | $ | 10,223 | $ | 4,809 | $ | 4,338 | ||||||||||
| Payments Due by Period | |||||||||||||||||||
| (In thousands) | Total | Less than 1 year | 1-3 years | 4-5 years | After 5 years | ||||||||||||||
| Debt | $ | 3,771 | $ | 894 | $ | 2,027 | $ | 850 | $ | — | |||||||||
| Operating leases | $ | 19,608 | $ | 6,169 | $ | 6,811 | $ | 4,172 | $ | 2,456 | |||||||||
| Purchase commitments* | $ | 88,144 | $ | 88,144 | $ | — | $ | — | $ | — | |||||||||
| Expected retirement plan benefit payments | $ | 11,552 | $ | 1,199 | $ | 2,501 | $ | 3,307 | $ | 4,545 | |||||||||
| Total contractual obligations | $ | 123,075 | $ | 96,406 | $ | 11,339 | $ | 8,329 | $ | 7,001 | |||||||||
| * | Includes amounts we are committed to spend on purchase orders entered in the normal course of business for capital equipment and for the purpose of manufacturing our products including contract manufacturers, specifically | |
The above table does not reflect our long-term liabilities associated with unrecognized tax benefits of $7.5 million recorded in accordance with ASC Topic 740, Income Taxes. Due to the complexity associated with tax uncertainties related to these unrecognized benefits, we cannot reasonably make a reliable estimate of the period in which we expect to settle these long-term liabilities. See Note 9 for more information on our unrecognized tax benefits.
Concentration of Credit Risk
Concentrations of credit risk with respect to trade accounts receivable are generally limited due to our large number of customers and their diversity across many geographic areas. A portion of our trade accounts receivable outside the United States, however, include sales to government-owned or supported healthcare systems in several countries, which are subject to payment delays. Payment is dependent upon the financial stability and creditworthiness of those countries’ national economies. We have not incurred significant losses on government receivables. We continually evaluate all government receivables for potential collection risks associated with the availability of government funding and reimbursement practices. If the financial condition of customers or the countries’ healthcare systems deteriorate such that their ability to make payments is uncertain, allowances may be required in future periods.
Deteriorating credit and economic conditions in parts of Western Europe, particularly in Italy where our net accounts receivable is $21.0 million as of March 31, 2012, may increase the average length of time it takes us to collect our accounts receivable in certain regions within these countries.
Contingent Commitments
Contingent Consideration
Under newthe accounting rules for business combinations, (specifically, ASC Topic 805,Business Combinations(formerly known as Statement No. 141(R),Business Combinations)), we established a liability for payments that we might make in the future to former shareholders of the L’Attitude Medical SystemsNeoteric that are tied to the performance of the Blood Track business for the first three years post acquisition, beginning with fiscal year 2010. During the fourth quarter of fiscal year2012, 2011 and 2010, it became evident that thethis business woulddid not achieve the necessary revenue growth milestones for fiscal year 2010.the former shareholders to receive additional performance payments. As such, we reduced the contingent liability by $2.3$1.6 million, $1.9 million and $2.3 million during fiscal 2012, 2011 and 2010, respectively, and recorded the adjustments as contingent consideration income in the statementconsolidated statements of operations.income.
In September 2011, we entered into an agreement to release the Company from the contingent consideration due to the former shareholders of Neoteric. Under the terms of the agreement, the former shareholders of Neoteric received $0.7 million in exchange for releasing the Company from any future claims for contingent consideration. The endingCompany paid the $0.7 million settlement amount during September 2011 and has recorded the associated expense in the selling, general and administrative line item in the accompanying consolidated statements of income.
35
Legal Proceedings
We are presently engaged in various legal actions, and although our ultimate liability balance is $1.8 millioncannot be determined at April 3, 2010.
42
Fenwal Patent Infringement
For the past five years, we have pursued patent infringement lawsuits against Baxter Healthcare SA and Fenwal Inc. in Massachusetts federal district court, seeking an injunction and damages on account of Baxter’sfrom their infringement of a Haemonetics patent, through the sale of Baxter’sthe ALYX brand automated red cell collection system, a competitor of our automated red cell collection systems. In March 2007, Baxter sold the Transfusion Technologies Division (which markets the ALYX product) to private investors, TPG, and Maverick Capital, Ltd. The new company which resulted from the sale was renamed Fenwal. In January 2009,
Currently, we are pursuing a jury found that the Fenwal ALYX system infringed Haemonetics’ patent and awarded us $15.7 millioninfringement action in damages for past infringement. On June 2, 2009, the court ruled that, in addition to paying the damages awarded by the jury, Fenwal must stop selling the ALYX consumable by December 1, 2010 and must pay Haemonetics a 10% royalty on ALYX consumable net sales from January 30, 2009 until December 1, 2010 when the injunction takes effect. In addition, the court awarded pre-judgment interest at 5% on the unpaid damages awarded. On August 19, 2009, an amended judgment was issued under which Haemonetics was awarded $11.3 million for lost profits suffered as a result of the infringement, $4.4 million in royalty damages suffered as a result of the infringement, and prejudgment interest of $2.3 million for a total award of $18.0 million.Germany against Fenwal, and Baxter have appealed these rulingsits European and German subsidiary. On September 20, 2010, we filed a patent infringement action in Germany. In response, Fenwal filed an action to the United States Court of Appeals for the Federal Circuit. The damages have not been paid and the royalties are being escrowed pending a decision on the appeal. On December 16, 2009, the U.S. Patent Office granted a request by Fenwal for the ex-parte re-examination ofinvalidate the Haemonetics patent which is the subject of this infringement action on December 1, 2010.
Haemonetics Italia Matter
In April 2008, our subsidiary Haemonetics Italia, Srl. and that re-examination process is proceeding.
When this matter first arose, our Board of Directors commissioned independent legal counsel to conduct investigations on its behalf. Based upon its evaluation of counsel's report, the Board concluded that itno disciplinary action was warranted in either case. Neither the original ruling nor its final affirmation has impacted the Company's business in Italy to date.
Pall Acquisition
In April 2012, we entered into a definitive Purchase Agreement to acquire the business assets of the blood collection, filtration and processing product lines of Pall Corporation. The transaction is discontinuing salesexpected to close in the second quarter of its original ALYX consumable kit. We believe this new collection kitHaemonetics' fiscal 2013, subject to the conditions precedent set forth in the Purchase Agreement, receipt of necessary regulatory and third-party approvals and labor-related notifications, as well as a period of confirmatory due diligence by Haemonetics. If in the course of conducting such confirmatory due diligence, Haemonetics discovers matters or issues that would adversely affect the Product Lines above certain thresholds, Haemonetics will have the right to terminate the Purchase Agreement. The Purchase Agreement also infringes our patent. On December 14, 2009, we filedincludes other customary termination provisions for both Haemonetics and Pall and provides that if, after all closing conditions are satisfied, one party refuses to consummate the Transaction, the other party will be entitled to a new infringement suittermination fee in Massachusetts federal district court seeking an injunctionamount equal to $17 million, which will be the sole and damages from Fenwal’s sale of this new consumable.exclusive remedy in such circumstances.
Inflation
We do not believe that inflation had a significant impact on our results of operations for the periods presented. Historically, we believe we have been able to mitigate the effects of inflation by improving our manufacturing and purchasing efficiencies, by increasing employee productivity, and by adjusting the selling prices of products. We continue to monitor inflation pressures generally and raw materials indices that may affect our procurement and production costs. Increases in the price of petroleum derivatives could result in corresponding increases in our costs to procure plastic raw materials.
Foreign Exchange
36
We have a program in place that is designed to mitigate our exposure to changes in foreign currency exposures in relation toexchange rates. That program includes the U.S. dollar are the Euro and the Japanese Yen. In response to the sharply increased volatility in the foreign exchange rates, we entered into forward contracts to hedge the anticipated cash flows from forecasted British Pound and Canadian Dollar denominated costs.
These contracts are designated as cash flow hedges and are intended to lock in the
43
expected cash flows of forecasted foreign currency denominated sales and costs at the available spot rate. Actual spot rate gains and losses on these contracts are recorded in sales and costs, at the same time the underlying transactions being hedged are recorded. The final impact of currency fluctuations on the results of operations is dependent on the local currency amounts hedged and the actual local currency results.
Presented below are the spot rates for our Euro, and Japanese Yen, Canadian Dollar, British Pound, and Swiss Franc cash flow hedges that settled induring fiscal year 20102012 and 20092011 or are presently outstanding. These hedges cover our long foreign currency positions that result from our sales designated in Europethe Euro and Japan.the Japanese Yen. These hedges also include our short positions associated with costs incurred in Canadian Dollars, British Pounds, and Swiss Francs. The table also shows how the relative strengthening or weakening of the spot rates associated with those hedge contracts versus the spot rates in the contracts that settled in the prior comparable period.period affects our results favorably or unfavorably. The table assumes a consistent notional amount for hedge contracts in each period presented.
| First | Strengthen | Second | Strengthen | Third | Strengthen | Fourth | Strengthen | |||||||||||||||||||||||||
| Quarter | /(Weaken) | Quarter | /(Weaken) | Quarter | /(Weaken) | Quarter | /(Weaken) | |||||||||||||||||||||||||
Euro — Hedge Spot Rate (US$ per Euro) | ||||||||||||||||||||||||||||||||
| FY09 | 1.3453 | 1.3704 | 1.4396 | 1.4908 | ||||||||||||||||||||||||||||
| FY10 | 1.5681 | 16.6 | % | 1.4890 | 8.6 | % | 1.3192 | (8.4 | )% | 1.2812 | (14.1 | )% | ||||||||||||||||||||
| FY11 | 1.3582 | (13.4 | )% | 1.4272 | (4.2 | )% | 1.4817 | 12.3 | % | 1.3689 | 6.8 | % | ||||||||||||||||||||
Japanese Yen — Hedge Spot Rate (JPY per US$) | ||||||||||||||||||||||||||||||||
| FY09 | 120.6432 | 116.7411 | 112.8810 | 106.2511 | ||||||||||||||||||||||||||||
| FY10 | 105.2792 | 12.7 | % | 105.1132 | 10.0 | % | 96.3791 | 14.6 | % | 93.4950 | 12.0 | % | ||||||||||||||||||||
| FY11 | 98.1677 | 6.8 | % | 94.9066 | 9.7 | % | 89.13 | 7.5 | % | 89.7839 | 4.0 | % | ||||||||||||||||||||
| First Quarter | Favorable / (Unfavorable) | Second Quarter | Favorable / (Unfavorable) | Third Quarter | Favorable / (Unfavorable) | Fourth Quarter | Favorable / (Unfavorable) | ||||||||||||||||
| Euro - Hedge Spot Rate (US$ per Euro) | |||||||||||||||||||||||
| FY10 | 1.57 | 1.49 | 1.32 | 1.28 | |||||||||||||||||||
| FY11 | 1.36 | (13 | )% | 1.41 | (5 | )% | 1.43 | 8 | % | 1.35 | 6 | % | |||||||||||
| FY12 | 1.24 | (9 | )% | 1.30 | (8 | )% | 1.36 | (5 | )% | 1.37 | 2 | % | |||||||||||
| FY13 | 1.43 | 15 | % | 1.42 | 9 | % | 1.36 | — | % | 1.32 | (4 | )% | |||||||||||
| Japanese Yen - Hedge Spot Rate (JPY per US$) | |||||||||||||||||||||||
| FY10 | 105.28 | 105.11 | 96.38 | 93.50 | |||||||||||||||||||
| FY11 | 98.17 | 7 | % | 94.91 | 10 | % | 89.13 | 8 | % | 89.78 | 4 | % | |||||||||||
| FY12 | 88.99 | 9 | % | 85.65 | 10 | % | 81.73 | 8 | % | 82.45 | 8 | % | |||||||||||
| FY13 | 79.40 | 11 | % | 76.65 | 11 | % | 77.58 | 5 | % | 78.69 | 5 | % | |||||||||||
| Canadian Dollar - Hedge Spot Rate (CAD per US$) | |||||||||||||||||||||||
| FY10 | 1.14 | 1.12 | 1.11 | 1.09 | |||||||||||||||||||
| FY11 | 1.10 | (4 | )% | 1.09 | (3 | )% | 1.07 | (4 | )% | 1.03 | (6 | )% | |||||||||||
| FY12 | 1.05 | (5 | )% | 1.03 | (6 | )% | 1.00 | (7 | )% | 0.99 | (4 | )% | |||||||||||
| FY13 | 0.98 | (7 | )% | 0.99 | (5 | )% | 1.01 | (1 | )% | 1.00 | 1 | % | |||||||||||
| British Pound - Hedge Spot Rate (US$ per GBP) | |||||||||||||||||||||||
| FY10 | 1.45 | 1.44 | 1.42 | 1.40 | |||||||||||||||||||
| FY11 | 1.47 | (1 | )% | 1.65 | (15 | )% | 1.63 | (15 | )% | 1.59 | (14 | )% | |||||||||||
| FY12 | 1.50 | (2 | )% | 1.54 | 7 | % | 1.57 | 4 | % | 1.58 | 1 | % | |||||||||||
| FY13 | 1.62 | (8 | )% | 1.63 | (6 | )% | 1.60 | (2 | )% | 1.57 | 1 | % | |||||||||||
| Swiss Franc - Hedge Spot Rate (CHF per US$) | |||||||||||||||||||||||
| FY11 | 1.05 | 1.04 | 1.05 | ||||||||||||||||||||
| FY12 | 1.05 | 1.01 | (4 | )% | 0.96 | (8 | )% | 0.92 | (12 | )% | |||||||||||||
| FY13 | 0.82 | (22 | )% | 0.85 | (21 | )% | 0.92 | (4 | )% | 0.91 | (1 | )% | |||||||||||
| * | We generally place our cash flow hedge contracts on a rolling twelve month basis. | |
Recent Accounting Pronouncements
37
In February 2010,June 2011, the FASB issued Accounting Standards UpdateNo. 2010-09,2011-05, Subsequent Events, an amendmentComprehensive Income (Topic 220): Presentation of Comprehensive Income. Update No. 2011-05 updates the disclosure requirements for comprehensive income to ASC Topic 855,Subsequent Events. This update addresses practice issues for evaluatinginclude total comprehensive income, the components of net income, and disclosing subsequent events with respect to processes around issuing financial statements and SEC registration requirements.the components of other comprehensive income either in a single continuous statement of comprehensive income or in two separate but consecutive statements. The updated guidance does not affect how earnings per share is calculated or presented. The updated guidance is effective immediately.for fiscal years, and interim periods within those years, beginning after December 15, 2011, and should be applied retrospectively. Early adoption is permitted and amendments do not require any transition disclosures. We will adopt this standard in the first quarter of fiscal 2013. The adoption of ASU 2011-05 will affect the presentation of comprehensive income but will not impact our financial condition or statement of operations.
In January 2010,September 2011, the FASB issued Accounting Standards UpdateNo. 2010-06,2011-08, Improving Disclosures about Fair Value MeasurementsIntangibles — Goodwill and Other (Topic 350). This update amends ASC Topic 820,Fair Value Measurements and Disclosures,ASU 2011-08 allows entities to requirefirst assess qualitatively whether it is necessary to perform the two-step goodwill impairment test. If an entity believes, as a numberresult of additional disclosures regardingits qualitative assessment, that it is more likely than not that the fair value measurements. Specifically,of a reporting unit is less than its carrying amount, the quantitative two-step goodwill impairment test is required. An entity has the unconditional option to bypass the qualitative assessment and proceed directly to performing the first step of the goodwill impairment test. ASU 2011-08 is effective for our first quarter of fiscal 2013 but is eligible for early adoption. We do not believe adoption of this standard will have an impact on our consolidated financial statements.
In December 2011, the FASB issued Accounting Standards Update No. 2011-11, Balance Sheet (Topic 210)-Disclosures about Offsetting Assets and Liabilities (ASU 2011-11). The update requires entities to disclose (i) the amountsinformation about offsetting and related arrangements of significant transfers between Level 1financial instruments and Level 2 of the fair value hierarchy and the reasons for these transfers, (ii) the reasons for any transfers in or out of Level 3, and (iii) information in the reconciliation of recurring Level 3 measurements about purchases, sales, issuances and settlements on a gross basis. In addition to these new disclosures, the update also amends ASC Topic 820 to clarify certain existing disclosure requirements. The update becamederivative instruments. ASU 2011-11 is effective for our first quarter of fiscal year 2010 and its impact is reflected in the notes to our consolidated financial statements for the year ended April 3, 2010.
44
Cautionary Statement Regarding Forward-Looking Information
Statements contained in this report, as well as oral statements we make which are prefaced with the words “may,” “will,” “expect,” “anticipate,” “continue,” “estimate,” “project,” “intend,” “designed,” and similar expressions, are intended to identify forward looking statements regarding events, conditions, and financial trends that may affect our future plans of operations, business strategy, results of operations, and financial position. These statements are based on our current expectations and estimates as to prospective events and circumstances about which we can give no firm assurance. Further, any forward-looking statement speaks only as of the date on which such statement is made, and we undertake no obligation to update any forward-looking statement to reflect events or circumstances after the date on which such statement is made. As it is not possible to predict every new factor that may emerge, forward-looking statements should not be relied upon as a prediction of our actual future financial condition or results. These forward-looking statements, like any forward-looking statements, involve risks and uncertainties that could cause actual results to differ materially from those projected or anticipated. Such risks and uncertainties include technological advances in the medical field and our standards for transfusion medicine and our ability to successfully implement products that incorporate such advances and standards, product demand and market acceptance of our products, regulatory
45
uncertainties, the effect of economic and political conditions, the impact of competitive products and pricing, the impact of industry consolidation, foreign currency exchange rates, changes in customers’ ordering patterns, the effect of industry consolidation as seen in the plasma market, the effect of communicable diseases, and the effect of uncertainties in markets outside the U.S. (including Europe and Asia) in which we operate.operate and such other risks described under Item 1A. Risk Factors included in this report. The foregoing list should not be construed as exhaustive.
38
ITEM 7A. QUANTITATIVE AND QUALITATIVE DISCLOSURES ABOUT MARKET RISK
The Company’s exposures relative to market risk are due principally to foreign exchange risk and interest rate risk.
Foreign Exchange Risk
See the section above entitled Foreign Exchange for a discussion of how foreign currency affects our business. It is our policy to minimize, for a period of time, the unforeseen impact on our financial results of fluctuations in foreign exchange rates by using derivative financial instruments known as forward contracts to hedge anticipated cash flows from forecasted foreign currency denominated sales.sales and costs. We do not use the financial instruments for speculative or trading activities. At April 3, 2010,March 31, 2012, we heldhad the following significant foreign exchange contracts to hedge the anticipated foreign currency cash flows from forecasted foreign currency denominated sales outstanding:outstanding. The contracts have been organized into maturity groups and the related quarter that we expect the hedge contract to affect our earnings.
| Weighted | Weighted | ||||||||||||||||||||||||||||||||||||
| (BUY)/SELL | Spot | Forward | |||||||||||||||||||||||||||||||||||
Hedged Currency | Local Currency | Contract Rate | Contract Rate | Fair Value | Maturity | (BUY)/SELL Local Currency | Weighted Spot Contract Rate | Weighted Forward Contract Rate | Fair Value Gain/(Loss) | Maturity | Quarter Expected to Affect Earnings | ||||||||||||||||||||||||||
| Euro | 6,633,736 | 1.371 | 1.369 | $ | 183,168 | Apr 2010 - May 2010 | 6,178,000 | 1.433 | 1.424 | $ | 584,628 | Mar 2012 - May 2012 | Q1 FY13 | ||||||||||||||||||||||||
| Euro | 8,816,747 | 1.427 | 1.428 | $ | 744,964 | Jun 2010 - Aug 2010 | 9,607,000 | 1.424 | 1.419 | $ | 837,202 | Jun 2012 - Aug 2012 | Q2 FY13 | ||||||||||||||||||||||||
| Euro | 10,242,532 | 1.482 | 1.478 | $ | 1,348,293 | Sep 2010 - Nov 2010 | 10,418,000 | 1.360 | 1.361 | $ | 303,286 | Sep 2012 - Nov 2012 | Q3 FY13 | ||||||||||||||||||||||||
| Euro | 10,370,808 | 1.369 | 1.367 | $ | 255,659 | Dec 2010 - Feb 2011 | 11,641,000 | 1.321 | 1.324 | $ | (83,772 | ) | Dec 2012 - Feb 2013 | Q4 FY13 | |||||||||||||||||||||||
| Japanese Yen | 948,098,509 | 98.02 per US$ | 97.31 per US$ | $ | (466,466 | ) | Apr 2010 -May 2010 | 933,690,000 | 78.40per US$ | 78.04per US$ | $ | 691,985 | Mar 2012 - May 2012 | Q1 FY13 | |||||||||||||||||||||||
| Japanese Yen | 1,392,004,698 | 94.91 per US$ | 94.35 per US$ | $ | (245,008 | ) | Jun 2010 -Aug 2010 | 1,402,958,000 | 76.65per US$ | 76.26per US$ | $ | 1,422,888 | Jun 2012 -Aug 2012 | Q2 FY13 | |||||||||||||||||||||||
| Japanese Yen | 1,527,960,999 | 89.13 per US$ | 88.77 per US$ | $ | 698,245 | Sep 2010 -Nov 2010 | 1,557,809,000 | 77.58per US$ | 76.95per US$ | $ | 1,357,095 | Sep 2012 - Nov 2012 | Q3 FY13 | ||||||||||||||||||||||||
| Japanese Yen | 1,487,690,000 | 89.78 per US$ | 89.43 per US$ | $ | 528,324 | Dec 2010 -Feb 2011 | 1,309,523,000 | 78.69per US$ | 78.29per US$ | $ | 822,620 | Oct 2012 - Feb 2013 | Q4 FY13 | ||||||||||||||||||||||||
| GBP | (763,689 | ) | 1.579 | 1.576 | $ | (53,532 | ) | Apr 2010 | (642,000 | ) | 1.620 | 1.611 | $ | (16,834 | ) | Feb 2012 - Apr 2012 | Q1 FY13 | ||||||||||||||||||||
| GBP | (2,727,724 | ) | 1.653 | 1.652 | $ | (393,430 | ) | May 2010 - Jul 2010 | (2,086,000 | ) | 1.631 | 1.625 | $ | (84,562 | ) | May 2012 - July 2012 | Q2 FY13 | ||||||||||||||||||||
| GBP | (2,645,949 | ) | 1.632 | 1.630 | $ | (320,475 | ) | Aug 2010 - Oct 2010 | (2,086,000 | ) | 1.599 | 1.593 | $ | (19,960 | ) | Aug 2012 - Oct 2012 | Q3 FY13 | ||||||||||||||||||||
| GBP | (2,602,543 | ) | 1.586 | 1.582 | $ | (194,893 | ) | Nov 2010 - Jan 2011 | (2,656,000 | ) | 1.572 | 1.567 | $ | 38,140 | Nov 2012 - Jan 2013 | Q4 FY13 | |||||||||||||||||||||
| GBP | (796,222 | ) | 1.506 | 1.503 | $ | (90 | ) | Feb 2011 | (904,000 | ) | 1.579 | 1.574 | $ | 5,714 | Feb 2012 - Apr 2013 | Q1 FY14 | |||||||||||||||||||||
| CAD | (2,985,642 | ) | 1.096 per US$ | 1.095 per US$ | $ | 199,400 | Apr 2010 - Jun 2010 | (2,889,637 | ) | 0.978per US$ | 0.985per US$ | $ | (34,874 | ) | Apr 2012 - Jun 2012 | Q1 FY13 | |||||||||||||||||||||
| CAD | (3,475,271 | ) | 1.085 per US$ | 1.086 per US$ | $ | 200,582 | Jul 2010 - Sep 2010 | (2,617,238 | ) | 0.993per US$ | 0.998per US$ | $ | (1,415 | ) | Jul 2012 - Aug 2012 | Q2 FY13 | |||||||||||||||||||||
| CAD | (3,241,542 | ) | 1.065 per US$ | 1.067 per US$ | $ | 126,902 | Oct 2010 - Dec 2010 | (2,944,842 | ) | 1.006per US$ | 1.012per US$ | $ | 31,005 | Oct 2012 - Nov 2012 | Q3 FY13 | ||||||||||||||||||||||
| CAD | (2,108,438 | ) | 1.048 per US$ | 1.050 per US$ | $ | 48,489 | Jan 2011 - Feb 2011 | (1,813,000 | ) | 0.997per US$ | 1.005per US$ | $ | 4,225 | Dec 2012 - Feb 2013 | Q4 FY13 | ||||||||||||||||||||||
| CHF | (4,171,000 | ) | 0.820per US$ | 0.816per US$ | $ | (504,249 | ) | Apr 2012 - Jun 2012 | Q1 FY13 | ||||||||||||||||||||||||||||
| CHF | (4,770,000 | ) | 0.847per US$ | 0.839per US$ | $ | (405,215 | ) | Jul 2012 - Sep 2012 | Q2 FY13 | ||||||||||||||||||||||||||||
| CHF | (4,724,000 | ) | 0.918per US$ | 0.910per US$ | $ | 32,219 | Oct 2012 - Dec 2012 | Q3 FY13 | |||||||||||||||||||||||||||||
| CHF | (2,888,000 | ) | 0.914per US$ | 0.909per US$ | $ | 20,034 | Jan 2012 - Mar 2013 | Q4 FY13 | |||||||||||||||||||||||||||||
| $ | 5,000,160 | ||||||||||||||||||||||||||||||||||||
| $ | 2,660,133 | ||||||||||||||||||||||||||||||||||||
We estimate the change in the fair value of all forward contracts assuming both a 10% strengthening and weakening of the U.S. dollar relative to all other major currencies. In the event of a 10% strengthening of the U.S. dollar, the change in fair value of all forward contracts would result in a $10.2$8.9 million increase in the fair value of the forward contracts; whereas a 10% weakening of the U.S.US dollar would result in a $11.7$9.7 million decrease in the fair value of the forward contracts.
Interest Rate Risk
All of our long-term debt is at fixed interest rates. Accordingly, a change in interest rates has an insignificant effect on our interest expense amounts. The fair value of our long-term debt, however, does change in response to interest ratesrate movements due to its fixed rate nature. These changes reflect the premium (when market interest rates decline below the contract fixed interest rates) or discount (when market interest rates rise above the fixed interest rate) that an investor in these long-term obligations would pay in the market interest rate environment.
At April 3, 2010,March 31, 2012, the fair value of
46
our long-term debt was approximately $0.5$0.2 million higher than the value of the debt reflected on our financial statements. This higher fair marketvalue is entirely related to our $4.6the $2.9 million remaining principal balance of
39
the original $10.0 million, 8.41% real estate mortgage.mortgage due January, 2016.
Using scenario analysis, if we changed the interest rate on all long-term maturities changed by 10% from the rate levels that existed at April 3, 2010March 31, 2012, the fair value of our long-term debt would not significantly change from the value reflected on our financial statements.
40
47
ITEM 8. FINANCIAL STATEMENTS AND SUPPLEMENTARY DATA
HAEMONETICS CORPORATION AND SUBSIDIARIES
CONSOLIDATED STATEMENTS OF INCOME
| Year Ended | ||||||||||||
| April 3 | March 28 | March 29 | ||||||||||
| 2010 | 2009 | 2008 | ||||||||||
| (In thousands, except per share data) | ||||||||||||
| Net revenues | $ | 645,430 | $ | 597,879 | $ | 516,440 | ||||||
| Cost of goods sold | 307,949 | 289,709 | 258,715 | |||||||||
Gross profit | 337,481 | 308,170 | 257,725 | |||||||||
| Operating expenses: | ||||||||||||
| Research, development, and engineering | 26,376 | 23,859 | 24,322 | |||||||||
| Selling, general, and administrative | 214,483 | 198,744 | 163,116 | |||||||||
| Contingent consideration income | (2,345 | ) | — | — | ||||||||
| Asset impairment | 15,686 | — | — | |||||||||
Total operating expenses | 254,200 | 222,603 | 187,438 | |||||||||
| Operating income | 83,281 | 85,567 | 70,287 | |||||||||
| Interest expense | (742 | ) | (64 | ) | (377 | ) | ||||||
| Interest income | 399 | 1,968 | 5,418 | |||||||||
| Other (expense)/income, net | (1,668 | ) | (2,469 | ) | 1,974 | |||||||
| Income before provision for income taxes | 81,270 | 85,002 | 77,302 | |||||||||
| Provision for income taxes | 22,900 | 25,698 | 25,322 | |||||||||
Net income | $ | 58,370 | $ | 59,304 | $ | 51,980 | ||||||
Basic income per common share | ||||||||||||
| Net income | $ | 2.29 | $ | 2.34 | $ | 2.01 | ||||||
Income per common share assuming dilution | ||||||||||||
| Net income | $ | 2.24 | $ | 2.27 | $ | 1.94 | ||||||
Weighted average shares outstanding | ||||||||||||
| Basic | 25,451 | 25,389 | 25,824 | |||||||||
| Diluted | 26,063 | 26,173 | 26,746 | |||||||||
| Year Ended | |||||||||||
| (In thousands, except per share data) | March 31, 2012 | April 2, 2011 | April 3, 2010 | ||||||||
| Net revenues | $ | 727,844 | $ | 676,694 | $ | 645,430 | |||||
| Cost of goods sold | 358,604 | 321,485 | 307,949 | ||||||||
| Gross profit | 369,240 | 355,209 | 337,481 | ||||||||
| Operating expenses: | |||||||||||
| Research and development | 36,801 | 32,656 | 26,376 | ||||||||
| Selling, general and administrative | 245,261 | 213,899 | 214,483 | ||||||||
| Contingent consideration income | (1,580 | ) | (1,894 | ) | (2,345 | ) | |||||
| Asset impairment | — | — | 15,686 | ||||||||
| Total operating expenses | 280,482 | 244,661 | 254,200 | ||||||||
| Operating income | 88,758 | 110,548 | 83,281 | ||||||||
| Other income (expense), net | 740 | (467 | ) | (2,010 | ) | ||||||
| Income before provision for income taxes | 89,498 | 110,081 | 81,271 | ||||||||
| Provision for income taxes | 22,612 | 30,101 | 22,901 | ||||||||
| Net income | $ | 66,886 | $ | 79,980 | $ | 58,370 | |||||
| Basic income per common share | |||||||||||
| Net income | $ | 2.64 | $ | 3.19 | $ | 2.29 | |||||
| Income per common share assuming dilution | |||||||||||
| Net income | $ | 2.59 | $ | 3.12 | $ | 2.24 | |||||
| Weighted average shares outstanding | |||||||||||
| Basic | 25,364 | 25,077 | 25,451 | ||||||||
| Diluted | 25,795 | 25,596 | 26,063 | ||||||||
The accompanying notes are an integral part of these consolidated financial statements.
41
HAEMONETICS CORPORATION AND SUBSIDIARIES
CONSOLIDATED BALANCE SHEETS
(in thousands, except per share data)
| April 3, | March 28, | |||||||
| 2010 | 2009 | |||||||
| (In thousands, except share data) | ||||||||
ASSETS | ||||||||
Current assets: | ||||||||
| Cash and cash equivalents | $ | 141,562 | $ | 156,721 | ||||
| Accounts receivable, less allowance of $2,554 in 2010 and $2,312 in 2009 | 118,684 | 113,598 | ||||||
| Inventories | 79,953 | 76,522 | ||||||
| Deferred tax assets | 10,985 | 7,190 | ||||||
| Prepaid expenses and other current assets | 34,959 | 28,362 | ||||||
Total current assets | 386,143 | 382,393 | ||||||
Property, plant and equipment | ||||||||
| Land, building and building & leasehold improvements | 49,292 | 42,540 | ||||||
| Plant equipment and machinery | 113,534 | 108,572 | ||||||
| Office equipment and information technology | 74,008 | 52,461 | ||||||
| Haemonetics equipment | 206,267 | 194,290 | ||||||
| Total property, plant and equipment | 443,101 | 397,863 | ||||||
| Less accumulated depreciation | (289,803 | ) | (260,056 | ) | ||||
Net property, plant and equipment | 153,298 | 137,807 | ||||||
Other assets: | ||||||||
| Other intangibles, less accumulated amortization of $32,693 in 2010 and $25,508 in 2009 | 86,102 | 65,261 | ||||||
| Goodwill | 120,543 | 56,426 | ||||||
| Deferred tax assets, long-term | 4,910 | 3,007 | ||||||
| Other long-term assets | 9,664 | 4,799 | ||||||
Total other assets | 221,219 | 129,493 | ||||||
Total assets | $ | 760,660 | $ | 649,693 | ||||
| LIABILITIES AND STOCKHOLDERS’ EQUITY | ||||||||
Current liabilities: | ||||||||
| Notes payable and current maturities of long-term debt | $ | 16,062 | $ | 695 | ||||
| Accounts payable | 25,590 | 20,652 | ||||||
| Accrued payroll and related costs | 39,046 | 30,771 | ||||||
| Accrued income taxes | 5,092 | 2,833 | ||||||
| Deferred tax liability | 68 | 17 | ||||||
| Other accrued liabilities | 50,639 | 37,895 | ||||||
Total current liabilities | 136,497 | 92,863 | ||||||
| Long-term debt, net of current maturities | 4,589 | 5,343 | ||||||
| Deferred tax liability, long-term | 13,535 | 3,129 | ||||||
| Other long-term liabilities | 12,915 | 8,474 | ||||||
| Commitments and contingencies (Note 10) | ||||||||
Stockholders’ equity: | ||||||||
| Common stock, $.01 par value; Authorized — 150,000,000 shares; Issued 25,440,856 in April 3, 2010 and 25,622,449 in 2009 | 255 | 256 | ||||||
| Additional paid-in capital | 252,323 | 226,829 | ||||||
| Retained earnings | 334,641 | 309,516 | ||||||
| Accumulated other comprehensive income | 5,905 | 3,283 | ||||||
Total stockholders’ equity | 593,124 | 539,884 | ||||||
Total liabilities and stockholders’ equity | $ | 760,660 | $ | 649,693 | ||||
| (In thousands, except share data) | March 31, 2012 | April 2, 2011 | |||||
| ASSETS | |||||||
| Current assets: | |||||||
| Cash and cash equivalents | $ | 228,861 | $ | 196,707 | |||
| Accounts receivable, less allowance of $1,480 at March 31, 2012 and $1,799 at April 2, 2011 | 135,464 | 127,166 | |||||
| Inventories, net | 117,163 | 84,387 | |||||
| Deferred tax asset, net | 9,665 | 9,674 | |||||
| Prepaid expenses and other current assets | 35,976 | 30,897 | |||||
| Total current assets | 527,129 | 448,831 | |||||
| Property, plant and equipment: | |||||||
| Land, building and building improvements | 59,816 | 52,359 | |||||
| Plant equipment and machinery | 136,057 | 128,612 | |||||
| Office equipment and information technology | 88,185 | 83,258 | |||||
| Haemonetics equipment | 226,476 | 211,455 | |||||
| Total property, plant and equipment | 510,534 | 475,684 | |||||
| Less: accumulated depreciation | (348,877 | ) | (320,156 | ) | |||
| Net property, plant and equipment | 161,657 | 155,528 | |||||
| Other assets: | |||||||
| Intangible assets, less amortization of $54,973 at March 31, 2012 and $43,827 at April 2, 2011 | 96,549 | 101,789 | |||||
| Goodwill | 115,058 | 115,367 | |||||
| Deferred tax asset, long term | 23 | 1,291 | |||||
| Other long-term assets | 10,719 | 10,458 | |||||
| Total other assets | 222,349 | 228,905 | |||||
| Total assets | $ | 911,135 | $ | 833,264 | |||
| LIABILITIES AND STOCKHOLDERS’ EQUITY | |||||||
| Current liabilities: | |||||||
| Notes payable and current maturities of long-term debt | $ | 894 | $ | 913 | |||
| Accounts payable | 35,425 | 28,323 | |||||
| Accrued payroll and related costs | 29,451 | 27,039 | |||||
| Accrued income taxes | 8,075 | 6,033 | |||||
| Deferred tax liability | 64 | 107 | |||||
| Other liabilities | 56,835 | 46,256 | |||||
| Total current liabilities | 130,744 | 108,671 | |||||
| Long-term debt, net of current maturities | 2,877 | 3,966 | |||||
| Long-term deferred tax liability | 23,332 | 18,669 | |||||
| Other long-term liabilities | 21,551 | 15,822 | |||||
| Commitments and contingencies (Note 12) | |||||||
| Stockholders’ equity: | |||||||
| Common stock, $0.01 par value; Authorized — 150,000,000 shares; Issued and outstanding — 25,301,899 shares at March 31, 2012 and 25,660,393 shares at April 2, 2011 | 253 | 256 | |||||
| Additional paid-in capital | 322,485 | 302,709 | |||||
| Retained earnings | 400,783 | 373,630 | |||||
| Accumulated other comprehensive income | 9,110 | 9,541 | |||||
| Total stockholders’ equity | 732,631 | 686,136 | |||||
| Total liabilities and stockholders’ equity | $ | 911,135 | $ | 833,264 | |||
The accompanying notes are an integral part of these consolidated financial statements.
42
HAEMONETICS CORPORATION AND SUBSIDIARIES
CONSOLIDATED STATEMENTSSTATEMENT OF STOCKHOLDERS’ EQUITY AND OTHER COMPREHENSIVE INCOME
| Accumulated | ||||||||||||||||||||||||||||
| Common | Additional | Other | Total | |||||||||||||||||||||||||
| Stock | Paid-in | Retained | Comprehensive | Stockholders’ | Comprehensive | |||||||||||||||||||||||
| Shares | $’s | Capital | Earnings | Income/(Loss) | Equity | Income | ||||||||||||||||||||||
| (In thousands) | ||||||||||||||||||||||||||||
| Balance, March 31, 2007 | 26,517 | $ | 265 | $ | 163,815 | $ | 315,767 | $ | (199 | ) | $ | 479,648 | ||||||||||||||||
| Employee stock purchase plan | 56 | 1 | 2,208 | — | — | 2,209 | ||||||||||||||||||||||
| Exercise of stock options, release of restricted stock units, vesting of restricted stock award, and related tax benefit | 575 | 5 | 20,488 | — | — | 20,493 | ||||||||||||||||||||||
| Shares repurchased — Authorized Unissued | (1,463 | ) | (15 | ) | (9,430 | ) | (65,551 | ) | — | (74,996 | ) | |||||||||||||||||
| Issuance of restricted stock, net of cancellations | 10 | — | — | — | — | — | ||||||||||||||||||||||
| Stock compensation expense | — | — | 9,852 | — | — | 9,852 | ||||||||||||||||||||||
| Net income | — | — | — | 51,980 | — | 51,980 | $ | 51,980 | ||||||||||||||||||||
| Impact of defined benefit plans, net of tax | — | — | — | — | 276 | 276 | 276 | |||||||||||||||||||||
| Foreign currency translation adjustment | — | — | — | — | 11,748 | 11,748 | 11,748 | |||||||||||||||||||||
| Unrealized loss on hedges, net of tax | — | — | — | — | (10,055 | ) | (10,055 | ) | (10,055 | ) | ||||||||||||||||||
| Reclassification of hedge loss to earnings | — | — | — | — | 3,033 | 3,033 | 3,033 | |||||||||||||||||||||
| Comprehensive income | — | — | — | — | — | — | $ | 56,982 | ||||||||||||||||||||
| Balance, March 29, 2008 | 25,695 | $ | 256 | $ | 186,933 | $ | 302,196 | $ | 4,803 | $ | 494,188 | |||||||||||||||||
| Employee stock purchase plan | 59 | 1 | 2,658 | — | — | 2,659 | ||||||||||||||||||||||
| Exercise of stock options, release of restricted stock units, vesting of restricted stock award, and related tax benefit | 950 | 10 | 35,060 | — | — | 35,070 | ||||||||||||||||||||||
| Shares repurchased — Authorized Unissued | (1,100 | ) | (11 | ) | (8,003 | ) | (51,984 | ) | — | (59,998 | ) | |||||||||||||||||
| Issuance of restricted stock, net of cancellations | 18 | — | — | — | — | — | ||||||||||||||||||||||
| Stock compensation expense | — | — | 10,181 | — | — | 10,181 | ||||||||||||||||||||||
| Net income | — | — | — | 59,304 | — | 59,304 | $ | 59,304 | ||||||||||||||||||||
| Impact of defined benefit plans, net of tax | — | — | — | — | (697 | ) | (697 | ) | (697 | ) | ||||||||||||||||||
| Foreign currency translation adjustment | — | — | — | — | (10,045 | ) | (10,045 | ) | (10,045 | ) | ||||||||||||||||||
| Unrealized gain on hedges, net of tax | — | — | — | — | 4,858 | 4,858 | 4,858 | |||||||||||||||||||||
| Reclassification of hedge loss to earnings | — | — | — | — | 4,364 | 4,364 | 4,364 | |||||||||||||||||||||
| Comprehensive income | — | — | — | — | — | — | $ | 57,784 | ||||||||||||||||||||
| Balance, March 28, 2009 | 25,622 | $ | 256 | $ | 226,829 | $ | 309,516 | $ | 3,283 | $ | 539,884 | |||||||||||||||||
| Employee stock purchase plan | 66 | 1 | 2,908 | — | — | 2,909 | ||||||||||||||||||||||
| Exercise of stock options, release of restricted stock units, vesting of restricted stock award, and related tax benefit | 488 | 5 | 19,067 | — | — | 19,072 | ||||||||||||||||||||||
| Shares repurchased — Authorized Unissued | (735 | ) | (7 | ) | (6,748 | ) | (33,245 | ) | — | (40,000 | ) | |||||||||||||||||
| Stock compensation expense | — | — | 10,267 | — | — | 10,267 | ||||||||||||||||||||||
| Net income | — | — | — | 58,370 | — | 58,370 | $ | 58,370 | ||||||||||||||||||||
| Impact of defined benefit plans, net of tax | — | — | — | — | (309 | ) | (309 | ) | (309 | ) | ||||||||||||||||||
| Foreign currency translation adjustment | — | — | — | — | 2,599 | 2,599 | 2,599 | |||||||||||||||||||||
| Unrealized loss on hedges, net of tax | — | — | — | — | (477 | ) | (477 | ) | (477 | ) | ||||||||||||||||||
| Reclassification of hedge loss to earnings | — | — | — | — | 809 | 809 | 809 | |||||||||||||||||||||
| Comprehensive income | — | — | — | — | — | — | $ | 60,992 | ||||||||||||||||||||
| Balance, April 3, 2010 | 25,441 | $ | 255 | $ | 252,323 | $ | 334,641 | $ | 5,905 | $ | 593,124 | |||||||||||||||||
| Common Stock | Additional Paid-in | Retained | Accumulated Other Comprehensive | Total Stockholders’ | Comprehensive | |||||||||||||||||||||
| Shares | $’s | Capital | Earnings | Income/(Loss) | Equity | Income | ||||||||||||||||||||
| Balance, March 28, 2009 | 25,622 | $ | 256 | $ | 226,829 | $ | 309,516 | $ | 3,283 | $ | 539,884 | |||||||||||||||
| Employee stock purchase plan | 66 | 1 | 2,908 | — | — | 2,909 | ||||||||||||||||||||
| Exercise of stock options and related tax benefit | 488 | 5 | 19,067 | — | — | 19,072 | ||||||||||||||||||||
| Shares repurchased | (735 | ) | (7 | ) | (6,748 | ) | (33,245 | ) | — | (40,000 | ) | |||||||||||||||
| Stock compensation expense | — | — | 10,267 | — | — | 10,267 | ||||||||||||||||||||
| Net income | — | — | — | 58,370 | — | 58,370 | $ | 58,370 | ||||||||||||||||||
| Impact of defined benefit plans, net of tax | — | — | — | — | (309 | ) | (309 | ) | (309 | ) | ||||||||||||||||
| Foreign currency translation adjustment | — | — | — | — | 2,599 | 2,599 | 2,599 | |||||||||||||||||||
| Unrealized gain on hedges, net of tax | — | — | — | — | (477 | ) | (477 | ) | (477 | ) | ||||||||||||||||
| Reclassification of hedge loss to earnings, net of tax | — | — | — | — | 809 | 809 | 809 | |||||||||||||||||||
| Comprehensive income | — | — | — | — | — | — | $ | 60,992 | ||||||||||||||||||
| Balance, April 3, 2010 | 25,441 | $ | 255 | $ | 252,323 | $ | 334,641 | $ | 5,905 | $ | 593,124 | |||||||||||||||
| Employee stock purchase plan | 78 | 1 | 3,680 | — | — | 3,681 | ||||||||||||||||||||
| Exercise of stock options and related tax benefit | 1,012 | 9 | 44,896 | — | — | 44,905 | ||||||||||||||||||||
| Shares repurchased | (907 | ) | (9 | ) | (9,000 | ) | (40,991 | ) | — | (50,000 | ) | |||||||||||||||
| Issuance of restricted stock, net of cancellations | 36 | — | — | — | — | — | ||||||||||||||||||||
| Stock compensation expense | — | — | 10,810 | — | — | 10,810 | ||||||||||||||||||||
| Net income | — | — | — | 79,980 | — | 79,980 | $ | 79,980 | ||||||||||||||||||
| Impact of defined benefit plans, net of tax | — | — | — | — | 555 | 555 | 555 | |||||||||||||||||||
| Foreign currency translation adjustment | — | — | — | — | 6,380 | 6,380 | 6,380 | |||||||||||||||||||
| Unrealized loss on hedges, net of tax | — | — | — | — | (4,068 | ) | (4,068 | ) | (4,068 | ) | ||||||||||||||||
| Reclassification of hedge loss to earnings, net of tax | — | — | — | — | 769 | 769 | 769 | |||||||||||||||||||
| Comprehensive income | — | — | — | — | — | — | $ | 83,616 | ||||||||||||||||||
| Balance, April 2, 2011 | 25,660 | $ | 256 | $ | 302,709 | $ | 373,630 | $ | 9,541 | $ | 686,136 | |||||||||||||||
| Employee stock purchase plan | 77 | 1 | 3,722 | — | — | 3,723 | ||||||||||||||||||||
| Exercise of stock options and related tax benefit | 369 | 4 | 17,024 | — | — | 17,028 | ||||||||||||||||||||
| Shares repurchased | (852 | ) | (9 | ) | (10,256 | ) | (39,733 | ) | — | (49,998 | ) | |||||||||||||||
| Issuance of restricted stock, net of cancellations | 48 | 1 | — | — | — | 1 | ||||||||||||||||||||
| Stock compensation expense | — | — | 9,286 | — | — | 9,286 | ||||||||||||||||||||
| Net income | — | — | — | 66,886 | — | 66,886 | $ | 66,886 | ||||||||||||||||||
| Impact of defined benefit plans, net of tax | — | — | — | — | (3,988 | ) | (3,988 | ) | (3,988 | ) | ||||||||||||||||
| Foreign currency translation adjustment | — | — | — | — | (2,813 | ) | (2,813 | ) | (2,813 | ) | ||||||||||||||||
| Unrealized gain on hedges, net of tax | — | — | — | — | 3,140 | 3,140 | 3,140 | |||||||||||||||||||
| Reclassification of hedge loss to earnings, net of tax | — | — | — | — | 3,230 | 3,230 | 3,230 | |||||||||||||||||||
| Comprehensive income | — | — | — | — | — | — | $ | 66,455 | ||||||||||||||||||
| Balance, March 31, 2012 | 25,302 | $ | 253 | $ | 322,485 | $ | 400,783 | $ | 9,110 | $ | 732,631 | |||||||||||||||
The accompanying notes are an integral part of these consolidated financial statements.
43
HAEMONETICS CORPORATION AND SUBSIDIARIES
CONSOLIDATED STATEMENTS OF CASH FLOWS
| Year Ended | ||||||||||||
| April 3, | March 28, | March 29, | ||||||||||
| 2010 | 2009 | 2008 | ||||||||||
| (In thousands) | ||||||||||||
Cash Flows from Operating Activities: | ||||||||||||
| Net income | $ | 58,370 | $ | 59,304 | $ | 51,980 | ||||||
Adjustments to reconcile net income to net cash provided by operating activities: | ||||||||||||
Non cash items: | ||||||||||||
| Depreciation and amortization | 43,236 | 36,462 | 31,197 | |||||||||
| Stock compensation expense | 10,267 | 10,181 | 9,852 | |||||||||
| Deferred tax expense/(benefit) | 2,592 | 1,645 | (882 | ) | ||||||||
| (Gain)/Loss on sales of property, plant and equipment | (435 | ) | (124 | ) | 222 | |||||||
| Unrealized loss/(gain) from hedging activities | (1,368 | ) | 3,812 | (3,995 | ) | |||||||
| Contingent consideration income | (2,345 | ) | — | — | ||||||||
| Accretion of intererst expense on contingent consideration | 588 | — | — | |||||||||
| Asset impairment | 15,686 | — | — | |||||||||
Change in operating assets and liabilities: | ||||||||||||
| Decrease/(Increase) in accounts receivable, net | 4,364 | 2 | (18,229 | ) | ||||||||
| Increase in inventories | (1,665 | ) | (11,236 | ) | (2,874 | ) | ||||||
| (Increase)/Decrease in prepaid income taxes | 7,254 | (2,913 | ) | (8,082 | ) | |||||||
| Decrease/(Increase) in other assets and other long-term liabilities | (13,809 | ) | (4,241 | ) | 6,439 | |||||||
| Tax benefit of exercise of stock options | 2,670 | 3,368 | 1,586 | |||||||||
| Increase/(Decrease) in accounts payable and accrued expenses | 5,263 | 20,104 | 10,455 | |||||||||
| Net cash provided by operating activities | 130,668 | 116,364 | 77,669 | |||||||||
Cash Flows from Investing Activities: | ||||||||||||
| Capital expenditures on property, plant and equipment | (56,304 | ) | (56,379 | ) | (57,790 | ) | ||||||
| Proceeds from sale of property, plant and equipment | 1,785 | 2,383 | 1,834 | |||||||||
| Acquisition of Global Med Technologies | (58,052 | ) | — | — | ||||||||
| Acquisition of SEBRA | (12,845 | ) | — | — | ||||||||
| Acquisition of Neoteric | (6,613 | ) | — | — | ||||||||
| Acquisition of Altivation | — | (3,545 | ) | — | ||||||||
| Acquisition of Medicell | (306 | ) | (2,459 | ) | — | |||||||
| Acquisition of HaemoScope | — | — | (45,591 | ) | ||||||||
| Acquisition of Infonale | — | — | (1,300 | ) | ||||||||
| Net cash used in investing activities | (132,335 | ) | (60,000 | ) | (102,847 | ) | ||||||
Cash Flows from Financing Activities: | ||||||||||||
| Payments on long-term real estate mortgage | (754 | ) | (694 | ) | (638 | ) | ||||||
| Net decrease in short-term revolving credit agreements | 6,184 | (5,580 | ) | (18,709 | ) | |||||||
| Employee stock purchase plan | 2,909 | 2,659 | 2,209 | |||||||||
| Exercise of stock options | 17,270 | 25,406 | 17,245 | |||||||||
| Excess tax benefit on exercise of stock options | 421 | 7,470 | 1,661 | |||||||||
| Stock repurchase | (40,000 | ) | (59,998 | ) | (74,996 | ) | ||||||
| Net cash used in financing activities | (13,970 | ) | (30,737 | ) | (73,228 | ) | ||||||
| Effect of Exchange Rates on Cash and Cash Equivalents | 478 | (2,459 | ) | 2,732 | ||||||||
Net Increase/(Decrease) in Cash and Cash Equivalents | (15,159 | ) | 23,168 | (95,674 | ) | |||||||
Cash and Cash Equivalents at Beginning of Year | 156,721 | 133,553 | 229,227 | |||||||||
Cash and Cash Equivalents at End of Period | $ | 141,562 | $ | 156,721 | $ | 133,553 | ||||||
Non-cash Investing and Financing Activities: | ||||||||||||
| Transfers from inventory to fixed assets for placements of Haemonetics equipment | $ | 5,132 | $ | 6,818 | $ | 1,672 | ||||||
| Debt assumed from acquisition | $ | 7,833 | $ | — | $ | — | ||||||
Supplemental Disclosures of Cash Flow Information: | ||||||||||||
| Interest paid | $ | 563 | $ | 545 | $ | 991 | ||||||
| Income taxes paid | $ | 21,519 | $ | 19,391 | $ | 23,851 | ||||||
| Year Ended | |||||||||||
| (In thousands) | March 31, 2012 | April 2, 2011 | April 3, 2010 | ||||||||
| Cash Flows from Operating Activities: | |||||||||||
| Net income | $ | 66,886 | $ | 79,980 | $ | 58,370 | |||||
| Adjustments to reconcile net income to net cash provided by operating activities: | |||||||||||
| Non cash items: | |||||||||||
| Depreciation and amortization | 49,966 | 48,145 | 43,236 | ||||||||
| Stock compensation expense | 9,286 | 10,810 | 10,267 | ||||||||
| Deferred tax expense | 5,878 | 5,782 | 2,592 | ||||||||
| Loss/(gain) on sales of property, plant and equipment | 772 | 674 | (435 | ) | |||||||
| Unrealized loss/(gain) from hedging activities | 166 | (614 | ) | (1,368 | ) | ||||||
| Contingent consideration income | (1,580 | ) | (1,894 | ) | (2,345 | ) | |||||
| (Reversal)/accretion of interest expense on contingent consideration | (574 | ) | (416 | ) | 588 | ||||||
| Asset impairment | — | — | 15,686 | ||||||||
| Change in operating assets and liabilities: | |||||||||||
| (Increase)/decrease in accounts receivable, net | (10,539 | ) | (3,920 | ) | 4,364 | ||||||
| (Increase)/decrease in inventories | (32,528 | ) | (2,560 | ) | (1,665 | ) | |||||
| Decrease in prepaid income taxes | 3,058 | 1,680 | 7,254 | ||||||||
| Decrease in other assets and other long-term liabilities | 3,156 | (470 | ) | (13,809 | ) | ||||||
| Tax benefit of exercise of stock options | 1,958 | 4,941 | 2,670 | ||||||||
| Increase/(decrease) in accounts payable and accrued expenses | 19,413 | (18,683 | ) | 5,263 | |||||||
| Net cash provided by operating activities | 115,318 | 123,455 | 130,668 | ||||||||
| Cash Flows from Investing Activities: | |||||||||||
| Capital expenditures on property, plant and equipment | (53,198 | ) | (46,669 | ) | (56,304 | ) | |||||
| Proceeds from sale of property, plant and equipment | 1,002 | 1,468 | 1,785 | ||||||||
| Acquisition of ACCS | — | (6,229 | ) | — | |||||||
| Acquisition of Global Med Technologies | — | (128 | ) | (58,052 | ) | ||||||
| Acquisition of SEBRA | — | — | (12,845 | ) | |||||||
| Acquisition of Neoteric | — | — | (6,613 | ) | |||||||
| Acquisition of Medicell | — | — | (306 | ) | |||||||
| Net cash used in investing activities | (52,196 | ) | (51,558 | ) | (132,335 | ) | |||||
| Cash Flows from Financing Activities: | |||||||||||
| Payments on long-term real estate mortgage | (815 | ) | (632 | ) | (754 | ) | |||||
| Net (decrease)/increase in short-term loans | (288 | ) | (15,153 | ) | 6,184 | ||||||
| Proceeds from employee stock purchase plan | 3,723 | 3,681 | 2,909 | ||||||||
| Proceeds from exercise of stock options | 15,475 | 40,896 | 17,270 | ||||||||
| Excess tax benefit on exercise of stock options | 1,433 | 3,124 | 421 | ||||||||
| Share repurchase | (49,998 | ) | (50,000 | ) | (40,000 | ) | |||||
| Net cash used in financing activities | (30,470 | ) | (18,084 | ) | (13,970 | ) | |||||
| Effect of exchange rates on cash and cash equivalents | (498 | ) | 1,332 | 478 | |||||||
| Net Increase in Cash and Cash Equivalents | 32,154 | 55,145 | (15,159 | ) | |||||||
| Cash and Cash Equivalents at Beginning of Year | 196,707 | 141,562 | 156,721 | ||||||||
| Cash and Cash Equivalents at End of Year | $ | 228,861 | $ | 196,707 | $ | 141,562 | |||||
| Non-cash Investing and Financing Activities: | |||||||||||
| Transfers from inventory to fixed assets for placements of | |||||||||||
| Haemonetics equipment | $ | 18,333 | $ | 5,069 | $ | 7,833 | |||||
| Debt assumed from acquisition | $ | — | $ | — | $ | 5,132 | |||||
| Supplemental Disclosures of Cash Flow Information: | |||||||||||
| Interest paid | $ | 414 | $ | 487 | $ | 563 | |||||
| Income taxes paid | $ | 10,764 | $ | 16,669 | $ | 21,519 | |||||
The accompanying notes are an integral part of these consolidated financial statements.statements
51
44
HAEMONETICS CORPORATION AND SUBSIDIARIES
NOTES TO CONSOLIDATED FINANCIAL STATEMENTS
1.
| DESCRIPTION OF THE BUSINESS |
Haemonetics is a global healthcare company dedicated to providing innovative blood management solutions for our customers — plasma collectors, blood collectors, and hospitals. Anchored by our strong brand name in medical device systems for the transfusion industry, we also provide information technology platforms and valued added services to provide customers with business solutions which support improved clinical outcomes for patients and efficiency in the blood supply chain.
Our systems automate the collection and processing of donated blood; perform blood diagnostics; salvage and process surgical patient blood; and dispense blood within the hospital. These systems include devices and single-use, proprietary disposable sets that operate only on our specialized equipment. Our blood processing systems allow users to collect and process only the blood component(s) they target — plasma, platelets, or red blood cells — increasing donor and patient safety as well as collection efficiencies. Our blood diagnostics system assesses the likelihood of a patient’s blood loss allowing clinicians to make informed decisions about a patient’s treatment as it relates to blood loss in surgery. Our surgical blood salvage systems collect blood lost by a patient in surgery, clean the blood, and make it available for reinfusion to the patient, in this way giving the patient the safest blood possible — his or her own. Our blood distribution systems are “smart” refrigerators located throughout hospitals which automate the storage, inventory tracking, and dispositioning of blood in key blood use areas.
Our information technology platforms are used by blood and plasma collectors to improve the safety and efficiency of blood collection logistics by eliminating previously manual functions at not-for-profit blood bankscenters and commercial plasma centers. Our platforms are also used by hospitals to enable hospital administrators to monitor and measure blood management practices and to manage processes within transfusion services. Our information technology platforms allow all customers to better manage processes across the blood supply chain, comply with regulatory requirements, and identify increased opportunities to reduce costs.
Our business services include consulting, Six Sigma, and LEAN manufacturing offerings that support our customers’ needs for regulatory compliance and operational efficiency in the blood supply chain and best practice in blood management.
| 2. | SUMMARY OF SIGNIFICANT ACCOUNTING POLICIES |
Fiscal Year
Our fiscal year ends on the Saturday closest to the last day of March. Fiscal years 2012 and 2011 each includes 52 weeks with each quarter having 13 weeks. Fiscal year 2010 includes 53 weeks with each of the first three quarters having 13 weeks and the fourth quarter having 14 weeks. Fiscal years 2009 and 2008 each included 52 weeks with all four quarters having 13 weeks.
Principles of Consolidation
The accompanying consolidated financial statements include all accounts including those of our subsidiaries. All significant intercompany accounts and transactions have been eliminated in consolidation.
Use of Estimates
The preparation of financial statements in conformity with GAAP requires us to make estimates and assumptions that affect the reported amounts of assets and liabilities and disclosure of contingent assets and liabilities at the date of the financial statements and the reported amounts of revenues and expenses during the reporting period. Actual results could vary from the amounts derived from our estimates and assumptions.
52
Reclassifications
Certain reclassifications have been made to prior years’ amounts to conform to the current year’s presentation.
Revenue Recognition
Our revenue recognition policy is to recognize revenues from product sales, software and services in accordance with ASC Topic 605,Revenue Recognition(formerly known as SAB No. 104,Revenue Recognition,and asEITF 00-21,Revenue Arrangements with Multiple Deliverables), and ASC Topic 985-605, 985-605,SoftwareSoftware(formerly known as Statement of Position97-2,Software Revenue Recognition, as amended). These standards require that revenues are recognized when persuasive evidence of an arrangement exists, product delivery, including customer acceptance, has occurred or services have been rendered, the price is fixed or determinable and collectibilitycollectability is reasonably assured. When more than one element
45
HAEMONETICS CORPORATION AND SUBSIDIARIES
NOTES TO CONSOLIDATED FINANCIAL STATEMENTS — (Continued)
such as equipment, disposables, and services are contained in a single arrangement, we allocate revenue between the elements based on each element’s relative fair value,selling price, provided that each element meets the criteria for treatment as a separate unit of accounting. An item is considered a separate unit of accounting if it has value to the customer on a stand alone basis and there is objective and reliable evidence of the fair value of the undelivered items.stand-alone basis. The fair valueselling price of the undelivered elements is determined by the price charged when the element is sold separately, or in cases when the item is not sold separately, by usingthird-party evidence of selling price or by management's best estimate of selling price. For our software arrangements accounted for under the provisions of ASC 985-605, Software, we establish fair value of undelivered elements based upon vendor specific objective evidenced under ASC Topic985-605evidence. or other objective evidence as defined in ASC Topic 605.
Product Revenues
Product sales consist of the sale of our equipment devices and the related disposables used with these devices. On product sales to end customers, revenue is recognized when both the title and risk of loss have transferred to the customer as determined by the shipping terms and all obligations have been completed. Examples of common post delivery obligations are installation and training. For product sales to distributors, we recognize revenue for both equipment and disposables upon shipment of these products to our distributors. Our standard contracts with our distributors state that title to the equipment passes to the distributors at point of shipment to a distributor’s location. The distributors are responsible for shipment to the end customer along with installation, training and acceptance of the equipment by the end customer. All shipments to distributors are at contract prices and payment is not contingent upon resale of the product.
Collection of Taxes from Customers
We are required to collect sales or valued added taxes in connection with the sale of certain of our products. We report revenues net of these amounts as they are promptly remitted to the relevant taxing authority.
Software Solutions and Services Revenues
Our software solutions business modelrevenues also include revenue from software sales which includes per collection or monthly subscription fees for the provisionlicense and support of the software as well as hosting services. With the acquisition of Global Med, a significant portion of our software sales are perpetual licenses typically accompanied with significant implementation service fees related to software customization as well as other professional and technical service fees.
We generally recognize revenue from the sale of perpetual licenses on a percentage-of-completion basis which requires us to make reasonable estimates of the extent of progress toward completion of the contract. These arrangements most often include providing customized implementation services to our customer. We also provide other services, including in some instances hosting, technical support, and maintenance, for the payment of periodic, monthly, or quarterly fees. We recognize these fees and charges as earned, typically as these services are provided during the contract period.
53
Translation of Foreign Currencies
All assets and liabilities of foreign subsidiaries are translated at the rate of exchange at year-end while sales and expenses are translated at an average rate in effect during the year. The net effect of these translation adjustments is shown in the accompanying financial statements as a component of stockholders’stockholders' equity. Foreign currency transaction gains and losses, including those resulting from inter-company transactions, are included in other income, net on the consolidated statements of income.
Cash and Cash Equivalents
Cash and cash equivalents are recorded at cost, which approximates fair market value. As of April 3, 2010, Haemonetics’ cash and cash equivalents consisted solely of investments in money market funds invested in United States Government Agency securities. Throughout the year, cash equivalents may include various instruments such as money market funds, U.S. government obligations and commercial paper with maturities of three months or less at date of acquisition. Cash and cash equivalents are recorded at cost, which approximates fair market value. As of March 31, 2012, our cash and cash equivalents consisted of investments in United States Government Agency and Institutional Money Market Funds.
46
HAEMONETICS CORPORATION AND SUBSIDIARIES
NOTES TO CONSOLIDATED FINANCIAL STATEMENTS — (Continued)
Allowance for Doubtful Accounts
We establish a specific allowance for customers when it is probable that they will not be able to meet their financial obligation. Customer accounts are reviewed individually on a regular basis and appropriate reserves are established as deemed appropriate. We also maintain a general reserve using a percentage that is established based upon the age of our receivables. We establish percentagesallowances for balances not yet due and past due accounts based on past experience.
Concentration of Credit Risk and Significant Customers
Financial instruments that potentially subject the Company to concentrations of credit risk consist primarily of cash equivalents and accounts receivable. Sales to one unaffiliated Japanese customer, the Japanese Red Cross Society, amounted to $92.6$99.5 million $87.6, $95.9 million, and $73.3$92.6 million for 2010, 2009,2012, 2011, and 2008,2010, respectively. Accounts receivable balances attributable to this customer accounted for 12.6%15.3%, 17.5%13.7%, and 15.9%12.6% of our consolidated accounts receivable at fiscal year ended 2010, 2009,2012, 2011, and 2008.2010. Sales to another global healthcare customer, "Customer B", amounted to $79.9 million in fiscal 2012. Accounts receivable balances attributable to this customer accounted for 6.6% of our consolidated accounts receivable at fiscal year ended 2012. While the accounts receivable related to the Japanese Red Cross Society and Customer B may be significant, we do not believe the credit loss risk to be significant given the consistent payment history by this customer.
these customers.
Certain other markets and industries can expose us to concentrations of credit risk. For example, in our commercial plasma business, we tend to have only a few customers in total but theyour sales are concentrated with several large in size.customers. As a result, our accounts receivable extended to any one of these commercial plasma customers can be somewhat significant at any point in time. Also, a portion of our trade accounts receivable outside the United States include sales to government-owned or supported healthcare systems in several countries, which are subject to payment delays. Payment is dependent upon the financial stability and creditworthiness of those countries’ national economies. We have not incurred significant losses on government receivables. We continually evaluate all government receivables for potential collection risks associated with the availability of government funding and reimbursement practices. If the financial condition of customers or the countries’ healthcare systems deteriorate such that their ability to make payments is uncertain, allowances may be required in future periods.
$21.0 million as of March 31, 2012 and $20.4 million as of April 2, 2011, may increase the average length of time it takes us to collect our accounts receivable in certain regions within these countries.
Property, Plant and Equipment
Property, plant and equipment is recorded at historical cost. We provide for depreciation and amortization by charges to operations using the straight-line method in amounts estimated to recover the cost of the building and improvements, equipment, and furniture and fixtures over their estimated useful lives as follows:
| Asset Classification | ||||
Estimated | ||||
| Useful Lives | ||||
| Building | 30 Years | |||
| Building improvements | 5-20 Years | |||
| Leasehold improvements | 5 Years | |||
| Plant equipment and machinery | 3-10 Years | |||
| Office equipment and information technology | 3-9 Years | |||
| Haemonetics equipment | 2-6 Years | |||
54
Depreciation expense was $35.5$38.6 million $30.5, $37.0 million, and $27.2$35.5 million for fiscal years 2010, 2009,2012, 2011, and 2008,2010, respectively.
Leasehold improvements are amortized over the lesser of their useful lives or the term of the lease. Maintenance and repairs are expensed to operations as incurred. When equipment and improvements are sold or otherwise disposed of, the asset cost and accumulated depreciation are removed from the accounts, and the resulting gain or loss, if any, is included in the statements of income. Fully depreciated assets are removed from the accounts when they are no longer in use.
Our installed base of devices includes devices owned by us and devices sold to the customer. The asset on our balance sheet entitled Haemonetics equipment consists of medical devices installed at customer sites but owned by Haemonetics (these devices remain our property).Haemonetics. Generally the customer has the right to use it for a period of time as long as they meet the conditions we have established, which among other things, generally include one or more of the following:
Purchase and consumption of a certain level of disposable products
47
HAEMONETICS CORPORATION AND SUBSIDIARIES
NOTES TO CONSOLIDATED FINANCIAL STATEMENTS — (Continued)
Payment of monthly rental fees
An asset utilization performance metric, such as performing a minimum level of procedures per month per device
Consistent with the impairment tests noted for goodwill and other intangible assets subject to amortization, we review our property, plant, and equipment assets, subject to depreciation, and their related useful lives at least once a year, or more frequently if certain conditions arise, to determine if any adverse conditions exist that would indicate the carrying value of these assets may not be recoverable. To conduct these reviews we estimate the future amount and timing of demand for these devices. Changes in expected demand can result in additional depreciation expense, which is classified as cost of goods sold. Any significant unanticipated changes in demand could impact the value of our devices and our reported operating results. There were no indicators of impairment in either fiscal year 20102012 or 2009.2011. Expenditures for normal maintenance and repairs are charged to expense as incurred.
Goodwill and Other Intangible Assets
Intangible assets acquired in a business combination, including licensed technology, are recorded under the purchase method of accounting at their estimated fair values at the date of acquisition. Goodwill represents the excess purchase price over the fair value of the net tangible and other identifiable intangible assets acquired. We amortize our other intangible assets over their useful lives using the estimated economic benefit method, as applicable.
Goodwill and certain other intangible assets, determined to have an indefinite life, areis not amortized. Instead these assets aregoodwill is reviewed for impairment at least annually in accordance with ASC Topic 350,Intangibles — Goodwill and Other(formerly known as Statement No. 142,Goodwill and Other Intangible Assets). We perform our annual impairment test on the first day of ourthe fiscal fourth quarter. We have threequarter for each of our reporting units. The test is based on a discounted cash flow analysis for each reporting unit. The test showed no evidence of impairment to our goodwill and other indefinite lived assets for either fiscal year2012, 2011 or 2010 or 2009.
and demonstrated that the fair value of each reporting unit significantly exceeded the reporting unit’s carrying value in each period.
We review our intangible assets, subject to amortization, and their related useful lives at least once a yearperiodically to determine if any adverse conditions exist that would indicate the carrying value of these assets may not be recoverable. We conduct more frequent impairment assessments ifOur review includes examination of whether certain conditions exist, including: a change in the competitive landscape, any internal decisions to pursue new or different technology strategies, a loss of a significant customer, or a significant change in the market place including changes in the prices paid for our products or changes in the size of the market for our products.
55
An impairment loss results if the carrying value of the asset exceeds the estimated fair value of the asset. Fair value is determined using different methodologies depending upon the nature of the underlying asset. If the estimate of an intangible asset’s remaining useful life is changed, the remaining carrying amount of the intangible asset is amortized prospectively over the revised remaining useful life.
Accounting for the Costs of Computer Software to be Sold, Leased, or Otherwise Marketed
ASC Topic 985-20, 985-20,SoftwareSoftware(formerly known as SFAS No. 86,Accounting for the Cost of Computer Software to be Sold, Leased or Otherwise Marketed), specifies that costs incurred internally in researching and developing a computer software product should be charged to expense until technological feasibility has been established for the product. Once technological feasibility is established, all software costs should be capitalized until the product is available for general release to customers. Technological feasibility is established when we have a detailed design of the software and when research and development activities on the underlying device, if applicable, are completed.
We review the net realizable value of capitalized assets periodically to assess the recoverability of amounts capitalized. In the future, the net realizable value may be adversely affected by the loss of a significant customer or a significant change in the market place, which could result in an impairment being recorded.
At the end of fiscal year 2010, based on a review of ongoing development plans for our next generation platelet apheresis products (Portico), we abandoned and wrote off $12.2$12.2 million associated with previously capitalized software development costs. Additionally, in connection with the acquisition of Global Med we elected to no longer market the Symphony blood bankcenter donation management system in favor of Global Med’s El Dorado application. As a result, we wrote off the carrying value of the Symphony intangible asset totaling approximately $3.5 million.
Other accruedLiabilities
Other liabilities represent costs incurred within the current year anditems payable within the next twelve months. Other accrued liabilities were $50.6$56.8 million and $37.9$46.3 million as of March 31, 2012 and April 3, 2010 and March 28, 2009,2, 2011, respectively.
48
HAEMONETICS CORPORATION AND SUBSIDIARIES
NOTES TO CONSOLIDATED FINANCIAL STATEMENTS — (Continued)
The significant items included in the fiscal year end balances were:
| April 3, | March 28, | |||||||
| 2010 | 2009 | |||||||
| (In thousands) | ||||||||
| VAT Liabilities | $ | 9,802 | $ | 6,696 | ||||
| Forward Contract Loss | 1,747 | 2,914 | ||||||
| Deferred Revenue | 19,548 | 10,833 | ||||||
| All Other | 19,542 | 17,452 | ||||||
| Total | $ | 50,639 | $ | 37,895 | ||||
| (In thousands) | March 31, 2012 | April 2, 2011 | |||||
| VAT Liabilities | $ | 6,875 | $ | 11,867 | |||
| Forward Contracts | 1,185 | 4,174 | |||||
| Deferred Revenue | 24,132 | 21,740 | |||||
| HS Core Liability | 3,654 | — | |||||
| All Other | 20,989 | 8,475 | |||||
| Total | $ | 56,835 | $ | 46,256 | |||
Research and Development and Engineering Expenses
All research and development and engineeringcosts are expensed as incurred.
Advertising Costs
All advertising costs are expensed as incurred withand are included in selling, general and administrative expenses in the exceptionconsolidated statement of the capitalization of software development cost (see Note 17). Research, developmentincome. Advertising expenses were $4.5 million, $2.8 million, and engineering expense was $26.4$1.6 million for fiscal year 2010, $23.9 million for fiscal year 2009,2012, 2011 and $24.3 million for fiscal year 2008.
56
2010, respectively.
Accounting for Shipping and Handling Costs
Shipping and handling costs are included in costs of goods sold with the exception of $11.2$10.9 million for fiscal year 2010, $11.92012, $9.7 million for fiscal year 2009,2011, and $9.8$11.2 million for fiscal year 20082010 that are included in selling, general and administrative expenses. Freight is classified in cost of goods sold when the customer is charged for freight and in selling, general and administration when the customer is not explicitly charged for freight.
Income Taxes
The income tax provision is calculated for all jurisdictions in which we operate. This process involves estimating actual current taxes due plus assessing temporary differences arising from differing treatment for tax and accounting purposes that are recorded as deferred tax assets and liabilities. Deferred tax assets are periodically evaluated to determine their recoverability and a valuation allowance is established with a corresponding additional income tax provision recorded in our consolidated statements of income if their recovery is not considered likely.more likely than not. The provision for income taxes could also be materially impacted if actual taxes due differ from our earlier estimates.
We record a liability for uncertain tax positions taken or expected to be taken in income tax returns. Uncertain tax positions are unrecognized tax benefits for which reserves have been established. Our financial statements reflect expected future tax consequences of such positions presuming the taxing authorities’ full knowledge of the position and all relevant facts.
We file income tax returns in all jurisdictions in which we operate. We establish reserves to provide for additional income taxes that may be due in future years as these previously filed tax returns are audited. These reserves have been established based on management’s assessment as to the potential exposure attributable to permanent differences and interest applicable to both permanent and temporary differences. All tax reserves are analyzed periodically and adjustments are made as events occur that warrant modification.
Foreign Currency
We recognize all derivative financial instruments in our consolidated financial statements at fair value in accordance with ASC Topic 815,Derivatives and Hedging(formerly known as FASB Statement No. 133,Accounting for Derivative Instruments and Hedging Activities). In accordance with ASC Topic 815, for those derivative instruments that are designated and qualify as hedging instruments, the hedging instrument must be designated, based upon the exposure being hedged, as a fair value hedge, cash flow hedge, or a hedge of a net investment in a foreign operation.
The accounting for changes in the fair value (i.e., gains or losses) of a derivative instrument depends on whether it has been designated and qualifies as part of a hedging relationship. The gains or losses on the forward exchange contracts designated as hedges are recorded in net revenues, cost of goods sold, and operating expenses in our consolidated statements of income when the underlying hedged transaction affects earnings. The cash flows related to the gains and losses are classified in the
49
HAEMONETICS CORPORATION AND SUBSIDIARIES
NOTES TO CONSOLIDATED FINANCIAL STATEMENTS — (Continued)
consolidated statements of cash flows as part of cash flows from operating activities. For those derivative instruments that are not designated as part of a hedging relationship we record the gains or losses in earnings currently. These gains and losses are intended to offset the gains and losses recorded on net monetary assets or liabilities that are denominated in foreign currencies. The Company recorded foreign currency losses of $2.2$0.4 million, $1.4 million, and $2.3$2.2 million in fiscal year 20102012, 2011 and fiscal year 2009,2010, respectively.
Our derivative instruments do not subject our earnings or cash flows to material risk, as gains and losses on these derivatives are intended to offset losses and gains on the item being hedged. We do not enter into derivative transactions for speculative purposes and we do not have any non-derivative instruments that are designated as hedging instruments pursuant to ASC Topic 815.
57
Stock-Based Compensation
We use the Black-Scholes option-pricing model to calculate the grant-date fair value of our stock options. The following assumptions, which involve the use of judgment by management, are used in the computation of the grant-date fair value of our stock options:
Expected Volatility — We have principally used our historical volatility as a basis to estimate expected volatility in our valuation of stock options.
Expected Term — We estimate the expected term of our options using historical exercise and forfeiture data. We believe that this historical data is currently the best estimate of the expected term of our new option grants.
Additionally, after determining the fair value of our stock options, we use judgment in establishing an estimated forfeiture rate, to determine the amount of stock based compensation to record each period:
Estimated Forfeiture Rate — We have applied, based on an analysis of our historical forfeitures, an annual forfeiture rate of 8% to all unvested stock options as of April 3, 2010, which represents the portion that we expect will be forfeited each year over the vesting period. We reevaluate this analysis periodically and adjust the forfeiture rate as necessary. Ultimately, we will only recognize expense for those shares that vest.
Valuation of Acquisitions
We allocate the amounts we pay for each acquisition to the assets we acquire and liabilities we assume based on their estimated fair values at the dates of acquisition, including acquired identifiable intangible assets, and purchased research and development.assets. We base the estimated fair value of identifiable intangible assets on detailed valuations that use historical information and market assumptions based upon the assumptions of a market participant. We allocate any excess purchase price over the fair value of the net tangible and intangible assets acquired to goodwill. The use of alternative valuation assumptions, including estimated cash flows and discount rates, and alternative estimated useful life assumptions could result in different purchase price allocations and intangible asset amortization expense in current and future periods.
In certain acquisitions, we have earn outearn-out arrangements or contingent consideration to provide potential future payments to the seller for achieving certainagreed-upon financial targets. We record the contingent consideration at its fair value at the acquisition date. Generally, we have entered into arrangements with contingent consideration that require payments in cash. As such, each quarter, we revalue the contingent consideration obligations associated with certain acquisitions to their then fair value and record the change in the fair value as contingent consideration income or expense. Increases or decreases in the fair value of the contingent consideration obligations can result from changes in assumed discount periods and rates, changes in the assumed timing and amount of revenue and expense estimates, and changes in assumed probability adjustments with respect to regulatory approval. Significant judgment is employed in determining the appropriateness of these assumptions as of the acquisition date and for each subsequent period. Accordingly, future business and economic conditions, as well as changes in any of the assumptions described above, can materially impact the amount of contingent consideration income or expense we record in any given period.
Recent Accounting Pronouncements
In February 2010,June 2011, the FASB issued Accounting Standards UpdateNo. 2010-09,2011-05, Subsequent Events, an amendmentComprehensive Income (Topic 220): Presentation of Comprehensive Income. Update No. 2011-05 updates the disclosure requirements for comprehensive income to ASC Topic 855,Subsequent Events. This update addresses practice issues for evaluatinginclude total comprehensive income, the components of net income, and disclosing subsequent events with respect to processes around issuing financial statements and SEC registration requirements.the components of other comprehensive income either in a single continuous statement of comprehensive income or in two separate but consecutive statements. The updated guidance does not affect how earnings per share is calculated or presented. The updated guidance is effective immediately.for fiscal years, and interim periods
58
50
HAEMONETICS CORPORATION AND SUBSIDIARIES
NOTES TO CONSOLIDATED FINANCIAL STATEMENTS — (Continued)
within those years, beginning after December 15, 2011, and should be applied retrospectively. Early adoption is permitted and amendments do not require any transition disclosures. We will adopt this standard in the first quarter of fiscal 2013. The adoption of ASU 2011-05 will affect the presentation of comprehensive income but will not impact our financial condition or statement of operations.
In January 2010,September 2011, the FASB issued Accounting Standards UpdateNo. 2010-06,2011-08, Improving Disclosures about Fair Value MeasurementsIntangibles — Goodwill and Other (Topic 350). This update amends ASC Topic 820,Fair Value Measurements and Disclosures,ASU 2011-08 allows entities to requirefirst assess qualitatively whether it is necessary to perform the two-step goodwill impairment test. If an entity believes, as a numberresult of additional disclosures regardingits qualitative assessment, that it is more likely than not that the fair value measurements. Specifically,of a reporting unit is less than its carrying amount, the quantitative two-step goodwill impairment test is required. An entity has the unconditional option to bypass the qualitative assessment and proceed directly to performing the first step of the goodwill impairment test. ASU 2011-08 is effective for our first quarter of fiscal 2013 but is eligible for early adoption. We do not believe adoption of this standard will have an impact on our consolidated financial statements.
In December 2011, the FASB issued Accounting Standards Update No. 2011-11, Balance Sheet (Topic 210)-Disclosures about Offsetting Assets and Liabilities (ASU 2011-11). The update requires entities to disclose (i) the amountsinformation about offsetting and related arrangements of significant transfers between Level 1financial instruments and Level 2 of the fair value hierarchy and the reasons for these transfers, (ii) the reasons for any transfers in or out of Level 3, and (iii) information in the reconciliation of recurring Level 3 measurements about purchases, sales, issuances and settlements on a gross basis. In addition to these new disclosures, the update also amends ASC Topic 820 to clarify certain existing disclosure requirements. The update becamederivative instruments. ASU 2011-11 is effective for our first quarter of fiscal year 2010 and its2014. We are currently evaluating the impact is reflected in the notes toof adopting ASU 2011-11, but currently believe there will be no significant impact on our consolidated financial statements for the year ended April 3, 2010.statements.
Standards Implemented
In October 2009, the FASB issued Accounting Standards UpdateNo. 2009-13,Revenue Recognition (Topic 605): Multiple-Deliverable Revenue Arrangements, an amendment to FASB ASC topic 605,Revenue Recognition, and Accounting Standards UpdateNo. 2009-14,Software (Topic 985): Certain Revenue Arrangements That Include Software Elements, an amendment to FASB ASC subtopic985-605,Software — Revenue Recognition(the (the “Updates”). The Updates provide guidance on arrangements that include software elements, including tangible products that have software components that are essential to the functionality of the tangible product and will no longer be within the scope of the software revenue recognition guidance, and software-enabled products that will now be subject to other relevant revenue recognition guidance. The Updates also provide authoritative guidance on revenue arrangements with multiple deliverables that are outside the scope of the software revenue recognition guidance. Under the new guidance, when vendor specific objective evidence or third party evidence of fair value for deliverables in an arrangement cannot be determined, a best estimate of the selling price is required to separate deliverables and allocate arrangement consideration using the relative selling price method. The Updates also include new disclosure requirements on how the application of the relative selling price method affects the timing and amount of revenue recognition. The Updates must beOn April 3, 2011, we adopted in the same period using the same transition method and are effective prospectively, with retrospective adoption permitted, for revenue arrangements entered into or materially modified in fiscal years beginning on or after June 15, 2010. Early adoption is also permitted; however, early adoption during an interim period requires retrospective application from the beginning of the fiscal year. The Company is currently assessing the timing and method of adoption, as well as the possible impact of this guidance, which did not have a material impact on itsour financial position and results of operations.
In May 2011, the FASB issued Accounting Standards Update No. 2011-04, Fair Value Measurement (Topic 820): Amendments to Achieve Common Fair Value Measurement and Disclosure Requirements in U.S. GAAP and IFRSs. Update No. 2011-04 updates the accounting guidance related to fair value measurements that an acquiring entity be identified in all business combinations. ASC Topic 805 also requires the acquiring entityresults in a business combination to recognize all (and only) the assets acquired and liabilities assumed in the transaction; establishes the acquisition-dateconsistent definition of fair value asand common requirements for measurement of and disclosure about fair value between U.S. GAAP and International Financial Reporting Standards (IFRS). ASU 2011-04 changes certain fair value measurement principles and enhances the measurement objectivedisclosure requirements particularly for all assets acquired and liabilities assumed; and requires the acquirer to disclose to investors and other users all of the information they need to evaluate and understand the nature and financial effect of the business combination. This statement became effective for our fiscal year 2010 and itslevel 3 fair value measurements. On January 1, 2012, we adopted this guidance, which did not have a material impact is reflected inon our financial position andor results of operationsoperations.
3.ACQUISITIONS
During fiscal 2011 and 2010 we completed several acquisitions as part of our growth initiatives. We did not complete any acquisitions during fiscal 2012.
Fiscal 2011 Acquisition
ACCS Acquisition
On December 28, 2010, Haemonetics acquired certain assets of Applied Critical Care Services, Inc. (ACCS) for $6.4 million. ACCS was a manufacturer’s representative for Haemonetics engaged in the selling and servicing of the TEG analyzer product
51
HAEMONETICS CORPORATION AND SUBSIDIARIES
NOTES TO CONSOLIDATED FINANCIAL STATEMENTS — (Continued)
line. The purchase price was allocated to customer relationships of $4.5 million, other liabilities of $0.8 million, and goodwill of $2.7 million.
Fiscal 2010 Acquisitions
Global Med Acquisition
On March 31, 2010 the Company completed its cash tender offer for the year ended April 3, 2010. The Company’s acquisition of L’Attitude Medical Systems, Inc. (“Neoteric”), asset acquisition of the blood collection and processing business unit of Engineering and Research Associates, Inc. (“SEBRA”), and stock purchaseshares of Global Med Technologies, Inc. (“Global Med”) during fiscal year 2010 were accounted for in accordance to the requirements of ASC Topic 805 — see Note 3.
59
| (In thousands) | ||||
Consideration for Haemoscope Corporation | ||||
| Cash portion of consideration | $ | 45,080 | ||
| Other acquisition-related costs: | ||||
| Acquisition-related costs | $ | 511 | ||
| Total acquisition related costs | $ | 45,591 | ||
Purchase Price Allocation
The following chart summarizes the final purchase price allocation, including the valuation of intangible assets:allocation:
| (In thousands) | ||||
| Intangible assets subject to amortization | $ | 26,060 | ||
| Goodwill | 17,530 | |||
| Other assets | 2,876 | |||
| Current liabilities | (875 | ) | ||
| Total | $ | 45,591 | ||
60
| (In thousands) | |||
| Goodwill | $ | 39,554 | |
| Intangible assets subject to amortization | 39,920 | ||
| Trade accounts receivable | 6,848 | ||
| Other assets | 7,639 | ||
| Deferred taxes | (10,928 | ) | |
| Notes payable | (7,701 | ) | |
| Deferred revenue | (7,180 | ) | |
| Other liabilities | (7,725 | ) | |
| Total | $ | 60,427 | |
| Risk-Adjusted | ||||||||||||
| Weighted Average | Discount Rate Used | |||||||||||
| Amount | Amortization | in Purchase Price | ||||||||||
| Assigned | Period | Allocation | ||||||||||
| (In thousands) | ||||||||||||
| Amortizable intangible assets | ||||||||||||
| Technology — developed | $ | 9,500 | 12.0 years | 23.0 | % | |||||||
| Customer relationships | $ | 15,960 | 11.0 years | 23.0 | % | |||||||
| Trade names | $ | 600 | 12.0 years | 23.0 | % | |||||||
| Goodwill | $ | 17,530 | ||||||||||
61
SEBRA Acquisition
On September 4, 2009, Haemonetics acquired the assets of the blood collection and processing business unit (“SEBRA”) of Engineering and Research Associates, Inc., a leading provider of blood and medical manufacturing technologies. SEBRA products, which include tubing sealers, blood shakers, sterile connection systems, mobile lounges and ancillary products used in blood collection and processing, complement Haemonetics’ portfolio and add depth to HaemoneticsHaemonetics’ blood bankcenter and plasma product lines. The purchase price of $12.8 millionwas $12.8 million.
Neoteric Acquisition
On April 16, 2009, Haemonetics acquired the outstanding shares of Neoteric. Neoteric is a medical information management company that markets a full end-to-end suite of products to track, allocate, release, and dispense hospital blood units while controlling inventory and recording the disposition of blood. The Company is still inacquisition strategically broadened Haemonetics’ blood management solutions. The purchase price of $6.6 million plus contingent consideration of $5.0 million was allocated to other intangible assets of $5.0 million, deferred tax liabilities of $1.6 million, and goodwill of $8.2 million.
The contingent consideration was based upon estimated annual revenue growth for the process of evaluatingthree years following the information necessaryacquisition, at established profitability thresholds, and was not limited. Using projected revenues for fiscal years 2011, 2012, and 2013, an analysis was performed that probability weighted three performance outcomes for the noted years. The performance outcomes were then discounted using a discount rate commensurate with the risks associated with Neoteric to determinearrive at the allocation of fair value of the assetscontingent consideration. The Company was required to reassess the fair value of contingent consideration on a periodic basis. During fiscal 2012, 2011 and liabilities acquired. The preliminary purchase price allocation will be finalized once2010, this business did not achieve the Company has completed this evaluation, which will occur not later than one year from the acquisition date. Net revenuesnecessary revenue growth milestones for the SEBRA operations afterformer shareholders to receive additional performance payments. As such, we reduced the acquisition date are included in our consolidated results for fiscal year 2010.contingent liability by $1.6 million, $1.9
62
52
HAEMONETICS CORPORATION AND SUBSIDIARIES
NOTES TO CONSOLIDATED FINANCIAL STATEMENTS — (Continued)
million and $2.3 million during fiscal 2012, 2011 and 2010, respectively, and recorded the adjustments as contingent consideration income in the consolidated statements of income. Interest expense accretion on the contingent consideration was $0.6 million in fiscal 2010, and interest expense reversal was $0.6 million and $0.4 million in fiscal 2012 and 2011, respectively.
| (In thousands) | ||||
| Goodwill | $ | 50,109 | ||
| Intangible assets subject to amortization | 25,962 | |||
| Trade accounts receivable | 6,344 | |||
| Other assets | 10,526 | |||
| Deferred taxes | (9,087 | ) | ||
| Notes payable | (7,833 | ) | ||
| Deferred revenue | (8,064 | ) | ||
| Other liabilities | (7,676 | ) | ||
| Total | $ | 60,281 | ||
4.PRODUCT WARRANTIES
63
warranty expense based on our historical warranty experience, and we periodically assess the adequacy of our warranty accrual and make adjustments as necessary.
| April 3, | March 28, | |||||||
| 2010 | 2009 | |||||||
| (In thousands) | ||||||||
| Warranty accrual as of the beginning of the period | $ | 1,835 | $ | 929 | ||||
| Warranty provision | 1,313 | 2,155 | ||||||
| Warranty spending | (2,245 | ) | (1,249 | ) | ||||
| Warranty accrual as of the end of the period | $ | 903 | $ | 1,835 | ||||
| (In thousands) | March 31, 2012 | April 2, 2011 | |||||
| Warranty accrual as of the beginning of the period | $ | 1,273 | $ | 903 | |||
| Warranty provision | 2,430 | 1,823 | |||||
| Warranty spending | (2,907 | ) | (1,453 | ) | |||
| Warranty accrual as of the end of the period | $ | 796 | $ | 1,273 | |||
5.INVENTORIES |
Inventories are stated at the lower of cost or market and include the cost of material, labor and manufacturing overhead. Cost is determined on thefirst-in, first-out basis.method.
| (In thousands) | March 31, 2012 | April 2, 2011 | |||||
| Raw materials | $ | 41,219 | $ | 26,404 | |||
| Work-in-process | 4,640 | 4,352 | |||||
| Finished goods | 71,304 | 53,631 | |||||
| $ | 117,163 | $ | 84,387 | ||||
53
| April 3, | March 28, | |||||||
| 2010 | 2009 | |||||||
| (In thousands) | ||||||||
| Raw materials | $ | 25,850 | $ | 23,778 | ||||
| Work-in-process | 3,825 | 8,732 | ||||||
| Finished goods | 50,278 | 44,012 | ||||||
| $ | 79,953 | $ | 76,522 | |||||
HAEMONETICS CORPORATION AND SUBSIDIARIES
NOTES TO CONSOLIDATED FINANCIAL STATEMENTS — (Continued)
6.GOODWILL AND OTHER INTANGIBLE ASSETS
The changes in the carrying amount of goodwill for fiscal year 2009, 20082012 and 20072011 are as follows:
| (In thousands) | ||||
| Carrying amount as of March 29, 2008 | $ | 54,222 | ||
| Medicell Ltd.(a) | 1,238 | |||
| Altivation Software Inc.(b) | 1,690 | |||
| Effect of change in rates used for translation | (724 | ) | ||
| Carrying amount as of March 28, 2009 | $ | 56,426 | ||
| Global Med(c) | 50,109 | |||
| SEBRA(d) | 3,521 | |||
| L’Attitude Medical Systems Inc. (Neoteric)(e) | 8,672 | |||
| Altivation Software Inc.(b) | 2,110 | |||
| Medicell Ltd.(a) | 583 | |||
| Effect of change in rates used for translation | (878 | ) | ||
| Carrying amount as of April 3, 2010 | $ | 120,543 | ||
| (In thousands) | |||
| Carrying amount as of April 3, 2010 | $ | 109,988 | |
| SEBRA (a) | 163 | ||
| Altivation Software Inc. | 228 | ||
| ACCS (b) | 2,662 | ||
| Effect of change in foreign currency exchange rates | 2,326 | ||
| Carrying amount as of April 2, 2011 | $ | 115,367 | |
| Effect of change in foreign currency exchange rates | (309 | ) | |
| Carrying amount as of March 31, 2012 | $ | 115,058 | |
| (a) | ||
64
| See Note 3, Acquisitions, for a full description of the acquisition of the SEBRA® assets, which occurred on September 4, 2009. |
| (b) | See Note 3, Acquisitions, for a full description of the acquisition of |
Other Intangible Assets
Other intangible assets include the value assigned to license rights and other technology, patents, customer contracts and relationships, software technology, and a trade name. The estimated useful lives for all of these intangible assets are 5 to 20 years.
Aggregate amortization expense for amortized other intangible assets for fiscal year 2010, 2009,2012, 2011, and 20082010 was $7.7$11.4 million $6.0, $11.1 million, and $4.1$7.7 million, respectively. Future annual amortization expense on other intangible assets is expected to approximate $11.7$11.0 million for fiscal year 2011, $11.22013, $10.7 million for fiscal year 2012, $11.12014, $10.1 million for fiscal year 2013, $10.82015, $9.7 million for fiscal year 20142016 and $9.6$9.4 million for fiscal year 2015.2017.
Amortized Intangibles
| Gross Carrying | Accumulated | Weighted Average | ||||||||||
| Amount | Amortization | Useful Life | ||||||||||
| (In thousands) | (In thousands) | (In years) | ||||||||||
As of April 3, 2010 | ||||||||||||
| Amortized Intangibles | ||||||||||||
| Patents | $ | 11,928 | $ | 5,801 | 11 | |||||||
| Capitalized software | 7,642 | 498 | 6 | |||||||||
| Other technology | 51,826 | 14,187 | 10 | |||||||||
| Customer contracts and related relationships | 45,897 | 11,549 | 11 | |||||||||
| Trade name | 1,502 | 658 | 7 | |||||||||
| Total Intangibles | $ | 118,795 | $ | 32,693 | 10 | |||||||
Gross Carrying Amount | Accumulated Amortization | Weighted Average Useful Life | ||||||||
| (In thousands) | (In thousands) | (In years) | ||||||||
| As of March 31, 2012 | ||||||||||
| Patents | $ | 13,463 | $ | 7,843 | 11 | |||||
| Capitalized software | 20,597 | 1,394 | 6 | |||||||
| Other technology | 42,693 | 20,120 | 11 | |||||||
| Customer contracts and related relationships | 69,361 | 23,639 | 12 | |||||||
| Trade names | 5,408 | 1,977 | 10 | |||||||
| Total intangibles | $ | 151,522 | $ | 54,973 | 11 | |||||
| Gross Carrying | Accumulated | Weighted Average | ||||||||||
| Amount | Amortization | Useful Life | ||||||||||
| (In thousands) | (In thousands) | (In years) | ||||||||||
As of March 28, 2009 | ||||||||||||
| Amortized Intangibles | ||||||||||||
| Patents | $ | 12,008 | $ | 4,945 | 11 | |||||||
| Capitalized software | 18,994 | 572 | 6 | |||||||||
| Other technology | 28,784 | 11,501 | 12 | |||||||||
| Customer contracts and related relationships | 29,886 | 8,240 | 12 | |||||||||
| Trade name | 1,097 | 250 | 7 | |||||||||
| Total Intangibles | $ | 90,769 | $ | 25,508 | 11 | |||||||
Gross Carrying Amount | Accumulated Amortization | Weighted Average Useful Life | ||||||||
| (In thousands) | (In thousands) | (In years) | ||||||||
| As of April 2, 2011 | ||||||||||
| Patents | $ | 12,704 | $ | 6,827 | 11 | |||||
| Capitalized software | 14,506 | 656 | 6 | |||||||
| Other technology | 43,244 | 17,391 | 11 | |||||||
| Customer contracts and related relationships | 69,908 | 17,740 | 12 | |||||||
| Trade names | 5,254 | 1,213 | 10 | |||||||
| Total intangibles | $ | 145,616 | $ | 43,827 | 11 | |||||
54
HAEMONETICS CORPORATION AND SUBSIDIARIES
NOTES TO CONSOLIDATED FINANCIAL STATEMENTS — (Continued)
The changes to the net carrying value of our intangible assets from April 2, 2011 to March 31, 2012 reflect amortization expense and the effect of exchange rate changes in the translation of our intangible assets held by our international subsidiaries.
7.DERIVATIVES AND FAIR VALUE MEASUREMENTS
We manufacture, market and sell our products globally. Approximately 52.9%For the fiscal year ended March 31, 2012, approximately 51.6% of our sales arewere generated outside the U.S. in local currencies. We also incur certain manufacturing, marketing and selling costs in international markets in local currency. Accordingly, our earnings and cash flows are exposed to market risk from changes in foreign currency exchange rates relative to the U.S. dollar, our reporting currency.
65
We have a program in place that is designed to mitigate our exposure to changes in foreign currency exchange rates. That program includes the use of derivative financial instruments to minimize for a period of time, the unforeseen impact on our financial results from changes in foreign exchange rates. We utilize forward foreign currency contracts to hedge the anticipated cash flows from transactions denominated in foreign currencies, primarily the Japanese Yen and the Euro, and to a lesser extent the Swiss Franc, British Pound Sterling and the Canadian Dollar. This does not eliminate the volatility of foreign exchange rates, but because we generally enter into forward contracts one year out, rates are fixed for a one-yearone-year period, thereby facilitating financial planning and resource allocation.
Designated Foreign Currency HedgesHedge Contracts
All of our designated foreign currency hedge contracts as of March 31, 2012 and April 3, 2010 and March 28, 20092, 2011 were cash flow hedges under ASC Topic 815,Derivatives and Hedging(formerly known as FASB Statement No. 133,Accounting for Derivative Instruments and Hedging Activities). We record the effective portion of any change in the fair value of designated foreign currency hedge contracts in other comprehensive income (OCI)Other Comprehensive Income in the Statement of Stockholders’ Equity and Comprehensive Income until the related third-party transaction occurs. Once the related third-party transaction occurs, we reclassify the effective portion of any related gain or loss on the designated foreign currency hedge contracts to earnings. In the event the hedged forecasted transaction does not occur, or it becomes probable that it will not occur, we would reclassify the amount of any gain or loss on the related cash flow hedge to earnings at that time. We had designated foreign currency derivative instruments designated as cash flow hedgeshedge contracts outstanding in the contract amount of $135.4$162.1 million as of April 3, 2010March 31, 2012 and $117.1$154.8 million as of March 28, 2009.April 2, 2011.
During fiscal year 2010,2012 and 2011, we recognized net losses of $3.4$3.2 million and $0.8 million, respectively, in earnings on our cash flow hedges. All currency cash flow hedges outstanding as of April 3, 2010March 31, 2012 mature within twelve months. AsFor the fiscal year ended March 31, 2012, $3.1 million of April 3, 2010, $1.4 million of net gains, net of tax, were recorded in OCIOther Comprehensive Income to recognize the effective portion of the fair value of any designated foreign currency derivative instrumentshedge contracts that are, or previously were, designated as foreign currency cash flow hedges, as compared to net losses of $4.1 million for the fiscal year ended April 2, 2011. At March 31, 2012, gains of $4.9$3.1 million as of March 28, 2009. As of April 3, 2010, $1.4 million of net gains,, net of tax, may be reclassified to earnings within the next twelve months.
Non-designated Foreign Currency Contracts
We manage our exposure to changes in foreign currency on a consolidated basis to take advantage of offsetting transactions and balances. We use currency forward contracts as a part of our strategy to manage exposure related to foreign currency denominated monetary assets and liabilities. These foreign currency forward contracts are entered into for periods consistent with currency transaction exposures, generally one month. They are not designated as cash flow or fair value hedges under ASC Topic 815. These forward contracts aremarked-to-market with changes in fair value recorded to earnings; and are entered into for periods consistent with currency transaction exposures, generally one month.earnings. We had non-designated foreign currency derivative instruments not designated as hedgeshedge contracts under ASC Topic 815 outstanding in the contract amount of $29.6$45.5 million as of April 3, 2010March 31, 2012 and $51.6$45.9 million as of March 28, 2009.April 2, 2011.
55
HAEMONETICS CORPORATION AND SUBSIDIARIES
NOTES TO CONSOLIDATED FINANCIAL STATEMENTS — (Continued)
Fair Value of Derivative Instruments
The following tables presenttable presents the effect of our derivative instruments designated as cash flow hedges and those not designated as hedging instruments under ASC Topic 815 in our consolidated statement of income for the fiscal year 2010.ended March 31, 2012.
| Amount of Gain | ||||||||||||||||||||
| Recognized in | ||||||||||||||||||||
| Earnings on | ||||||||||||||||||||
| Amount of Loss | Ineffective | |||||||||||||||||||
| Amount of | Reclassified | Portion and | ||||||||||||||||||
| Loss | from OCI into | Amount | ||||||||||||||||||
| Recognized in | Earnings | Location in | Excluded from | Location in | ||||||||||||||||
| OCI (Effective | (Effective | Statement of | Effectiveness | Statement of | ||||||||||||||||
Cash Flow Hedges | Portion) | Portion) | Operations | Testing (*) | Operations | |||||||||||||||
| (In thousands) | ||||||||||||||||||||
| Foreign exchange contracts | $ | (477 | ) | $ | (809 | ) | Net revenues | $ | 529 | Other expense | ||||||||||
| $ | (477 | ) | $ | (809 | ) | $ | 529 | |||||||||||||
| Derivative Instruments (In thousands) | Amount of Gain/(Loss) Recognized in OCI (Effective Portion) | Amount of Loss Reclassified from OCI into Earnings (Effective Portion) | Location in Statement of Operations | Amount of Gain/(Loss) Excluded from Effectiveness Testing (*) | Location in Statement of Operations | |||||||||||
| Designated foreign currency hedge contracts | $ | 3,140 | $ | (3,230 | ) | Net revenues, COGS, and SG&A | $ | 67 | Other income (expense), net | |||||||
| Non-designated foreign currency contracts | $ | (1,666 | ) | Other income (expense), net | ||||||||||||
| $ | 3,140 | $ | (3,230 | ) | $ | (1,599 | ) | |||||||||
| (*) | We exclude the difference between the spot rate and hedge forward rate from our effectiveness testing. | |
We did not have fair value hedges or net investment hedges outstanding as of March 31, 2012 or April 3, 2010 or March 28, 2009.2, 2011.
ASC Topic 815 requires all derivative instruments to be recognized at their fair values as either assets or liabilities on the balance sheet. We determine the fair value of our derivative instruments using the framework prescribed by ASC Topic 820,Fair Value Measurements and Disclosures(formerly known as FASB Statement No. 157,Fair Value Measurements), by considering the estimated amount we would receive or pay to sell or transfer these instruments at the reporting date and by taking into account current interest rates, currency exchange rates, the creditworthiness of the counterparty for assets, and our creditworthiness for liabilities. In certain instances, we may utilize financial models to measure fair value. Generally, we use inputs that include quoted prices for similar assets or liabilities in active markets; quoted prices for identical or similar assets or liabilities in markets that are not active; other observable inputs for the asset or liability; and inputs derived principally from, or corroborated by, observable market data by correlation or other means. As of April 3, 2010,March 31, 2012, we have classified our derivative assets and liabilities within Level 2 of the fair value hierarchy prescribed by ASC Topic 815, as discussed below, because these observable inputs are available for substantially the full term of our derivative instruments.
67
The following tables present the fair value of our derivative instruments as they appear in our consolidated balance sheets as of March 31, 2012 and April 3, 20102, 2011 by type of contract and whether it is a qualifying hedge under ASC Topic 815.
| Location in | Balance as of | |||||
| Balance Sheet | April 3, 2010 | |||||
| (In thousands) | ||||||
Derivative Assets: | ||||||
| Designated Hedging Instruments | ||||||
| Currency Exchange Contracts | Other current assets | $ | 4,407 | |||
| $ | 4,407 | |||||
Derivative Liabilities: | ||||||
| Designated Hedging Instruments | ||||||
| Currency Exchange Contracts | Other accrued liabilities | $ | 1,747 | |||
| $ | 1,747 | |||||
| (In thousands) | Location in Balance Sheet | Balance as of March 31, 2012 | Balance as of April 2, 2011 | ||||||
| Derivative Assets: | |||||||||
| Designated foreign currency hedge contracts | Other current assets | $ | 6,186 | $ | 2,563 | ||||
| $ | 6,186 | $ | 2,563 | ||||||
| Derivative Liabilities: | |||||||||
| Designated foreign currency hedge contracts | Other current liabilities | $ | 1,185 | $ | 4,174 | ||||
| $ | 1,185 | $ | 4,174 | ||||||
Other Fair Value Measurements
On a recurring basis, we measure certain financial assets and financial liabilities at fair value, including our money market funds, foreign currency derivative contracts, and contingent consideration. ASC Topic 820 defines fair value as the price that would be received to sell an asset or paid to transfer a liability in an orderly transaction between market participants at the
56
HAEMONETICS CORPORATION AND SUBSIDIARIES
NOTES TO CONSOLIDATED FINANCIAL STATEMENTS — (Continued)
measurement date. As such, fair value is a market-based measurement that should be determined based on assumptions that market participants would use in pricing an asset or liability. We base fair value upon quoted market prices, where available. Where quoted market prices or other observable inputs are not available, we apply valuation techniques to estimate fair value.
ASC Topic 820 establishes a three-level valuation hierarchy for disclosure of fair value measurements. The categorization of assets and liabilities within the valuation hierarchy is based upon the lowest level of input that is significant to the measurement of fair value. The three levels of the hierarchy are defined as follows:
Level 1 — Inputs to the valuation methodology are quoted market prices for identical assets or liabilities.
68
Level 2 — Inputs to the valuation methodology are other observable inputs, including quoted market prices for similar assets or liabilities and market-corroborated inputs.
Our money market funds carried at fair value are generally classified within Level 1 of the fair value hierarchy because they are valued using quoted market prices.
We recognize all derivative financial instruments in our consolidated financial statements at fair value in accordance with ASC Topic 815,Derivatives and Hedging(formerly known as FASB Statement No. 133,Accounting for Derivative Instruments and Hedging Activities). We determine the fair value of these instruments using the framework prescribed by ASC Topic 820 by considering the estimated amount we would receive or pay to terminate these agreements at the reporting date and by taking into account current spot rates, the creditworthiness of the counterparty for assets, and our creditworthiness for liabilities. We have classified our foreign currency hedge contracts within Level 2 of the fair value hierarchy because these observable inputs are available for substantially the full term of our derivative instruments. ForThe fair value of our foreign currency hedge contracts is the fiscal year ended April 3, 2010, we have classified our other liabilities — contingent consideration relating to our acquisition of Neoteric within Level 3estimated amount that the Company would receive or pay upon liquidation of the fair value hierarchy becausecontracts, taking into account the value is determined using significant unobservable inputs.change in currency exchange rates.
Fair Value Measured on a Recurring Basis
Financial assets and financial liabilities measured at fair value on a recurring basis consist of the following as of April 3, 2010:March 31, 2012:
| Quoted | Significant | |||||||||||||||
| Market Prices | Other | Significant | ||||||||||||||
| for Identical | Observable | Unobservable | ||||||||||||||
| Assets | Inputs | Inputs | ||||||||||||||
| (Level 1) | (Level 2) | (Level 3) | Total | |||||||||||||
| (In thousands) | ||||||||||||||||
Assets | ||||||||||||||||
| Money market funds | $ | 109,564 | $ | — | $ | — | $ | 109,564 | ||||||||
| Forward currency exchange contracts | — | 4,407 | — | 4,407 | ||||||||||||
| $ | 109,564 | $ | 4,407 | $ | — | $ | 113,971 | |||||||||
Liabilities | ||||||||||||||||
| Forward currency exchange contracts | $ | — | $ | 1,747 | $ | — | $ | 1,747 | ||||||||
| Other liabilities — contingent consideration | $ | — | — | 4,101 | $ | 4,101 | ||||||||||
| $ | — | $ | 1,747 | $ | 4,101 | $ | 5,848 | |||||||||
| (In thousands) | Quoted Market Prices for Identical Assets (Level 1) | Significant Other Observable Inputs (Level 2) | Significant Unobservable Inputs (Level 3) | Total | |||||||||||
| Assets | |||||||||||||||
| Money market funds | $ | 194,574 | $ | — | $ | — | $ | 194,574 | |||||||
| Forward currency exchange contracts | — | 6,186 | — | 6,186 | |||||||||||
| $ | 194,574 | $ | 6,186 | $ | — | $ | 200,760 | ||||||||
| Liabilities | |||||||||||||||
| Forward currency exchange contracts | $ | — | $ | 1,185 | $ | — | $ | 1,185 | |||||||
| Other liabilities — contingent consideration | — | — | — | — | |||||||||||
| $ | — | $ | 1,185 | $ | — | $ | 1,185 | ||||||||
Neoteric contingent consideration
Under ASC Topic 805, Business Combinations, we established a liability for payments to former shareholders of Neoteric which were contingent on the performance of the methods usedBlood Track business in the first three years post acquisition, beginning with fiscal 2010. As of April 2, 2011, the liability was $2.3 million. We have reviewed the expected performance versus the performance thresholds for payment. Because the expected performance thresholds would not be achieved, we recorded an adjustment to determine the fair value of the Level 3 liabilities (other liabilities — contingent consideration) is included within Note 3 — Acquisitions. The table below provides a reconciliationconsideration liability. This appears as contingent consideration income of $1.6 million in the accompanying consolidated statements of income. Interest expense reversal on the contingent consideration was $0.6 million in fiscal 2012.
In September 2011, we entered into an agreement to release the Company from the contingent consideration due to the former shareholders of Neoteric. Under the terms of the beginning and ending Level 3 liabilities foragreement, the fiscal year ended April 3, 2010.former shareholders of Neoteric received $0.7 million in
57
| Fair Value | ||||
| Measurements | ||||
| Using Significant | ||||
| Unobservable | ||||
| Inputs | ||||
| (Level 3) | ||||
| (In thousands) | ||||
| Beginning balance | $ | — | ||
| Transfers into Level 3 | 4,988 | |||
| Accretion of interest expense on contingent consideration | 588 | |||
| Contingent consideration income | (2,345 | ) | ||
| Currency translation adjustment | 870 | |||
| Ending balance | $ | 4,101 | ||
69
HAEMONETICS CORPORATION AND SUBSIDIARIES
NOTES TO CONSOLIDATED FINANCIAL STATEMENTS — (Continued)
exchange for releasing the Company from any future claims for contingent consideration. The Company paid the $0.7 million settlement amount during September 2011 and has recorded the associated expense in the selling, general and administrative line item in the accompanying consolidated statements of income.
Other Fair Value Disclosures
The fair value of our long-term debt obligationsreal estate mortgage obligation was $5.1$3.1 million and $6.2$4.1 million at March 31, 2012 and April 3, 20102, 2011, respectively. This liability is a Level 2 financial instrument and March 28, 2009, respectively. Refer to Note 8 — Notes Payable and Long-Term Debt forthe fair value has been determined using a discussionnet present value calculation of our debt obligations.the future mortgage payments due discounted by a rate derived from corresponding U.S. Treasury rates.
| 8. | NOTES PAYABLE AND LONG-TERM DEBT |
Notes payable and long-term debt consistsconsisted of the following:
| April 3, | March 28, | |||||||
| 2010 | 2009 | |||||||
| (In thousands) | ||||||||
| Real estate mortgage | $ | 5,344 | $ | 6,038 | ||||
| Short-term notes payable | 7,474 | — | ||||||
| Notes payable assumed in acquisition | 7,833 | — | ||||||
| $ | 20,651 | $ | 6,038 | |||||
| Less — Current portion | $ | 16,062 | $ | 695 | ||||
| $ | 4,589 | $ | 5,343 | |||||
| (In thousands) | March 31, 2012 | April 2, 2011 | |||||
| Real estate mortgage | $ | 3,771 | $ | 4,590 | |||
| Short-term notes payable | — | 289 | |||||
| $ | 3,771 | $ | 4,879 | ||||
| Less-Current portion | $ | 894 | $ | 913 | |||
| $ | 2,877 | $ | 3,966 | ||||
Real Estate Mortgage Agreement
In December 2000, we entered into a $10.0$10.0 million real estate mortgage agreement (the “Mortgage Agreement”) with an investment firm. The Mortgage Agreement requires principal and interest payments of $0.1$0.1 million per month for a period of 180 months, commencing February 1, 2001. The entire balance of the loan may be repaid at any time after February 1, 2006, subject to a prepayment premium, which is calculated based upon the change in the current weekly average yield of Ten (10)-year U.S. Treasury Constant Maturities, the principal balance due and the remaining loan term. The Mortgage Agreement provides for interest to accrue on the unpaid principal balance at a rate of 8.41% per annum. Borrowings under the Mortgage Agreement, with a carrying value of approximately $3.8 million and $4.6 million as of March 31, 2012 and April 2, 2011, respectively, are secured by the land, building and building improvements at our headquarters and manufacturing facility in the U.S. with a collective carrying value of approximately $5.3 million and $4.4 million as of April 3, 2010 and March 28, 2009, respectively.U.S.. There are no financial covenants in the terms and conditions of this agreement.
As of April 3, 2010, our subsidiary, Haemonetics Japan Co. Ltd., had $7.5 million outstanding in unsecured debt.
70
| (In thousands) | ||||
Fiscal Year Ending | ||||
| 2011 | $ | 16,062 | ||
| 2012 | 821 | |||
| 2013 | 892 | |||
| 2014 | 970 | |||
| 2015 | 1,055 | |||
| 2016 and thereafter | 851 | |||
| $ | 20,651 | |||
| Fiscal Year Ending | |||
| 2013 | $ | 894 | |
| 2014 | 971 | ||
| 2015 | 1,056 | ||
| 2016 | 850 | ||
| 2017 and thereafter | — | ||
| $ | 3,771 | ||
9. | INCOME TAXES |
Domestic and foreign income before provision for income tax is as follows:
| April 3, | March 28, | March 29, | ||||||||||
| 2010 | 2009 | 2008 | ||||||||||
| (In thousands) | ||||||||||||
| Domestic | $ | 42,259 | $ | 55,240 | $ | 53,365 | ||||||
| Foreign | 39,011 | 29,762 | 23,937 | |||||||||
Total | $ | 81,270 | $ | 85,002 | $ | 77,302 | ||||||
| (In thousands) | March 31, 2012 | April 2, 2011 | April 3, 2010 | ||||||||
| Domestic | $ | 40,666 | $ | 58,040 | $ | 42,260 | |||||
| Foreign | $ | 48,832 | $ | 52,041 | $ | 39,011 | |||||
| Total | $ | 89,498 | $ | 110,081 | $ | 81,271 | |||||
58
HAEMONETICS CORPORATION AND SUBSIDIARIES
NOTES TO CONSOLIDATED FINANCIAL STATEMENTS — (Continued)
The income tax provision contains the following components:
| Year Ended | ||||||||||||
| April 3, | March 28, | March 29, | ||||||||||
| 2010 | 2009 | 2008 | ||||||||||
| (In thousands) | ||||||||||||
| Current | ||||||||||||
| Federal | $ | 10,088 | $ | 16,809 | $ | 18,763 | ||||||
| State | 887 | 1,768 | 1,586 | |||||||||
| Foreign | 9,333 | 5,476 | 5,855 | |||||||||
| Total current | 20,308 | 24,053 | 26,204 | |||||||||
| Deferred | ||||||||||||
| Federal | 4,103 | 1,779 | (1,314 | ) | ||||||||
| State | 259 | (1 | ) | (304 | ) | |||||||
| Foreign | (1,770 | ) | (133 | ) | 736 | |||||||
| Total deferred | 2,592 | 1,645 | (882 | ) | ||||||||
| Total tax expense | $ | 22,900 | $ | 25,698 | $ | 25,322 | ||||||
71
| (In thousands) | March 31, 2012 | April 2, 2011 | April 3, 2010 | ||||||||
| Current | |||||||||||
| Federal | $ | 8,505 | $ | 14,982 | $ | 10,088 | |||||
| State | 2,275 | 2,111 | 887 | ||||||||
| Foreign | 5,954 | 7,226 | 9,334 | ||||||||
| Total current | $ | 16,734 | $ | 24,319 | $ | 20,309 | |||||
| Deferred | |||||||||||
| Federal | 7,522 | 4,931 | 4,103 | ||||||||
| State | (597 | ) | 438 | 259 | |||||||
| Foreign | (1,047 | ) | 413 | (1,770 | ) | ||||||
| Total deferred | $ | 5,878 | $ | 5,782 | $ | 2,592 | |||||
| Total | $ | 22,612 | $ | 30,101 | $ | 22,901 | |||||
Included in the domestic income before provision for income tax and federal income tax provisions for fiscal years 2010, 20092012, 2011 and 20082010 are approximately $8.1$1.6 million $6.8, $10.8 million and $1.7$8.1 million, respectively, provided on foreign source income of approximately $23.2$6.2 million $19.6, $31.0 million and $6.0$23.2 million for fiscal year 2010, 20092012, 2011 and 2008,2010, respectively, for taxes which are payable in the United States.
Tax affected, significant temporary differences comprising the net deferred tax assetassets/(liabilities) are as follows:
| April 3, | March 28, | |||||||
| 2010 | 2009 | |||||||
| (In thousands) | ||||||||
| Depreciation | $ | (8,317 | ) | $ | (3,345 | ) | ||
| Amortization | (14,996 | ) | (8,985 | ) | ||||
| Inventory | 1,169 | 2,012 | ||||||
| Hedging | (1,329 | ) | (907 | ) | ||||
| Accruals and reserves | 9,419 | 5,126 | ||||||
| Net operating loss carryforward | 6,904 | 3,861 | ||||||
| Stock based compensation | 8,226 | 7,087 | ||||||
| Tax credit carryforward, net | 1,594 | 2,580 | ||||||
| Gross deferred taxes | 2,670 | 7,429 | ||||||
| Less valuation allowance | (378 | ) | (378 | ) | ||||
| Net deferred tax asset | $ | 2,292 | $ | 7,051 | ||||
| (In thousands) | March 31, 2012 | April 2, 2011 | |||||
| Depreciation | $ | (17,208 | ) | $ | (9,447 | ) | |
| Amortization | (19,249 | ) | (20,597 | ) | |||
| Inventory | 4,224 | 2,244 | |||||
| Hedging | (589 | ) | 1,120 | ||||
| Accruals and reserves | 6,352 | 5,950 | |||||
| Net operating loss carry-forward | 3,354 | 7,241 | |||||
| Stock Based Compensation | 8,649 | 7,725 | |||||
| Tax credit carry-forward, net | 2,328 | 1,583 | |||||
| Gross Deferred Taxes | (12,139 | ) | (4,181 | ) | |||
| Less valuation allowance | $ | (1,569 | ) | $ | (3,630 | ) | |
| Net deferred tax liabilities | $ | (13,708 | ) | $ | (7,811 | ) | |
As of April 3, 2010, we haveMarch 31, 2012, the Company has approximately $17.9$4.7 million in U.S. acquisition and approximately $1.4$1.2 million in CanadaFrench acquisition related net operating loss carry forwards subject to separate limitationscarry-forwards that it believes are more likely than not that they will expire beginning in 2020. We have $1.6be realized. The Company also has $2.3 million in gross federal and state tax credits available to offset future tax. The Company has established valuation allowances to reduce the value of tax assets to amounts that it deems to be realizable. The valuation allowance is made up of $0.4 million acquisition-related R&D credits and $1.2 million acquisition-related net operating losses. The net operating loss carry-forwards are subject to separate limitations and will expire beginning in 2020.
59
HAEMONETICS CORPORATION AND SUBSIDIARIES
NOTES TO CONSOLIDATED FINANCIAL STATEMENTS — (Continued)
Approximately $106$167 million of our foreign subsidiary undistributed earnings are deemed to be indefinitely reinvested outside the US. Determination of the amount of unrecognized deferred U.S. income taxes is not practical because of the complexities associated with this hypothetical calculation. Accordingly we have not provided USU.S. income taxes on these earnings. In fiscal year 2009 and early fiscal year 2010, we did repatriate dividends from Japan of approximately $20.8 million in anticipation of our Japanese reorganization that we completed this year. No additional US income taxes were due upon repatriation.
The income tax provision from operations differs from a tax provision computed at the 35% U.S. federal statutory income tax rate due to the following:
| Year Ended | ||||||||||||||||||||||||
| April 3, | March 29, | March 29, | ||||||||||||||||||||||
| 2010 | 2008 | 2008 | ||||||||||||||||||||||
| (In thousands) | ||||||||||||||||||||||||
| Tax at federal statutory rate | $ | 28,444 | 35.0 | % | $ | 29,751 | 35.0 | % | $ | 27,044 | 35.0 | % | ||||||||||||
| Domestic manufacturing deduction and extraterritorial income exclusion | (883 | ) | (1.1 | )% | (1,396 | ) | (1.6 | )% | (987 | ) | (1.3 | )% | ||||||||||||
| Difference between U.S. and foreign tax | (5,145 | ) | (6.4 | )% | (4,267 | ) | (5.0 | )% | (1,099 | ) | (1.4 | )% | ||||||||||||
| State income taxes net of federal benefit | 764 | 0.9 | % | 1,461 | 1.7 | % | 1,192 | 1.5 | % | |||||||||||||||
| Tax exempt interest | — | — | — | — | (1,432 | ) | (1.9 | )% | ||||||||||||||||
| Japan dividend | (1,574 | ) | (1.9 | )% | (795 | ) | (1.0 | )% | — | — | ||||||||||||||
| Other, net | 1,294 | 1.7 | % | 944 | 1.1 | % | 604 | 0.8 | % | |||||||||||||||
| Income tax provision | $ | 22,900 | 28.2 | % | $ | 25,698 | 30.2 | % | $ | 25,322 | 32.8 | % | ||||||||||||
72
| (In thousands) | March 31, 2012 | April 2, 2011 | April 3, 2010 | |||||||||||||||||
| Tax at federal statutory rate | $ | 31,324 | 35.0 | % | $ | 38,528 | 35.0 | % | $ | 28,444 | 35.0 | % | ||||||||
| Domestic Manufacturing Deduction | (700 | ) | (0.8 | )% | (1,120 | ) | (1.0 | )% | (883 | ) | (1.1 | )% | ||||||||
| Difference between U.S. and foreign tax | (8,539 | ) | (9.5 | )% | (8,610 | ) | (7.9 | )% | (4,392 | ) | (5.4 | )% | ||||||||
| State income taxes net of federal benefit | 1,136 | 1.3 | % | 1,741 | 1.6 | % | 764 | 0.9 | % | |||||||||||
| Repatriation of Earnings | — | — | % | (506 | ) | (0.5 | )% | (1,574 | ) | (1.9 | )% | |||||||||
| Other, net | (609 | ) | (0.7 | )% | 68 | 0.1 | % | 542 | 0.7 | % | ||||||||||
| Income tax provision | $ | 22,612 | 25.3 | % | $ | 30,101 | 27.3 | % | $ | 22,901 | 28.2 | % | ||||||||
Unrecognized Tax Benefits
Unrecognized tax benefits represent uncertain tax positions for which reserves have been established. As of April 3, 2010,March 31, 2012, we had $4.6$6.9 million of unrecognized tax benefits, of which $4.2$6.6 million will impact the effective tax rate, if recognized. As of March 28, 2009,April 2, 2011, we had $3.9$4.7 million of unrecognized tax benefits, of which $3.2$4.3 million will impact the effective tax rate, if recognized.
The following table summarizes the activity related to our gross unrecognized tax benefits for the fiscal years ending April 2, 2011 and March 28, 2009 and April 3, 2010.31, 2012:
| April 3, | March 28, | |||||||
| 2010 | 2009 | |||||||
| (In thousands) | ||||||||
| Beginning Balance | $ | 3,890 | $ | 4,965 | ||||
| Additions based upon positions related to the current year | 1,722 | 293 | ||||||
| Additions for tax positions of prior years | 1,335 | 716 | ||||||
| Settlements with taxing authorities | (924 | ) | — | |||||
| Closure of statute of limitations | (1,403 | ) | (2,084 | ) | ||||
| Ending Balance | $ | 4,620 | $ | 3,890 | ||||
| (In thousands) | March 31, 2012 | April 2, 2011 | |||||
| Beginning Balance | $ | 4,669 | $ | 4,620 | |||
| Additions based upon positions related to the current year | 1,124 | 20 | |||||
| Additions for tax positions of prior years | 1,216 | 1,641 | |||||
| Reductions of tax positions | (124 | ) | (1,042 | ) | |||
| Settlements with taxing authorities | — | — | |||||
| Closure of statute of limitations | — | (570 | ) | ||||
| Ending Balance | $ | 6,885 | $ | 4,669 | |||
As of April 3, 2010March 31, 2012 we anticipate that the liability for unrecognized tax benefits for uncertain tax positions could change by up to $1.2$0.8 million in the next twelve months, as a result of the resolution of state positions as well as the closure of various foreign statutes of limitations.
Our historic practice has been and continues to be to recognize interest and penalties related to Federal, state and foreign income tax matters in income tax expense. Approximately $0.6$1.0 million and $0.8$0.7 million is was accrued for interest and penalties at March 31, 2012 and April 3, 2010 and March 28, 2009,2, 2011, respectively and is not included in the amounts above.
We conduct business globally and, as a result, file consolidated and separate Federal, state and foreign income tax returns in multiple jurisdictions. In the normal course of business, we are subject to examination by taxing authorities throughout the world in jurisdictions including the U.S., Japan, Germany, France, the United Kingdom, and Switzerland.world. With a few exceptions, overseas, we are no longer subject to U.S. federal, state and local, or foreign income tax examinations for years before 2006.2008.
60
HAEMONETICS CORPORATION AND SUBSIDIARIES
NOTES TO CONSOLIDATED FINANCIAL STATEMENTS — (Continued) 10. | COMMITMENTS AND CONTINGENCIES |
We lease facilities and certain equipment under operating leases expiring at various dates through fiscal year 2016.2017. Facility leases require us to pay certain insurance expenses, maintenance costs and real estate taxes.
73
Approximate future basic rental commitments under operating leases as of April 3, 2010March 31, 2012 are as follows:follows (in thousands):
| (In thousands) | ||||
Fiscal Year Ending | ||||
| 2011 | $ | 6,930 | ||
| 2012 | 5,137 | |||
| 2013 | 3,373 | |||
| 2014 | 1,696 | |||
| 2015 | 1,088 | |||
| Thereafter | 3,487 | |||
| $ | 21,711 | |||
| Fiscal Year Ending | |||
| 2013 | $ | 6,169 | |
| 2014 | 4,093 | ||
| 2015 | 2,718 | ||
| 2016 | 2,320 | ||
| 2017 | 1,852 | ||
| Thereafter | 2,456 | ||
| $ | 19,608 | ||
Rent expense in fiscal year 2010, 2009,2012, 2011, and 20082010 was $8.4$6.1 million $8.0, $6.6 million, and $8.8$5.9 million, respectively.
In September 2011, we might make inentered into an agreement to release the futureCompany from the contingent consideration due to the former shareholders of Neoteric. Under the L’Attitude Medical Systems that are tied to the performanceterms of the Blood Track businessagreement, the former shareholders of Neoteric received $0.7 million in exchange for releasing the first three years post acquisition, beginning with fiscal year 2010. DuringCompany from any future claims for contingent consideration. The Company paid the fourth quarter of fiscal year 2010, it became evident that the business would not achieve revenue growth milestones for fiscal year 2010. As such, we reduced the contingent liability by $2.3$0.7 million settlement amount during September 2011 and has recorded the adjustments as contingent consideration incomeassociated expense in the statementselling, general and administrative line item in the accompanying consolidated statements of operations. The ending liability balance is $4.1 million at April 3, 2010.
income.
We are presently engaged in various legal actions, and although our ultimate liability cannot be determined at the present time, we believe based on consultation with counsel, that any such liability will not materially affect our consolidated financial position or our results of operations.
Currently, we are pursuing a jury found that the Fenwal ALYX system infringed Haemonetics’ patent and awarded us $15.7 millioninfringement action in damages for past infringement. On June 2, 2009, the court ruled that, in addition to paying the damages awarded by the jury, Fenwal must stop selling the ALYX consumable by December 1, 2010 and must pay Haemonetics a 10% royalty on ALYX consumable net sales from January 30, 2009 until December 1, 2010 when the injunction takes effect. In addition, the court awarded pre-judgment interest at 5% on the unpaid damages awarded. On August 19, 2009, an amended judgment was issued under which Haemonetics was awarded $11.3 million for lost profits suffered as a result of the infringement, $4.4 million in royalty damages suffered as a result of the infringement, and prejudgment interest of $2.3 million for a total award of $18.0 million.Germany against Fenwal, and Baxter have appealed these rulingsits European and German subsidiary. On September 20, 2010, we filed a patent infringement action in Germany. In response, Fenwal filed an action to the United States Court of Appeals for the Federal Circuit and oral arguments were heard on April 5, 2010. The damages have not been paid and the royalties are being escrowed pending a decision on the appeal. On December 16, 2009, the U.S. Patent Office granted a request by Fenwal for the ex-parte re-examination ofinvalidate the Haemonetics patent which is the subject of this infringement action on December 1, 2010.
In April 2008, our subsidiary Haemonetics Italia, Srl. and that re-examination process is proceeding.
When this matter first arose, our Board of Directors commissioned independent legal counsel to conduct investigations on its behalf. Based upon its evaluation of counsel's report, the Board concluded that it is discontinuing salesno disciplinary action was warranted in either case. Neither the original ruling nor its final affirmation has impacted the Company's business in Italy to date.
61
HAEMONETICS CORPORATION AND SUBSIDIARIES
NOTES TO CONSOLIDATED FINANCIAL STATEMENTS — (Continued)
11.CAPITAL STOCK
Stock Plans
The Company has an incentive compensation plan, (the “2005 Incentive Compensation Plan”). The 2005 Incentive Compensation Plan permits the award of nonqualified stock options, incentive stock options, stock appreciation rights, restricted stock, deferred stock/restricted stock units, other stock units and performance shares to the Company’s key employees, officers and directors. The 2005 Incentive Compensation Plan is administered by the Compensation Committee of the Board of Directors (the “Committee”) consisting of two or morethree independent members of our Board of Directors. The maximum number of shares available for award under the 2005 Incentive Compensation Plan is 4,575,566.7,512,460. The maximum number of shares that may be issued pursuant to incentive stock options may not exceed 500,000.500,000. Any shares that are subject to the award of stock options shall be counted against this limit as one (1) share for every one (1) share issued. Any shares that are subject to awards other than stock options shall be counted against this limit as 2.53.26 shares for every one (1) share granted. The exercise price for the nonqualified stock options, incentive stock options, stock appreciation rights, restricted stock, deferred stock/restricted stock units, other stock units and performance shares granted under the 2005 Incentive Compensation Plan is determined by the Committee, but in no event shall such exercise price be less than the fair market value of the common stock at the time of the grant. Options, Restricted Stock Awards and Restricted Stock Units become exercisable, or in the case of restricted stock, the resale restrictions are released in a manner determined by the Committee, generally over a four year period for employees and one year from grant for non-employee directors, and all options expire not more than 7 years from the date of the grant. At April 3, 2010,March 31, 2012, there were 2,067,7532,182,028 shares subject to options, 5,000no shares of restricted stock awardedoutstanding and 106,934160,763 shares subject to restricted stock units outstanding under this plan; leaving 1,586,532plan and 3,203,967 shares available for future grant.
The Company had a long-term incentive stock option plan and a non-qualified stock option plan, (the “2000 Long-term Incentive Plan”) which permitted the issuance of a maximum of 3,500,000 shares of our common stock pursuant to incentive and non-qualified stock options granted to key employees, officers and directors. The plan was terminated in connection with the adoption of the 2005 Incentive Compensation Plan. At April 3, 2010,March 31, 2012, there were 788,890241,539 options outstanding under this plan and no further options will be granted under this plan.
The Company had a non-qualified stock option plan under which options were granted to non-employee directors and two previous plans under which options were granted to key employees. At April 3, 2010,March 31, 2012, there were 38,992no options outstanding related to these plans. No further options will be granted under these plans.
The Company has an Employee Stock Purchase Plan (the “Purchase Plan”) under which a maximum of 700,000 shares (subject to adjustment for stock splits and similar changes) of common stock may be purchased by eligible employees. Substantially all of our full-time employees are eligible to participate in the Purchase Plan.
The Purchase Plan provides for two “purchase periods” within each of our fiscal years, the first commencing on November 1 of each year and continuing through April 30 of the next calendar year, and the second commencing on May 1 of each year and continuing through October 31 of such year. Shares are purchased through an accumulation of payroll deductions (of not less than 2% nor more than 15% of compensation, as defined) for the number of whole shares determined by dividing the balance in the employee’s account on the last day of the purchase period by the purchase price per share for the stock determined under the Purchase Plan. The purchase price for shares is the lower of 85% of the fair market
75
value of the common stock at the beginning of the purchase period, or 85% of such value at the end of the purchase period.
Stock-based compensation expense of $10.3$9.3 million, $10.8 million, and $10.2$10.3 million was recognized under ASC Topic 718,Compensation — Stock Compensation(formerly known as Statement No. 123(R),Share-Based Payment) for each of the yearsfiscal year ended March 31, 2012, April 2, 2011, and April 3, 2010 and March 28, 2009., respectively. The related income tax benefit recognized was $3.0$2.7 million, $3.7 million, and $2.9$3.0 million for the fiscal year ended March 31, 2012, April 2, 2011, and April 3, 2010 and March 28, 2009,, respectively. We recognize stock-based compensation on a straight line basis.
ASC Topic 718 requires that cash flows relating to the benefits of tax deductions in excess of stock compensation cost recognized be reported as a financing cash flow, rather than as an operating cash flow, as previously required.flow. This excess tax benefit was $0.4$1.4 million, $3.1 million, and $7.5$0.4 million for the fiscal year ended March 31, 2012, April 2, 2011, and April 3, 2010 and March 28, 2009,, respectively.
62
HAEMONETICS CORPORATION AND SUBSIDIARIES
NOTES TO CONSOLIDATED FINANCIAL STATEMENTS — (Continued)
A summary of stock option activity for the fiscal year ended April 3, 2010March 31, 2012 is as follows:
| Weighted | ||||||||||||||||
| Average | ||||||||||||||||
| Exercise Price | Weighted | |||||||||||||||
| per Share | Average | Aggregate | ||||||||||||||
| Shares | Weighted | Remaining | Intrinsic | |||||||||||||
| Options | Average | Life | Value | |||||||||||||
| Outstanding | Exercise Price | (Years) | ($000’s) | |||||||||||||
| Outstanding at March 28, 2009 | 3,054,674 | $ | 42.54 | |||||||||||||
| Granted | 378,654 | $ | 54.03 | |||||||||||||
| Exercised | (462,557 | ) | $ | 38.77 | ||||||||||||
| Terminated | (75,136 | ) | $ | 51.49 | ||||||||||||
| Outstanding at April 3, 2010 | 2,895,635 | $ | 44.41 | 3.73 | $ | 35,236 | ||||||||||
| Exercisable at April 3, 2010 | 1,976,994 | $ | 40.23 | 2.95 | $ | 32,229 | ||||||||||
| Vested or expected to vest at April 3, 2010 | 2,796,151 | $ | 44.09 | 3.66 | $ | 34,929 | ||||||||||
Options Outstanding (shares) | Weighted Average Exercise Price per Share | Weighted Average Remaining Life (years) | Aggregate Intrinsic Value ($000’s) | ||||||||||
| Outstanding at April 2, 2011 | 2,446,843 | $ | 48.94 | 4.09 | $ | 43,149 | |||||||
| Granted | 464,837 | 62.29 | |||||||||||
| Exercised | (369,092 | ) | 42.00 | ||||||||||
| Forfeited | (119,021 | ) | 54.16 | ||||||||||
| Outstanding at March 31, 2012 | 2,423,567 | $ | 52.30 | 3.87 | $ | 42,134 | |||||||
| Exercisable at March 31, 2012 | 1,412,052 | $ | 47.98 | 2.57 | $ | 30,644 | |||||||
| Vested or expected to vest at March 31, 2012 | 2,302,589 | $ | 51.95 | 3.76 | $ | 40,816 | |||||||
The total intrinsic value of options exercised was $8.5 million, $26.5 million, and $8.2 millionduring fiscal years 2010, 2009,2012, 2011, and 2008 was $8.2 million, $26.6 million, and $16.5 million,2010, respectively.
As of April 3, 2010 and March 28, 2009,31, 2012, there was $8.9$11.1 million and $11.8 million, respectively, of total unrecognized compensation cost related to non vestednon-vested stock options. These costs areThis cost is expected to be recognized over a weighted average period of 2.3 years and 2.2 years, respectively. The total fair value of stock options that became fully vested during the year ended April 3, 2010 and March 28, 2009 was $29.0 million and $30.3 million, respectively.
2.6 years.
The fair value was estimated using the Black-Scholes option-pricing model based on the weighted average of the high and low stock prices at the grant date and the weighted average assumptions specific to the underlying options. Expected volatility assumptions are based on the historical volatility of our common stock. The risk-free interest rate was selected based upon yields of USU.S. Treasury issues with a term equal to the expected life of the option being valued. The expected life of the option was estimated with reference to
76
historical exercise patterns, the contractual term of the option and the vesting period. The assumptions utilized for option grants during the periods presented are as follows:
| April 3, | March 28, | March 29, | ||||||||||
| 2010 | 2009 | 2008 | ||||||||||
| Volatility | 28.6 | % | 29.8 | % | 29.6 | % | ||||||
| Risk-Free Interest Rate | 2.4 | % | 2.7 | % | 4.0 | % | ||||||
| Expected Life of Options | 5 yrs. | 5 yrs. | 5 yrs. | |||||||||
| March 31, 2012 | April 2, 2011 | April 3, 2010 | ||||||
| Volatility | 27.5 | % | 28.2 | % | 28.6 | % | ||
| Expected life (years) | 4.9 | 4.9 | 4.9 | |||||
| Risk-free interest rate | 1.1 | % | 1.8 | % | 2.4 | % | ||
| Dividend yield | 0.0 | % | 0.0 | % | 0.0 | % | ||
The weighted average grant date fair value of options granted during 2010, 2009,2012, 2011, and 20082010 was approximately $15.37, $16.73,$16.31, $15.83, and $17.19,$15.37, respectively.
We have applied, based on an analysis of our historical forfeitures, an annual forfeiture rate of 8% to all unvested stock options as of both March 31, 2012 and April 3, 2010 and March 28, 2009,2, 2011, which represents the portion that we expect will be forfeited each year over the vesting period.
The fair values of shares purchased under the Employee Stock Purchase Plan are estimated using the Black-Scholes single option-pricing model with the following weighted average assumptions:
| April 3, | March 28, | March 29, | ||||||||||
| 2010 | 2009 | 2008 | ||||||||||
| Volatility | 30.9 | % | 32.8 | % | 21.3 | % | ||||||
| Risk-Free Interest Rate | 0.2 | % | 1.4 | % | 4.6 | % | ||||||
| Expected Life of Options | 6 mos. | 6 mos. | 6 mos. | |||||||||
| March 31, 2012 | April 2, 2011 | April 3, 2010 | ||||||
| Volatility | 26.3 | % | 21.1 | % | 30.9 | % | ||
| Expected life | 6 | mos. | 6 | mos. | 6 | mos. | ||
| Risk-free interest rate | 0.1 | % | 0.2 | % | 0.2 | % | ||
| Dividend Yield | 0.0 | % | 0.0 | % | 0.0 | % | ||
The weighted average grant date fair value of the six-month option inherent in the Purchase Plan was $12.53, $13.71,approximately $14.19, $11.73, and $10.81 in$12.53 during fiscal 2012, 2011, and 2010, respectively.
63
HAEMONETICS CORPORATION AND SUBSIDIARIES
NOTES TO CONSOLIDATED FINANCIAL STATEMENTS — (Continued)
Restricted Stock Awards
As of March 31, 2012, there was no unrecognized compensation cost related to non-vested restricted stock awards.
A summary of restricted stock awards activity for the fiscal year 2010, 2009, and 2008, respectively.ended March 31, 2012 is as follows:
| Shares | Weighted Average Grant Date Fair Value | |||||
| Outstanding at April 2, 2011 | 2,500 | $ | 48.09 | |||
| Released | (2,500 | ) | $ | 48.09 | ||
| Outstanding at March 31, 2012 | — | $ | — | |||
Restricted Stock AwardsUnits
As of April 3, 2010,March 31, 2012, there was $0.1$6.4 million of total unrecognized compensation cost related to non vestednon-vested restricted stock awards. Thatunits. This cost is expected to be recognized over a weighted average period of 1.12.7 years. The total fair value of shares fully vested during the year ended April 3, 2010 was $0.1 million.
| Weighted | ||||||||
| Average Grant | ||||||||
| Shares | Date Fair Value | |||||||
| Outstanding at March 28, 2009 | 10,956 | $ | 50.97 | |||||
| Forfeited | (3,456 | ) | $ | 57.22 | ||||
| Released | (2,500 | ) | $ | 48.09 | ||||
| Outstanding at April 3, 2010 | 5,000 | $ | 48.09 | |||||
77
A summary of restricted stock units activity for the fiscal year ended April 3, 2010March 31, 2012 is as follows:
| Weighted | ||||||||
| Average | ||||||||
| Market Value | ||||||||
| Shares | at Grant Date | |||||||
| Outstanding at March 28, 2009 | 102,302 | $ | 53.48 | |||||
| Awarded | 42,593 | $ | 53.31 | |||||
| Released | (28,653 | ) | $ | 55.08 | ||||
| Forfeited | (9,308 | ) | $ | 52.54 | ||||
| Outstanding at April 3, 2010 | 106,934 | $ | 50.62 | |||||
| Shares | Weighted Average Market Value at Grant Date | |||||
| Nonvested at April 2, 2011 | 130,632 | $ | 50.62 | |||
| Awarded | 90,228 | $ | 59.81 | |||
| Released | (45,064 | ) | $ | 61.45 | ||
| Forfeited | (15,033 | ) | $ | 53.48 | ||
| Nonvested at March 31, 2012 | 160,763 | $ | 51.72 | |||
64
HAEMONETICS CORPORATION AND SUBSIDIARIES
NOTES TO CONSOLIDATED FINANCIAL STATEMENTS — (Continued)
12.EARNINGS PER SHARE (“EPS”)
The following table provides a reconciliation of the numerators and denominators of the basic and diluted earnings per share computations as required by ASC Topic 260,Earnings Per Share (formerly known as FASB Statement No. 128,Earnings Per Share)(“EPS”). Basic EPS is computed by dividing reported earnings available to stockholdersnet income by the weighted average shares outstanding. Diluted EPS also includes the effect of potentially dilutive potential common shares.
| Year Ended | ||||||||||||
| April 3, | March 28, | March 29, | ||||||||||
| 2010 | 2009 | 2008 | ||||||||||
| (Dollars and shares in thousands | ||||||||||||
| except per share amounts) | ||||||||||||
Basic EPS | ||||||||||||
| Net income | $ | 58,370 | $ | 59,304 | $ | 51,980 | ||||||
| Weighted average shares | 25,451 | 25,389 | 25,824 | |||||||||
| Basic income per share | $ | 2.29 | $ | 2.34 | $ | 2.01 | ||||||
Diluted EPS | ||||||||||||
| Net income | $ | 58,370 | $ | 59,304 | $ | 51,980 | ||||||
| Basic weighted average shares | 25,451 | 25,389 | 25,824 | |||||||||
| Dilutive effect of stock options | 612 | 784 | 922 | |||||||||
| Diluted weighted average shares | 26,063 | 26,173 | 26,746 | |||||||||
| Diluted income per share | $ | 2.24 | $ | 2.27 | $ | 1.94 | ||||||
| (In thousands, except per share amounts) | March 31, 2012 | April 2, 2011 | April 3, 2010 | ||||||||
| Basic EPS | |||||||||||
| Net income | $ | 66,886 | $ | 79,980 | $ | 58,370 | |||||
| Weighted average shares | 25,364 | 25,077 | 25,451 | ||||||||
| Basic income per share | $ | 2.64 | $ | 3.19 | $ | 2.29 | |||||
| Diluted EPS | |||||||||||
| Net income | $ | 66,886 | $ | 79,980 | $ | 58,370 | |||||
| Basic weighted average shares | 25,364 | 25,077 | 25,451 | ||||||||
| Net effect of common stock equivalents | 431 | 519 | 612 | ||||||||
| Diluted weighted average shares | 25,795 | 25,596 | 26,063 | ||||||||
| Diluted income per share | $ | 2.59 | $ | 3.12 | $ | 2.24 | |||||
During 2010, 2009,2012, 2011, and 20082010, approximately 0.7 million, 1.2 million, and 0.9 million 0.5 million, and 1.0 million, respectively, potentially dilutive common shares respectively, were not included in the computation of diluted earnings per share because exercise prices were greater than the average market priceinclusion of the common shares.these potentially dilutive shares would be anti-dilutive.
| 13. | COMPREHENSIVE INCOME |
Comprehensive income is the total of net income and all other non-owner changes in stockholders’ equity. For us, all otherOther non-owner changes are primarily foreign currency translation; actuarial gains and losses and prior service costs, ontranslation, the change in our defined benefit plans, that arise during the period and are not recognized as components of net periodic benefit cost of the period;minimum pension liability, and the changes in fair value of the effective portion of our outstanding cash flow hedge contracts.
78
| (In thousands) | Foreign Currency Translation | Unrealized Gain/(Loss) on Derivatives, Net of Tax | Impact of Defined Benefit Plans, Net of Tax | Accumulated Other Comprehensive Income | ||||||||||||
| Balance as of April 3, 2010 | $ | 5,271 | $ | 1,454 | $ | (820 | ) | $ | 5,905 | |||||||
| Changes during the year | 6,380 | (3,299 | ) | 555 | $ | 3,636 | ||||||||||
| Balance as of April 2, 2011 | $ | 11,651 | $ | (1,845 | ) | $ | (265 | ) | $ | 9,541 | ||||||
| Changes during the year | (2,813 | ) | 6,370 | (3,988 | ) | $ | (431 | ) | ||||||||
| Balance as of March 31, 2012 | $ | 8,838 | $ | 4,525 | $ | (4,253 | ) | $ | 9,110 | |||||||
| Unrealized | Impact of | |||||||||||||||
| Foreign | Gain (Loss) on | Defined Benefit | ||||||||||||||
| Currency | Derivatives, | Plans, | ||||||||||||||
| Translation | Net of Tax | Net of Tax | Total | |||||||||||||
| (In thousands) | ||||||||||||||||
| Balance as of March 29, 2008 | $ | 12,717 | $ | (8,100 | ) | $ | 186 | $ | 4,803 | |||||||
| Changes during the year | (10,045 | ) | 9,222 | (697 | ) | (1,520 | ) | |||||||||
| Balance as of March 28, 2009 | $ | 2,672 | $ | 1,122 | $ | (511 | ) | $ | 3,283 | |||||||
| Changes during the year | 2,599 | 332 | (309 | ) | $ | 2,622 | ||||||||||
| Balance as of April 3, 2010 | $ | 5,271 | $ | 1,454 | $ | (820 | ) | $ | 5,905 | |||||||
14.RETIREMENT PLANS
Defined Contribution Plans
We have a Savings Plus Plan that is a 401(k) plan that allows our U.S. employees to accumulate savings on a pre-tax basis. In addition, matching contributions are made to the Plan based upon pre-established rates. Our matching contributions amounted to approximately $3.0$4.0 million in 2010, $2.92012, $3.3 million in 2009,2011, and $2.4$3.0 million in 2008.2010. Upon Board approval, additional discretionary contributions can also be made. No discretionary contributions were made for the Savings Plan in fiscal year 2010, 2009,2012, 2011, or 2008.2010.
Some of our subsidiaries also have a defined contribution plan,plans, to which plan both the employee and the employer make contributions. The employer contributions to these plans totaled $1.7$0.8 million $1.4, $1.8 million, and $1.2$1.7 million in fiscal year 2010, 2009,2012, 2011, and 2008,2010, respectively, of which $1.4$1.5 million $1.2, and $1.4 million and $0.9 million in fiscal year 2010, 2009,2011, and 2008,2010, respectively, were contributed for our employees in Switzerland.
65
HAEMONETICS CORPORATION AND SUBSIDIARIES
NOTES TO CONSOLIDATED FINANCIAL STATEMENTS — (Continued)
During fiscal 2012, it was determined that the plan for our employees in Switzerland was a defined benefit plan rather than a defined contribution plan. For fiscal 2012, this plan has been accounted for as a defined benefit plan as described below.
Defined Benefit Plans
Benefits under these plans are generally based on either career average or final average salaries and creditable years of service as defined in the plans. The annual cost for these plans is determined using the projected unit credit actuarial cost method that includes actuarial assumptions and estimates which are subject to change. The measurement date for the plans is March 31, 2009.
79
Some of the Company’s foreign subsidiaries have defined benefit pension plans covering substantially all full time employees at those subsidiaries. Net periodic benefit costs for the plans in the aggregate include the following components:
| Year Ended | ||||||||||||
| April 3, | March 28, | March 29, | ||||||||||
| 2010 | 2009 | 2008 | ||||||||||
| (In thousands) | ||||||||||||
| Service cost | $ | 512 | $ | 539 | $ | 594 | ||||||
| Interest cost on benefit obligation | 242 | 242 | 217 | |||||||||
| Expected (return)/loss on plan assets | (288 | ) | 946 | (74 | ) | |||||||
| Actuarial gain/(loss) | 223 | (1,028 | ) | — | ||||||||
| Amortization of unrecognized prior service cost | (68 | ) | (41 | ) | (35 | ) | ||||||
| Amortization of unrecognized initial obligation | 27 | 26 | 22 | |||||||||
| Totals | $ | 647 | $ | 684 | $ | 724 | ||||||
| (In thousands) | March 31, 2012 | April 2, 2011 | April 3, 2010 | ||||||||
| Service cost | $ | 2,545 | $ | 667 | $ | 512 | |||||
| Interest cost on benefit obligation | 601 | 283 | 242 | ||||||||
| Expected (return)/loss on plan assets | 2 | (467 | ) | (289 | ) | ||||||
| Actuarial (gain)/loss | (385 | ) | (48 | ) | 223 | ||||||
| Amortization of unrecognized prior service cost | (31 | ) | 381 | (68 | ) | ||||||
| Amortization of unrecognized transition obligation | 221 | 30 | 27 | ||||||||
| Totals | $ | 2,953 | $ | 846 | $ | 647 | |||||
The net periodic benefit costs shown above for fiscal 2012 include the associated costs for the Switzerland defined benefit plan. The net periodic benefit costs for fiscal 2011 and 2010 shown above have not been updated to reflect the Switzerland plan costs. These costs were approximately $1.5 million and $1.4 million for fiscal 2011 and 2010, respectively. During those periods, the Switzerland plan was accounted for as a defined contribution plan and Company contributions to the plan were expensed.
66
HAEMONETICS CORPORATION AND SUBSIDIARIES
NOTES TO CONSOLIDATED FINANCIAL STATEMENTS — (Continued)
The activity under those defined benefit plans are as follows:
| Year Ended | ||||||||||||||||
| April 3, | March 28, | March 29, | ||||||||||||||
| 2010 | 2009 | 2008 | ||||||||||||||
| (In thousands) | ||||||||||||||||
| Change in Benefit Obligation: | ||||||||||||||||
| Benefit Obligation, beginning of year | $ | (6,721 | ) | $ | (6,932 | ) | $ | (6,690 | ) | |||||||
| Service cost | (512 | ) | (539 | ) | (594 | ) | ||||||||||
| Interest cost | (242 | ) | (242 | ) | (217 | ) | ||||||||||
| Benefits paid | 217 | 488 | 203 | |||||||||||||
| Actuarial (loss)/gain | (558 | ) | 389 | 829 | ||||||||||||
| Currency translation | (133 | ) | 115 | (463 | ) | |||||||||||
| Benefit obligation, end of year | $ | (7,949 | ) | $ | (6,721 | ) | $ | (6,932 | ) | |||||||
| Change in Plan Assets: | ||||||||||||||||
| Fair value of plan assets, beginning of year | $ | 3,097 | $ | 3,851 | $ | 3,669 | ||||||||||
| Company contributions | 471 | 403 | 373 | |||||||||||||
| Benefits paid | (176 | ) | (460 | ) | (175 | ) | ||||||||||
| Gain/(Loss) on plan assets | 288 | (946 | ) | (454 | ) | |||||||||||
| Currency translation | 153 | 249 | 438 | |||||||||||||
| Fair value of Plan Assets, end of year | $ | 3,833 | $ | 3,097 | $ | 3,851 | ||||||||||
| Funded Status | $ | (4,116 | ) | $ | (3,624 | ) | $ | (3,141 | ) | |||||||
| Unrecognized net actuarial loss/(gain) | 785 | 433 | (235 | ) | ||||||||||||
| Unrecognized initial obligation | (117 | ) | (152 | ) | 209 | |||||||||||
| Unrecognized prior service cost | 180 | 197 | (182 | ) | ||||||||||||
| Net amount recognized | $ | (3,268 | ) | $ | (3,146 | ) | $ | (3,349 | ) | |||||||
| (In thousands) | March 31, 2012 | April 2, 2011 | |||||
| Change in Benefit Obligation: | |||||||
| Benefit Obligation, beginning of year | $ | (8,628 | ) | $ | (7,949 | ) | |
| Switzerland Benefit Obligation, beginning of year | (14,079 | ) | n/a | ||||
| Service cost | (2,545 | ) | (667 | ) | |||
| Interest cost | (601 | ) | (283 | ) | |||
| Benefits paid | 1,952 | 843 | |||||
| Actuarial (loss)/gain | (1,244 | ) | 102 | ||||
| Employee and plan participants contribution | (1,728 | ) | |||||
| Plan Amendments | (193 | ) | — | ||||
| Currency translation | (84 | ) | (674 | ) | |||
| Benefit obligation, end of year | $ | (27,150 | ) | $ | (8,628 | ) | |
| Change in Plan Assets: | |||||||
| Fair value of plan assets, beginning of year | $ | 4,449 | $ | 3,833 | |||
| Fair value of Switzerland plan assets, beginning of year | 11,349 | n/a | |||||
| Company contributions | 2,156 | 478 | |||||
| Benefits paid | (1,873 | ) | (783 | ) | |||
| Gain/(Loss) on plan assets | 124 | 467 | |||||
| Employee and plan participants contributions | 1,728 | n/a | |||||
| Currency translation | 252 | 454 | |||||
| Fair value of Plan Assets, end of year | $ | 18,185 | $ | 4,449 | |||
| Funded Status | $ | (8,965 | ) | $ | (4,179 | ) | |
| Unrecognized net actuarial loss/(gain) | 4,513 | 341 | |||||
| Unrecognized initial obligation | 141 | (83 | ) | ||||
| Unrecognized prior service cost | 254 | 171 | |||||
| Net amount recognized | $ | (4,057 | ) | $ | (3,750 | ) | |
The fiscal 2012 amounts shown above include the Switzerland plan amounts. The fiscal 2011 amounts shown above have not been updated to reflect the Switzerland amounts. The benefit obligation for the Switzerland plan was approximately $14.1 million as of April 2, 2011. The fair value of the Switzerland plan assets as of April 2, 2011 was approximately $11.3 million.
One of the benefit plans is funded through assets ofby benefit payments made by the Company. Accordingly that plan has no assets included in the information presented above. The assetstotal liability for this plan was $4.9 million and $4.1 million as of the other plan were greater than theMarch 31, 2012 and April 2, 2011, respectively.
The accumulated benefit obligation for all plans was $22.5 million and $3.9 million for the fiscal year ended March 31, 2012 and April 2, 2011, respectively. The increase in the current fiscal years 2010, 2009, and 2008, respectively.
80
year is due to the change in accounting for the Switzerland plan. The accumulated benefit obligation for fiscal 2011 has not been updated to reflect the Switzerland plan.
Amounts recognized as a component of other accrued liabilities on the balance sheet as of March 31, 2012 and April 3, 2010,2, 2011, under ASC Topic 715 totaled $3.3 million.$9.0 million and $4.2 million, respectively.
67
HAEMONETICS CORPORATION AND SUBSIDIARIES
NOTES TO CONSOLIDATED FINANCIAL STATEMENTS — (Continued)
The components of the change recorded in our accumulated other comprehensive income related to our defined benefit plans, net of tax, are as follows:follows (in thousands):
| (In thousands) | ||||
| Balance as of March 28, 2009 | $ | (511 | ) | |
| Obligation at transition | 28 | |||
| Actuarial loss | (293 | ) | ||
| Prior service cost | (44 | ) | ||
| Balance as of April 3, 2010 | $ | (820 | ) | |
| Balance as of April 3, 2010 | $ | (820 | ) |
| Obligation at transition | 574 | ||
| Actuarial loss | (50 | ) | |
| Prior service cost | 31 | ||
| Balance as of April 2, 2011 | $ | (265 | ) |
| Obligation at transition | 30 | ||
| Actuarial loss | (3,701 | ) | |
| Prior service cost | (317 | ) | |
| Balance as of March 31, 2012 | $ | (4,253 | ) |
The weighted average rates used to determine the net periodic benefit costs were as follows:
| April 3, | March 28, | March 29, | ||||||||||
| 2010 | 2009 | 2008 | ||||||||||
| Discount rate | 5.2 | % | 4.5 | % | 3.7 | % | ||||||
| Rate of increased salary levels | 2.0 | % | 2.3 | % | 2.0 | % | ||||||
| Expected long-term rate of return on assets | 1.6 | % | 1.9 | % | 0.0 | % | ||||||
| March 31, 2012 | April 2, 2011 | April 3, 2010 | ||||||
| Discount rate | 2.40 | % | 5.30 | % | 5.20 | % | ||
| Rate of increased salary levels | 1.50 | % | 2.60 | % | 2.00 | % | ||
| Expected long-term rate of return on assets | 2.10 | % | 1.60 | % | 1.60 | % | ||
Assumptions for expected long-term rate of return on plan assets are based upon actual historical returns, future expectations of returns for each asset class and the effect of periodic target asset allocation rebalancing. The results are adjusted for the payment of reasonable expenses of the plan from plan assets.
We have no other material obligation for post-retirement or post-employment benefits.
The Company’s investment policy for its pension plans is to balance risk and return through a diversified portfolio to reduce interest rate and market risk. Maturities are managed so that sufficient liquidity exists to meet immediate and future benefit payment requirements.
For the Company’s planCompany's plans with assets, the asset allocation atmajority of the end of April 3, 2010investments are in fixed-income instruments such as bonds and March 28, 2009 year end by asset category are presented in the following table:time-deposits.
| April 3, | March 28, | |||||||
| 2010 | 2009 | |||||||
Plan Assets | ||||||||
| Equity Securities | 58.3 | % | 58.6 | % | ||||
| Debt Securities | 41.7 | % | 41.4 | % | ||||
| Total | 100.0 | % | 100.0 | % | ||||
Expected benefit payments for both plans are estimated using the same assumptions used in determining the company’s benefit obligation at April 3, 2010.March 31, 2012. Benefit payments will depend on future employment and compensation levels, average years employed and average life spans, among other factors, and changes in any
81
of these factors could significantly affect these estimated future benefit payments.
68
HAEMONETICS CORPORATION AND SUBSIDIARIES
NOTES TO CONSOLIDATED FINANCIAL STATEMENTS — (Continued)
Estimated future benefit payments during the next five years and in the aggregate for the five fiscal years thereafter, are as follows:follows (in thousands):
| (In thousands) | ||||
Expected Benefit Payments | ||||
| Fiscal Year 2011 | $ | 433 | ||
| Fiscal Year 2012 | $ | 440 | ||
| Fiscal Year 2013 | $ | 450 | ||
| Fiscal Year 2014 | $ | 452 | ||
| Fiscal Year 2015 | $ | 464 | ||
Fiscal Year2016-2019 | $ | 1,893 | ||
| Expected Benefit Payments | |||
| Fiscal Year 2013 | $ | 1,199 | |
| Fiscal Year 2014 | $ | 1,428 | |
| Fiscal Year 2015 | $ | 1,073 | |
| Fiscal Year 2016 | $ | 1,429 | |
| Fiscal Year 2017 | $ | 1,878 | |
| Fiscal Year 2018-2021 | $ | 4,545 | |
The Company contributions for fiscal year 20112013 are expected to be consistent with our recent historical experience.
| 15. | SEGMENT |
Segment Definition Criteria
We manage our business on the basis of one operating segment: the design, manufacture, and marketing of blood management solutions. Our chief operating decision-maker uses consolidated results to make operating and strategic decisions. Manufacturing processes, as well as the regulatory environment in which we operate, are largely the same for all product lines.categories.
Enterprise Wide Disclosures about Product and Services
We have four global product families: plasma, blood bank,center, hospital, and software solutions.
Our products include equipment devices and the related disposables used with these devices. Disposables include the plasma, blood bank,center, and hospital product families. Plasma consists of the disposables used to perform apheresis for the separation of whole blood components and subsequent collection of plasma.plasma to be used as a raw material for biologically derived pharmaceuticals (also known as source plasma). Blood bankcenter consists of disposables which separate whole blood for the subsequent collection of platelets, plasma, red cells, or a combination of these components.components for transfusion to patients. Hospital consists of surgical disposables (principally the Cell Saver® autologous blood recovery system targeted to procedures that involve rapid, high volume blood loss such as cardiovascular surgeries and the cardioPAT® cardiovascular perioperative autotransfusion system designed to remain with the patient following surgery to recover blood and produce a washedthe patient’s red cell productcells to prepare them for autotransfusion)reinfusion), the OrthoPAT® orthopedic perioperative autotransfusion system designed to operate both during and after surgery to recover and wash the patient’s red cells to prepare them for reinfusion, and diagnostics products (principally the TEG® Thrombelastograph® hemostasis analyzer used to help assess a surgical patient’s hemostasis (blood clotting ability) during and after surgery).
Software solutions include information technology platforms that assist blood banks,centers, plasma centers, and hospitals to more effectively manage regulatory compliance and operational efficiency.
69
HAEMONETICS CORPORATION AND SUBSIDIARIES
NOTES TO CONSOLIDATED FINANCIAL STATEMENTS — (Continued)
Revenues from External Customers:
| Year Ended | ||||||||||||
| April 3, | March 28, | March 29, | ||||||||||
| 2010 | 2009 | 2008 | ||||||||||
| (In thousands) | ||||||||||||
| Disposables Revenues | ||||||||||||
| Plasma disposables | $ | 232,378 | $ | 202,176 | $ | 155,219 | ||||||
| Blood bank disposables | ||||||||||||
| Platelet | 151,026 | 143,420 | 136,148 | |||||||||
| Red Cell | 48,031 | 49,508 | 46,377 | |||||||||
| 199,057 | 192,928 | 182,525 | ||||||||||
| Hospital disposables | ||||||||||||
| Surgical | 69,942 | 67,697 | 66,250 | |||||||||
| OrthoPAT | 37,079 | 35,419 | 34,301 | |||||||||
| Diagnostic | 21,862 | 19,881 | 5,835 | |||||||||
| 128,883 | 122,997 | 106,386 | ||||||||||
| Disposables revenue | 560,318 | 518,101 | 444,130 | |||||||||
| Software solutions | 35,919 | 31,605 | 24,173 | |||||||||
| Equipment and other | 49,193 | 48,173 | 48,137 | |||||||||
| Total revenues from external customers | 645,430 | $ | 597,879 | $ | 516,440 | |||||||
| (In thousands) | March 31, 2012 | April 2, 2011 | April 3, 2010 | ||||||||
| Disposable revenues | |||||||||||
| Plasma disposables | $ | 258,061 | $ | 227,209 | $ | 232,378 | |||||
| Blood center disposables | |||||||||||
| Platelet | 167,946 | 156,251 | 151,026 | ||||||||
| Red cell | 48,034 | 46,828 | 48,031 | ||||||||
| 215,980 | 203,079 | 199,057 | |||||||||
| Hospital disposables | |||||||||||
| Surgical | 66,619 | 66,503 | 69,942 | ||||||||
| OrthoPAT | 31,186 | 35,631 | 37,079 | ||||||||
| Diagnostics | 23,087 | 19,414 | 16,770 | ||||||||
| 120,892 | 121,548 | 123,791 | |||||||||
| Disposables revenue | 594,933 | 551,836 | 555,226 | ||||||||
| Software solutions | 70,557 | 66,876 | 35,919 | ||||||||
| Equipment & other | 62,354 | 57,982 | 54,285 | ||||||||
| Total revenues | $ | 727,844 | $ | 676,694 | $ | 645,430 | |||||
Enterprise Wide Disclosures about Product and Services
Year ended (in thousands)
| Other | Total | |||||||||||||||||||||||||||||||
| United | North | North | Other | Total | Total | Total | ||||||||||||||||||||||||||
| States | America | America | Japan | Asia | Asia | Europe | Consolidated | |||||||||||||||||||||||||
April 3, 2010 | ||||||||||||||||||||||||||||||||
Sales | $ | 301,491 | $ | 2,191 | $ | 303,682 | $ | 109,573 | $ | 51,324 | $ | 160,897 | $ | 180,851 | $ | 645,430 | ||||||||||||||||
Total Assets | $ | 484,310 | $ | 22,941 | $ | 500,734 | $ | 42,438 | $ | 20,928 | $ | 63,366 | $ | 190,043 | $ | 760,660 | ||||||||||||||||
Long-Lived Assets | $ | 308,823 | $ | 16,800 | $ | 326,623 | $ | 11,230 | $ | 3,805 | $ | 15,035 | $ | 19,285 | $ | 359,943 | ||||||||||||||||
| March 31, 2012 | United States | Other North America | Total North America | Japan | Other Asia | Total Asia | Total Europe | Total Consolidated | |||||||||||||||||||||||
| Sales | $ | 352,160 | $ | 512 | $ | 352,672 | $ | 124,381 | $ | 67,223 | $ | 191,604 | $ | 183,568 | $ | 727,844 | |||||||||||||||
| Total Assets | $ | 634,171 | $ | 15,365 | $ | 649,536 | $ | 50,509 | $ | 27,353 | $ | 77,862 | $ | 183,737 | $ | 911,135 | |||||||||||||||
| Long-Lived Assets | $ | 305,370 | $ | 12,796 | $ | 318,166 | $ | 13,128 | $ | 3,961 | $ | 17,089 | $ | 38,009 | $ | 373,264 | |||||||||||||||
| Other | Total | |||||||||||||||||||||||||||||||
| United | North | North | Other | Total | Total | Total | ||||||||||||||||||||||||||
| States | America | America | Japan | Asia | Asia | Europe | Consolidated | |||||||||||||||||||||||||
March 28, 2009 | ||||||||||||||||||||||||||||||||
Sales | $ | 279,029 | $ | — | $ | 279,029 | $ | 97,215 | $ | 45,460 | $ | 142,675 | $ | 176,175 | $ | 597,879 | ||||||||||||||||
Total Assets | $ | 461,226 | $ | 6,756 | $ | 467,982 | $ | 47,723 | $ | 18,557 | $ | 66,280 | $ | 115,431 | $ | 649,693 | ||||||||||||||||
Long-Lived Assets | $ | 220,531 | $ | 5,607 | $ | 226,138 | $ | 11,121 | $ | 3,912 | $ | 15,033 | $ | 18,323 | $ | 259,494 | ||||||||||||||||
| April 2, 2011 | United States | Other North America | Total North America | Japan | Other Asia | Total Asia | Total Europe | Total Consolidated | |||||||||||||||||||||||
| Sales | $ | 316,447 | $ | 908 | $ | 317,355 | $ | 110,263 | $ | 61,594 | $ | 171,857 | $ | 187,482 | $ | 676,694 | |||||||||||||||
| Total Assets | $ | 582,733 | $ | 15,903 | $ | 598,636 | $ | 47,156 | $ | 18,164 | $ | 65,320 | $ | 169,308 | $ | 833,264 | |||||||||||||||
| Long-Lived Assets | $ | 305,305 | $ | 12,715 | $ | 318,020 | $ | 12,391 | $ | 4,181 | $ | 16,572 | $ | 38,092 | $ | 372,684 | |||||||||||||||
| April 3, 2010 | United States | Other North America | Total North America | Japan | Other Asia | Total Asia | Total Europe | Total Consolidated | |||||||||||||||||||||||
| Sales | $ | 301,774 | $ | 2,191 | $ | 303,965 | $ | 109,573 | $ | 51,324 | $ | 160,897 | $ | 180,568 | $ | 645,430 | |||||||||||||||
| Total Assets | $ | 487,955 | $ | 22,941 | $ | 510,896 | $ | 42,438 | $ | 20,928 | $ | 63,366 | $ | 190,043 | $ | 764,305 | |||||||||||||||
| Long-Lived Assets | $ | 313,241 | $ | 16,800 | $ | 330,041 | $ | 11,230 | $ | 3,805 | $ | 15,035 | $ | 19,285 | $ | 364,361 | |||||||||||||||
The Long-Lived Assets reported above include Goodwill, Other Intangibles and Net Property, Plant and Equipment.
70
HAEMONETICS CORPORATION AND SUBSIDIARIES
NOTES TO CONSOLIDATED FINANCIAL STATEMENTS — (Continued)
| Other | Total | |||||||||||||||||||||||||||||||
| United | North | North | Other | Total | Total | Total | ||||||||||||||||||||||||||
| States | America | America | Japan | Asia | Asia | Europe | Consolidated | |||||||||||||||||||||||||
March 29, 2008 | ||||||||||||||||||||||||||||||||
Sales | $ | 232,812 | $ | 53 | $ | 232,865 | $ | 88,759 | $ | 39,323 | $ | 128,082 | $ | 155,493 | $ | 516,440 | ||||||||||||||||
Total Assets | $ | 342,006 | $ | 6,559 | $ | 348,565 | $ | 51,016 | $ | 24,513 | $ | 75,529 | $ | 184,856 | $ | 608,950 | ||||||||||||||||
Long-Lived Assets | $ | 192,203 | $ | 5,743 | $ | 197,946 | $ | 11,355 | $ | 3,119 | $ | 14,474 | $ | 22,619 | $ | 235,039 | ||||||||||||||||
16.RESTRUCTURING
During fiscal 2012, the Company's restructuring activities primarily consist of reorganization within our research and development, manufacturing and software operations. Employee-related costs primarily consist of employee severance and benefits. Facility-related costs primarily consist of charges associated with closing facilities, related lease obligations, and other related costs.
For fiscal 2012, the Company incurred $5.9 million of restructuring charges. Restructuring expenses have been primarily included as a component of selling, general and administrative expense in the accompanying statements of income.
On April 1, 2010, our Board of Directors approved transformation and restructuring plans, which include the integration of Global Med Technologies, Inc. InDuring fiscal 2011, in addition to the costs in the below table and as part of our approved transformation and restructuring plans, we incurred the following expenses:
Stock compensation expense of $1.7 million resulting from the acceleration of unvested stock options in accordance to terms of an employment contract for an employee. This expense is included as part of our restructuring charges and reflected in our consolidated statement of income as selling, general and administrative expense for the fiscal year ended April 2, 2011.
$2.1 million of integration costs related to the Global Med acquisition.
During fiscal 2010, in connection with the transformation plan, we had an asset write down of $15.7$15.7 million related to the abandonment of our next generation platelet apheresis platform and our blood bankcenter donation management software, as well as $8.6$8.6 million in transformation costs related to the separation of employees. In fiscal year 2011, we expect to incur additional cash restructuring costsemployees and reflected in our consolidated statement of $6.4 million for employee matters and facility closures. We also expect to incur $1.5 million of integration costs.
The following summarizes the restructuring activity for the fiscal yearsyear ended March 31, 2012, April 2, 2011, and April 3, 2010 2009, and 2008,, respectively:
| Restructuring | ||||||||||||||||||||
| Accrual | ||||||||||||||||||||
| Balance at | Cost | Asset | Balance at | |||||||||||||||||
| March 28, 2009 | Incurred | Payments | Write Down | April 3, 2010 | ||||||||||||||||
| (In thousands) | ||||||||||||||||||||
| Employee-related costs | $ | 2,729 | $ | 8,598 | $ | (1,566 | ) | $ | — | $ | 9,761 | |||||||||
| Facility related costs | 42 | — | (42 | ) | — | — | ||||||||||||||
| Other transformation costs | 78 | 15,686 | (78 | ) | (15,686 | ) | — | |||||||||||||
| $ | 2,849 | $ | 24,284 | $ | (1,686 | ) | $ | (15,686 | ) | $ | 9,761 | |||||||||
| (In thousands) | Balance at April 2, 2011 | Cost Incurred | Payments | Asset Write down | Restructuring Accrual Balance at March 31, 2012 | ||||||||||||||
| Employee-related costs | $ | 2,782 | $ | 4,112 | $ | (5,433 | ) | $ | — | $ | 1,461 | ||||||||
| Facility related costs | 889 | 1,746 | (2,102 | ) | — | 533 | |||||||||||||
| $ | 3,671 | $ | 5,858 | $ | (7,535 | ) | $ | — | $ | 1,994 | |||||||||
84
| (In thousands) | Balance at April 3, 2010 | Cost Incurred | Payments | Asset Write down | Restructuring Accrual Balance at April 2, 2011 | ||||||||||||||
| Employee-related costs | $ | 9,761 | $ | 3,595 | $ | (10,574 | ) | $ | — | $ | 2,782 | ||||||||
| Facility related costs | — | 89 | — | — | 889 | ||||||||||||||
| $ | 9,761 | $ | 3,684 | $ | (10,574 | ) | $ | — | $ | 3,671 | |||||||||
| (In thousands) | Balance at March 28, 2009 | Cost Incurred | Payments | Asset Write down | Restructuring Accrual Balance at April 3, 2010 | ||||||||||||||
| Employee-related costs | $ | 2,729 | $ | 8,598 | $ | (1,566 | ) | $ | — | $ | 9,761 | ||||||||
| Facility related costs | 42 | — | (42 | ) | — | — | |||||||||||||
| Other exit & termination costs | 78 | 15,686 | (78 | ) | (15,686 | ) | — | ||||||||||||
| $ | 2,849 | $ | 24,284 | $ | (1,686 | ) | $ | (15,686 | ) | $ | 9,761 | ||||||||
71
HAEMONETICS CORPORATION AND SUBSIDIARIES
NOTES TO CONSOLIDATED FINANCIAL STATEMENTS — (Continued)
| Restructuring | ||||||||||||||||||||
| Accrual | ||||||||||||||||||||
| Balance at | Cost | Asset | Balance at | |||||||||||||||||
| March 29, 2008 | Incurred | Payments | Write Down | March 28, 2009 | ||||||||||||||||
| (In thousands) | ||||||||||||||||||||
| Employee-related costs | $ | 521 | $ | 6,076 | $ | 3,868 | $ | — | $ | 2,729 | ||||||||||
| Facility related costs | 42 | 72 | 72 | — | 42 | |||||||||||||||
| Other transformation costs | 78 | — | — | — | 78 | |||||||||||||||
| $ | 641 | $ | 6,148 | $ | 3,940 | $ | — | $ | 2,849 | |||||||||||
17.CAPITALIZATION OF SOFTWARE DEVELOPMENT COSTS
| Restructuring | ||||||||||||||||||||
| Accrual | ||||||||||||||||||||
| Balance at | Cost | Asset | Balance at | |||||||||||||||||
| March 31,2007 | Incurred | Payments | Write Down | March 29, 2008 | ||||||||||||||||
| (In thousands) | ||||||||||||||||||||
| Employee-related costs | $ | — | $ | 2,800 | $ | 2,279 | $ | — | $ | 521 | ||||||||||
| Facility related costs | — | 1,073 | 727 | 304 | 42 | |||||||||||||||
| Other transformation costs | — | 663 | 188 | 397 | 78 | |||||||||||||||
| $ | — | $ | 4,536 | $ | 3,194 | $ | 701 | $ | 641 | |||||||||||
The cost of software that is developed or obtained for internal use is accounted for pursuant to ASC Topic 350,Intangibles — Goodwill and Other(formerly known as AICPA Statement of Position98-1,Accounting for the Costs of Computer Software Developed or Obtained for Internal Use). Pursuant to ASC Topic 350, the Company capitalizes costs incurred during the application development stage of software developed for internal use, and expenses costs incurred during the preliminary project and the post-implementation operation stages of development. The Company capitalized $4.9$3.6 million and $6.8$2.8 million in costs incurred for acquisition of the software license and related software development costs for new internal software that was in the application development stage during the fiscal year 2010ended March 31, 2012 and 2009,April 2, 2011, respectively. The total capitalized costs incurred include $1.8 million for the cost of the software license and $26.1 million in third party development costs and internal personnel costs. The capitalized costs are included as a component of property, plant and equipment in the consolidated financial statements. The Company
For costs incurred depreciation expense of $2.9 million, $1.7 million, and $1.4 million during fiscal year 2010, 2009, and 2008, respectively relatingrelated to the above capitalized costs.
The Company capitalized $4.7$6.1 million, $6.9 million and $3.3$4.7 million in other software development costs for ongoing initiatives during the fiscal year 2010ended March 31, 2012, April 2, 2011 and 2009, respectively. At April 3, 2010, respectively. At March 31, 2012 and April 2, 2011, we have a total of $7.6$19.5 million and $13.4 million, respectively, of software costs capitalized, of which $15.4 million and $13.4 million, respectively, related to other in process software development initiatives. The costs capitalized for each project are included in intangible assets in the consolidated financial statements. In connection with these
85