UNITED STATES SECURITIES AND EXCHANGE COMMISSION
Washington, D.C. 20549
Form 10-K
| (Mark One) | ||||
þ | ANNUAL REPORT PURSUANT TO SECTION 13 OR 15(d) OF THE SECURITIES EXCHANGE ACT OF 1934 | |||
| For the fiscal year ended August 31, | ||||
o | TRANSITION REPORT PURSUANT TO SECTION 13 OR 15(d) OF THE SECURITIES EXCHANGE ACT OF 1934 | |||
| For the transition period from to | ||||
Commission file number 1-4304
Commercial Metals Company
(Exact name of registrant as specified in its charter)
| Delaware | 75-0725338 | |
(State or other jurisdiction of incorporation or organization) | (I.R.S. Employer Identification No.) | |
6565 MacArthur Blvd, Irving, TX (Address of principal executive offices) | 75039 (Zip Code) | |
(214) 689-4300
Securities registered pursuant to Section 12(b) of the Act:
| Title of Each Class | Name of Each Exchange on Which Registered | |||
| Common Stock, $0.01 par value | New York Stock Exchange | |||
| Preferred Stock Purchase Rights | New York Stock Exchange | |||
Securities registered pursuant to Section 12(g) of the Act: None
Indicate by check mark if the registrant is a well-known seasoned issuer, as defined in Rule 405 underof the Securities Act. Yes þ No o No þ
Indicate by check mark if the registrant is not required to file reports pursuant to Section 13 ofor Section 15(d) of the Act. Yes o No þ
Indicate by check mark whether the registrant (1) has filed all reports required to be filed by Section 13 or 15(d) of the Securities Exchange Act of 1934 during the preceding 12 months (or for such shorter period that the registrant was required to file such reports), and (2) has been subject to such filing requirements for the past 90 days. Yes þ No o
Indicate by check mark whether the registrant has submitted electronically and posted on its corporate Web site, if any, every Interactive Data File required to be submitted and posted pursuant to Rule 405 ofRegulation S-T (§ 232.405 of this chapter) during the preceding 12 months (or for such shorter period that the registrant was required to submit and post such files). Yes oþ No o
Indicate by check mark if disclosure of delinquent filers pursuant to Item 405 ofRegulation S-K (Section 229.405 of this chapter) (§ 229.405) is not contained herein, and will not be contained, herein, to the best of registrant’sregistrant's knowledge, in definitive proxy or information statements incorporated by reference in Part III of thisForm 10-K or any amendment to thisForm 10-K. o
Indicate by check mark whether the registrant is a large accelerated filer, an accelerated filer, a non-accelerated filer, or a smaller reporting company. See the definitions of “large"large accelerated filer,” “accelerated filer”" "accelerated filer" and “smaller"smaller reporting company”company" inRule 12b-2 of the Exchange Act. (Check one):
Large accelerated filer þ | Accelerated filer o | Non-accelerated filer o | Smaller reporting company o | |||
(Do not check if a smaller reporting company)
Indicate by check mark whether the registrant is a shell company (as defined inRule 12b-2 of the Act). Yes o No þ
The aggregate market value of the common stock on February 26, 2010,28, 2013, held by non-affiliates of the registrant, based on the closing price of $16.40 per share on February 26, 2010,28, 2013, on the New York Stock Exchange was approximately $1,612,607,063.$1,899,268,984. (For purposes of determination of this amount, only directors, executive officers and 10% or greater stockholders have been deemed affiliates.)
The number of shares outstanding of common stock as of October 20, 201023, 2013 was 114,358,610.117,024,102.
DOCUMENTS INCORPORATED BY REFERENCE:
Portions of the following document are incorporated by reference into the listed Part ofForm 10-K:
COMMERCIAL METALS COMPANY
AND SUBSIDIARIES
AND SUBSIDIARIES
TABLE OF CONTENTS
| 3 | ||||||||
| 3 | ||||||||
| 10 | ||||||||
| 17 | ||||||||
| 17 | ||||||||
| 18 | ||||||||
| 18 | ||||||||
| 19 | ||||||||
| 19 | ||||||||
| 21 | ||||||||
| Item 7: | 21 | |||||||
| 37 | ||||||||
| 39 | ||||||||
| 67 | ||||||||
| 67 | ||||||||
| 68 | ||||||||
| 68 | ||||||||
| 68 | ||||||||
| 69 | ||||||||
| 69 | ||||||||
| 69 | ||||||||
| 69 | ||||||||
| 70 | ||||||||
| 70 | ||||||||
| 78 | ||||||||
2
PART I
ITEM 1. BUSINESS
GENERAL
Commercial Metals Company ("CMC") together with its consolidated subsidiaries (collectively, the "Company," "we," "our" or "us") manufacture, recycle manufacture, fabricate and distributemarket steel and metal products, and related materials and services through a network of locations throughoutincluding steel mills, commonly referred to as "minimills", steel fabrication and processing plants, construction-related product warehouses, metal recycling facilities and marketing and distribution offices in the United States and internationally. Prior to December 1, 2009, we organized our business into the following five segments: Americas Recycling, Americas Mills, Americas Fabrication and Distribution, all operating as part of the CMC Americas Divisions, with the CMC International Division comprised of two segments, International Mills and International Fabrication and Distribution. Effective December 1, 2009, we implemented a new organizational structure. As a result, the CMC Americas Division operates utilizing three segments: Americas Recycling, America Mills and Americas Fabrication. The CMC International Division operates utilizing two segments: International Mills (comprised of all mills, recycling and fabrication operations located outside of the U.S.) and International Marketing and Distribution, which includes all marketing and distribution operations located outside the Americas as well as two U.S. based trading and distribution divisions, CMC Cometals, located in Fort Lee, New Jersey and CMC Cometals — Steel (previously CMC Dallas Trading) located in Irving, Texas. All prior period information has been recast to be presented in the new organizational structure.strategic international markets.
We were incorporated in 1946 in the State of Delaware. Our predecessor company, a metals recycling business, has existed since approximately 1915. We maintain our executive offices at 6565 MacArthur Boulevard in Irving, Texas, telephone number (214) 689-4300. Our fiscal year ends August 31, and all referencesany reference in this Form 10-K to years referany year refers to the fiscal year ended August 31 of that year unless otherwise noted. Financial information for the last three fiscal years concerning our five business segments and the geographic areas of our operations is incorporated herein by reference from “Note 15."Note 21, Business Segments”Segments" of the notes to consolidated financial statements which are in Part II, Item 8 of this Form 10-K.
Our Annual Report on Form 10-K, quarterly reports on Form 10-Q, current reports on Form 8-K and all amendments to these reports will be made available free of charge through the Investor Relations section of our Internet website,
http://www.cmc.com, as soon as reasonably practicable after such material is electronically filed with, or furnished to, the Securities and Exchange Commission. Except as otherwise stated in these reports, the information contained on our website or available by hyperlink from our website is not incorporated into this Annual Report on Form 10-K or other documents we file with, or furnish to, the Securities and Exchange Commission.
We have five business segments across two geographic divisions, the CMC Americas Division and the CMC International Division. The CMC Americas Division includes three segments: Americas Recycling, Americas Mills and Americas Fabrication. The CMC International Division includes two segments: International Mill and International Marketing and Distribution.
On October 17, 2013, we announced that we sold our wholly-owned copper tube manufacturing operation, Howell Metal Company ("Howell"), which had been part of our Americas Mills segment.
CMC AMERICAS DIVISION OPERATIONS
AMERICAS RECYCLING SEGMENT
Our Americas Recycling segment processes scrap metals for use as a raw material by manufacturers of new metal products. This segment operates 4331 scrap metal processing facilities with 1915 locations in Texas, 8seven locations in Florida, 4two locations in South Carolina, 2Missouri and one location in each of Alabama, Missouri and Tennessee and one each in Arkansas, Georgia, Kansas, Louisiana, North Carolina, Oklahoma and Oklahoma.Tennessee.
We purchase ferrous and nonferrous scrap metals, processed and unprocessed, from a variety of sources in a variety of forms for our metals recycling plants.facilities. Sources of metal for recycling include manufacturing and industrial plants, metal fabrication plants, electric utilities, machine shops, factories, railroads, refineries, shipyards, ordinance depots, demolition businesses, automobile salvage firms and wrecking firms. Collectively, small scrap metal collection firms are a major supplier.
3
Our scrap metal recycling plantsfacilities typically consist of an office and a warehouse building equipped with specialized equipment for processing both ferrous and nonferrous metal located on several acres of land that we use for receiving, sorting, processing and storing metals. Our warehouse buildings are equipped with specialized equipment for processing both ferrous and nonferrous metal. Several of our scrap metal recycling plantsfacilities use a small portion of their site or a nearby location to display and sell metal products that may be reused for their original purpose without further processing. We equip our larger plantsfacilities with scales, shears, baling presses, briquetting machines, conveyors and magnetic separators, which enable these plantsfacilities to efficiently process large volumes of scrap metals.
Two plantsof our facilities have extensive equipment that segregates metallic content from large quantities of insulated wire. To facilitate processing, shipping and receiving, we equip our ferrous metal processing centersfacilities with presses, shredders or hydraulic shears to prepare and compress scrap metal for easier handling. Cranes are utilizedWe use cranes to handle scrap metals for processing and to load material for shipment. Many facilities have rail access asWe primarily transport processed ferrous scrap is primarily transported to consumers by open gondola railcar or barge whenrailcar; therefore many of our facilities have rail access. When water access is available.available, we transport processed ferrous scrap via barge.
3
Americas Recycling owns sixoperates five large shredding machines, fourthree in Texas, and one each in Florida, and South Carolina,one in Oklahoma, capable of pulverizing obsolete automobiles or other sources of scrap metal. We have threefour additional shredders, onetwo operated by our Americas Mills segment and two operated by our International MillsMill segment. With the exception of precious metals, our scrap metal recycling facilities recycle and process practically all types of metal.
We sell scrap metals to steel mills and foundries, aluminum sheet and ingot manufacturers, brass and bronze ingot makers, copper refineries and mills, secondary lead smelters, specialty steel mills, high temperature alloy manufacturers and other consumers. Ferrous scrap metal is the primary raw material for electric arc furnaces, such as those operated by our Americas Mills segment, and other minimills. Some minimills periodically supplement purchases of ferrous scrap metal with direct reduced iron and pig iron for certain product lines. Our Irving office coordinates the salessale of scrap metals from our scrap metal processing plantsfacilities to our customers. We negotiate export sales through our global network of foreign offices as well as through our Irving office.
We doare not purchase a material amount ofmaterially dependent on any single source for the scrap metal from one source.we purchase. One customer represents 15%14% of our Americas Recycling segment’ssegment's revenues. Our recycling segmentbusiness competes with other scrap metals processors and primary nonferrous metals producers, both domestic and foreign, for sales of nonferrous materials. Consumers of nonferrous scrap metals frequently can utilize primary or “virgin”"virgin" ingot processed by mining companies instead of nonferrous scrap metals. The prices of nonferrous scrap metals are closely related to, but generally are less than, the prices of primary or “virgin”"virgin" ingot.
AMERICAS MILLS SEGMENT
Our Americas Mills operations through a network of:
Our five steel minimills are located in Texas, Alabama, South Carolina, Arizona and Arkansas and one micro mill located in Arizona.Arkansas. We utilize a fleet of trucks that we own as well as private haulers to transport finished products from the millsminimills to our customers and to our fabricating shops. To minimize the cost of our products, to the extent feasibly consistent with market conditions and working capital demands, we prefer to operate all millsof our minimills near full capacity. Market conditions such as increases in quantities of competing imported steel, production rates at domestic competitors, customer inventory levels or a decrease in construction activity may reduce demand for our products and limit our ability to operate the millsminimills at full capacity. Through our operations and capital improvements, we strive to increase productivity and capacity at the millsminimills and to enhance our product mix. Since the steel mill
4
business is capital intensive, we make substantial capital expenditures on a regular basis to remain competitive with other low cost producers. Over the past three fiscal years we have spent approximately $232$100 million, or 27%39% of our total capital expenditures, on projects at the steel mills operated bywithin our Americas Mills segment.
The following table compares the amount of steel (in short tons) melted, rolled and shipped by our five steel millsminimills in the past three fiscal years:
| 2010 | 2009 | 2008 | ||||||||||
| Tons melted | 2,077,000 | 1,599,000 | 2,396,000 | |||||||||
| Tons rolled | 1,734,000 | 1,478,000 | 2,101,000 | |||||||||
| Tons shipped | 2,156,000 | 1,736,000 | 2,528,000 | |||||||||
| (in short tons) | 2013 | 2012 | 2011 | ||||||
| Tons melted | 2,407,000 | 2,568,000 | 2,470,000 | ||||||
| Tons rolled | 2,295,000 | 2,206,000 | 2,088,000 | ||||||
| Tons shipped | 2,561,000 | 2,682,000 | 2,518,000 | ||||||
Descriptions of minimill capacity, particularly rolling capacity, are highly dependent on the specific product mix manufactured. Each of ourOur minimills can and do roll many different types and sizes of products in their range depending on market conditions including pricing and demand. Therefore ourOur estimated annual capacity estimates assumefor finished goods of 2,900,000 tons assumes a typical product mix and will vary with the products we actually produced. produce.
We acquired our largest steel minimill, located in Seguin, Texas, in 1963. We acquired our minimills in Birmingham, Alabama and Cayce, South Carolina in 1983 and 1994, respectively, and our smallest steel minimill, located near Magnolia, Arkansas, has been in operation since 1987. In September 2009, we opened our newest minimill in Mesa, Arizona.
4
Our Texas, minimill has annual capacity of approximately 1,000,000 tons meltedAlabama and 900,000 rolled. Our Alabama minimill’s annual capacity is approximately 700,000 tons melted and 575,000 tons rolled. We have annual capacity at our South Carolina minimill of approximately 800,000 tons meltedminimills each consist of:
a melt shop with an electric arc furnace that melts ferrous scrap metal;
continuous casting equipment that shapes the molten metal into billets;
a reheating furnace that prepares billets for rolling;
a rolling mill that forms products from heated billets;
a mechanical cooling bed that receives hot product from the rolling mill;
finishing facilities that cut, straighten, bundle and 900,000 tons rolled. Our Arizona micro mill has annual capacity of approximately 280,000 tons meltedprepare products for shipping; and rolled. We have annual capacity at our Arkansas minimill of approximately 150,000 tons rolled.
supporting facilities such as maintenance, warehouse and office areas.
Our Texas minimill manufactures a full line of bar size products, including reinforcing bar, commonly referred to as "rebar", angles, rounds, channels, flats, and special sections used primarily in building highways, reinforcing concrete structures and manufacturing. ItThis mill sells primarily to the construction, energy and petrochemical industries, as well as to service center, energy, petrochemical,centers and manufacturers of original equipment manufacturing industries.equipment. The Texas minimill primarily ships its products to customers located in Texas, Louisiana, Arkansas, Oklahoma and New Mexico.Louisiana. It also ships products to approximately 20 other states and to Mexico. states.
Our Texas minimill melted 896,000 tons during 2010 compared to 746,000 tons during 2009, and rolled 731,000 tons, an increase of 64,000 tons from 2009.
Our South Carolina minimill manufactures a full line of bar size products, which primarily includesinclude steel
5
reinforcing bar. TheThis minimill also manufactures angles, rounds, squares, fence post sections and flats. The South Carolina minimill ships its products to customers located in the Southeast and mid-Atlantic areasregions, which include the states from Florida through southern New England. During 2010, the
Our minimill melted 565,000 tons and rolled 475,000 tons compared to 511,000 tons melted and 481,000 tons rolled during 2009.
The primary raw material for our Texas, Alabama, South Carolina and Arizona millsminimills is ferrous scrap metal. We purchaseThis segment operates nine scrap metal recycling plants with four located in South Carolina, three located in Texas, and two located in Alabama, which directly support the raw material from suppliers generally within a 300 mile radius of each minimill including a substantial amount from the CMC Americas Recycling segment. Our Texas minimill runs a shredding facility as a part of the mill operations with that entire shredder’s processed ferrous scrap consumed at the Texas minimill.minimills. This segment also includes two automobile shredders. We believe the supply of ferrous scrap metal is adequate to meet our future needs, but it has historically been subject to significant price fluctuations which have occurred more rapidly over the last sixseveral years. All four mills alsoof these minimills consume large amounts of electricity and natural gas. We have not had any significant curtailments and believe that energy supplies are adequate. The supply and demand of regional and national energy and the extent of applicable regulatory oversight of rates charged by providers affect the prices we pay for electricity and natural gas.
Our smaller Arkansas minimill does not have a melt shop or continuous casting equipment. The Arkansas minimill manufacturing process begins with a reheating furnace utilizing used rail, primarily salvaged from railroad abandonments, and excess billets acquired either from our other millsminimills or from unrelated suppliers as its raw material. The remainder of the manufacturing process utilizes a rolling mill, cooling bed and finishing equipment and support facilities similar to, but on a smaller scale than, those at our other minimills. The Arkansas minimill primarily manufactures metal fence post stock, small diameter reinforcing bar sign posts and bed frame angles with some flats, angles and squares.
At our Arkansas minimill and at our facilities in San Marcos, Texas, Brigham City, Utah, and Cayce, South Carolina, we fabricate fence post stock into studded “T”"T" metal fence posts. Since our Arkansas minimill does not have melting facilities, the minimill depends on an adequate supply of competitively priced used rail or billets. The availability of these raw materials fluctuates with the pace of railroad abandonments, rail replacement by railroads, demand for used rail from competing domestic and foreign rail rerolling mills and the level of excess billet production offered for sale atby steel producers.
5
No single customer purchasesrepresents 10% or more of our Americas Mills segment’s production.segment's revenues. Due to the nature of certain stock products we sell in the Americas Mills segment, we do not have a long lead time between receipt of a purchase order and delivery.the delivery of product. We generally fill orders for stock products from inventory or with products near completion. As a result, we do not believe that backlog levels are a significant factor in the evaluation of these operations. Backlog for our millsAmericas Mills minimills at August 31, 20102013 was approximately $244$252.2 million as compared to $142$244.5 million at August 31, 2009.2012.
6
AMERICAS FABRICATION SEGMENT
Steel Fabrication Through our Americas Fabrication segment we operate 46 facilities that we consider to be engaged in the various aspects of steel fabrication. Most of the facilities engage in general fabrication of reinforcing and structural steel, with four facilities fabricating only steel fence posts. We obtain steel for these facilities from our own mills,minimills, through purchases from other steel manufacturers through our marketing and distribution business, and directly from unrelatedthird-party steel vendors. In 2010, we shipped 979,000 tons of fabricated steel, a decrease of 170,000 tons from 2009.
We conduct steel fabrication activities in facilities located15 locations in Alabama at Birmingham; in Arkansas at Little Rock, Hope and Magnolia; in Arizona at Mesa;Texas, five in California, at Bloomington, Claremont, Etiwanda, Fontana, Fresno, Santee, Stockton, and Tracy; in Colorado at Brighton and Denver; in Florida at Fort Myers, Jacksonville, and Kissimmee; in Georgia at Garden City and Lawrenceville; in Illinois at Kankakee; in Louisiana at Baton Rouge, Keithville and Pearl River; in Mississippi at Lumberton; in Nevada at Las Vegas; in New Mexico at Albuquerque; in North Carolina at Gastonia; in Ohio at Cleveland; in Oklahoma at Oklahoma City;four in South Carolina, at Cayce (2), Columbiathree in Florida, two each in Arkansas, Colorado, Illinois, Louisiana, North Carolina and Taylors (2);Virginia, and one each in Arizona, Georgia, Mississippi, Nevada, New Mexico, Tennessee at Nashville; in Texas at Beaumont, Buda, Corpus Christi, Dallas, Harlingen, Houston (2), Laredo, Melissa, Pharr, San Antonio, San Marcos, Seguin, Victoria, Waco and Waxahachie (2); in Utah at Brigham City; and in Virginia at Farmville, Fredericksburg and Norfolk.Utah. Three locations were closed during fiscal 2013.
Fabricated steel products are used primarily in the construction of commercial and non-commercial buildings, hospitals, convention centers, industrial plants, power plants, highways, bridges, arenas, stadiums, and dams. Generally, we sell fabricated steel in response to a bid solicitation from a construction contractor or from the project owner. Typically, the contractor or the owner of the project awards the job based on the competitive prices of the bids and does not individually negotiate with the bidders.bidders individually.
7
Backlog in our steel fabrication operations was approximately $471$713.8 million at August 31, 20102013 as compared to $621$718.1 million at August 31, 2009. Other2012. We do not consider other backlogs in the Americas Fabrication segment are not consideredto be material. No single customer accountsaccounted for 10% or more of our Americas Fabrication segment’s sales.segment's sales in 2013.
CMC INTERNATIONAL DIVISION OPERATIONS
INTERNATIONAL MILLS SEGMENTMILL
Our Swiss subsidiary, Commercial Metals International AG owns two steel minimills — CMC Zawiercie S.A. (“CMCZ”) with operations at Zawiercie, Poland and CMC Sisak d.o.o. (“CMCS”) with operations at Sisak, Croatia. These two mills along with our internationalMill segment is comprised of all mill, recycling and fabrication operations constitute the International Mills segment.
CMCP is a significant manufacturer of rebar, merchant bar and wire rod in Central Europe, selling rebar primarily to fabricators, manufacturers, distributors and construction companies. Principal customers for wire rod are meshmakers, end users and distributors. CMCZ’s products are generally sold to customers located within a market area of 400 miles of the mill. The majority of sales are to customers within Poland withPoland; however, CMCP exports approximately 30% of sales to Germany, the Czech Republic, Slovakia Hungary and Germany being the major export markets.other countries. Ferrous scrap metal, is the principal raw material for CMCZ and is generally obtained from scrap metal processors and generators within 400 miles of the mill. Ferrous scrap metal,used by CMCP, electricity, natural gas and other necessary raw materials for the steel manufacturing process are generally readily available, although they are subject to periodic significant price fluctuations. A large capacity scrap metal shredding
6
facility similar to the largest shredder we operate in the United States is located at CMCZCMCP and supplies CMCZCMCP with a portion of its scrap metal requirements.
Our international fabrication operations have expanded downstream captive uses for a portion of the rebar and wire rod manufactured at CMCZ.CMCP. We conduct rebar fabrication activities in Zawiercie, Żyrardów and Zyrardow, Poland, and Rosslau, Germany.Glogów Małopolski, Poland. These three rebar fabrication facilities are similar to those operated by our domestic fabrication facilities and sell fabricated rebar to contractors for incorporation into construction projects generally within 200 miles of each facility. Apart fromprojects. In addition to fabricated rebar, our unitsthese facilities sell fabricated mesh, assembled rebar cages and other rebar byproducts. Total production capacity of these units is approximately 180,000 tons of steel products annually.
8
Additionally, we operate a fabrication facility in Dabrowa Górnicza, Poland that produces welded steel mesh, cold rolled wire rod and cold rolled reinforcing bar. This operation enables our international fabricationsfabrication operations to supplement sales of fabricated reinforcing bar by also offering wire mesh to customers including metals service centers as well as construction contractors. At the end of fiscal year 2010, we upgraded this facility with two cold drawing lines and a fast and efficient mesh welding line which will increase our production capacities to 160,000 tons per year. With our cold drawn and mesh products weWe maintain a presence in the Polish market but we also sell to neighboring countries such as the Czech Republic, Germany and Slovakia.
During the first quarter of 2012, we announced the closure of our Croatian pipe mill, CMC Sisak, d.o.o. ("CMCS"). After review of the marketplace and our production capabilities, we determined that achieving sustained profitability would take additional time and investment in an operation which was not considered part of our core business. In June 2012, we completed the sale of all of the outstanding shares of CMCS for $30.6 million, of which $3.1 million will be paid, subject to the satisfaction of certain conditions. As part of the share sale, certain assets were excluded from the transaction. The Company sold a majority of the excluded assets during fiscal 2012, resulting in a pre-tax gain of $13.8 million, including a foreign currency translation gain of $7.5 million. The remaining assets were sold during the first quarter of fiscal 2013 for $3.9 million with no impact to the consolidated statements of operations. Additionally, we sold our rebar fabrication shop in Rosslau, Germany for $11.3 million which resulted in a fourth quarter loss of $3.8 million in fiscal 2012.
INTERNATIONAL MARKETING AND DISTRIBUTION SEGMENT
Our International Marketing and Distribution segment includes international operations for the sales, distribution and processing of steel products, ferrous and nonferrous metals and other industrial products. Additionally, this segment includes the Company's U.S.-based marketing and distribution divisions, CMC Cometals and CMC Cometals Steel, and a recycling facility in Singapore. We buy and sell primary and secondary metals, fabricated metals, semi-finished, long and flat steel products and other industrial products. During the past year, theour International Marketing and Distribution facilities sold approximately 2.33.5 million tons of steel products.products in addition to raw material commodities. We market and distribute these products through aour global network of offices, processing facilities and joint venture offices located around the world. ventures.
We purchase steel products, industrial minerals, ores, metal concentrates and ferroalloys from producers in domestic and foreign markets. Occasionally, we purchase these materials from suppliers, such as trading companies or industrial consumers, who have a surplus of these materials. We utilize long-term contracts, spot market purchases and trading or barter transactions to purchase materials. To obtain favorable long termlong-term supply agreements, we occasionally offer assistance to producers by arranging structured finance transactions to suit their objectives. Our exposure to these structured finance transactions is negligible to our business. See discussion in Note 12, Commitments and Contingencies, to our consolidated financial statements.
We sell our products to customers, primarily manufacturers, in the steel, nonferrous metals, metal fabrication, chemical, refractory, construction and transportation businesses. We sell directly to our customers through and with the assistance of our offices in Irving, Texas; Fort Lee, New Jersey; Sydney, Perth, Melbourne, Brisbane and Adelaide, Australia; Singapore; Bangkok, Thailand; Zug, Switzerland; Luxembourg; Kürten, Germany; Cardiff, United Kingdom; Temse, Belgium; Hong Kong; Beijing, Guangzhou and Shanghai, China. We have a representative officeoffices in Moscow. WeMoscow and Malaysia, and we have agents or joint venture partners in additional offices located in significant international markets. Our network of offices shares information regarding the demand for our materials, assists with negotiation and performance of contracts and other services for our customers and identifies and maintains relationships with our sources of supply.
In most transactions, we act as principal by taking title and ownership of the products. We are at times designated as a marketing representative, sometimes exclusively, by product suppliers. We utilize agents when appropriate,suppliers and on occasion we act as a broker for these products. We buy and sell these products in almost all major markets throughout the world where tradepermitted by American-owned companies is permitted.United States companies.
As opposed to companies that trade commodity futures contracts and frequently do not take delivery of the commodity.commodity, we market physical products. As a result of sophisticated global communications, our customers and suppliers often have easy access
7
to quoted market prices, although such price quotes are not always indicative of actual transaction prices. Therefore, to distinguish ourselves, we focus on value addedvalue-added services for both sellers and buyers. Our services include actual physical market pricing and trend information (in contrast to market information from more speculative metal exchange futures), technical information and assistance, financing, transportation and shipping (including chartering of vessels), storage, warehousing, just-in-time delivery, insurance, hedging and the ability to consolidate smaller purchases and sales into larger, more cost efficient transactions. TheseWe perform these services are performed in the normal course of business and the services are included in the transaction price as there is no separate revenue stream for each service. We attempt to limit exposure to price fluctuations by offsetting purchases with concurrent sales. We also enter into currency exchange contracts as economic hedges of sales and purchase commitments denominated in currencies other than the U.S. dollar or the functional currency of our international subsidiaries. OurWe design our policies are designed to prohibit speculation on changes in the markets.
We have investments of approximately 11% of the outstanding stock of a Czech Republic long products steel mill and approximately 24% of a Belgium business that processes and pickles hot rolled steel coil. Through marketing and distribution agreements, these investments allow us to expand our marketing and distribution activities by selling a portion of the products they produce and on occasion supplying a portion of their raw material requirements. Our marketing and distribution joint venture with the Czech Republic mill represents 15% of sales for this segment for the year ended August 31, 2010. This marketing and distribution agreement will expire on December 31, 2010.
9
This segment also operates a recycling facility in Singapore. The facility is similar to those operated by theour Americas Recycling segment of CMC Americas but on a smaller scale, and is operated as part of the International Marketing and Distribution segment due to its oversight by managers in this segment.
During the first quarter of fiscal 2013, we completed the sale of our 11% ownership interest in Trinecke Zelezarny, a.s. ("Trinecke"), a discussionCzech Republic joint-stock company, for $29.0 million resulting in a pre-tax gain of the risks attendant to our foreign operations, see “Risk Factors — Operating Internationally Carries Risks and Uncertainties which Could Negatively Affect Our Results of Operations.”$26.1 million.
For financial data on the above segments, see “Financial"Financial Statements and Supplementary Data — Note 15,21, Business Segments.”"
SEASONALITY
Many of our millsminimills and fabrication facilities’facilities serve customers are in the construction business. Due to the increase in construction during the spring and summer months, our sales are generally higher in the third and fourth quarters than in the first and second quarters of our fiscal year.
COMPETITION
We believe our Americas Recycling segment is one of the largest entities engaged in the recycling of nonferrous scrap metals in the United States. We are also a major regional processor of ferrous scrap metal. The scrap metal recycling business is subject to cyclical fluctuations based upon the availability and price of unprocessed scrap metal and the demand for steel and nonferrous metals. Buying pricesIn our Americas Recycling segment, we compete primarily on price and serviceon the services we provide to scrap suppliers and generators are the principal competitive factors for the recycling segment.generators. The price offered for scrap metal is the principal competitive factor in acquiring material from smaller scrap metals collection firms, while industrialfirms. Industrial generators of scrap metal may also consider the importance offactors other factorsthan price, such as supplying appropriate collection containers, timely removal, reliable documentation including accurate and detailed purchase records with customized reports, the ability to service multiple locations, insurance coverage, and the buyer’sbuyer's financial strength.
Our Americas Mills segment competes with regional, national and foreign manufacturers of steel and copper.steel. We do not produce a significant percentage of the total domestic output of most of our products. However, we are considered a substantial supplier in the markets near our facilities. We compete primarily on the services we provide to our customers and the price and quality of our products and our service.products. See “Risk"Risk Factors — Risks Related to Our Industry.”Industry" below.
Our Americas Fabrication segment competes with regional and national suppliers. We believe that we are among the largest fabricators of reinforcing bar in the United States. We also believe that we are the largest manufacturer of steel fence posts in the United States.
8
Our International Mill segment competes with several large manufacturers of rebar and wire rod in Central and Eastern Europe, primarily on the basis of price, quality and product availability. We believe that CMCP is the second largest supplier of wire rod and reinforcing bar in the Polish market.
Our International Marketing and Distribution business issegment operates in a highly competitive.competitive sector. Our products in the distribution business are standard commodity items. We compete primarily on the price, quality and reliability of our products, our financing alternatives and ourthe additional services.services we provide. In this business, we compete with other domestic and foreign trading companies, some of which are larger and may have access to greater financial resources. In addition, some of
10
our competitors may be able to pursue business without being restrictedrestriction by the laws of the United States. We also compete with industrial consumers who purchase directly from suppliers, and from importers and manufacturers of semi-finished ferrous and nonferrous products. Our CMC Coil Steels Group, a distributorWe believe Steel Distribution and G.A.M., distributors of steel sheet and coil in Australia, is believed to beare the third largest distributordistributors of those products in Australia.
ENVIRONMENTAL MATTERS
A significant factor in our business is our compliance with environmental laws and regulations. See “Risk"Risk Factors — Risks Related to Our Industry”Industry" below. Compliance with and changes in various environmental requirements and environmental risks applicable to our industry may adversely affect our results of operations and financial condition.
Occasionally, we may be required to clean up or take certain remediation action with regard to sites we use or formerly used in our operations. We may also be required to pay for a portion of the costs of clean up or remediation cost at sites we never owned or onat sites which we never operated, if we are found to have arranged for treatment or disposal of hazardous substances on the sites. The U.S. Environmental Protection Agency (“EPA”("EPA"), or equivalent state agency, has named us as a potentially responsible party (“PRP”("PRP"), at several Federal Superfund sites or similar state sites. These agencies allege that we and other PRP’sPRPs are responsible for the cleanup of those sites solely because we sold scrap metals or other materials to unrelated manufacturers. With respect to the sale of scrap metals, we contend that an arm’sarm's length sale of valuable scrap metal for use as a raw material in a manufacturing process that we have nodo not control of should not constitute “an"an arrangement for disposal or treatment of hazardous substances”substances" as defined under Federal law. In 2000, the Superfund Recycling Equity Act was signed into law which, subject to the satisfaction of certain conditions, provides legitimate sellers of scrap metal for recycling with some relief from Superfund liability under Federal law. Despite Congress’Congress' clarification of the intent of the Federal law, some state laws and environmental agencies still seek to impose such liability. We believe efforts to impose such liability are contrary to public policy objectives and legislation encouraging recycling and promoting the use of recycled materials, and we continue to support clarification of state laws and regulations consistent with Congress’Congress' action.
New Federal, state and local laws, regulations and the varying interpretations of such laws by regulatory agencies and the judiciary impact how much money we spend on environmental compliance. In addition, uncertainty regarding adequate control levels, testing and sampling procedures, new pollution control technology and cost benefit analysis based on market conditions impact our future expenditures in order to comply with environmental requirements. We cannot predict the total amount of capital expenditures or increases in operating costs or other expenses that may be required as a result of environmental compliance. We also do not know if we can pass such costs on to our customers through product price increases. During 2010,2013, we incurred environmental costs including disposal, permits, license fees, tests, studies, remediation, consultant fees and environmental personnel expense of approximately $23 million.$30.1 million. In addition, we estimate that we spent approximately $14$10.5 million during 20102013 on capital expenditures for environmental projects. We believe that our facilities are in material compliance with currently applicable environmental laws and regulations. We anticipate capital expenditures for new environmental control facilities during 20112014 to be approximately $3 million.$7.2 million.
As of August 31, 2010,2013, we had 11,558approximately 9,411 employees. The Americas Recycling segment employed 1,496approximately 1,411 people, the Americas Mills segment employed 2,008approximately 1,695 people, the Americas Fabrication segment employed 3,354approximately 2,989 people, the International MillsMill segment employed 3,471approximately 2,103 people and the International Marketing and Distribution segment employed 657approximately 703 people. As of August 31, 2010,2013, we had 572approximately 510 employees providing services to our divisions and subsidiaries in shared service operations, general corporate administration (including treasury, tax, IT,information technology, internal audit and other services), and management. ProductionCertain of our employees belong to unions for collective bargaining purposes, including employees at one metals recycling plant and five fabrication facilities are represented by unions for collective bargaining purposes. Approximately one halfwithin the Americas division, and approximately 44% of International Mills’ employees are represented by unions.Mill's employees. We believe that our labor relations are generally good to excellent and our work force is highly motivated.
11
9
ITEM 1A. RISK FACTORS
There are inherent risks and uncertainties associated with our company, you shouldbusiness that could adversely affect our business, results of operations and financial condition. Set forth below are descriptions of those risks and uncertainties that we currently believe to be aware of variousmaterial, but the risks including those described below. You should carefully consider these risk factors together with all of the other information included in this Annual Report on Form 10-K. The risksand uncertainties described below are not the only risks facing us.and uncertainties that could adversely affect our business, results of operations and financial condition. If any of these risks actually occur,occurs, our business, financial condition and results of operations or cash flows could be materially adversely affected and you may lose all or part of your investment.affected.
RISKS RELATED TO OUR INDUSTRY
OUR INDUSTRY IS AFFECTED BYVULNERABLE TO GLOBAL ECONOMIC FACTORSCONDITIONS, INCLUDING THE SLOW RECOVERY FROM THE RECENT RECESSION AND THE RISK OF A RECESSION AND OUR CUSTOMERS’ ACCESS TO CREDIT FACILITIES.RELAPSE.
Our financial results are substantially dependent upon the overall economic conditions in the United States and the European Union. A continuedThe sluggish pace of recovery from the deep global recession that began in the United States the European Union, or globally — or the public perception that a recession is continuing — could further substantially decreasein December 2007 and officially ended in June 2009 has continued to have an adverse effect on the demand for our products and, adversely affectconsequently, our business. Manybusiness, results of our products are commodities subjectoperations and financial condition. In addition, uncertainties in Europe regarding the financial sector and sovereign debt and the potential impact on banks in other regions of the world have continued to cyclical fluctuations in supplyweigh on global and demand in metal consuming industries and construction.domestic growth. Metals industries have historically been vulnerable to significant declines in consumption and product pricing during prolonged periods of economic downturn. Likewise the pace of construction has historically slowed significantly during economic downturns. Many of our customers rely on access to credit to adequately fund their operations or to finance construction projects. The inability of our customers to access credit facilities will adversely affect our business by reducing our sales, increasing our exposure to accounts receivable, increasing our bad debts and reducing our profitability. Our geographic concentration in the southern and southwestern United States as well as Central Europe, Australia, China, and the Middle East exposes us to the local market conditions in these regions. Economic downturns in these areas or decisions by governments that have an impact on the level and pace of overall economic activity in a particular region could also adversely affect demand for our products and, consequently, our sales and profitability.
Although we believe that the long-term prospects for the steel industry remain bright, we are unable to predict the duration of the depressed economic conditions that are contributing to reduced demand for our products. Future economic downturns or a prolonged period of slow growth or economic stagnation could materially adversely affect our business, results of operations and financial condition.
OUR INDUSTRY IS CYCLICAL, AND PROLONGED PERIODS OF SLOW ECONOMIC DECLINESGROWTH COULD HAVE A MATERIAL ADVERSE EFFECT ON OUR BUSINESS.BUSINESS, RESULTS OF OPERATIONS AND FINANCIAL CONDITION.
Our business supports cyclical industries such as commercial, residential and government construction, energy, metals service center, petrochemical and original equipment manufacturing. These industriesWe may experience significant fluctuations in demand for our products from these industries based on economic conditions, energy prices, consumer demand and decisions by governments to fund infrastructure projects such as highways, schools, energy plants and airports. Many of these factors are beyond our control. As a result of the volatility in the industries we serve, we may have difficulty increasing or maintaining our level of sales or profitability. IfOur business, results of operations and financial condition would be adversely affected if the industries we serve suffer a prolonged downturn then our business may be adversely affected.or anemic growth. Although the residential housing market is not a significant direct factor in our business, related commercial and infrastructure construction activities, such as shopping centers, schools and roads, could be adversely impacted by a prolonged slump in new housing construction.
Our industry is characterized by low backlogs, which means that our business, results of operations and financial condition are promptly affected by short-term economic fluctuations.
THE SCRAP METAL RECYCLING INDUSTRY HAS HISTORICALLY BEEN, AND IS EXPECTED TO REMAIN, HIGHLY CYCLICAL. A PROLONGED PERIOD OF LOW SCRAP PRICES OR A FALL IN SCRAP METAL PRICES, COULD RESULT IN THE WEAKENING OF SCRAP FLOWS AND THEREBY REDUCE OUR ABILITY TO OBTAIN, PROCESS AND SELL RECYCLED MATERIALS, AND THIS COULD HAVE A MATERIAL ADVERSE EFFECT ON OUR METALS RECYCLING OPERATIONS' BUSINESS, RESULTS OF OPERATIONS AND FINANCIAL CONDITION.
The purchase prices for automobile bodies and various other grades of obsolete and industrial scrap, as well as the selling prices for processed and recycled scrap metals we utilize in our own manufacturing process or we resell to others through our metals recycling operations, are highly volatile. As a metals recycler, we may attempt to respond to changing recycled metal selling prices by adjusting the scrap metal purchase prices we pay to others, but our ability to do this may be limited by competitive or other factors during periods of low scrap prices, when the supply of scrap may decline considerably, as scrap generators hold onto their scrap in the hope of getting higher prices later; conversely, increased foreign demand for scrap due to economic expansion in countries such as China, India, Brazil, and Turkey can result in an outflow of available domestic scrap as well as higher scrap
prices that cannot always be passed on to domestic scrap consumers, further reducing the available domestic scrap flows and scrap margins all of which could adversely affect our sales and profitability.
A SIGNIFICANT REDUCTION IN CHINA’SCHINA'S STEEL CONSUMPTION OR INCREASED CHINESE STEEL PRODUCTION SUBSTANTIALLY EXCEEDING LOCAL DEMAND MAY RESULT IN CHINA BECOMING A LARGE EXPORTER OF STEEL AND DISRUPTION TO WORLD STEEL MARKETS.
Chinese economic expansion has affected the availability and heightened the volatility of many commodities that we market and use in our manufacturing process, including steel. Expansions and contractions in China’sChina's economy can have major effects on the price of our finished steel products and many commodities that affect us such as secondary metals, energy, marine freight rates, steel making supplies such as ferroalloys and graphite electrodes, and materials we market, such as iron ore and coke. ShouldIf Chinese demand weakenweakens or Chinese steel production be allowed to expand uncheckedexpands to the point that it significantly exceeds the country’scountry's consumption, prices for many of the products that we both sell to and export from China may fall, causing erosion in our gross margins and subjecting us to possible renegotiation of contracts or increases in bad debts. Significant exports from China of steel in the product lines we manufacture would likely cause our selling prices to decline and negatively impact our volumes and gross margins.
12
RAPID AND SIGNIFICANT CHANGES IN THE PRICE OF METALS COULD NEGATIVELYADVERSELY IMPACT OUR INDUSTRY.BUSINESS, RESULTS OF OPERATIONS AND FINANCIAL CONDITION.
Prices for most metals in which we deal have experienced increased volatility over the last several years, and the substantial rapid decreases or increases impactsuch increased price volatility impacts us in several ways. Some of our operations, such as theour fabrication operations, may benefit from rapidly decreasing steel prices as their material cost for previously contracted fixed price work declines. Others, such as our Americas Mills and International MillsMill segments, would likely experience reduced margins and may be forced to liquidate high cost inventory at reduced margins or losses until prices stabilized.stabilize. Sudden increases could have the opposite effect. Overall, we believe that rapid substantial price changes are not to our industry’sindustry's benefit. Our customer and supplier base would be impacted due to uncertainty as to future prices. A reluctance to purchase inventory in the face of extreme price decreases or to sell quickly during a period of rapid price increases would likely reduce our volume of business. Marginal industry participants or speculators may attempt to participate to an unhealthy extent during a period of rapid price escalation with a substantial risk of contract default shouldif prices suddenly reverse. Risks of default in contract performance by customers or suppliers as well as an increased risk of bad debts and customer credit exposure wouldcould increase during periods of rapid and substantial price changes.
EXCESS CAPACITY IN OUR INDUSTRY COULD INCREASE THE LEVEL OF STEEL IMPORTS INTO THE UNITED STATES, RESULTING IN LOWER DOMESTIC PRICES WHICH WOULD ADVERSELY AFFECT OUR SALES, MARGINS AND PROFITABILITY.
Steel-making capacity exceeds demand for steel products in some countries. Rather than reducing employment by rationalizing capacity with consumption, steel manufacturers in these countries (often with local government assistance or subsidies in various forms) have traditionally periodically exported steel at prices significantly below their home market prices and which may not reflect their costs of production or capital. This supply of imports can decrease the sensitivity of domestic steel prices to increases in demand or decrease our ability to recover our manufacturing costs. The excess capacity may create downward pressure on our steel prices which couldwould adversely affect our sales, margins and profitability.
COMPLIANCE WITH AND CHANGES IN ENVIRONMENTAL AND REMEDIATION REQUIREMENTS COULD RESULT IN SUBSTANTIALLY INCREASED CAPITAL REQUIREMENTS AND OPERATING COSTS.
Existing laws or regulations, as currently interpreted or reinterpreted in the future, orand future laws orand regulations, may have a material adverse effect on our business, results of operations and financial condition. Compliance with environmental laws and regulations is a significant factor in our business. We are subject to local, state, Federal and international environmental laws and regulations concerning, among other matters, waste disposal, air emissions, waste and storm water effluent and disposal and employee health. New facilities that we may build, especially steel minimills, are required to obtain several environmental permits before significant construction or commencement of operations. Delays in obtaining permits or unanticipated conditions in such permits could delay the project or increase construction costs or operating expenses. Our manufacturing and recycling operations produce significant amounts of by-products, some of which are handled as industrial waste or hazardous waste. For example, our minimills generate electric arc furnace dust (“("EAF dust”dust"), which the EPAEnvironmental Protection Agency (the "EPA") and other regulatory authorities classify as hazardous waste. EAF dust requiresand other industrial waste and hazardous waste require special handling, recycling or disposal.
In addition, the primary feed materials for the shredders operated by our scrap metal recycling facilities are automobile hulks and obsolete household appliances. Approximately 20% of the weight of an automobile hull consists of unrecyclable material
known as shredder fluff. After the segregation of ferrous and saleable nonferrous metals, shredder fluff remains. We, along with others in the recycling industry, interpret Federal regulations to require shredder fluff to meet certain criteria and pass a toxic leaching test to avoid classification as a hazardous waste. We also endeavor to remove hazardous contaminants from the feed material prior to shredding. As a result, we believe the shredder fluff we generate is not normally considered or properly classified as hazardous waste. If the laws, regulations or testing methods change with regard to EAF dust or shredder fluff or other by-products, we may incur additional significant expenditures.costs.
13
We may also be required to conduct additional clean up at sites where we have already participated in remediation efforts or to take remediation action with regard to sites formerly used in connection with our operations. We may be required to pay for a portion or all of the costs of clean up or remediation at sites we never owned or on which we never operated if we are found to have arranged for treatment or disposal of hazardous substances on the sites. In cases of joint and several liability, we may be obligated to pay a disproportionate share of cleanup costs if other responsible parties are financially insolvent.
INCREASED REGULATION ASSOCIATED WITH CLIMATE CHANGE AND GREENHOUSE GAS EMISSIONS COULD IMPOSE SIGNIFICANT ADDITIONAL COSTS ON BOTH OUR STEELMAKING AND METALS RECYCLING OPERATIONS.
The U.S. government and various governmental agencies have introduced or are contemplating regulatory changes in response to the potential impactsimpact of climate change. International treaties or agreements may also result in increasing regulation of greenhouse gas emissions, including the introduction of carbon emissions trading mechanisms. Any such regulation regarding climate change and greenhouse gas or GHG("GHG") emissions could impose significant costs on our steelmaking and metals recycling operations and on the operations of our customers and suppliers, including increased energy, capital equipment, environmental monitoring and reporting and other costs in order to comply with current or future laws or regulations concerning and limitations imposed on our operations by virtue of climate change and GHG emissions laws and regulations. The potential costs of “allowances,” “offsets”"allowances," "offsets" or “credits”"credits" that may be part of potential cap-and-trade programs or similar future regulatory measures are still uncertain. Any adopted future climate change and GHG regulations could negatively impact our ability (and that of our customers and suppliers) to compete with companies situated in areas not subject to such limitations. From a medium and long-term perspective, as a result of these regulatory initiatives, we may see an increase in costs relating to our assets that emit significant amounts of greenhouse gases as a result of these regulatory initiatives.gases. These regulatory initiatives will be either voluntary or mandatory and may impact our operations directly or through our suppliers or customers. Until the timing, scope and extent of any future regulation becomes known, we cannot predict the effect on our business, results of operations or financial condition, operating performancebut such effect could be materially adverse to our business, financial condition, and ability to compete.results of operations.
RISKS RELATED TO OUR COMPANY
POTENTIAL LIMITATIONS ON OUR ABILITY TO ACCESS CREDIT FACILITIES MAY NEGATIVELY IMPACTADVERSELY AFFECT OUR BUSINESS.BUSINESS, RESULTS OF OPERATIONS AND FINANCIAL CONDITION.
We could be adversely affected if our banks the buyers of our commercial paper or other of the traditional sources supplying our short term borrowing requirements refused to honor their contractcontractual commitments or ceased lending. While we believe the lending institutions participating in our credit arrangements are financially capable, events in the global credit markets, including the failure, takeover or rescue by various government entities of major financial institutions, have created uncertainty of credit availability to an extent not experienced in recent decades. Our commercial paper program is ranked in the third highest category by Moody’s Investors Service (P-3) and by Standard & Poor’s Corporation (A-3). Our senior unsecured debt is investment grade rated by Standard & Poor’sPoor's Corporation (BBB-(BB+) and Moody’sMoody's Investors Service (Baa3)(Ba2). In determining our credit ratings, the rating agencies consider a number of both quantitative and qualitative factors. These factors include earnings (loss), fixed charges such as interest, cash flows, total
14
debt outstanding, off balanceoff-balance sheet obligations and other commitments, total capitalization and various ratios calculated from these factors. The rating agencies also consider predictability of cash flows, business strategy and diversity, industry conditions and contingencies. Lower ratings on our commercial paper program or our senior unsecured debt could impair our ability to obtain additional financing and will increase the cost of the financing that we do obtain.
OUR CUSTOMERSCUSTOMERS' INABILITY TO OBTAIN CREDIT MAY RESULT IN THEIR DEFAULT ON THE DEBTS THEY OWE TO US.
If the recent constraints on access to credit continue for a prolonged period, some of our customers may struggle or fail to meet their obligations to pay us, especially if they in turn experience defaults on receivables due from their customers. A continued recessioneconomic downturn could result in our incurring bad debt costs in excess of our expectations and prior experience. In certain markets, we have experienced a consolidation among those entities to whom we sell. This consolidation, along with higher metals and other commodity prices, has resulted in an increased credit risk spread among fewer customers, often without a corresponding strengthening of their financial status. We have expanded our use of credit insurance for accounts receivableboth in our businesses. While we believe the insurance companies with whom our accounts receivable are insured are capableUnited States and internationally to mitigate the risk of meeting their contract obligations,customer insolvency. However, it is possible that we may not be capable of recovering all of our insured losses should theyif the insurers with whom our accounts receivable are insured experience significant losses threatening their viability. Additionally, credit insurance policies typically have relatively short policy periods and require pre-approval of customers with maximum insured limits established by the customer. ShouldIf credit insurers incur large losses, the insurance may be more difficult and more costly to secure and when available likely only at increased costs with decreased coverage.may be on less favorable terms. While in many international sales transactions we require letters of credit from financial institutions, which we believe to be financially secure, we may be at risk in the event the financial institution subsequently fails and the customer is unable to pay for the products we sold. A significant amount of our accounts receivable are considered to be open account uninsured accounts receivable. We regularly maintain a substantial amount of accounts receivable ($989.7 millionat year end $824 million. During the fiscal year, we had net reductions to bad debt expense of $2.6 million, charged off accounts receivable of $11.6 million and had recoveries of $1.8 million and at year end our allowance for doubtful accounts was approximately $30 million.August 31, 2013).
POTENTIAL IMPACT OF OUR CUSTOMERS’CUSTOMERS' NON-COMPLIANCE WITH EXISTING COMMERCIAL CONTRACTS AND COMMITMENTS.
Most consumers of the metals products we sell have been negatively impacted by the recession. Many of our customers have experienced reductions, some substantial,recession and the continued slow recovery therefrom. Due to their economic hardship or the contraction in their operations. Pricesoperations or due to the fact that the prices for many of the metals products we sell have declined since the customers entered into the contracts with us, some substantially. These factorsof our customers have contributedsought to attempts by some customers to seek renegotiationrenegotiate or cancellation ofcancel their existing purchase commitments. SomeIn addition, some of our customers have breached previously agreed upon contracts to buy our products by refusing delivery of the products. Where appropriate, we have and will in the future pursue litigation to recover our damages resulting from customer contract defaults. A large number of our customers defaulting on existing contractual obligations to purchase our products wouldcould have a material impactadverse effect on our business, results of operations.operations and financial condition.
THE AGREEMENTS GOVERNING THEOUR NOTES AND OUR OTHER DEBT CONTAIN FINANCIAL COVENANTS AND IMPOSE RESTRICTIONS ON OUR BUSINESS.
The indenture governing our 5.625% notes due 2013, 6.50% notes due 2017, and 7.35% notes due 2018 and 4.875% notes due 2023 contains restrictions on our ability to create liens, sell assets, enter into sale and leaseback transactions and consolidate or merge. In addition to these restrictions, our credit facility contains covenants that place restrictions onrestrict our ability to, among other things:
15
things, enter into transactions with affiliates and guarantee the debt of some of our subsidiaries. Our credit facility also requires that we meet certain financial tests and maintain certain financial ratios, including a maximum debt to capitalization and interest coverage ratios and a minimum liquidity requirement.ratios.
Other agreements that we may enter into in the future may contain covenants imposing significant restrictions on our business that are similar to, or in addition to, the covenants under our existing agreements. These restrictions may affect our ability to operate our business and may limit our ability to take advantage of potential business opportunities as they arise.
Our ability to comply with these covenants may be affected by events beyond our control, including prevailing economic, financial and industry conditions. The breach of any of these restrictionscovenants could result in a default under the indenture governing the notes or under our other debt agreements. An event of default under our debt agreements would permit some of our lenders to declare all amounts borrowed from them to be due and payable, together with accrued and unpaid interest. If we were unable to repay debt to our secured lenders or if we incur secured debt in the future, these lenders could proceed against the collateral securing that debt. In addition, acceleration of our other indebtedness may cause us to be unable to make interest payments on the notes.
INCREASES IN THE VALUE OF THE U.S. DOLLAR RELATIVE TO OTHER CURRENCIES MAY ADVERSELY AFFECT OUR BUSINESS.BUSINESS, RESULTS OF OPERATIONS AND FINANCIAL CONDITION.
An increase in the value of the U.S. dollar can be expected tomay adversely affect our business. Inbusiness, results of operations and financial condition, and in particular, major changes in the rateincreased strength of exchange of China’sthe U.S. dollar as compared to China's renminbi or the value of the euro to the U.S. dollar could negatively impactadversely affect our business.business, results of operations and financial condition. A strong U.S. dollar makes imported metal products less expensive, resulting in more imports of steel products into the United States by our foreign competitors, while a weak U.S. dollar may have the opposite impact on imports. With the exception of exports of nonferrous scrap metal by our Americas Recycling segment, we have not recently been a significant exporter of metal products from our United States operations. Economic difficulties in some large steel producing regions of the world, resulting in lower local demand for steel products, have historically encouraged greater steel exports to the United States at depressed prices which can be exacerbated by a strong dollar. As a result, our products whichthat are made in the United States may become relatively more expensive as compared to imported steel, which has had and in the future could have a negative impact on our sales, revenues, profitabilitybusiness, results of operations and cash flows.financial condition.
A strong U.S. dollar hampersmay also hamper our international marketing and distribution business. Weak local currencies limit the amount of U.S. dollar denominated products that we can import for our international operations and limit our ability to be competitive against local producers selling in local currencies.
OPERATING INTERNATIONALLY CARRIES RISKS AND UNCERTANTIESUNCERTAINTIES WHICH COULD NEGATIVELYADVERSELY AFFECT OUR BUSINESS, RESULTS OF OPERATIONS.OPERATIONS AND FINANCIAL CONDITION.
Our foreign operations generated approximately 27% of our 2013 revenue. We have our heaviest concentration of manufacturing facilities in the United States but also have significant facilities in EuropePoland and Australia. Our marketing and trading offices are located in most major markets of the world, withand our suppliers and our customers are located throughout the world. Our marketing and distribution segment relies on substantial international shipments of materials and products in the ordinary course of its business. Our stability, growth and profitability are subject to a number of risks inherent in doing business internationally in addition to the currency exchange risk discussed above, including:
political, military, terrorist or major pandemic events;
legal and regulatory requirements or limitations imposed by foreign governments (particularly those with significant steel consumption or steel related production including China, Brazil, Russia and India) including quotas, tariffs or other protectionist trade barriers, adverse tax law changes, nationalization or currency restrictions;
disruptions or delays in shipments caused by customs compliance or government agencies; and
potential difficulties in staffing and managing local operations.
These types of eventsfactors may adversely affect our ability to operate our business, and could negatively affect our results of operations.operations and financial condition.
16
WE RELY ON THE AVAILABILITY OF LARGE AMOUNTS OF ELECTRICITY AND NATURAL GAS FOR OUR MINIMILL OPERATIONS. DISRUPTIONS IN DELIVERY OR SUBSTANTIAL INCREASES IN ENERGY COSTS, INCLUDING CRUDE OIL PRICES, COULD ADVERSLYADVERSELY AFFECT OUR BUSINESS, RESULTS OF OPERATIONS AND FINANCIAL PERFORMANCE.CONDITION.
Minimills melt steel scrap in electric arc furnaces and use natural gas to heat steel billets for rolling into finished products. As large consumers of electricity and gas, often the largest in the geographic area where our minimills are located, we must have dependable delivery of electricity and natural gas in order to operate. Accordingly, we are at risk in the event of an energy disruption. Prolonged black-outs or brown-outs or disruptions caused by natural disasters such as hurricanes or by political considerations would substantially disrupt our production. While we have not suffered prolonged production delays due to our inability to access electricity or natural gas, several of our competitors have experienced such occurrences. Prolonged substantial increases in energy costs would have an adverse effect on the costs of operating our minimills and would negatively impact our gross margins unless we were able to fully pass through the additional expense.expense to our customers. Our finished steel products are typically delivered by truck. Rapid increases in the price of fuel attributable to increases in crude oil prices will have a negative impact onwould increase our costs and adversely affect many of our customers’customers' financial results, which in turn could result in reduced margins and declining demand for our products. Rapid increases in fuel costs may also negatively impact our ability to charter ships for international deliveries at anticipated freight rates, thereby decreasing our margins on those transactions or causing our customers to look for alternative sources.
IF WE LOSE THE SERVICES OF KEY EMPLOYEES WE MAY NOT BE ABLE TO SUCCESSFULLY MANAGE OUR OPERATIONS AND MEET OUR STRATEGIC OBJECTIVES.
Our future success depends, in large part, on the continued service of our officers and other key employees and our ability to continue to attract and retain additional highly qualified personnel. These employees are integral to our success based on their expertise and knowledge of our business and products. We compete for such personnel with other companies, including public and private company competitors who may periodically offer more favorable terms of employment. The loss or interruption of the services of a number of our key employees could reduce our ability to effectively manage our operations due to the fact that we may not be able to find appropriate replacement personnel in a timely manner appropriate replacement personnel should the need arise.
WE MAY HAVE DIFFICULTY COMPETING WITH COMPANIES THAT HAVE A LOWER COST STRUCTURE OR ACCESS TO GREATER FINANCIAL RESOURCES.
We compete with regional, national and foreign manufacturers and traders. Consolidation among participants in the steel manufacturing and recycling industries has resulted in fewer competitors but several which are significantly larger.larger than us. Some of our larger competitors have greater financial resources and more diverse businesses than us. Some of our foreign competitors may be able to pursue business opportunities without regard forto certain of the laws and regulations with which we must comply, such as environmental regulations. These companies may have a lower cost structure, more operating flexibility and consequently they may be able to offer better prices and more services than we can. There is no assurance that we will be able to compete successfully with these companies. Any of these resultsfactors could have a material adverse effect on our business, financial condition or results of operations.operations and financial condition.
OUR STEEL MINIMILL BUSINESS REQUIRESMINIMILLS REQUIRE CONTINUOUS CAPITAL INVESTMENTS THAT WE MAY NOT BE ABLE TO SUSTAIN.
We must make regular substantial capital investments in our steel minimills to maintain the minimills, lower production costs and remain competitive. We cannot be certain that we will have sufficient internally generated cash or acceptable external financing to make necessary substantial capital expenditures in the future. The availability of external financing depends on many factors outside of our control, including capital market conditions and the overall performance of the economy. If funding is insufficient, we may be unable to develop or enhance our minimills, take advantage of business opportunities and respond to competitive pressures.
SCRAP AND OTHER SUPPLIES FOR OUR BUSINESSES ARE SUBJECT TO SIGNIFICANT PRICE FLUCTUATIONS, WHICH MAY ADVERSELY AFFECT OUR BUSINESS.BUSINESS, RESULTS OF OPERATIONS AND FINANCIAL CONDITION.
17
We depend on ferrous scrap, the primary feedstock for our steel minimills, and other supplies such as graphite electrodes and ferroalloys for our steel minimill operations. Although we believe that the supply of scrap is adequate to meet future needs, theThe price of scrap and other supplies has historically been subject to significant fluctuation. Our future profitability will be adversely affected iffluctuation, and we are unable to pass on to our customers increased raw material and supply costs. We may not be able to adjust our product prices to recover the costs of rapid increases in material prices, especially over the short-term and in our domestic fabrication segment’ssegment's fixed price fabrication contracts.
Our Arkansas mill does not have melting capacity, so it is dependent on an adequate supply of competitively priced used rail. The availability of used rail fluctuates with the pace of railroad abandonments, rail replacement by railroads in the United States and abroad and demand for used rail from other domestic and foreign rail rerolling mills. Price increases for used rail could adversely affect our business.business, results of operations and financial condition.
UNEXPECTED EQUIPMENT FAILURES MAY LEAD TO PRODUCTION CURTAILMENTS OR SHUTDOWNS.
Interruptions in our production capabilities willwould adversely affect our production costs, steel available for salessale and earnings for the affected period. In addition to equipment failures, our facilities are also subject to the risk of catastrophic loss due to unanticipated events such as fires, explosions or violent weather conditions. Our manufacturing processes are dependent upon critical pieces of steel-making equipment, such as our furnaces, continuous casters and rolling equipment, as well as electrical equipment, such as transformers. This equipment may, on occasion, be out of service as a result of unanticipated failures. We have experienced, and may in the future experience, material plant shutdowns or periods of reduced production as a result of such equipment failures. In addition to equipment failures, our facilities are also subject to the risk of catastrophic loss due to unanticipated events such as fires, explosions or violent weather conditions.
COMPETITION FROM OTHER MATERIALS MAY HAVE A MATERIAL ADVERSE EFFECT ON OUR BUSINESS, FINANCIAL CONDITION, RESULTS OF OPERATIONS OR PROSPECTS.AND FINANCIAL CONDITION.
In many applications, steel competes with other materials, such as aluminum and plastics (particularly in the automobile industry), cement, composites, glass and wood. Increased use of or additional substitutes for steel products could adversely affect future market prices and demand for steel products.
HEDGING TRANSACTIONS MAY EXPOSE US TO LOSSLOSSES OR LIMIT OUR POTENTIAL GAINS.
Our product lines and worldwide operations expose us to risks associated with fluctuations in foreign currency exchange rates, commodity prices and interest rates. As part of our risk management program, we use financial instruments, including metals commodity futures, or forwards,natural gas forward contracts, freight forward contracts, foreign currency exchange forward contracts and interest rate swaps.swap contracts. While intended to reduce the effects of the fluctuations, these transactions may limit our potential gains or expose us to loss. Shouldlosses. If our counterparties to such transactions or the sponsors of the exchanges through which these transactions are offered, such as the London Metal Exchange, fail to honor their obligations due to financial distress, we would be exposed to potential losses or the inability to recover anticipated gains from these transactions.
We enter into the foreign currency exchange forwardsforward contracts as economic hedges of trade commitments or anticipated commitments denominated in currencies other than the functional currency to mitigate the effects of changes in currency rates. Although we do not enter into these instruments for trading purposes or speculation, and although our management believes all of these instruments are economically effective as hedges of underlying physical transactions, theseThese foreign exchange commitments are dependent on timely performance by our counterparties. Their failure to perform could result in our having to close these hedges without the anticipated underlying transaction and could result in losses if foreign currency exchange rates have changed.
18
WE ARE INVOLVED AND MAY IN THE FUTURE BECOME INVOLVED IN VARIOUS ENVIRONMENTAL MATTERS THAT MAY RESULT IN FINES, PENALTIES OR JUDGMENTS BEING ASSESSED AGAINST US OR LIABILITY IMPOSED UPON US WHICH WE CANNOT PRESENTLY ESTIMATE OR REASONABLY FORESEE AND WHICH MAY HAVE A MATERIAL IMPACT ON OUR EARNINGSBUSINESS, RESULTS OF OPERATIONS AND CASH FLOWS.FINANCIAL CONDITION.
Under the Comprehensive Environmental Response, Compensation and Liability Act of 1980, called CERCLA or Superfund, or similar state statutes, we may have obligations to conduct investigation and remediation activities associated with alleged releases of hazardous substances or to reimburse the EPAEnvironmental Protection Agency (the "EPA") (or state agencies as applicable) for such activities and to pay for natural resource damages associated with alleged releases. We have been named a potentially responsible party ("PRP") at several Federal and state Superfund sites because the EPA or an equivalent state agency contends that we and other potentially responsible scrap metal suppliers are liable for the cleanup of those sites as a result of having sold scrap metal to unrelated manufacturers for recycling as a raw material in the manufacture of new products. We are involved in litigation or administrative proceedings with regard to several of these sites in which we are contesting, or at the appropriate time may contest, our liability at the sites.liability. In addition, we have received information requests with regard to other sites which may be under consideration by the EPA as potential CERCLA sites.
We are presently participating in PRP organizations at several sites, which are paying for certain remediation expenses. Although we are unable to estimate precisely the ultimate dollar amount of exposure to loss in connection with various environmental matters or the effect on our consolidated financial position, we make accruals as warranted. DueIn addition, although we do not believe that a reasonably possible range of loss in excess of amounts accrued for pending lawsuits, claims or proceedings would be material to our financial statements, additional developments may occur, and due to inherent uncertainties, including evolving remediation technology, changing regulations, possible third-party contributions, the inherent shortcomings of the estimation process, the uncertainties involved in litigation and other factors, the amounts we accrueultimately are required to pay could vary significantly from the amounts we ultimately are required to pay, whichaccrue, and this could have a material adverse effect on our earningsbusiness, results of operations and cash flow.financial condition.
WE ARE SUBJECT TO LITIGATION WHICH COULD ADVERSELY AFFECT OUR PROFITABILITY.BUSINESS, RESULTS OF OPERATIONS AND FINANCIAL CONDITION.
We are involved in various litigation matters, including regulatory proceedings, administrative proceedings, governmental investigations, environmental matters and construction contract disputes. The nature of our operations also exposes us to possible litigation claims in the future. Although we make every effort to avoid litigation, these matters are not totally within our control. We will contest these matters vigorously and have made insurance claims where appropriate, but becauseBecause of the uncertain nature of litigation and coverage decisions, we cannot predict the outcome of these matters. These matters could have a material adverse affecteffect on our business, results of operations and financial condition and profitability.condition. Litigation is very costly, and the costs associated with prosecuting and defending litigation matters could have a material adverse effect on our business, results of operations and financial condition and profitability.condition. Although we are unable to estimate precisely the ultimate dollar amount of exposure to loss in connection with litigation matters, we make accruals as warranted. However, the amounts
that we accrue could vary significantly from the amounts we actually pay, due to inherent uncertainties and the inherent shortcomings of the estimation process, the uncertainties involved in litigation and other factors.
SOME OF OUR OPERATIONS PRESENT SIGNIFICANT RISK OF INJURY OR DEATH.
The industrial activities conducted at our facilities present significant risk of serious injury or death to our employees, customers or other visitors to our operations, notwithstanding our safety precautions, including our material compliance with Federal, state and local employee health and safety regulations. Whileregulations, and we have in place policies and procedures to minimize such risks, we may nevertheless be unable to avoid material liabilities for an injuryinjuries or death. Even though wedeaths. We maintain workers’workers' compensation insurance to address the risk of incurring material liabilities for injuryinjuries or death,deaths, but there can be no assurance that the insurance coverage will be adequate or will continue to be available on the terms acceptable to us, or at all, which could result in material liabilities to us for an injuryany injuries or death.
19
HEALTH CARE LEGISLATION COULD RESULT IN SUBSTANTIALLY INCREASED COSTS AND NEGATIVELYADVERSELY AFFECT OUR WORKFORCE.
Recently enacted health care mandates may cause us to evaluate the scope of health benefits offered to our workforce and the method in which they are delivered, and increase our and our employees’employees' costs. If we are not able to offer a competitive level of benefits, itour ability to hire and retain qualified personnel may negatively affect the hiring and retention of qualified personnel.be adversely affected. Higher health care costs may reduce our earnings resultingresult in (i) an inability to reinvest sufficient capital in our operations, (ii) an inability to sustain dividends, (iii) lowered debt ratings and (iv) an increase in the cost of capital, all of which may have a negative effect on the price of our share price.common stock.
ITEM 1B. UNRESOLVED STAFF COMMENTS
None.
ITEM 2. PROPERTIES
Americas Mills Our Texas steel minimill is located on approximately 660 acres of land that we own. Our Texas minimillown, and its facilities include several buildings that occupy approximately 850,000845,000 square feet. Our Alabama steel minimill is located on approximately 70 acres of land, and it includes several buildings that occupy approximately 540,000 square feet. We utilize our facilities at the Texas and Alabama steel minimills for manufacturing, storage, office and other related uses. Our South Carolina steel minimill is located on approximately 110 acres of land, and the buildings occupy approximately 700,000 square feet. Our Arkansas steel minimill is located on approximately 140 acres of land, and the buildings occupy approximately 240,000230,000 square feet. Our Arizona steel micro millminimill is located on approximately 230 acres of land, and the buildings occupy approximately 130,000 square feet. We lease approximately 30 acres of land at the Alabama minimill and all the land at the Arkansas and South Carolina minimills in connection with revenue bond financing or property tax incentives. We may purchase the land at the termination of the leases or earlier for a nominal sum. Howell Metal Company owns approximately 75 acres of land in New Market, Virginia, with buildings occupying approximately 410,000 square feet.
Americas Recycling segment’s Our domestic recycling operating plants occupy approximately 820 acres of land that we own in Alabama, Arkansas, Florida, Georgia, Kansas, Louisiana, Missouri, North Carolina, Oklahoma, South Carolina, Tennessee and Texas. The recycling segment’s other scrap metal processing locations are on approximately 50 acres of leased land.
Americas Fabrication Through our Americas Fabrication segment we conduct steel fabrication in 46 locations, which occupy approximately 640 acres of land, at variousof which we lease approximately 20 acres. Additionally, we conduct our construction services in 23 locations, in Alabama, Arizona, Arkansas, California, Colorado, Florida, Georgia, Idaho, Illinois, Louisiana, Mississippi, Nevada, New Jersey, New Mexico, North Carolina, Ohio, Oklahoma, Pennsylvania, South Carolina, Tennessee, Texas, Utah and Virginia.which occupy approximately 80 acres of land, of which we lease approximately 50 acres. Finally through CMC Impact Metals, our plants occupy approximately 110 acres of land that we own.
International Mill CMCP's steel manufacturing operations are located in Zawiercie in South Central Poland about 40 kilometers from Katowice. CMCZCMCP and its subsidiaries lease approximately 98% of the 2 million square meters of land utilized by thefor its principal operations with a small balancethe remaining portion owned. The land is leased from the State of Poland under contracts with 99 year durations andterms that are considered to create a right of perpetual usufruct. The leases expire beginning in 2089 through 2100. The principal operations are conducted in buildings having an area of approximately 260,000 square meters. The seven major buildings in use have all been constructed on or after 1974. The real estate is also developed with over 130 other buildings including warehouses, administrative offices, workshops, a garage, transformer stations, pumping stations, gas stations, boiler houses, gate houses and contains some structures leased to unrelated parties, CMCZCMCP subsidiaries and affiliated companies. Other much smaller tracts of land are leased or
20
owned in communities nearby communitiesZawiercie including those utilized by six affiliated scrap processing facilities. Our international fabrication operations utilize approximately 136,000 square meters of land, which is either owned or subject to a perpetual usufruct.
International Marketing and Distribution We own two warehouse buildings which our operations in Australia utilize, one of which is located on leased real estate. We lease the other warehouse facilities located in Australia as well as our Australian headquarters, marketing and administration offices. Additionally, this segment operates a recycling facility in Singapore, which is located on approximately two acres of land we lease.
Corporate We lease the office space occupied by our corporate headquarters as well as that occupied by all of our marketing and distribution offices.
The leases on the leased properties described above will expire on various dates and, with the exception of the CMCZCMCP leases described above, generally expire over the next sixten years. Several of the leases have renewal options. We have had little difficulty in the past renewing such leases as they expire.prior to their expiration. We estimate our minimum annual rental obligation for real estate operating leases in effect at August 31, 2010,2013, to be paid during fiscal 2011,2014, to be approximately $24$21.6 million. We also lease a portion of the equipment we use in our plants. We estimate our minimum annual rental obligation for equipment operating leases in effect at August 31, 2010,2013, to be paid during fiscal 2011,2014, to be approximately $17$13.8 million.
ITEM 3. LEGAL PROCEEDINGS
In the ordinary course of conducting our business, we become involved in litigation, administrative proceedings and governmental investigations, including environmental matters.
On September 18, 2008, we were served with a purported class action antitrust lawsuit alleging violations of Section 1 of the Sherman Act, brought by Standard Iron Works of Scranton, Pennsylvania, against nine steel manufacturing companies, including Commercial Metals Company. The lawsuit, filed in the United States District Court for the Northern District of Illinois, alleges that the defendants conspired to fix, raise, maintain and stabilize the price at which steel products were sold in the United States by artificially restricting the supply of such steel products. The lawsuit, which purports to be brought on behalf of a class consisting of all purchasers ofparties who purchased steel products directly from the defendants between January 1, 2005 and September 2008, seeks treble damages and costs, including reasonable attorney fees and pre- and post-judgment interest. Motions for and against class certification have been filed. Oral arguments related to class certification are pending. Discovery on the case remains pending. We believe that the lawsuit is without merit and plan to defend it vigorously.
Since the filing of thisthe direct purchaser lawsuit, additional plaintiffs havea case has been filed in federal court in the Northern District of Illinois on behalf of a purported class action lawsuitsof indirect purchasers in approximately 28 states naming the same defendants and containing allegations substantially identical to those of the Standard Iron Works complaint. That case has in effect been stayed. Another indirect purchaser action was filed in Tennessee state court, again naming the same defendants but contending that the conspiracy continued through 2010. The case has been removed to federal court, and plaintiffs have moved to remand. The motion to remand has not yet been decided, and no motion practice or discovery has taken place. We believe that the lawsuits are without merit and plan to aggressively defend them vigorously. Due to the actions.uncertainty and the information available as of the time of the filing of this report, we cannot reasonably estimate a range of loss relating to these cases.
We have received notices from the EPA or state agencies with similar responsibility that we and numerous other parties are considered PRPs and may be obligated under CERCLA,the Comprehensive Environmental Response, Compensation and Liability Act of 1980 ("CERCLA"), or similar state statute,statutes, to pay for the cost of remedial investigation, feasibility studies and ultimately remediation to correct alleged releases of hazardous substances at ten locations. We may contest our designation as a PRP with regard to certain sites, while at other sites we are participating with other named PRPs in agreements or negotiations that have resulted or that we expect will result in agreements to remediate the sites. The EPA or respective state agency, as applicable, refers to these locations, none of which involve real estate we ever owned or conducted operations upon, asupon: the Sapp Battery Site in Cottondale, Florida, the Interstate Lead Company Site in Leeds, Alabama, the Ross Metals Site in Rossville, Tennessee, the Li Tungsten Site in Glen Cove, New York, the Peak Oil Site in Tampa, Florida, the R&H Oil Site in San Antonio, Texas, the SoGreen/Parramore Site in Tifton, Georgia, the Stoller Site in Jericho, South Carolina, the Jensen Drive site in Houston, Texas, and the Industrial Salvage site in Corpus Christi, Texas. During 2010, we acquired a 70% interest in the real property at Jensen Drive as part of the remediation of that site. We have periodically received information requests from government environmental agencies with regard to other sites that are apparently under consideration for designation as listed sites under CERCLA or similar state statutes. Often we do not receive any further communication with regard to these sites. Wesites, and as of the date of this report, we do not know if any of these inquiries will ultimately result in a demand for payment from us.
The EPA notified us and other alleged PRPs that under Sec. 106 of CERCLA we and the other PRPs could be subject to a maximum fine of $25,000 per day and the imposition of treble damages if we and the other PRPs refuse to clean up the Peak Oil, Sapp Battery, and SoGreen/Parramore and Stoller sitesites as ordered by the EPA. We are presently participating in PRP organizations at these sites which are paying for certain site remediation expenses. We do not believe that the EPA will pursue any fines against us if we continue to participate in the PRP groups or if we have adequate defenses to the EPA’sEPA's imposition of fines against us in these matters.
21
We believe that adequate provision hasprovisions have been made in the financial statements for the potential impact of any loss in connection with the above-described legal proceedings, environmental matters, government proceedings, and disputes that could result in
18
additional litigation, some of which may have a material impact on earnings and cash flows for a particular quarter.litigation. Management believes that the outcome of the suits and proceedings mentioned, and other miscellaneous litigation and proceedings now pending, will not have a material adverse effect on our business, consolidatedresults of operations or financial position or liquidity.condition.
ITEM 4. REMOVEDMINE SAFETY DISCLOSURE
Not applicable.
DIRECTORS, EXECUTIVE OFFICERS AND RESERVEDCORPORATE GOVERNANCE
Information regarding the Company's directors and executive officers is set forth under the caption "Directors, Executive Officers and Corporate Governance" in Part III, Item 10, of this Form 10-K and is incorporated herein by this reference.
PART II
ITEM 5. MARKET FOR REGISTRANT’SREGISTRANT'S COMMON EQUITY, RELATED STOCKHOLDER MATTERS AND ISSUER PURCHASES OF EQUITY SECURITIES
MARKET AND DIVIDEND INFORMATION
The table below summarizes the high and low sales prices reported on the New York Stock Exchange for oura share of CMC common stock and the quarterly cash dividends weper share that CMC paid for the past two fiscal years.
PRICE RANGE
OF COMMON STOCK
| 2010 | ||||||||||||
| FISCAL | ||||||||||||
| QUARTER | HIGH | LOW | CASH DIVIDENDS | |||||||||
1st | $ | 21.29 | $ | 13.30 | 12 cents | |||||||
2nd | 17.52 | 13.16 | 12 cents | |||||||||
3rd | 18.18 | 12.66 | 12 cents | |||||||||
4th | 16.49 | 12.12 | 12 cents | |||||||||
| 2009 | ||||||||||||
| FISCAL | ||||||||||||
| QUARTER | HIGH | LOW | CASH DIVIDENDS | |||||||||
1st | $ | 25.76 | $ | 6.25 | 12 cents | |||||||
2nd | 14.37 | 8.50 | 12 cents | |||||||||
3rd | 17.53 | 8.83 | 12 cents | |||||||||
4th | 18.54 | 13.18 | 12 cents | |||||||||
| 2013 FISCAL QUARTER | HIGH | LOW | CASH DIVIDENDS | |||||||||
| 1st | $ | 15.10 | $ | 12.63 | $ | 0.12 | ||||||
| 2nd | 17.47 | 13.15 | 0.12 | |||||||||
| 3rd | 17.25 | 13.33 | 0.12 | |||||||||
| 4th | 16.25 | 13.43 | 0.12 | |||||||||
| 2012 FISCAL QUARTER | HIGH | LOW | CASH DIVIDENDS | |||||||||
| 1st | $ | 14.50 | $ | 8.64 | $ | 0.12 | ||||||
| 2nd | 16.48 | 12.57 | 0.12 | |||||||||
| 3rd | 15.40 | 11.50 | 0.12 | |||||||||
| 4th | 14.09 | 11.30 | 0.12 | |||||||||
CMC common stock has been listed andis traded on the New York Stock Exchange. From 1959 until the NYSE listing in 1982, our common stock was traded on the American Stock Exchange. The number of shareholders of record of ourCMC common stock at October 22, 2010,23, 2013, was 4,744.4,149.
22
EQUITY COMPENSATION PLANS
Information about our equity compensation plans as of August 31, 2010, that2013 was either approved or not approved by our stockholders is as follows:
| C. | ||||||||||||
| NUMBER OF SECURITIES | ||||||||||||
| A. | REMAINING AVAILABLE FOR FUTURE | |||||||||||
| NUMBER OF SECURITIES | B. | ISSUANCE UNDER EQUITY | ||||||||||
| TO BE ISSUED | WEIGHTED-AVERAGE | COMPENSATION PLANS | ||||||||||
| UPON EXERCISE OF | EXERCISE PRICE OF | (EXCLUDING SECURITIES | ||||||||||
| OUTSTANDING OPTIONS, | OUTSTANDING OPTIONS, | REFLECTED IN COLUMN | ||||||||||
| PLAN CATEGORY | WARRANTS AND RIGHTS | WARRANTS AND RIGHTS | (A)) | |||||||||
| Equity Compensation plans approved by security holders | 3,922,016 | $ | 23.67 | 6,566,043 | ||||||||
| Equity Compensation plans not approved by security holders | — | — | — | |||||||||
| TOTAL | 3,922,016 | $ | 23.67 | 6,566,043 | ||||||||
23
| A. | B. | C. | ||||
| PLAN CATEGORY | NUMBER OF SECURITIES TO BE ISSUED UPON EXERCISE OF OUTSTANDING OPTIONS, WARRANTS AND RIGHTS | WEIGHTED-AVERAGE EXERCISE PRICE OF OUTSTANDING OPTIONS, WARRANTS AND RIGHTS | NUMBER OF SECURITIES REMAINING AVAILABLE FOR FUTURE ISSUANCE UNDER EQUITY COMPENSATION PLANS (EXCLUDING SECURITIES REFLECTED IN COLUMN (A)) | |||
| Equity | ||||||
| Compensation plans approved by security holders | 2,653,430 | $24.07 | 17,781,754 | |||
| Equity | ||||||
| Compensation plans not approved by security holders | — | — | — | |||
| TOTAL | 2,653,430 | 24.07 | 17,781,754 | |||
STOCK PERFORMANCE GRAPH
The following graph compares the cumulative total return of ourCMC common stock during the five year period beginning September 1, 20052008 and ending August 31, 20102013 with the Standard & Poor’sPoor's 500 Composite Stock Price Index also known as the “S"S&P 500”500" and the Standard & Poor’sPoor's Steel Industry Group Index also known as the “S"S&P Steel Group.”" Each index assumes $100 invested at the close of trading August 31, 2005,2008, and reinvestment of dividends.

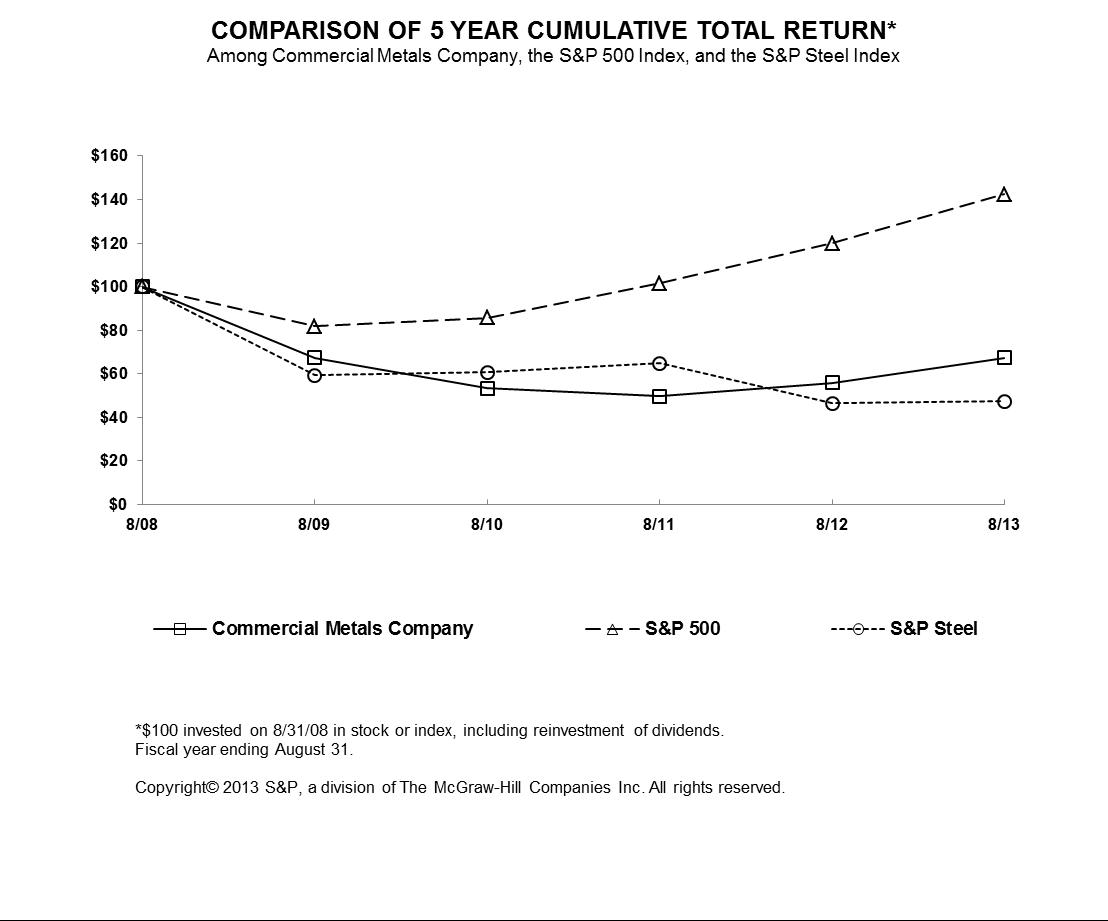
| 8/05 | 8/06 | 8/07 | 8/08 | 8/09 | 8/10 | |||||||||||||||||||||||||
Commercial Metals Company | 100.00 | 145.40 | 196.91 | 179.97 | 121.07 | 96.06 | ||||||||||||||||||||||||
S&P 500 | 100.00 | 108.88 | 125.36 | 111.40 | 91.06 | 95.53 | ||||||||||||||||||||||||
S&P Steel | 100.00 | 171.62 | 237.52 | 239.35 | 142.02 | 145.58 | ||||||||||||||||||||||||
| 8/08 | 8/09 | 8/10 | 8/11 | 8/12 | 8/13 | |||||||||||||
| Commercial Metals Company | 100.00 | 67.27 | 53.38 | 49.67 | 55.91 | 67.47 | ||||||||||||
| S&P 500 | 100.00 | 81.75 | 85.76 | 101.63 | 119.92 | 142.35 | ||||||||||||
| S&P Steel | 100.00 | 59.34 | 60.82 | 64.81 | 46.45 | 47.49 | ||||||||||||
ITEM 6. SELECTED FINANCIAL DATA
The table below sets forth a summary of our selected consolidated financial information for the periods indicated. The per share amounts have been adjusted to reflect any stock splits and stock dividends.
FOR THE YEAR ENDED AUGUST 31,
(DOLLARS IN THOUSANDS EXCEPT RATIO AND PER SHARE AMOUNTS)
| 2010 | 2009 | 2008 | 2007 | 2006 | |||||||||||||||||||
| Net sales * | $ | 6,306,102 | $ | 6,409,376 | $ | 9,896,637 | $ | 7,881,472 | $ | 6,814,463 | |||||||||||||
| Net earnings (loss) attributable to CMC | (205,344 | ) | 20,802 | 231,966 | 355,431 | 356,347 | |||||||||||||||||
| Diluted earnings (loss) per share | (1.81 | ) | 0.18 | 1.97 | 2.92 | 2.89 | |||||||||||||||||
| Total assets | 3,706,153 | 3,687,556 | 4,746,371 | 3,472,663 | 2,898,868 | ||||||||||||||||||
| Stockholders’ equity attributable to CMC | 1,250,736 | 1,529,693 | 1,638,383 | 1,548,567 | 1,220,104 | ||||||||||||||||||
| Long-term debt | 1,197,282 | 1,181,740 | 1,197,533 | 706,817 | 322,086 | ||||||||||||||||||
| Cash dividends per share | 0.48 | 0.48 | 0.45 | 0.33 | 0.17 | ||||||||||||||||||
| Ratio of earnings to fixed charges | ** | 1.20 | 4.78 | 11.16 | 14.80 | ||||||||||||||||||
| 2013 | 2012 | 2011 | 2010 | 2009 | |||||||||||||||
| Net sales* | $ | 6,889,575 | $ | 7,656,375 | $ | 7,666,773 | $ | 6,119,628 | $ | 6,228,343 | |||||||||
| Net earnings (loss) attributable to CMC* | 74,953 | 210,543 | 11,326 | (101,260 | ) | 25,608 | |||||||||||||
| Diluted earnings (loss) per share attributable to CMC* | $ | 0.64 | $ | 1.80 | $ | 0.09 | $ | (0.89 | ) | $ | 0.22 | ||||||||
| Total assets | 3,494,801 | 3,441,246 | 3,683,131 | 3,706,153 | 3,687,556 | ||||||||||||||
| Stockholders’ equity attributable to CMC | 1,269,999 | 1,246,368 | 1,160,425 | 1,250,736 | 1,529,693 | ||||||||||||||
| Long-term debt | 1,278,814 | 1,157,073 | 1,167,497 | 1,197,282 | 1,181,740 | ||||||||||||||
| Cash dividends per share | 0.48 | 0.48 | 0.48 | 0.48 | 0.48 | ||||||||||||||
| Ratio of earnings to fixed charges | 2.56 | 2.94 | 1.32 | ** | 1.13 | ||||||||||||||
__________________________
* Excludes divisions classified as discontinued operations.
** Earnings for the year ended August 31, 2010 were inadequate to cover fixed charges due to asset impairment charges and losses from discontinued operations. The coverage deficiency was approximately $167 million for the year ended August 31, 2010.
ITEM 7. MANAGEMENT’SMANAGEMENT'S DISCUSSION AND ANALYSIS OF FINANCIAL CONDITION AND RESULTS OF OPERATIONS
This Annual Report on Form 10-K contains “forward-looking statements”"forward-looking statements" within the meaning of Section 27A of the Securities Act of 1933, as amended, Section 21E of the Securities Exchange Act of 1934, as amended (the “Exchange Act”), and the Private Securities Litigation Reform Act of 1995,federal securities laws, with respect to ourthe Company's financial condition, results of operations, cash flows and business, and ourits expectations or beliefs concerning future events, including net earnings (loss), economic conditions, credit availability, product pricing and demand, currency valuation, production rates, energy expense, interest rates, inventory levels, acquisitions, construction and operation of new facilities and general market conditions.events. These forward-looking statements can generally be identified by phrases such as we or our management “expects,” “anticipates,” “believes,” “estimates,” “intends,” “plans"expects," "anticipates," "believes," "estimates," "intends," "plans to,” “ought,” “could,” “will,” “should,” “likely,” “appears,” “projects,” “forecasts,” “outlook”" "ought," "could," "will," "should," "likely," "appears," "projects," "forecasts," "outlook" or other similar words or phrases. There are inherent risks and uncertainties in any forward-looking statements. VariancesWe caution readers not to place undue reliance on any forward-looking statements.
The Company's forward-looking statements are based on its expectations and beliefs as of the time this report is filed with the Securities and Exchange Commission or, with respect to any document incorporated by reference, as of the time such document was prepared. Although the Company believes that its expectations are reasonable, it can give no assurance that these expectations will occurprove to have been correct, and some could be materially different from our current opinion. Developments that could impact our expectationsactual results may vary materially. These factors include the following:
25
absence of global economic recovery or possible recession relapse and the pace of overall global economic activity;
solvency of financial institutions and their ability or willingness to lend;
success or failure of governmental efforts to stimulate the economy including restoring credit availability and confidence in anya recovery;
continued sovereign debt problems in the Euro-zone;
construction activity or lack thereof;
availability and pricing of raw materials over which we exert little influence, including scrap metal, energy, insurance and supply prices;
increased capacity and product availability from competing steel minimills and other steel suppliers including import quantities and pricing;
decisions by governments affecting the level of steel imports;
22
passage of new, or interpretation of existing, environmental laws and regulations;
customers' inability to obtain credit and non-compliance with contracts;
financial covenants and restrictions on the operation of our forward-looking statements. Other unknownbusiness contained in agreements governing our debt;
currency fluctuations;
global factors including political and military uncertainties;
difficulties or unpredictable factors also could harmdelays in the execution of construction contracts, resulting in cost overruns or contract disputes;
ability to retain key executives;
execution of cost reduction strategies;
industry consolidation or changes in production capacity or utilization;
ability to make necessary capital expenditures;
unexpected equipment failures;
competition from other materials;
losses or limited potential gains due to hedging transactions;
litigation claims and settlements, court decisions and regulatory rulings;
risk of injury or death to employees, customers or other visitors to our results. Consequently, we cannot assure you that the actual results or developments we anticipate will be realized or, even if substantially realized, that they will have the expected consequencesoperations; and
increased costs related to or effects on, us. Given these uncertainties, we caution prospective investors not to place undue reliance on such forward-looking statements. We undertake no obligation to publicly update or revise any forward-looking statements, whether as a result of new information, future events or otherwise.health care reform legislation.
This Management’sManagement's Discussion and Analysis of Financial Condition and Results of Operations should be read in conjunction with ourthe consolidated financial statements and the accompanying notes contained in this Annual Report on Form 10-K.
OVERVIEW
Our business is organized into the following five segments: Americas Recycling, Americas Mills, Americas Fabrication, International MillsMill and International Marketing and Distribution.
AMERICAS RECYCLING
Our domestic and international distribution business activities consist only of physical transactions and not market speculation.
Americas Recycling Operations
26
AMERICAS MILLS
Our Americas Mills Operationssegment includes the Company's five steel mills, commonly referred to as "minimills," that produce one or more of reinforcing bar, angles, flats, rounds, small beams, fence-post sections and other shapes; two scrap metal shredders and nine processing facilities that directly support the steel minimills; and a railroad salvage company.
During the fourth quarter of 2013, we decided to sell our wholly-owned copper tube manufacturing operation, Howell Metal Company ("Howell"). We conduct our domestic millsdetermined that the decision to sell this business met the definition of a discontinued operation. As a result, we have included Howell in discontinued operations through a network of:for all periods presented. Howell was previously an operating segment included in the Americas Mills reporting segment. On October 17, 2013, we sold all of the stock of Howell for $58.5 million, subject to customary purchase price adjustments.
AMERICAS FABRICATION
The Americas Fabrication Operationssegment consists of the Company's steel plants that bend, weld, cut and fabricate steel, primarily reinforcing bar; warehouses that sell or rent products for the installation of concrete; plants that produce steel fence posts; and plants that heat-treat steel to strengthen and provide flexibility.
Our International Mills Operations
INTERNATIONAL MARKETING AND DISTRIBUTION
Our International Marketing and Distribution Operations
segment includes international operations for the sales, distribution and processing of steel products, ferrous and nonferrous metals and other industrial products. Additionally, this segment includes the Company's U.S.-based marketing and distribution divisions, CMC Cometals and CMC Cometals Steel, and a recycling facility in Singapore. We buy and sell primary and secondary metals, fabricated metals, semi-finished, long and flat steel products and other industrial products. We market and distribute steel, copper and aluminum coil, sheet and tubing, ores, metal concentrates, industrial minerals, ferroalloys and chemicalsthese products through our global network of marketing and distribution offices, processing facilities and joint ventures domestically and internationally.ventures. Our customers use these products in a variety of industries.
Results of operationsThe following are important accounting policies, estimates and assumptions that you should understand as you review our financial statements. We apply these accounting policies and make these estimates and assumptions to prepare financial statements under accounting principles generally accepted in the United States (“GAAP”). Our usediscussion of these accounting policies, estimates and assumptions affects our results of operations and our reported amounts of assets and liabilities. Where we have used estimates or assumptions, actual results could differ significantly from our estimates.
27
Consolidated Results of Operations
| Year ended August 31, | ||||||||||||
| (in millions except share data) | 2010 | 2009 | 2008 | |||||||||
| Net sales* | $ | 6,306 | $ | 6,409 | $ | 9,897 | ||||||
| Net earnings (loss) from continuing operations attributable to CMC | (166.7 | ) | 1.7 | 244.6 | ||||||||
| Per diluted share | (1.47 | ) | 0.02 | 2.08 | ||||||||
| Adjusted EBITDA | 14.9 | 275.2 | 531.4 | |||||||||
| International net sales | 3,091 | 2,731 | 4,591 | |||||||||
| As % of total sales | 49 | % | 43 | % | 46 | % | ||||||
| LIFO (income) expense** effect on net earnings attributable to CMC | (7.4 | ) | (208.4 | ) | 209.1 | |||||||
| Per diluted share | (0.07 | ) | (1.83 | ) | 1.78 | |||||||
28
| Year Ended August 31, | ||||||||||||
| (in thousands except per share data) | 2013 | 2012 | 2011 | |||||||||
| Net sales* | $ | 6,889,575 | $ | 7,656,375 | $ | 7,666,773 | ||||||
| Earnings from continuing operations | 74,957 | 210,549 | 11,539 | |||||||||
| Per diluted share | $ | 0.64 | $ | 1.80 | $ | 0.09 | ||||||
| Adjusted EBITDA* | 353,542 | 368,710 | 271,199 | |||||||||
| International net sales* | 2,782,344 | 3,152,589 | 3,499,813 | |||||||||
| As % of total sales | 40 | % | 41 | % | 46 | % | ||||||
| LIFO income (expense)** effect on net earnings (loss) attributable to CMC* | 34,393 | 27,149 | (46,712 | ) | ||||||||
| Per diluted share | 0.29 | 0.23 | (0.40 | ) | ||||||||
_________________________
* Excludes divisions classified as discontinued operations.
** Last-in, first-out inventory valuation method.
In the table above, we have included a financial statement measure that was not derived in accordance with GAAP.United States generally accepted accounting principles ("GAAP"). We use adjusted EBITDA (earnings before interest expense, income taxes, depreciation, amortization, impairment charges and impairment charges)net earnings attributable to noncontrolling interests) as a non-GAAP performancefinancial measure. In calculating adjusted EBITDA, we exclude our largest recurring non-cash charge, depreciation and amortization, andas well as impairment charges. Adjusted EBITDA provides a core operational performance measurement that compares results without the need to adjust for Federal,federal, state and local taxes which have considerable variation between domestic jurisdictions. Tax regulations in international operations add additional complexity. Also, weWe also exclude interest cost in our calculation of adjusted EBITDA. The results are, therefore, without consideration of financing alternatives of capital employed. We use adjusted EBITDA as one guideline to assess our unleveraged performance return on our investments.investments, our ability to pay our current debt obligations as they mature and as a tool to calculate possible future levels of leverage capacity. Adjusted EBITDA is also the target benchmark for our annual and long-term cash incentive performance planplans for management and part of a debt compliance test forin certain of our revolving credit agreement and our accounts receivable securitization program. debt agreements. Adjusted EBITDA may be inconsistent with similar measures presented by other companies.
24
Reconciliations fromof net earnings (loss) from continuing operations attributable to CMC to adjusted EDITDAEBITDA are provided below for the years ended August 31:below:
| (in millions) | 2010 | 2009 | 2008 | |||||||||
| Net earnings (loss) from continuing operations attributable to CMC | $ | (166.7 | ) | $ | 1.7 | $ | 244.6 | |||||
| Interest expense | 75.5 | 77.0 | 58.3 | |||||||||
| Income taxes (benefit) | (38.1 | ) | 0.7 | 112.3 | ||||||||
| Depreciation, amortization and impairment charges | 168.4 | 151.4 | 124.4 | |||||||||
| Adjusted EBITDA from continuing operations | $ | 39.1 | $ | 230.8 | 539.6 | |||||||
| Adjusted EBITDA from discontinued operations | (24.2 | ) | 44.4 | (8.2 | ) | |||||||
| Adjusted EBITDA | $ | 14.9 | $ | 275.2 | $ | 531.4 | ||||||
| Year Ended August 31, | ||||||||||||
| (in thousands) | 2013 | 2012 | 2011 | |||||||||
| Earnings from continuing operations | $ | 74,957 | $ | 210,549 | $ | 11,539 | ||||||
| Less net earnings attributable to noncontrolling interests | 4 | 6 | 213 | |||||||||
| Interest expense | 69,608 | 69,487 | 69,814 | |||||||||
| Income taxes (benefit) | 57,979 | (45,762 | ) | 14,592 | ||||||||
| Depreciation, amortization and impairment charges | 151,002 | 134,442 | 175,467 | |||||||||
| Adjusted EBITDA | $ | 353,542 | $ | 368,710 | $ | 271,199 | ||||||
Our adjusted EBITDA does not include interest expense, income taxes, depreciation, amortization and impairment charges.charges or net earnings attributable to noncontrolling interests. Because we have borrowed money in order to finance our operations, interest expense is a necessary element of our costs and our ability to generate revenues. Because we use capital assets, depreciation amortization and impairment chargesamortization are also necessary elements of our costs. Also,Impairment charges, when necessary, accelerate the write-off of fixed assets that otherwise would have been accomplished by periodic depreciation charges. Additionally, the payment of income taxes is a necessary element of our operations. Therefore, any measures that exclude these elements have material limitations. To compensate for these limitations, we believe that it is appropriate to consider both net earnings (loss) determined underin accordance with GAAP, as well as adjusted EBITDA, to evaluate our performance. Also,Further, we separately analyze any significant fluctuations in interest expense, depreciation, amortization, impairment charges and income taxes.
The following eventsare the significant factors that impacted our financial performance during 2013 compared with 2012:
Our Americas Recycling segment was negatively impacted by declining ferrous and performances hadnon-ferrous volumes and margins, when compared to the prior fiscal year.
Our Americas Fabrication segment showed the most progress when compared to the prior year, recording adjusted operating profit of $28.0 million, compared with an adjusted operating loss of $15.7 million in fiscal 2012. In our rebar and structural fabrication businesses, selling prices increased while raw material input prices for steel declined, enabling margin expansion for this segment.
Our International Mill segment recorded a significant financial impact during 2010 asdecline in adjusted operating profit in fiscal 2013 when compared to 2009 or are expectedthe prior year. The decline in profitability was primarily a result of 17% lower shipments when compared to be significantfiscal 2012, as business conditions in the Eurozone remain challenged.
We recorded impairments related to long-lived assets of $17.3 million. Of this amount, approximately $12.7 million related to our Australian operations, as market conditions in Australia continued to show weakness in general and specifically in the steel construction market.
Our year-to-date effective tax rate was negatively impacted by the recognition of a full valuation allowance on the deferred tax assets related to our Australian operations as well as lower earnings by our foreign subsidiaries.
Pre-tax LIFO income was $52.9 million, $11.1 million more than LIFO income of $41.8 million in 2012.
During the first quarter of fiscal 2013, we completed the sale of our 11% ownership interest in Trinecke Zelezarny, a.s. ("Trinecke"), a Czech Republic joint-stock company, for $29.0 million resulting in a pre-tax gain of $26.1 million. This gain was recorded in our future operations:International Marketing and Distribution segment.
29
Unless otherwise indicated, all dollar amounts below are calculated before income taxes. Financial results for our reportable segments are consistent with the basis and manner in which we internally disaggregate financial information for the purpose of making operating decisions. See Note 15,21, Business Segments, to the consolidated financial statements.statements included in this report.
We use adjusted operating profit (loss) to compare and evaluatemeasure the financial performance of our segments. Adjusted operating profit (loss) is the sum of our earnings (loss) before income taxes and financing costs.
25
The following table shows net sales and adjusted operating profit (loss) by business segment:
| Year ended August 31, | ||||||||||||
| (in millions) | 2010 | 2009 | 2008 | |||||||||
| Net sales: | ||||||||||||
| Americas Recycling | $ | 1,424 | $ | 785 | $ | 2,189 | ||||||
| Americas Mills | 1,395 | 1,253 | 1,966 | |||||||||
| Americas Fabrication | 1,140 | 1,596 | 1,741 | |||||||||
| International Mills | 764 | 754 | 1,234 | |||||||||
| International Marketing and Distribution | 2,464 | 2,827 | 3,975 | |||||||||
| Corporate | 4 | (11 | ) | (2 | ) | |||||||
| Eliminations | (885 | ) | (795 | ) | (1,206 | ) | ||||||
| Adjusted operating profit (loss): | ||||||||||||
| Americas Recycling | 15.2 | (89.6 | ) | 145.8 | ||||||||
| Americas Mills | 33.3 | 263.4 | 207.8 | |||||||||
| Americas Fabrication | (107.8 | ) | 145.7 | (8.6 | ) | |||||||
| International Mills | (73.5 | ) | (96.0 | ) | 99.7 | |||||||
| International Marketing and Distribution | 74.7 | (53.1 | ) | 82.1 | ||||||||
| Corporate | (70.7 | ) | (94.8 | ) | (99.5 | ) | ||||||
| Eliminations | 3.6 | 8.2 | (0.5 | ) | ||||||||
| Discontinued Operations | (59.8 | ) | 32.6 | (18.9 | ) | |||||||
| Year Ended August 31, | ||||||||||||
| (in thousands) | 2013 | 2012 | 2011 | |||||||||
| Net sales: | ||||||||||||
| Americas Recycling | $ | 1,391,749 | $ | 1,606,161 | $ | 1,829,537 | ||||||
| Americas Mills | 1,819,520 | 1,983,721 | 1,839,718 | |||||||||
| Americas Fabrication | 1,442,691 | 1,381,638 | 1,225,722 | |||||||||
| International Mill | 826,044 | 1,033,357 | 1,046,233 | |||||||||
| International Marketing and Distribution | 2,355,572 | 2,727,319 | 2,650,899 | |||||||||
| Corporate | 11,832 | 8,033 | 6,882 | |||||||||
| Eliminations | (957,833 | ) | (1,083,854 | ) | (932,218 | ) | ||||||
| Net sales | $ | 6,889,575 | $7,656,375 | $7,666,773 | ||||||||
| Adjusted operating profit (loss): | ||||||||||||
| Americas Recycling | $ | 3,170 | $ | 39,446 | $ | 43,059 | ||||||
| Americas Mills | 204,333 | 235,918 | 149,213 | |||||||||
| Americas Fabrication | 28,033 | (15,697 | ) | (129,141 | ) | |||||||
| International Mill | 890 | 23,044 | 47,594 | |||||||||
| International Marketing and Distribution | 35,617 | 47,287 | 76,337 | |||||||||
| Corporate | (66,453 | ) | (83,035 | ) | (84,729 | ) | ||||||
| Eliminations | 848 | (6,251 | ) | (1,275 | ) | |||||||
| Adjusted operating profit | $ | 206,438 | $ | 240,712 | $ | 101,058 | ||||||
LIFO Impact on Adjusted Operating Profit (Loss)LIFO is an inventory costing method that assumes the most recent inventory purchases or goods manufactured are sold first. This results inTherefore, current sales prices are offset against current inventory costs. In periods of rising prices, itthe LIFO inventory costing method has the effect of eliminating inflationary profits from operations. In periods of declining prices, itthis method has the effect of eliminating deflationary losses from operations. In either case the goal is to reflect economic profit.profit of current market conditions. The table below reflects LIFO income or (expense) representing decreases or (increases) in the LIFO inventory reserve.
The International MillsMill segment exclusively uses the FIFO inventory valuation method and thus is not included in this table as it uses FIFO valuation exclusively for its inventory:table:
| Three Months Ended | Twelve Months Ended | |||||||||||||||
| August 31, | August 31, | |||||||||||||||
| (in thousands) | 2010 | 2009 | 2010 | 2009 | ||||||||||||
| Americas Recycling | $ | 3,142 | $ | (8,253 | ) | $ | (11,072 | ) | $ | 27,049 | ||||||
| Americas Mills | 10,665 | (8,713 | ) | (27,327 | ) | 135,541 | ||||||||||
| Americas Fabrication | 6,553 | 21,833 | (9,968 | ) | 86,859 | |||||||||||
| International Marketing and Distribution | 6,556 | 24,176 | 40,372 | 6,065 | ||||||||||||
| Discontinued Operations | 9,030 | 8,476 | 19,356 | 65,081 | ||||||||||||
| Consolidated pre-tax LIFO income (expense) | $ | 35,946 | $ | 37,519 | $ | 11,361 | $ | 320,595 | ||||||||
30
| Year Ended August 31, | ||||||||||||
| (in thousands) | 2013 | 2012 | 2011 | |||||||||
| Americas Recycling | $ | 7,423 | $ | 7,007 | $ | (12,980 | ) | |||||
| Americas Mills | 7,166 | 16,629 | (48,023 | ) | ||||||||
| Americas Fabrication | 12,177 | 15,248 | (6,644 | ) | ||||||||
| International Marketing and Distribution | 26,146 | 2,884 | (4,217 | ) | ||||||||
| Pre-tax LIFO income (expense) | $ | 52,912 | $ | 41,768 | $ | (71,864 | ) | |||||
Fiscal Year 2013 Compared to 2009Fiscal Year 2012
Americas RecyclingDuring 2010, scrap prices, metal margins This segment recorded an adjusted operating profit of $3.2 million for fiscal 2013, compared with adjusted operating profit of $39.4 million for 2012. The decline in profitability in 2013 was due to a decrease in both ferrous and shipments increased asnonferrous volumes and average selling prices. Additionally, in 2013 this segment began recovering from the economic recession that significantly impacted operating results in 2009. Adjusted operating profit for 2010 was driven by improved margins from both prices and volumes and cost containment efforts. Metal margins were negatively impacted by LIFO expensenonferrous margin compression of $11.1 million in 2010 asapproximately 15% when compared to LIFO income of $27.0 million in 2009. Ferrous pricing was stronger as domestic mill operating rates increased and general manufacturing output was higher. Nonferrous pricing was driven by strong export demand, primarily from Asia.2012. We exported 10%6% of our ferrous scrap tonnage and 40%27% of our nonferrous scrap tonnage during the year.2013.
26
The following table reflects our Americas Recycling segment’ssegment's average selling prices per ton and tons shipped (in thousands) for the yearyears ended August 31:
| Increase | ||||||||||||||||
| 2010 | 2009 | Amount | % | |||||||||||||
| Average ferrous selling price | $ | 264 | $ | 181 | $ | 83 | 46 | % | ||||||||
| Average nonferrous selling price | $ | 2,634 | $ | 1,824 | $ | 810 | 44 | % | ||||||||
| Ferrous tons shipped | 2,289 | 1,817 | 472 | 26 | % | |||||||||||
| Nonferrous tons shipped | 239 | 203 | 36 | 18 | % | |||||||||||
| Total volume processed and shipped | 2,535 | 2,033 | 502 | 25 | % | |||||||||||
| Increase (Decrease) | |||||||||||||||
| 2013 | 2012 | Amount | % | ||||||||||||
| Average ferrous selling price | $ | 327 | $ | 345 | $ | (18 | ) | (5 | )% | ||||||
| Average nonferrous selling price | $ | 2,729 | $ | 2,823 | $ | (94 | ) | (3 | )% | ||||||
| Ferrous tons shipped | 2,078 | 2,196 | (118 | ) | (5 | )% | |||||||||
| Nonferrous tons shipped | 234 | 243 | (9 | ) | (4 | )% | |||||||||
Americas MillsWe include our five domestic steel millsminimills and our copper tube minimillthe scrap locations which directly support the steel minimills in our Americas Mills segment.
This segment recorded an adjusted operating profit of $204.3 millionfor our five domestic steel mills was $29.82013, compared with adjusted operating profit of $235.9 million for 2010 as compared2012. The decline in profitability was partially due to $239.6 million for 2009. Adjusted operating profit primarily declined from ferrous margin compression as scrap prices increased at a greater rate than average selling prices and start-up costs at our new milldecrease in Arizona. Additionally, we recorded LIFO expense of $19.2 million in 2010 as compared topre-tax LIFO income of $121.0$9.5 million from 2012 to 2013. Additionally, both volumes and selling prices within this segment were 5% lower in 2009. Our mills ran at 63% utilization during 2010 as2013 when compared to 60% during 2009.2012. Rebar accounted for 52%57% of tonnage shipped, a decrease from 58% in 2009. Higher production rates as well as price increases in some alloysan increase over the prior year. Lower electrical and natural gasalloy rates resulted in an overall increasedecrease of $9.4$12.2 million in electrode, alloys and energy costs. Shipments included 242 thousand tons of billets in 2013 as compared to 410 thousand tons of billets in 2012.
| Increase (Decrease) | ||||||||||||||||
| 2010 | 2009 | Amount | % | |||||||||||||
| Average mill selling price (finished goods) | $ | 618 | $ | 662 | $ | (44 | ) | (7 | %) | |||||||
| Average mill selling price (total sales) | 584 | 642 | (58 | ) | (9 | %) | ||||||||||
| Average cost of ferrous scrap consumed | 292 | 254 | 38 | 15 | % | |||||||||||
| Average FIFO metal margin | 292 | 388 | (96 | ) | (25 | %) | ||||||||||
| Average ferrous scrap purchase price | 259 | 195 | 64 | 33 | % | |||||||||||
The table below reflects our domestic steel mills’minimills' operating statistics (short tons in(in thousands) and average prices per short ton for the yearyears ended August 31:
| Increase | ||||||||||||||||
| 2010 | 2009 | Amount | % | |||||||||||||
| Tons melted | 2,077 | 1,599 | 478 | 30 | % | |||||||||||
| Tons rolled | 1,734 | 1,478 | 256 | 17 | % | |||||||||||
| Tons shipped | 2,156 | 1,736 | 420 | 24 | % | |||||||||||
| Increase (Decrease) | |||||||||||||||
| 2013 | 2012 | Amount | % | ||||||||||||
| Tons melted | 2,407 | 2,568 | (161 | ) | (6 | )% | |||||||||
| Tons rolled | 2,295 | 2,206 | 89 | 4 | % | ||||||||||
| Tons shipped | 2,561 | 2,682 | (121 | ) | (5 | )% | |||||||||
| Average mill selling price (finished goods) | $ | 683 | $ | 730 | $ | (47 | ) | (6 | )% | ||||||
| Average mill selling price (total sales) | 669 | 706 | (37 | ) | (5 | )% | |||||||||
| Average cost of ferrous scrap consumed | 343 | 379 | (36 | ) | (9 | )% | |||||||||
| Average metal margin | 326 | 327 | (1 | ) | — | % | |||||||||
| Average ferrous scrap purchase price | 299 | 339 | (40 | ) | (12 | )% | |||||||||
Americas Fabrication This segment recorded an adjusted operating profit decreased $20.3of $28.0 million to $3.5 million during 2010 as compared to 2009 primarily due to an increase in LIFO expense for 2010 of $22.7 million.
| Decrease | ||||||||||||||||
| (pounds in millions) | 2010 | 2009 | Amount | % | ||||||||||||
| Pounds shipped | 42.6 | 48.2 | (5.6 | ) | (12 | %) | ||||||||||
| Pounds produced | 40.9 | 45.5 | (4.6 | ) | (10 | %) | ||||||||||
31
The tables below showsshow our average fabrication selling prices per short ton and total fabrication plant shipments for the year ended August 31:
| Decrease | ||||||||||||||||
| Average selling price* | 2010 | 2009 | Amount | % | ||||||||||||
| Rebar | $ | 720 | $ | 980 | $ | (260 | ) | (27 | %) | |||||||
| Structural | 1,835 | 3,037 | (1,202 | ) | (40 | %) | ||||||||||
| Post | 881 | 956 | (75 | ) | (8 | %) | ||||||||||
| Increase (Decrease) | |||||||||||||||||||||||||||||||
| Tons shipped (in thousands) | 2010 | 2009 | Amount | % | |||||||||||||||||||||||||||
| Increase (Decrease) | |||||||||||||||||||||||||||||||
| Average selling price (excluding stock and buyout sales) | 2013 | 2012 | Amount | % | |||||||||||||||||||||||||||
| Rebar | 830 | 1,010 | (180 | ) | (18 | %) | $ | 901 | $ | 864 | $ | 37 | 4 | % | |||||||||||||||||
| Structural | 54 | 70 | (16 | ) | (23 | %) | 2,580 | 2,342 | 238 | 10 | % | ||||||||||||||||||||
| Post | 95 | 69 | 26 | 38 | % | 914 | 949 | (35 | ) | (4 | )% | ||||||||||||||||||||
| Increase (Decrease) | ||||||||||||
| Tons shipped (in thousands) | 2013 | 2012 | Amount | % | ||||||||
| Rebar | 902 | 911 | (9 | ) | (1 | )% | ||||||
| Structural | 53 | 60 | (7 | ) | (12 | )% | ||||||
| Post | 99 | 90 | 9 | 10 | % | |||||||
27
International MillsCMC Zawiercie (“CMCZ”) hadMill This segment recorded an adjusted operating lossprofit of $31.6$0.9 million during 2010 as for 2013, compared towith an adjusted operating profit of $23.0 million in 2012. Volumes declined 17%, or approximately 266 thousand tons, primarily related to our merchant and wire rod products. International Mill selling prices also declined $12 per ton to $589 per ton during 2013. Included in the 2012 results was a loss of $58.1$3.8 million during 2009. During 2010, this segment continued on the trendsale of strong volumes combined with compressed metal margins. Metal margina rebar fabrication shop in Rosslau, Germany. The lack of meaningful market improvements across Europe continued to be compressed as ferrous scrap prices were driven by global demand while average selling prices increased slightly as the local market remained intensely competitive.challenge this segment. Shipments in 2013included 29775 thousand tons of billets compared to 241205 thousand tons of billets in the prior year. During 2010, we hot commissioned our new flexible rolling mill which, when combined with our existing long products, wire rod mills and rod block, will enable us to upgrade, expand and tailor our product offerings.2012.
The table below reflects CMCZ’sour International Mill's operating statistics (in thousands) and average prices per short ton:
| Increase (Decrease) | ||||||||||||||||
| 2010 | 2009 | Amount | % | |||||||||||||
| Tons melted | 1,468 | 1,269 | 199 | 16 | % | |||||||||||
| Tons rolled | 1,107 | 997 | 110 | 11 | % | |||||||||||
| Tons shipped | 1,387 | 1,258 | 129 | 10 | % | |||||||||||
| Average mill selling price (total sales) | 1,382 | PLN | 1,351 | PLN | 31 | PLN | 2 | % | ||||||||
| Averaged ferrous scrap production cost | 880 | PLN | 785 | PLN | 95 | PLN | 12 | % | ||||||||
| Average metal margin | 502 | PLN | 566 | PLN | (64 | ) PLN | (11 | %) | ||||||||
| Average ferrous scrap purchase price | 730 | PLN | 613 | PLN | 117 | PLN | 19 | % | ||||||||
| Average mill selling price (total sales) | $ | 461 | $ | 457 | $ | 4 | 1 | % | ||||||||
| Average ferrous scrap production cost | $ | 295 | $ | 255 | $ | 40 | 16 | % | ||||||||
| Average metal margin | $ | 166 | $ | 202 | $ | (36 | ) | (18 | %) | |||||||
| Average ferrous scrap purchase price | $ | 244 | $ | 202 | $ | 42 | 21 | % | ||||||||
| Increase (Decrease) | |||||||||||||||
| 2013 | 2012 | Amount | % | ||||||||||||
| Tons melted | 1,386 | 1,638 | (252 | ) | (15 | )% | |||||||||
| Tons rolled | 1,244 | 1,395 | (151 | ) | (11 | )% | |||||||||
| Tons shipped | 1,318 | 1,584 | (266 | ) | (17 | )% | |||||||||
| Average mill selling price (total sales) | $ | 589 | $ | 601 | $ | (12 | ) | (2 | )% | ||||||
| Average cost of ferrous scrap consumed | 360 | 385 | (25 | ) | (6 | )% | |||||||||
| Average metal margin | 229 | 216 | 13 | 6 | % | ||||||||||
| Average ferrous scrap purchase price | 289 | 315 | (26 | ) | (8 | )% | |||||||||
32
During the global recession, primarily Asia and several markets in Europe. Additionally, improved pricing minimizedfirst quarter of fiscal 2013, we completed the need for contract and inventory loss charges during 2010. Eachsale of our major geographic marketing operations were profitable11% ownership interest in Trinecke Zelezarny, a.s. ("Trinecke"), a Czech Republic joint-stock company, for 2010.$29.0 million resulting in a pre-tax gain of $26.1 million.
CorporateOur corporate expenses decreased $24.1by $16.6 million in 20102013 to $70.7$66.5 million primarily due toas a result of our continued cost containment initiative and fewer costs associated withinitiatives when compared to the global installation of SAP software.prior year.
CONTINUING OPERATIONS DATA
Consolidated DataThe LIFO method of inventory valuation increased our net lossearnings from continuing operations by $5.2$34.4 million ($0.05 per diluted share) for 20102013, compared with an increase in our net earnings of $27.1 million for 2012.
Selling, General and Administrative ("SG&A") Expenses Consolidated SG&A expenses decreased $13.1 million, or 3%, for 2013 as compared to increasing2012. The costs were down as a result of our net earningscost containment initiatives.
Interest Expense Our interest expense increased by $166.1$0.1 million ($1.46 per diluted share) for 2009. Our overall selling, general and administrative (“SG&A”) expenses decreased by $94.0 to $69.6 million or 15%, for 2010 during 2013 as compared to 2009. SG&A expenses primarily declined from our cost containment initiative, reductions2012 due to an increase in bad debt expense and fewer costs incurred with the global installation of SAP software.
Income TaxesOur effective tax rate from continuing operations for the year ended August 31, 20102013 was 18.6%43.6% as compared to 38.6%(27.8)% in 2009.2012. The increase in the effective tax rate to 43.6% for the year ended August 31, 2013 over the statutory tax rate of 35% is due to the mix and amount of pre-tax income in the jurisdictions in which we operate and the recognition of valuation allowances on deferred tax assets in various jurisdictions that are not more likely than not to be realized. Our effective tax raterates can be impacted by state and local taxes as well as by earnings or losses from foreign jurisdictions. State and local taxes are generally consistent while the composition of domestic and foreign earnings can create larger fluctuations in the rate.
During the year ended August 31, 2012, the Company recognized a tax loss in the amount of $291.0 million related to its investments in its Croatian subsidiary. As a result, a tax benefit of $102.1 million was recorded from these losses in continuing operations for 2010 varies
28
the year ended August 31, 2012. The Company reported and disclosed the investment loss on its U.S. tax return as ordinary worthless stock and bad debt deductions. This tax benefit is the primary reason for the variance from ourthe statutory rate due to lower tax rate jurisdictions incurring losses alongof 35%.
DISCONTINUED OPERATIONS DATA
Adjusted operating profit from discontinued operations was $3.7 million in 2013, compared with an adjusted operating loss of $10.7 million and $138.2 million in 2012 and 2011, respectively.
During the recordingfourth quarter of valuation allowances against2013, we decided to sell Howell, our wholly-owned copper tube manufacturing operation. We determined that the deferred tax assetdecision to sell this business met the definition of a discontinued operation. As result, we have included Howell in discontinued operations for all periods presented. Howell was previously an operating segment included in the Americas Mills reporting segment. On October 17, 2013, we sold all of the Company’s Croatianstock of Howell for $58.5 million, subject to customary purchase price adjustments.
During 2012, we announced our decision to exit CMC Sisak, d.o.o. ("CMCS") by closure of the facility and German subsidiaries duesale of the assets. We determined that the decision to exit this business met the definition of a discontinued operation and has been presented as such for all periods presented. The results for 2011 include approximately $110.6 million of impairment and other charges incurred at CMCS. The results for 2012 consist of severance cost of $18.0 million associated with closing the facility and a pre-tax gain of $13.8 million for the sale of all of the shares of the CMCS operation, excluding $3.9 million in assets which were sold in the first quarter of 2013 with no impact to the uncertaintyconsolidated statements of their realization.
operations. CMCS' operations were previously included as part of the International Mill segment. See Note 10, Businesses Held for Sale, Discontinued OperationsAdjusted operating results and Dispositions.
OUTLOOK
We are encouraged by our ability to post another positive earnings quarter and strong cash flows even after factoring in restructuring charges recorded in our fiscal 2013 fourth quarter. From a U.S. perspective, we are further encouraged by the strength of the Architecture Billings Index (ABI), posting a 53.8 for our divisions classified as discontinued operations decreasedAugust, the highest mark since February. In addition, the ABI has been above 50 for 12 of the last 13 months which historically has been a good leading indicator of improved non-residential construction. Our International Mill segment should see an improvement in margins in light of the newly-passed legislation to a loss of $59.8 million from adjusted operating profit of $32.6 millioncurb VAT circumvention arrangements in 2009.Poland.
Fiscal Year 2012 Compared to Fiscal Year 2011
Americas Recycling The decrease in adjusted operating results isprofit during 2012 resulted in part from lower nonferrous average selling prices and volumes primarily due to significant costs associatedfrom reduced export demand within Asia coupled with our decision to exit our joist and deck business during the second quarter of 2010. Additionally, these divisions recorded aferrous margin compression. LIFO income of $19.4was $7.0 million in 2010for 2012 as compared to LIFO incomeexpense of $65.1$13.0 million in 2009. The results for 2009 include our joist and deck business in addition to one of our U.S. trading divisions which was winding down operations in 2009 and dissolved as of August 31, 2009.
33
The following table reflects our Americas Recycling segment’ssegment's average selling prices per ton and tons shipped (in thousands) for the yearyears ended August 31:
| Decrease | ||||||||||||||||
| 2009 | 2008 | Amount | % | |||||||||||||
| Average ferrous selling price | $ | 181 | $ | 346 | $ | (165 | ) | (48 | %) | |||||||
| Average nonferrous selling price | $ | 1,824 | $ | 3,037 | $ | (1,213 | ) | (40 | %) | |||||||
| Ferrous tons shipped | 1,817 | 3,053 | (1,236 | ) | (40 | %) | ||||||||||
| Nonferrous tons shipped | 203 | 305 | (102 | ) | (33 | %) | ||||||||||
| Total volume processed and shipped | 2,033 | 3,391 | (1,358 | ) | (40 | %) | ||||||||||
| Increase (Decrease) | |||||||||||||||
| 2012 | 2011 | Amount | % | ||||||||||||
| Average ferrous selling price | $ | 345 | $ | 340 | $ | 5 | 1 | % | |||||||
| Average nonferrous selling price | $ | 2,823 | $ | 3,292 | $ | (469 | ) | (14 | )% | ||||||
| Ferrous tons shipped | 2,196 | 2,202 | (6 | ) | — | % | |||||||||
| Nonferrous tons shipped | 243 | 267 | (24 | ) | (9 | )% | |||||||||
Americas MillsWe include our fourfive domestic steel minimills and our copper tube minimillthe scrap locations which directly support the steel minimills in our Americas Mills segment. While this
This segment had a decrease in net sales during 2009 as compared to 2008,recorded an adjusted operating profit increased dueof $235.9 million for 2012, as compared with adjusted operating profit of $149.2 million for 2011. The results were primarily impacted from the change in LIFO to LIFO income recordedof $16.6 million in 20092012 as compared to LIFO expense recordedof $48.0 million in 2008.
29
in electrode, alloys and energy costs. During the fourth quarterShipments included 410 thousand tons of 2009, we completed constructionbillets in 2012 as compared to 430 thousand tons of our new micro millbillets in Arizona and in September of 2009 began start-up operations.2011.
The table below reflects our domestic steel minimills' operating statistics (in thousands) and ferrous scrapaverage prices per short ton for the year ended August 31:
| Increase (Decrease) | ||||||||||||||||
| 2009 | 2008 | Amount | % | |||||||||||||
| Average mill selling price (finished goods) | $ | 662 | $ | 723 | $ | (61 | ) | (8 | %) | |||||||
| Average mill selling price (total sales) | 642 | 691 | (49 | ) | (7 | %) | ||||||||||
| Average cost of ferrous scrap consumed | 254 | 350 | (96 | ) | (27 | %) | ||||||||||
| Average FIFO metal margin | 388 | 341 | 47 | 14 | % | |||||||||||
| Average ferrous scrap purchase price | 195 | 329 | (134 | ) | (41 | )% | ||||||||||
| Increase (Decrease) | |||||||||||||||
| 2012 | 2011 | Amount | % | ||||||||||||
| Tons melted | 2,568 | 2,470 | 98 | 4 | % | ||||||||||
| Tons rolled | 2,206 | 2,088 | 118 | 6 | % | ||||||||||
| Tons shipped | 2,682 | 2,518 | 164 | 7 | % | ||||||||||
| Average mill selling price (finished goods) | $ | 730 | $ | 696 | $ | 34 | 5 | % | |||||||
| Average mill selling price (total sales) | 706 | 669 | 37 | 6 | % | ||||||||||
| Average cost of ferrous scrap consumed | 379 | 364 | 15 | 4 | % | ||||||||||
| Average metal margin | 327 | 305 | 22 | 7 | % | ||||||||||
| Average ferrous scrap purchase price | 339 | 329 | 10 | 3 | % | ||||||||||
Americas Fabrication This segment recorded an improvement in thousands) for the year ended August 31:
| Decrease | ||||||||||||||||
| 2009 | 2008 | Amount | % | |||||||||||||
| Tons melted | 1,599 | 2,396 | (797 | ) | (33 | %) | ||||||||||
| Tons rolled | 1,478 | 2,101 | (623 | ) | (30 | %) | ||||||||||
| Tons shipped | 1,736 | 2,528 | (792 | ) | (31 | %) | ||||||||||
34
| Decrease | ||||||||||||||||
| (pounds in millions) | 2009 | 2008 | Amount | % | ||||||||||||
| Pounds shipped | 48.2 | 52.3 | (4.1 | ) | (8 | %) | ||||||||||
| Pounds produced | 45.5 | 46.8 | (1.3 | ) | (3 | %) | ||||||||||
The tables below showsshow our average fabrication selling prices per short ton and total fabrication plant shipments for the year ended August 31:
| Increase | ||||||||||||||||
| Average selling price* | 2009 | 2008 | Amount | % | ||||||||||||
| Rebar | $ | 980 | $ | 909 | $ | 71 | 8 | % | ||||||||
| Structural | 3,037 | 2,697 | 340 | 13 | % | |||||||||||
| Post | 956 | 834 | 122 | 15 | % | |||||||||||
| Increase (Decrease) | |||||||||||||||
| Average selling price (excluding stock and buyout sales) | 2012 | 2011 | Amount | % | |||||||||||
| Rebar | $ | 864 | $ | 773 | $ | 91 | 12 | % | |||||||
| Structural | 2,342 | 1,980 | 362 | 18 | % | ||||||||||
| Post | 949 | 928 | 21 | 2 | % | ||||||||||
| Decrease | Increase (Decrease) | |||||||||||||||||||||||||||
| Tons shipped (in thousands) | 2009 | 2008 | Amount | % | 2012 | 2011 | Amount | % | ||||||||||||||||||||
| Rebar | 1,010 | 1,061 | (51 | ) | (5 | %) | 911 | 851 | 60 | 7 | % | |||||||||||||||||
| Structural | 70 | 90 | (20 | ) | (22 | %) | 60 | 56 | 4 | 7 | % | |||||||||||||||||
| Post | 69 | 106 | (37 | ) | (35 | %) | 90 | 99 | (9 | ) | (9 | )% | ||||||||||||||||
International MillsWeak international steel markets, metal margin compression, mill start-up costs and lower of cost or market inventory adjustments caused by rapidly falling sales prices resulted in an adjusted operating loss for thisMill This segment in 2009. CMC Zawiercie (“CMCZ”) had an adjusted operating lossprofit of $58.1$23.0 million in 2009during 2012 as compared to an adjusted operating profit of $125.0$47.6 million during 2011. Included in 2008the 2012 results is a loss of $3.8 million on the sale of a rebar fabrication shop in Rosslau, Germany. Our Polish operations set full year production and shipping records in the mill operation in 2012, primarily due to compressed metal margins combined with a 12% declineon the strength of rebar and billet demand. Shipments in volume. Shipments2012 included 241205 thousand tons of billets compared to 373203 thousand tons of billets in the prior year. We successfully rolled 22 thousand tons of material on our newly commissioned wire rod block.2011.
30
The table below reflects CMCZ’sour International Mill's operating statistics (in thousands) and average prices per short ton:
| Decrease | ||||||||||||||||
| 2009 | 2008 | Amount | % | |||||||||||||
| Tons melted | 1,269 | 1,502 | (233 | ) | (16 | %) | ||||||||||
| Tons rolled | 997 | 1,100 | (103 | ) | (9 | %) | ||||||||||
| Tons shipped | 1,258 | 1,434 | (176 | ) | (12 | %) | ||||||||||
| Average mill selling price (total sales) | 1,351 | PLN | 1,698 | PLN | (347 | ) PLN | (20 | %) | ||||||||
| Averaged cost of ferrous scrap production cost | 785 | PLN | 1,039 | PLN | (254 | ) PLN | (24 | %) | ||||||||
| Average metal margin | 566 | PLN | 659 | PLN | (93 | ) PLN | (14 | %) | ||||||||
| Average ferrous scrap purchase price | 613 | PLN | 905 | PLN | (292 | ) PLN | (32 | %) | ||||||||
| Average mill selling price (total sales) | $ | 457 | $ | 744 | $ | (287 | ) | (39 | %) | |||||||
| Average cost of ferrous scrap production cost | $ | 255 | $ | 441 | $ | (186 | ) | (42 | %) | |||||||
| Average metal margin | $ | 202 | $ | 303 | $ | (101 | ) | (33 | %) | |||||||
| Average ferrous scrap purchase price | $ | 202 | $ | 396 | $ | (194 | ) | (49 | %) | |||||||
35
| Increase (Decrease) | |||||||||||||||
| 2012 | 2011 | Amount | % | ||||||||||||
| Tons melted | 1,638 | 1,585 | 53 | 3 | % | ||||||||||
| Tons rolled | 1,395 | 1,334 | 61 | 5 | % | ||||||||||
| Tons shipped | 1,584 | 1,494 | 90 | 6 | % | ||||||||||
| Average mill selling price (total sales) | $ | 601 | $ | 638 | $ | (37 | ) | (6 | )% | ||||||
| Average ferrous scrap production cost | 385 | 389 | (4 | ) | (1 | )% | |||||||||
| Average metal margin | 216 | 249 | (33 | ) | (13 | )% | |||||||||
| Average ferrous scrap purchase price | 315 | 325 | (10 | ) | (3 | )% | |||||||||
CorporateOur corporate expenses decreased $4.7by $1.7 million in 20092012 to $94.8$83.0 million primarily due to reductions in bonus and profit sharing expenses and costs incurred for the global installationas a result of SAP software which wereour cost containment initiatives, partially offset by increased salary$15.0 million in fees and severance expense.expenses associated with a proxy contest and hostile tender offer.
CONTINUING OPERATIONS DATA
Consolidated DataThe LIFO method of inventory valuation increased our net earnings from continuing operations by $166.1approximately $27.1 million ($1.46 per diluted share) for 20092012 as compared to decreasingincreasing our net earningsloss by $185.4approximately $46.7 million ($1.58 diluted share) for 2008. 2011.
Selling, General and Administrative ("SG&A") Expenses Our overall selling, general and administrative (“SG&A”)&A expenses decreased by $34.2$27.2 million, (5%)or 5%, for 20092012 as compared to 2008. SG&A expense primarily declined due to decreased bonus and profit sharing expenses and2011. The costs were down as a result of our cost incurred for the global installation of SAP software partiallycontainment initiatives offset by increased salary expense becauseexpenses associated with a proxy contest and hostile tender offer.
Impairment of company growth, including recent acquisitions, increased bad debt expenseAssets Our impairment of assets decreased by $23.9 million as a result of 2011 impairments related to closure of certain rebar fabrication and severance expense.construction services locations. There were no significant impairments in 2012.
Interest ExpenseOur interest expense increaseddecreased by $18.7$0.3 million to $77.0$69.5 million during 20092012 as compared to 20082011 primarily due to the issuance of $500 million in senior unsecured notes in August 2008 and increasedfrom lower average debt outstanding internationally during the current fiscal year which was offset in part by the repayment of $100 million senior unsecured notes in February 2009.internationally.
Income TaxesOur effective tax rate from continuing operations for the year ended August 31, 20092012 was 38.6%(27.8)% as compared to 31.4%55.8% in 2008. Our2011. The Company recognized a tax benefit of $102.1 million for ordinary worthless stock and bad debt deductions on the investment in CMCS. The Company also recorded a tax benefit of $11.5 million in 2012 related to federal and state research and experimentation expenditures. These tax benefits are the primary reason for the variance from the statutory tax rate of 35%. Additionally, the effective tax rate for 2009 varies from our statutory rate due to lower tax rateis increased by state and local taxes, while earnings generated in foreign jurisdictions (predominately international) incurring lossesdecrease the rate. State and higher rate jurisdictions generating income. Aslocal taxes are generally consistent while the composition of August 31, 2009, it is our intention to indefinitely reinvestdomestic and foreign earnings of non-U.S. subsidiaries. As a result,can create larger fluctuations in the deferred income tax liability relating to prior periods has been reversed positively impacting our effective tax rate for 2009.rate.
36
See Note 6,11, Credit Arrangements, to the consolidated financial statements.statements included in this report for additional information.
While we believe the lending institutions participating in our credit arrangements are financially capable, recent events init is important to note that the globalbanking and capital markets periodically experience volatility that may limit our ability to raise capital. Additionally, changes to our credit markets, including the failure, takeover or rescuerating by various government entities of major financial institutions, have created uncertainty of credit availabilityany rating agency may negatively impact our ability to an extent not experienced in recent decades.raise capital and our financing costs.
31
The table below reflects our sources, facilities and availability of liquidity and capital resources as of August 31, 2010 (dollars in thousands)2013:
| Total Facility | Availability | |||||||
| Cash and cash equivalents | $ | 399,313 | $ | N/A | ||||
| Commercial paper program* | 400,000 | 390,000 | ||||||
| Domestic accounts receivable securitization | 100,000 | 100,000 | ||||||
| International accounts receivable sales facilities | 166,457 | 62,521 | ||||||
| Bank credit facilities — uncommitted | 793,478 | 379,155 | ||||||
| Notes due from 2013 to 2018 | 1,100,000 | ** | ||||||
| CMCZ term note | 69,716 | — | ||||||
| CMCS term facility | 50,682 | 31,676 | ||||||
| Trade financing arrangements | ** | As required | ||||||
| Equipment notes | 6,710 | ** | ||||||
* We believe we have access to additional financing and refinancing, if needed. All of our | ||||||||||||||||||||||||||||||||||||||||||||||||||||||||||||||||||||||||||||||||||
CMC Poland Sp. z.o.o. ("CMCP") (formerly CMC Zawiercie S.A. or "CMCZ") has uncommitted credit facilities of PLN 245.0 million ($75.9 million) with several banks with expiration dates ranging from September 30, 2013 to March 31, 2014. The Company intends to renew the uncommitted credit facilities upon expiration. During 2013, CMCP had total borrowings of $229.4 million and total repayments of $254.0 million under these facilities. At August 31, 2013, no amounts were outstanding under these facilities.
The maximum availability under our financing agreements include various financial covenants. We amended the existing$300 million revolving credit facility and accounts receivable securitization agreementcan be increased to modify$400 million with the covenant structureconsent of both parties. The facility's capacity, with a sublimit of $50 million for letters of credit, is reduced by outstanding stand-by letters of credit which requires ustotaled $28.3 million at August 31, 2013. Under the credit facility, we were required to maintain a minimum interest coverage ratio (Adjusted(adjusted EBITDA to interest expense)expense, as each is defined in the facility) of not less than 2.503.00 to 1.00 for the sixtwelve month cumulative period ended August 31, 2010, nine month cumulative period ending November 30, 2010, twelve month cumulative period ending February 28, 20112012 and for each fiscal quarter on a rolling twelve month cumulative period thereafter. At August 31, 2010,2013, our interest coverage ratio was 3.495.17 to 1.00. The agreementscredit facility also require us to maintain liquidity of at least $300 million (cash, short-term investments, and accounts receivable securitization capacity combined) through November 30, 2010 and at August 31, 2010 we had liquidity of $499.3 million. The agreements did not change the existing debt to capitalization ratio covenant which requires us to maintain a debt to capitalization ratio that does not greater than exceed 0.60 to 1.00.1.00. At August 31, 2010, the Company’s2013, our debt to capitalization ratio was 0.520.51 to 1.00. Current market conditions, including volatility1.00. The credit facility provides for interest based on the LIBOR, the Eurodollar rate or Bank of metal prices, LIFO adjustments, markAmerica's prime rate.
At August 31, 2013, we were in compliance with all covenants related to market adjustments on inventories, reserves for future job losses,our debt agreements.
Our foreign operations generated approximately 27% of our revenue in 2013, and as a result, our foreign operations had cash and cash equivalents of approximately $56.6 million and $108.0 million at August 31, 2013 and 2012, respectively. Historically, our domestic operations have generated the levelmajority of allowance for doubtful accounts,our cash, which has been used to fund the amountcash needs of interest capitalized on capital projects andour domestic operations as well as our foreign operations. Additionally, our domestic operations have access to the effect of interest rate changes on our interest rate swaps could impact our ability to meet the interest coverage ratio for the first quarter of fiscal 2011. The$300 million revolving credit facility and accountsthe $200 million sale of receivable securitization are used as alternative sourcesprogram described below. It is the Company's intention to indefinitely reinvest all undistributed earnings of liquidity. Our public debt doesnon-U.S. subsidiaries. While not contain these covenants.
37
We regularly maintain a substantial amount of accounts receivable. Recent economic conditions and a continued recession have had negative effects on the liquidity of our customers which has resulted in higher defaults on accounts receivable and additional bad debt expense. We actively monitor our accounts receivable and, based on market conditions and customers' financial condition, we record allowances as soon as we believe theyaccounts are uncollectible based on current market conditions and customers’ financial condition.uncollectible. Continued pressure on the liquidity of our customers could result in additional reserves as we make our assessments in the future. We use credit insurance both in the U.S. and internationally to mitigate the risk of customer insolvency. We estimate that the amount of credit insured receivables (and those covered by export letters of credit) was approximately 60%49% of total receivables at August 31, 2010.2013.
For added flexibility, we may secure financing through securitization and sales ofsell certain accounts receivable both in the U.S. and internationally. See Note 3,5, Sales of Accounts Receivable, to the consolidated financial statements. We may sellstatements contained in this report. Our domestic sale of accounts receivable on an ongoing basis to replace those receivables that have been collected from our customers. Our domestic securitization program contains certain cross-default provisions whereby a termination event could occur shouldif we default under anothercertain of our credit arrangement, andarrangements. Additionally, our sales of accounts receivable program contains covenants that conform toare consistent with the same requirementscovenants contained in our revolving credit agreement. Compliance with these covenants is discussed above.
32
Cash FlowsOur cash flows from operating activities result primarily result from sales of steel and related products, and to a lesser extent, sales of nonferrous metal products. We also sell and rent construction-related products and accessories.other raw materials used in steel manufacturing. We have a diverse and generally stable customer base. WeFrom time to time, we use futures or forward contracts as needed to mitigate the risks from fluctuations in foreign currency exchange rates, metal commodity prices and metals commoditynatural gas prices. See Note 7, Financial Instruments, Market12, Derivatives and Credit Risk Management, to the consolidated financial statements.statements contained in this report.
Fiscal Year 2013 Compared to Fiscal Year 2012
Net cash flows from operating activities aswere $147.7 million and $196.0 million in 2013 and 2012, respectively. The $48.3 million decline in cash flow from operations is primarily due to the following:
Net earnings for fiscal 2013 declined by $130.2 million when compared to generating $806.52012. See further discussion under the Consolidated Results of Operations above.
Deferred income taxes changed by $114.7 million from 2012 from a benefit of $60.0 millionin 2009. Significant fluctuations2012 to an expense of $54.7 million in working capital were2013.
The net change in operating assets and liabilities was a reduced cash inflow of $35.6 million during fiscal 2013 compared to fiscal 2012. The most significant components of change within the operating assets and liabilities are as follows:
| ◦ | Accounts receivable |
| ◦ | Inventory - Cash generated from inventory during 2013 was lower when compared to 2012. As overall net sales declined year-over-year, we continue to adjust our operating levels to reflect changing market demands, while maintaining stocking levels that allow us to meet our customers' needs. Furthermore, our days' sales in inventory increased three days in 2013 from 41 days in 2012. |
| ◦ | |||
Accounts payable, |
We expectestimate that our total2014 capital budget for fiscal 2011 towill be approximately $150between $120 million and $160 million. We continuallyregularly assess our capital spending and reevaluate our requirements based on current and expected results.
Net cash flows from financing activities were $15.0 million in 2013, while net cash flows used by financing activities were $121.7 million in 2012.
In May 2013, we issued $330.0 million of 4.875% Senior Notes due May 15, 2023 (the "2023 Notes") and received proceeds of $325.0 million, net of underwriting discounts and debt issuance costs. We used $205.3 million of the proceeds from the 2023 Notes to purchase all of our outstanding $200.0 million of 5.625% Notes due 2013 (the "2013 Notes"). We intend to use the remaining proceeds for general corporate purposes. Interest on the 2023 Notes is payable semi-annually on May 15 and November 15 of each year, beginning on November 15, 2013. We may, at any time, redeem the 2023 Notes at a redemption price equal to 100 percent of the principal amount, plus a "make-whole" premium described in the indenture. Additionally, if a change of control triggering event occurs, as defined by the terms of the indenture, holders of the 2023 Notes may require us to repurchase the 2023 Notes at a purchase price equal to 101 percent of the principal amount, plus accrued and unpaid interest, if any, to the date of purchase. We are generally not limited under the indenture governing the 2023 Notes in our ability to incur additional indebtedness provided we are in compliance with certain restrictive covenants, including restrictions on liens, sale and leaseback transactions, mergers, consolidations and transfers of substantially all of our assets. These covenants are not expected to impact our liquidity or capital resources.
33
During 2013, we had net short-term borrowings of $19.5 million and a decrease of $6.2 million in our usage of documentary letters of credit. Our cash dividend payments were $56.0 million and $55.6 million in 2013 and 2012, respectively.
Fiscal Year 2012Compared to Fiscal Year 2011
During 2010,2012, we generated $84.6$196.0 million of net cash flows from operating activities as compared to generating $27.7 million during 2011. This increase resulted primarily from a significant improvement in pre-tax earnings and improvements in operations for working capital. Significant fluctuations in working capital were as follows:
Inventory - Inventory decreased during the year ended 2012 as compared to the fourth quarter of 2011 as inventory levels were matched to lower sales in the fourth quarter 2012 as compared to fourth quarter 2011. Days sales in inventory was 41 days and 45 days as of August 31, 2012 and 2011, respectively.
Accounts payable and accrued expenses — Accounts payable and accrued expenses decreased as our expenses were lower from decreased sales in the fourth quarter of 2012 as compared to the fourth quarter of 2011.
During 2012, we used $27.4 million of net cash flows from investing activities as compared to using $61.5 million in 2011. We invested $113.9 million in property, plant and equipment during 2012, an increase of $40.6 million over 2011. Additionally, proceeds from disposal of assets and businesses were $55.4 million in 2012, an increase of $2.0 million over 2011. During 2012, we sold all outstanding shares of CMCS, excluding certain assets that were sold in June and September 2012, and we also sold a rebar fabrication shop in Rosslau, Germany. Additionally, we generated cash of $31.1 million in 2012 from the release of deposits for letters of credit. During 2011, we sold assets of our joist and deck business and sold the forms of our heavy forms rental business.
During 2012, we used $121.7 million of net cash flows from financing activities as compared to using $246.5$147.0 million during 2009.2011. The increasereduction in cash generatedused was primarily due to approximately $52.7 million of proceeds from the increasetermination of our interest rate swaps during 2012 which was partially offset by a reduction in the usage of documentary letters of credit of $117.4 million in 2010 as compared to the decrease in documentary letters of credit of $83.3 million in 2009 and net borrowings on short-term and long-term debt of $7.1 million in 2010 as compared to net repayments of $94.7 million in 2009. During 2010, we made no purchases of our common stock as part of our stock repurchase program compared to using $18.5 million in 2009.million. Our cash dividends have remained consistent at approximately $54 million for both periods.2012 and 2011.
38
Our contractual obligations for the next twelve months of approximately $696$836.5 million are typically expenditures incurred in connection with normal revenue producing activities. We believe our cash flows from operating activities and debtcredit facilities are adequate to fund our ongoing operations and planned capital expenditures.
Contractual Obligations
The following table represents our contractual obligations as of August 31, 2010 (dollars2013:
| Payments Due By Period* | ||||||||||||||||||||
| Contractual Obligations (in thousands) | Total | Less than 1 Year | 1-3 Years | 3-5 Years | More than 5 Years | |||||||||||||||
| Long-term debt(1) | $ | 1,249,594 | $ | 5,228 | $ | 8,444 | $ | 905,164 | $ | 330,758 | ||||||||||
| Interest(2) | 441,176 | 79,653 | 158,579 | 127,174 | 75,770 | |||||||||||||||
| Operating leases(3) | 123,497 | 35,430 | 51,543 | 24,606 | 11,918 | |||||||||||||||
| Purchase obligations(4) | 1,024,401 | 716,238 | 163,121 | 106,906 | 38,136 | |||||||||||||||
| Total contractual cash obligations | $ | 2,838,668 | $ | 836,549 | $ | 381,687 | $ | 1,163,850 | $ | 456,582 | ||||||||||
* We have not discounted the cash obligations in thousands):this table.
| Payments Due By Period* | ||||||||||||||||||||
| Less than | More than | |||||||||||||||||||
| Contractual Obligations: | Total | 1 Year | 1-3 Years | 3-5 Years | 5 Years | |||||||||||||||
| Long-term debt(1) | $ | 1,227,870 | $ | 30,588 | $ | 58,317 | $ | 214,758 | $ | 924,207 | ||||||||||
| Notes payable | 6,453 | 6,453 | — | — | — | |||||||||||||||
| Interest(2) | 432,637 | 65,681 | 125,565 | 109,057 | 132,334 | |||||||||||||||
| Commercial paper | 10,000 | 10,000 | — | — | — | |||||||||||||||
| Operating leases(3) | 156,033 | 40,965 | 57,689 | 33,988 | 23,391 | |||||||||||||||
| Purchase obligations(4) | 671,635 | 541,850 | 78,742 | 41,540 | 9,503 | |||||||||||||||
| Total contractual cash obligations | $ | 2,504,628 | $ | 695,537 | $ | 320,313 | $ | 399,343 | $ | 1,089,435 | ||||||||||
| (1) | Total amounts are included in the August 31, |
| (2) | Interest payments related to our short-term debt are not included in the table as they do not represent a significant obligation as of August 31, |
| (3) | Includes minimum lease payment obligations for |
34
| (4) | Approximately |
The Company provides certain eligible executives' benefits pursuant to a nonqualified benefit restoration plan ("BRP Plan") equal to amounts that would have been available under the tax qualified plans under the Employee Retirement Income Security Act of 1974, as amended ("ERISA"), but for limitations of ERISA, tax laws and regulations. The deferred compensation liability under the BRP Plan was $78.8 million at August 31, 2013 and is included in other long-term liabilities on the consolidated balance sheets. We generally expect to fund future contributions with cash flows from operating activities. We did not include estimated payments related to BRP in the above contractual obligation table. Refer to Note 17, Employees' Retirement Plans to the consolidated financial Statements included in this report.
A certain number of employees, primarily outside of the U.S., participate in defined benefit plans maintained in accordance with local regulations. At August 31, 2013, the Company's liability related to the unfunded status of the defined benefit plans was $3.5 million. We generally expect to fund future contributions with cash flows from operating activities. We did not include estimated payments related to defined benefit plans in the table above. Refer to Note 17, Employees' Retirement Plans to the consolidated financial statements included in this report.
The Company's other noncurrent liabilities on the consolidated balance sheets include deferred tax liabilities, gross unrecognized tax benefits, and the related gross interest and penalties. As of August 31, 2013, the Company had noncurrent deferred tax liabilities of $46.6 million. In addition, as of August 31, 2013, the Company had gross unrecognized tax benefits of $9.4 million and an additional $2.8 million for gross interest and penalties classified as noncurrent liabilities. At this time, the Company is unable to make a reasonably reliable estimate of the timing of payments in individual years in connection with these tax liabilities; therefore, such amounts are not included in the above contractual obligations table.
Other Commercial Commitments
We maintain stand-by letters of credit to provide support for certain transactions that our insurance providers and suppliers request. At August 31, 2010,2013, we had committed $39.4$28.9 million under these arrangements.
Off-Balance Sheet Arrangements
We provide guarantees and issue standby letters of credit to our vendors, customers, insurance providers and governmental agencies in the normal course of business. These arrangements of which $26.9 million is cash collateralized. All ofdo not have, and we do not expect them to have, a material effect on our liquidity. See Note 18, Commitments and Contingencies, to the commitments expire within one year.consolidated financial statements included in this report.
Contingencies
See Note 18, Commitments and Contingencies, to the consolidated financial statements included in this report.
In the ordinary course of conducting our business, we become involved in litigation, administrative proceedings and governmentgovernmental investigations, including environmental matters. We may incur settlements, fines, penalties or judgments because of some of these matters. While we are unable to estimate precisely the ultimate dollar amount of exposure or loss in connection with these matters, we make accruals as warranted. The amounts we accrue could vary substantially from amounts we payInherent uncertainties exist in these estimates primarily due to several factors including the following: evolving remediation technology, changing regulations, possible third-party contributions the inherent shortcomings of the estimation process, and the uncertainties involved in litigation. Accordingly, we cannot always estimate a meaningful range of possible exposure. We believe that we have adequately provided in our consolidated financial statements for the potential impact of these contingencies. We alsodo not believe that any currently pending legal proceedings to which we are a party will have a material adverse effect, individually or in the outcomes will not significantly affect the long-termaggregate, on our results of operations, ourcash flows or financial position or our liquidity. However, they may have a material impact on operations for a particular quarter.condition.
Environmental and Other Matters
The information set forth in Note 12,18, Commitments and Contingencies, to the consolidated financial statements.statements included in this report is hereby incorporated by reference.
39
GeneralWe are subject to Federal, state and local pollution control laws and regulations in all locations where we have operating facilities. We anticipate that compliance with these laws and regulations will involve continuing capital expenditures and operating costs.
35
Our original business and one of our core businesses for over nine decades is metals recycling. In the present era of conservation of natural resources and ecological concerns, we are committed to sound ecological and business conduct. Certain governmental regulations regarding environmental concerns, however well intentioned, may expose us and theour industry to potentially significant risks. We believe that recycled materials are commodities that are diverted by recyclers, such as us, from the solid waste streams because of their inherent value. Commodities are materials that are purchased and sold in public and private markets and commodities exchanges every day around the world. They are identified, purchased, sorted, processed and sold in accordance with carefully established industry specifications.
Solid and Hazardous WasteWe currently own or lease, and in the past owned or leased, properties that have been used in our operations. Although we used operating and disposal practices that were standard in the industry at the time, wastes may have been disposed of or released on or under the properties or on or under locations where such wastes have been taken for disposal. We are currently involved in the investigation and remediation of several such properties. State and Federal laws applicable to wastes and contaminated properties have gradually become stricter over time. Under new laws, we could be required to remediate properties impacted by previously disposed wastes. We have been named as a potentially responsible party (“PRP”("PRP") at a number of contaminated sites.
We generate wastes, including hazardous wastes, that are subject to the Federal Resource Conservation and Recovery Act (“RCRA”) and comparable state and/orand local statutes where we operate. These statutes, regulations and laws may have limited disposal options for certain wastes.
SuperfundThe U.S. Environmental Protection Agency (“EPA”("EPA"), or an equivalent state agency, has notified us that we are considered a PRP at ten sites, none of which are owned by us. We may be obligated under the Comprehensive Environmental Response, Compensation, and Liability Act of 1980 (“CERCLA”("CERCLA"), or a similar state statute, to conduct remedial investigation, feasibility studies, remediation and/or removal of alleged releases of hazardous substances or to reimburse the EPA for such activities. We are involved in litigation or administrative proceedings with regard to several of these sites in which we are contesting, or at the appropriate time we may contest, our liability at the sites.liability. In addition, we have received information requests with regard to other sites which may be under consideration by the EPA as potential CERCLA sites. Because of various factors, including the ambiguity of the regulations, the difficulty of identifying the responsible parties for any particular site, the complexity of determining the relative liability among them, the uncertainty as to the most desirable remediation techniques and the amount of damages and cleanup costs and the extended time periods over which such costs may be incurred, we cannot reasonably estimate our ultimate costs of compliance with CERCLA. At August 31, 2010, basedBased on currently available information, which is in many cases preliminary and incomplete, we had $1.1$0.9 million and $1.0 million accrued for cleanupas of August 31, 2013 and remediation costs2012, respectively, in connection with eight of the ten CERCLA sites. We have accrued for these liabilities based upon our best estimates. We are not able to reasonably estimate an amount for the two other CERCLA sites. The amounts paid and the expenses incurred on these sites for the years ended August 31, 2010, 20092013, 2012 and 20082011 were not material. Historically, the amounts that we have ultimately paid for such remediation activities have not been material.
Clean Water ActThe Clean Water Act (“CWA”("CWA") imposes restrictions and strict controls regarding the discharge of wastes into waters of the United States, a term broadly defined, or into publicly owned treatment works. These controls have become more stringent over time and it is probable that additional restrictions will be imposed in the future. Permits must generally be obtained to discharge pollutants into Federal waters or into publicly owned treatment works; comparable permits may be required at the state level. The CWA and many state agencies provide for civil, criminal and administrative penalties for unauthorized discharges of pollutants. In addition, the EPA’sEPA's regulations and comparable state regulations may require us to obtain permits to discharge storm water runoff. In the event of an unauthorized discharge or non-compliance with permit requirements, we may be liable for penalties and costs.
Clean Air ActOur operations are subject to regulations at the Federal, state and local level for the control of emissions from sources of air pollution. New and modified sources of air pollutants are often required to obtain permits prior to commencing construction, modification and/or operations. Major sources of air pollutants are subject to more stringent requirements, including the potential need for additional permits and to increasedincrease scrutiny
40
in the context of enforcement. The EPA has been implementing its stationary emission control program through expanded enforcement of the New Source Review Program. Under this program, new or modified sources may be required to construct emission sources using what is referred to as the Best Available Control Technology, or in any areas that are not meeting national ambient air quality standards, using methods that satisfy requirements for Lowest Achievable Emission Rate. Additionally, the EPA is implementing new, more stringent standards for ozone and fine particulate matter. The EPA recently has promulgated new national emission standards for hazardous air pollutants for steel mills which will require specific sources in this category to meet the standards by reflecting application of maximum achievable control technology. Compliance with the new standards could require additional expenditures.
We incurred environmental expenses of $22.7 million.$30.1 million, $26.8 million and $32.2 million for 2013, 2012 and 2011, respectively. The expenses included the cost of environmental personnel at various divisions, permit and license fees, accruals and payments
36
for studies, tests, assessments, remediation, consultant fees, baghouse dust removal and various other expenses. During 2010, $14.1In addition, we spent $10.5 million of our in capital expenditures related to costs directly associated with environmental compliance. At August 31, 2010, $9.8 million wasWe accrued for environmental liabilities of $9.0 million at August 31, 2013 and 2012, respectively, of which $5.9$5.0 million was and $4.9 million were classified as other long-term liabilities.liabilities at August 31, 2013 and 2012, respectively.
Dividends
We have paid quarterly cash dividends in each of the past 184196 consecutive quarters. We paid dividends in 20102013 at the rate of $0.12 per share for each quarter.
Critical Accounting Policies and Estimates
The following discussion and analysis of our financial condition and results of operations is based upon our consolidated financial statements, which have been prepared in accordance with accounting principles generally accepted in the United States. The preparation of the consolidated financial statements requires us to make estimates and assumptions that affect the reported amounts of assets, liabilities, revenue and expenses and related disclosure of contingent liabilities. We evaluate the appropriateness of these estimations and assumptions, including those related to the valuation allowances for receivables, the carrying value of non-current assets, reserves for environmental obligations and income taxes, on an ongoing basis. Estimates and assumptions are based on historical experience and on various other assumptions that we believe to be reasonable under the circumstances, the results of which form the basis for making judgments about the carrying value of assets and liabilities that are not readily apparent from other sources. Accordingly, actual results in future periods could differ materially from these estimates. Significant judgments and estimates used in the preparation of the consolidated financial statements apply to the following critical accounting policies:
Revenue Recognition and Allowance for Doubtful Accounts We recognize sales when title passes to the customer either when goods are shipped or when they are delivered based on the terms of the sale, there is persuasive evidence of an agreement, the price is fixed or determinable and collectability is reasonably assured. When we estimate that a contract with one of our customers will result in a loss, we accrue the calculated loss as soon as it is probable and estimable. We account for fabrication projects based on the percentage of completion accounting method, based primarily on contract cost incurred to date compared to total estimated contract cost. Changes to total estimated contract cost, or loss, if any, are recognized in the period in which they are determined. We maintain an allowance for doubtful accounts to reflect our estimate of the uncollectability of accounts receivable. These reserves are based on historical trends, current market conditions and customers' financial condition.
Income Taxes We periodically assess the likelihood of realizing our deferred tax assets based on the amount of deferred tax assets that we believe is more likely than not to be realized. We base our judgment of the recoverability of our deferred tax asset primarily on historical earnings, our estimate of current and expected future earnings, prudent and feasible tax planning strategies, and current and future ownership changes.
Our effective income tax rate may fluctuate on a quarterly basis due to various factors, including, but not limited to, total earnings and the mix of earnings by jurisdiction, the timing of changes in tax laws, and the amount of tax provided for uncertain tax positions. We establish income tax liabilities to reduce some or all quarters.of the income tax benefit of any of our income tax positions at the time we determine that the positions become uncertain based upon one of the following: (1) the tax position is not "more likely than not" to be sustained, (2) the tax position is "more likely than not" to be sustained, but for a lesser amount, or (3) the tax position is "more likely than not" to be sustained, but not in the financial period in which the tax position was originally taken. Our evaluation of whether or not a tax position is uncertain is based on the following: (1) we presume the tax position will be examined by the relevant taxing authority that has full knowledge of all relevant information, (2) the technical merits of a tax position are derived from authorities such as legislation and statutes, legislative intent, regulations, rulings and case law and their applicability to the facts and circumstances of the tax position, and (3) each tax position is evaluated without considerations of the possibility of offset or aggregation with other tax positions taken. We adjust these income tax liabilities when our judgment changes as a result of new information. Any change will impact income tax expense in the period in which such determination is made.
Inventory Cost We determine inventory cost for most domestic inventories by the last-in, first-out method, or LIFO. We calculate our LIFO reserve by using quantities and costs at period end and recording the resulting LIFO income or expense in its entirety. Inventory cost for international and remaining inventories is determined by the first-in, first-out method, or FIFO. We record all inventories at the lower of their cost or market value.
Elements of cost in finished goods inventory in addition to the cost of material include depreciation, amortization, utilities, consumable production supplies, maintenance, production, wages and transportation costs. Additionally, the costs of departments that support production, including materials management and quality control, are allocated to inventory.
37
Goodwill We perform our goodwill impairment test in the fourth quarter of each fiscal year or when changes in circumstances indicate an impairment event may have occurred by estimating the fair value of each reporting unit compared to its carrying value. Our reporting units represent an operating segment or a reporting level below an operating segment.
Additionally, the reporting units are aggregated based on similar economic characteristics, nature of products and services, nature of production processes, type of customers and distribution methods. We use a discounted cash flow model and a market approach to calculate the fair value of our reporting units. The model includes a number of significant assumptions and estimates regarding future cash flows including discount rates, volumes, prices, capital expenditures and the impact of current market conditions. These estimates could be materially impacted by adverse changes in market conditions.
As a result of the goodwill impairment tests in 2013, we recorded goodwill impairment charges of $6.4 million, including foreign currency translation gains of $0.6 million, related to our Australian subsidiaries. The annual goodwill impairment analysis did not result in any impairment charges at any of our other reporting units. The fair value of each of our reporting units exceeded carrying value by at least 38%. As of August 31, 2013 and 2012, one of our reporting units within the Americas Fabrication reporting segment comprised $51.3 million of our total goodwill. Goodwill at other reporting units is not material. See Note 7, Goodwill and Other Intangible Assets, to the consolidated financial statements included in this report for additional information.
Long-Lived Assets We evaluate the carrying value of property, plant and equipment and finite-lived intangible assets whenever a change in circumstances indicates that the carrying value may not be recoverable from the undiscounted future cash flows from operations. If an impairment exists, the net book values are reduced to fair values as warranted. Our domestic and international minimills, fabrication and recycling businesses are capital intensive. Some of the estimated values for assets that we currently use in our operations are based upon judgments and assumptions of future undiscounted cash flows that the assets will produce. If these assets were for sale, our estimates of their values could be significantly different because of market conditions, specific transaction terms and a buyer's different viewpoint of future cash flows. Also, we depreciate property, plant and equipment on a straight-line basis over the estimated useful lives of the assets. Depreciable lives are based on our estimate of the assets' economical useful lives. To the extent that an asset's actual life differs from our estimate, there could be an impact on depreciation expense or a gain/loss on the disposal of the asset in a later period. We expense major maintenance costs as incurred.
Contingencies In the ordinary course of conducting our business, we become involved in litigation, administrative proceedings and governmental investigations, including environmental matters. We may incur settlements, fines, penalties or judgments in connection with some of these matters. While we are unable to estimate the ultimate dollar amount of exposure or loss in connection with these matters, we make accruals as warranted. The amounts we accrue could vary substantially from amounts we pay due to several factors including the following: evolving remediation technology, changing regulations, possible third-party contributions, the inherent shortcomings of the estimation process, and the uncertainties involved in litigation. We believe that we have adequately provided in our consolidated financial statements for the impact of these contingencies. We also believe that the outcomes will not materially affect our results of operations, our financial position or our cash flows.
Other Accounting Policies and New Accounting Pronouncements See Note 2, Summary of Significant Accounting Policies, to our consolidated financial statements included in this report.
38
ITEM 7A. QUANTITATIVE AND QUALITATIVE DISCLOSURES ABOUT MARKET RISK
Market Risk
Approach to MinimizingMitigating Market RiskSee Note 7, Financial Instruments, Market12, Derivatives and Credit Risk Management, to the consolidated financial statements included in this report for disclosure regarding our approach to minimizingmitigating market risk.risk and for summarized market risk information for the preceding fiscal year. Also, see Note 1,2, Summary of Significant Accounting Policies, to the consolidated financial statements.statements included in this report. The following types of derivative instruments were outstanding at August 31, 2010,or utilized during 2013, in accordance with our risk management program. All of the instruments are highly liquid, and not entered into for trading purposes.
Currency Exchange ForwardsWe enter into currency exchange forward contracts as economic hedges of international trade commitments denominated in currencies other than the functional currency of the CompanyCMC or its subsidiaries. No single foreign currency poses a primary risk to us. Fluctuations that cause temporary disruptions in one market segment tend to open opportunities in other segments.
Commodity PricesWe base pricing in some of our sales and purchase contracts on metal commodity futures exchange quotes, which we determine at the beginning of the contract. Due to the volatility of the metal commodity indexes, we enter into metal commodity futures contracts for copper, aluminum, nickel and zinc. These futures mitigate the risk of unanticipated declines in gross margin due to the volatility of the commodity prices on these contractual commitments. Physical transaction quantities will not match exactly with standard commodity lot sizes, leading to minimal gains and losses from ineffectiveness.
Natural GasWe enter into natural gas forward contracts as economic hedges of the Company’sCompany's Americas Mills operations based on anticipated consumption of natural gas in order to mitigate the risk of unanticipated increase toincreases in operating cost due to the volatility of natural gas prices. As of August 31, 2013, the Company had no open natural gas forward contract commitments.
FreightWe occasionally enter into freight forward contracts when sales commitments to customers include a fixed price freight component in order to minimizemitigate the effect of the volatility of ocean freight rates. As of August 31, 2013, the Company had no open freight forward contract commitments.
Interest RatesWe enter into interest rate swap contracts to maintain a portion of our debt obligations at variable interest rates. These interest rate swap contracts, under which we have agreed to pay variable rates of interest and receive fixed rates of interest, are designated as fair value hedges of fixed rate debt. OurDuring the third quarter of 2012, the Company terminated its existing interest rate swap contract commitments were $500 million as of August 31, 2010. If interest rates increased or decreased by one percentage point, the impact on interest expense related to our variable-rate debt would be approximately $6 million and the impact on fairtransactions with a notional value of our long-term debt would be$800 million and received cash proceeds of approximately $60$53 million as, net of August 31, 2010.customary finance charges.
The following tables provide certain information regarding the foreign exchange and commodity financial instruments discussed above.
41
Gross foreign currency exchange contract commitments as of August 31, 2010:2013:
| Functional Currency | Foreign Currency | U.S. | ||||||||||||||
| Amount | Amount | Range of | Equivalent | |||||||||||||
| Type | (in thousands) | Type | (in thousands) | Hedge Rates* | (in thousands) | |||||||||||
| AUD | 917 | EUR | 642 | 0.67 - 0.70 | $ | 817 | ||||||||||
| AUD | 182 | GBP | 104 | 0.57 | 161 | |||||||||||
| AUD | 134 | NZD** | 167 | 1.24 - 1.27 | 120 | |||||||||||
| AUD | 103,758 | USD | 89,967 | 0.80 - 0.92 | 89,967 | |||||||||||
| EUR | 2,669 | HRK | 19,369 | 7.21 - 7.31 | 3,425 | |||||||||||
| EUR | 3,103 | USD | 3,992 | 1.28 - 1.29 | 3,992 | |||||||||||
| GBP | 3,864 | EUR | 4,707 | 0.81 - 0.83 | 5,998 | |||||||||||
| GBP | 4,096 | USD | 6,342 | 1.52 - 1.56 | 6,342 | |||||||||||
| PLN | 238,150 | EUR | 58,942 | 3.90 - 4.19 | 75,748 | |||||||||||
| PLN | 5,559 | GBP | 1,107 | 5.02 | 1,601 | |||||||||||
| PLN | 113,272 | USD | 35,139 | 2.98 - 3.32 | 35,139 | |||||||||||
| PLN | 1,102 | SEK*** | 2,642 | 0.42 | 359 | |||||||||||
| SGD | 5,091 | USD | 3,750 | 1.36 | 3,750 | |||||||||||
| USD | 51,979 | EUR | 40,963 | 1.18 - 1.32 | 51,979 | |||||||||||
| USD | 27,916 | GBP | 18,100 | 1.54 | 27,916 | |||||||||||
| USD | 1,887 | JPY | 159,412 | 84.5 | 1,887 | |||||||||||
| $ | 309,201 | |||||||||||||||
| Functional Currency | Foreign Currency | |||||||||||||
| Type | Amount (in thousands) | Type | Amount (in thousands) | Range of Hedge Rates (1) | U.S. Equivalent (in thousands) | |||||||||
| AUD | 94 | EUR | 67 | 0.67 — 0.76 | $ | 89 | ||||||||
| AUD | 1,240 | NZD (2) | 1,438 | 1.13 — 1.20 | 1,124 | |||||||||
| AUD | 76,296 | USD | 69,121 | 0.88 — 1.01 | 69,121 | |||||||||
| AUD | 240 | CNY (3) | 1,313 | 5.46 | 214 | |||||||||
| GBP | 1,437 | EUR | 1,669 | 0.85 — 0.87 | 2,213 | |||||||||
| GBP | 18,844 | USD | 29,039 | 1.51 — 1.57 | 29,039 | |||||||||
| PLN | 284,936 | EUR | 66,873 | 4.16 — 4.41 | 88,954 | |||||||||
| PLN | 1,447 | USD | 442 | 3.26 — 3.32 | 442 | |||||||||
| SGD | 7,206 | USD | 5,654 | 1.27 — 1.28 | 5,654 | |||||||||
| USD | 38,700 | EUR | 29,173 | 1.27 — 1.34 | 38,700 | |||||||||
| USD | 46,879 | GBP | 30,286 | 1.55 | 46,879 | |||||||||
| USD | 1,375 | JPY | 137,974 | 100.33 | 1,375 | |||||||||
| USD | 10,556 | PLN | 33,594 | 3.18 — 3.23 | 10,556 | |||||||||
| USD | 14,610 | SGD | 18,279 | 1.23 — 1.26 | 14,610 | |||||||||
| USD | 2,186 | CHF | 2,055 | 0.92 — 0.96 | 2,186 | |||||||||
| USD | 19,196 | AUD | 21,500 | 0.89 — 0.90 | 19,196 | |||||||||
| USD | 648 | THB | 20,000 | 30.88 | 648 | |||||||||
| $ | 331,000 | |||||||||||||
(1) Substantially all foreign currency exchange contracts mature within one year. The range of hedge rates represents functional to foreign currency conversion rates.
(2) New Zealand dollar
(3) Chinese yuan
Commodity contract commitments as of August 31, 2010:2013:
| Range or | Total Contract | |||||||||||||||||||||
| Long/ | # of | Standard | Total | Amount of Hedge | Value at Inception | |||||||||||||||||
| Terminal Exchange | Metal | Short | Lots | Lot Size | Weight | Rates Per MT/lb. | (in thousands) | |||||||||||||||
| London Metal Exchange | Aluminum | Long | 121 | 25 MT | 3,025 MT | $1,991.50 - 2,087.00 | $ | 6,131 | ||||||||||||||
| Aluminum | Short | 3 | 25 MT | 75 MT | 2,045.00 - 2,046.00 | 153 | ||||||||||||||||
| Copper | Long | 2 | 25 MT | 54 MT | 6,208.40 - 6,270.00 | 340 | ||||||||||||||||
| Copper | Short | 2 | 25 MT | 54 MT | 6,670.09 - 7,304.64 | 375 | ||||||||||||||||
| Zinc | Long | 1 | 25 MT | 36 MT | 1,670.00 - 1,730.00 | 62 | ||||||||||||||||
| New York Mercantile Exchange | Copper | Long | 49 | 25,000 lbs. | 1,225,000 lbs. | 286.50 - 346.80 | 4,037 | |||||||||||||||
| Copper | Short | 635 | 25,000 lbs. | 15,875,000 lbs. | 275.85 - 342.95 | 51,192 | ||||||||||||||||
| Natural Gas | Long | 14 | 10,000 MMBtu | 140,000 MMBtu | 4.53 - 4.63 | 644 | ||||||||||||||||
| $ | 62,934 | |||||||||||||||||||||
| Terminal Exchange | Metal | Long/ Short | # of Lots | Standard Lot Size | Total Weight | Range or Amount of Hedge Rates Per MT/lb. | Total Contract Value at Inception (in thousands) | ||||||||||
| London Metal Exchange | Aluminum | Long | 123 | 25 MT | 3,063 MT | 1,895.00 — 2,028.00 | $ | 5,862 | |||||||||
| Aluminum | Short | 4 | 25 MT | 100 MT | 1,896.50 — 1,907.75 | 190 | |||||||||||
| Copper | Long | 1.31 | 25 MT | 33 MT | 8,025.00 — 8,055.00 | 263 | |||||||||||
| Zinc | Long | 0.87 | 25 MT | 22 MT | 2,247.00 — 2,259.00 | 49 | |||||||||||
| New York Mercantile Exchange | Copper | Long | 86 | 25,000 lbs. | 2,150,000 lbs. | 309.95 — 350.15 | 7,098 | ||||||||||
| Copper | Short | 441 | 25,000 lbs. | 11,025,000 lbs. | 302.45 — 340.70 | 35,808 | |||||||||||
| $ | 49,270 | ||||||||||||||||
_________________
MT = Metric Ton
ton42
ITEM 8. FINANCIAL STATEMENTS AND SUPPLEMENTARY DATA
REPORT OF MANAGEMENT ON INTERNAL CONTROL OVER FINANCIAL REPORTING
Our management is responsible for establishing and maintaining adequate internal control over financial reporting for the Company as defined in Rules 13a-15(f) and 15d-15(f) under the Securities Exchange Act of 1934, as amended. Internal control over financial reporting is a process to provide reasonable assurance regarding the reliability of our financial reporting for external purposes in accordance with accounting principles generally accepted in the United States of America. Internal control over financial reporting includes maintaining records that in reasonable detail accurately and fairly reflect our transactions; providing reasonable assurance that transactions are recorded as necessary for preparation of our financial statements; providing reasonable assurance that receipts and expenditures of company assets are made in accordance with management authorization; and providing reasonable assurance that unauthorized acquisition, use or disposition of company assets that could have a material effect on our financial statements would be prevented or detected on a timely basis. Because of its inherent limitations, internal control over financial reporting is not intended to provide absolute assurance that a misstatement of our financial statements would be prevented or detected.
Management conducted an evaluation of the effectiveness of our internal control over financial reporting based on the framework in Internal Control — Integrated Framework 1992 issued by the Committee of Sponsoring Organizations of the Treadway Commission. Based on this evaluation, management concluded that the Company’sCompany's internal control over financial reporting was effective as of August 31, 2010.2013. Deloitte & Touche LLP has audited the effectiveness of the Company’sCompany's internal control over financial reporting; their attestation report is included on page 4442 of this Form 10-K.
43
REPORT OF INDEPENDENT REGISTERED PUBLIC ACCOUNTING FIRM
To the Board of Directors and Stockholders of
Commercial Metals Company
Irving, Texas
We have audited the internal control over financial reporting of Commercial Metals Company and subsidiaries (the “Company”"Company") as of August 31, 2010,2013, based on criteria established inInternal Control —- Integrated Framework 1992 issued by the Committee of Sponsoring Organizations of the Treadway Commission. The Company’sCompany's management is responsible for maintaining effective internal control over financial reporting and for its assessment of the effectiveness of internal control over financial reporting, included in the accompanying Report of Management on Internal Control Over Financial Reporting. Our responsibility is to express an opinion on the Company’sCompany's internal control over financial reporting based on our audit.
We conducted our audit in accordance with the standards of the Public Company Accounting Oversight Board (United States). Those standards require that we plan and perform the audit to obtain reasonable assurance about whether effective internal control over financial reporting was maintained in all material respects. Our audit included obtaining an understanding of internal control over financial reporting, assessing the risk that a material weakness exists, testing and evaluating the design and operating effectiveness of internal control based on the assessed risk, and performing such other procedures as we considered necessary in the circumstances. We believe that our audit provides a reasonable basis for our opinion.
A company’scompany's internal control over financial reporting is a process designed by, or under the supervision of, the company’scompany's principal executive and principal financial officers, or persons performing similar functions, and effected by the company’scompany's board of directors, management, and other personnel to provide reasonable assurance regarding the reliability of financial reporting and the preparation of financial statements for external purposes in accordance with generally accepted accounting principles. A company’scompany's internal control over financial reporting includes those policies and procedures that (1) pertain to the maintenance of records that, in reasonable detail, accurately and fairly reflect the transactions and dispositions of the assets of the company; (2) provide reasonable assurance that transactions are recorded as necessary to permit preparation of financial statements in accordance with generally accepted accounting principles, and that receipts and expenditures of the company are being made only in accordance with authorizations of management and directors of the company; and (3) provide reasonable assurance regarding prevention or timely detection of unauthorized acquisition, use, or disposition of the company’scompany's assets that could have a material effect on the financial statements.
Because of the inherent limitations of internal control over financial reporting, including the possibility of collusion or improper management override of controls, material misstatements due to error or fraud may not be prevented or detected on a timely basis. Also, projections of any evaluation of the effectiveness of the internal control over financial reporting to future periods are subject to the risk that the controls may become inadequate because of changes in conditions, or that the degree of compliance with the policies or procedures may deteriorate.
In our opinion, the Company maintained, in all material respects, effective internal control over financial reporting as of August 31, 2010,2013, based on the criteria established inInternal Control —- Integrated Framework 1992 issued by the Committee of Sponsoring Organizations of the Treadway Commission.
We have also audited, in accordance with the standards of the Public Company Accounting Oversight Board (United States), the consolidated financial statements and financial statement schedule as of and for the year ended August 31, 20102013 of the Company and our report dated October 29, 201028, 2013 expressed an unqualified opinion on those financial statements and financial statement schedule and included an explanatory paragraph regarding the Company’s discontinued operations.schedule.
/s/ Deloitte & Touche LLP
Dallas, Texas
October 29, 201028, 2013
44
42
REPORT OF INDEPENDENT REGISTERED PUBLIC ACCOUNTING FIRM
To the Board of Directors and Stockholders of
Commercial Metals Company
Irving, Texas
We have audited the accompanying consolidated balance sheets of Commercial Metals Company and subsidiaries (the “Company”"Company") as of August 31, 20102013 and 2009,2012, and the related consolidated statements of operations, stockholders’comprehensive income (loss), stockholders' equity, and cash flows for each of the three years in the period ended August 31, 2010.2013. Our audits also included the financial statement schedule listed in the Index at Item 15. These financial statements and financial statement schedule are the responsibility of the Company’sCompany's management. Our responsibility is to express an opinion on these financial statements and financial statement schedule based on our audits.
We conducted our audits in accordance with the standards of the Public Company Accounting Oversight Board (United States). Those standards require that we plan and perform the audit to obtain reasonable assurance about whether the financial statements are free of material misstatement. An audit includes examining, on a test basis, evidence supporting the amounts and disclosures in the financial statements. An audit also includes assessing the accounting principles used and significant estimates made by management, as well as evaluating the overall financial statement presentation. We believe that our audits provide a reasonable basis for our opinion.
In our opinion, such consolidated financial statements present fairly, in all material respects, the financial position of Commercial Metals Company and subsidiaries at August 31, 20102013 and 2009,2012, and the results of their operations and their cash flows for each of the three years in the period ended August 31, 2010,2013, in conformity with accounting principles generally accepted in the United States of America. Also, in our opinion, such financial statement schedule, when considered in relation to the basic consolidated financial statements taken as a whole, presents fairly, in all material respects, the information set forth therein.
We have also audited, in accordance with the standards of the Public Company Accounting Oversight Board (United States), the Company’sCompany's internal control over financial reporting as of August 31, 2010,2013, based on the criteria established inInternal Control—IntegratedControl-Integrated Framework 1992 issued by the Committee of Sponsoring Organizations of the Treadway Commission and our report dated October 29, 201028, 2013 expressed an unqualified opinion on the Company’sCompany's internal control over financial reporting.
/s/ Deloitte & Touche LLP
Dallas, Texas
October 29, 201028, 2013
45
| Year ended August 31, | ||||||||||||
| (in thousands, except share data) | 2010 | 2009 | 2008 | |||||||||
| Net sales | $ | 6,306,102 | $ | 6,409,376 | $ | 9,896,637 | ||||||
| Costs and expenses: | ||||||||||||
| Cost of goods sold | 5,911,065 | 5,712,347 | 8,828,635 | |||||||||
| Selling, general and administrative expenses | 524,135 | 618,131 | 652,290 | |||||||||
| Interest expense | 75,508 | 76,964 | 58,254 | |||||||||
| 6,510,708 | 6,407,442 | 9,539,179 | ||||||||||
| Earnings (loss) from continuing operations before taxes | (204,606 | ) | 1,934 | 357,458 | ||||||||
| Income taxes (benefit) | (38,118 | ) | 747 | 112,275 | ||||||||
| Earnings (loss) from continuing operations | (166,488 | ) | 1,187 | 245,183 | ||||||||
| Earnings (loss) from discontinued operations before taxes | (59,762 | ) | 31,991 | (20,148 | ) | |||||||
| Income taxes (benefit) | (21,142 | ) | 12,926 | (7,469 | ) | |||||||
| Earnings (loss) from discontinued operations | (38,620 | ) | 19,065 | (12,679 | ) | |||||||
| Net earnings (loss) | (205,108 | ) | 20,252 | 232,504 | ||||||||
| Less net earnings (loss) attributable to noncontrolling interests | 236 | (550 | ) | 538 | ||||||||
| Net earnings (loss) attributable to CMC | $ | (205,344 | ) | $ | 20,802 | $ | 231,966 | |||||
| Basic earnings (loss) per share attributable to CMC: | ||||||||||||
| Earnings (loss) from continuing operations | $ | (1.47 | ) | $ | 0.02 | $ | 2.13 | |||||
| Earnings (loss) from discontinued operations | (0.34 | ) | 0.17 | (0.11 | ) | |||||||
| Net earnings (loss) | $ | (1.81 | ) | $ | 0.19 | $ | 2.02 | |||||
| Diluted earnings (loss) per share attributable to CMC: | ||||||||||||
| Earnings (loss) from continuing operations | $ | (1.47 | ) | $ | 0.02 | $ | 2.08 | |||||
| Earnings (loss) from discontinued operations | (0.34 | ) | 0.16 | (0.11 | ) | |||||||
| Net earnings (loss) | $ | (1.81 | ) | $ | 0.18 | $ | 1.97 | |||||
COMMERCIAL METALS COMPANY AND SUBSIDIARIES CONSOLIDATED STATEMENTS OF OPERATIONS | |||||||||||
| Year Ended August 31, | |||||||||||
| (in thousands, except share data) | 2013 | 2012 | 2011 | ||||||||
| Net sales | $ | 6,889,575 | $ | 7,656,375 | $ | 7,666,773 | |||||
| Costs and expenses: | |||||||||||
| Cost of goods sold | 6,227,238 | 6,939,748 | 7,037,446 | ||||||||
| Selling, general and administrative expenses | 468,611 | 481,746 | 508,916 | ||||||||
| Impairment of assets | 17,270 | 607 | 24,466 | ||||||||
| Gain on sale of cost method investment | (26,088 | ) | — | — | |||||||
| Interest expense | 69,608 | 69,487 | 69,814 | ||||||||
| 6,756,639 | 7,491,588 | 7,640,642 | |||||||||
| Earnings from continuing operations before income taxes | 132,936 | 164,787 | 26,131 | ||||||||
| Income taxes (benefit) | 57,979 | (45,762 | ) | 14,592 | |||||||
| Earnings from continuing operations | 74,957 | 210,549 | 11,539 | ||||||||
| Earnings (loss) from discontinued operations before income taxes | 3,672 | (11,906 | ) | (139,195 | ) | ||||||
| Income taxes (benefit) | 1,310 | (8,847 | ) | 1,748 | |||||||
| Earnings (loss) from discontinued operations | 2,362 | (3,059 | ) | (140,943 | ) | ||||||
| Net earnings (loss) | 77,319 | 207,490 | (129,404 | ) | |||||||
| Less net earnings attributable to noncontrolling interests | 4 | 6 | 213 | ||||||||
| Net earnings (loss) attributable to CMC | $ | 77,315 | $ | 207,484 | $ | (129,617 | ) | ||||
| Basic earnings (loss) per share attributable to CMC: | |||||||||||
| Earnings from continuing operations | $ | 0.64 | $ | 1.82 | $ | 0.10 | |||||
| Earnings (loss) from discontinued operations | 0.02 | (0.03 | ) | (1.23 | ) | ||||||
| Net earnings (loss) | $ | 0.66 | $ | 1.79 | $ | (1.13 | ) | ||||
| Diluted earnings (loss) per share attributable to CMC: | |||||||||||
| Earnings from continuing operations | $ | 0.64 | $ | 1.80 | $ | 0.09 | |||||
| Earnings (loss) from discontinued operations | 0.02 | (0.02 | ) | (1.21 | ) | ||||||
| Net earnings (loss) | $ | 0.66 | $ | 1.78 | $ | (1.12 | ) | ||||
See notes to consolidated financial statements.
46
| August 31, | ||||||||
| (in thousands, except share data) | 2010 | 2009 | ||||||
| Assets | ||||||||
| Current assets: | ||||||||
| Cash and cash equivalents | $ | 399,313 | $ | 405,603 | ||||
| Accounts receivable (less allowance for doubtful accounts of $29,721 and $42,134) | 824,339 | 731,282 | ||||||
| Inventories | 674,680 | 678,541 | ||||||
| Other | 276,874 | 182,126 | ||||||
| Total current assets | 2,175,206 | 1,997,552 | ||||||
| Property, plant and equipment: | ||||||||
| Land | 94,426 | 87,530 | ||||||
| Buildings and improvements | 540,285 | 502,031 | ||||||
| Equipment | 1,649,723 | 1,395,104 | ||||||
| Construction in process | 56,124 | 380,185 | ||||||
| 2,340,558 | 2,364,850 | |||||||
| Less accumulated depreciation and amortization | (1,108,290 | ) | (1,013,461 | ) | ||||
| 1,232,268 | 1,351,389 | |||||||
| Goodwill | 71,580 | 74,236 | ||||||
| Other assets | 227,099 | 264,379 | ||||||
| Total assets | $ | 3,706,153 | $ | 3,687,556 | ||||
| Liabilities and stockholders’ equity | ||||||||
| Current liabilities: | ||||||||
| Accounts payable-trade | $ | 504,388 | $ | 344,355 | ||||
| Accounts payable-documentary letters of credit | 226,633 | 109,210 | ||||||
| Accrued expenses and other payables | 324,897 | 327,212 | ||||||
| Notes payable | 6,453 | 1,759 | ||||||
| Commercial paper | 10,000 | — | ||||||
| Current maturities of long-term debt | 30,588 | 32,802 | ||||||
| Total current liabilities | 1,102,959 | 815,338 | ||||||
| Deferred income taxes | 43,668 | 44,564 | ||||||
| Other long-term liabilities | 108,870 | 113,850 | ||||||
| Long-term debt | 1,197,282 | 1,181,740 | ||||||
| Total liabilities | 2,452,779 | 2,155,492 | ||||||
| Commitments and contingencies | ||||||||
| CMC stockholders’ equity | ||||||||
| Preferred stock | — | — | ||||||
| Common stock, par value $0.01 per share; authorized 200,000,000 shares; issued 129,060,664 shares; outstanding 114,325,349 and 112,573,433 shares | 1,290 | 1,290 | ||||||
| Additional paid-in capital | 373,308 | 380,737 | ||||||
| Accumulated other comprehensive income (loss) | (12,526 | ) | 34,257 | |||||
| Retained earnings | 1,178,372 | 1,438,205 | ||||||
| 1,540,444 | 1,854,489 | |||||||
| Less treasury stock 14,735,315 and 16,487,231 shares at cost | (289,708 | ) | (324,796 | ) | ||||
| Stockholders’ equity attributable to CMC | 1,250,736 | 1,529,693 | ||||||
| Stockholders’ equity attributable to noncontrolling interests | 2,638 | 2,371 | ||||||
| Total equity | 1,253,374 | 1,532,064 | ||||||
| Total liabilities and stockholders’ equity | $ | 3,706,153 | $ | 3,687,556 | ||||
COMMERCIAL METALS COMPANY AND SUBSIDIARIES CONSOLIDATED STATEMENTS OF COMPREHENSIVE INCOME (LOSS) | |||||||||||
| Year Ended August 31, | |||||||||||
| (in thousands) | 2013 | 2012 | 2011 | ||||||||
| Net earnings (loss) | $ | 77,319 | $ | 207,490 | $ | (129,404 | ) | ||||
| Other comprehensive income (loss), net of income taxes: | |||||||||||
| Foreign currency translation adjustment and other: | |||||||||||
| Foreign currency translation adjustment and other during the year, net of income taxes of $(925), $(41,752) and $39,301 | (10,108 | ) | (71,631 | ) | 72,987 | ||||||
| Reclassification for translation gain realized upon sale of investments in foreign entities, net of income taxes of $0, $664 and $0 | — | (4,675 | ) | — | |||||||
| Foreign currency translation adjustment and other, net of income taxes of $(925), $(41,088) and $39,301 | (10,108 | ) | (76,306 | ) | 72,987 | ||||||
| Net unrealized gain (loss) on derivatives: | |||||||||||
| Unrealized holding gain (loss), net of income taxes of $2, $(604) and $135 | 221 | (1,545 | ) | 823 | |||||||
| Reclassification for loss (gain) included in net earnings, net of income taxes of $(128), $132 and $(254) | (337 | ) | 578 | (1,018 | ) | ||||||
| Net unrealized loss on derivatives, net of income taxes of $(126), $(472) and $(119) | (116 | ) | (967 | ) | (195 | ) | |||||
| Defined benefit obligation: | |||||||||||
| Net loss, net of income taxes of $(51), $(425) and $(48) | (168 | ) | (410 | ) | (1,118 | ) | |||||
| Prior service credit (cost), net of income taxes of $0, $0 and $(9) | — | — | (34 | ) | |||||||
| Amortization of net loss, net of income taxes of $45, $40 and $74 | 207 | 188 | 261 | ||||||||
| Amortization of prior service credit, net of income taxes of $(38), $(2) and $(2) | (170 | ) | (15 | ) | (18 | ) | |||||
| Amortization of transition asset, net of income taxes of $0, $0 and $13 | — | — | 116 | ||||||||
| Adjustment from plan changes, net of income taxes of $309, $(26) and $0 | 1,315 | (99 | ) | — | |||||||
| Defined benefit obligation, net of income taxes of $265, $(413) and $28 | 1,184 | (336 | ) | (793 | ) | ||||||
| Other comprehensive income (loss) | (9,040 | ) | (77,609 | ) | 71,999 | ||||||
| Comprehensive income (loss) | $ | 68,279 | $ | 129,881 | $ | (57,405 | ) | ||||
See notes to consolidated financial statements.
47
| Year ended August 31, | ||||||||||||
| (in thousands) | 2010 | 2009 | 2008 | |||||||||
| Cash flows from (used by) operating activities: | ||||||||||||
| Net earnings (loss) | $ | (205,108 | ) | $ | 20,252 | $ | 232,504 | |||||
| Adjustments to reconcile net earnings (loss) to cash flows from (used by) operating activities: | ||||||||||||
| Depreciation and amortization | 168,934 | 154,679 | 135,069 | |||||||||
| Provision for losses (recoveries) on receivables, net | (2,582 | ) | 33,733 | 4,478 | ||||||||
| Share-based compensation | 13,132 | 17,475 | 18,996 | |||||||||
| Deferred income taxes | 59,286 | (49,066 | ) | (4,379 | ) | |||||||
| Tax benefits from stock plans | (4,033 | ) | (926 | ) | (10,982 | ) | ||||||
| Net (gain) loss on sale of assets and other | (4,740 | ) | 2,795 | 749 | ||||||||
| Write-down of inventory | 53,203 | 127,056 | — | |||||||||
| Asset impairment | 35,041 | 8,468 | 1,004 | |||||||||
| Changes in operating assets and liabilities, net of acquisitions: | ||||||||||||
| Decrease (increase) in accounts receivable | (106,402 | ) | 692,386 | (287,052 | ) | |||||||
| Accounts receivable sold (repurchased), net | 10,239 | (129,227 | ) | 45,348 | ||||||||
| Decrease (increase) in inventories | (60,612 | ) | 533,896 | (414,556 | ) | |||||||
| Decrease (increase) in other assets | (94,313 | ) | 94,183 | (166,528 | ) | |||||||
| Increase (decrease) in accounts payable, accrued expenses, other payables and income taxes | 186,952 | (691,912 | ) | 395,987 | ||||||||
| Increase (decrease) in other long-term liabilities | (4,087 | ) | (7,256 | ) | 5,906 | |||||||
| Net cash flows from (used by) operating activities | 44,910 | 806,536 | (43,456 | ) | ||||||||
| Cash flows from (used by) investing activities: | ||||||||||||
| Capital expenditures | (127,121 | ) | (369,694 | ) | (355,041 | ) | ||||||
| Proceeds from the sale of property, plant and equipment and other | 22,887 | 2,620 | 1,791 | |||||||||
| Acquisitions, net of cash acquired | (2,448 | ) | (906 | ) | (228,591 | ) | ||||||
| Increase in deposit for letters of credit | (26,930 | ) | — | — | ||||||||
| Net cash flows used by investing activities | (133,612 | ) | (367,980 | ) | (581,841 | ) | ||||||
| Cash flows from (used by) financing activities: | ||||||||||||
| Increase (decrease) in documentary letters of credit | 117,423 | (83,282 | ) | 39,061 | ||||||||
| Short-term borrowings, net change | 14,636 | (26,244 | ) | (1,427 | ) | |||||||
| Repayments on long-term debt | (29,939 | ) | (132,496 | ) | (6,053 | ) | ||||||
| Proceeds from issuance of long-term debt | 22,438 | 64,014 | 596,669 | |||||||||
| Stock issued under incentive and purchase plans | 10,494 | 3,284 | 8,910 | |||||||||
| Treasury stock acquired | — | (18,514 | ) | (172,312 | ) | |||||||
| Cash dividends | (54,489 | ) | (54,139 | ) | (52,061 | ) | ||||||
| Tax benefits from stock plans | 4,033 | 926 | 10,982 | |||||||||
| Contribution from noncontrolling interests | 21 | — | — | |||||||||
| Net cash flows from (used by) financing activities | 84,617 | (246,451 | ) | 423,769 | ||||||||
| Effect of exchange rate changes on cash | (2,205 | ) | (5,528 | ) | 1,279 | |||||||
| Increase (decrease) in cash and cash equivalents | (6,290 | ) | 186,577 | (200,249 | ) | |||||||
| Cash and cash equivalents at beginning of year | 405,603 | 219,026 | 419,275 | |||||||||
| Cash and cash equivalents at end of year | $ | 399,313 | $ | 405,603 | $ | 219,026 | ||||||
COMMERCIAL METALS COMPANY AND SUBSIDIARIES CONSOLIDATED BALANCE SHEETS | |||||||
| August 31, | |||||||
| (in thousands, except share data) | 2013 | 2012 | |||||
| Assets | |||||||
| Current assets: | |||||||
| Cash and cash equivalents | $ | 378,770 | $ | 262,422 | |||
| Accounts receivable (less allowance for doubtful accounts of $10,042 and $9,480) | 989,694 | 958,364 | |||||
| Inventories, net | 757,417 | 807,923 | |||||
| Other | 240,314 | 211,122 | |||||
| Total current assets | 2,366,195 | 2,239,831 | |||||
| Property, plant and equipment: | |||||||
| Land | 80,764 | 79,123 | |||||
| Buildings and improvements | 486,494 | 483,708 | |||||
| Equipment | 1,666,250 | 1,656,328 | |||||
| Construction in process | 18,476 | 41,036 | |||||
| 2,251,984 | 2,260,195 | ||||||
| Less accumulated depreciation and amortization | (1,311,747 | ) | (1,265,891 | ) | |||
| 940,237 | 994,304 | ||||||
| Goodwill | 69,579 | 76,897 | |||||
| Other assets | 118,790 | 130,214 | |||||
| Total assets | $ | 3,494,801 | $ | 3,441,246 | |||
| Liabilities and stockholders’ equity | |||||||
| Current liabilities: | |||||||
| Accounts payable-trade | $ | 342,678 | $ | 433,132 | |||
| Accounts payable-documentary letters of credit | 112,281 | 95,870 | |||||
| Accrued expenses and other payables | 314,949 | 343,337 | |||||
| Notes payable | 5,973 | 24,543 | |||||
| Current maturities of long-term debt | 5,228 | 4,252 | |||||
| Total current liabilities | 781,109 | 901,134 | |||||
| Deferred income taxes | 46,558 | 20,271 | |||||
| Other long-term liabilities | 118,165 | 116,261 | |||||
| Long-term debt | 1,278,814 | 1,157,073 | |||||
| Total liabilities | 2,224,646 | 2,194,739 | |||||
| Commitments and contingencies | |||||||
| Stockholders’ equity: | |||||||
| Preferred stock | — | — | |||||
| Common stock, par value $0.01 per share; authorized 200,000,000 shares; issued 129,060,664 shares; outstanding 117,010,990 and 116,351,424 shares | 1,290 | 1,290 | |||||
| Additional paid-in capital | 363,772 | 365,778 | |||||
| Accumulated other comprehensive loss | (27,176 | ) | (18,136 | ) | |||
| Retained earnings | 1,166,732 | 1,145,445 | |||||
| Less treasury stock, 12,049,674 and 12,709,240 shares at cost | (234,619 | ) | (248,009 | ) | |||
| Stockholders’ equity attributable to CMC | 1,269,999 | 1,246,368 | |||||
| Stockholders’ equity attributable to noncontrolling interests | 156 | 139 | |||||
| Total equity | 1,270,155 | 1,246,507 | |||||
| Total liabilities and stockholders’ equity | $ | 3,494,801 | $ | 3,441,246 | |||
See notes to consolidated financial statements.
48
| Accumulated | ||||||||||||||||||||||||||||||||||||
| Common Stock | Additional | Other | Treasury Stock | Non- | ||||||||||||||||||||||||||||||||
| Number of | Paid-In | Comprehensive | Retained | Number of | Controlling | |||||||||||||||||||||||||||||||
| (in thousands, except share data) | Shares | Amount | Capital | Income (Loss) | Earnings | Shares | Amount | Interests | Total | |||||||||||||||||||||||||||
| Balance, September 1, 2007 | 129,060,664 | $ | 1,290 | $ | 356,983 | $ | 64,452 | $ | 1,296,631 | (10,494,283 | ) | $ | (170,789 | ) | $ | 2,900 | $ | 1,551,467 | ||||||||||||||||||
| FIN 48 adjustment | (4,994 | ) | (4,994 | ) | ||||||||||||||||||||||||||||||||
| Comprehensive income (loss): | ||||||||||||||||||||||||||||||||||||
| Net earnings | 231,966 | 538 | 232,504 | |||||||||||||||||||||||||||||||||
| Other comprehensive income (loss): | ||||||||||||||||||||||||||||||||||||
| Foreign currency translation adjustment, net of taxes ($5,179) | 57,245 | 205 | 57,450 | |||||||||||||||||||||||||||||||||
| Unrealized loss on derivatives, net of taxes ($1,743) | (7,866 | ) | (7,866 | ) | ||||||||||||||||||||||||||||||||
| Defined benefit obligation, net of taxes ($366) | (1,050 | ) | (1,050 | ) | ||||||||||||||||||||||||||||||||
| Comprehensive income | 281,038 | |||||||||||||||||||||||||||||||||||
| Cash dividends | (52,061 | ) | (52,061 | ) | ||||||||||||||||||||||||||||||||
| Treasury stock acquired | (6,212,238 | ) | (172,312 | ) | (172,312 | ) | ||||||||||||||||||||||||||||||
| Issuance of stock under incentive and purchase plans | (11,921 | ) | 1,277,417 | 20,831 | 8,910 | |||||||||||||||||||||||||||||||
| Issuance of restricted stock | (3,315 | ) | 163,770 | 3,315 | ||||||||||||||||||||||||||||||||
| Stock-based compensation | 19,184 | (18,178 | ) | (188 | ) | 18,996 | ||||||||||||||||||||||||||||||
| Tax benefits from stock plans | 10,982 | 10,982 | ||||||||||||||||||||||||||||||||||
| Balance, August 31, 2008 | 129,060,664 | $ | 1,290 | $ | 371,913 | $ | 112,781 | $ | 1,471,542 | (15,283,512 | ) | $ | (319,143 | ) | $ | 3,643 | $ | 1,642,026 | ||||||||||||||||||
| Comprehensive income (loss): | ||||||||||||||||||||||||||||||||||||
| Net earnings | 20,802 | (550 | ) | 20,252 | ||||||||||||||||||||||||||||||||
| Other comprehensive income (loss): | ||||||||||||||||||||||||||||||||||||
| Foreign currency translation adjustment | (89,110 | ) | (722 | ) | (89,832 | ) | ||||||||||||||||||||||||||||||
| Unrealized gain on derivatives, net of taxes ($2,339) | 11,034 | 11,034 | ||||||||||||||||||||||||||||||||||
| Defined benefit obligation, net of taxes ($90) | (448 | ) | (448 | ) | ||||||||||||||||||||||||||||||||
| Comprehensive loss | (58,994 | ) | ||||||||||||||||||||||||||||||||||
| Cash dividends | (54,139 | ) | (54,139 | ) | ||||||||||||||||||||||||||||||||
| Treasury stock acquired | (1,752,900 | ) | (18,514 | ) | (18,514 | ) | ||||||||||||||||||||||||||||||
| Issuance of stock under incentive and purchase plans | (9,776 | ) | 561,800 | 13,060 | 3,284 | |||||||||||||||||||||||||||||||
| Stock-based compensation | 17,674 | (12,619 | ) | (199 | ) | 17,475 | ||||||||||||||||||||||||||||||
| Tax benefits from stock plans | 926 | 926 | ||||||||||||||||||||||||||||||||||
| Balance, August 31, 2009 | 129,060,664 | $ | 1,290 | $ | 380,737 | $ | 34,257 | $ | 1,438,205 | (16,487,231 | ) | $ | (324,796 | ) | $ | 2,371 | $ | 1,532,064 | ||||||||||||||||||
| Comprehensive income (loss): | ||||||||||||||||||||||||||||||||||||
| Net earnings (loss) | (205,344 | ) | 236 | (205,108 | ) | |||||||||||||||||||||||||||||||
| Other comprehensive income (loss): | ||||||||||||||||||||||||||||||||||||
| Foreign currency translation adjustment | (45,607 | ) | 10 | (45,597 | ) | |||||||||||||||||||||||||||||||
| Unrealized loss on derivatives, net of taxes ($150) | (79 | ) | (79 | ) | ||||||||||||||||||||||||||||||||
| Defined benefit obligation, net of taxes ($620) | (1,097 | ) | (1,097 | ) | ||||||||||||||||||||||||||||||||
| Comprehensive loss | (251,881 | ) | ||||||||||||||||||||||||||||||||||
| Cash dividends | (54,489 | ) | (54,489 | ) | ||||||||||||||||||||||||||||||||
| Issuance of stock under incentive and purchase plans | (24,860 | ) | 1,766,481 | 35,354 | 10,494 | |||||||||||||||||||||||||||||||
| Stock-based compensation | 13,398 | (14,565 | ) | (266 | ) | 13,132 | ||||||||||||||||||||||||||||||
| Tax benefits from stock plans | 4,033 | 4,033 | ||||||||||||||||||||||||||||||||||
| Contribution from noncontrolling interests | 21 | 21 | ||||||||||||||||||||||||||||||||||
| Balance, August 31, 2010 | 129,060,664 | $ | 1,290 | $ | 373,308 | $ | (12,526 | ) | $ | 1,178,372 | (14,735,315 | ) | $ | (289,708 | ) | $ | 2,638 | $ | 1,253,374 | |||||||||||||||||
COMMERCIAL METALS COMPANY AND SUBSIDIARIES CONSOLIDATED STATEMENTS OF CASH FLOWS | |||||||||||
| Year Ended August 31, | |||||||||||
| (in thousands) | 2013 | 2012 | 2011 | ||||||||
| Cash flows from (used by) operating activities: | |||||||||||
| Net earnings (loss) | $ | 77,319 | $ | 207,490 | $ | (129,404 | ) | ||||
| Adjustments to reconcile net earnings (loss) to cash flows from (used by) operating activities: | |||||||||||
| Depreciation and amortization | 136,548 | 137,310 | 159,576 | ||||||||
| Provision for losses (recoveries) on receivables, net | 4,430 | (2,463 | ) | 306 | |||||||
| Share-based compensation | 18,693 | 13,125 | 12,893 | ||||||||
| Amortization of interest rate swaps termination gain | (12,470 | ) | (5,815 | ) | — | ||||||
| Loss on debt extinguishment | 4,758 | — | — | ||||||||
| Deferred income taxes (benefit) | 54,655 | (59,999 | ) | (19,856 | ) | ||||||
| Tax expense (benefit) from stock plans | 1,444 | (1,968 | ) | (2,355 | ) | ||||||
| Net gain on sale of assets and other | (25,371 | ) | (11,932 | ) | (1,315 | ) | |||||
| Write-down of inventory | 3,003 | 13,917 | 25,503 | ||||||||
| Asset impairments | 17,270 | 3,316 | 120,145 | ||||||||
| Changes in operating assets and liabilities, net of acquisitions: | |||||||||||
| Accounts receivable | 11,065 | 68,260 | (168,779 | ) | |||||||
| Accounts receivable sold (repurchased), net | (80,580 | ) | (77,116 | ) | 78,297 | ||||||
| Inventories | 26,459 | 53,449 | (200,204 | ) | |||||||
| Other assets | 2,894 | 5,001 | 73,382 | ||||||||
| Accounts payable, accrued expenses and other payables | (87,375 | ) | (157,025 | ) | 82,642 | ||||||
| Other long-term liabilities | (5,010 | ) | 10,443 | (3,084 | ) | ||||||
| Net cash flows from operating activities | 147,732 | 195,993 | 27,747 | ||||||||
| Cash flows from (used by) investing activities: | |||||||||||
| Capital expenditures | (89,035 | ) | (113,853 | ) | (73,215 | ) | |||||
| Proceeds from the sale of property, plant and equipment and other | 13,904 | 55,360 | 53,394 | ||||||||
| Proceeds from the sale of equity method investments | — | — | 10,802 | ||||||||
| Proceeds from the sale of cost method investment | 28,995 | — | — | ||||||||
| Acquisitions, net of cash acquired | — | — | (48,386 | ) | |||||||
| Decrease (increase) in deposit for letters of credit | — | 31,053 | (4,123 | ) | |||||||
| Net cash flows used by investing activities | (46,136 | ) | (27,440 | ) | (61,528 | ) | |||||
| Cash flows from (used by) financing activities: | |||||||||||
| Increase (decrease) in documentary letters of credit | (6,221 | ) | (74,493 | ) | (55,950 | ) | |||||
| Short-term borrowings, net change | (19,524 | ) | 18,607 | (10,253 | ) | ||||||
| Repayments on long-term debt | (204,856 | ) | (64,801 | ) | (33,577 | ) | |||||
| Proceeds from termination of interest rate swaps | — | 52,733 | — | ||||||||
| Proceeds from issuance of long-term debt | 330,000 | — | — | ||||||||
| Payments for debt issuance costs | (4,684 | ) | — | — | |||||||
| Debt extinguishment costs | (4,557 | ) | — | — | |||||||
| Increase in restricted cash | (18,620 | ) | — | — | |||||||
| Stock issued under incentive and purchase plans, net of forfeitures | 951 | (81 | ) | 9,615 | |||||||
| Cash dividends | (56,028 | ) | (55,617 | ) | (55,177 | ) | |||||
| Tax benefit (expense) from stock plans | (1,444 | ) | 1,968 | 2,355 | |||||||
| Contribution from (purchase of) noncontrolling interests | 13 | (55 | ) | (4,027 | ) | ||||||
| Net cash flows from (used by) financing activities | 15,030 | (121,739 | ) | (147,014 | ) | ||||||
| Effect of exchange rate changes on cash | (278 | ) | (6,782 | ) | 3,872 | ||||||
| Increase (decrease) in cash and cash equivalents | 116,348 | 40,032 | (176,923 | ) | |||||||
| Cash and cash equivalents at beginning of year | 262,422 | 222,390 | 399,313 | ||||||||
| Cash and cash equivalents at end of year | $ | 378,770 | $ | 262,422 | $ | 222,390 | |||||
See notes to consolidated financial statements.
49
COMMERCIAL METALS COMPANY AND SUBSIDIARIES CONSOLIDATED STATEMENTS OF STOCKHOLDERS’ EQUITY | |||||||||||||||||||||||||
| Common Stock | Additional | Accumulated Other | Treasury Stock | Non- | |||||||||||||||||||||
| (in thousands, except share data) | Number of Shares | Amount | Paid-In Capital | Comprehensive Income (Loss) | Retained Earnings | Number of Shares | Amount | Controlling Interests | Total | ||||||||||||||||
| Balance at September 1, 2010 | 129,060,664 | $ | 1,290 | $ | 373,308 | $ | (12,526 | ) | $ | 1,178,372 | (14,735,315 | ) | $ | (289,708 | ) | $ | 2,638 | $ | 1,253,374 | ||||||
| Net earnings (loss) | (129,617 | ) | 213 | (129,404 | ) | ||||||||||||||||||||
| Other comprehensive income | 71,999 | 71,999 | |||||||||||||||||||||||
| Cash dividends | (55,177 | ) | (55,177 | ) | |||||||||||||||||||||
| Issuance of stock under incentive and purchase plans, net of forfeitures | (14,561 | ) | 1,208,414 | 24,176 | 9,615 | ||||||||||||||||||||
| Share-based compensation | 11,913 | 11,913 | |||||||||||||||||||||||
| Tax benefits from stock plans | 2,355 | 2,355 | |||||||||||||||||||||||
| Purchase of noncontrolling interest | (1,399 | ) | (2,628 | ) | (4,027 | ) | |||||||||||||||||||
| Balance at August 31, 2011 | 129,060,664 | $ | 1,290 | $ | 371,616 | $ | 59,473 | $ | 993,578 | (13,526,901 | ) | $ | (265,532 | ) | $ | 223 | $ | 1,160,648 | |||||||
| Net earnings | 207,484 | 6 | 207,490 | ||||||||||||||||||||||
| Other comprehensive loss | (77,609 | ) | (77,609 | ) | |||||||||||||||||||||
| Cash dividends | (55,617 | ) | (55,617 | ) | |||||||||||||||||||||
| Issuance of stock under incentive and purchase plans, net of forfeitures | (17,604 | ) | 817,661 | 17,523 | (81 | ) | |||||||||||||||||||
| Share-based compensation | 9,763 | 9,763 | |||||||||||||||||||||||
| Tax benefits from stock plans | 1,968 | 1,968 | |||||||||||||||||||||||
| Purchase of noncontrolling interests | 35 | (90 | ) | (55 | ) | ||||||||||||||||||||
| Balance at August 31, 2012 | 129,060,664 | $ | 1,290 | $ | 365,778 | $ | (18,136 | ) | $ | 1,145,445 | (12,709,240 | ) | $ | (248,009 | ) | $ | 139 | $ | 1,246,507 | ||||||
| Net earnings | 77,315 | 4 | 77,319 | ||||||||||||||||||||||
| Other comprehensive loss: | (9,040 | ) | (9,040 | ) | |||||||||||||||||||||
| Cash dividends | (56,028 | ) | (56,028 | ) | |||||||||||||||||||||
| Issuance of stock under incentive and purchase plans, net of forfeitures | (12,439 | ) | 659,566 | 13,390 | 951 | ||||||||||||||||||||
| Share-based compensation | 11,877 | 11,877 | |||||||||||||||||||||||
| Tax benefits from stock plans | (1,444 | ) | (1,444 | ) | |||||||||||||||||||||
| Purchase of noncontrolling interests | 13 | 13 | |||||||||||||||||||||||
| Balance at August 31, 2013 | 129,060,664 | $ | 1,290 | $ | 363,772 | $ | (27,176 | ) | $ | 1,166,732 | (12,049,674 | ) | $ | (234,619 | ) | $ | 156 | $ | 1,270,155 | ||||||
COMMERCIAL METALS COMPANY AND SUBSIDIARIES
NOTES TO CONSOLIDATED FINANCIAL STATEMENTS
NOTE 1. NATURE OF OPERATIONS
Nature of Operations Through its global operations and marketing offices, Commercial Metals Company ("CMC," and together with its consolidated subsidiaries, the "Company") recycles ferrous and nonferrous scrap metal, operates steel mills, commonly referred to as "minimills", and fabrication shops and trades and distributes steel and nonferrous metal products and other industrial products worldwide.
The Company has five business segments across two geographic divisions, the CMC Americas Division and the CMC International Division. The CMC Americas Division includes three segments: Americas Recycling, Americas Mills and Americas Fabrication. The CMC International Division includes two segments: International Mill and International Marketing and Distribution.
Americas Recycling The Americas Recycling segment processes scrap metals for use as a raw material by manufacturers of new metal products. This segment sells scrap metals to steel mills and foundries, aluminum sheet and ingot manufacturers, brass and bronze ingot makers, copper refineries and mills, secondary lead smelters, specialty steel mills, high temperature alloy manufacturers and other consumers.
Americas Mills The Americas Mills segment manufactures finished long steel products including rebar, merchant bar, light structural, some special bar quality (SBQ) and other special sections as well as semi-finished billets for re-rolling and forging applications. This segment's products are sold to the construction, service center, transportation, steel warehousing, fabrication, energy, petrochemical and original equipment manufacturing industries.
Americas Fabrication The Americas Fabrication segment consists of rebar and structural fabrication operations, fence post manufacturing plants, construction-related product facilities and plants that heat-treat steel to strengthen and provide flexibility. Fabricated steel products are used primarily in the construction of commercial and non-commercial buildings, hospitals, convention centers, industrial plants, power plants, highways, bridges, arenas, stadiums and dams.
International MillThe International Mill segment is comprised of all recycling and fabrication operations and one steel mill located in Poland. Principal products manufactured include rebar and wire rod as well as merchant bar and billets.
International Marketing and Distribution The International Marketing and Distribution segment includes international operations for the sale, distribution and processing of steel products, ferrous and nonferrous metals and other industrial products. Additionally, this segment includes the U.S.-based marketing and distribution divisions and also operates a recycling facility in Singapore. The International Marketing and Distribution segment buys and sells primary and secondary metals, fabricated metals, semi-finished, long and flat steel products and other industrial products. This segment sells its products to customers, primarily manufacturers, in the steel, nonferrous metals, metal fabrication, chemical, refractory, construction and transportation businesses.
NOTE 1.2. SUMMARY OF SIGNIFICANT ACCOUNTING POLICIES
ConsolidationThe consolidated financial statements include the accounts of the Company and its subsidiaries. The equity method of accounting is used for investments in affiliates in which the Company has the ability to exert significant influence, but does not have effective control. Investments in affiliates which are 20% or less owned are accounted for using the cost method of accounting. The Company currently does not have any investments in affiliates accounted for under the equity method. All significant intercompany transactions and balances are eliminated.
Use of Estimates The preparation of financial statements in 20%accordance with accounting principles generally accepted in the United States requires management to 50% owned affiliates whichmake estimates and assumptions that affect the Company hasamounts reported in the ability to exercise a significant influence overconsolidated financial statements and accompanying notes. These estimates are based on information available as of the operating anddate of the financial policies are accounted for on the equity method. All investments under 20% are accounted for under the cost method.statements. Actual results could significantly differ from those estimates.
Revenue RecognitionSales are recognized The Company recognizes sales when title passes to the customer either when goods are shipped or when they are delivered based upon the terms of the sale, there is persuasive evidence of an agreement, the price is fixed or determinable and collectability is reasonably assured. When the Company estimates that a contract with a customerfirm purchase commitment will result in a loss, the
Company accrues the entire loss is accrued as soon as it is probable and estimable. The Company accounts for fabrication projects based on the percentage of completion accounting method, based primarily on contract cost incurred to date compared to total estimated contract cost. Changes to total estimated contract cost, or loss, if any, are recognized in the period in which they are determined. As of August 31, 20102013 and 2009,2012, the Company recorded in its accounts receivable unbilled revenue related to fabrication projects of $14.3$24.3 million and $27.2$19.2 million respectively, included in accounts receivable in the consolidated financial statements., respectively.
Allowance for Doubtful Accounts.AccountsThe Company maintains an allowance for doubtful accounts to reflect anits estimate of the uncollectability of accounts receivable. These reserves are based on historical trends, current market conditions and customer’scustomers' financial condition.
Credit Risk The Company maintains both corporate and divisional credit departments. Credit limits are set for each customer. Some of the Company's divisions use credit insurance or letters of credit to ensure prompt payment in accordance with the terms of sale. Generally, collateral is not required. Approximately 49% and 60% of total receivables at August 31, 2013 and 2012, respectively, were secured by credit insurance or letters of credit.
Cash and Cash EquivalentsThe Company considers temporary investments that are short termshort-term (with original maturities of three months or less) and highly liquid to be cash equivalents. The Company had restricted cash of $18.0 million serving as collateral for letters of credit obligations for its Australian subsidiary as of August 31, 2013. Restricted cash balances are included in other current assets on the Company's consolidated balance sheets.
Inventory Costs The Company records all inventories at the lower of their cost or market.market value. Inventory cost for most domestic inventories is determined by the last-in, first-out (“LIFO”("LIFO") method; cost of international and remaining inventories is determined by the first-in, first-out (“FIFO”("FIFO") method.
Elements of cost in finished goods inventory in addition to the cost of material include depreciation, amortization, utilities, consumable production supplies, maintenance, production, wages and transportation costs. Additionally, the costs of departments that support production, including materials management and quality control, are allocated to inventory.
Property, Plant and EquipmentProperty, plant and equipment are recorded at cost and are depreciated on a straight-line basis over the estimated useful lives of the assets. ProvisionProvisions for amortization of leasehold improvements are made at annual rates based upon the lesser of the estimated useful lives of the assets or terms of the leases. Major maintenance is expensed as incurred.
At August 31, 2010,2013, the useful lives used for depreciation and amortization were as follows:
| Buildings | 7 | to | 40 | years |
| Land improvements | 3 | to | 25 | years |
| Leasehold improvements | 3 | to | 15 | years |
| Equipment | 3 | to | 25 | years |
Goodwill and Other Intangible AssetsThe Company tests forperforms its goodwill impairment test during the fourth quarter of goodwilleach fiscal year or when changes in circumstances indicate an impairment event may have occurred by estimating the fair value of each reporting unit compared to its carrying value. The Company’sCompany's reporting units are based on its internal reporting structure and represent an operating segment or a reporting level below an operating segment.
50
Additionally, the reporting units are aggregated based on similar economic characteristics, nature of products and services, nature of production processes, type of customers and distribution methods. The company has determined its operating units that have a significant amount of goodwill to be in the Americas Recycling and Americas Fabrication segments. The Company uses a discounted cash flow model and a market approach to calculate the fair value of its reporting units. The model includes a number of significant assumptions and estimates regarding future cash flows including discount rates, volumes, prices, capital expenditures and the impact of current market conditions. These estimates could be materially impacted by adverse changes in market conditions. The Company performs
As a result of the goodwill impairment testtests in 2013, the fourth quarter each fiscal year and when changesCompany recorded goodwill impairment charges of $6.4 million, including foreign currency translation gains of $0.6 million, related to its Australian subsidiaries. The annual goodwill impairment analysis did not result in circumstances indicate anany impairment event may have occurred. Based on the Company’s analysis during the fourth quarter of 2010, the estimated fair valuecharges at any of the Company's other reporting units. As of August 31, 2013 and 2012, one of the Company's reporting units substantially exceeded their carrying values.
| 2010 | 2009 | |||||||||||||||||||||||
| Gross | Gross | |||||||||||||||||||||||
| Carrying | Accumulated | Carrying | Accumulated | |||||||||||||||||||||
| (in thousands) | Amount | Amortization | Net | Amount | Amortization | Net | ||||||||||||||||||
| Customer base | $ | 56,423 | $ | 17,453 | $ | 38,970 | $ | 66,227 | $ | 14,107 | $ | 52,120 | ||||||||||||
| Non-competition agreements | 9,984 | 7,211 | 2,773 | 11,200 | 6,016 | 5,184 | ||||||||||||||||||
| Favorable land leases | 5,728 | 388 | 5,340 | 5,880 | 380 | 5,500 | ||||||||||||||||||
| Brand name | 1,509 | 557 | 952 | 5,214 | 4,637 | 577 | ||||||||||||||||||
| Production backlog | — | — | — | 3,198 | 3,198 | — | ||||||||||||||||||
| Other | 265 | 18 | 247 | 1,596 | 296 | 1,300 | ||||||||||||||||||
| Total | $ | 73,909 | $ | 25,627 | $ | 48,282 | $ | 93,315 | $ | 28,634 | $ | 64,681 | ||||||||||||
| Year | (in thousands) | |||
| 2011 | $ | 9,475 | ||
| 2012 | 8,409 | |||
| 2013 | 7,387 | |||
| 2014 | 7,331 | |||
| 2015 | 7,278 | |||
50
Impairment of Long-Lived AssetsThe Company evaluates the carrying value of property, plant and equipment and finite-lived intangible assets whenever a change in circumstances indicates that the carrying value may not be recoverable from the undiscounted future cash flows from operations. If an impairment exists, the net book values are reduced to fair values as warranted. During the second quarter of 2010, the Company recorded impairment charges to long-lived assets of $29.5 million relating to the joist and deck business. See Note 5, Discontinued Operations, for additional information. Additionally, during the fourth quarter of 2010, the Company recorded an impairment charge of $2.4 million to impair the customer base intangible relating to one acquired business. The Company recorded impairment charges of $8.5 million and $1.0 million during 2009 and 2008, respectively.
51
Environmental CostsThe Company accrues liabilities for environmental investigation and remediation costs when it isthey are both probable and the amount can be reasonably estimated. Environmental costs are based upon estimates regarding the sites for which the Company will be responsible, the scope and cost of work to be performed at each site, the portion of costs that will be shared with other parties and the timing of remediation. Where timing and amounts cannot be reasonably determined, a range is estimated and the lower end of the range is recorded.
Stock-Based CompensationThe Company recognizes share-based transactionsstock-based equity awards and liability awards at fair value in the financial statements. The fair value of each share-basedstock-based equity award is estimated at the date of grant using either the Black-Scholes pricing model or a binomialMonte Carlo pricing model. Total compensation cost of the stock-based equity award is amortized over the requisite service period using the accelerated method of amortization for grants with graded vesting or using the straight-line method for grants with cliff vesting.
| 2010 | 2009 | 2008 | ||||||||||
| Risk-free interest rate | 0.86 | % | 1.24 | % | 2.93 | % | ||||||
| Expected life | 2.0 years | 3.9 years | 4.4 years | |||||||||
| Expected volatility | 80 | % | 60 | % | 43 | % | ||||||
| Expected dividend yield | 3.42 | % | 1.1 | % | 1.1 | % | ||||||
| 2010 | 2009 | |||||||
| Risk-free interest rate | 1.31 | % | 1.37 | % | ||||
| Expected life | 3.0 years | 2.6 years | ||||||
| Expected volatility | 71 | % | 69 | % | ||||
| Expected dividend yield | 0 | % | 2.9 | % | ||||
Accounts Payable — Documentary Letters of CreditIn order to facilitate certain trade transactions, the Company utilizes documentary letters of credit to provide assurance of payment to its suppliers. These letters of credit may be
52
Income TaxesThe Company CMC and its U.S. subsidiaries file a consolidated Federal income tax return. Deferred income taxes are provided for temporary differences between financial statement and tax reporting.bases of asset and liabilities. The principal differences are described in Note 9,14, Income Tax. Benefits from tax credits are reflected currently in earnings. As of August 31, 2009, theThe Company intends to indefinitely reinvest all undistributed earnings of non-U.S. subsidiaries. The Company records income tax positions based on a more likely than not threshold that the tax positions will be sustained on examination by the taxing authorities having full knowledge of all relevant information.
Foreign CurrenciesThe functional currency of most of the Company’sCompany's European marketing and distribution operations and CMCS is the euro. The functional currencies of the Company’sCompany's Australian, CMCZ,Polish, United Kingdom and certain Chinese, MexicanSingaporean and SingaporeanThai operations are their local currencies. The Company's remaining international subsidiaries’subsidiaries' functional currency is the U.S. dollar. Translation adjustments are reported as a component of accumulated other comprehensive income (loss). Transaction gains (losses) from transactions denominated in currencies other than the functional currencies, recorded as a component of selling, general and administrative expenses, were $(2.7)$(5.8) million $(5.3), $2.2 million and $4.4$7.1 million for the years ended August 31, 2010, 20092013, 2012 and 2008,2011, respectively.
Derivative Financial InstrumentsThe Company records derivative instruments on the balance sheet as assets or liabilities, measured at fair value. Gains or losses from the changes in the values of the derivative instruments and hedged items are recorded in the statements of operations, or are deferred if they are designated for hedge accounting and are highly effective in achieving offsetting changes in fair values or cash flows of the hedged items during the term of the hedge.
Fair Value The Company has established a fair value hierarchy which prioritizes the inputs to the valuation techniques used to measure fair value into three levels. These levels are determined based on the lowest level input that is significant to the fair value measurement. Level 1 represents unadjusted quoted prices in active markets for identical assets and liabilities. Level 2 represents quoted prices for similar assets and liabilities in active markets (other than those included in Level 1) which are observable, either directly or indirectly. Level 3 represents valuations derived from valuation techniques in which one or more significant inputs or significant value drivers are unobservable.
Comprehensive Income (Loss)The Company reports comprehensive income (loss) in its consolidated statementstatements of stockholders’ equity.comprehensive income (loss). Comprehensive income (loss) consists of net earnings (loss) plus gains and losses affecting stockholders’stockholders' equity that, under generally accepted accounting principles, are excluded from net earnings (loss), such as gains and losses related to certain derivative instruments, defined benefit plan obligations, and the translation effect of foreign currency assets and liabilities, net of tax. taxes.
Recent Accounting Pronouncements In the fourth quarter of 2013, the Company adopted guidance issued by the Financial Accounting Standards Board ("FASB") requiring an entity to disclose additional information about reclassifications out of
51
accumulated other comprehensive income (loss), including (1) changes in accumulated other comprehensive income (loss) balances by component and (2) significant items reclassified out of accumulated other comprehensive income (loss) and the effect on the respective line items in net income if the amounts are required to be reclassified in their entirety to net income. For other amounts that are not required to be reclassified in their entirety to net income in the same reporting period, an entity is required to cross-reference to other disclosures that provide additional detail about those amounts. The adoption of this guidance only impacts the Company's disclosures and has no impact on its consolidated financial position, results of operations or cash flows. As a result of the adoption of the new guidance, the Company has disclosed this information within the notes to the consolidated financial statements.
In the first quarter of 2013, the Company adopted guidance issued by the FASB on disclosure requirements for the presentation of comprehensive income (loss). This guidance requires entities to report total comprehensive income (loss), the components of net income (loss), and the components of comprehensive income (loss) in either (1) a continuous statement of comprehensive income (loss) or (2) two separate but consecutive statements. As a result of the adoption, the Company's financial statements now include a separate consolidated statement of comprehensive income (loss) immediately following the consolidated statements of operations.
In the first quarter of 2013, the Company adopted guidance that simplifies how entities test indefinite-lived intangible assets for impairment and improves consistency in impairment testing guidance among long-lived asset categories. The guidance permits entities to first assess qualitative factors to determine whether it is more likely than not that an indefinite-lived intangible asset is impaired as a basis for determining whether it is necessary to perform the quantitative impairment test in accordance with U.S. generally accepted accounting principles. An entity will have an option not to calculate annually the fair value of an indefinite-lived intangible asset if the entity determines that it is not more likely than not that the asset is impaired. The adoption of this guidance did not have a material impact on the Company's consolidated financial statements. The Company did not elect the qualitative option in testing goodwill in 2013.
In July 2013, the FASB issued guidance requiring entities to net an unrecognized tax benefit with a deferred tax asset for a net operating loss carryforward, a similar tax loss or a tax credit carryforward. To the extent a net operating loss carryforward, a similar tax loss, or a tax credit carryforward is not available at the reporting date under the tax law of the applicable jurisdiction to settle any additional income taxes that would result from the disallowance of a tax position or the tax law of the applicable jurisdiction does not require the entity to use, and the entity does not intend to use, the deferred tax asset for such purpose, the unrecognized tax benefit should be presented in the financial statements as a liability and should not be combined with deferred tax assets. The new guidance is effective prospectively for fiscal years, and interim periods within those years, beginning after December 15, 2013. The Company does not expect this guidance to have a material impact on its consolidated financial statements.
In July 2013, the FASB issued guidance permitting the Fed Funds Effective Swap Rate ("Overnight Index Swap Rate" or OIS) to be used as a U.S. benchmark interest rate for hedge accounting purposes in addition to interest rates on direct obligations of the U.S. Treasury (UST) and the London Interbank Offered Rate (LIBOR) swap rate. The guidance also removed the restriction on using different benchmark rates for similar hedges. The new guidance is effective prospectively for qualifying new or redesignated hedging relationships entered into on or after July 17, 2013. The Company had no new or redesignated interest rate hedging transactions during the period from July 17, 2013 to August 31, 2013. The Company will evaluate the impact of this guidance on its consolidated financial statements when applicable.
In April 2013, the FASB issued guidance requiring an entity to prepare its financial statements using the liquidation basis of accounting when liquidation is imminent. In addition, the guidance provides principles for the recognition and measurement of assets and liabilities and requirements for financial statements prepared using the liquidation basis of accounting. The new guidance is effective prospectively for entities that determine liquidation is imminent during fiscal years, and interim reporting periods within those years, beginning after December 15, 2013. The Company does not expect this guidance to have a material impact on its consolidated financial statements.
In March 2013, the FASB issued guidance requiring an entity to release any related cumulative translation adjustment into net income when it either sells a part or all of its investment in a foreign entity or no longer holds a controlling financial interest in a subsidiary or group of assets that is a nonprofit activity or a business within a foreign entity. In addition, the guidance resolves the diversity in practice for the treatment of business combinations achieved in stages involving a foreign entity. The new guidance is effective prospectively for fiscal years, and interim reporting periods within those years, beginning after December 15, 2013. The Company does not expect the adoption of this guidance to have a material impact on its consolidated financial statements.
In February 2013, the FASB issued guidance requiring an entity to measure obligations resulting from joint and several liability arrangements for which the total amount of the obligation is fixed at the reporting date. The guidance also requires entities to disclose the nature and amount of the obligation as well as other information about the obligation. The new guidance is effective
52
retrospectively for fiscal years, and interim reporting periods within those years, beginning after December 15, 2013. The Company does not expect the adoption of this guidance to have a material impact on its consolidated financial statements.
In December 2011, the FASB issued guidance requiring an entity to disclose the nature of its rights of setoff and related arrangements associated with its financial instruments and derivative instruments. The objective is to make financial statements that are prepared under GAAP more comparable to those prepared under International Financial Reporting Standards. The new disclosures will give financial statement users information about both gross and net exposures. In January 2013, the FASB issued an update and clarified the scope of transactions that are subject to disclosures concerning offsetting. These disclosure requirements are effective for annual reporting periods beginning on or after January 1, 2013, and interim periods within those annual periods, and should be applied retrospectively for all comparative periods presented. The Company does not expect the adoption of these disclosure requirements to have a material impact on its consolidated financial statements.
NOTE 3. ACCUMULATED OTHER COMPREHENSIVE INCOME (LOSS)
Accumulated other comprehensive income (loss), net of taxes, is comprised of the following:
| (in thousands) | 2010 | 2009 | ||||||
| Foreign currency translation adjustment | $ | (14,050 | ) | $ | 31,557 | |||
| Unrealized gain on derivatives | 4,872 | 4,951 | ||||||
| Defined benefit obligations | (3,348 | ) | (2,251 | ) | ||||
| Total | $ | (12,526 | ) | $ | 34,257 | |||
| (in thousands) | Foreign Currency Translation | Unrealized Gain (Loss) on Derivatives | Defined Benefit Obligation | Total Accumulated Other Comprehensive Income (Loss) | ||||||||||||
| Balance at August 31, 2012 | $ | (17,369 | ) | $ | 3,710 | $ | (4,477 | ) | $ | (18,136 | ) | |||||
| Other comprehensive income (loss) before reclassifications | (10,108 | ) | 221 | 1,147 | (8,740 | ) | ||||||||||
| Amounts reclassified from AOCI | — | (337 | ) | 37 | (300 | ) | ||||||||||
| Net other comprehensive income (loss) | (10,108 | ) | (116 | ) | 1,184 | (9,040 | ) | |||||||||
| Balance at August 31, 2013 | $ | (27,477 | ) | $ | 3,594 | $ | (3,293 | ) | $ | (27,176 | ) | |||||
The significant items reclassified out of accumulated other comprehensive income (loss) and the first quarter of 2010, the Company adopted accounting guidance on business combinations. The guidance establishes principles for recognizing and measuring the identifiable assets acquired, the liabilities assumed, any noncontrolling interestcorresponding line items in the acquired business and goodwill acquired in a business combination. Additionally,consolidated statements of operations to which the guidance clarifies accounting and disclosure of assets and liabilities arising from contingencies in a business combination. This guidance will be applied to future business combinations.
53
| Components of AOCI | Location | (in thousands) | ||||
| Unrealized gain (loss) on derivatives: | ||||||
| Commodity | Cost of goods sold | $ | (260 | ) | ||
| Foreign exchange | Net sales | 60 | ||||
| Foreign exchange | SG&A expenses | 48 | ||||
| Interest rate | Interest expense | 617 | ||||
| 465 | ||||||
| Income tax effect | Income tax (expense) benefit | (128 | ) | |||
| Net of income taxes | $ | 337 | ||||
| Defined benefit obligation: | ||||||
| Amortization of net gain (loss) | SG&A expenses | $ | (252 | ) | ||
| Amortization of prior service credit (cost) | SG&A expenses | 208 | ||||
| (44 | ) | |||||
| Income tax effect | Income tax (expense) benefit | 7 | ||||
| Net of income taxes | $ | (37 | ) | |||
Amounts in a transferred financial asset and limits the circumstances in which a financial asset should be derecognized when the transferor has not transferred the entire original financial asset. The Company is required to adopt the provisions of this statement in the first quarter of fiscal 2011. The Company is still in the process of evaluating the impact, if any, this statement will have on the Company’s consolidated financial statements.parentheses reduce income.
NOTE 2.4. ACQUISITIONS
For the years ended August 31, 20102013 and 2009,2012, the Company did not have any material business acquisitions.
During the year ended August 31, 2008, the Company acquired the following businesses:
53
54
| (in thousands) | Total | |||
| Accounts receivable | $ | 20,415 | ||
| Inventories | 78,087 | |||
| Other current assets | 7,589 | |||
| Property, plant and equipment | 112,077 | |||
| Goodwill | 53,405 | |||
| Intangible assets | 49,047 | |||
| Other assets | 10,294 | |||
| Liabilities | (99,377 | ) | ||
| Net assets acquired | $ | 231,537 | ||
NOTE 3.5. SALES OF ACCOUNTS RECEIVABLE
The Company has a domestic sale of accounts receivable program which expires on December 26, 2014. Under the program, the Company renegotiated an existing accounts receivable securitization agreement of $100 million. The agreement extended the maturity date of the facility to November 24, 2010. On February 26, 2010, the Company amended the existing agreement to modify the covenant structure. The covenants contained in this agreement are consistent with the credit facility fully described in Note 6, Credit Arrangements.
The third-party financial institutions advance up to a maximum of $200 million for all receivables, and the remaining portion due to the Company is deferred until the ultimate collection of the underlying receivables. The Company accounts for CMCRV’s sales of undivided interests in these receivables to the financial institutions as sales. Attrue sales, and the time an undivided interest in the pool ofcash advances for receivables is sold, the amount isare removed from the consolidated balance sheetsheets and the proceeds from the sale are reflected as cash provided by operating activities. At August 31, 2010 and 2009, accounts receivable of $190 million and $141 million, respectively, had been sold to CMCRV. The Company’s undivided interest in these receivables (representing the Company’s retained interest) was 100% at August 31, 2010 and 2009, respectively. The Company had no sales to third party financial institutional buyers during the year ended August 31, 2010. The average monthly amounts of undivided interests owned by the financial institutional buyers were $20.8 million and $8.3 million for the years ended August 31, 2009 and 2008. The carrying amount of the Company’s retained interest inAdditionally, the receivables approximated fair value due to the short-term nature of the collection period. No other material assumptions are made in determining the fair value of the retained interest. The retained interest is subordinate to, and provides credit enhancement for, the financial institutional buyers’ ownership interest in CMCRV’s receivables, and is available to the financial institution buyers to pay any fees or expenses due to them and to absorb all credit losses incurred on any of the receivables. The Company is responsible for servicing the entire pool of receivables; however, no servicing asset or liability is recorded as these receivables are collected in the normal course of business and the collection of receivables related to any sales to third party institutional buyers are normally short-term in nature. The U.S. securitization program contains certain cross-default provisions whereby a termination event could occur if the Company defaulted under onecertain of its credit arrangements. The covenants contained in the receivables purchase agreement are consistent with the credit facility described in Note 11, Credit Arrangements.
At August 31, 2013 and 2012, the Company sold $358.8 million and $406.9 million of receivables, respectively, to the third-party financial institutions. The Company had no advance payments outstanding on the sales of its receivables at August 31, 2013. At August 31, 2012 the Company had $10.0 million in advance payments outstanding on the sales of its receivables. The remaining amounts at August 31, 2013 and 2012 of $358.8 million and $396.9 million, respectively, are the deferred purchase prices and are included in trade receivables on the Company's consolidated balance sheets.
In addition to the securitizationdomestic sale of accounts receivable program described above, the Company’sCompany's international subsidiaries in Europe and Australia and a domestic subsidiary periodically sell accounts receivable without recourse. These arrangements constitute true sales, and once the accounts are sold, they are no longer available to satisfy the Company’sCompany's creditors in the event of bankruptcy. Uncollected accounts receivable sold under these arrangements, and removed from the Company's consolidated balance sheets, were $103.9$24.5 million and $93.7$95.1 million at as of August 31, 20102013 and 2009,August 31, 2012, respectively. The
55
For the years ended August 31, 2013, 2012 and 2009,2011, proceeds from the domestic and international sales of receivables were $831.0 million$1.0 billion, $1.9 billion and $966.5 million,$1.3 billion, respectively, and cash payments to the owners of receivables were $820.8 million$1.1 billion, $1.9 billion, and $1,095.7 million,$1.2 billion, respectively. The Company is responsible for servicing the receivables for a nominal servicing fee. Discounts on domestic and international sales of accounts receivable were $4.0$3.9 million $4.9, $6.4 million and $11.1$5.1 million for the years ended August 31, 2010, 20092013, 2012 and 2008,2011, respectively. These discounts primarily representedrepresent the costscost of funds and wereare included in selling, general and administrative expenses.expenses in the Company's consolidated statements of operations.
NOTE 4.6. INVENTORIES
Inventories are stated at the lower of cost or market. Inventory cost for most domestic inventories is determined by the LIFOlast-in, first-out ("LIFO") method. LIFO inventory reserves were $230.3$185.5 million and $241.7$261.8 million at August 31, 20102013 and 2009,2012, respectively. Inventory cost for international inventories and the remaining domestic inventories are determined by the FIFOfirst-in, first-out ("FIFO") method.
At August 31, 20102013 and 2009, 51%2012, 43% and 62%55%, respectively, of the Company's total inventories were valued at LIFO. The remainder of inventories, valued at FIFO, consisted mainly of material dedicated to CMCZCMC Poland Sp. z.o.o. ("CMCP") (formerly CMC Zawiercie S.A. or "CMCZ") and certain marketing and distribution businesses.
The majority of the Company’sCompany's inventories are in the form of finished goods with minimal work in process. At August 31, 20102013 and 2009, $59.12012, inventories of $66.7 million and $52.9$68.0 million before LIFO reserves, respectively, were in the form of raw materials.
During 2010, 20092013 and 2008,2012, inventory quantities in certain LIFO pools werewas reduced. This reduction resulted in a liquidation of LIFO inventory quantities carried at lower costs prevailing in prior years as compared with the cost of current purchases. The effect for 2010 decreased cost of goods sold by $52.2 million and decreased net loss by $33.9 million. The effect for 2009 decreased cost of goods sold by $75.9 million and2013 increased net earnings by $49.3 million.$3.5 million. The effect on net earnings for 2008 decreased2012 was not material. During 2011, there was no liquidation of LIFO inventory.
NOTE 7. GOODWILL AND OTHER INTANGIBLE ASSETS
The following table details the changes in the carrying amount of goodwill by reportable segment:
| Americas | International | ||||||||||||||||||||||
| (in thousands) | Recycling | Mills | Fabrication | Mill | Marketing and Distribution | Consolidated | |||||||||||||||||
| Balance at September 1, 2011 | $ | 7,267 | $ | 295 | $ | 57,144 | $ | 3,092 | $ | 9,840 | $ | 77,638 | |||||||||||
| Translation | — | — | — | (407 | ) | (334 | ) | (741 | ) | ||||||||||||||
| Balance at August 31, 2012 | $ | 7,267 | $ | 295 | $ | 57,144 | $ | 2,685 | $ | 9,506 | $ | 76,897 | |||||||||||
| Impairment | — | — | — | — | (6,331 | ) | (6,331 | ) | |||||||||||||||
| Translation | — | — | — | 70 | (1,057 | ) | (987 | ) | |||||||||||||||
| Balance at August 31, 2013 | $ | 7,267 | $ | 295 | $ | 57,144 | $ | 2,755 | $ | 2,118 | $ | 69,579 | |||||||||||
As a result of the Company's annual goodwill impairment analysis in the fourth quarter of 2013, the Company determined that the carrying amount of its Australian reporting unit exceeded its estimated fair value. The resulting impairment charges of $6.4 million, including foreign currency translation gains of $0.6 million, were recorded within the International Marketing and Distribution reporting segment at August 31, 2013. The weakened Australian economy and in particular the demand for construction steel, coupled with continued operating performance below planned levels during 2013 and a weak forecast of future operating results were the contributing factors that lead to the impairment charges recorded in 2013. These goodwill impairment charges represent our accumulated goodwill impairment as of August 31, 2013.
The annual goodwill impairment analysis did not result in any impairment charges at any of the Company's other reporting units. As of August 31, 2013 and 2012, one of the Company's reporting units within the Americas Fabrication reporting segment comprised $51.3 million of the Company's total goodwill.
The following intangible assets subject to amortization are included in other noncurrent assets on the Company's consolidated balance sheets:
| August 31, 2013 | August 31, 2012 | ||||||||||||||||||||||
| (in thousands) | Gross Carrying Amount | Accumulated Amortization | Net | Gross Carrying Amount | Accumulated Amortization | Net | |||||||||||||||||
| Customer base | $ | 33,625 | $ | 21,408 | $ | 12,217 | $ | 33,928 | $ | 17,133 | $ | 16,795 | |||||||||||
| Favorable land leases | 6,257 | 612 | 5,645 | 6,133 | 527 | 5,606 | |||||||||||||||||
| Brand name | 2,942 | 946 | 1,996 | 4,113 | 1,394 | 2,719 | |||||||||||||||||
| Other | 101 | 38 | 63 | 101 | 31 | 70 | |||||||||||||||||
| Total | $ | 42,925 | $ | 23,004 | $ | 19,921 | $ | 44,275 | $ | 19,085 | $ | 25,190 | |||||||||||
Excluding goodwill, there are no other significant intangible assets with indefinite lives. Amortization expense for intangible assets for the years ended August 31, 2013, 2012, and 2011 was $4.9 million, $5.9 million, and $9.9 million, respectively. At August 31, 2013, the weighted average remaining useful life of these intangible assets, excluding the favorable land leases in Poland, was four years. The weighted average life of the favorable land leases was 76 years. Estimated amounts of amortization expense for the next five years are as follows:
| Year Ended August 31, | (in thousands) | |||
| 2014 | $ | 4,801 | ||
| 2015 | 4,748 | |||
| 2016 | 3,110 | |||
| 2017 | 663 | |||
| 2018 | 523 | |||
NOTE 8. IMPAIRMENT AND FACILITY CLOSURE COSTS
The Company evaluates the carrying value of property, plant and equipment and finite-lived intangible assets whenever a change in circumstances indicates that the carrying value may not be recoverable. The fair values include estimated cost to sell the assets. Lease termination costs represent the estimated fair value of future lease payments less any sub-lease income which the Company estimates at the cease use date of the leased property.
During the fourth quarter of 2013, the Company prepared an impairment analysis on its Australian operating unit and determined the carrying value of certain fixed assets exceeded their fair value as determined utilizing market and cost approaches. Determining the fair value is judgmental in nature and requires the use of significant estimates and assumptions, considered to be level 3 inputs. The resulting non-recurring impairment charges of $6.3 million, primarily related to the write-down of long-lived assets, were recorded within the International Marketing and Distribution reporting segment at August 31, 2013. As a result of the $6.3 million non-recurring impairment charges, the fair value of International Marketing and Distribution's fixed assets is $20.4 million at August 31, 2013.
Asset impairment and facility closure costs associated with the Company's other operating units were approximately $4.6 million for the year ended August 31, 2013.
Asset impairment and facility closure costs were not significant in 2012.
During the fourth quarter of 2011, the Company prepared an impairment analysis on its steel pipe manufacturing operation at CMC Sisak, d.o.o. ("CMCS") and recorded charges of $110.6 million to impair the CMCS operation. The impairment of property, plant and equipment was based on the fair values calculated by independent appraisals. Additionally, the Company decided to close certain rebar fabrication and construction services locations in the Americas Fabrication segment and the German fabrication operation in the International Mill segment during the fourth quarter of 2011. The construction services locations were leased properties. As a result, the Company recorded impairment charges for these locations. The Company also determined that one of the Company's rebar fabrication customer base intangible assets was not recoverable; the Company recorded an impairment charge to reduce the customer base intangible to its estimated fair value in 2011. See Note 10, Businesses Held for Sale, Discontinued Operations and Dispositions, for additional details about dispositions of CMCS and the German fabrication operation.
In connection with these actions, the following pre-tax charges were recorded in 2011:
| (in thousands) | ||||
| Impairment of property, plant and equipment and other assets | $ | 106,655 | ||
| Impairment of customer list intangible asset | 12,140 | |||
| Write-down of inventory | 8,500 | |||
| Severance costs | 5,051 | |||
| Lease termination costs | 2,196 | |||
| Other closure costs | 7,700 | |||
NOTE 9. SEVERANCE
The Company recorded consolidated severance cost of goods$6.1 million, $25.6 million and $8.2 million for the years ended August 31, 2013, 2012 and 2011, respectively. The severance cost recorded during 2013 was not individually material to any of the Company's segments. The severance cost recorded during 2012 primarily related to the Company's discontinued operations. During 2011, the Company closed several locations which resulted in involuntary employee termination benefits. These termination benefits have been included in selling, general and administrative expenses in the Company's consolidated statements of operations. As of August 31, 2013 and 2012, the remaining liability to be paid in the future related to termination benefits was $2.8 million and $2.7 million, respectively.
NOTE 10. BUSINESSES HELD FOR SALE, DISCONTINUED OPERATIONS AND DISPOSITIONS
Businesses Held for Sale The assets and liabilities of businesses classified as held for sale are included in other current assets and accrued expenses on the Company's consolidated balance sheets. The components of assets and liabilities of businesses held for sale are as follows.
| August 31, | ||||||||
| (in thousands) | 2013 | 2012 | ||||||
| Assets: | ||||||||
| Accounts receivable | $ | 20,313 | $ | — | ||||
| Inventories, net | 8,713 | — | ||||||
| Other current assets | 3,683 | — | ||||||
| Property, plant and equipment, net of accumulated depreciation and amortization | 10,459 | 6,601 | ||||||
| Assets of businesses held for sale | $ | 43,168 | $ | 6,601 | ||||
| Liabilities: | ||||||||
| Accounts payable-trade | $ | 7,615 | $ | — | ||||
| Accrued expenses and other payables | 3,251 | — | ||||||
| Liabilities of businesses held for sale | $ | 10,866 | $ | — | ||||
Discontinued Operations During the fourth quarter of 2013, the Company decided to sell all of the stock of its wholly-owned copper tube manufacturing operation, Howell Metal Company ("Howell"). The Company determined that the decision to sell this business met the definition of a discontinued operation. As result, the Company included Howell in discontinued operations for all periods presented. Howell was previously an operating segment included in the Americas Mills reporting segment. On October 17, 2013, the Company sold by $8.4all of the stock of Howell for $58.5 million and increased net earnings by $5.4 million., subject to customary purchase price adjustments.
Financial information for discontinued operations was as follows:
| Year Ended August 31, | ||||||||||||
| (in thousands) | 2013 | 2012 | 2011 | |||||||||
| Revenue | $ | 157,780 | $ | 202,632 | $ | 253,426 | ||||||
| Earnings (loss) before taxes | 3,672 | (11,906 | ) | (139,195 | ) | |||||||
Dispositions During the first quarter of fiscal 2013, the Company completed the sale of the majority of the deck assets and recordedits 11% ownership interest in Trinecke Zelezarny, a.s. ("Trinecke"), a Czech Republic joint-stock company, for $29.0 million resulting in a pre-tax gain of $2.6$26.1 million. The Trinecke investment was included in the International Marketing and LIFO incomeDistribution segment.
During 2012, the Company sold its rebar fabrication shop in Rosslau, Germany for $11.3 million, resulting in a loss of $1.9$3.8 million from. The result of this sale is included in continuing operations in the liquidationconsolidated statements of the LIFO reserve. On September 27, 2010,operations. Additionally during 2012, the Company completed the sale of two properties that were previously joist and deck locations. The result of this sale is included in discontinued operations in the consolidated statements of operations.
During 2011, Construction Services, a division of a subsidiary of the Company, completed the sale of heavy forming and shoring equipment for $35 million. The result of this sale is included in continuing operations in the consolidated statements of operations. Additionally during 2011, the Company sold a majority of theits joist assets resulting in an estimateda gain of $2.0$1.9 million which will be recordedis included in discontinued operations in the first quarterconsolidated statements of 2011.operations.
56
| (in thousands) | 2010 | 2009 | 2008 | |||||||||
| At August 31, | ||||||||||||
| Current assets | $ | 10,850 | $ | 60,594 | $ | 244,050 | ||||||
| Noncurrent assets | 27,045 | 79,861 | 93,279 | |||||||||
| Current liabilities | 14,723 | 25,885 | 92,638 | |||||||||
| Noncurrent liabilities | 22 | 72 | 952 | |||||||||
| Fiscal Year | ||||||||||||
| Revenue | 122,971 | 474,056 | 867,919 | |||||||||
| Earnings (loss) before taxes | (59,762 | ) | 31,991 | (20,148 | ) | |||||||
NOTE 6.11. CREDIT ARRANGEMENTS
In May 2013, the Company renegotiatedissued $330.0 million of 4.875% Senior Notes due May 15, 2023 (the "2023 Notes") and received proceeds of $325.0 million, net of underwriting discounts and debt issuance costs. The Company used $205.3 million of the proceeds from the 2023 Notes to purchase all of its outstanding $200.0 million of 5.625% Notes due 2013 (the "2013 Notes"). The Company intends to use the remaining proceeds for general corporate purposes. Interest on the 2023 Notes is payable semi-annually on May 15 and November 15 of each year, beginning on November 15, 2013. The Company may, at any time, redeem the 2023 Notes at a redemption price equal to 100 percent of the principal amount, plus a "make-whole" premium described in
the indenture. Additionally, if a change of control triggering event occurs, as defined by the terms of the indenture, holders of the 2023 Notes may require the Company to repurchase the 2023 Notes at a purchase price equal to 101 percent of the principal amount, plus accrued and unpaid interest, if any, to the date of purchase. The Company is generally not limited under the indenture governing the 2023 Notes in its ability to incur additional indebtedness provided the Company is in compliance with certain restrictive covenants, including restrictions on liens, sale and leaseback transactions, mergers, consolidations and transfers of substantially all of the Company's assets.
As a result of redeeming the 2013 Notes, the Company recognized expenses of $4.8 million related to loss on early extinguishment of debt and write-off of unamortized debt issuance costs, discounts and premiums, all of which were included in selling, general and administrative expenses in the consolidated statements of operations for the year ended August 31, 2013.
In December 2011, the Company entered into a third amended and restated $300 million revolving credit facility that matures on December 27, 2016. The maximum availability under this facility can be increased to $400 million with the consent of $400both parties. The program's capacity, with a sublimit of $50 million and extended for letters of credit, is reduced by outstanding stand-by letters of credit which totaled $28.3 million at August 31, 2013. Under the maturity date from May 23, 2010 to November 24, 2012. On February 26, 2010,credit facility, the Company amended the existing agreement to modify the covenant structure which requires the Companywas required to maintain a minimum interest coverage ratio (adjusted EBITDA to interest expense, as each is defined in the facility) of not less than 2.503.00 to 1.00 for the sixtwelve month cumulative period ended August 31, 2010, nine month cumulative period ending November 30, 2010, twelve month cumulative period ending February 28, 20112012 and for each fiscal quarter on a rolling twelve month cumulative period thereafter. At August 31, 2010,2013, the Company’sCompany's interest coverage ratio was 3.495.17 to 1.00.1.00. The agreementcredit facility also requires the Company to maintain liquidity of at least $300 million (cash, short-term investments and accounts receivable securitization capacity combined) through November 30, 2010. At August 31, 2010 the Company had liquidity of $499.3 million. The agreement did not change the existinga debt to capitalization ratio covenant which requires the Companythat does not exceed 0.60 to maintain a ratio not greater than 0.60 to 1.00.1.00. At August 31, 2010,2013, the Company’sCompany's debt to capitalization ratio was 0.520.51 to 1.00.1.00. The agreementcredit facility provides for interest based on the LIBOR, the Eurodollar rate or Bank of America’sAmerica's prime rate.
At August 31, 2013, the Company was in compliance with all covenants contained in its debt agreements.
During 2012, the Company terminated its existing interest rate swap transactions and received cash proceeds of approximately $52.7 million, net of customary finance charges. The facility feeresulting gain was deferred and is 60 basis points per annum and no compensating balances are required.
The Company has numerous uncommitted credit facilities available from domestic and international banks. No commitment fees or compensating balances are required underIn general, these credit facilities. These credit facilities are used in general, to support importtrade letters of credit (including accounts payable settled under bankers’bankers' acceptances as described in Note 1.2, Summary of Significant Accounting Polices)Policies), foreign exchange transactions and short termshort-term advances which are priced at market rates.
Long-term debt, including the net effectdeferred gain from the termination of the interest rate swap revaluation adjustments,swaps, was as follows as of August 31:
| (in thousands) | 2010 | 2009 | ||||||
| 5.625% notes due November 2013 (weighted average rate of 3.57% at August 31, 2010) | 208,253 | 200,000 | ||||||
| 6.50% notes due July 2017 | 400,000 | 400,000 | ||||||
| 7.35% notes due August 2018 (weighted average rate of 5.50% at August 31, 2010) | 524,185 | 500,000 | ||||||
| CMCZ term note due May 2013 | 69,716 | 104,945 | ||||||
| CMCS financing agreement | 19,006 | — | ||||||
| Other, including equipment notes | 6,710 | 9,597 | ||||||
| 1,227,870 | 1,214,542 | |||||||
| Less current maturities | 30,588 | 32,802 | ||||||
| $ | 1,197,282 | $ | 1,181,740 | |||||
| (in thousands) | Weighted Average Interest Rate as of August 31, 2013 | 2013 | 2012 | ||||||
| $200 million notes at 5.625% due November 2013 | —% | $ | — | $ | 204,873 | ||||
| $400 million notes at 6.50% due July 2017 | 5.7% | 411,518 | 414,491 | ||||||
| $500 million notes at 7.35% due August 2018 | 6.4% | 522,930 | 527,554 | ||||||
| $330 million notes at 4.875% due May 2023 | 4.9% | 330,000 | — | ||||||
| Other, including equipment notes | 19,594 | 14,407 | |||||||
| 1,284,042 | 1,161,325 | ||||||||
| Less current maturities | 5,228 | 4,252 | |||||||
| $ | 1,278,814 | $ | 1,157,073 | ||||||
Interest on thethese notes except for the CMCZ note, is payable semiannually.
57
The scheduled maturities of the Company’sCompany's long-term debt are as follows:
| (in thousands) | ||||
| 2011 | $ | 30,588 | ||
| 2012 | 32,666 | |||
| 2013 | 25,651 | |||
| 2014 | 214,032 | |||
| 2015 | 726 | |||
| Thereafter | 924,207 | |||
| Total | $ | 1,227,870 | ||
| Year Ending August 31, | (in thousands) | |||
| 2014 | $ | 5,228 | ||
| 2015 | 4,948 | |||
| 2016 | 3,496 | |||
| 2017 | 402,969 | |||
| 2018 | 502,195 | |||
| Thereafter | 330,758 | |||
| Total excluding deferred gain of interest rate swaps | 1,249,594 | |||
| Deferred gain of interest rate swaps | 34,448 | |||
| Total long-term debt including current maturities | $ | 1,284,042 | ||
Interest of $4.5$1.0 million $12.6, $1.3 million and $6.9$0.8 million was capitalized in the cost of property, plant and equipment constructed in 2010, 20092013, 2012 and 2008,2011, respectively. Interest of $80.0$82.5 million $91.2, $74.1 million and $63.3$71.4 million was paid in 2010, 20092013, 2012 and 2008,2011, respectively.
NOTE 7. FINANCIAL INSTRUMENTS, MARKET12. DERIVATIVES AND CREDIT RISK MANAGEMENT
The Company’s long-term debt is predominantly publicly held. Fair value was determined by indicated market values:
| August 31, | ||||||||
| (in thousands) | 2010 | 2009 | ||||||
| Long-Term Debt: | ||||||||
| Carrying amount | $ | 1,227,870 | $ | 1,181,740 | ||||
| Estimated fair value | 1,291,570 | 1,173,280 | ||||||
58
At August 31, 2013, the Company's notional value of the Company’s debt obligations at variable interest rates. These interest rate swap contracts, under which the Company has agreed to pay variable rates of interest and receive fixed rates of interest, are designated as fair value hedges of fixed rate debt. The Company’s interest rate swapits foreign currency contract commitments were $500and its commodity contract commitments was $331.0 million as of August 31, 2010. and $49.3 million, respectively.
The Company designates only those contracts which closely match the terms of the underlying transaction as hedges for accounting purposes. These hedges resulted in substantially no ineffectiveness in the Company's consolidated statements of operations, and there were no components excluded from the assessment of hedge effectiveness for the yearyears ended August 31, 2010.2013 and 2012. Certain of the foreign currency and commodity contracts were not designated as hedges for accounting purposes, although management believes they are essential economic hedges.
The following tables summarize activities related to the Company’sCompany's derivative instruments and hedged (underlying) items recognized withinin the consolidated statements of operations (in thousands) for the year ended August 31:operations:
| Derivatives Not Designated as Hedging Instruments | Location | 2010 | 2009 | |||||||
| Commodity | Cost of goods sold | $ | (5,745 | ) | $ | 14,666 | ||||
| Foreign exchange | Net sales | (898 | ) | 532 | ||||||
| Foreign exchange | Cost of goods sold | (1,153 | ) | 26 | ||||||
| Foreign exchange | SG&A expenses | 32 | (9,816 | ) | ||||||
| Other | Cost of goods sold | — | (941 | ) | ||||||
| Other | SG&A expenses | — | 97 | |||||||
| Gain (loss) before taxes | $ | (7,764 | ) | $ | 4,564 | |||||
| Year Ended August 31, | ||||||||||||||
| Derivatives Not Designated as Hedging Instruments (in thousands) | Location | 2013 | 2012 | 2011 | ||||||||||
| Commodity | Cost of goods sold | $ | 2,456 | $ | 4,496 | $ | (10,857 | ) | ||||||
| Foreign exchange | Net sales | — | (199 | ) | 38 | |||||||||
| Foreign exchange | Cost of goods sold | — | (537 | ) | 1,412 | |||||||||
| Foreign exchange | SG&A expenses | 5,089 | (872 | ) | (8,025 | ) | ||||||||
| Other | Cost of goods sold | 9 | — | — | ||||||||||
| Gain (loss) before taxes | $ | 7,554 | $ | 2,888 | $ | (17,432 | ) | |||||||
The Company’sCompany's fair value hedges are designated for accounting purposes with the gains andor losses on the hedged (underlying) items offsetting the gaingains or losslosses on the related derivative transaction.transactions. Hedged (underlying) items relate to firm commitments on commercial sales and purchases and capital expenditures and fixed rate debt obligations. As of August 31, 2010, fair value hedge accounting forexpenditures.
During 2012, the Company terminated its interest rate swap contracts increased the carryingtransactions having a notional value of debt instruments by $32.4 million.
| August 31, | ||||||||||
| Derivatives Designated as Fair Value Hedging Instruments | Location | 2010 | 2009 | |||||||
| Foreign exchange | SG&A expenses | $ | (4,194 | ) | $ | 43,185 | ||||
| Interest rate | Interest expense | 32,438 | — | |||||||
| Gain before taxes | $ | 28,244 | $ | 43,185 | ||||||
| Hedged (Underlying) Items Designated as Fair Value | August 31, | |||||||||
| Hedging Instruments | Location | 2010 | 2009 | |||||||
| Foreign exchange | Net sales | $ | 39 | $ | 32 | |||||
| Foreign exchange | SG&A expenses | 4,147 | (43,212 | ) | ||||||
| Interest rate | Interest expense | (32,438 | ) | — | ||||||
| Loss before taxes | $ | (28,252 | ) | $ | (43,180 | ) | ||||
59
$800 million. The Company recognizesrecorded net of the impact of netCompany's periodic settlements of currentvariable-rate interest on our activeobligations and the swap counterparty's fixed-rate interest rate swaps obligations
as adjustmentsa reduction to interest expense. The following table summarizesexpense of $6.5 million and $15.7 million for the impact of periodic settlements of active swap agreements on the results of operations:years ended August 31, 2012 and 2011, respectively. See Note 11, Credit Arrangements for additional information.
| August 31, | ||||||
| Reductions to Interest Expense Due to Hedge Accounting for Interest Rate Swaps | 2010 | 2009 | ||||
| Periodic estimated and actual settlements of active swap agreements* | $ | (5,676 | ) | $ — | ||
| Effective Portion of Derivatives Designated as Cash Flow Hedging Instruments | August 31, | |||||||
| Recognized in Accumulated Other Comprehensive Income (Loss) | 2010 | 2009 | ||||||
| Commodity | $ | 27 | $ | (360 | ) | |||
| Foreign exchange | 264 | 11,446 | ||||||
| Gain, net of taxes | $ | 291 | $ | 11,086 | ||||
| Derivatives Designated as Fair Value Hedging Instruments (in thousands) | Year Ended August 31, | |||||||||||||
| Location | 2013 | 2012 | 2011 | |||||||||||
| Foreign exchange | Net sales | $ | (151 | ) | $ | — | $ | — | ||||||
| Foreign exchange | Cost of goods sold | 2,241 | — | — | ||||||||||
| Foreign exchange | SG&A expenses | — | 383 | (15,053 | ) | |||||||||
| Interest rate | Interest expense | — | 10,561 | 33,485 | ||||||||||
| Gain before taxes | $ | 2,090 | $ | 10,944 | $ | 18,432 | ||||||||
| Effective Portion of Derivatives Designated as Cash Flow | ||||||||||
| Hedging Instruments Reclassified from | August 31, | |||||||||
| Accumulated Other Comprehensive Income (Loss) | Location | 2010 | 2009 | |||||||
| Commodity | Cost of goods sold | $ | (7 | ) | $ | (284 | ) | |||
| Foreign exchange | SG&A expenses | (81 | ) | (122 | ) | |||||
| Interest rate | Interest expense | 458 | 458 | |||||||
| Gain, net of taxes | $ | 370 | $ | 52 | ||||||
| Hedged Items Designated as Fair Value Hedging Instruments (in thousands) | Year Ended August 31, | |||||||||||||
| Location | 2013 | 2012 | 2011 | |||||||||||
| Foreign exchange | Net sales | $ | 153 | $ | — | $ | 91 | |||||||
| Foreign exchange | Cost of goods sold | (2,241 | ) | — | — | |||||||||
| Foreign exchange | SG&A expenses | — | (383 | ) | 14,955 | |||||||||
| Interest rate | Interest expense | — | (10,561 | ) | (33,485 | ) | ||||||||
| Loss before taxes | $ | (2,088 | ) | $ | (10,944 | ) | $ | (18,439 | ) | |||||
| Effective Portion of Derivatives Designated as Cash Flow Hedging Instruments Recognized in Accumulated Other Comprehensive Income (Loss) (in thousands) | August 31, | |||||||||||
| 2013 | 2012 | 2011 | ||||||||||
| Commodity | $ | (218 | ) | $ | — | $ | 26 | |||||
| Foreign exchange | 439 | (1,545 | ) | 797 | ||||||||
| Gain (loss), net of taxes | $ | 221 | $ | (1,545 | ) | $ | 823 | |||||
| Effective Portion of Derivatives Designated as Cash Flow Hedging Instruments Reclassified from Accumulated Other Comprehensive Income (Loss) (in thousands) | Year Ended August 31, | |||||||||||||
| Location | 2013 | 2012 | 2011 | |||||||||||
| Commodity | Cost of goods sold | $ | (169 | ) | $ | 27 | $ | 195 | ||||||
| Foreign exchange | Net sales | 46 | (826 | ) | — | |||||||||
| Foreign exchange | Cost of goods sold | 20 | — | — | ||||||||||
| Foreign exchange | SG&A expenses | 39 | (300 | ) | 365 | |||||||||
| Interest rate | Interest expense | 401 | 521 | 458 | ||||||||||
| Gain (loss), net of taxes | $ | 337 | $ | (578 | ) | $ | 1,018 | |||||||
The Company’sCompany's derivative instruments were recorded at their respective fair values as follows on the consolidated balance sheets (in thousands) forsheets:
| Derivative Assets (in thousands) | August 31, | |||||||
| 2013 | 2012 | |||||||
| Commodity — not designated for hedge accounting | $ | 1,066 | $ | 407 | ||||
| Foreign exchange — designated for hedge accounting | 1,626 | 670 | ||||||
| Foreign exchange — not designated for hedge accounting | 1,238 | 798 | ||||||
| Derivative assets (other current assets and other assets)* | $ | 3,930 | $ | 1,875 | ||||
| Derivative Liabilities (in thousands) | August 31, | |||||||
| 2013 | 2012 | |||||||
| Commodity — designated for hedge accounting | $ | 129 | $ | 2 | ||||
| Commodity — not designated for hedge accounting | 1,268 | 993 | ||||||
| Foreign exchange — designated for hedge accounting | 432 | 1,272 | ||||||
| Foreign exchange — not designated for hedge accounting | 1,738 | 1,248 | ||||||
| Other — not designated for hedge accounting | — | 32 | ||||||
| Derivative liabilities (accrued expenses, other payables and long-term liabilities)* | $ | 3,567 | $ | 3,547 | ||||
_________________________
* Derivative assets and liabilities do not include the year ended August 31:hedged items designated as fair value hedges.
| Derivative Assets | 2010 | 2009 | ||||||
| Commodity — designated | $ | 80 | $ | 13 | ||||
| Commodity — not designated | 911 | 2,948 | ||||||
| Foreign exchange — designated | 435 | 3,823 | ||||||
| Foreign exchange — not designated | 1,188 | 4,678 | ||||||
| Interest rate — designated | 12,173 | — | ||||||
| Long-term interest rate — designated | 20,265 | — | ||||||
| Derivative assets (other current assets and other assets)* | $ | 35,052 | $ | 11,462 | ||||
| Derivative Liabilities | 2010 | 2009 | ||||||
| Commodity — designated | $ | 95 | $ | 35 | ||||
| Commodity — not designated | 2,817 | 8,895 | ||||||
| Foreign exchange — designated | 1,749 | 6,421 | ||||||
| Foreign exchange — not designated | 1,097 | 1,420 | ||||||
| Derivative liabilities (accrued expenses and other payables)* | $ | 5,758 | $ | 16,771 | ||||
As of August 31, 2010,2013, all of the Company’sCompany's derivative instruments designated to hedge exposure to the variability in future cash flows of the forecasted transactions will mature within twelve months.
All of the instruments are highly liquid, and none arenot entered into for trading purposes.
NOTE 8.13. FAIR VALUE
The Company has established a fair value hierarchy which prioritizes the inputs to the valuation techniques used to measure fair value into three levels. These levels are determined based on the lowest level input that is significant to the fair value measurement. Levels within the hierarchy are defined as follows:
60
Level 1 - Unadjusted quoted prices in active markets for identical assets and liabilities;
Level 2 - Quoted prices for similar assets and liabilities in active markets (other than those included in Level 1) which are observable, either directly or indirectly; and
Level 3 - Valuations derived from valuation techniques in which one or more significant inputs or significant value drivers are unobservable.
The following table summarizestables summarize information regarding the Company’sCompany's financial assets and financial liabilities that were measured at fair value on a recurring basis:
| Fair Value Measurements at Reporting Date Using | ||||||||||||||||
| Quoted Prices in | ||||||||||||||||
| Active Markets for | Significant Other | Significant | ||||||||||||||
| August 31, | Identical Assets | Observable Inputs | Unobservable Inputs | |||||||||||||
| (in thousands) | 2010 | (Level 1) | (Level 2) | (Level 3) | ||||||||||||
| Money market investments | $ | 352,881 | $ | 352,881 | $ | — | $ | — | ||||||||
| Derivative assets | 35,052 | 911 | 34,141 | — | ||||||||||||
| Nonqualified benefit plan assets * | 43,681 | 43,681 | — | — | ||||||||||||
| Derivative liabilities | 5,758 | 2,817 | 2,941 | — | ||||||||||||
| Nonqualified benefit plan liabilities * | 86,043 | — | 86,043 | — | ||||||||||||
| August 31, | ||||||||||||||||
| (in thousands) | 2009 | |||||||||||||||
| Money market investments | $ | 357,723 | $ | 357,723 | $ | — | $ | — | ||||||||
| Derivative assets | 11,462 | 2,948 | 8,514 | — | ||||||||||||
| Nonqualified benefit plan assets * | 55,596 | 55,596 | — | — | ||||||||||||
| Derivative liabilities | 16,771 | 8,895 | 7,876 | — | ||||||||||||
| Nonqualified benefit plan liabilities * | 96,904 | — | 96,904 | — | ||||||||||||
| Fair Value Measurements at Reporting Date Using | |||||||||||||||
| (in thousands) | August 31, 2013 | Quoted Prices in Active Markets for Identical Assets (Level 1) | Significant Other Observable Inputs (Level 2) | Significant Unobservable Inputs (Level 3) | |||||||||||
| Assets: | |||||||||||||||
| Money market investments (1) | $ | 236,727 | $ | 236,727 | $ | — | $ | — | |||||||
| Commodity derivative assets (2) | 1,066 | 1,066 | — | — | |||||||||||
| Foreign exchange derivative assets (2) | 2,864 | — | 2,864 | — | |||||||||||
| Liabilities: | |||||||||||||||
| Commodity derivative liabilities (2) | 1,397 | 1,268 | 129 | — | |||||||||||
| Foreign exchange derivative liabilities (2) | 2,170 | — | 2,170 | — | |||||||||||
| Fair Value Measurements at Reporting Date Using | |||||||||||||||
| (in thousands) | August 31, 2012 | Quoted Prices in Active Markets for Identical Assets (Level 1) | Significant Other Observable Inputs (Level 2) | Significant Unobservable Inputs (Level 3) | |||||||||||
| Assets: | |||||||||||||||
| Money market investments (1) | $ | 172,462 | $ | 172,462 | $ | — | $ | — | |||||||
| Commodity derivative assets (2) | 407 | 407 | — | — | |||||||||||
| Foreign exchange derivative assets (2) | 1,468 | — | 1,468 | — | |||||||||||
| Liabilities: | |||||||||||||||
| Commodity derivative liabilities (2) | 995 | 993 | 2 | — | |||||||||||
| Foreign exchange derivative liabilities (2) | 2,520 | — | 2,520 | — | |||||||||||
| Other derivative liabilities (2) | 32 | — | 32 | — | |||||||||||
_________________
(1) Money market investments are short-term in nature, and the value is determined by broker quoted prices in active markets. The following table summarizes informationinvestment portfolio mix can change each period based on the Company's assessment of investment options.
(2) Derivative assets and liabilities classified as Level 1 are commodity futures contracts valued based on quoted market prices in the London Metal Exchange or the New York Mercantile Exchange. Amounts in Level 2 are based on broker quotes in the over-the-counter market. Further discussion regarding the Company’s nonfinancialCompany's use of derivatives and the classification of the assets and liabilities is included in Note 12, Derivatives and Risk Management.
Fair value of property, plant and equipment held for sale (Level 3) was $3.8 million at August 31, 2013 and $9.0 million at August 31, 2012 based on appraised values less costs to sell.
During the fourth quarter of 2013, the Company prepared an impairment analysis on its Australian operating unit and determined the carrying value of certain fixed assets exceeded their fair value as determined utilizing market and cost approaches. Determining the fair value is judgmental in nature and requires the use of significant estimates and assumptions, considered to be level 3 inputs. The resulting non-recurring impairment charges of $6.3 million were recorded within the International Marketing and Distribution reporting segment at August 31, 2013. As a result of the non-recurring impairment charges, the fair value of International Marketing and Distribution's fixed assets is $20.4 million at August 31, 2013. CMC does not have other assets or intangible assets measured at fair value on a non-recurring basis:basis at August 31, 2013. The carrying values of the Company's short-term items, including the deferred purchase prices of accounts receivable, documentary letters of credit and notes payable approximate fair value due to their short term nature.
| Fair Value Measurements Using | ||||||||||||||||||||
| Year | Quoted Prices in | |||||||||||||||||||
| Ended | Active Markets for | Significant Other | Significant | |||||||||||||||||
| August 31, | Identical Assets | Observable Inputs | Unobservable Inputs | Recognized | ||||||||||||||||
| (in thousands) | 2010 | (Level 1) | (Level 2) | (Level 3) | Loss | |||||||||||||||
| Joist and deck assets held for sale | $ | 27,045 | $ | — | $ | — | $ | 27,045 | $ | 24,243 | ||||||||||
| August 31, 2013 | August 31, 2012 | ||||||||||||||||
| (in thousands) | Fair Value Hierarchy | Carrying Value | Fair Value | Carrying Value | Fair Value | ||||||||||||
| $200 million notes at 5.625% due November 2013 (1) | Level 2 | $ | — | $ | — | $ | 204,873 | $ | 212,413 | ||||||||
| $400 million notes at 6.50% due July 2017 (1) | Level 2 | 411,518 | 443,646 | 414,491 | 434,991 | ||||||||||||
| $500 million notes at 7.35% due August 2018 (1) | Level 2 | 522,930 | 570,429 | 527,554 | 559,894 | ||||||||||||
| $330 million notes at 4.875% due May 2023 (1) | Level 2 | 330,000 | 298,650 | — | — | ||||||||||||
_________________
(1) The fair value wasof the notes is calculated based on appraised values less costs to sell.indicated market values.
NOTE 9.14. INCOME TAX
The domestic and foreign components of incomeearnings (loss) from continuing operations before provision for income taxes were(benefit) are as follows (in thousands):follows:
| Year ended August 31, | ||||||||||||
| (in thousands) | 2010 | 2009 | 2008 | |||||||||
| United States | $ | (148,829 | ) | $ | 132,027 | $ | 192,156 | |||||
| Foreign | (55,777 | ) | (130,093 | ) | 165,302 | |||||||
| Total | $ | (204,606 | ) | $ | 1,934 | $ | 357,458 | |||||
| Year Ended August 31, | ||||||||||||
| (in thousands) | 2013 | 2012 | 2011 | |||||||||
| United States | $ | 147,204 | $ | 116,400 | $ | (33,769 | ) | |||||
| Foreign | (14,268 | ) | 48,387 | 59,900 | ||||||||
| Total | $ | 132,936 | $ | 164,787 | $ | 26,131 | ||||||
The provision for income taxes (benefit) included in the consolidated statements of operations is as follows:
| Year Ended August 31, | ||||||||||||
| (in thousands) | 2013 | 2012 | 2011 | |||||||||
| Current: | ||||||||||||
| United States | $ | 849 | $ | 1,560 | $ | 23,452 | ||||||
| Foreign | 1,970 | 419 | 352 | |||||||||
| State and local | 1,815 | 3,411 | 5,226 | |||||||||
| Current taxes (benefit) | $ | 4,634 | $ | 5,390 | $ | 29,030 | ||||||
| Deferred: | ||||||||||||
| United States | $ | 45,908 | $ | (65,710 | ) | $ | (28,048 | ) | ||||
| Foreign | 4,980 | 7,130 | 9,742 | |||||||||
| State and local | 3,767 | (1,419 | ) | 5,616 | ||||||||
| Deferred taxes (benefit) | $ | 54,655 | $ | (59,999 | ) | $ | (12,690 | ) | ||||
| Total taxes (benefit) on income | $ | 59,289 | $ | (54,609 | ) | $ | 16,340 | |||||
| Taxes (benefit) on discontinued operations | 1,310 | (8,847 | ) | 1,748 | ||||||||
| Taxes (benefit) on continuing operations | $ | 57,979 | $ | (45,762 | ) | $ | 14,592 | |||||
A reconciliation of the federal statutory rate to the Company's effective tax rate from continuing operations includesis as follows:
| Year Ended August 31, | ||||||||||||
| 2013 | 2012 | 2011 | ||||||||||
| Tax expense (benefit) at statutory rate of 35% | $ | 46,528 | $ | 57,675 | $ | 9,146 | ||||||
| State and local taxes | 3,460 | 4,596 | 6,958 | |||||||||
| Section 199 manufacturing deduction | — | — | (1,105 | ) | ||||||||
| Foreign rate differential | (3,295 | ) | (9,909 | ) | (9,617 | ) | ||||||
| Change in valuation allowance | 14,264 | 10,033 | — | |||||||||
| Liability for non-US earnings | — | — | 8,848 | |||||||||
| Disposition of CMCS | 6,292 | (102,104 | ) | — | ||||||||
| Australian reorganization | (7,245 | ) | — | — | ||||||||
| Research and experimentation tax credits | — | (11,500 | ) | — | ||||||||
| Other | (2,025 | ) | 5,447 | 362 | ||||||||
| Tax expense (benefit) on continuing operations | $ | 57,979 | $ | (45,762 | ) | $ | 14,592 | |||||
| Effective tax rates from continuing operations | 43.6 | % | (27.8 | )% | 55.8 | % | ||||||
The Company's effective tax rate from discontinued operations for the following:years ended 2013, 2012 and 2011 is 35.7%, 74.3% and (1.3)%, respectively.
| Year ended August 31, | ||||||||||||
| (in thousands) | 2010 | 2009 | 2008 | |||||||||
| Current: | ||||||||||||
| United States | $ | (104,135 | ) | $ | 43,488 | $ | 67,556 | |||||
| Foreign | (2,684 | ) | (4,537 | ) | 44,267 | |||||||
| State and local | (18,581 | ) | 20,903 | 17,331 | ||||||||
| Current taxes (benefit) | $ | (125,400 | ) | $ | 59,854 | $ | 129,154 | |||||
61
| Year ended August 31, | ||||||||||||
| (in thousands) | 2010 | 2009 | 2008 | |||||||||
| Deferred: | ||||||||||||
| United States | $ | 39,399 | $ | (20,566 | ) | $ | (9,269 | ) | ||||
| Foreign | 34,749 | (22,003 | ) | (10,582 | ) | |||||||
| State and local | (8,008 | ) | (3,612 | ) | (4,497 | ) | ||||||
| Deferred taxes | $ | 66,140 | $ | (46,181 | ) | $ | (24,348 | ) | ||||
| Total taxes (benefit) on income | $ | (59,260 | ) | $ | 13,673 | $ | 104,806 | |||||
| Taxes (benefit) on discontinued operations | (21,142 | ) | 12,926 | (7,469 | ) | |||||||
| Taxes (benefit) on continuing operations | $ | (38,118 | ) | $ | 747 | $ | 112,275 | |||||
The increase in the effective tax rate to 43.6% for the year ended August 31, 2013 over the statutory tax rate of 35% is due to the mix and amount of pre-tax income in the jurisdictions in which the Company operates and the recognition of valuation allowances on deferred assets in various jurisdictions that are not more likely than not to be realized.
During the year ended August 31, 2012, the Company recognized a tax loss in the amount of $291 million related to its investments in its Croatian subsidiary. As a result, a tax benefit of $102.1 million was recorded from these losses in continuing operations for the year ended August 31, 2012. The Company reported and disclosed the investment loss on its U.S. tax return as ordinary worthless stock and bad debt deductions. This tax benefit was the primary reason for the variance from the statutory tax rate of 35%.
The Company had a net refund of $7.6 million and paid $17.2 million of taxes for the years ended August 31, 2013 and 2012, respectively. The Company had a net tax refundsrefund of $38.4$79.9 million during for the year ended 2010. Taxes of $33.8 million and $155.4 million were paid in 2009 and 2008, respectively.August 31, 2011.
The tax effects of significant temporary differences giving rise to deferred tax assets and liabilities are as follows:
| August 31, | ||||||||
| (in thousands) | 2010 | 2009 | ||||||
| Deferred tax assets: | ||||||||
| Deferred compensation and employee benefits | $ | 50,207 | $ | 56,703 | ||||
| Net operating losses and credits | 75,798 | 52,037 | ||||||
| Reserves and other accrued expenses | 22,857 | 18,722 | ||||||
| Allowance for doubtful accounts | 11,561 | 14,563 | ||||||
| Inventory | — | 10,115 | ||||||
| Intangibles | 10,335 | — | ||||||
| Impaired Assets | — | 3,758 | ||||||
| Deferred revenue | 2,851 | — | ||||||
| Other | 8,793 | 18,809 | ||||||
| Total deferred tax assets | $ | 182,402 | $ | 174,707 | ||||
| Valuation Allowance for deferred tax assets | (53,860 | ) | (9,885 | ) | ||||
| Deferred tax assets, net | $ | 128,542 | $ | 164,822 | ||||
| Deferred tax liabilities: | ||||||||
| Fixed Assets | $ | 110,892 | $ | 87,709 | ||||
| Inventory | 4,426 | — | ||||||
| Deferred Revenue | — | 1,673 | ||||||
| Other | 6,116 | 9,717 | ||||||
| Total deferred tax liabilities | $ | 121,434 | $ | 99,099 | ||||
| Deferred tax assets, net of deferred tax liabilities | $ | 7,108 | $ | 65,723 | ||||
| August 31, | ||||||||
| (in thousands) | 2013 | 2012 | ||||||
| Deferred tax assets: | ||||||||
| Deferred compensation and employee benefits | $ | 56,504 | $ | 52,113 | ||||
| Net operating losses and credits | 99,200 | 110,553 | ||||||
| Reserves and other accrued expenses | 34,375 | 41,516 | ||||||
| Allowance for doubtful accounts | 5,020 | 5,816 | ||||||
| Inventory | — | 1,881 | ||||||
| Intangibles | 8,153 | 9,668 | ||||||
| Other | 12,879 | 15,062 | ||||||
| Total deferred tax assets | 216,131 | 236,609 | ||||||
| Valuation allowance for deferred tax assets | (48,837 | ) | (25,779 | ) | ||||
| Deferred tax assets, net | $ | 167,294 | $ | 210,830 | ||||
| Deferred tax liabilities: | ||||||||
| Fixed assets | $ | 113,547 | $ | 111,777 | ||||
| Inventory | 10,219 | — | ||||||
| Other | 5,354 | 5,012 | ||||||
| Total deferred tax liabilities | $ | 129,120 | $ | 116,789 | ||||
| Deferred tax assets, net of deferred tax liabilities | $ | 38,174 | $ | 94,041 | ||||
Net operating losses giving rise to deferred tax assets consist of $268.2$140.7 million of federal and $319.8 million state net operating losses that expire during the tax years ending from 20112013 to 20302032 and foreign net operating losses of $247.5$119.9 million that expire during the tax years ending from 2011 to 2016.beginning in 2014. These assets will be reduced as tax expense is recognized in future periods. In addition, the
The Company hasmaintains a foreignvaluation allowance to reduce certain deferred tax credit carryforward of $3.0 million which expires in 2020.
assets to amounts that are more likely than not to be realized. During the year ended August 31, 2010,2013, the Company recorded a valuation allowance in the amount of $43.9$23.1 million against deferred tax assets primarily for the benefit of net operating loss carryforwards in certain jurisdictions due to the uncertainty of their realization.
During the year ended August 31, 2009,2012, the Company recorded a decrease to the valuation allowance in the amount of $49.5 million against deferred tax assets as well as the write off of net operating losses related to the disposition of CMCS. The decrease in the valuation allowance was offset by an increase for the benefit of net operating loss carryforwards in certain jurisdictions due to the uncertainty of their realization.
In general, it is the Company’spractice and intention of the Company to indefinitely reinvest all undistributedthe earnings of its non-U.S. subsidiaries which amounts to approximately $340 million dollars.in those operations. As these earnings are considered permanently reinvested, no provisionsof August 31, 2013, the Company has not made a provision for U.S. Federal or state incomeadditional foreign withholding taxes are required.
62
The unrecognized tax benefits as of August 31, 2013 and 2012 were as follows:
| Year ended August 31, | ||||||||||||
| 2010 | 2009 | 2008 | ||||||||||
| Statutory rate | 35.0 | % | 35.0 | % | 35.0 | % | ||||||
| State and local taxes | 6.1 | 695.0 | 2.2 | |||||||||
| Section 199 manufacturing deduction | — | (171.3 | ) | (1.0 | ) | |||||||
| Foreign rate differential | (4.4 | ) | 1,181.9 | (8.0 | ) | |||||||
| Change in valuation allowance | (20.4 | ) | 259.3 | 1.2 | ||||||||
| Liability for non-US earnings | — | (1,798.3 | ) | 1.6 | ||||||||
| Other | 2.3 | (163.0 | ) | 0.4 | ||||||||
| Effective tax rate from continuing operations | 18.6 | % | 38.6 | % | 31.4 | % | ||||||
A reconciliation of the beginning and ending amounts of unrecognized tax benefits is as follows (in thousands):follows:
| (in thousands) | 2010 | 2009 | ||||||
| Balance September 1 | $ | 1,532 | $ | 4,223 | ||||
| Change in tax positions of current year | 1,640 | — | ||||||
| Change for tax positions of prior years | 17,302 | (1,426 | ) | |||||
| Reductions due to settlements with taxing authorities | — | (122 | ) | |||||
| Reductions due to statute of limitations lapse | (107 | ) | (1,143 | ) | ||||
| Balance August 31 | $ | 20,367 | $ | 1,532 | ||||
| (in thousands) | 2013 | 2012 | 2011 | |||||||||
| Balance at September 1 | $ | 27,384 | $ | 10,762 | $ | 20,367 | ||||||
| Change in tax positions of current year | 1,255 | — | 2,440 | |||||||||
| Change for tax positions of prior years | — | 18,006 | (12,045 | ) | ||||||||
| Reductions due to settlements with taxing authorities | (88 | ) | (600 | ) | — | |||||||
| Reductions due to statute of limitations lapse | — | (784 | ) | — | ||||||||
| Balance at August 31 | $ | 28,551 | $ | 27,384 | $ | 10,762 | ||||||
The CompanyCompany's policy classifies any interest recognized on an underpayment of income taxes and any statutory penalties recognized on a tax position as tax expense and the balances at the end of a reporting period are recorded as part of the current or non-current reservenoncurrent liability for uncertain income tax positions. For the year ended At August 31, 2010, before any tax benefits,2013 and 2012, the Company recorded an increase ofhad accrued interest and penalties on unrecognizedrelated to uncertain tax benefitspositions of $2.3 million.$2.8 million and $2.0 million, respectively.
During the next twelve months, it is reasonably possible that the statute of limitations may lapse pertaining to positions taken by the Company in prior year tax returns or that income tax audits in various taxing jurisdictions could be finalized. As a result, the total amount of unrecognized tax benefits may decrease, which could reduce the liability for uncertain tax positions by approximately $14 million.$17.9 million.
The Company files income tax returns in the United States and multiple foreign jurisdictions with varying statutes of limitations. In the normal course of business, the Company and its subsidiaries are subject to examination by various taxing authorities. The following is a summary of tax years subject to examination:
US Federal — 2009 and forward
US States — 2009 and forward
Foreign — 2006 and forward
U.S. States — 2006 and forward
Foreign — 2004 and forward
The Federal tax returns for fiscal years 2006 to 2008 areCompany is under examination by the Internal Revenue Service (“IRS”), and state revenue authorities from 2009 to 2011. Management believes the 2009 tax return of CMCZ is under examination by the Polish Revenue Authority. However, we believe ourCompany's recorded tax liabilities as of August 31, 20102013 sufficiently reflect the anticipated outcome of these examinations.
NOTE 10. CAPITAL STOCK15. SHARE-BASED COMPENSATION PLANS
The Company's share-based compensation plans provide for the issuance of incentive and 2008,non-qualified stock options, restricted stock and units, stock appreciation rights and performance-based awards. The Compensation Committee of the Board of Directors approves all awards that are granted under the Company's share-based compensation plans. Share-based compensation expense for the years ended August 31, 2013, 2012 and 2011 of $18.7 million, $13.1 million and $12.9 million, respectively, is included in selling, general and administrative expenses on the Company’s consolidated statements of operations. As of August 31, 2013, total unrecognized compensation cost related to unvested share-based compensation arrangements was $26.5 million, which is expected to be recognized over a three year period.
The following table summarizes the total awards granted:
| Stock Options/SARs | Restricted Stock Awards/Units | Performance Awards | |||||||
| 2013 Grants | 244,403 | 1,149,696 | 640,002 | ||||||
| 2012 Grants | 927,312 | 829,001 | 693,472 | ||||||
| 2011 Grants | 112,000 | 690,180 | 686,548 | ||||||
As of August 31, 2013, the maximum number of shares available for awards under the Company's share-based compensation plans was 19,581,278. As of August 31, 2013, CMC had 17,781,754 shares available for future grants.
Restricted Stock Units Restricted stock units issued under the Company's plans provide that shares awarded may not be sold, transferred, pledged or assigned until service-based restrictions have elapsed. The restricted stock units granted to U.S. employees generally vest and are converted to CMC common stock in three equal installments on each of the first three anniversaries of the date of grant. The restricted stock units granted to non-U.S. employees generally vest and are settled in cash in three equal installments on each of the first three anniversaries of the date of grant. Generally, upon termination of employment, restricted stock awards that have not vested are forfeited. Upon death, disability or qualifying retirement a pro-rata portion of the unvested restricted stock awarded will vest and become payable.
The estimated fair value of the stock-settled restricted stock units is based on the closing price of CMC common stock on the date of grant, discounted for the expected dividend yield through the vesting period. Compensation cost related to the stock-settled restricted stock units is recognized ratably over the service period and is included in equity on the Company’s consolidated balance sheets. The fair value of the cash-settled restricted stock units is remeasured each reporting period and is recognized ratably over the service period. The liability related to the cash-settled restricted stock units is included in accrued expenses and other payables on the Company’s consolidated balance sheets.
Performance Stock Units Performance stock units issued under the Company’s plans provide that shares awarded may not be sold, transferred, pledged or assigned until service-based restrictions have elapsed and any performance objectives have been attained as established by the Compensation Committee. Recipients of these awards generally must be actively employed by and providing services to the Company purchased 1,752,900on the last day of the performance period in order to receive an award payout. Upon death, disability or qualifying retirement a pro-rata portion of the performance stock units will vest and 6,212,238 common sharesbecome payable at the end of the performance period.
Compensation cost for treasury, respectively.performance stock units is accrued based on the probable outcome of specified performance conditions, net of estimated forfeitures. The Company accrues compensation cost if it is probable that the performance conditions will be met. The Company reassesses the probability of meeting the specified performance conditions at the end of each reporting period and adjusts compensation cost, as necessary, based on the probability of achieving the performance conditions. If the performance conditions are not met at the end of the performance period, the Company reverses the related compensation cost.
Performance targets established by the Compensation Committee for performance stock units awarded in fiscal 2013 are weighted 75% based on the Company’s cumulative EBITDA targets for fiscal years 2013, 2014 and 2015, as approved by the Company’s Board of Directors authorizedin the purchaserespective year’s business plan, and 25% based on a three year relative total shareholder return metric. Performance stock units awarded to U.S. participants will be settled in CMC common stock. Award payouts range from a threshold of an additional 10,000,000 shares50% to a maximum of 200% for each portion of the target awards. The performance stock units associated with the cumulative EBITDA targets have been classified as liability awards since the final EBITDA target will not be set until the third year of the performance period. Consequently, these awards are included in accrued expenses and other payables on October 21, 2008the Company’s consolidated balance sheets. The fair value of these performance stock units is remeasured each reporting period and is recognized ratably over the service period. The performance stock units associated with the total shareholder return metric were valued at fair value on the date of grant using the Monte Carlo pricing model and are included in equity on the Company’s consolidated balance sheets.
Performance stock units awarded to non-U.S. participants in fiscal 2013 will be settled in cash. The fair value of the performance stock units is remeasured each reporting period and is recognized ratably over the service period. The liability related to these awards is included in accrued expenses and other payables on the Company’s consolidated balance sheets
Performance targets established by the Compensation Committee for performance stock units awarded in fiscal 2012 are weighted 50% based on the Company’s EBITDA targets and 50% based on Company's RONA targets for fiscal years 2012, 2013 and 2014, as approved by the Company's Board of Directors. Performance stock units awarded in fiscal 2012 will be settled in cash. Consequently, these awards are included in accrued expenses and other payables on the Company’s consolidated balance sheets. The fair value of the fiscal 2012 performance share units is remeasured each reporting period and is recognized ratably over the service period.
Performance targets established by the Compensation Committee for performance stock units awarded in fiscal 2011 are weighted 50% based on the Company’s EBITDA targets and 50% based on Company's RONA targets for fiscal years 2011, 2012 and 2013, as approved by the Company’s Board of Directors. Settlement of the performance stock units awarded in fiscal 2011 is split and upon vesting, award participants will receive one-half in CMC common stock and one-half in cash. The fair value of the portion of the performance stock units associated with the EBITDA target, and are settled in CMC common stock, was based on the closing price of CMC common stock on the date of grant discounted for the expected dividend yield through the vesting period. Compensation cost related to these performance stock units is recognized ratably over the service period and is included in equity on the Company’s consolidated balance sheets. The fair value of the performance share units settled in cash is remeasured each
reporting period and is recognized ratably over the service period. The liability related to the cash settled portion of the performance stock units is included in accrued expenses and other payables on the Company’s consolidated balance sheets. At August 31, 2013, the Company had remaining authorizationreassessed the probability of achieving the specified performance conditions related to purchase 8,259,647performance stock units awarded in fiscal 2011 and determined the Company will not meet the EBITDA and RONA targets at the end of its commonthe service period. As a result, the compensation cost previously recognized for these performance stock units has been reversed as of August 31, 2010.2013.
63
Performance targets established by the Compensation Committee for performance stock units awarded in fiscal 2010 are based on a three year relative total shareholder return metric where 50% of the performance share units will vest if the Company ranks at the 50th percentile of its peer group at the end of the performance period and 100% of the performance share units will vest if the Company ranks at or greater than the 60th percentile of its peer group at the end of the performance period. In 2013, the Compensation Committee determined that the Company did not meet the total shareholder return vesting criteria at the end of the performance period. As a result, the compensation cost previously recognized for these performance stock units has been reversed.
Information for restricted stock units and performance stock units, excluding the cash component, is as follows:
| Number | Weighted Average Grant-Date Fair Value | |||||
| Outstanding as of August 31, 2012 | 1,683,572 | $ | 13.16 | |||
| Granted | 1,159,451 | 13.60 | ||||
| Vested | (537,303 | ) | 13.35 | |||
| Forfeited | (398,302 | ) | 12.22 | |||
| Outstanding as of August 31, 2013 | 1,907,418 | $ | 13.57 | |||
The weighted-average grant-date fair value per share of restricted stock units and performance stock units was $10.68 and $15.55 for 2012 and 2011, respectively. The total fair value of shares vested during 2013, 2012 and 2011 was $7.2 million, $10.7 million and $2.9 million, respectively.
The Company granted 174,710 equivalent shares of cash-settled restricted stock units and performance stock units during the year ended August 31, 2013. As of August 31, 2013, the Company had 1,670,113 equivalent shares of awards outstanding and expects 1,378,779 equivalent shares to vest.
Stock Appreciation Rights and Stock Options Stock appreciation rights and stock options are awarded to certain employees with an exercise price equal to the market value of CMC common stock on the date of grant. Stock appreciation rights and stock options issued in fiscal 2013, 2012 and 2011 are exercisable ratably over the three year vesting period and have a contractual term of seven years. The estimated fair value of stock appreciation rights and stock options granted under the Company’s plans during the years ended August 31, 2013, 2012 and 2011 was $0.6 million, $3.0 million and $1.9 million, respectively was estimated on the date of grant using the Black-Scholes Option Pricing Model with the following assumptions:
| 2013 | 2012 | 2011 | ||||||||||
| Risk-free interest rate | 0.41 | % | 0.43 | % | 0.59 | % | ||||||
| Expected life, years | 3.0 | 3.0 | 2.0 | |||||||||
| Expected volatility | 43 | % | 59 | % | 56 | % | ||||||
| Expected dividend yield | 3.40 | % | 4.14 | % | 2.85 | % | ||||||
| Weighted average grant-date fair value per share | $ | 3.38 | $ | 3.67 | $ | 4.63 | ||||||
Combined activity for the Company’s stock appreciation rights and stock options, excluding the cash component, is as follows:
| Number | Weighted Average Exercise Price | Weighted Average Remaining Contractual Life (Years) | Aggregate Intrinsic Value | |||||||||
| Outstanding as of September 1, 2010 | 3,922,016 | $ | 23.67 | |||||||||
| Granted | 112,000 | 16.83 | ||||||||||
| Exercised | (854,023 | ) | 8.03 | |||||||||
| Forfeited/Expired | (372,495 | ) | 28.96 | |||||||||
| Outstanding as of August 31, 2011 | 2,807,498 | $ | 27.45 | 2.8 | $ | 94,500 | ||||||
| Granted | 828,463 | 11.63 | ||||||||||
| Exercised | (361,478 | ) | 12.34 | |||||||||
| Forfeited/Expired | (343,991 | ) | 27.78 | |||||||||
| Outstanding as of August 31, 2012 | 2,930,492 | $ | 24.81 | 3.3 | $ | 1,104,590 | ||||||
| Granted | 185,004 | 14.25 | ||||||||||
| Exercised | (4,105 | ) | 11.60 | |||||||||
| Forfeited/Expired | (457,961 | ) | 24.91 | |||||||||
| Outstanding as of August 31, 2013 | 2,653,430 | $ | 24.07 | 2.8 | $ | 2,867,175 | ||||||
| Exercisable at August 31, 2013 | 1,756,862 | $ | 30.15 | 1.5 | $ | 666,807 | ||||||
| Remaining unvested stock appreciation rights and stock options expected to vest | 851,740 | 12.18 | ||||||||||
There was no intrinsic value of stock appreciation rights and stock options exercised during 2013. The aggregate intrinsic value of stock appreciation rights and stock options exercised during 2012 and 2011 was $0.4 million and $7.4 million, respectively and represents the difference between the market value on the date of exercise and the exercise price.
Information related to stock appreciation rights and stock options as of August 31, 2013 is summarized below:
| Stock Appreciation Rights and Stock Options Outstanding | Stock Appreciation Rights and Stock Options Exercisable | ||||||||||||||||||
| Range of Exercise Prices | Number Outstanding | Weighted Average Remaining Contractual Life (In Years) | Weighted Average Exercise Price | Number Exercisable | Weighted Average Remaining Contractual Life (In Years) | Weighted Average Exercise Price | |||||||||||||
| $11.00 | - | 14.68 | 1,161,224 | 4.8 | $ | 12.20 | 274,362 | 3.1 | $ | 12.45 | |||||||||
| $16.54 | - | 16.83 | 121,706 | 4.5 | $ | 16.81 | 112,000 | 4.4 | $ | 16.83 | |||||||||
| $31.75 | - | 35.38 | 1,370,500 | 1.0 | $ | 34.78 | 1,370,500 | 1.0 | $ | 34.78 | |||||||||
| 2,653,430 | 2.8 | $ | 24.07 | 1,756,862 | 1.5 | $ | 30.15 | ||||||||||||
During the year ended August 31, 2013, the Company awarded 59,399 equivalent shares of stock appreciation rights to non-U.S. employees, which are settled in cash. The fair value of these stock appreciation rights is remeasured each reporting period and is recognized ratably over the service period. The liability related to these awards is included in accrued expenses and other payables on the Company’s consolidated balance sheets. As of August 31, 2013, the Company had 141,340 equivalent shares of stock appreciation rights outstanding and expects 134,273 equivalent shares of stock appreciation rights to vest.
Stock Purchase PlanAlmost all U.S. resident employees with one year of service at the beginning of each calendar year may participate in the Company’sCompany's employee stock purchase plan. Each eligible employee may purchase up to 400 shares annually. The Board of Directors establishes the purchase discount from theof 15% based on market price. The discount was 15%prices on specified dates for the yearyears ended August 31, 20102013, 2012 and 25% for years ended August 31, 2009 and 2008.2011. Yearly activity of the stock purchase plan wasis as follows:
| 2010 | 2009 | 2008 | ||||||||||
| Shares subscribed | 526,890 | 1,234,080 | 489,510 | |||||||||
| Price per share | $ | 13.63 | $ | 7.94 | $ | 23.48 | ||||||
| Shares purchased | 980,940 | 7,530 | 441,770 | |||||||||
| Price per share | $ | 7.94 | $ | 9.90 | $ | 21.69 | ||||||
| Shares available for future issuance | 4,730,824 | |||||||||||
| 2013 | 2012 | 2011 | ||||||||||
| Shares subscribed | 281,460 | 299,210 | 339,620 | |||||||||
| Price per share | $ | 12.61 | $ | 11.85 | $ | 14.34 | ||||||
| Shares purchased | 211,580 | 198,300 | 357,180 | |||||||||
| Price per share | $ | 11.85 | $ | 11.76 | $ | 13.63 | ||||||
| Shares available for future issuance | 4,134,634 | |||||||||||
NOTE 16. CAPITAL STOCK
Treasury Stock CMC did not purchase any shares to be available for future issuance under the Company’s stock purchase plan.
64
| Weighted | ||||||||||||
| Average | Price | |||||||||||
| Exercise | Range | |||||||||||
| Number | Price | Per Share | ||||||||||
| September 1, 2007 | ||||||||||||
| Outstanding | 6,480,908 | $ | 14.74 | $ | 2.94-34.28 | |||||||
| Exercisable | 4,333,089 | 7.65 | 2.94-24.71 | |||||||||
| Granted | 1,062,670 | 35.37 | 32.82-35.38 | |||||||||
| Exercised | (1,247,477 | ) | 7.24 | 2.94-34.28 | ||||||||
| Forfeited | (74,695 | ) | 29.97 | 12.31-35.38 | ||||||||
| August 31, 2008 | ||||||||||||
| Outstanding | 6,221,406 | $ | 19.60 | $ | 3.64-35.38 | |||||||
| Exercisable | 4,057,115 | 11.96 | 3.64-34.28 | |||||||||
| Granted | 126,000 | 11.00 | 11.00 | |||||||||
| Exercised | (813,271 | ) | 5.00 | 3.64-12.31 | ||||||||
| Forfeited | (106,583 | ) | 30.85 | 7.78-35.38 | ||||||||
| August 31, 2009 | ||||||||||||
| Outstanding | 5,427,552 | $ | 21.36 | $ | 3.64-35.38 | |||||||
| Exercisable | 4,240,734 | 18.27 | 3.64-35.38 | |||||||||
| Granted | 126,000 | 14.05 | 14.05 | |||||||||
| Exercised | (1,053,206 | ) | 6.59 | 3.64-12.31 | ||||||||
| Forfeited | (578,330 | ) | 31.05 | 7.78-35.38 | ||||||||
| August 31, 2010 | ||||||||||||
| Outstanding | 3,922,016 | $ | 23.67 | $ | 7.53-35.38 | |||||||
| Exercisable | 3,503,681 | 23.38 | 7.53-35.38 | |||||||||
| Outstanding | Exercisable | |||||||||||||||||||||||||||||
| Weighted | ||||||||||||||||||||||||||||||
| Average | Weighted | Weighted | ||||||||||||||||||||||||||||
| Range of | Remaining | Average | Aggregate | Average | Aggregate | |||||||||||||||||||||||||
| Exercise | Number | Contractual | Exercise | Intrinsic | Number | Exercise | Intrinsic | |||||||||||||||||||||||
| Price | Outstanding | Life (Years) | Price | Value | Outstanding | Price | Value | |||||||||||||||||||||||
| $ | 7.53 - 7.78 | 807,346 | 0.5 | $ | 7.77 | 807,346 | $ | 7.77 | ||||||||||||||||||||||
| 11.00 - 14.05 | 764,892 | 3.1 | 12.41 | 589,892 | 12.17 | |||||||||||||||||||||||||
| 21.81 - 24.71 | 448,942 | 2.4 | 24.51 | 448,942 | 24.51 | |||||||||||||||||||||||||
| 31.75 - 35.38 | 1,900,836 | 3.7 | 34.76 | 1,657,501 | 34.67 | |||||||||||||||||||||||||
| $ | 7.53 - 35.38 | 3,922,016 | 2.8 | $ | 23.67 | $ | 4,849,517 | 3,503,681 | $ | 23.38 | $ | 4,750,537 | ||||||||||||||||||
65
| Weighted Average | ||||||||
| Grant-Date | ||||||||
| Shares | Fair Value | |||||||
| September 1, 2007 | 554,424 | $ | 24.04 | |||||
| Granted | 163,770 | $ | 32.90 | |||||
| Vested | (327,030 | ) | 20.42 | |||||
| Forfeited | (18,178 | ) | 24.30 | |||||
| August 31, 2008 | 372,986 | $ | 31.09 | |||||
| Granted | 403,000 | $ | 8.89 | |||||
| Vested | (213,767 | ) | 29.32 | |||||
| Forfeited | (12,619 | ) | 33.20 | |||||
| August 31, 2009 | 549,600 | $ | 15.45 | |||||
| Granted | 1,301,518 | $ | 12.89 | |||||
| Vested | (99,026 | ) | 32.79 | |||||
| Forfeited | (102,107 | ) | 13.03 | |||||
| August 31, 2010 | 1,649,985 | $ | 12.54 | |||||
Preferred StockPreferred stock has a par value of $1.00$1.00 a share, with 2,000,000 shares authorized. It may be issued in series, and the shares of each series shall have such rights and preferences as may be fixed by theCMC's Board of Directors when authorizing the issuance of that particular series. There are no shares of preferred stock outstanding.
Stockholder Rights Plan On July 30, 2011, CMC's Board of Directors adopted a stockholder rights plan ("Rights Plan") pursuant to which the Board declared a dividend to stockholders of record as of August 11, 2011, of one Preferred Stock Purchase Right ("Right") on each outstanding share of CMC common stock. On December 6, 2012, the Company terminated the Rights Plan. No Rights were exercised, traded or redeemed under the Rights Plan for the years ended August 31, 2013 and 2012, respectively.
NOTE 11. EMPLOYEES’17. EMPLOYEES' RETIREMENT PLANS
Substantially all employees in the U.S. are covered by a defined contribution profit sharing and savings plan. This tax qualified plan is maintained and contributions are made in accordance with ERISA.the Employee Retirement Income Security Act of 1974, as amended ("ERISA"). The Company also provides certain eligible executives’executives' benefits pursuant to a nonqualified benefit restoration plan (“("BRP Plan”Plan") equal to amounts that would have been available under the tax qualified ERISA plans, but forwere subject to the limitations of ERISA, tax laws and regulations. Company expenses, which are discretionary, for these plans were $19.4$15.9 million $20.8, $13.0 million and $55.1$14.1 million for 2010, 2009the years ended August 31, 2013, 2012 and 2008,2011, respectively.
The deferred compensation liability under the BRP Plan was $86.0$78.8 million and $96.9$77.0 million at August 31, 20102013 and 2009,2012, respectively, and recorded in other long-term liabilities. Though under no obligation to fund the plan, the Company has segregated assets in a trust with a current value at August 31, 20102013 and 20092012 of $43.7$59.4 million and $55.6$52.9 million, respectively, recorded in other long-term assets. The net holding gain (loss) on these segregated assets was $3.2$9.9 million $(12.2), $5.3 million and $(6.5)$6.5 million for the years ended August 31, 2010, 20092013, 2012 and 2008,2011, respectively.
A certain number of employees, primarily outside of the U.S., participate in defined benefit plans maintained in accordance with local regulations. Company expenses for these international plans were $2.4$3.6 million $2.4, $2.2 million and $4.3$3.2 million for the years ended August 31, 2010, 20092013, 2012 and 2008,2011, respectively.
The Company provides post retirement defined benefits to employees at certain divisions and recognizes the unfunded status of defined benefit plans as a liability with a corresponding reduction to accumulated other comprehensive income, net of taxes. During 2010, 2009At August 31, 2013 and 2008,2012, the Company recorded an additionalCompany's liability of $1.7 million, $0.5 million and $1.5 million, respectively, and a corresponding reduction to accumulated other comprehensive income, net of taxes of $1.1 million, $0.4 million and $1.1 million, respectively, related to the unfunded status of the Company’s defined benefit plans.plans was $3.5 million and $5.1 million, respectively.
66
NOTE 12.18. COMMITMENTS AND CONTINGENCIES
Minimum lease commitments payable by the Company and its consolidated subsidiaries for noncancelable operating leases in effect at August 31, 2010, are as follows:
| Real | ||||||||
| (in thousands) | Equipment | Estate | ||||||
| 2011 | $ | 17,391 | $ | 23,574 | ||||
| 2012 | 12,892 | 19,878 | ||||||
| 2013 | 7,775 | 17,144 | ||||||
| 2014 | 3,848 | 15,858 | ||||||
| 2015 | 503 | 13,779 | ||||||
| Year Ending August 31, | (in thousands) | |||
| 2014 | $ | 35,430 | ||
| 2015 | 28,600 | |||
| 2016 | 22,943 | |||
| 2017 | 15,576 | |||
| 2018 | 9,030 | |||
| Thereafter | 11,918 | |||
| Total | $ | 123,497 | ||
Total rental expense was $48.9$46.6 million $68.4, $43.9 million and $63.7$45.9 million in 2010, 20092013, 2012 and 2008,2011, respectively.
Legal and Environmental Matters
In the ordinary course of conducting its business, the Company becomes involved in litigation, administrative proceedings and governmentgovernmental investigations, including environmental matters.
On September 18, 2008, the Company was served with a purported class action antitrust lawsuit alleging violations of Section 1 of the Sherman Act, brought by Standard Iron Works of Scranton, Pennsylvania, against nine steel manufacturing companies, including Commercial Metals Company. The lawsuit, filed in the United States District Court for the Northern District of Illinois, alleges that the defendants conspired to fix, raise, maintain and stabilize the price at which steel products were sold in the United States by artificially restricting the supply of such steel products. The lawsuit, which purports to be brought on behalf of a class consisting of all purchasersparties who purchased of steel products directly from the defendants between January 1, 2005 and September 2008, seeks treble damages and costs, including reasonable attorney fees and pre- and post-judgment interest. Motions for and against class certification have been filed. Oral arguments related to class certification are pending. Discovery on the case merits remains pending. The Company believes the case is without merit and intends to defend it vigorously.
Since the filing of thisthe direct purchaser lawsuit, additional plaintiffs havea case has been filed in federal court in the Northern District of Illinois on behalf of a purported class action lawsuitsof indirect purchasers in approximately 28 states naming the same defendants and containing allegations substantially identical to those of the Standard Iron Works complaint. That case has in effect been stayed. Another indirect purchaser action was filed in Tennessee state court, again naming the same defendants but contending that the conspiracy continued through 2010. The case has been removed to federal court, and plaintiffs have moved to remand. The motion to remand has not yet been decided, and no motion practice or discovery has taken place. The Company believes that the lawsuits are entirely without merit and plans to aggressively defend them vigorously. Due to the actions.uncertainty and the information available as of the date of these financial statements, we cannot reasonably estimate a range of loss relating to these cases.
The Company has received notices from the U.S. Environmental Protection Agency (“EPA”("EPA") or equivalent state agencyagencies with similar responsibility that it is considered a potentially responsible party (“PRP”("PRP") at tenseveral sites, none owned by the Company, and may be obligated under the Comprehensive Environmental Response, Compensation, and Liability Act of 1980 (“CERCLA”("CERCLA") or similar state statute to conduct remedial investigations, feasibility studies, remediation and/or removal of alleged releases of hazardous substances or to reimburse the EPA for such activities. The Company is involved in litigation or administrative proceedings with regard to several of these sites in which the Company is contesting, or at the appropriate time may contest, its liability at the sites. In addition, the Company has received information requests with regard to other sites which may be under consideration by the EPA as potential CERCLA sites. Some of these environmental matters or other proceedings may result in fines, penalties or judgments being assessed against the Company. At August 31, 20102013 and 2009,2012, the Company had $1.1$0.9 million and $2.2$1.0 million, respectively, accrued for cleanup and remediation costs in connection with eight of the ten CERCLA sites. The estimation process is based on currently available information, which is in many cases preliminary and incomplete. As a result, the Company is unable to reasonably estimate an amount relating to cleanup and remediation costs for two CERCLA sites. Total environmental liabilities, including CERCLA sites, were $9.8$9.0 million at August 31, 2013 and $14.3 million,2012, respectively, of which $5.9$5.0 million and $6.4$4.9 million were classified as other long-term liabilities at August 31, 20102013 and 2009,2012, respectively. Due to evolving remediation technology, changing regulations, possible third-party contributions, the inherent shortcomings of the estimation process and other factors, amounts accrued could vary significantly from amounts paid. Historically, the amounts the Company has ultimately paid for such remediation activities have not been material.
Management believes that adequate provision hasprovisions have been made in the Company's consolidated financial statements for the potential impact of these issues,contingencies, and that the outcomes of the suits and proceedings described above, and other miscellaneous litigation and proceedings now pending, will not significantly impacthave a material adverse effect on the business, results of operations, or financial position or liquiditycondition of the Company.
Guarantees
During 2012, the Company although they may haveentered into a material impact on earnings forguarantee agreement with a particular quarter.bank in connection with a credit facility granted by the bank to a supplier of the Company. The fair value of the guarantee is negligible. The maximum credit facility with the bank was $4.0 million, and the Company's maximum exposure was $3.5 million as of August 31, 2013.
67
NOTE 13.19. EARNINGS (LOSS) PER SHARE ATTRIBUTABLE TO CMC
In calculating earnings (loss) per share, there were no adjustments to net earnings (loss) to arrive at earnings (loss) for any yearsperiods presented. The reconciliation of the denominators of the earnings (loss) per share calculations areis as follows at August 31:follows:
| 2010 | 2009 | 2008 | ||||||||||
| Shares outstanding for basic earnings (loss) per share | 113,524,836 | 112,391,180 | 115,048,512 | |||||||||
| Effect of dilutive securities: | ||||||||||||
| Stock-based incentive/purchase plans | — | 1,489,195 | 2,637,241 | |||||||||
| Shares outstanding for diluted earnings (loss) per share | 113,524,836 | 113,880,375 | 117,685,753 | |||||||||
| August 31, | |||||||||
| 2013 | 2012 | 2011 | |||||||
| Shares outstanding for basic earnings (loss) per share | 116,677,836 | 115,861,986 | 114,995,616 | ||||||
| Effect of dilutive securities: | |||||||||
| Stock-based incentive/purchase plans | 875,116 | 921,174 | 1,115,507 | ||||||
| Shares outstanding for diluted earnings (loss) per share | 117,552,952 | 116,783,160 | 116,111,123 | ||||||
For the yearyears ended August 31, 2010, no stock options, restricted stock or SARs were included in the calculation of dilutive shares because the Company recorded a loss from continuing operations. All of the Company’s outstanding stock options2013, 2012 and restricted stock were dilutive at August 31, 2009 and 2008 based on the average share price of $16.62 and $32.55, respectively.2011 SARs with total share commitments of 2,879,7071.5 million, 2.8 million and 2,414,0272.3 million respectively, were antidilutive at August 31, 2009 and 2008.therefore excluded from the calculation of diluted earnings per share. All stock options and SARs expire by 2017.2020.
The Company’sCompany's restricted stock is included in the number of shares of common stock issued and outstanding, but omitted from the basic earnings (loss) per share calculation until the shares vest.
NOTE 14.20. ACCRUED EXPENSES AND OTHER PAYABLES
| August 31, | ||||||||
| (in thousands) | 2010 | 2009 | ||||||
| Salaries and incentive compensation | $ | 61,260 | $ | 67,425 | ||||
| Advance billings on contracts | 42,549 | 47,253 | ||||||
| Taxes other than income taxes | 35,252 | 20,030 | ||||||
| Contract losses | 28,328 | 24,492 | ||||||
| Insurance | 27,914 | 17,540 | ||||||
| Legal and other professional services | 18,098 | 11,493 | ||||||
| Unrecognized tax benefits | 14,095 | — | ||||||
| Freight and other selling expenses | 10,924 | 34,007 | ||||||
| Interest | 9,970 | 9,875 | ||||||
| Derivative liability | 5,758 | 16,771 | ||||||
| Employees’ retirement plans | 4,593 | 2,941 | ||||||
| Environmental | 3,895 | 8,088 | ||||||
| Other | 62,261 | 67,297 | ||||||
| $ | 324,897 | $ | 327,212 | |||||
Significant accrued expenses and other payables were as follows:
| August 31, | ||||||||
| (in thousands) | 2013 | 2012 | ||||||
| Salaries and incentive compensation | $ | 77,849 | $ | 88,717 | ||||
| Advance billings on contracts | 53,089 | 65,241 | ||||||
| Taxes other than income taxes | 46,480 | 38,024 | ||||||
| Insurance | 24,911 | 27,646 | ||||||
| Contract losses | 5,621 | 3,784 | ||||||
NOTE 15.21. BUSINESS SEGMENTS
The Company’s reportableCompany's reporting segments are based on strategic business areas, which offer different products and services. These segments have different lines of management responsibility as each business requires different marketing strategies and management expertise.
The Americas Recycling segment consistsprocesses scrap metals for use as a raw material by manufacturers of the scrapnew metal processing and sales operations primarily in Texas, Florida and the southern United States including the scrap processing facilities which directly support the Company’s domestic steel mills.products. The Americas Mills segment includes the Company’s domesticmanufactures finished long steel minimills, its micro mill,products including rebar, merchant bar, light structural, some special bar quality (SBQ) and the copper tube minimill. The copper tube minimill is aggregated with the Company’s steel mills because it has similar economic characteristics.other special sections as well as semi-finished billets for re-rolling and forging applications. The Americas Fabrication segment consists of the Company’sCompany's rebar
68
and structural fabrication operations, fence post manufacturing plants, construction-related product facilities and other products facilities.plants that heat-treat steel to strengthen and provide flexibility. The International MillsMill segment includes the minimills in PolandCompany's minimill and Croatia,the Company's recycling operations in Poland and fabrication operations in Europe, which have been presented as a separate segment because the economic characteristics of their markets and the regulatory environment in which they operate are different from that of the Company’s domestic mills and rebar fabrication operations.Poland. The International Marketing and Distribution segment includes international operations for
the sales,sale, distribution and processing of steel products, ferrous and nonferrous metals and other industrial products. Additionally, the International Marketing and Distributionthis segment includes the Company’s two U.S. based tradingCompany's U.S.-based marketing and distribution divisions CMC Cometals and CMC Cometals — Steel (previously CMC Dallas Trading). The international distribution operations consist only of physical transactions and not positions taken for speculation.also operates a recycling facility in Singapore. Corporate contains expenses of the Company’sCompany's corporate headquarters expenses related to its deployment of SAP software, and interest expense relatingrelated to its long-term public debt and commercial paper program.debt.
The financial information presented for the Americas FabricationInternational Mill segment excludes its joist and deck fabricationCMCS operations. Additionally, the financial information presented for the International Marketing and DistributionAmericas Mills segment excludes its copper, aluminum, and stainless steel import operating division.Howell. These operations have been classified as discontinued operations in the consolidated statements of operations. See Note 5,10, Businesses Held for Sale, Discontinued Operations and Dispositions for more detailed information.
The Company uses adjusted operating profit (loss) to measure segment performance.the financial performance of its segments. Intersegment sales are generally priced at prevailing market prices. Certain corporate administrative expenses are allocated to segments based upon the nature of the expense. The accounting policies of the segments are the same as those described in the summary of significant accounting policies.
The following is a summary of certain financial information from continuing operations by reportable segment:
| Americas | International | |||||||||||||||||||||||||||||||
| Marketing | ||||||||||||||||||||||||||||||||
| and | ||||||||||||||||||||||||||||||||
| Recycling | Mills | Fabrication | Mills | Distribution | Corporate | Eliminations | Consolidated | |||||||||||||||||||||||||
| 2010 | ||||||||||||||||||||||||||||||||
| Net sales-unaffiliated customers | $ | 1,208,651 | $ | 872,178 | $ | 1,131,928 | $ | 650,404 | $ | 2,439,018 | $ | 3,923 | $ | — | $ | 6,306,102 | ||||||||||||||||
| Intersegment sales | 215,821 | 523,236 | 8,349 | 113,574 | 24,396 | 326 | (885,702 | ) | — | |||||||||||||||||||||||
| Net sales | 1,424,472 | 1,395,414 | 1,140,277 | 763,978 | 2,463,414 | 4,249 | (885,702 | ) | 6,306,102 | |||||||||||||||||||||||
| Adjusted operating profit (loss) | 15,196 | 33,295 | (107,800 | ) | (73,484 | ) | 74,689 | (70,678 | ) | 3,636 | (125,146 | ) | ||||||||||||||||||||
| Interest expense* | 328 | 11,894 | 9,076 | 11,425 | 3,273 | 39,512 | — | 75,508 | ||||||||||||||||||||||||
| Capital expenditures | 6,689 | 30,985 | 2,948 | 72,468 | 7,118 | 6,913 | — | 127,121 | ||||||||||||||||||||||||
| Depreciation and amortization** | 20,590 | 50,527 | 42,777 | 31,010 | 5,021 | 18,512 | — | 168,437 | ||||||||||||||||||||||||
| Goodwill | 7,467 | 95 | 57,144 | 2,820 | 4,054 | — | — | 71,580 | ||||||||||||||||||||||||
| Total assets | 265,015 | 586,371 | 660,503 | 703,589 | 732,900 | 1,083,744 | (325,969 | ) | 3,706,153 | |||||||||||||||||||||||
| 2009 | ||||||||||||||||||||||||||||||||
| Net sales-unaffiliated customers | $ | 625,858 | $ | 773,965 | $ | 1,591,058 | $ | 655,599 | $ | 2,773,505 | $ | (10,609 | ) | $ | — | $ | 6,409,376 | |||||||||||||||
| Intersegment sales | 159,530 | 479,433 | 5,424 | 98,360 | 53,179 | — | (795,926 | ) | — | |||||||||||||||||||||||
| Net sales | 785,388 | 1,253,398 | 1,596,482 | 753,959 | 2,826,684 | (10,609 | ) | (795,926 | ) | 6,409,376 | ||||||||||||||||||||||
| Adjusted operating profit (loss) | (89,576 | ) | 263,393 | 145,672 | (96,030 | ) | (53,102 | ) | (94,813 | ) | 8,218 | 83,762 | ||||||||||||||||||||
| Interest expense* | 198 | (6,994 | ) | (543 | ) | 3,059 | 4,648 | 76,596 | — | 76,964 | ||||||||||||||||||||||
| Capital expenditures | 28,281 | 122,719 | 18,602 | 152,194 | 11,487 | 36,411 | — | 369,694 | ||||||||||||||||||||||||
| Depreciation and amortization** | 21,352 | 38,543 | 46,837 | 25,793 | 3,271 | 15,570 | — | 151,366 | ||||||||||||||||||||||||
| Goodwill | 7,467 | 95 | 58,878 | 2,920 | 4,876 | — | — | 74,236 | ||||||||||||||||||||||||
| Total assets | 257,084 | 585,763 | 857,198 | 625,135 | 687,738 | 956,802 | (282,164 | ) | 3,687,556 | |||||||||||||||||||||||
| 2008 | ||||||||||||||||||||||||||||||||
| Net sales-unaffiliated customers | $ | 1,820,607 | $ | 1,387,290 | $ | 1,728,826 | $ | 1,100,785 | $ | 3,860,984 | $ | (1,855 | ) | $ | — | $ | 9,896,637 | |||||||||||||||
| Intersegment sales | 369,112 | 578,980 | 11,770 | 132,588 | 114,281 | — | (1,206,731 | ) | — | |||||||||||||||||||||||
| Net sales | 2,189,719 | 1,966,270 | 1,740,596 | 1,233,373 | 3,975,265 | (1,855 | ) | (1,206,731 | ) | 9,896,637 | ||||||||||||||||||||||
| Adjusted operating profit (loss) | 145,751 | 207,756 | (8,639 | ) | 99,660 | 82,144 | (99,481 | ) | (446 | ) | 426,745 | |||||||||||||||||||||
| Interest expense* | (5,426 | ) | (10,329 | ) | 12,941 | 10,740 | 16,435 | 33,893 | — | 58,254 | ||||||||||||||||||||||
| Capital expenditures | 52,299 | 78,319 | 45,234 | 112,608 | 4,774 | 61,807 | — | 355,041 | ||||||||||||||||||||||||
| Depreciation and amortization** | 19,129 | 35,340 | 29,168 | 29,397 | 2,835 | 8,525 | — | 124,394 | ||||||||||||||||||||||||
| Goodwill | 7,467 | — | 68,398 | 3,805 | 5,167 | — | — | 84,837 | ||||||||||||||||||||||||
| Total assets | 435,008 | 630,612 | 1,237,448 | 743,654 | 1,267,208 | 983,329 | (550,888 | ) | 4,746,371 | |||||||||||||||||||||||
69
| Americas | International | |||||||||||||||||||||||||||||||
| (in thousands) | Recycling | Mills | Fabrication | Mill | Marketing and Distribution | Corporate | Eliminations | Continuing Operations | ||||||||||||||||||||||||
| 2013 | ||||||||||||||||||||||||||||||||
| Net sales-unaffiliated customers | $ | 1,225,604 | $ | 1,060,337 | $ | 1,427,785 | $ | 819,889 | $ | 2,344,128 | $ | 11,832 | $ | — | $ | 6,889,575 | ||||||||||||||||
| Intersegment sales | 166,145 | 759,183 | 14,906 | 6,155 | 11,444 | — | (957,833 | ) | — | |||||||||||||||||||||||
| Net sales | 1,391,749 | 1,819,520 | 1,442,691 | 826,044 | 2,355,572 | 11,832 | (957,833 | ) | 6,889,575 | |||||||||||||||||||||||
| Adjusted operating profit (loss) | 3,170 | 204,333 | 28,033 | 890 | 35,617 | (66,453 | ) | 848 | 206,438 | |||||||||||||||||||||||
| Interest expense* | 9 | (101 | ) | 83 | 992 | 4,369 | 64,256 | — | 69,608 | |||||||||||||||||||||||
| Capital expenditures** | 21,261 | 37,216 | 5,605 | 15,155 | 1,015 | 7,552 | — | 87,804 | ||||||||||||||||||||||||
| Depreciation and amortization*** | 13,453 | 42,925 | 22,302 | 33,238 | 17,988 | 21,096 | — | 151,002 | ||||||||||||||||||||||||
| Total assets**** | 309,599 | 598,478 | 631,510 | 487,613 | 838,413 | 1,075,594 | (496,946 | ) | 3,444,261 | |||||||||||||||||||||||
| 2012 | ||||||||||||||||||||||||||||||||
| Net sales-unaffiliated customers | $ | 1,418,717 | $ | 1,206,651 | $ | 1,366,944 | $ | 955,730 | $ | 2,700,300 | $ | 8,033 | $ | — | $ | 7,656,375 | ||||||||||||||||
| Intersegment sales | 187,444 | 777,070 | 14,694 | 77,627 | 27,019 | — | (1,083,854 | ) | — | |||||||||||||||||||||||
| Net sales | 1,606,161 | 1,983,721 | 1,381,638 | 1,033,357 | 2,727,319 | 8,033 | (1,083,854 | ) | 7,656,375 | |||||||||||||||||||||||
| Adjusted operating profit (loss) | 39,446 | 235,918 | (15,697 | ) | 23,044 | 47,287 | (83,035 | ) | (6,251 | ) | 240,712 | |||||||||||||||||||||
| Interest expense* | 1,933 | 12,995 | 10,809 | 10,090 | 6,548 | 27,112 | — | 69,487 | ||||||||||||||||||||||||
| Capital expenditures** | 40,329 | 38,140 | 4,389 | 14,016 | 3,314 | 8,197 | — | 108,385 | ||||||||||||||||||||||||
| Depreciation and amortization*** | 13,260 | 40,704 | 22,056 | 32,306 | 5,821 | 20,295 | — | 134,442 | ||||||||||||||||||||||||
| Total assets**** | 285,136 | 615,070 | 629,970 | 529,160 | 870,933 | 961,654 | (494,053 | ) | 3,397,870 | |||||||||||||||||||||||
| 2011 | ||||||||||||||||||||||||||||||||
| Net sales-unaffiliated customers | $ | 1,692,824 | $ | 1,111,483 | $ | 1,208,823 | $ | 1,043,267 | $ | 2,603,494 | $ | 6,882 | $ | — | $ | 7,666,773 | ||||||||||||||||
| Intersegment sales | 136,713 | 728,235 | 16,899 | 2,966 | 47,405 | — | (932,218 | ) | — | |||||||||||||||||||||||
| Net sales | 1,829,537 | 1,839,718 | 1,225,722 | 1,046,233 | 2,650,899 | 6,882 | (932,218 | ) | 7,666,773 | |||||||||||||||||||||||
| Adjusted operating profit (loss) | 43,059 | 149,213 | (129,141 | ) | 47,594 | 76,337 | (84,729 | ) | (1,275 | ) | 101,058 | |||||||||||||||||||||
| Interest expense* | 246 | 12,894 | 9,717 | 18,251 | 2,173 | 26,533 | — | 69,814 | ||||||||||||||||||||||||
| Capital expenditures** | 7,666 | 24,169 | 2,029 | 14,278 | 2,873 | 7,896 | — | 58,911 | ||||||||||||||||||||||||
| Depreciation and amortization*** | 12,860 | 49,264 | 48,299 | 36,528 | 4,600 | 23,916 | — | 175,467 | ||||||||||||||||||||||||
| Total assets**** | 278,120 | 587,053 | 590,278 | 643,748 | 990,111 | 1,505,672 | (1,047,716 | ) | 3,547,266 | |||||||||||||||||||||||
________________________
* Includes intercompany interest expense (income) in the segments and is all eliminated within Corporate.
** Excludes capital expenditures from discontinued operations of $1.2 million, $5.5 million and $14.3 million for the years ended August 31, 2013, 2012 and 2011, respectively.
*** Includes asset impairment charges.
**** Excludes total assets from discontinued operations of $50.5 million at August 31, 2013, $43.4 million at August 31, 2012 and $135.9 million at August 31, 2011.
The following table provides a reconciliation of consolidated adjusted operating profit to net earnings (loss) from continuing operations attributable to CMC:
| Year ended August 31, | ||||||||||||
| (in thousands) | 2010 | 2009 | 2008 | |||||||||
| Net earnings (loss) from continuing operations attributable to CMC | $ | (166,724 | ) | $ | 1,737 | $ | 244,645 | |||||
| Noncontrolling interests | 236 | (550 | ) | 538 | ||||||||
| Income taxes (benefit) | (38,118 | ) | 747 | 112,275 | ||||||||
| Interest expense | 75,508 | 76,964 | 58,254 | |||||||||
| Discounts on sales of accounts receivable | 3,952 | 4,864 | 11,033 | |||||||||
| Adjusted operating profit (loss) from continuing operations | $ | (125,146 | ) | $ | 83,762 | $ | 426,745 | |||||
| Adjusted operating profit (loss) from discontinued operations | (59,755 | ) | 32,622 | (18,881 | ) | |||||||
| Adjusted operating profit (loss) | $ | (184,901 | ) | $ | 116,384 | $ | 407,864 | |||||
| Year Ended August 31, | ||||||||||||
| (in thousands) | 2013 | 2012 | 2011 | |||||||||
| Earnings from continuing operations | $ | 74,957 | $ | 210,549 | $ | 11,539 | ||||||
| Income taxes (benefit) | 57,979 | (45,762 | ) | 14,592 | ||||||||
| Interest expense | 69,608 | 69,487 | 69,814 | |||||||||
| Discounts on sales of accounts receivable | 3,894 | 6,438 | 5,113 | |||||||||
| Adjusted operating profit from continuing operations | $ | 206,438 | $ | 240,712 | $ | 101,058 | ||||||
Adjusted operating profit (loss) from discontinued operations for the years ended August 31, 2013, 2012 and 2011 was $3.7 million, $(10.7) million and $(138.2) million, respectively.
The following represents the Company’sCompany's external net sales from continuing operations by major product and geographic area:
| Year ended August 31, | ||||||||||||
| (in thousands) | 2010 | 2009 | 2008 | |||||||||
| Steel products | $ | 3,637,631 | $ | 4,351,569 | $ | 6,097,107 | ||||||
| Industrial materials | 913,019 | 885,333 | 1,247,907 | |||||||||
| Nonferrous scrap | 702,467 | 411,490 | 1,006,456 | |||||||||
| Ferrous scrap | 561,119 | 260,755 | 861,106 | |||||||||
| Construction materials | 230,294 | 288,707 | 327,732 | |||||||||
| Nonferrous products | 178,844 | 150,461 | 273,790 | |||||||||
| Other | 82,728 | 61,061 | 82,539 | |||||||||
| Net sales* | $ | 6,306,102 | $ | 6,409,376 | $ | 9,896,637 | ||||||
| Geographic area: | ||||||||||||
| United States | $ | 3,215,337 | $ | 3,678,447 | $ | 5,305,658 | ||||||
| Europe | 1,290,907 | 1,272,621 | 2,399,859 | |||||||||
| Asia | 1,059,673 | 727,681 | 955,800 | |||||||||
| Australia/New Zealand | 531,595 | 533,528 | 636,760 | |||||||||
| Other | 208,590 | 197,099 | 598,560 | |||||||||
| Net sales* | $ | 6,306,102 | $ | 6,409,376 | $ | 9,896,637 | ||||||
| Year Ended August 31, | ||||||||||||
| (in thousands) | 2013 | 2012 | 2011 | |||||||||
| Major product information: | ||||||||||||
| Steel products | $ | 4,318,072 | $ | 4,699,226 | $ | 4,412,810 | ||||||
| Industrial materials | 928,472 | 1,147,386 | 1,134,819 | |||||||||
| Nonferrous scrap | 682,611 | 765,349 | 997,717 | |||||||||
| Ferrous scrap | 646,263 | 763,772 | 805,067 | |||||||||
| Construction materials | 189,046 | 177,827 | 217,741 | |||||||||
| Nonferrous products | 5,674 | 2,689 | 2,573 | |||||||||
| Other | 119,437 | 100,126 | 96,046 | |||||||||
| Net sales | $ | 6,889,575 | $ | 7,656,375 | $ | 7,666,773 | ||||||
| Year Ended August 31, | ||||||||||||
| (in thousands) | 2013 | 2012 | 2011 | |||||||||
| Geographic area: | ||||||||||||
| United States | $ | 4,107,231 | $ | 4,503,786 | $ | 4,166,960 | ||||||
| Europe | 1,108,196 | 1,313,611 | 1,581,688 | |||||||||
| Asia | 1,094,458 | 1,018,675 | 1,131,332 | |||||||||
| Australia/New Zealand | 488,108 | 617,919 | 564,084 | |||||||||
| Other | 91,582 | 202,384 | 222,709 | |||||||||
| Net sales | $ | 6,889,575 | $ | 7,656,375 | $ | 7,666,773 | ||||||
The following table represents long-lived assets by geographic area:
| Year ended August 31, | ||||||||||||
| (in thousands) | 2010 | 2009 | 2008 | |||||||||
| United States | $ | 1,062,080 | $ | 1,186,624 | $ | 1,132,775 | ||||||
| Europe | 443,986 | 462,412 | 356,667 | |||||||||
| Australia/New Zealand | 16,725 | 19,286 | 19,164 | |||||||||
| Other | 8,156 | 21,682 | 20,322 | |||||||||
| Total long-lived assets | $ | 1,530,947 | $ | 1,690,004 | $ | 1,528,928 | ||||||
70
| August 31, | ||||||||||||
| (in thousands) | 2013 | 2012 | 2011 | |||||||||
| United States | $ | 868,643 | $ | 907,009 | $ | 944,851 | ||||||
| Europe | 239,899 | 250,392 | 364,207 | |||||||||
| Australia/New Zealand | 12,446 | 36,097 | 38,973 | |||||||||
| Other | 7,618 | 7,917 | 8,847 | |||||||||
| Total long-lived assets | $ | 1,128,606 | $ | 1,201,415 | $ | 1,356,878 | ||||||
NOTE 16.22. QUARTERLY FINANCIAL DATA (UNAUDITED)
Summarized quarterly financial data for fiscal 2010, 20092013 and 20082012 are as follows (in thousands except per share data):
| Three Months Ended 2010 | ||||||||||||||||
| Nov. 30 | Feb. 28 | May 31 | Aug. 31 | |||||||||||||
| Net sales* | $ | 1,402,258 | $ | 1,322,443 | $ | 1,765,154 | $ | 1,816,247 | ||||||||
| Gross profit* | 107,763 | 8,614 | 119,904 | 158,756 | ||||||||||||
| Net earnings (loss) attributable to CMC | (31,229 | ) | (173,290 | ) | (8,826 | ) | 8,001 | |||||||||
| Basic EPS (loss) attributable to CMC | (0.28 | ) | (1.53 | ) | (0.08 | ) | 0.07 | |||||||||
| Diluted EPS (loss) attributable to CMC | (0.28 | ) | (1.53 | ) | (0.08 | ) | 0.07 | |||||||||
| Three Months Ended 2009 | ||||||||||||||||
| Nov. 30 | Feb. 29 | May 31 | Aug. 31 | |||||||||||||
| Net sales* | $ | 2,232,230 | $ | 1,507,460 | $ | 1,258,237 | $ | 1,411,449 | ||||||||
| Gross profit* | 235,308 | 134,090 | 179,383 | 148,248 | ||||||||||||
| Net earnings (loss) attributable to CMC | 62,006 | (35,307 | ) | (13,077 | ) | 7,180 | ||||||||||
| Basic EPS (loss) attributable to CMC | 0.55 | (0.32 | ) | (0.12 | ) | 0.06 | ||||||||||
| Diluted EPS (loss) attributable to CMC | 0.54 | (0.32 | ) | (0.12 | ) | 0.06 | ||||||||||
| Three Months Ended 2008 | ||||||||||||||||
| Nov. 30 | Feb. 28 | May 31 | Aug. 31 | |||||||||||||
| Net sales* | $ | 1,970,711 | $ | 2,137,744 | $ | 2,777,336 | $ | 3,010,846 | ||||||||
| Gross profit* | 236,914 | 225,903 | 289,198 | 315,987 | ||||||||||||
| Net earnings attributable to CMC | 69,164 | 39,775 | 59,484 | 63,543 | ||||||||||||
| Basic EPS attributable to CMC | 0.59 | 0.35 | 0.52 | 0.56 | ||||||||||||
| Diluted EPS attributable to CMC | 0.57 | 0.34 | 0.51 | 0.55 | ||||||||||||
| Three Months Ended 2013 | ||||||||||||||||
| Nov. 30 | Feb. 28 | May 31 | Aug. 31 | |||||||||||||
| Net sales* | $ | 1,749,515 | $ | 1,688,665 | $ | 1,752,534 | $ | 1,698,861 | ||||||||
| Gross profit* | 186,665 | 139,365 | 175,519 | 160,788 | ||||||||||||
| Net earnings attributable to CMC | 49,717 | 4,577 | 18,964 | 4,057 | ||||||||||||
| Basic EPS attributable to CMC | 0.43 | 0.04 | 0.16 | 0.03 | ||||||||||||
| Diluted EPS attributable to CMC | 0.42 | 0.04 | 0.16 | 0.03 | ||||||||||||
| Three Months Ended 2012 | ||||||||||||||||
| Nov. 30 | Feb. 29 | May 31 | Aug. 31 | |||||||||||||
| Net sales* | $ | 1,947,473 | $ | 1,918,049 | $ | 1,957,827 | $ | 1,833,026 | ||||||||
| Gross profit* | 171,641 | 179,058 | 186,490 | 179,438 | ||||||||||||
| Net earnings attributable to CMC | 107,734 | 28,853 | 40,682 | 30,215 | ||||||||||||
| Basic EPS attributable to CMC | 0.93 | 0.25 | 0.35 | 0.26 | ||||||||||||
| Diluted EPS attributable to CMC | 0.93 | 0.25 | 0.35 | 0.26 | ||||||||||||
_________________________
* Excludes divisions classified as discontinued operations. See Note 10, Businesses Held for Sale, Discontinued Operations and Dispositions.
NOTE 17.23. RELATED PARTY TRANSACTIONS
The Company had no significant related party transactions for the years ended August 31, 2013 and 2012, respectively.
During the first quarter of fiscal 2013, the Company completed the sale of its 11% ownership interest in Trinecke. See Note 10, Businesses Held for Sale, Discontinued Operations and Disposals.
During 2011, the Company sold two joint ventures for approximately $8.3 million, resulting in a minimal gain. Net sales from related party transactions were $135.3 million and total purchases were $150.9 million for the year ended August 31, 2011.
NOTE 24. SUBSEQUENT EVENTS
On October 17, 2013, the Company sold all of the Company’s international subsidiaries has a marketingstock of Howell, its wholly-owned copper tube manufacturing operation, for $58.5 million, subject to customary purchase price adjustments. See Note 10, Businesses Held for Sale, Discontinued Operations and distribution agreement with a key supplier of which the Company owns an 11% interest. This marketing and distribution agreement expires on December 31, 2010. The following presents related party transactions:Disposals for additional information.
| Year ended August 31, | ||||||||||||
| (in thousands) | 2010 | 2009 | 2008 | |||||||||
| Sales | $ | 329,380 | $ | 275,012 | $ | 396,739 | ||||||
| Purchases | 352,822 | 338,877 | 420,909 | |||||||||
| Year ended August 31, | |||||||||||
| (in thousands) | 2010 | 2009 | |||||||||
| Accounts Receivable | $ | 10,611 | $ | 12,664 | |||||||
| Accounts Payable | 22,603 | 17,012 | |||||||||
ITEM 9. CHANGES IN AND DISAGREEMENTS WITH ACCOUNTANTS ON ACCOUNTING AND FINANCIAL DISCLOSURE
Not applicable.
ITEM 9A. CONTROLS AND PROCEDURES
(a) Evaluation of Disclosure Controls and Procedures.The term “disclosure"disclosure controls and procedures”procedures" is defined in Rules 13a-15(e) and 15d-15(e) of the Securities Exchange Act of 1934, or the Exchange Act. This term refers to the controls and procedures of a company that are designed to ensure that information required to be disclosed by a company in the reports that it files under the Exchange Act is recorded, processed, summarized and reported within required time periods, including controls and disclosures designed to ensure that this information is accumulated and communicated to the Company’scompany's management, including its Chief Executive Officer and Chief Financial Officer, as appropriate, to allow timely decisions regarding required disclosure. Our Chief Executive Officer and our Chief Financial Officer have evaluated the effectiveness of our disclosure controls and procedures as of the end of the
71
period covered by this Annual Report on Form 10-K, and they have concluded that as of that date, our disclosure controls and procedures were effective.
(b) Management’sManagement's Report on Internal Control Over Financial Reporting.Management concluded that, as of August 31, 2010,2013, our internal control over financial reporting was effective. Our Management’sManagement's Report on Internal Control Over Financial Reporting, as of August 31, 2010,2013, can be found on page 4341 of this Form 10-K, and the related Report of Our Independent Registered Public Accounting Firm, Deloitte & Touche LLP, on Internal Control Over Financial Reporting can be found on page 4442 of this Form 10-K, each of which is incorporated by reference into this Item 9A.
(c) Changes in Internal Control Over Financial Reporting. No changeWe have an ongoing initiative to implement a new enterprise information system (the "Recy system") in our recycling businesses. We substantially completed implementing the Recy system in the United States in fiscal 2013 and continue to evaluate expanding the Recy system to our non-U.S. recycling facilities in fiscal 2014 and beyond. Management believes the necessary procedures are in place to maintain effective internal control over financial reporting as the implementation continues.
Other than this item, no other changes in our internal control over financial reporting occurred during our last fiscal quarter that has materially affected, or is reasonably likely to materially affect, our internal control over our financial reporting.
75
ITEM 9B. OTHER INFORMATION
On October 28, 2013, the Company announced that the Company and Ann J. Bruder, Senior Vice President of Law, Government Affairs and Global Compliance and General Counsel, have mutually agreed that Ms. Bruder would separate from her position as an officer of the Company as of October 22, 2013 and will leave her employment with the Company effective November 25, 2013 (the "Separation Date").
In connection with her departure, the Company and Ms. Bruder entered into a Transition and Separation Agreement (the "Agreement") on October 28, 2013. Except as provided in the Agreement, the Agreement supersedes (a) the Terms and Conditions of Stock Award, Employment and Separation Agreement, dated June 1, 2010, between Ms. Bruder and the Company, as amended by the First Amendment to Employment Agreement, dated February 1, 2013, and (b) the Commercial Metals Company Executive Employment Continuity Agreement, dated as of May 20, 2008, between Ms. Bruder and the Company, as amended and restated as of October 19, 2009. During the period ending May 25, 2015, the Agreement prohibits Ms. Bruder from directly or indirectly competing with the Company; consulting with, providing information to or performing services for any person or entity that Ms. Bruder knows (after reasonable inquiry) is considering or pursuing an acquisition of the Company or an investment in the Company of more than $25,000; and directly or indirectly soliciting customers or employees of the Company. In addition, Ms. Bruder has agreed to certain ongoing cooperation obligations contained in the Agreement.
In consideration for Ms. Bruder’s release and waiver of claims and agreement to comply with the non-competition and non-solicitation obligations referenced in the Agreement, the Company agreed to pay Ms. Bruder: (i) a lump sum payment in the gross amount of $830,000, which is equivalent to two years annual base salary; (ii) Ms. Bruder’s fiscal year 2013 annual performance bonus in the gross amount of $111,000; (iii) continuation of existing health benefits and certain other perquisites through the Separation Date; (iv) Company fully-subsidized COBRA coverage continuing through May 25, 2015; and (v) to the extent permitted under the applicable plan, vesting of all previously unvested employer contributions to Ms. Bruder’s account in the Commercial Metals Company Profit Sharing and 401(k) Plan, the Commercial Metals Companies 2005 Benefits Restoration Plan and the Commercial Metals Companies Benefit Restoration Plan established September 1, 1995 on the Separation Date and a credit to Ms. Bruder’s accounts in such plans for any employer contributions attributable to the plan year during which the Separation Date occurs that would have otherwise been made had she remained employed by the Company. Also in consideration for Ms. Bruder’s release and waiver of claims and agreement to comply with the non-competition obligations referenced in the Agreement, the Company agreed to the following with respect to Ms. Bruder’s outstanding equity awards: (A) accelerated vesting of 16,500 time-vested restricted stock units ("RSUs") granted on June 3, 2010, (B) accelerated vesting through the Separation Date of 2,509 of the 2,964 outstanding time-vested RSUs granted on January 18, 2011 and 683 of the 16,073 outstanding time-vested RSUs granted on October 23, 2012, (C) in accordance with the terms of her award agreement, vesting on November 23, 2013 of 5,241 outstanding time-vested RSUs granted on November 23, 2011, (D) in accordance with the terms of her award agreement, vesting on November 23, 2013 of 15,720 stock appreciation rights ("SARs") granted on November 23, 2011, (E) the payment of the equivalent value of the prorated portion of performance stock units ("PSUs") granted on November 23, 2011 and the payment of the equivalent value of the prorated portion of PSUs granted on October 23, 2012, in each case, in the event the Company achieves all of the vesting criteria and the stock awards vest en mass (notwithstanding the provision of Ms. Bruder’s applicable award agreements mandating forfeiture of unvested PSUs upon departure from the Company) and (F) the extension until May 20, 2015 of the exercise period for the 13,000 SARs that were granted to Ms. Bruder on May 20, 2008 and that were vested and outstanding on the date of the Agreement.
The foregoing summary of the Agreement is qualified in its entirety by reference to the Agreement itself, a copy of which is filed as Exhibit 10(iii)(bb) to this report and is hereby incorporated herein by reference.
PART III
ITEM 10. DIRECTORS, EXECUTIVE OFFICERS AND CORPORATE GOVERNANCE
Some of the information required in response to this item with regard to directors is incorporated by reference into this Annual Report on Form 10-K from our definitive proxy statement for theour 2014 annual meeting of stockholders to be held January 17, 2011, which(such proxy statement, the "2014 Proxy Statement"). Such information will be filed no later than 120 days afterincluded in the close2014 Proxy Statement under the captions "Election of our fiscal year. The following is a listing of employees we believe to be our “Executive Officers” as of October 29, 2010, as defined under Rule 3b-7 of the Securities Exchange Act of 1934:Directors," "Certain Relationships and Related Person Transactions," "Section 16(a) Beneficial Ownership Reporting Compliance," "Audit Committee" and "Corporate Governance; Board and Committee Matters."
| NAME | CURRENT TITLE & POSITION | AGE | EXECUTIVE OFFICER SINCE | |||||||
| Joseph Alvarado | Executive Vice President and Chief Operating Officer | 58 | 2010 | |||||||
| Ann J. Bruder | Senior Vice President of Law, Government Affairs and Global Compliance, General Counsel and Corporate Secretary | 45 | 2009 | |||||||
| Louis A. Federle | Vice President and Treasurer | 62 | 1999 | |||||||
| William B. Larson | Senior Vice President and Chief Financial Officer | 57 | 1995 | |||||||
| Murray R. McClean | President, Chief Executive Officer and Chairman of the Board of Directors | 62 | 1995 | |||||||
| Tracy L. Porter | Senior Vice President Commercial Metals Company and President CMC Americas Division | 53 | 2010 | |||||||
| Leon K. Rusch | Vice President and Controller | 59 | 2006 | |||||||
| Devesh Sharma | Senior Vice President, Business Development and Business Processes | 47 | 2010 | |||||||
| Hanns K. Zoellner | Executive Vice President Commercial Metals Company and President CMC International Division | 62 | 2004 | |||||||
| EXECUTIVE | |||||||
| NAME | CURRENT TITLE & POSITION | AGE | OFFICER SINCE | ||||
| Joseph Alvarado | Chairman of the Board, President and Chief Executive Officer | 61 | 2010 | ||||
| Adam B. Batchelor | Vice President of Strategy and Planning | 32 | 2013 | ||||
| Carey J. Dubois | Vice President and Treasurer | 53 | 2012 | ||||
| John Elmore | Senior Vice President and President of CMC International | 55 | 2012 | ||||
| Adam R. Hickey | Vice President and Controller | 38 | 2012 | ||||
| Paul K. Kirkpatrick | Vice President, General Counsel and Corporate Secretary | 42 | 2013 | ||||
| Tracy L. Porter | Senior Vice President and President, CMC Americas Division | 56 | 2010 | ||||
| Barbara R. Smith | Senior Vice President and Chief Financial Officer | 54 | 2011 | ||||
Our Board of Directors usually elects officers at its first meeting after our annual stockholders meeting. Our executive officers continue to serve for terms set from time to time by the Board of Directors in its discretion.
72
Joseph Alvarado was hired by the Company in April 2010, as Executive Vice President and Chief Operating Officer. From 2004 to 2007, Mr. Alvarado was employed as President and Chief Operating Officer at Lone Star Technologies, Inc., a Dallas, Texas-based company and manufacturer and marketer of alloy and carbon welded oil country tubular goods and line pipe. In 2007, U.S. Steel, a steel producer, acquired Lone Star Technologies, Inc. and named him President, U.S. Steel Tubular Products. After joining our Company in 2010, he was named President and Chief Operating Officer on April 6, 2011, and in June, 2011, he was appointed President and Chief Executive Officer effective September 1, 2011. He was appointed to our Board of Directors on September 1, 2011 and was named Chairman of the Board of Directors on January 1, 2013.
In August 2011, Adam B. Batchelor joined the Company as Director of Financial Planning and Analysis. He was appointed Senior Director in September 2012 and Vice President of Strategy and Planning in August 2013. Prior to joining the Company, he was an associate at Oliver Wyman from 2003 to 2009 and an associate at Wingate Partners from 2009 to 2011.
Carey J. Dubois was hired by the Company in January 2012 as Vice President and Treasurer. Prior to his appointment at CMC, Mr. Dubois served as Vice President and Treasurer for Peabody Energy Corporation, which he joined after he was employed by Smithfield Foods, Inc. where he served most recently as Vice President, Finance, and in other key financial roles, from 2005.
In July 2012, John Elmore joined the Company as Senior Vice President and President of CMC International. Prior to joining the Company, Mr. Elmore was Group Director of Jindal Steel and Power based in New Delhi, a leading international company in the steel, power, mining, oil and gas and infrastructure sectors straddling across Asia, Africa, Australia, South America and Georgia from November 2009. Previously, he was President and Chief Executive Officer of Minnesota Steel Industries in Minneapolis from March 2005 to December 2007.
Adam R. Hickey was appointed Vice President and Controller of the Company in April 2012. Mr. Hickey joined the Company in February 2004 as a Senior Accountant. Since 2006, Mr. Hickey has held various positions within the Company, including Manager of Cost & Planning, Assistant Controller and Controller of CMC Americas Division.
Paul K. Kirkpatrick was appointed Vice President, General Counsel and Corporate Secretary in October 2013. Mr. Kirkpatrick joined the Company in December 2009 as Assistant General Counsel and Assistant Corporate Secretary, and in February 2013, he was appointed Vice President, Corporate Secretary and Assistant General Counsel. Prior to joining the Company, Mr. Kirkpatrick was an attorney at Haynes and Boone, LLP, a law firm based in Dallas, Texas.
In July 2010, Tracy L. Porter was appointed Senior Vice President of the Company and President of CMC Americas Division. Prior to such appointment and since April 2010, Mr. Porter served as Vice President of the Company and President of CMC Americas Division. Prior to that, and for nineteen years, Mr. Porter has held various positions within the Company, including General Manager of CMC Steel Arkansas at Magnolia, Arkansas, head of the Company’s Rebar Fabrication Division, and Interim President of the Company’sCMC Americas Division.
Barbara R. Smith joined the Company in May 2011 as Senior Vice President of Business Development and Business Processes. Mr. Sharma was hired byChief Financial Officer. Prior to joining the Company, in 2008Ms. Smith served as Vice President and Chief Financial Officer of Business Development. Mr. Sharma had previously been employed for overGerdau Ameristeel Corporation, a decade at Robert Bosch LLC, a technology-based corporation operatingmini-mill steel producer, since July 2007, after joining Gerdau Ameristeel as Treasurer in the areas of automotive and industrial technology, consumer goods and building technology, where he held the position ofJuly 2006. From February 2005 to July 2006, she served as Senior Vice President Mergers and Acquisitions, Americas Region.Chief Financial Officer of FARO Technologies, Inc., a developer and manufacturer of 3-D measurement and imaging systems. From 1981 to 2005, Ms. Smith was employed by Alcoa Inc., a producer of primary aluminum, fabricated
77
aluminum and alumina, where she held various financial leadership positions including Vice President of our other executive officers in the positions indicated above or in positionsFinance for Alcoa’s Aerospace, Automotive & Commercial Transportation Group, Vice President and Chief Financial Officer for Alcoa Fujikura Ltd. and Director of similar responsibility for more than five years. There are no family relationships among our officers or among the executive officers and directors.Internal Audit.
We have adopted a Financial Code of Ethics that applies to our Chief Executive Officer, Chief Financial Officer, Corporate Controller and any of our other officers that may function as a Chief Accounting Officer. We intend to post any amendments to or waivers from our Financial Code of Ethics on our website (www.cmc.com) to the extent applicable to our Chief Executive Officer, Chief Financial Officer, Corporate Controller, and any other officer that may function as a Chief Accounting Officer. We hereby undertake to provide to any person without charge, upon request, a copy of our Financial Code of Ethics. Requests may be directed to Commercial Metals Company, 6565 N. MacArthur Blvd., Suite 800, Irving, Texas 75039, Attention: Corporate Secretary, or by calling (214) 689-4300.
73
ITEM 11. EXECUTIVE COMPENSATION
Information required in response to this Item 11 is incorporated by reference into this Annual Report on Form 10-K from our definitive proxy statement for2014 Proxy Statement. Such information will be included under the annual meeting of stockholders to be held January 17, 2011. We will file our definitive proxy statement no later than 120 days after the close of our fiscal year.caption "Executive Compensation," "Compensation Committee Interlocks and Insider Participation" and "Compensation Committee Report."
ITEM 12. SECURITY OWNERSHIP OF CERTAIN BENEFICIAL OWNERS AND MANAGEMENT AND RELATED STOCKHOLDER MATTERS
The information required in response to this Item 12 is incorporated by reference into this Annual Report on Form 10-K from our definitive proxy statement for the annual meeting2014 Proxy Statement. Such information will be included in the 2014 Proxy Statement under the caption "Security Ownership of stockholders to be held January 17, 2011. We will file our definitive proxy statement no later than 120 days after the close of our fiscal year.Certain Beneficial Owners and Management."
ITEM 13. CERTAIN RELATIONSHIPS AND RELATED TRANSACTIONS AND DIRECTOR INDEPENDENCE
To the extent applicable, information required in response to this Item 13 is incorporated by reference into this Annual Report on Form 10-K from our definitive proxy statement for the annual meeting of stockholders to2014 Proxy Statement. Such information will be held January 17, 2011. We will file our definitive proxy statement no later than 120 days afterincluded in the close of our fiscal year.2014 Proxy Statement under the caption "Certain Relationships and Related Transactions."
ITEM 14. PRINCIPAL ACCOUNTANT FEES AND SERVICES
The information required in response to this Item 14 is incorporated by reference into this Annual Report on Form 10-K from our definitive proxy statement for the annual meeting2014 Proxy Statement. Such information will be included in the 2014 Proxy Statement under the caption "Ratification of stockholders to be held January 17, 2011. We will file our definitive proxy statement no later than 120 days after the closeAppointment of our fiscal year.Independent Registered Public Accounting Firm."
74
78
PART IV
(a) The following documents are filed as a part of this report:
1. All financial statements are included in Item 8 above.
2. Financial statement schedule: The following financial statement schedule is attached to this report.
Schedule II — Valuation and Qualifying Accounts and Reserves
All other financial statement schedules have been omitted because they are not applicable, they are not required or the required information is shown in the financial statements or notes thereto.
3. Exhibits:
| EXHIBIT | ||
| NO. | DESCRIPTION | |
| 2(a) | ||
| 3(i)(a) | ||
| 3(i)(b) | Certificate of Amendment of Restated Certificate of Incorporation dated February | |
| 3(i)(c) | Certificate of Amendment of Restated Certificate of Incorporation dated February 17, 1995 (filed as Exhibit 3(i)(b) to Commercial Metals' Form 10-K for the fiscal year ended August 31, 2009 and incorporated herein by reference). | |
| 3(i)(d) | Certificate of Amendment of Restated Certificate of Incorporation dated January 30, 2004 (filed as Exhibit 3(i)(d) to Commercial Metals' Form 10-Q for the quarter ended February 29, 2004 and incorporated herein by reference). | |
| 3(i)(e) | Certificate of Amendment of Restated Certificate of Incorporation dated January 26, 2006 (filed as Exhibit 3(i) to Commercial | |
| 3(i) | Certificate of Designation, Preferences and Rights of Series A Preferred Stock (filed as Exhibit 2 to Commercial | |
| 3(i)(g) | Certificate of Designation of Series B Junior Participating Preferred Stock of Commercial Metals Company (filed as Exhibit 99.2 to Commercial Metals' Form 8-A filed August 1, 2011 and incorporated herein by reference). | |
| 3(i)(h) | Certificate of Elimination of Series B Junior Participating Preferred Stock dated December 7, 2012 (filed as Exhibit 3.1 to Commercial Metals' Form 8-K filed December 7, 2012 and incorporated herein by reference). | |
| 3(ii) | Second Amended and Restated Bylaws (filed as Exhibit 3.1 to Commercial | |
| 4(i)(a) | Indenture between Commercial Metals Company and Chase Manhattan Bank dated as of July 31, 1995 (filed as Exhibit | |
| EXHIBIT | ||
| NO. | DESCRIPTION | |
| 4(i)(b) | ||
| 4(i)(c) | Form of Note for Commercial | |
| 4(i)(d) | Form of Note for Commercial | |
| 4(i)(e)** | ||
75
| 4(i)(f)** | Supplemental Indenture, dated as of July 17, 2007, to Indenture dated as of July 31, 1995, by and between Commercial Metals Company and The Bank of New York Trust Company, N. A. (filed as Exhibit 4.1 to Commercial | |
| 4(i)(g)** | Supplemental Indenture, dated as of August 4, 2008, to Indenture dated as of July 31, 1995, by and between Commercial Metals Company and The Bank of New York Mellon Trust Company, N. A. (filed as Exhibit 4.1 to Commercial | |
| 10(i) | ||
| 10(i) | ||
76
| Commercial Paper Dealer Agreement, dated October 7, 2009, between Commercial Metals Company and Banc of America Securities, LLC (filed as Exhibit 10.1 to Commercial | ||
| 10(i) | Commercial Paper Dealer Agreement, dated October 7, 2009, between Commercial Metals Company and Goldman, Sachs & Co. (filed as Exhibit 10.2 to Commercial | |
| 10(i) | ISDA® International Swap Dealers Association, Inc. Master Agreement, dated as of April 4, 2002, between Commercial Metals Company and Goldman Sachs Capital Markets, L.P. (filed as Exhibit 10.1 to Commercial | |
| 10(i) | Schedule to the Master Agreement, dated as of April 4, 2002, between Goldman Sachs Capital Markets, L.P. and Commercial Metals Company (filed as Exhibit 10.2 to Commercial | |
| 10(i) | General Guarantee Agreement, dated December 1, 2008 from The Goldman Sachs Group, Inc. (filed as Exhibit 10.3 to Commercial | |
80
| EXHIBIT | ||
| NO. | DESCRIPTION | |
| 10(ii)(a) | ||
| 10(ii)(b) | ||
| 10(ii)(c) | ||
| 10(ii)(d) | ||
| 10(ii)(e) | Performance Undertaking executed by Commercial Metals Company in favor of CMC Receivables, Inc. (a special purpose wholly-owned subsidiary of Commercial Metals Company), dated as of April 5, 2011 (filed as Exhibit 10.5 to Commercial Metals' Form 10-Q for the | |
| 10(ii)(f) | Amendment No. 1 to | |
| 10(iii)(a)* | ||
77
| Key Employee Long-Term Performance Plan description (filed as Exhibit 10(iii)(d) to Commercial | ||
| 10(iii) | Key Employee Annual Incentive Plan description (filed as Exhibit 10(iii)(e) to Commercial | |
| 10(iii) | Amended and Restated 1999 Non-Employee Director Stock Option Plan (filed as Exhibit 10(iii)(a) to Commercial | |
| 10(iii) | Amendment Number One to the Amended and Restated 1999 Non-Employee Director Stock Option Plan (filed as Exhibit 10.3 to Commercial | |
| 10(iii) | Commercial Metals Company 1996 Long-Term Incentive Plan (filed | |
| 10(iii) | Commercial Metals Company 2006 Long-Term Equity Incentive Plan (filed as Exhibit 10(iii)(b) to Commercial | |
| 10(iii)(g)* | Amendment Number One to Commercial Metals Company 2006 Long-Term Equity Incentive Plan (filed as Exhibit 10.2 to Commercial Metals' Form 8-K filed January 28, 2010 and incorporated herein by reference). | |
| 10(iii)(h)* | Form of Commercial Metals Company 1996 Long-Term Incentive Plan Restricted Stock Award Agreement (filed as Exhibit 10(iii)(l) to Commercial Metals' Form 10-K for the fiscal year ended August 31, 2010 and incorporated herein by reference). |
81
| EXHIBIT | ||
| NO. | DESCRIPTION | |
| 10(iii)(i)* | Form of Commercial Metals Company 1996 Long-Term Incentive Plan Stock Appreciation Rights Agreement (filed as Exhibit 10(iii)(m) to Commercial Metals' Form 10-K for the fiscal year ended August 31, 2010 and incorporated herein by reference). | |
| 10(iii)(j)* | Commercial Metals Company 2006 Cash Incentive Plan (filed as Exhibit 10(iii)(c) to Commercial Metals' Form 10-Q for the quarter ending February 28, 2007 and incorporated herein by reference). | |
| 10(iii)(k)* | Amendment Number One to | |
| 10(iii) | Commercial Metals Company 2010 Employee Stock Purchase Plan (filed as Exhibit 10.1 to Commercial | |
| 10(iii) | Form of Non-Employee Director Restricted Stock Award Agreement (filed as Exhibit 10.1 to Commercial | |
| 10(iii) | Form of Executive Employment Continuity Agreement (filed as Exhibit 10.1 to Commercial | |
| 10(iii) | Form of Restricted Stock Unit Award Agreement (filed as Exhibit 10.2 to Commercial | |
78
| 10(iii) | Retirement and Consulting Agreement, between Commercial Metals Company and David M. Sudbury, dated as of May 28, 2009 (filed as Exhibit 10.1 to Commercial | |
| 10(iii) | Form of Non-Employee Director Stock Appreciation Rights Agreement (filed as Exhibit 10(iii)(q) to Commercial | |
| 10(iii)(r)* | Separation Agreement, dated March 28, 2013, by and between James Alleman and Commercial Metals Company (filed as Exhibit 10.1 to Commercial Metals' Form 10-Q for the quarter ended February 28, 2013 and incorporated herein by reference). | |
| 10(iii)(s)* | Form of Performance Restricted Stock Unit Award Agreement (filed as Exhibit 10 (iii)(x) to Commercial Metals' Form 10-K for the fiscal year ended August 31, 2010 and incorporated herein by reference). | |
| 10(iii)(t)* | Form of Restricted Stock Unit Agreement (filed as Exhibit 10 (iii)(y) to Commercial Metals' Form 10-K for the fiscal year ended August 31, 2010 and incorporated herein by reference). | |
| 10(iii)(u)* | Form of Long-Term Cash and Equity Award Agreement (filed as Exhibit 10.1 to Commercial Metals' Form 10-Q for the quarter ended February 28, 2011 and incorporated herein by reference). | |
| 10(iii)(v)* | ||
| 10(iii)(w)* | ||
| 10(iii)(x)* | First Amendment, dated April 8, 2011, to Employment Agreement by and between Joseph Alvarado and Commercial Metals Company (filed as Exhibit 10.2 to Commercial Metals' Form |
82
| EXHIBIT | ||
| NO. | DESCRIPTION | |
| 10(iii)(y)* | Employment Agreement, dated May 3, 2011, by and between Barbara R. Smith and Commercial Metals Company (filed as Exhibit 10.3 to Commercial Metals' Form | |
| 10(iii)(z)* | Second Amendment, dated May 26, 2011, to Employment Agreement by and between Joseph Alvarado and Commercial Metals Company (filed as Exhibit 10.6 to Commercial Metals' Form 10-Q for the quarter ended May 31, 2011 and incorporated herein by reference). | |
| 10(iii)(aa)* | Third Amendment, dated September 1, 2011, to Employment Agreement by and between Joseph Alvarado and Commercial Metals Company (filed as Exhibit 10(iii)(dd) to Commercial Metals' Form 10-K for the year ended August 31, 2011 and incorporated herein by reference). | |
| 10(iii)(bb) | Transition and Separation Agreement, dated October 28, 2013, by and between Ann J. Bruder and Commercial Metals Company (filed herewith). | |
| 12 | Statement re computation of earnings to fixed charges (filed herewith). | |
| 21 | Subsidiaries of Registrant (filed herewith). | |
| 23 | Consent of Independent Registered Public Accounting Firm to incorporation by reference of report dated October | |
| 31(a) | Certification of | |
| 31(b) | Certification of | |
| 32(a) | Certification of | |
| 32(b) | Certification of | |
| 101*** | The following financial information from Commercial Metals Company's Annual Report on Form 10-K for the fiscal year ended August 31, 2013, formatted in XBRL (eXtensible Business Reporting Language): (i) the Consolidated Statements of Operations, (ii) the Consolidated Statements of Comprehensive Income, (iii) the Consolidated Balance Sheets, (iv) the Consolidated Statements of Cash Flows, (v) the Consolidated Statements of Stockholders' Equity and (vi) the Notes to Consolidated Financial Statements (submitted electronically herewith). | |
| * | Denotes management contract or compensatory plan. |
| ** | Does not contain Schedules or exhibits. A copy of any such Schedules or exhibits will be furnished to the Securities and Exchange Commission upon request. |
79
| *** | In accordance with Rule 406T of Regulation S-T, the XBRL information in Exhibit 101 to this annual report on Form 10-K shall not be deemed to be "filed" for purposes of Section 18 of the Securities Exchange Act of 1934, as amended (the Exchange Act), or otherwise subject to the liability of that section, and shall not be incorporated by reference into any registration statement or other document filed under the Securities Act of 1933, as amended, or the Exchange Act, except as shall be expressly set forth by specific reference in such filing. |
83
SCHEDULE II — VALUATION AND QUALIFYING ACCOUNTS AND RESERVES
(in thousands)
| Additions | Deductions | |||||||||||||||||||||||
| Balance at | Charged to | Charged | Charged to | Charged to | Balance at | |||||||||||||||||||
| Beginning | Costs and | to Other | Costs and | Other | End of | |||||||||||||||||||
| Description | of Period | Expenses | Accounts | Expenses | Accounts | Period | ||||||||||||||||||
Year ended August 31, 2010 | ||||||||||||||||||||||||
| Allowance for doubtful accounts | $ | 42,134 | 3,085 | 1,802 | (1) | (5,640 | ) | (11,633 | )(2) | $ | 29,721 | |||||||||||||
Year ended August 31, 2009 | ||||||||||||||||||||||||
| Allowance for doubtful accounts | $ | 17,652 | 33,733 | 3,448 | (1) | — | (12,699 | )(2) | $ | 42,134 | ||||||||||||||
Year ended August 31, 2008 | ||||||||||||||||||||||||
| Allowance for doubtful accounts | $ | 16,495 | 4,478 | 7,048 | (1) | — | (10,369 | )(2) | $ | 17,652 | ||||||||||||||
| Additions | Deductions | ||||||||||||||||||||||
| Description (in thousands) | Balance at Beginning of Period | Charged to Costs and Expenses | Charged to Other Accounts | Charged to Costs and Expenses | Charged to Other Accounts | Balance at End of Period | |||||||||||||||||
| Year Ended August 31, 2013 | |||||||||||||||||||||||
| Allowance for doubtful accounts | $ | 9,480 | 4,980 | 193 | (1) | (550 | ) | (4,061 | ) | (2) | $ | 10,042 | |||||||||||
| Deferred tax valuation allowance | 25,779 | 25,119 | (2,061 | ) | 48,837 | ||||||||||||||||||
| Year ended August 31, 2012 | |||||||||||||||||||||||
| Allowance for doubtful accounts | $ | 16,095 | 2,017 | (3,423 | ) | (1) | (4,480 | ) | (729 | ) | (2) | $ | 9,480 | ||||||||||
| Deferred tax valuation allowance | 75,289 | 11,855 | (356 | ) | (61,009 | ) | 25,779 | ||||||||||||||||
| Year ended August 31, 2011 | |||||||||||||||||||||||
| Allowance for doubtful accounts | $ | 29,721 | 4,037 | 2,756 | (1) | (3,727 | ) | (16,692 | ) | (2) | $ | 16,095 | |||||||||||
| Deferred tax valuation allowance | $ | 53,860 | 28,139 | (6,710 | ) | $ | 75,289 | ||||||||||||||||
| (1) | Recoveries and translation adjustments. |
| (2) | Uncollectable accounts charged to the allowance. For the years ended August 31, 2013, 2012 and 2011, $(1,163), $(5,864) and $12,238 were reclassified to the fair value of the deferred purchase price under our sale of receivables program, respectively. |
80
84
SIGNATURES
Pursuant to the requirements of Section 13 or 15(d) of the Securities Exchange Act of 1934, the Registrant has caused this report to be signed on its behalf by the undersigned, thereunto duly authorized.
COMMERCIAL METALS COMPANY | ||||
| By | /s/ | |||
| Joseph Alvarado | ||||
| Chairman of the Board, | ||||
| Date: October 28, 2013 | ||||
Pursuant to the requirements of the Securities Exchange Act of 1934, this report has been signed below by the following persons on behalf of the Registrant and in the capacities and on the dates indicated:
| /s/ | /s/ | |||
| Director | ||||
| /s/ Anthony A. Massaro | /s/ J. David Smith | |||
| Anthony A. Massaro, October 28, 2013 | J. David Smith, October 28, 2013 | |||
| Lead Director | Director | |||
| /s/ Harold L. Adams | /s/ | |||
| Harold L. Adams, October | ||||
| Director | Director | |||
| /s/ Rhys J. Best | /s/ | |||
| Rhys J. Best, October | ||||
| Director | Senior Vice President and Chief Financial Officer | |||
| /s/ | /s/ | |||
| Director | Vice President and Controller | |||
| /s/ Richard B. Kelson | ||||
| Richard B. Kelson, October 28, 2013 | ||||
| Director | ||||
| /s/ Rick J. Mills | ||||
| Rick J. Mills, October 28, 2013 | ||||
| Director | ||||
81
| INDEX TO EXHIBITS | ||
| EXHIBIT | ||
| NO. | DESCRIPTION | |
| 2(a) | Stock Purchase Agreement, dated October 17, 2013, by and among Commercial Metals Company, Howell Metal Company and Mueller Copper Tube Products, Inc. (filed as Exhibit 10(i) to Commercial Metals Form 8-K filed October 23, 2013 and incorporated herein by reference). | |
| 3(i)(a) | Restated Certificate of Incorporation (filed as Exhibit 3(i) to Commercial Metals' Form 10-K for the fiscal year ended August 31, 2009 and incorporated herein by reference). | |
| 3(i)(b) | Certificate of Amendment of Restated Certificate of Incorporation dated February 1, 1994 (filed as Exhibit 3(i)(a) to Commercial Metals' Form 10-K for the fiscal year ended August 31, 2009 and incorporated herein by reference). | |
| 3(i)(c) | Certificate of Amendment of Restated Certificate of Incorporation dated February 17, 1995 (filed as Exhibit 3(i)(b) to Commercial Metals' Form 10-K for the fiscal year ended August 31, 2009 and incorporated herein by reference). | |
| 3(i)(d) | Certificate of Amendment of Restated Certificate of Incorporation dated January 30, 2004 (filed as Exhibit 3(i)(d) to Commercial Metals' Form 10-Q for the quarter ended February 29, 2004 and incorporated herein by reference). | |
| 3(i)(e) | Certificate of Amendment of Restated Certificate of Incorporation dated January 26, 2006 (filed as Exhibit 3(i) to Commercial Metals' Form 10-Q for the quarter ended February 28, 2006 and incorporated herein by reference). | |
| 3(i)(f) | Certificate of Designation, Preferences and Rights of Series A Preferred Stock (filed as Exhibit 2 to Commercial Metals' Form 8-A filed August 3, 1999 and incorporated herein by reference). | |
| 3(i)(g) | Certificate of Designation of Series B Junior Participating Preferred Stock of Commercial Metals Company (filed as Exhibit 99.2 to Commercial Metals' Form 8-A filed August 1, 2011 and incorporated herein by reference). | |
| 3(i)(h) | Certificate of Elimination of Series B Junior Participating Preferred Stock dated December 7, 2012 (filed as Exhibit 3.1 to Commercial Metals' Form 8-K filed December 7, 2012 and incorporated herein by reference). | |
| 3(ii) | Second Amended and Restated Bylaws (filed as Exhibit 3.1 to Commercial Metals' Form 8-K filed October 25, 2010 and incorporated herein by reference). | |
| 4(i)(a) | Indenture between Commercial Metals Company and Chase Manhattan Bank dated as of July 31, 1995 (filed as Exhibit 4(i)(a) to Commercial Metals' Registration Statement No. 333-112243 filed April 26, 2004 and incorporated herein by reference). | |
| 4(i)(b) | Indenture, dated as of May 6, 2013, between the Company and U.S. Bank National Association, as trustee (filed as Exhibit 4.1 to Commercial Metals' Registration Statement on Form S-3 filed May 6, 2013 and incorporated herein by reference). | |
| 4(i)(c) | Form of Note for Commercial Metals' 6.50% Senior Notes due 2017 (filed as Exhibit 4(i)(e) to Commercial Metals' Form 10-K for the fiscal year ended August 31, 2007 and incorporated herein by reference). | |
| 4(i)(d) | Form of Note for Commercial Metals' 7.35% Senior Notes due 2018 (filed as Exhibit 4(i)(g) to Commercial Metals' Form 10-K for the fiscal year ended August 31, 2008 and incorporated herein by reference). | |
| 4(i)(e)** | Form of 4.875% Senior Note due 2023 (filed as Exhibit 4.2 to Commercial Metals' Current Report on Form 8-K filed May 20, 2013 and incorporated herein by reference). | |
86
| INDEX TO EXHIBITS | ||
| EXHIBIT | ||
| NO. | DESCRIPTION | |
| 4(i)(f)** | Supplemental Indenture, dated as of July 17, 2007, to Indenture dated as of July 31, 1995, by and between Commercial Metals Company and The Bank of New York Trust Company, N. A. (filed as Exhibit 4.1 to Commercial Metals' Form 8-K filed July 17, 2007 and incorporated herein by reference). | |
| 4(i)(g)** | Supplemental Indenture, dated as of August 4, 2008, to Indenture dated as of July 31, 1995, by and between Commercial Metals Company and The Bank of New York Mellon Trust Company, N. A. (filed as Exhibit 4.1 to Commercial Metals' Form 8-K filed August 5, 2008 and incorporated herein by reference). | |
| 4(i)(h) | First Supplemental Indenture, dated as of May 20, 2013, to the Indenture, dated as of May 6, 2013, between Commercial Metals Company and U.S. Bank National Association, as trustee (filed as Exhibit 4.1 to Commercial Metals' Current Report on Form 8-K filed May 20, 2013 and incorporated herein by reference). | |
| 10(i)(a) | Omnibus Amendment No. 1 (Amendment No. 2 to Receivables Sale Agreement, Amendment No. 2 to Receivables Purchase Agreement, and Amendment No. 2 to Performance Undertaking), dated May 3, 2013, by and among Commercial Metals Company, individually and as provider of the Performance Undertaking, CMC Cometals Processing, Inc., Howell Metal Company, Structural Metals, Inc., CMC Steel Fabricators, Inc., SMI Steel LLC, SMI-Owen Steel Company, Inc., Owen Electric Steel Company of South Carolina, AHT, Inc., CMC Receivables, Inc., Liberty Street Funding LLC, The Bank of Nova Scotia, individually and in its capacity as administrator of the Liberty Street Funding Group, and Wells Fargo Bank, N.A., individually and as administrative agent (filed as Exhibit 10.3 to Commercial Metals' Form 10-Q for the quarter ended May 31, 2013 and incorporated herein by reference). | |
| 10(i)(b) | Commercial Paper Dealer Agreement, dated October 7, 2009, between Commercial Metals Company and Banc of America Securities, LLC (filed as Exhibit 10.1 to Commercial Metals' Form 8-K filed March 2, 2010 and incorporated herein by reference). | |
| 10(i)(c) | Commercial Paper Dealer Agreement, dated October 7, 2009, between Commercial Metals Company and Goldman, Sachs & Co. (filed as Exhibit 10.2 to Commercial Metals' Form 8-K filed March 2, 2010 and incorporated herein by reference). | |
| 10(i)(d) | ISDA® International Swap Dealers Association, Inc. Master Agreement, dated as of April 4, 2002, between Commercial Metals Company and Goldman Sachs Capital Markets, L.P. (filed as Exhibit 10.1 to Commercial Metals' Form 8-K filed March 24, 2010 and incorporated herein by reference). | |
| 10(i)(e) | Schedule to the Master Agreement, dated as of April 4, 2002, between Goldman Sachs Capital Markets, L.P. and Commercial Metals Company (filed as Exhibit 10.2 to Commercial Metals' Form 8-K filed March 24, 2010 and incorporated herein by reference). | |
| 10(i)(f) | General Guarantee Agreement, dated December 1, 2008 from The Goldman Sachs Group, Inc. (filed as Exhibit 10.3 to Commercial Metals' Form 8-K filed March 24, 2010 and incorporated herein by reference). | |
| 10(ii)(a) | Third Amended and Restated Credit Agreement, dated December 27, 2011, by and among Commercial Metals Company, CMCLUX, S.à r.l., Bank of America, N.A., Wells Fargo Bank, National Association, The Royal Bank of Scotland plc, Goldman Sachs Bank USA, PNC Bank, National Association, Merrill Lynch, Pierce, Fenner & Smith Incorporated, Wells Fargo Securities, LLC and RBS Securities Inc. (filed as Exhibit 10.1 to Commercial Metals' Form 8-K filed January 3, 2012 and incorporated herein by reference). | |
| 10(ii)(b) | First Amendment to Third Amended and Restated Credit Agreement, dated April 29, 2013, by and among Commercial Metals Company, CMCLUX, S.à.r.l., the lenders party to the Credit Agreement and Bank of America, N.A., as administrative agent (filed as Exhibit 10.1 to Commercial Metals' Form 10-Q for the quarter ended May 31, 2013 and incorporated herein by reference). | |
87
| INDEX TO EXHIBITS | ||
| EXHIBIT | ||
| NO. | DESCRIPTION | |
| 10(ii)(c) | Receivables Sale Agreement, by and between Commercial Metals Company and several of its subsidiaries and CMC Receivables, Inc. (a special purpose wholly-owned subsidiary of Commercial Metals Company), dated as of April 5, 2011 (filed as Exhibit 10.3 to Commercial Metals' Form 10-Q for the quarterly period ended February 28, 2011 and incorporated herein by reference). | |
| 10(ii)(d) | Receivables Purchase Agreement, by and among Commercial Metals Company, CMC Receivables, Inc. (a special purpose wholly-owned subsidiary of Commercial Metals Company), certain purchasers and Wells Fargo Bank, N.A., as administrative agent for the purchasers, dated as of April 5, 2011 (filed as Exhibit 10.4 to Commercial Metals' Form 10-Q for the quarterly period ended February 28, 2011 and incorporated herein by reference). | |
| 10(ii)(e) | Performance Undertaking executed by Commercial Metals Company in favor of CMC Receivables, Inc. (a special purpose wholly-owned subsidiary of Commercial Metals Company), dated as of April 5, 2011 (filed as Exhibit 10.5 to Commercial Metals' Form 10-Q for the quarterly period ended February 28, 2011 and incorporated herein by reference). | |
| 10(ii)(f) | Amendment No. 1 to Receivables Purchase Agreement, dated December 28, 2011, by and among Commercial Metals Company, CMC Receivables, Inc., Wells Fargo Bank, N.A., The Bank of Nova Scotia and Liberty Street Funding LLC (filed as Exhibit 10.2 to Commercial Metals' Form 8-K filed January 3, 2012 and incorporated herein by reference). | |
| 10(iii)(a)* | Key Employee Long-Term Performance Plan description (filed as Exhibit 10(iii)(d) to Commercial Metals' Form 10-K for the fiscal year ended August 31, 2009 and incorporated herein by reference). | |
| 10(iii)(b)* | Key Employee Annual Incentive Plan description (filed as Exhibit 10(iii)(e) to Commercial Metals' Form 10-K for the fiscal year ended August 31, 2009 and incorporated herein by reference). | |
| 10(iii)(c)* | Amended and Restated 1999 Non-Employee Director Stock Option Plan (filed as Exhibit 10(iii)(a) to Commercial Metals' Form 10-Q for the quarter ending February 28, 2007 and incorporated herein by reference). | |
| 10(iii)(d)* | Amendment Number One to the Amended and Restated 1999 Non-Employee Director Stock Option Plan (filed as Exhibit 10.3 to Commercial Metals' Form 8-K filed January 28, 2010 and incorporated herein by reference). | |
| 10(iii)(e)* | Commercial Metals Company 1996 Long-Term Incentive Plan (filed as Exhibit 10(iii)(i) to Commercial Metals' Form 10-K for the fiscal year ended August 31, 2010 and incorporated herein by reference). | |
| 10(iii)(f)* | Commercial Metals Company 2006 Long-Term Equity Incentive Plan (filed as Exhibit 10(iii)(b) to Commercial Metals' Form 10-Q for the quarter ending February 28, 2007 and incorporated herein by reference). | |
| 10(iii)(g)* | Amendment Number One to Commercial Metals Company 2006 Long-Term Equity Incentive Plan (filed as Exhibit 10.2 to Commercial Metals' Form 8-K filed January 28, 2010 and incorporated herein by reference). | |
| 10(iii)(h)* | Form of Commercial Metals Company 1996 Long-Term Incentive Plan Restricted Stock Award Agreement (filed as Exhibit 10(iii)(l) to Commercial Metals' Form 10-K for the fiscal year ended August 31, 2010 and incorporated herein by reference). | |
| 10(iii)(i)* | Form of Commercial Metals Company 1996 Long-Term Incentive Plan Stock Appreciation Rights Agreement (filed as Exhibit 10(iii)(m) to Commercial Metals' Form 10-K for the fiscal year ended August 31, 2010 and incorporated herein by reference). | |
| 10(iii)(j)* | Commercial Metals Company 2006 Cash Incentive Plan (filed as Exhibit 10(iii)(c) to Commercial Metals' Form 10-Q for the quarter ending February 28, 2007 and incorporated herein by reference). | |
88
| INDEX TO EXHIBITS | ||
| EXHIBIT | ||
| NO. | DESCRIPTION | |
| 10(iii)(k)* | Amendment Number One to the Commercial Metals Company 2006 Cash Incentive Plan (filed as Exhibit 10.4 to Commercial Metals' Form 10-Q for the quarter ended February 28, 2010 and incorporated herein by reference). | |
| 10(iii)(l)* | Commercial Metals Company 2010 Employee Stock Purchase Plan (filed as Exhibit 10.1 to Commercial Metals' Form 8-K filed January 28, 2010 and incorporated herein by reference) | |
| 10(iii)(m)* | Form of Non-Employee Director Restricted Stock Award Agreement (filed as Exhibit 10.1 to Commercial Metals' Form 8-K filed January 27, 2005 and incorporated herein by reference). | |
| 10(iii)(n)* | Form of Executive Employment Continuity Agreement (filed as Exhibit 10.1 to Commercial Metals' Form 10-Q for the quarter ended February 28, 2006 and incorporated herein by reference). | |
| 10(iii)(o)* | Form of Restricted Stock Unit Award Agreement (filed as Exhibit 10.2 to Commercial Metals' Form 8-K filed May 26, 2009 and incorporated herein by reference). | |
| 10(iii)(p)* | Retirement and Consulting Agreement, between Commercial Metals Company and David M. Sudbury, dated as of May 28, 2009 (filed as Exhibit 10.1 to Commercial Metals' Form 8-K filed May 29, 2009 and incorporated herein by reference). | |
| 10(iii)(q)* | Form of Non-Employee Director Stock Appreciation Rights Agreement (filed as Exhibit 10(iii)(q) to Commercial Metals' Form 10-K for the fiscal year ended August 31, 2009 and incorporated herein by reference). | |
| 10(iii)(r)* | Separation Agreement, dated March 28, 2013, by and between James Alleman and Commercial Metals Company (filed as Exhibit 10.1 to Commercial Metals' Form 10-Q for the quarter ended February 28, 2013 and incorporated herein by reference). | |
| 10(iii)(s)* | Form of Performance Restricted Stock Unit Award Agreement (filed as Exhibit 10 (iii)(x) to Commercial Metals' Form 10-K for the fiscal year ended August 31, 2010 and incorporated herein by reference). | |
| 10(iii)(t)* | Form of Restricted Stock Unit Agreement (filed as Exhibit 10 (iii)(y) to Commercial Metals' Form 10-K for the fiscal year ended August 31, 2010 and incorporated herein by reference). | |
| 10(iii)(u)* | Form of Long-Term Cash and Equity Award Agreement (filed as Exhibit 10.1 to Commercial Metals' Form 10-Q for the quarter ended February 28, 2011 and incorporated herein by reference). | |
| 10(iii)(v)* | Form of Long-Term Equity Award Agreement (filed as Exhibit 10.2 to Commercial Metals' Form 10-Q for the quarter ended February 28, 2011 and incorporated herein by reference). | |
| 10(iii)(w)* | Employment Agreement, dated April 16, 2010, by and between Joseph Alvarado and Commercial Metals Company (filed as Exhibit 10.4 to Commercial Metals' Form 10-Q for the quarter ended May 31, 2010 and incorporated herein by reference). | |
| 10(iii)(x)* | First Amendment, dated April 8, 2011, to Employment Agreement by and between Joseph Alvarado and Commercial Metals Company (filed as Exhibit 10.2 to Commercial Metals' Form 8-K filed April 11, 2011 and incorporated herein by reference). | |
| 10(iii)(y)* | Employment Agreement, dated May 3, 2011, by and between Barbara R. Smith and Commercial Metals Company (filed as Exhibit 10.3 to Commercial Metals' Form 10-Q for the quarter ended May 31, 2011 and incorporated herein by reference). | |
89
| INDEX TO EXHIBITS | ||
| EXHIBIT | ||
| NO. | DESCRIPTION | |
| 10(iii)(z)* | Second Amendment, dated May 26, 2011, to Employment Agreement by and between Joseph Alvarado and Commercial Metals Company (filed as Exhibit 10.6 to Commercial Metals' Form 10-Q for the quarter ended May 31, 2011 and incorporated herein by reference). | |
| 10(iii)(aa)* | Third Amendment, dated September 1, 2011, to Employment Agreement by and between Joseph Alvarado and Commercial Metals Company (filed as Exhibit 10(iii)(dd) to Commercial Metals' Form 10-K for the year ended August 31, 2011 and incorporated herein by reference). | |
| 10(iii)(bb) | Transition and Separation Agreement, dated October 28, 2013, by and between Ann J. Bruder and Commercial Metals Company (filed herewith). | |
| 12 | Statement re computation of earnings to fixed charges (filed herewith). | |
| 21 | Subsidiaries of Registrant (filed herewith). | |
| 23 | Consent of Independent Registered Public Accounting Firm to incorporation by reference of report dated October 25, 2013, accompanying the consolidated financial statements and financial statement schedule of Commercial Metals Company and subsidiaries for the year ended August 31, 2013, into previously filed Registration Statements No. 333-186974, No. 333-164604, No. 333-164603, No. 333-141663, No. 333-141662, No. 333-90726, No. 333-90724, No. 033-42648, No. 333-27967, and No. 033-61075 on Form S-8 and Registration Statements No. 333-144500 and No. 333-188366 on Form S-3 (filed herewith). | |
| 31(a) | Certification of Joseph Alvarado, President and Chief Executive Officer of Commercial Metals Company, pursuant to Section 302 of the Sarbanes-Oxley Act of 2002 (filed herewith). | |
| 31(b) | Certification of Barbara R. Smith, Senior Vice President and Chief Financial Officer of Commercial Metals Company, pursuant to Section 302 of the Sarbanes-Oxley Act of 2002 (filed herewith). | |
| 32(a) | Certification of Joseph Alvarado, President and Chief Executive Officer of Commercial Metals Company, pursuant to 18 U.S.C. 1350, as adopted pursuant to Section 906 of the Sarbanes-Oxley Act of 2002 (furnished herewith). | |
| 32(b) | Certification of Barbara R. Smith, Vice President and Chief Financial Officer of Commercial Metals Company, pursuant to 18 U.S.C. 1350, as adopted pursuant to Section 906 of the Sarbanes-Oxley Act of 2002 (furnished herewith). | |
| 101*** | The following financial information from Commercial Metals Company's Annual Report on Form 10-K for the fiscal year ended August 31, 2013, formatted in XBRL (eXtensible Business Reporting Language): (i) the Consolidated Statements of Operations, (ii) the Consolidated Statements of Comprehensive Income, (iii) the Consolidated Balance Sheets, (iv) the Consolidated Statements of Cash Flows, (v) the Consolidated Statements of Stockholders' Equity and (vi) the Notes to Consolidated Financial Statements (submitted electronically herewith). | |
| * | Denotes management contract or compensatory plan. |
| ** | Does not contain Schedules or exhibits. A copy of any such Schedules or exhibits will be furnished to the Securities and Exchange Commission upon request. |
| *** | In accordance with Rule 406T of Regulation S-T, the XBRL information in Exhibit 101 to this annual report on Form 10-K shall not be deemed to be "filed" for purposes of Section 18 of the Securities Exchange Act of 1934, as amended (the Exchange Act), or otherwise subject to the liability of that section, and shall not be incorporated by reference into any registration statement or other document filed under the Securities Act of 1933, as amended, or the Exchange Act, except as shall be expressly set forth by specific reference in such filing. |
90