UNITED STATES SECURITIES AND EXCHANGE COMMISSION
(Mark one)
| | þ | |
(Mark one) | | |
þ
| | ANNUAL REPORT PURSUANT TO SECTION 13 OR 15(d)
OF THE SECURITIES EXCHANGE ACT OF 1934 |
For the fiscal year ended October 30, 2011
or
| | ¨ | For the fiscal year ended October 31, 2010 |
or
|
o
| | TRANSITION REPORT PURSUANT TO SECTION 13 OR 15(d)
OF THE SECURITIES EXCHANGE ACT OF 1934 |
| | For the transition period from to |
For the transition period from to
Commission file number000-06920
(Exact name of registrant as specified in its charter)
| | |
| Delaware | | 94-1655526 |
Delaware
| | 94-1655526 |
(State or other jurisdiction of
incorporation or organization) | | (I.R.S. Employer
Identification No.) |
| | |
3050 Bowers Avenue, P.O. Box 58039 Santa Clara, California | | 95052-8039 (Zip Code) |
Santa Clara, California
| | (Zip Code) |
(Address of principal executive offices) | | |
Registrant’s telephone number, including area code:
Securities registered pursuant to Section 12(b) of the Act:
| | |
Title of Each Class | | Name of Each Exchange on Which Registered |
|
Common Stock, par value $.01 per share | | The NASDAQ Stock Market LLC |
Securities registered pursuant to Section 12(g) of the Act:
Indicate by check mark if the registrant is a well-known, seasoned issuer, as defined in Rule 405 of the Securities Act. Yes þ No o¨
Indicate by check mark if the registrant is not required to file reports pursuant to Section 13 or Section 15(d) of the Act. Yes o¨ No þ
Indicate by check mark whether the registrant (1) has filed all reports required to be filed by Section 13 or 15(d) of the Securities Exchange Act of 1934 during the preceding 12 months (or for such shorter period that the registrant was required to file such reports), and (2) has been subject to such filing requirements for the past 90 days. Yes þ No o¨
Indicate by check mark whether the registrant has submitted electronically and posted on its corporate Web site, if any, every Interactive Data File required to be submitted and posted pursuant to Rule 405 ofRegulation S-T (§232.405 of this chapter) during the preceding 12 months (or for such shorter period that the registrant was required to submit and post such files). Yes þ No o¨
Indicate by check mark if disclosure of delinquent filers pursuant to Item 405 ofRegulation S-K (§229.405 of this chapter) is not contained herein, and will not be contained, to the best of registrant’s knowledge, in definitive proxy or information statements incorporated by reference in Part III of thisForm 10-K or any amendment to thisForm 10-K. þ
Indicate by check mark whether the registrant is a large accelerated filer, an accelerated filer, a non-accelerated filer, or a smaller reporting company. See the definitions of “large accelerated filer,” “accelerated filer” and “smaller reporting company” inRule 12b-2 of the Exchange Act. (Check one):
| | | | | | |
Large accelerated filer þ | | Accelerated filer o¨ | | Non-accelerated filer o¨ | | Smaller reporting company o¨ |
| | (Do not check if a smaller reporting company) |
(Do not check if a smaller reporting company)
Indicate by check mark whether the registrant is a shell company (as defined inRule 12b-2 of the Act). Yes o¨ No þ
Aggregate market value of the voting stock held by non-affiliates of the registrant as of May 2, 2010,1, 2011, based upon the closing sale price reported by the NASDAQ Global Select Market on that date: $18,484,888,271
$20,652,343,218Number of shares outstanding of the registrant’s Common Stock, $.01 par value, as of November 19, 2010: 1,327,685,208
20, 2011: 1,305,637,099DOCUMENTS INCORPORATED BY REFERENCE:
Portions of the definitive Proxy Statement for Applied Materials, Inc.’s 2012 Annual Meeting of Stockholders to be held on March 8, 2011 are incorporated by reference into Part III of thisForm 10-K.
Caution Regarding Forward-Looking Statements
Certain information in this Annual Report onForm 10-K (report orForm 10-K) of Applied Materials, Inc. and its subsidiaries (Applied or the Company), including “Management’s Discussion and Analysis of Financial Condition and Results of Operations” in Item 7, is forward-looking in nature. All statements in this report, including those made by the management of Applied, other than statements of historical fact, are forward-looking statements.
Examples of forward-looking statements include statements regarding Applied’s future financial or operating results, cash flows and cash deployment strategies, declaration of dividends, share repurchases, business strategies, projected costs, products, competitive positions, management’s plans and objectives for future operations, research and development, acquisitions and joint ventures, growth opportunities, customers, working capital, liquidity, financing plans, investment portfolio and policies, cost controls, taxes, supply chain, manufacturing, properties, and legal proceedings and claims, as well asclaims; the acquisition of Varian Semiconductor Equipment Associates, Inc. and other businesses; customer demand and spending; end-use demand; market and industry trends and outlooks.outlooks; and general economic conditions. These forward-looking statements are based on management’s estimates, projections and assumptions as of the date hereof and include the assumptions that underlie such statements. Forward-looking statements may contain words such as “may,” “will,” “should,” “could,” “would,” “expect,” “plan,” “anticipate,” “believe,” “estimate,” “potential” and “continue,” the negative of these terms, or other comparable terminology. Any expectations based on these forward-looking statements are subject to risks and uncertainties and other important factors, including those discussed in Part II, Item 1A, “Risk Factors,” below and elsewhere in this report. Other risks and uncertainties may be disclosed in Applied’s prior Securities and Exchange Commission (SEC) filings. These and many other factors could affect Applied’s future financial condition and operating results and could cause actual results to differ materially from expectations based on forward-looking statements made in this document or elsewhere by Applied or on its behalf. Applied undertakes no obligation to revise or update any forward-looking statements.
The following information should be read in conjunction with the Consolidated Financial Statements and the accompanying Notes to Consolidated Financial Statements included in this report.
FORM 10-K FOR THE FISCAL YEAR ENDED OCTOBER 31, 2010
30, 2011
PART I
PART I
Incorporated in 1967, Applied, a Delaware corporation, provides manufacturing equipment, services and software to the global semiconductor, flat panel display, solar photovoltaic (PV) and related industries. Applied’s customers include manufacturers of semiconductor wafers and chips, flat panel liquid crystal displays (LCDs), solar PV cells and modules, and other electronic devices. These customers may use what they manufacture in their own end products or sell the items to other companies for use in advanced electronic components. The Company’s fiscal year ends on the last Sunday in October.
Applied is the world’s largest semiconductor fabrication equipment supplier based on revenue, with the capability to provide global deployment and support services. Applied also is athe leading supplier of LCD fabrication equipment to the flat panel display industry, and is the leading supplier of solar PV manufacturing systems to the solar industry, based on revenue.
Applied operates in four reportable segments: Silicon Systems Group, Applied Global Services, Display, and Energy and Environmental Solutions. Applied manages its business based upon these segments. A summary of financial information for each reportable segment is found in Note 1716 of Notes to Consolidated Financial Statements. A discussion of factors that could affect Applied’s operations is set forth under “Risk Factors” in Item 1A, which is incorporated herein by reference.
Silicon Systems Group Segment
Applied’s Silicon Systems Group segment develops, manufactures and sells a wide range of manufacturing equipment used to fabricate semiconductor chips, also referred to as integrated circuits (ICs). Most chips are built on a silicon wafer base and include a variety of circuit components, such as transistors and other devices, that are connected by multiple layers of wiring (interconnects). Applied offers systems that perform most of the primary processes used in chip fabrication, including atomic layer deposition (ALD), chemical vapor deposition (CVD), physical vapor deposition (PVD), electrochemical deposition (ECD) etch,, rapid thermal processing (RTP), chemical mechanical planarization (CMP), wet cleaning, and wafer metrology and inspection, as well as systems that etch measure andor inspect circuit patterns on masks used in the photolithography process. Applied’s semiconductor manufacturing systems are used by integrated device manufacturers and foundries to build and package memory, logic and other types of chips.
Most chips currently are fabricated using 6545 nanometer (nm) and larger linewidth dimensions, although Applied is also working with customers on leading-edge technology for advanced nodes using 45nm, 32nm, 22nm and smaller dimensions. To build a chip, the transistors, capacitors and other circuit components are first created on the surface of the wafer by performing a series of processes to deposit and selectively remove portions of successive film layers. Similar processes are then used to build the layers of wiring structures on the wafer. As the density of the circuit components increases to enable greater computing capability in the same or smaller physical area, the complexity of building the chip also increases, necessitating more process steps to form smaller structures and more intricate wiring schemes. A typical, simplified process sequence for building the wiring or interconnect portion of a chip involves initially depositing a dielectric film layer onto the base layer of circuit components using a CVD system. An etch system is then used to create openings and patterns in the dielectric layer. To form the metal interconnects, these openings and patterns are subsequently filled with conducting material using PVD and ECD technologies. A CMP step then polishes the wafer to achieve a flat surface. Additional deposition, etch and CMP steps are then performed to build up the layers needed to complete the interconnection of the circuit elements. Advanced chip designs require more than 500 steps involving these and other processes to complete the manufacturing cycle.
While some device manufacturers are still using aluminum as the main conducting material for building interconnect structures, most have transitioned to copper. Copper has lower resistance than aluminum and can carry more current in a smaller area. Applied is the leading supplier of systems for manufacturing copper-based chips, including equipment for depositing, etching and planarizing copper interconnect layers. Complementing
the transition to copper to improve chip speed is the use of low dielectric constant (low k) films to replace silicon
1
dioxide material as the insulator between the copper wiring structures. Applied also leads the industry in providing systems for depositing low k dielectric films.
The transistor is another key area of the chip where semiconductor manufacturers are improving their device designs to enhance speed.performance. Applied has the industry’s largest portfolio of technically advanced products for building smaller and faster transistors. One method of enhancing chip performance is strain engineering, a technique that stretches or compresses the space between atoms, allowing electrical current to flow more quickly. Multiple strain films are typically used in advanced devices since they have an additive effect on increasing transistor speed. Applied has a comprehensive portfolio of systems to enable these applications using CVD and epitaxial deposition technologies.
Major chipmakers have announced that they will beare integrating new high dielectric constant (high-k) and metal materials and processes in their transistor gate structures to increase chip performance and reduce power consumption. Applied has a comprehensive portfolio of fully characterized processes for building thesehigh-k/metal gates. These solutions include an integrated dielectric gate stack tool that combines four critical processes in a single system, a portfolio of metallization technologies using ALD and PVD, and an innovative high temperature etch system.
AsA new type of chip packaging is also emerging, known as three-dimensional (3D) ICs, as new consumer products demand higher performance in a smaller space, a new type of chip packaging is emerging, known as three-dimensional (3D) ICs.space. Providing greater functionality in a smaller footprint, 3DICs3D-ICs stack multiple chips together and electrically interconnectconnect them using deep holes, called through-silicon via (TSV) structures. In fiscal 2010, Applied acquired Semitool, Inc., a leading supplier of ECD and wafer surface preparation equipment used by chip packaging companies. Applied now has the industry’s most comprehensive line of production-proven systems and processes required for the majority of advanced packaging manufacturing steps, including etch, CVD, PVD, ECD, wafer cleaning and CMP systems. Applied is leading efforts to enableTo facilitate the adoption of packaging technology, Applied is working with consortiums and other equipment suppliers to lower customers’ implementation costs.
Some chip manufacturers have announced that they will be employing the new 3D manufacturing methods to enhance chip performance. One method is based on new 3D transistor designs that replace the traditional two-dimensional gate with a thin 3D gate. This new structure, targeted for the 22nm technology node and below, improves the performance and energy efficiency of the chip. In 2011, the Company introduced the Applied Centura Conforma™ system, which uses conformal plasma doping technology to modify the electrical properties of 3D and planar transistor structures.
Most of Applied’s semiconductor equipment products are single-wafer systems with multiple process chambers attached to a base platform. This enables each wafer to be processed separately in its own environment, allowing precise process control, while the system’s multiple chambers enable simultaneous, high productivity manufacturing. Applied sells most of its single-wafer, multi-chamber systems on fourfive basic platforms: the Centura®, the Endura®, the Producer®, Raider® and the Vantage®. platforms. These platforms support ALD, CVD, PVD, ECD, etch and RTP technologies.
Over time, the semiconductor industry has migrated to increasingly larger wafers to build chips. The predominant or common wafer size used today for volume production of advanced chips is 300 millimeter (mm), or12-inch, wafers. Applied offers a comprehensive range of 300mm systems.systems through its Silicon Systems Group segment. Applied also offers earlier-generation 200mm systems, as well as products and services to support all of its systems, which are reported under its Applied Global Services segment.
The following summarizes Applied’s portfolio of products and their associated process technology areas reported under its Silicon Systems Group segment.
Deposition is a fundamental step in fabricating a chip. During deposition, layers of dielectric (an insulator), barrier, or electrically conductive (typically metal) films are deposited or grown on a wafer. Applied currently provides equipment to perform four types of deposition: ALD, CVD, ECD and PVD. In addition, Applied’s RTP systems can be used to perform certain types of dielectric deposition.
ALD is an advanced technology in which atoms are deposited one layer at a time to build chip structures. This technology enables customers to fabricate thin films of either conducting or insulating material with uniform coverage insub-nanometer sized nanometer-sized structures. Applied offers ALD chambers forOne of the most critical areas of the transistor is its gate, which is built by depositing tungstenlayers of dielectric films. At the 22nm node and high-k/metal gate films. In 2010, the Companybelow, these film layers are so thin that they must be atomically engineered. To meet this challenge, in 2011, Applied introduced its Applied Endura iLB PVD/Centura Integrated Gate Stack system with advanced ALD technology. The system an advancementbuilds ultrathin high-k film layers less than 2nm in ALD technology that
2
enables customers to shrink the contact structures to increase signal speeds in 22nm and beyond logic and memory devices.
Chemical Vapor Deposition
CVD is used to deposit dielectric and metal films on a wafer. During the CVD process, gases that contain atoms of the material to be deposited react on the wafer surface, forming a thin film of solid material. Films deposited by CVD may be silicon oxide, single-crystal epitaxial silicon, amorphous silicon, silicon nitride, dielectric anti-reflective coatings, low k dielectric (for highly efficient insulating materials), aluminum, titanium, titanium nitride, polysilicon, tungsten, refractory metals or silicides. Applied offers the following CVD products and technologies:
The Applied Producer CVD platform — This high-throughput platform features Twin-Chamber® modules that have two single-wafer process chambers per unit. Up to three Twin-Chamber modules can be mounted on each Producer platform, giving it a simultaneous processing capacity of six wafers. Many dielectric CVD processes can be performed on this platform. The highest productivity model of this system is the Applied Producer GT, which has achieved rapid customer acceptance due to its fast wafer handling performance and compact design.
Low k Dielectric Films — Low k dielectric materials are used in copper-based chip designs to further improve interconnect speed. Using conventional CVD equipment, the Applied Producer Black Diamond® family of low k systems provides customers with a proven, cost-effective way to integrate a variety of low k films into advanced interconnect structures. To further increaseIn 2011, the Company introduced its third-generation low k technologies, the Applied Producer Black Diamond 3 system and Applied Producer Nanocure 3 system. Together, these products are designed to enable smaller, higher performance of the complete multi-layer dielectric structure, Applied offers a line of BLOKand more power-efficient devices at 22nm and below.
tm (barrier low k) films deposited with the Producer system.
Lithography-Enabling Solutions — Applied offers several technologies on the Producer system to help chipmakers extend their current 193nm lithography tools, including a line of Applied APF® (advanced patterning film) films and Applied DARC® (dielectric anti-reflective coating) films. Together, they provide a film stack with the precise dimensional control and compatibility needed to cost-effectively pattern nano-scale features without additional integration complexity.
Gap Fill Films — There are many steps during the chipmaking process in which very small and deep, or high aspect ratio (HAR), structures must be filled void-free with a dielectric film. Many of these applications include the deposition of silicon oxides in substrate isolation structures, contacts and interconnects. TheIn addition to its Applied Centura Ultima HDP-CVD® (high-density plasma CVD) and Applied Producer HARPtm™ (high aspect ratio process) systems, have been workhorses for the industry, enabling customers to scale their devices to the 32nm node. In 2010, the Company introducedoffers its breakthrough Applied Producer Eternatm™ FCVD system. Targeted for 20nm and below chips, the Eterna system delivers a liquid-like film that flows freely into virtually any structure to provide void-free dielectric fill.
Strain Engineering Solutions — The Applied Producer HARP system also plays a key role in enhancing transistor performance, enabling chipmakers to boost chip speed by depositing strain-inducing dielectric films. Offering the industry’s first integrated stress nitride deposition and ultraviolet (UV) cure solution, the Applied Producer Celera CVD delivers benchmark levels of high-stress tensile silicon nitride films. The Company also offers the Applied Centura SiNgenPlus low pressure CVD system for low temperature silicon nitride films. Used together, and in conjunction with silicon germanium (SiGe) films using Applied’s epitaxial deposition technologies, these systems can provide additive strain engineering benefits.
Through-Silicon Via Films— In 2010, Applied expanded its offeringsThe Company has a comprehensive portfolio of products for TSV fabrication, with two new CVD systems. Theincluding the Applied Producer InViatm™ system system. This product uses a unique process to deposit the critical oxide liner film layer in HAR TSV structures, enabling robust electrical isolation of the TSV, which is vital for reliable device performance. For applications where higher temperatures can damage the manufacturing process, the Applied Producer Avilatm™ CVD system allows high quality dielectric film deposition at stable substrate temperatures at a low cost of ownership.
Epitaxial Deposition — Epitaxial silicon (epitaxy or epi) is a layer of pure silicon grown in a uniform crystalline structure on the wafer to form a high quality base for the device circuitry. Epi technology is used in an increasing number of integrated circuit devices in both the wafer substrate and transistor areas of a chip to
3
enhance speed. The Applied Centura Epi system integrates pre- and post-epi processes on the same system to improve film quality and reduce production costs. This system is also used for SiGe epi technology, which reduces power usage and increases speed in certain types of advanced chips. For emerging transistor designs, the Applied Centura RP Epi system offers selective epi processes to enable faster transistor switching through strain engineering techniques.
Polysilicon Deposition — Polysilicon is a type of silicon used to form portions of the transistor structure within the integrated circuit device. The Applied Centura Polygentm™ LPCVD system is a single-wafer, multi-chamber product that deposits thin polysilicon films at high temperatures to create transistor gate structures. To address the challenging requirements of shrinking gate dimensions, the Applied Centura DPN Gate Stack system integrates chambers for decoupled plasma nitridation (DPN), RTP anneal and polysilicon deposition on one platform to enable superior film quality and material properties.
Tungsten Deposition — Tungsten is used in the contact area of a chip that connects the transistors to the wiring circuitry. In aluminum-based devices, tungsten is also used in the structures that connect the multiple layers of aluminum wiring. Applied has two products for depositing tungsten: the Applied Centura Sprint® Tungsten CVD system for 90nm and below devices and the Applied Centura iSprint ALD/CVD system for more advanced applications. The latter product combines ALD technology and CVD chambers on the same platform.
Electrochemical Deposition
Electrochemical deposition is a process by which metal atoms from a chemical fluid (an electrolyte) are deposited on the surface of an immersed object. Its main application in the semiconductor industry is to deposit copper in interconnect wiring structures. This process step follows the deposition of barrier and seed layers which prevent the copper from contaminating other areas of the device, and improve the adhesion of the copper filmenablefilm and enable electrodeposition to occur. As a result of Applied’s acquisition of Semitool, the CompanyApplied offers two ECD systems: the Applied Raider GT ECD for electroplating advanced chip interconnect structures, and the Applied Raider S ECD for advanced TSV packaging applications.
Physical Vapor Deposition
PVD is a physical process in which atoms of a gas, such as argon, are accelerated toward a metal target. The metal atoms chip off, or sputter away, and are then deposited on the wafer. The Applied Endura PVD system offers a broad range of advanced metal deposition processes, including aluminum, aluminum alloys, cobalt,titanium/titanium nitride, tantalum/tantalum nitride, tungsten/tungsten nitride, nickel, vanadium and copper. In 2010, Applied celebrated the 20th20th year of its Applied Endura platform, the most successful metal deposition system in the history of the semiconductor industry.
The Applied Endura CuBS (copper barrier/seed) PVD system is widely used by customers for fabricating copper-based chips. Using PVD technology, the system deposits a tantalum-based barrier film that prevents copper material from entering other areas of the device and then a copper seed layer that primes the structure for the subsequent deposition of bulk copper. The Applied Endura CuBS RFX PVD system extends cost-effective CuBS technology to the 22nm node. In 2010, Applied introduced two new PVD systems for creating the leading-edge chips needed for the next generation of smart devices. The Applied Endura Avenirtm™ RF PVD system sequentially deposits the
multiple metal film layers that form the heart of the industry’s new, faster, metal gate transistors. The Applied Endura iLB PVD/ALD system advances thestate-of-the-art in ALD technology, enabling customers to shrink their speed-critical contact structures for 20nm and below devices.
Applied’s Endura system has also been used for many years in back-end applications to deposit metal layers before final bump or wire bonding packaging steps are performed. The Applied Chargertm™ UBM PVD system, which is specifically designed for under-bump metallization (UBM) and other back-end processes, features linear architecture for reliable performance and very high productivity at a low cost per wafer.
4
EtchEtch
Etching is used many times throughout the integrated circuit manufacturing process to selectively remove material from the surface of a wafer. Before etching begins, the wafer is coated with a light-sensitive film, called photoresist. A photolithography process then projects the circuit pattern onto the wafer. Etching removes material only from areas dictated by the photoresist pattern. Applied offers a wide range of systems for etching dielectric, metal and silicon films to meet the requirements of
advanced processing.sub-100nm processing.
Applied’s Producer Etch system utilizes the Company’s Twin-Chamber Producer platform to target cost-sensitive dielectric etch applications. To address advanced dielectric etch applications, the Applied Centura Enabler® E5 Etch system enables customers to create the 40:1 HAR contact features that are critical to the yield and performance of 32nm and below DRAM and Flash memory chips. The Applied Centura Carinatm™ system uses innovative, high-temperature technology to deliver the etch capability essential for scaling logic and memory devices with high-k/metal gates at 45nm and below.
In 2010,2011, the Company introduced its Applied CenturaCentris AdvantEdge™ Mesatm™ Mesatm silicon etch, which features an unprecedented eight process chambers for high wafer output and proprietary system for fabricating nano-scale circuit features with angstrom-level precision.intelligence software to assure every process on every chamber precisely matches. The system has achieved strong acceptance byalso saves on power, water and gas consumption, helping customers providing the critical technical capability needed forto lower operating costs and support their next-generation devices.sustainable manufacturing initiatives. The Applied Centura Marianatm™ Trench Etch system provides customers with the capability to scale DRAM capacitors by enabling the etching of 80:1 aspect ratio structures. The Applied Centura Silviatm™ system is specifically designed for etching small, deep holes for TSV applications in 3D-ICs. For etching metals, the Applied Opustm™ AdvantEdge Metal Etch uses an optimized 5-chamber platform configuration that enables customers to extend aluminum interconnect technology and productivity for flash and DRAM memory applications.
RTP is a process in which a wafer is subjected to rapid bursts of intense heat that can take the wafer from room temperature to more than 1,000 degrees Celsius in less than 10 seconds. A rapid thermal process is used mainly for annealing, which modifies the properties of deposited films. The Applied Centura Radiance®Plusand Applied Vantage RadOxtm™ RTP systems feature advanced RTP technology with differing platform designs. While the multi-chamber Centura platform offers exceptional process flexibility, the streamlined two-chamber Vantage platform is designed for dedicated high-volume manufacturing. These single-wafer RTP systems are also used for growing high quality oxide and oxynitride films, deposition steps that traditional large batch furnaces can no longer achieve with the necessary precision and control. With its proprietary radical-based oxidation process,
Applied’s latest RTP systems address the critical need for controlling wafer temperature to increase chip performance and yield. The laser-based Applied Vantage Astra™ millisecond anneal system abruptly raises the surface temperature of the wafer locally to modify material properties at the atomic level. In 2011, the Company introduced the Applied Vantage RadOxVulcan system, deposits high-performance transistor gate oxides withthe first RTP system to heat the wafer entirely from the backside. This system brings a new level of precision and control to the anneal process, allowing chipmakers to produce more high productivity and low operating cost for flash memory applications. In 2010, the Company introduced its laser-based Applied Vantage Astraperformance devices per wafer.
tm millisecond anneal system for creating the sensitive nickel silicide transistor contact layers, enabling faster, lower power-consumption logic chips.
Chemical Mechanical Planarization
The CMP process removes material from a wafer to create a flat (planarized) surface. This process allows subsequent photolithography patterning steps to occur with greater accuracy and enables film layers to build with
minimal height variations. Applied has led the industry with its 300mm Applied Reflexion® LK system, with features such as integrated cleaning, film measurement and process control capabilities. In 2010, Applied introduced itsApplied’s latest CMP product, the Applied Reflexion GT CMP system, has an innovative dual-wafer design that increases performance while lowering system cost of ownership in fabricating copper interconnects.
interconnects and tungsten contacts.Surface Preparation
Cleaning the surface of the wafer is critical to the adhesion and quality of films that are subsequently deposited in the chip fabrication process. Through its acquisition of Semitool, Applied offers several surface preparation systems. The Applied Raider SP can incorporate several types of cleaning methods, including spray, vapor, immersion, megasonics and anneal technologies with automated single or dual-side wafer processing for high volume manufacturing.
5
Metrology and Wafer Inspection
Applied offers several products for measuring features and inspecting defects on the wafer during various stages of the fabrication process. These systems enable customers to characterize and control critical dimension (CD) and defect issues, especially at advanced generation technology nodes.
Critical Dimension and Defect Review Scanning Electron Microscopes (CD-SEMs and DR-SEMs)
Scanning electron microscopes (SEMs) use an electron beam to form images of microscopic features of a patterned wafer at extremely high magnification. Applied’s SEM products provide customers with full automation, along with the high accuracy and sensitivity needed for measuring very small CDs. The Applied VeritySEM® 4i metrology system uses proprietary SEM imaging technology to enable precise control of the lithography and etching processes. The VeritySEM measuresprocesses, measuring CDs at a precision of less than 0.3nm, a requirement for 32nm and below device production and incorporates automation and software advancements for significantly higher throughput.0.3nm. Applied’s OPC Checktm™ software for the VeritySEM system performs automated qualification of OPC-based (optical proximity correction) chip designs, significantly reducing mask (see Mask Making section below) verification time over conventional manual methods.
DR-SEMs review defects on the wafer (such as particles, scratches or residues) that are first located by a defect detection system and then classify the defects to identify their source. The high-throughput, fully automatic Applied SEMVisiontm™ Defect Analysis products enable customers to use this technology as an integral part of their production lines to analyze defects as small as 30nm with industry-leading throughput.
Using deep ultraviolet (DUV) laser-based technology, defects can be detected on patterned wafers (wafers with printed circuit images) as they move between processing steps. Defects include particles, open circuit lines, and shorts between lines. Incorporating key advances in imaging technology, the Applied ComPlustm Inspection system, for darkfield applications, detects defects in devices with advanced design rules with the high speed required for customers’ volume production lines. The Applied UVision® 4 wafer Inspectioninspection system was introduced in 2010, enabling customers to detectdetects yield-limiting defects in the critical patterning layers of 22nm and below logic and memory devices usingdevices. In 2011, the Company introduced the Applied DFinder system, the first darkfield wafer inspection system to use DUV laser-based imaging technology.
laser scanning to detect particles as small as 40nm in interconnect layers.Mask Making
Masks are used by photolithography systems to transfer microscopic circuit designs onto wafers. Since an imperfection in a mask may be replicated on the wafer, the mask must be virtually defect-free. Applied provides systems for etching and inspecting masks.
In 2010, the Company introduced itsThe Applied Centura Tetratm™ X Advanced Reticle Etch system is an advanced etch tool for fabricating leading-edge masks at 22nm and beyond.below. Applied’s Tetra line of systems has been used by mask makers worldwide to etch the majority of high-end masks over the last five years. AppliedThe Company also introducedaddresses the challenges of detecting defects on 22nm masks with its Applied Aera3tm™ Mask Inspection system which allows customers to meet the most critical defect detection challenges of 22nm masks.inspection system. Using sophisticated aerial imaging technology, the Aera3 allows users to immediately see how the pattern on the mask will appear on the
wafer, revealing only the defects most likely to print and significantly reducing inspection time.
These systems also address the challenge of fabricating emerging extreme ultraviolet (EUV) lithography masks.Ion Implantation
With the acquisition of Varian Semiconductor Associates, Inc. (Varian) in November 2011, Applied began to design, market, manufacture and service ion implantation systems. These systems are primarily used in the manufacture of transistors, which are a basic building block of ICs or microchips. Ion implantation systems create a beam of electrically charged particles called ions, which are implanted into transistor structures at precise locations and depths, changing the electrical properties of the semiconductor device. These implantation systems may also be used in other areas of IC manufacture for modifying the material properties of the semiconductor devices, as well as in manufacturing crystalline-silicon solar cells and light-emitting diodes (LEDs).
Applied Global Services Segment
The Applied Global Services segment encompasses products and services designed to improve the performance and productivity, and reduce the environmental impact, of the fab operations of semiconductor, LCD and solar PV manufacturers. The in-depth expertise and best known methods of Applied’s extensive global support infrastructure enable Applied to continuously support customers’ production requirements. Trained customer engineers and process support engineers are deployed in more than a dozen countries. These engineers are usually
6
located at or near customers’ fab sites and service over 34,00037,000 installed Applied systems, as well as non-Applied systems. Applied offers the following general types of services and products:
Fab and Equipment Services — Applied offers a portfolio of fab-wide operations services to maintain and optimize customers’ fabrication facilities. Applied Performance Services offers customers comprehensive equipment support with performance-based pricing and predictable costs to enable improved cost of ownership. Included in this program is Applied’s ExpertConnect remote diagnostic capability, providing expert support around the clock. The Company
Applied also offers Performance Services for solar PV manufacturing. The first service product of its kind for the solar industry, theTotal Parts Management program enables customers to quickly ramp to volume production while optimizing the performance, cost and output of their manufacturing lines.
The Company also offers Performance Spares, which arewith spare parts manufactured to Applied’s strict technical specifications and quality standards.
Applied’s Metron Chamber Performance Services unit provides precision cleaning, technology-enhanced coating and refurbishment on chamber process kits and components. The unit also has extensive analytical testing capabilitiesIn addition to validate and certify performance specifications.
In addition,advanced 300mm fabs, Applied offers a wide range of products and services to extend the productive life of 200mm semiconductor fabs, including new and remanufactured 200mm equipment, system enhancements and fab transition services. Designed to maximize productivity and lower cost of ownership, these products also assist customers in implementing green manufacturing solutions. Applied’s 200mm systems are available in a broad range of production-proven technologies, including CVD, PVD, etch, implant, RTP, CMP, epitaxy, metrology and inspection tools.
Automation Systems — Applied offers automated factory-level and tool-level control software systems for semiconductor, LCD and solar cellPV manufacturing facilities. These enterprise solutions include manufacturing execution systems (MES) to automate the production of wafers and LCD and solar substrates, advanced process control systems, and scheduling and materials handling control systems. In 2010, the Company introduced itsThe Applied SmartFactorytm™ MES software is a factory automation solution designed to help accelerate the production ramp of emerging technologies for solar PV, chip-packaging, and light-emitting diode (LED)LED applications.
Applied also offers computerized maintenance management systems, performance tracking and modeling and simulation tools for improving asset utilization. Applied’s E3™ equipment engineering system solution, for example, uniquely integrates all critical equipment automation and process control components. In 2010, the Company introduced itsThe Applied SmartSchedtm™ system is the semiconductor industry’s first predictive scheduling solution for optimizing the movement of wafers during the lithography process to reduce cycle time and increase tool utilization.
Sub-Fab SystemsThin Film Solar — — A significant componentAs a result of solar PV chip manufacturing is the ancillary equipment such as pumpsApplied’s restructuring of its Energy and abatement systems that are connected to the process chambers. Located outside the clean area of the facilityEnvironmental Solutions segment in thesub-fab, this equipment controls fab emissions to assure clean, sustainable chip manufacturing.
Abatement Control Systems — Infiscal 2010, the Company
introduceddiscontinued sales to new customers of its
fully-integrated SunFab™ thin film solar production lines, but continues to support existing SunFab customers with services, upgrades and capacityincreases through the Applied iSYStm platform, the industry’s first fully-integrated abatementGlobal Services segment. Thin film solar technologies are well-suited for large-scale applications, such as utility scale solar farms and vacuum pumping solution for controlling emissions and reducing energy costs in the fab. Synchronized with an Applied process tool, the iSYS system can deliver typical annual savings in power, water and gas consumption equivalent to 200MWh of energy compared to currently available technologies.
commercial rooftops, where space is not a constraint.Display Segment
Applied’s AKT subsidiary, reported under the Display segment, designs, manufactures and sells equipment to fabricateproducts for manufacturing thin film transistor LCDsliquid crystal displays (TFT- LCDs) for televisions, computer displayspersonal computers (PCs), tablet PCs, smartphones and other consumer-oriented electronic applications.applications are reported under its Display segment. While similarities exist between the technologies utilized in chipmaking and LCD fabrication, the most significant differences are in the size and composition of the substrate. Substrates used to manufacture LCD panels can be more than 70120 times larger in area than 300mm wafers and are made of glass, while wafers are made of silicon.
Applied supplies a wide range of systems that process and test different glass substrate sizes. To meet consumer demand for larger, more cost-effective LCD TVs, Applied’s latest generation (Gen) 10 systems can process substrates sized at approximately 2.85 x 3.05 meters, with each substrate enabling the production of up to six 65-inch LCD TV screens. Applied is also extending its core LCD equipment technology into new mobility display segments that require smaller, high-performance LCD or organic LED (OLED) screens and touch capability.
For fabricating the transistor layer of these panels, the CompanyApplied offers a line of plasma-enhanced CVD (PECVD) systems that use
7
multi-chamber platform architecture to deposit dielectric and semiconducting films.
In 2011, the Company introduced the Applied AKT-20K PX PECVD system for manufacturing high-performance LCD and OLED displays for advanced smartphones and tablet PC products. The system deposits highly-uniform low-temperature polysilicon (LTPS) films on 1.95m2glass sheets that are three times larger than the previous standard size, enabling larger, higher resolution screen sizes compared to previous-generation mobile products.The AKT-PiVottm™ 55KV system employs high-productivity, cost-efficient PVD technology to deposit metal and transparent conductive oxide films on the substrate. For manufacturing the color filter of LCD panels, Applied offers the AKT-NEW ARISTOtm™ for transparent conductive oxide film deposition.
Providing customers with new levels of productivity and flexibility, the Company introduced in 2011 the Applied AKT-AristoTwin system for manufacturing touch-enabled displays. The system features two independent processing tracks on a single system, enabling customers to achieve 50% more capacity using half the manufacturing space.To complement these systems, Applied also offers a line of electron beam test (EBT) systems for testing substrates during production for defective pixels and other imperfections.imperfections, including the Gen-10 AKT-90K EBT product. Featuring one of the industry’s fastest and most accurate pixel test technologies with the lowest operating cost, the EBT systems’ non-contact test technology enables the safe testing of high-value LCD TV panels without damaging or scratching the display.
To meet growing consumer demand for larger, more cost-effective LCD TVs, LCD manufacturers have moved to increasingly larger-sized substrates. Applied’s latest generation (Gen) 10 systems can process substrates sized at approximately 2.85 x 3.05 meters, with each substrate enabling the production of up to six65-inch LCD TV screens. These Gen-10 systems include the AKT-90K PECVD and the Gen-10 AKT-90K EBT products.
Energy and Environmental Solutions Segment
The Energy and Environmental Solutions segment includes manufacturing solutionssystems to produce products for the generation and conservation of energy. To increase the conversion efficiency and yields of solar PV devices and help reduce the cost per watt of solar-generated electricity, Applied offers manufacturing solutions for wafer-based crystalline silicon (c-Si) and glass based thin film applications.
Applied’s portfolio of solar PV wafer and cell fabrication technologies has made it athe leading supplier of c-Si manufacturing systems worldwide. Key benefitsequipment worldwide in terms of revenue. In addition to innovative technology, these systems are high-productivity,offer key manufacturing benefits to customers in high productivity, advanced ultra-thin wafer handling, and extensive automation, helping customersautomation.
Wafer manufacturing — Applied’s precision wafering systems crop and square silicon ingots into bricks and slice silicon bricks into thin wafers with high productivity and minimal silicon loss. These wafers are subsequently processed by cell manufacturing systems to lowercreate the cost per watt of electricity fromPV cells used in making c-Si solar PVs.panels. The
Applied HCT wire saw cropper and squarer systems cut silicon ingots into bricks with high productivity and minimal silicon loss. The Applied HCT B5 wire saw, a leading wafer slicing system, was designed for large load capacity in volume manufacturing and has a unique four-position architecture that provides the load flexibility for optimizing yield and productivity.
Cell manufacturing — Applied offers a comprehensive line of automated metallization and test systems for c-Si cell manufacturing. Themanufacturing with its Applied Baccini products. These systems offerinclude high-precision printing capability designed to increasefor increasing the efficiency of c-Si solar cells. In 2011, the Company introduced the Applied also offers systemsBaccini Pegaso™ platform for slicingnext-generation solar cell manufacturing. In addition to increased yield and squaring wafers from silicon ingots. The high productivity and performanceoutput, a key feature of the Applied HCT B5 platform have made it the leading wire saw used by solar PV cell manufacturers worldwide. The Company also offers the Applied HCT Diamond SquarertmPegaso system is its proprietary “smart” capabilities which uses diamond wire technology to eliminate the need for abrasive slurrybring a new level of precision and reduces electricity consumption.
Thin film solar technologies are ideally suited for large-scale applications, such as utility scale solar farms and commercial rooftops, where space is not a constraint. The Company offers the Applied AKT PECVD system for depositing low temperature polysilicon films for thin film applications. Applied also offers the ATONtm in-line deposition system, a large-area platform for high-quality deposition and high-throughput in both c-Si and thin film solar PV manufacturing.
Priorcontrol to the third quartercell manufacturing process. The system’s modular architecture allows customers to rapidly add modules for additional processing capability, reducing the time, cost and risk of fiscal 2010, Applied offered its fully-integrated SunFabtm production line for manufacturing large-size thin film panels. In the third quarter of fiscal 2010, Applied restructured its Energy and Environmental Solutions segment in response to adverse market conditions for thin film solar, including delays in utility-scale solar adoption, solar panel manufacturers’ challenges in obtaining affordable capital, changes and uncertainty in government renewable energy policies, and competitive pressure from c-Si solar technologies. As part of the restructuring, Applied discontinued sales toimplementing new customers of its fully-integrated SunFab lines, but will offer individual tools for thin film solar manufacturing. Applied is supporting existing SunFab line customers with services, upgrades and capacity increases through its Applied Global Services segment and will continue RD&E efforts to improve thin film panel efficiency and high-productivity deposition.
cell designs.Other products offered under the Energy and Environmental Solutions segment includeroll-to-roll, vacuum web coating systems for high-performance deposition of a range of films on flexible substrates for functional, aesthetic or optical properties. The Company’s Applied TopmetTopMettm™ 4450, is the world’s largest and fastestroll-to-roll machine for depositing ultra-thin aluminum films for flexible packaging applications.
The Applied SmartWeb™ system uses PVD technology to deposit critical multi-layer films required for fabricating advanced touch panels in mobile devices and other flexible electronic substrates. The system’s modular design allows up to 12 different thin film layers to be deposited simultaneously on flexible material, enabling complex structures to be created in a single pass.Backlog
Applied manufactures systems to meet demand represented by order backlog and customer commitments. Backlog consists of: (1) orders for which written authorizations have been accepted and assigned shipment dates are within the next 12 months, or shipment has occurred but revenue has not been recognized; (2) contractual service
8
revenue and maintenance fees to be earned within the next 12 months; and (3) orders for SunFab lines that are anticipated to be recognized as revenue within the next 12 months.
Applied’s backlog
increasedat any particular time is not necessarily indicative of actual sales for any future periods, due to the potential for customer changes in delivery schedules or cancellation of orders.Applied’s backlog decreased from $2.7 billion at October 25, 2009 to $3.2 billion at October 31, 2010.2010 to $2.4 billion at October 30, 2011. Applied’s backlog on any particular date is not necessarily indicative of actual sales for any succeeding period. Customers may delay delivery of products or cancel orders prior to shipment, subject to possible cancellation penalties. Delays in delivery schedulesand/or a reduction of backlog during any particular period could have a material adverse effect on Applied’s business and results of operations.
Manufacturing, Raw Materials and Supplies
Applied’s manufacturing activities consist primarily of procurement, assembly, test and integration of various proprietary and commercial parts, components and subassemblies (collectively, parts) that are used to manufacture systems. Manufacturing requires raw materials,Applied has implemented a distributed manufacturing model under which manufacturing and supply chain activities are conducted in various countries, including a wide varietythe United States, Europe, Israel, Singapore, Taiwan and other countries in Asia, and assembly of mechanical and electrical components, to be manufactured to Applied’s specifications.some systems is completed at customer sites. Applied uses numerous companies,vendors, including contract manufacturers, to supply parts and assembly services for the manufacture and support of its products. Although Applied makes reasonable efforts to assure that parts are available from multiple qualified suppliers, this is not always possible. Accordingly, some key parts may be obtained from only a single supplier or a limited group of suppliers. Applied seeks to reduce costs and to lower the risks of productionmanufacturing and service interruptions as well as shortages of key parts, by: (1) selecting and qualifying alternate suppliers for key parts; (2) monitoring the financial condition of key suppliers; (3) maintaining appropriate inventories of key parts; (4) qualifying new parts on a timely basis; and (5) locating certain manufacturing operations in areas that are closerclose proximity to suppliers and customers Applied is implementing a more distributed manufacturing model, which includes transitioning certain manufacturing and supply chain activities from the United States and Europe to Singapore, Taiwan and other countries in Asia and completing assembly of some systems at the customer site.
customers.Research, Development and Engineering
Applied’s long-term growth strategy requires continued development of new products. Applied’s significant investment in research, development and engineering (RD&E) has generally enabled it to deliver new products and technologies before the emergence of strong demand, thus allowing customers to incorporate these products into their manufacturing plans at an early stage in the technology selection cycle. Applied works closely with its global customers to design systems and processes that meet their planned technical and production requirements. Product development and engineering organizations are located primarily in the United States, as well as in Europe, Israel, Taiwan and China. In addition, Applied outsources certain RD&E activities, some of which are performed outside the United States, primarily in India. Process support and customer demonstration laboratories are located in the United States, China, Taiwan, Europe and Israel.
Applied’s investments in RD&E for product development and engineering programs to create or improve products and technologies over the last three years were as follows: $1.1 billion (11 percent of net sales) in fiscal 2011, $1.1 billion (12 percent of net sales) in fiscal 2010 and $934 million (19 percent of net sales) in fiscal 2009 and $1.1 billion (14 percent of net sales) in fiscal 2008.2009. Applied has spent an average of 13 percent of net sales in RD&E over the last five years. In addition to RD&E for specific product technologies, Applied maintains ongoing programs for automation control systems, materials research and environmental control that are applicable to its products.
In fiscal 2011, Applied developed logic and memory chip technologies to meet the requirements of manufacturing below the 22nm node. These technologies include low k dielectrics and curing for interconnect structures and high-k dielectric materials and ALD processes for fabricating transistor gates. Applied also focused on processes to help customers build new 3D gate structures. In addition, Applied continued to focus on optimizing the cost-effectiveness of TSV technologies to enable their widespread implementation. TSV is an emerging solution for interconnecting three dimensional chip stacks to provide better device performance, lower power consumption and the integration of heterogeneous devices. Applied is also investing in other new product development areas such as 450mm wafer systems. In the Display sector, Applied developed deposition systems to enable larger OLED, LCD and touch-enabled displays. In solar, Applied focused on screen printing technology to keep pace with cell manufacturers’ new higher-efficiency cell designs. A key development area was “smart” capability, which bring a new level of precision and control to the production process. RD&E also continued the development of products that enable lower-cost production of solar energy, production of LED devices for display backlighting and general lighting, and other products to enable energy conservation.
In fiscal 2010, Applied developed new technology to enable next-generation 22nm and below chip designs. These systems were designed to help customers continue their drive to pack more transistors in the same space using using high-k/metal gate technologies and double patterning processes. Applied also developed technology for through-silicon vias (TSVs), an emerging solution for interconnecting three dimensional chip stacks to provide better device performance, lower power consumption and the integration of heterogeneous devices.TSVs. In the solar PV area, Applied continued the development of its precision wafering and cell manufacturing products for lowering the cost of producing solar-generated electricity through advanced crystalline silicon technology. RD&E also included activities to develop products that enable lower-cost production of solar energy, production of light emitting diode (LED)LED devices for display backlighting and general lighting, and other products to enable energy conservation.
9
In fiscal 2009, Applied focused on developing systems for semiconductor customers’ new chip designs with 32nm and below geometries, including systems to enable faster transistors using strain engineering andhigh-k/metal gate technologies, as well as double patterning processes that enable customers to extend their existing 193nm lithography tools through additional technology generations. Applied also focused on developing technology for manufacturing next generationnext-generation displays. RD&E also included activities to develop products that enable lower-cost production of solar energy and other products to enable energy conservation.
In fiscal 2008, Applied focused on the development of processes and systems for the continued scaling of semiconductor devices. Applied pioneered a self-aligned double patterning approach that can enable 22nm and below device fabrication using conventional optical lithography. The Company also developed technology for the implementation of through-silicon vias. Efforts were also focused on developing the systems and technology to reduce thecost-per-watt of solar electricity.
Net sales by geographic region, which are attributed according to the location of customers’ facilities, were as follows:
| | | | | | | | | | | | | | | | | | | | | | | | | |
| | | 2010 | | | 2009 | | | 2008 | |
| | | ($) | | | (%) | | | ($) | | | (%) | | | ($) | | | (%) | |
| | | (In millions, except percentages) | |
| |
| Taiwan | | | 2,750 | | | | 29 | | | | 1,026 | | | | 21 | | �� | | 1,837 | | | | 22 | |
| Korea | | | 1,768 | | | | 19 | | | | 664 | | | | 13 | | | | 1,309 | | | | 16 | |
| China | | | 1,557 | | | | 16 | | | | 635 | | | | 13 | | | | 780 | | | | 10 | |
| Japan | | | 768 | | | | 8 | | | | 718 | | | | 14 | | | | 1,218 | | | | 15 | |
| Southeast Asia | | | 578 | | | | 6 | | | | 252 | | | | 5 | | | | 516 | | | | 6 | |
| | | | | | | | | | | | | | | | | | | | | | | | | |
| Asia Pacific | | | 7,421 | | | | 78 | | | | 3,295 | | | | 66 | | | | 5,660 | | | | 69 | |
| North America(*) | | | 1,147 | | | | 12 | | | | 966 | | | | 19 | | | | 1,520 | | | | 19 | |
| Europe | | | 981 | | | | 10 | | | | 753 | | | | 15 | | | | 949 | | | | 12 | |
| | | | | | | | | | | | | | | | | | | | | | | | | |
| Total | | | 9,549 | | | | 100 | | | | 5,014 | | | | 100 | | | | 8,129 | | | | 100 | |
| | | | | | | | | | | | | | | | | | | | | | | | | |
| | | | | | | | | | | | | | | | | | | | | | | | |
| | | 2011 | | | 2010 | | | 2009 | |
| | | ($) | | | (%) | | | ($) | | | (%) | | | ($) | | | (%) | |
| | | (In millions, except percentages) | |
China | | | 2,574 | | | | 24 | | | | 1,557 | | | | 16 | | | | 635 | | | | 13 | |
Taiwan | | | 2,093 | | | | 20 | | | | 2,750 | | | | 29 | | | | 1,026 | | | | 21 | |
Korea | | | 1,263 | | | | 12 | | | | 1,768 | | | | 19 | | | | 664 | | | | 13 | |
Japan | | | 912 | | | | 9 | | | | 768 | | | | 8 | | | | 718 | | | | 14 | |
Southeast Asia | | | 592 | | | | 5 | | | | 578 | | | | 6 | | | | 252 | | | | 5 | |
| | | | | | | | | | | | | | | | | | | | | | | | |
Asia Pacific | | | 7,434 | | | | 70 | | | | 7,421 | | | | 78 | | | | 3,295 | | | | 66 | |
North America(*) | | | 1,963 | | | | 19 | | | | 1,147 | | | | 12 | | | | 966 | | | | 19 | |
Europe | | | 1,120 | | | | 11 | | | | 981 | | | | 10 | | | | 753 | | | | 15 | |
| | | | | | | | | | | | | | | | | | | | | | | | |
Total | | | 10,517 | | | | 100 | | | | 9,549 | | | | 100 | | | | 5,014 | | | | 100 | |
| | | | | | | | | | | | | | | | | | | | | | | | |
| | |
| (*) | | Primarily the United States. |
Because of the highly technical nature of its products, Applied markets and sells products worldwide almost entirely through a direct sales force. Approximately 8881 percent of Applied’s fiscal 20102011 net sales were to regions outside of the United States.
General economic conditions impact Applied’s business and financial results. From time to time, the markets in which products are sold experience weak economic conditions that may negatively impact sales. Applied’s business is usually not seasonal in nature, but it is highly cyclical, based on capital equipment investment by major semiconductor, flat panel display, solar PV and other manufacturers. Customers’ expenditures depend on many factors, including: anticipated market demand and pricing for semiconductors, LCDs, solar cells and modules, and other substrates; the development of new technologies; customers’ factory utilization; capital resources and financing; government policies and incentives; and global and regional economic conditions.
Applied manages its business and reports financial results based on the segments described above, but does not allocate certain sales and marketing costs to the segments.
Information on net sales to unaffiliated customers and long-lived assets attributable to Applied’s geographic regions is included in Note 1716 of Notes to Consolidated Financial Statements. The following companies accounted
10
for at least 10 percent of Applied’s net sales in 2011, 2010, 2009,and/or 2008, 2009, which were for products in multiple reportable segments.
| | | | | | | | | | | | | |
| | | 2010 | | | 2009 | | | 2008 | |
| |
| Samsung Electronics Co., Ltd. | | | 14 | % | | | 10 | % | | | 16 | % |
| Taiwan Semiconductor Manufacturing Company Limited | | | 11 | % | | | * | | | | * | |
| Intel Corporation | | | * | | | | 12 | % | | | * | |
| | | | | | | | | | | | |
| | | 2011 | | | 2010 | | | 2009 | |
Samsung Electronics Co., Ltd. | | | 12 | % | | | 14 | % | | | 10 | % |
Taiwan Semiconductor Manufacturing Company Limited | | | 10 | % | | | 11 | % | | | * | |
Intel Corporation | | | 10 | % | | | * | | | | 12 | % |
The industries in which Applied operates are highly competitive and characterized by rapid technological change. Applied’s ability to compete generally depends on its ability to timely commercialize its technology, continually improve its products and develop new products that meet constantly evolving customer requirements. Significant competitive factors include technical capability and differentiation, productivity and cost-effectiveness. The importance of these factors varies according to customers’ needs, including product mix and respective product requirements, applications, and the timing and circumstances of purchasing decisions. Substantial competition exists in all areas of Applied’s business. Competitors range from small companies that compete with a single productand/or in a single region, to global, diversified companies with a range of
products. Applied’s ability to compete requires a high level of investment in RD&E, marketing and sales and global customer support activities. Management believes that many of Applied’s products have strong competitive positions.
The competitive environment for each segment is described below:
The semiconductor industry has been increasingly driven by consumer demand for lower-cost electronic products with increased capability and, to a lesser extent, by demand for commercial applications.capability. As a result, products within the Silicon Systems Group segment are subject to rapidsignificant changes in customer requirements, including transitions to smaller dimensions, new materials and an increasing number of applications. While certain existing technologies may be adapted to new requirements, some applications create the need for an entirely different technicaltechnological approach. The rapid pace of technological change can quickly diminish the value of current technologies and products and create opportunities for existing and new competitors. Applied offers a broad portfolio of technically-technologically differentiated products that must continuously evolve to satisfy customers’ requirements in order to compete effectively. Applied allocates resources among its numerous product offerings and therefore may decide not to invest in an individual product to the same degree as competitors who specialize in fewer products. There are a number of competitors serving the semiconductor manufacturing equipment industry, with some offering a single product line and others offering multiple product lines. These competitors range from suppliers serving a single region to global, diversified companies. Factors that influenced the competitive environment for the Silicon Systems Group in fiscal 20102011 included the rebounda softening in the semiconductor industry, driven bydespite higher demand for PCstablet computers, laptop computers and cell phones as well as the introduction of tablet computers. Higher factory utilization ratescellular phones. Device supply and tight device supplydemand dynamics led manufacturers to increasereduce their annual wafer fab equipment (WFE) capital spending, which is the major driver for Silicon Systems Group net sales.
Products and services within the Applied Global Services segment complement the Silicon Systems Group, Display, and Energy and Environmental Solutions segments’ products, in markets that are characterized by demanding worldwide service requirements and a diverse group of numerous competitors. To compete effectively, Applied offers products and services to reduce costs, improve tool performance, and increase the productivity and lessen the environmental impactenergy efficiency of customers’ fab operations. Significant competitive factors include productivity, cost-effectiveness, and the level of technical service and support. The importance of these factors varies according to customers’ needs and the type of products or services offered. Customers with more significant operationsand/or expertise may require fewer service products than customers who place greater reliance on an outsourcing model. Industry conditions that affected Applied Global Services’ sales of spares and services in fiscal 20102011 were principally semiconductor manufacturers’ wafer starts as well as additions to the tool installed base.
manufacturing capacity and utilization rates of fabs.Products in the Display segment are generally subject to strong competition from a number of major competitors. Applied holds established market positions with its technically-differentiated thin film technology (TFT)-LCDTFT-LCD manufacturing solutions for PECVD, color filter PVD, PVD array, PVD touch panel, and TFT array testing, although its market position could
11
change quickly due to customers’ evolving requirements. The competitive environment for Applied’s Display segment in fiscal 20102011 was characterized by increased demand and capacity requirements for larger flat panel televisionsmobile devices, such as smartphones and growing globaltablets PCs, which drove demand for high-performance displays and touch screen devices.
LCD TV demand and capacity also grew, but not as rapidly as in recent years. Important factors affecting the competitive position of Applied’s Display products include (i) industry trends, Applied’s ability to innovate and develop new products, and the extent to which Applied’s products are technically-differentiated, (ii) which customers within a highly concentrated customer base are making capital equipment investments, and (iii) Applied’s existing position at these customers.Applied’s products within the Energy and Environmental Solutions segment compete in several diverse market areas, including primarily the c-Si solar equipment to make solar PV cells and modules.market. All of these markets are drivencharacterized by extreme pressure to reduce customers’ overall production costs and improve cell performance. In this segment, Applied offersWith respect to its c-Si equipment products, primarily for c-Si wafer-based applications. Applied competes with manya number of other companies, some of which have moresignificant experience with solar applications and some of which are just enteringnew entrants to the solar equipment business.
Management believes that Applied’s competitive position significantly depends upon the Company’s research, development, engineering, manufacturing and marketing capabilities, and not just on its patent position. However, protection of Applied’s technological assets through enforcement of its intellectual property rights, including patents, is important. Therefore, Applied’s practice is to file patent applications in the United States and other countries for inventions that Applied considers significant. Applied has a substantial number of patents in the United States and other countries, and additional applications are pending for new inventions. Although Applied does not consider its business materially dependent upon any one patent, the rights of Applied and the products made and sold under its patents, taken as a whole, are a significant element of Applied’s business. In addition to patents, Applied also possesses other intellectual property, including trademarks, know-how, trade secrets and copyrights.
Applied enters into patent and technology licensing agreements with other companies when management determines that it is in the Company’sApplied’s best interest to do so. Applied pays royalties under existing patent license agreements for the use, in several of its products, of certain patented technologies that are licensed to Applied for the life of the patents.Applied. Applied also receives royalties from licenses granted to third parties. Royalties received from or paid to third parties have not been, and are not expected to be, material to Applied’s consolidated results of operations.
In the normal course of business, Applied periodically receives and makes inquiries regarding possible patent infringement. In responding to such inquiries, it may become necessary or useful for Applied to obtain or grant licenses or other rights. However, there can be no assurance that such licenses or rights will be available to Applied on commercially reasonable terms, or at all. If Applied is not able to resolve or settle claims, obtain necessary licenses on commercially reasonable terms,and/or successfully prosecute or defend its position, Applied’s business, financial condition and results of operations could be materially and adversely affected.
Applied maintains a number of environmental, health and safety programs that are primarily preventive in nature. As part of these programs, Applied regularly monitors ongoing compliance with applicable laws and regulations. In addition, Applied has trained personnel to conduct investigations of any environmental, health or safety incidents, including, without limitation, spills, releases or possible contamination.
Compliance with federal, state and local environmental, health and safety provisions, including, without limitation, those regulating the discharge of materials into the environment, remedial agreements and other actions relating to the environment have not had, and are not expected to have, a material effect on Applied’s capital expenditures, competitive position, financial condition or results of operations.
The most recent report on Applied’s environmental, health and safety activities can be found in the Company’s latest Citizenship Report on its website athttp://www.appliedmaterials.com/about/environment.html with additional information athttp://www.appliedmaterials.com/about/cr/sustainability. The Citizenship Report is updated periodically. This website address is intended to be an inactive textual reference only. None of the information on, or accessible through, Applied’s website is part of thisForm 10-K or is incorporated by reference herein.
At October 31, 2010,30, 2011, Applied employed approximately 13,000 regular employees and 1,325900 temporary employees. In the high-technology industry, competition for highly-skilled employees is intense. Applied believes
12
that its future success is highly dependent upon its continued ability to attract, retain and motivate qualified employees. There can be no assurance that Applied will be able to attract, hire, assimilate, motivate and retain a sufficient number of qualified employees.
Executive Officers of the Registrant
The following table and notes set forth information about Applied’s executive officers as of October 31, 2010:
| | |
Name of Individual | | Position |
Name of Individual | | Position |
|
Michael R. Splinter(1) | | Chairman of Board of Directors, President and Chief Executive Officer |
George S. Davis(2) | | Executive Vice President, Chief Financial Officer |
Mark R. Pinto(3) | | Executive Vice President, General Manager Energy and Environmental Solutions and Display, Chief Technology Officer |
Randhir Thakur(4) | | Executive Vice President, General Manager Silicon Systems |
Joseph Flanagan(5) | | Senior Vice President, Worldwide Operations and Supply Chain |
Mary Humiston(6) | | Senior Vice President, Global Human Resources |
Manfred Kerschbaum(6)Kerschbaum(7) | | Senior Vice President, Chief of Staff |
Joseph J. Sweeney(7)Sweeney(8) | | Senior Vice President, General Counsel and Corporate Secretary |
Chris Bowers(8)Bowers(9) | | Group Vice President, Corporate Initiatives |
Thomas T. Edman(10) | | Group Vice President, General Manager Display Business Group |
Ron Kifer(9)Kifer(11) | | Group Vice President, Chief Information Officer |
Mary Humiston(10) | | Group Vice President, Global Human Resources |
Charlie Pappis(11)Pappis(12) | | Group Vice President, General Manager Applied Global Services |
Omkaram Nalamasu(13) | | Corporate Vice President, Chief Technology Officer |
Thomas S. Timko(12)Timko(14) | | Corporate Vice President, Corporate Controller and Chief Accounting Officer |
| | |
| (1) | | Mr. Splinter, age 60, was named61, has been President and Chief Executive Officer and a member of Applied’s Board of Directors upon joining Applied insince April 2003 and he has been Chairman of the Board of Directors since March 2009. Prior to joining Applied, Mr. Splinter worked for nearlywas an executive at Intel Corporation (Intel), a manufacturer of chips and computer, networking and communications products, where Mr. Splinter held a number of positions in his 20 years at Intel, Corporation (Intel), most recently asincluding Executive Vice President and Director of the Sales and Marketing Group, responsible for sales and operations worldwide. Mr. Splinter previously held various executive positions at Intel, including Executive Vice President and General Manager of the Technology and Manufacturing Group. |
| |
| (2) | | Mr. Davis, age 53,54, was promoted to Executive Vice President, Chief Financial Officer in December 2009, after serving as Senior Vice President, Chief Financial Officer, since December 2006, after beingand appointed Group Vice President, Chief Financial Officer effectivein November 2006. Previously, he had been Group Vice President, General Manager, Corporate Business Development since FebruaryMarch 2005. From November 1999 to February 2005, Mr. Davis served as Vice President and Corporate Treasurer, where he managed Applied’s worldwide treasury operations and was responsible for investments, tax, financial risk management, and trade and export matters. Mr. Davis joined Applied in 1999. |
| |
| (3) | | Dr. Pinto, age 51,52, has served asheld the position of Executive Vice President, General Manager Energy and Environmental Solutions since joining AppliedJanuary 2011. Dr. Pinto was promoted to Executive Vice President in January 2004. His current responsibility isDecember 2009 and was previously Senior Vice President, General Manager, Energy and Environmental Solutions and Display as well as corporate Chief Technology Officer. Prior to joining Applied in January 2004, Dr. Pinto spent 19 years with Bell Laboratories (Bell Labs), a communications research and development company, and the Lucent Microelectronics Group, which later became Agere Systems Inc., an IC components company, most recently as Vice President of the Analog Products Division. Dr. Pinto holds a Ph.D. in Electrical Engineering from Stanford University. |
| |
| (4) | | Dr. Thakur, age 48, has held the position of49, was promoted to Executive Vice President, General Manager Silicon Systems in December 2009, after serving as Senior Vice President, General Manager Silicon Systems since October 2009. Previously, he was Senior Vice President, General Manager, Thin Film Solar and Display. He was appointed Senior Vice President, General Manager, Strategic Operations when he rejoined Applied in May 2008. He previously was with Applied from 2000 to 2005 in a variety of executive roles including Group Vice President, General Manager for Front End Products. From September 2005 to May 2008, Dr. Thakur served as Executive Vice President of Technology and Fab Operations at SanDisk Corporation, a data storage solutions manufacturer, and as head of SanDisk’s worldwide operations. Prior to joining Applied in 2000, Dr. Thakur served in leadership roles at Steag Electronic Systems AG, an electronics company, and Micron Technology, Inc., a semiconductor manufacturer. |
13
| | |
| (5) | | Mr. Flanagan, age 39, was appointed40, joined Applied as Senior Vice President, Worldwide Operations and Supply Chain in February 2010. Prior to joining Applied, Mr. Flanagan held executive positions in global operations for Nortel Networks Corporation, a telecommunications equipment manufacturer, since 2006, including presidentPresident of Nortel Business Services from August 2009 to February 2010.2010, and Senior Vice President of Global Operations from August 2007 until August 2009. Previously, Mr. Flanagan held a number of positions from 1993 to 2006 at General Electric.Electric Company (GE), a global infrastructure, finance and media company. |
| |
| (6) | Ms. Humiston, age 46, was named Senior Vice President, Global Human Resources in July 2011. She was Corporate Vice President, Global Human Resources from July 2009 to June 2010 and then promoted to Group Vice President in July 2010. Prior to July 2009, she served as the Corporate Vice President of Human Resources for both the Energy and Environmental Solutions and Display groups. Prior to joining Applied, Ms. Humiston was Vice President of Human Resources at Honeywell International Inc., which provides technologies to address safety, security and energy, from October 2002 to June 2008, with responsibility for various corporate and international organizations. She previously held executive positions with PeoplePC, an internet service provider; Gap, Inc., an apparel retailer; and GE. |
| (7) | Mr. Kerschbaum, age 56,57, was named Senior Vice President, Chief of Staff in September 2009. Prior to that he served as Senior Vice President, General Manager, Applied Global Services from January 2005 to September 2009. Mr. Kerschbaum was Senior Vice President, Global Operations from July 2004 to January 2005 and from October 2002 to May 2003. From May 2003 to July 2004, he was Group Vice President, Foundation Engineering and Operations. From January 1996 to October 2002, he held various positions in Applied Materials North America, most recently as Group Vice President, General Manager, Applied Materials North America. Mr. Kerschbaum has served in various other operations, customer service and engineering positions since joining Applied in 1983. |
| |
(7) | (8) | Mr. Sweeney, age 62,63, has held the position of Senior Vice President, General Counsel and Corporate Secretary of Applied since July 2005, with responsibility for global legal affairs, intellectual property and security. From April 2002 to July 2005, Mr. Sweeney was Group Vice President, Legal Affairs and Intellectual Property, and Corporate Secretary. Mr. Sweeney joined Applied in 1993. |
| |
(8) | (9) | Mr. Bowers, age 50,51, has been Group Vice President, Corporate Initiatives since March 2008.October 2009, working on enterprise wide transformation projects. From March 2008 to September 2009, he was Group Vice President and General Manager of Corporate Services and Chief of Staff, working closely with executives on effective business strategy execution. Prior to joining Applied, Mr. Bowers was a partner at the Hay Group, a global consulting firm, where he held various business leadership and consulting positions from 1992 to 2008. Most recently, he was Director of Client Services in Europe, the Middle East and Africa, and a member of the Hay Group Global R&D Council. Prior to the Hay Group, Mr. Bowers was a member of the U.K. Special Forces. |
| (10) | Mr. Edman, age 49, was appointed Group Vice President and General Manager of the Display Business Group in February 2011. Previously, he served as Group Vice President and General Manager of Corporate Business Development and Global Corporate Affairs and Marketing from June 2006 to June 2011. Prior to joining Applied, Mr. Edman served as President and Chief Executive Officer of Applied Films Corporation until the company was acquired by Applied in June 2006, and he held various executive positions at Marubeni Specialty Chemicals, Inc., a distributor of specialty chemicals. Mr. Edman also serves on the governing board of the FlexTech Alliance and on the Board of Directors of TTM Technologies, Inc. as Chairman of its compensation committee. |
(9) | (11) | Mr. Kifer, age 59,60, joined Applied in May 2006 as Group Vice President and Chief Information Officer, Global Information Services. Prior to his appointment, Mr. Kifer spent five years with DHL, a global logistics company, in various executive management roles, most recently as the Senior Vice President and Chief Information Officer for North America, Asia Pacific and Emerging Markets. |
|
(10) | | Ms. Humiston, age 45, was named Group Vice President, Global Human Resources, in May 2010. Prior to that, she served as the Corporate Vice President of Human Resources for both the Energy and Environmental Solutions and Display groups. Prior to joining Applied, Ms. Humiston was Vice President of Human Resources at Honeywell International Inc. from October 2002 to June 2008, with responsibility for various corporate and international organizations. She previously held executive positions with PeoplePC, Gap, Inc. and General Electric. |
|
(11) | (12) | Mr. Pappis, age 50, has been Group Vice President and General Manager of Applied Global Services since September 2009. He previously held positions in Applied Global Services as Corporate Vice President and General Manager for the Semiconductor Service Solutions group and as general manager for Equipment Productivity Services. He has held various other management positions since joining Applied in 1986. |
| (13) | Dr. Nalamasu, age 53, was promoted to Corporate Vice President and Chief Technology Officer for Applied in January 2011. Upon joining Applied in June 2006 to January 2011, Dr. Nalamasu was Corporate Vice President and Deputy Chief Technology Officer and served as General Manager for Applied’s Advanced Technologies Group Dr. Nalamasu was Vice President of Research and a NYSTAR Distinguished Professor of Materials Science and Engineering at Rensselaer Polytechnic Institute from 2002 to 2006. Prior to that he held various R&D leadership positions at Bell Labs and later Lucent Technologies, Inc., a telecommunications company, for 17 years. |
(12) | (14) | Mr. Timko, age 42,43, joined Applied in March 2010 as Corporate Vice President, Corporate Controller and Chief Accounting Officer. From June 2006 until March 2010, Mr. Timko was with Delphi Automotive LLP, a supplier to the automotive, computing, communications, energy and consumer accessories markets, where he was most recently Chief Accounting Officer and Controller. He served as Assistant Controller for The Interpublic Group of Companies, Inc., a global provider of advertising and marketing services, from December 2004 to June 2006, and previously at Dover Corporation.Corporation, a manufacturer of industrial products. Mr. Timko began his career in 1991 with PricewaterhouseCoopers LLC, a provider of audit and assurance, tax and advisory services, and is a certified public accountant. |
Applied’s website ishttp://www.appliedmaterials.com.Applied makes available free of charge, on or through its website, its annual, quarterly and current reports, and any amendments to those reports, as soon as reasonably practicable after electronically filing such reports with, or furnishing them to, the SEC. This website address is intended to be an inactive textual reference only. None of the information on, or accessible through, Applied’s website is part of thisForm 10-K or is incorporated by reference herein.
14
The following factors could materially affect Applied’s business, financial condition or results of operations and should be carefully considered in evaluating the Company and its business, in addition to other information presented elsewhere in this report.
The industries that Applied serves are volatile and difficult to predict.
As a supplier to the global semiconductor, flat panel display, solar and related industries, Applied is subject to business cycles, the timing, length and volatility of which can be difficult to predict and which vary by reportable segment. These industries historically have been cyclical due to sudden changes in customers’ manufacturing capacity and advanced technology requirements and spending, which depend in part on customers’ capacity utilization, production volumes, access to affordable capital, end-use demand, and inventory levels relative to demand, as well as the rate of technology transitions and customers’ access to affordable capital.transitions. These changes have affected the timing and amounts of customers’ purchases and investments in technology, and continue to affect Applied’s orders, net sales, operating expenses and net income.
To meet rapidly changing demand in the industries it serves, Applied must accurately forecast demand and effectively manage its resources and production capacity for each of its segments as well as across multiple segments. During periods of decreasing demand, Applied must reduce costs and align its cost structure with prevailing market conditions; effectively manage its supply chain; and motivate and retain key employees. During periods of increasing demand for its products, Applied must have sufficient manufacturing capacity and inventory to meet customer demand; effectively manage its supply chain; attract, retain and motivate a sufficient number of qualified employees; and continue to control costs. During periods of decreasing demand, Applied must reduce costs and align its cost structure with prevailing market conditions; effectively manage its supply chain; and motivate and retain key employees. If Applied does not accurately forecast and timely and appropriately adapt to changes in its business environment, Applied’s business, financial condition and results of operations may be materially and adversely affected.
Applied is exposed to risks as a result of ongoing changes in the various industries in which it operates.
The global semiconductor, flat panel display, solar and related industries in which Applied operates are characterized by ongoing changes affecting some or all of these industries, including:
increasing capital requirements for building and operating new fabrication plants and customers’ ability to raise the necessary capital, particularly when financial market conditions are difficult;
differences in growth rates among the semiconductor, display and solar industries;
the increasing importance of establishing, improving and maintaining strong relationships with customers;
changes in end demand for electronic products over time and the effect of these changes on customers’ businesses and, in turn, on demand for Applied’s products;
abrupt and unforeseen shifts in the nature and amount of customer and end-user demand;
the increasing cost and complexity for customers to move from product design to volume manufacturing, which may slow the adoption rate of new manufacturing technology;
the need to continually reduce the total cost of manufacturing system ownership, due in part to greater demand for lower-cost consumer electronics compared to business information technology spending;
the heightened importance to customers of system reliability and productivity and the effect on demand for fabrication systems as a result of their increasing productivity, device yield and reliability;
the increasing importance of, and difficulties in, developing products with sufficient differentiation to influence customers’ purchasing decisions;
requirements for shorter cycle times for the development, manufacture and installation of manufacturing equipment;
price and performance trends for semiconductor devices, LCDs and solar PVs, and the corresponding effect on demand for such products;
the increasing importance of the availability of spare parts to maximize the time that customers’ systems are available for production;
the increasing role for and complexity of software in Applied products; and
the increasing focus on reducing energy usage and improving the environmental impact and sustainability associated with manufacturing operations.
If Applied does not successfully manage the risks resulting from the ongoing changes in the semiconductor, flat panel display, solar and related industries, its business, financial condition and results of operations could be materially and adversely affected.
Applied is exposed to risks as a result of ongoing changes specific to the semiconductor industry.
The greatest portion of Applied’s consolidated net sales and profitability historically has been derived from sales of manufacturing equipment by the Silicon Systems Group to the global semiconductor industry. In addition, a majority of the revenues of Applied Global Services is from sales of service products to semiconductor manufacturers. The semiconductor industry is characterized by ongoing changes particular to that industry in addition to the general industry changes described in the preceding risk factor, including:
the increasing cost of research and development due to many factors, including: decreasing linewidths on a chip; the use of new materials such as cobalt and yttrium; new and more complex device structures; more applications and process steps; increasing chip design costs; and the increasing cost and complexity of integrated manufacturing processes;
the cost, technical complexity and timing of a proposed industry transition from 300mm to 450mm wafers, and the resulting effect on demand for manufacturing equipment and services;
the need to reduce product development time, despite the increasing difficulty of technical challenges;
the growing number of types and varieties of semiconductors and number of applications across multiple substrate sizes;
changes in demand and differing market growth rates for (i) different electronic products, such as tablets, smartphones, and personal computers, and in turn (ii) different applications/devices, such as NAND Flash, DRAM, logic, foundry and MRAM, and the resulting effect on customers’ capital spending patterns and on Applied’s ability to compete in these market segments;
the increasing cost and complexity for semiconductor manufacturers to move more technically advanced capability and smaller linewidths to volume manufacturing, and the resulting impact on the rates of technology transition and investment in capital equipment;
challenges associated with generating organic growth in light of semiconductor manufacturers’ decreasing rate of capital expenditures as a percentage of revenue, and manufacturers’ increasing allocation of capital investment to markets that Applied does not serve, such as lithography;
the increasing frequency and complexity of technology transitions and inflections, such as ALD, 3-D transistors, advanced interconnect, wafer-level packaging, and extreme ultraviolet lithography (EUV);
shorter cycle times between customers’ order placement and product shipment, which may lead to inventory write-offs and manufacturing inefficiencies that decrease gross margin;
technology developments in related markets, such as lithography, to which Applied may need to adapt;
competitive factors that make it difficult to enhance market position;
the importance of increasing market positions in larger market segments, such as etch and inspection;
the increasing concentration of wafer starts in one country, Korea, where Applied’s service penetration and service-revenue-per-wafer-start have been lower than in other regions; and
the increasing fragmentation of semiconductor markets, leading certain markets to become too small to support the cost of a new fabrication plant, while others require less technologically advanced products.
If Applied does not successfully manage the risks resulting from the ongoing changes occurring in the semiconductor industry, its business, financial condition and results of operations could be materially and adversely affected.
Applied is exposed to risks as a result of ongoing changes specific to the flat panel display industry.
The global flat panel display industry historically has experienced considerable volatility in capital equipment investment levels, due in part to the limited number of LCD manufacturers and the concentrated nature of LCD end-use applications. Recently, industry growth has depended to a considerable extent on consumer demand for increasingly larger and more advanced TVs, as well as smartphones and other mobile devices, which demand is highly sensitive to cost and improvements in technologies and features. In addition to the general industry changes described above in the second risk factor, the display industry is characterized by ongoing changes particular to that industry, including:
the planned expansion of manufacturing facilities in China by Chinese display manufacturers and manufacturers from other countries, and the ability of non-Chinese manufacturers to obtain government approvals on a timely basis;
the slowing rate of transition to larger substrate sizes for LCDs and the resulting effect on capital intensity in the industry and on Applied’s product differentiation, gross margin and return on investment;
the increasing importance of new types of displays, such as low temperature polysilicon (LTPS) and OLEDs, and new touch panel films, such as anti-reflective and anti-fingerprint;
the likelihood and timing of a transition to a new CVD backplane technology, metal oxide; and
uncertainty with respect to future LCD technology end-use applications and growth drivers.
If Applied does not successfully manage the risks resulting from the ongoing changes occurring in the display industry, its business, financial condition and results of operations could be materially and adversely affected.
Applied is exposed to risks as a result of ongoing changes specific to the solar industry.
An increasing portion of Applied’s business is in the emerging solar market, which, in addition to the general industry changes described above in the second risk factor, is characterized by ongoing changes specific to the solar industry, including:
the need to continually decrease the cost-per-watt of electricity produced by solar PV products to at or below grid parity by, among other things, reducing operating costs and increasing throughputs for solar PV manufacturing, and improving the conversion efficiency of solar PVs;
the impact on demand for solar PV products arising from the cost of electricity generated by solar PVs compared to the cost of electricity from the existing grid or other energy sources;
the varying energy policies of governments around the world and their effect in influencing the rate of growth of the solar PV market, including the availability and amount of government incentives for solar power such as tax credits, feed-in tariffs, rebates, renewable portfolio standards that require electricity providers to sell a targeted amount of energy from renewable sources, and goals for solar installations on government facilities;
the growing number of solar PV manufacturers and increasing global production capacity for solar PVs, primarily in China;
the filing by U.S. solar manufacturers of a regulatory unfair trade action against solar PVs from China, where most of Applied’s solar equipment sales are concentrated, which could result in the U.S. government’s assessment of duties on solar cells and modules imported from China or other outcomes and, in turn, adversely impact demand for Applied’s products;
the varying levels of operating and industry experience among solar PV manufacturers and the resulting differences in the nature and extent of customer support services requested from Applied;
challenges associated with marketing and selling manufacturing equipment and services to a diverse and diffuse customer base;
the growth of market segments in which Applied does not participate, such as passivation and furnaces;
the increasing number of government-affiliated entities in China that are becoming customers;
the cost of polysilicon and other materials; and
access to affordable financing and capital by customers and end-users.
In addition, current projections for global solar PV production exceed anticipated near-term, end-use demand, which is heavily dependent on installed cost-per-watt, government policies and incentives, and the availability of affordable capital. An oversupply of solar PVs that leads customers to delay or reduce investments in manufacturing capacity and new technology adversely impacts the sales growth rates and/or profitability of Applied’s products. If Applied does not successfully manage the risks resulting from the ongoing changes occurring in the solar industry, its business, financial condition and results of operations could be materially and adversely affected.
Applied is exposed to risks associated with the difficult financial markets and uncertain global economy.
The tightening of the credit markets, disruption in the financial markets, and global economic recession that began in 2008 contributed to significant slowdowns in the industries in which Applied operates. Although economic and market conditions have improved, continuingContinuing difficulties in the financial markets, national debt concerns in various regions, and uncertainty regarding the global economic recoveryeconomy are posing challenges.challenges, and some governments may implement policies to control economic growth. The markets for semiconductors and flat panel displays in particular depend largely on consumer spending.spending, while the solar market depends in part on government incentives and the availability of financing for PV installations. Economic uncertainty exacerbatesand related factors, including unemployment, inflation and fuel prices, exacerbate negative trends in business and consumer spending and may cause certain Applied customers to push out, cancel, or refrain from placing orders for equipment or services, which may reduce net sales, reduce backlog, and affect Applied’s ability to convert backlog to sales. Difficulties in obtaining capital, uncertain market conditions, or reduced profitability may also cause some customers to scale back operations, exit businesses, merge with other manufacturers, or file for bankruptcy protection and potentially cease operations, leading to customers’ reducedreducing research and development fundingand/or capital expenditures and, in turn, lower salesand/or additional inventory or bad debt expense for Applied. These conditions may also similarly affect key suppliers, which could impair their ability to deliver parts and result in delays for Applied’s products or added costs. In addition, these conditions may lead to strategic alliances by, or consolidation of, other equipment manufacturers, which could adversely affect Applied’s ability to compete effectively.
Uncertainty about future economic and industry conditions also makes it more challenging for Applied to forecast its operating results, make business decisions, and identify and prioritize the risks that may affect its business, sources and uses of cash, financial condition and results of operations. Applied may be required to implement additional cost reduction efforts, including restructuring activities,and/or modify its business model, which may adversely affect Applied’s ability to capitalize on opportunities in a market recovery.
In addition, Applied maintains an investment portfolio that is subject to general credit, liquidity, foreign exchange, market and interest rate risks. The risks to Applied’s investment portfolio may be exacerbated if financial market conditions deteriorate and, as a result, the value and liquidity of the investment portfolio, and returnas well as returns on pension assets, could be negatively impacted and lead to impairment charges. Applied also maintains cash balances in various bank accounts globally in order to fund normal operations. If one or more of these financial institutions become insolvent or are taken over by a government, it could limit Applied’s ability to access cash in the affected accounts.
If Applied does not timely and appropriately adapt to changes resulting from the uncertain
15
macroeconomic environment and industry conditions, or to difficulties in the financial markets. Applied’s business, financial condition or results of operations may be materially and adversely affected.
Applied is exposed to risks as a result of ongoing changes in the various industries in which it operates.
The global semiconductor, flat panel display, solar and related industries in which Applied operates are characterized by ongoing changes affecting some or all of these industries, including:
| | |
| • | increasing capital requirements for building and operating new fabrication plants and customers’ ability to raise the necessary capital, particularly in a difficult financial market; |
|
| • | differences in growth rates among the semiconductor, display and solar industries; |
|
| • | the increasing importance of establishing, improving and maintaining strong relationships with customers; |
|
| • | abrupt and unforeseen shifts in the nature and amount of customer and end-user demand; |
|
| • | the increasing cost and complexity for customers to move from product design to volume manufacturing, which may slow the adoption rate for new manufacturing technology; |
|
| • | the need to reduce the total cost of manufacturing system ownership, due in part to greater demand for lower-cost consumer electronics as compared to business information technology spending; |
|
| • | the heightened importance to customers of system reliability and productivity and the effect on demand for fabrication systems as a result of their increasing productivity, device yield and reliability; |
|
| • | the increasing importance of, and difficulties in, developing products with sufficient differentiation to influence customers’ purchasing decisions; |
|
| • | requirements for shorter cycle times for the development, manufacture and installation of manufacturing equipment; |
|
| • | price and performance trends for semiconductor devices, LCDs and solar PVs, and the corresponding effect on demand for such products; |
|
| • | the increasing importance of the availability of spare parts to maximize the time that customers’ systems are available for production; |
|
| • | the increasing role for and complexity of software in Applied products; and |
|
| • | the increasing focus on reducing energy usage and improving the environmental impact and sustainability associated with manufacturing operations. |
If Applied does not successfully manage the risks resulting from the ongoing changes in the semiconductor, flat panel display, solar and related industries, its business, financial condition and results of operations could be materially and adversely affected.
Applied is exposed to risks as a result of ongoing changes specific to the semiconductor industry.
The greatest portion of Applied’s consolidated net sales and profitability historically has been derived from sales of manufacturing equipment by the Silicon Systems Group to the global semiconductor industry. In addition, a majority of the revenues of Applied Global Services is from sales of service products to semiconductor manufacturers. The semiconductor industry is characterized by ongoing changes particular to that industry in addition to the general industry changes described in the preceding risk factor, including:
| | |
| • | the increasing cost of research and development due to many factors, including: decreasing linewidths on a chip; the use of new materials such as cobalt and yttrium; new and more complex device structures; more applications and process steps; increasing chip design costs; and the increasing cost and complexity of integrated manufacturing processes; |
|
| • | the growing number of types and varieties of semiconductors and number of applications across multiple substrate sizes; |
16
| | |
| • | differing market growth rates and capital requirements for different applications, such as NAND Flash, DRAM, logic and foundry, and the resulting effect on customers’ spending patterns and on Applied’s ability to compete in these market segments; |
|
| • | the increasing cost and complexity for semiconductor manufacturers to move more technically advanced capability and smaller linewidths to volume manufacturing, and the resulting impact on the rates of technology transition and investment in capital equipment; |
|
| • | semiconductor manufacturers’ increasing adoption of more productive 300mm systems in relation to 200mm system capacity, and the resulting effect on demand for manufacturing equipment and services; |
|
| • | the decreasing rate of capital expenditures as a percentage of semiconductor manufacturers’ revenue; |
|
| • | shorter cycle times between customers’ order placement and product shipment, which may lead to inventory write-offs and manufacturing inefficiencies that decrease gross margin; |
|
| • | technology developments in related markets, such as lithography, to which Applied may need to adapt; |
|
| • | competitive factors that make it difficult to enhance market position; |
|
| • | the importance of growing market positions in larger market segments, such as etch and inspection; |
|
| • | the increasing concentration of wafer starts in one country, Korea, where Applied’s service penetration and service-revenue-per-wafer-start have been lower than in other regions; |
|
| • | the increasing fragmentation of semiconductor markets, leading certain markets to become too small to support the cost of a new fabrication plant, while others require less technologically advanced products; and |
|
| • | the cost, technical complexity and timing of a proposed transition from 300mm to 450mm wafers. |
If Applied does not successfully manage the risks resulting from the ongoing changes occurring in the semiconductor industry, its business, financial condition and results of operations could be materially and adversely affected.
Applied is exposed to risks as a result of ongoing changes specific to the flat panel display industry.
The global flat panel display industry historically has experienced considerable volatility in capital equipment investment levels, due in part to the limited number of LCD manufacturers and the concentrated nature of LCD end-use applications. Recently, industry growth has depended to a considerable extent on consumer demand for increasingly larger and more advanced TVs. In addition to the general industry changes described above in the third risk factor, the display industry is characterized by ongoing changes particular to that industry, including:
| | |
| • | the planned expansion of manufacturing facilities in China by Chinese display manufacturers as well as manufacturers from other countries, and the ability of non-Chinese manufacturers to obtain government approvals; |
|
| • | technical and financial difficulties associated with transitioning to larger substrate sizes for LCDs; |
|
| • | the effect of a slowing rate of transition to larger substrate sizes on capital intensity and product differentiation; |
|
| • | technical difficulties and costs associated with developing new technologies for use in LCD manufacturing, such as LEDs for backlighting; |
|
| • | new energy efficiency standards for large-screen LCD TVs; and |
|
| • | uncertainty with respect to future LCD technology end-use applications and growth drivers. |
If Applied does not successfully manage the risks resulting from the ongoing changes occurring in the display industry, its business, financial condition and results of operations could be materially and adversely affected.
17
Applied is exposed to risks as a result of ongoing changes specific to the solar industry.
Applied anticipates that an increasing portion of its business will be in the emerging solar market, which, in addition to the general industry changes described above in the third risk factor, is characterized by ongoing changes specific to the solar industry, including:
| | |
| • | the need to continually decrease thecost-per-watt of electricity produced by solar PV products by, among other things, reducing operating costs and increasing throughputs for solar PV manufacturing, and improving the conversion efficiency of solar PVs; |
|
| • | the impact on demand for solar PV products arising from the cost of electricity generated by solar PVs compared to the cost of electricity from the existing grid or other energy sources; |
|
| • | the varying energy policies of governments around the world and their effect in influencing the rate of growth of the solar PV market, including the availability and amount of government incentives for solar power such as tax credits, feed-in tariffs, rebates, renewable portfolio standards that require electricity providers to sell a targeted amount of energy from renewable sources, and goals for solar installations on government facilities; |
|
| • | the cost of polysilicon and other materials; |
|
| • | changes in the nature and amount of end demand for solar PVs that may adversely impact the sales growth rates and profitability of Applied’s products; |
|
| • | varying levels of infrastructure investment for “smart grid” technologies to modernize and enhance the transmission, distribution and use of electricity, which link distributed solar PV sources to population centers, increase transmission capability, and optimize power usage; |
|
| • | access to affordable financing and capital by customers and end-users; and |
|
| • | the growing number of solar PV manufacturers and increasing global production capacity for solar PVs, primarily in China as a result of increased solar subsidies and lower manufacturing costs, which may lead to oversupply. |
If Applied does not successfully manage the risks resulting from the ongoing changes occurring in the solar industry, its business, financial condition and results of operations could be materially and adversely affected.
Applied must continually innovate and adapt its business and product offerings to respond to competition and rapid technological changes.
As Applied operates in a highly competitive environment in which innovation is critical, its future success depends on many factors, including the effective commercialization and customer acceptance of its equipment, services and related products. In addition, Applied must successfully execute its growth strategy, including enhancing market share in existing markets, expanding into related markets, cultivating new markets and exceeding industry growth rates, while constantly improving its operational performance. The development, introduction and support of a broadening set of products in more collaborative, geographically diverse, open and varied competitive environments have grown increasingly complex and expensive over time. Furthermore, new or improved products may entail higher costs and reduced profits. Applied’s performance may be adversely affected if it does not timely, cost-effectively and successfully:
identify and address technology inflections, market changes, new applications, customer requirements and end-use demand;
develop new products (including disruptive technologies), improve and/or develop new applications for existing products, and adapt similar products for use by customers in different applications and/or markets with varying technical requirements;
| | |
| • | develop new products, improveand/or develop new applications for existing products, and adapt similar products for use by customers in different applicationsand/or markets with varying technical requirements; |
|
| • | appropriately price and achieve market acceptance of its products; |
|
| • | differentiate its products from those of competitors and any disruptive technologies, meet performance specifications, and drive efficiencies and cost reductions; |
|
| • | maintain operating flexibility to enable different responses to different markets, customers and applications; |
18
differentiate its products from those of competitors and any disruptive technologies, and meet customers’ performance specifications;
maintain operating flexibility to enable different responses to different markets, customers and applications;
enhance its worldwide operations across all business segments to reduce cycle time, enable continuous quality improvement, reduce costs, and enhance design for manufacturability and design for serviceability;
focus on sales and marketing strategies that foster strong customer relationships;
| | |
| • | allocate resources, including people and R&D funding, among Applied’s products and between the development of new products and the enhancement of existing products, as most appropriate and effective for future growth; |
|
| • | reduce the cost of, and improve the productivity of capital invested in, R&D activities; |
|
| • | accurately forecast demand, work with suppliers and meet production schedules for its products; |
|
| • | improve its manufacturing processes and achieve cost efficiencies across product offerings; |
|
| • | adapt to changes in value offered by companies in different parts of the supply chain; |
|
| • | qualify products for volume manufacturing with its customers; and |
|
| • | implement changes in its design engineering methodology, including those that enable reduction of material costs and cycle time, greater commonality of platforms and types of parts used in different systems, greater effectiveness of product life cycle management, and reduced energy usage and environmental impact. |
allocate resources, including people and R&D funding, among Applied’s products and between the development of new products and the enhancement of existing products, as most appropriate and effective for future growth;
reduce the cost, and improve the productivity of capital invested in R&D activities;
accurately forecast demand, work with suppliers and meet production schedules for its products;
improve its manufacturing processes and achieve cost efficiencies across product offerings;
adapt to changes in value offered by companies in different parts of the supply chain;
qualify products for evaluation and, in turn, volume manufacturing with its customers; and
implement changes in its design engineering methodology, including those that enable reduction of material costs and cycle time, greater commonality of platforms and types of parts used in different systems, greater effectiveness of product life cycle management, and reduced energy usage and environmental impact.
If Applied does not successfully manage these challenges, its business, financial condition and results of operations could be materially and adversely affected.
Operating in multiple industries, and the entry into new markets and industries, entail additional challenges.challenges and obligations.
As part of its growth strategy, Applied must successfully expand into related or new markets and industries, either with its existing products or with new products developed internally or obtained through acquisitions. The entry into different markets involves additional challenges, including those arising from:
the need to devote additional resources to develop new products for, and operate in, new markets;
the need to develop new sales and marketing strategies and cultivate relationships with new customers;
| | |
| • | the need to devote additional resources to develop new products for, and operate in, new markets; |
|
| • | differing rates of profitability and growth among multiple businesses; |
|
| • | Applied’s ability to anticipate demand, capitalize on opportunities, and avoid or minimize risks; |
|
| • | the complexity of managing multiple businesses with variations in production planning, execution, supply chain management and logistics; |
|
| • | the adoption of new business models; |
|
| • | the need to undertake activities to grow demand for end-products; |
|
| • | the need to develop adequate new business processes and systems; |
|
| • | Applied’s ability to rapidly expand its operations to meet increased demand and the associated effect on working capital; |
|
| • | new materials, processes and technologies; |
|
| • | differing rates of profitability and growth among multiple businesses; Applied’s ability to anticipate demand, capitalize on opportunities, and avoid or minimize risks; the complexity of managing multiple businesses with variations in production planning, execution, supply chain management and logistics; the adoption of new business models; the need to undertake activities to grow demand for end-products; the need to develop and successfully implement adequate new business processes and systems; Applied’s ability to rapidly expand its operations to meet increased demand and the associated effect on working capital; new materials, processes and technologies; the need to attract, motivate and retain employees with skills and expertise in these new areas; |
|
| • | new and more diverse customers and suppliers, including some with limited operating histories, uncertainand/or limited funding, evolving business modelsand/or locations in regions where Applied does not have existing operations; |
|
| • | different customer service requirements; |
|
| • | new or different competitors with potentially more financial or other resources, industry experienceand/or established customer relationships; |
|
| • | entry into new industries and countries, with differing levels of government involvement, laws and regulations, and business, employment and safety practices; |
|
| • | third parties’ intellectual property rights; and |
|
| • | the need to comply with, or work to establish, industry standards and practices. |
19
new and more diverse customers and suppliers, including some with limited operating histories, uncertain and/or limited funding, evolving business models and/or locations in regions where Applied does not have, or has limited, operations;
different customer service requirements;
new or different competitors with potentially more financial or other resources, industry experience and/or established customer relationships;
entry into new industries and countries, with differing levels of government involvement, laws and regulations, and business, employment and safety practices;
third parties’ intellectual property rights; and
the need to comply with, or work to establish, industry standards and practices.
In addition, Applied has begun applying for and receiving funding from United States and other government agencies for certain strategic development programs to increase its R&D resources and address new market opportunities. As a condition to this government funding, Applied may be subject to certain record-keeping, audit, intellectual property rights-sharingand/or other obligations.
If Applied does not successfully manage the risks resulting from its diversification and entry into new markets and industries, its business, financial condition and results of operations could be materially and adversely affected.
Applied is exposed to the risks of operating a global business.
In fiscal 2010,2011, approximately 8881 percent of Applied’s net sales were to customers in regions outside the United States. Certain of Applied’s R&D and manufacturing facilities, as well as suppliers to Applied, are also located outside the United States, including in Singapore, Taiwan, China, Korea, Israel, Germany, Italy and Switzerland. Applied is also expanding its business and operations in new countries. The global nature of Applied’s business and operations presents challenges, including but not limited to those arising from:
varying regional and geopolitical business conditions and demands;
political and social attitudes, laws, rules, regulations and policies within countries that favor domestic companies over non-domestic companies, including customer- or government-supported efforts to promote the development and growth of local competitors;
| | |
| • | varying regional and geopolitical business conditions and demands; |
|
| • | political and social attitudes, laws, rules, regulations and policies within countries that favor domestic companies over non-domestic companies, including customer- or government-supported efforts to promote the development and growth of local competitors; |
|
| • | variations among, and changes in, local, regional, national or international laws and regulations (including intellectual property, labor, tax, and import /export laws), as well as the interpretation and application of such laws and regulations; |
|
| • | global trade issues, including those related to the interpretation and application of import and export licenses; |
|
| • | positions taken by governmental agencies regarding possible national commercialand/or security issues posed by international business operations; |
|
| • | fluctuating raw material, commodity and energy costs; |
|
| • | challenges associated with managing more geographically diverse operations and projects ; |
|
| • | varying customs, practices and expectations of workers in different regions; |
|
| • | variations in the ability to develop relationships with local customers, suppliers and governments; |
|
| • | fluctuations in interest rates and currency exchange rates, including the relative strength or weakness of the U.S. dollar and the euro; |
|
| • | the need to provide sufficient levels of technical support in different locations; |
|
| • | political instability, natural disasters (such as earthquakes, floods or storms), pandemics, terrorism or acts of war in locations where Applied has operations, suppliers or sales; |
|
| • | cultural and language differences; |
|
| • | shipping costsand/or delays; |
|
| • | the need to continually improve the Company’s operating cost structure; |
|
| • | difficulties and uncertainties associated with the entry into new countries; |
|
| • | uncertainties with respect to economic growth rates in various countries; and |
|
| • | uncertainties with respect to growth rates for the manufacture and sales of semiconductors, LCDs and solar PVs in the developing economies of certain countries. |
customer- or government-supported efforts to influence Applied to conduct more of its operations in a particular country, such as Korea and China;
variations among, and changes in, local, regional, national or international laws and regulations (including intellectual property, labor, tax, and import /export laws), as well as the interpretation and application of such laws and regulations;
global trade issues, including those related to the interpretation and application of import and export licenses, as well as international trade disputes;
positions taken by governmental agencies regarding possible national commercial and/or security issues posed by international business operations;
fluctuating raw material, commodity and energy costs;
challenges associated with managing more geographically diverse operations and projects, which requires an effective organizational structure and appropriate business processes, procedures and controls;
a more diverse workforce with different cultures, customs, business practices and worker expectations;
variations in the ability to develop relationships with local customers, suppliers and governments;
fluctuations in interest rates and currency exchange rates, including the relative strength or weakness of the U.S. dollar against the Japanese yen, euro, Taiwanese dollar, Israeli shekel or Chinese yuan;
the need to provide sufficient levels of technical support in different locations around the world;
political instability, natural disasters (such as earthquakes, floods or storms), pandemics, social unrest, terrorism or acts of war in locations where Applied has operations, suppliers or sales, or that may influence the value chain of the industries that Applied serves;
reliance on various information systems, data centers and software applications to conduct many aspects of the Company’s business, which may be vulnerable to cyberattacks by third parties or breached due to employee error, misuse or other causes that could result in business disruptions, loss of confidential information, or other adverse consequences in the event that Applied’s firewalls and security processes and practices are ineffective;
the need for an effective business continuity plan if a disaster or other event occurs that could disrupt business operations;
the need to regularly reassess the size, capability and location of the Company’s global infrastructure and make appropriate changes;
cultural and language differences;
shipping costs and/or delays;
the need to continually improve the Company’s operating cost structure;
difficulties and uncertainties associated with the entry into new countries;
hiring and integration of an increasing percentage of new workers, including in countries such as India and China;
the increasing need for the workforce to be more mobile and work in or travel to different regions;
uncertainties with respect to economic growth rates in various countries; and
uncertainties with respect to growth rates for the manufacture and sales of semiconductors, LCDs and solar PVs in the developing economies of certain countries.
Many of these challenges are present in China and Korea, which are experiencing significant growth of bothcustomers, suppliers and competitors to Applied. Applied further believes that China and Korea present large potential markets
20
for its products and opportunity for growth over the long term, although at lower projected levels of profitability and margins for certain products than historically have been achieved in other regions. In addition, Applied must regularly reassess the size, capability and location of its global infrastructure and make appropriate changes, and must have effective change management processes and procedures to address changes in its business and operations. These challenges may materially and adversely affect Applied’s business, financial condition and results of operations.
In addition, in March 2011, Japan experienced a significant earthquake, aftershocks, and tsunami that resulted in widespread damage and business interruptions throughout the country, including those associated with radiation concerns arising from damage to a nuclear power plant. Certain of Applied’s customers and suppliers are located in Japan and Applied also has sales and service centers in the country. While Applied has not experienced any material impact on its business or operations to date and has taken actions to enhance its ability to meet customers’ requirements, Applied cannot predict the extent of the impact the situation in Japan may have, if any, on its future business and operations.
Applied is exposed to risks associated with a highly concentrated customer base.
Applied’s semiconductor and flat panel display customer bases historically have been, and are becoming even more, highly concentrated as a result of economic and industry conditions. For example, in fiscal 2010, four2011, three semiconductor manufacturers accounted for 5152 percent of Silicon Systems Group net sales, and fivethree LCD manufacturers accounted for 7154 percent of Display net sales.Certainsales. Further, three customers accounted for 32 percent of Applied’s consolidated net sales in fiscal 2011. Certain customers have experienced significant ownership or management changes, consolidated with other manufacturers, outsourced manufacturing activities, or engaged in
collaboration or cooperation arrangements with other manufacturers. In addition, customers have entered into strategic alliances or industry consortia that have increased the influence of key industry participants in technology decisions made by their partners. Also, certain semiconductor and display customers are making an increasingly greater percentage of their respective industry’s capital equipment investments.
Customer concentration within Applied’s solar customer base varies depending on the product line. For precision wafering systems, five solar manufacturers accounted for 57 percent of net sales in fiscal 2011, while the Baccini cell systems business has a more diffuse customer base. Applied’s customer base in each of the Display and Energy and Environmental Solutions segments is also geographically-concentrated. In fiscal 2011, customers in China and Taiwan accounted for a total of 78 percent of net sales for the Display segment, while customers in China accounted for 80 percent of net sales for the Energy and Environmental Solutions segment.In this environment, contracts or orders from a relatively limited number of semiconductor and display manufacturers have accounted for, and are expected to continue to account for, a substantial portion of Applied’s business, which may result in added complexities in managing customer relationships and transactions.transactions and make it more challenging for Applied’s business units to generate organic growth. In addition, the mix and type of customers, and sales to any single customer, may vary significantly from quarter to quarter and from year to year. If customers do not place orders, or they substantially reduce, delay or cancel orders, Applied may not be able to replace the business. As Applied’s products are configured to customer specifications, changing, rescheduling or canceling orders may result in significant, non-recoverable costs. Major customers may also seek, and on occasion receive, pricing, payment, intellectual property-related, or other commercial terms that are less favorable to Applied. These factors could have a material adverse effect on Applied’s business, financial condition and results of operations.
Manufacturing interruptions or delays could affect Applied’s ability to meet customer demand and lead to higher costs, while the failure to estimate customer demand accurately could result in excess or obsolete inventory.
Applied’s business depends on its timely supply of equipment, services and related products that meet the rapidly changing technical and volume requirements of its customers, which depends in part on the timely delivery of parts, components and subassemblies (collectively, parts) from suppliers, and timely performance byincluding contract manufacturers. Some key parts may beare subject to long lead-timesand/or obtainable only from a single supplier or limited group of suppliers, and some sourcing or subassembly is provided by suppliers located in countries other than the United States,countries where Applied conducts its manufacturing, including China and Korea. Cyclical industry conditions and the volatility of demand for manufacturing equipment increase capital, technical, operational and other risks for companies throughout Applied’s supply chain. Further, the adverse conditions in the credit and financial markets and industry slowdowns in recent periods have caused, and may continue to cause, some suppliers to scale back operations, exit businesses, merge with other companies, or file for bankruptcy protection and possibly cease operations, potentially affecting Applied’s ability to obtain quality parts on a timely basis. Applied may also experience significant interruptions of its manufacturing operations, delays in its ability to deliver products or services, increased costs or customer order cancellations as a result of:
| | |
| • | the failure or inability of suppliers to timely deliver sufficient quantities of quality parts on a cost-effective basis; |
|
| • | volatility in the availability and cost of materials; |
|
| • | difficulties or delays in obtaining required import or export approvals; |
|
| • | information technology or infrastructure failures; |
21
volatility in the availability and cost of materials, including rare earth elements;difficulties or delays in obtaining required import or export approvals;
information technology or infrastructure failures;
natural disasters or other events (such as earthquakes, floods or storms, regional economic downturns, pandemics, social unrest, political instability, terrorism, or acts of war).
| | |
| • | natural disasters (such as earthquakes, floods or storms); or |
|
| • | other causes (such as regional economic downturns, pandemics, political instability, terrorism, or acts of war) that could result in delayed deliveries, manufacturing inefficiencies, increased costs or order cancellations. |
If a supplier fails to meet Applied’s requirements concerning quality, cost or other performance factors, Applied may transfer its business to alternative sources, which could entail manufacturing delays, additional costs, or other difficulties. In addition, Applied’s needif Applied needs to rapidly increase its business and manufacturing capacity to meet increases in demand or expedited shipment schedules, this may exacerbate any interruptions in
Applied’s manufacturing operations and supply chain and the associated effect on Applied’s working capital. Moreover, if actual demand for Applied’s products is different than expected, Applied may purchase more/fewer parts than necessary or incur costs for canceling, postponing or expediting delivery of parts. If Applied purchases inventory in anticipation of customer demand that does not materialize, or if customers reduce or delay orders, Applied may incur excess inventory charges. Any or all of these factors could materially and adversely affect Applied’s business, financial condition and results of operations.
Applied is exposed to risks associated with acquisitions and strategic investments.
Applied has made, and in the future intends to make, acquisitions of andor investments in, companies, technologies or products in existing, related or new markets for Applied. Most recently, in November 2011, Applied completed its acquisition of Varian Semiconductor Associates, Inc. (Varian), which was the Company’s largest acquisition to date. Acquisitions involve numerous risks, including but not limited to:
diversion of management’s attention from other operational matters;
inability to complete acquisitions as anticipated or at all, which in certain circumstances may require Applied to pay a termination fee to the target company;
| | |
| • | diversion of management’s attention from other operational matters; |
|
| • | inability to complete acquisitions as anticipated or at all; |
|
| • | inability to realize anticipated benefits; |
|
| • | failure to commercialize purchased technologies; |
|
| • | inability to capitalize on characteristics of new markets that may be significantly different from Applied’s existing markets and where competitors may have stronger market positions and customer relationships; |
|
| • | failure to attract, retain and motivate key employees from the acquired business; |
|
| • | exposure to new operational risks, rules, regulations, worker expectations, customs and practices to the extent acquired businesses are located in countries where Applied has not historically conducted business; |
|
| • | challenges associated with managing new, more diverse and more widespread operations, projects and people; |
|
| • | inability to obtain and protect intellectual property rights in key technologies; |
|
| • | inadequacy or ineffectiveness of an acquired company’s internal financial controls, disclosure controls and procedures,and/or environmental, health & safety, human resource, or other policies or practices; |
|
| • | impairment of acquired intangible assets and goodwill as a result of changing business conditions, technological advancements orworse-than-expected performance of the segment; |
|
| • | the risk of litigation or disputes with customers, suppliers, partners or stockholders of an acquisition target arising from a proposed or completed transaction; |
|
| • | unknown, underestimatedand/or undisclosed commitments or liabilities; |
|
| • | inappropriate scale of acquired entities’ critical resources or facilities for business needs; and |
|
| • | ineffective integration of operations, systems, technologies, products or employees of an acquired business. |
requirements imposed by government regulators in connection with their review of a transaction, which may include, among other things, divestitures and/or restrictions on the conduct of Applied’s existing business or the acquired business;
ineffective integration of operations, systems, technologies, products or employees of an acquired business;
inability to realize anticipated synergies or other benefits;
failure to commercialize purchased technologies;
initial dependence on unfamiliar supply chains or relatively small supply partners;
inability to capitalize on characteristics of new markets that may be significantly different from Applied’s existing markets and where competitors may have stronger market positions and customer relationships;
failure to attract, retain and motivate key employees from the acquired business;
exposure to new operational risks, rules, regulations, worker expectations, customs and practices to the extent acquired businesses are located in regions where Applied has not historically conducted business;
challenges associated with managing new, more diverse and more widespread operations, projects and people;
inability to obtain and protect intellectual property rights in key technologies;
inadequacy or ineffectiveness of an acquired company’s internal financial controls, disclosure controls and procedures, and/or environmental, health and safety, anti-corruption, human resource, or other policies or practices;
impairment of acquired intangible assets and goodwill as a result of changing business conditions, technological advancements or worse-than-expected performance of the segment;
the risk of litigation or claims associated with a proposed or completed transaction;
unknown, underestimated and/or undisclosed commitments or liabilities; and
the inappropriate scale of acquired entities’ critical resources or facilities for business needs.
Applied also makes strategic investments in other companies, including companies formed as joint ventures, which may decline in valueand/or not meet desired objectives. The success of these investments depends on various factors over which Applied may have limited or no control and, particularly with respect to joint ventures,ven-
tures, requires ongoing and effective cooperation with strategic partners. The risks to Applied’s strategic investment portfolio may be exacerbated by unfavorable financial market and macroeconomic conditions and, as a result, the value of the
22
investment portfolio could be negatively impacted and lead to impairment charges. Mergers and acquisitions and strategic investments are inherently subject to significant risks, and the inability to effectively manage these risks could materially and adversely affect Applied’s business, financial condition and results of operations.risks. If Applied does not successfully manage the risks associated with acquisitions and strategic investments, its business, financial condition and results of operations could be materially and adversely affected.
Applied used existing cash and incurred debt obligations to acquire Varian that could affect its ability to respond to changes in business conditions or otherwise adversely affect its business.
Applied financed the acquisition of Varian through a combination of existing cash balances and the net proceeds of senior unsecured notes in the aggregate principal amount of $1.75 billion issued on June 8, 2011. The reduction in cash balances, assumed lower interest income, and payments on the debt obligations will reduce the availability of cash flow for general corporate or other purposes, such as further mergers and acquisitions. This in turn may reduce Applied’s flexibility in responding to changes in its businesses and in the industries in which it operates.
The ability to attract, retain and motivate key employees is vital to Applied’s success.
Applied’s success, competitiveness and competitivenessability to execute on its global strategies and maintain a culture of innovation depend in large part on its ability to attract, retain and motivate key employees.employees, especially in critical positions and in growing markets. Achieving this objective may be difficult due to many factors, including fluctuations in global economic and industry conditions, changes in Applied’s management or leadership,organizational structure, competitors’ hiring practices, cost reduction activities (including workforce reductions)reductions and unpaid shutdowns), availability of career development opportunities, and the effectiveness of Applied’s compensation and benefit programs, including its share-based programs. Applied periodically evaluates its overall compensation program and makes adjustments, as appropriate, to enhance its competitiveness. If Applied does not successfully attract, retain and motivate key employees, Applied may be unable to capitalize on its opportunities and its business, financial condition and operating results may be materially and adversely affected.
The failure to successfully implement and conduct outsourcing activities and other operational initiatives could adversely affect results of operations.
To better align its costs with market conditions, locate closer to customers, enhance productivity, and improve efficiencies, Applied conducts certain engineering, software development, manufacturing, sourcing and other operations in regions outside the United States, including India, Taiwan, China, and Korea. Applied is implementinghas implemented a more distributed manufacturing model, under which includes transitioning certain manufacturing and supply chain activities fromare conducted in various countries, including the United States, and Europe, toIsrael, Singapore, Taiwan and other countries in Asia, and completing assembly of some systems is completed at the customer site.sites. In addition, Applied outsources certain functions to third parties, including companies in the United States, India, China, Korea, Malaysia and other countries. Outsourced functions include contract manufacturing, engineering, customer support, software development, information technology support, finance and administrative activities. The expanding role of third party providers has required changes to Applied’s existing operations and the adoption of new procedures and processes for retaining and managing these providers, as well as redistributing responsibilities as warranted, in order to realize the potential productivity and operational efficiencies, assure quality and continuity of supply, and protect Applied’sthe intellectual property.property of Applied and its customers, suppliers and other partners. If Applied does not accurately forecast the amount, timing and mix of demand for products, or if contract manufacturers or other outsource providers fail to perform in a timely manner or at satisfactory quality levels, Applied’s ability to meet customer requirements could suffer, particularly during a market upturn.
In addition, Applied is implementing a comprehensive program to better align its global organizations and processes, including initiatives to enhance the Asia supply chain integrate its sales teams into the business units, and improve back office and information technology infrastructure for more efficient transaction processing. Applied also is implementing a multi-year, company-wide program to transform certain business processes, including the transition to a single enterprise resource planning (ERP) software system to perform various functions. The implementation of additional functionalityfunc-
tionality to the ERP system entails certain risks, including difficulties with changes in business processes that could disrupt Applied’s operations, such as its ability to track orders and timely ship products, project inventory requirements, manage its supply chain and aggregate financial and operational data. The implementation of new initiatives may not achieve the anticipated benefits and may divert management’s attention from other operational activities, negatively affect employee morale, or have other unintended consequences.
If Applied does not effectively develop and implement its outsourcing and relocation strategies, if required export and other governmental approvals are not timely obtained, if Applied’s third party providers do not perform as anticipated, or if there are delays or difficulties in enhancing business processes, Applied may not realize anticipated productivity improvements or cost efficiencies, and may experience operational difficulties, increased costs (including energy and transportation), manufacturing interruptions or delays, inefficiencies in the structureand/or operation of its supply chain, loss of its intellectual property rights, quality issues, increased product
23
time-to-market,and/or inefficient allocation of human resources, any or all of which could materially and adversely affect Applied’s business, financial condition and results of operations.
Applied may incur impairment charges to goodwill or long-lived assets.
Applied has a significant amount of goodwill and other acquired intangible assets related to acquisitions. Goodwill and purchased intangible assets with indefinite useful lives are not amortized, but are reviewed for impairment annually during the fourth quarter of each fiscal year, and more frequently when events or changes in circumstances indicate that the carrying value of an asset may not be recoverable. The review compares the fair value for each of Applied’s reporting units to its associated carrying value, including goodwill. Factors that could lead to impairment of goodwill and intangible assets include adverse industry or economic trends, reduced estimates of future cash flows, declines in the market price of Applied common stock, changes in the Company’sApplied’s strategies or product portfolio, and restructuring activities. Applied’s valuation methodology for assessing impairment requires management to make judgments and assumptions based on historical experience and projections of future operating performance. Applied may be required to record a charge to earnings during the period in which an impairment of goodwill or amortizable intangible assets is determined to exist, which could materially and adversely affect Applied’s results of operations.
Applied is exposed to various risks related to legal proceedings or claims and protection of intellectual property rights.
Applied from time to time is, and in the future may be, involved in legal proceedings or claims regarding patent infringement, intellectual property rights, antitrust, environmental regulations, securities, contracts, product performance, product liability, unfair competition, misappropriation of trade secrets, employment, workplace safety, and other matters. Applied also on occasion receives notification from customers who believe that Applied owes them indemnification or other obligations related to claims made against such customers by third parties.
In February 2010, the Seoul Prosecutor’s Office for the Eastern District in Korea indicted certain employees of Applied Materials Korea (AMK), including the former head of AMK who at the time of indictment was a vice president of Applied Materials, Inc., along with employees of several other companies, alleging the improper receipt and use of the confidential information of Samsung Electronics Co., Ltd. (Samsung), a major customer. Hearings on these matters are ongoing in the Seoul Eastern District Court..Court. Applied and Samsung entered into a settlement agreement effective as of November 1, 2010, which resolves potential civil claims related to this matter and which is separate from and does not affect the criminal proceedings.
Legal proceedings and claims, whether with or without merit, and associated internal investigations, may (1) be time-consuming and expensive to prosecute, defend or conduct; (2) divert management’s attention and other Applied resources; (3) inhibit Applied’s ability to sell its products; (4) result in adverse judgments for damages, injunctive relief, penalties and fines;and/or (5) negatively affect Applied’s business. There can be no assurance regarding the outcome of current or future legal proceedings, claims or investigations. If Applied is not able to favorably resolve or settle legal proceedings or claims, or in the event of any adverse findings against Applied or any of its employees, Applied’s business, financial condition and results of operations could be materially and adversely affected and Applied may suffer harm to its reputation.
Applied’s success depends in significant part on the protection of its intellectual property and other rights. Infringement of Applied’s rights by a third party, such as the unauthorized manufacture or sale of equipment or spare parts, could result in uncompensated lost market and revenue opportunities for Applied. Applied’s intellectual property rights may not provide significant competitive advantages if they are circumvented, invalidated, rendered obsolete by the rapid pace of technological change, or if Applied does not adequately protect or assert these rights. Furthermore, the laws and practices of other countries, including China, India, Taiwan and Korea, permit the protection and enforcement of Applied’s rights to varying extents, which may not be sufficient to adequately protect Applied’s rights. Applied previously entered into an arrangement with one of its competitors to decrease the risk of patent infringement lawsuits in the future. There can be no assurance that the intended results of this arrangement will be achieved or that Applied will be able to adequately protect its intellectual property rights with the restrictions associated with the arrangement. If Applied is not able to favorably resolve or settle claims, obtain or enforce
24
intellectual property rights, obtain necessary licenses on commercially reasonable terms,and/or successfully prosecute or defend its intellectual property position, Applied’s business, financial condition and results of operations could be materially and adversely affected and Applied may suffer harm to its reputation. See Note 18 of Notes to Consolidated Financial Statements.
Changes in tax rates or tax assets and liabilities could affect results of operations.
As a global company, Applied is subject to taxation in the United States and various other countries. Significant judgment is required to determine and estimate worldwide tax liabilities. Applied’s future annual and quarterly tax rates could be affected by numerous factors, including changes in the: (1) applicable tax laws; (2) amount and composition of pre-tax income in countries with differing tax rates; (3) plans of the Company to permanently reinvest certain funds held outside of the U.S.; or (3)(4) valuation of Applied’s deferred tax assets and liabilities.
To better align with the increasingly international nature of its business, Applied is transitioning certain manufacturing, supply chain, and other operations into Asia, bringing these activities closer to customers. These changes are expected to result in a reduction of future operating costs. In Singapore, Applied is pursuing availablehas received authorization to use tax incentives that provide that certain income earned in Singapore wouldwill be subject to tax holidays or reduced income tax rates. To obtain the benefit of these tax benefits,provisions, Applied must meet requirements relating to various activities. Applied is engaged in discussions with tax authorities in Singapore and the United States concerning these incentives. Applied’s ability to realize benefits from these initiativesprovisions could be materially affected if, among other things, applicable requirements are not met, the incentives are substantially modified, or if Applied incurs net losses for which it cannot claim a deduction.
In addition, Applied is subject to regular examination by the Internal Revenue Service and other tax authorities, and from time to time initiates amendments to previously filed tax returns. Applied regularly assesses the likelihood of favorable or unfavorable outcomes resulting from these examinations and amendments to determine the adequacy of its provision for income taxes, which requires estimates and judgments. Although Applied believes its tax estimates are reasonable, there can be no assurance that the tax authorities will agree with such estimates. Applied may have to engage in litigation to achieve the results reflected in the estimates, which may be time-consuming and expensive. There can be no assurance that Applied will be successful or that any final determination will not be materially different from the treatment reflected in Applied’s historical income tax provisions and accruals, which could materially and adversely affect Applied’s financial condition and results of operations.
Applied is subject to risks of non-compliance with environmental and safety regulations.
Applied is subject to environmental and safety regulations in connection with its global business operations, including but not limited to: regulations related to the development, manufacture and use of its products; recycling and disposal of materials used in its products or in producing its products; the operation of its facilities; and the use of its real property. The failure or inability to comply with existing or future environmental and safety regulations, such as those related to climate change, could result in: (1) significant remediation liabilities; (2) the imposition of fines; (3) the suspension or termination of the development, manufacture, sale or use of certain of its products; (4) limitations on the operation of its facilities or ability to use its real property;and/or (5) a decrease in the value of its real property, each of which could have a material adverse effect on Applied’s business, financial condition and results of operations.
Applied is exposed to various risks related to the regulatory environment.
Applied is subject to various risks related to: (1) new, different, inconsistent or even conflicting laws, rules and regulations that may be enacted by executive order, legislative bodiesand/or regulatory agencies in the countries in which Applied operates; (2) disagreements or disputes between national or regional regulatory agencies related to international trade; and (3) the interpretation and application of laws, rules and regulations. For example, as a public company with global operations, Applied is subject to the laws of multiple jurisdictions and the rules and regulations of various governing bodies, including those related to financial and other disclosures, corporate governance, privacy, and anti-corruption. Changes in laws, regulations and standards may create uncertainty regarding compliance matters. Efforts to comply with new and changing regulations have resulted in, and are likely to continue to result in, increased general and administrative expenses and a diversion of management time and attention from revenue-
25
generatingrevenue-generating activities to compliance activities. If Applied is found by a court or regulatory agency not to be in compliance with applicable laws, rules or regulations, Applied could be subject to legal or regulatory sanctions, the public’s and customers’ perception of Applied could decline, and Applied’s business, financial condition and results of operations could be materially and adversely affected.
| |
| Item 1B: | Unresolved Staff Comments |
Information concerning Applied’s principal properties at October 31, 201030, 2011 is set forth below:
| | | | | | | | | | | | |
Location | | Type | | Principal Use | | Square
Footage | | | | | | | | | Ownership | |
| | | | | | Square
| | |
Location | | Type | | Principal Use | | Footage | | Ownership |
|
Santa Clara, CA | | Office, Plant & Warehouse | | Headquarters; Marketing; | | | 1,640,0001,512,000 | | | | Owned | |
| | | | Manufacturing; Distribution; | | | 420,000 | | | Leased |
| 250,000 | | | | Research, Development and Engineering | | | | | Leased | |
| | | | Research, Development and
Engineering | | | | | | | | |
Austin, TX | | Office, Plant & Warehouse | | Manufacturing | | | 1,458,000 | | | Owned |
| 1,719,000 | | | | Owned | |
| | | | | | | 145,000 | | | | Leased | |
Rehovot, Israel | | Office, Plant & Warehouse | | Manufacturing; Research,
Development andEngineering | | | 442,000 | | | | Owned | |
Alzenau, Germany | | Office, Plant & Warehouse | | Manufacturing; Research,
Development andEngineering | | | 281,000 | | | | Leased | |
Kalispell, MT | | Office, Plant & Warehouse | | Manufacturing; Research,
Development andEngineering | | | 252,000 | | | | Owned | |
Cheseaux, Switzerland | | Office, Plant & Warehouse | | Manufacturing; Research,
Development, and EngineeringEngineering;
Customer Support | | | 442,000171,000 | | | Owned | Leased | |
Alzenau, GermanyTreviso, Italy | | Office, Plant & Warehouse | | Manufacturing; Research, Development and Engineering | | | 255,000 | | | Leased |
Kalispell, MT | | Office, Plant & Warehouse | | Manufacturing; Research, Development and Engineering | | | 252,000 | | | Owned |
Cheseaux, Switzerland | | Office, Plant & Warehouse | | Manufacturing; Research,
Development, Engineering;
Customer Support | | | 163,000124,000 | | | | Leased |
Treviso, Italy | | Office, Plant & Warehouse | | Manufacturing; Research, Development, Engineering; Customer Support | | | 89,000 | | | Leased |
Singapore | | Office, Plant & Warehouse | | Manufacturing and
Customer Support | | | 392,000 | | | | Owned | |
| | | | | | | 5,000 | | | | Leased | | | 55,000 | | | Leased |
Tainan, Taiwan | | Office, Plant & Warehouse | | Manufacturing and
Customer Support | | | 320,000 | | | | Owned | |
Xi’an, China | | Office, Plant & Warehouse | | Research, Development and
Engineering | | | 486,000567,000 | | | | Owned | |
Hsinchu, Taiwan | | Office & Warehouse | | Customer Support | | | 90,000 | | | | Owned | |
| | | | | | | 28,000 | | | | Leased | |
Shanghai, China | | Office & Warehouse | | Customer Support | | | 95,000 | | | | Leased | |
Because of the interrelation of Applied’s operations, properties within a country may be shared by the segments operating within that country. Products in the Silicon Systems Group are manufactured in Austin, Texas,Texas; Rehovot, Israel; and Singapore. Remanufactured products in the Applied Global Services segment are produced primarily in Austin, Texas and Korea.Texas. Products in the Display segment are manufactured in Santa Clara, California; Alzenau, Germany; and Tainan, Taiwan. Products in the Energy and Environmental Solutions segment are primarily manufactured in Alzenau, Germany; Cheseaux, Switzerland; Treviso, Italy; and Santa Clara, California.
26
In addition to the above properties, Applied leases office space for marketing, sales, engineering and customer support offices in 8075 locations throughout the world: 17 in Europe, 19 in Europe, 18 in Japan, 1714 in North America (principally the United States), 910 in China, 87 in Korea, 76 in Southeast Asia, and 2 in Taiwan. Applied has a manufacturing facility of 261,000 square feet in Austin, Texas available for sale.
In addition, Applied also owns 112 acres of buildable land in Texas that could accommodate approximately 1,708,000 square feet of additional building space, and 4312.5 acres in California that could accommodate approximately 1,247,000 square feet of additional building space. Applied also leases: 4 acres in Italy that could accommodate approximately 180,000400,000 square feet of additional building space, and 10 acres in Israel that could accommodate approximately 111,000 square feet of additional building space.
Applied also leases 4 acres in Italy that could accommodate approximately 180,000 square feet of additional building space.In connection with the acquisition of Varian in November 2011, Applied added owned and leased facilities aggregating 715,000 square feet. These facilities consist of a manufacturing facility located in Gloucester, Massachusetts and multiple international sales and service offices.
Applied considers the properties that it owns or leases as adequate to meet its current and future requirements. Applied regularly assesses the size, capability and location of its global infrastructure and periodically makes adjustments based on these assessments.
The information set forth under “Legal Matters” in Note 1615 of Notes to Consolidated Financial Statements is incorporated herein by reference.
| |
| Item 4: | (Removed and Reserved) |
27
PART II
| |
| Item 5: | Market for Registrant’s Common Equity, Related Stockholder Matters and Issuer Purchases of Equity Securities |
The following table sets forth the high and low closing sale prices for the periods presented as reported on the NASDAQ Global Select Market.
| | | | | | | | | |
| | | Price Range |
| | | High | | Low |
| |
Fiscal 2009 | | | | | | | | |
| First quarter | | $ | 13.31 | | | $ | 8.14 | |
| Second quarter | | $ | 11.92 | | | $ | 8.34 | |
| Third quarter | | $ | 13.49 | | | $ | 10.50 | |
| Fourth quarter | | $ | 14.01 | | | $ | 12.66 | |
Fiscal 2010 | | | | | | | | |
| First quarter | | $ | 14.87 | | | $ | 11.89 | |
| Second quarter | | $ | 14.47 | | | $ | 11.80 | |
| Third quarter | | $ | 14.00 | | | $ | 11.78 | |
| Fourth quarter | | $ | 12.35 | | | $ | 10.37 | |
| | | | | | | | |
| | | Price Range | |
| | | High | | | Low | |
Fiscal 2010 | | | | | | | | |
First quarter | | $ | 14.87 | | | $ | 11.89 | |
Second quarter | | $ | 14.47 | | | $ | 11.80 | |
Third quarter | | $ | 14.00 | | | $ | 11.78 | |
Fourth quarter | | $ | 12.35 | | | $ | 10.37 | |
Fiscal 2011 | | | | | | | | |
First quarter | | $ | 16.10 | | | $ | 12.37 | |
Second quarter | | $ | 16.85 | | | $ | 14.46 | |
Third quarter | | $ | 15.24 | | | $ | 12.27 | |
Fourth quarter | | $ | 12.62 | | | $ | 9.85 | |
Applied’s common stock is traded on the NASDAQ Global Select Market under the symbol AMAT. As of November 19, 2010,20, 2011, there were 4,4074,192 registered holders of Applied common stock.
28
Performance Graph
The performance graph below shows the five-year cumulative total stockholder return on Applied common stock during the period from October 30, 200529, 2006 through October 31, 2010.30, 2011. This is compared with the cumulative total return of the Standard & Poor’s 500 Stock Index and the RDG Semiconductor Composite Index over the same period. The comparison assumes $100 was invested on October 30, 200529, 2006 in Applied common stock and in each of the foregoing indices and assumes reinvestment of dividends, if any. Dollar amounts in the graph are rounded to the nearest whole dollar. The performance shown in the graph represents past performance and should not be considered an indication of future performance.
Comparison ofCOMPARISON OF 5 Year Cumulative Total Return*
YEAR CUMULATIVE TOTAL RETURN*
Among Applied Materials, Inc., Thethe S&P 500 Index
And The
and the RDG Semiconductor Composite Index
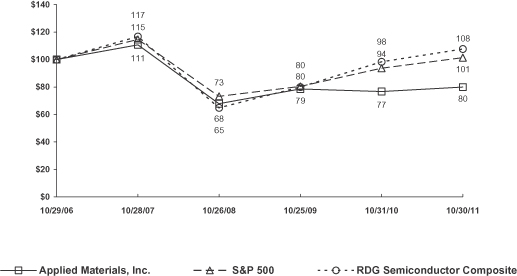
| | |
| * | | $100 invested on 10/30/0529/06 in stock or 10/31/0506 in index, including reinvestment of dividends.
Indexes calculated on month-end basis.
Copyright© 2010 S&P, a division of The McGraw-Hill Companies Inc. All rights reserved. |
| | | | | | | | | | | | | | | | | | | | | | | | | |
| | | 10/30/05 | | | 10/29/06 | | | 10/28/07 | | | 10/26/08 | | | 10/25/09 | | | 10/31/10 | |
| |
| Applied Materials | | | 100.00 | | | | 106.47 | | | | 117.66 | | | | 72.04 | | | | 83.61 | | | | 81.46 | |
| S&P 500 Index | | | 100.00 | | | | 116.34 | | | | 133.28 | | | | 85.17 | | | | 93.52 | | | | 108.97 | |
| RDG Semiconductor Composite Index | | | 100.00 | | | | 103.56 | | | | 120.77 | | | | 66.98 | | | | 82.42 | | | | 101.07 | |
Indexes calculated on month-end basis.
Copyright© 2011 S&P, a division of The McGraw-Hill Companies Inc. All rights reserved.
| | | | | | | | | | | | | | | | | | | | | | | | |
| | | 10/29/06 | | | 10/28/07 | | | 10/26/08 | | | 10/25/09 | | | 10/31/10 | | | 10/30/11 | |
Applied Materials | | | 100.00 | | | | 110.51 | | | | 67.66 | | | | 78.53 | | | | 76.51 | | | | 79.98 | |
S&P 500 Index | | | 100.00 | | | | 114.56 | | | | 73.21 | | | | 80.38 | | | | 93.66 | | | | 101.24 | |
RDG Semiconductor Composite Index | | | 100.00 | | | | 116.74 | | | | 64.72 | | | | 79.94 | | | | 98.31 | | | | 107.61 | |
Dividends
The following table summarizes the dividends declared by Applied’s Board of Directors during fiscal 2011:
| | | | | | |
Date declared | | Record date | | Payable date | | Amount per share |
December 7, 2010 | | March 2, 2011 | | March 23, 2011 | | $ 0.07 |
March 8, 2011 | | June 1, 2011 | | June 22, 2011 | | $ 0.08 |
June 6, 2011 | | August 31, 2011 | | September 21, 2011 | | $ 0.08 |
September 13, 2011 | | November 23, 2011 | | December 14, 2011 | | $ 0.08 |
During fiscal 2010, Applied’s Board of Directors declared three quarterly cash dividends in the amount of $0.07 per share each and one quarterly cash dividend in the amount of $0.06 per share. The fourth quarterly cash dividend of $0.07 per share declared in fiscal 2010 will be paid on December 15, 2010 to stockholders of record as of November 24, 2010. During fiscal 2009, Applied’s Board of Directors declared four quarterly cash dividends in the amount of $0.06 per share each. Dividends declared during fiscal 2011, 2010 2009 and 20082009 amounted to $408 million, $361 million and $320 million, and $323 million,
respectively. Applied currently anticipates that it will continue to pay cash dividends on a quarterly basis in the future, although the declaration and amount of any future cash dividend are at the discretion of the Board of Directors and will depend on Applied’s financial condition, results of operations, capital requirements, business conditions and other factors, as well as a determination that cash dividends are in the best interests of Applied’s stockholders.
29
Repurchases of Applied Common Stock
The following table provides information as of October 31, 201030, 2011 with respect to the shares of common stock repurchased by Applied during the fourth quarter of fiscal 2010.
| | | | | | | | | | | | | | | | | |
| | | | | | | | | | | | Maximum Dollar
| |
| | | | | | | | | Total Number of
| | | Value of Shares
| |
| | | | | | Average
| | | Shares Purchased as
| | | That May Yet be
| |
| | | Total Number of
| | | Price Paid
| | | Part of Publicly
| | | Purchased Under
| |
| Period | | Shares Purchased | | | per Share | | | Announced Program* | | | the Program* | |
| | | (Shares in thousands) | | | | | | (Shares in thousands) | | | (Dollars in millions) | |
| |
| Month #1 | | | | | | | | | | | | | | | | |
| (August 2, 2010 to August 29, 2010) | | | 2,114 | | | $ | 10.97 | | | | 2,114 | | | $ | 1,777 | |
| Month #2 | | | | | | | | | | | | | | | | |
| (August 30, 2010 to September 26, 2010) | | | 5,472 | | | $ | 10.92 | | | | 5,472 | | | $ | 1,717 | |
| Month #3 | | | | | | | | | | | | | | | | |
| (September 27, 2010 to October 31, 2010) | | | 5,679 | | | $ | 11.81 | | | | 5,679 | | | $ | 1,650 | |
| | | | | | | | | | | | | | | | | |
| Total | | | 13,265 | | | $ | 11.31 | | | | 13,265 | | | | | |
| | | | | | | | | | | | | | | | | |
| | | | | | | | | | | | | | | | |
Period | | Total Number of
Shares Purchased | | | Average
Price Paid
per Share | | | Total Number of
Shares Purchased as
Part of Publicly
Announced Program* | | | Maximum Dollar
Value of Shares
That May Yet be
Purchased Under
the Program* | |
| | | (In millions, except per share amounts) | |
Month #1 | | | | | | | | | | | | | | | | |
(August 1, 2011 to August 28, 2011) | | | 0.9 | | | $ | 11.44 | | | | 0.9 | | | $ | 1,347 | |
Month #2 | | | | | | | | | | | | | | | | |
(August 29, 2011 to September 25, 2011) | | | 10.5 | | | $ | 11.08 | | | | 10.5 | | | $ | 1,231 | |
Month #3 | | | | | | | | | | | | | | | | |
(September 26, 2011 to October 30, 2011) | | | 4.5 | | | $ | 10.86 | | | | 4.5 | | | $ | 1,182 | |
| | | | | | | | | | | | | | | | |
Total | | | 15.9 | | | $ | 11.04 | | | | 15.9 | | | | | |
| | | | | | | | | | | | | | | | |
| | |
| * | | On March 8, 2010, the Board of Directors approved a stock repurchase program for up to $2.0 billion in repurchases over the next three years, ending March 2013. |
30
| |
| Item 6: | Selected Financial Data |
The following selected financial information has been derived from Applied’s historical audited consolidated financial statements and should be read in conjunction with the consolidated financial statements and the accompanying notes for the corresponding fiscal years:
| | | | | | | | | | | | | | | | | | | | | |
| Fiscal Year(1) | | 2010 | | | 2009 | | | 2008 | | | 2007 | | | 2006 | |
| | | (In millions, except percentages, ratios, per share amounts and number of employees) | |
| |
| Net sales | | $ | 9,549 | | | $ | 5,014 | | | $ | 8,129 | | | $ | 9,735 | | | $ | 9,167 | |
| Gross margin | | $ | 3,715 | | | $ | 1,431 | | | $ | 3,443 | | | $ | 4,492 | | | $ | 4,292 | |
| (% of net sales) | | | 39 | | | | 29 | | | | 42 | | | | 46 | | | | 47 | |
| Research, development and engineering | | $ | 1,144 | | | $ | 934 | | | $ | 1,104 | | | $ | 1,142 | | | $ | 1,152 | |
| (% of net sales) | | | 12 | | | | 19 | | | | 14 | | | | 12 | | | | 13 | |
| Marketing, selling, general and administrative | | $ | 942 | | | $ | 735 | | | $ | 965 | | | $ | 952 | | | $ | 907 | |
| (% of net sales) | | | 10 | | | | 15 | | | | 12 | | | | 10 | | | | 10 | |
| Operating income (loss) | | $ | 1,384 | | | $ | (394 | ) | | $ | 1,355 | | | $ | 2,372 | | | $ | 2,021 | |
| (% of net sales) | | | 14 | | | | (8 | ) | | | 17 | | | | 24 | | | | 22 | |
| Income (loss) before income taxes | | $ | 1,387 | | | $ | (486 | ) | | $ | 1,409 | | | $ | 2,440 | | | $ | 2,167 | |
| Effective tax rate(%) | | | 32 | | | | (37 | ) | | | 32 | | | | 30 | | | | 30 | |
| Net income (loss) | | $ | 938 | | | $ | (305 | ) | | $ | 961 | | | $ | 1,710 | | | $ | 1,517 | |
| (% of net sales) | | | 10 | | | | (6 | ) | | | 12 | | | | 18 | | | | 17 | |
| Earnings (loss) per diluted share | | $ | 0.70 | | | $ | (0.23 | ) | | $ | 0.70 | | | $ | 1.20 | | | $ | 0.97 | |
| Weighted average common shares | | | 1,349 | | | | 1,333 | | | | 1,375 | | | | 1,427 | | | | 1,565 | |
| New orders | | $ | 10,249 | | | $ | 4,097 | | | $ | 9,155 | | | $ | 9,677 | | | $ | 9,888 | |
| Order backlog | | $ | 3,244 | | | $ | 2,735 | | | $ | 4,848 | | | $ | 3,655 | | | $ | 3,398 | |
| Working capital | | $ | 3,877 | | | $ | 3,749 | | | $ | 3,719 | | | $ | 4,226 | | | $ | 3,645 | |
| Long-term debt | | $ | 204 | | | $ | 201 | | | $ | 202 | | | $ | 202 | | | $ | 205 | |
| Cash dividends declared per common share | | $ | 0.27 | | | $ | 0.24 | | | $ | 0.24 | | | $ | 0.23 | | | $ | 0.18 | |
| Stockholders’ equity | | $ | 7,536 | | | $ | 7,095 | | | $ | 7,549 | | | $ | 7,821 | | | $ | 6,651 | |
| Total assets | | $ | 10,943 | | | $ | 9,574 | | | $ | 11,006 | | | $ | 10,662 | | | $ | 9,481 | |
| Capital expenditures, net of loss on fixed asset retirements | | $ | 149 | | | $ | 224 | | | $ | 281 | | | $ | 243 | | | $ | 151 | |
| Regular employees | | | 13,045 | | | | 12,619 | | | | 14,824 | | | | 14,550 | | | | 14,072 | |
| | | | | | | | | | | | | | | | | | | | |
Fiscal Year(1) | | 2011 | | | 2010 | | | 2009 | | | 2008 | | | 2007 | |
| | | (In millions, except percentages, per share amounts and number of employees) | |
Net sales | | $ | 10,517 | | | $ | 9,549 | | | $ | 5,014 | | | $ | 8,129 | | | $ | 9,735 | |
Gross margin | | $ | 4,360 | | | $ | 3,715 | | | $ | 1,431 | | | $ | 3,443 | | | $ | 4,492 | |
(% of net sales) | | | 41 | | | | 39 | | | | 29 | | | | 42 | | | | 46 | |
Research, development and engineering | | $ | 1,118 | | | $ | 1,143 | | | $ | 934 | | | $ | 1,104 | | | $ | 1,142 | |
(% of net sales) | | | 11 | | | | 12 | | | | 19 | | | | 14 | | | | 12 | |
Marketing, selling, general and administrative | | $ | 901 | | | $ | 942 | | | $ | 735 | | | $ | 965 | | | $ | 952 | |
(% of net sales) | | | 9 | | | | 10 | | | | 15 | | | | 12 | | | | 10 | |
Operating income (loss) | | $ | 2,398 | | | $ | 1,384 | | | $ | (394 | ) | | $ | 1,355 | | | $ | 2,372 | |
(% of net sales) | | | 23 | | | | 14 | | | | (8 | ) | | | 17 | | | | 24 | |
Income (loss) before income taxes | | $ | 2,378 | | | $ | 1,387 | | | $ | (486 | ) | | $ | 1,409 | | | $ | 2,440 | |
Effective tax rate (%) | | | 19 | | | | 32 | | | | (37 | ) | | | 32 | | | | 30 | |
Net income (loss) | | $ | 1,926 | | | $ | 938 | | | $ | (305 | ) | | $ | 961 | | | $ | 1,710 | |
(% of net sales) | | | 18 | | | | 10 | | | | (6 | ) | | | 12 | | | | 18 | |
Earnings (loss) per diluted share | | $ | 1.45 | | | $ | 0.70 | | | $ | (0.23 | ) | | $ | 0.70 | | | $ | 1.20 | |
Weighted average common shares, diluted | | | 1,330 | | | | 1,349 | | | | 1,333 | | | | 1,375 | | | | 1,427 | |
New orders | | $ | 10,142 | | | $ | 10,249 | | | $ | 4,097 | | | $ | 9,155 | | | $ | 9,677 | |
Order backlog | | $ | 2,392 | | | $ | 3,244 | | | $ | 2,735 | | | $ | 4,848 | | | $ | 3,655 | |
Working capital | | $ | 7,561 | | | $ | 3,877 | | | $ | 3,749 | | | $ | 3,719 | | | $ | 4,226 | |
Long-term debt | | $ | 1,947 | | | $ | 204 | | | $ | 201 | | | $ | 202 | | | $ | 202 | |
Cash dividends declared per common share | | $ | 0.31 | | | $ | 0.27 | | | $ | 0.24 | | | $ | 0.24 | | | $ | 0.23 | |
Stockholders’ equity | | $ | 8,800 | | | $ | 7,536 | | | $ | 7,095 | | | $ | 7,549 | | | $ | 7,821 | |
Total assets | | $ | 13,861 | | | $ | 10,943 | | | $ | 9,574 | | | $ | 11,006 | | | $ | 10,662 | |
Capital expenditures | | $ | 209 | | | $ | 169 | | | $ | 249 | | | $ | 288 | | | $ | 265 | |
Regular employees | | | 12,973 | | | | 13,045 | | | | 12,619 | | | | 14,824 | | | | 14,550 | |
| | |
| (1) | | Each fiscal year ended on the last Sunday in October. |
31
| |
| Item 7: | Management’s Discussion and Analysis of Financial Condition and Results of Operations |
Management’s Discussion and Analysis of Financial Condition and Results of Operations (MD&A) is intended to facilitate an understanding of Applied’s business and results of operations. This MD&A should be read in conjunction with Applied’s Consolidated Financial Statements and the accompanying Notes to Consolidated Financial Statements included elsewhere in thisForm 10-K. The following discussion contains forward-looking statements and should also be read in conjunction with the cautionary statement set forth at the beginning of thisForm 10-K. MD&A consists of the following sections:
| | |
| | • | | Overview:a summary of Applied’s business and measurements |
|
| | • | | Results of Operations:a discussion of operating results. |
|
| | • | | Segment Information:a discussion of segment operating results. |
|
| | • | | Financial Condition, Liquidity and Capital Resources:an analysis of cash flows, sources and uses of cash, contractual obligations and financial position. |
|
| | • | | Critical Accounting Policies:a discussion of critical accounting policies that require the exercise of judgments and estimates. |
Applied provides manufacturing equipment, services and software to the global semiconductor, flat panel display, solar photovoltaic (PV) and related industries. Applied’s customers include manufacturers of semiconductor wafers and chips, flat panel liquid crystal displays (LCDs), solar PV cells and modules, and other electronic devices. These customers may use what they manufacture in their own end products or sell the items to other companies for use in advanced electronic components. Applied operates in four reportable segments: Silicon Systems Group, Applied Global Services, Display, and Energy and Environmental Solutions. A summary of financial information for each reportable segment is found in Note 16 of Notes to Consolidated Financial Statements. A discussion of factors that could affect Applied’s operations is set forth under “Risk Factors” in Item 1A, which is incorporated herein by reference. Product development and manufacturing activities occur primarily in North America, Europe, Israel and Asia. Applied’s broad range of equipment and service products are highly technical and are sold primarily through a direct sales force.
Applied’s results historically have been driven primarily by worldwide demand for semiconductors, which in turn depends on end-user demand for electronic products. Each of Applied’s businesses is subject to highly cyclical industry conditions, as demand for manufacturing equipment and services can change depending on supply and demand for chips, LCDs, solar PVs and other electronic devices, as well as other factors, such as global economic and market conditions, and technological advances in fabrication processes. After a challenging year in fiscal 2009 that was characterized by credit constraints in the financial markets, a weak global economy and a semiconductor industry downturn, global economic and industry conditions affecting Applied’s businesses generally improved in fiscal 2010, except for conditions in the thin film solar PV market.
The following table presents certain significant measurements for the past three fiscal years:
| | | | | | | | | | | | | | | | | | | | | |
| | | | | | | | | | | | Change | |
| Fiscal Year | | 2010 | | | 2009 | | | 2008 | | | 2010 over 2009 | | | 2009 over 2008 | |
| | | (In millions, except per share amounts and percentages) | |
| |
| New orders | | $ | 10,249 | | | $ | 4,097 | | | $ | 9,155 | | | $ | 6,152 | | | $ | (5,058) | |
| Net sales | | $ | 9,549 | | | $ | 5,014 | | | $ | 8,129 | | | $ | 4,535 | | | $ | (3,115) | |
| Gross margin | | $ | 3,715 | | | $ | 1,431 | | | $ | 3,443 | | | $ | 2,284 | | | $ | (2,012) | |
| Gross margin percent | | | 39 | % | | | 29 | % | | | 42 | % | | | 10 points | | | | (14) points | |
| Operating income (loss) | | $ | 1,384 | | | $ | (394 | ) | | $ | 1,355 | | | $ | 1,778 | | | $ | (1,749) | |
| Operating margin percent | | | 14 | % | | | (8 | )% | | | 17 | % | | | 22 points | | | | (25) points | |
| Net income (loss) | | $ | 938 | | | $ | (305 | ) | | $ | 961 | | | $ | 1,243 | | | $ | (1,266) | |
| Earnings (loss) per share | | $ | 0.70 | | | $ | (0.23 | ) | | $ | 0.70 | | | $ | 0.93 | | | $ | (0.93) | |
32
| | | | | | | | | | | | | | | | | | | | |
| | | | | | | | | | | | Change | |
Fiscal Year | | 2011 | | | 2010 | | | 2009 | | | 2011 over 2010 | | | 2010 over 2009 | |
| | | (In millions, except per share amounts and percentages) | |
New orders | | $ | 10,142 | | | $ | 10,249 | | | $ | 4,097 | | | $ | (107 | ) | | $ | 6,152 | |
Net sales | | $ | 10,517 | | | $ | 9,549 | | | $ | 5,014 | | | $ | 968 | | | $ | 4,535 | |
Gross margin | | $ | 4,360 | | | $ | 3,715 | | | $ | 1,431 | | | $ | 645 | | | $ | 2,284 | |
Gross margin percent | | | 41 | % | | | 39 | % | | | 29 | % | | | 2 points | | | | 10 points | |
Operating income (loss) | | $ | 2,398 | | | $ | 1,384 | | | $ | (394 | ) | | $ | 1,014 | | | $ | 1,778 | |
Operating margin percent | | | 23 | % | | | 14 | % | | | (8 | )% | | | 9 points | | | | 22 points | |
Net income (loss) | | $ | 1,926 | | | $ | 938 | | | $ | (305 | ) | | $ | 988 | | | $ | 1,243 | |
Earnings (loss) per diluted share | | $ | 1.45 | | | $ | 0.70 | | | $ | (0.23 | ) | | $ | 0.75 | | | $ | 0.93 | |
Fiscal 2011 and 2009 contained 52 weeks each, while fiscal 2010 contained 53 weeks.
Financial results for fiscal 2011 over fiscal 2010 reflected a decrease in total new orders, while net sales increased to a record level and net income also increased. The decline in new orders reflected softening demand for semiconductor, LCD and solar equipment in the second half of the year. The semiconductor industry was negatively impacted by uncertainty in the macroeconomic environment whereas the LCD and solar equipment industries were negatively impacted by overcapacity. In the fourth quarter of fiscal 2011, new orders were $1.6 billion, down 33 percent from the prior quarter. For fiscal 2011, net sales increased year-over-year primarily due to increased industry investment in crystalline-silicon (c-Si) solar equipment and higher sales of spares and refurbished semiconductor equipment. Operating income for fiscal 2011 included favorable adjustments to restructuring reserves of $60 million, offset in part by asset impairment charges of $30 million, and a net gain on sale of facilities of $27 million. In fiscal 2010, Applied incurred charges totaling $486 million that included a plan to restructure its Energy and Environmental Solutions segment.Financial results for fiscal 2010 over fiscal 2009 reflected significantly increased demand for manufacturing equipment and services due to more favorable global economic and industry conditions. The increase in total orders from fiscal 2009 was primarily due to increased demand for semiconductor, display and crystalline silicon (c-Si)c-Si solar PV products, partially offset by decreased demand for SunFabtm™ thin film solar lines. Net sales increased during fiscal 2010 compared to fiscal 2009, due primarily to higher sales of semiconductor and display equipment.
Also, in In fiscal 2010, Applied incurred charges totaling $84 million associated with a restructuring program to reduce its global workforce as of October 25, 2009 by approximately 1,000 positions over a period of 18 months. In addition, Applied incurred charges totaling $486 million that included a plan to restructure its Energy and Environmental Solutions segment.segment, consisting of inventory-related charges of $330 million related to SunFab thin film solar equipment, asset impairment charges of $108 million, employee severance charges of $45 million, and other costs of $3 million. This action was in response to adverse market conditions for thin film solar, including delays in utility-scale solar adoption, solar panel manufacturers’ challenges in obtaining affordable capital, changes and uncertainty in government renewable energy policies, and competitive pressure from c-Si solar technologies. As part of the restructuring, Applied discontinued sales to new customers of its fully-integrated SunFab lines but continued to offer individual tools for thin film solar manufacturing. Applied is supporting existing SunFab customers with services, upgrades and capacity increases through its Applied Global Services segment and will continueis continuing RD&E efforts to improve thin film panel efficiency and high-productivity deposition.
Also in fiscal 2010, Applied incurred charges totaling $84 million associated with a restructuring program to reduce its global workforce as of October 25, 2009 by approximately 1,000 positions over a period of 18 months.Fiscal 2009 financial results reflected significantly reduced demand for manufacturing equipment and services due to extremely unfavorable global economic and industry conditions, particularly in the first half of fiscal 2009. Negative trends in consumer spending and pervasive economic uncertainty led some customers to dramatically reduce factory operations and to reduce their spending. In the second half of fiscal 2009, demand for semiconductor and display equipment increased, but was still down significantly from fiscal 2008 levels. Fiscal 2009 financial results included charges associated with restructuring programs.
Fiscal 2008 financial results reflected decreased demandIn November 2011, Applied completed its acquisition of Varian Semiconductor Equipment Associates, Inc. (Varian) for semiconductor equipmentan aggregate purchase price of approximately $4.2 billion, net of cash acquired. The acquisition enhances Applied’s product portfolio with market-leading ion implantation technology and is expected to a lesser extent, service products, dueenable Applied to unfavorable market conditions inbecome the semiconductor industry partially offset by increased demand for LCD and solar products. New orders decreased from fiscal 2007 due to lower demand for semiconductor equipment from memory, foundry and logic chip manufacturers, partially offset by increased demand by LCD customers and, beginningleader in the first quarter of fiscal 2008, the initial recognition of orders for Applied’s SunFab thin film line for manufacturing solar panels. Net sales decreased during fiscal 2008 compared to fiscal 2007 due to the decline in investment from memory and logic customers, partially offset by increased sales of c-Si solar manufacturing products. Net income decreased in fiscal 2008 compared to fiscal 2007 due to lower net sales, offset in part by lower operating expenses. Fiscal 2008 financial results included charges associated with restructuring programs.
33transistor technologies.
Results of Operations
The following table presents certain quarterly and full fiscal year financial information:
| | | | | | | | | | | | | | | | | | | | | |
| | | Fiscal Quarter | | Fiscal
|
| | | First | | Second | | Third | | Fourth | | Year |
| | | (In millions, except per share amounts) |
| |
| 2010: | | | | | | | | | | | | | | | | | | | | |
| New orders | | $ | 1,965 | | | $ | 2,533 | | | $ | 2,725 | | | $ | 3,026 | | | $ | 10,249 | |
| Net sales | | $ | 1,849 | | | $ | 2,296 | | | $ | 2,518 | | | $ | 2,886 | | | $ | 9,549 | |
| Gross margin | | $ | 711 | | | $ | 927 | | | $ | 860 | | | $ | 1,217 | | | $ | 3,715 | |
| Operating income | | $ | 116 | | | $ | 386 | | | $ | 183 | | | $ | 699 | | | $ | 1,384 | |
| Net income | | $ | 83 | | | $ | 264 | | | $ | 123 | | | $ | 468 | | | $ | 938 | |
| Earnings per diluted share | | $ | 0.06 | | | $ | 0.20 | | | $ | 0.09 | | | $ | 0.35 | | | $ | 0.70 | |
| 2009: | | | | | | | | | | | | | | | | | | | | |
| New orders | | $ | 903 | | | $ | 649 | | | $ | 1,072 | | | $ | 1,473 | | | $ | 4,097 | |
| Net sales | | $ | 1,333 | | | $ | 1,020 | | | $ | 1,134 | | | $ | 1,526 | | | $ | 5,014 | |
| Gross margin | | $ | 392 | | | $ | 156 | | | $ | 325 | | | $ | 559 | | | $ | 1,431 | |
| Operating income (loss) | | $ | (196 | ) | | $ | (293 | ) | | $ | (77 | ) | | $ | 173 | | | $ | (394 | ) |
| Net income (loss) | | $ | (133 | ) | | $ | (255 | ) | | $ | (55 | ) | | $ | 138 | | | $ | (305 | ) |
| Earnings (loss) per diluted share | | $ | (0.10 | ) | | $ | (0.19 | ) | | $ | (0.04 | ) | | $ | 0.10 | | | $ | (0.23 | ) |
| 2008: | | | | | | | | | | | | | | | | | | | | |
| New orders | | $ | 2,500 | | | $ | 2,414 | | | $ | 2,030 | | | $ | 2,212 | | | $ | 9,155 | |
| Net sales | | $ | 2,087 | | | $ | 2,150 | | | $ | 1,848 | | | $ | 2,044 | | | $ | 8,129 | |
| Gross margin | | $ | 935 | | | $ | 967 | | | $ | 742 | | | $ | 799 | | | $ | 3,443 | |
| Operating income | | $ | 373 | | | $ | 438 | | | $ | 228 | | | $ | 316 | | | $ | 1,355 | |
| Net income | | $ | 262 | | | $ | 303 | | | $ | 165 | | | $ | 231 | | | $ | 961 | |
| Earnings per diluted share | | $ | 0.19 | | | $ | 0.22 | | | $ | 0.12 | | | $ | 0.17 | | | $ | 0.70 | |
| | | | | | | | | | | | | | | | | | | | |
| | | Fiscal Quarter | | | Fiscal
Year | |
| | | First | | | Second | | | Third | | | Fourth | | |
| | | (In millions, except per share amounts) | |
2011: | | | | | | | | | | | | | | | | | | | | |
New orders | | $ | 2,971 | | | $ | 3,185 | | | $ | 2,390 | | | $ | 1,596 | | | $ | 10,142 | |
Net sales | | $ | 2,686 | | | $ | 2,862 | | | $ | 2,787 | | | $ | 2,182 | | | $ | 10,517 | |
Gross margin | | $ | 1,136 | | | $ | 1,189 | | | $ | 1,184 | | | $ | 852 | | | $ | 4,360 | |
Operating income | | $ | 674 | | | $ | 677 | | | $ | 687 | | | $ | 361 | | | $ | 2,398 | |
Net income | | $ | 506 | | | $ | 489 | | | $ | 476 | | | $ | 456 | | | $ | 1,926 | |
Earnings per diluted share | | $ | 0.38 | | | $ | 0.37 | | | $ | 0.36 | | | $ | 0.34 | | | $ | 1.45 | |
2010: | | | | | | | | | | | | | | | | | | | | |
New orders | | $ | 1,965 | | | $ | 2,533 | | | $ | 2,725 | | | $ | 3,026 | | | $ | 10,249 | |
Net sales | | $ | 1,849 | | | $ | 2,296 | | | $ | 2,518 | | | $ | 2,886 | | | $ | 9,549 | |
Gross margin | | $ | 711 | | | $ | 927 | | | $ | 860 | | | $ | 1,217 | | | $ | 3,715 | |
Operating income | | $ | 116 | | | $ | 386 | | | $ | 183 | | | $ | 699 | | | $ | 1,384 | |
Net income | | $ | 83 | | | $ | 264 | | | $ | 123 | | | $ | 468 | | | $ | 938 | |
Earnings per diluted share | | $ | 0.06 | | | $ | 0.20 | | | $ | 0.09 | | | $ | 0.35 | | | $ | 0.70 | |
2009: | | | | | | | | | | | | | | | | | | | | |
New orders | | $ | 903 | | | $ | 649 | | | $ | 1,072 | | | $ | 1,473 | | | $ | 4,097 | |
Net sales | | $ | 1,333 | | | $ | 1,020 | | | $ | 1,134 | | | $ | 1,526 | | | $ | 5,014 | |
Gross margin | | $ | 392 | | | $ | 156 | | | $ | 325 | | | $ | 559 | | | $ | 1,431 | |
Operating income (loss) | | $ | (196 | ) | | $ | (293 | ) | | $ | (77 | ) | | $ | 173 | | | $ | (394 | ) |
Net income (loss) | | $ | (133 | ) | | $ | (255 | ) | | $ | (55 | ) | | $ | 138 | | | $ | (305 | ) |
Earnings (loss) per diluted share | | $ | (0.10 | ) | | $ | (0.19 | ) | | $ | (0.04 | ) | | $ | 0.10 | | | $ | (0.23 | ) |
Demand for manufacturing equipment historically has been volatile as a result of sudden changes in chip, LCD, and solar PV supply and demand and other factors, including global economic and market conditions and rapid technological advances in fabrication processes. Applied’s business was subject to cyclical industry conditions in fiscal 2011, 2010 2009 and 2008.2009. As a result of these conditions and the changing global economic environment, there were significant fluctuations in Applied’s quarterly new orders and net sales, both within and across the three fiscal years. Demand for manufacturing equipment has historically been volatile as a resultAs of sudden changes in chip, LCDthe end of fiscal 2011, the semiconductor, display and solar PV supplyequipment industries were each in a capacity-driven downturn. The nature and demand and other factors, including global economic and market conditions and rapid technological advancestiming of a recovery in fabrication processes.
34capital equipment investment are expected to depend largely on the macroeconomic environment.
New Orders
New orders by geographic region, which are attributed according to the location of customers’ facilities, were as follows:
| | | | | | | | | | | | | | | | | | | | | | | | | | | | | | | | | |
| | | | | | Change
| | | | | | Change
| | | | |
| | | 2010 | | | 2010 over 2009 | | | 2009 | | | 2009 over 2008 | | | 2008 | |
| | | ($) | | | (%) | | | (%) | | | ($) | | | (%) | | | (%) | | | ($) | | | (%) | |
| | | | | | | | | (In millions, except percentages) | | | | | | | |
| |
| Taiwan | | | 2,760 | | | | 27 | | | | 342 | | | | 625 | | | | 15 | | | | (70 | ) | | | 2,110 | | | | 23 | |
| Korea | | | 2,155 | | | | 21 | | | | 188 | | | | 749 | | | | 18 | | | | (24 | ) | | | 986 | | | | 11 | |
| China | | | 1,703 | | | | 17 | | | | 205 | | | | 559 | | | | 14 | | | | (62 | ) | | | 1,477 | | | | 17 | |
| Japan | | | 741 | | | | 7 | | | | 40 | | | | 531 | | | | 13 | | | | (57 | ) | | | 1,224 | | | | 13 | |
| Southeast Asia | | | 675 | | | | 7 | | | | 173 | | | | 247 | | | | 6 | | | | (55 | ) | | | 544 | | | | 6 | |
| | | | | | | | | | | | | | | | | | | | | | | | | | | | | | | | | |
| Asia Pacific | | | 8,034 | | | | 79 | | | | 196 | | | | 2,711 | | | | 66 | | | | (57 | ) | | | 6,341 | | | | 70 | |
| North America(*) | | | 1,348 | | | | 13 | | | | 90 | | | | 711 | | | | 17 | | | | (58 | ) | | | 1,680 | | | | 18 | |
| Europe | | | 867 | | | | 8 | | | | 28 | | | | 675 | | | | 17 | | | | (40 | ) | | | 1,134 | | | | 12 | |
| | | | | | | | | | | | | | | | | | | | | | | | | | | | | | | | | |
| Total | | | 10,249 | | | | 100 | | | | 150 | | | | 4,097 | | | | 100 | | | | (55 | ) | | | 9,155 | | | | 100 | |
| | | | | | | | | | | | | | | | | | | | | | | | | | | | | | | | | |
| | | | | | | | | | | | | | | | | | | | | | | | | | | | | | | | |
| | | 2011 | | | Change
2011 over 2010 | | | 2010 | | | Change
2010 over 2009 | | | 2009 | |
| | | ($) | | | (%) | | | (%) | | | ($) | | | (%) | | | (%) | | | ($) | | | (%) | |
| | | (In millions, except percentages) | |
Taiwan | | | 2,235 | | | | 22 | | | | (19 | ) | | | 2,760 | | | | 27 | | | | 342 | | | | 625 | | | | 15 | |
China | | | 2,066 | | | | 20 | | | | (4 | ) | | | 2,155 | | | | 21 | | | | 188 | | | | 749 | | | | 18 | |
Korea | | | 1,286 | | | | 13 | | | | (25 | ) | | | 1,703 | | | | 17 | | | | 205 | | | | 559 | | | | 14 | |
Japan | | | 1,001 | | | | 10 | | | | 35 | | | | 741 | | | | 7 | | | | 40 | | | | 531 | | | | 13 | |
Southeast Asia | | | 463 | | | | 5 | | | | (31 | ) | | | 675 | | | | 7 | | | | 173 | | | | 247 | | | | 6 | |
| | | | | | | | | | | | | | | | | | | | | | | | | | | | | | | | |
Asia Pacific | | | 7,051 | | | | 70 | | | | (12 | ) | | | 8,034 | | | | 79 | | | | 196 | | | | 2,711 | | | | 66 | |
North America(*) | | | 2,069 | | | | 20 | | | | 54 | | | | 1,348 | | | | 13 | | | | 90 | | | | 711 | | | | 17 | |
Europe | | | 1,022 | | | | 10 | | | | 18 | | | | 867 | | | | 8 | | | | 28 | | | | 675 | | | | 17 | |
| | | | | | | | | | | | | | | | | | | | | | | | | | | | | | | | |
Total | | | 10,142 | | | | 100 | | | | (1 | ) | | | 10,249 | | | | 100 | | | | 150 | | | | 4,097 | | | | 100 | |
| | | | | | | | | | | | | | | | | | | | | | | | | | | | | | | | |
| | |
| (*) | | Primarily the United States. |
New orders of $10.1 billion for fiscal 2011 were down 1 percent from fiscal 2010. The decrease was primarily attributable to decreased demand for semiconductor equipment from memory customers and decreased demand for LCD equipment, partially offset by increased demand for touch panel tools from display customers and increased demand for c-Si equipment from solar manufacturers. Customers in China and Taiwan together represented 42 percent of total new orders for fiscal 2011.
From fiscal 2009 to fiscal 2010, new orders more than doubled to $10.2 billion in fiscal 2010 compared to fiscal 2009.billion. The increase was principally due to greater demand for semiconductor equipment and services, primarily from memory and foundry customers, as well as increased demand for c-Si solar manufacturing products and display equipment. The increase in new orders reflected the general recovery in the semiconductor equipment industry and the LCD market from the steep downturn experienced in fiscal 2009.
Customers in Taiwan and China together represented 48 percent of total new orders for fiscal 2010.New orders decreased 55 percent to $4.1 billion in fiscal 2009 compared to fiscal 2008. The decrease in new orders was across all segments, and particularly in the semiconductor and display businesses, reflecting the challenging economic and industry conditions prevalent during fiscal 2009. Customer demand for semiconductor and LCD equipment began to recover in the second half of fiscal 2009.
Customers in China, North America, and Europe combined represented 52 percent of total new orders for fiscal 2009.New orders decreased 5 percent to $9.2 billion inby reportable segment for the past three fiscal 2008years were as follows:
| | | | | | | | | | | | | | | | | | | | | | | | | | | | | | | | |
| | | 2011 | | | Change
2011 over 2010 | | | 2010 | | | Change
2010 over 2009 | | | 2009 | |
| | | ($) | | | (%) | | | (%) | | | ($) | | | (%) | | | (%) | | | ($) | | | (%) | |
| | | (In millions, except percentages) | |
Silicon Systems Group | | | 5,489 | | | | 54 | | | | (5 | ) | | | 5,759 | | | | 56 | | | | 243 | | | | 1,677 | | | | 41 | |
Applied Global Services | | | 2,333 | | | | 23 | | | | 7 | | | | 2,183 | | | | 21 | | | | 85 | | | | 1,179 | | | | 29 | |
Display | | | 636 | | | | 6 | | | | (20 | ) | | | 799 | | | | 8 | | | | 178 | | | | 287 | | | | 7 | |
Energy and Environmental Solutions | | | 1,684 | | | | 17 | | | | 12 | | | | 1,508 | | | | 15 | | | | 58 | | | | 955 | | | | 23 | |
| | | | | | | | | | | | | | | | | | | | | | | | | | | | | | | | |
Total | | | 10,142 | | | | 100 | | | | (1 | ) | | | 10,249 | | | | 100 | | | | 150 | | | | 4,098 | | | | 100 | |
| | | | | | | | | | | | | | | | | | | | | | | | | | | | | | | | |
For fiscal 2011 as compared to fiscal 2007, due to lower demand for semiconductor equipment from logic, memory, and foundry chip manufacturers, partially offset2010, new orders by increased demand for LCD and solar equipment, includingsegment as well as the initial recognitionrelative share of total new orders for the Silicon Systems Group and Display decreased, while new orders by segment as well as the relative
share of new orders in Applied SunFab thin film line. DemandGlobal Services and Energy and Environmental Solutions increased. For fiscal 2010 as compared to fiscal 2009, new orders increased in all segments, with the relative share of total new orders increasing significantly for LCD equipment slowed substantiallythe Silicon Systems Group while the relative share of new orders in the fourth quarter of fiscal 2008, as Display customers absorbed capacity following robust demand over the preceding three quarters.
Applied Global Services and Energy and Environmental Solutions decreased by 8 percentage points each.Applied’s backlog was $2.4 billion at October 30, 2011 as of the end of each of the last three fiscal years was as follows:compared to $3.2 billion at October 31, 2010, $2.7 billion at October 25, 2009,2010. Backlog adjustments were negative for fiscal 2011 and $4.8 billion at October 26, 2008.totaled $504 million, consisting primarily of orders with revised shipment dates outside of Applied’s order policy and included $124 million in customer cancellations. Backlog increaseddecreased in fiscal 2011 from fiscal 2010 primarily due to an increasedecreases in new orders for the Silicon Systems Group and Applied Global ServicesDisplay, reflecting increaseddecreased demand for semiconductor equipment.equipment and a weaker LCD market, respectively. Backlog consists of: (1) orders for which written authorizations have been accepted and assigned shipment dates are within the next 12 months, or shipment has occurred but revenue has not been recognized; (2) contractual service revenue and maintenance fees to be earned within the next 12 months; and (3) orders for SunFab lines that are anticipated to be recognized as revenue within the next 12 months. Applied’s backlog at any particular time is not necessarily indicative of actual sales for any future periods, due to the potential for customer changes in delivery schedules or cancellation of orders. In addition, the majorityfourth quarter of fiscal 2011, approximately 45 percent of net sales in the Silicon Systems Group, Applied’s largest business segment, were fromfor orders received and shipped inwithin the same quarter.
35
Backlog by reportable segment as of October 30, 2011 and October 31, 2010 was as follows: | | | | | | | | | | | | | | | | | | | | |
| | | 2011 | | | Change
2011 over 2010 | | | 2010 | |
| | | ($) | | | (%) | | | (%) | | | ($) | | | (%) | |
| | | (In millions, except percentages) | |
Silicon Systems Group | | | 913 | | | | 38 | | | | (17 | ) | | | 1,099 | | | | 34 | |
Applied Global Services | | | 662 | | | | 28 | | | | (15 | ) | | | 779 | | | | 24 | |
Display | | | 337 | | | | 14 | | | | (33 | ) | | | 505 | | | | 16 | |
Energy and Environmental Solutions | | | 480 | | | | 20 | | | | (44 | ) | | | 861 | | | | 26 | |
| | | | | | | | | | | | | | | | | | | | |
Total | | | 2,392 | | | | 100 | | | | (26 | ) | | | 3,244 | | | | 100 | |
| | | | | | | | | | | | | | | | | | | | |
Net Sales
Net sales by geographic region, which are attributed according to the location of customers’ facilities, were as follows:
| | | | | | | | | | | | | | | | | | | | | | | | | | | | | | | | | |
| | | | | | Change
| | | | | | Change
| | | | |
| | | 2010 | | | 2010 over 2009 | | | 2009 | | | 2009 over 2008 | | | 2008 | |
| | | ($) | | | (%) | | | (%) | | | ($) | | | (%) | | | (%) | | | ($) | | | (%) | |
| | | (In millions, except percentages) | |
| |
| Taiwan | | | 2,750 | | | | 29 | | | | 168 | | | | 1,026 | | | | 21 | | | | (44 | ) | | | 1,837 | | | | 22 | |
| Korea | | | 1,768 | | | | 19 | | | | 166 | | | | 664 | | | | 13 | | | | (49 | ) | | | 1,309 | | | | 16 | |
| China | | | 1,557 | | | | 16 | | | | 145 | | | | 635 | | | | 13 | | | | (19 | ) | | | 780 | | | | 10 | |
| Japan | | | 768 | | | | 8 | | | | 7 | | | | 718 | | | | 14 | | | | (41 | ) | | | 1,218 | | | | 15 | |
| Southeast Asia | | | 578 | | | | 6 | | | | 129 | | | | 252 | | | | 5 | | | | (51 | ) | | | 516 | | | | 6 | |
| | | | | | | | | | | | | | | | | | | | | | | | | | | | | | | | | |
| Asia Pacific | | | 7,421 | | | | 78 | | | | 125 | | | | 3,295 | | | | 66 | | | | (42 | ) | | | 5,660 | | | | 69 | |
| North America(*) | | | 1,147 | | | | 12 | | | | 19 | | | | 966 | | | | 19 | | | | (36 | ) | | | 1,520 | | | | 19 | |
| Europe | | | 981 | | | | 10 | | | | 30 | | | | 753 | | | | 15 | | | | (21 | ) | | | 949 | | | | 12 | |
| | | | | | | | | | | | | | | | | | | | | | | | | | | | | | | | | |
| Total | | | 9,549 | | | | 100 | | | | 90 | | | | 5,014 | | | | 100 | | | | (38 | ) | | | 8,129 | | | | 100 | |
| | | | | | | | | | | | | | | | | | | | | | | | | | | | | | | | | |
| | | | | | | | | | | | | | | | | | | | | | | | | | | | | | | | |
| | | 2011 | | | Change
2011 over 2010 | | | 2010 | | | Change
2010 over 2009 | | | 2009 | |
| | | ($) | | | (%) | | | (%) | | | ($) | | | (%) | | | (%) | | | ($) | | | (%) | |
| | | (In millions, except percentages) | |
China | | | 2,574 | | | | 24 | | | | 65 | | | | 1,557 | | | | 16 | | | | 145 | | | | 635 | | | | 13 | |
Taiwan | | | 2,093 | | | | 20 | | | | (24 | ) | | | 2,750 | | | | 29 | | | | 168 | | | | 1,026 | | | | 21 | |
Korea | | | 1,263 | | | | 12 | | | | (29 | ) | | | 1,768 | | | | 19 | | | | 166 | | | | 664 | | | | 13 | |
Japan | | | 912 | | | | 9 | | | | 19 | | | | 768 | | | | 8 | | | | 7 | | | | 718 | | | | 14 | |
Southeast Asia | | | 592 | | | | 5 | | | | 2 | | | | 578 | | | | 6 | | | | 129 | | | | 252 | | | | 5 | |
| | | | | | | | | | | | | | | | | | | | | | | | | | | | | | | | |
Asia Pacific | | | 7,434 | | | | 70 | | | | — | | | | 7,421 | | | | 78 | | | | 125 | | | | 3,295 | | | | 66 | |
North America(*) | | | 1,963 | | | | 19 | | | | 72 | | | | 1,147 | | | | 12 | | | | 19 | | | | 966 | | | | 19 | |
Europe | | | 1,120 | | | | 11 | | | | 14 | | | | 981 | | | | 10 | | | | 30 | | | | 753 | | | | 15 | |
| | | | | | | | | | | | | | | | | | | | | | | | | | | | | | | | |
Total | | | 10,517 | | | | 100 | | | | 10 | | | | 9,549 | | | | 100 | | | | 90 | | | | 5,014 | | | | 100 | |
| | | | | | | | | | | | | | | | | | | | | | | | | | | | | | | | |
| | |
| (*) | | Primarily the United States. |
Net sales of $10.5 billion for fiscal 2011 increased 10 percent from fiscal 2010, primarily due to increased industry investment in c-Si solar equipment and higher sales of spares and refurbished semiconductor equipment.
Customers in China, North America, and Taiwan combined represented 63 percent of total net sales in fiscal 2011. Net sales of $9.5 billion for fiscal 2010 increased 90 percent from fiscal 2009, primarily due to higher sales of semiconductor equipment. Customers in Taiwan and Korea combined represented 48 percent of total net sales in fiscal 2010. Net sales decreased 38 percent to $5.0 billion in fiscal 2009 compared to fiscal 2008, as a result of significantly lower sales of equipment and services to semiconductor and display customers, partially offset by increased sales of solar manufacturing equipment. Customers in Taiwan and North America combined represented 40 percent of total net sales in fiscal 2009.
Net sales decreased 16 percent to $8.1 billion inby reportable segment for the past three fiscal 2008years were as follows:
| | | | | | | | | | | | | | | | | | | | | | | | | | | | | | | | |
| | | 2011 | | | Change
2011 over 2010 | | | 2010 | | | Change
2010 over 2009 | | | 2009 | |
| | | ($) | | | (%) | | | (%) | | | ($) | | | (%) | | | (%) | | | ($) | | | (%) | |
| | | (In millions, except percentages) | |
Silicon Systems Group | | | 5,415 | | | | 51 | | | | 2 | | | | 5,304 | | | | 56 | | | | 171 | | | | 1,960 | | | | 39 | |
Applied Global Services | | | 2,413 | | | | 23 | | | | 29 | | | | 1,865 | | | | 20 | | | | 34 | | | | 1,397 | | | | 28 | |
Display | | | 699 | | | | 7 | | | | (22 | ) | | | 899 | | | | 9 | | | | 79 | | | | 502 | | | | 10 | |
Energy and Environmental Solutions | | | 1,990 | | | | 19 | | | | 34 | | | | 1,481 | | | | 15 | | | | 28 | | | | 1,155 | | | | 23 | |
| | | | | | | | | | | | | | | | | | | | | | | | | | | | | | | | |
Total | | | 10,517 | | | | 100 | | | | 10 | | | | 9,549 | | | | 100 | | | | 90 | | | | 5,014 | | | | 100 | |
| | | | | | | | | | | | | | | | | | | | | | | | | | | | | | | | |
For fiscal 2011 as compared to fiscal 2007,2010, net sales in the Silicon Systems Group remained essentially flat while net sales in Energy and Environment Solutions and Applied Global Services increased due to decreased investment from memory and logic chip manufacturers, partially offset by increased demand from solarfor c-Si equipment, and spare parts and refurbished equipment, respectively. Net sales in Display reflected a decrease during fiscal 2011 as compared to fiscal 2010 due to a weaker LCD customers.
Gross Margin
| | | | | | | | | | | | | | | | | | | | | |
| | | | | | | | | | | | Change | |
| | | 2010 | | | 2009 | | | 2008 | | | 2010 over 2009 | | | 2009 over 2008 | |
| | | (In millions, except percentages) | | | | | | | |
| |
| Gross margin | | $ | 3,715 | | | $ | 1,431 | | | $ | 3,443 | | | $ | 2,284 | | | $ | (2,012) | |
| Gross margin (% of net sales) | | | 39 | % | | | 29 | % | | | 42 | % | | | 10 points | | | | (13) points | |
market. For fiscal 2011 as compared to fiscal 2010, the relative share of total net sales in the Silicon Systems Group decreased, while the relative share of total net sales in Energy and Environmental Solutions increased. The increase in
Energy and Environmental Solutions’ relative share of total net sales was due to increased demand for c-Si equipment.Gross Margin
Gross margins for the past three fiscal years were as follows:
| | | | | | | | | | | | | | | | | | | | |
| | | | | | | | | | | | Change | |
| | | 2011 | | | 2010 | | | 2009 | | | 2011 over 2010 | | | 2010 over 2009 | |
| | | (In millions, except percentages) | |
Gross margin | | $ | 4,360 | | | $ | 3,715 | | | $ | 1,431 | | | $ | 645 | | | $ | 2,284 | |
Gross margin (% of net sales) | | | 41 | % | | | 39 | % | | | 29 | % | | | 2 points | | | | 10 points | |
The increase in gross margin as a percentage of net sales in fiscal 2011 from fiscal 2010 was principally attributable to the absence of inventory-related charges incurred in fiscal 2010 associated with SunFab thin film solar equipment. The increase in gross margin as a percentage of net sales in fiscal 2010 from fiscal 2009 was principally attributable to higher net sales, more favorable product mix, improved factory utilization, and continued cost control measures, offset in part by inventory-related charges of $330 million associated with SunFab thin film solar equipment. These inventory-related chargesequipment, which lowered gross margin for fiscal 2010 by approximately 3 percentage points. The decrease in the gross margin percentage in fiscal 2009 from fiscal 2008 was due to lower net sales, lower-margin product mix, and reduced factory absorption, offset in part by cost control initiatives. Gross margin during fiscal 2011, 2010 and 2009 and 2008 included $48 million, $32 million $28 million and $32$28 million, respectively, of share-based compensation expense.
Research, Development and Engineering
| | | | | | | | | | | | | | | | | | | | | |
| | | | | | | | | | | | Change | |
| | | 2010 | | | 2009 | | | 2008 | | | 2010 over 2009 | | | 2009 over 2008 | |
| | | (In millions) | | | | | | | |
| |
| Research, development and engineering | | $ | 1,144 | | | $ | 934 | | | $ | 1,104 | | | $ | 210 | | | $ | (170 | ) |
Research, Development and Engineering (RD&E) expenses for the past three fiscal years were as follows:
| | | | | | | | | | | | | | | | | | | | |
| | | | | | | | | | | | Change | |
| | | 2011 | | | 2010 | | | 2009 | | | 2011 over 2010 | | | 2010 over 2009 | |
| | | (In millions) | |
Research, development and engineering | | $ | 1,118 | | | $ | 1,143 | | | $ | 934 | | | $ | (25 | ) | | $ | 209 | |
Applied’s future operating results depend to a considerable extent on its ability to maintain a competitive advantage in the equipment and service products it provides. Applied believes that it is critical to continue to make substantial investments in RD&E to assure the availability of innovative technology that meets the current and
36
projected requirements of its customers’ most advanced designs. Applied historically has maintained its commitment to investing in RD&E in order to continue to offer new products and technologies. RD&E expenses were $1.1 billion (11 percent of net sales) in fiscal 2011, $1.1 billion (12 percent of net sales) in fiscal 2010, and $934 million (19 percent of net sales) in fiscal 2009 and $1.1 billion (14 percent of net sales) in fiscal 2008.2009. RD&E expense during fiscal 2011, 2010 and 2009 and 2008 included $46 million, $43 million $50 million and $59$50 million, respectively, of share-based compensation expense. Development cycles range from 12 to 36 months depending on whether the product is an enhancement of an existing product, which typically has a shorter development cycle, or a new product, which typically has a longer development cycle. Most of Applied’s existing products resulted from internal development activities and innovations involving new technologies, materials and processes. In certain instances, Applied acquires technologies, either in existing or new product areas, to complement its existing technology capabilities and to reduce time to market.
In fiscal 2011, Applied developed logic and memory chip technologies to meet the requirements of manufacturing below the 22nm node. These systems were designed to help semiconductor customers continue their drive to pack more transistors in the same space using high-k/metal gate technologies and double patterning processes. These technologies include low k dielectrics and curing for interconnect structures and high-k dielectric materials and ALD processes for fabricating transistor gates. Applied also focused on processes to help customers build new three-dimensional (3D) gate structures. In addition, Applied continued to focus on optimizing the cost-effectiveness of through-silicon via (TSV) technologies to enable their widespread implementation. TSV technologies permit interconnecting 3D chip stacks to enable better device performance, lower power consumption and the integration of heterogeneous devices. Applied is also investing in other new product development areas such as 450mm wafer systems. In the Display sector, Applied developed deposition systems to enable larger OLED, LCD and touch-enabled displays. In solar, Applied focused on screen printing technology to keep pace with cell manufacturers’ new higher-efficiency cell designs. Another key development area was “smart” capability, which brings a new level of precision and control to the PV production process.
In fiscal 2010, Applied developed new technology to enable next-generation 22nm and below chip designs. These systems were designed to help customers continue their drive to pack more transistors in the same space using using high-k/metal gate technologies and double patterning processes. Applied also developed technology for through-silicon vias (TSVs), an emerging solution for interconnecting three dimensional chip stacks to provide better device performance, lower power consumption and the integration of heterogeneous devices.TSVs. In the solar PV area, Applied continued the development of its precision wafering and cell manufacturing products for lowering the cost of producing solar-generated electricity through advanced crystalline siliconc-Si technology.
RD&E also included activities to develop products that enable lower-cost production of solar energy, production of LED devices for display backlighting and general lighting, and other products to enable energy conservation.In fiscal 2009, Applied focused on developing systems for semiconductor customers’ new chip designs with 32nm and below geometries, including systems to enable faster transistors using strain engineering and high-k/metal gate technologies, as well as double patterning processes that enable customers to extend their existing 193nm lithography tools through additional technology generations. Applied also focused on developing technology for manufacturing next generationnext-generation displays. RD&E also included activities to develop products that enable lower-cost production of solar energy and other products to enable energy conservation.
In fiscal 2008, Applied focused on the development of processes and systems for the continued scaling of semiconductor devices. Applied pioneered a self-aligned double patterning approach that can enable 22nm and below device fabrication using conventional optical lithography. The Company also developed technology for the implementation of through-silicon vias. Efforts were also focused on developing the systems and technology to reduce thecost-per-watt of solar electricity.
Marketing, Selling, General and Administrative
| | | | | | | | | | | | | | | | | | | | | |
| | | | | | | | | | | | Change | |
| | | 2010 | | | 2009 | | | 2008 | | | 2010 over 2009 | | | 2009 over 2008 | |
| | | (In millions) | | | | | | | |
| |
| Marketing, selling, general and administrative | | $ | 942 | | | $ | 735 | | | $ | 965 | | | $ | 207 | | | $ | (230 | ) |
Selling, general and administrative (SG&A) expenses for the past three fiscal years were as follows:
| | | | | | | | | | | | | | | | | | | | |
| | | | | | | | | | | | Change | |
| | | 2011 | | | 2010 | | | 2009 | | | 2011 over 2010 | | | 2010 over 2009 | |
| | | (In millions) | |
Selling, general and administrative | | $ | 901 | | | $ | 942 | | | $ | 735 | | | $ | (41 | ) | | $ | 207 | |
The decrease in SG&A expenses for fiscal 2011 compared to fiscal 2010 reflected lower expenses as a result of the restructuring of the Energy and Environmental Solutions segment that occurred in fiscal 2010. SG&A expenses for fiscal 2011 included $19 million in transaction costs associated with the acquisition of Varian announced on May 4, 2011. SG&A expenses for fiscal 2010 included $10 million in transaction costs associated
with the acquisition of Semitool, Inc. The increase in marketing, selling, general and administrativeSG&A expenses in fiscal 2010 from fiscal 2009 reflected the elimination of temporary salary reductions and shutdowns that occurred in fiscal 2009, and the resumption of variable compensation programs. The decrease in marketing, selling, general and administrativeSG&A expenses were 9 percent of net sales in fiscal 2009 from fiscal 2008 was primarily due to cost control initiatives. Marketing, selling, general and administrative expenses were2011, 10 percent of net sales in fiscal 2010, and 15 percent of net sales in fiscal 2009, and 12 percent of net sales in fiscal 2008. Marketing, selling and general and administrative2009. SG&A expenses during fiscal 2011, 2010 and 2009 and 2008 included $52 million, $51 million $69 million and $88$69 million, respectively, of share-based compensation expense.
Restructuring and Asset Impairments
| | | | | | | | | | | | | | | | | | | | | |
| | | | | | | | | | | | Change | |
| | | 2010 | | | 2009 | | | 2008 | | | 2010 over 2009 | | | 2009 over 2008 | |
| | | (In millions) | | | | | | | |
| |
| Restructuring and asset impairments | | $ | 246 | | | $ | 156 | | | $ | 40 | | | $ | 90 | | | $ | 116 | |
DuringRestructuring and asset impairment expenses for the past three fiscal years were as follows:
| | | | | | | | | | | | | | | | | | | | |
| | | 2011 | | | 2010 | | | 2009 | | | Change | |
| | | | | | 2011 over 2010 | | | 2010 over 2009 | |
| | | (In millions) | | | | | | | |
Restructuring and asset impairments, net | | $ | (30 | ) | | $ | 246 | | | $ | 156 | | | $ | (276 | ) | | $ | 90 | |
Results for fiscal 2011 included favorable adjustments of $60 million related to restructuring program charges recorded in prior years offset in part by asset impairment charges of $30 million primarily related to certain intangible assets.
Results for fiscal 2010 included restructuring charges of $129 million related to two restructuring programs announced in fiscal 2010, and asset impairment charges of $117 million primarily related to a plan to restructure the Energy and Environmental Solutions segment.
Results for fiscal 2009 included restructuring charges of $141 million primarily associated with a restructuring program announced in fiscal 2009, and asset impairment charges of $15 million related to wafer cleaning equipment.
For further details, see Note 11 of Notes to Consolidated Financial Statements.
Gain on Sale of Facilities, net
In the first quarter of fiscal 2011, Applied received $39 million in proceeds from the sale of a property located in North America and incurred a loss of $1 million on the transaction. In the third quarter of fiscal 2010,2011, Applied announcedreceived $60 million in proceeds from the sale of another property located in North America and incurred a plan to restructure its Energygain of $28 million on the transaction.
Interest and Environmental Solutions segment. Other Expenses
Interest and other expenses for the past three fiscal years were as follows:
| | | | | | | | | | | | | | | | | | | | |
| | | 2011 | | | 2010 | | | 2009 | | | Change | |
| | | | | 2011 over 2010 | | | 2010 over 2009 | |
| | | (In millions) | | | | | | | |
Interest and other expense | | $ | 59 | | | $ | 21 | | | $ | 21 | | | $ | 38 | | | $ | — | |
The action, which was expected to impact between 400 to 500 positions globally, wasincrease in response to adverse market conditionsinterest and other expense for thin film solar, including delays in utility-scale solar adoption, solar panel
37
manufacturers’ challenges in obtaining affordable capital, changes and uncertainty in government renewable energy polices, and competitive pressurefiscal 2011 from c-Si solar technologies. During fiscal 2010 Applied recorded charges relatedwas primarily due to this plan totaling $403interest of $31 million which included inventory-related chargespayable on senior unsecured notes issued in fiscal 2011 and to fees of $247 million related to SunFab thin film solar equipment, asset impairment charges of $108 million, employee severance charges of $45 million, and other costs of $3 million.
During the first quarter of fiscal 2010, Applied announced a restructuring program to reduce its global workforce as of October 25, 2009 by approximately 1,300 to 1,500 positions, or 10 to 12 percent, over a period of 18 months. During the first quarter of fiscal 2010, Applied recorded restructuring charges of $104$8 million associated with this program. During the third quarter ofa bridge loan facility that was entered into and terminated during fiscal 2011. Interest and other expense for fiscal 2010 as a result of changes in business requirements, Applied revised its global workforce reductioncompared to approximately 1,000 positions and recorded a favorable adjustment of $20 million.
During the first quarter of fiscal 2009
Applied announced a restructuring program to reduce its global workforce by approximately 1,800 positions. During the second quarter of fiscal 2009, Applied expanded the scope of the restructuring program by approximately 200 positions. During fiscal 2009, Applied recorded restructuring charges of $143 million associated with this program. The restructuring charges consisted of employee-related costs to reduce the Company’s workforce through a combination of attrition, voluntary separationremained essentially flat.Interest and Other Income, net
Interest and other workforce reduction programs. In addition, Applied determined thatincome, net for the carrying valuepast three fiscal years was as follows:
| | | | | | | | | | | | | | | | | | | | |
| | | 2011 | | | 2010 | | | 2009 | | | Change | |
| | | | | 2011 over 2010 | | | 2010 over 2009 | |
| | | (In millions) | | | | | | | |
Interest and other income, net | | $ | 42 | | | $ | 37 | | | $ | 48 | | | $ | 5 | | | $ | (11 | ) |
The increase in interest and other income in fiscal 2011 from fiscal 2010 was primarily due to an increase in gains realized on sale of certain fixed assets to be sold exceeded the estimated fair value and, as a result, recorded a $15 million impairment charge.
During the first quarter of fiscal 2008, Applied announced a global cost reduction plan that primarily affected its Silicon Systems Group and Applied Global Services segments and related support organizations. As part of this plan, Applied reduced its global workforce through a combination of job elimination and attrition. For fiscal 2008, Applied recorded restructuring charges of $29 million relating to this plan, consisting primarily of employee related costs to reduce its workforce. The affected employees were based in North America, Europe and Asia, and represented multiple functions.
For further details, see Note 12 of Notes to Consolidated Financial Statements.
Net Interest Income
| | | | | | | | | | | | | | | | | | | | | |
| | | | | | | | | | | | Change | |
| | | 2010 | | | 2009 | | | 2008 | | | 2010 over 2009 | | | 2009 over 2008 | |
| | | (In millions) | | | | | | | |
| |
| Net interest income | | $ | 16 | | | $ | 27 | | | $ | 89 | | | $ | (11 | ) | | $ | (62 | ) |
investment securities. The decrease in
net interest income in fiscal 2010 from fiscal 2009 was primarily due to a decrease in interest rates.
Income Taxes
Income tax expenses for the past three fiscal years were as follows:
| | | | | | | | | | | | | | | | | | | | |
| | | 2011 | | | 2010 | | | 2009 | | | Change | |
| | | | | 2011 over 2010 | | | 2010 over 2009 | |
| | | (In millions, except percentages) | | | | | | | |
Provision (benefit) for income taxes | | $ | 452 | | | $ | 449 | | | $ | (181 | ) | | $ | 3 | | | $ | 630 | |
Effective income tax rate | | | 19 | % | | | 32 | % | | | (37 | )% | | | (13) points | | | | 69 points | |
The decrease in net interest income intax rate for fiscal 2009 from2011 was lower than the rate for the fiscal 2008 was2010 primarily due to a decreasean increase in interest rates. The decrease in net interest income in fiscal 2008 from fiscal 2007 was primarily due to a reduction in investmentsjurisdictions outside the U.S. with lower tax rates and a decreasefavorable U.S. Internal Revenue Service audit settlement. The tax rate for fiscal 2011 further benefited from tax incentives offered in interest rates, offset by a decreaseseveral jurisdictions and from the December 2010 reinstatement of the U.S. R&D tax credit retroactive to its prior expiration in interest expense associated with scheduled debt maturities that occurred in September 2007.
Income Taxes
| | | | | | | | | | | | | | | | | | | | | |
| | | | | | | | | | | | Change | |
| | | 2010 | | | 2009 | | | 2008 | | | 2010 over 2009 | | | 2009 over 2008 | |
| | | (In millions, except percentages) | | | | | | | |
| |
| Provision (benefit) for income taxes | | $ | 449 | | | $ | (180 | ) | | $ | 448 | | | $ | 629 | | | $ | (628) | |
| Effective income tax rate | | | 32 | % | | | (37 | )% | | | 32 | % | | | 69 points | | | | (69) points | |
December 2009. The change in the fiscal 2010 tax rate from the fiscal 2009 rate was principally attributable to the income before taxes for fiscal 2010 as opposed to the net loss before taxes incurred in fiscal 2009. The effective income tax rate for fiscal 2010 did not include the impact of the U.S. R&D tax credit from the time it expired in December 2009. In the event the U.S. R&D tax credit is enacted on a retroactive basis, there would be a favorable impact to Applied’s effective income tax rate in the period enacted. The change in the fiscal 2009 tax rate from the fiscal 2008 rate was
38
principally attributable to the net loss before taxes incurred in fiscal 2009. Applied’s effective income tax rate depends on various factors, such as tax legislation, and the geographic composition of Applied’s pre-tax income.
Applied reports financial results in four segments: Silicon Systems Group, Applied Global Services, Display, and Energy and Environmental Solutions. A description of the products and services, as well as financial data, for each reportable segment can be found in Note 1716 of Notes to Consolidated Condensed Financial Statements. Applied does not allocate to its reportable segments certain operating expenses that it manages separately at the corporate level. These unallocated costs include costs for share-based compensation; certain management, finance, legal, human resources, and RD&E functions provided at the corporate level; and unabsorbed information technology and occupancy. In addition, Applied does not allocate to its reportable segments restructuring and asset impairment charges and any associated adjustments related to restructuring actions, unless these charges or adjustments pertain to a specific reportable segment.
Effective in the first quarter of fiscal 2010, Applied changed its methodology for allocating certain expenses to its reportable segments, such as components of variable compensation and operating expenses associated with the global sales organization. Applied has reclassified segment operating results for fiscal 2009 and 2008 to conform to the fiscal 2010 presentation.
The results for each reportable segment are discussed below.
Silicon Systems Group Segment
The Silicon Systems Group segment includes semiconductor capital equipment for deposition, etch, rapid thermal processing, chemical mechanical planarization, metrology and inspection, and wafer packaging. Development efforts are focused on solving customers’ key technical challenges, including transistor performance and nanoscale patterning, and improving chip manufacturing productivity to reduce costs.
Certain significant measures for the past three fiscal years were as follows:
| | | | | | | | | | | | | | | | | | | | | | | | | | | | | |
| | | | | | | | | | | | Change | |
| | | 2010 | | | 2009 | | | 2008 | | | 2010 over 2009 | | | 2009 over 2008 | |
| | | (In millions, except percentages) | |
| |
| New orders | | $ | 5,759 | | | $ | 1,677 | | | $ | 4,092 | | | $ | 4,082 | | | | 243 | % | | $ | (2,415 | ) | | | (59) | % |
| Net sales | | | 5,304 | | | | 1,960 | | | | 4,005 | | | | 3,344 | | | | 171 | % | | | (2,045 | ) | | | (51) | % |
| Operating income | | | 1,892 | | | | 201 | | | | 1,229 | | | | 1,691 | | | | 841 | % | | | (1,028 | ) | | | (84) | % |
| Operating margin | | | 36 | % | | | 10 | % | | | 31 | % | | | | | | | 26 points | | | | | | | | (21) points | |
| | | | | | | | | | | | | | | | | | | | | | | | | | | | |
| | | 2011 | | | 2010 | | | 2009 | | | Change | |
| | | | | 2011 over 2010 | | | 2010 over 2009 | |
| | | (In millions, except percentages) | |
New orders | | $ | 5,489 | | | $ | 5,759 | | | $ | 1,677 | | | $ | (270 | ) | | | (5)% | | | $ | 4,082 | | | | 243% | |
Net sales | | | 5,415 | | | | 5,304 | | | | 1,960 | | | | 111 | | | | 2% | | | | 3,344 | | | | 171% | |
Operating income | | | 1,764 | | | | 1,892 | | | | 201 | | | | (128 | ) | | | (7)% | | | | 1,691 | | | | 841% | |
Operating margin | | | 33 | % | | | 36 | % | | | 10 | % | | | | | | | (3) points | | | | | | | | 26 points | |
New orders for the Silicon Systems Group by end use application for the past three fiscal years were as follows:
| | | | | | | | | | | | |
| | | 2011 | | | 2010 | | | 2009 | |
Foundry | | | 47 | % | | | 41 | % | | | 33 | % |
Memory | | | 28 | % | | | 43 | % | | | 38 | % |
Logic and other | | | 25 | % | | | 16 | % | | | 29 | % |
| | | | | | | | | | | | |
| | | 100 | % | | | 100 | % | | | 100 | % |
| | | | | | | | | | | | |
The following region accounted for at least 30 percent of total net sales for the Silicon Systems Group segment for one or more of the past three fiscal years:
| | | | | | | | | | | | | | | | | | | | | | | | | | | | |
| | | 2011 | | | 2010 | | | 2009 | | | Change | |
| | | | | | 2011 over 2010 | | | 2010 over 2009 | |
| | | (In millions, except percentages) | |
Taiwan | | $ | 1,309 | | | $ | 1,976 | | | $ | 508 | | | $ | (667 | ) | | | (34 | )% | | $ | 1,468 | | | | 289 | % |
In fiscal 2011, customers in Taiwan accounted for 24 percent of total net sales for the Silicon Systems Group segment compared to 37 percent in fiscal 2010, and 26 percent in fiscal 2009.
Fiscal 2011 financial results reflected decreased demand for semiconductor manufacturing equipment compared to fiscal 2010, particularly in the second half of fiscal 2011, due primarily to uncertain global economic conditions. In the fourth quarter of fiscal 2011, new orders were $925 million, a decrease of 25 percent compared to the prior quarter. For fiscal 2011, new orders decreased by $270 million to $5.5 billion compared to fiscal 2010. The decrease in new orders was primarily due to reduced demand from memory customers. Net sales increased by $111 million to $5.4 billion for fiscal 2011 compared to fiscal 2010. The increase in net sales was primarily due to increased investment by logic customers. Three customers accounted for 52 percent of net sales in this segment in fiscal 2011. Approximately 45 percent of net sales in the fourth quarter of fiscal 2011 were for orders received and shipped within the quarter, down from 49 percent in the third quarter of fiscal 2011. The book to bill ratio (new orders divided by net sales) decreased to 1.0 for fiscal 2011, reflecting decreased demand, compared to 1.1 for fiscal 2010. Operating income in fiscal 2011 was $1.8 billion, a decrease of $128 million from the prior year. The decrease was due in part to a settlement agreement between Applied and Samsung Electronics Co., Ltd (Samsung) that provided for volume-based rebates and other incentives to Samsung. The decrease was also due to operating expenses incurred as a result of headcount increases during fiscal 2011. In 2011, Applied introduced the Applied Centura Conforma system which uses conformal plasma doping technology to modify the electrical properties of 3D and planar transistor structures.
Fiscal 2010 financial results reflected increased demand for manufacturing equipment over fiscal 2009 due to improved global economic and industry conditions. New orders increased by $4.1 billion to $5.8 billion for fiscal 2010 compared to fiscal 2009. The significant increase in new orders was primarily from memory and foundry customers and to a lesser extent logic customers, which reflected the general recovery in the semiconductor equipment industry. The majority of fiscal 2010 new orders were for customers’ capacity expansions, while fiscal 2009 orders were primarily for customers’ new technology investments. Net sales increased by $3.3 billion to $5.3 billion forin fiscal 2010 compared to fiscal 2009. The increase in net sales was primarily due to increased investment by memory and foundry customers. Four customers accounted for 51 percent of net sales in this segment in fiscal 2010. Approximately 61 percent of net sales in the fourth quarter of fiscal 2010 were for orders received and shipped within the quarter. The book to bill ratio (new orders divided by net sales) increased to 1.1 for fiscal 2010, reflecting increased demand, compared to 0.9 for fiscal 2009. Operating income increased by $1.7 billion to $1.9 billion for fiscal 2010 compared to fiscal 2009. The increase in operating income for fiscal 2010 was due to considerably higher revenue from semiconductor equipment sales and reflected the general recovery in the semiconductor equipment industry during fiscal 2010. Results for fiscal 2010 included Semitool, which was acquired by Applied during the first quarter of fiscal 2010. In 2010, Applied introduced its Applied Reflexion GT CMP system, for fabricating copper interconnects and its Applied Centura AdvantEdgetm Mesatm silicon etch system for fabricating nano-scale circuit features with angstrom-level precision.
The Company also introduced the Applied Producer Eternatm
39
FCVDEternaFCVD system, which is targeted for 20nm and below chips and delivers a liquid-like film that flows freely into virtually any structure to provide void-free dielectric fill.
Fiscal 2009 financial results reflected significantly reduced demand for manufacturing equipment due to extremely unfavorable global economic and industry conditions. Silicon Systems Group new orders decreased 59 percentby $2.4 billion to $1.7 billion in fiscal 2009 compared to fiscal 2008. The decrease in new orders reflected significantly lower demand, primarily from memory and logic customers. Net sales decreased 51 percentby $2.0 billion to $2.0 billion in fiscal 2009 compared to fiscal 2008. The decrease in net sales was due to decreased capital investments, primarily by memory customers. The book to bill ratio decreased to 0.9 for fiscal 2009, reflecting significantly decreased demand, compared to 1.0 for fiscal 2008. Operating income decreased 84 percentby $1.0 billion to $201 million in fiscal 2009 compared to fiscal 2008. The decrease in operating income was due to significantly lower sales resulting in lower factory absorption, partially offset by lower operating expenses from cost control initiatives. Operating income for fiscal 2009 also reflected an increase in bad debt expense. After an operating loss in the first half of fiscal 2009, the Silicon Systems Group returned to operating profitability during the second half of the year, which was primarily driven by sales to foundry customers. During the year, the Company introduced a new platform specifically designed for under-bump metallization (UBM) and other back-end processes, the Applied Charger UBM PVD system.
Fiscal 2008 financial results reflected reduced demand for manufacturing equipment due to less favorable industry conditions. Fiscal 2008 Silicon Systems Group new orders decreased 38 percent to $4.1 billion compared to fiscal 2007. The decrease in new orders was due to reduced demand for equipment from logic, memory and foundry customers. Net sales decreased 38 percent to $4.0 billion in fiscal 2008 compared to fiscal 2007. The decrease in net sales was due to decreased investment by logic and memory customers. Operating income decreased 48 percent to $1.2 billion in fiscal 2008 compared to fiscal 2007. The decrease in operating income was due to significantly lower revenue levels from the slowdown in the semiconductor equipment industry, partially offset by lower operating expenses attributable to continued focus on cost controls and improvement in manufacturing activities. In fiscal 2008, the Company launched two products for photomask applications: the Applied Aera2 Mask Inspection system, which detects critical defects on a photomask, and the Applied Tetra Reticle Clean system, which cleans 32nm and below photomasks using wet clean chemistry. The Company also introduced the Applied Producer eHARP system for depositing films in high aspect ratio device structures.
Applied Global Services Segment
The Applied Global Services segment encompasses technically differentiated products, including spares, services, certain earlier generation equipment products, and remanufactured equipment, to improve operating efficiency, reduce operating costs, and lessen the environmental impact of semiconductor, display and solar customers’ factories. Customer demand for products and services is fulfilled through a global distribution system with trained service engineers located in close proximity to customer sites.
In fiscal 2010, as part of the restructuring of the Energy and Environmental Solutions segment, Applied discontinued sales to new customers of its fully-integrated SunFab thin film solar production lines but continued to offer individual tools for thin film solar manufacturing. Applied is supporting existing SunFab customers with services, upgrades and capacity increases through its Applied Global Services segment as these products are considered to have reached a particular stage in the product lifecycle and, effective in the first quarter of fiscal 2011, Applied accounts for these products under its Applied Global Services segment.
Certain significant measures for the past three fiscal years were as follows:
| | | | | | | | | | | | | | | | | | | | | | | | | | | | | |
| | | | | | | | | | | | Change | |
| | | 2010 | | | 2009 | | | 2008 | | | 2010 over 2009 | | | 2009 over 2008 | |
| | | (In millions, except percentages) | |
| |
| New orders | | $ | 2,183 | | | $ | 1,179 | | | $ | 2,249 | | | $ | 1,004 | | | | 85 | % | | $ | (1,070 | ) | | | (48) | % |
| Net sales | | | 1,865 | | | | 1,397 | | | | 2,329 | | | | 468 | | | | 34 | % | | | (932 | ) | | | (40) | % |
| Operating income | | | 337 | | | | 115 | | | | 545 | | | | 222 | | | | 193 | % | | | (430 | ) | | | (79) | % |
| Operating margin | | | 18 | % | | | 8 | % | | | 23 | % | | | | | | | 10 points | | | | | | | | (15) points | |
| | | | | | | | | | | | | | | | | | | | | | | | | | | | |
| | | 2011 | | | 2010 | | | 2009 | | | Change | |
| | | | | 2011 over 2010 | | | 2010 over 2009 | |
| | | (In millions, except percentages) | |
New orders | | $ | 2,333 | | | $ | 2,183 | | | $ | 1,179 | | | $ | 150 | | | | 7% | | | $ | 1,004 | | | | 85% | |
Net sales | | | 2,413 | | | | 1,865 | | | | 1,397 | | | | 548 | | | | 29% | | | | 468 | | | | 34% | |
Operating income | | | 482 | | | | 337 | | | | 115 | | | | 145 | | | | 43% | | | | 222 | | | | 193% | |
Operating margin | | | 20 | % | | | 18 | % | | | 8 | % | | | | | | | 2 points | | | | | | | | 10 points | |
Fiscal 2011 financial results reflected increased demand for services over fiscal 2010. In the fourth quarter of fiscal 2011, new orders were $564 million, a decrease of 8 percent compared to the prior quarter. For fiscal 2011, new orders increased by $150 million to $2.3 billion compared to fiscal 2010. The increase in new orders was due primarily to higher demand for spare parts and refurbished equipment. Net sales increased by $548 million to $2.4 billion for fiscal 2011, a record for the segment, compared to fiscal 2010. The increase in net sales was primarily due to higher sales in spare parts and refurbished equipment and included $71 million in sales for two thin film solar projects. The book to bill ratio decreased to 1.0 for fiscal 2011, compared to 1.2 for fiscal 2010. The decrease for fiscal 2011 reflected a higher increase in net sales year-over-year relative to demand. Operating income increased by $145 million to $482 million for fiscal 2011 compared to fiscal 2010. The increase in operating income for fiscal 2011 primarily reflected increased sales of spare parts and refurbished equipment.
Fiscal 2010 financial results reflected increased demand for manufacturing services over fiscal 2009 due to improved global economic and industry conditions. New orders increased by $1.0 billion to $2.2 billion for fiscal 2010 compared to fiscal 2009. The increase in new orders was due primarily to higher demand for spare parts and refurbished equipment, reflecting customers’ higher factory utilization rates. Net sales increased by $468 million to $1.9 billion for fiscal 2010 compared to fiscal 2009. The increase in net sales was primarily due to higher sales in spare parts. The book to bill ratio increased to 1.2 for fiscal 2010, reflecting increased demand, compared to 0.8 for
40
fiscal 2009. Operating income increased by $222 million to $337 million for fiscal 2010 compared to fiscal 2009. The increase in operating income for fiscal 2010 primarily reflected increased sales of spare parts.
Fiscal 2009 financial results reflected significantly reduced demand for manufacturing services due to extremely unfavorable global economic and industry conditions, as well as a significant reduction in the installed base of 200mm systems. New orders decreased 48 percentby $1.1 billion to $1.2 billion in fiscal 2009 compared to fiscal 2008, due primarily to decreased demand for spares and refurbished equipment arising from semiconductor manufacturers’ low wafer production volumes. Net sales decreased 40 percentby $932 million to $1.4 billion in fiscal 2009 compared to fiscal 2008, reflecting lower sales of spares and refurbished equipment. Operating income decreased 79 percentby $430 million to $115 million in fiscal 2009 compared to fiscal 2008 as a result of lower sales volumes, which led to lower infrastructure cost absorption, partially offset by lower operating expenses from cost control initiatives. Operating income for fiscal 2009 also included an increase in bad debt expense. In the second half of fiscal 2009, the Applied Global Services segment returned to operating profitability as sales of spares improved. The book to bill ratio decreased to 0.8 for fiscal 2009, reflecting significantly decreased demand, compared to 1.0 for fiscal 2008.
Fiscal 2008 financial results reflected reduced demand for manufacturing services due to less favorable industry conditions. Fiscal 2008 results were impacted by lower levels of semiconductor and display customers’ factory utilization. New orders decreased 10 percent to $2.2 billion in fiscal 2008 compared to fiscal 2007, due to lower orders for spares, fab-wide services, and refurbished equipment, partially offset by increased orders for service and system enhancements. Net sales decreased 1 percent to $2.3 billion in fiscal 2008 compared to fiscal 2007. The net sales decrease reflected lower sales of fab-wide services and spares, offset by increased sales in services and system enhancements. Operating income decreased 9 percent to $545 million in fiscal 2008 compared to fiscal 2007 due to higher operating expenses in fiscal 2008.
The Display segment encompasses products for manufacturing LCDs for TVs, personal computers (PCs), tablet PCs, smart phones, and other video-enabledconsumer-oriented devices. The businesssegment is focused on expanding market share by differentiation with larger-scale substrates, entry into new markets such as the LTPS and touch panel sectors, and development of products to enable cost reductions through productivity and uniformity.
Certain significant measures for the past three fiscal years were as follows:
| | | | | | | | | | | | | | | | | | | | | | | | | | | | | |
| | | | | | | | | | | | Change | |
| | | 2010 | | | 2009 | | | 2008 | | | 2010 over 2009 | | | 2009 over 2008 | |
| | | (In millions, except percentages) | |
| |
| New orders | | $ | 799 | | | $ | 287 | | | $ | 1,486 | | | $ | 512 | | | | 179 | % | | $ | (1,199 | ) | | | (81) | % |
| Net sales | | | 899 | | | | 502 | | | | 976 | | | | 397 | | | | 79 | % | | | (474 | ) | | | (49) | % |
| Operating income | | | 267 | | | | 51 | | | | 301 | | | | 216 | | | | 424 | % | | | (250 | ) | | | (83) | % |
| Operating margin | | | 30 | % | | | 10 | % | | | 31 | % | | | | | | | 20 points | | | | | | | | (21) points | |
| | | | | | | | | | | | | | | | | | | | | | | | | | | | |
| | | 2011 | | | 2010 | | | 2009 | | | Change | |
| | | | | 2011 over 2010 | | | 2010 over 2009 | |
| | | (In millions, except percentages) | |
New orders | | $ | 636 | | | $ | 799 | | | $ | 287 | | | $ | (163 | ) | | | (20)% | | | $ | 512 | | | | 179% | |
Net sales | | | 699 | | | | 899 | | | | 502 | | | | (200 | ) | | | (22)% | | | | 397 | | | | 79% | |
Operating income | | | 147 | | | | 267 | | | | 51 | | | | (120 | ) | | | (45)% | | | | 216 | | | | 424% | |
Operating margin | | | 21 | % | | | 30 | % | | | 10 | % | | | | | | | (9) points | | | | | | | | 20 points | |
The following regions accounted for at least 30 percent of total net sales for the Display segment for one or more of the past three fiscal years:
| | | | | | | | | | | | | | | | | | | | | | | | | | | | |
| | | 2011 | | | 2010 | | | 2009 | | | Change | |
| | | | | | 2011 over 2010 | | | 2010 over 2009 | |
| | | (In millions, except percentages) | |
China | | $ | 330 | | | $ | 162 | | | $ | 53 | | | $ | 168 | | | | 104 | % | | $ | 109 | | | | 206 | % |
Taiwan | | $ | 216 | | | $ | 311 | | | $ | 165 | | | $ | (95 | ) | | | (31) | % | | $ | 146 | | | | 88 | % |
Korea | | $ | 111 | | | $ | 334 | | | $ | 144 | | | $ | (223 | ) | | | (67) | % | | $ | 190 | | | | 132 | % |
In fiscal 2011, customers in China accounted for 47 percent of total net sales for the Display segment compared to 18 percent in fiscal 2010, and 11 percent in fiscal 2009. Customers in Taiwan accounted for 31 percent of total net sales for the segment in fiscal 2011 compared to 35 percent in fiscal 2010, and 33 percent in fiscal 2009. Customers in Korea accounted for 16 percent of total net sales for the Display segment in fiscal 2011 compared to 37 percent in fiscal 2010, and 29 percent in fiscal 2009.
Fiscal 2011 operating financial results reflected a cyclical downturn in demand for equipment to manufacture LCD products that resulted in an extremely low level of orders in the fourth quarter of fiscal 2011. In the fourth quarter of fiscal 2011, new orders were $20 million, a decrease of 91 percent compared to the prior quarter. For fiscal 2011, new orders decreased by $163 million to $636 million compared to fiscal 2010. The decrease in new orders reflected customers’ decisions to delay investment in new LCD TV capacity, which was partially offset by increased demand for LTPS and touch panel systems, although this demand also softened in the fourth quarter of fiscal 2011 as an initial build-out of manufacturing capacity was absorbed. Net sales decreased by $200 million to $699 million for fiscal 2011 compared to fiscal 2010. The decrease in net sales reflected a decline in spending for LCD TV products, as customers delayed their investments, including plans for manufacturing in China, partially offset by increased demand for equipment to manufacture new mobile devices like smart phones and tablets. The book to bill ratio remained flat at 0.9 for fiscal 2011. Operating income decreased by $120 million to $147 million for fiscal 2011 compared to fiscal 2010. The decrease in operating income for fiscal 2011 reflected an unfavorable product mix. Three customers accounted for 54 percent of net sales for the Display segment in fiscal 2011. The decrease in operating margin in fiscal 2011 compared to fiscal 2010 was due to changes in product mix. In 2011, the Company introduced the Applied AKT-20K PX PECVD system for manufacturing high-performance OLED and LCD displays and the Applied AKT-AristoTwin system for manufacturing touch-enabled displays.
Fiscal 2010 operating financial results reflected increased demand for LCD equipment over fiscal 2009 due to improved global economic and industry conditions. New orders increased by $512 million to $799 million for fiscal 2010 compared to fiscal 2009. The increase in new orders reflected the general recovery in the LCD market, as customers increased production levels in response to strong end-demand for flat panel TVs and notebook computers. Net sales increased by $397 million to $899 million for fiscal 2010 compared to fiscal 2009. The increase in net sales reflected strong market demand for LCD products. Five customers accounted for 71 percent of net sales for the Display segment in fiscal 2010. The book to bill ratio increased to 0.9 for fiscal 2010, reflecting increased demand, compared to 0.6 for fiscal 2009. Operating income increased by $216 million to $267 million for fiscal 2010 compared to fiscal 2009. The increase in operating income was due to a significant increase in net sales and improved gross margin driven by an increase in volume.
Fiscal 2009 financial results reflected significantly reduced demand for LCD equipment due to extremely unfavorable global economic and industry conditions. New orders decreased significantly to $287 million in fiscal 2009 compared to $1.5 billion in fiscal 2008, which reflected the slowdown in the display industry from fiscal 2008 when display manufacturers added capacity. Net sales decreased 49 percentby $474 million to $502 million in fiscal 2009 compared
41
to fiscal 2008 as a result of significantly lower orders. Operating income decreased to $51 million in fiscal 2009 from $301 million in fiscal 2008. Operating income decreased due to significantly lower revenue, partially offset by lower operating expenses due to cost control initiatives. The book to bill ratio decreased to 0.6 for fiscal 2009, reflecting significantly decreased demand, compared to 1.5 for fiscal 2008.
Fiscal 2008 financial results reflected increased demand for LCD equipment over fiscal 2007. In fiscal 2008, new orders increased significantly to $1.5 billion compared to $273 million in fiscal 2007. Increased orders were due to substantial increases in demand by Display customers in response to strong end-product demand. This demand for LCD equipment reached an inflection point in the third quarter of fiscal 2008 and decreased significantly in the fourth quarter of fiscal 2008, reflecting the volatility of the display industry. Net sales increased 38 percent to $976 million in fiscal 2008 compared to fiscal 2007, primarily due to customers’ investment in Gen-8 products. Operating income increased to $301 million in fiscal 2008 from $159 million in fiscal 2007. Operating income increased due to higher revenue levels, product mix and lower operating costs. In fiscal 2008, the Company introduced its Gen-10 systems that can process substrates sized at approximately 2.85 x 3.05 meters. These systems include the AKT-90K PECVD and AKT-90K EBT products.
Energy and Environmental Solutions Segment
The Energy and Environmental Solutions segment includes products for fabricating thin film and c — c–Si solar PVs, high throughputroll-to-roll coating systems for flexible electronics, and web products, and systems used in the manufacture of energy-efficient glass.products. This business is focused on delivering solutions to generate and conserve energy, with an emphasis on lowering the cost to produce solar power by providing equipment to enhance manufacturing scale and efficiency.
Until the first quarter of fiscal 2011, the Energy and Environmental Solutions segment included the fully-integrated SunFab production line for manufacturing thin film solar panels. During the third quarter of fiscal 2010, Applied announced a plan to restructure its Energy and Environmental Solutions segment in response to adverse market conditions for thin film solar and as a result, Applied discontinued sales of SunFab lines to new customers, but is offering individual tools for thin film solar manufacturing. Applied is supporting existing SunFab line customers with services, upgrades and capacity increases through its Applied Global Services segment, and effective in the first quarter of fiscal 2011, Applied accounts for these products under its Applied Global Services segment.Certain significant measures for the past three fiscal years were as follows:
| | | | | | | | | | | | | | | | | | | | | | | | | | | | |
| | | 2011 | | | 2010 | | | 2009 | | | Change | |
| | | | | 2011 over 2010 | | | 2010 over 2009 | |
| | | (In millions, except percentages) | |
New orders | | $ | 1,684 | | | $ | 1,508 | | | $ | 955 | | | $ | 176 | | | | 12% | | | $ | 553 | | | | 58% | |
Net sales | | | 1,990 | | | | 1,481 | | | | 1,155 | | | | 509 | | | | 34% | | | | 326 | | | | 28% | |
Operating income (loss) | | | 453 | | | | (466 | ) | | | (234 | ) | | | 919 | | | | 197% | | | | (232 | ) | | | (99%) | |
Operating margin | | | 23 | % | | | (31 | %) | | | (20 | %) | | | | | | | 54 points | | | | | | | | (11) points | |
The following regions accounted for at least 30 percent of total net sales for the Energy and Environmental Solutions segment for one or more of the past three fiscal years:
| | | | | | | | | | | | | | | | | | | | | | | | | | | | |
| | | 2011 | | | 2010 | | | 2009 | | | Change | |
| | | | | | 2011 over 2010 | | | 2010 over 2009 | |
| | | (In millions, except percentages) | |
China | | $ | 1,584 | | | $ | 935 | | | $ | 442 | | | $ | 649 | | | | 69 | % | | $ | 493 | | | | 112 | % |
Europe | | $ | 58 | | | $ | 372 | | | $ | 452 | | | $ | (314 | ) | | | (84) | % | | $ | (80 | ) | | | (18 | %) |
In fiscal 2011, customers in China accounted for 80 percent of total net sales for the Energy and Environmental Solutions segment compared to 63 percent in fiscal 2010 and 38 percent in fiscal 2009. Customers in Europe accounted for 3 percent of total net sales for the segment in fiscal 2011 compared to 25 percent in fiscal 2010, and 39 percent in fiscal 2009.
Fiscal 2011 financial results reflected increased demand for c-Si products in the first half of the year, which rapidly declined in the second half of fiscal 2011 due to excess manufacturing capacity and customers’ decreased access to capital. In the fourth quarter of fiscal 2011, new orders were $86 million, a decrease of 73 percent compared to the prior quarter. For fiscal 2011, new orders increased by $176 million to $1.7 billion compared to fiscal 2010. The increase in new orders for fiscal 2011 reflected significantly increased demand for c-Si equipment, particularly wafering and metallization products. The increased demand was partially driven by government incentives for solar. Net sales increased by $509 million to $2.0 billion for fiscal 2011 compared to fiscal 2010. The increase in net sales for fiscal 2011 primarily reflected higher sales to c-Si customers. Net sales in fiscal 2010 included $539 million from sales of SunFab thin film lines. There were no sales of SunFab thin film lines recognized in the Energy and Environmental Solutions segment in fiscal 2011. In fiscal 2011, customers in China accounted for an increased proportion of the Energy and Environment Solutions segment’s results compared to prior years, including 78 percent of new orders. The book to bill ratio decreased to 0.8 for fiscal 2011 compared to 1.0 for fiscal 2010. The decrease for fiscal 2011 reflected a higher increase in net sales year-over-year relative to demand. The Energy and Environmental Solutions segment reported operating income of $453 million for fiscal 2011 compared to an operating loss of $466 million for fiscal 2010. Operating loss for fiscal 2010 included charges totaling $486 million associated with the Energy and Environmental Solutions restructuring plan announced in July 2010. The increase in operating income for fiscal 2011 was also attributable to significantly higher net sales of c-Si equipment and included favorable adjustments of $36 million related to the restructuring program announced in the third quarter of fiscal 2010. The increase in operating margin for fiscal 2011 was due to higher manufacturing volume for c-Si equipment. In 2011, the Applied Baccini Pegaso platform for next-generation solar cell manufacturing was introduced.
In fiscal 2010, Applied incurred charges of $486 million that included a plan to restructure its Energy and Environmental Solutions segment as described above, and consistedconsisting of inventory-related charges of $330 million related to SunFab thin film solar equipment, asset impairment charges of $108 million, employee severance charges of $45 million, and other costs of $3 million.
Certain significant measures for the past three fiscal years were as follows:
| | | | | | | | | | | | | | | | | | | | | | | | | | | | | |
| | | | | | | | | | | | Change | |
| | | 2010 | | | 2009 | | | 2008 | | | 2010 over 2009 | | | 2009 over 2008 | |
| | | (In millions, except percentages) | |
| |
| New orders | | $ | 1,508 | | | $ | 955 | | | $ | 1,329 | | | $ | 553 | | | | 58 | % | | $ | (374 | ) | | | (28) | % |
| Net sales | | | 1,481 | | | | 1,155 | | | | 819 | | | | 326 | | | | 28 | % | | | 336 | | | | 41 | % |
| Operating income | | | (466 | ) | | | (234 | ) | | | (206 | ) | | | (232 | ) | | | (99) | % | | | (28 | ) | | | (14) | % |
| Operating margin | | | (31 | )% | | | (20 | )% | | | (25 | )% | | | | | | | (11) points | | | | | | | | 5 points | |
Fiscal 2010 financial results compared to fiscal 2009 reflected increased demand for c-Si products, offset by reduced demand for SunFab thin film solar manufacturing lines due to the challenging market conditions for utility-scale solar. New orders increased 58 percentby $553 million to $1.5 billion for fiscal 2010 compared to fiscal 2009. The increase in orders reflected increased demand for c-Si products, particularly wafering and metallization products, offset by reduced demand for SunFab lines. Net sales increased 28 percentby $326 million to $1.5 billion for
fiscal 2010 compared to fiscal 2009. Net sales for fiscal 2010 primarily reflected higher sales to c-Si customers than in fiscal 2009. The relative share of the segment’s net sales attributable to SunFab customers decreased to 36 percent in fiscal 2010 from 44 percent in fiscal 2009. For fiscal 2010, customers in China and Europe accounted for 88 percent of total net sales in this segment. The book to bill ratio increased to 1.0 for fiscal 2010 compared to 0.8 for fiscal 2009. The operating loss in the Energy and Environmental Solutions segment increased by $232 million to $466 million for fiscal 2010 compared to fiscal 2009. The increase in operating loss was primarily due to restructuring, asset impairment and inventory-related charges of $486 million recognized in the second and third quarters of fiscal 2010, and lower net sales to SunFab customers, partially offset by increased sales of c-Si products and cost control initiatives. Results for the fourth quarter of fiscal 2010 reflected customer final acceptance of two SunFab lines.
Fiscal 2009 financial results reflected reduced demand for c-Si products over fiscal 2008 offset in part by higher demand for SunFab lines. New orders of $955 million in fiscal 2009 decreased from $1.3 billion in fiscal 2008. The decrease in new orders was primarily due to decreased demand from c-Si customers and reflected the
42
challenging global economic environment, solar manufacturers’ difficulties in obtaining cost-effective capital, and a decrease in end demand. Net sales of $1.2 billion in fiscal 2009 increased from $819 million in fiscal 2008 due to an increase in sales for SunFab lines. The operating loss of $234 million in fiscal 2009 increased from $206 million in fiscal 2008 due to an increase in RD&E expenses and unfavorable gross margins associated with initial SunFab linestart-ups, offset in part by cost control initiatives. In 2009, the Company introduced its Baccini Esatto Technology, a high precision, multi-step printing capability designed to increase the efficiency of c-Si solar cells. The book to bill ratio decreased to 0.8 for fiscal 2009, reflecting significantly decreased demand, compared to 1.6 for fiscal 2008.
Fiscal 2008 financial results reflected increased demand for In 2009, Applied introduced its Baccini Esatto Technology, a high precision, multi-step printing capability designed to increase the efficiency of c-Si
products over fiscal 2007solar cells.Business Combinations
On May 4, 2011, Applied and Varian Semiconductor Equipment Associates, Inc. (Varian), a public company manufacturer of semiconductor processing equipment and the recognitionleading supplier of ordersion implantation equipment used by chip makers around the world, announced the signing of a definitive merger agreement dated May 3, 2011, under which Applied agreed to acquire Varian for the SunFab line beginning$63 per share in fiscal 2008. New orderscash.
In November 2011, Applied completed its acquisition of $1.3 billion in fiscal 2008 increased from $245 million in fiscal 2007. The increase in new orders was primarily due to the recognition of orders for the SunFab line beginningVarian. Beginning in the first quarter of fiscal 2008,2012, the acquired business will be included in results for the Silicon Systems Group and Applied Global Services segments.
The aggregate purchase price of the acquisition was approximately $4.2 billion, net of cash acquired, and is expected to result in an increase in goodwill of approximately $2.5 billion and intangible assets of up to $1.5 billion. Applied funded the transaction with a combination of existing cash balances and debt. On June 8, 2011, Applied issued senior unsecured notes (the Notes) in the aggregate principal amount of $1.75 billion and used the net proceeds of the Notes to fund a portion of the consideration and certain costs associated with the acquisition. The indenture governing the Notes includes certain covenants with which Applied was in compliance at October 30, 2011. See Note 10 of Notes to 5 Financial Statements for additional discussion of long-term debt.
Varian designs, markets, manufactures and services ion implantation systems. These systems are primarily used in the manufacture of transistors, which are a basic building block of ICs or microchips. Ion implantation systems create a beam of electrically charged particles called ions, which are implanted into transistor structures at precise locations and depths, changing the electrical properties of the semiconductor device. These implantation systems may also be used in other areas of IC manufacture for modifying the material properties of the semiconductor devices, as well as growth in orders for c-Si products. Net sales of $819 million in fiscal 2008 increased from $165 million in fiscal 2007 due to customers’ investment in c-Si products from the acquisitions of HCTmanufacturing crystalline-silicon solar cells and Baccini, in addition to increased sales across all other products in the segment. The increase in net sales for fiscal 2008 included the first revenue recognition of a SunFab line. The operating loss of $206 million in fiscal 2008 increased from $89 million in fiscal 2007. The increase in operating loss reflected increased RD&E spending to develop products that enable lower-cost production of solar energy, increased operating costs, amortization of acquisition-related costs, and costs related to expansion of solar marketing efforts, partially offset by higher revenues.
Subsequent Event
On November 29, 2010, Applied entered into a Settlement Agreement (the Agreement) with Samsung Electronics Co., Ltd. (Samsung). The Agreement resolved potential civil claims and removed the risk of civil litigation between the parties relating to the alleged acquisition, misappropriation and misuse of Samsung confidential semiconductor information in Korea that is the subject of criminal proceedings pending against employees of several companies, including current and former Applied Materials Korea employees, in the Seoul Eastern District Court of the Republic of Korea (the Korea proceedings). Neither Applied nor any of its subsidiaries is a defendant in the Korea proceedings. The settlement terms of the Agreement pertain to potential civil claims between the parties and are separate from and do not affect criminal proceedings against individual defendants, including but not limited to the individuals charged in the Korea proceedings.
Under the Agreement, which is generally effective for a three-year period starting November 1, 2010, Applied will provide volume-based rebates on purchases of semiconductor products by Samsung and its affiliated companies. Applied also will provide volume-based incentives related to Samsung’s use of Applied systems (i) for production of semiconductor devices in applications for which Samsung has not previously used Applied systems, and (ii) for joint development activities. In addition, the Agreement includes volume-based credits for certain upgrades, engineering services and spare parts. The financial impact of the above rebates and incentives on Applied’s consolidated results of operations and financial position will depend on the volume of purchases by Samsung after the effective date of the Agreement.
Business Combinations
LEDs.On December 21, 2009, Applied acquired Semitool, Inc., a public company based in the state of Montana, for a purchase price of $323 million in cash, net of cash acquired, pursuant to a tender offer and subsequent short-form merger. The acquired business is a leading supplier of electrochemical plating and wafer surface preparation equipment used by semiconductor packaging and manufacturing companies globally. Applied’s primary reasons for this acquisition were to complement its existing product offerings and to provide opportunities for future growth. The acquired business is included in results for the Silicon Systems Group segment.
Semitool is a leading provider of wet chemical processing equipment, targeting wafer surface preparation and ECD plating applications for all areas of wafer fabrication, including device packaging. Semitool’s solutions address critical applications within the semiconductor manufacturing process, and enable its customers to manufacture more advanced semiconductor devices that feature higher levels of performance.
In November 2009, Applied acquired substantially all the assets, including the intellectual property, of Advent Solar, a developer of advanced technology for c-Si solar photovoltaic cells and modules (PVs), for a purchase price of $14 million. This acquisition complemented Applied’s portfolio of solar PV technologies and enhanced
43
Applied’s opportunities in the c-Si equipment market. The acquisition is included in results for the Energy and Environmental Solutions segment.
On January 31, 2008, Applied acquired all of the outstanding shares of Baccini S.p.A., a privately-held company based in Italy, for a purchase price of $215 million in cash, net of cash and marketable securities acquired. The acquired business is a leading supplier of automated metallization and test systems for manufacturing c-Si photovoltaic cells.
On November 9, 2007, Applied purchased from Edwards Vacuum, Inc. certain assets of its Kachina semiconductor equipment parts cleaning and refurbishment business for $19 million.
For further details, see Note 9 of Notes to Consolidated Financial Statements.
Recent Accounting Pronouncements
In March 2010,September 2011, the FASB issued updated authoritative guidance that amends the requirementsto allow entities to use a qualitative approach to test goodwill for evaluating whether a decision maker or service provider has a variable interest entity and clarified that a quantitative approach should not be the sole consideration in assessing the criteria for variable interest entity determination. The guidance also clarifies that related parties should be considered in applying all of the decision maker and service provider criteria.impairment. This is in addition to the authoritative guidance the FASB issued in June 2009 that applies to determining whetherpermits an entity isto first perform a variable interest entity and requiring an enterprise to perform an analysisqualitative assessment to determine whether it is more likely than not that the enterprise’s variable interest or interests give it a controlling financial interest in a variable interest entity. Under this guidance, an enterprise has a controlling financial interest when it has (1) the power to direct the activitiesfair value of a variable interest entityreporting unit is less than its carrying value. If it is concluded that most significantly impact the entity’s economic performance and (2) the obligation to absorb losses of the entity or the right to receive benefits from the entity that could potentially be significant to the variable interest entity. The guidance also requires an enterprise to assess whether it has an implicit financial responsibility to ensure that a variable interest entity operates as designed when determining whether it has power to direct the activities of the variable interest entity that most significantly impact the entity’s economic performance. The guidance also requires ongoing assessments of whether an enterprisethis is the primary beneficiary of a variable interest entity, requires enhanced disclosures, and eliminatescase, it is necessary to perform the scope exclusion for qualifying special-purpose entities.two-step goodwill impairment test. Otherwise, the two-step goodwill impairment test is not required. This authoritative guidance is effective for annual and interim goodwill impairment tests performed for fiscal years beginning after December 15, 2011 and earlier adoption is permitted. Applied beginningelected to adopt this authoritative guidance in fiscal 2011. The implementation of this authoritative guidance had no impact on Applied’s financial position or results of operations.
In June 2011, the FASB issued authoritative guidance on the presentation of comprehensive income to require an entity to present the total of comprehensive income, the components of net income, and the components of other comprehensive income either in a single continuous statement of comprehensive income or in two separate but consecutive statements. This authoritative guidance eliminates the option to present the components of other comprehensive income as part of the statement of equity. This guidance is effective for Applied in the first quarter of fiscal 2011.2012, with early adoption permitted, and should be applied retrospectively. The implementation of this authoritative guidance will change only the presentation of comprehensive income and will have no impact on Applied’s financial position or results of operations.
In May 2011, the FASB issued authoritative guidance to provide a consistent definition of fair value and ensure that the fair value measurement and disclosure requirements are similar between U.S. GAAP and International Financial Reporting Standards. This authoritative guidance limits the highest-and-best-use measure to nonfinancial assets, permits certain financial assets and liabilities with offsetting positions in market or counterparty credit risks to be measured at a net basis, and provides guidance on the applicability of premiums and discounts. This authoritative guidance also expands the disclosures on Level 3 inputs by requiring quantitative disclosure of the unobservable inputs and assumptions, as well as description of the valuation processes and the sensitivity of the fair value to changes in unobservable inputs. The new guidance will be effective for Applied in the first quarter of fiscal 2012. The implementation of this authoritative guidance is not expected to have a material impact on Applied’s financial position or results of operations.
In JanuaryDecember 2010, the FASB issued authoritativeamended its existing guidance for fair value measurements, which requires additional disclosuresgoodwill and clarifications to existing disclosures.other intangible assets. This authoritative guidance modifies Step 1 of the goodwill impairment test for reporting units with zero or negative carrying amounts. For those reporting units, an entity is required to perform Step 2 of the goodwill impairment test if there are qualitative factors indicating that it is more likely than not that a goodwill impairment exists. The qualitative factors are consistent with the existing guidance which requires goodwill of a reporting entityunit to disclose separatelybe tested for impairment between annual tests if an event occurs or circumstances change that would more likely than not reduce the amounts of significant transfers in and out of Level 1 and Level 2 fair value measurements and also to describe the reasons for these transfers.of a reporting unit below its carrying amount. This authoritative guidance also requires enhanced disclosure of activity in Level 3 fair value measurements. The new disclosures and clarifications of existing disclosures for Level 1 and Level 2 fair value measurements becamebecomes effective for Applied in the secondfirst quarter of fiscal 2010. Disclosures regarding activity within Level 3 fair value measurements become effective the first interim reporting period after December 15, 2010 and will be effective for Applied in the second quarter of fiscal 2011. Applied is evaluating the potential impact of the implementation of this authoritative guidance on its consolidated financial statements. See Note 4 of Notes to Consolidated Financial Statements for information and related disclosures regarding Applied’s fair value measurements.
In June 2009, the FASB issued authoritative guidance on variable interest entities, which requires revised evaluations of whether entities represent variable interest entities, ongoing assessments of control over such entities, and additional disclosures for variable interests. In December 2009, the FASB issued authoritative guidance on the financial reporting by entities involved with variable interest entities which amends previously issued guidance on variable interest entities. The amendments in this authoritative guidance replace the quantitative-based risks and rewards calculation for determining which reporting entity, if any, has a controlling financial interest in a variable interest entity with an approach focused on identifying which reporting entity has the power to direct the activities of a variable interest entity that most significantly impact the entity’s economic performance and (1) the obligation to absorb losses of the entity or (2) the right to receive benefits from the entity. This authoritative guidance becomes
44
effective for Applied in fiscal 2011.2012. The implementation of this authoritative guidance is not expected to have a material impact on Applied’s financial position or results of operations.
In December 2010, the FASB issued authoritative guidance on business combinations. This authoritative guidance requires a public entity that presents comparative financial statements to disclose the revenue and
earnings of the combined entity as though the business combinations that occurred during the current year had occurred as of the beginning of the prior annual reporting period. In addition, this authoritative guidance expands the supplemental pro forma disclosures to include a description of the nature and amount of material, nonrecurring pro forma adjustments directly attributable to the business combination included in the reported pro forma revenue and earnings. This authoritative guidance is effective prospectively for business combinations for which the acquisition date is on or after the beginning of the first annual reporting period beginning on or after December 15, 2010. Applied will comply with this authoritative guidance in the first quarter of fiscal 2012.
Financial Condition, Liquidity and Capital Resources
Applied’s cash, cash equivalents and investments increased to $7.2 billion at October 30, 2011 from $3.9 billion at October 31, 2010, from $3.3 billion at October 25, 2009, due primarily to an increase inthe receipt of proceeds from the issuance of $1.75 billion of senior unsecured notes discussed below and cash generated fromprovided by operating activities. Applied has not undertaken any significant external financing activities for several years.
of $2.4 billion.Cash, cash equivalents and investments consist of the following:
| | | | | | | | | | | | | |
| | | October 31,
| | | October 25,
| | | October 26,
| |
| | | 2010 | | | 2009 | | | 2008 | |
| | | (In millions) | |
| |
| Cash and cash equivalents | | $ | 1,858 | | | $ | 1,577 | | | $ | 1,412 | |
| Short-term investments | | | 727 | | | | 638 | | | | 689 | |
| Long-term investments | | | 1,307 | | | | 1,052 | | | | 1,367 | |
| | | | | | | | | | | | | |
| Total cash, cash-equivalents and investments | | $ | 3,892 | | | $ | 3,267 | | | $ | 3,468 | |
| | | | | | | | | | | | | |
| | | | | | | | | | | | |
| | | October 30,
2011 | | | October 31,
2010 | | | October 25,
2009 | |
| | | (In millions) | |
Cash and cash equivalents | | $ | 5,960 | | | $ | 1,858 | | | $ | 1,577 | |
Short-term investments | | | 283 | | | | 727 | | | | 638 | |
Long-term investments | | | 931 | | | | 1,307 | | | | 1,052 | |
| | | | | | | | | | | | |
Total cash, cash-equivalents and investments | | $ | 7,174 | | | $ | 3,892 | | | $ | 3,267 | |
| | | | | | | | | | | | |
A summary of cash provided by (used in) operating, investing, and financing activities is as follows:
| | | | | | | | | | | | | |
| | | 2010 | | 2009 | | 2008 |
| | | (In millions) |
| |
| Cash provided by operating activities | | $ | 1,723 | | | $ | 333 | | | $ | 1,710 | |
| Cash provided by (used in) investing activities | | $ | (862 | ) | | $ | 113 | | | $ | (76 | ) |
| Cash used in financing activities | | $ | (576 | ) | | $ | (281 | ) | | $ | (1,426 | ) |
| | | | | | | | | | | | |
| | | 2011 | | | 2010 | | | 2009 | |
| | | (In millions) | |
Cash provided by operating activities | | $ | 2,426 | | | $ | 1,723 | | | $ | 333 | |
Cash provided by (used in) investing activities | | $ | 710 | | | $ | (862 | ) | | $ | 112 | |
Cash provided by (used in) financing activities | | $ | 960 | | | $ | (576 | ) | | $ | (281 | ) |
Applied generated cash from operating activities of $2.4 billion in fiscal 2011, $1.7 billion in fiscal 2010, and $333 million in fiscal 2009, and $1.7 billion in fiscal 2008.2009. The primary sources of cash from operating activities for fiscal 20102011 were net income, as adjusted to exclude the effect of non-cash charges including depreciation, amortization, share-based compensation, restructuring and asset impairments, share-based compensation, and changes in components of working capital. Changes in working capital included thin film solar inventory-related charges of $330 million. Applied utilized programs to discount letters of credit issued by customers of $211 million in fiscal 2011, $230 million in fiscal 2010, and $299 million in fiscal 2009, and $167 million in fiscal 2008.2009. Discounting of letters of credit depends on many factors, including the willingness of financial institutions to discount the letters of credit and the cost of such arrangements. For fiscal 2010, Applied factored accounts receivable of $153 million and discounted promissory notes of $3 million. For$80 million in fiscal 2009, Applied factored accounts receivable of $392011, $157 million in fiscal 2010, and discounted promissory notes of $4 million. For$43 million in fiscal 2008, Applied factored accounts receivable of $133 million and discounted promissory notes of $6 million.2009. Days sales outstanding were 62 at the end of fiscal 2011, 58 at the end of fiscal 2010, and 75 days at the end of fiscal 2009, and 79 days at the end of fiscal 2008. The 2010 reduction in the days2009. Days sales outstanding fromvaries due to the prior year was attributable to higher net salestiming of shipments and improved working capital management.the payment terms. Applied’s working capital was $7.6 billion at October 30, 2011, $3.9 billion at October 31, 2010 and $3.7 billion at both October 25, 2009 and October 26, 2008.2009. During fiscal 2011, Applied received a U.S. federal income tax refund of $276 million including interest. During fiscal 2010, Applied received a U.S. federal income tax refund of approximately $130 million for the carryback of Applied’s net operating loss from fiscal 2009 to fiscal 2005.
Applied generated $710 million of cash from investing activities in 2011. Applied used $862 million of cash for investing activities in fiscal 2010. Applied2010 and generated $113$112 million of cash from investing activities in fiscal 2009 and used $762009. Capital expenditures were $209 million in fiscal 2008. Purchases of investments, net of proceeds from sales and maturities of investments, totaled $370 million in fiscal 2010. Proceeds from sales and maturities of investments, net of purchases of investments, totaled $361 million in fiscal 2009 and $405 million in fiscal 2008. Capital expenditures were2011, $169 million in fiscal 2010, $248$249 million in fiscal 2009, and $2882009. Capital expenditures in fiscal 2011 was offset by $99 million in proceeds received from the sale of two properties located in North America and $31 million in proceeds received from completed divestiture of certain assets held for sale. Capital expenditures for both fiscal 2008. These expenditures2010 and fiscal 2009 were primarily for the implementation of an enterprise resource planning software system and the construction of a solar R&D/demonstration center in Xi’an,
China. Capital expenditures for fiscal 2010 and fiscal 2009 also included investment to construct a facility in Singapore.
Proceeds from sales and maturities of investments, net of purchases of investments, totaled $789 million for fiscal 2011 and $361 million in fiscal 2009. Purchases of investments, net of proceeds from sales and maturities of investments, totaled $370 million in fiscal 2010.Investing activities also included investments in technology and acquisitions of companies to allow Applied to access new market opportunities or emerging technologies. In fiscal 2010, Applied acquired Semitool, a public company based in the state of Montana, for $323 million, net of cash acquired. During fiscal 2008, Applied acquired
45
all of the outstanding shares of Baccini, a privately-held company based in Italy, for a purchase price of $215 million in cash, net of cash and marketable securities acquired. Also in fiscal 2008, Applied purchased certain assets from Edwards Vacuum, Inc. consisting of its Kachina semiconductor equipment parts cleaning and refurbishment business for $19 million. See Note 9 of Notes to Consolidated Financial Statements for additional details.
Applied generated $960 million of cash from financing activities in fiscal 2011, consisting primarily of net proceeds received from the issuance of senior unsecured notes of $1.75 billion, as discussed further below. Applied used cash for financing activities in the amount of $576 million for fiscal 2010 and $281 million for fiscal 2009, and $1.4 billion for fiscal 2008.2009. Financing activities included payment of cash dividends to stockholders and issuances and repurchases of common stock. Cash used to repurchase shares totaled $468 million in fiscal 2011, $350 million in fiscal 2010, and $23 million in fiscal 2009, and $1.5 billion in fiscal 2008.2009. In March 2010, Applied’s Board of Directors approved a new stock repurchase program authorizing up to $2.0 billion in repurchases over the next three years ending in March 2013. Proceeds from stock issuances related to equity compensation awards were $95 million in fiscal 2011, $129 million in fiscal 2010, and $62 million in fiscal 2009, and $401 million in2009.
The following table summarizes the dividends declared by Applied’s Board of Directors during fiscal 2008.
2011: | | | | | | |
Date declared | | Record date | | Payable date | | Amount per share |
December 7, 2010 | | March 2, 2011 | | March 23, 2011 | | $ 0.07 |
March 8, 2011 | | June 1, 2011 | | June 22, 2011 | | $ 0.08 |
June 6, 2011 | | August 31, 2011 | | September 21, 2011 | | $ 0.08 |
September 13, 2011 | | November 23, 2011 | | December 14, 2011 | | $ 0.08 |
During fiscal 2010, Applied’s Board of Directors declared three quarterly cash dividends in the amount of $0.07 per share each and one quarterly cash dividend in the amount of $0.06 per share. The fourth quarterly cash dividend of $0.07 per share declared in fiscal 2010 will be paid on December 15, 2010 to stockholders of record as of November 24, 2010. During fiscal 2009, Applied’s Board of Directors declared four quarterly cash dividends in the amount of $0.06 per share each quarter. During fiscal 2008, Applied’s Board of Directors declared four quarterly cash dividends in the amount of $0.06 per share each. Cash paid in dividends during fiscal 2011, 2010 2009 and 20082009 amounted to $397 million, $349 million $320 million and $325$319 million, respectively. Applied currently anticipates that itcash dividends will continue to pay cash dividendsbe paid on a quarterly basis, in the future, although the declaration and amount of any future cash dividend areis at the discretion of the Board of Directors and will depend on Applied’s financial condition, results of operations, capital requirements, business conditions and other factors, as well as a determination by the Board of Directors that cash dividends are in the best interestinterests of Applied’s stockholders.
Applied has credit facilities for unsecured borrowings in various currencies of up to $1.1$1.6 billion, of which $1.0$1.5 billion is comprised of a5-year committed four-year revolving credit agreement with a group of banks that is scheduled to expire in January 2012.May 2015. This agreement provides for borrowings in United States dollars at interest rates keyed to one of the two rates selected by Applied for each advance and includes financial and other covenants with which Applied was in compliance at October 31, 2010.30, 2011. Remaining credit facilities in the amount of approximately $98$105 million are with Japanese banks. Applied’s ability to borrow under these facilities is subject to bank approval at the time of the borrowing request, and any advances will be at rates indexed to the banks’ prime reference rate denominated in Japanese yen. No amounts were outstanding under any of the above creditthese facilities at both October 30, 2011 and October 31, 2010.
In fiscal 2011, Applied established a short-term commercial paper program of up to $1.5 billion. At October 30, 2011, Applied did not have any commercial paper outstanding.
In June 2011, Applied issued senior unsecured notes (the Notes) in the aggregate principal amount of $1.75 billion. The following table summarizes the Notes issued in June 2011:
| | | | | | | | | | | | | | | | | | | | |
Due Date | | Principal
Amount | | | Stated
Interest Rate | | | Effective
Interest Rate | | | Interest
Pay Date | | | Interest Pay Date | |
| | | (In millions) | | | | | | | | | | |
June 15, 2016 | | $ | 400 | | | | 2.650 | % | | | 2.666 | % | | | June 15 | | | | December 15 | |
June 15, 2021 | | | 750 | | | | 4.300 | % | | | 4.326 | % | | | June 15 | | | | December 15 | |
June 15, 2041 | | | 600 | | | | 5.850 | % | | | 5.879 | % | | | June 15 | | | | December 15 | |
| | | | | | | | | | | | | | | | | | | | |
| | $ | 1,750 | | | | | | | | | | | | | | | | | |
| | | | | | | | | | | | | | | | | | | | |
The indenture governing the Notes includes certain covenants with which Applied was in compliance at October 30, 2011. See Note 10 of Notes to Consolidated Financial Statements for additional discussion of long-term debt.
In November 2011, Applied completed its acquisition of Varian. The aggregate purchase price of the acquisition was approximately $4.2 billion, net of cash acquired. See Business Combinations section above. Applied funded the transaction with a combination of existing cash balances, including proceeds from the Notes. Following the acquisition of Varian Applied’s cash, cash equivalents and investments totaled approximately $3.0 billion. After completion of the acquisition, Applied’s credit ratings remained unchanged. The Company’s long-term credit ratings are “A3” with Moody’s Investors Services and “A-” with Standard and Poor’s Ratings Services. The Company’s short term credit ratings, which were initiated in July, 2011, are “P-2” with Moody’s Investors Services and “A-2” with Standard and Poor’s Ratings Services.
In the ordinary course of business, Applied provides standby letters of credit or other guarantee instruments to third parties as required for certain transactions initiated by either Applied or its subsidiaries. As of October 31, 2010,30, 2011, the maximum potential amount of future payments that Applied could be required to make under these guarantee agreements was $54approximately $58 million. Applied has not recorded any liability in connection with these guarantee agreements beyond that required to appropriately account for the underlying transaction being guaranteed. Applied does not believe, based on historical experience and information currently available, that it is probable that any amounts will be required to be paid under these guarantee agreements.
Applied also has agreements with various banks to facilitate subsidiary banking operations worldwide, including overdraft arrangements, issuance of bank guarantees, and letters of credit. As of October 30, 2011, Applied Materials Inc. has provided parent guarantees to banks for approximately $191 million to cover these services.
Applied’s investment portfolio consists principally of investment grade money market mutual funds, U.S. Treasury and agency securities, municipal bonds, corporate bonds and mortgage-backed and asset-backed securities, as well as equity securities. Applied regularly monitors the credit risk in its investment portfolio and takes appropriate measures, which may include the sale of certain securities, to manage such risks prudently in accordance with its investment policies.
In fiscal 2010, as partAs of its regular investment review process, Applied recorded impairment chargesOctober 30, 2011, less than $470 million of $13 million associated with equity investments in privately-held companies. At October 31, 2010, Applied had a gross unrealized loss in its investment portfoliocash, cash equivalents, and marketable securities was held by foreign subsidiaries of $1 million due to a decreaseApplied. If these funds are needed for Applied’s operations in the fair value of certain fixed income securities.U.S., Applied regularly reviews its investment portfolio to identify and evaluate investments that have indications of possible impairment. Factors considered in determining whether a loss is temporary include: the length of time and extent to which fair value has been lower than the cost basis; the financial condition, credit quality and near-term prospects of the investee; and whether it is morelikely-than-not that Applied willmay be required to sell the security prioraccrue and pay U.S. taxes to any anticipated recovery in fair value. Generally, the contractual termsrepatriate these funds. Applied’s intent is to permanently reinvest these funds outside of the investments
46
U.S. and its current plans do not permit settlement at prices less thandemonstrate a need to repatriate these funds to the amortized cost of the investments. While Applied cannot predict future market conditions or market liquidity, Applied believes that its investment policies provide an appropriate means to manage the risks in its investment portfolio.
During fiscal 2010 and fiscal 2009, Applied recorded bad debt provisions, net of recoveries, of $10 million and $62 million, respectively, as a result of certain customers’ deteriorating financial condition. While Applied believes that its allowance for doubtful accounts at October 31, 2010 is adequate, it will continue to closely monitor customer liquidity and economic conditions.
U.S.Although cash requirements will fluctuate based on the timing and extent of factors such as those discussed above, Applied’s management believes that cash generated from operations, together with the liquidity provided by existing cash balances and borrowing capability, will be sufficient to satisfy Applied’s liquidity requirements for the next 12 months. For further details regarding Applied’s operating, investing and financing activities, see the Consolidated Statements of Cash Flows in this report.
Off-Balance Sheet Arrangements
During the ordinary course of business, Applied provides standby letters of credit or other guarantee instruments to third parties as required for certain transactions initiated either by Applied or its subsidiaries. As of October 31, 2010,30, 2011, the maximum potential amount of future payments that Applied could be required to make under these guarantee agreements was $54$58 million. Applied has not recorded any liability in connection with these guarantee agreements beyond that required to appropriately account for the underlying transaction being guaranteed. Applied does not believe, based on historical experience and information currently available, that it is probable that any amounts will be required to be paid under these guarantee agreements.
Applied also has agreements with various banks to facilitate subsidiary banking operations worldwide, including overdraft arrangements, issuance of bank guarantees, and letters of credit. As of October 30, 2011, Applied Materials Inc. has provided parent guarantees to banks for approximately $191 million to cover these services.
Applied also has operating leases for various facilities. Total rental expense for operating leases was $52$44 million for fiscal 2011, $44 million for fiscal 2010, $64and $55 million for fiscal 2009, and $68 million for fiscal 2008.
2009.Contractual Obligations
The following table summarizes Applied’s contractual obligations as of October 31, 2010:
| | | | | | | | | | | | | | | | | | | | | |
| | | Payments Due by Period | |
| | | | | | Less Than
| | | 1-3
| | | 3-5
| | | More Than
| |
| Contractual Obligations | | Total | | | 1 Year | | | Years | | | Years | | | 5 Years | |
| | | (In millions) | |
| |
| Long-term debt obligations | | $ | 205 | | | $ | 1 | | | $ | 2 | | | $ | 1 | | | $ | 201 | |
| Interest expense associated with long-term debt obligations | | | 101 | | | | 14 | | | | 29 | | | | 29 | | | | 29 | |
| Operating lease obligations | | | 143 | | | | 42 | | | | 45 | | | | 26 | | | | 30 | |
| Purchase obligations* | | | 2,055 | | | | 2,053 | | | | 2 | | | | — | | | | — | |
| Other long-term liabilities | | | 239 | | | | 21 | | | | 44 | | | | 45 | | | | 129 | |
| | | | | | | | | | | | | | | | | | | | | |
| | | $ | 2,743 | | | $ | 2,131 | | | $ | 122 | | | $ | 101 | | | $ | 389 | |
| | | | | | | | | | | | | | | | | | | | | |
| | | | | | | | | | | | | | | | | | | | |
| | | Payments Due by Period | |
Contractual Obligations | | Total | | | Less Than
1 Year | | | 1-3
Years | | | 3-5
Years | | | More Than
5 Years | |
| | | (In millions) | |
Long-term debt obligations | | $ | 1,951 | | | $ | — | | | $ | 1 | | | $ | 400 | | | $ | 1,550 | |
Interest expense associated with long-term debt obligations | | | 1,515 | | | | 94 | | | | 184 | | | | 184 | | | | 1,053 | |
Operating lease obligations | | | 108 | | | | 33 | | | | 36 | | | | 18 | | | | 21 | |
Purchase obligations* | | | 3,184 | | | | 3,153 | | | | 29 | | | | 2 | | | | — | |
Other long-term liabilities | | | 221 | | | | 42 | | | | 57 | | | | 42 | | | | 80 | |
| | | | | | | | | | | | | | | | | | | | |
| | $ | 6,979 | | | $ | 3,322 | | | $ | 307 | | | $ | 646 | | | $ | 2,704 | |
| | | | | | | | | | | | | | | | | | | | |
| | |
| * | | Represents Applied’s agreements to purchase goods and services consisting of Applied’s (a) outstanding purchase orders for goods and services; and (b) contractual requirements to make specified minimum payments even if Applied does not take delivery of the contracted goods. |
In addition to the contractual obligations disclosed above, the Company has certain tax obligations. Gross interest and penalties and unrecognized tax benefits that are not expected to result in payment or receipt of cash within one year have been reported as non-current liabilities on the Consolidated Balance Sheet. As of October 31, 2010,30, 2011, the gross liability for unrecognized tax benefits was $328$59 million, exclusive of interest and penalties. Increases or decreases to interest and penalties on uncertain tax positions are included in provision for income taxes in the Consolidated Statement of Operations. Interest and penalties related to uncertain tax positions were $1 million as of October 30, 2011 and $6 million as of October 31, 2010 and $5 million as of October 25, 2009.2010. All $6$1 million in interest and penalties is classified as long-term payable in the Consolidated Balance Sheets. At this time, the Company is unable to make a
47
reasonably reliable estimate of the timing of payments in individual years due to uncertainties in the timing of tax audit outcomes and, accordingly, such amounts are not included in the above contractual obligation table.
Critical Accounting Policies and Estimates
The preparation of consolidated financial statements and related disclosures in conformity with accounting principles generally accepted in the United States of America requires management to make judgments, assumptions and estimates that affect the amounts reported. Note 1 of Notes to Consolidated Financial Statements
describes the significant accounting policies used in the preparation of the consolidated financial statements. Certain of these significant accounting policies are considered to be critical accounting policies.
A critical accounting policy is defined as one that is both material to the presentation of Applied’s consolidated financial statements and that requires management to make difficult, subjective or complex judgments that could have a material effect on Applied’s financial condition or results of operations. Specifically, these policies have the following attributes: (1) Applied is required to make assumptions about matters that are highly uncertain at the time of the estimate; and (2) different estimates Applied could reasonably have used, or changes in the estimate that are reasonably likely to occur, would have a material effect on Applied’s financial condition or results of operations.
Estimates and assumptions about future events and their effects cannot be determined with certainty. Applied bases its estimates on historical experience and on various other assumptions believed to be applicable and reasonable under the circumstances. These estimates may change as new events occur, as additional information is obtained and as Applied’s operating environment changes. These changes have historically been minor and have been included in the consolidated financial statements as soon as they became known. In addition, management is periodically faced with uncertainties, the outcomes of which are not within its control and will not be known for prolonged periods of time. These uncertainties include those discussed in Part II,I, Item 1A, “Risk Factors.” Based on a critical assessment of its accounting policies and the underlying judgments and uncertainties affecting the application of those policies, management believes that Applied’s consolidated financial statements are fairly stated in accordance with accounting principles generally accepted in the United States of America, and provide a meaningful presentation of Applied’s financial condition and results of operations.
Management believes that the following are critical accounting policies:
Applied recognizes revenue when all four revenue recognition criteria have been met: persuasive evidence of an arrangement exists; delivery has occurred or services have been rendered; seller’s price to buyer is fixed or determinable; and collectability is probable. Each sale arrangement may contain commercial terms that differ from other arrangements. In addition, Applied frequently enters into contracts that contain multiple deliverables. Judgment is required to properly identify the accounting units of the multiple deliverable transactions and to determine the manner in which revenue should be allocated among the accounting units. Moreover, judgment is used in interpreting the commercial terms and determining when all criteria of revenue recognition have been met in order for revenue recognition to occur in the appropriate accounting period. While changes in the allocation of the estimated sales price between the units of accounting will not affect the amount of total revenue recognized for a particular sales arrangement, any material changes in these allocations could impact the timing of revenue recognition, which could have a material effect on Applied’s financial condition and results of operations.
In 2009, the Financial Accounting Standards Board issued amended revenue recognition guidance for arrangements with multiple deliverables and certain software sold with tangible products. This new guidance eliminateseliminated the residual method of revenue recognition and allows the use of management’s best estimate of selling price for individual elements of an arrangement when vendor specific evidence or third party evidence is unavailable. Applied implemented this guidance prospectively beginning in the first quarter of fiscal 2010 for transactions that were initiated or materially modified during fiscal 2010. The implementation of the new guidance had an insignificant impact on reported net sales as compared to net sales under previous guidance, as the new guidance did not change the units of accounting within sales arrangements and the elimination of the residual method for the allocation of arrangement consideration had an inconsequential impact on the amount and timing of reported net sales.
48
Warranty Costs
Applied provides for the estimated cost of warranty when revenue is recognized. Estimated warranty costs are determined by analyzing specific product, current and historical configuration statistics and regional warranty
support costs. Applied’s warranty obligation is affected by product and component failure rates, material usage and labor costs incurred in correcting product failures during the warranty period. As Applied’s customer engineers and process support engineers are highly trained and deployed globally, labor availability is a significant factor in determining labor costs. The quantity and availability of critical replacement parts is another significant factor in estimating warranty costs. Unforeseen component failures or exceptional component performance can also result in changes to warranty costs. If actual warranty costs differ substantially from Applied’s estimates, revisions to the estimated warranty liability would be required, which could have a material adverse effect on Applied’s business, financial condition and results of operations.
Allowance for Doubtful Accounts
Applied maintains an allowance for doubtful accounts for estimated losses resulting from the inability of its customers to make required payments. This allowance is based on historical experience, credit evaluations, specific customer collection history and any customer-specific issues Applied has identified. Changes in circumstances, such as an unexpected material adverse change in a major customer’s ability to meet its financial obligation to Applied or its payment trends, may require Applied to further adjust its estimates of the recoverability of amounts due to Applied, which could have a material adverse effect on Applied’s business, financial condition and results of operations.
Inventories are generally stated at the lower of cost or market, with cost determined on afirst-in, first-out basis. The carrying value of inventory is reduced for estimated obsolescence by the difference between its cost and the estimated market value based upon assumptions about future demand. Applied evaluates the inventory carrying value for potential excess and obsolete inventory exposures by analyzing historical and anticipated demand. In addition, inventories are evaluated for potential obsolescence due to the effect of known and anticipated engineering change orders and new products. If actual demand were to be substantially lower than estimated, additional adjustments for excess or obsolete inventory may be required, which could have a material adverse effect on Applied’s business, financial condition and results of operations.
Goodwill and Intangible Assets
Applied reviews goodwill and intangible assets for impairment whenever events or changes in circumstances indicate that the carrying amount of these assets may not be recoverable, and also annually reviews goodwill and intangibles with indefinite lives for impairment. Intangible assets, such as purchased technology, are generally recorded in connection with a business acquisition. The value assigned to intangible assets is usually based on estimates and judgments regarding expectations for the success and life cycle of products and technology acquired. If actual product acceptance differs significantly from the estimates, Applied may be required to record an impairment charge to reduce the carrying value of the reporting unit to its realizable value. The fair value of a reporting unit is estimated using both the income approach and the market approach taking into account such factors as future anticipated operating results and estimated cost of capital. Management uses significant judgment when assessing goodwill for potential impairment, especially in emerging markets. A severe decline in market value could result in an unexpected impairment charge for impaired goodwill, which could have a material adverse effect on Applied’s business, financial condition and results of operations.
The effective tax rate is highly dependent upon the geographic composition of worldwide earnings, tax regulations governing each region, non-tax deductible expenses incurred in connection with acquisitions and availability of tax credits. Management carefully monitors the changes in many factors and adjusts the effective income tax rate as required. If actual results differ from these estimates, Applied could be required to record a
49
valuation allowance on deferred tax assets or adjust its effective income tax rate, which could have a material adverse effect on Applied’s business, financial condition and results of operations.
Applied accounts for income taxes by recognizing deferred tax assets and liabilities using statutory tax rates for the effect of temporary differences between the book and tax bases of recorded assets and liabilities, net operating losses and tax credit carryforwards. Deferred tax assets are also reduced by a valuation allowance if it is more likely than not that a portion of the deferred tax asset will not be realized. Management has determined that it is more likely than not that Applied’s future taxable income will be sufficient to realize its deferred tax assets.
assets, net of existing valuation allowance.The calculation of tax liabilities involves significant judgment in estimating the impact of uncertainties in the application of complex tax laws. Resolution of these uncertainties in a manner inconsistent with Applied’s expectations could have a material impact on Applied’s results of operations and financial condition.
Non-GAAP Results
Management uses non-GAAP results to evaluate the Company’s operating and financial performance in light of business objectives and for planning purposes. Applied believes these measures enhance investors’ ability to review the Company’s business from the same perspective as the Company’s management and facilitate comparisons of this period’s results with prior periods. The non-GAAP results presented below exclude the impact of the following, where applicable: restructuring and asset impairment charges and any associated adjustment related to restructuring actions, certain discrete tax items, certain acquisition-related costs, investment impairments, and gain or loss on sale of facilities. These non-GAAP measures are not in accordance with GAAP and may differ from non-GAAP methods of accounting and reporting used by other companies. The presentation of this additional information should not be considered a substitute for results prepared in accordance with GAAP.
Non-GAAP operating income for fiscal 2011 and 2010 were $2.4 billion and $1.7 billion, respectively. Non-GAAP operating loss for fiscal 2009 was $142 million.
Non-GAAP net income for fiscal 2011 and 2010 were $1.7 billion or $1.30 per share and $1.2 billion or $0.88 per share, respectively. Non-GAAP net loss for fiscal 2009 was $69 million or $0.05 per share.
The following table presents a reconciliation of the GAAP and non-GAAP results for the past three fiscal years:
APPLIED MATERIALS, INC.
RECONCILIATION OF GAAP TO NON-GAAP RESULTS
| | | | | | | | | | | | |
| | | Twelve Months Ended | |
| (In millions, except per share amounts) | | October 30,
2011 | | | October 31,
2010 | | | October 25,
2009 | |
Non-GAAP Operating Income (Loss) | | | | | | | | | | | | |
Reported operating income (loss) GAAP basis | | $ | 2,398 | | | $ | 1,384 | | | $ | (394 | ) |
Certain items associated with acquisitions1 | | | 51 | | | | 91 | | | | 96 | |
Varian and Semitool deal cost | | | 19 | | | | 10 | | | | — | |
Restructuring charges and asset impairments2,3,4 | | | (30 | ) | | | 246 | | | | 156 | |
Gain on sale of facilities, net | | | (27 | ) | | | — | | | | — | |
| | | | | | | | | | | | |
Non-GAAP operating income | | $ | 2,411 | | | $ | 1,731 | | | $ | (142 | ) |
| | | | | | | | | | | | |
Non-GAAP Net Income (Loss) | | | | | | | | | | | | |
Reported net income (loss) GAAP basis | | $ | 1,926 | | | $ | 938 | | | $ | (305 | ) |
Certain items associated with acquisitions1 | | | 51 | | | | 91 | | | | 96 | |
Varian and Semitool deal cost | | | 19 | | | | 10 | | | | — | |
Restructuring charges and asset impairments2,3,4 | | | (30 | ) | | | 246 | | | | 156 | |
Impairment of equity method investment and strategic investments | | | 3 | | | | 13 | | | | 84 | |
Gain on sale of facilities, net | | | (27 | ) | | | — | | | | — | |
Reinstatement of federal R&D tax credit | | | (13 | ) | | | — | | | | — | |
Resolution of audits of prior years’ income tax filings | | | (203 | ) | | | — | | | | — | |
Income tax effect of non-GAAP adjustments | | | (3 | ) | | | (117 | ) | | | (100 | ) |
| | | | | | | | | | | | |
Non-GAAP net income | | $ | 1,723 | | | $ | 1,181 | | | $ | (69 | ) |
| | | | | | | | | | | | |
Non-GAAP Earnings (Loss) Per Diluted Share | | | | | | | | | | | | |
Reported earnings (loss) per diluted share GAAP basis | | $ | 1.45 | | | $ | 0.70 | | | $ | (0.23 | ) |
Certain items associated with acquisitions | | | 0.03 | | | | 0.05 | | | | 0.05 | |
Varian and Semitool deal cost | | | 0.01 | | | | 0.01 | | | | — | |
Restructuring charges and asset impairments | | | (0.01 | ) | | | 0.12 | | | | 0.08 | |
Impairment of equity method investment and strategic investments | | | — | | | | — | | | | 0.05 | |
Gain on sale of facilities, net | | | (0.02 | ) | | | — | | | | — | |
Reinstatement of federal R&D tax credit and resolution of audits of prior years’ income tax filings | | | (0.16 | ) | | | — | | | | — | |
Non-GAAP earnings (loss) per diluted share | | $ | 1.30 | | | $ | 0.88 | | | $ | (0.05 | ) |
Weighted average number of diluted shares | | | 1,330 | | | | 1,349 | | | | 1,333 | |
| 1 | These items are incremental charges attributable to acquisitions consisting of inventory fair value adjustments on products sold and amortization of purchased intangible assets. |
| 2 | Results for fiscal 2011 included favorable adjustments of $36 million related to a restructuring program announced on July 21, 2010, $19 million related to a restructuring program announced on November 11, 2009, and $5 million related to a restructuring program announced on November 12, 2008, offset by asset impairment charges of $30 million primarily related to certain intangible assets. |
| 3 | Results for fiscal 2010 included asset impairment charges of $108 million and restructuring charges of $45 million related to a restructuring program announced on July 21, 2010, restructuring charges of $84 million associated with a restructuring program announced on November 11, 2009, and asset impairment charges of $9 million related to a facility held for sale. |
| 4 | Results for fiscal 2009 included restructuring charges of $141 million primarily associated with a restructuring program announced on November 12, 2008 and asset impairment charges of $15 million related to wafer cleaning equipment. |
| Item 7A: | Quantitative and Qualitative Disclosures About Market Risk |
Applied is exposed to interest rate risk related to its investment portfolio and debt issuances. Applied’s investment portfolio includes fixed-income securities with a fair value of approximately $2.0$1.1 billion at October 31, 2010.30, 2011. These securities are subject to interest rate risk and will decline in value if interest rates increase. Based on Applied’s investment portfolio at October 31, 2010,30, 2011, an immediate 100 basis point increase in interest rates would result in a decrease in the fair value of the portfolio of approximately $25$19 million. While an increase in interest rates reduces the fair value of the investment portfolio, Applied will not realize the losses in the consolidated condensed statement of operations unless the individual fixed-income securities are sold prior to recovery or the loss is determined to beother-than-temporary.
At October 30, 2011, the carrying amount of debt issued by Applied was $1.9 billion with an estimated fair value of $2.2 billion. A hypothetical decrease in interest rates of 100 basis points would result in an increase in the fair value of Applied’s debt issuances of approximately $215 million at October 30, 2011.Certain operations of Applied are conducted in foreign currencies, such as Japanese yen, euro, Israeli shekel, Taiwanese dollar and Swiss franc. Applied enters into currency forward exchange and option contracts to hedge a portion of, but not all, existing and anticipated foreign currency denominated transactions expected to occur within 24 months. Gains and losses on these contracts are generally recognized in income at the time that the related transactions being hedged are recognized. Because the effect of movements in currency exchange rates on currency forward exchange and option contracts generally offsets the related effect on the underlying items being hedged, these financial instruments are not expected to subject Applied to risks that would otherwise result from changes in currency exchange rates. Applied does not use derivative financial instruments for trading or speculative purposes. Net foreign currency gains and losses were not material for fiscal 2010.
2011. | |
| Item 8: | Financial Statements and Supplementary Data |
The consolidated financial statements required by this Item are set forth on the pages indicated at Item 15(a).
| |
| Item 9: | Changes in and Disagreements with Accountants on Accounting and Financial Disclosure |
| |
| Item 9A: | Controls and Procedures |
Disclosure Controls and Procedures
As of the end of the period covered by this report, management of Applied conducted an evaluation, under the supervision and with the participation of Applied’s Chief Executive Officer and Chief Financial Officer, of the effectiveness of the design and operation of Applied’s disclosure controls and procedures, as such term is defined inRule 13a-15(e) of the Securities Exchange Act of 1934 (the Exchange Act). Based upon that evaluation, Applied’s Chief Executive Officer and Chief Financial Officer concluded that Applied’s disclosure controls and procedures were effective as of the end of the period covered by this report in ensuring that information
required to be disclosed was recorded, processed, summarized and reported within the time periods specified in the SEC’s rules and forms, and to provide reasonable assurance that information required to be disclosed by Applied in such reports is accumulated and communicated to the Company’s management, including its Chief Executive Officer and Chief Financial Officer, as appropriate to allow timely decisions regarding required disclosure.
50
Management’s Report on Internal Control over Financial Reporting
Applied’s management is responsible for establishing and maintaining adequate internal control over financial reporting, as such term is defined inRule 13a-15(f) of the Exchange Act. Under the supervision and with the participation of Applied’s Chief Executive Officer and Chief Financial Officer, management of Applied conducted an evaluation of the effectiveness of Applied’s internal control over financial reporting based upon the framework in “Internal Control — Integrated Framework” issued by the Committee of Sponsoring Organizations of the Treadway Commission. Based on that evaluation, Applied’s management concluded that Applied’s internal control over financial reporting was effective as of October 31, 2010.
30, 2011.KPMG LLP, an independent registered public accounting firm, has audited the consolidated financial statements included in thisForm 10-K and, as part of the audit, has issued a report, included herein, on the effectiveness of Applied’s internal control over financial reporting as of October 31, 2010.
30, 2011.Changes in Internal Control over Financial Reporting
During the fourth quarter of fiscal 2010,2011, there were no changes in the internal control over financial reporting that materially affected, or are reasonably likely to materially affect, Applied’s internal control over financial reporting.
Inherent Limitations of Disclosure Controls and Procedures and Internal Control over Financial Reporting
It should be noted that any system of controls, however well designed and operated, can provide only reasonable, and not absolute, assurance that the objectives of the system will be met. In addition, the design of any control system is based in part upon certain assumptions about the likelihood of future events.
| |
| Item 9B: | Other Information |
51
REPORT OF INDEPENDENT REGISTERED PUBLIC ACCOUNTING FIRM
The Board of Directors and Stockholders
We have audited Applied Materials, Inc.’s (the Company) internal control over financial reporting as of October 31, 2010,30, 2011, based on criteria established in Internal Control -— Integrated Framework issued by the Committee of Sponsoring Organizations of the Treadway Commission (COSO). The Company’s management is responsible for maintaining effective internal control over financial reporting and for its assessment of the effectiveness of internal control over financial reporting, included in the accompanying Management’s Report on Internal Control over Financial Reporting in Item 9A. Our responsibility is to express an opinion on the Company’s internal control over financial reporting based on our audit.
We conducted our audit in accordance with the standards of the Public Company Accounting Oversight Board (United States). Those standards require that we plan and perform the audit to obtain reasonable assurance about whether effective internal control over financial reporting was maintained in all material respects. Our audit included obtaining an understanding of internal control over financial reporting, assessing the risk that a material weakness exists, and testing and evaluating the design and operating effectiveness of internal control based on the assessed risk. Our audit also included performing such other procedures as we considered necessary in the circumstances. We believe that our audit provides a reasonable basis for our opinion.
A company’s internal control over financial reporting is a process designed to provide reasonable assurance regarding the reliability of financial reporting and the preparation of financial statements for external purposes in accordance with generally accepted accounting principles. A company’s internal control over financial reporting includes those policies and procedures that (1) pertain to the maintenance of records that, in reasonable detail, accurately and fairly reflect the transactions and dispositions of the assets of the company; (2) provide reasonable assurance that transactions are recorded as necessary to permit preparation of financial statements in accordance with generally accepted accounting principles, and that receipts and expenditures of the company are being made only in accordance with authorizations of management and directors of the company; and (3) provide reasonable assurance regarding prevention or timely detection of unauthorized acquisition, use, or disposition of the company’s assets that could have a material effect on the financial statements.
Because of its inherent limitations, internal control over financial reporting may not prevent or detect misstatements. Also, projections of any evaluation of effectiveness to future periods are subject to the risk that controls may become inadequate because of changes in conditions, or that the degree of compliance with the policies or procedures may deteriorate.
In our opinion, Applied Materials, Inc. maintained, in all material respects, effective internal control over financial reporting as of October 31, 2010,30, 2011, based on criteria established in Internal Control — Integrated Framework issued by the Committee of Sponsoring Organizations of the Treadway Commission.
We also have audited, in accordance with the standards of the Public Company Accounting Oversight Board (United States), the consolidated balance sheets of Applied Materials Inc. and subsidiaries as of October 31, 201030, 2011 and October 25, 2009,31, 2010, and the related consolidated statements of operations, stockholders’ equity and comprehensive income (loss), and cash flows for each of the years in the three-year period ended October 31, 2010.30, 2011. In connection with our audits of the consolidated financial statements, we also have also audited the financial statement schedule II. Our report dated December 10, 20106, 2011 expressed an unqualified opinion on those consolidated financial statements and financial statement schedule.
KPMG LLP
Mountain View, California
526, 2011
PART III
Pursuant to Paragraph G(3) of the General Instructions toForm 10-K, portions of the information required by Part III ofForm 10-K are incorporated by reference from Applied’s Proxy Statement to be filed with the SEC in connection with the 20112012 Annual Meeting of Stockholders (the Proxy Statement).
| |
| Item 10: | Directors, Executive Officers and Corporate Governance |
(1) Information regarding directors, including director nominations, and Applied’s audit committee and audit committee financial expert, appears in the Proxy Statement under “Election of Directors,” and is incorporated herein by reference.
(2) For information with respect to Executive Officers, see Part I, Item 1 of this Annual Report onForm 10-K, under “Executive Officers of the Registrant.”
(3) Information regarding Section 16(a) beneficial ownership reporting compliance appears in the Proxy Statement under “Section 16(a) Beneficial Ownership Reporting Compliance,” and is incorporated herein by reference.
Applied has implemented the Standards of Business Conduct, a code of ethics with which every person who works for Applied and every member of the Board of Directors is expected to comply. If any substantive amendments are made to the Standards of Business Conduct or any waiver is granted, including any implicit waiver, from a provision of the code to Applied’s Chief Executive Officer, Chief Financial Officer or Chief Accounting Officer, Applied will disclose the nature of such amendment or waiver on its website or in a report onForm 8-K. The above information, including the Standards of Business Conduct, is available on Applied’s website under the InvestorsCorporate Governance section athttp://investors.appliedmaterials.com.This website address is intended to be an inactive, textual reference only. None of the material on, or accessible through, this website is part of this report or is incorporated by reference herein.
| |
| Item 11: | Executive Compensation |
Information regarding executive compensation appears in the Proxy Statement under “Executive Compensation and Related Information” and is incorporated herein by reference.
Information regarding compensation committee interlocks and insider participation appears in the Proxy Statement under “Compensation Committee Interlocks and Insider Participation” and is incorporated herein by reference.
Information regarding the compensation committee report appears in the Proxy Statement under “Human Resources and Compensation Committee Report” and is incorporated herein by reference.
| |
| Item 12: | Security Ownership of Certain Beneficial Owners and Management and Related Stockholder Matters |
Information regarding the security ownership of certain beneficial owners and management appears in the Proxy Statement, under “Principal Stockholders,” and is incorporated herein by reference.
53
The following table summarizes information with respect to options and other equity awards under Applied’s equity compensation plans as of October 31, 2010:
30, 2011:Equity Compensation Plan Information
| | | | | | | | | | | | | |
| | | | | | | | | (c)
| |
| | | (a)
| | | | | | Number of Securities
| |
| | | Number of
| | | (b)
| | | Available for Future
| |
| | | Securities to be
| | | Weighted Average
| | | Issuance Under Equity
| |
| | | Issued Upon Exercise
| | | Exercise Price of
| | | Compensation Plans
| |
| | | of Outstanding Options,
| | | Outstanding Options,
| | | (Excluding Securities
| |
| | | Warrants and
| | | Warrants and
| | | Reflected in
| |
| Plan Category | | Rights(1) | | | Rights(2) | | | Column(a)) | |
| | | (In thousands, except prices) | |
| |
| Equity compensation plans approved by security holders | | | 45,105 | | | $ | 11.55 | | | | 152,373 | (3) |
| Equity compensation plans not approved by security holders | | | 24,206 | (4) | | $ | 18.93 | | | | 62,715 | (5) |
| | | | | | | | | | | | | |
| Total | | | 69,311 | | | $ | 15.04 | | | | 215,088 | |
| | | | | | | | | | | | | |
| | | | | | | | | | | | |
Plan Category | | (a)
Number of
Securities to be
Issued Upon Exercise
of Outstanding Options,
Warrants and
Rights(1) | | | (b)
Weighted Average
Exercise Price of
Outstanding Options,
Warrants and
Rights(2) | | | (c)
Number of Securities
Available for Future
Issuance Under Equity
Compensation Plans
(Excluding Securities
Reflected in
Column(a)) | |
| | | (In millions, except prices) | |
Equity compensation plans approved by security holders | | | 47 | | | $ | 10.85 | | | | 137 | (3) |
Equity compensation plans not approved by security holders | | | 11 | (4) | | $ | 16.98 | | | | 73 | (5) |
| | | | | | | | | | | | |
Total | | | 58 | | | $ | 13.05 | | | | 210 | |
| | | | | | | | | | | | |
| | |
| (1) | | Includes only options and restricted stock units (also referred to as “performance shares” under the Applied Materials, Inc. Employee Stock Incentive Plan) outstanding under Applied’s equity compensation plans, as no stock warrants or other rights were outstanding as of October 31, 2010.30, 2011. |
|
| (2) | | The weighted average exercise price calculation does not take into account any restricted stock units as they have a de minimis purchase price. |
|
| (3) | | Includes 54,071 thousand50 million shares of Applied common stock available for future issuance under the Applied Materials, Inc. Employees’ Stock Purchase Plan. Of these 54,071 thousand50 million shares, 1,932 thousand2 million are subject to purchase during the purchase period in effect as of October 31, 2010.30, 2011. |
|
| (4) | | Includes options to purchase 1,306 thousand1 million shares of Applied common stock assumed through various mergers and acquisitions, after giving effect to the applicable exchange ratios. The assumed options had a weighted average exercise price of $13.80$14.09 per share. No further shares are available for issuance under the plans under which these assumed awards were granted. |
|
| (5) | | Includes 5,315 thousand3 million shares of Applied common stock available for future issuance under the Applied Materials, Inc. Stock Purchase Plan for Offshore Employees. Of these 5,315 thousand3 million shares, 928 thousand1 million are subject to purchase during the purchase period in effect as of October 31, 2010.30, 2011. |
In addition to the options and other equity awards under Applied’s plans as of October 30, 2011 described above, subsequent to the end of fiscal year 2011 and as part of the acquisition of Varian in November 2011, Applied assumed certain outstanding options under Varian’s two stock plans then in effect. After giving effect to the merger exchange ratio, these Varian options were converted into options to purchase 5 million shares of Applied common stock. The converted options had a weighted average exercise price of $4.85 per share. No further shares are available for issuance under the Varian plans.
Applied has the following equity compensation plans that have not been approved by stockholders:
2000 Global Equity Incentive PlanThe 2000 Global Equity Incentive Plan (the 2000 Plan) was adopted effective as of June 21, 2000. The 2000 Plan provides for the grant of non-qualified stock options to employees other than officers and directors. The administrator of the 2000 Plan (either the Board of DirectorsDirec-
tors of Applied or a committee appointed by the Board) determines the terms and conditions of all stock options granted; provided, however, that (1) the exercise price generally may not be less than 100 percent of the fair market value (on the date of grant) of the stock covered by the option, and (2) the term of options can be no longer than 10 years (or 13 years in the event of death). A total of 147,000,000147 million shares have been authorized for issuance under the 2000 Plan, and 57,201,00070 million shares remain available for issuance as of October 31, 2010.
30, 2011.Stock Purchase Plan for Offshore EmployeesThe Stock Purchase Plan for Offshore Employees (the Offshore ESPP) was adopted effective as of October 16, 1995 for the benefit of employees of Applied’s participating affiliates (other than United States citizens or residents). The Offshore ESPP provides for the grant of options to purchase shares of Applied common stock through payroll deductions pursuant to one or more offerings. The administrator of the Offshore ESPP (the Board of Directors of Applied or a committee appointed by the Board) determines the terms and conditions of all options prior to the start of an offering, including the purchase price of shares, the number of shares covered by the option and when the option may be exercised. All options granted as part of an offering must be granted on the same date. Prior to December 7,
54
2009, a total of 15,800,00016 million shares had been authorized for issuance under the Offshore ESPP. Effective December 7, 2009, Applied amended the Offshore ESPP to increase the number of shares available for issuance under such plan by 5,000,0005 million shares and correspondingly amended the stockholder-approved Applied Materials, Inc. Employees’ Stock Purchase Plan (the U.S. ESPP) to reduce the number of shares available for issuance under such plan by 5,000,0005 million shares. Accordingly, as of October 31, 201030, 2011 a total of 20,800,00021 million shares have been authorized for issuance under the Offshore ESPP, and 5,315,0003 million shares remain available for issuance. These plan amendments did not result in any increase in the total aggregate number of shares authorized for issuance under the Offshore ESPP and the U.S. ESPP.
Nonemployee Director Share Purchase PlanThe Applied Materials, Inc. Nonemployee Director Share Purchase Plan was adopted effective March 22, 2005. The Nonemployee Director Share Purchase Plan provides a method by which non-employee directors may purchase Applied common stock at 100% of fair market value on the purchase date by foregoing cash they have earned as retainer fees or meeting fees. The shares generally are purchased at the same time the directors otherwise would have been paid the fees in cash. Since the directors pay full fair market value for the shares, there is no reserved amount of shares under this plan and, accordingly, the table above does not include any set number of shares available for future issuance under the plan.
Applied Materials Profit Sharing SchemeThe Applied Materials Profit Sharing Scheme was adopted effective July 3, 1996 to enable employees of Applied Materials Ireland Limited and its participating subsidiaries to purchase Applied common stock at 100% of fair market value on the purchase date. Under this plan, eligible employees may elect to forego a certain portion of their base salary and certain bonuses they have earned and that otherwise would be payable in cash to purchase shares of Applied common stock at full fair market value. Since the eligible employees pay full fair market value for the shares, there is no reserved amount of shares under this plan and, accordingly, the table above does not include any set number of shares available for future issuance under the plan.
| |
| Item 13: | Certain Relationships and Related Transactions, and Director Independence |
The information appearing in the Proxy Statement under the heading “Certain Relationships and Related Transactions” is incorporated herein by reference.
The information appearing in the Proxy Statement under the heading “Director Independence” is incorporated herein by reference.
| |
| Item 14: | Principal Accounting Fees and Services |
Information regarding principal accounting fees and services and the audit committee’s preapproval policies and procedures appears in the Proxy Statement under the headings “Fees Paid to KPMG LLP” and “Policy on Audit Committee’s Pre-Approval of Audit and PermisssiblePermissible Non-audit Services of Independent Registered Public Accounting Firm,” is incorporated herein by reference.
55
PART IV
| |
| Item 15: | Exhibits and Financial Statement Schedules |
(a) The following documents are filed as part of this Annual Report onForm 10-K:
| | | | | | | | |
| | | | | Page
Number |
| | | | Number |
| |
| (1) | | | Financial Statements: | | | | |
| | |
| | |
| | | | Consolidated Statements of Operations for each of the three years in the three-year period ended October 31, 201030, 2011 | | | 5770 | |
| | |
| | | | Consolidated Balance Sheets at October 31, 201030, 2011 and October 25, 200931, 2010 | | | 5871 | |
| | |
| | | | Consolidated Statements of Stockholders’ Equity and Comprehensive Income (Loss) for each of the three years in the three-year period ended October 31, 201030, 2011 | | | 5972 | |
| | |
| | | | Consolidated Statements of Cash Flows for each of the three years in the three-year period ended October 31, 201030, 2011 | | | 6073 | |
| | |
| | | | Notes to Consolidated Financial Statements | | | 6174 | |
| | |
| | | | Report of KPMG LLP, Independent Registered Public Accounting Firm | | | 103116 | |
| (2) | |
(2) | | Exhibits: | | | | |
| | |
| | |
| | | | The exhibits listed in the accompanying Index to Exhibits are filed or incorporated by reference as part of this Annual Report onForm 10-K | | | 104117 | |
| (3) | |
(3) | | Financial Statement Schedule: | | | | |
| | |
| | |
| | | | Schedule II — Valuation and Qualifying Accounts for each of the three years in the period ended October 31, 201030, 2011 | | | 111124 | |
All other schedules are omitted because they are not applicable or the required information is shown in the Consolidated Financial Statements or Notes thereto.
56
| | | | | | | | | | | | | |
| Fiscal Year | | 2010 | | | 2009 | | | 2008 | |
| | | (In thousands, except per share amounts) | |
| |
| Net sales | | $ | 9,548,667 | | | $ | 5,013,607 | | | $ | 8,129,240 | |
| Cost of products sold | | | 5,833,665 | | | | 3,582,802 | | | | 4,686,412 | |
| | | | | | | | | | | | | |
| Gross margin | | | 3,715,002 | | | | 1,430,805 | | | | 3,442,828 | |
| Operating expenses: | | | | | | | | | | | | |
| Research, development and engineering | | | 1,143,521 | | | | 934,115 | | | | 1,104,122 | |
| General and administrative | | | 535,820 | | | | 406,946 | | | | 505,762 | |
| Marketing and selling | | | 406,028 | | | | 327,572 | | | | 459,402 | |
| Restructuring charges and asset impairments (Note 12) | | | 245,925 | | | | 155,788 | | | | 39,948 | |
| Gain on sale of facility | | | — | | | | — | | | | 21,837 | |
| | | | | | | | | | | | | |
| Total operating expenses | | | 2,331,294 | | | | 1,824,421 | | | | 2,087,397 | |
| Income (loss) from operations | | | 1,383,708 | | | | (393,616 | ) | | | 1,355,431 | |
| Pre-tax loss of equity-method investment | | | — | | | | 34,983 | | | | 35,527 | |
| Impairments of investments and strategic investments (Note 3) | | | 12,665 | | | | 84,480 | | | | — | |
| Interest expense | | | 21,507 | | | | 21,304 | | | | 20,506 | |
| Interest income | | | 37,430 | | | | 48,580 | | | | 109,320 | |
| | | | | | | | | | | | | |
| Income (loss) before income taxes | | | 1,386,966 | | | | (485,803 | ) | | | 1,408,718 | |
| Provision (benefit) for income taxes | | | 449,100 | | | | (180,476 | ) | | | 447,972 | |
| | | | | | | | | | | | | |
| Net income (loss) | | $ | 937,866 | | | $ | (305,327 | ) | | $ | 960,746 | |
| | | | | | | | | | | | | |
| Earnings (loss) per share: | | | | | | | | | | | | |
| Basic | | $ | 0.70 | | | $ | (0.23 | ) | | $ | 0.71 | |
| Diluted | | $ | 0.70 | | | $ | (0.23 | ) | | $ | 0.70 | |
| Weighted average number of shares: | | | | | | | | | | | | |
| Basic | | | 1,339,949 | | | | 1,333,091 | | | | 1,354,176 | |
| Diluted | | | 1,348,804 | | | | 1,333,091 | | | | 1,374,507 | |
| | | | | | | | | | | | |
Fiscal Year | | 2011 | | | 2010 | | | 2009 | |
| | | (In millions, except per share amounts) | |
Net sales | | $ | 10,517 | | | $ | 9,549 | | | $ | 5,014 | |
Cost of products sold | | | 6,157 | | | | 5,834 | | | | 3,583 | |
| | | | | | | | | | | | |
Gross margin | | | 4,360 | | | | 3,715 | | | | 1,431 | |
Operating expenses: | | | | | | | | | | | | |
Research, development and engineering | | | 1,118 | | | | 1,143 | | | | 934 | |
Selling, general and administrative | | | 901 | | | | 942 | | | | 735 | |
Restructuring charges and asset impairments (Note 11) | | | (30 | ) | | | 246 | | | | 156 | |
Gain on sale of facilities, net (Note 7) | | | (27 | ) | | | — | | | | — | |
| | | | | | | | | | | | |
Total operating expenses | | | 1,962 | | | | 2,331 | | | | 1,825 | |
Income (loss) from operations | | | 2,398 | | | | 1,384 | | | | (394 | ) |
Pre-tax loss of equity-method investment | | | — | | | | — | | | | 35 | |
Impairments of investments and strategic investments (Notes 3 and 4) | | | 3 | | | | 13 | | | | 84 | |
Interest and other expenses (Note 10) | | | 59 | | | | 21 | | | | 21 | |
Interest and other income, net | | | 42 | | | | 37 | | | | 48 | |
| | | | | | | | | | | | |
Income (loss) before income taxes | | | 2,378 | | | | 1,387 | | | | (486 | ) |
Provision (benefit) for income taxes | | | 452 | | | | 449 | | | | (181 | ) |
| | | | | | | | | | | | |
Net income (loss) | | $ | 1,926 | | | $ | 938 | | | $ | (305 | ) |
| | | | | | | | | | | | |
Earnings (loss) per share: | | | | | | | | | | | | |
Basic | | $ | 1.46 | | | $ | 0.70 | | | $ | (0.23 | ) |
Diluted | | $ | 1.45 | | | $ | 0.70 | | | $ | (0.23 | ) |
Weighted average number of shares: | | | | | | | | | | | | |
Basic | | | 1,319 | | | | 1,340 | | | | 1,333 | |
Diluted | | | 1,330 | | | | 1,349 | | | | 1,333 | |
See accompanying Notes to Consolidated Financial Statements.
57
| | | | | | | | | |
| | | October 31,
| | | October 25,
| |
| | | 2010 | | | 2009 | |
| | | (In thousands, except per share amounts) | |
| |
ASSETS |
| Current assets: | | | | | | | | |
| Cash and cash equivalents (Note 3) | | $ | 1,857,664 | | | $ | 1,576,381 | |
| Short-term investments (Note 3) | | | 726,918 | | | | 638,349 | |
| Accounts receivable, net (Note 6) | | | 1,831,006 | | | | 1,041,495 | |
| Inventories (Note 7) | | | 1,547,378 | | | | 1,627,457 | |
| Deferred income taxes, net (Note 15) | | | 512,944 | | | | 356,336 | |
| Income taxes receivable (Note 15) | | | 857 | | | | 184,760 | |
| Other current assets | | | 288,548 | | | | 264,169 | |
| | | | | | | | | |
| Total current assets | | | 6,765,315 | | | | 5,688,947 | |
| Long-term investments (Note 3) | | | 1,307,283 | | | | 1,052,165 | |
| Property, plant and equipment, net (Note 7) | | | 963,004 | | | | 1,090,433 | |
| Goodwill, net (Note 8) | | | 1,336,426 | | | | 1,170,932 | |
| Purchased technology and other intangible assets, net (Note 8) | | | 286,821 | | | | 306,416 | |
| Deferred income taxes and other assets (Note 15) | | | 284,496 | | | | 265,350 | |
| | | | | | | | | |
| Total assets | | $ | 10,943,345 | | | $ | 9,574,243 | |
| | | | | | | | | |
| |
| LIABILITIES AND STOCKHOLDERS’ EQUITY |
| Current liabilities: | | | | | | | | |
| Current portion of long-term debt | | $ | 1,258 | | | $ | 1,240 | |
| Accounts payable and accrued expenses (Note 7) | | | 1,765,966 | | | | 1,061,502 | |
| Customer deposits and deferred revenue (Note 7) | | | 847,231 | | | | 864,280 | |
| Income taxes payable (Note 15) | | | 273,421 | | | | 12,435 | |
| | | | | | | | | |
| Total current liabilities | | | 2,887,876 | | | | 1,939,457 | |
| Long-term debt (Note 11) | | | 204,271 | | | | 200,654 | |
| Employee benefits and other liabilities (Note 14) | | | 315,085 | | | | 339,524 | |
| | | | | | | | | |
| Total liabilities | | | 3,407,232 | | | | 2,479,635 | |
| | | | | | | | | |
| Commitments and contingencies (Note 16) | | | | | | | | |
| Stockholders’ equity (Note 13): | | | | | | | | |
| Preferred stock: $.01 par value per share; 1,000 shares authorized; no shares issued | | | — | | | | — | |
| Common stock: $.01 par value per share; 2,500,000 shares authorized; 1,327,998 and 1,340,917 shares outstanding at 2010 and 2009, respectively | | | 13,280 | | | | 13,409 | |
| Additional paid-in capital | | | 5,406,598 | | | | 5,195,437 | |
| Retained earnings | | | 11,510,843 | | | | 10,934,004 | |
| Treasury stock: 537,056 and 508,254 shares at 2010 and 2009, respectively, net | | | (9,396,274 | ) | | | (9,046,562 | ) |
| Accumulated other comprehensive income (loss) | | | 1,666 | | | | (1,680 | ) |
| | | | | | | | | |
| Total stockholders’ equity | | | 7,536,113 | | | | 7,094,608 | |
| | | | | | | | | |
| Total liabilities and stockholders’ equity | | $ | 10,943,345 | | | $ | 9,574,243 | |
| | | | | | | | | |
| | | | | | | | |
| | | October 30,
2011 | | | October 31,
2010 | |
| | | (In millions, except per share
amounts) | |
| ASSETS | |
Current assets: | | | | | | | | |
Cash and cash equivalents (Notes 3 and 4) | | $ | 5,960 | | | $ | 1,858 | |
Short-term investments (Notes 3 and 4) | | | 283 | | | | 727 | |
Accounts receivable, net (Note 6) | | | 1,532 | | | | 1,831 | |
Inventories (Note 7) | | | 1,701 | | | | 1,547 | |
Deferred income taxes, net (Note 14) | | | 580 | | | | 513 | |
Other current assets | | | 299 | | | | 289 | |
| | | | | | | | |
Total current assets | | | 10,355 | | | | 6,765 | |
Long-term investments (Notes 3 and 4) | | | 931 | | | | 1,307 | |
Property, plant and equipment, net (Note 7) | | | 866 | | | | 963 | |
Goodwill (Note 8) | | | 1,335 | | | | 1,336 | |
Purchased technology and other intangible assets, net (Note 8) | | | 211 | | | | 287 | |
Deferred income taxes and other assets (Note 14) | | | 163 | | | | 285 | |
| | | | | | | | |
Total assets | | $ | 13,861 | | | $ | 10,943 | |
| | | | | | | | |
| LIABILITIES AND STOCKHOLDERS’ EQUITY | |
Current liabilities: | | | | | | | | |
Current portion of long-term debt (Note 10) | | $ | — | | | $ | 1 | |
Accounts payable and accrued expenses (Note 7) | | | 1,520 | | | | 1,766 | |
Customer deposits and deferred revenue (Note 7) | | | 1,116 | | | | 847 | |
Income taxes payable (Note 14) | | | 158 | | | | 274 | |
| | | | | | | | |
Total current liabilities | | | 2,794 | | | | 2,888 | |
Long-term debt (Note 10) | | | 1,947 | | | | 204 | |
Employee benefits and other liabilities (Note 13) | | | 320 | | | | 315 | |
| | | | | | | | |
Total liabilities | | | 5,061 | | | | 3,407 | |
| | | | | | | | |
Commitments and contingencies (Note 15) | | | | | | | | |
Stockholders’ equity (Note 12): | | | | | | | | |
Preferred stock: $.01 par value per share; 1 shares authorized; no shares issued | | | — | | | | — | |
Common stock: $.01 par value per share; 2,500 shares authorized; 1,306 and 1,328 shares outstanding at 2011 and 2010, respectively | | | 13 | | | | 13 | |
Additional paid-in capital | | | 5,616 | | | | 5,406 | |
Retained earnings | | | 13,029 | | | | 11,511 | |
Treasury stock: 573 and 537 shares at 2011 and 2010, respectively, net | | | (9,864 | ) | | | (9,396 | ) |
Accumulated other comprehensive income | | | 6 | | | | 2 | |
| | | | | | | | |
Total stockholders’ equity | | | 8,800 | | | | 7,536 | |
| | | | | | | | |
Total liabilities and stockholders’ equity | | $ | 13,861 | | | $ | 10,943 | |
| | | | | | | | |
See accompanying Notes to Consolidated Financial Statements.
58
APPLIED MATERIALS, INC.
INC AND COMPREHENSIVE INCOME (LOSS)
| | | | | | | | | | | | | | | | | | | | | | | | | | | | | | | | | |
| | | | | | | | | | | | | | | | | | | | | Accumulated
| | | | |
| | | | | | | | | Additional
| | | | | | | | | | | | Other
| | | | |
| | | Common Stock | | | Paid-In
| | | Retained
| | | Treasury Stock | | | Comprehensive
| | | | |
| | | Shares | | | Amount | | | Capital | | | Earnings | | | Shares | | | Amount | | | Income (Loss) | | | Total | |
| |
| Balance at October 28, 2007 | | | 1,385,711 | | | $ | 13,857 | | | $ | 4,658,832 | | | $ | 10,863,291 | | | | 434,686 | | | $ | (7,725,924 | ) | | $ | 11,353 | | | $ | 7,821,409 | |
| Components of comprehensive income, net of tax: | | | | | | | | | | | | | | | | | | | | | | | | | | | | | | | | |
| Net income | | | — | | | | — | | | | — | | | | 960,746 | | | | — | | | | — | | | | — | | | | 960,746 | |
| Change in unrealized net loss on investments | | | — | | | | — | | | | — | | | | — | | | | — | | | | — | | | | (41,739 | ) | | | (41,739 | ) |
| Change in unrealized net gain on derivative instruments | | | — | | | | — | | | | — | | | | — | | | | — | | | | — | | | | 9,448 | | | | 9,448 | |
| Change in defined benefit plan liability | | | — | | | | — | | | | — | | | | — | | | | — | | | | — | | | | (7,440 | ) | | | (7,440 | ) |
| Change in retiree medical benefit | | | — | | | | — | | | | — | | | | — | | | | — | | | | — | | | | 1,866 | | | | 1,866 | |
| Translation adjustments | | | — | | | | — | | | | — | | | | — | | | | — | | | | — | | | | (58 | ) | | | (58 | ) |
| | | | | | | | | | | | | | | | | | | | | | | | | | | | | | | | | |
| Comprehensive income | | | | | | | | | | | | | | | | | | | | | | | | | | | | | | | 922,823 | |
| Cumulative effect of adoption of interpretative tax guidance on uncertainties in income taxes | | | — | | | | — | | | | — | | | | 100,000 | | | | — | | | | — | | | | — | | | | 100,000 | |
| Dividends | | | — | | | | — | | | | — | | | | (322,749 | ) | | | — | | | | — | | | | — | | | | (322,749 | ) |
| Share-based compensation | | | — | | | | — | | | | 178,943 | | | | — | | | | — | | | | — | | | | — | | | | 178,943 | |
| Issuance under stock plans, net of a tax detriment of $11,519 and other | | | 28,213 | | | | 283 | | | | 258,119 | | | | — | | | | (4,617 | ) | | | 90,114 | | | | — | | | | 348,516 | |
| Common stock repurchases | | | (83,163 | ) | | | (832 | ) | | | — | | | | — | | | | 83,163 | | | | (1,499,152 | ) | | | — | | | | (1,499,984 | ) |
| | | | | | | | | | | | | | | | | | | | | | | | | | | | | | | | | |
| Balance at October 26, 2008 | | | 1,330,761 | | | $ | 13,308 | | | $ | 5,095,894 | | | $ | 11,601,288 | | | | 513,232 | | | $ | (9,134,962 | ) | | $ | (26,570 | ) | | $ | 7,548,958 | |
| Components of comprehensive loss, net of tax: | | | | | | | | | | | | | | | | | | | | | | | | | | | | | | | | |
| Net loss | | | — | | | | — | | | | — | | | | (305,327 | ) | | | — | | | | — | | | | — | | | | (305,327 | ) |
| Change in unrealized net gain on investments | | | — | | | | — | | | | — | | | | — | | | | — | | | | — | | | | 44,956 | | | | 44,956 | |
| Change in unrealized net gain on derivative instruments | | | — | | | | — | | | | — | | | | — | | | | — | | | | — | | | | (7,729 | ) | | | (7,729 | ) |
| Change in defined benefit plan liability | | | — | | | | — | | | | — | | | | — | | | | — | | | | — | | | | (12,492 | ) | | | (12,492 | ) |
| Change in retiree medical benefit | | | — | | | | — | | | | — | | | | — | | | | — | | | | — | | | | (719 | ) | | | (719 | ) |
| Translation adjustments | | | — | | | | — | | | | — | | | | — | | | | — | | | | — | | | | 874 | | | | 874 | |
| | | | | | | | | | | | | | | | | | | | | | | | | | | | | | | | | |
| Comprehensive loss | | | | | | | | | | | | | | | | | | | | | | | | | | | | | | | (280,437 | ) |
| Change in measurement date to apply authoritative guidance on defined benefit plans | | | — | | | | — | | | | — | | | | (1,942 | ) | | | — | | | | — | | | | — | | | | (1,942 | ) |
| Dividends | | | — | | | | — | | | | — | | | | (320,117 | ) | | | — | | | | — | | | | — | | | | (320,117 | ) |
| Share-based compensation | | | — | | | | — | | | | 147,160 | | | | — | | | | — | | | | — | | | | — | | | | 147,160 | |
| Issuance under stock plans, net of a tax detriment of $13,409 and other | | | 12,098 | | | | 121 | | | | (47,617 | ) | | | (39,898 | ) | | | (6,920 | ) | | | 111,286 | | | | — | | | | 23,892 | |
| Common stock repurchases | | | (1,942 | ) | | | (20 | ) | | | — | | | | — | | | | 1,942 | | | | (22,886 | ) | | | — | | | | (22,906 | ) |
| | | | | | | | | | | | | | | | | | | | | | | | | | | | | | | | | |
| Balance at October 25, 2009 | | | 1,340,917 | | | $ | 13,409 | | | $ | 5,195,437 | | | $ | 10,934,004 | | | | 508,254 | | | $ | (9,046,562 | ) | | $ | (1,680 | ) | | $ | 7,094,608 | |
| Components of comprehensive income, net of tax: | | | | | | | | | | | | | | | | | | | | | | | | | | | | | | | | |
| Net income | | | — | | | | — | | | | — | | | | 937,866 | | | | — | | | | — | | | | — | | | | 937,866 | |
| Change in unrealized net gain on investments | | | — | | | | — | | | | — | | | | — | | | | — | | | | — | | | | 4,410 | | | | 4,410 | |
| Change in unrealized net gain on derivative instruments | | | — | | | | — | | | | — | | | | — | | | | — | | | | — | | | | 4,000 | | | | 4,000 | |
| Change in defined benefit plan liability | | | — | | | | — | | | | — | | | | — | | | | — | | | | — | | | | (6,698 | ) | | | (6,698 | ) |
| Change in retiree medical benefit | | | — | | | | — | | | | — | | | | — | | | | — | | | | — | | | | (284 | ) | | | (284 | ) |
| Translation adjustments | | | — | | | | — | | | | — | | | | — | | | | — | | | | — | | | | 1,918 | | | | 1,918 | |
| | | | | | | | | | | | | | | | | | | | | | | | | | | | | | | | | |
| Comprehensive income | | | | | | | | | | | | | | | | | | | | | | | | | | | | | | | 941,212 | |
| Dividends | | | — | | | | — | | | | — | | | | (361,027 | ) | | | — | | | | — | | | | — | | | | (361,027 | ) |
| Share-based compensation | | | — | | | | — | | | | 126,070 | | | | — | | | | — | | | | — | | | | — | | | | 126,070 | |
| Issuance under stock plans, net of a tax detriment of $27,678 and other | | | 15,883 | | | | 159 | | | | 85,091 | | | | — | | | | — | | | | — | | | | — | | | | 85,250 | |
| Common stock repurchases | | | (28,802 | ) | | | (288 | ) | | | — | | | | — | | | | 28,802 | | | | (349,712 | ) | | | — | | | | (350,000 | ) |
| | | | | | | | | | | | | | | | | | | | | | | | | | | | | | | | | |
| Balance at October 31, 2010 | | | 1,327,998 | | | $ | 13,280 | | | $ | 5,406,598 | | | $ | 11,510,843 | | | | 537,056 | | | $ | (9,396,274 | ) | | $ | 1,666 | | | $ | 7,536,113 | |
| | | | | | | | | | | | | | | | | | | | | | | | | | | | | | | | | |
| | | | | | | | | | | | | | | | | | | | | | | | | | | | | | | | |
| | | | | | Additional
Paid-In
Capital | | | | | | | | | | | | Accumulated
Other
Comprehensive
Income (Loss) | | | Total | |
| | | Common Stock | | | | Retained
Earnings | | | Treasury Stock | | | |
| | | Shares | | | Amount | | | | | Shares | | | Amount | | | |
| | | (In millions) | |
Balance at October 26, 2008 | | | 1,331 | | | $ | 13 | | | $ | 5,096 | | | $ | 11,601 | | | | 513 | | | $ | (9,134 | ) | | $ | (27 | ) | | $ | 7,549 | |
Components of comprehensive loss, net of tax: | | | | | | | | | | | | | | | | | | | | | | | | | | | | | | | | |
Net loss | | | — | | | | — | | | | — | | | | (305 | ) | | | — | | | | — | | | | — | | | | (305 | ) |
Change in unrealized net gain on investments | | | — | | | | — | | | | — | | | | — | | | | — | | | | — | | | | 45 | | | | 45 | |
Change in unrealized net gain on derivative instruments | | | — | | | | — | | | | — | | | | — | | | | — | | | | — | | | | (8 | ) | | | (8 | ) |
Change in defined benefit plan liability | | | — | | | | — | | | | — | | | | — | | | | — | | | | — | | | | (12 | ) | | | (12 | ) |
Change in retiree medical benefit | | | — | | | | — | | | | — | | | | — | | | | — | | | | — | | | | (1 | ) | | | (1 | ) |
Translation adjustments | | | — | | | | — | | | | — | | | | — | | | | — | | | | — | | | | 1 | | | | 1 | |
| | | | | | | | | | | | | | | | | | | | | | | | | | | | | | | | |
Comprehensive loss | | | | | | | | | | | | | | | | | | | | | | | | | | | | | | | (280 | ) |
Change in measurement date to apply authoritative guidance on defined benefit plans | | | — | | | | — | | | | — | | | | (2 | ) | | | — | | | | — | | | | — | | | | (2 | ) |
Dividends | | | — | | | | — | | | | — | | | | (320 | ) | | | — | | | | — | | | | — | | | | (320 | ) |
Share-based compensation | | | — | | | | — | | | | 147 | | | | — | | | | — | | | | — | | | | — | | | | 147 | |
Issuance under stock plans, net of a tax detriment of $13 and other | | | 12 | | | | — | | | | (48 | ) | | | (40 | ) | | | (7 | ) | | | 111 | | | | — | | | | 23 | |
Common stock repurchases | | | (2 | ) | | | — | | | | — | | | | — | | | | 2 | | | | (23 | ) | | | — | | | | (23 | ) |
| | | | | | | | | | | | | | | | | | | | | | | | | | | | | | | | |
Balance at October 25, 2009 | | | 1,341 | | | $ | 13 | | | $ | 5,195 | | | $ | 10,934 | | | | 508 | | | $ | (9,046 | ) | | $ | (2 | ) | | $ | 7,094 | |
Components of comprehensive income, net of tax: | | | | | | | | | | | | | | | | | | | | | | | | | | | | | | | | |
Net income | | | — | | | | — | | | | — | | | | 938 | | | | — | | | | — | | | | — | | | | 938 | |
Change in unrealized net gain on investments | | | — | | | | — | | | | — | | | | — | | | | — | | | | — | | | | 4 | | | | 4 | |
Change in unrealized net gain on derivative instruments | | | — | | | | — | | | | — | | | | — | | | | — | | | | — | | | | 4 | | | | 4 | |
Change in defined benefit plan liability | | | — | | | | — | | | | — | | | | — | | | | — | | | | — | | | | (6 | ) | | | (6 | ) |
Translation adjustments | | | — | | | | — | | | | — | | | | — | | | | — | | | | — | | | | 2 | | | | 2 | |
| | | | | | | | | | | | | | | | | | | | | | | | | | | | | | | | |
Comprehensive income | | | | | | | | | | | | | | | | | | | | | | | | | | | | | | | 942 | |
Dividends | | | — | | | | — | | | | — | | | | (361 | ) | | | — | | | | — | | | | — | | | | (361 | ) |
Share-based compensation | | | — | | | | — | | | | 126 | | | | — | | | | — | | | | — | | | | — | | | | 126 | |
Issuance under stock plans, net of a tax detriment of $28 and other | | | 16 | | | | — | | | | 85 | | | | — | | | | — | | | | — | | | | — | | | | 85 | |
Common stock repurchases | | | (29 | ) | | | — | | | | — | | | | — | | | | 29 | | | | (350 | ) | | | — | | | | (350 | ) |
| | | | | | | | | | | | | | | | | | | | | | | | | | | | | | | | |
Balance at October 31, 2010 | | | 1,328 | | | $ | 13 | | | $ | 5,406 | | | $ | 11,511 | | | | 537 | | | $ | (9,396 | ) | | $ | 2 | | | $ | 7,536 | |
Components of comprehensive income, net of tax: | | | | | | | | | | | | | | | | | | | | | | | | | | | | | | | | |
Net income | | | — | | | | — | | | | — | | | | 1,926 | | | | — | | | | — | | | | — | | | | 1,926 | |
Change in unrealized net gain on investments | | | — | | | | — | | | | — | | | | — | | | | — | | | | — | | | | (8 | ) | | | (8 | ) |
Change in unrealized net gain on derivative instruments | | | — | | | | — | | | | — | | | | — | | | | — | | | | — | | | | (4 | ) | | | (4 | ) |
Change in defined benefit plan liability | | | — | | | | — | | | | — | | | | — | | | | — | | | | — | | | | 14 | | | | 14 | |
Translation adjustments | | | — | | | | — | | | | — | | | | — | | | | — | | | | — | | | | 2 | | | | 2 | |
| | | | | | | | | | | | | | | | | | | | | | | | | | | | | | | | |
Comprehensive income | | | | | | | | | | | | | | | | | | | | | | | | | | | | | | | 1,930 | |
Dividends | | | — | | | | — | | | | — | | | | (408 | ) | | | — | | | | — | | | | — | | | | (408 | ) |
Share-based compensation | | | — | | | | — | | | | 146 | | | | — | | | | — | | | | — | | | | — | | | | 146 | |
Issuance under stock plans, net of a tax detriment of $5 and other | | | 14 | | | | — | | | | 64 | | | | — | | | | — | | | | — | | | | — | | | | 64 | |
Common stock repurchases | | | (36 | ) | | | — | | | | — | | | | — | | | | 36 | | | | (468 | ) | | | — | | | | (468 | ) |
| | | | | | | | | | | | | | | | | | | | | | | | | | | | | | | | |
Balance at October 30, 2011 | | | 1,306 | | | $ | 13 | | | $ | 5,616 | | | $ | 13,029 | | | | 573 | | | $ | (9,864 | ) | | $ | 6 | | | $ | 8,800 | |
| | | | | | | | | | | | | | | | | | | | | | | | | | | | | | | | |
See accompanying Notes to Consolidated Financial Statements.
59
| | | | | | | | | | | | | |
| Fiscal Year | | 2010 | | | 2009 | | | 2008 | |
| | | (In thousands) | |
| |
| Cash flows from operating activities: | | | | | | | | | | | | |
| Net income (loss) | | $ | 937,866 | | | $ | (305,327 | ) | | $ | 960,746 | |
| Adjustments required to reconcile net income (loss) to cash provided by operating activities: | | | | | | | | | | | | |
| Depreciation and amortization | | | 304,515 | | | | 291,203 | | | | 320,051 | |
| Loss on fixed asset retirements | | | 20,034 | | | | 24,017 | | | | 6,826 | |
| Provision for bad debts | | | 17,000 | | | | 62,539 | | | | 2,456 | |
| Restructuring charges and asset impairments | | | 245,925 | | | | 155,788 | | | | 39,948 | |
| Deferred income taxes | | | (186,057 | ) | | | 18,863 | | | | (58,259 | ) |
| Net recognized loss on investments | | | 20,473 | | | | 10,231 | | | | 4,392 | |
| Pre-tax loss of equity method investment | | | — | | | | 34,983 | | | | 35,527 | |
| Impairments of investments | | | 12,665 | | | | 84,480 | | | | — | |
| Excess tax benefits from share-based compensation plans | | | — | | | | — | | | | (7,491 | ) |
| Share-based compensation | | | 126,070 | | | | 147,160 | | | | 178,943 | |
| Changes in operating assets and liabilities, net of amounts acquired: | | | | | | | | | | | | |
| Accounts receivable | | | (766,937 | ) | | | 586,993 | | | | 421,834 | |
| Inventories | | | 144,626 | | | | 359,560 | | | | (638,256 | ) |
| Income taxes receivable | | | 183,903 | | | | (59,155 | ) | | | (125,605 | ) |
| Other current assets | | | (4,590 | ) | | | 94,740 | | | | 94,247 | |
| Other assets | | | (6,690 | ) | | | (6,530 | ) | | | (394 | ) |
| Accounts payable and accrued expenses | | | 469,049 | | | | (660,006 | ) | | | (260,041 | ) |
| Customer deposits and deferred revenue | | | (22,908 | ) | | | (361,455 | ) | | | 622,645 | |
| Income taxes payable | | | 261,909 | | | | (229,128 | ) | | | 133,731 | |
| Employee benefits and other liabilities | | | (34,000 | ) | | | 83,709 | | | | (20,832 | ) |
| | | | | | | | | | | | | |
| Cash provided by operating activities | | | 1,722,853 | | | | 332,665 | | | | 1,710,468 | |
| | | | | | | | | | | | | |
| Cash flows from investing activities: | | | | | | | | | | | | |
| Capital expenditures | | | (169,081 | ) | | | (248,427 | ) | | | (287,906 | ) |
| Cash paid for acquisitions, net of cash acquired | | | (322,599 | ) | | | — | | | | (235,324 | ) |
| Proceeds from sale of facility | | | — | | | | — | | | | 42,210 | |
| Proceeds from sales and maturities of investments | | | 1,407,804 | | | | 1,317,365 | | | | 5,939,509 | |
| Purchases of investments | | | (1,777,736 | ) | | | (956,249 | ) | | | (5,534,475 | ) |
| | | | | | | | | | | | | |
| Cash provided by (used in) investing activities | | | (861,612 | ) | | | 112,689 | | | | (75,986 | ) |
| | | | | | | | | | | | | |
| Cash flows used for financing activities: | | | | | | | | | | | | |
| Debt repayments, net | | | (6,441 | ) | | | (750 | ) | | | (2,117 | ) |
| Proceeds from common stock issuances | | | 128,832 | | | | 61,824 | | | | 393,978 | |
| Common stock repurchases | | | (350,000 | ) | | | (22,906 | ) | | | (1,499,984 | ) |
| Excess tax benefits from share-based compensation plans | | | — | | | | — | | | | 7,491 | |
| Payments of dividends to stockholders | | | (348,522 | ) | | | (319,507 | ) | | | (325,405 | ) |
| | | | | | | | | | | | | |
| Cash used in financing activities | | | (576,131 | ) | | | (281,339 | ) | | | (1,426,037 | ) |
| | | | | | | | | | | | | |
| Effect of exchange rate changes on cash and cash equivalents | | | (3,827 | ) | | | 742 | | | | 457 | |
| | | | | | | | | | | | | |
| Increase in cash and cash equivalents | | | 281,283 | | | | 164,757 | | | | 208,902 | |
| Cash and cash equivalents — beginning of year | | | 1,576,381 | | | | 1,411,624 | | | | 1,202,722 | |
| | | | | | | | | | | | | |
| Cash and cash equivalents — end of year | | $ | 1,857,664 | | | $ | 1,576,381 | | | $ | 1,411,624 | |
| | | | | | | | | | | | | |
| Supplemental cash flow information: | | | | | | | | | | | | |
| Cash payments for income taxes | | $ | 388,144 | | | $ | 206,537 | | | $ | 490,826 | |
| Cash refunds for income taxes | | $ | 200,660 | | | $ | 72,297 | | | $ | 122,367 | |
| Cash payments for interest | | $ | 14,485 | | | $ | 14,372 | | | $ | 14,580 | |
| | | | | | | | | | | | |
Fiscal Year | | 2011 | | | 2010 | | | 2009 | |
| | | (In millions) | |
Cash flows from operating activities: | | | | | | | | | | | | |
Net income (loss) | | $ | 1,926 | | | $ | 938 | | | $ | (305 | ) |
Adjustments required to reconcile net income (loss) to cash provided by operating activities: | | | | | | | | | | | | |
Depreciation and amortization | | | 246 | | | | 305 | | | | 291 | |
Net loss (gain) on dispositions and fixed asset retirements | | | (13 | ) | | | 20 | | | | 24 | |
Provision for bad debts | | | 5 | | | | 17 | | | | 63 | |
Restructuring charges and asset impairments | | | (30 | ) | | | 246 | | | | 156 | |
Deferred income taxes | | | 122 | | | | (186 | ) | | | 19 | |
Net recognized loss on investments | | | 19 | | | | 20 | | | | 10 | |
Pre-tax loss of equity method investment | | | — | | | | — | | | | 35 | |
Impairments of investments | | | — | | | | 13 | | | | 84 | |
Share-based compensation | | | 146 | | | | 126 | | | | 147 | |
Changes in operating assets and liabilities, net of amounts acquired: | | | | | | | | | | | | |
Accounts receivable | | | 292 | | | | (767 | ) | | | 587 | |
Inventories | | | (163 | ) | | | 145 | | | | 360 | |
Other current assets | | | (23 | ) | | | 179 | | | | 36 | |
Other assets | | | (38 | ) | | | (7 | ) | | | (7 | ) |
Accounts payable and accrued expenses | | | (221 | ) | | | 469 | | | | (660 | ) |
Customer deposits and deferred revenue | | | 267 | | | | (23 | ) | | | (362 | ) |
Income taxes payable | | | (89 | ) | | | 262 | | | | (229 | ) |
Employee benefits and other liabilities | | | (20 | ) | | | (34 | ) | | | 84 | |
| | | | | | | | | | | | |
Cash provided by operating activities | | | 2,426 | | | | 1,723 | | | | 333 | |
| | | | | | | | | | | | |
Cash flows from investing activities: | | | | | | | | | | | | |
Capital expenditures | | | (209 | ) | | | (169 | ) | | | (249 | ) |
Cash paid for acquisitions, net of cash acquired | | | — | | | | (323 | ) | | | — | |
Proceeds from sale of facilities and dispositions | | | 130 | | | | — | | | | — | |
Proceeds from sales and maturities of investments | | | 1,926 | | | | 1,408 | | | | 1,317 | |
Purchases of investments | | | (1,137 | ) | | | (1,778 | ) | | | (956 | ) |
| | | | | | | | | | | | |
Cash provided by (used in) investing activities | | | 710 | | | | (862 | ) | | | 112 | |
| | | | | | | | | | | | |
Cash flows from financing activities: | | | | | | | | | | | | |
Debt borrowings (repayments), net | | | 1,744 | | | | (6 | ) | | | (1 | ) |
Payments of debt issuance costs | | | (14 | ) | | | — | | | | — | |
Proceeds from common stock issuances | | | 95 | | | | 129 | | | | 62 | |
Common stock repurchases | | | (468 | ) | | | (350 | ) | | | (23 | ) |
Payments of dividends to stockholders | | | (397 | ) | | | (349 | ) | | | (319 | ) |
| | | | | | | | | | | | |
Cash provided by (used in) financing activities | | | 960 | | | | (576 | ) | | | (281 | ) |
| | | | | | | | | | | | |
Effect of exchange rate changes on cash and cash equivalents | | | 6 | | | | (3 | ) | | | 1 | |
| | | | | | | | | | | | |
Increase in cash and cash equivalents | | | 4,102 | | | | 282 | | | | 165 | |
Cash and cash equivalents — beginning of year | | | 1,858 | | | | 1,576 | | | | 1,411 | |
| | | | | | | | | | | | |
Cash and cash equivalents — end of year | | $ | 5,960 | | | $ | 1,858 | | | $ | 1,576 | |
| | | | | | | | | | | | |
Supplemental cash flow information: | | | | | | | | | | | | |
Cash payments for income taxes | | $ | 761 | | | $ | 388 | | | $ | 207 | |
Cash refunds from income taxes | | $ | 289 | | | $ | 201 | | | $ | 72 | |
Cash payments for interest | | $ | 14 | | | $ | 14 | | | $ | 14 | |
See accompanying Notes to Consolidated Financial Statements.
60
NOTES TO CONSOLIDATED FINANCIAL STATEMENTS
| |
| Note 1 | Summary of Significant Accounting Policies |
Principles of Consolidation and Basis of Presentation
The consolidated financial statements include the accounts of Applied Materials, Inc. and its subsidiaries (Applied or the Company) after elimination of intercompany balances and transactions. All references to a fiscal year apply to Applied’s fiscal year which ends on the last Sunday in October. Fiscal 2011 and 2009 contained 52 weeks each, while fiscal 2010 contained 53 weeks, whileweeks. Each fiscal quarter of 2011 and 2009 and 2008 contained 52 weeks each.13 weeks. The first quarter of fiscal 2010 contained 14 weeks, while the second, third, and fourth quarters of fiscal 2010 contained 13 weeks. Each fiscal quarter of 2009 and 2008 contained 13 weeks.
The preparation of financial statements in conformity with accounting principles generally accepted in the United States of America requires management to make judgments, estimates and assumptions that affect the amounts reported in the financial statements and accompanying notes. Actual results could differ materially from those estimates. On an ongoing basis, Applied evaluates its estimates, including those related to accounts receivable and sales allowances, fair values of financial instruments, inventories, intangible assets and goodwill, useful lives of intangible assets and property and equipment, fair values of share-based awards, and income taxes, among others. Applied bases its estimates on historical experience and on various other assumptions that are believed to be reasonable, the results of which form the basis for making judgments about the carrying values of assets and liabilities.
All highly-liquid investments with a remaining maturity of three months or less at the time of purchase are considered to be cash equivalents. Cash equivalents consistsconsist primarily of investments in institutional money market funds.
All of Applied’s investments are classified asavailable-for-sale at the respective balance sheet dates. Investments classified asavailable-for-sale are recorded at fair value based upon quoted market prices, and any temporary difference between the cost and fair value of an investment is presented as a separate component of accumulated other comprehensive income (loss). The specific identification method is used to determine the gains and losses on investments.
Inventories are stated at the lower of cost or market, with cost determined on afirst-in, first-out (FIFO) basis. Applied adjusts inventory carrying value for estimated obsolescence equal to the difference between the cost of inventory and the estimated market value based upon assumptions about future demand and market conditions. Applied fully reserves for inventories and noncancelable purchase orders for inventory deemed obsolete. Applied performs periodic reviews of inventory items to identify excess inventories on hand by comparing on-hand balances to anticipated usage using recent historical activity as well as anticipated or forecasted demand. If estimates of customer demand diminish further or market conditions become less favorable than those projected by Applied, additional inventory adjustments may be required. During fiscal 2010, Applied incurred inventory-related charges, including $330 million associated with SunFab™ thin film solar equipment.
APPLIED MATERIALS, INC.
NOTES TO CONSOLIDATED FINANCIAL STATEMENTS — (Continued)
Property, Plant and Equipment
Property, plant and equipment is stated at cost. Depreciation is provided over the estimated useful lives of the assets using the straight-line method. Estimated useful lives for financial reporting purposes are as follows:
61
APPLIED MATERIALS, INC.
NOTES TO CONSOLIDATED FINANCIAL STATEMENTS — (Continued)
buildings and improvements, 3 to 30 years; demonstration and manufacturing equipment, 3 to 5 years; software, 3 to 5 years; and furniture, fixtures and other equipment, 3 to 15 years. Land improvements are amortized over the shorter of 15 years or the estimated useful life. Leasehold improvements are amortized over the shorter of five years or the lease term.
Goodwill and indefinite-lived assets are not amortized, but are reviewed for impairment annually during the fourth quarter of each fiscal year. Purchased technology and other intangible assets are presented at cost, net of accumulated amortization, and are amortized over their estimated useful lives of 1 to 15 years using the straight-line method.
Applied reviews long-lived assets for impairment whenever events or changes in circumstances indicate that the carrying amount of these assets may not be recoverable. Applied assesses these assets for impairment based on estimated future cash flows from these assets.
Effective in the first quarter of fiscal 2010, Applied adopted revised authoritative guidance on business combinations that covers the measurement of acquirer shares issued as consideration for a business combination, the recognition of contingent consideration, the accounting for preacquisitionpre-acquisition gain and loss contingencies, the recognition of capitalized in-process research and development, the accounting for acquisition-related restructuring cost accruals, the treatment of acquisition-related transaction costs, and the recognition of changes in the acquirer’s income tax valuation allowance. This authoritative guidance also revised the accounting for both increases and decreases in a parent’s controlling ownership interest.
Research, Development and Engineering Costs
Research, development and engineering costs are expensed as incurred.
Sales and Value Added Taxes
Taxes collected from customers and remitted to governmental authorities are presented on a net basis in the accompanying Consolidated Statements of Operations.
Income tax expense is based on pretax earnings. Deferred tax assets and liabilities are recognized for the expected tax consequences of temporary differences between the book and tax bases of recorded assets and liabilities, net operating losses and tax credit carryforwards.
Applied recognizes revenue when all four revenue recognition criteria have been met: persuasive evidence of an arrangement exists; delivery has occurred or services have been rendered; seller’s price to buyer is fixed or
APPLIED MATERIALS, INC.
NOTES TO CONSOLIDATED FINANCIAL STATEMENTS — (Continued)
determinable; and collectability is probable. Applied’s shipping terms are customarily FOB Applied shipping point or equivalent terms. Applied’s revenue recognition policy generally results in revenue recognition at the following points: (1) for all transactions where legal title passes to the customer upon shipment, Applied recognizes revenue upon shipment for all products that have been demonstrated to meet product specifications prior to shipment; the portion of revenue associated with certain installation-related tasks is deferred, and that revenue is recognized upon completion of the installation-related tasks; (2) for products that have not been demonstrated to meet product
62
APPLIED MATERIALS, INC.
NOTES TO CONSOLIDATED FINANCIAL STATEMENTS — (Continued)
specifications prior to shipment, revenue is recognized at customer technical acceptance; (3) for transactions where legal title does not pass at shipment, revenue is recognized when legal title passes to the customer, which is generally at customer technical acceptance; (4)(4) for arrangements initiated prior to fiscal 2010 containing multiple elements and initiated at or prior to October 25, 2009, the last day of fiscal 2009, the revenue relating to the undelivered elements is deferred at their estimated relative fair values until delivery of the deferred elements; and (5) for arrangements initiated or materially modified during fiscal 2010subsequent to October 25, 2009 containing multiple elements, the revenue relating to the undelivered elements is deferred using the relative selling price method utilizing estimated sales prices until delivery of the deferred elements. Applied limits the amount of revenue recognition for delivered elements to the amount that is not contingent on the future delivery of products or services, future performance obligations or subject to customer-specified return or adjustment. In cases where Applied has sold products that have been demonstrated to meet product specifications prior to shipment, Applied believes that at the time of delivery, it has an enforceable claim to amounts recognized as revenue. The completed contract method is used for SunFabtm™ thin film production lines. Certain SunFab thin film contracts have provisions for additional amounts to become due to Applied if the line achieves certain output criteria subsequent to factory acceptance. Any additional amounts earned under these contracts are recognized upon achievement of such criteria. Spare parts revenue is generally recognized upon shipment, and services revenue is generally recognized over the period that the services are provided.
In the first quarter of fiscal 2010, Applied elected to early adopt amended accounting standards issued by the Financial Accounting Standards Board (FASB) for multiple deliverable revenue arrangements on a prospective basis for applicable transactions originating or materially modified after October 25, 2009. The new standard changeschanged the requirements for establishing separate units of accounting in a multiple element arrangement and requires the allocation of arrangement consideration to each deliverable to be based on the relative selling price. The FASB also amended the accounting standards for revenue recognition to exclude software that is contained in a tangible product from the scope of software revenue guidance when the software is essential to the tangible product’s functionality. Implementation of this new authoritative guidance had an insignificant impact on reported net sales as compared to net sales under previous guidance, as the new guidance did not change the units of accounting within sales arrangements and the elimination of the residual method for the allocation of arrangement consideration had an inconsequential impact on the amount and timing of reported net sales.
For fiscal 2010 and futuresubsequent periods, when a sales arrangement contains multiple elements, such as hardware and servicesand/or software products, Applied allocates revenue to each element based on a selling price hierarchy. The selling price for a deliverable is based on its vendor specific objective evidence (VSOE) if available, third party evidence (TPE) if VSOE is not available, or estimated selling price (ESP) if neither VSOE nor TPE is available. Applied generally utilizes the ESP due to the nature of its products. In multiple element arrangements wheremore-than-incidental software deliverables are included, revenue is allocated to each separate unit of accounting for each of the non-software deliverables and to the software deliverables as a group using the relative selling prices of each of the deliverables in the arrangement based on the aforementioned selling price hierarchy. If the arrangement contains more than one software deliverable, the arrangement consideration allocated to the software deliverables as a group is then allocated to each software deliverable using the guidance for recognizing software revenue, as amended.
Derivative Financial Instruments
Applied uses financial instruments, such as forward exchange and currency option contracts, to hedge a portion of, but not all, existing and anticipated foreign currency denominated transactions typically expected to occur within 24 months. The terms of currency instruments used for hedging purposes are generally consistent
APPLIED MATERIALS, INC.
NOTES TO CONSOLIDATED FINANCIAL STATEMENTS — (Continued)
with the timing of the transactions being hedged. The purpose of Applied’s foreign currency management is to mitigate the effect of exchange rate fluctuations on certain foreign currency denominated revenues, costs and eventual cash flows. All of Applied’s derivative financial instruments are recorded at fair value based upon quoted market prices for comparable instruments. For derivative instruments designated and qualifying as cash flow hedges of
63
APPLIED MATERIALS, INC.
NOTES TO CONSOLIDATED FINANCIAL STATEMENTS — (Continued)
anticipated foreign currency denominated transactions, the effective portion of the gain or loss on these hedges is reported as a component of accumulated other comprehensive income (loss) in stockholders’ equity, and is reclassified into earnings when the hedged transaction affects earnings. If the transaction being hedged fails to occur, or if a portion of any derivative is ineffective, the gain or loss on the associated financial instrument is recorded promptly in earnings. For derivative instruments used to hedge existing foreign currency denominated assets or liabilities, the gain or loss on these hedges is recorded promptly in earnings to offset the changes in the fair value of the assets or liabilities being hedged. Applied does not use derivative financial instruments for trading or speculative purposes.
Foreign Currency Translation
As of October 31, 2010,30, 2011, primarily all of Applied’s subsidiaries use the United States dollar as their functional currency. Accordingly, assets and liabilities of these subsidiaries are translated using exchange rates in effect at the end of the period, except for non-monetary assets, such as inventories and property, plant and equipment, which are translated using historical exchange rates. Revenues and costs are translated using average exchange rates for the period, except for costs related to those balance sheet items that are translated using historical exchange rates. The resulting translation gains and losses are included in the Consolidated Statements of Operations as incurred.
Concentrations of Credit Risk
Financial instruments that potentially subject Applied to significant concentrations of credit risk consist principally of cash equivalents, investments, trade accounts receivable and derivative financial instruments used in hedging activities. Applied invests in a variety of financial instruments, such as, but not limited to, certificates of deposit, corporate and municipal bonds, United States Treasury and agency securities, and asset-backed and mortgage-backed securities, and, by policy, limits the amount of credit exposure with any one financial institution or commercial issuer. Applied performs ongoing credit evaluations of its customers’ financial condition and generally requires no collateral to secure accounts receivable. Applied maintains an allowance reserve for potentially uncollectible accounts receivable based on its assessment of the collectibilitycollectability of accounts receivable. Applied regularly reviews the allowance by considering factors such as historical experience, credit quality, age of the accounts receivable balances, and current economic conditions that may affect a customer’s ability to pay. In addition, Applied utilizes letters of credit to mitigate credit risk when considered appropriate. Applied is exposed to credit-related losses in the event of nonperformance by counterparties to derivative financial instruments, but does not expect any counterparties to fail to meet their obligations.
Recent Accounting Pronouncements
In March 2010,September 2011, the FASB issued updated authoritative guidance that amends the requirementsto allow entities to use a qualitative approach to test goodwill for evaluating whether a decision maker or service provider has a variable interest entity and clarified that a quantitative approach should not be the sole consideration in assessing the criteria for variable interest entity determination. The guidance also clarifies that related parties should be considered in applying all of the decision maker and service provider criteria.impairment. This is in addition to the authoritative guidance the FASB issued in June 2009 that applies to determining whetherpermits an entity isto first perform a variable interest entity and requiring an enterprise to perform an analysisqualitative assessment to determine whether it is more likely than not that the enterprise’s variable interest or interests give it a controlling financial interest in a variable interest entity. Under this guidance, an enterprise has a controlling financial interest when it has (1) the power to direct the activitiesfair value of a variable interest entityreporting unit is less than its carrying value. If it is concluded that most significantly impact the entity’s economic performance and (2) the obligation to absorb losses of the entity or the right to receive benefits from the entity that could potentially be significant to the variable interest entity. The guidance also requires an enterprise to assess whether it has an implicit financial responsibility to ensure that a variable interest entity operates as designed when determining whether it has power to direct the activities of the variable interest entity that most significantly impact the entity’s economic performance. The guidance also requires ongoing assessments of whether an enterprisethis is the primary beneficiarycase, it is necessary to perform the two-step goodwill impairment test. Otherwise, the two-step goodwill impairment test is not required. This guidance is effective for annual and interim goodwill impairment tests performed for fiscal years beginning after December 15, 2011 and earlier adoption is permitted. Applied elected to adopt this authoritative guidance in fiscal 2011. The implementation of a variable interest entity, requires enhanced disclosures, and eliminates the scope exclusion for qualifying special-purpose
64
APPLIED MATERIALS, INC.
NOTES TO CONSOLIDATED FINANCIAL STATEMENTS — (Continued)
entities.In June 2011, the FASB issued authoritative guidance on the presentation of comprehensive income to require an entity to present the total of comprehensive income, the components of net income, and the components of other comprehensive income either in a single continuous statement of comprehensive income or in two separate but consecutive statements. This authoritative guidance eliminates the option to present the components of other comprehensive income as part of the statement of equity. This guidance is effective for Applied beginning in the first quarter of fiscal 2011.2012, with early adoption permitted, and should be applied retrospectively. The implementation of this authoritative guidance will change only the presentation of comprehensive income and will have no impact on Applied’s financial position or results of operations.
In May 2011, the FASB issued authoritative guidance to provide a consistent definition of fair value and ensure that the fair value measurement and disclosure requirements are similar between U.S. GAAP and International Financial Reporting Standards. This authoritative guidance limits the highest-and-best-use measure to nonfinancial assets, permits certain financial assets and liabilities with offsetting positions in market or counterparty credit risks to be measured on a net basis, and provides guidance on the applicability of premiums and discounts. This authoritative guidance also expands the disclosures on Level 3 inputs by requiring quantitative disclosure of the unobservable inputs and assumptions, as well as description of the valuation processes and the sensitivity of the fair value to changes in unobservable inputs. The new guidance will be effective for Applied in the first quarter of fiscal 2012. The implementation of this authoritative guidance is not expected to have a material impact on Applied’s financial position or results of operations.
In JanuaryDecember 2010, the FASB issued authoritativeamended its existing guidance for fair value measurements, which requires additional disclosuresgoodwill and clarifications to existing disclosures.other intangible assets. This authoritative guidance modifies Step 1 of the goodwill impairment test for reporting units with zero or negative carrying amounts. For those reporting units, an entity is required to perform Step 2 of the goodwill impairment test if there are qualitative factors indicating that it is more likely than not that a goodwill impairment exists. The qualitative factors are consistent with the existing guidance which requires goodwill of a reporting entityunit to disclose separatelybe tested for impairment between annual tests if an event occurs or circumstances change that would more likely than not reduce the amounts of significant transfers in and out of Level 1 and Level 2 fair value measurements and also to describe the reasons for these transfers. This authoritative guidance also requires enhanced disclosure of activity in Level 3 fair value measurements. The new disclosures and clarifications of existing disclosures for Level 1 and Level 2 fair value measurements became effective for Applied in the second quarter of fiscal 2010. Disclosures regarding activity within Level 3 fair value measurements become effective the first interim reporting period after December 15, 2010 and will be effective for Applied in the second quarter of fiscal 2011. Applied is evaluating the potential impact of the implementation of this authoritative guidance on its consolidated financial statements. See Note 4 for information and related disclosures regarding Applied’s fair value measurements.
In June 2009, the FASB issued authoritative guidance on variable interest entities, which requires revised evaluations of whether entities represent variable interest entities, ongoing assessments of control over such entities, and additional disclosures for variable interests. In December 2009, the FASB issued authoritative guidance on the financial reporting by entities involved with variable interest entities which amends previously issued guidance on variable interest entities. The amendments in this authoritative guidance replace the quantitative-based risks and rewards calculation for determining which reporting entity, if any, has a controlling financial interest in a variable interest entity with an approach focused on identifying which reporting entity has the power to direct the activities of a variable interest entity that most significantly impact the entity’s economic performance and (1) the obligation to absorb losses of the entity or (2) the right to receive benefits from the entity.reporting unit below its carrying amount. This authoritative guidance becomes effective for Applied in the first quarter fiscal 2011.2012. The implementation of this authoritative guidance is not expected to have a material impact on Applied’s financial position or results of operations.
In December 2010, the FASB issued authoritative guidance on business combinations. This authoritative guidance requires a public entity that presents comparative financial statements to disclose the revenue and earnings of the combined entity as though the business combinations that occurred during the current year had occurred as of the beginning of the prior annual reporting period. In addition, this authoritative guidance expands the supplemental pro forma disclosures to include a description of the nature and amount of material, nonrecurring pro forma adjustments directly attributable to the business combination included in the reported pro forma revenue and earnings. This authoritative guidance is effective prospectively for business combinations for which the acquisition date is on or after the beginning of the first annual reporting period beginning on or after December 15, 2010. This authoritative guidance becomes effective for Applied in the first quarter of fiscal 2012.
| |
| Note 2 | Earnings (Loss) Per Share |
Basic earnings (loss) per share is determined using the weighted average number of common shares outstanding during the period. Diluted earnings (loss) per share is determined using the weighted average number of common shares and potential common shares (representing the dilutive effect of stock options, restricted stock units, and employee stock purchase plans shares) outstanding during the period. Applied’s net income (loss) has not been adjusted for any period presented for purposes of computing basic or diluted earnings (loss) per share due to the Company’s non-complex capital structure. For purposes of computing diluted earnings (loss) per share, weighted average potential common shares do not include stock options with an exercise price greater than the average fair market value of Applied common stock for the period as the effect would be anti-dilutive.
APPLIED MATERIALS, INC.
NOTES TO CONSOLIDATED FINANCIAL STATEMENTS — (Continued)
Potential common shares have not been included in the calculation of diluted net loss per share for the fiscal year ended October 25, 2009 as
65
APPLIED MATERIALS, INC.
NOTES TO CONSOLIDATED FINANCIAL STATEMENTS — (Continued)
the effect would be anti-dilutive. As such, the numerator and the denominator used in computing both basic and diluted net loss per share for the fiscal year ended October 25, 2009 are the same.
| | | | | | | | | | | | | |
| | | 2010 | | | 2009 | | | 2008 | |
| | | (In thousands, except per share amounts) | |
| |
| Numerator: | | | | | | | | | | | | |
| Net income (loss) | | $ | 937,866 | | | $ | (305,327 | ) | | $ | 960,746 | |
| Denominator: | | | | | | | | | | | | |
| Weighted average common shares outstanding | | | 1,339,949 | | | | 1,333,091 | | | | 1,354,176 | |
| Effect of dilutive stock options, restricted stock units and employee stock purchase plans shares | | | 8,855 | | | | — | | | | 20,331 | |
| | | | | | | | | | | | | |
| Denominator for diluted earnings (loss) per share | | | 1,348,804 | | | | 1,333,091 | | | | 1,374,507 | |
| | | | | | | | | | | | | |
| Basic earnings (loss) per share | | $ | 0.70 | | | $ | (0.23 | ) | | $ | 0.71 | |
| Diluted earnings (loss) per share | | $ | 0.70 | | | $ | (0.23 | ) | | $ | 0.70 | |
| Potentially dilutive securities | | | 33,706 | | | | 85,049 | | | | 36,423 | |
| | | | | | | | | | | | |
| | | 2011 | | | 2010 | | | 2009 | |
| | | (In millions, except per share amounts) | |
Numerator: | | | | | | | | | | | | |
Net income (loss) | | $ | 1,926 | | | $ | 938 | | | $ | (305 | ) |
Denominator: | | | | | | | | | | | | |
Weighted average common shares outstanding | | | 1,319 | | | | 1,340 | | | | 1,333 | |
Effect of dilutive stock options, restricted stock units and employee stock purchase plans shares | | | 11 | | | | 9 | | | | — | |
| | | | | | | | | | | | |
Denominator for diluted earnings (loss) per share | | | 1,330 | | | | 1,349 | | | | 1,333 | |
| | | | | | | | | | | | |
Basic earnings (loss) per share | | $ | 1.46 | | | $ | 0.70 | | | $ | (0.23 | ) |
Diluted earnings (loss) per share | | $ | 1.45 | | | $ | 0.70 | | | $ | (0.23 | ) |
| | | |
Potentially dilutive securities | | | 16 | | | | 34 | | | | 85 | |
| |
| Note 3 | Cash, Cash Equivalents and Investments |
Summary of Cash, Cash Equivalents and Investments
The following tables summarizessummarize Applied’s cash, cash equivalents and investments by security type:
| | | | | | | | | | | | | | | | | | | | | |
| | | | | | Gross
| | | Gross
| | | | |
| | | | | | Unrealized
| | | Unrealized
| | | Estimated
| |
| October 31, 2010 | | Cost | | | Gains | | | Losses | | | Fair Value | |
| | | | | | (In thousands) | | | | | | | |
| |
| Cash | | $ | 700,467 | | | $ | — | | | $ | — | | | $ | 700,467 | | | | | |
| | | | | | | | | | | | | | | | | | | | | |
| Cash equivalents: | | | | | | | | | | | | | | | | | | | | |
| Money market funds | | | 1,138,770 | | | | — | | | | — | | | | 1,138,770 | | | | | |
| Obligations of states and political subdivisions | | | 18,427 | | | | — | | | | — | | | | 18,427 | | | | | |
| | | | | | | | | | | | | | | | | | | | | |
| Total Cash equivalents | | | 1,157,197 | | | | — | | | | — | | | | 1,157,197 | | | | | |
| | | | | | | | | | | | | | | | | | | | | |
| Total Cash and Cash equivalents | | $ | 1,857,664 | | | $ | — | | | $ | — | | | $ | 1,857,664 | | | | | |
| | | | | | | | | | | | | | | | | | | | | |
| Short-term and long-term investments: | | | | | | | | | | | | | | | | | | | | |
| U.S. Treasury and agency securities | | $ | 664,573 | | | $ | 8,697 | | | $ | 41 | | | $ | 673,229 | | | | | |
| Obligations of states and political subdivisions | | | 500,392 | | | | 5,039 | | | | 65 | | | | 505,366 | | | | | |
| U.S. commercial paper, corporate bonds and medium-term notes | | | 501,686 | | | | 6,611 | | | | 40 | | | | 508,257 | | | | | |
| Other debt securities* | | | 261,335 | | | | 2,317 | | | | 382 | | | | 263,270 | | | | | |
| | | | | | | | | | | | | | | | | | | | | |
| Total fixed income securities | | | 1,927,986 | | | | 22,664 | | | | 528 | | | | 1,950,122 | | | | | |
| Publicly traded equity securities | | | 9,119 | | | | 16,067 | | | | — | | | | 25,186 | | | | | |
| Equity investments in privately-held companies | | | 58,893 | | | | — | | | | — | | | | 58,893 | | | | | |
| | | | | | | | | | | | | | | | | | | | | |
| Total short-term and long-term investments | | $ | 1,995,998 | | | $ | 38,731 | | | $ | 528 | | | $ | 2,034,201 | | | | | |
| | | | | | | | | | | | | | | | | | | | | |
| Total Cash, Cash equivalents and Investments | | $ | 3,853,662 | | | $ | 38,731 | | | $ | 528 | | | $ | 3,891,865 | | | | | |
| | | | | | | | | | | | | | | | | | | | | |
66
| | | | | | | | | | | | | | | | |
October 30, 2011 | | Cost | | | Gross
Unrealized
Gains | | | Gross
Unrealized
Losses | | | Estimated
Fair Value | |
| | | (In millions) | |
Cash | | $ | 297 | | | $ | — | | | $ | — | | | $ | 297 | |
| | | | | | | | | | | | | | | | |
Cash equivalents: | | | | | | | | | | | | | | | | |
Money market funds | | | 5,663 | | | | — | | | | — | | | | 5,663 | |
| | | | | | | | | | | | | | | | |
Total Cash equivalents | | | 5,663 | | | | — | | | | — | | | | 5,663 | |
| | | | | | | | | | | | | | | | |
Total Cash and Cash equivalents | | $ | 5,960 | | | $ | — | | | $ | — | | | $ | 5,960 | |
| | | | | | | | | | | | | | | | |
Short-term and long-term investments: | | | | | | | | | | | | | | | | |
U.S. Treasury and agency securities | | $ | 184 | | | $ | 1 | | | $ | — | | | $ | 185 | |
Obligations of states and political subdivisions | | | 371 | | | | 2 | | | | — | | | | 373 | |
U.S. commercial paper, corporate bonds and medium-term notes | | | 256 | | | | 3 | | | | 1 | | | | 258 | |
Other debt securities* | | | 307 | | | | 3 | | | | 1 | | | | 309 | |
| | | | | | | | | | | | | | | | |
Total fixed income securities | | | 1,118 | | | | 9 | | | | 2 | | | | 1,125 | |
Publicly traded equity securities | | | 8 | | | | 19 | | | | — | | | | 27 | |
Equity investments in privately-held companies | | | 62 | | | | — | | | | — | | | | 62 | |
| | | | | | | | | | | | | | | | |
Total short-term and long-term investments | | $ | 1,188 | | | $ | 28 | | | $ | 2 | | | $ | 1,214 | |
| | | | | | | | | | | | | | | | |
Total Cash, Cash equivalents and Investments | | $ | 7,148 | | | $ | 28 | | | $ | 2 | | | $ | 7,174 | |
| | | | | | | | | | | | | | | | |
APPLIED MATERIALS, INC.
NOTES TO CONSOLIDATED FINANCIAL STATEMENTS — (Continued)
| | | | | | | | | | | | | | | | | |
| | | | | | Gross
| | | Gross
| | | | |
| | | | | | Unrealized
| | | Unrealized
| | | Estimated
| |
| October 25, 2009 | | Cost | | | Gains | | | Losses | | | Fair Value | |
| | | (In thousands) | |
| |
| Cash | | $ | 341,127 | | | $ | — | | | $ | — | | | $ | 341,127 | |
| | | | | | | | | | | | | | | | | |
| Cash equivalents: | | | | | | | | | | | | | | | | |
| Money market funds | | | 1,235,254 | | | | — | | | | — | | | | 1,235,254 | |
| | | | | | | | | | | | | | | | | |
| Total Cash equivalents | | | 1,235,254 | | | | — | | | | — | | | | 1,235,254 | |
| | | | | | | | | | | | | | | | | |
| Total Cash and Cash equivalents | | $ | 1,576,381 | | | $ | — | | | $ | — | | | $ | 1,576,381 | |
| | | | | | | | | | | | | | | | | |
| Short-term and long-term investments: | | | | | | | | | | | | | | | | |
| U.S. Treasury and agency securities | | $ | 653,627 | | | $ | 8,013 | | | $ | 170 | | | $ | 661,470 | |
| Obligations of states and political subdivisions | | | 419,640 | | | | 7,597 | | | | — | | | | 427,237 | |
| U.S. commercial paper, corporate bonds and medium-term notes | | | 382,550 | | | | 5,676 | | | | 281 | | | | 387,945 | |
| Other debt securities* | | | 103,193 | | | | 1,430 | | | | 391 | | | | 104,232 | |
| | | | | | | | | | | | | | | | | |
| Total fixed income securities | | | 1,559,010 | | | | 22,716 | | | | 842 | | | | 1,580,884 | |
| Publicly traded equity securities | | | 9,572 | | | | 9,439 | | | | — | | | | 19,011 | |
| Equity investments in privately-held companies | | | 90,619 | | | | — | | | | — | | | | 90,619 | |
| | | | | | | | | | | | | | | | | |
| Total short-term and long-term investments | | $ | 1,659,201 | | | $ | 32,155 | | | $ | 842 | | | $ | 1,690,514 | |
| | | | | | | | | | | | | | | | | |
| Total Cash, Cash equivalents and Investments | | $ | 3,235,582 | | | $ | 32,155 | | | $ | 842 | | | $ | 3,266,895 | |
| | | | | | | | | | | | | | | | | |
| | | | | | | | | | | | | | | | |
October 31, 2010 | | Cost | | | Gross
Unrealized
Gains | | | Gross
Unrealized
Losses | | | Estimated
Fair Value | |
| | | (In millions) | |
Cash | | $ | 701 | | | $ | — | | | $ | — | | | $ | 701 | |
| | | | | | | | | | | | | | | | |
Cash equivalents: | | | | | | | | | | | | | | | | |
Money market funds | | | 1,139 | | | | — | | | | — | | | | 1,139 | |
Obligations of states and political subdivisions | | | 18 | | | | — | | | | — | | | | 18 | |
| | | | | | | | | | | | | | | | |
Total Cash equivalents | | | 1,157 | | | | — | | | | — | | | | 1,157 | |
| | | | | | | | | | | | | | | | |
Total Cash and Cash equivalents | | $ | 1,858 | | | $ | — | | | $ | — | | | $ | 1,858 | |
| | | | | | | | | | | | | | | | |
Short-term and long-term investments: | | | | | | | | | | | | | | | | |
U.S. Treasury and agency securities | | $ | 665 | | | $ | 8 | | | $ | — | | | $ | 673 | |
Obligations of states and political subdivisions | | | 500 | | | | 5 | | | | — | | | | 505 | |
U.S. commercial paper, corporate bonds and medium-term notes | | | 502 | | | | 7 | | | | — | | | | 509 | |
Other debt securities* | | | 261 | | | | 3 | | | | 1 | | | | 263 | |
| | | | | | | | | | | | | | | | |
Total fixed income securities | | | 1,928 | | | | 23 | | | | 1 | | | | 1,950 | |
Publicly traded equity securities | | | 9 | | | | 16 | | | | — | | | | 25 | |
Equity investments in privately-held companies | | | 59 | | | | — | | | | — | | | | 59 | |
| | | | | | | | | | | | | | | | |
Total short-term and long-term investments | | $ | 1,996 | | | $ | 39 | | | $ | 1 | | | $ | 2,034 | |
| | | | | | | | | | | | | | | | |
Total Cash, Cash equivalents and Investments | | $ | 3,854 | | | $ | 39 | | | $ | 1 | | | $ | 3,892 | |
| | | | | | | | | | | | | | | | |
| | |
| * | | Other debt securities consist primarily of investment grade asset-backed and mortgage-backed securities. |
Maturities of Investments
The following table summarizes the contractual maturities of Applied’s investments at October 31, 2010:
| | | | | | | | | |
| | | | | | Estimated
| |
| | | Cost | | | Fair Value | |
| | | (In thousands) | |
| |
| Due in one year or less | | $ | 699,095 | | | $ | 701,494 | |
| Due after one through five years | | | 964,098 | | | | 981,459 | |
| Due after five years | | | 3,457 | | | | 3,899 | |
| No single maturity date** | | | 329,348 | | | | 347,349 | |
| | | | | | | | | |
| | | $ | 1,995,998 | | | $ | 2,034,201 | |
| | | | | | | | | |
| | |
** | | Securities with no single maturity date include publicly-traded and privately-held equity securities, and asset-backed and mortgage-backed securities. |
67
| | | | | | | | |
| | | Cost | | | Estimated
Fair Value | |
| | | (In millions) | |
Due in one year or less | | $ | 253 | | | $ | 254 | |
Due after one through five years | | | 556 | | | | 559 | |
Due after five years | | | 3 | | | | 3 | |
No single maturity date | | | 376 | | | | 398 | |
| | | | | | | | |
| | $ | 1,188 | | | $ | 1,214 | |
| | | | | | | | |
Securities with no single maturity date include publicly-traded and privately-held equity securities, and asset-backed and mortgage-backed securities.
APPLIED MATERIALS, INC.
NOTES TO CONSOLIDATED FINANCIAL STATEMENTS — (Continued)
Gains and Losses on Investments
Gross realized gains and losses on sales of investments during fiscal 2011, 2010, 2009, and 20082009 were as follows:
| | | | | | | | | | | | | |
| | | 2010 | | | 2009 | | | 2008 | |
| | | (In thousands) | |
| |
| Gross realized gains | | $ | 6,184 | | | $ | 8,666 | | | $ | 13,483 | |
| Gross realized losses | | $ | 1,622 | | | $ | 10,486 | | | $ | 14,690 | |
| | | | | | | | | | | | |
| | | 2011 | | | 2010 | | | 2009 | |
| | | (In millions) | |
Gross realized gains | | $ | 20 | | | $ | 6 | | | $ | 9 | |
Gross realized losses | | $ | 4 | | | $ | 2 | | | $ | 10 | |
At October 31, 2010,30, 2011, Applied had a gross unrealized loss of $1$2 million related to its investment portfolio due to a decrease in the fair value of certain fixed income securities. securities.Applied regularly reviews its investment portfolio to identify and evaluate investments that have indications of possible impairment. Factors considered in determining whether an unrealized loss iswas considered to be temporary, orother-than-temporary and therefore impaired, include: the length of time and extent to which fair value has been lower than the cost basis; the financial condition, credit quality and near-term prospects of the investee; and whether it is more likely than not that Applied will be required to sell the security prior to recovery. Generally, the contractual terms of investments in marketable securities do not permit settlement at prices less than the amortized cost of the investments. Applied has determined that the gross unrealized losses on its marketable securities at October 30, 2011 and October 31, 2010 arewere temporary in nature and therefore it did not recognize any impairment of its marketable securities for fiscal 2011 or fiscal 2010. During fiscal 2010,2009, Applied determined that certain ofthe gross unrealized losses on its equity investmentsmarketable securities at October 25, 2009 were other than temporary in privately-held companies wereother-than-temporarily impairednature and accordingly,therefore recognized impairment charges$2 million in the amounts of $13 million. Impairmentimpairment charges associated with financial assets for fiscal 2009 totaled $84 million, consisting of the following: equity method investment, $45 million; publicly-traded equity securities, $20 million; equity investments in privately-held companies, $17 million; andits marketable securities $2 million. Applied did not recognize any impairment of its financial assets for fiscal 2008.
securities.The following table provides the fair market value of Applied’s investments with unrealized losses that are not deemed to beother-than-temporarily impaired as of October 30, 2011.
| | | | | | | | | | | | | | | | |
| | | In Loss Position for
Less Than 12 Months | | | Total | |
| | | Fair Value | | | Gross
Unrealized
Losses | | | Fair Value | | | Gross
Unrealized
Losses | |
| | | (In millions) | |
U.S. commercial paper, corporate bonds and medium-term notes | | $ | 38 | | | $ | 1 | | | $ | 38 | | | $ | 1 | |
Other debt securities | | | 77 | | | | 1 | | | | 77 | | | | 1 | |
| | | | | | | | | | | | | | | | |
Total | | $ | 115 | | | $ | 2 | | | $ | 115 | | | $ | 2 | |
| | | | | | | | | | | | | | | | |
The following table provides the fair market value of Applied’s investments with unrealized losses that are not deemed to be other-than-temporarily impaired as of October 31, 2010.
| | | | | | | | | | | | | | | | | | | | | | | | | |
| | | In Loss Position for
| | | In Loss Position for
| | | | |
| | | Less Than 12 Months | | | 12 Months or Greater | | | Total | |
| | | | | | Gross
| | | | | | Gross
| | | | | | Gross
| |
| | | | | | Unrealized
| | | | | | Unrealized
| | | | | | Unrealized
| |
| | | Fair Value | | | Losses | | | Fair Value | | | Losses | | | Fair Value | | | Losses | |
| | | | | | | | | (In thousands) | | | | | | | |
| |
| U.S. Treasury and agency securities | | $ | 37,742 | | | $ | 31 | | | $ | 7,543 | | | $ | 10 | | | $ | 45,285 | | | $ | 41 | |
| Obligations of states and political subdivisions | | | 66,024 | | | | 65 | | | | — | | | | — | | | | 66,024 | | | | 65 | |
| U.S. commercial paper, corporate bonds and medium-term notes | | | 54,127 | | | | 40 | | | | — | | | | — | | | | 54,127 | | | | 40 | |
| Other debt securities | | | 56,113 | | | | 264 | | | | 1,624 | | | | 118 | | | | 57,737 | | | | 382 | |
| | | | | | | | | | | | | | | | | | | | | | | | | |
| Total | | $ | 214,006 | | | $ | 400 | | | $ | 9,167 | | | $ | 128 | | | $ | 223,173 | | | $ | 528 | |
| | | | | | | | | | | | | | | | | | | | | | | | | |
| | | | | | | | | | | | | | | | |
| | | In Loss Position for
Less Than 12 Months | | | Total | |
| | | Fair Value | | | Gross
Unrealized
Losses | | | Fair Value | | | Gross
Unrealized
Losses | |
| | | (In millions) | |
Other debt securities | | $ | 56 | | | $ | 1 | | | $ | 56 | | | $ | 1 | |
| | | | | | | | | | | | | | | | |
Unrealized gains and temporary losses on investments classified asavailable-for-sale are included within accumulated other comprehensive income, (loss), net of any related tax effect. Upon realization, those amounts are reclassified from accumulated other comprehensive income (loss) to results of operations.
APPLIED MATERIALS, INC.
NOTES TO CONSOLIDATED FINANCIAL STATEMENTS — (Continued)
| |
| Note 4 | Fair Value Measurements |
Applied’s financial assets are measured and recorded at fair value, except for equity investments held in privately-held companies. These equity investments are generally accounted for under the cost method of accounting and are periodically assessed forother-than-temporary impairment when events or circumstances indicate that another-than-temporary decline in value may have occurred. Applied’s nonfinancial assets, such as
68
APPLIED MATERIALS, INC.
NOTES TO CONSOLIDATED FINANCIAL STATEMENTS — (Continued)
goodwill, intangible assets, and property, plant and equipment, are recorded at cost and are assessed for impairment when events or circumstances indicate that another-than-temporary decline in value may have occurred.
Applied uses the following fair value hierarchy, which prioritizes the inputs to valuation techniques used to measure fair value into three levels and bases the categorization within the hierarchy upon the lowest level of input that is available and significant to the fair value measurement:
Level 1 — Quoted prices in active markets for identical assets or liabilities;
Level 2 — Observable inputs other than Level 1 that are observable, either directly or indirectly, such as quoted prices for similar assets or liabilities, quoted prices in markets that are not active, or other inputs that are observable or can be corroborated by observable market data for substantially the full term of the assets or liabilities; and
| | |
| • | Level 1 — Quoted prices in active markets for identical assets or liabilities; |
|
| • | Level 2 — Observable inputs other than Level 1 that are observable, either directly or indirectly, such as quoted prices for similar assets or liabilities; quoted prices in markets that are not active; or other inputs that are observable or can be corroborated by observable market data for substantially the full term of the assets or liabilities; and |
|
| • | Level 3 — Unobservable inputs that are supported by little or no market activity and that are significant to the fair value of the assets or liabilities. |
Level 3 — Unobservable inputs that are supported by little or no market activity and that are significant to the fair value of the assets or liabilities.
Applied’s investments are comprised primarily of debt securities that are classified asavailable-for-sale and recorded at their fair values. In determining the fair value of investments, Applied uses pricing information from pricing services that value securities based on quoted market prices and models that utilize observable market inputs. In the event a fair value estimate is unavailable from a pricing service, Applied generally obtains non-binding price quotes from brokers. Applied then reviews the information provided by the pricing services or brokers to determine the fair value of its short-term and long-term investments. In addition, to validate pricing information obtained from pricing services, Applied periodically performs supplemental analysis on a sample of securities. Applied reviews any significant unanticipated differences identified through this analysis to determine the appropriate fair value.
Investments with remaining effective maturities of 12 months or less from the balance sheet date are classified as short-term investments. Investments with remaining effective maturities of more than 12 months from the balance sheet date are classified as long-term investments. As of October 31, 2010,30, 2011, substantially all of Applied’savailable-for-sale, short-term and long-term investments were recognized at fair value that was determined based upon observable inputs.
69
APPLIED MATERIALS, INC.
NOTES TO CONSOLIDATED FINANCIAL STATEMENTS — (Continued)
Assets and Liabilities Measured at Fair Value on a Recurring Basis
Financial assets and liabilities (excluding cash balances) measured at fair value on a recurring basis are summarized below as of October 31, 201030, 2011 and October 25, 2009:
| | | | | | | | | | | | | | | | | | | | | | | | | | | | | | | | | |
| | | October 31, 2010 | | | October 25, 2009 | |
| | | Level 1 | | | Level 2 | | | Level 3 | | | Total | | | Level 1 | | | Level 2 | | | Level 3 | | | Total | |
| | | (In thousands) | | | (In thousands) | |
| |
| Assets: | | | | | | | | | | | | | | | | | | | | | | | | | | | | | | | | |
| Money market funds | | $ | 1,138,770 | | | | — | | | $ | — | | | $ | 1,138,770 | | | $ | 1,235,254 | | | $ | — | | | $ | — | | | $ | 1,235,254 | |
| U.S. Treasury and agency securities | | | 153,426 | | | | 519,803 | | | | — | | | | 673,229 | | | | 145,166 | | | | 516,304 | | | | — | | | | 661,470 | |
| Obligations of states and political subdivisions | | | — | | | | 523,793 | | | | — | | | | 523,793 | | | | — | | | | 427,237 | | | | — | | | | 427,237 | |
| U.S. commercial paper, corporate bonds and medium-term notes | | | — | | | | 508,257 | | | | — | | | | 508,257 | | | | — | | | | 387,945 | | | | — | | | | 387,945 | |
| Other debt securities | | | — | | | | 263,270 | | | | — | | | | 263,270 | | | | — | | | | 104,232 | | | | — | | | | 104,232 | |
| Publicly traded equity securities | | | 25,186 | | | | — | | | | — | | | | 25,186 | | | | 19,011 | | | | — | | | | — | | | | 19,011 | |
| Foreign exchange derivative assets | | | — | | | | 5,983 | | | | — | | | | 5,983 | | | | — | | | | 2,173 | | | | — | | | | 2,173 | |
| | | | | | | | | | | | | | | | | | | | | | | | | | | | | | | | | |
| Total | | $ | 1,317,382 | | | $ | 1,821,106 | | | $ | — | | | $ | 3,138,488 | | | $ | 1,399,431 | | | $ | 1,437,891 | | | $ | — | | | $ | 2,837,322 | |
| | | �� | | | | | | | | | | | | | | | | | | | | | | | | | | | | | | |
| Liabilities: | | | | | | | | | | | | | | | | | | | | | | | | | | | | | | | | |
| Foreign exchange derivative liabilities | | $ | — | | | $ | (1,265 | ) | | $ | — | | | $ | (1,265 | ) | | $ | — | | | $ | (1,678 | ) | | $ | — | | | $ | (1,678 | ) |
| | | | | | | | | | | | | | | | | | | | | | | | | | | | | | | | | |
| Total | | $ | — | | | $ | (1,265 | ) | | $ | — | | | $ | (1,265 | ) | | $ | — | | | $ | (1,678 | ) | | $ | — | | | $ | (1,678 | ) |
| | | | | | | | | | | | | | | | | | | | | | | | | | | | | | | | | |
31, 2010: | | | | | | | | | | | | | | | | | | | | | | | | | | | | | | | | |
| | | October 30, 2011 | | | October 31, 2010 | |
| | | Level 1 | | | Level 2 | | | Level 3 | | | Total | | | Level 1 | | | Level 2 | | | Level 3 | | | Total | |
| | | (In millions) | | | (In millions) | |
Assets: | | | | | | | | | | | | | | | | | | | | | | | | | | | | | | | | |
Money market funds | | $ | 5,663 | | | $ | — | | | $ | — | | | $ | 5,663 | | | $ | 1,139 | | | $ | — | | | $ | — | | | $ | 1,139 | |
U.S. Treasury and agency securities | | | 109 | | | | 76 | | | | — | | | | 185 | | | | 153 | | | | 520 | | | | — | | | | 673 | |
U.S. commercial paper, corporate bonds and medium-term notes | | | — | | | | 258 | | | | — | | | | 258 | | | | — | | | | 509 | | | | — | | | | 509 | |
Obligations of states and political subdivisions | | | — | | | | 373 | | | | — | | | | 373 | | | | — | | | | 523 | | | | — | | | | 523 | |
Other debt securities | | | — | | | | 309 | | | | — | | | | 309 | | | | — | | | | 263 | | | | — | | | | 263 | |
Publicly traded equity securities | | | 27 | | | | — | | | | — | | | | 27 | | | | 25 | | | | — | | | | — | | | | 25 | |
Foreign exchange derivative assets | | | — | | | | 1 | | | | — | | | | 1 | | | | — | | | | 6 | | | | — | | | | 6 | |
| | | | | | | | | | | | | | | | | | | | | | | | | | | | | | | | |
Total | | $ | 5,799 | | | $ | 1,017 | | | $ | — | | | $ | 6,816 | | | $ | 1,317 | | | $ | 1,821 | | | $ | — | | | $ | 3,138 | |
| | | | | | | | | | | | | | | | | | | | | | | | | | | | | | | | |
Liabilities: | | | | | | | | | | | | | | | | | | | | | | | | | | | | | | | | |
Foreign exchange derivative liabilities | | $ | — | | | $ | (1 | ) | | $ | — | | | $ | (1 | ) | | $ | — | | | $ | (1 | ) | | $ | — | | | $ | (1 | ) |
| | | | | | | | | | | | | | | | | | | | | | | | | | | | | | | | |
Total | | $ | — | | | $ | (1 | ) | | $ | — | | | $ | (1 | ) | | $ | — | | | $ | (1 | ) | | $ | — | | | $ | (1 | ) |
| | | | | | | | | | | | | | | | | | | | | | | | | | | | | | | | |
There were no significant transfers in and out of Level 1 and Level 2 fair value measurements and Applied did not have any financial assets measured at fair value on a recurring basis within Level 3 fair value measurements during either the fiscal yearyears ended October 30, 2011 or October 31, 2010. During the fiscal year ended October 25, 2009, Level 3 assets consisted of asset-backed and mortgage-backed securities, the values of which were based on non-binding, broker-provided price quotes and may not have been corroborated by observable market data. The following table presents the activity in Level 3 instruments during fiscal 2010 and 2009:
| | | | | | | | | |
| | | 2010 | | | 2009 | |
| | | Level 3 | | | Level 3 | |
| | | (In thousands) | |
| |
| Balance, beginning of year | | $ | — | | | $ | 13,100 | |
| Total realized and unrealized losses: | | | | | | | | |
| Included in earnings | | | — | | | | (1,856 | ) |
| Included in other comprehensive loss | | | — | | | | (1,152 | ) |
| Purchases, sales, and maturities | | | — | | | | (9,606 | ) |
| Transfers out of Level 3, net | | | — | | | | (486 | ) |
| | | | | | | | | |
| Balance, end of year | | $ | — | | | $ | — | |
| | | | | | | | | |
Assets and Liabilities Measured at Fair Value on a Non-recurring Basis
Equity investments in privately-held companies are generally accounted for under the cost method of accounting and are periodically assessed forother-than-temporary impairment when an event or circumstance
70
APPLIED MATERIALS, INC.
NOTES TO CONSOLIDATED FINANCIAL STATEMENTS — (Continued)
indicates that an
other-than-temporary decline in value may have occurred. If Applied determines that an
other-than-temporary impairment has occurred, the investment will be written down to its estimated fair value based on available information, such as pricing in recent rounds of financing, current cash positions, earnings and cash flow forecasts, recent operational performance and any other readily available market data. Equity investments in privately-held companies totaled
$62 million at October 30, 2011, of which $40 million of investments were accounted for under the cost method of accounting and $22 million of investments had been measured at fair value on a non-recurring basis due to an other-than-temporary decline in value. Equity investments in privately-held companies totaled $59 million at October 31, 2010, of which $40 million of investments were accounted for under the cost method of accounting and $19 million of investments had been measured at fair value on a non-recurring basis due to an
other-than-temporary decline in value.
At October 25, 2009,During fiscal 2011, Applied determined that certain of its equity investments in privately-held companies were other-than-temporarily impaired and, accordingly, recognized impairment charges in the amount of $3 million. During fiscal 2010, Applied determined that certain of its equity investments in privately-held companies were other-than-temporarily impaired and, accordingly, recognized impairment charges in the amount of $13 million. Impairment charges associated with financial assets for fiscal 2009 totaled $91$84 million, consisting of which $52 million ofthe
APPLIED MATERIALS, INC.
NOTES TO CONSOLIDATED FINANCIAL STATEMENTS — (Continued)
following: equity method investment, $45 million; publicly-traded equity securities, $20 million; equity investments were accounted for under the cost method of accountingin privately-held companies, $17 million; and $39 million of investments had been measured at fair value on a non-recurring basis due to another-than-temporary decline in value.
marketable securities, $2 million.The following tables present the balances of equity securities at October 31, 201030, 2011 and October 25, 200931, 2010 that had been measured at fair value on a non-recurring basis, using the process described above, and the impairment charges recorded during the fiscal year then ended:
| | | | | | | | | | | | | | | | | |
| | | | | | | | | | | | Impairment of
| |
| | | | | | | | | | | | Equity Investments
| |
| | | | | | | | | | | | in Privately-Held
| |
| | | Level 1 | | | Level 2 | | | Level 3 | | | Companies | |
| | | | | | (In thousands) | | | | |
| |
| Equity investments in privately-held companies measured at fair value on a non-recurring basis during fiscal 2010 | | $ | — | | | $ | — | | | $ | 18,781 | | | $ | 12,665 | |
| | | | | | | | | | | | | | | | | |
| | | | | | | | | | | | | | | | | |
| | | | | | | | | | | | Impairment of
| |
| | | | | | | | | | | | Equity Investments
| |
| | | | | | | | | | | | in Privately-Held
| |
| | | Level 1 | | | Level 2 | | | Level 3 | | | Companies | |
| | | | | | (In thousands) | | | | |
| |
| Equity investments in privately-held companies measured at fair value on a non-recurring basis during fiscal 2009 | | $ | — | | | $ | — | | | $ | 39,250 | | | $ | 17,529 | |
| | | | | | | | | | | | | | | | | |
| | | | | | | | | | | | | | | | |
| | | Level 1 | | | Level 2 | | | Level 3 | | | Impairment of
Equity Investments
in Privately-Held
Companies | |
| | | (In millions) | |
Equity investments in privately-held companies measured at fair value on a non-recurring basis during fiscal 2011 | | $ | — | | | $ | — | | | $ | 22 | | | $ | 3 | |
| | | | | | | | | | | | | | | | |
| | | | | | | | | | | | | | | | |
| | | Level 1 | | | Level 2 | | | Level 3 | | | Impairment of
Equity Investments
in Privately-Held
Companies | |
| | | (In millions) | |
Equity investments in privately-held companies measured at fair value on a non-recurring basis during fiscal 2010 | | $ | — | | | $ | — | | | $ | 19 | | | $ | 13 | |
| | | | | | | | | | | | | | | | |
Other
The carrying amounts of Applied’s financial instruments, including cash and cash equivalents, accounts receivable, notes payable, and accounts payable and accrued expenses, approximate fair value due to the short maturities of these financial instruments. At October 30, 2011, the carrying amount of long-term debt was $1.9 billion and the estimated fair value was $2.2 billion. At October 31, 2010, the carrying amount of long-term debt was $206 million and the estimated fair value was $238 million. At October 25, 2009, the carrying amount of long-term debt was $202 million and the estimated fair value was $216 million. The estimated fair value of long-term debt is determined by Level 2 inputs and is based primarily on quoted market prices for the same or similar issues.
| |
| Note 5 | Derivative Instruments and Hedging Activities |
Derivative Financial Instruments
Applied conducts business in a number of foreign countries, with certain transactions denominated in local currencies, such as Japanese yen, euro, Israeli shekel, Taiwanese dollar and Swiss franc. Applied uses derivative financial instruments, such as forward exchange contracts and currency option contracts, to hedge certain forecasted foreign currency denominated transactions expected to occur typically within the next 24 months. The purpose of Applied’s foreign currency management is to mitigate the effect of exchange rate fluctuations on certain foreign currency denominated revenues, costs and eventual cash flows. The terms of currency instruments used for hedging purposes are generally consistent with the timing of the transactions being hedged. Applied does not use derivative financial instruments for trading or speculative purposes.
71
APPLIED MATERIALS, INC.
NOTES TO CONSOLIDATED FINANCIAL STATEMENTS — (Continued)
Derivative instruments and hedging activities, including foreign currency exchange contracts, are recognized on the balance sheet at fair value. Changes in the fair value of derivatives that do not qualify for hedge treatment, as well as the ineffective portion of any hedges, are recognized currently in earnings. All of Applied’s derivative financial instruments are recorded at their fair value in other current assets or in accounts payable and accrued expenses.
APPLIED MATERIALS, INC.
NOTES TO CONSOLIDATED FINANCIAL STATEMENTS — (Continued)
Hedges related to anticipated transactions are designated and documented at the inception of the hedge as cash flow hedges and are typically entered into once per month. Cash flow hedges are evaluated for effectiveness quarterly. The effective portion of the gain or loss on these hedges is reported as a component of accumulated other comprehensive income or loss (AOCI) in stockholders’ equity and is reclassified into earnings when the hedged transaction affects earnings. The majority of the after-tax net income or loss related to derivative instruments included in AOCI at October 31, 201030, 2011 is expected to be reclassified into earnings within 12 months. Changes in the fair value of currency forward exchange and option contracts due to changes in time value are excluded from the assessment of effectiveness. Both ineffective hedge amounts and hedge components excluded from the assessment of effectiveness are recognized promptly in earnings. If the transaction being hedged is no longer probable to occur, or if a portion of any derivative is deemed to be ineffective, Applied promptly recognizes the gain or loss on the associated financial instrument in general and administrative expenses. The amount recognized due to discontinuance of cash flow hedges that were probable not to occur by the end of the originally specified time period was not significant for fiscal 20102011 or 2008.2010. The amount recognized due to discontinuance of cash flow hedges that were probable not to occur by the end of the originally specified time period was $25 million for fiscal 2009.
Additionally, forward exchange contracts are generally used to hedge certain foreign currency denominated assets or liabilities. These derivatives are typically entered into once per month and are not designated for hedge accounting treatment. Accordingly, changes in the fair value of these hedges are recorded promptly in earnings to offset the changes in the fair value of the assets or liabilities being hedged.
Fair values of derivative instruments were as follows:
| | | | | | | | | | | | | | | | | | | | | |
| | | | | Asset Derivatives | | | | | Liability Derivatives | |
| | | Balance Sheet
| | October 31,
| | | October 25,
| | | Balance Sheet
| | October 31,
| | | October 25,
| |
| | | Location | | 2010 | | | 2009 | | | Location | | 2010 | | | 2009 | |
| | | | | (In thousands) | | | | | (In thousands) | |
| |
| Derivatives Designated as Hedging Instruments | | | | | | | | | | | | | | | | | | | | |
| | | | | | | | | | | | | | | | | | | | | |
| Foreign exchange contracts | | Other current
assets | | $ | 4,547 | | | $ | 1,811 | | | Accrued
expenses | | $ | 1,042 | | | $ | 1,225 | |
| | | | | | | | | | | | | | | | | | | | | |
| Derivatives Not Designated as Hedging Instruments | | | | | | | | | | | | | | | | | | | | |
| | | | | | | | | | | | | | | | | | | | | |
| Foreign exchange contracts | | Other current
assets | | $ | 1,436 | | | $ | 362 | | | Accrued
expenses | | $ | 223 | | | $ | 453 | |
| | | | | | | | | | | | | | | | | | | | | |
| Total derivatives | | | | $ | 5,983 | | | $ | 2,173 | | | | | $ | 1,265 | | | $ | 1,678 | |
| | | | | | | | | | | | | | | | | | | | | |
72
| | | | | | | | | | | | | | | | | | | | |
| | | | | Asset Derivatives | | | | | Liability Derivatives | |
| | | Balance Sheet Location | | October 30,
2011 | | | October 31,
2010 | | | Balance Sheet
Location | | October 30,
2011 | | | October 31,
2010 | |
| | | | | (In millions) | | | | | (In millions) | |
Derivatives Designated as Hedging Instruments | | | | | | | | | | | | | | | | |
Foreign exchange contracts | | Other current assets | | $ | 1 | | | $ | 5 | | | Accrued
expenses | | $ | 1 | | | $ | 1 | |
| | | | | | | | | | | | | | | | | | | | |
| | | | | | |
Derivatives Not Designated as Hedging Instruments | | | | | | | | | | | | | | | | |
Foreign exchange contracts | | Other current assets | | $ | — | | | $ | 1 | | | Accrued
expenses | | $ | — | | | $ | — | |
| | | | | | | | | | | | | | | | | | | | |
Total derivatives | | | | $ | 1 | | | $ | 6 | | | | | $ | 1 | | | $ | 1 | |
| | | | | | | | | | | | | | | | | | | | |
APPLIED MATERIALS, INC.
NOTES TO CONSOLIDATED FINANCIAL STATEMENTS — (Continued)
The effect of derivative instruments on the Consolidated Condensed Statement of Operations for fiscal years ended October 31, 201030, 2011 and October 25, 200931, 2010 were as follows:
| | | | | | | | | | | | | | | | | | | | | | | | | | | |
| | | | | 2010 | | | 2009 | |
| | | | | | | | | | | Ineffective Portion
| | | | | | | | | Ineffective Portion
| |
| | | Location of Gain
| | | | | | | | and Amount Excluded
| | | | | | | | | and Amount Excluded
| |
| | | or (Loss)
| | | | | | | | from Effectiveness
| | | | | | | | | from Effectiveness
| |
| | | Reclassified from
| | Effective Portion | | | Testing | | | Effective Portion | | | Testing | |
| | | AOCI into Income
| | Gain or (Loss)
| | | Gain or (Loss)
| | | Gain or (Loss)
| | | Gain or (Loss)
| | | Gain or (Loss)
| | | Gain or (Loss)
| |
| | | or Recognized in
| | Recognized in
| | | Reclassified from
| | | Recognized in
| | | Recognized
| | | Reclassified from
| | | Recognized in
| |
| | | Income | | AOCI | | | AOCI into Income | | | Income | | | in AOCI | | | AOCI into Income | | | Income | |
| | | | | | | | (In thousands) | | | | | | | | | (In thousands) | | | | |
| |
Derivatives in Cash Flow Hedging Relationships | | | | | | | | | | | | | | | | | | | | | | | | | | |
| | | | | | | | | | | | | | | | | | | | | | | | | | | |
| Foreign exchange contracts | | Cost of products
sold | | $ | 616 | | | $ | (4,317 | ) | | $ | (2,420 | ) | | $ | (3,467 | ) | | $ | (11,676 | ) | | $ | (3,352 | ) |
| Foreign exchange contracts | | General and
administrative | | | — | | | | (1,003 | ) | | | (1,686 | ) | | | — | | | | (5,511 | ) | | | 23,582 | |
| Foreign exchange contracts | | Research,
development and
engineering | | | — | | | | (327 | ) | | | — | | | | — | | | | (327 | ) | | | — | |
| | | | | | | | | | | | | | | | | | | | | | | | | | | |
| Total | | | | $ | 616 | | | $ | (5,647 | ) | | $ | (4,106 | ) | | $ | (3,467 | ) | | $ | (17,514 | ) | | $ | 20,230 | |
| | | | | | | | | | | | | | | | | | | | | | | | | | | |
| | | | | | | | | | | |
| | | | | 2010 | | | 2009 | |
| | | Location of Gain or
| | | |
| | | (Loss) Recognized
| | Amount of Gain or (Loss)
| |
| | | in Income | | Recognized in Income | |
| | | | | (In thousands) | |
| |
Derivatives Not Designated as Hedging Instruments | | | | | | | | | | |
| | | | | | | | | | | |
| Foreign exchange contracts | | General and
administrative | | $ | (19,590 | ) | | $ | (9,848 | ) |
| | | | | | | | | | | |
| Total | | | | $ | (19,590 | ) | | $ | (9,848 | ) |
| | | | | | | | | | | |
| | | | | | | | | | | | | | | | | | | | | | | | | | |
| | | | | 2011 | | | 2010 | |
| | | | | Effective Portion | | | Ineffective Portion
and Amount
Excluded from
Effectiveness
Testing | | | Effective Portion | | | Ineffective
Portion and
Amount
Excluded
from
Effectiveness
Testing | |
| | | Location of Gain
or (Loss)
Reclassified
from AOCI into
Income or
Recognized in
Income | | Gain or
(Loss)
Recognized
in AOCI | | | Gain or
(Loss)
Reclassified
from AOCI
into
Income | | | Gain or
(Loss)
Recognized in
Income | | | Gain or
(Loss)
Recognized
in AOCI | | | Gain or
(Loss)
Reclassified
from AOCI
into
Income | | | Gain or
(Loss)
Recognized
in Income | |
| | | | | (In millions) | | | (In millions) | |
Derivatives in Cash Flow
Hedging Relationships | | | | | | | | | | | | | | | | | | | | |
Foreign exchange contracts | | Cost of products sold | | $ | (4 | ) | | $ | (1 | ) | | $ | (6 | ) | | $ | 1 | | | $ | (4 | ) | | $ | (2 | ) |
Foreign exchange contracts | | General and administrative | | | — | | | | 4 | | | | (1 | ) | | | — | | | | (1 | ) | | | (2 | ) |
Foreign exchange contracts | | Research, development and engineering | | | — | | | | — | | | | — | | | | — | | | | (1 | ) | | | — | |
| | | | | | | | | | | | | | | | | | | | | | | | | | |
Total | | | | $ | (4 | ) | | $ | 3 | | | $ | (7 | ) | | $ | 1 | | | $ | (6 | ) | | $ | (4 | ) |
| | | | | | | | | | | | | | | | | | | | | | | | | | |
| | | | | | | | | | |
| | | | | 2011 | | | 2010 | |
| | | Location of
Gain or
(Loss)
Recognized in
Income | | Amount of
Gain or
(Loss)
Recognized
in Income | |
| | | (In millions) | |
Derivatives Not Designated as Hedging Instruments | | | | | | | | |
Foreign exchange contracts | | General and
administrative | | $ | (4 | ) | | $ | (20 | ) |
| | | | | | | | | | |
Total | | | | $ | (4 | ) | | $ | (20 | ) |
| | | | | | | | | | |
Derivative-related activity in accumulated other comprehensive loss, net of taxes, was as follows:
| | | | | | | | | |
| | | 2010 | | | 2009 | |
| | | (In thousands) | |
| |
| Unrealized gain on derivative instruments at beginning of year | | $ | 310 | | | $ | 8,039 | |
| Increase (decrease) in fair value of derivative instruments | | | 1,849 | | | | (10,591 | ) |
| Loss reclassified into earnings, net | | | 2,151 | | | | 2,862 | |
| | | | | | | | | |
| Unrealized gain, net, on derivative instruments at end of year | | $ | 4,310 | | | $ | 310 | |
| | | | | | | | | |
| | | | | | | | |
| | | 2011 | | | 2010 | |
| | | (In millions) | |
Unrealized gain on derivative instruments at beginning of year | | $ | 4 | | | $ | — | |
Increase (decrease) in fair value of derivative instruments | | | (2 | ) | | | 2 | |
Gain (loss) reclassified into earnings, net | | | (2 | ) | | | 2 | |
| | | | | | | | |
Unrealized gain, net, on derivative instruments at end of year | | $ | — | | | $ | 4 | |
| | | | | | | | |
APPLIED MATERIALS, INC.
NOTES TO CONSOLIDATED FINANCIAL STATEMENTS — (Continued)
Credit Risk Contingent Features
If Applied’s credit rating were to fall below investment grade, it would be in violation of credit risk contingent provisions of the derivative instruments discussed above, and certain counterparties to the derivative instruments could request immediate payment on derivative instruments in net liability positions. The aggregate fair value of all derivative instruments with credit-risk related contingent features that were in a net liability position was immaterial as of October 31, 2010.
30, 2011.Entering into foreign exchange contracts with banks exposes Applied to credit-related losses in the event of the banks’ nonperformance. However, Applied’s exposure is not considered significant.
73
APPLIED MATERIALS, INC.
NOTES TO CONSOLIDATED FINANCIAL STATEMENTS — (Continued)
| |
| Note 6 | Accounts Receivable, Net |
Applied has agreements with various financial institutions to sell accounts receivable and discount promissory notes from selected customers. Applied also discounts letters of credit through various financial institutions. Applied sells its accounts receivable without recourse. Details of discounted letters of credit, factored accounts receivable and discounted promissory notes for fiscal years ended October 30, 2011, October 31, 2010 and October 25, 2009 and October 26, 2008 were as follows:
| | | | | | | | | | | | | |
| | | 2010 | | | 2009 | | | 2008 | |
| | | (In thousands) | |
| |
| Discounted letters of credit | | $ | 229,803 | | | $ | 299,401 | | | $ | 167,110 | |
| Factored accounts receivable | | | 153,079 | | | | 38,868 | | | | 132,788 | |
| Discounted promissory notes | | | 3,458 | | | | 3,550 | | | | 5,570 | |
| | | | | | | | | | | | | |
| Total | | $ | 386,340 | | | $ | 341,819 | | | $ | 305,468 | |
| | | | | | | | | | | | | |
| | | | | | | | | | | | |
| | | 2011 | | | 2010 | | | 2009 | |
| | | (In millions) | |
Discounted letters of credit | | $ | 211 | | | $ | 230 | | | $ | 299 | |
Factored accounts receivable and discounted promissory notes | | | 80 | | | | 157 | | | | 43 | |
| | | | | | | | | | | | |
Total | | $ | 291 | | | $ | 387 | | | $ | 342 | |
| | | | | | | | | | | | |
Financing charges on the sale of receivables and discounting of letters of credit are included in interest expense in the accompanying Consolidated Condensed Statements of Operations and were not material for all years presented.
Accounts receivable are presented net of allowance for doubtful accounts of $73 million at October 30, 2011 and $74 million at October 31, 2010 and $67 million at October 25, 2009.2010. Applied sells principally to manufacturers within the semiconductor, display and solar industries. As a result of challenging economic and industry conditions, certain of these manufacturers may experience difficulties in meeting their obligations in a timely manner. While Applied believes that its allowance for doubtful accounts is adequate and represents Applied’s best estimate atas of October 31, 2010,30, 2011, Applied will continue to closely monitor customer liquidity and other economic conditions, which may result in changes to Applied’s estimates regarding collectability.
| |
| Note 7 | Balance Sheet Detail |
| | | | | | | | | |
| | | October 31,
| | | October 25,
| |
| | | 2010 | | | 2009 | |
| | | (In thousands) | |
| |
Inventories | | | | | | | | |
| Customer service spares | | $ | 323,693 | | | $ | 263,688 | |
| Raw materials | | | 260,591 | | | | 351,824 | |
| Work-in-process | | | 499,931 | | | | 667,484 | |
| Finished goods* | | | 463,163 | | | | 344,461 | |
| | | | | | | | | |
| | | $ | 1,547,378 | | | $ | 1,627,457 | |
| | | | | | | | | |
| | |
* | | Included in finished goods inventory is $148 million at October 31, 2010, and $133 million at October 25, 2009, of newly-introduced systems at customer locations where the sales transaction did not meet Applied’s revenue recognition criteria as set forth in Note 1. |
74
| | | | | | | | |
| | | October 30,
2011 | | | October 31,
2010 | |
| | | (In millions) | |
Inventories | | | | | | | | |
Customer service spares | | $ | 328 | | | $ | 324 | |
Raw materials | | | 407 | | | | 260 | |
Work-in-process | | | 336 | | | | 500 | |
Finished goods | | | 630 | | | | 463 | |
| | | | | | | | |
| | $ | 1,701 | | | $ | 1,547 | |
| | | | | | | | |
APPLIED MATERIALS, INC.
NOTES TO CONSOLIDATED FINANCIAL STATEMENTS — (Continued)
| | | | | | | | | | | |
| | | | | October 31,
| | | October 25,
| |
| | | Useful Life | | 2010 | | | 2009 | |
| | | (In Years) | | (In thousands) | |
| |
Property, Plant and Equipment, Net | | | | | | | | | | |
| Land and improvements | | | | $ | 227,202 | | | $ | 228,057 | |
| Buildings and improvements | | 3-30 | | | 1,233,850 | | | | 1,164,384 | |
| Demonstration and manufacturing equipment | | 3-5 | | | 669,473 | | | | 654,779 | |
| Furniture, fixtures and other equipment | | 3-15 | | | 719,119 | | | | 713,505 | |
| Construction in progress | | | | | 19,144 | | | | 146,232 | |
| | | | | | | | | | | |
| Gross property, plant and equipment | | | | | 2,868,788 | | | | 2,906,957 | |
| Accumulated depreciation | | | | | (1,905,784 | ) | | | (1,816,524 | ) |
| | | | | | | | | | | |
| | | | | $ | 963,004 | | | $ | 1,090,433 | |
| | | | | | | | | | | |
| | | | | | | | | | | |
| |
Accounts Payable and Accrued Expenses | | | | | | | | | | |
| Accounts payable | | | | $ | 657,971 | | | $ | 477,148 | |
| Compensation and employee benefits | | | | | 435,021 | | | | 134,949 | |
| Warranty | | | | | 155,242 | | | | 117,537 | |
| Restructuring reserve | | | | | 104,229 | | | | 31,581 | |
| Other accrued taxes | | | | | 98,634 | | | | 36,954 | |
| Dividends payable | | | | | 92,960 | | | | 80,455 | |
| Other | | | | | 221,909 | | | | 182,878 | |
| | | | | | | | | | | |
| | | | | $ | 1,765,966 | | | $ | 1,061,502 | |
| | | | | | | | | | | |
| | | | | | | | | | | |
| |
Customer Deposits and Deferred Revenue | | | | | | | | | | |
| Customer deposits | | | | $ | 407,115 | | | $ | 564,412 | |
| Deferred revenue | | | | | 440,116 | | | | 299,868 | |
| | | | | | | | | | | |
| | | | | $ | 847,231 | | | $ | 864,280 | |
| | | | | | | | | | | |
DuringIncluded in finished goods inventory is $224 million at October 30, 2011, and $148 million at October 31, 2010, of newly-introduced systems at customer locations where the sales transaction did not meet Applied’s revenue recognition criteria as set forth in Note 1. Finished goods inventory includes $140 million and $117 million of evaluation inventory at October 30, 2011 and October 31, 2010, respectively.
| | | | | | | | | | |
| | | Useful Life | | October 30,
2011 | | | October 31,
2010 | |
| | | (In years) | | (In millions) | |
Property, Plant and Equipment, Net | | | | | | |
Land and improvements | | | | $ | 163 | | | $ | 227 | |
Buildings and improvements | | 3-30 | | | 1,155 | | | | 1,234 | |
Demonstration and manufacturing equipment | | 3-5 | | | 686 | | | | 670 | |
Furniture, fixtures and other equipment | | 3-15 | | | 722 | | | | 719 | |
Construction in progress | | | | | 12 | | | | 19 | |
| | | | | | | | | | |
Gross property, plant and equipment | | | | | 2,738 | | | | 2,869 | |
Accumulated depreciation | | | | | (1,872 | ) | | | (1,906 | ) |
| | | | | | | | | | |
| | | | $ | 866 | | | $ | 963 | |
| | | | | | | | | | |
In fiscal 2010,2011, Applied incurred asset impairmentreceived $99 million in proceeds from the sale of two properties located in North America and recognized a net gain of $27 million on the transactions. Applied also completed the divestiture of certain assets held for sale for proceeds of $31 million.
| | | | | | | | |
| | | October 30,
2011 | | | October 31,
2010 | |
| | | (In millions) | |
Accounts Payable and Accrued Expenses | | | | | | | | |
Accounts payable | | $ | 484 | | | $ | 658 | |
Compensation and employee benefits | | | 455 | | | | 435 | |
Warranty | | | 168 | | | | 155 | |
Dividends payable | | | 104 | | | | 93 | |
Other accrued taxes | | | 81 | | | | 99 | |
Interest payable | | | 31 | | | | 1 | |
Restructuring reserve | | | 11 | | | | 104 | |
Other | | | 186 | | | | 221 | |
| | | | | | | | |
| | $ | 1,520 | | | $ | 1,766 | |
| | | | | | | | |
Other accrued expenses included contractual termination obligation charges of $117$2 million primarily related toand $40 million as of October 30, 2011 and October 31, 2010, respectively.
| | | | | | | | |
| | | October 30,
2011 | | | October 31,
2010 | |
| | | (In millions) | |
Customer Deposits and Deferred Revenue | | | | | | | | |
Customer deposits | | $ | 249 | | | $ | 407 | |
Deferred revenue | | | 867 | | | | 440 | |
| | | | | | | | |
| | $ | 1,116 | | | $ | 847 | |
| | | | | | | | |
APPLIED MATERIALS, INC.
NOTES TO CONSOLIDATED FINANCIAL STATEMENTS — (Continued)
Applied typically receives deposits on future deliverables from customers in the restructuring of its Energy and Environmental Solutions segment. As of October 31, 2010, other accrued expenses included $40 millionand Display segments. In certain instances, customer deposits may be received from customers in contractual termination obligation charges.
| |
| Note 8 | Goodwill, Purchased Technology and Other Intangible Assets |
Goodwill and Purchased Intangible Assets
Applied’s methodology for allocating the purchase price relating to purchase acquisitions is determined through established and generally accepted valuation techniques. Goodwill is measured as the excess of the cost of the acquisition over the sum of the amounts assigned to tangible and identifiable intangible assets acquired less liabilities assumed. Applied assigns assets acquired (including goodwill) and liabilities assumed to one or more reporting units as of the date of acquisition. Typically, acquisitions relate to a single reporting unit and thus do not require the allocation of goodwill to multiple reporting units. If the products obtained in an acquisition are assigned to multiple reporting units, the goodwill is distributed to the respective reporting units as part of the purchase price allocation process.
Goodwill and purchased intangible assets with indefinite useful lives are not amortized, but are reviewed for impairment annually during the fourth quarter of each fiscal year and whenever events or changes in circumstances indicate that the carrying value of an asset may not be recoverable. The process of evaluating the potential
75
APPLIED MATERIALS, INC.
NOTES TO CONSOLIDATED FINANCIAL STATEMENTS — (Continued)
impairment of goodwill and intangible assets requires significant judgment, especially in emerging markets. Applied regularly monitors current business conditions and other factors including, but not limited to, adverse industry or economic trends, restructuring actions and lower projections of profitability that may impact future operating results.
ForIn fiscal 2011, Applied adopted authoritative guidance which allow entities to use a qualitative approach to test goodwill Applied performsfor impairment. This authoritative guidance permits an entity to first perform a qualitative assessment to determine whether it is more likely than not that the fair value of a reporting unit is less than its carrying value. If it is concluded that this is the case, it is necessary to perform the two-step goodwill impairment test. InOtherwise, the two-step goodwill impairment test is not required. Under the two-step goodwill impairment test, Applied would in the first step Applied comparescompare the estimated fair value of each reporting unit to its carrying value. Applied’s reporting units are consistent with the reportable segments identified in Note 17,16, Industry Segment Operations, which are based on the manner in which Applied operates its business and the nature of those operations. Applied determines the fair value of each of its reporting units based on a weighting of income and market approaches. Under the income approach, Applied calculates the fair value of a reporting unit based on the present value of estimated future cash flows. Estimated future cash flows will be impacted by a number of factors including anticipated future operating results, estimated cost of capitaland/or discount rates. Under the market approach, Applied estimates the fair value based on market multiples of revenue or earnings for comparable companies, as appropriate. If the fair value of the reporting unit exceeds the carrying value of the net assets assigned to that unit, goodwill is not impaired and no further testing is performed. If the carrying value of the net assets assigned to the reporting unit exceeds the fair value of the reporting unit, then Applied would perform the second step of the impairment test in order to determine the implied fair value of the reporting unit’s goodwill. Applied would then allocate the fair value of the reporting unit to all of the assets and liabilities of that unit, as if Applied had acquired the reporting unit in a business combination, with the fair value of the reporting unit being the “purchase price.” The excess of the “purchase price” over the carrying amounts assigned to assets and liabilities represents the implied fair value of goodwill. If Applied determined that the carrying value of a reporting unit’s goodwill exceeded its implied fair value, Applied would record an impairment charge equal to the difference.
APPLIED MATERIALS, INC.
NOTES TO CONSOLIDATED FINANCIAL STATEMENTS — (Continued)
Applied conductedperformed a qualitative assessment to test goodwill for impairment tests in the fourth quarter of fiscal 2011 and determined that it was more likely than not that each of its reporting units fair value exceeded its carrying value and that it was not necessary to perform the two-step goodwill impairment test.
At October 31, 2010, and the results of the first step of the impairment test indicated that Applied’s goodwill and purchased intangible assets with indefinite useful lives consisted primarily of a trade name. In fiscal 2011, Applied negotiated the divestiture of certain assets and determined the trade name, which was included in assets held for eachsale, to be impaired, and, accordingly, recorded $18 million of impairment charges.
In fiscal 2011, Applied transferred its reporting units were not impaired.
SunFab thin film solar product from the Energy and Environmental Solutions segment to the Applied Global Services segment. As a result of this transfer, Applied reallocated $17 million of goodwill from its Energy and Environmental Solutions segment to its Applied Global Services segment.Details of goodwill and other indefinite-lived intangible assets were as follows:
| | | | | | | | | | | | | | | | | | | | | | | | | |
| | | October 31, 2010 | | | October 25, 2009 | |
| | | | | | Other
| | | | | | | | | Other
| | | | |
| | | | | | Intangible
| | | | | | | | | Intangible
| | | | |
| | | Goodwill | | | Assets | | | Total | | | Goodwill | | | Assets | | | Total | |
| | | | | | | | | (In thousands) | | | | | | | |
| |
| Silicon Systems Group | | $ | 381,305 | | | $ | — | | | $ | 381,305 | | | $ | 223,584 | | | $ | — | | | $ | 223,584 | |
| Applied Global Services | | | 177,184 | | | | 17,400 | | | | 194,584 | | | | 177,184 | | | | 17,860 | | | | 195,044 | |
| Display | | | 115,908 | | | | — | | | | 115,908 | | | | 115,908 | | | | — | | | | 115,908 | |
| Energy and Environmental Solutions | | | 662,029 | | | | — | | | | 662,029 | | | | 654,256 | | | | — | | | | 654,256 | |
| | | | | | | | | | | | | | | | | | | | | | | | | |
| Carrying amount | | $ | 1,336,426 | | | $ | 17,400 | | | $ | 1,353,826 | | | $ | 1,170,932 | | | $ | 17,860 | | | $ | 1,188,792 | |
| | | | | | | | | | | | | | | | | | | | | | | | | |
From October 25, 2009 to October 31, 2010, goodwill increased by $158 million due to the acquisition of Semitool, Inc. (Semitool), and by $7 million due to an asset purchase from Advent Solar, Inc. (Advent Solar), both during the first quarter of fiscal 2010 (see Note 9). Other intangible assets that are not subject to amortization consist primarily of a trade name.
| | | | | | | | | | | | | | | | | | | | | | | | |
| | | October 30, 2011 | | | October 31, 2010 | |
| | | Goodwill | | | Other
Intangible
Assets | | | Total | | | Goodwill | | | Other
Intangible
Assets | | | Total | |
| | | (In millions) | |
Silicon Systems Group | | $ | 381 | | | $ | — | | | $ | 381 | | | $ | 381 | | | $ | — | | | $ | 381 | |
Applied Global Services | | | 193 | | | | — | | | | 193 | | | | 177 | | | | 18 | | | | 195 | |
Display | | | 116 | | | | — | | | | 116 | | | | 116 | | | | — | | | | 116 | |
Energy and Environmental Solutions | | | 645 | | | | — | | | | 645 | | | | 662 | | | | — | | | | 662 | |
| | | | | | | | | | | | | | | | | | | | | | | | |
Carrying amount | | $ | 1,335 | | | $ | — | | | $ | 1,335 | | | $ | 1,336 | | | $ | 18 | | | $ | 1,354 | |
| | | | | | | | | | | | | | | | | | | | | | | | |
Finite-Lived Purchased Intangible Assets
Applied amortizes purchased intangible assets with finite lives using the straight-line method over the estimated economic lives of the assets, ranging from 1 to 15 years.
Applied evaluates long-lived assets for impairment whenever events or changes in circumstances indicate the carrying value of an asset group may not be recoverable. Applied assesses the fair value of the assets based on the amount of the undiscounted future cash flow that the assets are expected to generate and recognizes an impairment
76
APPLIED MATERIALS, INC.
NOTES TO CONSOLIDATED FINANCIAL STATEMENTS — (Continued)
loss when estimated undiscounted future cash flow expected to result from the use of the asset, plus net proceeds expected from disposition of the asset, if any, are less than the carrying value of the asset. When Applied identifies an impairment, Applied reduces the carrying value of the group of assets to comparable market values, when available and appropriate, or to its estimated fair value based on a discounted cash flow approach.
Intangible assets, such as purchased technology, are generally recorded in connection with a business acquisition. The value assigned to intangible assets is usually based on estimates and judgments regarding expectations for the success and life cycle of products and technology acquired. Applied evaluates the useful lives of its intangible assets each reporting period to determine whether events and circumstances require revising the remaining period of amortization. In addition, Applied reviews intangible assets for impairment when events or changes in circumstances indicate their carrying value may not be recoverable. Management considers such indicators as significant differences in actual product acceptance from the estimates, changes in the competitive and economic environment, technological advances, and changes in cost structure.
Details of amortized intangible assets were as follows:
| | | | | | | | | | | | | | | | | | | | | | | | | |
| | | October 31, 2010 | | | October 25, 2009 | |
| | | | | | Other
| | | | | | | | | Other
| | | | |
| | | Purchased
| | | Intangible
| | | | | | Purchased
| | | Intangible
| | | | |
| | | Technology | | | Assets | | | Total | | | Technology | | | Assets | | | Total | |
| | | (In thousands) | |
| |
| Silicon Systems Group | | $ | 310,259 | | | $ | 19,800 | | | $ | 330,059 | | | $ | 244,558 | | | $ | — | | | $ | 244,558 | |
| Applied Global Services | | | 32,089 | | | | 60,564 | | | | 92,653 | �� | | | 39,729 | | | | 60,564 | | | | 100,293 | |
| Display | | | 109,828 | | | | 33,500 | | | | 143,328 | | | | 109,828 | | | | 33,500 | | | | 143,328 | |
| Energy and Environmental Solutions | | | 105,305 | | | | 231,667 | | | | 336,972 | | | | 160,805 | | | | 235,565 | | | | 396,370 | |
| | | | | | | | | | | | | | | | | | | | | | | | | |
| Gross carrying amount | | $ | 557,481 | | | $ | 345,531 | | | $ | 903,012 | | | $ | 554,920 | | | $ | 329,629 | | | $ | 884,549 | |
| | | | | | | | | | | | | | | | | | | | | | | | | |
| Silicon Systems Group | | $ | (247,115 | ) | | $ | (5,578 | ) | | $ | (252,693 | ) | | $ | (238,628 | ) | | $ | — | | | $ | (238,628 | ) |
| Applied Global Services | | | (19,022 | ) | | | (43,279 | ) | | | (62,301 | ) | | | (19,974 | ) | | | (38,635 | ) | | | (58,609 | ) |
| Display | | | (96,429 | ) | | | (22,258 | ) | | | (118,687 | ) | | | (91,364 | ) | | | (19,602 | ) | | | (110,966 | ) |
| Energy and Environmental Solutions | | | (36,690 | ) | | | (163,220 | ) | | | (199,910 | ) | | | (50,127 | ) | | | (137,663 | ) | | | (187,790 | ) |
| | | | | | | | | | | | | | | | | | | | | | | | | |
| Accumulated amortization | | $ | (399,256 | ) | | $ | (234,335 | ) | | $ | (633,591 | ) | | $ | (400,093 | ) | | $ | (195,900 | ) | | $ | (595,993 | ) |
| | | | | | | | | | | | | | | | | | | | | | | | | |
| Carrying amount | | $ | 158,225 | | | $ | 111,196 | | | $ | 269,421 | | | $ | 154,827 | | | $ | 133,729 | | | $ | 288,556 | |
| | | | | | | | | | | | | | | | | | | | | | | | | |
From October 25, 2009 to October 31, 2010, the change in gross carrying amount of the amortized intangible assets was approximately $18 million, primarily due the acquisition of Semitool during the first quarter of fiscal 2010, offset by impairment of intangible assets in connection with restructuring of the Energy and Environmental Solutions segment in the third quarter of fiscal 2010. Aggregate amortization expense was $113 million, $89 million and $121 million for fiscal 2010, 2009 and 2008, respectively.
77
APPLIED MATERIALS, INC.
NOTES TO CONSOLIDATED FINANCIAL STATEMENTS — (Continued)
Details of finite-lived intangible assets were as follows:
| | | | | | | | | | | | | | | | | | | | | | | | |
| | | October 30, 2011 | | | October 31, 2010 | |
| | | Purchased
Technology | | | Other
Intangible
Assets | | | Total | | | Purchased
Technology | | | Other
Intangible
Assets | | | Total | |
| | | (In millions) | |
Silicon Systems Group | | $ | 310 | | | $ | 20 | | | $ | 330 | | | $ | 310 | | | $ | 20 | | | $ | 330 | |
Applied Global Services | | | 28 | | | | 40 | | | | 68 | | | | 32 | | | | 61 | | | | 93 | |
Display | | | 110 | | | | 33 | | | | 143 | | | | 110 | | | | 33 | | | | 143 | |
Energy and Environmental Solutions | | | 105 | | | | 232 | | | | 337 | | | | 105 | | | | 232 | | | | 337 | |
| | | | | | | | | | | | | | | | | | | | | | | | |
Gross carrying amount | | $ | 553 | | | $ | 325 | | | $ | 878 | | | $ | 557 | | | $ | 346 | | | $ | 903 | |
| | | | | | | | | | | | | | | | | | | | | | | | |
Silicon Systems Group | | $ | (256 | ) | | $ | (8 | ) | | $ | (264 | ) | | $ | (247 | ) | | $ | (6 | ) | | $ | (253 | ) |
Applied Global Services | | | (20 | ) | | | (31 | ) | | | (51 | ) | | | (19 | ) | | | (43 | ) | | | (62 | ) |
Display | | | (102 | ) | | | (25 | ) | | | (127 | ) | | | (96 | ) | | | (23 | ) | | | (119 | ) |
Energy and Environmental Solutions | | | (48 | ) | | | (177 | ) | | | (225 | ) | | | (37 | ) | | | (163 | ) | | | (200 | ) |
| | | | | | | | | | | | | | | | | | | | | | | | |
Accumulated amortization | | $ | (426 | ) | | $ | (241 | ) | | $ | (667 | ) | | $ | (399 | ) | | $ | (235 | ) | | $ | (634 | ) |
| | | | | | | | | | | | | | | | | | | | | | | | |
Carrying amount | | $ | 127 | | | $ | 84 | | | $ | 211 | | | $ | 158 | | | $ | 111 | | | $ | 269 | |
| | | | | | | | | | | | | | | | | | | | | | | | |
In fiscal 2011, Applied entered into an agreement to divest certain assets held in the Applied Global Services segment and determined certain identified purchased technology and finite-lived intangible assets, which were included in the assets held for sale, to be impaired, and, accordingly, recorded $6 million of impairment charges. The gross carrying amount of the divested amortized intangible assets was approximately $25 million. In fiscal 2010, Applied incurred intangible impairment charges of $31 million related to a plan to restructure its Energy and Environmental Solutions segment.
Amortization expense was $52 million, $82 million and $89 million for fiscal 2011, 2010 and 2009, respectively.
As of October 31, 2010,30, 2011, future estimated amortization expense is expected to be as follows:
| | | | | |
| | | Amortization
| |
| | | Expense | |
| | | (In thousands) | |
| |
| 2011 | | $ | 52,787 | |
| 2012 | | | 51,342 | |
| 2013 | | | 48,633 | |
| 2014 | | | 40,986 | |
| 2015 | | | 24,897 | |
| Thereafter | | | 50,776 | |
| | | | | |
| | | $ | 269,421 | |
| | | | | |
| | | | |
| | | Amortization
Expense | |
| | | (In millions) | |
2012 | | | 50 | |
2013 | | | 48 | |
2014 | | | 40 | |
2015 | | | 25 | |
2016 | | | 17 | |
Thereafter | | | 31 | |
| | | | |
| | $ | 211 | |
| | | | |
| |
| Note 9 | Business Combinations |
Varian Semiconductor Equipment Associates, Inc.
On May 4, 2011, Applied and Varian Semiconductor Equipment Associates, Inc. (Varian), a public company manufacturer of semiconductor processing equipment and the leading supplier of ion implantation equipment used by chip makers around the world, announced the signing of a definitive merger agreement dated May 3, 2011, under which Applied agreed to acquire Varian for $63 per share in cash.
APPLIED MATERIALS, INC.
NOTES TO CONSOLIDATED FINANCIAL STATEMENTS — (Continued)
As described in Note 17, Subsequent Events, on November 10, 2011, Applied completed its acquisition of Varian. Applied’s primary reasons for this acquisition were to complement its existing product offerings and to provide opportunities for future growth. Beginning in the first quarter of fiscal 2012, the acquired business will be included in results for the Silicon Systems Group and Applied Global Services segments.
The aggregate purchase price of the acquisition was approximately $4.2 billion, net of cash acquired, and Applied funded the transaction with a combination of existing cash, including proceeds from long-term debt issued in June 2011. See Note 10 for additional discussion of long-term debt.
Semitool, Inc. and Advent Solar
On December 21, 2009, Applied acquired Semitool, Inc. (Semitool), a public company based in the state of Montana, for a purchase price of $323 million in cash, net of cash acquired, pursuant to a tender offer and subsequent short-form merger. The acquired business is a leading supplier of electrochemical plating and wafer surface preparation equipment used by semiconductor packaging and manufacturing companies globally. Applied’s primary reasons for this acquisition were to complement its existing product offerings and to provide opportunities for future growth. The acquired business is included in results for the Silicon Systems Group segment.
In November 2009, Applied acquired substantially all the assets, including the intellectual property, of Advent Solar, a developer of advanced technology for c-Si solar photovoltaic cells and modules (PVs), for a purchase price of $14 million. This acquisition complemented Applied’s portfolio of solar PV technologies and enhanced Applied’s opportunities in the c-Si equipment market. The acquisition is included in results for the Energy and Environmental Solutions segment.
Applied allocated the purchase price of each of these acquisitions to tangible assets, liabilities and identifiable intangible assets acquired, based on their estimated fair values. The excess of purchase price over the aggregate fair values was recorded as goodwill. The fair value assigned to identifiable intangible assets acquired was based on estimates and assumptions made by management. These estimates were determined through established and generally accepted calculation techniques. Applied calculated the fair value of the tangible and intangible assets
78
APPLIED MATERIALS, INC.
NOTES TO CONSOLIDATED FINANCIAL STATEMENTS — (Continued)
acquired to allocate the purchase prices at the respective acquisition dates. Based upon these calculations, the purchase prices for the above acquisitions were allocated as follows:
| | | | | |
| | | Acquisitions
| |
| Fair Market Values | | 2010 | |
| | | (In thousands) | |
| |
| Cash and cash equivalents | | $ | 38,744 | |
| Accounts receivable, net | | | 37,961 | |
| Inventories | | | 61,838 | |
| Other current assets | | | 3,837 | |
| Property and equipment, net | | | 45,578 | |
| Goodwill | | | 165,495 | |
| Purchased intangible assets | | | 93,376 | |
| | | | | |
| Total assets acquired | | | 446,829 | |
| Accounts payable and accrued expenses | | | (46,246 | ) |
| Other liabilities | | | (25,240 | ) |
| | | | | |
| Total liabilities assumed | | | (71,486 | ) |
| | | | | |
| Purchase price allocated | | $ | 375,343 | |
| | | | | |
| | | | | | | |
| | | | | Purchased
| |
| | | Useful
| | Intangible Assets
| |
| | | Life | | 2010 | |
| | | (In years) | | (In thousands) | |
| |
| Developed technology | | 6 - 10 | | $ | 65,700 | |
| Customer relationships | | 8 | | | 10,900 | |
| Trade names | | 3 - 10 | | | 5,700 | |
| Patents and trademarks | | 7 - 10 | | | 5,462 | |
| Backlog | | 1 | | | 4,100 | |
| Other | | 5 | | | 1,514 | |
| | | | | | | |
| Total purchased intangible assets | | | | $ | 93,376 | |
| | | | | | | |
On January 31, 2008, Applied acquired all of the outstanding shares of Baccini, a privately-held company based in Italy, for a purchase price of $215 million in cash, net of cash and marketable securities acquired. The acquired business is a leading supplier of automated metallization and test systems for manufacturing c-Si photovoltaic cells. In connection with this acquisition, Applied recorded goodwill of $158 million and intangible assets of $130 million. Of the $130 million of acquired intangible assets, $61 million was assigned to acquired backlog (to be amortized over 2 years), $34 million was assigned to customer relationships (to be amortized over 9 years), $27 million was assigned to purchased technology (to be amortized over 7 years), $6 million was assigned to covenants not to compete (to be amortized over 2 years), and $3 million was assigned to trademarks and tradenames (to be amortized over 7 years). The allocation of the purchase price was based on estimates of the fair value of the assets acquired. The acquired business is reported under the Energy and Environmental Solutions segment.
On November 9, 2007, Applied purchased from Edwards Vacuum, Inc. certain assets of its Kachina semiconductor equipment parts cleaning and refurbishment business for $19 million. The acquisition expanded Applied’s existing Chamber Performance Services network of facilities that provide customers worldwide with technology and support for maintaining their chamber components. In connection with this acquisition, Applied
79
| | | | |
Fair Market Values | | Acquisitions
2010 | |
| | | (In millions) | |
Cash and cash equivalents | | $ | 39 | |
Accounts receivable, net | | | 38 | |
Inventories | | | 62 | |
Other current assets | | | 4 | |
Property and equipment, net | | | 46 | |
Goodwill | | | 165 | |
Purchased intangible assets | | | 93 | |
| | | | |
Total assets acquired | | | 447 | |
Accounts payable and accrued expenses | | | (47 | ) |
Other liabilities | | | (25 | ) |
| | | | |
Total liabilities assumed | | | (72 | ) |
| | | | |
Purchase price allocated | | $ | 375 | |
| | | | |
APPLIED MATERIALS, INC.
NOTES TO CONSOLIDATED FINANCIAL STATEMENTS — (Continued)
recorded goodwill of $13 million and an intangible asset of $3 million (customer relationships, to be amortized over 13 years). | | | | | | |
| | | Useful
Life | | Purchased
Intangible Assets
2010 | |
| | | (In years) | | (In millions) | |
Developed technology | | 6 - 10 | | $ | 66 | |
Customer relationships | | 8 | | | 11 | |
Trade names | | 3 - 10 | | | 6 | |
Patents and trademarks | | 7 - 10 | | | 5 | |
Backlog | | 1 | | | 4 | |
Other | | 5 | | | 1 | |
| | | | | | |
Total purchased intangible assets | | | | $ | 93 | |
| | | | | | |
The acquired business is reported under the Applied Global Services segment.
For all of the purchase business combinations discussed above, the results of operations
prior to the acquisition datesof Semitool were not material in relation to those of Applied for any of the periods presented herein.
Goodwill is not amortized but is reviewed periodicallyat least annually for impairment and purchased technology is amortized over its useful life of 1 to 15 years.
| |
| Note 10 | Borrowing Facilities and Long-Term Debt |
Applied has credit facilities for unsecured borrowings in various currencies of up to $1.1$1.6 billion, of which $1.0$1.5 billion is comprised of a5-year committed four-year revolving credit agreement with a group of banks that is scheduled to expire in January 2012.May 2015. This agreement provides for borrowings in United States dollars at interest rates keyed to one of the two rates selected by Applied for each advance and includes financial and other covenants with which Applied was in compliance at October 31, 2010.30, 2011. Remaining credit facilities in the amount of approximately $98$105 million are with Japanese banks. Applied’s ability to borrow under these facilities is subject to bank approval at the time of the borrowing request, and any advances will be at rates indexed to the banks’ prime reference rate denominated in Japanese yen. No amounts were outstanding under any of these facilities at both October 30, 2011 and October 31, 2010.
Long-term debt outstanding as of October 30, 2011 was as follows:
| | | | | | | | | | | | | | | | |
Due Date | | Principal
Amount | | | Stated
Interest Rate | | | Effective
Interest Rate | | | Interest
Pay Date | | Interest
Pay Date |
| | | (In millions) | | | | | | | | |
June 15, 2016 | | $ | 400 | | | | 2.650 | % | | | 2.666 | % | | June 15 | | December 15 |
October 15, 2017 | | | 200 | | | | 7.125 | % | | | 7.190 | % | | April 15 | | October 15 |
June 15, 2021 | | | 750 | | | | 4.300 | % | | | 4.326 | % | | June 15 | | December 15 |
June 15, 2041 | | | 600 | | | | 5.850 | % | | | 5.879 | % | | June 15 | | December 15 |
Other debt | | | 1 | | | | | | | | | | | | | |
| | | | | | | | | | | | | | | | |
| | | 1,951 | | | | | | | | | | | | | |
Total unamortized discount | | | (4 | ) | | | | | | | | | | | | |
| | | | | | | | | | | | | | | | |
Total long-term debt | | $ | 1,947 | | | | | | | | | | | | | |
| | | | | | | | | | | | | | | | |
APPLIED MATERIALS, INC.
NOTES TO CONSOLIDATED FINANCIAL STATEMENTS — (Continued)
Long-term debt outstanding as of October 31, 2010 and October 25, 2009 was as follows:
| | | | | | | | | |
| | | October 31,
| | | October 25,
| |
| | | 2010 | | | 2009 | |
| | | (In thousands) | |
| |
| 7.125% unsecured senior notes due 2017, interest payable April 15 and October 15 | | $ | 200,000 | | | $ | 200,000 | |
| Other debt | | | 5,529 | | | | 1,894 | |
| | | | | | | | | |
| | | | 205,529 | | | | 201,894 | |
| Current portion | | | (1,258 | ) | | | (1,240 | ) |
| | | | | | | | | |
| | | $ | 204,271 | | | $ | 200,654 | |
| | | | | | | | | |
| | | | | | | | | | | | | | | | | | | | |
Due Date | | Principal
Amount | | | Stated
Interest Rate | | | Effective
Interest Rate | | | Interest
Pay Date | | | Interest
Pay Date | |
| | | (In millions) | | | | | | | | | | | | | |
October 15, 2017 | | $ | 200 | | | | 7.125 | % | | | 7.190 | % | | | April 15 | | | | October 15 | |
Other debt | | | 5 | | | | | | | | | | | | | | | | | |
| | | | | | | | | | | | | | | | | | | | |
| | | 205 | | | | | | | | | | | | | | | | | |
Current portion | | | (1 | ) | | | | | | | | | | | | | | | | |
| | | | | | | | | | | | | | | | | | | | |
Total long-term debt | | $ | 204 | | | | | | | | | | | | | | | | | |
| | | | | | | | | | | | | | | | | | | | |
In June 2011, Applied issued senior unsecured notes due 2016, 2021, and 2041 in the aggregate principal amount of $1.75 billion (collectively, the Notes) pursuant to the terms of an indenture and first supplemental indenture (collectively, the Indenture). The Indenture contains certain covenants with which Applied was in compliance at October 30, 2011. The Notes were sold in a public offering pursuant to a registration statement on Form S-3 and related preliminary prospectus supplement filed with the Securities and Exchange Commission (SEC) on June 1, 2011, and a related final prospectus supplement filed with the SEC on June 2, 2011. Applied used the net proceeds of the Notes to fund a portion of the consideration payable in, and certain costs associated with, Applied’s acquisition of Varian.
Applied has debt agreements that contain financial and other covenants. These covenants require Applied to maintain certain minimum financial ratios. At October 31, 2010,30, 2011, Applied was in compliance with all such covenants. Aggregate debt maturities at October 31, 2010 were: $1 million in fiscal 2011, $1 million in fiscal 2012, $1 million in fiscal 2013, $1 million in fiscal 2014, and $201 million thereafter.
| Note | |
Note 12 | 11 Restructuring Charges and Asset Impairments |
The following table summarizes major components of the restructuring and asset impairment charges during fiscal 2011, 2010 and 2009:
| | | | | | | | | | | | |
| | | 2011 | | | 2010 | | | 2009 | |
| | | (In millions) | |
Provision for restructuring reserves, severance | | $ | (60 | ) | | $ | 129 | | | $ | 142 | |
Provision for restructuring reserves, facilities | | | — | | | | — | | | | (3 | ) |
Asset impairments | | | 30 | | | | 117 | | | | 17 | |
| | | | | | | | | | | | |
Total | | $ | (30 | ) | | $ | 246 | | | $ | 156 | |
| | | | | | | | | | | | |
APPLIED MATERIALS, INC.
NOTES TO CONSOLIDATED FINANCIAL STATEMENTS — (Continued)
Changes in restructuring reserves for fiscal 2011, 2010, and 2009 related to other restructuring plans and 2008:
| | | | | | | | | | | | | |
| | | 2010 | | | 2009 | | | 2008 | |
| | | (In thousands) | |
| |
| Provision for restructuring reserves, severance | | $ | 128,857 | | | $ | 142,098 | | | $ | 28,549 | |
| Provision for restructuring reserves, facilities | | | 78 | | | | (3,355 | ) | | | 11,399 | |
| Asset impairments | | | 116,990 | | | | 17,045 | | | | — | |
| | | | | | | | | | | | | |
| Total | | $ | 245,925 | | | $ | 155,788 | | | $ | 39,948 | |
| | | | | | | | | | | | | |
facilities realignment programs initiated in prior periods were as follows: | | | | | | | | | | | | |
| | | Severance | | | Facilities | | | Total | |
| | | (In millions) | |
Balance, October 26, 2008 | | | 5 | | | | 15 | | | | 20 | |
Provision for restructuring reserves | | | 145 | | | | — | | | | 145 | |
Consumption of reserves | | | (121 | ) | | | (7 | ) | | | (128 | ) |
Adjustment of restructuring reserves | | | (3 | ) | | | (3 | ) | | | (6 | ) |
| | | | | | | | | | | | |
Balance, October 25, 2009 | | | 26 | | | | 5 | | | | 31 | |
Provision for restructuring reserves | | | 149 | | | | — | | | | 149 | |
Consumption of reserves | | | (56 | ) | | | — | | | | (56 | ) |
Adjustment of restructuring reserves | | | (20 | ) | | | — | | | | (20 | ) |
| | | | | | | | | | | | |
Balance, October 31, 2010 | | $ | 99 | | | $ | 5 | | | $ | 104 | |
Consumption of reserves | | | (33 | ) | | | — | | | | (33 | ) |
Adjustment of restructuring reserves | | | (60 | ) | | | — | | | | (60 | ) |
| | | | | | | | | | | | |
Balance, October 30, 2011 | | $ | 6 | | | $ | 5 | | | $ | 11 | |
| | | | | | | | | | | | |
On July 21, 2010, Applied announced a plan to restructure its Energy and Environmental Solutions segment, which iswas expected to impact between 400 to 500 positions globally. The plan was in response to adverse market
80
APPLIED MATERIALS, INC.
NOTES TO CONSOLIDATED FINANCIAL STATEMENTS — (Continued)
conditions for thin film solar, including delays in utility-scale solar adoption, solar panel manufacturers’ challenges in obtaining affordable capital, changes and uncertainty in government renewable energy polices, and competitive pressure from crystalline silicon (c-Si) solar technologies. Under this plan,During fiscal 2010, Applied incurred charges totaling $403 million, which included inventory-related charges included in cost of products sold of $247 million related to SunFab thin film solar equipment, asset impairment charges of $108 million, employee severance charges of $45 million associated with this program. During fiscal 2011, as a result of changes in Applied’s operating environment and other costsbusiness requirements, Applied revised its workforce reduction under this program to approximately 200 positions and recorded a favorable adjustment of $3$36 million.
As of October 30, 2011, the remaining severance accrual associated with restructuring reserves under this program was $1 million.On November 11, 2009, Applied announced a restructuring program to reduce its global workforce as of October 25, 2009 by approximately 1,300 to 1,500 positions, or 10 to 12 percent, over a period of 18 months. During the first quarter of fiscal 2010, Applied recorded restructuring charges of $104 million associated with this program. During the third quarter of fiscal 2010, as a result of changes in business requirements, Applied revised its global workforce reduction under this program to approximately 1,000 positions and recorded a favorable adjustment of $20 million.
Changes The improved economic environment continued in the first half of fiscal 2011, and as a result Applied recorded an additional favorable adjustment of $19 million. As of October 30, 2011, the remaining severance accrualsaccrual associated with restructuring reserves related to the programs described above for fiscal 2010 were as follows:
| | | | | |
| | | Severance | |
| | | (In thousands) | |
| |
| Provision for restructuring reserves | | $ | 148,855 | |
| Consumption of reserves | | | (35,655 | ) |
| Adjustment of restructuring reserves | | | (20,000 | ) |
| | | | | |
| Balance, October 31, 2010 | | $ | 93,200 | |
| | | | | |
under this program was $5 million.In fiscal 2009,November 12, 2008, Applied initiated a restructuring program to reduce its global workforce by approximately 2,000 positions. During fiscal 2009, Applied recognized restructuring and asset impairmentincurred employee severance charges of $156$145 million primarily consisting of $143 million in restructuring charges associated with this program and $15$17 million in asset impairments. The restructuring charges consisted of employee-related costs to reduce the Company’s workforce through a combination of attrition, voluntary separation and other workforce reduction programs. During fiscal 2008,2011, Applied recognized restructuringfavorably adjusted the severance accrual associated with this program by $5 million. As of October 30, 2011, no severance accrual remained under this program.
In fiscal 2011, Applied incurred impairment charges of $40$24 million of which $29 million was associated with a global cost reduction plan announced in fiscal 2008,certain intangible assets and $11purchased technology. See Note 8 of the Notes to Consolidated Financial Statements. Applied also incurred asset impairment charges of $3 million with a plan announced in fiscal 2007.
81
APPLIED MATERIALS, INC.
NOTES TO CONSOLIDATED FINANCIAL STATEMENTS — (Continued)
Changes in restructuring reserves for fiscal 2010, 2009, and 2008 related to other restructuring plans and facilities realignment programs initiated in prior periods were as follows:
| | | | | | | | | | | | | |
| | | Severance | | | Facilities | | | Total | |
| | | (In thousands) | |
| |
| Balance, October 28, 2007 | | $ | 9,739 | | | | 13,454 | | | $ | 23,193 | |
| Provision for restructuring reserves | | | 38,670 | | | | 11,399 | | | | 50,069 | |
| Consumption of reserves | | | (32,174 | ) | | | (8,428 | ) | | | (40,602 | ) |
| Adjustment of restructuring reserves | | | (10,121 | ) | | | — | | | | (10,121 | ) |
| Foreign currency changes | | | (412 | ) | | | (1,680 | ) | | | (2,092 | ) |
| | | | | | | | | | | | | |
| Balance, October 26, 2008 | | | 5,702 | | | | 14,745 | | | | 20,447 | |
| Provision for restructuring reserves | | | 144,901 | | | | 114 | | | | 145,015 | |
| Consumption of reserves | | | (121,265 | ) | | | (6,074 | ) | | | (127,339 | ) |
| Adjustment of restructuring reserves | | | (2,803 | ) | | | (3,469 | ) | | | (6,272 | ) |
| Foreign currency changes | | | (182 | ) | | | (88 | ) | | | (270 | ) |
| | | | | | | | | | | | | |
| Balance, October 25, 2009 | | | 26,353 | | | | 5,228 | | | | 31,581 | |
| Provision for restructuring reserves | | | — | | | | 238 | | | | 238 | |
| Consumption of reserves | | | (19,882 | ) | | | (459 | ) | | | (20,341 | ) |
| Adjustment of restructuring reserves | | | 2 | | | | (160 | ) | | | (158 | ) |
| Foreign currency changes | | | — | | | | (291 | ) | | | (291 | ) |
| | | | | | | | | | | | | |
| Balance, October 31, 2010 | | $ | 6,473 | | | $ | 4,556 | | | $ | 11,029 | |
| | | | | | | | | | | | | |
Duringcertain fixed assets.In fiscal 2010, Applied recorded asset impairment charges of $108 million related to the restructuring of its Energy and Environmental Solutions segment and of $9 million to write down a facility to its estimated fair value
APPLIED MATERIALS, INC.
NOTES TO CONSOLIDATED FINANCIAL STATEMENTS — (Continued)
based on prices for comparable local properties. The facility was reclassified as an asset held for sale within other current assets.
| |
Note 13 12 | Stockholders’ Equity, Comprehensive Income and Share-Based Compensation |
Accumulated Other Comprehensive Income (Loss)
Components of accumulated other comprehensive income (loss), on an after-tax basis where applicable, were as follows:
| | | | | | | | | |
| | | October 31,
| | | October 25,
| |
| | | 2010 | | | 2009 | |
| | | (In thousands) | |
| |
| Pension liability | | $ | (38,862 | ) | | $ | (32,164 | ) |
| Retiree medical benefits | | | (269 | ) | | | 15 | |
| Unrealized gain on investments, net | | | 24,382 | | | | 19,972 | |
| Unrealized gain on derivative instruments qualifying as cash flow hedges | | | 4,310 | | | | 310 | |
| Cumulative translation adjustments | | | 12,105 | | | | 10,187 | |
| | | | | | | | | |
| | | $ | 1,666 | | | $ | (1,680 | ) |
| | | | | | | | | |
For further details on derivative instruments, see Note 5 of the Notes to Consolidated Condensed Financial Statements.
82
| | | | | | | | |
| | | October 30,
2011 | | | October 31,
2010 | |
| | | (In millions) | |
Unrealized gain on investments, net | | $ | 17 | | | $ | 25 | |
Unrealized gain on derivative instruments qualifying as cash flow hedges | | | — | | | | 4 | |
Pension liability | | | (25 | ) | | | (39 | ) |
Cumulative translation adjustments | | | 14 | | | | 12 | |
| | | | | | | | |
| | $ | 6 | | | $ | 2 | |
| | | | | | | | |
APPLIED MATERIALS, INC.
NOTES TO CONSOLIDATED FINANCIAL STATEMENTS — (Continued)
Stock Repurchase Program
On March 8, 2010, Applied’s Board of Directors approved a new stock repurchase program authorizing up to $2.0 billion in repurchases over the next three years ending in March 2013. Under this authorization, Applied renewed its systematic stock repurchase program and may also make supplemental stock repurchases from time to time, depending on market conditions, stock price and other factors. In
The following table summarizes Applied’s stock repurchases for fiscal 2011, 2010, Applied repurchased 28,802,000 shares of its common stock at an average price of $12.15 per share for a total cash outlay of $350 million. In fiscal 2009, Applied repurchased 1,942,000 shares of its common stock at an average price of $11.80 per share for a total cash outlay of $23 million. In fiscal 2008, Applied repurchased 83,163,000 shares of its common stock at an average price of $18.04 per share for a total cash outlay of $1.5 billion.
and 2009: | | | | | | | | | | | | |
| | | 2011 | | | 2010 | | | 2009 | |
| | | (In millions, except per share amounts) | |
Shares of common stock repurchased | | | 36 | | | | 29 | | | | 2 | |
Cost of stock repurchased | | $ | 468 | | | $ | 350 | | | $ | 23 | |
Average price paid per share | | $ | 12.88 | | | $ | 12.15 | | | $ | 11.80 | |
Applied records treasury stock purchases under the cost method using thefirst-in, first-out (FIFO) method. Upon reissuance of treasury stock, amounts in excess of the acquisition cost are credited to additional paid in capital. If Applied reissues treasury stock at an amount below its acquisition cost and additional paid in capital associated with prior treasury stock transactions is insufficient to cover the difference between the acquisition cost and the reissue price, this difference is recorded against retained earnings. During fiscal 2009, shares of treasury stock were issued in connection withunder Applied’s ESPPEmployee Stock Purchase Plans at an aggregate value that was less than the treasury stock’s acquisition price, resulting in $40 million being recorded against retained earnings.
Dividends
The following table summarizes the dividends declared by Applied’s Board of Directors during fiscal 2011:
| | | | | | |
Date declared | | Record date | | Payable date | | Amount per share |
December 7, 2010 | | March 2, 2011 | | March 23, 2011 | | $ 0.07 |
March 8, 2011 | | June 1, 2011 | | June 22, 2011 | | $ 0.08 |
June 6, 2011 | | August 31, 2011 | | September 21, 2011 | | $ 0.08 |
September 13, 2011 | | November 23, 2011 | | December 14, 2011 | | $ 0.08 |
DividendsAPPLIED MATERIALS, INC.
NOTES TO CONSOLIDATED FINANCIAL STATEMENTS — (Continued)
During fiscal 2010, Applied’s Board of Directors declared three quarterly cash dividends in the amount of $0.07 per share each and one quarterly cash dividendsdividend in the amount of $0.06 per share. The fourth quarterly cash dividend of $0.07 per share declared in fiscal 2010 will be paid on December 15, 2010 to stockholders of record as of November 24, 2010. During fiscal 2009, Applied’s Board of Directors declared four quarterly cash dividends in the amount of $0.06 per share each. During fiscal 2008, Applied’s Board of Directors declared four quarterly cash dividends in the amount of $0.06 per share each.each quarter. Dividends declared during fiscal 2011, 2010 2009 and 20082009 amounted to $408 million, $361 million $320 million and $323$320 million, respectively. Applied currently anticipates that itcash dividends will continue to pay cash dividendsbe paid on a quarterly basis, in the future, although the declaration and amount of any future cash dividend areis at the discretion of the Board of Directors and will depend on Applied’s financial condition, results of operations, capital requirements, business conditions and other factors, as well as a determination by the Board of Directors that cash dividends are in the best interestinterests of Applied’s stockholders.
Applied has adopted stock plans that permit grants to employees of share-based awards, including stock options, restricted stock and restricted stock units (also referred to as “performance shares” under Applied’s principal equity compensation plan, the Employee Stock Incentive Plan). In addition, the Employee Stock Incentive Plan provides for the automatic grant of restricted stock units to non-employee directors and permits the grant of equity-basedshare-based awards to consultants. Applied also has two Employee Stock Purchase Plans, one generally for United States employees and a second for employees of international employeessubsidiaries (collectively, ESPP), which enable eligible employees to purchase Applied common stock.
During fiscal 2011, 2010, 2009, and 2008,2009, Applied recognized share-based compensation expense related to stock options, ESPP shares, restricted stock units and restricted stock. Total share-based compensation and related tax benefits were as follows:
| | | | | | | | | | | | | |
| | | 2010 | | 2009 | | 2008 |
| | | (In thousands) |
| |
| Share-based compensation | | $ | 126,070 | | | $ | 147,160 | | | $ | 178,943 | |
| Tax benefit recognized | | $ | 38,035 | | | $ | 41,205 | | | $ | 50,104 | |
83
| | | | | | | | | | | | |
| | | 2011 | | | 2010 | | | 2009 | |
| | | (In millions) | |
Share-based compensation | | $ | 146 | | | $ | 126 | | | $ | 147 | |
Tax benefit recognized | | $ | 42 | | | $ | 38 | | | $ | 41 | |
The effect of share-based compensation on the results of operations for fiscal 2011, 2010, and 2009 was as follows:
| | | | | | | | | | | | |
| | | 2011 | | | 2010 | | | 2009 | |
| | | (In millions) | |
Cost of products sold | | $ | 48 | | | $ | 32 | | | $ | 28 | |
Research, development, and engineering | | | 46 | | | | 43 | | | | 50 | |
Selling, general and administrative | | | 52 | | | | 51 | | | | 69 | |
| | | | | | | | | | | | |
Total share-based compensation | | $ | 146 | | | $ | 126 | | | $ | 147 | |
| | | | | | | | | | | | |
APPLIED MATERIALS, INC.
NOTES TO CONSOLIDATED FINANCIAL STATEMENTS — (Continued)
The cost associated with equityshare-based awards that are subject solely to time-based vesting requirements, less expected forfeitures, is recognized over the awards’ service period for the entire award on a straight-line basis. The cost associated with performance-based equity awards is recognized for each tranche over the service period, based on an assessment of the achievement oflikelihood that the applicable performance goals.
goals will be achieved.At October 31, 2010,30, 2011, Applied had $180$219 million in total unrecognized compensation expense, net of estimated forfeitures, related to grants of stock option,options, restricted stock unitunits and restricted stock, grants,and shares issued under Applied’s ESPP, which will be recognized over a weighted average period of 2.42.6 years. Under the stock plans,At October 30, 2011, there were 155,617,000157 million shares available for grant at October 31, 2010, 151,809,000stock option, restricted stock unit, restricted stock grants and other share-based awards, and an additional 54 million shares available for grant at October 25, 2009, and 167,289,000 shares available for grant at October 26, 2008.
issuance under the ESPP.APPLIED MATERIALS, INC.
NOTES TO CONSOLIDATED FINANCIAL STATEMENTS — (Continued)
Stock Options
Applied grants options to purchase, at future dates, shares of its common stock to employees and consultants, at future dates, at the fair market value on the date of grant. Most options are scheduled to vest over four years, and expire no later than seven years from the grant date.consultants. The exercise price of each stock option equals the fair market value of Applied common stock on the date of grant. Most options are scheduled toOptions typically vest over three to four years, subject to the grantee’s continued service with Applied through the scheduled vesting date, and expire no later than seven years from the grant date. The fair value of each option grant is estimated on the date of grant using the Black-Scholes option pricing model. This model was developed for use in estimating the value of publicly traded options that have no vesting restrictions and are fully transferable. Applied’s employee stock options have characteristics significantly different from those of publicly traded options. There were no stock options granted during fiscal 2011 and 2010. The weighted average assumptions used in the model for options granted in fiscal 2009 and 2008 are outlined in the following table:
| | | | | | | | | |
| | | 2009 | | 2008 |
| |
| Stock Options: | | | | | | | | |
| Dividend yield | | | 2.8 | % | | | 1.24 | % |
| Expected volatility | | | 49.9 | % | | | 32.1 | % |
| Risk-free interest rate | | | 1.26 | % | | | 2.92 | % |
| Expected life (in years) | | | 3.0 | | | | 3.9 | |
| | | | |
| | 2009 | |
Stock Options: | | | | |
Dividend yield | | | 2.8 | % |
Expected volatility | | | 49.9 | % |
Risk-free interest rate | | | 1.26 | % |
Expected life (in years) | | | 3.0 | |
The computation of the expected volatility assumption used in the Black-Scholes calculations for new grants is based on a combination of historical and implied volatilities. When establishing the expected life assumption, Applied periodically reviews historical employee exercise behavior with respect to option grants.
The weighted average grant date fair value of options granted during fiscal 2009 and 2008 was $2.52 and $5.05, respectively.
$2.52.Options outstanding had an aggregate intrinsic value of $58 million, $73 million $109 million and $1$109 million at October 30, 2011, October 31, 2010, and October 25, 2009, and October 26, 2008, respectively. The total grant date fair value of options granted during fiscal 2009 and 2008 was $62 million and $34,000, respectively.million. The total intrinsic value of options exercised during fiscal 2011, 2010 and 2009 and 2008 was $23 million, $15 million $1 million and $54$1 million, respectively. The total fair value of options that vested during fiscal 2011, 2010 and 2009 and 2008 was $17 million, $21 million $14 million and $55$14 million, respectively. Cash received from stock option exercises was $41 million, $78 million and $9 million, and $328 million, respectively, during fiscal 2011, 2010 and 2009, and 2008.respectively. The actual tax benefit realized for the tax deductions from options exercised for fiscal 2011, 2010 and 2009 and 2008 totaled $26$11 million, $22$4 million and $57$0.4 million, respectively.
84
Stock option activity for fiscal 2011, 2010 and 2009 was as follows: | | | | | | | | | | | | | | | | | | | | | | | | |
| | | 2011 | | | 2010 | | | 2009 | |
| | | Shares | | | Weighted
Average
Exercise
Price | | | Shares | | | Weighted
Average
Exercise
Price | | | Shares | | | Weighted
Average
Exercise
Price | |
| | | (In millions, except per share amounts) | |
Outstanding, beginning of year | | | 51 | | | $ | 15.04 | | | | 73 | | | $ | 14.72 | | | | 61 | | | $ | 17.71 | |
Granted and assumed | | | — | | | $ | — | | | | — | | | $ | — | | | | 24 | | | $ | 8.58 | |
Exercised | | | (5 | ) | | $ | 9.21 | | | | (7 | ) | | $ | 10.88 | | | | (1 | ) | | $ | 11.44 | |
Canceled and forfeited | | | (16 | ) | | $ | 20.28 | | | | (15 | ) | | $ | 15.64 | | | | (11 | ) | | $ | 17.73 | |
| | | | | | | | | | | | | | | | | | | | | | | | |
Outstanding, end of year | | | 30 | | | $ | 13.05 | | | | 51 | | | $ | 15.04 | | | | 73 | | | $ | 14.72 | |
| | | | | | | | | | | | | | | | | | | | | | | | |
Exercisable, end of year | | | 24 | | | $ | 14.23 | | | | 37 | | | $ | 17.39 | | | | 50 | | | $ | 17.53 | |
NOTES TO CONSOLIDATED FINANCIAL STATEMENTS — (Continued)
Stock option activity for fiscal 2010, 2009 and 2008 was as follows:
| | | | | | | | | | | | | | | | | | | | | | | | | |
| | | 2010 | | | 2009 | | | 2008 | |
| | | | | | Weighted
| | | | | | Weighted
| | | | | | Weighted
| |
| | | | | | Average
| | | | | | Average
| | | | | | Average
| |
| | | | | | Exercise
| | | | | | Exercise
| | | | | | Exercise
| |
| | | Shares | | | Price | | | Shares | | | Price | | | Shares | | | Price | |
| | | | | | (In thousands, except per share amounts) | | | | |
| |
| Outstanding, beginning of year | | | 73,101 | | | $ | 14.72 | | | | 60,757 | | | $ | 17.71 | | | | 94,901 | | | $ | 17.81 | |
| Granted and assumed | | | — | | | $ | — | | | | 24,514 | | | $ | 8.58 | | | | 7 | | | $ | 19.38 | |
| Exercised | | | (7,149 | ) | | $ | 10.88 | | | | (797 | ) | | $ | 11.44 | | | | (19,004 | ) | | $ | 17.27 | |
| Canceled and forfeited | | | (14,838 | ) | | $ | 15.64 | | | | (11,373 | ) | | $ | 17.73 | | | | (15,147 | ) | | $ | 18.86 | |
| | | | | | | | | | | | | | | | | | | | | | | | | |
| Outstanding, end of year | | | 51,114 | | | $ | 15.04 | | | | 73,101 | | | $ | 14.72 | | | | 60,757 | | | $ | 17.71 | |
| | | | | | | | | | | | | | | | | | | | | | | | | |
| Exercisable, end of year | | | 37,476 | | | $ | 17.39 | | | | 49,727 | | | $ | 17.53 | | | | 57,671 | | | $ | 17.73 | |
The following table summarizes information with respect to options outstanding and exercisable at October 31, 2010:
| | | | | | | | | | | | | | | | | | | | | | | | | | | | | |
| | | Options Outstanding | | | Options Exercisable | |
| | | | | | | | | Weighted
| | | | | | | | | | | | | |
| | | | | | Weighted
| | | Average
| | | | | | | | | Weighted
| | | | |
| | | | | | Average
| | | Remaining
| | | Aggregate
| | | | | | Average
| | | Aggregate
| |
Range of
| | Number of
| | | Exercise
| | | Contractual
| | | Intrinsic
| | | Number of
| | | Exercise
| | | Intrinsic
| |
| Exercise Prices | | Shares | | | Price | | | Life | | | Value | | | Shares | | | Price | | | Value | |
| | | (In thousands) | | | | | | (In years) | | | (In thousands) | | | (In thousands) | | | | | | (In thousands) | |
| |
| $0.01 — $9.99 | | | 19,133 | | | $ | 8.58 | | | | 3.35 | | | $ | 72,171 | | | | 5,524 | | | $ | 8.57 | | | $ | 20,877 | |
| $10.00 — $19.99 | | | 19,459 | | | $ | 16.99 | | | | 1.70 | | | | 555 | | | | 19,429 | | | $ | 16.99 | | | | 541 | |
| $20.00 — $29.99 | | | 12,522 | | | $ | 21.89 | | | | 0.14 | | | | — | | | | 12,522 | | | $ | 21.89 | | | | — | |
| | | | | | | | | | | | | | | | | | | | | | | | | | | | | |
| | | | 51,114 | | | $ | 15.04 | | | | 1.94 | | | $ | 72,726 | | | | 37,475 | | | $ | 17.39 | | | $ | 21,418 | |
| | | | | | | | | | | | | | | | | | | | | | | | | | | | | |
| Options exercisable and expected to become exercisable | | | 50,402 | | | $ | 15.13 | | | | 1.92 | | | $ | 70,105 | | | | | | | | | | | | | |
30, 2011: | | | | | | | | | | | | | | | | | | | | | | | | | | | | |
| | | Options Outstanding | | | Options Exercisable | |
Range of Exercise Prices | | Number of
Shares | | | Weighted
Average
Exercise
Price | | | Weighted
Average
Remaining
Contractual
Life | | | Aggregate
Intrinsic
Value | | | Number of
Shares | | | Weighted
Average
Exercise
Price | | | Aggregate
Intrinsic
Value | |
| | | (In millions) | | | | | | (In years) | | | (In millions) | | | (In millions) | | | | | | (In millions) | |
$0.01 — $9.99 | | | 14 | | | $ | 8.58 | | | | 2.36 | | | $ | 58 | | | | 8 | | | $ | 8.58 | | | $ | 33 | |
$10.00 — $19.99 | | | 16 | | | $ | 17.08 | | | | 0.82 | | | | — | | | | 16 | | | $ | 17.08 | | | | — | |
$20.00 — $29.99 | | | — | | | $ | 21.91 | | | | 2.14 | | | | — | | | | — | | | $ | 21.91 | | | | — | |
| | | | | | | | | | | | | | | | | | | | | | | | | | | | |
| | | 30 | | | $ | 13.05 | | | | 1.56 | | | $ | 58 | | | | 24 | | | $ | 14.23 | | | $ | 33 | |
| | | | | | | | | | | | | | | | | | | | | | | | | | | | |
Options exercisable and expected to become exercisable | | | 30 | | | $ | 13.08 | | | | 1.55 | | | $ | 58 | | | | | | | | | | | | | |
Restricted Stock Units and Restricted Stock
Restricted stock units are converted into shares of Applied common stock upon vesting on aone-for-one basis. Restricted stock has the same rights as other issued and outstanding shares of Applied common stock except these shares have no right to dividends and are held in escrow until the award vests. Restricted stock units and awards of restricted stock typically are scheduled to vest over three to four years. Vesting of restricted stock units and restricted stock usually is subject to the grantee’s continued service with Applied and, in some cases, achievement of specified performance goals. The compensation expense related to these awards is determined using the fair market value of Applied common stock on the date of the grant, and the compensation expense is recognized over the vesting period. Beginning in fiscal 2007, Applied initiated a performance-based equity award program for named executive officers and other key employees. Awards of restricted stock units or restricted stock granted under this program (performance-based awards) become eligible to vest only if specific performance goals set by the Human Resources and Compensation Committee of Applied’s Board of Directors (the Committee) are achieved and then will vest only if the grantee remains employed by Applied through theeach applicable vesting date.
The performance goals require the achievement of targeted relativeadjusted annual operating profit margin levels as compared to Applied’s peer companies in at least one of the four fiscal years beginning with the fiscal year of the grant.grant and that Applied’s annual adjusted operating profit margin is positive in such year. An award that has become eligible for time-based vesting based on achievement of the performance goals will vest as to 25% of the award on December 19 of each of the four calendar years starting in the calendar year of the grant, provided that the grantee remains employed by Applied through each scheduled vesting date. Performance-based awards that do not become eligible for time-based vesting in a particular year may become eligible for time-based vesting in subsequent years up until the fourth fiscal year after grant, after which they are forfeited if the required performance goals have not been achieved. The fair value of these performance-based awards is estimated using the fair market value of Applied common stock on the date of the grant and assumes that the specified performance goals will be achieved. If achieved, these awards vest over a specified remaining service period.period as described above. If the performance goals are not met, no compensation expense is recognized and any previously recognized compensation expense is reversed. The
85
APPLIED MATERIALS, INC.
NOTES TO CONSOLIDATED FINANCIAL STATEMENTS — (Continued)
expected cost of each award is reflected over the service period and is reduced for estimated forfeitures. The Committee approved the grant of
1,825,0002 million performance-based restricted stock units and
50,0000.1 million performance-based shares of restricted stock under this program
forin each of fiscal
2010.2011, 2010 and 2008. There were no performance-based awards granted
forin fiscal 2009.
The Committee approvedWith respect to the
grantperformance-based awards granted in fiscal 2011, as of
1,565,000 performance-based restricted stock units and 100,000 performance-based sharesOctober 30, 2011, 100 percent of
restricted stock under this program for fiscal 2008.the awards had beenAPPLIED MATERIALS, INC.
NOTES TO CONSOLIDATED FINANCIAL STATEMENTS — (Continued)
earned, subject to additional time-based vesting requirements. With respect to the performance-based awards granted in fiscal 2010, as of October 31, 2010, 4030, 2011, 82 percent of the performance goals associated with these awards had been achieved.earned, subject to additional time-based vesting requirements. The performance goals associated withremaining 18 percent of the remaining 60 percentawards may still be achieved during the next threeearned, depending on future performance in one or both of fiscal years. With respect toyears 2012 and 2013. As of October 30, 2011, 90 percent of the performance-based awards granted in fiscal 2008, as of October 31, 2010, 78 percent of the performance goals associated with these awards had been achieved. The performance goals associated with the remaining 22 percent may still be achieved during fiscal 2011.
were earned.A summary of the changes in restricted stock units outstanding under Applied’s equity compensation plans during fiscal 2010, 2009 and 20082011 are presented below:
| | | | | | | | | | | | | | | | | |
| | | | | | Weighted
| | | Weighted
| | | | |
| | | | | | Average
| | | Average
| | | Aggregate
| |
| | | | | | Grant Date
| | | Remaining
| | | Intrinsic
| |
| | | Shares | | | Fair Value | | | Contractual Term | | | Value | |
| | | (In thousands, except per share amounts) | |
| |
| Non-vested restricted stock units and restricted stock at October 25, 2009 | | | 12,105 | | | $ | 16.16 | | | | 2.4 Years | | | $ | 156,762 | |
| Granted | | | 12,779 | | | | 12.36 | | | | | | | | | |
| Vested | | | (4,760 | ) | | | 17.13 | | | | | | | | | |
| Canceled | | | (1,774 | ) | | | 15.41 | | | | | | | | | |
| | | | | | | | | | | | | | | | | |
| Non-vested restricted stock units and restricted stock at October 31, 2010 | | | 18,350 | | | | 13.33 | | | | 2.8 | | | $ | 226,627 | |
| | | | | | | | | | | | | | | | | |
| Non-vested restricted stock units and restricted stock expected to vest | | | 16,143 | | | | 13.42 | | | | 2.7 | | | $ | 199,364 | |
| | | | | | | | | | | | | | | | |
| | | Shares | | | Weighted
Average
Grant Date
Fair Value | | | Weighted
Average
Remaining
Contractual Term | | | Aggregate
Intrinsic
Value | |
| | | (In millions, except per share amounts) | |
Non-vested restricted stock units and restricted stock at October 31, 2010 | | | 18 | | | $ | 13.33 | | | | 2.8 Years | | | $ | 227 | |
Granted | | | 17 | | | | 12.62 | | | | | | | | | |
Vested | | | (5 | ) | | | 14.64 | | | | | | | | | |
Canceled | | | (2 | ) | | | 13.11 | | | | | | | | | |
| | | | | | | | | | | | | | | | |
Non-vested restricted stock units and restricted stock at October 30, 2011 | | | 28 | | | | 12.64 | | | | 2.8 | | | $ | 345 | |
| | | | | | | | | | | | | | | | |
Non-vested restricted stock units and restricted stock expected to vest | | | 24 | | | | 12.52 | | | | 2.7 | | | $ | 304 | |
The actual tax benefit realized for the tax deductions from vested restricted stock units totaled $22 million in each of fiscal 2011, 2010 and 2009.
Employee Stock Purchase Plans
Under the ESPP, substantially all employees may purchase Applied common stock through payroll deductions at a price equal to 85 percent of the lower of the fair market value of Applied common stock at the beginning or end of each6-month purchase period, subject to certain limits. The number of shares issued under the ESPP during fiscal 2010, 2009 and 2008 was 5,436,000 shares, 6,920,000 shares and 4,617,000 shares, respectively. At October 31, 2010, there were 59,386,000 shares available for future issuance under the ESPP. Based on the Black-Scholes option pricing model, the weighted average estimated fair value of purchase rights under the ESPP was $3.03 per share for the year ended October 30, 2011, $2.76 per share for the year ended October 31, 2010 and $3.19 per share for the year ended October 25, 2009. The number of shares issued under the ESPP during fiscal 2011, 2010 and 2009 was 6 million, 5 million and $4.97 per share7 million, respectively. At October 30, 2011, there were 54 million available for future issuance under the year ended October 26, 2008.ESPP. Compensation expense is calculated using the fair value of the employees’ purchase rights under the Black-Scholes model. Underlying assumptions used in the model for fiscal 2011, 2010 2009 and 20082009 are outlined in the following table:
| | | | | | | | | | | | | |
| | | 2010 | | 2009 | | 2008 |
| |
| ESPP: | | | | | | | | | | | | |
| Dividend yield | | | 2.44 | % | | | 2.37 | % | | | 1.21 | % |
| Expected volatility | | | 33.3 | % | | | 58.8 | % | | | 29.9 | % |
| Risk-free interest rate | | | 0.19 | % | | | 0.33 | % | | | 4.16 | % |
| Expected life (in years) | | | 0.5 | | | | 0.5 | | | | 1.25 | |
86
| | | | | | | | | | | | |
| | | 2011 | | | 2010 | | | 2009 | |
ESPP: | | | | | | | | | | | | |
Dividend yield | | | 2.53 | % | | | 2.44 | % | | | 2.37 | % |
Expected volatility | | | 31.1 | % | | | 33.3 | % | | | 58.8 | % |
Risk-free interest rate | | | 0.09 | % | | | 0.19 | % | | | 0.33 | % |
Expected life (in years) | | | 0.5 | | | | 0.5 | | | | 0.5 | |
APPLIED MATERIALS, INC.
NOTES TO CONSOLIDATED FINANCIAL STATEMENTS — (Continued)
| Note | |
Note 14 | 13 Employee BenefitsBenefit Plans |
Applied has various employee bonus plans. A discretionary bonus plan provides for the distribution of a percentage of pre-tax profitsincome to Applied employees who are not eligible forparticipants in other performance-based incentive plans, up to a maximum percentage of eligible compensation. Other plans provide for bonuses to Applied’s executives and other key contributors based on the achievement of profitabilityand/or other specified performance criteria. Charges under these plans were $319 million for fiscal 2011, $320 million for fiscal 2010, and no charges for fiscal 2009, and $150 million for fiscal 2008.
2009.Employee Savings and Retirement Plan
Applied’s Employee Savings and Retirement Plan (401(k) Plan) is qualified under Sections 401(a) and (k) of the Internal Revenue Code. Eligible employees may make salary deferral andcatch-up contributions under the 401(k) Plan on a pre-tax basis. Applied matches a percentage of each participant’s salary deferral contributions with cash contributions. Plan participants who were employed by Applied or any of its affiliates on or after January 1, 2010 became 100% vested in their Applied matching contribution account balances. Participants may direct that funds held in their 401(k) Plan accounts, including any Applied matching contributions, be invested in any of the diversified investment funds available under the 401(k) Plan or within certain limits in the Applied Materials, Inc. Common Stock Fund (Stock Fund), which invests solely in shares of Applied common stock. The Stock Fund is a non-leveraged employee stock ownership plan (within the meaning of Section 4975(e)(7) of the Internal Revenue Code) and, as a result, participants have the option of specifying that any future cash dividends paid on shares held in the Stock Fund be either reinvested in the Stock Fund or distributed directly to them in cash no later than 90 days after the calendar year for which the dividends were paid. Applied’s matching contributions under this plan were approximately $27 million for fiscal 2011; $25 million, net of $1 million in forfeitures, for fiscal 2010; and $24 million, net of $1 million in forfeitures, for fiscal 2009; and $29 million, net of $2 million in forfeitures, for fiscal 2008.
2009.Defined Benefit Pension Plans of Foreign Subsidiaries and Other Post-Retirement Benefits
Several of Applied’s foreign subsidiaries have defined benefit pension plans covering substantially all of their eligible employees. Benefits under these plans are typically based on years of service and final average compensation levels. The plans are managed in accordance with applicable local statutes and practices. Applied deposits funds for certain of these plans with insurance companies, pension trustees, government-managed accounts,and/or accrues the expense for the unfunded portion of the benefit obligation on its Consolidated Financial Statements. Applied’s practice is to fund the various pension plans in amounts sufficient to meet the minimum requirements as established by applicable local governmental oversight and taxing authorities. Depending on the design of the plan, local custom and market circumstances, the liabilities of a plan may exceed qualified plan assets. The differences between the aggregate projected benefit obligations and aggregate plan assets of these plans have been recorded as liabilities by Applied and are included in employee benefits and accrued expenses in the Consolidated Balance Sheets. In fiscal 2009, Applied changed the measurement date for its defined and postretirement benefit plan assets and obligations from an interim date to Applied’s fiscal year end.
Applied also has a post-retirement plan that provides certain medical and vision benefits to eligible retirees who are at least age 55 and who havewhose years of service plus their age equals at least 10 years of service65 at their date of retirement. An eligible retiree also may elect coverage for an eligible spouse or domestic partner who is not eligible for Medicare. Coverage under the plan generally ends for both the retiree and spouse or domestic partner upon becoming eligible for Medicare. Applied’s liability under this post-retirement plan, which was included in other long-term liabilities in the Consolidated Balance Sheets, was $13 million at October 30, 2011 and $12 million at October 31, 2010 and $11 million at October 25, 2009.
87
APPLIED MATERIALS, INC.
NOTES TO CONSOLIDATED FINANCIAL STATEMENTS — (Continued)
A summary of the changes in benefit obligations and plan assets, which includes post-retirement benefits, for fiscal 20102011 and 20092010 is presented below.
| | | | | | | | | |
| | | 2010 | | | 2009 | |
| | | (In thousands, except percentages) | |
| |
Change in projected benefit obligation | | | | | | | | |
| Beginning projected benefit obligation | | $ | 279,394 | | | $ | 230,754 | |
| Service cost | | | 12,975 | | | | 13,604 | |
| Interest cost | | | 12,915 | | | | 12,095 | |
| Plan participants’ contributions | | | 1,088 | | | | 1,174 | |
| Actuarial loss | | | 24,765 | | | | 11,316 | |
| Curtailments, settlements and special termination benefits | | | (9,156 | ) | | | (5,842 | ) |
| Foreign currency exchange rate changes | | | (6,588 | ) | | | 21,789 | |
| Benefits paid | | | (6,050 | ) | | | (5,496 | ) |
| Plan amendments and business combinations | | | (223 | ) | | | — | |
| | | | | | | | | |
| Ending projected benefit obligation | | $ | 309,120 | | | $ | 279,394 | |
| | | | | | | | | |
Ending accumulated benefit obligation | | $ | 279,075 | | | $ | 253,934 | |
| | | | | | | | | |
Range of assumptions to determine benefit obligations | | | | | | | | |
| Discount rate | | | 1.5% - 5.6% | | | | 2.0% - 6.7% | |
| Rate of compensation increase | | | 2.0% - 5.0% | | | | 2.0% - 6.0% | |
Change in plan assets | | | | | | | | |
| Beginning fair value of plan assets | | $ | 109,607 | | | $ | 97,578 | |
| Return on plan assets | | | 7,569 | | | | 2,608 | |
| Employer contributions | | | 60,798 | | | | 14,996 | |
| Plan participants’ contributions | | | 1,088 | | | | 1,174 | |
| Foreign currency exchange rate changes | | | (2,864 | ) | | | 5,642 | |
| Divestitures, settlements and business combinations | | | (7,967 | ) | | | (6,895 | ) |
| Benefits paid | | | (6,050 | ) | | | (5,496 | ) |
| | | | | | | | | |
| Ending fair value of plan assets | | $ | 162,181 | | | $ | 109,607 | |
| | | | | | | | | |
| Funded status | | $ | (146,939 | ) | | $ | (169,787 | ) |
| | | | | | | | | |
Amounts recognized in the consolidated balance sheets | | | | | | | | |
| Noncurrent asset | | $ | — | | | $ | 30 | |
| Current liability | | | (2,616 | ) | | | (2,048 | ) |
| Noncurrent liability | | | (144,323 | ) | | | (167,769 | ) |
| | | | | | | | | |
| Total | | $ | (146,939 | ) | | $ | (169,787 | ) |
| | | | | | | | | |
Estimated amortization from accumulated other comprehensive loss into net periodic benefit cost over the next fiscal year | | | | | | | | |
| Actuarial loss | | $ | 2,119 | | | $ | 1,145 | |
| Prior service cost (credit) | | | (484 | ) | | | (251 | ) |
| Transition obligation | | | 32 | | | | 54 | |
| | | | | | | | | |
| Total | | $ | 1,667 | | | $ | 948 | |
| | | | | | | | | |
Amounts recognized in accumulated other comprehensive loss | | | | | | | | |
| Net actuarial loss | | $ | 47,996 | | | $ | 27,580 | |
| Prior service cost (credit) | | | (3,966 | ) | | | (1,943 | ) |
| Transition obligation | | | 109 | | | | 157 | |
| | | | | | | | | |
| Total | | $ | 44,139 | | | $ | 25,794 | |
| | | | | | | | | |
Plans with projected benefit obligations in excess of plan assets | | | | | | | | |
| Projected benefit obligation | | $ | 309,120 | | | $ | 270,425 | |
| Fair value of plan assets | | $ | 162,181 | | | $ | 100,608 | |
Plans with accumulated benefit obligations in excess of plan assets | | | | | | | | |
| Accumulated benefit obligation | | $ | 225,308 | | | $ | 237,174 | |
| Fair value of plan assets | | $ | 105,823 | | | $ | 89,443 | |
88
| | | | | | | | |
| | | 2011 | | | 2010 | |
| | | (In millions, except percentages) | |
Change in projected benefit obligation | | | | | | | | |
Beginning projected benefit obligation | | $ | 309 | | | $ | 279 | |
Service cost | | | 15 | | | | 13 | |
Interest cost | | | 14 | | | | 13 | |
Plan participants’ contributions | | | 1 | | | | 1 | |
Actuarial (gain) loss | | | (26 | ) | | | 25 | |
Curtailments, settlements and special termination benefits | | | (9 | ) | | | (9 | ) |
Foreign currency exchange rate changes | | | 5 | | | | (7 | ) |
Benefits paid | | | (8 | ) | | | (6 | ) |
Plan amendments and business combinations | | | 2 | | | | — | |
| | | | | | | | |
Ending projected benefit obligation | | $ | 303 | | | $ | 309 | |
| | | | | | | | |
Ending accumulated benefit obligation | | $ | 273 | | | $ | 279 | |
| | | | | | | | |
Range of assumptions to determine benefit obligations | | | | | | | | |
Discount rate | | | 1.7% - 6.5% | | | | 1.5% - 5.6% | |
Rate of compensation increase | | | 2.0% - 5.0% | | | | 2.0% - 5.0% | |
Change in plan assets | | | | | | | | |
Beginning fair value of plan assets | | $ | 162 | | | $ | 110 | |
Return on plan assets | | | 3 | | | | 7 | |
Employer contributions | | | 26 | | | | 61 | |
Plan participants’ contributions | | | 1 | | | | 1 | |
Foreign currency exchange rate changes | | | 2 | | | | (3 | ) |
Divestitures, settlements and business combinations | | | (3 | ) | | | (8 | ) |
Benefits paid | | | (8 | ) | | | (6 | ) |
| | | | | | | | |
Ending fair value of plan assets | | $ | 183 | | | $ | 162 | |
| | | | | | | | |
Funded status | | $ | (120 | ) | | $ | (147 | ) |
| | | | | | | | |
Amounts recognized in the consolidated balance sheets | | | | | | | | |
Noncurrent asset | | $ | 13 | | | $ | — | |
Current liability | | | (3 | ) | | | (3 | ) |
Noncurrent liability | | | (130 | ) | | | (144 | ) |
| | | | | | | | |
Total | | $ | (120 | ) | | $ | (147 | ) |
| | | | | | | | |
Estimated amortization from accumulated other comprehensive loss into net periodic benefit cost over the next fiscal year | | | | | | | | |
Actuarial loss | | | 1 | | | | 2 | |
| | | | | | | | |
Total | | $ | 1 | | | $ | 2 | |
| | | | | | | | |
Amounts recognized in accumulated other comprehensive loss | | | | | | | | |
Net actuarial loss | | $ | 27 | | | $ | 48 | |
Prior service cost (credit) | | | (4 | ) | | | (4 | ) |
| | | | | | | | |
Total | | $ | 23 | | | $ | 44 | |
| | | | | | | | |
Plans with projected benefit obligations in excess of plan assets | | | | | | | | |
Projected benefit obligation | | $ | 259 | | | $ | 309 | |
Fair value of plan assets | | $ | 126 | | | $ | 162 | |
Plans with accumulated benefit obligations in excess of plan assets | | | | | | | | |
Accumulated benefit obligation | | $ | 225 | | | $ | 225 | |
Fair value of plan assets | | $ | 116 | | | $ | 106 | |
APPLIED MATERIALS, INC.
NOTES TO CONSOLIDATED FINANCIAL STATEMENTS — (Continued)
| | | | | | | | | |
| | | 2010 | | | 2009 | |
| |
Plan assets — allocation | | | | | | | | |
| Equity securities | | | 38 | % | | | 47 | % |
| Debt securities | | | 29 | % | | | 40 | % |
| Real Estate | | | — | | | | 3 | % |
| Cash | | | — | | | | 1 | % |
| Other | | | 33 | % | | | 9 | % |
| | | | | | | | |
| | | 2011 | | | 2010 | |
Plan assets — allocation | | | | | | | | |
Equity securities | | | 37 | % | | | 38 | % |
Debt securities | | | 28 | % | | | 29 | % |
Cash | | | 4 | % | | | — | |
Other | | | 31 | % | | | 33 | % |
The following table presents a summary of the ending fair value of the plan assets:
| | | | | | | | | | | | | | | | | |
| | | October 31, 2010 | |
| | | Level 1 | | | Level 2 | | | Level 3 | | | Total | |
| | | (In thousands) | |
| |
| Equity securities | | $ | 61,905 | | | $ | — | | | $ | — | | | $ | 61,905 | |
| Debt securities | | | 45,993 | | | | — | | | | — | | | | 45,993 | |
| Insurance contracts | | | — | | | | — | | | | 44,077 | | | | 44,077 | |
| Commingled funds | | | — | | | | 9,795 | | | | — | | �� | | 9,795 | |
| Real Estate | | | — | | | | — | | | | 153 | | | | 153 | |
| Cash | | | 258 | | | | — | | | | — | | | | 258 | |
| | | | | | | | | | | | | | | | | |
| Total | | $ | 108,156 | | | $ | 9,795 | | | $ | 44,230 | | | $ | 162,181 | |
| | | | | | | | | | | | | | | | | |
| | | | | | | | | | | | | | | | | | | | | | | | | | | | | | | | |
| | | October 30, 2011 | | | October 31, 2010 | |
| | | Level 1 | | | Level 2 | | | Level 3 | | | Total | | | Level 1 | | | Level 2 | | | Level 3 | | | Total | |
| | | (In millions) | | | (In millions) | |
Equity securities | | $ | 67 | | | $ | — | | | $ | — | | | $ | 67 | | | $ | 62 | | | $ | — | | | $ | — | | | $ | 62 | |
Debt securities | | | 51 | | | | — | | | | — | | | | 51 | | | | 46 | | | | — | | | | — | | | | 46 | |
Insurance contracts | | | — | | | | — | | | | 48 | | | | 48 | | | | — | | | | — | | | | 44 | | | | 44 | |
Commingled funds | | | — | | | | 10 | | | | — | | | | 10 | | | | — | | | | 10 | | | | — | | | | 10 | |
Cash | | | 7 | | | | — | | | | — | | | | 7 | | | | — | | | | — | | | | — | | | | — | |
| | | | | | | | | | | | | | | | | | | | | | | | | | | | | | | | |
Total | | $ | 125 | | | $ | 10 | | | $ | 48 | | | $ | 183 | | | $ | 108 | | | $ | 10 | | | $ | 44 | | | $ | 162 | |
| | | | | | | | | | | | | | | | | | | | | | | | | | | | | | | | |
The following table presents the activity in Level 3 instruments during fiscal 2010:
| | | | | |
| | | 2010 | |
| | | Level 3 | |
| | | (In thousands) | |
| |
| Balance, beginning of year | | $ | 11,308 | |
| Actual return on plan assets: | | | | |
| Relating to assets still held at reporting date | | | 380 | |
| Purchases, sales, settlements, net | | | 31,745 | |
| Actual return on transfers in and/or out of Level 3, net | | | — | |
| Currency impact | | | 797 | |
| | | | | |
| Balance, end of year | | $ | 44,230 | |
| | | | | |
2011: | | | | | | | | |
| | | 2011 | | | 2010 | |
| | | Level 3 | | | Level 3 | |
| | | (In millions) | |
Balance, beginning of year | | $ | 44 | | | $ | 11 | |
Actual return on plan assets: | | | | | | | | |
Relating to assets still held at reporting date | | | 1 | | | | — | |
Purchases, sales, settlements, net | | | 2 | | | | 32 | |
Actual return on transfers in and/or out of Level 3, net | | | — | | | | — | |
Currency impact | | | 1 | | | | 1 | |
| | | | | | | | |
Balance, end of year | | $ | 48 | | | $ | 44 | |
| | | | | | | | |
Applied’s investment strategy for its defined benefit plans is to invest plan assets in a prudent manner, maintaining well-diversified portfolios with the long-term objective of meeting the obligations of the plans as they come due. Asset allocation decisions are typically made by plan fiduciaries with input from Applied’s international pension oversight committee. Applied’s asset allocation strategy incorporates a sufficient equity exposure in order for the plans to benefit from the expected long-term outperformance of equities relative to the plans’ liabilities. Applied retains investment managers, where appropriate, to manage the assets of the plans. Performance of investment managers is monitored by plan fiduciaries with the assistance of local investment consultants. The investment managers make investment decisions within the guidelines set forth by plan fiduciaries. Risk management practices include diversification across asset classes and investment styles, and periodic rebalancing toward target asset allocation ranges. Investment managers may use derivative instruments for efficient portfolio management purposes. Plan assets do not include any of Applied’s own equity or debt securities.
89
APPLIED MATERIALS, INC.
NOTES TO CONSOLIDATED FINANCIAL STATEMENTS — (Continued)
A summary of the components of net periodic benefit costs and the weighted average assumptions used for net periodic benefit cost and benefit obligation calculations for fiscal 2011, 2010 2009 and 20082009 is presented below.
| | | | | | | | | | | | | |
| | | 2010 | | | 2009 | | | 2008 | |
| | | (In thousands, except percentages) | |
| |
Components of net periodic benefit cost | | | | | | | | | | | | |
| Service cost | | $ | 12,975 | | | $ | 13,604 | | | $ | 15,546 | |
| Interest cost | | | 12,915 | | | | 12,095 | | | | 13,409 | |
| Expected return on plan assets | | | (7,181 | ) | | | (7,187 | ) | | | (8,583 | ) |
| Amortization of actuarial loss | | | 1,012 | | | | 634 | | | | 561 | |
| Amortization of prior service costs (credit) | | | (303 | ) | | | (294 | ) | | | 231 | |
| Amortization of transition obligation | | | 51 | | | | 76 | | | | 83 | |
| Settlement loss | | | 1,273 | | | | 807 | | | | 91 | |
| Curtailment gain | | | (68 | ) | | | (1,379 | ) | | | — | |
| | | | | | | | | | | | | |
| Net periodic benefit cost | | $ | 20,674 | | | $ | 18,356 | | | $ | 21,338 | |
| | | | | | | | | | | | | |
Weighted average assumptions | | | | | | | | | | | | |
| Discount rate | | | 4.76% | | | | 5.00% | | | | 4.81% | |
| Expected long-term return on assets | | | 6.92% | | | | 7.43% | | | | 7.41% | |
| Rate of compensation increase | | | 3.30% | | | | 3.67% | | | | 3.31% | |
| | | | | | | | | | | | |
| | | 2011 | | | 2010 | | | 2009 | |
| | | (In millions, except percentages) | |
Components of net periodic benefit cost | | | | | | | | | | | | |
Service cost | | $ | 15 | | | $ | 13 | | | $ | 13 | |
Interest cost | | | 14 | | | | 13 | | | | 12 | |
Expected return on plan assets | | | (11) | | | | (7) | | | | (7) | |
Amortization of actuarial loss | | | 2 | | | | 1 | | | | 1 | |
Settlement loss | | | 2 | | | | 1 | | | | 1 | |
Curtailment gain | | | (4) | | | | — | | | | (2) | |
| | | | | | | | | | | | |
Net periodic benefit cost | | $ | 18 | | | $ | 21 | | | $ | 18 | |
| | | | | | | | | | | | |
Weighted average assumptions | | | | | | | | | | | | |
Discount rate | | | 4.33% | | | | 4.76% | | | | 5.00% | |
Expected long-term return on assets | | | 6.39% | | | | 6.92% | | | | 7.43% | |
Rate of compensation increase | | | 3.42% | | | | 3.30% | | | | 3.67% | |
Asset return assumptions are derived based on actuarial and statistical methodologies, from analysis of long-term historical data relevant to the country in which each plan is in effect and the investments applicable to the corresponding plan. The discount rate for each plan was derived by reference to appropriate benchmark yields on high quality corporate bonds, allowing for the approximate duration of both plan obligations and the relevant benchmark yields.
Future expected benefit payments for the pension plans and the post-retirement plan over the next ten fiscal years are: $10 million in fiscal 2011, $11 million in fiscal 2012, $11 million in fiscal 2013, $16 million in fiscal 2014, $16$17 million in fiscal 2015, $17 million in fiscal 2016, and $94$98 million collectively for fiscal years 20162017 through 2020.2021. Company contributions to these plans for fiscal 20112012 are expected to be approximately $18$24 million.
Executive Deferred Compensation Plans
Applied sponsors two unfunded deferred compensation plans, the Executive Deferred Compensation Plan (Predecessor EDCP) and the 2005 Executive Deferred Compensation Plan (2005 EDCP), under which certain employees may elect to defer a portion of their following year’s eligible earnings. The Predecessor EDCP was frozen as of December 31, 2004 such that no new deferrals could be made under the plan after that date and the plan would qualify for “grandfather” relief under Section 409A of the Internal Revenue Code. The Predecessor EDCP participant accounts continue to be maintained under the plan and credited with deemed interest. The 2005 EDCP was implemented by Applied effective as of January 1, 2005 and is intended to comply with the requirements of Section 409A of the Internal Revenue Code. Amounts payable, including accrued deemed interest, totaled $59 million at October 30, 2011 and $66 million at October 31, 2010, and $77 million at October 25, 2009, which were included in other long-term liabilities in the Consolidated Balance Sheets.
90
APPLIED MATERIALS, INC.
NOTES TO CONSOLIDATED FINANCIAL STATEMENTS — (Continued)
| Note | |
Note 15 | 14 Income Taxes |
The components of income (loss) from operations before income taxes for fiscal 2011, 2010 2009 and 20082009 were as follows:
| | | | | | | | | | | | | |
| | | 2010 | | | 2009 | | | 2008 | |
| | | | | | (In thousands) | | | | |
| |
| U.S. | | $ | 786,675 | | | $ | (555,456 | ) | | $ | 1,021,961 | |
| Foreign | | | 600,291 | | | | 69,653 | | | | 386,757 | |
| | | | | | | | | | | | | |
| | | $ | 1,386,966 | | | $ | (485,803 | ) | | $ | 1,408,718 | |
| | | | | | | | | | | | | |
| | | | | | | | | | | | |
| | | 2011 | | | 2010 | | | 2009 | |
| | | (In millions) | |
U.S. | | $ | 1,257 | | | $ | 787 | | | $ | (555 | ) |
Foreign | | | 1,121 | | | | 600 | | | | 69 | |
| | | | | | | | | | | | |
| | $ | 2,378 | | | $ | 1,387 | | | $ | (486 | ) |
| | | | | | | | | | | | |
The components of the provision (benefit) for income taxes for fiscal 2011, 2010 2009 and 20082009 were as follows:
| | | | | | | | | | | | | |
| | | 2010 | | | 2009 | | | 2008 | |
| | | (In thousands) | |
| |
| Current: | | | | | | | | | | | | |
| U.S. | | $ | 463,119 | | | $ | (196,643 | ) | | $ | 248,308 | |
| Foreign | | | 133,745 | | | | 22,858 | | | | 182,803 | |
| State | | | 33,796 | | | | (36,683 | ) | | | 5,314 | |
| | | | | | | | | | | | | |
| | | | 630,660 | | | | (210,468 | ) | | | 436,425 | |
| | | | | | | | | | | | | |
| Deferred: | | | | | | | | | | | | |
| U.S. | | | (160,396 | ) | | | 25,351 | | | | 61,469 | |
| Foreign | | | 4,537 | | | | 10,347 | | | | (43,505 | ) |
| State | | | (25,701 | ) | | | (5,706 | ) | | | (6,417 | ) |
| | | | | | | | | | | | | |
| | | | (181,560 | ) | | | 29,992 | | | | 11,547 | |
| | | | | | | | | | | | | |
| | | $ | 449,100 | | | $ | (180,476 | ) | | $ | 447,972 | |
| | | | | | | | | | | | | |
| | | | | | | | | | | | |
| | | 2011 | | | 2010 | | | 2009 | |
| | | (In millions) | |
Current: | | | | | | | | | | | | |
U.S. | | $ | 290 | | | $ | 463 | | | $ | (197 | ) |
Foreign | | | 206 | | | | 134 | | | | 23 | |
State | | | 5 | | | | 34 | | | | (37 | ) |
| | | | | | | | | | | | |
| | | 501 | | | | 631 | | | | (211 | ) |
| | | | | | | | | | | | |
Deferred: | | | | | | | | | | | | |
U.S. | | | (95 | ) | | | (160 | ) | | | 25 | |
Foreign | | | (23 | ) | | | 4 | | | | 10 | |
State | | | 69 | | | | (26 | ) | | | (5 | ) |
| | | | | | | | | | | | |
| | | (49 | ) | | | (182 | ) | | | 30 | |
| | | | | | | | | | | | �� |
| | $ | 452 | | | $ | 449 | | | $ | (181 | ) |
| | | | | | | | | | | | |
A reconciliation between the statutory U.S. federal income tax rate of 35 percent and Applied’s actual effective income tax rate for fiscal 2011, 2010 2009 and 20082009 is presented below:
| | | | | | | | | | | | | |
| | | 2010 | | | 2009 | | | 2008 | |
| |
| Tax provision (benefit) at U.S. statutory rate | | | 35.0 | % | | | (35.0 | )% | | | 35.0 | % |
| Favorable resolutions from audits of prior years’ income tax filings | | | — | | | | (2.9 | ) | | | — | |
| Effect of foreign operations taxed at various rates | | | (3.0 | ) | | | — | | | | (1.0 | ) |
| State income taxes, net of federal benefit | | | 0.9 | | | | (3.9 | ) | | | 0.7 | |
| Research and other tax credits | | | (0.3 | ) | | | (2.0 | ) | | | (1.1 | ) |
| Export sales/production benefit | | | (1.2 | ) | | | — | | | | (2.0 | ) |
| Equity method investment loss/impairment | | | — | | | | 5.7 | | | | 0.9 | |
| Share-based compensation | | | 0.6 | | | | 2.4 | | | | 1.0 | |
| Other | | | 0.4 | | | | (1.5 | ) | | | (1.7 | ) |
| | | | | | | | | | | | | |
| | | | 32.4 | % | | | (37.2 | )% | | | 31.8 | % |
| | | | | | | | | | | | | |
91
| | | | | | | | | | | | |
| | | 2011 | | | 2010 | | | 2009 | |
Tax provision (benefit) at U.S. statutory rate | | | 35.0 | % | | | 35.0 | % | | | (35.0 | )% |
Favorable resolutions from audits of prior years’ income tax filings | | | (6.9 | ) | | | — | | | | (2.9 | ) |
Effect of foreign operations taxed at various rates | | | (10.1 | ) | | | (3.0 | ) | | | — | |
State income taxes, net of federal benefit | | | 1.6 | | | | 0.9 | | | | (3.9 | ) |
Research and other tax credits | | | (1.2 | ) | | | (0.3 | ) | | | (2.0 | ) |
Export sales/production benefit | | | (0.8 | ) | | | (1.2 | ) | | | — | |
Equity method investment loss/impairment | | | — | | | | — | | | | 5.7 | |
Share-based compensation | | | 0.4 | | | | 0.6 | | | | 2.4 | |
Other | | | 1.0 | | | | 0.4 | | | | (1.5 | ) |
| | | | | | | | | | | | |
| | | 19.0 | % | | | 32.4 | % | | | (37.2 | )% |
| | | | | | | | | | | | |
APPLIED MATERIALS, INC.
NOTES TO CONSOLIDATED FINANCIAL STATEMENTS — (Continued)
Deferred income taxes reflect the net tax effects of temporary differences between the carrying amounts of assets and liabilities for financial reporting purposes and the amounts used for income tax purposes. The components of deferred income tax assets and liabilities are as follows:
| | | | | | | | | |
| | | October 31,
| | | October 25,
| |
| | | 2010 | | | 2009 | |
| | | (In thousands) | |
| |
| Deferred tax assets: | | | | | | | | |
| Inventory reserves and basis difference | | $ | 156,226 | | | $ | 102,180 | |
| Installation and warranty reserves | | | 38,832 | | | | 44,802 | |
| Accrued liabilities | | | 307,289 | | | | 178,414 | |
| Restructuring reserves | | | 40,024 | | | | 16,510 | |
| Deferred revenue | | | 47,308 | | | | 24,631 | |
| Capital loss carryforward | | | 17,629 | | | | 11,049 | |
| Tax credits and net operating losses | | | 65,017 | | | | 84,075 | |
| Deferred compensation | | | 25,624 | | | | 29,041 | |
| Share-based compensation | | | 46,346 | | | | 63,791 | |
| Intangibles | | | 22,020 | | | | 28,415 | |
| | | | | | | | | |
| Gross deferred tax assets | | | 766,315 | | | | 582,908 | |
| Valuation allowance | | | (12,949 | ) | | | (11,049 | ) |
| | | | | | | | | |
| Total deferred tax assets | | | 753,366 | | | | 571,859 | |
| | | | | | | | | |
| Deferred tax liabilities: | | | | | | | | |
| Depreciation | | | (43,064 | ) | | | (56,927 | ) |
| Purchased technology | | | (113,462 | ) | | | (98,717 | ) |
| Other | | | (48,984 | ) | | | (33,807 | ) |
| | | | | | | | | |
| Total gross deferred tax liabilities | | | (205,510 | ) | | | (189,451 | ) |
| | | | | | | | | |
| Net deferred tax assets | | $ | 547,856 | | | $ | 382,408 | |
| | | | | | | | | |
| | | | | | | | |
| | | October 30,
2011 | | | October 31,
2010 | |
| | | (In millions) | |
Deferred tax assets: | | | | | | | | |
Inventory reserves and basis difference | | $ | 214 | | | $ | 228 | |
Installation and warranty reserves | | | 31 | | | | 39 | |
Foreign tax credits on undistributed foreign earnings | | | 112 | | | | 18 | |
Accrued liabilities | | | 250 | | | | 217 | |
Restructuring reserves | | | 4 | | | | 40 | |
Deferred revenue | | | 53 | | | | 47 | |
Capital loss carryforward | | | 4 | | | | 18 | |
Tax credits and net operating losses | | | 39 | | | | 65 | |
Deferred compensation | | | 21 | | | | 26 | |
Share-based compensation | | | 49 | | | | 46 | |
Intangibles | | | 10 | | | | 22 | |
| | | | | | | | |
Gross deferred tax assets | | | 787 | | | | 766 | |
Valuation allowance | | | (13 | ) | | | (13 | ) |
| | | | | | | | |
Total deferred tax assets | | | 774 | | | | 753 | |
| | | | | | | | |
Deferred tax liabilities: | | | | | | | | |
Depreciation | | | (61 | ) | | | (43 | ) |
Purchased technology | | | (86 | ) | | | (113 | ) |
Other | | | (44 | ) | | | (49 | ) |
| | | | | | | | |
Total gross deferred tax liabilities | | | (191 | ) | | | (205 | ) |
| | | | | | | | |
Net deferred tax assets | | $ | 583 | | | $ | 548 | |
| | | | | | | | |
The following table presents the breakdown between current and non-current net deferred tax assets and liabilities:
| | | | | | | | | |
| | | October 31,
| | | October 25,
| |
| | | 2010 | | | 2009 | |
| | | (In thousands) | |
| |
| Current deferred tax asset | | $ | 512,944 | | | $ | 356,336 | |
| Non-current deferred tax asset | | | 112,147 | | | | 98,271 | |
| Current deferred tax liability | | | (2,534 | ) | | | (3,487 | ) |
| Non-current deferred tax liability | | | (74,701 | ) | | | (68,712 | ) |
| | | | | | | | | |
| | | $ | 547,856 | | | $ | 382,408 | |
| | | | | | | | | |
| | | | | | | | |
| | | October 30,
2011 | | | October 31,
2010 | |
| | | (In millions) | |
Current deferred tax asset | | $ | 580 | | | $ | 513 | |
Non-current deferred tax asset | | | 78 | | | | 112 | |
Current deferred tax liability | | | (1 | ) | | | (2 | ) |
Non-current deferred tax liability | | | (74 | ) | | | (75 | ) |
| | | | | | | | |
| | $ | 583 | | | $ | 548 | |
| | | | | | | | |
Current deferred tax liabilities are included in accounts payable and accrued expenses on the Consolidated Balance Sheets and non-current deferred tax liabilities are included in employee benefits and other liabilities on the Consolidated Balance Sheets.
APPLIED MATERIALS, INC.
NOTES TO CONSOLIDATED FINANCIAL STATEMENTS — (Continued)
A valuation allowance is recorded to reflect the estimated amount of deferred tax assets that may not be realized. TheIn fiscal 2011, the valuation allowance has been established against capital loss carryforwards was released due to recognition of sufficient capital gains. A valuation allowance was established against California Research and Development Credit carryforward where it is believed that it is not more likely than not that sufficient capital gainsthe carryforward will be realized withinrealized.
The Company has been granted tax holidays for certain of its subsidiaries in Singapore and Israel. The tax benefit arising from these tax holidays was $128 million for 2011 ($0.10 per diluted share), The tax holidays expire at various times through 2025, excluding potential renewals, and are subject to certain conditions with which the remaining carryforward period.
92
APPLIED MATERIALS, INC.
NOTES TO CONSOLIDATED FINANCIAL STATEMENTS — (Continued)
For fiscal 2010,2011, U.S. income taxes have not been provided for approximately $652 million$1.0 billion of cumulative undistributed earnings of severalnon-U.S. subsidiaries. Applied intends to reinvest these earnings indefinitely in operations outside of the U.S. If these earnings were distributed to the United States in the form of dividends or otherwise, or if the shares of the relevant foreign subsidiaries were sold or otherwise transferred, the Company would be subject to additional U.S. income taxes (subject to an adjustment for foreign tax credits) and foreign withholding taxes. Determination of the amount of unrecognized deferred income tax liability related to these earnings is not practicable.
At October 31, 2010, Applied’s state net operating loss carryforwards were $55 million. The carryforwards expire between fiscal 2021 and fiscal 2031.30, 2011, Applied has a California research and development tax credit carryforward of $31$13 million which has an unlimited life. Applied also has net operating loss carryforwards in foreign jurisdictions of $105$64 million. The carryforwards have lives ranging from five years to indefinite. Management believes it is more likely than not that all loss and tax credit carryforwards at October 31, 201030, 2011, net of valuation allowance, will be utilized in future periods.
Applied’s income taxes payable have been reduced by the tax benefits associated with employee stock option transactions. These benefits, credited directly to stockholders’ equity, amounted to $4 million for fiscal 2011, $2 million for fiscal 2010, and $1 million for fiscal 2009 and $7 million for fiscal 2008 with a corresponding reduction to taxes payable of $2$4 million in fiscal 2010, $1 million in fiscal 2009, and $72011, $2 million for fiscal 2008.
2010, and $1 million for fiscal 2009.Applied maintains liabilities for uncertain tax positions. These liabilities involve considerable judgment and estimation and are continuously monitored by management based on the best information available. A reconciliation of the beginning and ending balances of the total amounts of gross unrecognized tax benefits is as follows (in thousands):
| | | | | | | | | |
| | | 2010 | | | 2009 | |
| | | (In thousands) | |
| |
| Beginning balance of gross unrecognized tax benefits | | $ | 325,300 | | | $ | 363,400 | |
| Settlements with tax authorities | | | — | | | | (37,400 | ) |
| Increases in tax positions for prior years | | | 3,000 | | | | 1,000 | |
| Decreases in tax positions for prior years | | | (300 | ) | | | (1,700 | ) |
| | | | | | | | | |
| Ending balance of gross unrecognized tax benefits | | $ | 328,000 | | | $ | 325,300 | |
| | | | | | | | | |
follows: | | | | | | | | |
| | | 2011 | | | 2010 | |
| | | (In millions) | |
Beginning balance of gross unrecognized tax benefits | | $ | 328 | | | $ | 325 | |
Settlements with tax authorities | | | (314 | ) | | | — | |
Increases in tax positions for current years | | | 45 | | | | 3 | |
Decreases in tax positions for prior years | | | — | | | | — | |
| | | | | | | | |
Ending balance of gross unrecognized tax benefits | | $ | 59 | | | $ | 328 | |
| | | | | | | | |
As of October 31, 2010,30, 2011, Applied had unrecognized tax benefits, net of federal deduction for state tax, of $324$59 million, all of which, if recognized, would result in a reduction of Applied’s effective tax rate.
As of October 31, 2010,30, 2011, the gross liability for unrecognized tax benefits was $328$59 million, exclusive of interest and penalties. Increases or decreases to interest and penalties on uncertain tax positions are included in provision for income taxes in the Consolidated Statement of Operations. Interest and penalties related to uncertain tax positions were $1 million as of October 30, 2011 and $6 million as of October 31, 2010 and $5 million as of October 25, 2009.2010. All $6$1 million in interest and penalties iswere classified as a long-term liability in the Consolidated Balance Sheets. Long term income taxes payable has been reduced by certain unrecognized tax benefits.
DuringAPPLIED MATERIALS, INC.
NOTES TO CONSOLIDATED FINANCIAL STATEMENTS — (Continued)
In fiscal 2010,2011, Applied received a refund of U.S. federal taxes$276 million, including interest, as a result of approximately $130 million due to the carryback of the fiscal year 2009 net operating loss to fiscal year 2005.
During fiscal 2009, thesettling an Internal Revenue Service
(IRS) audit for fiscal years 2006 and 2007. This resulted in the recognition of a tax benefit of $176 million in the Consolidated Statement of Operations for fiscal 2011, which was net of previously recognized tax benefits.During fiscal 2011, the IRS began an examination of Applied’s federal income tax returns for fiscal years 20072009 and 2006.2008. Applied believes it has adequately reserved for any income tax uncertainties that may arise as a result of this examination.
A number of Applied’s tax returns remain subject to examination by taxing authorities. These include U.S. federal returns for fiscal 20042008 and later years, California returns for fiscal 2006 and later years, tax returns for
93
APPLIED MATERIALS, INC.
NOTES TO CONSOLIDATED FINANCIAL STATEMENTS — (Continued)
certain other states for fiscal 20052006 and later years, and tax returns in certain jurisdictions outside of the United States for fiscal 20032004 and later years.
The timing of the resolution of income tax examinations, as well as the amounts and timing of various tax payments that may be part of the settlement process, is highly uncertain. This could cause large fluctuations in the balance sheet classification of current assets and non-current assets and liabilities. Applied does not expect a material change in unrecognized tax benefits in the next 12 months.
| |
Note 16 15 | Warranty, Guarantees and Contingencies |
Applied leases some of its facilities and equipment under non-cancelable operating leases and has options to renew most leases, with rentals to be negotiated. Total rent expense was $52$44 million for fiscal 2011, $44 million for fiscal 2010, $64and $55 million for fiscal 2009, and $68 million for fiscal 2008.
2009.As of October 31, 2010,30, 2011, future minimum lease payments is expected to be as follows:
| | | | | |
| | | Lease Payments | |
| | | (In thousands) | |
| |
| 2011 | | $ | 41,765 | |
| 2012 | | | 28,924 | |
| 2013 | | | 16,100 | |
| 2014 | | | 14,211 | |
| 2015 | | | 12,114 | |
| Thereafter | | | 30,376 | |
| | | | | |
| | | $ | 143,490 | |
| | | | | |
| | | | |
| | | Lease Payments | |
| | | (In millions) | |
2012 | | $ | 33 | |
2013 | | | 22 | |
2014 | | | 14 | |
2015 | | | 10 | |
2016 | | | 8 | |
Thereafter | | | 21 | |
| | | | |
| | $ | 108 | |
| | | | |
Warranty
Changes in the warranty reserves during fiscal 20102011 and 20092010 were as follows:
| | | | | | | | | |
| | | 2010 | | | 2009 | |
| | | (In thousands) | |
| |
| Beginning balance | | $ | 117,537 | | | $ | 142,846 | |
| Provisions for warranty | | | 151,915 | | | | 92,976 | |
| Consumption of reserves | | | (114,210 | ) | | | (118,285 | ) |
| | | | | | | | | |
| Ending balance | | $ | 155,242 | | | $ | 117,537 | |
| | | | | | | | | |
| | | | | | | | |
| | | 2011 | | | 2010 | |
| | | (In millions) | |
Beginning balance | | $ | 155 | | | $ | 117 | |
Provisions for warranty | | | 170 | | | | 152 | |
Consumption of reserves | | | (157 | ) | | | (114 | ) |
| | | | | | | | |
Ending balance | | $ | 168 | | | $ | 155 | |
| | | | | | | | |
APPLIED MATERIALS, INC.
NOTES TO CONSOLIDATED FINANCIAL STATEMENTS — (Continued)
Applied products are generally sold with a12-month warranty period following installation. The provision for the estimated cost of warranty is recorded when revenue is recognized. Parts and labor are covered under the terms of the warranty agreement. The warranty provision is based on historical experience by product, configuration and geographic region. Accordingly, currentQuarterly warranty consumption is generally associated with sales that occurred during the preceding four quarters, and quarterly warranty provisions are generally related to the current year’s net sales, and warranty consumption is associated with current and prior year’s netquarter’s sales.
DuringIn the ordinary course of business, Applied provides standby letters of credit or other guarantee instruments to certainthird parties as required for certain transactions initiated by either Applied or its subsidiaries. As of October 31, 2010,30, 2011, the maximum potential amount of future payments that Applied could be required to make under these guarantee agreements was approximately $54$58 million. Applied has not recorded any liability in connection with these guarantee agreements belowbeyond that required to appropriately account for the underlying
94
APPLIED MATERIALS, INC.
NOTES TO CONSOLIDATED FINANCIAL STATEMENTS — (Continued)
transaction being guaranteed. Applied does not believe, based on historical experience and information currently available, that it is probable that any amounts will be required to be paid under these guarantee agreements.
Applied also has agreements with various banks to facilitate subsidiary banking operations worldwide, including overdraft arrangements, issuance of bank guarantees, and letters of credit. As of October 31, 2010,30, 2011, Applied Materials Inc. has provided parent guarantees to banks for approximately $181$191 million to cover these services.
SemitoolVarian Shareholder Litigation
On November 17, 2009, AppliedIn connection with the proposed acquisition of Varian announced that it was makingin May 2011, the Louisiana Municipal Police Employees Retirement Systems filed a tender offer to acquire alllawsuit (the “LMPERS lawsuit”) on July 23, 2011, for itself and on behalf of the outstanding sharesa putative class of Semitool in accordance with an Agreement and Plan of Merger entered into with Semitool. Following this announcement, three lawsuits were filed by Semitool shareholdersVarian stockholders, in the District Court of the Eleventh JudicialU.S. District Court for the StateDistrict of Montana, County of Flathead,Massachusetts against Semitool, Semitool’sVarian and its directors, as well as Applied Materials, Inc. and Applied’s acquisition subsidiary. The actions sought certification of a class of all holders of Semitool common stock, except the defendants and their affiliates. The complaintsLMPERS complaint alleged that Semitool’sVarian’s directors breached their fiduciary duties by, among other things, failing to maximize shareholder value and failing to disclose material information,in connection with the transaction and that Applied aided and abetted such alleged breaches. The actionslawsuit sought, injunctive relief, damagesamong other things, an order rescinding the Merger Agreement, an injunction preventing consummation of the transaction, a constructive trust in favor of the plaintiff class, and attorneys’ fees.
On
December 14, 2009, all partiesJuly 25, 2011, plaintiff in
these cases reached an agreement in principlethe LMPERS lawsuit filed motions for expedited discovery and for a preliminary injunction to
settleprevent a shareholder vote on the
mattersmerger. The Court denied plaintiff’s motion for expedited discovery on August 1, 2011 and
denied plaintiff’s motion for a preliminary injunction on August 8, 2011. On August 30, 2011, the
plaintiffs withdrew their motion to enjoin consummation of the transaction. Without admitting any wrongdoing or fault, Semitool disclosed certain additional information inLMPERS plaintiff voluntarily dismissed its
lawsuit without prejudice.Schedule 14D-9Jusung filed with the Securities and Exchange Commission on December 14, 2009. Following the tender of shares representing over 95 percent of the outstanding shares of Semitool common stock, the merger of Semitool into Applied’s acquisition subsidiary was completed on December 21, 2009. Pursuant to a memorandum of understanding between the parties, plaintiffs conducted discovery to confirm the fairness and reasonableness of the settlement and defendants agreed not to object to an application by plaintiffs’ counsel for an award of attorneys’ fees and expenses in an amount up to $200,000. A class of Semitool’s public shareholders is expected to be certified solely for purposes of settlement, which, if approved by the Court, will result in a complete and final discharge of all claims on behalf of the class.
Jusung
Applied has been engaged in several lawsuits and patent and administrative proceedings with Jusung Engineering Co., Ltd.and/or Jusung Pacific Co., Ltd. (Jusung) in Taiwan and South Korea since 2003, and more recently in China, involving technology used in manufacturing LCDs. Applied believes that it has meritorious claims and defenses against Jusung that it intends to pursue vigorously.
In 2004, Applied filed a complaint for patent infringement against Jusung in the Hsinchu District Court in Taiwan seeking damages and a permanent injunction for infringement of a patent related to chemical vapor deposition (CVD) equipment,equipment. Jusung filed a counterclaim against Applied. On December 31, 2010, the Hsinchu District Court announced that it had ruled against Applied and this case remains pending.dismissed the lawsuit and Jusung’s counterclaim. Applied appealed the dismissal of its lawsuit and Jusung appealed the dismissal of its counterclaim. Jusung
APPLIED MATERIALS, INC.
NOTES TO CONSOLIDATED FINANCIAL STATEMENTS — (Continued)
unsuccessfully sought invalidation of Applied’s CVD patent in the Taiwanese Intellectual Property Office (TIPO). In September 2010, the Taipei Supreme Administrative Court dismissed Jusung’s appeal of the TIPO’s decision. In 2009, Jusung filed a second action with the TIPO seeking invalidation of Applied’s CVD patent, which action remains pending.
In 2006, Applied filed an action in the TIPO challenging the validity of a Jusung patent related to severabilityseparability of the transfer chamber on a CVD tool. Jusung sued Applied and AKT America in Hsinchu District Court in Taiwan alleging infringement of the same patent. In March 2009, the Hsinchu District Court dismissed Jusung’s lawsuit, and in October, 2010, the Taiwan Intellectual Property Court dismissed Jusung’s appeal. Separately, the TIPO granted Applied’s request for invalidation and also revoked Jusung’s patent. . In January 2010, the Taiwan Intellectual Property Court granted Jusung’s appeal of the TIPO decision revoking its patent and remanded the
95
APPLIED MATERIALS, INC.
NOTES TO CONSOLIDATED FINANCIAL STATEMENTS — (Continued)
matter to the TIPO for reconsideration of validity. TIPO subsequently granted another party’s request for invalidation of Jusung’s patent. Jusung appealed to the Taiwan Intellectual Property Court and Applied intervened in the appeal. On May 12, 2011, the Taiwan Intellectual Property Court dismissed Jusung’s appeal. Jusung has appealed this decision to the Taipei Supreme Administrative Court. In November 2009, Applied filed an action in China with the Patent Reexamination Board of the State Intellectual Property Office seeking to invalidate this patent. On June 18, 2010, the Patent Reexamination Board issued a decision invalidating Jusung’s patent in China. Jusung hasappealed to the Beijing No. 1 Intermediate People’s Court and on June 13, 2011, this Court dismissed Jusung’s appeal. Jusung appealed this decision.
decision to the Beijing High People’s Court in July 2011, and Jusung’s appeal remains pending.In 2006, Jusung filed a complaint of private prosecution in the Taipei District Court of Taiwan alleging that Applied’s outside counsel received from the Court and used a copy of an expert report that Jusung had filed in the ongoing patent infringement lawsuits that Jusung had intended to remain confidential. The complaint names as defendants Applied’s outside counsel in Taiwan, as well as Michael R. Splinter, Applied’s Chairman, President and Chief Executive Officer, as the statutory representative of Applied. The Taipei District Court dismissed the private prosecution complaint, and the matter was transferred to the Taipei District Attorney’s Office. The Taipei District Attorney’s Office issued four successivefive separate rulings not to prosecute, each of which Jusung appealed. In each instance,the first five instances, the Taiwan High Court District Attorney returned the matter to the Taipei District Attorney’s Office for further consideration. In October 2010,response to the sixth ruling not to prosecute, the Taiwan High Court District Attorney dismissed Jusung’s appeal. Jusung subsequently petitioned to the Taipei District Attorney’s Office issued its fifth ruling not to prosecute.
Court for a trial and Jusung’s petition remains pending.Korea Criminal Proceedings
In February 2010, the Seoul Prosecutor’s Office for the Eastern District of Korea (the Prosecutor’s Office) indicted employees of several companies for the alleged improper receipt and use of confidential information belonging to Samsung Electronics Co., Ltd. (Samsung), a major Applied customer based in Korea. The Prosecutor’s Office did not name Applied or any of its subsidiaries as a party to the criminal action. The individuals charged included the former head of Applied Materials Korea (AMK), who at the time of the indictment was a vice president of Applied Materials, Inc., and certain other AMK employees. Hearings on these matters are ongoing in the Seoul Eastern District Court. Applied and Samsung entered into a settlement agreement effective as of November 1, 2010, which resolves potential civil claims related to this matter, and which is separate from and does not affect the criminal proceedings.
From time to time, Applied receives notification from third parties, including customers and suppliers, seeking indemnification, litigation support, payment of money or other actions by Applied in connection with claims made against them. In addition, from time to time, Applied receives notification from third parties claiming that Applied may be or is infringing or misusing their intellectual property or other rights. Applied also is subject to various other legal proceedings and claims, both asserted and unasserted, that arise in the ordinary course of business.
APPLIED MATERIALS, INC.
NOTES TO CONSOLIDATED FINANCIAL STATEMENTS — (Continued)
Although the outcome of the above-described matters or these claims and proceedings cannot be predicted with certainty, Applied does not believe that any of these proceedings or other claims will have a material adverse effect on its consolidated financial condition or results of operations.
| |
Note 17 16 | Industry Segment Operations |
Applied’s four reportable segments are: Silicon Systems Group, Applied Global Services, Display, and Energy and Environmental Solutions. Applied’s chief operating decision-maker has been identified as the President and Chief Executive Officer, who reviews operating results to make decisions about allocating resources and assessing performance for the entire Company.company. Segment information is presented based upon Applied’s management organization structure as of October 31, 201030, 2011 and the distinctive nature of each segment. Future changes to this internal financial structure may result in changes to the Company’sApplied’s reportable segments.
Each reportable segment is separately managed and has separate financial results that are reviewed by Applied’s chief operating decision-maker. Each reportable segment contains closely related products that are unique to the particular segment. Segment operating income is determined based upon internal performance measures used by Applied’s chief operating decision-maker.
Applied derives the segment results directly from its internal management reporting system. The accounting policies Applied uses to derive reportable segment results are substantially the same as those used for external
96
APPLIED MATERIALS, INC.
NOTES TO CONSOLIDATED FINANCIAL STATEMENTS — (Continued)
reporting purposes. Effective in the first quarter of fiscal 2010, Applied changed its methodology for allocating certain expenses to its reportable segments, such as components of variable compensation and operating expenses associated with the global sales organization. Applied has reclassified segment operating results for fiscal 2009 and 2008 to conform to the fiscal 2010 presentation. Management measures the performance of each reportable segment based upon several metrics including orders, net sales and operating income. Management uses these results to evaluate the performance of, and to assign resources to, each of the reportable segments. Applied does not allocate to its reportable segments certain operating expenses that it manages separately at the corporate level, which include costs related to share-based compensation; certain management, finance, legal, human resources, and research, development and engineering functions provided at the corporate level; and unabsorbed information technology and occupancy. In addition, Applied does not allocate to its reportable segments restructuring and asset impairment charges and any associated adjustments related to restructuring actions, unless these charges or adjustments pertain to a specific reportable segment. Segment operating income excludes interest income/expense and other financial charges and income taxes according to how a particular reportable segment’s management is measured.taxes. Management does not consider the unallocated costs in measuring the performance of the reportable segments.
In fiscal 2010, as part of the restructuring of the Energy and Environmental Solutions segment, Applied discontinued marketing of its fully-integrated SunFab production lines but continued to offer individual tools for thin film solar manufacturing. Applied is supporting existing SunFab customers with services, upgrades and capacity increases through its Applied Global Services segment as these products are considered to have reached a particular stage in the product lifecycle. Effective in the first quarter of fiscal 2011, Applied accounts for thin film products under its Applied Global Services segment.
The Silicon Systems Group segment includes semiconductor capital equipment for etch, rapid thermal processing, deposition, chemical mechanical planarization, metrology and inspection, and wafer packaging.
The Applied Global Services segment includes technically differentiated products and services to improve operating efficiency, reduce operating costs and lessen the environmental impact of semiconductor, display and solar customers’ factories. Applied Global Services’ products consist of spares, services, certain earlier generation products, remanufactured equipment, and remanufactured equipment.products that have reached a particular stage in the product lifecycle. Customer demand for these products and services is fulfilled through a global distribution system with trained service engineers located in close proximity to customer sites.
The Display segment includes products for manufacturing LCDs for TVs, personal computers, video-enabled devices and other video-enabled devices.
touch panel applications.APPLIED MATERIALS, INC.
NOTES TO CONSOLIDATED FINANCIAL STATEMENTS — (Continued)
The Energy and Environmental Solutions segment includes products for fabricating crystalline-silicon (c-Si) solar photovoltaic cells and modules, high throughputroll-to-roll coating systems for flexible electronics and web products, and systems used in the manufacture of energy-efficient glass.
97
APPLIED MATERIALS, INC.
NOTES TO CONSOLIDATED FINANCIAL STATEMENTS — (Continued)
Information for each reportable segment as of October 30, 2011, October 31, 2010 and October 25, 2009 and October 26, 2008 and for the fiscal years then ended, is as follows:
| | | | | | | | | | | | | | | | | | | | | |
| | | | | | Operating
| | | Depreciation/
| | | Capital
| | | Segment
| |
| | | Net Sales | | | Income (Loss) | | | Amortization | | | Expenditures | | | Assets | |
| | | (In thousands) | |
| |
| 2010: | | | | | | | | | | | | | | | | | | | | |
| Silicon Systems Group | | $ | 5,304,028 | | | $ | 1,892,307 | | | $ | 66,465 | | | $ | 38,514 | | | $ | 2,317,023 | |
| Applied Global Services | | | 1,864,938 | | | | 337,386 | | | | 25,306 | | | | 5,453 | | | | 1,285,405 | |
| Display | | | 898,998 | | | | 267,495 | | | | 7,820 | | | | 4,534 | | | | 418,874 | |
| Energy and Environmental Solutions | | | 1,480,703 | | | | (466,124 | ) | | | 56,717 | | | | 41,412 | | | | 1,401,634 | |
| | | | | | | | | | | | | | | | | | | | | |
| Total Segment | | $ | 9,548,667 | | | $ | 2,031,064 | | | $ | 156,308 | | | $ | 89,913 | | | $ | 5,422,936 | |
| | | | | | | | | | | | | | | | | | | | | |
| 2009: | | | | | | | | | | | | | | | | | | | | |
| Silicon Systems Group | | $ | 1,960,225 | | | $ | 200,829 | | | $ | 53,504 | | | $ | 23,167 | | | $ | 1,194,929 | |
| Applied Global Services | | | 1,396,643 | | | | 115,170 | | | | 33,641 | | | | 14,952 | | | | 1,043,022 | |
| Display | | | 501,692 | | | | 51,226 | | | | 11,924 | | | | 14,428 | | | | 444,619 | |
| Energy and Environmental Solutions | | | 1,155,047 | | | | (234,259 | ) | | | 80,095 | | | | 51,320 | | | | 1,853,283 | |
| | | | | | | | | | | | | | | | | | | | | |
| Total Segment | | $ | 5,013,607 | | | $ | 132,966 | | | $ | 179,164 | | | $ | 103,867 | | | $ | 4,535,853 | |
| | | | | | | | | | | | | | | | | | | | | |
| 2008: | | | | | | | | | | | | | | | | | | | | |
| Silicon Systems Group | | $ | 4,005,141 | | | $ | 1,229,432 | | | $ | 104,130 | | | $ | 61,518 | | | $ | 1,773,348 | |
| Applied Global Services | | | 2,328,930 | | | | 545,065 | | | | 34,831 | | | | 19,694 | | | | 1,306,158 | |
| Display | | | 975,582 | | | | 300,607 | | | | 8,397 | | | | 11,478 | | | | 658,744 | |
| Energy and Environmental Solutions | | | 819,587 | | | | (206,211 | ) | | | 106,663 | | | | 7,544 | | | | 2,075,516 | |
| | | | | | | | | | | | | | | | | | | | | |
| Total Segment | | $ | 8,129,240 | | | $ | 1,868,893 | | | $ | 254,021 | | | $ | 100,234 | | | $ | 5,813,766 | |
| | | | | | | | | | | | | | | | | | | | | |
| | | | | | | | | | | | | | | | | | | | |
| | | Net Sales | | | Operating
Income (Loss) | | | Depreciation/
Amortization | | | Capital
Expenditures | | | Segment
Assets | |
| | | (In millions) | |
2011: | | | | | | | | | | | | | | | | | | | | |
Silicon Systems Group | | $ | 5,415 | | | $ | 1,764 | | | $ | 52 | | | $ | 59 | | | $ | 2,036 | |
Applied Global Services | | | 2,413 | | | | 482 | | | | 13 | | | | 7 | | | | 1,337 | |
Display | | | 699 | | | | 147 | | | | 7 | | | | 31 | | | | 459 | |
Energy and Environmental Solutions | | | 1,990 | | | | 453 | | | | 34 | | | | 16 | | | | 1,438 | |
| | | | | | | | | | | | | | | | | | | | |
Total Segment | | $ | 10,517 | | | $ | 2,846 | | | $ | 106 | | | $ | 113 | | | $ | 5,270 | |
| | | | | | | | | | | | | | | | | | | | |
2010: | | | | | | | | | | | | | | | | | | | | |
Silicon Systems Group | | $ | 5,304 | | | $ | 1,892 | | | $ | 66 | | | $ | 39 | | | $ | 2,317 | |
Applied Global Services | | | 1,865 | | | | 337 | | | | 25 | | | | 5 | | | | 1,285 | |
Display | | | 899 | | | | 267 | | | | 8 | | | | 5 | | | | 419 | |
Energy and Environmental Solutions | | | 1,481 | | | | (466 | ) | | | 57 | | | | 41 | | | | 1,402 | |
| | | | | | | | | | | | | | | | | | | | |
Total Segment | | $ | 9,549 | | | $ | 2,030 | | | $ | 156 | | | $ | 90 | | | $ | 5,423 | |
| | | | | | | | | | | | | | | | | | | | |
2009: | | | | | | | | | | | | | | | | | | | | |
Silicon Systems Group | | $ | 1,960 | | | $ | 201 | | | $ | 53 | | | $ | 23 | | | $ | 1,195 | |
Applied Global Services | | | 1,397 | | | | 115 | | | | 34 | | | | 15 | | | | 1,043 | |
Display | | | 502 | | | | 51 | | | | 12 | | | | 15 | | | | 445 | |
Energy and Environmental Solutions | | | 1,155 | | | | (234 | ) | | | 80 | | | | 51 | | | | 1,853 | |
| | | | | | | | | | | | | | | | | | | | |
Total Segment | | $ | 5,014 | | | $ | 133 | | | $ | 179 | | | $ | 104 | | | $ | 4,536 | |
| | | | | | | | | | | | | | | | | | | | |
In fiscal 2011, Applied entered into an agreement to divest certain assets held in the Applied Global Services segment and determined certain identified intangible assets and purchased technology to be impaired. Operating results for fiscal 2011 included impairment charges of $24 million, which were reported in the Applied Global Services segment.
In fiscal 2010, Applied recorded charges related to a plan to restructure its Energy and Environmental Solutions segment totaling $405 million, which included inventory related charges of $247 million related to SunFab thin film solar equipment, asset impairment charges of $110 million, employee severance charges of $45 million, and other costs of $3 million. These charges were reported in the Energy and Environmental Solutions segment. Operating results in the Energy and Environmental Solutions segment for fiscal 2011 included favorable adjustments of $36 million related to this restructuring program.
APPLIED MATERIALS, INC.
NOTES TO CONSOLIDATED FINANCIAL STATEMENTS — (Continued)
Reconciliations of segment operating results to Applied consolidated totals for fiscal 2011, 2010 2009 and 20082009 are as follows:
| | | | | | | | | | | | | |
| | | 2010 | | | 2009 | | | 2008 | |
| | | (In thousands) | |
| |
| Total segment operating income | | $ | 2,031,064 | | | $ | 132,966 | | | $ | 1,868,893 | |
| Corporate and unallocated costs | | | (554,427 | ) | | | (370,794 | ) | | | (495,351 | ) |
| Restructuring and asset impairment charges | | | (92,929 | ) | | | (155,788 | ) | | | (39,948 | ) |
| Gain on sale of facility | | | — | | | | — | | | | 21,837 | |
| | | | | | | | | | | | | |
| Income (loss) from operations | | $ | 1,383,708 | | | $ | (393,616 | ) | | $ | 1,355,431 | |
| | | | | | | | | | | | | |
| | | | | | | | | | | | |
| | | 2011 | | | 2010 | | | 2009 | |
| | | (In millions) | |
Total segment operating income | | $ | 2,846 | | | $ | 2,030 | | | $ | 133 | |
Corporate and unallocated costs | | | (496 | ) | | | (553 | ) | | | (371 | ) |
Restructuring charges and asset impairments | | | 21 | | | | (93 | ) | | | (156 | ) |
Gain on sale of facility | | | 27 | | | | — | | | | — | |
| | | | | | | | | | | | |
Income (loss) from operations | | $ | 2,398 | | | $ | 1,384 | | | $ | (394 | ) |
| | | | | | | | | | | | |
Reconciliations of depreciation and amortization expense to Applied consolidated totals for fiscal 2011, 2010 2009 and 20082009 are as follows:
| | | | | | | | | | | | | |
| | | 2010 | | | 2009 | | | 2008 | |
| | | (In thousands) | |
| |
| Total segment depreciation and amortization | | $ | 156,308 | | | $ | 179,164 | | | $ | 254,021 | |
| Depreciation on shared facilities and information technology assets | | | 148,207 | | | | 112,039 | | | | 66,030 | |
| | | | | | | | | | | | | |
| Consolidated depreciation and amortization | | $ | 304,515 | | | $ | 291,203 | | | $ | 320,051 | |
| | | | | | | | | | | | | |
98
| | | | | | | | | | | | |
| | | 2011 | | | 2010 | | | 2009 | |
| | | (In millions) | |
Total segment depreciation and amortization | | $ | 106 | | | $ | 156 | | | $ | 179 | |
Depreciation on shared facilities and information technology assets | | | 140 | | | | 149 | | | | 112 | |
| | | | | | | | | | | | |
Consolidated depreciation and amortization | | $ | 246 | | | $ | 305 | | | $ | 291 | |
| | | | | | | | | | | | |
APPLIED MATERIALS, INC.
NOTES TO CONSOLIDATED FINANCIAL STATEMENTS — (Continued)
Reconciliations of capital expenditures to Applied consolidated totals for fiscal 2011, 2010 2009 and 20082009 are as follows:
| | | | | | | | | | | | | |
| | | 2010 | | | 2009 | | | 2008 | |
| | | (In thousands) | |
| |
| Total segment capital expenditures | | $ | 89,913 | | | $ | 103,867 | | | $ | 100,234 | |
| Shared facilities and information technology assets | | | 79,168 | | | | 144,560 | | | | 187,672 | |
| | | | | | | | | | | | | |
| Consolidated capital expenditures | | $ | 169,081 | | | $ | 248,427 | | | $ | 287,906 | |
| | | | | | | | | | | | | |
| | | | | | | | | | | | |
| | | 2011 | | | 2010 | | | 2009 | |
| | | (In millions) | |
Total segment capital expenditures | | $ | 113 | | | $ | 90 | | | $ | 104 | |
Shared facilities and information technology assets | | | 96 | | | | 79 | | | | 145 | |
| | | | | | | | | | | | |
Consolidated capital expenditures | | $ | 209 | | | $ | 169 | | | $ | 249 | |
| | | | | | | | | | | | |
Reconciliations of segment assets to Applied consolidated totals as of October 30, 2011, October 31, 2010 and October 25, 2009 and October 26, 2008 are as follows:
| | | | | | | | | | | | | |
| | | October 31,
| | | October 25,
| | | October 26,
| |
| | | 2010 | | | 2009 | | | 2008 | |
| | | (In thousands) | |
| |
| Total segment assets | | $ | 5,422,936 | | | $ | 4,535,853 | | | $ | 5,813,766 | |
| Cash and investments | | | 3,891,865 | | | | 3,266,895 | | | | 3,467,724 | |
| Allowance for bad debts | | | (73,940 | ) | | | (67,313 | ) | | | (5,275 | ) |
| Deferred income taxes | | | 625,091 | | | | 454,607 | | | | 502,534 | |
| Other current assets | | | 92,736 | | | | 337,015 | | | | 382,912 | |
| Common property, plant and equipment | | | 740,087 | | | | 820,959 | | | | 644,578 | |
| Equity-method investment | | | — | | | | — | | | | 79,533 | |
| Other assets | | | 244,570 | | | | 226,227 | | | | 120,546 | |
| | | | | | | | | | | | | |
| Consolidated total assets | | $ | 10,943,345 | | | $ | 9,574,243 | | | $ | 11,006,318 | |
| | | | | | | | | | | | | |
99
| | | | | | | | | | | | |
| | | October 30,
2011 | | | October 31,
2010 | | | October 25,
2009 | |
| | | (In millions) | |
Total segment assets | | $ | 5,270 | | | $ | 5,423 | | | $ | 4,536 | |
Cash and investments | | | 7,174 | | | | 3,892 | | | | 3,267 | |
Allowance for bad debts | | | (73 | ) | | | (74 | ) | | | (68 | ) |
Deferred income taxes | | | 658 | | | | 625 | | | | 455 | |
Other current assets | | | 90 | | | | 93 | | | | 337 | |
Common property, plant and equipment | | | 620 | | | | 740 | | | | 821 | |
Other assets | | | 122 | | | | 244 | | | | 226 | |
| | | | | | | | | | | | |
Consolidated total assets | | $ | 13,861 | | | $ | 10,943 | | | $ | 9,574 | |
| | | | | | | | | | | | |
APPLIED MATERIALS, INC.
NOTES TO CONSOLIDATED FINANCIAL STATEMENTS — (Continued)
For geographical reporting, revenue is attributed to the geographic location in which the customers’ facilities are located. Long-lived assets consist primarily of property, plant and equipment and equity-method investments, and are attributed to the geographic location in which they are located. Net sales and long-lived assets by geographic region were as follows:
| | | | | | | | | |
| | | | | | Long-lived
| |
| | | Net Sales | | | Assets | |
| | | (In thousands) | |
| |
| 2010: | | | | | | | | |
| North America(1) | | $ | 1,147,186 | | | $ | 714,527 | |
| | | | | | | | | |
| Taiwan | | | 2,749,448 | | | | 32,200 | |
| Korea | | | 1,767,860 | | | | 4,747 | |
| China | | | 1,556,900 | | | | 77,813 | |
| Europe | | | 981,396 | | | | 94,792 | |
| Japan | | | 767,503 | | | | 5,494 | |
| Southeast Asia | | | 578,374 | | | | 65,140 | |
| | | | | | | | | |
| Total outside North America | | | 8,401,481 | | | | 280,186 | |
| | | | | | | | | |
| Consolidated total | | $ | 9,548,667 | | | $ | 994,713 | |
| | | | | | | | | |
| 2009: | | | | | | | | |
| North America(1) | | $ | 965,603 | | | $ | 803,071 | |
| | | | | | | | | |
| Taiwan | | | 1,025,823 | | | | 32,939 | |
| Korea | | | 663,813 | | | | 4,624 | |
| China | | | 635,371 | | | | 97,707 | |
| Europe | | | 752,635 | | | | 115,280 | |
| Japan | | | 718,573 | | | | 7,611 | |
| Southeast Asia | | | 251,789 | | | | 57,121 | |
| | | | | | | | | |
| Total outside North America | | | 4,048,004 | | | | 315,282 | |
| | | | | | | | | |
| Consolidated total | | $ | 5,013,607 | | | $ | 1,118,353 | |
| | | | | | | | | |
| 2008: | | | | | | | | |
| North America(1) | | $ | 1,519,898 | | | $ | 895,723 | |
| | | | | | | | | |
| Taiwan | | | 1,837,097 | | | | 43,169 | |
| Korea | | | 1,309,490 | | | | 6,258 | |
| China | | | 779,853 | | | | 37,166 | |
| Europe | | | 949,105 | | | | 109,224 | |
| Japan | | | 1,217,635 | | | | 89,782 | |
| Southeast Asia | | | 516,162 | | | | 16,953 | |
| | | | | | | | | |
| Total outside North America | | | 6,609,342 | | | | 302,552 | |
| | | | | | | | | |
| Consolidated total | | $ | 8,129,240 | | | $ | 1,198,275 | |
| | | | | | | | | |
| | | | | | | | |
| | | Net Sales | | | Long-lived
Assets | |
| | | (In millions) | |
2011: | | | | | | | | |
North America(1) | | $ | 1,963 | | | $ | 623 | |
| | | | | | | | |
China | | | 2,574 | | | | 81 | |
Taiwan | | | 2,093 | | | | 33 | |
Korea | | | 1,263 | | | | 8 | |
Europe | | | 1,120 | | | | 128 | |
Japan | | | 912 | | | | 7 | |
Southeast Asia | | | 592 | | | | 71 | |
| | | | | | | | |
Total outside North America | | | 8,554 | | | | 328 | |
| | | | | | | | |
Consolidated total | | $ | 10,517 | | | $ | 951 | |
| | | | | | | | |
2010: | | | | | | | | |
North America(1) | | $ | 1,147 | | | $ | 715 | |
| | | | | | | | |
China | | | 1,557 | | | | 78 | |
Taiwan | | | 2,750 | | | | 32 | |
Korea | | | 1,768 | | | | 5 | |
Europe | | | 981 | | | | 95 | |
Japan | | | 768 | | | | 5 | |
Southeast Asia | | | 578 | | | | 65 | |
| | | | | | | | |
Total outside North America | | | 8,402 | | | | 280 | |
| | | | | | | | |
Consolidated total | | $ | 9,549 | | | $ | 995 | |
| | | | | | | | |
2009: | | | | | | | | |
North America(1) | | $ | 966 | | | $ | 803 | |
| | | | | | | | |
China | | | 635 | | | | 98 | |
Taiwan | | | 1,026 | | | | 33 | |
Korea | | | 664 | | | | 5 | |
Europe | | | 753 | | | | 115 | |
Japan | | | 718 | | | | 7 | |
Southeast Asia | | | 252 | | | | 57 | |
| | | | | | | | |
Total outside North America | | | 4,048 | | | | 315 | |
| | | | | | | | |
Consolidated total | | $ | 5,014 | | | $ | 1,118 | |
| | | | | | | | |
| | |
| (1) | | Primarily the United States. |
100
APPLIED MATERIALS, INC.
NOTES TO CONSOLIDATED FINANCIAL STATEMENTS — (Continued)
The following companies accounted for at least 10 percent of Applied’s net sales in fiscal 2011, 2010, 2009,and/or 2008, 2009, which were for products in multiple reportable segments.
| | | | | | | | | | | | | |
| | | 2010 | | | 2009 | | | 2008 | |
| |
| Samsung Electronics Co., Ltd. | | | 14 | % | | | 10 | % | | | 16 | % |
| Taiwan Semiconductor Manufacturing Company Limited | | | 11 | % | | | * | | | | * | |
| Intel Corporation | | | * | | | | 12 | % | | | * | |
| | | | | | | | | | | | |
| | | 2011 | | | 2010 | | | 2009 | |
Samsung Electronics Co., Ltd. | | | 12 | % | | | 14 | % | | | 10 | % |
Taiwan Semiconductor Manufacturing Company Limited | | | 10 | % | | | 11 | % | | | * | |
Intel Corporation | | | 10 | % | | | * | | | | 12 | % |
AsOn November 10, 2011, Applied completed its acquisition of October 31, 2010, accounts receivable for those customers that accounted for at least 10%Varian. The aggregate purchase price of the acquisition was approximately $4.2 billion, net of cash acquired. The transaction was funded with a combination of cash and proceeds of long-term debt issued in June 2011. Following the acquisition of Varian Applied’s net sales in fiscal 2010 were as follows:
| | | | |
| | October 31,
| |
| | 2010 | |
|
Taiwan Semiconductor Manufacturing Company Limited | | | 14 | % |
Samsung Electronics Co., Ltd. | | | 7 | % |
On November 29, 2010, Applied entered into a Settlement Agreement (the Agreement) with Samsung Electronics Co., Ltd. (Samsung). The Agreement resolved potential civil claims and removed the risk of civil litigation between the parties relating to the alleged acquisition, misappropriation and misuse of Samsung confidential semiconductor information in Korea that is the subject of criminal proceedings pending against employees of several companies, including current and former Applied Materials Korea employees, in the Seoul Eastern District Court of the Republic of Korea (the Korea proceedings). Neither Applied nor any of its subsidiaries is a defendant in the Korea proceedings. The settlement terms of the Agreement pertain to potential civil claims between the parties and are separate from and do not affect criminal proceedings against individual defendants, including but not limited to the individuals charged in the Korea proceedings.
Under the Agreement, which is generally effective for a three-year period starting November 1, 2010, Applied will provide volume-based rebates on purchases of semiconductor products by Samsung and its affiliated companies. Applied also will provide volume-based incentives related to Samsung’s use of Applied systems (i) for production of semiconductor devices in applications for which Samsung has not previously used Applied systems, and (ii) for joint development activities. In addition, the Agreement includes volume-based credits for certain upgrades, engineering services and spare parts. The financial impact of the above rebates and incentives on Applied’s consolidated results of operations and financial position will depend on the volume of purchases by Samsung after the effective date of the Agreement.
101
APPLIED MATERIALS, INC.
NOTES TO CONSOLIDATED FINANCIAL STATEMENTS — (Continued)
| |
Note 19 | Unaudited Quarterly Consolidated Financial Data |
| | | | | | | | | | | | | | | | | | | | | |
| | | Fiscal Quarter | | | | |
| | | First | | | Second | | | Third | | | Fourth | | | Fiscal Year | |
| | | (In thousands, except per share amounts) | |
| |
| 2010: | | | | | | | | | | | | | | | | | | | | |
| Net sales | | $ | 1,848,902 | | | $ | 2,295,540 | | | $ | 2,517,790 | | | $ | 2,886,435 | | | $ | 9,548,667 | |
| Gross margin | | $ | 711,184 | | | $ | 926,892 | | | $ | 860,128 | | | $ | 1,216,798 | | | $ | 3,715,002 | |
| Net income | | $ | 82,751 | | | $ | 264,004 | | | $ | 123,096 | | | $ | 468,015 | | | $ | 937,866 | |
| Earnings per diluted share | | $ | 0.06 | | | $ | 0.20 | | | | 0.09 | | | | 0.35 | | | | 0.70 | |
| 2009: | | | | | | | | | | | | | | | | | | | | |
| Net sales | | $ | 1,333,396 | | | $ | 1,020,077 | | | $ | 1,133,740 | | | $ | 1,526,394 | | | $ | 5,013,607 | |
| Gross margin | | $ | 391,576 | | | $ | 155,519 | | | $ | 324,874 | | | $ | 558,836 | | | $ | 1,430,805 | |
| Net income (loss) | | $ | (132,934 | ) | | $ | (255,390 | ) | | $ | (54,865 | ) | | $ | 137,862 | | | $ | (305,327 | ) |
| Earnings (loss) per diluted share | | | (0.10 | ) | | $ | (0.19 | ) | | $ | (0.04 | ) | | $ | 0.10 | | | $ | (0.23 | ) |
102
| | | | | | | | | | | | | | | | | | | | |
| | | Fiscal Quarter | | | | |
| | | First | | | Second | | | Third | | | Fourth | | | Fiscal Year | |
| | | (In millions, except per share amounts) | |
2011: | | | | | | | | | | | | | | | | | | | | |
Net sales | | $ | 2,686 | | | $ | 2,862 | | | $ | 2,787 | | | $ | 2,182 | | | $ | 10,517 | |
Gross margin | | $ | 1,136 | | | $ | 1,189 | | | $ | 1,184 | | | $ | 852 | | | $ | 4,360 | |
Net income | | $ | 506 | | | $ | 489 | | | $ | 476 | | | $ | 456 | | | $ | 1,926 | |
Earnings per diluted share | | $ | 0.38 | | | $ | 0.37 | | | $ | 0.36 | | | $ | 0.34 | | | $ | 1.45 | |
2010: | | | | | | | | | | | | | | | | | | | | |
Net sales | | $ | 1,849 | | | $ | 2,296 | | | $ | 2,518 | | | $ | 2,886 | | | $ | 9,549 | |
Gross margin | | $ | 711 | | | $ | 927 | | | $ | 860 | | | $ | 1,217 | | | $ | 3,715 | |
Net income | | $ | 83 | | | $ | 264 | | | $ | 123 | | | $ | 468 | | | $ | 938 | |
Earnings per diluted share | | $ | 0.06 | | | $ | 0.20 | | | $ | 0.09 | | | $ | 0.35 | | | $ | 0.70 | |
REPORT OF INDEPENDENT REGISTERED PUBLIC ACCOUNTING FIRM
The Board of Directors and Stockholders
We have audited the accompanying consolidated balance sheets of Applied Materials, Inc. and subsidiaries (the Company) as of October 31, 201030, 2011 and October 25, 2009,31, 2010, and the related consolidated statements of operations, stockholders’ equity and comprehensive income (loss), and cash flows for each of the years in the three-year period ended October 31, 2010.30, 2011. In connection with our audits of the consolidated financial statements, we also have audited the financial statement schedule II. These consolidated financial statements and financial statement schedule are the responsibility of the Company’s management. Our responsibility is to express an opinion on these consolidated financial statements and financial statement schedule based on our audits.
We conducted our audits in accordance with the standards of the Public Company Accounting Oversight Board (United States). Those standards require that we plan and perform the audit to obtain reasonable assurance about whether the financial statements are free of material misstatement. An audit includes examining, on a test basis, evidence supporting the amounts and disclosures in the financial statements. An audit also includes assessing the accounting principles used and significant estimates made by management, as well as evaluating the overall financial statement presentation. We believe that our audits provide a reasonable basis for our opinion.
In our opinion, the consolidated financial statements referred to above present fairly, in all material respects, the financial position of Applied Materials, Inc. and subsidiaries as of October 31, 201030, 2011 and October 25, 2009,31, 2010, and the results of their operations and their cash flows for each of the years in the three-year period ended October 31, 2010,30, 2011, in conformity with U.S. generally accepted accounting principles. Also in our opinion, the related financial statement schedule, when considered in relation to the basic consolidated financial statements taken as a whole, presents fairly, in all material respects, the information set forth therein.
As discussed in Note 1 to the consolidated financial statements, the Company adopted Accounting Standards Codification Topic 805,Business Combinations, during the year ended October 31, 2010.
We also have audited, in accordance with the standards of the Public Company Accounting Oversight Board (United States), Applied Materials, Inc.’s internal control over financial reporting as of October 31, 2010,30, 2011, based on criteria established in Internal Control - Control—Integrated Framework issued by the Committee of Sponsoring Organizations of the Treadway Commission (COSO), and our report dated December 10, 20106, 2011 expressed an unqualified opinion on the effectiveness of the Company’s internal control over financial reporting.
KPMG LLP
Mountain View, California
1036, 2011
INDEX TO EXHIBITS
These Exhibits are numbered in accordance with the Exhibit Table of Item 601 ofRegulation S-K:
| | | | | |
| Exhibit No. | | Description |
| |
| | 2 | .1 | | Agreement and Plan of Merger, dated November 16, 2009, among Applied Materials, Inc., Semitool Inc. and Jupiter Acquisition Sub, Inc., incorporated by reference to Applied’sForm 10-Q for the quarter ended January 31, 2010 (fileno. 000-06920) filed March 9, 2010. |
| | 3 | .1 | | Certificate of Incorporation of Applied Materials, Inc., as amended and restated through March 10, 2009, incorporated by reference to Applied’sForm 10-Q for the quarter ended April 26, 2009(file no. 000-06920) filed June 3, 2009. |
| | 3 | .2 | | Certificate of Designation, Preferences and Rights of the Terms of the Series A Junior Participating Preferred Stock dated as of July 9, 1999, incorporated by reference to Applied’sForm 10-Q for the quarter ended August 1, 1999 (fileno. 000-06920) filed September 14, 1999. |
| | 3 | .3 | | Bylaws of Applied Materials, Inc., as amended and restated through December 8, 2008, incorporated by reference to Applied’sForm 8-K (fileno. 000-06920) filed December 10, 2008. |
| | 4 | .1 | | Form of Indenture (including form of debt security) between Applied Materials, Inc. and Harris Trust Company of California, as Trustee, incorporated by reference to Applied’sForm 8-K(file no. 000-06920) filed August 17, 1994. |
| | 10 | .1 | | License Agreement dated January 1, 1992, between Applied Materials and Varian Associates, Inc., incorporated by reference to Applied’sForm 10-K for fiscal year 1992 (fileno. 000-06920) filed December 16, 1992. |
| | 10 | .2* | | Applied Materials, Inc. Executive Deferred Compensation Plan, as amended and restated on April 1, 1995, incorporated by reference to Applied’sForm 10-Q for the quarter ended April 30, 1995(file no. 000-06920) filed June 7, 1995. |
| | 10 | .3* | | Amendment No. 1 to the Applied Materials, Inc. Executive Deferred Compensation Plan, incorporated by reference to Applied’sForm 10-Q for the quarter ended July 26, 1998 (fileno. 000-06920) filed September 9, 1998. |
| | 10 | .4* | | Amendment No. 2 to the Applied Materials, Inc. Executive Deferred Compensation Plan, incorporated by reference to Applied’sForm 10-Q for the quarter ended July 26, 1998 (fileno. 000-06920) filed September 9, 1998. |
| | 10 | .5 | | Form of Indemnification Agreement between Applied Materials, Inc. and Non-Employee Directors, dated June 11, 1999, incorporated by reference to Applied’sForm 10-K for fiscal year 1999(file no. 333-88777) filed January 31, 2000. |
| | 10 | .6 | | Form of Indemnification Agreement between Applied Materials, Inc. and James C. Morgan and Dan Maydan, dated June 11, 1999, incorporated by reference to Applied’sForm 10-K for fiscal year 1999 (fileno. 333-88777) filed January 31, 2000. |
| | 10 | .7 | | Form of Indemnification Agreement between Applied Materials, Inc. and certain of its officers, incorporated by reference to Applied’sForm 10-K for fiscal year 1999 (fileno. 333-88777) filed January 31, 2000. |
| | 10 | .8* | | Applied Materials, Inc. amended and restated 2000 Global Equity Incentive Plan, incorporated by reference to Applied’sForm 10-K for fiscal year 2002 (fileno. 000-06920) filed January 23, 2003. |
| | 10 | .9 | | Applied Materials Profit Sharing Scheme, incorporated by reference to Applied’sS-8(file no. 333-45011) filed January 27, 1998. |
| | 10 | .10* | | Term Sheet for employment of Michael R. Splinter, as amended and restated December 8, 2008, incorporated by reference to Applied’sForm 10-Q for the quarter ended January 25, 2009(file no. 000-06920) filed March 3, 2009. |
| | 10 | .11 | | Binding Memorandum of Understanding between Applied Materials, Inc. and Novellus Systems, Inc. dated September 20, 2004, incorporated by reference to Applied’sForm 8-K (fileno. 000-06920) filed September 24, 2004. (Confidential treatment has been granted for the redacted portions of the agreement.) |
| | 10 | .12* | | Applied Materials, Inc. Nonemployee Director Share Purchase Plan, incorporated by reference to Applied’sForm 10-Q for the quarter ended May 1, 2005 (fileno. 000-06920) filed May 31, 2005. |
104
| | | | | |
| Exhibit No. | | Description |
| |
| | 10 | .13* | | Election Form to Receive Shares in lieu of Retainer and/or Meeting Fees for use under the Applied Materials, Inc. Nonemployee Director Share Purchase Plan, incorporated by reference to Applied’sForm 10-Q for the quarter ended May 1, 2005 (fileno. 000-06920) filed May 31, 2005. |
| | 10 | .14* | | Applied Materials, Inc. amended and restated Relocation Policy, incorporated by reference to Applied’sForm 8-K (fileno. 000-06920) filed October 31, 2005. |
| | 10 | .15* | | Form of Restricted Stock Agreement for use under the Applied Materials, Inc. Employee Stock Incentive Plan, as amended, incorporated by reference to Applied’sForm 10-K for fiscal year 2005(file no. 000-06920) filed December 14, 2005. |
| | 10 | .16* | | Amendment No. 3 to the Applied Materials, Inc. Executive Deferred Compensation Plan, incorporated by reference to Applied’sForm 10-K for fiscal year 2005 (fileno. 000-06920) filed December 14, 2005. |
| | 10 | .17* | | Amendment No. 4 to the Applied Materials, Inc. Executive Deferred Compensation Plan, incorporated by reference to Applied’sForm 10-K for fiscal year 2005 (fileno. 000-06920) filed December 14, 2005. |
| | 10 | .18* | | Form of Non-Qualified Stock Option Grant Agreement for use under the Applied Materials Employee Stock Incentive Plan, as amended, incorporated by reference to Applied’sForm 10-Q for the quarter ended July 30, 2006 (fileno. 000-06920) filed August 31, 2006. |
| | 10 | .19* | | Form of Non-Qualified Stock Option Grant Agreement for use under the Applied Materials, Inc. 2000 Global Equity Incentive Plan, as amended, incorporated by reference to Applied’sForm 10-Q for the quarter ended July 30, 2006 (fileno. 000-06920) filed August 31, 2006. |
| | 10 | .20* | | Form of Performance Shares Agreement for use under the Applied Materials, Inc. Employee Stock Incentive Plan, as amended, incorporated by reference to Applied’sForm 10-Q for the quarter ended July 30, 2006 (fileno. 000-06920) filed August 31, 2006. |
| | 10 | .21* | | Applied Materials, Inc. amended and restated Employee Financial Assistance Plan (as of December 18, 2008), incorporated by reference to Applied’sForm 10-Q for the quarter ended January 25, 2009(file no. 000-06920) filed March 3, 2009. |
| | 10 | .22 | | Master Confirmation dated September 18, 2006 between Goldman, Sachs & Co. and Applied Materials, Inc., incorporated by reference to Applied’sForm 10-K for fiscal year 2006(file no. 000-06920) filed December 14, 2006. (Confidential treatment has been granted for redacted portions of the agreement.) |
| | 10 | .23 | | Supplemental Confirmation dated September 18, 2006 between Goldman, Sachs & Co. and Applied Materials, Inc., incorporated by reference to Applied’sForm 10-K for fiscal year 2006 (fileno. 000-06920) filed December 14, 2006. (Confidential treatment has been granted for redacted portions of the agreement.) |
| | 10 | .24 | | $1,000,000,000 Credit Agreement dated as of January 26, 2007 among Applied Materials, Inc., as borrower, several lenders named therein and Citicorp USA, Inc., as agent for the lenders, incorporated by reference to Applied’sForm 10-Q for the quarter ended January 28, 2007 (fileno. 000-06920) filed February 28, 2007. (Confidential treatment has been granted for redacted portions of the agreement.)** |
| | 10 | .25* | | Form of Non-Qualified Stock Option Grant Agreement for use under the Applied Materials, Inc. Employee Stock Incentive Plan, as amended, incorporated by reference to Applied’sForm 10-Q for the quarter ended April 29, 2007 (fileno. 000-06920) filed May 30, 2007. |
| | 10 | .26* | | Form of Non-Qualified Stock Option Grant Agreement for use under the Applied Materials, Inc. 2000 Global Equity Incentive Plan, as amended, incorporated by reference to Applied’sForm 10-Q for the quarter ended April 29, 2007 (fileno. 000-06920) filed May 30, 2007. |
| | 10 | .27* | | Form of Performance Share Agreement for use under the Applied Materials, Inc. Employee Stock Incentive Plan, as amended, incorporated by reference to Applied’sForm 10-Q for the quarter ended April 29, 2007 (fileno. 000-06920) filed May 30, 2007. |
| | 10 | .28* | | Form of Restricted Stock Agreement for use under the Applied Materials, Inc. Employee Stock Incentive Plan, as amended, incorporated by reference to Applied’sForm 10-Q for the quarter ended April 29, 2007 (fileno. 000-06920) filed May 30, 2007. |
| | 10 | .29* | | Applied Materials, Inc. amended and restated 2005 Executive Deferred Compensation Plan, incorporated by reference to Applied’sForm 8-K (fileno. 000-06920) filed July 13, 2007. |
105
| | | | | |
| Exhibit No. | | Description |
| |
| | 10 | .30 | | Share Purchase Agreement among Applied Materials, Inc., the Shareholders of HCT Shaping Systems SA and Sellers’ Representative dated June 25, 2007, incorporated by reference to Applied’sForm 10-Q for the quarter ended July 29, 2007 (fileno. 000-06920) filed August 30, 2007. |
| | 10 | .31* | | Form of Performance Shares Agreement for use under the Applied Materials, Inc. Employee Stock Incentive Plan, as amended, incorporated by reference to Applied’sForm 10-K for fiscal year 2007(file no. 000-06920) filed December 14, 2007. |
| | 10 | .32* | | Form of Performance Shares Agreement for Nonemployee Directors for use under the Applied Materials, Inc. Employee Stock Incentive Plan, as amended, incorporated by reference to Applied’sForm 10-K for fiscal year 2007 (fileno. 000-06920) filed December 14, 2007. |
| | 10 | .33* | | Form of Non-Qualified Stock Option Grant Agreement for use under the Applied Materials, Inc. Employee Stock Incentive Plan, as amended, incorporated by reference to Applied’sForm 10-K for fiscal year 2007 (fileno. 000-06920) filed December 14, 2007. |
| | 10 | .34* | | Form of Restricted Stock Agreement for use under the Applied Materials, Inc. Employee Stock Incentive Plan, as amended, incorporated by reference to Applied’sForm 10-K for fiscal year 2007(file no. 000-06920) filed December 14, 2007. |
| | 10 | .35* | | Form of Non-Qualified Stock Option Grant Agreement for use under the Applied Materials, Inc. 2000 Global Equity Incentive Plan, as amended, incorporated by reference to Applied’sForm 10-K for fiscal year 2007 (fileno. 000-06920) filed December 14, 2007. |
| | 10 | .36 | | Share Purchase Agreement among Applied Materials, Inc. and the Shareholders of Baccini S.p.A. dated November 18, 2007, incorporated by reference to Applied’sForm 10-Q for the quarter ended January 27, 2008 (fileno. 000-06920) filed March 3, 2008. |
| | 10 | .37* | | Form of Restricted Stock Agreement for use under the Applied Materials, Inc. Employee Stock Incentive Plan, as amended, incorporated by reference to Applied’sForm 10-Q for the quarter ended July 27, 2008 (fileno. 000-06920) filed August 29, 2008. |
| | 10 | .38 | | Deed of Amendment to Applied Materials Profit Sharing Scheme, dated February 7, 2006, to amend Clause 20 of the Trust Deed thereunder, incorporated by reference to Applied’sForm 10-K for fiscal year 2008 (fileno. 000-06920) filed December 12, 2008. |
| | 10 | .39 | | Deed of Amendment to Applied Materials Profit Sharing Scheme, dated February 7, 2006, to amend the definition of Eligible Employee in the First Schedule to the Trust Deed thereunder, incorporated by reference to Applied’sForm 10-K for fiscal year 2008 (fileno. 000-06920) filed December 12, 2008. |
| | 10 | .40* | | Amendment No. 5 to the Applied Materials, Inc. Executive Deferred Compensation Plan, incorporated by reference to Applied’sForm 10-K for fiscal year 2008 (fileno. 000-06920) filed December 12, 2008. |
| | 10 | .41* | | Amendment No. 6 to the Applied Materials, Inc. Executive Deferred Compensation Plan, incorporated by reference to Applied’sForm 10-Q for the quarter ended January 25, 2009 (fileno. 000-06920) filed March 3, 2009, incorporated by reference to Applied’sForm 10-K for fiscal year 2008(file no. 000-06920) filed December 12, 2008. |
| | 10 | .42* | | Amendment No. 1 to the Applied Materials, Inc. 2005 Executive Deferred Compensation Plan, incorporated by reference to Applied’sForm 10-K for fiscal year 2008 (fileno. 000-06920) filed December 12, 2008. |
| | 10 | .43* | | Amendment No. 2 to the Applied Materials, Inc. 2005 Executive Deferred Compensation Plan, incorporated by reference to Applied’sForm 10-Q for the quarter ended January 25, 2009(file no. 000-06920) filed March 3, 2009. |
| | 10 | .44* | | Applied Materials, Inc. amended and restated Employee Stock Incentive Plan, incorporated by reference to Applied’sForm 10-K for fiscal year 2008 (fileno. 000-06920) filed December 12, 2008. |
| | 10 | .45* | | Form of Performance Shares Agreement for use under the Applied Materials, Inc. Employee Stock Incentive Plan, as amended, incorporated by reference to Applied’sForm 10-K for fiscal year 2008(file no. 000-06920) filed December 12, 2008. |
| | 10 | .46 | | Amendment No. 1 to the U.S. $1,000,000,000 Credit Agreement dated as of May 22, 2009 among Applied Materials, Inc., as borrower, several lenders named therein and Citicorp USA, Inc., as agent for the lenders, incorporated by reference to Applied’sForm 10-Q for the quarter ended July 26, 2009. (Confidential treatment has been granted for redacted portions of the agreement.) |
106
| | | | | |
| Exhibit No. | | Description |
| |
| | 10 | .47* | | Form of Performance Shares Agreement for Nonemployee Directors for use under the Applied Materials, Inc. Employee Stock Incentive Plan, as amended, incorporated by reference to Applied’sForm 10-Q for the quarter ended January 25, 2009 (fileno. 000-06920) filed March 3, 2009. |
| | 10 | .48* | | Form of Non-Qualified Stock Option Agreement for Employees for use under the Applied Materials, Inc. Employee Stock Incentive Plan, as amended, incorporated by reference to Applied’sForm 10-Q for the quarter ended January 25, 2009 (fileno. 000-06920) filed March 3, 2009. |
| | 10 | .49* | | Form of Non-Qualified Stock Option Agreement for use under the Applied Materials, Inc. 2000 Global Equity Incentive Plan, as amended, incorporated by reference to Applied’sForm 10-Q for the quarter ended January 25, 2009 (fileno. 000-06920) filed March 3, 2009. |
| | 10 | .50* | | Separation Agreement and Release between Applied Materials, Inc. and Thomas M. St. Dennis dated October 5, 2009., incorporated by reference to Applied’sForm 10-K for fiscal year 2009(file no. 000-06920) file December 11, 2009. |
| | 10 | .51* | | Applied Materials, Inc. Stock Purchase Plan for Offshore Employees, amended and restated effective December 7, 2009, incorporated by reference to Applied’sForm S-8 (fileno. 333-165035) filed February 23, 2010. |
| | 10 | .52* | | Applied Materials, Inc. Employees’ Stock Purchase Plan, amended and restated effective February 23, 2010, incorporated by reference to Applied’s Post-Effective Amendment No. 2 to Registration Statement onForm S-8 (fileno. 333-143377) filed February 23, 2010. |
| | 10 | .53* | | Amendment No. 7 to the Applied Materials, Inc. Executive Deferred Compensation Plan, incorporated by reference to Applied’sForm 10-Q for the quarter ended May 2, 2010 (fileno. 000-06920) filed June 9, 2010. |
| | 10 | .54* | | Amendment No. 3 to the Applied Materials, Inc. 2005 Executive Deferred Compensation Plan, incorporated by reference to Applied’sForm 10-Q for the quarter ended May 2, 2010(file no. 000-06920) filed June 9, 2010. |
| | 10 | .55* | | Amended and Restated Applied Materials, Inc. Senior Executive Bonus Plan, incorporated by reference to Applied’sForm 10-Q for the quarter ended May 2, 2010 (fileno. 000-06920) filed June 9, 2010. |
| | 10 | .56* | | Form of Performance Share Agreement for use under the Applied Materials, Inc. Employee Stock Incentive Plan, as amended, incorporated by reference to Applied’sForm 10-Q for the quarter ended May 2, 2010 (fileno. 000-06920) filed June 9, 2010. |
| | 10 | .57* | | Form of Restricted Stock Agreement for use under the Applied Materials, Inc. Employee Stock Incentive Plan, as amended, incorporated by reference to Applied’sForm 10-Q for the quarter ended May 2, 2010 (fileno. 000-06920) filed June 9, 2010. |
| | 10 | .58* | | Retirement Agreement and Release between Applied Materials, Inc. and Franz Janker dated July 10, 2010, incorporated by reference to Applied’sForm 10-Q for the quarter ended August 1, 2010(file no. 000-06920) filed September 3, 2010. |
| | 10 | .59* | | Amended and Restated Applied Materials, Inc. Applied Incentive Plan. |
| | 21 | | | Subsidiaries of Applied Materials, Inc. |
| | 23 | | | Consent of Independent Registered Public Accounting Firm, KPMG LLP. |
| | 24 | | | Power of Attorney. |
| | 31 | .1 | | Certification of Chief Executive Officer Pursuant to Section 302 of the Sarbanes-Oxley Act of 2002. |
| | 31 | .2 | | Certification of Chief Financial Officer Pursuant to Section 302 of the Sarbanes-Oxley Act of 2002. |
| | 32 | .1 | | Certification Pursuant to 18 U.S.C. Section 1350, as adopted pursuant to Section 906 of the Sarbanes-Oxley Act of 2002. |
| | 32 | .2 | | Certification Pursuant to 18 U.S.C. Section 1350, as adopted pursuant to Section 906 of the Sarbanes-Oxley Act of 2002. |
| | 101 | .INS | | XBRL Instance Document |
| | 101 | .SCH | | XBRL Taxonomy Extension Schema Document |
| | 101 | .CAL | | XBRL Taxonomy Extension Calculation Linkbase Document |
107
| | |
Exhibit No. | | Description |
| 2.1** | | Agreement and Plan of Merger dated as of May 3, 2011, among Applied Materials, Inc., Barcelona Acquisition Corp. and Varian Semiconductor Equipment Associates, Inc., incorporated by reference to Applied’s Form 8-K (file no. 000-06920) filed on May 4, 2011. |
Exhibit No. 3.1 | | DescriptionCertificate of Incorporation of Applied Materials, Inc., as amended and restated through March 10, 2009, incorporated by reference to Applied’s Form 10-Q for the quarter ended April 26, 2009 (file no. 000-06920) filed June 3, 2009. |
| 3.2 | | Certificate of Designation, Preferences and Rights of the Terms of the Series A Junior Participating Preferred Stock dated as of July 9, 1999, incorporated by reference to Applied’s Form 10-Q for the quarter ended August 1, 1999 (file no. 000-06920) filed September 14, 1999. |
| 3.3 | 101 | .LABBylaws of Applied Materials, Inc., as amended and restated through December 8, 2008, incorporated by reference to Applied’s Form 8-K (file no. 000-06920) filed December 10, 2008. |
| 4.1 | | Form of Indenture (including form of debt security) between Applied Materials, Inc. and Harris Trust Company of California, as Trustee, incorporated by reference to Applied’s Form 8-K (file no. 000-06920) filed August 17, 1994. |
| 4.2 | | Indenture, dated June 8, 2011, by and between Applied Materials, Inc. and U.S. Bank National Association, incorporated by reference to Applied’s Form 8-K (file no. 000-06920) filed June 10, 2011. |
| 4.3 | | First Supplemental Indenture, dated June 8, 2011, by and between Applied Materials, Inc. and U.S. Bank National Association, incorporated by reference to Applied’s Form 8-K (file no. 000-06920) filed June 10, 2011. |
| 10.1* | | Applied Materials, Inc. Executive Deferred Compensation Plan, as amended and restated on April 1, 1995, incorporated by reference to Applied’s Form 10-Q for the quarter ended April 30, 1995 (file no. 000-06920) filed June 7, 1995. |
| 10.2* | | Amendment No. 1 to the Applied Materials, Inc. Executive Deferred Compensation Plan, incorporated by reference to Applied’s Form 10-Q for the quarter ended July 26, 1998 (file no. 000-06920) filed September 9, 1998. |
| 10.3* | | Amendment No. 2 to the Applied Materials, Inc. Executive Deferred Compensation Plan, incorporated by reference to Applied’s Form 10-Q for the quarter ended July 26, 1998 (file no. 000-06920) filed September 9, 1998. |
| 10.4 | | Form of Indemnification Agreement between Applied Materials, Inc. and Non-Employee Directors, dated June 11, 1999, incorporated by reference to Applied’s Form 10-K for fiscal year 1999 (file no. 333-88777) filed January 31, 2000. |
| 10.5 | | Form of Indemnification Agreement between Applied Materials, Inc. and certain of its officers, incorporated by reference to Applied’s Form 10-K for fiscal year 1999 (file no. 333-88777) filed January 31, 2000. |
| 10.6* | | Applied Materials, Inc. amended and restated 2000 Global Equity Incentive Plan, incorporated by reference to Applied’s Form 10-K for fiscal year 2002 (file no. 000-06920) filed January 23, 2003. |
| 10.7 | | Applied Materials Profit Sharing Scheme, incorporated by reference to Applied’s S-8 (file no. 333-45011) filed January 27, 1998. |
| 10.8* | | Term Sheet for employment of Michael R. Splinter, as amended and restated December 8, 2008, incorporated by reference to Applied’s Form 10-Q for the quarter ended January 25, 2009 (file no. 000-06920) filed March 3, 2009. |
| 10.9 | | Binding Memorandum of Understanding between Applied Materials, Inc. and Novellus Systems, Inc. dated September 20, 2004, incorporated by reference to Applied’s Form 8-K (file no. 000-06920) filed September 24, 2004. (Confidential treatment has been granted for the redacted portions of the agreement.) |
| | |
Exhibit No. | | Description |
| 10.10* | | Applied Materials, Inc. Nonemployee Director Share Purchase Plan, incorporated by reference to Applied’s Form 10-Q for the quarter ended May 1, 2005 (file no. 000-06920) filed May 31, 2005. |
| 10.11* | | Election Form to Receive Shares in lieu of Retainer and/or Meeting Fees for use under the Applied Materials, Inc. Nonemployee Director Share Purchase Plan, incorporated by reference to Applied’s Form 10-Q for the quarter ended May 1, 2005 (file no. 000-06920) filed May 31, 2005. |
| 10.12* | | Applied Materials, Inc. amended and restated Relocation Policy, incorporated by reference to Applied’s Form 8-K (file no. 000-06920) filed October 31, 2005. |
| 10.13* | | Amendment No. 3 to the Applied Materials, Inc. Executive Deferred Compensation Plan, incorporated by reference to Applied’s Form 10-K for fiscal year 2005 (file no. 000-06920) filed December 14, 2005. |
| 10.14* | | Amendment No. 4 to the Applied Materials, Inc. Executive Deferred Compensation Plan, incorporated by reference to Applied’s Form 10-K for fiscal year 2005 (file no. 000-06920) filed December 14, 2005. |
| 10.15* | | Form of Non-Qualified Stock Option Grant Agreement for use under the Applied Materials Employee Stock Incentive Plan, as amended, incorporated by reference to Applied’s Form 10-Q for the quarter ended July 30, 2006 (file no. 000-06920) filed August 31, 2006. |
| 10.16* | | Form of Non-Qualified Stock Option Grant Agreement for use under the Applied Materials, Inc. 2000 Global Equity Incentive Plan, as amended, incorporated by reference to Applied’s Form 10-Q for the quarter ended July 30, 2006 (file no. 000-06920) filed August 31, 2006. |
| 10.17* | | Form of Performance Shares Agreement for use under the Applied Materials, Inc. Employee Stock Incentive Plan, as amended, incorporated by reference to Applied’s Form 10-Q for the quarter ended July 30, 2006 (file no. 000-06920) filed August 31, 2006. |
| 10.18* | | Applied Materials, Inc. amended and restated Employee Financial Assistance Plan (as of December 18, 2008), incorporated by reference to Applied’s Form 10-Q for the quarter ended January 25, 2009 (file no. 000-06920) filed March 3, 2009. |
| 10.19* | | Form of Non-Qualified Stock Option Grant Agreement for use under the Applied Materials, Inc. Employee Stock Incentive Plan, as amended, incorporated by reference to Applied’s Form 10-Q for the quarter ended April 29, 2007 (file no. 000-06920) filed May 30, 2007. |
| 10.20* | | Form of Non-Qualified Stock Option Grant Agreement for use under the Applied Materials, Inc. 2000 Global Equity Incentive Plan, as amended, incorporated by reference to Applied’s Form 10-Q for the quarter ended April 29, 2007 (file no. 000-06920) filed May 30, 2007. |
| 10.21* | | Form of Performance Share Agreement for use under the Applied Materials, Inc. Employee Stock Incentive Plan, as amended, incorporated by reference to Applied’s Form 10-Q for the quarter ended April 29, 2007 (file no. 000-06920) filed May 30, 2007. |
| 10.22* | | Form of Restricted Stock Agreement for use under the Applied Materials, Inc. Employee Stock Incentive Plan, as amended, incorporated by reference to Applied’s Form 10-Q for the quarter ended April 29, 2007 (file no. 000-06920) filed May 30, 2007. |
| 10.23* | | Applied Materials, Inc. amended and restated 2005 Executive Deferred Compensation Plan, incorporated by reference to Applied’s Form 8-K (file no. 000-06920) filed July 13, 2007. |
| 10.24* | | Form of Performance Shares Agreement for use under the Applied Materials, Inc. Employee Stock Incentive Plan, as amended, incorporated by reference to Applied’s Form 10-K for fiscal year 2007 (file no. 000-06920) filed December 14, 2007. |
| 10.25* | | Form of Performance Shares Agreement for Nonemployee Directors for use under the Applied Materials, Inc. Employee Stock Incentive Plan, as amended, incorporated by reference to Applied’s Form 10-K for fiscal year 2007 (file no. 000-06920) filed December 14, 2007. |
| 10.26* | | Form of Non-Qualified Stock Option Grant Agreement for use under the Applied Materials, Inc. Employee Stock Incentive Plan, as amended, incorporated by reference to Applied’s Form 10-K for fiscal year 2007 (file no. 000-06920) filed December 14, 2007. |
| | |
Exhibit No. | | Description |
| 10.27* | | Form of Restricted Stock Agreement for use under the Applied Materials, Inc. Employee Stock Incentive Plan, as amended, incorporated by reference to Applied’s Form 10-K for fiscal year 2007 (file no. 000-06920) filed December 14, 2007. |
| 10.28* | | Form of Non-Qualified Stock Option Grant Agreement for use under the Applied Materials, Inc. 2000 Global Equity Incentive Plan, as amended, incorporated by reference to Applied’s Form 10-K for fiscal year 2007 (file no. 000-06920) filed December 14, 2007. |
| 10.29* | | Form of Restricted Stock Agreement for use under the Applied Materials, Inc. Employee Stock Incentive Plan, as amended, incorporated by reference to Applied’s Form 10-Q for the quarter ended July 27, 2008 (file no. 000-06920) filed August 29, 2008. |
| 10.30 | | Deed of Amendment to Applied Materials Profit Sharing Scheme, dated February 7, 2006, to amend Clause 20 of the Trust Deed thereunder, incorporated by reference to Applied’s Form 10-K for fiscal year 2008 (file no. 000-06920) filed December 12, 2008. |
| 10.31 | | Deed of Amendment to Applied Materials Profit Sharing Scheme, dated February 7, 2006, to amend the definition of Eligible Employee in the First Schedule to the Trust Deed thereunder, incorporated by reference to Applied’s Form 10-K for fiscal year 2008 (file no. 000-06920) filed December 12, 2008. |
| 10.32* | | Amendment No. 5 to the Applied Materials, Inc. Executive Deferred Compensation Plan, incorporated by reference to Applied’s Form 10-K for fiscal year 2008 (file no. 000-06920) filed December 12, 2008. |
| 10.33* | | Amendment No. 6 to the Applied Materials, Inc. Executive Deferred Compensation Plan, incorporated by reference to Applied’s Form 10-Q for the quarter ended January 25, 2009 (file no. 000-06920) filed March 3, 2009, incorporated by reference to Applied’s Form 10-K for fiscal year 2008 (file no. 000-06920) filed December 12, 2008. |
| 10.34* | | Amendment No. 1 to the Applied Materials, Inc. 2005 Executive Deferred Compensation Plan, incorporated by reference to Applied’s Form 10-K for fiscal year 2008 (file no. 000-06920) filed December 12, 2008. |
| 10.35* | | Amendment No. 2 to the Applied Materials, Inc. 2005 Executive Deferred Compensation Plan, incorporated by reference to Applied’s Form 10-Q for the quarter ended January 25, 2009 (file no. 000-06920) filed March 3, 2009. |
| 10.36* | | Applied Materials, Inc. amended and restated Employee Stock Incentive Plan, incorporated by reference to Applied’s Form 10-K for fiscal year 2008 (file no. 000-06920) filed December 12, 2008. |
| 10.37* | | Form of Performance Shares Agreement for use under the Applied Materials, Inc. Employee Stock Incentive Plan, as amended, incorporated by reference to Applied’s Form 10-K for fiscal year 2008 (file no. 000-06920) filed December 12, 2008. |
| 10.38* | | Form of Performance Shares Agreement for Nonemployee Directors for use under the Applied Materials, Inc. Employee Stock Incentive Plan, as amended, incorporated by reference to Applied’s Form 10-Q for the quarter ended January 25, 2009 (file no. 000-06920) filed March 3, 2009. |
| 10.39* | | Form of Non-Qualified Stock Option Agreement for Employees for use under the Applied Materials, Inc. Employee Stock Incentive Plan, as amended, incorporated by reference to Applied’s Form 10-Q for the quarter ended January 25, 2009 (file no. 000-06920) filed March 3, 2009. |
| 10.40* | | Form of Non-Qualified Stock Option Agreement for use under the Applied Materials, Inc. 2000 Global Equity Incentive Plan, as amended, incorporated by reference to Applied’s Form 10-Q for the quarter ended January 25, 2009 (file no. 000-06920) filed March 3, 2009. |
| 10.41* | | Separation Agreement and Release between Applied Materials, Inc. and Thomas M. St. Dennis dated October 5, 2009, incorporated by reference to Applied’s Form 10-K for fiscal year 2009 (file no. 000-06920) file December 11, 2009. |
| | |
Exhibit No. | | Description |
| 10.42* | | Applied Materials, Inc. Stock Purchase Plan for Offshore Employees, amended and restated effective December 7, 2009, incorporated by reference to Applied’s Form S-8 (file no. 333-165035) filed February 23, 2010. |
| 10.43* | | Applied Materials, Inc. Employees’ Stock Purchase Plan, amended and restated effective February 23, 2010, incorporated by reference to Applied’s Post-Effective Amendment No. 2 to Registration Statement on Form S-8 (file no. 333-143377) filed February 23, 2010. |
| 10.44* | | Amendment No. 7 to the Applied Materials, Inc. Executive Deferred Compensation Plan, incorporated by reference to Applied’s Form 10-Q for the quarter ended May 2, 2010 (file no. 000-06920) filed June 9, 2010. |
| 10.45* | | Amendment No. 3 to the Applied Materials, Inc. 2005 Executive Deferred Compensation Plan, incorporated by reference to Applied’s Form 10-Q for the quarter ended May 2, 2010 (file no. 000-06920) filed June 9, 2010. |
| 10.46* | | Amended and Restated Applied Materials, Inc. Senior Executive Bonus Plan, incorporated by reference to Applied’s Form 10-Q for the quarter ended May 2, 2010 (file no. 000-06920) filed June 9, 2010. |
| 10.47* | | Form of Performance Share Agreement for use under the Applied Materials, Inc. Employee Stock Incentive Plan, as amended, incorporated by reference to Applied’s Form 10-Q for the quarter ended May 2, 2010 (file no. 000-06920) filed June 9, 2010. |
| 10.48* | | Form of Restricted Stock Agreement for use under the Applied Materials, Inc. Employee Stock Incentive Plan, as amended, incorporated by reference to Applied’s Form 10-Q for the quarter ended May 2, 2010 (file no. 000-06920) filed June 9, 2010. |
| 10.49* | | Retirement Agreement and Release between Applied Materials, Inc. and Franz Janker dated July 10, 2010, incorporated by reference to Applied’s Form 10-Q for the quarter ended August 1, 2010 (file no. 000-06920) filed September 3, 2010. |
| 10.50* | | Amended and Restated Applied Materials, Inc. Applied Incentive Plan, incorporated by reference to Applied’s Form 10-K for the fiscal year ended October 31, 2011 (file no. 000-06920) filed December 10, 2010. |
| 10.51* | | Amendment No. 8 to the Applied Materials, Inc. Executive Deferred Compensation Plan, incorporated by reference to Applied’s Form 10-Q for the quarter ended January 30, 2011 (file no. 000-06920) filed February 28, 2011. |
| 10.52* | | Amendment No. 4 to the Applied Materials, Inc. 2005 Executive Deferred Compensation Plan, incorporated by reference to Applied’s Form 10-Q for the quarter ended January 30, 2011 (file no. 000-06920) filed February 28, 2011. |
| 10.53 | | Settlement Agreement between Applied Materials, Inc. and Samsung Electronics Co., Ltd. dated November 1, 2010, incorporated by reference to Applied’s Form 10-Q/A for the quarter ended January 30, 2011 (file no. 000-06920) filed May 19, 2011. (Confidential treatment has been granted for the redacted portions of the agreement.) |
| 10.54 | | Bridge Loan Agreement, dated as of May 25, 2011, among Applied Materials, Inc., JPMorgan Chase Bank, N.A., as administrative agent, and other lenders named therein, incorporated by reference to Applied’s Form 10-Q/A for the quarter ended July 31, 2011 (file no. 000-06920) filed November 18, 2011. |
| 10.55 | | Credit Agreement, dated as of May 25, 2011, among Applied Materials, Inc., JPMorgan Chase Bank, N.A., as administrative agent, and other lenders named therein, incorporated by reference to Applied’s Form 10-Q/A for the quarter ended July 31, 2011 (file no. 000-06920) filed November 18, 2011. |
| 21 | | Subsidiaries of Applied Materials, Inc. |
| 23 | | Consent of Independent Registered Public Accounting Firm, KPMG LLP. |
| 24 | | Power of Attorney |
| | |
Exhibit No. | | Description |
| 31.1 | | Certification of Chief Executive Officer Pursuant to Section 302 of the Sarbanes-Oxley Act of 2002. |
| 31.2 | | Certification of Chief Financial Officer Pursuant to Section 302 of the Sarbanes-Oxley Act of 2002. |
| 32.1 | | Certification Pursuant to 18 U.S.C. Section 1350, as adopted pursuant to Section 906 of the Sarbanes-Oxley Act of 2002. |
| 32.2 | | Certification Pursuant to 18 U.S.C. Section 1350, as adopted pursuant to Section 906 of the Sarbanes-Oxley Act of 2002. |
| 101.INS | | XBRL Instance Document |
| 101.SCH | | XBRL Taxonomy Extension Schema Document |
| 101.CAL | | XBRL Taxonomy Extension Calculation Linkbase Document |
| 101.DEF | | XBRL Taxonomy Extension Definition Linkbase Document |
| | 101 | .PRE101.LAB | | XBRL Taxonomy Extension Label Linkbase Document |
| | 101 | .DEF101.PRE | | XBRL Taxonomy Extension Presentation Linkbase Document |
| | |
| * | | Indicates a management contract or compensatory plan or arrangement, as required by Item 15(a)3. |
|
| ** | | Certain schedulesSchedules and certain exhibits to this agreement as set forth in the Table of Contents of the agreement, have been omitted.omitted pursuant to Item 601(b)(2) of Regulation S-K. Applied Materials, Inc. hereby undertakes to furnish supplementally copies of any of the omitted schedules and exhibits upon request by the Securities and Exchange Commission. |
108
SIGNATURES
SIGNATURES
Pursuant to the requirements of Section 13 or 15(d) of the Securities Exchange Act of 1934, the registrant has duly caused this report to be signed on its behalf by the undersigned, thereunto duly authorized.
APPLIED MATERIALS, INC.
| | |
| APPLIED MATERIALS, INC. |
| |
| By: | | /s/ S/ MICHAEL R. SPLINTER |
| | Michael R. Splinter |
| | President, Chief Executive Officer |
Michael R. Splinter
President, Chief Executive Officer
6, 2011Pursuant to the requirements of the Securities Exchange Act of 1934, this report has been signed below by the following persons on behalf of the registrant and in the capacities and on the dates indicated.
| | | | | | |
| | | Title | | TitleDate |
| | |
/S/ MICHAEL R. SPLINTER Michael R. Splinter | | DatePresident, Chief Executive Officer (Principal Executive Officer) | | December 6, 2011 |
| | |
/S/ GEORGE S. DAVIS George S. Davis | | Executive Vice President, Chief Financial Officer (Principal Financial Officer) | | December 6, 2011 |
| | |
/S/ THOMAS S. TIMKO Thomas S. Timko | | Corporate Vice President, Corporate Controller and Chief Accounting Officer (Principal Accounting Officer) | | December 6, 2011 |
| | |
Directors: | | | | |
| | |
* Michael R. Splinter | | Chairman of the Board | | December 6, 2011 |
| | |
* Aart J. de Geus | | Director | | December 6, 2011 |
| | |
* Stephen R. Forrest | | Director | | December 6, 2011 |
| | |
* Thomas J. Iannotti | | Director | | December 6, 2011 |
| | |
* Susan M. James | | Director | | December 6, 2011 |
| | |
* Alexander A. Karsner | | Director | | December 6, 2011 |
| | |
* Gerhard H. Parker | | Director | | December 6, 2011 |
| | | | |
| | | Title | | Date |
/s/ MICHAEL R. SPLINTER
Michael R. Splinter | | |
* Dennis D. Powell | | President, Chief Executive Officer (Principal Executive Officer)Director | | December 10, 20106, 2011 |
| | |
* Willem P. Roelandts | | | | |
/s/ GEORGE S. DAVIS
George S. Davis | | Executive Vice President, Chief Financial Officer
(Principal Financial Officer)Director | | December 10, 20106, 2011 |
| | |
* James E. Rogers | | | | |
/s/ THOMAS S. TIMKO
Thomas S. Timko | | Corporate Vice President, Corporate Controller and Chief Accounting Officer
(Principal Accounting Officer)Director | | December 10, 20106, 2011 |
| | |
* Robert H. Swan | | | | | | |
Directors: | | | | | | |
| | | | |
*
Michael R. Splinter | | Chairman of the BoardDirector | | December 10, 2010 |
| | | | |
*
Aart J. de Geus | | Director | | December 10, 2010 |
| | | | |
*
Stephen R. Forrest | | Director | | December 10, 2010 |
| | | | |
*
Thomas J. Iannotti | | Director | | December 10, 2010 |
| | | | |
Susan M. James | | Director | | December 10, 2010 |
| | | | |
*
Alexander A. Karsner | | Director | | December 10, 2010 |
| | | | |
*
Gerhard H. Parker | | Director | | December 10, 20106, 2011 |
109
| | | | | | |
| | | | Title | | Date |
|
| | | | |
*
Dennis D. Powell | | Director | | December 10, 2010 |
| | | | |
*
Willem P. Roelandts | | Director | | December 10, 2010 |
| | | | |
*
James E. Rogers | | Director | | December 10, 2010 |
| | | | |
*
Robert H. Swan | | Director | | December 10, 2010 |
Representing a majority of the members of the Board of
Directors.
| | |
* By | /s/ MICHAEL R. SPLINTER
| |
Michael R. Splinter
Attorney-in-Fact**
| | |
| * By | | /s/ MICHAEL R. SPLINTER |
| | Michael R. Splinter |
| | Attorney-in-Fact** |
| ** | By authority of the power of attorney filed herewith. |
110
SCHEDULESchedule Of Valuation And Qualifying Accounts
SCHEDULE II
VALUATION AND QUALIFYING ACCOUNTS
ALLOWANCE FOR DOUBTFUL ACCOUNTS
| | | | | | | | | | | | | | | | | | | | | | | | | |
| | | Balance at
| | | Additions —
| | | Additions —
| | | | | | Deductions —
| | | Balance at
| |
| | | Beginning of
| | | Charged to
| | | Business
| | | Deductions —
| | | Not Charged to
| | | End of
| |
| Fiscal Year | | Fiscal Year | | | Income | | | Combinations | | | Recoveries | | | Income | | | Fiscal Year | |
| | | (In thousands) | |
| |
| 2010 | | $ | 67,313 | | | $ | 17,000 | | | $ | — | | | $ | (7,500 | ) | | $ | (2,873 | ) | | $ | 73,940 | |
| 2009 | | $ | 5,275 | | | $ | 62,539 | | | $ | — | | | $ | (501 | ) | | $ | — | | | $ | 67,313 | |
| 2008 | | $ | 4,136 | | | $ | 2,456 | | | $ | 501 | | | $ | (1,818 | ) | | $ | — | | | $ | 5,275 | |
111
| | | | | | | | | | | | | | | | | | | | |
Fiscal Year | | Balance at
Beginning of
Fiscal Year | | | Additions —
Charged to
Income | | | Deductions —
Recoveries | | | Deductions —
Not Charged to
Income | | | Balance at
End of
Fiscal Year | |
| | | (In millions) | |
2011 | | $ | 74 | | | $ | 5 | | | $ | (6 | ) | | $ | — | | | $ | 73 | |
2010 | | $ | 67 | | | $ | 17 | | | $ | (7 | ) | | $ | (3 | ) | | $ | 74 | |
2009 | | $ | 5 | | | $ | 63 | | | $ | (1 | ) | | $ | — | | | $ | 67 | |
124