UNITED STATES SECURITIES AND EXCHANGE COMMISSION
ANNUAL REPORT PURSUANT TO SECTION 13 OR 15(d)
OF THE SECURITIES EXCHANGE ACT OF 1934
For the fiscal year ended September 30, 2010
2011Commission file number 0-23837
(Exact Name of Registrant as Specified in Its Charter)
| | |
| Minnesota | | 41-1356149 |
Minnesota | | 41-1356149 |
(State or other jurisdiction of
incorporation or organization) | | (IRS Employer
Identification No.) |
| |
9924 West 74th Street Eden Prairie, Minnesota | | 55344 |
9924 West 74thStreet
Eden Prairie, Minnesota
(Address of Principal Executive Offices) | | 55344
(Zip Code) |
(Registrant’s Telephone Number, Including Area Code)
Securities registered pursuant to Section 12(b) of the Act:
| | |
| | Name of Exchange on Which Registered |
|
Common Stock, $0.05 par value | | NASDAQ Global Select Market |
Securities registered pursuant to Section 12(g) of the Act:
Indicate by check mark if the registrant is a well-known seasoned issuer, as defined in Rule 405 of the Securities Act. Yes o¨ No þ
Indicate by check mark if the registrant is not required to file reports pursuant to Section 13 or Section 15(d) of the Act. Yes o¨ No þ
Indicate by check mark whether the registrant: (1) has filed all reports required to be filed by Section 13 or 15(d) of the Securities Exchange Act of 1934 during the preceding 12 months (or for such shorter period that the registrant was required to file such reports), and (2) has been subject to such filing requirements for the past 90 days. Yes þ No o¨
Indicate by check mark whether the registrant has submitted electronically and posted on its corporate Website, if any, every Interactive Data File required to be submitted and posted pursuant to Rule 405 ofRegulation S-T (§ 232.405 of this chapter) during the preceding 12 months (or for such shorter period that the registrant was required to submit and post such files). Yes oþ No o¨
Indicate by check mark if disclosure of delinquent filers pursuant to Item 405 ofRegulation S-K is not contained herein, and will not be contained, to the best of registrant’s knowledge, in definitive proxy or information statements incorporated by reference in Part III of thisForm 10-K or any amendment to thisForm 10-K. ¨o
Indicate by check mark whether the registrant is a large accelerated filer, an accelerated filer, a non-accelerated filer, or a smaller reporting company. See the definitions of “large accelerated filer,” “accelerated filer” and “smaller reporting company” in Rule12b-2 of the Exchange Act. (Check one):
| | |
Large accelerated filer o¨ | | Accelerated filer þ |
Non-accelerated filer o¨ | | Smaller reporting company o¨ |
(Do not check if a smaller reporting company)
Indicate by check mark whether the registrant is a shell company (as defined inRule 12b-2 of the Exchange Act). Yes o¨ No þ
The aggregate market value of the Common Stock held by shareholders other than officers, directors or holders of more than 5% of the outstanding stock of the registrant as of March 31, 20102011 was approximately $207$163 million (based upon the closing sale price of the registrant’s Common Stock on such date).
The number of shares of the registrant’s Common Stock outstanding as of December 9, 20102011 was 17,467,101.
17,527,547.DOCUMENTS INCORPORATED BY REFERENCE
Portions of the Registrant’s Proxy Statement for the Registrant’s 20112012 Annual Meeting of Shareholders are incorporated by reference into Part III.
Forward-Looking Statements
Certain statements contained in thisForm 10-K, or in other reports of the Company and other written and oral statements made from time to time by the Company, do not relate strictly to historical or current facts. As such, they are considered “forward-looking statements” that provide current expectations or forecasts of future events. These forward-looking statements are made pursuant to the safe harbor provisions of the Private Securities Litigation Reform Act of 1995. Such statements can be identified by the use of terminology such as “anticipate,” “believe,” “could,” “estimate,” “expect,” “forecast,” “intend,” “may,” “plan,” “possible,” “project,” “will” and similar words or expressions. Any statement that is not a historical fact, including estimates, projections, future trends and the outcome of events that have not yet occurred, areis a forward-looking statements.statement. The Company’s forward-looking statements generally relate to its growth strategy, financial prospects, product development programs, sales efforts, and the impact of the Medtronic, Inc. (“Medtronic”) and Cordis and GenentechCorporation (a subsidiary of Johnson & Johnson) (“Cordis”), agreements, as well as other significant customer agreements. You should carefully consider forward-looking statements and understand that such statements
involve a variety of risks and uncertainties, known and unknown, and may be affected by inaccurate assumptions. Consequently, no forward-looking statement can be guaranteed and actual results may vary materially. The Company undertakes no obligation to update any forward-looking statement. Investors are advised not to place undue reliance upon the Company’s forward-looking statements and to consult any further disclosures by the Company on this subject in its filings with the Securities and Exchange Commission.Commission (“SEC”). Factors that could cause our actual results to differ from those discussed in the forward-looking statements include, but are not limited to, those described in Item 1A “Risk Factors” Below.
2below.
PART I
Overview — Recent Sale of Pharmaceuticals Business
SurModics, Inc. (referred to as “SurModics,” “the Company,” “we,” “us,” “our” and other like terms) is a leading provider of drug delivery and surface modification technologies to the healthcare industry.
In December 2010, we announced that the Board of Directors of the Company had authorized the Company to explore strategic alternatives for our Pharmaceuticals business, including a potential sale of that business. This decision by the Board reflected our focus on returning the Company to profitable growth, and our renewed commitment to pursuing growth opportunities and investments in our Medical Device and In Vitro Diagnostics businesses. On November 1, 2011, we entered into a definitive agreement (the “Purchase Agreement”) to sell substantially all of the assets of our wholly-owned subsidiary, SurModics Pharmaceuticals, Inc. (“SurModics Pharmaceuticals”) to Evonik Degussa Corporation (“Evonik”). We closed the sale (the “Pharma Sale”) on November 17, 2011. The total consideration received from the sale was $30.0 million in cash. Of the total consideration, $3.275 million was placed in escrow at closing for any inventory shortfall and the payment of certain contingent consideration obligations related to our acquisition of SurModics Pharmaceuticals in July 2007.
Under the terms of the Purchase Agreement, the entire portfolio of products and services of SurModics Pharmaceuticals and its Current Good Manufacturing Practice (“cGMP”) development and manufacturing facility located in Birmingham, Alabama, were acquired by Evonik. As part of the Pharma Sale, we agreed not to compete in the restricted business (as defined in the Purchase Agreement) for a period of five years and to indemnify Evonik against specified losses in connection with the SurModics Pharmaceuticals business, including certain contingent consideration obligations related to the acquisition by SurModics Pharmaceuticals of the portfolio of intellectual property and drug delivery projects from PR Pharmaceuticals, Inc. (“PR Pharma”). We also retained responsibility for certain obligations of the SurModics Pharmaceuticals business, including contingent consideration obligations of $2.9 million related to our acquisition of SurModics Pharmaceuticals in July 2007 and repayment obligations related to an agreement with various governmental authorities to obtain financial incentives associated with creation of jobs in Alabama. The foregoing summary of the Purchase Agreement is qualified in its entirety by reference to the full text of the Purchase Agreement, which is attached as Exhibit 2.1 to the Company’s Current Report on Form 8-K filed on November 7, 2011. We refer you to the Purchase Agreement for more details on the Pharma Sale.
We acquired SurModics Pharmaceuticals in July 2007 to increase our drug delivery capabilities in the areas of proprietary injectable microparticles and implant technology, both of which are based on biodegradable polymers, to provide sustained drug delivery. A significant part of that business included manufacturing services for clinical trial materials as well as for commercial products through the state-of-the-art cGMP facility we constructed and qualified.
In November 2008, we acquired a portfolio of intellectual property and collaborative drug delivery projects from PR Pharma, a drug delivery company specializing in injectable, biodegradable sustained release formulations. Total consideration paid through September 30, 2011 was $5.6 million and the sellers of PR Pharma are still eligible to receive up to an additional $3.0 million in cash based on successful achievement of specified milestones.
Because the Pharma Sale closed subsequent to our fiscal year ended September 30, 2011, the discussion of the Company and its business operations and financial results in this Form 10-K for all applicable periods prior to such sale includes the Company’s Pharmaceuticals segment, unless the context indicates otherwise. We will report the Pharmaceuticals segment as discontinued operations beginning in the first quarter of fiscal 2012, as disclosed in Note 1 to the consolidated financial statements.
Overview — General
Our mission is to exceed our customers’ expectations and enhance the well-being of patients by providing the world’s foremost, innovative drug delivery and surface modification technologies and products.in vitro diagnostic chemical components. We partner with many of the world’s leading and emerging medical device, pharmaceuticaldiagnostic and life science companies to develop and commercialize innovative products designed to improve patient outcomes.diagnosis and treatment. Our core offerings include: drug delivery technologies (coatings, microparticles, and implants);include surface modification coating technologies that impart lubricity, prohealing, and biocompatibility characteristics; and components forin vitrodiagnostic test kits and microarrays. Our strategy is to build on our product and technical leadership in the fieldour core fields of drug delivery and surface modification technologies and in vitro diagnostic products, enablingand expanding our core technologies to provide us to strengthen our position as a leading edge product development partner to the healthcare industry.
with opportunities for longer term sustained growth.Our drug delivery and surface modification technologies are utilized by our customers to enable drug delivery through our microparticle, polymer implant or device platforms; alter the characteristics of the surfaces of devices and biological materials (e.g., lubricity or hemocompatibility); or. For example, our patented PhotoLink® technology enhances the maneuverability of minimally invasive devices (e.g., dilatation catheters and guidewires) within the body by improving the lubricity of the device surface.
Additionally, our surface modification technologies can create new functions for the surfaces of the devices (e.g., drug deliverylubricity or promotion of healing)heomcompatability). For example our patented drug delivery technologies can create new device capabilities by enabling site specific, extended release drug delivery in cases where devices (e.g., stents or balloon catheters) are themselves necessary to treat a medical condition and in cases where devices serve only as a vehicle to deliver a drug (e.g., ophthalmology implants and drug delivery depots). Microparticles can be used to provide sustained drug delivery, allowing patients to receive injections at less frequent intervals (e.g., monthly instead of daily). Similarly, our patented PhotoLink® technology enhances the maneuverability of minimally invasive devices (e.g., dilatation catheters and guidewires) within the body by improving the lubricity of the device surface.
We believe that site specific, localized drug delivery from medical devices has the potential to change the landscape of the current medical device industry.improve life changing therapies. Drug-eluting stents are one of the first manifestations of how drugs and devices can be combined to dramatically improve patient outcomes. We believe that drug coated balloons may also show great promise, and that significantadditional opportunities exist for site specific drug delivery from a wide range of other medical devices. Working with both pharmaceutical and medical device companies, we believe we are poised to exploit this growing market opportunity as drugs and devices converge to create improved products and therapies.
In January 2005, we extended the application of our drug delivery technologies beyond the cardiovascular market, where our drug delivery polymer expertise first gained prominence, into the ophthalmology market by acquiring all of the assets of InnoRx, Inc., including its innovative sustained drug delivery platform technologies used to treat a variety of serious eye diseases. A Phase I clinical trial to demonstrate safety of the I-vationtm intravitreal implant in patients with diabetic macular edema (DME) was initiated during fiscal 2005. The study was fully enrolled in fiscal 2006 and patients completed their three-yearfollow-up during fiscal 2009. The clinical data suggest that the I-vationtm TA (triamcinolone acetonide) intravitreal implant is safe and well tolerated in patients with DME.
On October 5, 2009, we entered into a License and Development Agreement with F. Hoffmann-La Roche, Ltd. (“Roche”) and Genentech, Inc., a member of the Roche Group (“Genentech”). Under the terms of the License Agreement, Roche and Genentech have an exclusive license to develop and commercialize a sustained drug delivery formulation of Lucentis® (ranibizumab injection) utilizing SurModics’ proprietary biodegradable microparticle drug delivery system. Under the terms of the agreement,June 2011 we received an upfront licensing fee of $3.5 million, are eligible to receive potential payments of up to approximately $200 million in fees and milestone payments inannouncement from Cordis regarding the eventcessation of the successful developmentmanufacture of the CYPHER® and commercializationCYPHER SELECT® Plus stents by the end of multiple products, and will be paid for development work done on these products. Roche and Genentech will have the right to obtain manufacturing services from SurModics. In the2011. This event a commercial product is developed, we will also receive royalties on sales of such product. During fiscal 2010, the focus of our development activities have changed, primarily as a result of technical issues experienced in the Lucentis® microparticle product development program. Such technical issues reflect the inherent challenges often experienced in the development of new or reformulated pharmaceutical
3
products. We are continuing to collaborate with Genentech under our agreement on sustained drug delivery products utilizing our proprietary biodegradable microparticle drug delivery system. However, the program remains subject to a number of risks and uncertainties, including those detailed under the heading “Risk Factors”more fully discussed in Item 1A7 “Management’s Discussion and Analysis of Financial Condition and Result of Operations” of thisForm 10-K.
In July 2007,October 2010, we acquired Brookwood Pharmaceuticals, Inc.,announced initiatives intended to reduce our cost structure. As part of these initiatives, the Company implemented a leading provider of drug delivery technology primarilychange in its organizational structure to the pharmaceutical industry. This acquisition greatly increasedreflect our drug delivery capabilities in the areas of proprietary injectable microparticles and implant technology, both of which are based on biodegradable polymers, to provide sustained drug delivery. We offer manufacturing services for clinical trial materials as well as for commercial products throughcomplementary, but distinct business units:
| • | | Medical Device,comprised of surface modification coating technologies to improve access, deliverability, and predictable deployment of medical devices, as well as drug delivery coating technologies to provide site-specific drug delivery from the surface of a medical device. End markets include coronary, peripheral, neuro-vascular, and urology, among others. |
| • | | In Vitro Diagnostics,consisting of component products and technologies for diagnostic test kits and biomedical research applications. Products include microarray slide technologies, protein stabilization reagents, substrates and antigens. |
| • | | Pharmaceuticals,incorporates a broad range of drug delivery techniques for injectable therapeutics, including microparticles, nanoparticles, and implants. As noted above, we sold substantially all of our assets related to our Pharmaceuticals business to Evonik in November 2011, including its cGMP manufacturing facility. |
state-of-the-art Current Good Manufacturing Practice (cGMP) facility we constructed and qualified in Birmingham, Alabama. SurModics Pharmaceuticals’ customer projects target a number of key clinical indications in the diabetes, oncology, ophthalmology, cardiovascular, orthopedics, dermatology and central nervous system (CNS) markets, in addition to other fields. SurModics Pharmaceuticals generates revenue from research and development fees, polymer sales, license fees and manufacturing services.
In August 2007, we acquired BioFX Laboratories, Inc. (“BioFX”). BioFX is a leading provider of innovative reagents and substrates for the biomedical research and medical diagnostic markets. BioFX offers both colorimetric and chemiluminescent substrates, as well as other products for use inin vitrodiagnostic applications. This acquisition expanded our product offerings for customers developing diagnostic test kits.
In fiscal 2011 we consolidated all of our In Vitro Diagnostics business into BioFX and renamed the entity SurModics IVD, Inc. (“SurModics IVD”).We continue to commercialize our drug delivery and surface modification technologies primarily through licensing and royalty arrangements with medical device manufacturers, pharmaceutical and biotechnology companies.manufacturers. We believe this approach allows us to focus our resources on the further development of our core technologies and enables us to expand our licensing activities into new markets.
RevenuesRevenue from our licensing arrangements typically includeincludes research and development revenues,revenue, license fees and milestone payments, minimum royalties, and royalties based on a percentage of licensees’ product sales. In addition to licensing fees and research and development fees, we generate revenue from the manufacture and sale of a variety of products. We manufacture and sell the chemical reagents used by our customers in coating their products. We also sell a range of biodegradable polymers under our Lakeshore Biomaterials brand. Additionally, through our CodeLink® microarray slide product line. Weline we manufacture and sell microarray slides to the diagnostic and biomedical research markets. Other immunoassay diagnostic products include a line of stabilization products used to extend the shelf life of immunoassay diagnostic tests, substrates used to detect and signal a result in immunoassay diagnostic tests and recombinant human antigens through our role as exclusive North American distributor for DIARECT AG.
The Company was organized as a Minnesota corporation in June 1979. We make available, free of charge, copies of our annual report on Form 10-K, quarterly reports on Form 10-Q, current reports on Form 8-K and amendments to those reports filed or furnished pursuant to Section 13(a) or 15(d) of the Securities Exchange Act of 1934 (the “Exchange Act”) on our web site,website,www.surmodics.com, as soon as reasonably practicable after filing such material electronically or otherwise furnishing it to the SEC. We are not including the information on our web sitewebsite as a part of, or incorporating it by reference into our Form 10-K.
Subsequent Events. In October 2010, we announced initiatives intended to reduce our cost structure. As part of these initiatives, the Company implemented a change in its organizational structure to reflect our three complementary, but distinct business units: Medical Device, Pharmaceuticals, and In Vitro Diagnostics.
| | |
| • | Medical Device,comprised of surface modification coating technologies to improve access, deliverability, and predictable deployment of medical devices, as well as drug delivery coating technologies to provide site-specific drug delivery from the surface of a medical device. End markets include coronary, peripheral, neuro-vascular, and urology, among others. |
|
| • | Pharmaceuticals,incorporates a broad range of drug delivery techniques for injectable therapeutics, including microparticles, nanoparticles, and implants. Customers include pharmaceutical and biotechnology companies addressing a range of clinical applications including ophthalmology, oncology, dermatology and neurology, among others. Based in Birmingham, Alabama, the Pharmaceuticals business operates the Company’s cGMP manufacturing facility. |
4
| | |
| • | In Vitro Diagnostics,consisting of component products and technologies for diagnostic test kits and biomedical research applications. Products include microarray slide technologies, protein stabilization reagents, substrates and antigens. |
In addition, in December 2010, we announced that the Board of Directors of the Company had authorized the Company to explore strategic alternatives for the Company’s Pharmaceuticals business, including a potential sale of that business. This decision by the Board reflects our focus on returning the Company to profitable growth, and our renewed commitment to pursuing growth opportunities and investments in our Medical Device and In Vitro Diagnostics businesses. We have retained Piper Jaffray & Co. as our financial advisor in connection with this process. The Company has made no decision to enter into any transaction regarding the Pharmaceuticals business, and there can be no assurance that we will enter into such a transaction in the future. Additional details concerning this announcement can be found in the Company’s Current Report onForm 8-K expected to be filed with the Securities and Exchange Commission on or before December 20, 2010.
In December 2010, we also announced that Gary R. Maharaj has been named President and Chief Executive Officer of the Company, with such appointment to be effective December 27, 2010. Mr. Maharaj will also serve as a member of the Company’s Board of Directors. Mr. Maharaj previously served as President and Chief Executive Officer of Arizant Inc., a provider of patient temperature management in hospital operating rooms. Additional details concerning this announcement can be found in the Company’s Current Report onForm 8-K expected to be filed with the Securities and Exchange Commission on or before December 20, 2010.
Drug Delivery and Surface Modification Markets
Advances in medical device technology have helped drive improved device efficacy and patient outcomes. Pacemakers and defibrillators have dramatically reduced deaths from cardiac arrhythmias. Stents, particularly drug-eluting stents, have significantly reduced the need for repeat intravascular procedures, and they have diminished the need for more invasive cardiac bypass surgery. Hip, knee and spine implants have relieved pain and increased mobility. Acceptance of these and other similar innovations by patients, physicians and insurance companies has helped the U.S. medical device industry grow at a faster pace than the economy as a whole. The attractiveness of the industry has drawn intense competition among the companies participating in this area. In an effort to improve their existing products or develop entirely new devices, a growing number of medical device manufacturers are exploring or using drug delivery and surface modification technologies as product differentiators or device enablers. In addition, the continuing trend toward minimally invasive surgical procedures, which often employ catheter-based delivery technologies, has increased the demand for hydrophilic, lubricious coatings and other technologies.
Pharmaceutical and Biotechnology Industries
The pharmaceutical and biotechnology industries have become increasingly competitive as a result of the launch of new products (many of which have limited differentiating characteristics), patent expirations, and reimbursement pressures. In response to these competitive pressures, companies in these industries are continually seeking to develop new products with improved efficacy, safety and convenience. Reducing dosing frequency through polymer-based sustained release systems has the opportunity to enable the development of new drug entities, as well as to improve a broad range of existing drugs. Converting a drug that must, for instance, be given daily as a pill or injection, to one that can be administered by injection or implant weekly, monthly or even less frequently, may have several patient benefits. Sustained, extended drug release has the potential to eliminate undesirable peak and trough drug levels in the body, which can lead to both improved drug safety and efficacy. Additionally, fewer treatments and improved patient convenience can result in improved patient compliance with a specified administration schedule, thereby further enabling the drug’s effect to be optimized.
Drug delivery solutions such as those offered by SurModics also create opportunities for local delivery of medications to sites of disease in the body. In certain applications such as ocular, orthopedic and pain applications, it can be beneficial to provide a high local concentration of drug. Such local delivery may enhance efficacy and reduce
5
side effects by focusing the drug’s effect where it is needed and limiting the amount of drug impacting other parts of the body.
Pharmaceutical and biotechnology companies have also found that sustained drug delivery solutions can enhance product sales by creating competitive advantage and extending patent protection through the issuance of patents on extended delivery formulations of their drugs.
We believe the benefits of polymer-based sustained release systems make them applicable to drugs targeting a wide range of therapeutic fields, including ophthalmology, orthopedics, dermatology, metabolic disease, alcoholism, central nervous system disorders, and cardiovascular disease, among others.
Convergence of the Medical Device, Pharmaceutical and Biotechnology Industries
The convergence of the pharmaceutical, biotechnology and medical device industries, often made possible by drug delivery and surface modification technologies, presents a powerful opportunity for major advancements in the healthcare industry. The dramatic success of drug-eluting stents in interventional cardiology has captured the attention of the drug and medical device industries. We believe the benefits of combining drugs and biologics with implantable devices are becoming increasingly valuable in applications in cardiology, ophthalmology, orthopedics, and other large markets. In addition, the ability to create sustained release formulations of drugs and biologics presents another opportunity for the Company.
SurModics’ Drug Delivery and Surface Modification Technologies — Overview
We believe SurModics is positioned to exploit the continuing trend of incorporating drug delivery and surface modification technologies into the design of products such as devices and drugs, potentially leading to
more efficient and effective products as well as creating entirely new product applications. We have a growing portfolio of proprietary technologies, market expertise and insight, and unique collaborative research and development capabilities — all key ingredients to bring innovation together for the benefit of patients, the Company, and the healthcare industry.
Coatings for Drug Delivery and Surface Modification
Our drug delivery coating technologies allow therapeutic drugs to be incorporated within our proprietary polymer matrices to provide controlled, site specific release of the drug into the surrounding environment. The release of the drug can be tuned to elute quickly (within minutes to a few days) or slowly (ranging from several months to over a year), illustrating the wide range of release profiles that can be achieved with our coating systems. On a wide range of devices, drug-eluting coatings can help improve device performance, increase patient safety and enable innovative new treatments. We work with companies in the pharmaceutical, biotechnology and medical device industries to develop specialized coatings that allow for the controlled release of drugs from device surfaces. We see at least three primary areas with strong future potential: (1) improving the function of a device which itself is necessary to treat the medical condition; (2) enabling drug delivery in cases where the device serves only as a vehicle to deliver a drug to a specific site in the body; and (3) enhancing the biocompatibility of a medical device to ensure that it continues to function over a long period of time.
We offer customers several distinct polymer families for site specific drug delivery. Our Bravotm™ Drug Delivery Polymer Matrix is utilized on the CYPHER® Sirolimus-eluting Coronary Stent from Cordis Corporation, a subsidiary of Johnson & Johnson. CYPHER® is a trademark of Cordis Corporation. The Bravo polymer(“Bravo”) is a durable coating and has also been used on our I-vationtm TA (triamcinolone acetonide) intravitreal implant.in a variety of applications. In addition, we offer several biodegradable polymer technologies that can be used for drug delivery applications. Because some biodegradable polymers can deliver proteins and other large molecule therapeutic agents, they have the potential to expand the breadth of drug delivery applications we can pursue. Biodegradable polymers can be combined with one or more drugs and applied to a medical device where the drug can then be released as the polymer degrades in the body over time.
Our proprietary PhotoLink® coating technology is a versatile, easily applied, coating technology that modifies medical device surfaces by creating covalent bonds between device surfaces and a variety of chemical agents.
6
PhotoLink coatings can impart many performance enhancing characteristics, such as advanced lubricity (slippery) and hemocompatibility (preventing clot formation), when bound onto surfaces of medical devices or other biological materials without materially changing the dimensions or other physical properties of devices. Our PhotoLink technology utilizes proprietary, light activated (photochemical) reagents, which include advanced polymers or active biomolecules having desired surface characteristics and an attached light reactive chemical compound (photogroup). When the reagent is exposed to a direct light source, typically ultraviolet light, a photochemical reaction creates a covalent bond between the photogroup and the surface of the medical device, thereby imparting the desired property to the surface. A covalent bond is a very strong chemical bond that results from the sharing of electrons between carbon atoms of the substrate and the applied coating, making the coating very durable and resilient.
Our proprietary PhotoLink reagents can be applied to a variety of substrates. Our reagents are easily applied to the material surface by a variety of methods including, but not limited to, dipping, spraying, roll coating, ink jetting or brushing. We continue to expand our portfolio of proprietary reagents for use by our customers. These reagents enable our customers to develop novel surface features for their devices, satisfying the expanding requirements of the healthcare industry. We are also continually working to expand the list of materials that are compatible with our drug delivery and surface modification reagents. Additionally, we develop coating processes and coating equipment to meet the device quality, manufacturing throughput and cost requirements of our customers.
Key differentiating characteristics of our coatings are their durability, flexibility and ease of use. In terms of flexibility, coatings can be applied to many different kinds of surfaces and can immobilize a variety of chemical, pharmaceutical and biological agents. This flexibility allows customers to be innovative in the design of their products without significantly changing the dimensions or other physical properties of the device. Additionally,
the surface modification process can be tailored to provide customers with the ability to improve the performance of their devices by choosing the specific coating properties desired for particular applications. Our surface modification technologies also can be combined to deliver multiple surface-enhancing characteristics on the same device.
In terms of ease of use, the PhotoLink coating process is relatively simple and is easily integrated into the customer’s manufacturing process. In addition, it does not subject the coated products to harsh chemical or temperature conditions, produces no hazardous byproducts, and does not require lengthy processing or curing time. Further, our Photolink coatings are generally compatible with accepted sterilization processes, so the surface attributes are not lost when the medical device is sterilized.
Systemic and Local Drug Delivery Through Injectable Microparticles and Implants
We offer customers drug delivery systems based on polymer-based microparticles and implants. These systems enable the controlled delivery of a broad variety of drugs, ranging in size from small molecule drugs to larger molecule drugs such as peptides and proteins. Depending on the drug and application, our microparticles and implants can incorporate drugs for delivery over days, weeks or months.
SurModics Pharmaceuticals scientists have developed an extensive body of experience, proprietary know-how and patented capability in the field of microparticle drug delivery, working with a wide range of drug classes. Our microparticles incorporate a customer’s drug and our polymers into very small particles that are measured in microns (1,000 microns equals one millimeter). Using our extensive technology base, we can develop long-acting, injectable microparticles for systemic, local, and cellular delivery of active pharmaceutical ingredients. A variety of commercially viable, proprietary microencapsulation processes are used including: solvent extraction, solvent evaporation, phase separation, fluid bed coating, and spray drying. Based on the desired product specifications, our scientists and engineers can select the appropriate microencapsulation process, as well as the formulation variables to achieve dose, duration and other product specifications.
Injectable solid implants are rod, coil or other-shaped devices with drug dispersed throughout a polymer matrix. They are designed to release the drug at a prescribed rate for days, weeks, or months. This type of drug delivery dosage form is especially suitable when efficacy is dependent on delivering a dose of a drug over a long duration. The polymer matrix controls the rate of release of the drug from the implant. We have developed long-acting implants with biodegradable and non-biodegradable polymers.
7
SurModics’ Drug Delivery and Surface Modification Technologies — Clinical Benefits
| | |
| | • | | Drug Delivery. We provide drug delivery polymer technology to enable controlled, site specific or systemic delivery of therapeutic agents. Our proprietary polymer reagents create coatings, microparticles and implants whichmatrices that serve as reservoirs for therapeutic drugs. The drugs can then be released on a controlled basis over days, weeks or months. Some of our systems can release drugs for over a year. For instance, when a drug-eluting stent is implanted into a patient, the drug releases from the surface of the stent into the blood vessel wall where it can act to inhibit unwanted tissue growth, thereby reducing the occurrence of restenosis. Cordis Corporation is currently selling throughout the world a drug-eluting stent incorporating SurModics’ technology. In addition to our biodurable polymer technologies, we offer a number of biodegradable polymer technologies allowing us to deliver both large and small molecule drugs and address a wide variety of applications. |
|
| | • | | Lubricity. Low friction or lubricious coatings reduce the force and time required for insertion, navigation and removal of devices in a variety of minimally invasive applications. Based on internal and customer evaluations, when compared with uncoated surfaces, our PhotoLink coatings have reduced the friction on surfaces by more than 90%, depending on the surface being coated. Lubricity also reduces tissue irritation and damage caused by products such as catheters, guidewires and endoscopy devices. Further, lubricious coatings can improve deliverability of a medical device, which can enhance the physician’s ability to place a medical device in the intended anatomical site within the patient’s body. |
|
| | • | | Prohealing. Biologically based extracellular matrix (ECM)(“ECM”) protein coatings for use in various applications are designed to improve and accelerate the healing of the tissue at or near the implant site through nature’s own healing mechanisms following procedures involving implantable medical devices. Certain ECM proteins, such as collagen and laminin, specifically stimulate the migration and proliferation of endothelial cells (cells that line blood vessels) to promote healing. By covalently attaching the appropriate ECM proteins to device surfaces utilizing the PhotoLink coating process, the biomimetic surface can signal endothelial cells in the blood and vascular wall to form a stable endothelial lining over the implant. We believe these prohealing coatings could help prevent late stent thrombosis. |
|
| | • | | Hemo/biocompatibility. Hemocompatible/biocompatible coatings help reduce adverse reactions that may be created when a device is inserted into the body and comes in contact with blood. Heparin has been used for decades as an injectable drug to reduce blood clotting in patients. PhotoLink reagents can be used to immobilize heparin on the surface of medical devices, thereby inhibiting blood clotting on the device surface, minimizing patient risk and enhancing the performance of the device. We have also developed synthetic, non-biological coatings that provide medical device surfaces with improved blood compatibility without the use of heparin. These coatings prevent undesirable cells and proteins that lead to clot formation from adhering to the device surface. These coatings may also reduce fibrous encapsulation. |
|
| | • | | DNA and Protein Immobilization. Both DNA and protein microarrays are useful tools for the pharmaceutical, diagnostic and research industries. During a DNA gene analysis, typically thousands of different probes need to be placed in a pattern on a surface, called a DNA microarray. These microarrays are used by the pharmaceutical industry to screen for new drugs, by genome mappers to sequence human, animal or plant genomes, or by diagnostic companies to search a patient sample for disease causing bacteria or viruses. However, DNA does not readily adhere to most surfaces. We have developed various surface chemistries for both DNA and protein immobilization. In September 2008, we re-acquired the rights to |
| our microarray slide product line which had previously been marketed by GE Healthcare under the CodeLink® trademark. As part of this transaction, we obtained the right to use the CodeLink® trademark from GE Healthcare in the sale and marketing of the product lines we re-acquired. Protein microarrays are used as diagnostic and research tools to determine the presenceand/or quantity of proteins in a biological sample. The most common type of protein microarray is the antibody microarray, where antibodies are spotted onto a surface and used as capture molecules for protein detection. |
8
SurModics’ Drug Delivery and Surface Modification Technologies — Applications
The table below identifies several market segments where drug delivery and surface modification technologies are desired to improve and enable both existing and new medical devices and drugs.
| | |
Market Segment Served | | |
| | Desired Surface Property and
|
Market Segment Served
| | |
|
Interventional Cardiology and Vascular Access | | Lubricity: catheters, guidewires, delivery systems |
| | Hemocompatibility: vascular stents, catheters, distal protection devices |
| | Drug/biologics delivery: vascular stents, catheters |
| | Prohealing: vascular stents, vascular grafts |
| |
Cardiac Rhythm Management | | Lubricity: pacemaker and defibrillator leads, electrophysiology devices |
| | Hemocompatibility: electrophysiology devices |
| | Prohealing: pacemaker and defibrillator leads |
| | Drug/biologics delivery: pacemaker and defibrillator leads |
| |
Cardiothoracic Surgery | | Prohealing: heart valves, septal defect repair devices |
| | Hemocompatibility: minimally invasive bypass devices, vascular grafts, ventricular assist devices |
| |
In VitroDiagnostics | | Lubricity: microfluidic devices |
| | Hemocompatibility: blood/glucose monitoring devices, biosensors |
| | Biomolecule immobilization: DNA and protein arrays, protein attachment to synthetic extracellular matrix for cell culture applications |
| |
Interventional Neurology and Neurosurgery | | Lubricity: catheters, guidewires |
| | Prohealing: neuroembolic devices |
| | Tissue engineering: aneurysm repair devices |
| |
Urology and Gynecology | | Lubricity: urinary catheters, incontinence devices, ureteral stents, fertility devices |
| | Drug/biologics delivery: prostatic stents microparticle injections |
| | Tissue engineering: female sterilization devices |
| |
Ophthalmology | | Drug/biologics delivery: sustained drug delivery implants and microparticle injections |
| |
Orthopedics | | Cell growth and tissue integration: bone and cartilage growth |
| | Infection resistance: orthopedic and trauma implants |
| | Drug/biologics delivery: orthopedic and trauma implants and microparticle injections |
| |
Metabolic Disease | | Drug/biologics delivery: microparticle injections
|
| | Tissue engineering: cell encapsulation |
| |
Central Nervous System Disorders | | Drug/biologics delivery: microparticle injections, polymer implants
|
Dermatology
| | Drug/biologics delivery: polymer implants |
| |
Dermatology | | Drug/biologics delivery: polymer implants |
| | Tissue engineering: tissue bulking, space filling materials |
9
Examples of applications for our coating technologies include guidewires, angiography catheters, IVUS catheters, neuro microcatheters/infusion catheters, PTCA/PTA laser and balloon angioplasty catheters, atherectomy systems, chronic total occlusion catheters, stent delivery catheters, cardiovascular stents, embolic protection devices, vascular closure devices, EP catheters, pacemaker leads, drug infusion catheters, wound drains, ureteral stents, urological catheters and implants, hydrocephalic shunts, and ophthalmic implants, among other devices. Beyond coatings, our drug delivery technologies have also been applied to a wide range of drugs currently in preclinical and clinical development.
We commercialize our drug delivery and surface modification technologies primarily through licensing arrangements with medical device and drug manufacturers. We believe this approach allows us to focus our resources on further developing new technologies and expanding our licensing activities. Many of our technologies have been designed to allow manufacturers to easily implement them into their own manufacturing processes so customers can control production and quality internally without the need to send their products to a contract manufacturer. Other customers, particularly in the pharmaceutical and biotechnology industries, prefer to outsource the manufacturing of drug delivery formulations to partners.
We generate the largest portion of our revenue through licensing arrangements. Royalties and license fees represented 49.0%45.1%, 62.1%49.0% and 53.4%62.1% of our total revenue in fiscal 2011, 2010 2009 and 2008,2009, respectively. Revenue from these licensing arrangements typically includes license fees and milestone payments, minimum royalties, and royalties based on a percentage of licensees’ product sales. We also generate revenue from sales of chemical reagents to licensees for use in their coating processes, and, prior to the Pharma Sale, from polymer sales under our Lakeshore Biomaterials brand. Our In Vitro Diagnostics business unit generates revenue from: sales of stabilization products, substrates, antigens and microarray slides to diagnostics customers. Product sales represented 28.9%33.9%, 15.9%28.9% and 20.6%15.9% of total revenue in fiscal 2011, 2010 2009 and 2008,2009, respectively. Research and development fees represented 22.1%21.0%, 22.0%22.1% and 26.0%22.0% of total revenue in fiscal 2011, 2010 and 2009, and 2008, respectively.
The licensing process begins with the customer specifying a desired product feature to be created such as lubricity, drug delivery, etc. Because each device and drug is unique, we routinely conduct a feasibility study to qualify each new potential product application, often generating research and development revenue. Once the feasibility phase has been completed in a manner satisfactory to the customer, the customer funds a development project to optimize the formulation to meet the customer’s specific technical needs. At any time prior to commercialization, a license agreement may be executed granting the licensee rights to use our technology. We often support our customers by providing coating assistance for parts required in animal tests and human clinical trials. However, most customers perform the coating work internally once a product has received regulatory approval and is being actively marketed.
The term of a license agreement is generally for a specified number of years or the life of our patents, whichever is longer, although a license generally may be terminated by the licensee for any reason upon 90 days’ advance written notice. Our license agreements may include certain license feesand/or milestone payments. The license can be either exclusive or nonexclusive, but a significant majority of our licensed applications are nonexclusive, allowing us to license technology to multiple customers. Moreover, even exclusive licenses generally are limited to a specific “field of use,” allowing us the opportunity to further license technology to other customers. The royalty rate on a substantial number of the agreements has traditionally been in the 2% to 3% range, but there are certain contracts with lower or higher rates. Royalty rates in certain more recent agreements have been trending higher, especially where the relevant SurModics technology is an enabling component of the customer’s device (i.e., the device could not perform as desired without our technology). The amount of the license fees, milestone payments, and the royalty rate are based on various factors, including the stage of development of the product or technology being licensed, whether the arrangement is exclusive or nonexclusive, the perceived value of our technology to the customer’s product, size of the potential market, and customer preferences. Most of our agreements also incorporate a minimum royalty to be paid by the licensee. Royalties are generally paid one quarter after the customer’s actual product sales occur because of the delay in reporting sales by our licensees.
10
As of September 30, 2010,2011, we had 102over 100 licensed product classes (customer products utilizing SurModics technology) already on the market generating royalties and 110greater than 100 customer product classes incorporating our technology pending regulatory approval. These 212 product classes are being sold or developed by 108 licensed customers.in various stages of pre-commercialization. We signed 2126 new licenses in fiscal 2010,2011, compared with 2221 in fiscal 2009.
2010.All of our product classes that were under development or pending regulatory approval as of September 30, 2011, are subject to the terms of license agreements between us and our customers. Generally, medical device, biotechnology and pharmaceutical products incorporating our technologies are required to undergo long, expensive and uncertain regulatory review processes that are governed by the United States (“U.S.”) Food and Drug Administration (“FDA”) and other international regulatory authorities. The time required to obtain regulatory approval and, hence market introduction, for these products varies considerably depending on the product, its clinical application, the jurisdiction where approval is being sought, and the extent of clinical testing needed. This timing can range anywhere from several months (e.g., for medical device products seeking regulatory approval in the U.S. under the 510(K) approval process) to several years (e.g., for pharmaceutical products seeking regulatory approval in the U.S. under the new drug application process, or medical device products under the pre-market approval process).
Under our agreements with our customers, the responsibility for securing regulatory approval for, and ultimately commercializing these products rests with our customers. Our reliance on our customers in this regard and the potential risks to our operations as a result are discussed in Item 1A “Risk Factors” of this Form 10-K. Moreover, we are often contractually obligated to keep the details concerning our customers’ research and development efforts (including the timing of expected regulatory filings, approvals and market introductions) confidential. As a result of the significant uncertainty inherent in product development and regulatory approval processes, the fact that those efforts are outside of our control, and because of our contractual obligations to our customers, the expected timing for regulatory approval and commercialization for the product classes pending regulatory approval is uncertain.
Under most of our licensing agreements, we are required to keep the identity of our customers confidential unless they approve of such disclosure. Some of our licensed customers who allow the use of their name are: Abbott Laboratories (“Abbott”), Boston Scientific Corporation Clinuvel Pharmaceuticals,(“Boston Scientific”), Cook Medical, Cordis, Corporation (a subsidiary of Johnson & Johnson), Edge Therapeutics, Inc., Edwards Lifesciences Corporation, Evalve, Inc. (a subsidiary of Abbott Laboratories)Abbott), Elixir Medical Corporation, ev3 Inc. (a subsidiary of Covidien PLC), F. Hoffmann-La Roche, Ltd. and its subsidiary Genentech, Inc., Medtronic, Inc., Nexeon MedSystems, Inc. (“Nexeon”), NuPathe, Inc, OrbusNeich Medical, Inc., Spectranetics Corporation, St. Jude Medical, Inc., and ThermopeutiX, Inc.
In Vitro Diagnostics Products
SurModics offers a full line of stabilization products for thein vitrodiagnostics market. These products increase sensitivity and extend the shelf life of diagnostic kits, thereby producing more consistent assay results. SurModics’ stabilization products areready-to-use, eliminating the preparation time and cost of producing stabilization and blocking reagents in house.
Since the acquisition of BioFXSurModics IVD in August 2007, SurModics has provided colorimetric and chemiluminescent substrates to thein vitrodiagnostics market. A substrate is the component of a diagnostic test kit that detects and signals that a reaction has taken place so that a result can be recorded. Colorimetric substrates signal a positive diagnostic result through a color change. Chemiluminescent substrates signal a positive diagnostic result by emitting light. We believe that our substrates offer a high level of stability, sensitivity and consistency.
Recombinant Human Antigens
SurModics is the exclusive North American distributor (and non-exclusive distributor in Japan) of DIARECT AG’s line of recombinant autoimmune antigens. Because of the lack of high-quality antigens from natural sources, DIARECT produces these proteins and other components using biotechnological methods. DIARECT has strong capabilities in the bacilovirus/Sf9 expression system for autoimmune antigens as well asE. colisystems for particular expression tasks.
Microarray Slide Products
SurModics offers microarray slide products for use in the diagnostic and biomedical research markets. Microarray slides are used by researchers for DNA analysis. In September 2008, we re-acquired the rights to market our microarray slide product line from GE Healthcare, including the right to use the CodeLink® trademark in connection with these products. Previously, these products had been marketed by GE Healthcare under the CodeLink® trademark.
Our research and development (R&D)(“R&D”) personnel work to enhance and expand our technology and product offerings in the area of drug delivery, surface modification, andin vitrodiagnostics through internal scientific investigation. These scientists and engineers also evaluate external technologies in support of our corporate development activities. All of these efforts are guided by the needs of the markets in which we do business. Additionally, the R&D staff support the sales staff and business units in performing feasibility studies, providing technical assistance to potential customers, optimizing the relevant technologies for specific customer applications,
11
supporting clinical trials, training customers, and integrating our technologies and know-how into customer manufacturing operations.
We work together with our customers to integrate the best possible drug delivery and surface modification technologies with their products, not only to meet their performance requirements, but also to perform services quickly so that the product may reach the market ahead of the competition. To quickly solve problems that might arise during the development and optimization process, we have developed extensive capabilities in analytical chemistry and surface characterization within our R&D organization. Ourstate-of-the-art instrumentation and extensive experience allow us to test the purity of coating reagents, to monitor the elution rate of drug from coatings, microparticles and implants, to measure coating thickness and smoothness, and to map the distribution of chemicals throughout coatings, microparticles and implants.coatings. We believe our capabilities far exceed those of our direct competitors, and sometimes even exceed those of our large-company customers.
As medical products become more sophisticated and complex and as competition increases, we believe the need for drug delivery and surface modification will continue to grow. We intend to continue our development efforts to expand our drug delivery and surface modification technologies to provide additional optimized properties to meet these needs across multiple medical markets. In addition, we are expanding our drug delivery and surface modification technology expertise to capture more of the final product value. We are doing this by, in selected cases, developing or acquiring technologies or devices to develop from feasibility stage up to and including animal and human clinical testing stage. There can be no assurance that we will be successful in developing or acquiring additional technologies or devices.
After thorough consideration of each market opportunity, our technical strategy is to target selected formulation characteristics for further development, to facilitate and shorten the license cycle. We continue to perform research into applications for future products both on our own and in conjunction with some of our customers. Some of the R&D projects currently in progress include additional polymer systems for site specific and systemic drug delivery, including microparticles, nanoparticles and biodegradable technologies, as well as technologies to improve healing around implantable devices, technologies to deliver nucleic acids, proteins and cell therapies, advanced stabilization reagents, slide-based microarray technologies and drug delivery platforms for ophthalmic applications.
In fiscal 2011, 2010 2009 and 2008,2009, our R&D expenses were $30.7 million, $36.1 million $34.4 million and $40.5$34.4 million, respectively. Of the above amounts, $12.3 million, $17.9 million $21.2 million and $21.3$21.2 million were spent on internal R&D in fiscal 2011, 2010 2009 and 2008,2009, respectively, and $18.4 million, $18.2 million $13.2 million and $19.2$13.2 million in those years, respectively, were spent on customer-sponsored R&D, which includes technology optimization and other development work on customer product applications. We intend to continue investing in R&D to advance our drug deliverysurface modification and surface modificationin vitro diagnostic technologies and to expand uses for our technology platforms. In addition, we continue to pursue access to products and technologies developed outside the Company as appropriate to complement our internal R&D efforts.
Patents and Proprietary Rights
Patents and other forms of proprietary rights are an essential part of the SurModics business model. We protect our extensive portfolio of technologies through filing and maintaining patent rights covering a variety of coatings, drug delivery methods, reagents, and formulations, as well as particular clinical device applications. Generally, we seek patent protection in the United StatesU.S. for many of our proprietary technologies. We may also file international patent applications in the locations matching the major markets of our customers (primarily in North America, Europe, and Japan). In fiscalExcluding filings related to the Pharmaceuticals business, since October 1, 2010 weSurModics filed 46 United States42 U.S. patent applications, as well as 4345 international patent applications, expanding the portfolio protection around our current technologies as well as enabling pursuit of new technology concepts, innovations, and directions.
We have licensed our patented BravoPhotolinktm Drug Delivery Polymer Matrix (“Bravo”) to Cordis Corporation, a subsidiary of Johnson & Johnson, for utilization with its Cypher® Sirolimus-eluting Coronary Stent. In particular, we have six issued U.S. patents, three pending U.S. patent applications, 30 issued international patents and two pending international patent applications protecting various aspects of Bravo, including composition and methods of manufacturing and coating products. The expiration dates for these patents range from 2019 to 2023.
12
Additionally, we have licensed our Photolink® hydrophilic technology to a number of our customers for use in a variety of medical device applications, including those described in “SurModics’ Drug Delivery and Surface Modification Technologies — Applications” above. In particular, we have 8eight issued U.S. patents, four pending U.S. patent applications, 13 issued international patents, and 4six pending international patent applications protecting various aspects of these technologies, including compositions, methods of manufacture, and methods of coating devices. The expiration dates for these patents and anticipated expiration dates of the patent applications range from 2015 to 2020.
2031.The Company aggressively pursues patent protection covering the proprietary technologies that we consider important to our business. In addition to seeking patent protection in the U.S., we also generally file patent applications in European countries and additional foreign countries, including Australia, Canada, China and Japan, on a selective basis. Generally, the expiration dates of our issued patents are determined based on the filing date of the earliest filed patent application from which the patent claims priority. We strategically manage our patent portfolio so as to ensure that we have valid and enforceable patent rights protecting our technological innovations.
As of September 30, 2010, weDecember 1, 2011, after the Pharma Sale, SurModics had 187133 pending United StatesU.S. patent applications, 12six of which were exclusively licensed from others, and 244182 foreign patent applications, of which 4221 were exclusively licensed from others. Likewise, as of September 30, 2010, weDecember 1, 2011, SurModics owned 10968 issued United StatesU.S. patents, 1617 of which were exclusively licensed from others, and 192137 international patents, of which 6569 were exclusively licensed from others.
We also rely upon trade secrets and other unpatented proprietary technologies. We seek to maintain the confidentiality of such information by requiring employees, consultants and other parties to sign confidentiality agreements and by limiting access by parties outside the Company to such information. There can be no assurance, however, that these measures will prevent the unauthorized disclosure or use of this information, or that others will not be able to independently develop such information. Additionally, there can be no assurance that any agreements regarding confidentiality and non-disclosure will not be breached, or, in the event of any breach, that adequate remedies would be available to us.
We market our technologies and products throughout the world using a direct sales force consisting of dedicated sales professionals who focus on specific markets and companies. These sales professionals work in concert with business unit personnel to coordinate customer activities. The specialization of our sales professionals
fosters an in-depth knowledge of the issues faced by our customers within these markets such as industry trends, technology changes, biomaterial changes and the regulatory environment. In addition, we enter into sales and marketing relationships with third-parties to distribute our diagnostic products around the world. See Note 11 to the consolidated financial statements for information regarding domestic and foreign revenue.
In general, we license our technologies on a non-exclusive basis to customers for use on specific products, or on an exclusive basis, but limited to a specific “field of use.” This strategy enables us to license our technologies to multiple customers in the same market. We also target new product applications with existing customers.
To support our marketing and sales activities, we publish technical literature on our various surface modification, drug delivery, andin vitrodiagnostics technologies and products. In addition, we exhibit at major trade shows and technical meetings, advertise in selected trade journals and through our website, and conduct direct mailings to appropriate target markets.
We also offer ongoing customer service and technical support throughout our licensees’ relationships with us. This service and support may begin with a feasibility study, and also may include additional services such as assistance in the transfer of the technology to the licensee, further optimization, process control and troubleshooting, preparation of product for clinical studies, and assistance with regulatory submissions for product approval. Most of these services are billable to customers.
Acquisitions and Investments
In order toTo further our strategic objectives and strengthen our existing businesses, we intend to continue to explore acquisitions, investments and strategic collaborations to diversify and grow our business. As a result, we expect to make future investments or acquisitions where we believe that we can broaden our technology offerings
13
and expand our sources of revenue and the number of markets in which we participate. See Note 2 to the consolidated financial statements for further information regarding our minority equity investments. Mergers and acquisitions of medical technology companies are inherently risky, and no assurance can be given that any of our previous or future acquisitions will be successful or will not materially adversely affect our consolidated results of operations, financial condition, or cash flows.
In July 2007, we acquired Brookwood Several acquisitions relating to our Pharmaceuticals Inc. (now known as SurModicsbusiness are discussed above in Overview — Recent Sale of Pharmaceuticals Inc.) for an up-front payment, including fees, of $42.3 million and potential additional payments of up to $22 million based upon achievement of certain milestones. Since the acquisition, we have paid the sellers additional consideration of $5.8 million related to achievement of milestones, and the sellers are still eligible to receive up to $16.3 million in additional consideration. The additional cash consideration was recorded as an increase to goodwill.
Business.In August 2007, we acquired BioFX Laboratories, Inc. (“BioFX”) for consideration consisting of an up-front payment, including fees, of $11.6 million and potential additional payments of up to $11.4 million based upon achievement of certain milestones. Since the acquisition, we have paid the sellers additional consideration of $1.1 million related to achievement of a milestone, and the sellers are still eligible to receive up to $3.5$3.0 million in additional consideration.
In November 2008, we extended our technology offerings by acquiring a portfolioconsideration through calendar 2011. Potential milestones of intellectual property$0.5 million were not earned and collaborative drug delivery projects from PR Pharmaceuticals, Inc., a drug delivery company specializinglapsed in injectable, biodegradable sustained release formulations for an up-front payment, including fees, of $3.1 million and potential payments of up to $6.0 million based upon achievement of certain milestones. Since the acquisition, we have paid the sellers additional consideration of $2.4 million related to achievement of certain milestones.
fiscal 2011.Significant Customers
We have two customers that each provided more than 10% of our revenue in fiscal 2010.2011. Revenue from Medtronic and Johnson & Johnson and Medtronic represented approximately 17%15% and 14%13%, respectively, of our total revenue for the year ended September 30, 2010.2011. The loss of one or more of our largest customers could have a material adverse effect on our business, financial condition, results of operations, and cash flow as discussed in more detail below.
flow. In June 2011, we received an announcement from Cordis, a Johnson & Johnson subsidiary, regarding the cessation of the manufacture of the CYPHER® and CYPHER SELECT® Plus stents by the end of 2011.Competition
The ability for drug delivery and surface modification technologies to improve the performance of medical devices and drugs and to enable new product categories has resulted in increased competition in these markets.
Some of our competitors offer drug delivery technologies, while others specialize in lubricious or hemocompatible coating technology. Some of these companies target ophthalmology applications, while others target cardiovascular or other medical device applications. In addition, because of the many product possibilities afforded by surface modification technologies, many of the large medical device manufacturers have developed, or are engaged in efforts to develop, internal competency in the area of drug delivery and surface modification. Many of our existing and potential competitors have greater financial, technical and marketing resources than we have.
We attempt to differentiate ourselves from our competitors by providing what we believe is a high value-added approach to drug delivery and surface modification technology. We believe that the primary factors customers consider in choosing a particular technology include performance (e.g., flexibility, ability to fine tune drug elution profiles, biocompatibility, etc.), ease of manufacturing,time-to-market, intellectual property protection, ability to produce multiple properties from a single process, compliance with manufacturing regulations, ability to manufacture clinical and commercial products (especially for SurModics Pharmaceuticals customers), customer service and total cost of goods (including manufacturing process labor). We believe our technologies deliver exceptional performance in these areas, allowing us to compete favorably with respect to these factors. We believe that the cost and time required to obtain the necessary regulatory approvals significantly reduces the likelihood of a customer changing the manufacturing process it uses once a device or drug has been approved for sale.
Because a significant portion of our revenue depends on the receipt of royalties based on sales of medical devices incorporating our technologies, we are also affected by competition within the markets for such devices. We believe that
14
the intense competition within the medical device market creates opportunities for our technologies as medical device manufacturers seek to differentiate their products through new enhancements or to remain competitive with enhancements offered by other manufacturers. Because we seek to license our technologies on a non-exclusive basis, we may further benefit from competition within the medical device markets by offering our technologies to multiple competing manufacturers of a device. However, competition in the medical device market could also have an adverse effect on us.us as demonstrated by the announcement we received, in June 2011, from Cordis regarding the cessation of the manufacture of the CYPHER® and CYPHER SELECT® Plus stents by the end of 2011. While we seek to license our products to established manufacturers, in certain cases our licensees may compete directly with larger, dominant manufacturers with extensive product lines and greater sales, marketing and distribution capabilities. We also are unable to control other factors that may impact commercialization of coated devices or drug products, such as regulatory approval, marketing and sales efforts of our licensees or competitive pricing pressures within the particular market. There can be no assurance that products employing our technologies will be successfully commercialized by our licensees or that such licensees will otherwise be able to compete effectively.
Competition in the diagnostics market is highly fragmented. In the product lines in which we compete (protein stabilization reagents, substrates, recombinant autoimmune antigens and surface chemistry technologies), we face an array of competitors ranging from large manufacturers with multiple business lines to small manufacturers that offer a limited selection of products. Many of our competitors have substantially more capital resources, marketing experience, research and development resources and production facilities than we do. We believe that our products compete on performance, stability (shelf life), sensitivity (lower levels detected, faster results), consistency and price. We believe that our continued competitive success will depend on our ability to develop or acquire new proprietary products, obtain patent or other protection for our products and successfully market our products directly or through partners.
Historically, we have performed limited manufacturing activities for our customers, other than the manufacture of ourin vitrodiagnostics products which we sell to our customers, all of which we manufacture in our Eden Prairie, Minnesota facility. In general, we do not coat medical devices that are intended for commercial sale by our customers, though we often support our customers by coating products intended for pre-clinical and clinical development, including human clinical trials and on occasion, even commercial product. Some of our
customers, particularly in the pharmaceutical and biotechnology industries, prefer to outsource the manufacturing of drug delivery formulations to partners. Accordingly, in April 2008, we acquired a facility in Birmingham, Alabama with approximately 286,000 square feet of warehouse and office space and constructed a cGMP manufacturing facility there in order to upgrade our manufacturing capabilities. This facility was opened and qualified in fiscal 2010. In December 2010, we announced that the Board of DirectorsThe cGMP manufacturing facility was sold as part of the Company had authorizedPharma Sale. See Note 1 to the Company to explore strategic alternativesconsolidated financial statements for further information regarding the Company’s Pharmaceuticals business, including a potential sale of that business, divestiture of our manufacturing facility, or other transactions that could result in the cGMP facility not being available to us to meet our manufacturing needs.
SurModics Pharmaceuticals business.We attempt to maintain multiple sources of supply for the key raw materials used to manufacture our products. We do, however, purchase some raw materials from single sources, but we believe that additional sources of supply are readily available. Further, to the extent additional sources of supply are not readily available, we believe that we could manufacture such raw materials.
We follow quality management procedures in accordance with applicable regulations and guidance for the development and manufacture of materials and pharmaceutical, device, biotechnology or combination products that support clinical trials and commercialization. In an effort to better meet our customers’ needs in this area, our Eden Prairie, Minnesota facility received ISO 13485:2003 and ISO 9001:2000 certification in fiscal 2004 and has received updated certifications in each subsequent year.as required. In fiscal 2010, our Birmingham, Alabama facility received ISO 9001:2008 and ISO 13485:2003 certification.
certification and received an updated certification in fiscal 2012.Government Regulation
Although our drug delivery and surface modification technologies themselves are not directly regulated by the Food and Drug Administration (FDA),U.S. FDA, the medical devices, pharmaceutical and biotechnology products incorporating our technologies are subject to FDA regulation. New medical devices utilizing our technologies can only be marketed in the United StatesU.S. after a 510(k) application has been cleared or a pre-market approval application (PMA)(“PMA”) has been approved by the FDA. This process can take anywhere from three months for a 510(k) application, to two or three years or more for a PMA application. The burden of demonstrating to the FDA that a new device is
15
either substantially equivalent to a previously marketed device (510(k)(“510(k) marketing clearance process)process”), or in the case of implantable devices, safe and effective (PMA process)(“PMA process”), rests with our customers as the medical device manufacturers. New pharmaceutical and biotechnology products utilizing our technologies can only be marketed in the United StatesU.S. after a New Drug Application (NDA)(“NDA”) or Biologics License Application (BLA)(“BLA”) has been approved by the FDA. The burden of obtaining FDA approval of the NDA or BLA rests with our customers.
In support of our customers’ regulatory filings, we maintain various confidential Drug Master Files, Device Master Files and Veterinary Master Files with the FDA and with other regulatory agencies outside the U.S. regarding the nature, chemical structure and biocompatibility of our reagents. Although our licensees generally do not have direct access to these files, they may, with our permission, reference these files in their various regulatory submissions to these agencies. This approach allows regulatory agencies to understand in confidence the details of our technologies without us having to share this highly confidential information with our customers.
U.S. legislation allows companies, prior to obtaining FDA clearance or approval to market a medical product in the U.S., to manufacture medical products in the U.S. and export them for sale in international markets. This generally allows us to realize earned royalties sooner. However, sales of medical products outside the U.S. are subject to international requirements that vary from country to country. The time required to obtain approval for sale internationally may be longer or shorter than that required by the FDA.
As of December 1, 2010,2011, after the Pharma Sale, we had 215 employees, of whom 166 were engaged in research, product development, quality, or manufacturing positions, with the remainder in sales, marketing, or administrative positions. Post-graduate degrees are held by 69 of our employees, 27 of whom hold Ph.D. degrees.113 employees. We are not a party to any collective bargaining agreements, and we believe that our employee relations are good.
We believe that our future success will depend in part on our ability to attract and retain qualified technical, management and marketing personnel. Such experienced personnel are in high demand, and we must compete for their services with other firms that may be able to offer more favorable compensation packages or benefits.
EXECUTIVE OFFICERS OF THE REGISTRANT
As of December 9, 2010,2011, the names, ages and positions of the Company’s executive officers are as follows:
| | | | | | |
Name | | Age | | | Position |
Gary R. Maharaj | | | |
Name
48 | | Age
| President and Chief Executive Officer |
Timothy J. Arens | | Position
| 44 | | | Vice President of Finance and Interim Chief Financial Officer |
|
Philip D. AnkenyCharles W. Olson | | | 47 | | | Interim Chief Executive Officer, Senior Vice President and Chief Financial Officer |
Timothy J. Arens | | | 43 | | | General Manager, In Vitro Diagnostics |
Charles W. Olson | | | 46 | | | Senior Vice President and General Manager, Medical Device |
Bryan K. Phillips | | | 3940 | | | Senior Vice President of Legal and Human Resources, General Counsel and Secretary |
Eugene C. RuschJoseph J. Stich | | | 6246 | | | Vice President, Manufacturing |
Joseph J. Stich | | | 45 | | | Vice President of Marketing, Corporate Development and Strategy |
Arthur J. Tipton, Ph.D. | | | 53 | | | Senior Vice PresidentBusiness Operations and General Manager, Pharmaceuticals |
Jan M. Webster | | | 51 | | | Vice President of Human ResourcesIn Vitro Diagnostics |
Philip D. AnkenyGary R. Maharajjoined the Company in December 2010 as its Vice President and Chief FinancialExecutive Officer in April 2003 withand was also appointed to the additional responsibilitiesSurModics Board of Vice President, Business Development added in April 2004. He was promoted to Senior Vice President and Chief Financial Officer in May 2006. In June 2010, Mr. Ankeny assumed the role of Interim Chief Executive Officer.Directors at such time. Prior to joining SurModics, heMr. Maharaj served as President and Chief FinancialExecutive Officer for Cognicity, Inc. from 1999 to 2002. Mr. Ankeny also serves on the Board of Directors of Innovex,Arizant Inc., which designsa provider of patient temperature management systems in hospital operating rooms, from 2006 to 2010. Previously, Mr. Maharaj served in several senior level management positions for Augustine Medical, Inc. (predecessor to Arizant Inc.) from 1996 to 2006, including Vice President of Marketing, and manufactures flexible circuit interconnect solutions to original equipment manufacturersVice President of Research and Development. During his 23 years in the electronics industry.
16
medical device industry, Mr. Ankeny received an A.B. degreeMaharaj has also served in economicsvarious management and engineering from Dartmouth College in 1985research positions for the orthopedic implant and rehabilitation divisions of Smith & Nephew, PLC. Mr. Maharaj holds an M.B.A. from Harvard Businessthe University of Minnesota’s Carlson School of Management, an M.S. in 1989.
biomedical engineering from the University of Texas at Arlington and the University of Texas Southwestern Medical Center at Dallas, and a B.Sc. in Physics from the University of the West Indies.Timothy J. Arensjoined the Company in February 2007 as Director, Business Development. Mr. ArensDevelopment and became Director of Financial Planning and Analysis in October 2007. He was promoted to his current role as Senior Director of Financial Planning and Analysis and General Manager, In Vitro Diagnostics in October 2010. He was promoted to his current role as Vice President of Finance and Interim Chief Financial Officer in August 2011. Prior to joining SurModics, Mr. Arens was employed at St. Jude Medical, a medical technology company, from 2003 to 2007 in positions of increasing responsibility related to business development and strategic planning functions. Mr. Arens received a B.S. degree in Finance from the University of Wisconsin Eau Claire in 1989 and an M.B.A. degree from the University of Minnesota’s Carlson School of Management in 1996.
Charles W. Olsonjoined the Company in July 2001 as Market Development Manager, was promoted in December 2002 to Director, Business Development, named General Manager of the Hydrophilic Technologies business unit in April 2004, and promoted to Vice President and General Manager, Hydrophilic Technologies in October 2004. In April 2005, the position of Vice President, Sales was added to his responsibilities. In November 2008, Mr. Olson was named Vice President of our Cardiovascular business unit, in March 2010 he was named Senior Vice President, Business Development and Marketing, and in October 2010, he was named Senior Vice President and General Manager, Medical Device. Prior to joining SurModics, Mr. Olson was employed as General Manager at Minnesota Extrusion from 1998 to 2001 and at Lake Region Manufacturing in project management and technical sales from 1993 to 1998. Mr. Olson received a B.S. degree in Marketing from Winona State University in 1987.
Bryan K. Phillipsjoined the Company in July 2005 as Patent Counsel and Assistant General Counsel. In January 2006, Mr. Phillips was appointed Corporate Secretary, and he was promoted to Deputy General Counsel in October 2007. He was promoted to Vice President, General Counsel and Corporate Secretary in September 2008 and was promoted to Senior Vice President in October 2010. In August 2011, he became Senior Vice
President, Legal and Human Resources, General Counsel and Secretary. Prior to joining SurModics, from 2001 to 2005, Mr. Phillips served as patent counsel at Guidant Corporation’s Cardiac Rhythm Management Group where he was responsible for developing and implementing intellectual property strategies and also for supporting the company’s business development function. He also practiced law at the Minneapolis-based law firm of Merchant & Gould P.C. Mr. Phillips received a B.S. degree in Mechanical Engineering from the University of Kansas in 1993 and a law degree from the University of Minnesota Law School in 1999. He is admitted to the Minnesota bar and is registered to practice before the United StatesU.S. Patent and Trademark Office.
Eugene C. Ruschjoined the Company in March 2010 as Vice President of Manufacturing. Prior to joining SurModics, Mr. Rusch served Alkermes, Inc., a biotechnology company, as Vice President/General Manager-Manufacturing Operations beginning in 2004. Prior to that, he worked for over 20 years for Hoffmann-LaRoche Pharmaceutical in several managerial positions. Mr. Rusch received his B.S. degree in Microbiology from Rutgers University.
Joseph J. Stichjoined the Company in March 2010 as Vice President of Marketing, Corporate Development and Strategy. In August 2011, he became Vice President, Business Operations and General Manager, In Vitro Diagnostics. Before joining SurModics, Mr. Stich was Vice President of Corporate Development for Abraxis BioScience, LLC, a biotechnology company focused on oncology therapeutics.therapeutics, from 2009 to 2010. Prior to joining Abraxis, he was a Vice President of MGI Pharma,Pharmaceuticals, Inc., a biopharmaceutical company, from 20052004 to 2009. Mr. Stich’s prior experience also includes serving as President/COO of Pharmaceutical Corp. of America (a subsidiary of Publicis Healthcare Specialty Group), and positions of increasing responsibility in sales and marketing at Sanofi-Aventis Pharmaceuticals. He received hisa B.B.A. degree from the University of Wisconsin — Whitewater in 1988, and hisan M.B.A. degree from Rockhurst University in Kansas City in 1996.
Arthur J. Tipton, Ph.D.,became Vice President, SurModics and President, SurModics Pharmaceuticals, coincident with the acquisition of SurModics Pharmaceuticals by SurModics in July 2007. Dr. Tipton was named Senior Vice President and Chief Scientific Officer in February 2010 and in October 2010 he was named Senior Vice President, Pharmaceuticals. Dr. Tipton joined Southern Research Institute in 2004 as Vice President of Pharmaceutical Formulations and then became President and CEO of SurModics Pharmaceuticals in January 2005 when it was launched as a new company based on Southern Research Institute’s pharmaceutical formulations business. Prior to joining Southern Research Institute, Dr. Tipton served as Executive Vice President at Durect Corporation from 2001 to 2004. Dr. Tipton also held a variety of positions at Southern BioSystems (now part of Durect),
17
including Vice President and Chief Scientific Officer, where he led all efforts on biodegradable technology from 1993 to 2001. Dr. Tipton was with Atrix Laboratories (now part of QLT Inc.) from 1988 to 1993. He currently serves on the Board of the Biotechnology Association of Alabama. Dr. Tipton earned a B.S. in Chemistry from Spring Hill College in 1980 and a Ph.D. in Polymer Science and Engineering from the University of Massachusetts, Amherst in 1988.
Jan M. Websterjoined the Company as Vice President of Human Resources in January of 2006. Ms. Webster came to SurModics with over 20 years of experience in the healthcare industry. From 1987 through 2005, she held various human resources and management positions at St. Jude Medical, Inc., most recently as Director of Human Resources for the Cardiac Surgery division. From 1984 to 1987, she served in several human resources roles for Fairview Health Services. Ms. Webster received a bachelor’s degree in business administration from Minnesota State University, Mankato in 1981 and earned an M.A. in human resources and industrial relations from the University of Minnesota in 2006.
The executive officers of the Company are elected by and serve at the discretion of the Board of Directors.
18
RISKS RELATING TO OUR BUSINESS, STRATEGY AND INDUSTRY
We are subject to changes in general economic conditions that are beyond our control including recession and declining consumer confidence.
During periods of economic slowdown or recession, such as the United StatesU.S. and world economies are currently experiencing, many of our customers are forced to delay or terminate some of their product development plans. Because we rely on licensing and commercialization of our technology by third parties, we may be severely impacted by the decreasing research and development budgets of our customers. In addition, in an environment of decreasing research and development spending, sales of our In Vitro Diagnostics products may similarly suffer as a result of the decreased utilization of research-focused products. Any sustained period of decreased research and development spending by our customers and potential customers could adversely affect our financial position, liquidity, and results of operations.
We may also be affected by a reduction in the amount of products purchased by our diagnostic customers.The decrease in available financing for our customers and for new ventures that could potentially become our customers can reduce our potential opportunities.
One of the consequences of the economic slowdown has been a decrease in the availability of financing for bothstart-up and other developing ventures, which can impact our business in several ways. For example, some customers have been unable to obtain additional financing and were forced to cease their operations. Because our financial results depend substantially on the success of our customers in commercializing their products, a reduced ability by companies to take their products to market can substantially adversely affect our results of operations. In addition, the decrease in available financing has resulted in fewerstart-up medical device specialty pharmaceutical, and biotechnology companies than in prior years. To the extent that fewer new companies are started, the number of potential customers for our technologies will be smaller, and we may be unable to meet our business goals, which could substantially affect our financial performance.
The loss of, or significant reduction in business from, one or more of our major customers could significantly reduce our revenue, earnings or other operating results.
We have two customers that each provided 10% or more of our revenue in fiscal 2010.2011. Revenue from Medtronic and Johnson & Johnson and Medtronic represented approximately 17%15% and 14%13%, respectively, of our total revenue for the fiscal year ended September 30, 2010.2011. The loss of one or more of our largest customers, or reductions in business from them, could have a material adverse effect on our business, financial condition, results of operations, and cash flow. For example, in December 2008, following a strategic reviewJune 2011, Cordis announced the cessation of the manufacture of the CYPHER® and CYPHER SELECT® Plus stents by the end of 2011. In July 2011, Cordis notified us of its business and product portfolio, Merck terminated its collaboration with us relatingintention to terminate the development and potential commercializationexclusivity arrangements under the license agreement, which also results in a termination of our I-vationtm intravitreal implant.the minimum quarterly royalty requirements beginning in the first quarter of fiscal 2012. There can be no assurance that revenue from any customer will continue at their historical levels. If we cannot broaden our customer base, we will continue to depend on a small number of customers for a significant portion of our revenue.
The long-term success of our business may suffer if we are unable to expand our licensing base to reduce our reliance upon several major customers.
A significant portion of our revenue is derived from a relatively small number of customer products. We intend to continue pursuing a strategy of licensing our technologies to a diversified base of medical device and drug manufacturers and other customers, thereby expanding the commercialization opportunities for our technologies. Success will depend, in part, on our ability to attract new licensees, to enter into agreements for additional applications with existing licensees and to develop and market new applications. There can be no
assurance that we will be able to identify, develop and adapt our technologies for new applications in a timely and cost-effective manner; that new license agreements will be executed on terms favorable to us; that new applications will be accepted by customers in our target markets; or that products incorporating newly licensed technology, including new applications, will gain regulatory approval, be commercialized or gain market acceptance. Delays or failures in these efforts could have an adverse effect on our business, financial condition and results of operations.
19
Drug delivery and surface modification are competitive markets and carry the risk of technological obsolescence.
We operate in a competitive and evolving field, and new developments are expected to continue at a rapid pace. Our success depends, in part, upon our ability to maintain a competitive position in the development of technologies and products in the field of drug delivery and surface modification. Our drug delivery and surface modification technologies compete with technologies developed by a number of other companies. In addition, many medical device manufacturers have developed, or are engaged in efforts to develop, drug delivery or surface modification technologies for use on their own products. Some of our existing and potential competitors (especially medical device manufacturers pursuing coating solutions through their own research and development efforts) have greater financial and technical resources and production and marketing capabilities than us. Competitors may succeed in developing competing technologies or obtaining governmental approval for products before us. Products incorporating our competitors’ technologies may gain market acceptance more rapidly than products using ours. Developments by competitors may render our existing and potential products uncompetitive or obsolete. Furthermore, there can be no assurance that new products or technologies developed by others, or the emergence of new industry standards, will not render our products or technologies or licensees’ products incorporating our technologies uncompetitive or obsolete. Any new technologies that make our drug delivery or surface modification technologies less competitive or obsolete would have a material adverse effect on our business, financial condition and results of operations.
We couldmay face adverse consequences as a resultindemnity and other liability claims pursuant to our agreement with Evonik relating to the sale of substantially all of the actions of a major stockholder.
According to a Schedule 13D, filed with the Securities Exchange Commission on November 17, 2010, by Ramius LLC and certain of its affiliates, Ramius beneficially owned approximately 12% of our common stock asassets of the
datePharmaceuticals business.Under the terms of the filing. Ramius has publicly and privately expressed opinions with respectPurchase Agreement, we have agreed to the operation of our business, our business strategy, and other matters. In addition, Ramius has nominated a slate of directors for election to our Board of Directors. To the extentindemnify Evonik against specified losses that Ramius is successful in preventing the Company from executing on its long-term business strategy, our business and operating results couldmight be negatively impacted. The uncertainty and negative publicity resulting from the activities of Ramius could also have a material adverse effect on our ability to attract new employees (or retain current employees), new customers and to do additional business with our existing customers. Finally, the expenses incurred in connection with Evonik’s utilization of the acquired assets. We have also agreed to retain responsibility for certain liabilities that may accrue and we have made representations and warranties to Evonik, including matters relating to intellectual property. Following the closing, if Evonik makes an indemnification claim because it has suffered a loss or a third party has commenced an action against Evonik, we may incur expenses to resolve Evonik’s claim or to defend Evonik and ourselves against the third party action, which expense could harm our operating results. In addition, such indemnity claims may divert management distraction causedattention from our continuing business. It may also be difficult to determine whether a claim from a third party stemmed from actions taken by us or by Evonik and we may expend substantial resources trying to determine which party has responsibility for the actions of Ramius and our responses to those actions could have a material adverse effect on our business, financial condition and results of operations.
claim.Failure to identify strategic investment and acquisition opportunities may limit our growth.
An important part of our growth in the future may involve strategic investments and the acquisition of complementary businesses or technologies. Our identification of suitable investment opportunities and acquisition candidates involves risks inherent in assessing the technology, value, strengths, weaknesses, overall risks and profitability, if any, of investment and acquisition candidates. We may not be able to identify suitable investment and acquisition candidates. If we do not make suitable investments and acquisitions, we may find it more difficult to realize our growth objectives.
The acquisitions that we have made, or any future acquisitions that we undertake could be difficult to integrate, disrupt our business, dilute shareholder value, or harm our operating results.
In recent years we have made several significant acquisitions, including SurModics Pharmaceuticals, Inc. (formerly Brookwood Pharmaceuticals, Inc.), the largest acquisition in our history.acquisitions. The process of integrating acquired businesses into our operations poses numerous risks, including:
| | |
| • | an inability to assimilate acquired operations, personnel, technology, information systems, and internal control systems and products; |
|
| • | diversion of management’s attention, including the need to manage several remote locations with a limited management team; |
|
| • | difficulties and uncertainties in transitioning the customers or other business relationships from the acquired entity to us; and |
|
| • | the loss of key employees of acquired companies. |
20
diversion of management’s attention, including the need to manage several remote locations with a limited management team;difficulties and uncertainties in transitioning the customers or other business relationships from the acquired entity to us; and
the loss of key employees of acquired companies.
In addition, future acquisitions by us may be dilutive to our shareholders, and cause large one-time expenses or create goodwill or other intangible assets that could result in significant asset impairment charges in the future. For example, in the first quarter of fiscal 2011 and the fourth quarter of fiscal 2010, we recognized a goodwill impairment chargecharges of $5.7 million and $13.8 million, respectively, which represented a full impairment of the remaining goodwill associated with our SurModics Pharmaceuticals acquisition. Strategic investments may result in impairment charges if the value of any such investment declines significantly. In addition, if we acquire entities that have not yet commercialized products but rather are developing technologies for future commercialization, our earnings per share may fluctuate as we expend significant funds for continued research and development efforts necessary to commercialize such acquired technology. We cannot guarantee that we will be able to successfully complete any investments or acquisitions or that we will realize any anticipated benefits from investments or acquisitions that we complete.
Goodwill or other assets on our balance sheet may become impaired, which could have a material adverse effect on our operating results.
As a result of our acquisitions, we have recorded a significant amount of goodwill on our balance sheet. As required by the accounting guidance for goodwill, we evaluate at least annually the potential impairment of goodwill. Testing for impairment of goodwill involves the determination of the fair value of our reporting units. The estimation of fair values involves a high degree of judgment and subjectivity in the assumptions used. We also evaluate other assets on our balance sheet, including intangible assets, whenever events or changes in circumstances indicate that their carrying value may not be recoverable. Our estimate of the fair value of the assets may be based on fair value appraisals or discounted cash flow models using various inputs.
Future impairment of our remaining goodwill of $8.0 million related to our In Vitro Diagnostics business unit or other assets could materially adversely affect our results of operations. For example, in the fourthfirst quarter of fiscal 20102011 we recognized ana goodwill impairment charge of $13.8$5.7 million related to goodwill associated with our acquisition of SurModics Pharmaceuticals Inc.and had recognized a goodwill impairment charge of $13.8 million related to this acquisition in the fourth quarter of fiscal 2010. In addition, in fiscal 2011 and 2010, we recognized asset impairment charges totaling $17.9 million and $4.9 million.
million, respectively.Research and development costs may adversely affect our operating results.
The success of our business depends on a number of factors, including our continued research and development of new technologies for future commercialization. In researching and developing such new technologies, we may incur significant expenses that may adversely affect our operating results, including our profitability. Additionally, these activities are subject to risks of failure that are inherent in the development of new medical technologies and as a result, may never result in commercially viable technologies.
Our failure to expand our management systems and controls to support our business and integrate acquisitions could seriously harm our operating results and business.
Executing our business strategy and integrating our past acquisitions has placed significant demands on management and our administrative, development, operational, information technology, manufacturing, financial and personnel resources. Accordingly, our future operating results will depend on the ability of our officers and other key employees to continue to implement and improve our operational, development, customer support and financial control systems, and effectively expand, train and manage our employee base. Otherwise, we may not be able to manage our growth successfully.
We recognize revenue in accordance with various complex accounting standards, and changes in circumstances or interpretations may lead to accounting adjustments.
Our revenue recognition policies involve application of various complex accounting standards, including accounting guidance associated with revenue arrangements with multiple deliverables. Our compliance with such accounting standards often involves management’s judgment regarding whether the criteria set forth in the standards have been met such that we can recognize as revenue the amounts that we receive as payment for our products or services. We base our judgments on assumptions that we believe to be reasonable under the circumstances. However, these judgments, or the assumptions underlying them, may change over time. In addition, the SEC or the Financial Accounting Standards Board (“FASB”) may issue new positions or revised guidance on the treatment of complex accounting matters. Changes in circumstances or third-party guidance could cause our judgments to
21
change with respect to our interpretations of these complex standards, and transactions recorded, including revenue recognized, for one or more prior reporting periods, which could be adversely affected.
RISKS RELATING TO OUR OPERATIONS AND RELIANCE ON THIRD PARTIES
We rely on third parties to market, distribute and sell most products incorporating our technologies, and those third parties may not perform or agreements with those parties could be terminated.
A principal element of our business strategy is to enter into licensing arrangements with medical device, pharmaceutical, and biotechnology companies that manufacture products incorporating our technologies. For the fiscal years ended September 30, 2011, 2010 2009 and 2008,2009, we derived approximately 49%45%, 62%49% and 53%62% of our revenue, respectively, from royalties and license fees. Although we do market certain diagnostic products and reagents, we do not currently market, distribute or sell our own medical devices or pharmaceutical compounds,diagnostic test kits, nor do we intend to do so in the foreseeable future. Thus, our prospects are greatly dependent on the receipt of royalties from licensees of our technologies. The amount and timing of such royalties are, in turn, dependent on the ability of our licensees to gain successful regulatory approval for, market and sell products incorporating our technologies. Failure of certain licensees to gain regulatory approval or market acceptance for such products could have a material adverse effect on our business, financial condition and results of operations.
Our customers market and sell (and most manufacture) the products incorporating our licensed technologies. If one or more of our licensees fail to pursue the development or marketing of these products as planned, our revenue and profits may not reach our expectations, or may decline. Additionally, our ability to generate positive operating results in connection with the achievement of development or commercialization milestones may also suffer. For example, Merck terminated their collaboration with us relating to the development and potential commercialization of our I-vationTMtm intravitreal implant following a strategic review of its business and product development portfolio in 2008. We do not control the timing and other aspects of the development or commercialization of products incorporating our licensed technologies because our customers may have priorities that differ from ours or their development or marketing efforts may be unsuccessful, resulting in delayed or discontinued products. Hence, the amount and timing of revenue we derive from our customers’ research and development as well as royalty payments received by us will fluctuate, and such fluctuations could have a material adverse effect on our business, financial condition and results of operations.
Under our standard license agreements, licensees can terminate the license for any reason upon 90 days’ prior written notice. Existing and potential licensees have no obligation to deal exclusively with us in obtaining drug delivery or surface modification technologies and may pursue parallel development or licensing of competing technological solutions on their own or with third parties. A decision by a licensee to terminate its relationship with us could materially adversely affect our business, financial condition and results of operations.
We have limited or no redundancy in our manufacturing facilities, and we may lose revenue and be unable to maintain our customer relationships if we lose our production capacity or are unable to successfully managecapacity.
Given the transitionPharma Sale, which included the sale of our BioFXthe Birmingham, Alabama manufacturing operations.
Wefacility, we now manufacture all of the products we sell in our existing production labsareas in our Eden Prairie, Minnesota Birmingham, Alabama, and Owings Mills, Maryland facilities. We have recently begun the process of migratingfacility. In August 2011, we began the production of our BioFX products from our leased facilities in Maryland to our headquarters facility in Eden Prairie, Minnesota. There are a number of risks associated with this move, including the loss of personnel associated with closing our Maryland facilities, damage to equipment, decreased efficiency associated with the relocation, product quality issues related to the transition, lack of continuity in key support functions and damaged customer relationships as a result of any of the above disruptions. If we experience any of the above issues associated with our recent change in the relocation of our production operations, we could experience material adverse effects on our business, financial condition and results of operations.
In addition, if any of our existing production facilitiesfacility becomes incapable of manufacturing products for any reason, we may be unable to meet production requirements, we may lose revenue and we may not be able to maintain our relationships with our customers, including certain of our licensees. In particular, because most of our customers use these reagents to create royalty-bearing products, failure by us to deliver products, including polymers and reagents, could result in decreased royalty revenue, as well as decreased revenue from the sale of products. Without our existing production facilities,facility, we would have no other means of manufacturing products until we were able to restore the manufacturing capability at a particularthe facility or develop an alternative manufacturing
22
facility. Although we carry business interruption insurance to cover lost revenue and profits in an amount we consider adequate, this insurance does not cover all possible situations. In addition, our business interruption insurance would not compensate us for the loss of opportunity and potential adverse impact on relations with our existing customers resulting from our inability to produce products for them.
We have limited experience manufacturing pharmaceutical products, and we may be subject to adverse consequences if we fail to comply with applicable regulations or contractual obligations.
Under the terms of certain of our licensing agreements, we may be obligated to manufacture pharmaceutical or biotechnology products for existing or future licensees under appropriate circumstances. In addition, certain potential customers may require that we be responsible for the manufacture of pharmaceutical or biotechnology products in order to enter into licensing agreements with us. In addition, as part of our strategy to utilize our cGMP manufacturing facility, we may manufacture products for customers other than our licensees, substantially increasing our exposure to risks related to manufacturing beyond those previously associated with our core business.
The manufacture of pharmaceutical or biotechnology products can be an expensive, time consuming, and complex process with which we have limited experience, and which we may not fully understand the operational or cost aspects of. For example, we have limited experience in the financial planning of contract manufacturing operations, and may not fully understand our cost structures, or may enter into contract manufacturing arrangements with customers based on financial assumptions that turn out not to be true. Any failure on our part to anticipate such issues could adversely affect our business, financial condition and results of operations.
Further, any manufacturer of pharmaceutical and biotechnology products is subject to applicable cGMP regulations as prescribed by the FDA or other rules and regulations prescribed by foreign regulatory authorities. We may be unable to maintain our facilities in compliance with cGMP or other applicable regulatory standards. Such a failure to comply with cGMP could result in significant time delays or inability to obtain (and maintain) marketing approval for any future products that we may be required to manufacture, which may result in financial penalties under the terms of license agreements, as well as damage our relationships with our customers in the future. Furthermore, we may be subject to sanctions, including fines and temporary or permanent suspension of operations, product recalls and marketing restrictions, if we fail to comply with the laws and regulations pertaining to our business.
We may face product liability claims related to participation in clinical trials, the use or misuse of our products or the manufacture and supply of pharmaceutical products.
The development and sale of medical devices and component products involves an inherent risk of product liability claims. Although in most cases our customer agreements provide indemnification against such claims, there can be no guarantee that product liability claims will not be filed against us for such products, that parties indemnifying us will have the financial ability to honor their indemnification obligations or that such manufacturers will not seek indemnification or other relief from us for any such claims. Any product liability claims, with or without merit, could result in costly litigation, reduced sales, significant liabilities and diversion of our management’s time, attention and resources. We have obtained a level of liability insurance coverage that we believe is appropriate to our activities, however we cannot be sure that our product liability insurance coverage is adequate or that it will continue to be available to us on acceptable terms, if at all. Furthermore, we do not expect to be able to obtain insurance covering our costs and losses as a result of any recall of products or devices incorporating our technologies because of alleged defects, whether such recall is instituted by us, by a customer, or is required by a regulatory agency. A product liability claim, recall or other claim with respect to uninsured liabilities or for amounts in excess of insured liabilities could have a material adverse effect on our business, financial condition and results of operations.
Our revenue will be harmed if we cannot purchase sufficient reagent components we use in our manufacture of reagents.
We currently purchase some of the components we use to manufacture reagents from sole suppliers. If any of our sole suppliers becomes unwilling to supply components to us, experiences an interruption in its production or is otherwise unable to provide us with sufficient material to manufacture our reagents, we will experience
production interruptions. If we lose our sole supplier of any particular reagent component or are otherwise unable to procure all
23
components required for our reagent manufacturing for an extended period of time, we may lose the ability to manufacture the reagents our customers require to commercialize products incorporating our technology. This could result in lost royalties and product sales, which would harm our financial results. Adding suppliers to our approved vendor list may require significant time and resources since we typically thoroughly review a supplier’s business and operations to become comfortable with the quality and integrity of the materials we purchase for use with our technology, including reviewing a supplier’s manufacturing processes and evaluating the suitability of materials and packaging procedures the supplier uses. We routinely attempt to maintain multiple suppliers of each of our significant materials, so we have alternative suppliers, if necessary. However, if the number of suppliers of a material is reduced, or if we are otherwise unable to obtain our material requirements on a timely basis and on favorable terms, our operations may be harmed.
We are dependent upon key personnel and may not be able to attract qualified personnel in the future.
Our success is dependent upon our ability to retain and attract highly qualified management and technical personnel. We face intense competition for such qualified personnel. We do not maintain key person insurance, and we generally do not enter into employment agreements, except for with certain executive officers. Although we have non-compete agreements with most employees, there can be no assurance that such agreements will be enforceable. The loss of the services of one or more key employees or the failure to attract and retain additional qualified personnel could have a material adverse effect on our business, financial condition and results of operations.
RISKS RELATING TO OUR INTELLECTUAL PROPERTY
If we cannot adequatelyWe may not be able to obtain, maintain or protect proprietary rights necessary for the commercialization of our technologies and proprietary information, we may be unable to sustain a competitive advantage.technologies.
Our success depends, in large part, on our ability to obtain and maintain patents, maintain trade secret protection, operate without infringing on the proprietary rights of third parties and protect our proprietary rights against infringement by third parties. We have been granted U.S. and foreign patents and have U.S. and foreign patent applications pending related to our proprietary technologies. There can be no assurance that any pending patent application will be approved, that we will develop additional proprietary technologies that are patentable, that any patents issued will provide us with competitive advantages or will not be challenged or invalidated by third parties, or that the patents of others will not prevent the commercialization of products incorporating our technologies. Furthermore, there can be no assurancetechnologies, or that others will not independently develop similar technologies duplicate any of our technologies or design around our patents.
Furthermore, because we generate a significant amount of our revenue through licensing arrangements, the loss or expiration of patent protection for our key technologies will result in a reduction of the revenue derived from these arrangements which may have a material adverse effect on the Company’s business, cash flow, results of operations, financial position and prospects.We may become involved in expensive and unpredictable patent litigation or other intellectual property proceedings which could result in liability for damages, or impair our development and commercialization efforts.
Our commercial success also will depend, in part, on our ability to avoid infringing patent or other intellectual property rights of third parties. There has been substantial litigation regarding patent and other intellectual property rights in the medical device and pharmaceutical industries, and intellectual property litigation may be used against us as a means of gaining a competitive advantage. Intellectual property litigation is complex, time consuming and expensive, and the outcome of such litigation is difficult to predict. If we were found to be infringing any third party patent or other intellectual property right, we could be required to pay significant damages, alter our products or processes, obtain licenses from others, which we may not be able to do on commercially reasonable terms, if at all, or cease commercialization of our products and processes. Any of these outcomes could have a material adverse effect on our business, financial condition and results of operations.
Patent litigation or certain other administrative proceedings may also be necessary to enforce any patents issued or licensed to us or to determine the scope and validity of third party proprietary rights. These activities could result in substantial cost to us, even if the eventual outcome is favorable to us. An adverse outcome of any such litigation or interference proceeding could subject us to significant liabilities to third parties, require disputed rights to be licensed from third parties or require us to cease using our technology. Any action to defend or prosecute
24
intellectual property would be costly and result in significant diversion of the efforts of our management and technical personnel, regardless of outcome, and could have a material adverse effect on our business, financial condition and results of operations.
If we are unable to keep our trade secrets confidential, our technology and proprietary information may be used by others to compete against us.
We rely significantly upon proprietary technology, information, processes and know-how that are not subject to patent protection. We seek to protect this information through trade secret or confidentiality agreements with our employees, consultants, potential licensees, or other parties as well as through other security measures. There can be no assurance that these agreements or any security measure will provide meaningful protection for our unpatented proprietary information. In addition, our trade secrets may otherwise become known or be independently developed by competitors.
If we or any of our licensees breach any of the agreements under which we have in-licensed intellectual property from others, we could be deprived of important intellectual property rights and future revenue.
We are a party to various agreements through which we have in-licensed or otherwise acquired from third parties rights to certain technologies that are important to our business. In exchange for the rights granted to us under these agreements, we agree to meet certain research, development, commercialization, sublicensing, royalty, indemnification, insurance, and other obligations. If we or one of our licensees fails to comply with these obligations set forth in the relevant agreement through which we have acquired rights, we may be unable to effectively use, license, or otherwise exploit the relevant intellectual property rights and may be deprived of current or future revenuesrevenue that areis associated with such intellectual property.
RISKS RELATING TO CLINICAL AND REGULATORY MATTERS
Healthcare policy changes, including new legislation intended to reform the U.S. healthcare system, may have a material adverse effect on us.
Healthcare costs have risen significantly over the past decade. There have been and continue to be proposals by legislators, regulators, and third-party payors to keep these costs down. Certain proposals, if implemented, would impose limitations on the prices our customers will be able to charge for our products, or the amounts of reimbursement available for their products from governmental agencies or third-party payors. Because our revenue is typically derived from royalties on products which constitute a percentage of the selling price, these limitations could have an adverse effect on our revenue.
On March 23, 2010, the Patient Protection and Affordable Care Act was signed into law. The legislation imposes significant new taxes on medical device makers who make up a significant portion of our customers. The legislation, if fully enacted, will have a significant total cost to the medical device industry, which could have a material, negative impact on both the financial condition of our customers as well as on our customers’ ability to attract financing, their willingness to commit capital to development projects or their ability to commercialize their products utilizing our technology, any of which could have a material adverse effect on our business, financial condition and results of operations. There continues to be substantial risk to our customers, and therefore us, from the uncertainty which continues to surround the future of health care delivery and reimbursement both in the United StatesU.S. and abroad.
Products incorporating our technologies are subject to continuing regulations and extensive approval or clearance processes. If our licensees are unable to obtain or maintain the necessary regulatory approvals or clearances for such products, then our licensees will not be able to commercialize those products on a timely basis, if at all.
Medical devices, biotechnology products or pharmaceutical products incorporating our technologies are subject to regulation by the FDA and other regulatory authorities. In order to obtain regulatory approval for products incorporating our technologies, extensive preclinical studies as well as clinical trials in humans may be required. Clinical development, including preclinical testing, is a long, expensive and uncertain process. The burden of securing regulatory approval for these products typically rests with our licensees, the medical device or
25
pharmaceutical manufacturers. However, we have prepared Drug Master Files and Device Master Files which may be accessed by the FDA and other regulatory authorities to assist them in their review of the applications filed by our licensees.
The process of obtaining FDA and other required regulatory approvals is expensive and time-consuming. Historically, most medical devices incorporating our technologies have been subject to the FDA’s 510(k) marketing approval process, which typically lasts from six to nine months. Supplemental or full pre-market approval reviews require a significantly longer period, delaying commercialization. By contrast, pharmaceutical products incorporating our technologies are subject to the FDA’s New Drug Application process, which typically takes a number of years to complete. Additionally, biotechnology products incorporating our technologies are subject to the FDA’s Biologics License Application process, which also typically takes a number of years to complete. In addition, sales of medical devices and pharmaceutical or biotechnology products outside the U.S. are subject to international regulatory requirements that vary from country to country. The time required to obtain approval for sale internationally may be longer or shorter than that required for FDA approval.
There can be no assurance that our licensees will be able to obtain regulatory approval for their products on a timely basis, if at all. Regulatory approvals, if granted, may include significant limitations on the indicated uses for which the product may be marketed. In addition, product approval could be withdrawn for failure to comply with regulatory standards or the occurrence of unforeseen problems following initial marketing. Changes in existing regulations or adoption of new governmental regulations or policies could prevent or delay regulatory approval of products incorporating our technologies or subject us to additional regulation. Failure or delay of our licensees in obtaining FDA and other necessary regulatory approval or clearance, or the loss of previously obtained approvals, could have a material adverse effect on our business, financial condition and results of operations.
We may face liability if we mishandle or improperly dispose of the hazardous materials used in some of our research, development and manufacturing processes.
Our research, development and manufacturing activities sometimes involve the controlled use of various hazardous materials. Although we believe that our safety procedures for handling and disposing of such materials comply with the standards prescribed by state and federal regulations, the risk of accidental contamination or injury from these materials cannot be completely eliminated. While we currently maintain insurance in amounts that we believe are appropriate, we could be held liable for any damages that might result from any such event. Any such liability could exceed our insurance and available resources and could have a material adverse effect on our business, financial condition and results of operations.
Additionally, certain of our activities are regulated by federal and state agencies in addition to the FDA. For example, activities in connection with disposal of certain chemical waste are subject to regulation by the U.S. Environmental Protection Agency. We could be held liable in the event of improper disposal of such materials, even if these acts were done by third parties. Some of our reagent chemicals must be registered with the agency, with basic information filed related to toxicity during the manufacturing process as well as the toxicity of the final product. Failure to comply with existing or future regulatory requirements could have a material adverse effect on our business, financial condition and results of operations.
RISKS RELATING TO OUR SECURITIES
Our stock price has been volatile and may continue to be volatile.
The trading price of our common stock has been, and is likely to continue to be, highly volatile, in large part attributable to developments and circumstances related to factors identified in “Forward-Looking Statements” and “Risk Factors.” The market value of shares of our common stock may rise or fall sharply at any time because of this volatility, as a result of large sales executed by significant holders of our stock, and also because of significant short positions taken by investors from time to time in our stock. In the fiscal year ended September 30, 2010,2011, the closing sale price for our common stock ranged from $10.67$8.28 to $30.69 per share. In addition, since the end of our fiscal year through November 30, 2010 the closing sale price for our common stock has ranged from $8.33 to $13.11$15.50 per share. The market prices for securities of medical technology, drug delivery and biotechnology companies historically have been highly volatile, and the market has experienced significant price and volume fluctuations that may be unrelated to the operating performance of particular companies.
26
| |
| ITEM 1B. | UNRESOLVED STAFF COMMENTS. |
Our principal operations are located in Eden Prairie, a suburb of Minneapolis, Minnesota, where we own a building that has approximately 64,000 square feet of space. We also own an undeveloped parcel of land adjacent to our principal facility, which we intend to use to accommodate our growth needs, and have leased additional warehouse space near our owned facility.
In addition toWe sold all of the properties associated with SurModics Pharmaceuticals, including our Eden Prairie facilities, we also owncGMP development and lease facilitiesmanufacturing facility, located in Birmingham, Alabama, in connection with our SurModics Pharmaceuticals operations. The facility which we acquired in the SurModics Pharmaceuticals acquisition consists of approximately 33,000 square feet. In April 2008, we acquired a second building in Birmingham, Alabama that has approximately 286,000 square feet in which we have constructed a cGMP (current good manufacturing practice) development and manufacturing facility. We also lease facilities in Owings Mills, Maryland that are used for general office space and manufacturing for our BioFX operations.Pharma Sale. We also lease office space in Irvine, California, which we vacated and subleased in connection with our March 2010 reorganization. In December 2010, we announced that
| ITEM 3. | LEGAL PROCEEDINGS. |
See the Boarddiscussion of Directors of“Litigation” and the Company had authorized the Company to explore strategic alternatives for the Company’s Pharmaceuticals business, including a potential sale of that business, divestiture of our manufacturing facility, or other transactions that could result“SRI Litigation” in the cGMP facility not being available to us to meet our manufacturing needs.
| |
ITEM 3. | LEGAL PROCEEDINGS. |
See Note 9 to the Consolidated Financial Statementsconsolidated financial statements for information regarding commitments and contingencies.
| |
| ITEM 4. | (REMOVED AND RESERVED). |
27
PART II
| |
| ITEM 5. | MARKET FOR REGISTRANT’S COMMON EQUITY, RELATED STOCKHOLDER MATTERS AND ISSUER PURCHASES OF EQUITY SECURITIES. |
Our stock is traded on the Nasdaq Global Select Market under the symbol “SRDX.” The table below sets forth the range of high and low sale prices, by quarter, for our Common Stock, as reported by Nasdaq, in each of the last two fiscal years.
| | | | | | | | | |
Fiscal Quarter Ended: | | High | | Low |
| |
| September 30, 2010 | | $ | 16.68 | | | $ | 10.62 | |
| June 30, 2010 | | | 22.25 | | | | 15.00 | |
| March 31, 2010 | | | 23.31 | | | | 19.00 | |
| December 31, 2009 | | | 31.00 | | | | 22.05 | |
| September 30, 2009 | | | 25.14 | | | | 20.87 | |
| June 30, 2009 | | | 23.40 | | | | 17.95 | |
| March 31, 2009 | | | 27.42 | | | | 15.96 | |
| December 31, 2008 | | | 31.69 | | | | 18.95 | |
| | | | | | | | |
Fiscal Quarter Ended: | | High | | | Low | |
September 30, 2011 | | $ | 12.95 | | | $ | 8.90 | |
June 30, 2011 | | | 15.50 | | | | 10.82 | |
March 31, 2011 | | | 13.40 | | | | 11.30 | |
December 31, 2010 | | | 13.23 | | | | 8.28 | |
September 30, 2010 | | | 16.68 | | | | 10.62 | |
June 30, 2010 | | | 22.25 | | | | 15.00 | |
March 31, 2010 | | | 23.31 | | | | 19.00 | |
December 31, 2009 | | | 31.00 | | | | 22.05 | |
Our transfer agent is:
American Stock Transfer & Trust Company
59 Maiden Lane, Plaza Level
New York, New York 10038
(800) 937-5449
According to the records of our transfer agent, as of December 9, 2010,2011, there were 217 holders of record of our common stock and approximately 6,4934,900 beneficial owners of shares registered in nominee or street name.
We have neverTo date, SurModics, has not paid or declared any cash dividends on ourits common stock. The payment by SurModics of dividends, if any, on its common stock and do not anticipate doing so in the foreseeable future.
future is subject to the discretion of the Board of Directors and will depend on SurModics’ continued earnings, financial condition, capital requirements and other relevant factors.The following table presents information with respect to purchases of common stock of the Company made during the three months ended September 30, 2010,2011, by the Company or on behalf of the Company or any “affiliated purchaser” of the Company, as defined inRule 10b-18(a)(3) under the Exchange Act.
| | | | | | | | | | | | | | | | | |
| | | | | | | (c)
| | (d)
|
| | | | | | | Total Number
| | Approximate Dollar
|
| | | | | | | of Shares
| | Value of
|
| | | | | | | Purchased
| | Shares That
|
| | | | | | | as Part of
| | May Yet Be
|
| | | (a)
| | (b)
| | Publicly
| | Purchased
|
| | | Total Number
| | Average
| | Announced
| | Under the
|
| | | of Shares
| | Price Paid
| | Plans or
| | Plans or
|
Period | | Purchased(1) | | per Share(1) | | Programs | | Programs(2) |
| |
| 7/1/10 — 7/31/10 | | | 10,769 | | | $ | 13.28 | | | | 0 | | | $ | 5,302,113 | |
| 8/1/10 — 8/31/10 | | | 0 | | | | NA | | | | 0 | | | $ | 5,302,113 | |
| 9/1/10 — 9/30/10 | | | 841 | | | $ | 10.93 | | | | 0 | | | $ | 5,302,113 | |
| Total | | | 11,610 | | | $ | 13.11 | | | | 0 | | | $ | 5,302,113 | |
| | | | | | | | | | | | | | | | |
Period | | Total Number
of Shares
Purchased(1) | | | Average
Price Paid
per Share(1) | | | Total Number
of Shares
Purchased
as Part of
Publicly
Announced
Plans or
Programs | | | Approximate Dollar
Value of
Shares That
May Yet Be
Purchased
Under the
Plans or
Programs(2) | |
7/1/11 — 7/31/11 | | | 870 | | | $ | 11.35 | | | | 0 | | | $ | 5,302,113 | |
8/1/11 — 8/31/11 | | | 1,955 | | | $ | 10.66 | | | | 0 | | | $ | 5,302,113 | |
9/1/11 — 9/30/11 | | | 0 | | | | NA | | | | 0 | | | $ | 5,302,113 | |
Total | | | 2,825 | | | $ | 10.87 | | | | 0 | | | $ | 5,302,113 | |
| | |
| (1) | | The purchases in this column were repurchased by the Company to pay the exercise price and/or to satisfy tax withholding obligations in connection with so-called “stock swap exercises” related to the vesting of employee restricted stock awards. |
|
| (2) | | On November 15, 2007, our Board of Directors announced the authorization of the repurchase of $35$35.0 million of our outstanding common stock. As of September 30, 2010,2011, pursuant to this authorization we have repurchased a cumulative 1,024,181 shares at an average price of $29.00 per share. Under the current authorization, the Company has $5.3 million available for authorized share repurchases as of September 30, 2010.2011. The repurchase authorization does not have an expiration date. |
28
Stock Performance Chart
The following chart compares the cumulative total shareholder return on the Company’s Common Stock with the cumulative total return on the Nasdaq Stock Market and the Nasdaq Medical Industry Index (Medical Devices, Instruments and Supplies). The comparison assumes $100 was invested on September 30, 200529, 2006 and assumes reinvestment of dividends.
29
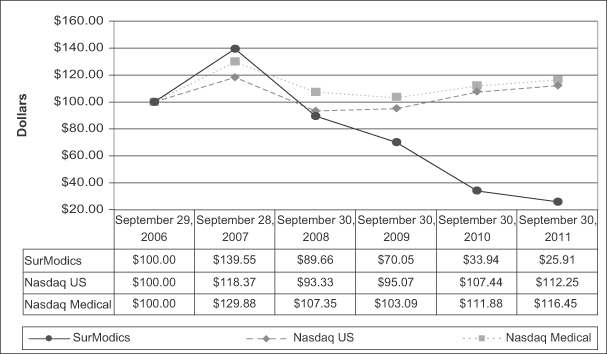
| |
| ITEM 6. | SELECTED FINANCIAL DATA. |
The data presented below as of and for the fiscal years ended September 30, 2011, 2010 and 2009 and 2008 areis derived from our audited consolidated financial statements included elsewhere in this report. The financial data as of and for the fiscal years ended September 30, 2008 and 2007 and 2006 areis derived from our audited financial statements which are not included in this report. The information set forth below should be read in conjunction with the Company’s consolidated financial statements and “Management’s Discussion and Analysis of Financial Condition and Results of Operations” contained in Item 7 of this report and our consolidated financial statements and related notes beginning onpage F-1 and other financial information included in this report.
| | | | | | | | | | | | | | | | | | | | | |
| | | Fiscal Year |
| | | 2010 | | 2009 | | 2008 | | 2007 | | 2006 |
| | | (Dollars in thousands, except per share data) |
| |
| Statements of Operations Data: | | | | | | | | | | | | | | | | | | | | |
| Total revenue | | $ | 69,898 | | | $ | 121,534 | | | $ | 97,051 | | | $ | 73,164 | | | $ | 69,884 | |
| Operating (loss) income | | | (14,053 | ) | | | 57,501 | | | | 27,261 | | | | 9,899 | | | | 36,163 | |
| Net (loss) income | | | (21,089 | ) | | | 37,550 | | | | 14,739 | | | | 3,347 | | | | 20,334 | |
| Diluted net (loss) income per share | | | (1.21 | ) | | | 2.15 | | | | 0.80 | | | | 0.18 | | | | 1.09 | |
| Balance Sheet Data: | | | | | | | | | | | | | | | | | | | | |
| Cash, short-term and long-term investments | | $ | 56,786 | | | $ | 47,868 | | | $ | 71,978 | | | $ | 70,225 | | | $ | 106,571 | |
| Total assets | | | 170,279 | | | | 185,562 | | | | 191,028 | | | | 171,331 | | | | 157,402 | |
| Retained earnings | | | 82,900 | | | | 103,989 | | | | 66,439 | | | | 51,620 | | | | 48,273 | |
| Total stockholders’ equity | | | 154,359 | | | | 172,372 | | | | 141,806 | | | | 130,922 | | | | 145,203 | |
| Statements of Cash Flows Data: | | | | | | | | | | | | | | | | | | | | |
| Net cash provided by operating activities | | $ | 22,008 | | | $ | 31,321 | | | $ | 39,822 | | | $ | 50,715 | | | $ | 35,279 | |
| | | | | | | | | | | | | | | | | | | | |
| | | Fiscal Year | |
| | | 2011 | | | 2010 | | | 2009 | | | 2008 | | | 2007 | |
| | | (Dollars in thousands, except per share data) | |
Statement of Operations Data: | | | | | | | | | | | | | | | | | | | | |
Total revenue | | $ | 67,781 | | | $ | 69,898 | | | $ | 121,534 | | | $ | 97,051 | | | $ | 73,164 | |
(Loss) income from operations | | | (17,518 | ) | | | (14,053 | ) | | | 57,501 | | | | 27,261 | | | | 9,899 | |
Net (loss) income | | | (12,778 | ) | | | (21,089 | ) | | | 37,550 | | | | 14,739 | | | | 3,347 | |
Diluted net (loss) income per share | | | (0.73 | ) | | | (1.21 | ) | | | 2.15 | | | | 0.80 | | | | 0.18 | |
Balance Sheet Data: | | | | | | | | | | | | | | | | | | | | |
Cash, short-term and long-term investments | | $ | 68,197 | | | $ | 56,786 | | | $ | 47,868 | | | $ | 71,978 | | | $ | 70,225 | |
Total assets | | | 162,654 | | | | 170,279 | | | | 185,562 | | | | 191,028 | | | | 171,331 | |
Retained earnings | | | 70,122 | | | | 82,900 | | | | 103,989 | | | | 66,439 | | | | 51,620 | |
Total stockholders’ equity | | | 145,336 | | | | 154,359 | | | | 172,372 | | | | 141,806 | | | | 130,922 | |
Statement of Cash Flows Data: | | | | | | | | | | | | | | | | | | | | |
Net cash provided by operating activities | | $ | 19,955 | | | $ | 22,008 | | | $ | 31,321 | | | $ | 39,822 | | | $ | 50,715 | |
As noted previously, the Pharma Sale closed subsequent to our fiscal year ended September 30, 2011 and therefore the selected financial data presented above includes all SurModics Pharmaceuticals historical data since its acquisition in July 2007.
| |
| ITEM 7. | MANAGEMENT’S DISCUSSION AND ANALYSIS OF FINANCIAL CONDITION AND RESULTS OF OPERATIONS. |
The following discussion and analysis of our financial condition, results of operations and trends for the future should be read together with “Selected Financial Data” and our audited consolidated financial statements and related notes appearing elsewhere in this report. Any discussion and analysis regarding trends in our future financial condition and results of operations are forward-looking statements that involve risks, uncertainties and assumptions, as more fully identified in “Forward-Looking Statements” and “Risk Factors.” Our actual future financial condition and results of operations may differ materially from those anticipated in the forward-looking statements.
SurModics is a leading provider of drug delivery and surface modification technologies to the healthcare industry. As further discussed in Item 1Overview — Recent Sale of Pharmaceuticals Business, in December 2010 we announced that the Board of Directors of the Company had authorized the Company to explore strategic alternatives for our Pharmaceuticals business, including a potential sale of that business. This decision by the Board reflected our focus on returning the Company to profitable growth, and our renewed commitment to pursuing growth opportunities and investments in our Medical Device and In MarchVitro Diagnostics businesses. On November 1, 2011, we entered into a Purchase Agreement to sell substantially all of the assets of SurModics Pharmaceuticals to Evonik. The Pharma Sale closed on November 17, 2011. The total consideration received
from the sale was $30.0 million in cash. Of the total consideration, $3.275 million was placed in escrow at closing for any inventory shortfall and the payment of certain contingent consideration obligations related to our acquisition of SurModics Pharmaceuticals in July 2007.
Because the Pharma Sale closed subsequent to our fiscal year ended September 30, 2011, the discussion for all fiscal years includes our Pharmaceuticals segment results as reported. We will report the Pharmaceuticals segment as discontinued operations beginning in the first quarter of fiscal 2012, as disclosed in Note 1 to the consolidated financial statements.
In October 2010, we announced a change in our operational structure to better align functional expertise, which resulted in the elimination of the Company’s business units.
The organizational change did not diminish the Company’s continued market focus. The “Therapeutic” market includes revenue from: (1) Cardiovascular, which provides drug delivery and surface modification technologies to customers in the cardiovascular market; (2) Ophthalmology, which is focused on the advancement of treatments for eye diseases, such as age-related macular degeneration (AMD) and diabetic macular edema (DME), two of the leading causes of blindness; and (3) Other Markets, which is focused on a variety of clinical markets principally in the pharmaceutical and biotechnology industries. The “Diagnostic” market includes revenue from the Company’s microarray slide technologies, our stabilization products, antigens and substrates for immunoassay diagnostic tests, and ourin vitrodiagnostic format technology.
In October 2010, we announced initiatives intended to reduce our cost structure. As part of these initiatives, the Company implemented a change in its organizational structure
to reflect ourmoving from a functional structure into one consisting of three
complementary, but distinct business units: Medical Device, Pharmaceuticals, and In Vitro Diagnostics.
BecauseWe believe this
structure improves the visibility, marketing and adoption of the Company’s broad array of technologies within specific markets and helps our customers in the medical device, pharmaceutical and life science industries better solve unmet clinical needs.The October 2010 organizational change occurredresulted in fiscal 2011the Company presenting revenue and operating results according to its three segments, as follows: (1) the Medical Device unit, which is therefore not usefulcomprised of surface modification coating technologies to improve access, deliverability, and predictable deployment of medical devices, as well as drug delivery coating technologies to provide site-specific drug delivery from the surface of a medical device. End markets include coronary, peripheral, and neuro-vascular, and urology, among others; (2) the Pharmaceuticals unit, which incorporates a broad range of drug delivery technologies for injectable therapeutics, including microparticles, nanoparticles, and implants addressing a range of clinical applications including ophthalmology, oncology, dermatology and neurology, among others. Based in explainingBirmingham, Alabama, the Pharmaceuticals business includes our fiscal 2010 results, we will describe our business below as it was conducted in fiscal 2010. Beginning withcGMP manufacturing facility; and (3) the first quarterIn Vitro Diagnostics unit, which consists of fiscal 2011, we will describe our business under the new reporting structure.
30
Our revenue is derived from three primary sources: (1) royalties and license fees from licensing our proprietary drug delivery and surface modification technologies andin vitrodiagnostic formats to customers; the vast majority (typically in excess of 90%) of revenue in the “royalties and license fees” category is in the form of royalties; (2) the sale of polymers and reagent chemicals, stabilization products, antigens, substrates and microarray slides to the diagnostics and biomedical research industry; and (3) research and development fees generated on customer projects. Revenue fluctuates from quarter to quarter depending on, among other factors: our customers’ success in selling products incorporating our technologies; the timing of introductions of licensed products by customers; the timing of introductions of products that compete with our customers’ products; the number and activity level associated with customer development projects; the number and terms of new license agreements that are finalized; the value of reagent chemicals and other products sold to customers; and the timing of future acquisitions we complete, if any.
For financial accounting and reporting purposes, we report our results in onefor the three reportable segment.segments noted above. We made this determination becausebased on how we manage our salesoperations and marketing efforts andthe information provided to our expenses on a company-wide basis. In addition, a significant percentage ofchief operating decision maker who is our employees provide support services (including research and development) to a variety of customers, and our technologies and products are marketed to the same or similar customers.
Chief Executive Officer.In June 2007, we entered into a License and Research Collaboration Agreement and separate Supply Agreement with Merck & Co., Inc. (“Merck”) related to our I-vationtm™ TA (triamcinolone acetonide) intravitreal implant. Under the terms of the Merck agreements, we received an upfront license fee of $20$20.0 million and were eligible to receive up to an additional $288$288.0 million in fees and development milestones associated with the successful product development and attainment of appropriate U.S. and EU regulatory approvals, as well as payment for our research and development activities. In September 2008, following a strategic review of itsMerck’s business and product development portfolio, Merck gave notice to SurModics that it was terminating the collaborative researchlicense and licenseresearch agreement, as well as the supply agreement entered into in June 2007. This decision was not based on any concerns about the safety or efficacy of the I-vation system. The termination was effective in December 2008, and we have recognized revenue related to the termination of approximately $45$45.0 million in fiscal 2009, principally from amounts that previously had
been deferred and amortized under the accounting treatment required by accounting guidance for revenue arrangements with multiple deliverables. The $45$45.0 million includesincluded a $9$9.0 million milestone payment from Merck associated with the termination of the triamcinolone acetonide development program.
Overview of Research and Development Activities
We manage our customer-sponsored R&D programs (“Customer R&D”), based largely on the requirements of our customers. In November 2008, we acquiredthis regard, our customers typically establish the various measures and metrics that are used to monitor a portfolio of intellectual propertyprogram’s progress, including key deliverables, milestones, timelines, and collaborative drug delivery projects from PRan overall program budget. The customer is ultimately responsible for deciding whether to continue or terminate a program, and does so based on research results (relative to the above measures and metrics) and other factors, including their own strategic and/or business priorities. Customer R&D programs are mainly in our Medical Device and Pharmaceuticals Inc., a drug delivery company specializing in injectable, biodegradable sustained release formulations. Total consideration paid through September 30, 2010 was $5.6 million and PR Pharmaceuticals, Inc. is eligible to receive up to an additional $3.6 million in cash upon successful achievement of specified milestones. The proprietary technologies we acquired complement and enhance our existing portfolio of drug delivery capabilities by providing a broader toolkit for protein deliverysegments and the abilityprocesses do not differ significantly.
For our internal R&D programs (included in “Other R&D”) in our three segments, we utilize R&D review committees to use smaller gauge needles for microparticle injections.
On October 5, 2009, we entered intoprioritize these programs based on a
Licensenumber of factors, including a program’s strategic fit, commercial impact, potential competitive advantage, technical feasibility, and
Development Agreement with F. Hoffmann-La Roche, Ltd. (“Roche”)the amount of investment required. The measures and
Genentech, Inc.,metrics used to monitor a
memberprogram’s progress varies based on the program, and typically includes many of the
Roche Group (“Genentech”). Undersame factors discussed above with respect to our Customer R&D programs. We typically make decisions to continue or terminate a program based on research results (relative to the
termsabove measures and metrics) and other factors, including our own strategic and/or business priorities, and the amount of additional investment required.With respect to cost components, R&D expenses in each of our three segments consist of labor, materials and overhead costs (utilities, depreciation, indirect labor, etc.) for both Customer R&D and Other R&D programs. We manage our R&D organization in a flexible manner, balancing workloads/resources between Customer R&D and Other R&D programs primarily based on the level of customer program activity. Therefore, costs incurred for Customer R&D and Other R&D can shift as customer activity increases or decreases. As a result of the License Agreement, Rocherecent economic conditions, some customers have delayed, slowed or cancelled development projects, which has affected the R&D expense mix between Customer R&D and Genentech will have an exclusive license to develop and commercialize a sustained drug delivery formulation of Lucentis® (ranibizumab injection) utilizing SurModics’ proprietary biodegradable microparticles drug delivery system. Under the terms of the agreement, we received an upfront licensing fee of $3.5 million and are eligible to receive potential payments of up to approximately $200 million in fees and milestone payments in the event of the successful development and commercialization of multiple products, as well as payment for development work done on these products. Roche and Genentech will have the right to obtain manufacturing services from SurModics. In the event a commercial product is developed, we will also receive royalties on sales of such product.
Other R&D.Critical Accounting Policies
The discussion and analysis of our financial condition and results of operations is based upon our consolidated financial statements, which have been prepared in accordance with accounting principles generally accepted in the
31
United States of America. U.S. (“GAAP”). The preparation of these financial statements is based in part on the application of significant accounting policies, many of which require management to make estimates and assumptions (see Note 2 to the consolidated financial statements). Actual results may differ from these estimates under different assumptions or conditions and could materially impact our results of operations. We believe the following are critical areas in the application of our accounting policies that currently affect our financial condition and results of operations.
Revenue recognition. In accordance with accounting guidance, revenue is recognized when all of the following criteria are met: (1) persuasive evidence of an arrangement exists; (2) shipment has occurred or delivery has occurred if the terms specify destination; (3) the sales price is fixed or determinable; and (4) collectability is reasonably assured. However, whenWhen there are additional performance requirements, revenue is recognized when all such requirements have been satisfied. Under revenue arrangements with multiple deliverables, the Company recognizes each separable deliverable as it is earned. The Company licenses technology to third parties and collects royalties. Royalty revenue is generated when a customer sells products incorporating the Company’s licensed technologies. Royalty revenue is recognized as our licensees report it to us, and payment is typically submitted concurrently with a quarterlythe report. This revenue recognition model is similar to usage fee accounting. Minimum royalty fees are recognized in the period earned, provided that collectability is reasonably assured. For stand-alone license agreements, up-front license fees are recognized over the economic lifeterm of the technology.
related licensing agreement. Minimum royalty fees are recognized in the period earned.Revenue related to a performance milestone is recognized upon the achievement of the milestone and meeting specific revenue recognition criteria. Product sales to third parties are recognized at the time of shipment, provided that an order has been received, the price is fixed or determinable, collectability of the resulting receivable is reasonably assured and returns can be reasonably estimated. Our sales terms provide no right of return outside of our standard warranty policy. Payment terms are generally set at30-45 days. Generally, revenue for research and development is recorded as performance progresses under the applicable contract.
Revenue arrangements with multiple deliverables have been accounted for based on accounting guidance in existence at the time the arrangement commences. Prior to October 1, 2009, arrangements such as license and development agreements were analyzed to determine whether the deliverables, which often include a license and performance obligations such as research and development, could be separated, or whether they must be accounted for as a single unit of accounting in accordance with accounting guidance. If the fair value of the undelivered performance obligations could be determined, such obligations would then be accounted for separately. If the license was considered to either (i) not have stand-alone value or (ii) have stand-alone value but the fair value of any of the undelivered performance obligations could not be determined, the arrangement would then be accounted for as a single unit of accounting, and the license payments and payments for performance obligations would be recognized as revenue over the estimated period of when the performance obligations are performed, or the economic life of the technology licensed to the customer. When we determined that an arrangement should be accounted for as a single unit of accounting, we recognized the related revenue on a time-based accounting model.
The Company had one significant multiple element arrangement prior to October 1, 2009 that was accounted for as a single unit of accounting resulting in deferral and recognition of all related payments received for license and research and development activities using a time-based model. This arrangement was terminated during the first quarter of fiscal 2009.
In October 2009, the FASB amended the accounting standards for multiple deliverable revenue arrangements were amended to:
(i) provide updated guidance on whether multiple deliverables exist, how the deliverables in an arrangement should be separated, and how the consideration should be allocated;
(ii) require an entity to allocate revenue in an arrangement using estimated selling prices (ESP)(“ESP”) of deliverables if a vendor does not have vendor-specific objective evidence of selling price (VSOE)(“VSOE”) or third-party evidence of selling price (TPE)(“TPE”); and
(iii) eliminate the use of the residual method and require an entity to allocate revenue using the relative selling price method.
We elected to early adopt this accounting guidance at the beginning of our first quarter of fiscal 2010, on a prospective basis, for applicable transactions originating or materially modified on or after October 1, 2009. In connection with the adoption of the amended accounting standard we also changed our policy prospectively
32
for multiple element arrangements, whereby we account for revenue using a multiple attribution model in which consideration allocated to research and development activities is recognized as performed, and milestone payments are recognized when the milestone events are achieved, when such activities and milestones are deemed substantive. Accordingly, in situations where a unit of accounting includes both a license and research and development activities, and when a license does not have stand-alone value, the Company applies a multiple attribution model in which consideration allocated to the license is recognized ratably, consideration allocated to research and development activities is recognized as performed and milestone payments are recognized when the milestone events are achieved, when such activities and milestones are deemed substantive.
The Company enters into license and development arrangements that may consist of multiple deliverables which could include a license(s) to SurModics’ technology, research and development activities, manufacturing services, and product sales based on the needs of its customers. For example, a customer may enter into an arrangement to obtain a license to SurModics’ intellectual property which may also include research and development activities, and supply of products manufactured by SurModics. For these services provided, SurModics could receive upfront license fees upon signing of an agreement and granting the license, fees for research and development activities as such activities are performed, milestone payments contingent upon advancement of the product through development and clinical stages to successful commercialization, fees for manufacturing services and supply of product, and royalty payments based on customer sales of product incorporating SurModics’ technology. Our license and development arrangements generally do not have refund provisions if the customer cancels or terminates the agreement. Typically all payments made are non-refundable.
WeUnder the accounting guidance, we are still required to evaluate each deliverable in a multiple element arrangement for separability. We are then required to allocate revenue to each separate deliverable using a hierarchy of VSOE, TPE, or ESP. In certainmany instances, we are not able to establish VSOE for all deliverables in an arrangement with multiple elements which may be a result of SurModics infrequently selling each element separately.separately or having a limited history with multiple element arrangements. When VSOE cannot be established, SurModics establishesattempts to establish a selling price of each element based on TPE. TPE is determined based on competitor prices for similar deliverables when sold separately.
When we are unable to establish a selling price using VSOE or TPE, we use ESP in our allocation of arrangement consideration. The objective of ESP is to determine the price at which SurModics would transact a sale if the product or service were sold on a stand-alone basis. ESP is generally used for highly customized offerings.
SurModics determines ESP for undelivered elements by considering multiple factors including, but not limited to, market conditions, competitive landscape and past pricing arrangements with similar characteristics.
features. The determination of ESP is made through consultation with the Company’s management, taking into consideration the marketing strategies for each business unit.Costs related to products and services delivered are recognized in the period revenue is recognized except for services related to the Merck agreement, which have beenwere recognized as incurred. Customer advances are accounted for as a liability until all criteria for revenue recognition have been met.
Valuation of long-lived assets. Accounting guidance requires us to periodically evaluate whether events and circumstances have occurred that may affect the estimated useful life or the recoverability of the remaining balance of long-lived assets, such as property and equipment and intangibles. If such events or circumstances were to indicate that the carrying amount of these assets wouldmay not be recoverable, we would estimate the future cash flows expected to result from the use of the assets and their eventual disposition. If the sum of the expected future cash flows (undiscounted and without interest charges) or other measure of fair value were less than the carrying amount of the assets, we would recognize an impairment charge.
charge to reduce such assets to their fair value.In the fourth quarter of fiscal 2011, we recognized asset impairment charges totaling $17.9 million associated with our Pharmaceuticals segment. We wrote down long-lived assets (fixed assets of $14.8 million and intangibles of $3.1 million), associated with our Pharmaceuticals segment, based on the current valuation of the assets relative to their carrying value. The Company had been exploring strategic alternatives for the Pharmaceuticals segment, including a potential sale. The assets of the Pharmaceuticals business did not qualify as held-for-sale as of September 30, 2011, because we had not committed to a plan to sell at that time. However, our assessment of options available as of September 30, 2011 resulted in a probability-weighted value of expected future cash flows below the carrying value of these assets, which required us to determine the fair value of the long-lived assets of the Pharmaceuticals segment using the probability-weighted value of the expected future cash flows. Asset impairment charges of $17.9 million were recognized based on this assessment. Subsequently, the Company sold substantially all of its Pharmaceuticals assets for $30.0 million on November 17, 2011. See Note 1 to the consolidated financial statements for further information regarding the sale of SurModics Pharmaceuticals.
In fiscal 2010, we recognized asset impairment charges totaling $4.9 million. We wrote down facility-related assets in Alabama by $1.9 million to their fair value based on a decision to sell the assets, however based on further analysis of various factors associated with the consolidation of facilities we later decided not to sell the facility. The carrying value of the facility iswas $2.1 million at September 30, 2010, which iswas based on a real estate appraisal obtained during our negotiations. We also wrote down certain project- and technology-related assets totaling $1.7 million, as there were very limitedno ongoing business opportunities expected in light of current market conditions and general economic environment. SurModics also incurredrecognized a charge of $1.3 million associated with certain construction-in-progress fixed assets in Minnesota, given the current level of business activity and overall economic conditions. Each of these events included analysis of expected future cash flows or real estate market
data which was compared towith the carrying values of the assets to
33
determine the impairment charges that were recognized. The assets associated with these charges had limited remaining value and as such were written down to zero value at September 30, 2010.
Goodwill. We record all assets and liabilities acquired in purchase acquisitions, including goodwill, at fair value as required by accounting guidance for business combinations. The initial recognition of goodwill requires management to make subjective judgments concerning estimates of how the acquired assets will perform in the future using valuation methods including discounted cash flow analysis.
Goodwill is not amortized but is subject, at a minimum, to annual tests for impairment in accordance with accounting guidance for goodwill. Under certain situations, interim impairment tests may be required if events occur or circumstances change that would more likely than not reduce the fair value of a reporting unit below its carrying amount.
Evaluating goodwill for impairment in fiscal 2011 was based on new goodwill accounting guidance which was early adopted by SurModics in the fourth quarter of fiscal 2011. The new accounting guidance involves assessment of qualitative factors to determine whether the existence of events or circumstances leads to a determination that it is more likely than not that the fair value of a reporting unit is less than its carrying amount. If, after assessing the totality of events or circumstances, an entity determines it is not more likely than not that the fair value of a reporting unit is less than its carrying amount, then performing the two-step impairment test becomes unnecessary.
Evaluating goodwill for impairment involves the determination of the fair value of our reporting units in which we have recorded goodwill. A reporting unit is a component of an operating segment for which discrete financial information is available and reviewed by management on a regular basis.
We have determined that our reporting units are our SurModics Pharmaceuticals Inc. (SurModics Pharma) subsidiary, the In Vitro Diagnostics operations known as our In Vitro Diagnostics reporting unit which contains the BioFX branded products, and the SurModics drug delivery and hydrophilic coatings operations. The Company reorganized in March 2010 which resulted in the elimination of the Company’soperations known as our Medical Device business units.unit. The reporting units with goodwill resulted from the acquisitions of SurModics PharmaPharmaceuticals and BioFX Laboratories, Inc.SurModics IVD in fiscal 2007. Inherent in the determination of fair value of our reporting units are certain estimates and judgments, including the interpretation of current economic indicators and market valuations as well as our strategic plans with regard to our operations.
The $8.0 million of goodwill at September 30, 2011 is related to the In Vitro Diagnostics reporting unit. We performed our annual impairment test of goodwill as of August 31, 2011, and did not record any goodwill impairment charges as there were no indicators of impairment associated with the In Vitro Diagnostics reporting unit.
We recognized a goodwill impairment charge of $5.7 million in the first quarter of fiscal 2011 associated with our SurModics Pharmaceuticals reporting unit. Two milestone events were achieved associated with the July 2007 acquisition of SurModics Pharmaceuticals and $5.7 million of additional purchase price was recorded as an increase to goodwill. During our annual test of goodwill in the fourth quarter of fiscal 2010, we determined the goodwill related to our SurModics Pharmaceuticals reporting unit was fully impaired and we recognized a non-cash goodwill impairment charge of $13.8 million, which represented a full impairmentmillion. There had been no substantial changes in operating results for SurModics Pharmaceuticals in the first quarter of fiscal 2011 when compared with fiscal 2010, and as such we concluded that the goodwill associated with our SurModics Pharma reporting unit. the milestone events was fully impaired.
Prior to testing goodwill for impairment in fiscal 2010, we tested our definite-lived assets, property plant and equipment as well as intangible assets, under the provisions of the accounting guidance for impairment or disposal of long-lived assets, and determined that there were no impairments of these assets. We did not record any goodwill impairment charges during fiscal 2009 or 2008.
The goodwill impairment in fiscal 2010 reflected a significant decline in the estimated fair value of our reporting units, mainly our SurModics Pharmaceuticals reporting unit, which resulted from a slowdown in
business activity which was most pronounced in the fourth quarter of fiscal 2010, higher operating costs with our recently placed in-service cGMP manufacturing facility, and a significant decrease in our stock price during the year.fiscal 2010. Our stock price declined from $24.13 per share at October 1, 2009 to $12.03 per share at the date of our annual impairment test, which was August 31, 2010. While we continually evaluateevaluated whether any indications of impairment are present that would require an impairment analysis on an interim basis, no such indicators were considered present prior to the fourth quarter of fiscal 2010. Prior to the fourth quarter, based on our outlook for future results and the fact that our market capitalization exceeded our book value by a margin of 64% at June 30, 2010, we did not believe that the events and circumstances in existence at our interim reporting dates indicated that it was more likely than not that the fair value of any of our reporting units would be less than its carrying amount.
In evaluating whether goodwill was impaired in fiscal 2010, we compared the fair value of the reporting units to which goodwill is assigned to their carrying values (Step 1 of the impairment test). In calculating fair value, we used the income approach as our primary indicator of fair value, with the market approach used as a test of reasonableness. The income approach is a valuation technique under which we estimate future cash flows using the reporting units’ financial forecasts. Future estimated cash flows are discounted to their present value to calculate fair value. The market approach establishes fair value by comparing our company to other publicly traded guideline companies or by analysis of actual transactions of similar businesses or assets sold. The income approach is tailored to the circumstances of our business, and the market approach is completed as a secondary test to ensure that the results of the income approach are reasonable and in line with comparable companies in the industry. The summation of our reporting units’ fair values was compared and reconciled to our market capitalization as of the date of our impairment test.
In the situation where a reporting unit’s carrying amount exceeds its fair value, the amount of the impairment loss must be measured. The measurement of the impairment (Step 2 of the impairment test) is calculated by determining the implied fair value of a reporting unit’s goodwill. In calculating the implied fair value of goodwill,
34
the fair value of the reporting unit is allocated to all other assets and liabilities of that unit based on their fair values. The excess of the fair value of a reporting unit over the amount assigned to its other assets and liabilities is the implied fair value of goodwill. The goodwill impairment is measured as the excess of the carrying amount of goodwill over its implied fair value.
In determining the fair value of our SurModics PharmaPharmaceuticals reporting unit under the income approach, ourthe expected cash flows areof SurModics Pharmaceuticals were affected by various assumptions. Fair value on a discounted cash flow basis used forecasts over a ten yearten-year period with an estimation of residual growth rates thereafter. We useused our business plans and projections as the basis for expected future cash flows. The most significant assumptions incorporated in these forecasts for the most recentfiscal 2010 goodwill impairment teststest included annual revenue changes based on then current customer programs and expected progression of these programs into different phases of development. A discount rate of 15 percent15% was used in the fiscal 2010 analysis to reflect the relevant risks of the higher growth assumed for this reporting unit. Given the significant difference between the reporting unit’s fair value and carrying value, any change in the discount rate would not have changed the evaluation of impairment.
In estimating the fiscal 2010 fair value of our company under the market approach, we considered the relative merits of commonly applied market capitalization multiples based on the availability of data. Based on our analysis, we utilized the guideline public company method to support the valuation of the reporting units.
units in fiscal 2010.Based on the goodwill analysis performed as of August 31, 2010, the $13.8 million of goodwill in the SurModics PharmaPharmaceuticals reporting unit failed Step 1 of the impairment test, and Step 2 of the impairment test indicated that goodwill was fully impaired. We also anticipate that this reporting unit may achieve additional milestone obligations of $5.7 million in fiscal 2011 and we may record a goodwill impairment charge for this amount in fiscal 2011. The indicated excess in fair value over carrying value of the Company’s In Vitro Diagnostics reporting unit in Step 1 of the impairment test at August 31, 2010 was approximately 82% and as such the $8.0 million of goodwill related to this reporting unit iswas not impaired. To the extent that actual results or other assumptions about future economic conditions or potential for our growth and profitability in this business changes,changed, it is possible that our conclusion regarding the goodwill could change, which could have a material effect on our financial position and results of operations. The SurModics drug
delivery and hydrophilic coatings operations doesdo not have any goodwill and waswere included in the fiscal 2010 analysis to assist in reconciling the fair value of all reporting units to the Company’s market capitalization at August 31, 2010. See Note 2 to the consolidated financial statements for further information.
We did not record any goodwill impairment charges during fiscal 2009.
Investments. Investments consist principally of U.S. government and government agency obligations and mortgage-backed securities and are classified asavailable-for-sale orheld-to-maturity at September 30, 2010.2011. Our investment policy calls for no more than 5% of investments be held in any one credit issue, excluding U.S. government and government agency obligations.Available-for-sale investments are reported at fair value with unrealized gains and losses excluded from operations and reported as a separate component of stockholders’ equity, except forother-than-temporary impairments, which are reported as a charge to current operations and result in a new cost basis for the investment. Our evaluation of theavailable-for-sale investments resulted in no loss recognition in fiscal 2011, 2010 andor 2009. Investments for which management has the intent and ability to hold to maturity are classified asheld-to-maturity and reported at amortized cost. If there was another-than-temporary impairment in the fair value of any individual security classified asheld-to-maturity, the Company would write down the security to fair value with a corresponding adjustment to other income (loss). Interest on debt securities, including amortization of premiums and accretion of discounts, is included in other income (loss). Realized gains and losses from the sales of debt securities, which are included in other income (loss), are determined using the specific identification method. See Notes 2 and 3 to the consolidated financial statements for further information.
Income tax accruals and valuation allowances. When preparing the consolidated financial statements, we are required to estimate the income tax obligations in each of the jurisdictions in which we operate. This process involves estimating the actual current tax obligations based on expected income, statutory tax rates and tax planning opportunities in the various jurisdictions. In the event there is a significant unusual or one-time item recognized in the results of operations, the tax attributable to that item would be separately calculated and recorded in the period the unusual or one-time item occurred. Tax law requires certain items to be included in our tax return at different times than the items are reflected in our results of operations. As a result, the annual effective tax rate reflected in
35
our results of operations is different than that reported on our tax return (i.e., our cash tax rate). Some of these differences are permanent, such as expenses that are not deductible in our tax return, and some are temporary differences that will reverse over time, such as depreciation expense on capital assets. These temporary differences result in deferred tax assets and liabilities, which are included in our consolidated balance sheets. Deferred tax assets generally represent items that can be used as a tax deduction or credit in our tax returns in future years, for which we have already recorded the expense in our consolidated statements of operations. We must assess the likelihood that our deferred tax assets will be recovered from future taxable income, and to the extent we believe that recovery is not likely, we must establish a valuation allowance against those deferred tax assets. Deferred tax liabilities generally represent items for which we have already taken a deduction in our tax return, but we have not yet recognized the items as expense in our results of operations. Significant judgment is required in evaluating our tax positions, and in determining our provision for income taxes, our deferred tax assets and liabilities and any valuation allowance recorded against our deferred tax assets. We had total deferred tax assets in excess of total deferred tax liabilities of $9.4 million as of September 30, 2011 and $2.9 million as of September 30, 2010, and 2009, including valuation allowances of $7.7 million as of September 30, 2011 and $6.5 million as of September 30, 2010 and $3.3 million as of September 30, 2009.2010. The valuation allowances related to impairment losses on investments were recorded because the Company does not currently foresee future capital gains within the allowable carry-forwardcarryforward and carry-backcarryback periods to offset these capital losses when they are recognized. As such, no tax benefit has been recorded in the consolidated statements of income.operations. In addition, we recorded a valuation allowance related to state net operating losses based on the uncertainty regarding the realization of the net operating losses in the carryforward periods.
The Company adopted accounting provisions on October 1, 2007 which defined new standards for recognizing the benefits of tax return positions in the financial statements as “more-likely-than-not” to be sustained by the taxing authorities based solely on the technical merits of the position. If the recognition threshold is met, the tax
benefit is measured and recognized as the largest amount of tax benefit that, in our judgment, is greater than 50 percent50% likely to be realized. The total gross amount of unrecognized tax benefits as of September 30, 2011, 2010 and 2009 and 2008 was $1.7 million, $1.9 million $2.0 million and $1.5$2.0 million, respectively, excluding accrued interest and penalties. Of these unrecognized tax benefits, $1.7 million, $1.9 million $2.0 million and $1.5$2.0 million would affect our effective tax rate for fiscal years2011, 2010 2009 and 2008,2009, respectively. Interest and penalties recorded for uncertain tax positions are included in our income tax provision. As of September 30, 2011, 2010 and 2009, and 2008,$0.8 million, $0.7 million $0.6 million and $0.4$0.6 million, respectively, of interest and penalties were accrued, excluding the tax benefits of deductible interest. The Internal Revenue Service has(“IRS”) commenced an examination of our United StatesU.S. income tax return for fiscal 2010 in the first quarter of fiscal 2012. The IRS completed an examination of our U.S. income tax return for fiscal 2009 and a payment was made in the firstthird quarter of fiscal 2011. Fiscal years2011 associated with timing adjustments. U.S. income tax returns for fiscal 2007 and 2008 remain subject to examination by federal tax authorities. Tax returns for state and local jurisdictions for fiscal years 2003 through 20092010 remain subject to examination by state and local tax authorities. In the event that we have determined not to file tax returns with a particular state or local jurisdiction, all years remain subject to examination by the tax authorities. The ultimate outcome of tax matters may differ from our estimates and assumptions. Unfavorable settlement of any particular issue would require the use of cash and could result in increased income tax expense. Favorable resolution could result in reduced income tax expense. Within the next 12 months, we do not expect that our unrecognized tax benefits will change significantly. See Note 8 to the consolidated financial statements for further information regarding changes in unrecognized tax benefits during fiscal 2011, 2010 2009 and 2008.
36
Use of Non-GAAP Financial Information.In addition to disclosing financial results in accordance with GAAP, this report includes certain non-GAAP financial results including non-GAAP operating income (or loss). We believe these non-GAAP measures provide meaningful insight into our operating performance, excluding certain event-specific charges, and provide an alternative perspective of our results of operations. We use non-GAAP measures, including certain of those set forth in this report, to assess our operating performance and to determine payout under our executive compensation programs. We believe that presentation of certain non-GAAP measures allows investors to review our results of operations from the same perspective as management and our Board of Directors and facilitates comparisons of our current results of operations. The method we use to produce non-GAAP results is not in accordance with GAAP and may differ from the methods used by other companies. Non-GAAP results should not be regarded as a substitute for corresponding GAAP measures but instead should be utilized as a supplemental measure of operating performance in evaluating our business. Non-GAAP measures do have limitations in that they do not reflect certain items that may have a material impact upon our reported financial results. As such, these non-GAAP measures presented should be viewed in conjunction with our consolidated financial statements prepared in accordance with GAAP.
Results of Operations
Years Ended September 30, 20102011 and 20092010
| | | | | | | | | | | | | | | | | |
| | | Fiscal
| | | Fiscal
| | | Increase/
| | | | |
(Dollars in thousands) | | 2010 | | | 2009 | | | (Decrease) | | | % Change | |
| |
| Revenue: | | | | | | | | | | | | | | | | |
| Therapeutic | | | | | | | | | | | | | | | | |
| Cardiovascular | | $ | 40,155 | | | $ | 39,841 | | | $ | 314 | | | | 1 | % |
| Ophthalmology | | | 7,617 | | | | 52,102 | | | | (44,485 | ) | | | (85 | )% |
| Other Markets | | | 10,932 | | | | 13,114 | | | | (2,182 | ) | | | (17 | )% |
| | | | | | | | | | | | | | | | | |
| Total Therapeutic | | | 58,704 | | | | 105,057 | | | | (46,353 | ) | | | (44 | )% |
| Diagnostic | | | 11,194 | | | | 16,477 | | | | (5,283 | ) | | | (32 | )% |
| | | | | | | | | | | | | | | | | |
| Total revenue | | $ | 69,898 | | | $ | 121,534 | | | $ | (51,636 | ) | | | (42 | )% |
| | | | | | | | | | | | | | | | | |
| | | | | | | | | | | | | | | | |
(in thousands) | | Fiscal
2011 | | | Fiscal
2010 | | | Increase/
(Decrease) | | | % Change | |
Revenue: | | | | | | | | | | | | | | | | |
Medical Device | | $ | 39,576 | | | $ | 43,211 | | | $ | (3,635 | ) | | | (8 | )% |
Pharmaceuticals | | | 15,055 | | | | 15,493 | | | | (438 | ) | | | (3 | )% |
In Vitro Diagnostics | | | 13,150 | | | | 11,194 | | | | 1,956 | | | | 17 | % |
| �� | | | | | | | | | | | | | | | |
Total revenue | | $ | 67,781 | | | $ | 69,898 | | | $ | (2,117 | ) | | | (3 | )% |
| | | | | | | | | | | | | | | | |
Revenue. Fiscal 20102011 revenue was $69.9$67.8 million, a decrease of $51.6$2.1 million, or 42%3%, from fiscal 2009.2010. The decreases in Therapeutic and Diagnosticabove table provides a summary of each operating segment’s revenue as detailed in the table above, are further explained inwith the narrative below.
that follows providing additional explanations.Therapeutic.Medical Device. Revenue in TherapeuticMedical Device was $58.7$39.6 million in fiscal 2010, a 44%2011, an 8% decrease compared with $105.1$43.2 million in the prior-year period. The decrease in total revenue principally reflectsreflected lower license fees and royalties as well as lower R&D revenue, partially offset by higher product sales. Fiscal 2010 included $1.3 million in license fee revenue that was one-time in nature.
In fiscal 2011, we had a $2.7 million decrease, or 37%, in royalty revenue from Cordis, compared with the recognition in fiscal 2009 of revenueprior-year period. Growth of approximately $45 million associated with4% in royalty revenue from our hydrophilic coating license agreements was not strong enough to offset the Merck collaborative research and license agreement, which was terminated effectivedecrease in the first quarter of fiscal 2009. Excluding this significant event-specific itemroyalty revenue from Cordis.
As we have disclosed in fiscal 2009, Therapeutic revenue decreased $1.4 million, or 2%.
Cardiovascular derivesprevious filings, Medical Device has derived a substantial amount of revenue from royalties and license fees and product sales attributable to Cordis, Corporation, a Johnson & Johnson company, on its CYPHER® Sirolimus-eluting Coronary Stent. The CYPHER® stent incorporates a proprietary SurModics polymer coating that delivers a therapeutic drug designed to reduce the occurrence of restenosis in coronary artery lesions. The CYPHER® stent faces continuing competition from Boston Scientific, Medtronic, and Abbott Laboratories. Stents from these companies compete directly withAbbott. In June 2011, Cordis announced the cessation of the manufacture of the CYPHER® stent both domestically and internationally.CYPHER SELECT® Plus stents by the end of 2011. In July 2011, Cordis notified the Company of its intention to terminate the exclusivity arrangements under the license agreement, which also results in a termination of the minimum quarterly royalty requirements beginning in the first quarter of fiscal 2012. For the last several years, royalty revenue and reagent product sales have decreased due toas a result of lower CYPHER® stent sales. We anticipatesales, and we had anticipated that royalty revenue from the CYPHER® stent are likely stents would continue to descreasedecrease in fiscal 2011 and beyond asuntil it reached minimum royalty levels per the various marketers of drug-eluting stents compete, and as others enter the marketplace. We also receive a royalty on sales of delivery systems used to deliver the Medtronic Endeavor® and Endeavor® Resolute drug-eluting stents. These stent delivery systems incorporate our proprietary hydrophilic technology and are sold in the United States and internationally.
Cardiovascular revenue increased $0.3 million, or 1%, in fiscal 2010, compared with the prior-year principally as a result of higher license fees which included recognition of fees of $1.25 million associated with a terminated agreement, and higher reagent product sales, partially offset by lower research and development revenue. Cordis CYPHER® stent sales decreased approximately 26% during fiscal 2010 which resulted in lower royalty revenue from this agreement.
Ophthalmology revenue decreased $44.5 million, or 85%, in fiscal 2010, compared with the prior-year. The significant decrease relates to the recognition of previously deferred revenue associated with the terminated collaborative research and license agreement with MerckCordis. The decline in CYPHER® stent sales in fiscal 2009. In September 2008, following a strategic review2011 resulted in SurModics recognizing minimum quarterly royalty income of Merck’s business$1.0 million for the third and product development portfolio, Merck gave notice that it was terminatingfourth quarters per the collaborative research andterms of our license agreement as well as the supply agreement entered into in June 2007. The termination became effective in December 2008. We recognized the revenue previously deferred totaling $34.8 million, and we received and recognized a $9 million milestone payment from Merck associated with the termination of the triamcinolone acetonide development program.
37
Ophthalmology revenue, when excluding the Merck event-specific itemsCordis. Beginning with our first quarter of fiscal 2009, increased by $0.5 million, or 7%, principally as2012, since the minimum royalty requirements have been eliminated, royalties under the license agreement will be based on a resultpercentage of a license fee milestone event.
Other Markets revenue decreased $2.2 million, or 17%, in fiscal 2010, compared with the prior-year period. Lower research and developmentCYPHER® sales, if any.Pharmaceuticals. Pharmaceuticals revenue was the primary reason for the decrease. Fiscal 2010, like fiscal 2009, continued to see selected customers delay, slow or cancel development projects as a result of various factors, including current economic conditions, financing challenges, and issues in the pharmaceutical industry. Other Markets revenue is derived from more than 50 customers.
Diagnostic. Diagnostic revenue was $11.2$15.1 million in fiscal
2010,2011, a decrease of
32%3% compared with
$16.5$15.5 million in the prior-year period. The decrease
was attributable toprincipally reflected lower
royalties and license
feesfee revenue, as one customer achieved a milestone event in fiscal
2010. 2010, as well as lower R&D revenue.In past years, Diagnostic derived a significant percentage ofVitro Diagnostics. In Vitro Diagnostics revenue from Abbott Laboratories. Royalty revenue from our diagnostic format patent license agreement with Abbott was $4.9$13.2 million in fiscal 2009. There was no royalty revenue from Abbott in fiscal 2010 because the patents had expired. In addition to the lower royalties and license fees, product sales decreased less than 1%2011, an increase of 17%, compared with fiscal 2009$11.2 million in the prior-year period. The increase was primarily attributable to higher sales of our BioFX branded products as customers continued to be cautious with their purchasing activity. We anticipate modest growth in product sales for fiscal 2011.
well as our stabilization and antigen products.Product costs. Product costs were $9.4$8.3 million in fiscal 2010,2011, a 26% increase12% decrease from the prior year. Overall product margins averaged 53%64%, compared with 61%53% in the prior year. The decreaseincrease in product margins reflected the mix of products sold in fiscal 2010,2011, as there were higher polymerlevels of diagnostic and reagent product sales whichcompared with prior year results. In addition, our polymer products carrygross margin improved, mainly attributable to lower margins than our reagent and diagnostic products. There wasfixed costs. In fiscal 2010 we recognized an inventory impairment charge totaling $0.4 million recognized in fiscal 2010.million. The gross margin for fiscal 2010, when adjusting for this impairment, was 55%.
Customer research and development expenses. Customer research and development (“Customer R&D”)&D expenses were $18.1$18.4 million, an increase of 38%1% compared with fiscal 2009.2010. The increase principally reflects the impact of higher fixed overhead costs attributable to our Alabama research and development operations.operations, offset somewhat by lower project material costs. Customer R&D margins were negative 18%29%, compared with 51%negative 18% in fiscal 2009. Fiscal 2009 margins2010. Customer R&D expenses in the Pharmaceuticals segment were 32% after adjusting for Merck deferred revenue recognition$16.3 million and final billings. The increase$15.6 million in fiscal 2011 and 2010, costs reflects the higher fixed overhead costs in Alabama as well as increased material costs. We anticipate fiscal 2011 costs associated with our cGMP facility to increase because of maintenance and validation activities.
respectively.Other research and development expenses. Other research and development (“Other R&D”)&D expenses were $17.9$12.2 million, a decrease of 15%32% compared with fiscal 2009.2010. All three expense categories (labor, materials and overhead) included in Other R&D decreased in fiscal 2011 compared with fiscal 2010. Lower fiscal 2011 labor costs of $2.2 million compared with fiscal 2010 was mainly the result of our March and October 2010 reorganizations which reduced our research and development headcount. In addition, we received a grant under the federal qualified therapeutic discovery project program (recorded as a reduction of Other R&D expense) which was approximately $0.8 million and with fewer research projects we spent less on project materials. Overhead costs allocated to Other R&D decreasedalso declined based on the
lower headcount levels. We also had a reduction of $1.7 million in Other R&D expenses in our Pharmaceuticals business, compared with fiscal 2009, and our research and development headcount decreased2010 expenses, based on a decision to limit its internal R&D activities in fiscal 2010 compared with fiscal 2009 as a result of our March 2010 reorganization and attrition, resulting in lower labor costs. These reductions were partially offset by higher project material costs.
2011.Selling, general and administrative expenses. Selling, general and administrative (“SG&A”) expenses were $18.5$20.5 million, an increase of 7%11% compared with fiscal 2009.2010. The increase principally reflects higher professional services fees, higher bad debt expenses and additional operatingvariable compensation costs with our Alabama facilities that are allocated to SG&A, partially offset by lower stock-based compensation expense and lower SG&A headcount.
of $1.8 million.Restructuring charges. In August 2011, we announced a realignment of our business to optimize the Company’s resources according to our strategic plan. As a result of the organizational change, we eliminated approximately 9% of our workforce. These employee terminations occurred across various functions, and the reorganization plan was completed by the end of the fourth quarter of fiscal 2011. We recorded total pre-tax restructuring charges of $1.0 million in the fourth quarter of fiscal 2011, which consisted of severance pay and benefits expenses.
In October 2010, we announced initiatives to reduce our cost structure and renew our focus on business units to more closely match operations and cost structure with the current customer environment. As a result of the organizational change, we eliminated 30 positions, or approximately 13% of our workforce. These employee terminations occurred across various functions, and the reorganization plan was completed by the end of the first quarter of fiscal 2011. The reorganization also resulted in SurModics vacating a leased production facility in Birmingham, Alabama and relocating the production activities to one of our owned facilities in Birmingham. We recorded total pre-tax restructuring charges of $1.2 million in the first quarter of fiscal 2011, which consisted of $1.2 million of severance pay and benefits expenses and less than $0.1 million of facility-related costs.
In March 2010, we announced an organizational change designed to support future growth by better meeting customer needs, leveraging our multiple competencies across the organization, and building on our pharmaceutical industry experience. WeAs a result of the reorganization, we eliminated approximately 4% of our workforce with the terminations occurring across various functions. SurModics recorded total restructuring charges of approximately $1.3 million in connection with the reorganization, consisting of $0.8 million associated with severance pay and benefits expenses and $0.5 million of facility-related costs. SurModics vacated and subleased its leased office facility in Irvine, California and a warehouse in Birmingham, Alabama.
In November 2008, we announced a functional reorganization which resulted in elimination of approximately 5% of our workforce. These employee terminations occurred across various functions and the reorganization plan was completed by the end of the firstthird quarter of fiscal 2009. The reorganization2010. SurModics also resultedvacated and subleased its leased sales office in SurModics vacatingIrvine, California and vacated a leased office facilitywarehouse in Eden Prairie, Minnesota, and consolidating into our owned office and research facility also in Eden Prairie.Birmingham, Alabama. We recorded total restructuring charges of $1.8approximately $1.3 million in connection with thisthe fiscal 2010 reorganization. These pre-tax charges consisted of $0.5$0.8 million of severance pay and benefits expenses and $1.3$0.5 million of facility-related costs.
38
CostsCumulative costs totaling $1.9$4.3 million have been paid associated with boththe fiscal 2011, 2010 and 2009 restructurings, and we anticipate paying the remaining $1.2$1.0 million within the next three years,27 months, with the majority in the next twelve12 months.
We also announced an additional restructuring subsequent to fiscal 2010 which resulted in a reduction to our cost structure and renewed focus on business units. This change resulted inAsset impairment charges. In the elimination of approximately 13% of our workforce with anticipated restructuring charges in the firstfourth quarter of fiscal 2011, we recognized asset impairment charges totaling $17.9 million. We wrote down long-lived assets (fixed assets of $14.8 million and intangibles of $3.1 million), associated with our Pharmaceuticals segment, based on the current valuation of the assets relative to their carrying value. The Company had been exploring strategic alternatives for the Pharmaceuticals segment, including a potential sale. The assets of the Pharmaceuticals business did not qualify as held-for-sale as of September 30, 2011, because we had not committed to a plan to sell at that time. However, our assessment of options available as of September 30, 2011 resulted in a probability-weighted value of expected future cash flows below the rangecarrying value of $1.3 millionthese assets, which required us to $1.7 million.
determine the fair value of the long-lived assets of the Pharmaceuticals segment using the probability-weighted value of the expected future cash flows. Asset impairment charges.charges of $17.9 million were recognized based on this assessment. Subsequently, the Company sold substantially all of its Pharmaceuticals assets for $30.0 million on November 17, 2011. See Note 1 to the consolidated financial statements for further information regarding the sale of SurModics Pharmaceuticals.In fiscal 2010, we recorded a $1.9 million asset impairment charge associated with writing down one of our facilities in Alabama to fair value based on a decision to sell the facility, which we later determined not to sell. The $2.1 million carrying value of this facility iswas based on a real estate market appraisal obtained during our negotiations.
We also recorded a $1.3 million asset impairment charge in fiscal 2010 associated with certain long-lived assets where very limitedno ongoing business iswas expected in the near termforeseeable future based on current market conditions. Furthermore, we recorded a $1.3 million asset impairment charge associated with certain fixed asset costs located in Minnesota and a $0.4 million asset impairment charge associated with prototypes and other equipment related to a development project for which very limited use isno ongoing business was expected in the near termforeseeable future in light of current market conditions. The assets associated with these charges had limited remaining value and as such were written down to zero value.
Goodwill impairment charge.charges. We recognized a goodwill impairment charge of $5.7 million in the first quarter of fiscal 2011 associated with our SurModics Pharmaceuticals reporting unit. Two milestone events were achieved associated with the July 2007 acquisition of SurModics Pharmaceuticals and $5.7 million of additional purchase price was recorded as an increase to goodwill. There had been no substantial changes in operating results for SurModics Pharmaceuticals in the first quarter of fiscal 2011 when compared with fiscal 2010, and as such we concluded that the goodwill associated with the milestone events was fully impaired.
In fiscal 2010, we recorded a $13.8 million goodwill impairment charge associated with our SurModics Pharmaceuticals reporting unit. The goodwill impairment charge in fiscal 2010 reflected a significant decline in the estimated fair value of our reporting units, mainly our SurModics Pharmaceuticals reporting unit, which resulted from a slowdown in business activity most pronounced in the fourth quarter of fiscal 2010, higher operating costs with our recently placed in-service cGMP manufacturing facility, and a significant decrease in our stock price during the year.fiscal 2010. Our stock price declined from $24.13 per share at October 1, 2009 to $12.03 per share at the date of our annual impairment test, which was August 31, 2010. We continually evaluateevaluated whether any indications of impairment arewere present that would require an impairment analysis on an interim basis. Prior to the fourth quarter, based on our outlook for future results and the fact that our market capitalization exceeded our book value by a margin of 64% at June 30, 2010, we did not believe that the events and circumstances in existence at our interim reporting dates indicated that it was more likely than not that the fair value of any of our reporting units would be less than its carrying amount.
Other income (loss), net. Other loss was $6.6 million in fiscal 2010, compared with income of $2.0 million in fiscal 2009. Income from investments was $1.0 million in fiscal 2010,2011, compared with $1.8a loss of $6.6 million in fiscal 2009.2010. Income from investments was $0.6 million in fiscal 2011, compared with $1.0 million in fiscal 2010. The decrease primarily reflects lower yields generated from our investment portfolio in fiscal 2010.2011. The fiscal 2010 loss primarily reflects a total of $7.9 million of impairment losses in connection with our portfolio of strategic investments.
We recognized an impairment loss on our investment in Nexeon MedSystems totaling $5.3 million in the fourth quarter of fiscal 2010 based on the valuations associated with potential new rounds of financing. In addition, we recognized a $2.4 million loss on our investment in a medical technology company in the third quarter of fiscal 2010 based on market valuations and a pending financing round for this company. Another entity in which the Company had a strategic investment sold the majority of its assets in the third quarter of fiscal 2010 resulting in an impairment loss of $0.2 million.
Income tax expense.benefit (provision). The income tax benefit was $3.7 million in fiscal 2011, compared with an income tax provision wasof $0.4 million in fiscal 2010, compared with $22.0 million in fiscal 2009.2010. The effective tax rate in fiscal 2011 was 22.5%, and when excluding the impact of the goodwill impairment charge of $5.7 million, the rate was 34.3%. The fiscal 2010 effective tax rate is not meaningful because a tax expense was recorded on a pretaxpre-tax loss. The fiscal 2010 effective tax rate, when excluding the impact of the goodwill impairment charge of $13.8 million and impairment losses on investments of $7.9 million, was 39.3% since SurModics doeswe do not currently foresee offsetting capital gains that could offset these capital losses, and therefore no benefit has beenwas recorded. The effective tax rate in fiscal 2009 was 36.9%. The increasedecrease in the effective tax rate, adjusted for the one-time items noted, is primarily a
39
result of non-deductible stock-based compensation expenses, offset partially by lower state taxes resulting from adjustments to state deferred taxes.
Segment Operating Results
Operating (loss) income for each of our reportable segments was as follows (in thousands):
| | | | | | | | |
| | | 2011 | | | 2010 | |
Operating (loss) income: | | | | | | | | |
Medical Device | | $ | 19,847 | | | $ | 19,524 | |
Pharmaceuticals | | | (32,522 | ) | | | (26,479 | ) |
In Vitro Diagnostics | | | 4,275 | | | | 3,304 | |
Corporate | | | (9,118 | ) | | | (10,402 | ) |
| | | | | | | | |
Total | | $ | (17,518 | ) | | $ | (14,053 | ) |
| | | | | | | | |
Medical Device.Operating income was $19.8 million in fiscal 2011, compared with $19.5 million in fiscal 2010. The increased operating income was driven by $1.5 million in lower development costs (reflecting the $0.8 million federal qualified therapeutic discovery project program and lower customer and internal project material expense), $1.3 million in lower compensation costs resulting from our August 2011 and October 2010 reorganizations and $0.6 million in lower product costs. The savings from these reduced operating costs were substantially offset by lower revenue.
Pharmaceuticals.Operating loss was $32.5 million in fiscal 2011, compared with a loss of $26.5 million in fiscal 2010. Fiscal 2011 loss included a goodwill impairment charge of $5.7 million and asset impairment charges of $17.9 million. Adjusting for the event-specific items, the operating loss was $8.9 million. The fiscal 2010 loss included a goodwill impairment charge of $13.8 million and asset impairment charges of $1.9 million. Adjusting for these one-time items, operating loss was $10.8 million. The decrease in the fiscal 2011 operating loss (as adjusted) was driven primarily by a $1.1 million reduction in product costs, $0.9 million reduction in research and development operating expenses, mostly related to lower external costs associated with the cGMP facility, and $0.7 million reduction in SG&A expenses, offset partially by $0.6 million in lower revenue.
In Vitro Diagnostics. Operating income was $4.3 million in fiscal 2011, compared with $3.3 million in fiscal 2010. The gross margin increase of $1.4 million, associated with the $2.0 million revenue increase, was the primary contributor to the operating income increase, partially offset by $0.2 million in higher compensation costs and $0.1 million in higher sales and marketing expenses.
Corporate. Operating loss was $9.1 million in fiscal 2011, compared with a loss of $10.4 million in fiscal 2010. Both periods included restructuring charges and fiscal 2010 included an asset impairment charge; when these charges are excluded, our adjusted operating losses were $6.9 million and $6.1 million for fiscal 2011 and 2010, respectively. The increased operating loss was driven primarily by higher variable compensation costs.
Results of Operations
Years Ended September 30, 20092010 and 20082009
| | | | | | | | | | | | | | | | | |
| | | Fiscal
| | | Fiscal
| | | Increase/
| | | | |
(Dollars in thousands) | | 2009 | | | 2008 | | | (Decrease) | | | % Change | |
| |
| Revenue: | | | | | | | | | | | | | | | | |
| Therapeutic | | | | | | | | | | | | | | | | |
| Cardiovascular | | $ | 39,841 | | | $ | 47,675 | | | $ | (7,834 | ) | | | (16 | )% |
| Ophthalmology | | | 52,102 | | | | 10,252 | | | | 41,850 | | | | 408 | % |
| Other Markets | | | 13,114 | | | | 17,875 | | | | (4,761 | ) | | | (27 | )% |
| | | | | | | | | | | | | | | | | |
| Total Therapeutic | | | 105,057 | | | | 75,802 | | | | 29,255 | | | | 39 | % |
| Diagnostic | | | 16,477 | | | | 21,249 | | | | (4,772 | ) | | | (22 | )% |
| | | | | | | | | | | | | | | | | |
| Total Revenue | | $ | 121,534 | | | $ | 97,051 | | | $ | 24,483 | | | | 25 | % |
| | | | | | | | | | | | | | | | | |
| | | | | | | | | | | | | | | | |
(in thousands) | | Fiscal
2010 | | | Fiscal
2009 | | | Increase/
(Decrease) | | | % Change | |
Revenue: | | | | | | | | | | | | | | | | |
Medical Device | | $ | 43,211 | | | $ | 86,546 | | | $ | (43,335 | ) | | | (50 | )% |
Pharmaceuticals | | | 15,493 | | | | 18,511 | | | | (3,018 | ) | | | (16 | )% |
In Vitro Diagnostics | | | 11,194 | | | | 16,477 | | | | (5,283 | ) | | | (32 | )% |
| | | | | | | | | | | | | | | | |
Total revenue | | $ | 69,898 | | | $ | 121,534 | | | $ | (51,636 | ) | | | (42 | )% |
| | | | | | | | | | | | | | | | |
Revenue. Fiscal 20092010 revenue was $121.5$69.9 million, an increasea decrease of $24.5$51.6 million, or 25%42%, from fiscal 2008.2009. The increase in Therapeutic and decrease in Diagnosticabove table provides a summary of each operating segment’s revenue as detailed in the table above, are further explained inwith the narrative below.
that follows providing additional explanations.Therapeutic.Medical Device. Revenue in TherapeuticMedical Device was $105.1$43.2 million in fiscal 2009,2010, a 39% increase50% decrease compared with $75.8$86.5 million in the prior-year.prior-year period. The increasedecrease in total revenue reflectsprincipally reflected the recognition in fiscal 2009 of revenue of approximately $45$45.0 million associated with the terminated Merck collaborative license and research and license agreement.agreement, which was terminated effective in the first quarter of fiscal 2009. Excluding thesethis significant event-specific items, Therapeutic revenue decreased $15.7 million, or 21%.
Cardiovascular derives a substantial amount of revenue from royalties and license fees and product sales attributable to Cordis Corporation, a Johnson & Johnson company, on its CYPHER® Sirolimus-eluting Coronary Stent. The CYPHER® stent incorporates a proprietary SurModics polymer coating that delivers a therapeutic drug designed to reduce the occurrence of restenosis in coronary artery lesions.
Cardiovascular revenue decreased $7.8 million, or 16%,item in fiscal 2009,
Medical Device revenue increased $1.7 million, or 4%.Royalty and license fee revenue increased $1.5 million or 5%, when excluding fiscal 2009 Merck license fee revenue, principally from milestone payments of $1.0 million associated with one customer. Product sales increased 13% based on higher reagent sales to Cordis. R&D revenue declined 16%, when excluding fiscal 2009 Merck R&D revenue, based on the timing of activities with one particular R&D program.
Pharmaceuticals. Pharmaceuticals revenue was $15.5 million in fiscal 2010, a decrease of 16% compared with $18.5 million in the prior-year principally as a result ofperiod. The decrease was mainly attributable to lower royalties and license fees and research and developmentR&D revenue. Our royalty revenue from Cordis decreased approximately 35% as a result of the decrease in CYPHER® stent sales.
Ophthalmology revenue increased $41.9 million, or 408%, in fiscal 2009, compared with the prior-year. The significant increase principally reflects the recognition of approximately $45 million of previously deferred revenue associated with the terminated collaborative research and license agreement with Merck and a milestone payment associated with the termination of the triamcinolone acetonide development program.
Ophthalmology revenue, excluding the Merck event-specific items of fiscal 2009 and amortization of revenue in fiscal 2008, was unchanged at $7.1 million in both fiscal years.
Other Markets revenue decreased $4.8 million, or 27%, in fiscal 2009, compared with the prior-year. Lower research and development revenue was the primary reason for the decrease. Selected customersCertain customer R&D programs were delayed, slowed or cancelled development projects in fiscal 20092010 as a result of various factors, including economic conditions.
conditions, financing challenges, and issues in the pharmaceutical industry. Increases in new or existing customer R&D programs were not enough to offset declines from two existing programs.Diagnostic.In Vitro Diagnostics. RevenueIn Vitro Diagnostics revenue was $11.2 million in Diagnostic wasfiscal 2010, a decrease of 32% compared with $16.5 million in fiscal 2009, a decrease of 22% compared with $21.2 million in the prior-year. Thisprior-year period. The decrease was attributable to lower royalties and license fees in fiscal 2009.2010. In past years, DiagnosticIn Vitro Diagnostics derived a significant percentage of revenue from Abbott Laboratories. Fiscal 2009Abbott. There was the last year in which we receivedno royalty revenue from oura diagnostic format patent license agreement with Abbott Laboratories.in fiscal 2010 because the patents had expired. Royalty revenue from Abbott was $4.9 million in fiscal 2009, compared with $8.72009. In addition to the lower royalties and license fees, product sales decreased $0.2 million or 2% in fiscal 2008. Product sales in Diagnostic decreased 4%2010 compared with fiscal 2008,2009 as customers slowedwere cautious with their purchasing activity in early fiscal 2009.
40
Product costs. Product costs were $7.5$9.4 million in fiscal 2009, an 11% decrease2010, a 26% increase from the prior year. Overall product margins averaged 61%53%, compared with 58%61% in the prior year. The increasedecrease in product margins reflected the mix of products sold in fiscal 20092010, as we had a decrease inthere were higher levels of polymer product sales, of our SurModics Pharmaceuticals polymerwhich products which carry lower margins than our reagent and diagnostic products.
There was an inventory impairment charge totaling $0.4 million recognized in fiscal 2010. The gross margin, when adjusting for this impairment, was 55%.Customer research and development expenses. Customer R&D expenses were $13.2$18.1 million a decreasein fiscal 2010, an increase of 31%38% compared with fiscal 2008.2009. The decreaseincrease principally reflectsreflected the impact of lowerhigher fixed costs attributable to our Alabama research and development revenue, adjusted for Merck.operations. Customer R&D margins were 51%negative 18%, compared with 24%positive 51% in fiscal 2008. The2009. Fiscal 2009 margins were positive 32% and 21% for fiscal 2009 and 2008, respectively, after adjusting for Merck deferred revenue recognition in both periods.and final billings. The increase in fiscal 2009 margins reflects lower labor and material2010 costs incurred on projects,reflected the higher fixed overhead costs in Alabama as well as lower overhead costs allocated toincreased material costs. Customer R&D.
&D expenses in the Pharmaceuticals segment were $15.6 million and $13.2 million in fiscal 2010 and 2009, respectively.Other research and development expenses. Other R&D expenses were $21.2 million, essentially unchanged compared with $21.3$17.9 million in fiscal 2008. Our2010, a decrease of 15% compared with fiscal 2009. Overhead costs allocated to Other R&D decreased compared with fiscal 2009, and our research and development headcount decreased in fiscal 2010 compared with fiscal 2009 as a result of our November 2008March 2010 reorganization as well as employee attrition, resulting in lower labor costs, whichcosts. These reductions were partially offset by higher overhead costs being allocated to Other R&D.
project material costs.Selling, general and administrative expenses. Selling, general and administrativeSG&A expenses were $17.2$18.5 million a decreasein fiscal 2010, an increase of 17%7% compared with fiscal 2008.2009. The decreaseincrease principally reflects lower employee compensationreflected higher professional services fees, higher bad debt expenses and additional operating costs relatedwith our Alabama facilities that are allocated to our annual incentive compensation program andSG&A, partially offset by lower stock-based compensation expense as fiscal 2008 included costs relatedand lower SG&A headcount.
Restructuring charges. In March 2010, we announced an organizational change designed to transitionssupport future growth by better meeting customer needs, leveraging our multiple competencies across the organization, and building on our Boardpharmaceutical industry experience. As a result of Directors.
Purchased in-process researchthe reorganization, we eliminated approximately 4% of our workforce with the terminations occurring across various functions. The reorganization was completed by the end of the third quarter of fiscal 2010. SurModics also vacated and development. In November 2008, we acquired certain assets comprisedsubleased its leased sales office in Irvine, California and vacated a leased warehouse in Birmingham, Alabama. SurModics recorded total pre-tax restructuring charges of intellectual property and collaborative programs from PR Pharmaceuticals, Inc. The fair valueapproximately $1.3 million in connection with the fiscal 2010 reorganization, which consisted of $3.2$0.8 million associated with the in-process researchseverance pay and development intangible asset was determined by managementbenefits expenses and recognized as an expense.
Restructuring charges.$0.5 million of facility-related costs.In November 2008, we announced a functional reorganization to better serve our customers and improve our operating performance. As a resultwhich resulted in elimination of the reorganization, we eliminated approximately 5% of our workforce. These employee terminations occurred across various functions, and the reorganization plan was completed by the end of the first quarter of fiscal 2009. The reorganization also resulted in SurModics vacating a leased office facility in Eden Prairie, Minnesota, and consolidating into our owned office and research facility also in Eden Prairie.
We recorded total pre-tax restructuring charges of $1.8 million in connection with the reorganization. These pre-tax chargesfiscal 2009 reorganization, which consisted of $0.5 million of severance pay and benefits expenses and $1.3 million of facility-related costs.
Asset impairment charges. In fiscal 2010, we recorded a $1.9 million asset impairment charge associated with writing down one of our facilities in Alabama to fair value based on a decision to sell the facility, which we later determined not to sell. The $2.1 million carrying value of this facility was based on a real estate market appraisal obtained during our negotiations.
We also recorded a $1.3 million asset impairment charge in fiscal 2010 associated with certain long-lived assets where no ongoing business was expected in the foreseeable future based on market conditions. Furthermore, we recorded a $1.3 million asset impairment charge associated with certain fixed asset costs located in Minnesota and a $0.4 million asset impairment charge associated with prototypes and other equipment related to a development project for which no ongoing business was expected in the foreseeable future in light of market conditions. The assets associated with these charges had limited remaining value and as such were written down to zero value.
Goodwill impairment charges. In fiscal 2010, we recorded a $13.8 million goodwill impairment charge associated with our SurModics Pharmaceuticals reporting unit. The goodwill impairment charge in fiscal 2010 reflected a significant decline in the estimated fair value of our reporting units, mainly our SurModics Pharmaceuticals reporting unit, which resulted from a slowdown in business activity most pronounced in the fourth quarter of fiscal 2010, higher operating costs with our cGMP manufacturing facility, and a significant decrease in our stock price during fiscal 2010. Our stock price declined from $24.13 per share at October 1, 2009 to $12.03 per share at the date of our annual impairment test, which was August 31, 2010. We continually evaluated whether any indications of impairment were present that would require an impairment analysis on an interim basis. Prior to the fourth quarter, based on our outlook for future results and the fact that our market capitalization exceeded our book value by a margin of 64% at June 30, 2010, we did not believe that the events and circumstances in existence at our interim reporting dates indicated that it was more likely than not that the fair value of any of our reporting units would be less than its carrying amount.
Other income (loss), net. Other loss was $6.6 million in fiscal 2010, compared with income wasof $2.0 million in fiscal 2009, compared with a loss of $0.4 million in fiscal 2008.2009. Income from investments was $1.0 million in fiscal 2010, compared with $1.8 million in fiscal 2009, compared with $3.3 million in fiscal 2008.2009. The decrease primarily reflectsreflected lower yields generated from our investment balancesportfolio in fiscal 2009.2010. The fiscal 20082010 loss primarily reflectsreflected a $4.3total of $7.9 million of impairment losses in connection with our portfolio of strategic investments.
We recognized an impairment loss on our investment in OctoPlus N.V.,Nexeon totaling $5.3 million in the fourth quarter of fiscal 2010 based on the valuations associated with potential new rounds of financing. In addition, we recognized a significant decline$2.4 million loss on our investment in a medical technology company in the stock price asthird quarter of September 30, 2008.
fiscal2010 based on market valuations and a pending financing round for this company. Another entity in which the Company had a strategic investment sold the majority of its assets in the third quarter of fiscal 2010 resulting in an impairment loss of $0.2 million.
Income tax expense.provision. The income tax provision was $0.4 million in fiscal 2010, compared with $22.0 million in fiscal 2009, compared with $12.2 million in fiscal 2008.2009. The effective tax rate in fiscal 20092010 is not meaningful because a tax expense was 36.9% compared with 45.2% in fiscal 2008.recorded on a pre-tax loss. The effective tax rate, when excluding the impact of the $4.3goodwill impairment charge of $13.8 million and impairment loss in fiscal 2008losses on investments of $7.9 million, was 38.9%39.3% since the CompanySurModics did not foresee offsetting capital gains that could offset thisthese capital loss,losses, and, therefore no tax benefit was recorded. The decreaseeffective tax rate in fiscal 2009 was 36.9%. The increase in the effective tax rate, adjusted for the one-time itemitems noted, is primarily a result of non-deductible stock-based compensation expenses, offset partially by lower state taxes and the tax reserveresulting from adjustments to state deferred taxes.
Segment Operating Results
Operating (loss) income for each of our reportable segments was as follows (in thousands):
| | | | | | | | |
| | | 2010 | | | 2009 | |
Operating (loss) income: | | | | | | | | |
Medical Device | | $ | 19,524 | | | $ | 62,472 | |
Pharmaceuticals | | | (26,479 | ) | | | (5,248 | ) |
In Vitro Diagnostics | | | 3,304 | | | | 8,081 | |
Corporate | | | (10,402 | ) | | | (7,804 | ) |
| | | | | | | | |
Total | | $ | (14,053 | ) | | $ | 57,501 | |
| | | | | | | | |
Medical Device. Operating income was $19.5 million in fiscal 2010, compared with $62.5 million in fiscal 2009. Fiscal 2009 operating income, excluding $45.0 million associated with uncertain tax positions.
the Merck contract termination, was $17.5 million. The increase in fiscal 2010, after adjusting for this event in fiscal 2009, was $2.0 million and driven principally by $1.5 million in higher royalty and license fee revenue and lower compensation costs.Pharmaceuticals. Pharmaceuticals operating loss was $26.5 million in fiscal 2010, compared with a loss of $5.2 million in fiscal 2009. The $21.3 million increase in the fiscal 2010 operating loss was driven primarily by a $12.5 million increase in event-specific charges, $3.0 million reduction in revenue (principally lower R&D revenue) and $4.9 million in increased operating expenses, mostly related to the cGMP facility which became operational in fiscal 2010.
In Vitro Diagnostics. Operating income was $3.3 million in fiscal 2010, compared with $8.1 million in fiscal 2009. Royalty revenue decreased $5.1 million in fiscal 2010 compared with the prior period, and was the primary contributor of the operating income decrease. Fiscal 2009 was the last year in which we received royalty revenue from our diagnostic format patent license agreement with Abbott. Royalty revenue from Abbott was $4.9 million in fiscal 2009.
Corporate. Operating loss was $10.4 million in fiscal 2010, compared with a loss of $7.8 million in fiscal 2009. Fiscal 2010 included $4.3 million in restructuring and asset impairment charges while fiscal 2009 included $1.8 million in restructuring charges. The operating losses for fiscal 2010 and 2009, when adjusted to exclude these charges, were $6.1 million and $6.0 million, respectively. The minor increase in operating loss for fiscal 2010, on an adjusted basis, reflected higher bad debt expense.
Liquidity and Capital Resources
Operating Activities. As of September 30, 2010,2011, the Company had working capital of $29.8$42.7 million, of which $20.5$38.4 million consisted of cash, cash equivalents and short-term investments. Working capital increased $0.8
$12.9 million from the September 30, 20092010 level, driven principally by higher income taxes receivablecash and short-term investment balances, offset by lower accounts receivable balances. Deferred revenue balances have increased as a result of the $3.5 million upfront payment associated with the licensehigher accrued compensation and development agreement with Roche and Genentech
41
in fiscal 2010.other current liabilities. Our cash, cash equivalents and short-term and long-term investments totaled $68.2 million at September 30, 2011, an increase of $11.4 million from $56.8 million at September 30, 2010, an increase of $8.9 million from $47.9 million at September 30, 2009.2010. The increase was principally driven by cash generated from operations.operations less payments related to a prior acquisition. The Company’s investments principally consist of U.S. government and government agency obligations and investment grade, interest-bearing corporate and municipal debt securities with varying maturity dates, the majority of which are five years or less. The Company’s policy requires that no more than 5% of investments be held in any one credit issue, excluding U.S. government and government agency obligations. The primary investment objective of the portfolio is to provide for the safety of principal and appropriate liquidity while meeting or exceeding a benchmark (Merrill(“Merrill Lynch 1-3 Year Government-Corporate Index)Index”) total rate of return. Management plans to continue to direct its investment advisors to manage the Company’s investments primarily for the safety of principal for the foreseeable future as it assesses other investment opportunities and uses of its investments.
The Company had positive cash flows from operating activities of approximately $20.0 million in fiscal 2011, compared with $22.0 million in fiscal 2010, compared with $31.3 million in fiscal 2009.2010. The following table depicts our cash flows from operations for each of fiscal 20102011 and 2009:
| | | | | | | | | |
| | | For the Years Ended September 30, | |
| | | 2010 | | | 2009 | |
| | | (In thousands) | |
| |
| Net (loss) income | | $ | (21,089 | ) | | $ | 37,550 | |
| Depreciation and amortization | | | 7,818 | | | | 5,912 | |
| Stock-based compensation | | | 5,875 | | | | 6,853 | |
| Purchased in-process research and development | | | — | | | | 3,200 | |
| Asset impairment charges | | | 4,896 | | | | — | |
| Goodwill impairment charge | | | 13,810 | | | | — | |
| Impairment loss on investments | | | 7,943 | | | | — | |
| Deferred taxes and other net operating activities | | | 774 | | | | 8,672 | |
| Net change in deferred revenue | | | 2,632 | | | | (36,050 | ) |
| Net change in other operating assets and liabilities | | | (651 | ) | | | 5,184 | |
| | | | | | | | | |
| Net cash provided by operating activities | | $ | 22,008 | | | $ | 31,321 | |
| | | | | | | | | |
2010: | | | | | | | | |
| | | For the Years Ended September 30, | |
| | | 2011 | | | 2010 | |
| | | (In thousands) | |
Net loss | | $ | (12,778 | ) | | $ | (21,089 | ) |
Depreciation and amortization | | | 7,145 | | | | 7,818 | |
Stock-based compensation | | | 4,252 | | | | 5,875 | |
Asset impairment charges | | | 17,890 | | | | 4,896 | |
Goodwill impairment charge | | | 5,650 | | | | 13,810 | |
Impairment loss on investments | | | — | | | | 7,943 | |
Deferred taxes | | | (5,892 | ) | | | 446 | |
Other net operating activities | | | (131 | ) | | | 328 | |
Net change in deferred revenue | | | 37 | | | | 2,632 | |
Net change in other operating assets and liabilities | | | 3,782 | | | | (651 | ) |
| | | | | | | | |
Net cash provided by operating activities | | $ | 19,955 | | | $ | 22,008 | |
| | | | | | | | |
Net (loss) income in fiscal 2010 decreased compared with fiscal 2009, which also resulted in lower cash provided by operating activities. Theactivities decreased $2.1 million in fiscal 2011 compared with fiscal 2010. This decrease in cash from operations reflectswas driven by continued lower CYPHER® stent royalties, and no Abbott royalties inwhich declined $2.7 million compared with fiscal 2010, as well as increased operating expenses associated with our facilities in Alabama. Net income wasto $1.3 million higher in fiscal 2009 principally as a result of the recognition of previously deferred revenue associated with the Merck agreement, which is a non-cash item. The Merck termination also resulted in a reduction in deferred tax asset balances, which are non-cash.
restructuring related payments.Investing Activities. We conduct a significantIn fiscal 2011, we invested $3.5 million in capital expenditures compared with $9.7 million in fiscal 2010. The majority of the fiscal 2010 capital expenditures were for our operations at our Eden Prairie, Minnesota headquarters and at our SurModics Pharmaceuticals subsidiary locatedcGMP facility in Birmingham, Alabama. In April 2008, we purchased a building for $12.2 million with approximately 286,000 square feet of space near our original Birmingham, Alabama location. We have invested an additional $32.9 million through fiscal 20102011 in this facility, to meet the development and cGMP manufacturing needs of our pharmaceutical and biotechnology customers.
In July 2007, we We also made equity investments in Paragon Intellectual Properties, LLC (“Paragon”) and Apollo Therapeutics, LLC (“Apollo”), a Paragon subsidiary. The Paragon and Apollo investments totaled $3.5 million. SurModics made an additional equity investment of $2.5 million, based upon successful completion of specified development milestones, in fiscal 2008. In October 2008, Paragon announced that it had restructured, moving from a limited liability company with seven subsidiaries to a single C-corporation named Nexeon MedSystems, Inc. (“Nexeon”). We continued to account for our investment in Paragon and Apollo under the equity method in the first quarter of fiscal 2009, as both entities report results to us on a one-quarter lag. Commencing with the second quarter of fiscal 2009, we account for our investment in Nexeon under the cost method, as our ownership is less than 20% and we do not exert significant influence over the medical technology company’s operating or financial activities.
42
SurModics made an additional cash investment in Nexeon of $500,000 in fiscal 2009. In the fourth quarter of fiscal 2010 we determined that this investment wasother-than-temporarily impaired and recognized a $5.3 million impairment loss. We held discussions with Nexeon management to understand the business status and outlook, valuations associated with potential new rounds of financing, operating metrics and other industry factors which impacted our assessment of the carrying value of this investment.
In July 2007, we entered into a stock purchase agreement with Southern Research Institute whereby we acquired 100% of the capital stock of SurModics Pharmaceuticals, Inc. (formerly known as Brookwood Pharmaceuticals, Inc.) (“SurModics Pharmaceuticals”) for $40 million in cash on the closing date, and up to an additional $22 million in cash upon the successful achievement of specified milestones. Additional milestones were achieved through fiscal 2010, such that $5.8 million of additional purchase price was recorded as an increase to goodwill. The sellers are still eligible to receive up to $16.3 million in additional consideration through calendar 2011. Based in Birmingham, Alabama, SurModics Pharmaceuticals specializes in proprietary injectable microparticles and implants to provide sustained delivery of drugs being developed by leading pharmaceutical, biotechnology and medical device clients as well as emerging companies. This acquisition has helped us broaden our technology offerings to our customers, diversify the range of markets in which we participate, expand our customer base, and enhance our pipeline of potential revenue generating opportunities. The goodwill recognized through fiscal 2010, $13.8 million, was impaired as a result of our annual goodwill impairment testing performed at August 31, 2010. In addition, we are likely to incur certain milestone payment obligations totaling a minimumpayments of $5.7 million in fiscal 2011. Assuming we do, we expect to record an additional goodwill impairment charge2011 compared with $0.8 million in fiscal 2011.
2010 associated with the July 2007 SurModics Pharmaceuticals acquisition. Subsequent to fiscal 2011, we completed the Pharma Sale for $30.0 million in cash.We believe the Company has sufficient cash and investments on hand as of September 30, 2011, which totaled $68.2 million, to finance foreseeable future needs.
Financing Activities.In August 2007, we entered into afiscal 2011, our financing activities were primarily associated with stock issued under our employee stock purchase agreement to acquire 100% of the capital stock of BioFX Laboratories, Inc. (“BioFX”) for $11.3 million in cash on the closing date, and up to an additional $11.4 million in cash upon the successful achievement of specified milestones.plan. In fiscal 2008, a milestone was achieved and $1.1 million of additional purchase price was recorded as an increase to goodwill. The sellers are still eligible to receive up to $3.5 million in additional consideration through calendar 2011. Based in Owings Mills, Maryland, BioFX is a leading manufacturer of substrates, a critical component of diagnostic test kits used to detect and signal that a certain reaction has taken place. The acquisition of BioFX has broadened2010, our product portfolio in the in vitro diagnostics market.
In November 2008, our SurModics Pharmaceuticals subsidiary entered into an asset purchase agreement with PR Pharmaceuticals, Inc. (“PR Pharma”) whereby it acquired certain contracts and assets of PR Pharma for $2.9 million in cash on the closing date, $0.3 million in transaction costs, and up to an additional $6.0 million upon the successful achievement of specified milestones. In fiscal 2009, $2.4 million of additional purchase price was paid based on achievement of certain milestones. PR Pharma is eligible to receive up to $3.6 million in cash upon the successful achievement of additional milestones. See Note 4 to the consolidated financial statements for further information.
In August 2009, the Company invested $2.0 million in a medical technology company with an additional $0.5 million invested in March 2010. In the third quarter of fiscal 2010, a new round of financing was completed for this entity which resulted in significantly lower valuation when compared with previous financings. We assessed the latest information and recognized a $2.4 million impairment loss on this investment. We account for this investment following the cost method, as our ownership level is below 20% and we do not exert significant influence over the medical technology company’s operating or financial activities.
Financing Activities.activities were driven by common stock repurchases. In November 2007, our Board of Directors authorized the repurchase of up to
$35$35.0 million of the
Company’s common stock in open-market transactions, private transactions, tender offers, or other transactions. The repurchase authorization does not have a fixed expiration date. During fiscal 2010, we purchased 102,533 shares of common stock for $2.0 million at an average price of $19.81 per share. There were no repurchases of common stock in fiscal 2011 under the repurchase authorization. Under the current authorization, the Company has $5.3 million remaining available for authorized share repurchases as of September 30, 2010.
43
In fiscal 2009,February 2011, we entered into the two-year $25.0 millionextended our unsecured revolving credit facility. As of September 30, 2010, we had no debt outstanding underfacility through March 2012 and reduced the facility.credit facility to $15.0 million. Borrowings under the credit facility, if any, will bear interest at a benchmark rate plus an applicable margin based upon the Company’s funded debt to EBITDA ratio. No borrowings have yet been made on the credit facility. In connection with the credit facility, the Company is required to maintain certain financial and nonfinancial covenants. As of September 30, 2010,2011, the Company had no debt outstanding under the credit facility and was not in compliance with certain covenants and is working with the bank to obtain waivers. The Company expects to complete these discussions by the end of the second quarter of fiscal 2011. We believe that the noncompliance will not cause liquidity issues given the Company’s investment holdings and cash flow generated by operations.
all covenants.We do not have any other credit agreements and believe that our existing cash, cash equivalents and investments, together with cash flow from operations, will provide liquidity sufficient to meet the below stated needs and fund our operations for the next twelve12 months. There can be no assurance, however, that SurModics’ business will continue to generate cash flows at current levels, and disruptions in financial markets may negatively impact the Company’s ability to access capital in a timely manner and on attractive terms. Our anticipated liquidity needs for fiscal 20112012 may include, but are not limited to, the following: general capital expenditures in the range of $4$1.5 million to $6$3.0 million; contingent consideration payments of $5.7 million to $6.4 million related to our acquisition of SurModics Pharmaceuticals; contingent consideration payments, if any, related to our acquisitionacquisitions of BioFXSurModics Pharmaceuticals and SurModics IVD as well as the purchase of certain assets from PR Pharmaceuticals;Pharma; and any amounts associated with the repurchase of common stock under the authorization discussed above.
Customer Concentrations. Our licensed technologies provide royalty revenue, which represents the largest revenue stream to the Company. We have licenses with a diverse base of customers and certain customers have multiple products using our technology. Medtronic is our largest customer at 15% of total revenue in fiscal 2011. Medtronic has several separately licensed products that generate royalty revenue for SurModics. In addition, there has been a decline in royalty revenue from one of our largest customers, Cordis, and with their June 2011 announcement of the cessation of the manufacture of the CYPHER® and CYPHER SELECT® Plus stents by the end of 2011, our royalty stream from this customer reached the contractual $1.0 million minimum quarterly level per the agreement in the third and fourth quarters of fiscal 2011. Beyond fiscal 2011, since the minimum levels in the agreement have been eliminated, we expect an earned royalty amount based on a percentage of CYPHER® sales, if any, until the products are no longer sold. No other individual customer product using licensed technology constitutes more than 5% of SurModics’ total revenue. Further, our licensing agreements with many of our customers, including most of our significant customers, cover many licensed products that each separately generate royalty revenue. This situation reduces the potential risk to our operations that may result from reduced sales (or the termination of a license) of a single product for any specific customer.
Off-Balance Sheet Arrangements and Contractual Obligations. As of September 30, 2010,2011, the Company did not have any off-balance sheet arrangements with any unconsolidated entities.
Presented below is a summary of contractual obligations and payments due by period (in thousands). See Note 9 to the consolidated financial statements for additional information regarding the below obligations.
| | | | | | | | | | | | | | | | | | | | | |
| | | | | | Less than
| | | | | | | | | More than
| |
| | | Total | | | 1 Year | | | 1-3 Years | | | 3-5 Years | | | 5 Years | |
| |
| Operating Leases | | $ | 515 | | | $ | 258 | | | $ | 117 | | | $ | 124 | | | $ | 16 | |
| Other long-term Liabilities(1) | | | 336 | | | | — | | | | 187 | | | | 21 | | | | 128 | |
| | | | | | | | | | | | | | | | | | | | | |
| Total | | $ | 851 | | | $ | 258 | | | $ | 304 | | | $ | 145 | | | $ | 144 | |
| | | | | | | | | | | | | | | | | | | | | |
| | | | | | | | | | | | | | | | | | | | |
| | | Total | | | Less than
1 Year | | | 1-3 Years | | | 3-5 Years | | | More than
5 Years | |
Operating leases | | $ | 261 | | | $ | 58 | | | $ | 123 | | | $ | 80 | | | $ | — | |
Other long-term liabilities(1) | | | 227 | | | | — | | | | 107 | | | | — | | | | 120 | |
| | | | | | | | | | | | | | | | | | | | |
Total | | $ | 488 | | | $ | 58 | | | $ | 230 | | | $ | 80 | | | $ | 120 | |
| | | | | | | | | | | | | | | | | | | | |
| | |
| (1) | | Other long-term liability contractual obligations primarily relate to payments associated with terminated operating leases as part of our restructuring activities in fiscal 20092010 and 2010.a long-term minimum usage incentive with a utility company. The long-term minimum usage incentive liability was assumed by Evonik in connection with the Pharma sale. |
As of September 30, 2010,2011, our gross liability for uncertain tax positions was $2.7$2.5 million. We are not able to reasonably estimate the amount by which the liability will increase or decrease over an extended period of time or whether a cash settlement of the liability will be required. Therefore, these amounts have been excluded from the schedule of contractual obligations.
Asobligations above.In addition, we may be required to pay additional cash or stock consideration of September 30, 2010, our liability for financial incentives associated with creationup to $14.2 million related to business acquisitions, contingent on future achievement of jobs in Alabama is $1.7 million. Wecertain development or business objectives of the acquired businesses. The timing and amounts are uncertain, thus we are not able to reasonably determineestimate whether a cash settlement of the contingent liability will be required as timing of future changes in full-time employees is uncertain at this time.required. Therefore, these amounts have been excluded from the schedule of contractual obligations.
obligations above.New Accounting Pronouncements.
In September 2011, the FASB issued changes to existing goodwill impairment testing guidance and permitted early adoption. The new accounting guidance involves assessment of qualitative factors to determine whether the existence of events or circumstances leads to a determination that it is more likely than not that the fair value of a reporting unit is less than its carrying amount. If, after assessing the totality of events or circumstances, an entity determines it is not more likely than not that the fair value of a reporting unit is less than its carrying amount, then moving to the next phase, the two-step impairment test, is unnecessary. We elected to early adopt the new guidance for our annual impairment testing in the fourth quarter of fiscal 2011.
In June 2011, the FASB issued changes to the presentation of comprehensive income. These changes give an entity the option to present the total of comprehensive income, the components of net income, and the components of other comprehensive income either in a single continuous statement of comprehensive income or in two separate but consecutive statements; the option to present components of other comprehensive income as part of the statement of changes in stockholders’ equity was eliminated. The items that must be reported in other comprehensive income or when an item of other comprehensive income must be reclassified to net income were not changed. Additionally, no changes were made to the calculation and presentation of earnings per share. These changes become effective for us on October 1, 2012 (fiscal 2013). Management is currently evaluating these changes to determine which option will be chosen for the presentation of comprehensive income. Other than the change in presentation, management has determined these changes will not have an impact on the consolidated financial statements.
In May 2011, the FASB issued changes to conform existing guidance regarding fair value measurement and disclosure between GAAP and International Financial Reporting Standards. These changes both clarify the FASB’s intent about the application of existing fair value measurement and disclosure requirements and amend certain principles or requirements for measuring fair value or for disclosing information about fair value measurements. The clarifying changes relate to the application of the highest and best use and valuation premise concepts, measuring the fair value of an instrument classified in a reporting entity’s shareholders’ equity, and disclosure of quantitative information about unobservable inputs used for Level 3 fair value measurements. The amendments relate to measuring the fair value of financial instruments that are managed within a portfolio; application of premiums and discounts in a fair value measurement; and additional disclosures concerning the valuation processes used and sensitivity of the fair value measurement to changes in unobservable inputs for those items categorized as Level 3, a reporting entity’s use of a nonfinancial asset in a way that differs from the asset’s highest and best use, and the categorization by level in the fair value hierarchy for items required to be measured at fair value for disclosure purposes only. These changes become effective for us on January 1, 2012 (fiscal 2012). Management is currently evaluating the potential impact of these changes on the consolidated financial statements.
No other new accounting pronouncement issued or effective has had, or is expected to have, a material impact on the Company’s consolidated financial statements.
| |
| ITEM 7A. | QUANTITATIVE AND QUALITATIVE DISCLOSURES ABOUT MARKET RISK. |
The Company’s investment policy requires investments with high credit quality issuers and limits the amount of credit exposure to any one issuer. The Company’s investments principally consist of U.S. government and government agency obligations and investment-grade, interest-bearing corporate and municipal debt securities with varying maturity dates, the majority of which are five years or less. Because of the credit criteria of the Company’s investment policies, the primary market risk associated with these investments is interest rate risk. SurModics does not use derivative financial instruments to manage interest rate risk or to speculate on future changes in interest
44
rates. A one percentage point increase in interest rates would result in an approximate $0.7 million decrease in the fair value of the Company’savailable-for-sale andheld-to-maturity securities as of September 30, 2010,2011, but no material impact on the results of operations or cash flows.
Management believes that a reasonable change in raw material prices would not have a material impact on future earnings or cash flows because the Company’s inventory exposure is not material.
Although we conduct business in foreign countries, our international operations consist primarily of sales of reagent and stabilization chemicals. Additionally, all sales transactions are denominated in U.S. dollars. Accordingly, we do not expect to be subject to material foreign currency risk with respect to future costs or cash flows from our foreign sales. To date, we have not entered into any foreign currency forward exchange contracts or other derivative financial instruments to hedge the effects of adverse fluctuations in foreign currency exchange.
| |
| ITEM 8. | FINANCIAL STATEMENTS AND SUPPLEMENTARY DATA. |
The consolidated balance sheets as of September 30, 20102011 and 20092010 and the consolidated statements of operations, stockholders’ equity and cash flows for each of the three years in the period ended September 30, 2010,2011, together with Report of Independent Registered Public Accounting Firm and related footnotes (including selected unaudited quarterly financial data) begin onpage F-1 of thisForm 10-K.
| |
| ITEM 9. | CHANGES IN AND DISAGREEMENTS WITH ACCOUNTANTS ON ACCOUNTING AND FINANCIAL DISCLOSURE. |
| |
| ITEM 9A. | CONTROLS AND PROCEDURES. |
| 1. | |
1. | Disclosure Controls and Procedures. |
As of the end of the period covered by this report, the Company conducted an evaluation under the supervision and with the participation of the Company’s management, including the Company’s interim Chief Executive Officer and Interim Chief Financial Officer regarding the effectiveness of the design and operation of the Company’s disclosure controls and procedures pursuant toRule 13a-15(b) of the Securities Exchange Act of 1934 (the “Exchange Act”).Act. Based upon that evaluation, the interim Chief Executive Officer and Interim Chief Financial Officer concluded that the Company’s disclosure controls and procedures are effective to ensure that information required to be disclosed by the Company in reports that it files under the Exchange Act is recorded, processed, summarized and reported within the time period specified in the Securities and Exchange Commission rules and forms, and to ensure that information required to be disclosed by us in the reports we file or submit under the Exchange Act is accumulated and communicated to our management, including our principal executive and principal financial officers, as appropriate to allow timely decisions regarding required disclosures.
| 2. | |
2. | Internal Control over Financial Reporting. |
a. Management’s Report on Internal Control Over Financial Reporting. Management is responsible for establishing and maintaining adequate internal control over financial reporting for the Company. Management
conducted an evaluation of the effectiveness of internal control over financial reporting based on the framework inInternal Control —Integrated Frameworkissued by the Committee of Sponsoring Organizations of the Treadway Commission (COSO).Commission. Based on this evaluation, management concluded that the Company’s internal control over financial reporting was effective as of September 30, 2010.2011. Deloitte & Touche LLP, the independent registered public accounting firm that audited the financial statements included in this Annual Report onForm 10-K, has issued the attestation report below regarding the Company’s internal control over financial reporting.
b. Attestation Report of the Independent Registered Public Accounting Firm.
45
REPORT OF INDEPENDENT REGISTERED PUBLIC ACCOUNTING FIRM
Board of Directors and Stockholders
We have audited the internal control over financial reporting of SurModics, Inc. and subsidiaries (the “Company”) as of September 30, 2010,2011, based on criteria established inInternal Control — Integrated Frameworkissued by the Committee of Sponsoring Organizations of the Treadway Commission. The Company’s management is responsible for maintaining effective internal control over financial reporting and for its assessment of the effectiveness of internal control over financial reporting, included in the accompanying Management’s Report on Internal Control Over Financial Reporting. Our responsibility is to express an opinion on the Company’s internal control over financial reporting based on our audit.
We conducted our audit in accordance with the standards of the Public Company Accounting Oversight Board (United States). Those standards require that we plan and perform the audit to obtain reasonable assurance about whether effective internal control over financial reporting was maintained in all material respects. Our audit included obtaining an understanding of internal control over financial reporting, assessing the risk that a material weakness exists, testing and evaluating the design and operating effectiveness of internal control based on the assessed risk, and performing such other procedures as we considered necessary in the circumstances. We believe that our audit provides a reasonable basis for our opinion.
A company’s internal control over financial reporting is a process designed by, or under the supervision of, the company’s principal executive and principal financial officers, or persons performing similar functions, and effected by the company’s board of directors, management, and other personnel to provide reasonable assurance regarding the reliability of financial reporting and the preparation of financial statements for external purposes in accordance with generally accepted accounting principles. A company’s internal control over financial reporting includes those policies and procedures that (1) pertain to the maintenance of records that, in reasonable detail, accurately and fairly reflect the transactions and dispositions of the assets of the company; (2) provide reasonable assurance that transactions are recorded as necessary to permit preparation of financial statements in accordance with generally accepted accounting principles, and that receipts and expenditures of the company are being made only in accordance with authorizations of management and directors of the company; and (3) provide reasonable assurance regarding prevention or timely detection of unauthorized acquisition, use, or disposition of the company’s assets that could have a material effect on the financial statements.
Because of the inherent limitations of internal control over financial reporting, including the possibility of collusion or improper management override of controls, material misstatements due to error or fraud may not be prevented or detected on a timely basis. Also, projections of any evaluation of the effectiveness of the internal control over financial reporting to future periods are subject to the risk that the controls may become inadequate because of changes in conditions, or that the degree of compliance with the policies or procedures may deteriorate.
In our opinion, the Company maintained, in all material respects, effective internal control over financial reporting as of September 30, 2010,2011, based on the criteria established inInternal Control — Integrated Frameworkissued by the Committee of Sponsoring Organizations of the Treadway Commission.
We have also audited, in accordance with the standards of the Public Company Accounting Oversight Board (United States), the consolidated financial statements and financial statement schedule as of and for the year ended September 30, 20102011 of the Company and our report dated December 14, 2010,2011, expressed an unqualified opinion on those financial statements.
/s/ DELOITTE & TOUCHE LLP
462011
| 3. | |
3. | Changes in Internal Controls. |
There was no change in our internal control over financial reporting that occurred during the fourth quarter of the year covered by thisForm 10-K that has materially affected, or is reasonably likely to materially affect, our internal control over financial reporting.
| |
| ITEM 9B. | OTHER INFORMATION. |
| |
| ITEM 10. | DIRECTORS, EXECUTIVE OFFICERS AND CORPORATE GOVERNANCE. |
The information required by Item 10 relating to directors, our audit committee, the nature of changes, if any, to procedures by which our shareholders may recommend nominees for directors, our code of ethics and compliance with Section 16(a) of the Securities Exchange Act of 1934 is incorporated herein by reference to the sections entitled “Election of Directors,” “Section 16(a) Beneficial Ownership Reporting Compliance,” “Corporate Governance — Code of Ethics and Business Conduct,” “Corporate Governance — Corporate Governance and Nominating Committee; Procedures & Policies”and Policy” and “Audit Committee Report,” which appear in the Company’s Proxy Statement for its 20112012 Annual Meeting of Shareholders. The information required by Item 10 relating to executive officers appears in Part I of thisForm 10-K.
| |
| ITEM 11. | EXECUTIVE COMPENSATION. |
The information required by Item 11 is incorporated herein by reference to the sections entitled “Executive Compensation and Other Information,” “Compensation Discussion and Analysis,” “Director Compensation During Fiscal 2010”2011” and “Compensation“Organization and Compensation Committee Report,” which appear in the Company’s Proxy Statement for its 20112012 Annual Meeting of Shareholders.
| |
| ITEM 12. | SECURITY OWNERSHIP OF CERTAIN BENEFICIAL OWNERS AND MANAGEMENT AND RELATED STOCKHOLDER MATTERS. |
The information required by Item 12 is incorporated herein by reference to the sections entitled “Principal Shareholders,” and “Management Shareholdings” which appear in the Company’s Proxy Statement for its 20112012 Annual Meeting of Shareholders.
Equity Compensation Plan Information
The following table provides information related to the Company’s equity compensation plans in effect as of September 30, 2010:
| | | | | | | | | | | | | |
| | | | | | | | | (c)
| |
| | | | | | | | | Number of Securities
| |
| | | (a)
| | | (b)
| | | Remaining Available for
| |
| | | Number of Securities to
| | | Weighted-Average
| | | Future Issuance Under
| |
| | | be Issued Upon Exercise
| | | Exercise Price of
| | | Equity Compensation
| |
| | | of Outstanding Options,
| | | Outstanding Options,
| | | Plans (Excluding Securities
| |
Plan Category | | Warrants and Rights | | | Warrants and Rights | | | Reflected in Column (a)) | |
| |
| Equity compensation plans approved by shareholders | | | 1,611,333 | (1) | | $ | 31.02 | (1) | | | 2,001,609 | (2) |
| Equity compensation plans not approved by shareholders | | | 0 | | | | N/A | | | | 0 | |
| | | | | | | | | | | | | |
| Total | | | 1,611,333 | | | $ | 31.02 | | | | 2,001,609 | |
| | | | | | | | | | | | |
Plan Category | | (a)
Number of Securities to
be Issued Upon Exercise
of Outstanding Options,
Warrants and Rights | | | (b)
Weighted-Average
Exercise Price of
Outstanding Options,
Warrants and Rights | | | (c)
Number of Securities
Remaining Available for
Future Issuance Under
Equity Compensation
Plans (Excluding Securities
Reflected in Column (a)) | |
Equity compensation plans approved by shareholders | | | 1,762,581 | (1) | | $ | 23.61 | (1) | | | 1,559,665 | (2) |
Equity compensation plans not approved by shareholders | | | 0 | | | | N/A | | | | 0 | |
| | | | | | | | | | | | |
Total | | | 1,762,581 | | | $ | 23.61 | | | | 1,559,665 | |
| | |
| (1) | | Excludes shares that may be issued under the Company’s amended and restated 1999 Employee Stock Purchase Plan, but includes amounts reserved for previously-granted restricted stock and performance share awards under the 2009 Equity Incentive Plan. |
|
| (2) | | Includes 1,818,8011,432,086 shares available for future issuance under the 2009 Equity Incentive Plan. There are 182,808127,579 shares available under the amended and restated 1999 Employee Stock Purchase Plan. |
47
| |
| ITEM 13. | CERTAIN RELATIONSHIPS AND RELATED TRANSACTIONS, AND DIRECTOR INDEPENDENCE. |
The information required by Item 13 is incorporated herein by reference to the sections entitled “Corporate Governance — Related Person Transaction Approval Policy,” “Corporate Governance — Transactions With Related Parties”Policy” and “Corporate Governance — Majority of Independent Directors; Committees of Independent Directors,” which appear in the Company’s Proxy Statement for its 20112012 Annual Meeting of Shareholders.
| |
| ITEM 14. | PRINCIPAL ACCOUNTANT FEES AND SERVICES. |
The information required by Item 14 is incorporated herein by reference to the section entitled “Independent Registered Public Accounting Firm,“Audit Committee Report,” which appears in the Company’s Proxy Statement for its 20112012 Annual Meeting of Shareholders.
48
PART IV
| |
| ITEM 15. | EXHIBITS AND FINANCIAL STATEMENT SCHEDULES. |
(a) 1.Financial Statements
The following statements are included in this report on the pages indicated:
| | |
| | | Page (s) |
|
| | F-1 |
| | F-2 |
| | F-3 |
| | F-4 |
| | F-5 |
| | F-6 to F-32F-35 |
2. Financial Statement Schedules. See Schedule II — “Valuation and Qualifying Accounts” in this section of thisForm 10-K. All other schedules are omitted because they are inapplicable, not required, or the information is in the consolidated financial statements or related notes.
3. Listing of Exhibits. The exhibits which are filed with this report or which are incorporated herein by reference are set forth in the Exhibit Index following the signature page.
SurModics, Inc.
Valuation and Qualifying Accounts
| | | | | | | | | | | | | | | | | |
| | | Column B | | | Column C | | | Column D | | | Column E | |
| | | Balance at
| | | Additions
| | | Deductions
| | | Balance at
| |
Column A | | Beginning of
| | | Charged to
| | | From
| | | End of
| |
Description | | Period | | | Expenses | | | Reserves | | | Period | |
| |
| Year Ended September 30, 2008 | | | | | | | | | | | | | | | | |
| Allowance for doubtful accounts | | $ | 40 | | | $ | 228 | | | $ | 133 | (a) | | $ | 135 | |
| | | | | | | | | | | | | | | | | |
| Year Ended September 30, 2009 | | | | | | | | | | | | | | | | |
| Allowance for doubtful accounts | | $ | 135 | | | $ | (34 | ) | | $ | 19 | (a) | | $ | 82 | |
| | | | | | | | | | | | | | | | | |
| Restructuring accrual | | $ | — | | | $ | 1,763 | | | $ | 808 | (b) | | $ | 955 | |
| | | | | | | | | | | | | | | | | |
| Year Ended September 30, 2010 | | | | | | | | | | | | | | | | |
| Allowance for doubtful accounts | | $ | 82 | | | $ | 367 | | | $ | (12 | )(a) | | $ | 461 | |
| | | | | | | | | | | | | | | | | |
| Restructuring accrual | | $ | 955 | | | $ | 1,306 | | | $ | 1,078 | (b) | | $ | 1,183 | |
| | | | | | | | | | | | | | | | | |
(In thousands)
| | | | | | | | | | | | | | | | |
Description | | Balance at
Beginning
of Period | | | Additions
Charged
(Credited)
to Expenses | | | Deductions
From
Reserves | | | Balance at
End of
Period | |
Year Ended September 30, 2009: | | | | | | | | | | | | | | | | |
Allowance for doubtful accounts | | $ | 135 | | | $ | (34 | ) | | $ | 19 | (a) | | $ | 82 | |
| | | | | | | | | | | | | | | | |
Restructuring accrual | | $ | — | | | $ | 1,763 | | | $ | 808 | (b) | | $ | 955 | |
| | | | | | | | | | | | | | | | |
Year Ended September 30, 2010: | | | | | | | | | | | | | | | | |
Allowance for doubtful accounts | | $ | 82 | | | $ | 367 | | | $ | (12 | )(a) | | $ | 461 | |
| | | | | | | | | | | | | | | | |
Restructuring accrual | | $ | 955 | | | $ | 1,306 | | | $ | 1,078 | (b) | | $ | 1,183 | |
| | | | | | | | | | | | | | | | |
Year Ended September 30, 2011: | | | | | | | | | | | | | | | | |
Allowance for doubtful accounts | | $ | 461 | | | $ | 80 | | | $ | 386 | (a) | | $ | 155 | |
| | | | | | | | | | | | | | | | |
Restructuring accrual | | $ | 1,183 | | | $ | 2,243 | | | $ | 2,446 | (b) | | $ | 980 | |
| | | | | | | | | | | | | | | | |
| | |
| (a) | | Uncollectible accounts written off and adjustments to the allowance. |
|
| (b) | | Adjustments to the accrual account reflect payments or non-cash charges associated with the accrual. |
49
SIGNATURES
Pursuant to the requirements of Section 13 or 15(d) of the Securities Exchange Act of 1934, the Registrant has duly caused this Report to be signed on its behalf by the undersigned, thereunto duly authorized.
SURMODICS, INC.
| | |
SURMODICS, INC. |
| |
By: | | /s/ Philip D. AnkenyGary R. Maharaj |
| | Gary R. Maharaj |
| | President and Chief Executive Officer |
Philip D. Ankeny
Interim Chief Executive Officer, Senior Vice
President and Chief Financial Officer
2011Pursuant to the requirements of the Securities Exchange Act of 1934, this Report has been signed below by the following persons on behalf of the Registrant, in the capacities, and on the dates indicated.
Each person whose signature appears below authorizes PHILIP D. ANKENY,GARY R. MAHARAJ or TIMOTHY J. ARENS, and constitutes and appoints said personpersons as his or her true and lawful attorney-in-factattorneys-in-fact and agent,agents, with full power of substitution and resubstitution, for him or her and in his or her name, place and stead, in any and all capacities, to sign any or all amendments to this Annual Report onForm 10-K and to file the same, with all exhibits thereto, and other documents in connection therewith, with the Securities and Exchange Commission, authorizing said personpersons and granting unto said attorney-in-factattorneys-in-fact and agent,agents, full power and authority to do and perform each and every act and thing requisite and necessary to be done in and about the premises, as fully to all intents and purposes as he or she might or could do in person, hereby ratifying and confirming all said attorney-in-factattorneys-in-fact and agent,agents, or his substitute or substitutes, may lawfully do or cause to be done by virtue thereof.
| | | | |
Signature | | Title | | Date |
| | |
/s/ Gary R. Maharaj Gary R. Maharaj | | |
Signature
| | Title
| | Date
|
|
| | | | |
/s/ Philip D. Ankeny
Philip D. Ankeny | | InterimPresident and Chief Executive Officer
Senior Vice President and
Chief Financial Officer
(principal (principal executive officer) and financial officer)Director | | December 14, 20102011 |
| | |
/s/ Timothy J. Arens Timothy J. Arens | | | | |
/s/ Mark A. Lehman
Mark A. Lehman | | Corporate Controller
Vice President of Finance and Interim Chief Financial Officer (principal accountingfinancial officer) | | December 14, 20102011 |
| | |
/s/ Mark A. Lehman Mark A. Lehman | | Corporate Controller (principal accounting officer) | | December 14, 2011 |
| | |
/s/ Robert C. Buhrmaster Robert C. Buhrmaster | | Chairman of the Board of Directors | | December 14, 2011 |
| | |
/s/ José H. Bedoya
José H. Bedoya | | Director | | December 14, 20102011 |
| | | | |
John W. Benson | | Director | | December 14, 20102011 |
| | | | |
Mary K. Brainerd | | Director | | December 14, 20102011 |
| | | | |
Signature | | Title | | Date |
| | |
/s/ Robert C. Buhrmaster
Robert C. BuhrmasterDavid R. Dantzker, M.D.David R. Dantzker, M.D. | | Director | | December 14, 2010 |
50
| | | | | | 2011 |
Signature
| | Title
| | Date
|
|
| | | | |
| | Director | | December 14, 20102011 |
| | | | |
| | Director | | |
| | | | |
| | Director | | December 14, 20102011 |
| | | | |
| Jeffrey C. Smith Jeffrey C. Smith | | Director | | December 14, 20102011 |
| | | | |
| | Director | | December 14, 20102011 |
51
UNITED STATES
SECURITIES AND EXCHANGE COMMISSION
EXHIBIT INDEX TOFORM 10-K
For the Fiscal Year Ended September 30, 2010
| | | | | |
Exhibit | | |
| |
| | 2 | .1 | | Agreement of Merger, dated January 18, 2005, with InnoRx, Inc. — incorporated by reference to Exhibit 2.1 to the Company’s Current Report onForm 8-K dated January 18, 2005, SEC FileNo. 0-23837. |
| | 2 | .2 | | Stock Purchase Agreement, dated July 31, 2007, between SurModics, Inc. and Southern Research Institute. — incorporated by reference to Exhibit 2.1 to the Company’s Current Report onForm 8-K dated July 31, 2007, SEC FileNo. 0-23837. |
| | 3 | .1 | | Restated Articles of Incorporation, as amended — incorporated by reference to Exhibit 3.1 to the Company’s Quarterly Report onForm 10-QSB for the quarter ended December 31, 1999,SEC File No. 0-23837. |
| | 3 | .2 | | Restated Bylaws of the Company, as amended — incorporated by reference to Exhibit 3.2 to the Company’s Annual Report onForm 10-K for the fiscal year ended September 30, 2009,SEC File No. 0-23837. |
| | 10 | .1* | | Company’s Incentive 1997 Stock Option Plan, including specimen of Incentive Stock Option Agreement — incorporated by reference to Exhibit 10.3 to the Company’s Registration Statement onform SB-2, Reg.No. 333-43217. |
| | 10 | .2* | | Form of Restricted Stock Agreement under 1997 Plan — incorporated by reference to Exhibit 10.4 to the Company’s Registration Statement onform SB-2, Reg.No. 333-43217. |
| | 10 | .3* | | Form of Non-qualified Stock Option Agreement under 1997 Plan — incorporated by reference to Exhibit 10.5 to the Company’s Registration Statement onform SB-2, Reg.No. 333-43217. |
| | 10 | .4+ | | Adjusted License Agreement by and between the Company and Cordis Corporation effective as of January 1, 2003 — incorporated by reference to Exhibit 10.11 to the Company’s Annual Report onForm 10-K for the fiscal year ended September 30, 2002, SEC FileNo. 0-23837. |
| | 10 | .5+ | | Reagent Supply Agreement by and between the Company and Cordis Corporation effective as of January 1, 2003 — incorporated by reference to Exhibit 10.12 to the Company’s Annual Report onForm 10-K for the fiscal year ended September 30, 2002, SEC FileNo. 0-23837. |
| | 10 | .6* | | Form of officer acceptance regarding employment/compensation — incorporated by reference to Exhibit 10.9 to the Company’s Annual Report onForm 10-K for the fiscal year ended September 30, 2005, SEC FileNo. 0-23837. |
| | 10 | .7* | | 2003 Equity Incentive Plan (as amended and restated December 13, 2005) (adopted December 13, 2005 by the board of directors and approved by the shareholders on January 30, 2006) — incorporated by reference to Exhibit 10.1 to the Company’sForm 8-K filed February 3, 2006, SEC FileNo. 0-23837. |
| | 10 | .8* | | Form of SurModics, Inc. 2003 Equity Incentive Plan Nonqualified Stock Option Agreement — incorporated by reference to Exhibit 99.1 to the Company’s8-K filed March 20, 2006,SEC File No. 0-23837. |
| | 10 | .9* | | Form of SurModics, Inc. 2003 Equity Incentive Plan Incentive Stock Option Agreement — incorporated by reference to Exhibit 99.2 to the Company’s8-K filed March 20, 2006, SEC FileNo. 0-23837. |
| | 10 | .10* | | Form of SurModics, Inc. 2003 Equity Incentive Plan Restricted Stock Agreement — incorporated by reference to Exhibit 99.3 to the Company’s8-K filed March 20, 2006, SEC FileNo. 0-23837. |
| | 10 | .11* | | Form of SurModics, Inc. 2003 Equity Incentive Plan Performance Share Award Agreement — incorporated by reference to Exhibit 99.4 to the Company’s8-K filed March 20, 2006,SEC File No. 0-23837. |
| | 10 | .12* | | Form of SurModics, Inc. 2003 Equity Incentive Plan Performance Unit Award (cash settled) Agreement — incorporated by reference to Exhibit 99.5 to the Company’s8-K filed March 20, 2006, SEC FileNo. 0-23837. |
| | 10 | .13* | | Form of SurModics, Inc. 2003 Equity Incentive Plan Restricted Stock Unit Agreement — incorporated by reference to Exhibit 99.6 to the Company’s8-K filed March 20, 2006, SEC FileNo. 0-23837. |
| | 10 | .14* | | Form of SurModics, Inc. 2003 Equity Incentive Plan Stock Appreciation Rights (cash settled) Agreement — incorporated by reference to Exhibit 99.7 to the Company’s8-K filed March 20, 2006, SEC FileNo. 0-23837. |
52
| | | | | |
Exhibit | | |
| |
| | 10 | .15* | | Form of SurModics, Inc. 2003 Equity Incentive Plan Stock Appreciation Rights (stock settled) Agreement — incorporated by reference to Exhibit 99.8 to the Company’s8-K filed March 20, 2006, SEC FileNo. 0-23837. |
| | 10 | .16* | | Change in Control Agreement with Philip D. Ankeny, dated April 19, 2006 — incorporated by reference to Exhibit 99.2 to the Company’sForm 8-K filed April 25, 2006, SEC FileNo. 0-23837. |
| | 10 | .17 | | The Company’s Board Compensation Policy, Amended and Restated as of February 8, 2010.** |
| | 10 | .18 | | Credit Agreement dated as of February 27, 2009, by and between SurModics, Inc. and Wells Fargo Bank, National Association as Sole Lead Arranger and Administrative Agent — incorporated by reference to Exhibit 10.1 to the Company’sForm 8-K filed March 4, 2009, SEC FileNo. 0-23837. |
| | 10 | .19* | | Amendment to Change of Control Agreement, dated as of December 23, 2008, between SurModics, Inc. and Philip D. Ankeny. — incorporated by reference to Exhibit 10.28 to the Company’s Annual Report onForm 10-K for the fiscal year ended September 30, 2009, SEC FileNo. 0-23837. |
| | 10 | .20* | | Second Amendment to Change of Control Agreement, dated as of April 19, 2009, between SurModics, Inc. and Philip D. Ankeny. — incorporated by reference to Exhibit 10.30 to the Company’s Annual Report onForm 10-K for the fiscal year ended September 30, 2009, SEC FileNo. 0-23837. |
| | 10 | .21+ | | License and Development Agreement between Genentech, Inc., F. Hoffmann-La Roche, Ltd., and SurModics, Inc., dated October 5, 2009 — incorporated by reference to Exhibit 10.1 to the Company’sForm 10-Q filed February 5, 2010, SEC FileNo. 0-23837. |
| | 10 | .22+ | | Master Services Agreement by and between Genentech, Inc., F. Hoffmann-La Roche, Ltd. and SurModics, Inc., dated October 5, 2009 — incorporated by reference to Exhibit 10.2 to the Company’sForm 10-Q filed February 5, 2010, SEC FileNo. 0-23837. |
| | 10 | .23* | | SurModics, Inc. 2009 Equity Incentive Plan. — incorporated by reference to Exhibit 10.3 to the Company’sForm 10-Q filed May 7, 2010, SEC FileNo. 0-23837. |
| | 10 | .24* | | SurModics, Inc. 1999 Employee Stock Purchase Plan (as amended and restated November 30, 2009). — incorporated by reference to Exhibit 10.2 to the Company’sForm 10-Q filed May 7, 2010,SEC File No. 0-23837. |
| | 10 | .25* | | Form of Incentive Stock Option Agreement for the SurModics, Inc. 2009 Equity Incentive Plan — incorporated by reference to Exhibit 10.4 to the Company’sForm 10-Q filed May 7, 2010, SEC FileNo. 0- 23837. |
| | 10 | .26* | | Form of Non-Statutory Stock Option Agreement for the SurModics, Inc. 2009 Equity Incentive Plan — incorporated by reference to Exhibit 10.5 to the Company’sForm 10-Q filed May 7, 2010,SEC File No. 0-23837. |
| | 10 | .27* | | Form of Performance Share Agreement for the SurModics, Inc. 2009 Equity Incentive Plan — incorporated by reference to Exhibit 10.6 to the Company’sForm 10-Q filed May 7, 2010,SEC File No. 0-23837. |
| | 10 | .28* | | Form of Restricted Stock Agreement for the SurModics, Inc. 2009 Equity Incentive Plan — incorporated by reference to Exhibit 10.7 to the Company’sForm 10-Q filed May 7, 2010, SEC FileNo. 0-23837. |
| | 21 | | | Subsidiaries of the Registrant.** |
| | 23 | | | Consent of Deloitte & Touche LLP.** |
| | 24 | | | Power of Attorney (included on signature page of thisForm 10-K).** |
| | 31 | .1 | | Certification of Chief Executive Officer and Chief Financial Officer Pursuant to Section 302 of Sarbanes-Oxley Act of 2002.** |
| | 32 | .1 | | Certification of Chief Executive Officer and Chief Financial Officer Pursuant to Section 906 of Sarbanes-Oxley Act of 2002.** |
| | |
Exhibit | | |
| 2.1 | | Agreement of Merger, dated January 18, 2005, with InnoRx, Inc. — incorporated by reference to Exhibit 2.1 to the Company’s Current Report on Form 8-K dated January 18, 2005, SEC File No. 0-23837. |
| 2.2 | | Stock Purchase Agreement, dated July 31, 2007, between SurModics, Inc. and Southern Research Institute — incorporated by reference to Exhibit 2.1 to the Company’s Current Report on Form 8-K dated July 31, 2007, SEC File No. 0-23837. |
| 2.3 | | Asset Purchase Agreement by and among SurModics, Inc., SurModics Pharmaceuticals, Inc., and Evonik Degussa Corporation dated as of November 1, 2011 — incorporated by reference to Exhibit 2.1 to the Company’s 8-K dated November 7, 2011, SEC File No. 0-23837. |
| 3.1 | | Restated Articles of Incorporation, as amended — incorporated by reference to Exhibit 3.1 to the Company’s Quarterly Report on Form 10-QSB for the quarter ended December 31, 1999, SEC File No. 0-23837. |
| 3.2 | | Restated Bylaws of the Company, as amended — incorporated by reference to Exhibit 3.2 to the Company’s Annual Report on Form 10-K for the fiscal year ended September 30, 2009, SEC File No. 0-23837. |
| 10.1* | | Company’s Incentive 1997 Stock Option Plan, including specimen of Incentive Stock Option Agreement — incorporated by reference to Exhibit 10.3 to the Company’s Registration Statement on form SB-2, Reg. No. 333-43217. |
| 10.2* | | Form of Restricted Stock Agreement under 1997 Plan — incorporated by reference to Exhibit 10.4 to the Company’s Registration Statement on form SB-2, Reg. No. 333-43217. |
| 10.3* | | Form of Non-qualified Stock Option Agreement under 1997 Plan — incorporated by reference to Exhibit 10.5 to the Company’s Registration Statement on form SB-2, Reg. No. 333-43217. |
| 10.4+ | | Adjusted License Agreement by and between the Company and Cordis Corporation effective as of January 1, 2003 — incorporated by reference to Exhibit 10.11 to the Company’s Annual Report on Form 10-K for the fiscal year ended September 30, 2002, SEC File No. 0-23837. |
| 10.5+ | | Reagent Supply Agreement by and between the Company and Cordis Corporation effective as of January 1, 2003 — incorporated by reference to Exhibit 10.12 to the Company’s Annual Report on Form 10-K for the fiscal year ended September 30, 2002, SEC File No. 0-23837. |
| 10.6* | | Form of officer acceptance regarding employment/compensation — incorporated by reference to Exhibit 10.9 to the Company’s Annual Report on Form 10-K for the fiscal year ended September 30, 2005, SEC File No. 0-23837. |
| 10.7* | | 2003 Equity Incentive Plan (as amended and restated December 13, 2005) (adopted December 13, 2005 by the board of directors and approved by the shareholders on January 30, 2006) — incorporated by reference to Exhibit 10.1 to the Company’s Form 8-K filed February 3, 2006, SEC File No. 0-23837. |
| 10.8* | | Form of SurModics, Inc. 2003 Equity Incentive Plan Nonqualified Stock Option Agreement — incorporated by reference to Exhibit 99.1 to the Company’s 8-K filed March 20, 2006, SEC File No. 0-23837. |
| 10.9* | | Form of SurModics, Inc. 2003 Equity Incentive Plan Incentive Stock Option Agreement — incorporated by reference to Exhibit 99.2 to the Company’s 8-K filed March 20, 2006, SEC File No. 0-23837. |
| 10.10* | | Form of SurModics, Inc. 2003 Equity Incentive Plan Restricted Stock Agreement — incorporated by reference to Exhibit 99.3 to the Company’s 8-K filed March 20, 2006, SEC File No. 0-23837. |
| | |
Exhibit | | |
| 10.11* | | Form of SurModics, Inc. 2003 Equity Incentive Plan Performance Share Award Agreement — incorporated by reference to Exhibit 99.4 to the Company’s 8-K filed March 20, 2006, SEC File No. 0-23837. |
| 10.12* | | Form of SurModics, Inc. 2003 Equity Incentive Plan Performance Unit Award (cash settled) Agreement — incorporated by reference to Exhibit 99.5 to the Company’s 8-K filed March 20, 2006, SEC File No. 0-23837. |
| 10.13* | | Form of SurModics, Inc. 2003 Equity Incentive Plan Restricted Stock Unit Agreement — incorporated by reference to Exhibit 99.6 to the Company’s 8-K filed March 20, 2006, SEC File No. 0-23837. |
| 10.14* | | Form of SurModics, Inc. 2003 Equity Incentive Plan Stock Appreciation Rights (cash settled) Agreement — incorporated by reference to Exhibit 99.7 to the Company’s 8-K filed March 20, 2006, SEC File No. 0-23837. |
| 10.15* | | Form of SurModics, Inc. 2003 Equity Incentive Plan Stock Appreciation Rights (stock settled) Agreement — incorporated by reference to Exhibit 99.8 to the Company’s 8-K filed March 20, 2006, SEC File No. 0-23837. |
| 10.16 | | Credit Agreement dated as of February 27, 2009, by and between SurModics, Inc. and Wells Fargo Bank, National Association as Sole Lead Arranger and Administrative Agent — incorporated by reference to Exhibit 10.1 to the Company’s Form 8-K filed March 4, 2009, SEC File No. 0-23837. |
| 10.17* | | Form of Incentive Stock Option Agreement for the SurModics, Inc. 2009 Equity Incentive Plan — incorporated by reference to Exhibit 10.2 to the Company’s 8-K filed February 12, 2010, SEC File No. 0- 23837. |
| 10.18* | | Form of Non-Statutory Stock Option Agreement for the SurModics, Inc. 2009 Equity Incentive Plan — incorporated by reference to Exhibit 10.3 to the Company’s 8-K filed February 12, 2010, SEC File No. 0-23837. |
| 10.19* | | Form of Performance Share Agreement for the SurModics, Inc. 2009 Equity Incentive Plan — incorporated by reference to Exhibit 10.4 to the Company’s 8-K filed February 12, 2010, SEC File No. 0-23837. |
| 10.20* | | Form of Restricted Stock Agreement for the SurModics, Inc. 2009 Equity Incentive Plan — incorporated by reference to Exhibit 10.5 to the Company’s 8-K filed February 12, 2010, SEC File No. 0-23837. |
| 10.21* | | SurModics, Inc. 2009 Equity Incentive Plan — incorporated by reference to Exhibit 10.1 to the Company’s Form 10-Q filed May 7, 2010, SEC File No. 0-23837. |
| 10.22* | | SurModics, Inc. 1999 Employee Stock Purchase Plan (as amended and restated November 30, 2009) — incorporated by reference to Exhibit 10.2 to the Company’s Form 10-Q filed May 7, 2010, SEC File No. 0-23837. |
| 10.23* | | The Company’s Board Compensation Policy, Amended and Restated as of February 8, 2010 – incorporated by reference to Exhibit 10.17 to the Company’s Annual Report on Form 10-K for the fiscal year ended September 30, 2010, SEC File No. 0-23837. |
| 10.24 | | Agreement by and among SurModics, Inc. and the Ramius Group dated as of January 5, 2011 — incorporated by reference to Exhibit 10.1 of the Company’s Current Report on Form 8-K filed on January 5, 2011, SEC File No. 0-23837. |
| 10.25* | | Offer Letter dated as of December 14, 2010 (in favor of Gary R. Maharaj executed by SurModics, Inc.) – incorporated by reference to Exhibit 10.1 of the Company’s Current Report on Form 10-Q filed on February 4, 2011, SEC File No. 0-23837. |
| 10.26* | | Severance Agreement by and between Gary R. Maharaj and SurModics, Inc. dated as of December 14, 2010 – incorporated by reference to Exhibit 10.2 of the Company’s Current Report on Form 10-Q on February 4, 2011, SEC File No. 0-23837. |
| 10.27 | | First Amendment to Credit Agreement dated as of February 28, 2011, by and between SurModics, Inc. and Wells Fargo Bank, National Association, as Sole Lead Arranger and Administrative Agent — incorporated by reference to Exhibit 10.1 of the Company’s 8-K filed on March 4, 2011, SEC File No. 0-23837. |
| | |
Exhibit | | |
| 21 | | Subsidiaries of the Registrant.** |
| 23 | | Consent of Deloitte & Touche LLP.** |
| 24 | | Power of Attorney (included on signature page of this Form 10-K).** |
| 31.1 | | Certification of Chief Executive Officer Pursuant to Section 302 of Sarbanes-Oxley Act of 2002.** |
| 31.2 | | Certification of Chief Financial Officer Pursuant to Section 302 of Sarbanes-Oxley Act of 2002.** |
| 32.1 | | Certification of Chief Executive Officer Pursuant to Section 906 of Sarbanes-Oxley Act of 2002.** |
| 32.2 | | Certification of Chief Financial Officer Pursuant to Section 906 of Sarbanes-Oxley Act of 2002.** |
101.INS**
101.SCH** 101.CAL** 101.LAB** 101.PRE** | | XBRL Instance Document*** XBRL Taxonomy Extension Schema Document*** XBRL Taxonomy Calculation Linkbase Document*** XBRL Taxonomy Extension Label Linkbase Document*** XBRL Taxonomy Extension Presentation Linkbase Document*** |
| * | Management contract or compensatory plan or arrangement |
| *** | XBRL (Extensible Business Reporting Language) information is furnished and not filed or a part of a registration statement or prospectus for purposes of Sections 11 or 12 of the Securities Act of 1933, as amended, is deemed not filed for purposes of Section 18 of the Securities Exchange Act of 1934, as amended, and otherwise is not subject to liability under these sections. |
| + | | Confidential treatment requested as to portions of the exhibit. Confidential portions omitted and provided separately to the Securities and Exchange Commission. |
53
REPORT OF INDEPENDENT REGISTERED PUBLIC ACCOUNTING FIRM
Board of Directors and Stockholders
We have audited the accompanying consolidated balance sheets of SurModics, Inc. and subsidiaries (the “Company”) as of September 30, 20102011 and 2009,2010, and the related consolidated statements of operations, stockholders’ equity, and cash flows for each of the three years in the period ended September 30, 2010.2011. Our audits also included the financial statement schedule listed in the Index at Item 15. These financial statements and financial statement schedule are the responsibility of the Company’s management. Our responsibility is to express an opinion on the financial statements and financial statement schedule based on our audits.
We conducted our audits in accordance with the standards of the Public Company Accounting Oversight Board (United States). Those standards require that we plan and perform the audit to obtain reasonable assurance about whether the financial statements are free of material misstatement. An audit includes examining, on a test basis, evidence supporting the amounts and disclosures in the financial statements. An audit also includes assessing the accounting principles used and significant estimates made by management, as well as evaluating the overall financial statement presentation. We believe that our audits provide a reasonable basis for our opinion.
In our opinion, such consolidated financial statements present fairly, in all material respects, the financial position of SurModics, Inc. and subsidiaries as of September 30, 20102011 and 2009,2010, and the results of their operations and their cash flows for each of the three years in the period ended September 30, 2010,2011, in conformity with accounting principles generally accepted in the United States of America. Also, in our opinion, such financial statement schedule, when considered in relation to the basic consolidated financial statements taken as a whole, presents fairly, in all material respects, the information set forth therein.
We have also audited, in accordance with the standards of the Public Company Accounting Oversight Board (United States), the Company’s internal control over financial reporting as of September 30, 2010,2011, based on the criteria established inInternal Control — Integrated Frameworkissued by the Committee of Sponsoring Organizations of the Treadway Commission and our report dated December 14, 2010,2011, expressed an unqualified opinion on the Company’s internal control over financial reporting.
/s/ DELOITTE & TOUCHE LLP
F-12011
SurModics, Inc. and Subsidiaries
| | | | | | | | | |
| | | 2010 | | | 2009 | |
| | | (In thousands, except share data) | |
| |
ASSETS |
| Current Assets | | | | | | | | |
| Cash and cash equivalents | | $ | 11,391 | | | $ | 11,636 | |
| Short-term investments | | | 9,105 | | | | 8,932 | |
| Accounts receivable, net of allowance for doubtful accounts of $461 and $82 as of September 30, 2010 and 2009, respectively | | | 8,987 | | | | 11,320 | |
| Inventories | | | 3,047 | | | | 3,330 | |
| Deferred tax asset | | | 247 | | | | 353 | |
| Prepaids and other | | | 4,701 | | | | 1,443 | |
| | | | | | | | | |
| Total Current Assets | | | 37,478 | | | | 37,014 | |
| | | | | | | | | |
| Property and equipment, net | | | 65,395 | | | | 66,915 | |
| Long-term investments | | | 36,290 | | | | 27,300 | |
| Deferred tax asset | | | 2,606 | | | | 2,548 | |
| Intangible assets, net | | | 15,257 | | | | 17,458 | |
| Goodwill | | | 8,010 | | | | 21,070 | |
| Other assets, net | | | 5,243 | | | | 13,257 | |
| | | | | | | | | |
| Total Assets | | $ | 170,279 | | | $ | 185,562 | |
| | | | | | | | | |
| |
| LIABILITIES AND STOCKHOLDERS’ EQUITY |
| Current Liabilities | | | | | | | | |
| Accounts payable | | $ | 3,341 | | | $ | 3,468 | |
| Accrued liabilities: | | | | | | | | |
| Compensation | | | 930 | | | | 926 | |
| Accrued income taxes payable | | | — | | | | 186 | |
| Accrued other | | | 1,753 | | | | 1,637 | |
| Deferred revenue | | | 562 | | | | 905 | |
| Other current liabilities | | | 1,061 | | | | 862 | |
| | | | | | | | | |
| Total Current Liabilities | | | 7,647 | | | | 7,984 | |
| Deferred revenue, less current portion | | | 3,598 | | | | 623 | |
| Other long-term liabilities | | | 4,675 | | | | 4,583 | |
| | | | | | | | | |
| Total Liabilities | | | 15,920 | | | | 13,190 | |
| | | | | | | | | |
| Commitments and Contingencies (Note 9) | | | | | | | | |
| Stockholders’ Equity | | | | | | | | |
| Series A preferred stock — $.05 par value, 450,000 shares authorized; | | | | | | | | |
| no shares issued and outstanding | | | — | | | | — | |
| Common stock — $.05 par value, 45,000,000 shares authorized; 17,423,601 and 17,471,472 shares issued and outstanding | | | 871 | | | | 874 | |
| Additional paid-in capital | | | 69,702 | | | | 66,005 | |
| Accumulated other comprehensive income | | | 886 | | | | 1,504 | |
| Retained earnings | | | 82,900 | | | | 103,989 | |
| | | | | | | | | |
| Total Stockholders’ Equity | | | 154,359 | | | | 172,372 | |
| | | | | | | | | |
| Total Liabilities and Stockholders’ Equity | | $ | 170,279 | | | $ | 185,562 | |
| | | | | | | | | |
| | | | | | | | |
| | | 2011 | | | 2010 | |
| | | (In thousands, except share data) | |
| ASSETS | |
Current Assets: | | | | | | | | |
Cash and cash equivalents | | $ | 23,217 | | | $ | 11,391 | |
Available-for-sale securities | | | 12,196 | | | | 8,093 | |
Held-to-maturity securities | | | 3,030 | | | | 1,012 | |
Accounts receivable, net of allowance for doubtful accounts of $155 and $461 as of September 30, 2011 and 2010, respectively | | | 7,694 | | | | 8,987 | |
Inventories | | | 4,150 | | | | 3,047 | |
Deferred tax assets | | | 376 | | | | 247 | |
Prepaids and other | | | 3,101 | | | | 4,701 | |
| | | | | | | | |
Total Current Assets | | | 53,764 | | | | 37,478 | |
| | | | | | | | |
Property and equipment, net | | | 47,926 | | | | 65,395 | |
Available-for-sale securities | | | 29,754 | | | | 33,178 | |
Held-to-maturity securities | | | — | | | | 3,112 | |
Deferred tax assets | | | 9,029 | | | | 2,606 | |
Intangible assets, net | | | 10,629 | | | | 15,257 | |
Goodwill | | | 8,010 | | | | 8,010 | |
Other assets, net | | | 3,542 | | | | 5,243 | |
| | | | | | | | |
Total Assets | | $ | 162,654 | | | $ | 170,279 | |
| | | | | | | | |
|
| LIABILITIES AND STOCKHOLDERS’ EQUITY | |
Current Liabilities: | | | | | | | | |
Accounts payable | | $ | 2,421 | | | $ | 3,341 | |
Accrued liabilities: | | | | | | | | |
Compensation | | | 3,474 | | | | 930 | |
Accrued other | | | 1,933 | | | | 1,753 | |
Deferred revenue | | | 603 | | | | 562 | |
Other current liabilities | | | 2,609 | | | | 1,061 | |
| | | | | | | | |
Total Current Liabilities | | | 11,040 | | | | 7,647 | |
Deferred revenue, less current portion | | | 3,594 | | | | 3,598 | |
Other long-term liabilities | | | 2,684 | | | | 4,675 | |
| | | | | | | | |
Total Liabilities | | | 17,318 | | | | 15,920 | |
| | | | | | | | |
Commitments and Contingencies (Note 9) | | | | | | | | |
Stockholders’ Equity: | | | | | | | | |
Series A preferred stock — $.05 par value, 450,000 shares authorized; no shares issued and outstanding | | | — | | | | — | |
Common stock — $.05 par value, 45,000,000 shares authorized; 17,531,408 and 17,423,601 shares issued and outstanding | | | 877 | | | | 871 | |
Additional paid-in capital | | | 74,490 | | | | 69,702 | |
Accumulated other comprehensive (loss) income | | | (153 | ) | | | 886 | |
Retained earnings | | | 70,122 | | | | 82,900 | |
| | | | | | | | |
Total Stockholders’ Equity | | | 145,336 | | | | 154,359 | |
| | | | | | | | |
Total Liabilities and Stockholders’ Equity | | $ | 162,654 | | | $ | 170,279 | |
| | | | | | | | |
The accompanying notes are an integral part of these consolidated financial statements.
F-2
SurModics, Inc. and Subsidiaries
For the Years Ended September 30
| | | | | | | | | | | | | |
| | | 2010 | | | 2009 | | | 2008 | |
| | | (In thousands, except net
| |
| | | income (loss) per share) | |
| |
| Revenue | | | | | | | | | | | | |
| Royalties and license fees | | $ | 34,277 | | | $ | 75,464 | | | $ | 51,788 | |
| Product sales | | | 20,184 | | | | 19,333 | | | | 20,052 | |
| Research and development | | | 15,437 | | | | 26,737 | | | | 25,211 | |
| | | | | | | | | | | | | |
| Total revenue | | | 69,898 | | | | 121,534 | | | | 97,051 | |
| | | | | | | | | | | | | |
| Operating costs and expenses | | | | | | | | | | | | |
| Product | | | 9,425 | | | | 7,508 | | | | 8,476 | |
| Customer research and development | | | 18,147 | | | | 13,183 | | | | 19,187 | |
| Other research and development | | | 17,916 | | | | 21,179 | | | | 21,311 | |
| Selling, general and administrative | | | 18,451 | | | | 17,200 | | | | 20,816 | |
| Purchased in-process research and development | | | — | | | | 3,200 | | | | — | |
| Restructuring charges | | | 1,306 | | | | 1,763 | | | | — | |
| Asset impairment charges | | | 4,896 | | | | — | | | | — | |
| Goodwill impairment charge | | | 13,810 | | | | — | | | | — | |
| | | | | | | | | | | | | |
| Total operating costs and expenses | | | 83,951 | | | | 64,033 | | | | 69,790 | |
| | | | | | | | | | | | | |
| (Loss) income from operations | | | (14,053 | ) | | | 57,501 | | | | 27,261 | |
| | | | | | | | | | | | | |
| Other (loss) income | | | | | | | | | | | | |
| Investment income, net | | | 1,023 | | | | 1,839 | | | | 3,329 | |
| Impairment loss on investments | | | (7,943 | ) | | | — | | | | (4,314 | ) |
| Other income, net | | | 314 | | | | 184 | | | | 616 | |
| | | | | | | | | | | | | |
| Other (loss) income, net | | | (6,606 | ) | | | 2,023 | | | | (369 | ) |
| | | | | | | | | | | | | |
| (Loss) income before income taxes | | | (20,659 | ) | | | 59,524 | | | | 26,892 | |
| Income tax provision | | | (430 | ) | | | (21,974 | ) | | | (12,153 | ) |
| | | | | | | | | | | | | |
| Net (loss) income | | $ | (21,089 | ) | | $ | 37,550 | | | $ | 14,739 | |
| | | | | | | | | | | | | |
| Basic net (loss) income per share | | $ | (1.21 | ) | | $ | 2.15 | | | $ | 0.82 | |
| Diluted net (loss) income per share | | $ | (1.21 | ) | | $ | 2.15 | | | $ | 0.80 | |
| Weighted average shares outstanding | | | | | | | | | | | | |
| Basic | | | 17,372 | | | | 17,435 | | | | 18,026 | |
| Dilutive effect of outstanding stock options and non-vested stock | | | — | | | | 34 | | | | 304 | |
| | | | | | | | | | | | | |
| Diluted | | | 17,372 | | | | 17,469 | | | | 18,330 | |
| | | | | | | | | | | | |
| | | 2011 | | | 2010 | | | 2009 | |
| | | (In thousands, except net | |
| | | (loss) income per share) | |
Revenue: | | | | | | | | | | | | |
Royalties and license fees | | $ | 30,583 | | | $ | 34,277 | | | $ | 75,464 | |
Product sales | | | 22,965 | | | | 20,184 | | | | 19,333 | |
Research and development | | | 14,233 | | | | 15,437 | | | | 26,737 | |
| | | | | | | | | | | | |
Total revenue | | | 67,781 | | | | 69,898 | | | | 121,534 | |
| | | | | | | | | | | | |
Operating costs and expenses: | | | | | | | | | | | | |
Product | | | 8,315 | | | | 9,425 | | | | 7,508 | |
Customer research and development | | | 18,412 | | | | 18,147 | | | | 13,183 | |
Other research and development | | | 12,244 | | | | 17,916 | | | | 21,179 | |
Selling, general and administrative | | | 20,545 | | | | 18,451 | | | | 17,200 | |
Purchased in-process research and development | | | — | | | | — | | | | 3,200 | |
Restructuring charges | | | 2,243 | | | | 1,306 | | | | 1,763 | |
Asset impairment charges | | | 17,890 | | | | 4,896 | | | | — | |
Goodwill impairment charges | | | 5,650 | | | | 13,810 | | | | — | |
| | | | | | | | | | | | |
Total operating costs and expenses | | | 85,299 | | | | 83,951 | | | | 64,033 | |
| | | | | | | | | | | | |
(Loss) income from operations | | | (17,518 | ) | | | (14,053 | ) | | | 57,501 | |
| | | | | | | | | | | | |
Other income (loss): | | | | | | | | | | | | |
Investment income, net | | | 625 | | | | 1,023 | | | | 1,839 | |
Impairment loss on cost method investments | | | — | | | | (7,943 | ) | | | — | |
Other income, net | | | 401 | | | | 314 | | | | 184 | |
| | | | | | | | | | | | |
Other income (loss), net | | | 1,026 | | | | (6,606 | ) | | | 2,023 | |
| | | | | | | | | | | | |
(Loss) income before income taxes | | | (16,492 | ) | | | (20,659 | ) | | | 59,524 | |
Income tax benefit (provision) | | | 3,714 | | | | (430 | ) | | | (21,974 | ) |
| | | | | | | | | | | | |
Net (loss) income | | $ | (12,778 | ) | | $ | (21,089 | ) | | $ | 37,550 | |
| | | | | | | | | | | | |
Basic net (loss) income per share | | $ | (0.73 | ) | | $ | (1.21 | ) | | $ | 2.15 | |
Diluted net (loss) income per share | | $ | (0.73 | ) | | $ | (1.21 | ) | | $ | 2.15 | |
Weighted average number of shares outstanding: | | | | | | | | | | | | |
Basic | | | 17,419 | | | | 17,372 | | | | 17,435 | |
Dilutive effect of outstanding stock options and non-vested stock | | | — | | | | — | | | | 34 | |
| | | | | | | | | | | | |
Diluted | | | 17,419 | | | | 17,372 | | | | 17,469 | |
The accompanying notes are an integral part of these consolidated financial statements.
F-3
SurModics, Inc. and Subsidiaries
For the Years Ended September 30, 2011, 2010 2009 and 20082009
| | | | | | | | | | | | | | | | | | | | | | | | | |
| | | | | | | | | | | | Accumulated
| | | | | | | |
| | | | | | | | | Additional
| | | Other
| | | | | | Total
| |
| | | Common Stock | | | Paid-In
| | | Comprehensive
| | | Retained
| | | Stockholders’
| |
| | | Shares | | | Amount | | | Capital | | | Income (Loss) | | | Earnings | | | Equity | |
| | | (In thousands) | |
| |
| Balance September 30, 2007 | | | 18,165 | | | $ | 909 | | | $ | 76,670 | | | $ | 1,723 | | | $ | 51,620 | | | $ | 130,922 | |
| Components of comprehensive income, net of tax: | | | | | | | | | | | | | | | | | | | | | | | | |
| Net income | | | — | | | | — | | | | — | | | | — | | | | 14,739 | | | | 14,739 | |
| Unrealized holding losses on available-for-sale securities arising during the period | | | — | | | | — | | | | — | | | | (5,882 | ) | | | — | | | | (5,882 | ) |
| Add reclassification for losses included in net income, net of tax provision of $167 | | | — | | | | — | | | | — | | | | 4,052 | | | | — | | | | 4,052 | |
| | | | | | | | | | | | | | | | | | | | | | | | | |
| Comprehensive income | | | — | | | | — | | | | — | | | | — | | | | — | | | | 12,909 | |
| | | | | | | | | | | | | | | | | | | | | | | | | |
| Issuance of common stock | | | 16 | | | | 1 | | | | 516 | | | | — | | | | — | | | | 517 | |
| Common stock repurchased | | | (342 | ) | | | (17 | ) | | | (13,954 | ) | | | — | | | | — | | | | (13,971 | ) |
| Common stock options exercised, net | | | 114 | | | | 4 | | | | 2,514 | | | | — | | | | — | | | | 2,518 | |
| Purchase of common stock to pay employee taxes | | | 77 | | | | 4 | | | | (1,678 | ) | | | — | | | | — | | | | (1,674 | ) |
| Excess tax benefit from stock-based compensation plans | | | — | | | | — | | | | 1,081 | | | | — | | | | — | | | | 1,081 | |
| Stock-based compensation | | | — | | | | — | | | | 9,652 | | | | — | | | | — | | | | 9,652 | |
| Other | | | — | | | | — | | | | (228 | ) | | | — | | | | — | | | | (228 | ) |
| Accounting change for income taxes | | | — | | | | — | | | | — | | | | — | | | | 80 | | | | 80 | |
| | | | | | | | | | | | | | | | | | | | | | | | | |
| Balance September 30, 2008 | | | 18,030 | | | | 901 | | | | 74,573 | | | | (107 | ) | | | 66,439 | | | | 141,806 | |
| Components of comprehensive income, | | | | | | | | | | | | | | | | | | | | | | | | |
| net of tax: | | | | | | | | | | | | | | | | | | | | | | | | |
| Net income | | | — | | | | — | | | | — | | | | — | | | | 37,550 | | | | 37,550 | |
| Unrealized holding gains on available-for-sale securities arising during the period | | | — | | | | — | | | | — | | | | 2,123 | | | | — | | | | 2,123 | |
| Add reclassification for gains included in net income, net of tax provision of $299 | | | — | | | | — | | | | — | | | | (512 | ) | | | — | | | | (512 | ) |
| | | | | | | | | | | | | | | | | | | | | | | | | |
| Comprehensive income | | | — | | | | — | | | | — | | | | — | | | | — | | | | 39,161 | |
| | | | | | | | | | | | | | | | | | | | | | | | | |
| Issuance of common stock | | | 40 | | | | 2 | | | | 611 | | | | — | | | | — | | | | 613 | |
| Common stock repurchased | | | (624 | ) | | | (31 | ) | | | (14,967 | ) | | | — | | | | — | | | | (14,998 | ) |
| Common stock options exercised, net | | | 15 | | | | 1 | | | | 65 | | | | — | | | | — | | | | 66 | |
| Purchase of common stock to pay employee taxes | | | 10 | | | | 1 | | | | (569 | ) | | | — | | | | — | | | | (568 | ) |
| Excess tax benefit from stock-based compensation plans | | | — | | | | — | | | | (366 | ) | | | — | | | | — | | | | (366 | ) |
| Stock-based compensation | | | — | | | | — | | | | 6,853 | | | | — | | | | — | | | | 6,853 | |
| Other | | | — | | | | — | | | | (195 | ) | | | — | | | | — | | | | (195 | ) |
| | | | | | | | | | | | | | | | | | | | | | | | | |
| Balance September 30, 2009 | | | 17,471 | | | | 874 | | | | 66,005 | | | | 1,504 | | | | 103,989 | | | | 172,372 | |
| Components of comprehensive loss, | | | | | | | | | | | | | | | | | | | | | | | | |
| net of tax: | | | | | | | | | | | | | | | | | | | | | | | | |
| Net loss | | | — | | | | — | | | | — | | | | — | | | | (21,089 | ) | | | (21,089 | ) |
| Unrealized holding losses on available-for-sale securities arising during the period | | | — | | | | — | | | | — | | | | (437 | ) | | | — | | | | (437 | ) |
| Add reclassification for gains included in net loss, net of tax benefit of $118 | | | — | | | | — | | | | — | | | | (181 | ) | | | — | | | | (181 | ) |
| | | | | | | | | | | | | | | | | | | | | | | | | |
| Comprehensive loss | | | | | | | | | | | | | | | | | | | | | | | (21,707 | ) |
| | | | | | | | | | | | | | | | | | | | | | | | | |
| Issuance of common stock | | | 40 | | | | 2 | | | | 608 | | | | — | | | | — | | | | 610 | |
| Common stock repurchased | | | (102 | ) | | | (6 | ) | | | (2,026 | ) | | | — | | | | — | | | | (2,032 | ) |
| Common stock options exercised, net | | | 14 | | | | 1 | | | | 281 | | | | — | | | | — | | | | 282 | |
| Purchase of common stock to pay employee taxes | | | 1 | | | | — | | | | (545 | ) | | | | | | | | | | | (545 | ) |
| Excess tax benefit from stock-based compensation plans | | | — | | | | — | | | | (496 | ) | | | — | | | | — | | | | (496 | ) |
| Stock-based compensation | | | — | | | | — | | | | 5,875 | | | | — | | | | — | | | | 5,875 | |
| | | | | | | | | | | | | | | | | | | | | | | | | |
| Balance September 30, 2010 | | | 17,424 | | | $ | 871 | | | $ | 69,702 | | | $ | 886 | | | $ | 82,900 | | | $ | 154,359 | |
| | | | | | | | | | | | | | | | | | | | | | | | | |
| | | | | | | | | | | | | | | | | | | | | | | | |
| | | | | | Additional
Paid-In
Capital | | | Accumulated
Other
Comprehensive
Income (Loss) | | | Retained
Earnings | | | Total
Stockholders’
Equity | |
| | | | | | | | |
| | | Common Stock | | | | | |
| | | Shares | | | Amount | | | | | |
| | | (In thousands) | |
Balance at September 30, 2008 | | | 18,030 | | | $ | 901 | | | $ | 74,573 | | | $ | (107 | ) | | $ | 66,439 | | | $ | 141,806 | |
Components of comprehensive income, net of tax: | | | | | | | | | | | | | | | | | | | | | | | | |
Net income | | | — | | | | — | | | | — | | | | — | | | | 37,550 | | | | 37,550 | |
Unrealized holding gains on available-for-sale securities arising during the period | | | — | | | | — | | | | — | | | | 2,123 | | | | — | | | | 2,123 | |
Add reclassification for gains included in net income, net of tax provision of $299 | | | — | | | | — | | | | — | | | | (512 | ) | | | — | | | | (512 | ) |
| | | | | | | | | | | | | | | | | | | | | | | | |
Comprehensive income | | | | | | | | | | | | | | | | | | | | | | | 39,161 | |
| | | | | | | | | | | | | | | | | | | | | | | | |
Issuance of common stock | | | 40 | | | | 2 | | | | 611 | | | | — | | | | — | | | | 613 | |
Common stock repurchased | | | (624 | ) | | | (31 | ) | | | (14,967 | ) | | | — | | | | — | | | | (14,998 | ) |
Common stock options exercised, net | | | 15 | | | | 1 | | | | 65 | | | | — | | | | — | | | | 66 | |
Purchase of common stock to pay employee taxes | | | 10 | | | | 1 | | | | (569 | ) | | | — | | | | — | | | | (568 | ) |
Reduction of tax benefit from stock-based compensation plans | | | — | | | | — | | | | (366 | ) | | | — | | | | — | | | | (366 | ) |
Stock-based compensation | | | — | | | | — | | | | 6,853 | | | | — | | | | — | | | | 6,853 | |
Other | | | — | | | | — | | | | (195 | ) | | | — | | | | — | | | | (195 | ) |
| | | | | | | | | | | | | | | | | | | | | | | | |
Balance at September 30, 2009 | | | 17,471 | | | | 874 | | | | 66,005 | | | | 1,504 | | | | 103,989 | | | | 172,372 | |
Components of comprehensive loss, net of tax: | | | | | | | | | | | | | | | | | | | | | | | | |
Net loss | | | — | | | | — | | | | — | | | | — | | | | (21,089 | ) | | | (21,089 | ) |
Unrealized holding losses on available-for-sale securities arising during the period | | | — | | | | — | | | | — | | | | (437 | ) | | | — | | | | (437 | ) |
Add reclassification for gains included in net loss, net of tax provision of $118 | | | — | | | | — | | | | — | | | | (181 | ) | | | — | | | | (181 | ) |
| | | | | | | | | | | | | | | | | | | | | | | | |
Comprehensive loss | | | | | | | | | | | | | | | | | | | | | | | (21,707 | ) |
| | | | | | | | | | | | | | | | | | | | | | | | |
Issuance of common stock | | | 40 | | | | 2 | | | | 608 | | | | — | | | | — | | | | 610 | |
Common stock repurchased | | | (102 | ) | | | (6 | ) | | | (2,026 | ) | | | — | | | | — | | | | (2,032 | ) |
Common stock options exercised, net | | | 14 | | | | 1 | | | | 281 | | | | — | | | | — | | | | 282 | |
Purchase of common stock to pay employee taxes | | | 1 | | | | — | | | | (545 | ) | | | — | | | | — | | | | (545 | ) |
Reduction of tax benefit from stock-based compensation plans | | | — | | | | — | | | | (496 | ) | | | — | | | | — | | | | (496 | ) |
Stock-based compensation | | | — | | | | — | | | | 5,875 | | | | — | | | | — | | | | 5,875 | |
| | | | | | | | | | | | | | | | | | | | | | | | |
Balance at September 30, 2010 | | | 17,424 | | | | 871 | | | | 69,702 | | | | 886 | | | | 82,900 | | | | 154,359 | |
Components of comprehensive income, net of tax: | | | | | | | | | | | | | | | | | | | | | | | | |
Net loss | | | — | | | | — | | | | — | | | | — | | | | (12,778 | ) | | | (12,778 | ) |
Unrealized holding losses on available-for-sale securities arising during the period | | | — | | | | — | | | | — | | | | (804 | ) | | | — | | | | (804 | ) |
Add reclassification for gains included in net loss, net of tax provision of $144 | | | — | | | | — | | | | — | | | | (235 | ) | | | — | | | | (235 | ) |
| | | | | | | | | | | | | | | | | | | | | | | | |
Comprehensive loss | | | | | | | | | | | | | | | | | | | | | | | (13,817 | ) |
| | | | | | | | | | | | | | | | | | | | | | | | |
Issuance of common stock | | | 55 | | | | 3 | | | | 571 | | | | — | | | | — | | | | 574 | |
Purchase of common stock to pay employee taxes | | | 52 | | | | 3 | | | | (43 | ) | | | — | | | | — | | | | (40 | ) |
Excess tax benefit from stock-based compensation plans | | | — | | | | — | | | | 8 | | | | — | | | | — | | | | 8 | |
Stock-based compensation | | | — | | | | — | | | | 4,252 | | | | — | | | | — | | | | 4,252 | |
| | | | | | | | | | | | | | | | | | | | | | | | |
Balance at September 30, 2011 | | | 17,531 | | | $ | 877 | | | $ | 74,490 | | | $ | (153 | ) | | $ | 70,122 | | | $ | 145,336 | |
| | | | | | | | | | | | | | | | | | | | | | | | |
The accompanying notes are an integral part of these consolidated financial statements.
F-4
SurModics, Inc. and Subsidiaries
For the Years Ended September 30
| | | | | | | | | | | | | |
| | | 2010 | | | 2009 | | | 2008 | |
| | | (In thousands) | |
| |
| Operating Activities | | | | | | | | | | | | |
| Net (loss) income | | $ | (21,089 | ) | | $ | 37,550 | | | $ | 14,739 | |
| Adjustments to reconcile net (loss) income to net cash provided by | | | | | | | | | | | | |
| operating activities: | | | | | | | | | | | | |
| Depreciation and amortization | | | 7,818 | | | | 5,912 | | | | 6,071 | |
| (Gain) loss on equity method investments and sales of investments | | | (299 | ) | | | (103 | ) | | | 415 | |
| Amortization of premium on investments | | | 128 | | | | 139 | | | | 70 | |
| Impairment loss on investments | | | 7,943 | | | | — | | | | 4,314 | |
| Stock-based compensation | | | 5,875 | | | | 6,853 | | | | 9,652 | |
| Purchased in-process research & development | | | — | | | | 3,200 | | | | — | |
| Asset impairment charges | | | 4,896 | | | | — | | | | — | |
| Goodwill impairment charge | | | 13,810 | | | | — | | | | — | |
| Deferred tax | | | 446 | | | | 8,229 | | | | (3,428 | ) |
| Excess tax benefit from stock-based compensation plans | | | 496 | | | | 366 | | | | (1,081 | ) |
| Loss on disposals of property and equipment | | | 3 | | | | 291 | | | | 78 | |
| Other | | | — | | | | (250 | ) | | | — | |
| Change in operating assets and liabilities: | | | | | | | | | | | | |
| Accounts receivable | | | 2,333 | | | | 3,269 | | | | 1,548 | |
| Inventories | | | 284 | | | | (679 | ) | | | (154 | ) |
| Accounts payable and accrued liabilities | | | 1,135 | | | | (624 | ) | | | (264 | ) |
| Income taxes | | | (4,121 | ) | | | 2,656 | | | | (5,003 | ) |
| Deferred revenue | | | 2,632 | | | | (36,050 | ) | | | 11,452 | |
| Prepaids and other | | | (282 | ) | | | 562 | | | | 1,413 | |
| | | | | | | | | | | | | |
| Net cash provided by operating activities | | | 22,008 | | | | 31,321 | | | | 39,822 | |
| | | | | | | | | | | | | |
| Investing Activities | | | | | | | | | | | | |
| Purchases of property and equipment | | | (9,679 | ) | | | (29,364 | ) | | | (23,866 | ) |
| Sales of property and equipment | | | — | | | | — | | | | 32 | |
Purchases ofavailable-for-sale investments | | | (34,919 | ) | | | (33,568 | ) | | | (22,857 | ) |
| Sales/maturities of investments | | | 25,986 | | | | 55,263 | | | | 29,258 | |
Purchases ofheld-to-maturity investments | | | — | | | | — | | | | (6,485 | ) |
| Investment in other strategic assets | | | (500 | ) | | | (2,500 | ) | | | (2,562 | ) |
| Purchase of licenses and patents | | | (210 | ) | | | (631 | ) | | | (2,452 | ) |
| Acquisitions, net of cash acquired | | | (750 | ) | | | (8,585 | ) | | | (3,219 | ) |
| Repayment of notes receivable | | | — | | | | — | | | | 5,870 | |
| Other investing activities | | | — | | | | (187 | ) | | | (228 | ) |
| | | | | | | | | | | | | |
| Net cash used in investing activities | | | (20,072 | ) | | | (19,572 | ) | | | (26,509 | ) |
| | | | | | | | | | | | | |
| Financing Activities | | | | | | | | | | | | |
| Excess tax benefit from stock-based compensation plans | | | (496 | ) | | | (366 | ) | | | 1,081 | |
| Issuance of common stock | | | 892 | | | | 679 | | | | 3,037 | |
| Repurchase of common stock | | | (2,032 | ) | | | (14,998 | ) | | | (13,971 | ) |
| Purchase of common stock to pay employee taxes | | | (545 | ) | | | (568 | ) | | | (1,674 | ) |
| Repayment of notes payable | | | — | | | | (236 | ) | | | (222 | ) |
| | | | | | | | | | | | | |
| Net cash used in financing activities | | | (2,181 | ) | | | (15,489 | ) | | | (11,749 | ) |
| | | | | | | | | | | | | |
| Net change in cash and cash equivalents | | | (245 | ) | | | (3,740 | ) | | | 1,564 | |
| Cash and Cash Equivalents | | | | | | | | | | | | |
| Beginning of year | | | 11,636 | | | | 15,376 | | | | 13,812 | |
| | | | | | | | | | | | | |
| End of year | | $ | 11,391 | | | $ | 11,636 | | | $ | 15,376 | |
| | | | | | | | | | | | | |
| Supplemental Information | | | | | | | | | | | | |
| Cash paid for income taxes | | $ | 4,105 | | | $ | 11,285 | | | $ | 21,058 | |
| Noncash transaction — acquisition of property, | | | | | | | | | | | | |
| plant, and equipment on account | | $ | 565 | | | $ | 1,247 | | | $ | 1,745 | |
| Noncash transaction — acquisition of intangibles on account | | $ | — | | | $ | 210 | | | $ | — | |
| | | | | | | | | | | | |
| | | 2011 | | | 2010 | | | 2009 | |
| | | (In thousands) | |
Operating Activities: | | | | | | | | | | | | |
Net (loss) income | | $ | (12,778 | ) | | $ | (21,089 | ) | | $ | 37,550 | |
Adjustments to reconcile net (loss) income to net cash provided by operating activities: | | | | | | | | | | | | |
Depreciation and amortization | | | 7,145 | | | | 7,818 | | | | 5,912 | |
Asset impairment charges | | | 17,890 | | | | 4,896 | | | | — | |
Goodwill impairment charges | | | 5,650 | | | | 13,810 | | | | — | |
Gains on sales of securities and equity method investment losses, net | | | (380 | ) | | | (299 | ) | | | (103 | ) |
Amortization of premium on held-to-maturity securities | | | 93 | | | | 128 | | | | 139 | |
Impairment loss on cost method investments | | | — | | | | 7,943 | | | | — | |
Stock-based compensation | | | 4,252 | | | | 5,875 | | | | 6,853 | |
Purchased in-process research and development | | | — | | | | — | | | | 3,200 | |
Deferred tax | | | (5,892 | ) | | | 446 | | | | 8,229 | |
(Excess) reduction of tax benefit from stock-based compensation plans | | | (8 | ) | | | 496 | | | | 366 | |
Loss on disposals of property and equipment | | | 164 | | | | 3 | | | | 291 | |
Other | | | — | | | | — | | | | (250 | ) |
Change in operating assets and liabilities: | | | | | | | | | | | | |
Accounts receivable | | | 1,293 | | | | 2,333 | | | | 3,269 | |
Inventories | | | (1,103 | ) | | | 284 | | | | (679 | ) |
Accounts payable and accrued liabilities | | | 1,949 | | | | 1,135 | | | | (624 | ) |
Income taxes | | | 1,168 | | | | (4,121 | ) | | | 2,656 | |
Deferred revenue | | | 37 | | | | 2,632 | | | | (36,050 | ) |
Prepaids and other | | | 475 | | | | (282 | ) | | | 562 | |
| | | | | | | | | | | | |
Net cash provided by operating activities | | | 19,955 | | | | 22,008 | | | | 31,321 | |
| | | | | | | | | | | | |
Investing Activities: | | | | | | | | | | | | |
Purchases of property and equipment | | | (3,459 | ) | | | (9,679 | ) | | | (29,364 | ) |
Purchases of available-for-sale securities | | | (50,926 | ) | | | (34,919 | ) | | | (33,568 | ) |
Sales and maturities of available-for-sale securities | | | 50,364 | | | | 23,986 | | | | 55,263 | |
Maturities of held-to-maturity securities | | | 1,000 | | | | 2,000 | | | | — | |
Investment in other strategic assets | | | — | | | | (500 | ) | | | (2,500 | ) |
Purchase of licenses and patents | | | — | | | | (210 | ) | | | (631 | ) |
Payments related to a prior business acquisition | | | (5,650 | ) | | | (750 | ) | | | (8,585 | ) |
Other investing activities | | | — | | | | — | | | | (187 | ) |
| | | | | | | | | | | | |
Net cash used in investing activities | | | (8,671 | ) | | | (20,072 | ) | | | (19,572 | ) |
| | | | | | | | | | | | |
Financing Activities: | | | | | | | | | | | | |
Excess (reduction of) tax benefit from stock-based compensation plans | | | 8 | | | | (496 | ) | | | (366 | ) |
Issuance of common stock | | | 574 | | | | 892 | | | | 679 | |
Repurchase of common stock | | | — | | | | (2,032 | ) | | | (14,998 | ) |
Purchase of common stock to pay employee taxes | | | (40 | ) | | | (545 | ) | | | (568 | ) |
Repayment of notes payable | | | — | | | | — | | | | (236 | ) |
| | | | | | | | | | | | |
Net cash provided by (used in) financing activities | | | 542 | | | | (2,181 | ) | | | (15,489 | ) |
| | | | | | | | | | | | |
Net change in cash and cash equivalents | | | 11,826 | | | | (245 | ) | | | (3,740 | ) |
Cash and Cash Equivalents: | | | | | | | | | | | | |
Beginning of year | | | 11,391 | | | | 11,636 | | | | 15,376 | |
| | | | | | | | | | | | |
End of year | | $ | 23,217 | | | $ | 11,391 | | | $ | 11,636 | |
| | | | | | | | | | | | |
Supplemental Information: | | | | | | | | | | | | |
Cash paid for income taxes | | $ | 1,010 | | | $ | 4,105 | | | $ | 11,285 | |
Noncash transaction — acquisition of property, plant and equipment on account | | $ | 209 | | | $ | 565 | | | $ | 1,247 | |
Noncash transaction — acquisition of intangibles on account | | $ | — | | | $ | — | | | $ | 210 | |
The accompanying notes are an integral part of these consolidated financial statements.
F-5
SurModics, Inc. and Subsidiaries
September 30, 20102011 and 20092010
SurModics, Inc. and subsidiaries (the “Company”) develops, manufactures and markets innovative drug delivery and surface modification technologies for the healthcare industry. The Company’s revenue is derived from three primary sources: (1) royalties and license fees from licensing its patented drug delivery and surface modification technologies andin vitrodiagnostic formats to customers; (2) the sale of polymers and reagent chemicals to licensees; substrates, antigens and stabilization products to the diagnostics industry; microarray slides to the diagnostic and biomedical research markets; and (3) research and development fees generated on projects for customers.
The consolidated financial statements include all accounts and wholly ownedwholly-owned subsidiaries, and have been prepared in accordance with accounting principles generally accepted in the United States of America (GAAP)(“GAAP”). All significant inter-company transactions have been eliminated.
Subsequent EventsCorrection of Presentation of Available-for-Sale and Held-to-Maturity Securities
Subsequent eventsThe Company has corrected the presentation of certain security investments in the fiscal 2010 consolidated financial statements, to present investments in available-for-sale and held-to-maturity securities separately. In the accompanying consolidated balance sheet as of September 30, 2010, $8.1 million of available-for-sale short-term securities, $1.0 million of held-to-maturity short-term securities, $33.2 million of available-for–sale long-term securities, and $3.1 million of held-to-maturity long-term securities have been evaluated throughdisclosed separately. Previously these securities were combined as part of short-term and long-term investments, respectively. In addition, the dateconsolidated statement of cash flows for fiscal 2010 has been corrected to present separately $24.0 million of maturities of available-for-sale securities and $2.0 million of maturities of held-to-maturity securities which were previously included in the financial statements were issued.
sales and maturities of securities category.Subsequent Event
On October 14, 2010November 1, 2011, the Company announced an organizational changethat it had entered into a definitive agreement to reducesell substantially all of its cost structureSurModics Pharmaceuticals, Inc. (“SurModics Pharmaceuticals”) assets for $30.0 million in cash to Evonik Degussa Corporation (“Evonik”). Under the terms of the asset purchase agreement, the entire portfolio of products and renew its focusservices of SurModics Pharmaceuticals, including the Company’s Current Good Manufacturing Practices (“cGMP”) development and manufacturing facility located in Birmingham, Alabama, were sold. The sale closed on business units.November 17, 2011. The Company reorganized into three market-focused business units: Medical Device,will report the Pharmaceuticals and In Vitro Diagnostics (IVD). Previously the Company operated under a functional expertise alignment. As a result of these organizational changes, which included a 13% reduction in total workforce, the Company will incur a one-time restructuring charge of approximately $1.3 million to $1.7 millionsegment as discontinued operations beginning in the first quarter of fiscal 2011. Beginning with2012. Although the first quarterassets of fiscalSurModics Pharmaceuticals continue to be presented as “held and used” as of September 30, 2011, the Company will describe its business underrecorded an impairment charge in fiscal 2011 based on the newfair value of the reporting structure.
unit which considered the expected sale price of substantially all of the assets. The Company has incurredexpects to recognize a $0.8 million milestone payment obligation related to the SurModics Pharmaceuticals, Inc. (SurModics Pharmaceuticals) acquisitionloss on disposal in the first quarter of fiscal 2011.
In November 2010, the Company received notice2012, primarily resulting from the Internal Revenue Service that it was awarded approximately $1.3 million of federal grants for qualified investments made in qualified therapeutic discovery projects. These grants will be recognized in fiscal 2011 as a reduction to the Company’s Other Research and Development expenses.
In addition, in December 2010, we announced that the Board of Directors of the Company had authorized the Company to explore strategic alternatives for the Company’s Pharmaceuticals business, including a potential sale of that business. This decision by the Board reflects our focus on returning the Company to profitable growth, and our renewed commitment to pursuing growth opportunities and investments in our Medical Device and In Vitro Diagnostics businesses. We have retained Piper Jaffray & Co. as our financial adviser in connection with this process. The Company has made no decision to enter into any transaction regarding the Pharmaceuticals business, and there can be no assurance that we will enter into such a transaction in the future. Additional details concerning this announcement can be found in the Company’s Current Report onForm 8-K expected to be filedcosts associated with the Securitiessale. See additional disclosures in Note 2 —Property and Exchange CommissionEquipment andIntangible Assets and Note 3 —Assets and Liabilities Measured on or before December 20, 2010.
In December 2010, we also announced that Gary R. Maharaj has been named President and Chief Executive Officer of the Company, with such appointment to be effective December 27, 2010. Mr. Maharaj will also serve as a member of the Company’s Board of Directors. Mr. Maharaj previously served as President and Chief Executive Officer of Arizant Inc., a provider of patient temperature management in hospital operating rooms. Additional details concerning this announcement can be found in the Company’s Current Report onForm 8-KNon-Recurring Basis. expected to be filed with the Securities and Exchange Commission on or before December 20, 2010.
F-6
SurModics, Inc. and Subsidiaries
Notes to Consolidated Financial Statements — (Continued)
| 2. | |
2. | Summary of Significant Accounting Policies and Select Balance Sheet Information |
Cash and Cash Equivalents
Cash and cash equivalents consist of financial instruments with original maturities of three months or less and are stated at cost which approximates fair value.
SurModics, Inc. and Subsidiaries
Notes to Consolidated Financial Statements — (Continued)
Investments
Investments consist principally of U.S. government and government agency obligations and mortgage-backed securities and are classified asavailable-for-sale orheld-to-maturity at September 30, 20102011 and 2009.2010. Available-for-sale investments are reported at fair value with unrealized gains and losses net of tax excluded from operations and reported as a separate component of stockholders’ equity, except forother-than-temporary impairments, which are reported as a charge to current operations. A loss would be recognized when there is another-than-temporary impairment in the fair value of any individual security classified asavailable-for-sale, with the associated net unrealized loss reclassified out of accumulated other comprehensive income with a corresponding adjustment to other income (loss). This adjustment results in a new cost basis for the investment. Investments that management has the intent and ability to hold to maturity are classified asheld-to-maturity and reported at amortized cost. If there isWhen another-than-temporary impairment in the fair value of any individual security classified asheld-to-maturity occurs, the Company will writewrites down the security to fair value with a corresponding adjustment to other income (loss). Interest on debt securities, including amortization of premiums and accretion of discounts, is included in other income (loss). Realized gains and losses from the sales of debt securities, which are included in other income (loss), are determined using the specific identification method.
The original cost, unrealized holding gains and losses, and fair value ofavailable-for-sale investments as of September 30 were as follows(in thousands):
| | | | | | | | | | | | | | | | | |
| | | 2010 | |
| | | Original Cost | | | Unrealized Gains | | | Unrealized Losses | | | Fair Value | |
| |
| U.S. government obligations | | $ | 25,968 | | | $ | 395 | | | $ | (34 | ) | | $ | 26,329 | |
| Mortgage-backed securities | | | 4,711 | | | | 164 | | | | (48 | ) | | | 4,827 | |
| Municipal bonds | | | 3,079 | | | | 72 | | | | — | | | | 3,151 | |
| Asset-backed securities | | | 1,146 | | | | 8 | | | | (42 | ) | | | 1,112 | |
| Corporate bonds | | | 5,828 | | | | 24 | | | | — | | | | 5,852 | |
| | | | | | | | | | | | | | | | | |
| Total | | $ | 40,732 | | | $ | 663 | | | $ | (124 | ) | | $ | 41,271 | |
| | | | | | | | | | | | | | | | | |
| | | | | | | | | | | | | | | | | |
| | | 2009 | |
| | | Original Cost | | | Unrealized Gains | | | Unrealized Losses | | | Fair Value | |
| |
| U.S. government obligations | | $ | 10,837 | | | $ | 253 | | | $ | — | | | $ | 11,090 | |
| Mortgage-backed securities | | | 7,938 | | | | 177 | | | | (106 | ) | | | 8,009 | |
| Municipal bonds | | | 7,210 | | | | 232 | | | | — | | | | 7,442 | |
| Asset-backed securities | | | 2,334 | | | | 65 | | | | (143 | ) | | | 2,256 | |
| Corporate bonds | | | 1,181 | | | | 3 | | | | — | | | | 1,184 | |
| | | | | | | | | | | | | | | | | |
| Total | | $ | 29,500 | | | $ | 730 | | | $ | (249 | ) | | $ | 29,981 | |
| | | | | | | | | | | | | | | | | |
F-7
| | | | | | | | | | | | | | | | |
| | | 2011 | |
| | | Original Cost | | | Unrealized Gains | | | Unrealized Losses | | | Fair Value | |
U.S. government and government agency obligations | | $ | 30,433 | | | $ | 176 | | | $ | (6 | ) | | $ | 30,603 | |
Mortgage-backed securities | | | 3,871 | | | | 131 | | | | (54 | ) | | | 3,948 | |
Municipal bonds | | | 3,561 | | | | 53 | | | | — | | | | 3,614 | |
Asset-backed securities | | | 1,336 | | | | 1 | | | | (49 | ) | | | 1,288 | |
Corporate bonds | | | 2,474 | | | | 32 | | | | (9 | ) | | | 2,497 | |
| | | | | | | | | | | | | | | | |
Total | | $ | 41,675 | | | $ | 393 | | | $ | (118 | ) | | $ | 41,950 | |
| | | | | | | | | | | | | | | | |
| | | | | | | | | | | | | | | | |
| | | 2010 | |
| | | Original Cost | | | Unrealized Gains | | | Unrealized Losses | | | Fair Value | |
U.S. government and government agency obligations | | $ | 25,968 | | | $ | 395 | | | $ | (34 | ) | | $ | 26,329 | |
Mortgage-backed securities | | | 4,711 | | | | 164 | | | | (48 | ) | | | 4,827 | |
Municipal bonds | | | 3,079 | | | | 72 | | | | — | | | | 3,151 | |
Asset-backed securities | | | 1,146 | | | | 8 | | | | (42 | ) | | | 1,112 | |
Corporate bonds | | | 5,828 | | | | 24 | | | | — | | | | 5,852 | |
| | | | | | | | | | | | | | | | |
Total | | $ | 40,732 | | | $ | 663 | | | $ | (124 | ) | | $ | 41,271 | |
| | | | | | | | | | | | | | | | |
SurModics, Inc. and Subsidiaries
Notes to Consolidated Financial Statements — (Continued)
The original cost and fair value of investments by contractual maturity at September 30, 20102011 were as follows(in thousands):
| | | | | | | | | |
| | | Amortized Cost | | | Fair Value | |
| |
| Debt securities due within: | | | | | | | | |
| One year | | $ | 8,075 | | | $ | 8,092 | |
| One to five years | | | 27,046 | | | | 27,541 | |
| Five years or more | | | 5,611 | | | | 5,638 | |
| | | | | | | | | |
| Total | | $ | 40,732 | | | $ | 41,271 | |
| | | | | | | | | |
| | | | | | | | |
| | | Amortized Cost | | | Fair Value | |
Debt securities due within: | | | | | | | | |
One year | | $ | 12,178 | | | $ | 12,196 | |
One to five years | | | 24,349 | | | | 24,587 | |
Five years or more | | | 5,148 | | | | 5,167 | |
| | | | | | | | |
Total | | $ | 41,675 | | | $ | 41,950 | |
| | | | | | | | |
The following table summarizes sales ofavailable-for-sale securities for the years ended September 30, 2011, 2010 2009 and 20082009(in thousands):
| | | | | | | | | | | | | |
| | | 2010 | | 2009 | | 2008 |
| |
| Proceeds from sales | | $ | 23,986 | | | $ | 55,263 | | | $ | 29,258 | |
| Gross realized gains | | $ | 302 | | | $ | 823 | | | $ | 454 | |
| Gross realized losses | | $ | (3 | ) | | $ | (12 | ) | | $ | (26 | ) |
| | | | | | | | | | | | |
| | | 2011 | | | 2010 | | | 2009 | |
Proceeds from sales | | $ | 50,364 | | | $ | 23,986 | | | $ | 55,263 | |
Gross realized gains | | $ | 384 | | | $ | 302 | | | $ | 823 | |
Gross realized losses | | $ | (4 | ) | | $ | (3 | ) | | $ | (12 | ) |
At September 30, 2011, the amortized cost and fair market value of held-to-maturity debt securities were $3.0 million and $3.1 million, respectively. Investments in securities designated as held-to-maturity consist of tax-exempt municipal bonds and have maturity dates ranging between five months and six months from September 30, 2011. At September 30, 2010, the amortized cost and fair market value ofheld-to-maturity debt securities were $4.1 million and $4.3 million, respectively. Investments in securities designated as
held-to-maturity consist of tax-exempt municipal bonds and have maturity dates ranging between three months and three years from September 30, 2010. At September 30, 2009, the amortized cost and fair market value ofheld-to-maturity debt securities were $6.3 million and $6.4 million, respectively.
Inventories
Inventories are principally stated at the lower of cost or market using the specific identification method and include direct labor, materials and overhead. Inventories consisted of the following as of September 30(in thousands):
| | | | | | | | | |
| | | 2010 | | | 2009 | |
| |
| Raw materials | | $ | 1,140 | | | $ | 1,287 | |
| Finished products | | | 1,907 | | | | 2,043 | |
| | | | | | | | | |
| Total | | $ | 3,047 | | | $ | 3,330 | |
| | | | | | | | | |
| | | | | | | | |
| | | 2011 | | | 2010 | |
Raw materials | | $ | 1,369 | | | $ | 1,140 | |
Finished products | | | 2,781 | | | | 1,907 | |
| | | | | | | | |
Total | | $ | 4,150 | | | $ | 3,047 | |
| | | | | | | | |
Property and Equipment
Property and equipment are stated at cost, less any impairment, and are depreciated using the straight-line method over the estimated useful lives of the assets. The Company recorded depreciation expense of $5.6 million, $6.2 million $3.8 million and $3.1$3.8 million for the years ended September 30, 2011, 2010 and 2009, and 2008, respectively.
The September 30, 20102011 and 20092010 balances inconstruction-in-progress include the cost of enhancing the capabilities of the Company’s Eden Prairie, Minnesota and Birmingham, Alabama facilities. As assets are placed in service,construction-in-progress is transferred to the specific property and equipment categories and depreciated over the estimated useful lives of the assets.
SurModics, Inc. and Subsidiaries
Notes to Consolidated Financial Statements — (Continued)
In the fourth quarter of fiscal 2011, the Company recorded a $14.8 million asset impairment charge associated with writing down its facilities in Alabama to fair value based on the current valuation of the Company’s SurModics Pharmaceuticals assets relative to their carrying value (the entire $14.8 million related to Buildings and improvements).
In fiscal 2010, the Company recorded a $1.9 million asset impairment charge associated with writing down one of ourits facilities in Alabama to fair value based on a decision to sell the facility, which decision was reversed later in fiscal 2010 ($0.5 million related to Land, $1.2 million related to Building and improvements and $0.2 million related to Laboratory fixtures and equipment). The Company also recognized aan $0.8 million asset impairment charge associated with certain long-lived assets included in Laboratory fixtures and equipment where very limited
F-8
SurModics, Inc. and Subsidiaries
Notes to Consolidated Financial Statements — (Continued)
no ongoing business
iswas expected in the
near termforeseeable future based on
currentmarket conditions. The Company also recognized a $0.4 million asset impairment charge associated with prototypes and other equipment related to a development project for which no ongoing business was expected in the foreseeable future in light of market conditions. In addition, the Company recorded a $1.3 million asset impairment charge associated with certain fixed asset costs located in Minnesota that were included in
Construction-in-progress during fiscal 2010.Construction-in-progress at September 30, 2009.
Property and equipment consisted of the following components as of September 30(in thousands):
| | | | | | | | | | | | | |
| | | Useful Life | | | 2010 | | | 2009 | |
| | | (In years) | | | | | | | |
| |
| Land | | | | | | $ | 6,886 | | | $ | 7,409 | |
| Laboratory fixtures and equipment | | | 3 to 12 | | | | 25,958 | | | | 19,549 | |
| Building and improvements | | | 1 to 39 | | | | 47,084 | | | | 15,911 | |
| Office furniture and equipment | | | 3 to 10 | | | | 5,879 | | | | 4,550 | |
| Construction-in-progress | | | | | | | 4,386 | | | | 40,210 | |
| Less accumulated depreciation | | | | | | | (24,798 | ) | | | (20,714 | ) |
| | | | | | | | | | | | | |
| Property and equipment, net | | | | | | $ | 65,395 | | | $ | 66,915 | |
| | | | | | | | | | | | | |
| | | | | | | | | | | | |
| | | Useful Life | | | 2011 | | | 2010 | |
| | | (In years) | | | | | | | |
Land | | | | | | $ | 6,886 | | | $ | 6,886 | |
Laboratory fixtures and equipment | | | 3 to 12 | | | | 26,571 | | | | 25,958 | |
Buildings and improvements | | | 1 to 39 | | | | 33,613 | | | | 47,084 | |
Office furniture and equipment | | | 3 to 10 | | | | 5,591 | | | | 5,879 | |
Construction-in-progress | | | | | | | 4,566 | | | | 4,386 | |
Less accumulated depreciation | | | | | | | (29,301 | ) | | | (24,798 | ) |
| | | | | | | | | | | | |
Property and equipment, net | | | | | | $ | 47,926 | | | $ | 65,395 | |
| | | | | | | | | | | | |
Other Assets
Other assets consist principally of strategic investments. In fiscal 2010, the balance in other assets decreased primarily as a result of impairments of three investments.
Other assets consisted of the following components as of September 30(in thousands):
| | | | | | | | | |
| | | 2010 | | | 2009 | |
| |
| Investment in OctoPlus | | $ | 2,624 | | | $ | 3,700 | |
| Investment in Nexeon MedSystems | | | 285 | | | | 5,651 | |
| Investment in ThermopeutiX | | | 1,185 | | | | 1,185 | |
| Investment in ViaCyte (formerly Novocell) | | | 559 | | | | 559 | |
| Other | | | 590 | | | | 2,162 | |
| | | | | | | | | |
| Other assets, net | | $ | 5,243 | | | $ | 13,257 | |
| | | | | | | | | |
| | | | | | | | |
| | | 2011 | | | 2010 | |
Investment in OctoPlus | | $ | 1,190 | | | $ | 2,624 | |
Investment in Nexeon MedSystems | | | 285 | | | | 285 | |
Investment in ThermopeutiX | | | 1,185 | | | | 1,185 | |
Investment in ViaCyte (formerly Novocell) | | | 559 | | | | 559 | |
Other | | | 323 | | | | 590 | |
| | | | | | | | |
Other assets, net | | $ | 3,542 | | | $ | 5,243 | |
| | | | | | | | |
In January 2005, the Company made an initial equity investment of approximately $3.9 million in OctoPlus N.V. (OctoPlus)(“OctoPlus”), a company based in the Netherlands active in the development of pharmaceutical formulations incorporating novel biodegradable polymers. Subsequent investments brought the Company’s total investment to $6.0 million. In October 2006, OctoPlus common stock began trading on an international exchange following an initial public offering of its common stock. With a readily determinable fair market value, the
SurModics, Inc. and Subsidiaries
Notes to Consolidated Financial Statements — (Continued)
Company now treats the investment in OctoPlus as anavailable-for-sale investment rather than a cost method investment.Available-for-sale investments are reported at fair value with unrealized gains and losses reported as a separate component of stockholders’ equity, except forother-than-temporary impairments, which are reported as a charge to current operations, recorded in the other income (loss) section of the consolidated statements of income,operations, and resultresulting in a new cost basis for the investment. As of September 30, 2010,2011, the investment in OctoPlus represented an ownership interest of less than 10%. The Company recorded no realized gain or loss related to this investment in fiscal 2011, 2010 or 2009. The Company recorded in comprehensive (loss) income an unrealized loss of $0.5 million and 2009.an unrealized gain of $0.9 million in fiscal 2011 and 2010, respectively, related to the OctoPlus investment. The Company recognized an impairment loss on the investment totaling $4.3 million in fiscal 2008 based on a significant decline in the stock price of OctoPlus as a result of market conditions. The cost basis in the Company’s investment in OctoPlus is $1.7 million.
million after consideration of the fiscal 2008 impairment.Beginning in May 2005, the Company has invested $1.2 million in ThermopeutiX, Inc. (ThermopeutiX)(“ThermopeutiX”), a California-based early stage company developing novel medical devices for the treatment of vascular and neurovascular diseases. In addition to the investment, SurModics has licensed its hydrophilic and hemocompatible
F-9
SurModics, Inc. and Subsidiaries
Notes to Consolidated Financial Statements — (Continued)
coating technologies to ThermopeutiX for use with its devices. The Company’s investment in ThermopeutiX, which is accounted for under the cost method, represents an ownership interest of less than 20%.
The Company does not exert significant influence over ThermopeutiX’s operating or financial activities.The Company has invested a total of $5.2 million in ViaCyte, Inc., (ViaCyte)(“ViaCyte”), formerly Novocell, Inc., a privately-held California-based biotechnology firm that is developing a unique treatment for diabetes using coated islet cells, the cells that produce insulin in the human body. In fiscal 2006, the Company determined its investment in ViaCyte was impaired and that the impairment wasother-than-temporary. other than temporary. Accordingly, the Company recorded an impairment loss of $4.7 million. The balance of the investment, $559,000,$0.6 million, which is accounted for under the cost method, represents less than a 5% ownership interest.
The Company does not exert significant influence over ViaCyte’s operating or financial activities.In July 2007, the Company made equity investments in Paragon Intellectual Properties, LLC (Paragon)(“Paragon”) and Apollo Therapeutics, LLC (Apollo)(“Apollo”), a Paragon subsidiary, totaling $3.5 million. SurModics made an additional equity investment in fiscal 2008 totaling $2.5 million, based upon successful completion of specified development milestones. In addition to the investments, the Company has licensed its Finaletm prohealing coating technology and provides development services on a time and materials basis to Apollo. In October 2008, Paragon announced that it had restructured, moving from a limited liability company with seven subsidiaries to a single C-corporation named Nexeon MedSystems, Inc. (Nexeon)(“Nexeon”). SurModics continued to accountaccounts for the investments in Paragon and Apollo under the equity method in the first quarter of fiscal 2009, as both entities reported results to us on a one-quarter lag. Commencing with the second quarter of fiscal 2009, SurModics accounted for theits investment in Nexeon under the cost method as the Company’s ownership level is less than 20%, and the Company diddoes not exert significant influence over Nexeon’s operating or financial activities. The Company made an additional cash investment of $500,000 in Nexeon of $0.5 million in fiscal 2009. In the fourth quarter of fiscal 2010, the Company held discussions with Nexeon management to understand the business status and outlook, valuations associated with potential new rounds of financing, operating metrics and other industry factors which impacted the Company’s assessment of the carrying value of this investment. As a result of its assessment, the Company recognized a $5.3 million impairment loss on this investment in fiscal 2010 as it was determined that the investment wasother-than-temporarily impaired.
In August 2009, the Company invested $2.0 million in a medical technology company and made a follow-on investment of $0.5 million in March 2010. The Company recognized an impairment loss on this investment totaling $2.4 million in fiscal 2010, based on market valuations and a pending financing round for this company. The Company’s investment in the medical technology company is accounted for under the cost method, as the Company’s ownership interest is less than 20% and the Company diddoes not exert significant influence over the medical technology company’s operating or financial activities. Another entity in which the Company had a strategic investment sold the majority of its assets in fiscal 2010, resulting in an impairment loss of $0.2 million to the Company.Company in fiscal 2010. These investments are included in the category titled “Other” in the table above.
SurModics, Inc. and Subsidiaries
Notes to Consolidated Financial Statements — (Continued)
In the years ended September 30, 2011, 2010 2009 and 2008,2009, the Company recognized revenue of $0.1 million, $1.5 million $1.4 million and $4.1$1.4 million, respectively, from activity with companies in which it had a strategic investment.
Intangible assets consist principally of acquired patents and technology, customer relationships, licenses and trademarks. The Company recorded amortization expense of $1.5 million, $1.6 million, $2.1 million, and $3.0$2.1 million for the years ended September 30, 2011, 2010 and 2009, and 2008, respectively.
In the fourth quarter of fiscal 2011, the Company recorded a $3.1 million asset impairment charge associated with writing down its SurModics Pharmaceuticals intangibles to fair value based on the current valuation of such assets relative to their carrying value.
In fiscal 2010, the Company recognized an asset impairment charge of $0.7$0.5 million associated with certain patent rights. Management applied the accounting guidance associated with long-lived assets and determined an impairment occurred for these assets as very limitedno ongoing business iswas expected in the near termforeseeable future based on current market conditions.
F-10
The asset impairment charges in fiscal 2011 and 2010 are included in the asset impairment charges line in the consolidated statements of operations.SurModics, Inc. and Subsidiaries
Notes to Consolidated Financial Statements — (Continued)
Intangible assets consisted of the following as of September 30(in thousands):
| | | | | | | | | | | | | |
| | | Useful Life | | | 2010 | | | 2009 | |
| | | (In years) | | | | | | | |
| |
| Customer lists | | | 9-11 | | | $ | 8,657 | | | $ | 8,657 | |
| Core technology | | | 8-18 | | | | 8,330 | | | | 8,330 | |
| Patents and other | | | 2-20 | | | | 2,376 | | | | 3,076 | |
| Trademarks | | | | | | | 600 | | | | 600 | |
| Less accumulated amortization | | | | | | | (4,706 | ) | | | (3,205 | ) |
| | | | | | | | | | | | | |
| Intangible assets, net | | | | | | $ | 15,257 | | | $ | 17,458 | |
| | | | | | | | | | | | | |
| | | | | | | | | | | | | | | | |
| | | 2011 | |
| | | Weighted Average
Original Life (Years) | | | Gross Carrying
Amount | | | Accumulated
Amortization | | | Net | |
| Definite-lived intangible assets: | | | | | | | | | | | | |
Customer lists | | | 9.5 | | | $ | 7,633 | | | $ | (3,585 | ) | | $ | 4,048 | |
Core technology | | | 17.2 | | | | 6,282 | | | | (1,984 | ) | | | 4,298 | |
Patents and other | | | 16.5 | | | | 2,358 | | | | (655 | ) | | | 1,703 | |
Trademarks | | | 1.0 | | | | 20 | | | | (20 | ) | | | — | |
| | | | | | | | | | | | | | | | |
Subtotal | | | | | | | 16,293 | | | | (6,244 | ) | | | 10,049 | |
| Unamortized intangible assets: | | | | | | | | | | | | |
Trademarks | | | | | | | 580 | | | | — | | | | 580 | |
| | | | | | | | | | | | | | | | |
Total | | | | | | $ | 16,873 | | | $ | (6,244 | ) | | $ | 10,629 | |
| | | | | | | | | | | | | | | | |
| | | | | | | | | | | | | | | | |
| | | 2010 | |
| | | Weighted Average
Original Life (Years) | | | Gross Carrying
Amount | | | Accumulated
Amortization | | | Net | |
| Definite-lived intangible assets: | | | | | | | | | | | | |
Customer lists | | | 9.7 | | | $ | 8,657 | | | $ | (2,682 | ) | | $ | 5,975 | |
Core technology | | | 17.4 | | | | 8,330 | | | | (1,485 | ) | | | 6,845 | |
Patents and other | | | 16.4 | | | | 2,376 | | | | (519 | ) | | | 1,857 | |
Trademarks | | | 1.0 | | | | 20 | | | | (20 | ) | | | — | |
| | | | | | | | | | | | | | | | |
Subtotal | | | | | | | 19,383 | | | | (4,706 | ) | | | 14,677 | |
| Unamortized intangible assets: | | | | | | | | | | | | |
Trademarks | | | | | | | 580 | | | | — | | | | 580 | |
| | | | | | | | | | | | | | | | |
Total | | | | | | $ | 19,963 | | | $ | (4,706 | ) | | $ | 15,257 | |
| | | | | | | | | | | | | | | | |
SurModics, Inc. and Subsidiaries
Notes to Consolidated Financial Statements — (Continued)
Based on the intangible assets in service as of September 30, 2010,2011, estimated amortization expense for each of the next five fiscal years is as follows (in thousands):
| | | | | |
| 2011 | | $ | 1,546 | |
| 2012 | | | 1,544 | |
| 2013 | | | 1,544 | |
| 2014 | | | 1,544 | |
| 2015 | | | 1,533 | |
Goodwill
The following table summarizes the | | | | |
2012 | | $ | 1,245 | |
2013 | | | 1,245 | |
2014 | | | 1,245 | |
2015 | | | 1,234 | |
2016 | | | 1,096 | |
Future amortization amounts presented above are estimates. Actual future amortization expense may be different, as a result of future acquisitions, impairments, changes in the carrying amount of goodwillamortization periods or other factors.
(in thousands)Goodwill:
| | | | | |
| Balance at October 1, 2008 | | $ | 18,001 | |
| Acquisitions | | | 3,016 | |
| Adjustment | | | 53 | |
| | | | | |
| Balance at September 30, 2009 | | | 21,070 | |
| Acquisitions | | | 750 | |
| Goodwill Impairment | | | (13,810 | ) |
| | | | | |
| Balance at September 30, 2010 | | $ | 8,010 | |
| | | | | |
Goodwill represents the excess of the cost of the acquired entities over the fair value assigned to the assets purchased and liabilities assumed in connection with the Company’s acquisitions. The carrying amount of goodwill is evaluated annually, and between annual evaluations if events occur or circumstances change indicating that the carrying amount of goodwill may be impaired.
The following table summarizes the changes in the carrying amount of goodwill(in thousands):
| | | | |
Balance at September 30, 2009 | | $ | 21,070 | |
Payment related to a prior business acquisition | | | 750 | |
Goodwill impairment | | | (13,810 | ) |
| | | | |
Balance at September 30, 2010 | | $ | 8,010 | |
Payments related to a prior business acquisition | | | 5,650 | |
Goodwill impairment | | | (5,650 | ) |
| | | | |
Balance at September 30, 2011 | | $ | 8,010 | |
| | | | |
The Company has recognized cumulative goodwill impairment charges of $19.5 million as of September 30, 2011 associated with the SurModics Pharmaceuticals reporting unit.
The Company has determined that theits reporting units are the SurModics Pharmaceuticals Inc. subsidiary, the In Vitro Diagnostics operations and the SurModics drug delivery and hydrophilic coatings operations.operations known as the Medical Device business unit. The reporting units with goodwill resulted from the acquisitions of SurModics PharmaPharmaceuticals and SurModics IVD, Inc. (formerly known as BioFX Laboratories, Inc.) (“SurModics IVD”) in fiscal 2007. Inherent in the determination of fair value of the reporting units are certain estimates and judgments, including the interpretation of current economic indicators and market valuations as well as the Company’s strategic plans with regard to its operations.
The $8.0 million of goodwill at September 30, 2011 is related to the In Vitro Diagnostics reporting unit. The Company performed its annual impairment test of goodwill as of August 31, 2011, and did not record any goodwill impairment charges as there were no indicators of impairment associated with the In Vitro Diagnostics reporting unit.
Evaluating goodwill for impairment in fiscal 2011 was based on new goodwill accounting guidance which was early adopted by the Company in the fourth quarter of fiscal 20102011. The new accounting guidance involves assessment of qualitative factors to determine whether the existence of events or circumstances leads to a
SurModics, Inc. and Subsidiaries
Notes to Consolidated Financial Statements — (Continued)
determination that it is more likely than not that the fair value of a reporting unit is less than its carrying amount. If, after assessing the totality of events or circumstances, an entity determines it is not more likely than not that the fair value of a reporting unit is less than its carrying amount, then performing the two-step impairment test becomes unnecessary.
The Company recognized a goodwill impairment charge of $13.8$5.7 million which represented a full impairmentin the first quarter of fiscal 2011 associated with its SurModics Pharmaceuticals reporting unit. Two milestone events were achieved associated with the July 2007 acquisition of SurModics Pharmaceuticals and $5.7 million of additional purchase price was recorded as an increase to goodwill. There had been no substantial changes in operating results for SurModics Pharmaceuticals in the first quarter of fiscal 2011 when compared with fiscal 2010, and, as such, the Company concluded that the goodwill associated with the milestone events was fully impaired.
During the Company’s annual test of goodwill as of August 31, 2010, the Company determined the goodwill related to its SurModics PharmaPharmaceuticals reporting unit. unit was fully impaired and it recognized a non-cash goodwill impairment charge of $13.8 million.
Prior to testing goodwill for impairment in fiscal 2010 the Company tested its definite-lived assets, property plant and equipment as well as intangible assets, under the provisions of the accounting guidance for impairment or disposal of long-lived assets, and determined that there were no impairments of these assets. The Company did not record any goodwill impairment charges during fiscal 2009 or 2008.
F-11
SurModics, Inc. and Subsidiaries
Notes to Consolidated Financial Statements — (Continued)
The goodwill impairment in fiscal 2010 reflected a significant decline in the estimated fair value of the Company’s reporting units, mainly the Company’s SurModics Pharmaceuticals reporting unit, which resulted from a slowdown in business activity which was most pronounced in the fourth quarter of fiscal 2010, higher operating costs with the recently placed in-service current Good Manufacturing Practices (cGMP)cGMP manufacturing facility, and a significant decrease in the Company’s stock price during the year.fiscal 2010. The stock price declined from $24.13 per share at October 1, 2009 to $12.03 at the date of the annual impairment test, which was August 31, 2010. While the Company continually evaluatesevaluated whether any indications of impairment are present which would require an impairment analysis on an interim basis, no such indicators were considered present prior to the fourth quarter of fiscal 2010. Prior to the fourth quarter, based on the Company’s outlook for future results and the fact that the market capitalization exceeded the Company’s book value by a margin of 64% at June 30, 2010, Company management did not believe that the events and circumstances in existence at interim reporting dates indicated it was more likely than not that the fair value of any of the Company’s reporting units would be less than its carrying amount.
In evaluating whether goodwill was impaired in fiscal 2010, the Company compared the fair value of the reporting units to which goodwill is assigned to their respective carrying values (Step 1 of the impairment test). In calculating fair value, the Company used the income approach as the primary indicator of fair value with the market approach used as a test of reasonableness. The income approach is a valuation technique under which the Company estimates future cash flows using the reporting units’ financial forecasts. Future estimated cash flows are discounted to their present value to calculate fair value. The market approach establishes fair value by comparing SurModics to other publicly traded guideline companies or by analysis of actual transactions of similar businesses or assets sold. The income approach is tailored to the circumstances of the Company’s business, and the market approach is completed as a secondary test to ensure that the results of the income approach are reasonable and in line with comparable companies in the industry. The summation of the reporting units’ fair values were compared and reconciled to the Company’s market capitalization as of the date of the impairment test.
In the situation where a reporting unit’s carrying amount exceeds its fair value, the amount of the impairment loss must be measured. The measurement of the impairment (Step 2 of the impairment test) is calculated by determining the implied fair value of a reporting unit’s goodwill. In calculating the implied fair
SurModics, Inc. and Subsidiaries
Notes to Consolidated Financial Statements — (Continued)
value of goodwill, the fair value of the reporting unit is allocated to all other assets and liabilities of that unit based on their fair values. The excess of the fair value of a reporting unit over the amount assigned to its other assets and liabilities is the implied fair value of goodwill. The goodwill impairment is measured as the excess of the carrying amount of goodwill over its implied fair value.
In determining the fair value of the SurModics PharmaPharmaceuticals reporting unit under the income approach, the SurModics Pharma expected cash flows areof SurModics Pharmaceuticals were affected by various assumptions. Fair value on a discounted cash flow basis used forecasts over a ten yearten-year period with an estimation of residual growth rates thereafter. The Company uses its business plans and projections as the basis for expected future cash flows. The most significant assumptions incorporated in these forecasts for the most recentfiscal 2010 goodwill impairment teststest included annual revenue changes based on then current customer programs and expected progression of these programs into different phases of development. A discount rate of 15 percent15% was used in the fiscal 2010 analysis to reflect the relevant risks of the higher growth assumed for this reporting unit. Given the significant difference between the reporting unit’s fair value and carrying value, any change in the discount rate would not have changed the evaluation of impairment.
In estimating the fiscal 2010 fair value of the Company under the market approach, management considered the relative merits of commonly applied market capitalization multiples based on the availability of data. Based on the analysis, the Company utilized the guideline public company method to support the valuation of the reporting units.
units in fiscal 2010.Based on the goodwill analysis performed as of August 31, 2010, goodwill in the SurModics PharmaPharmaceuticals reporting unit failed Step 1 of the impairment test and Step 2 of the impairment test indicated that goodwill was fully impaired. The indicated excess in fair value over carrying value of the Company’s In Vitro Diagnostics reporting unit in Step 1 of the impairment test at August 31, 2010 was approximately 82% and as such the $8.0 million of goodwill related to this reporting unit iswas not impaired. The SurModics drug delivery and hydrophilic coatings
F-12
SurModics, Inc. and Subsidiaries
Notes to Consolidated Financial Statements — (Continued)
operations doesdo not have any goodwill and waswere included in the analysis to assist in reconciling the fair value of all reporting units to the Company’s market capitalization at August 31, 2010.
The Company did not record any goodwill impairment charges during fiscal 2009.
ImpairmentValuation of Long-Lived Assets
TheAccounting guidance requires the Company to periodically evaluatesevaluate whether events and circumstances have occurred that may affect the estimated useful life or the recoverability of the remaining balance of long-lived assets, such as property and equipment intangible assets and investments.intangibles with finite lives. If such events or circumstances were to indicate that the carrying amount of these assets wouldmay not be recoverable, the Company would estimate the future cash flows expected to result from the use of the assets and their eventual disposition. If the sum of the expected future cash flows (undiscounted and without interest charges) or other measure of fair value were less than the carrying amount of the assets, the Company would recognize an impairment loss reducing the carrying valuecharge to reduce such assets to their fair market value. See the Property and Equipment, Other Assets and Intangible Assets sections in Note 2 for further information on impairments that were recognized in fiscal 2011 and 2010.
The Company recognizes revenue when all of the following criteria are met: (1) persuasive evidence of an arrangement exists; (2) shipment has occurred or delivery has occurred if the terms specify destination; (3) the sales price is fixed or determinable; and (4) collectability is reasonably assured. When there are additional performance requirements, revenue is recognized when all such requirements have been satisfied.
Under revenue arrangements with multiple deliverables, the Company recognizes each separable deliverable as it is earned.SurModics, Inc. and Subsidiaries
Notes to Consolidated Financial Statements — (Continued)
The Company’s revenue is derived from three primary sources: (1) royalties and license fees from licensing its proprietary drug delivery and surface modification technologies to customers; (2) the sale of polymers and reagent chemicals, stabilization products, antigens, substrates and microarray slides to the diagnostics and biomedical research industries; and (3) research and development fees generated on customer projects.
Taxes collected from customers and remitted to governmental authorities are excluded from revenue and amounted to $0.1 million, $0.2$0.1 million and $0.3$0.2 million for the years ended September 30, 2011, 2010 and 2009, and 2008, respectively.
Royalties and licenseslicense fees. The Company licenses technology to third parties and collects royalties. Royalty revenue is generated when a customer sells products incorporating the Company’s licensed technologies. Royalty revenue is recognized as licensees report it to the Company, and payment is typically submitted concurrently with the report. This revenue recognition model is similar to usage fee accounting. Minimum royalty fees are recognized in the period earned, provided that collectability is reasonably assured. For stand-alone license agreements, up-front license fees are recognized over the economic lifeterm of the technology.
Milestone payments.related licensing agreement. Minimum royalty fees are recognized in the period earned.Revenue related to a performance milestone is recognized based upon the achievement of the milestone, as defined in the respective agreements and provided the following conditions have been met:
| | |
| • | The milestone payment is non-refundable; |
|
| • | The milestone involved a significant degree of risk, and was not reasonably assured at the inception of the arrangement; |
|
| • | Accomplishment of the milestone involved substantial past effort/performance; |
|
| • | The amount of the milestone payment is commensurate with the related effort and risk; |
|
| • | The milestone payment is reasonable in comparison to all of the deliverables and payment terms in the arrangement; and |
|
| • | A reasonable amount of time passed between the initial license payment and the first and subsequent milestone payments. |
F-13
SurModics, Inc.The milestone involved a significant degree of risk, and Subsidiaries
was not reasonably assured at the inception of the arrangement;
Accomplishment of the milestone involved substantial effort;
Notes to Consolidated Financial Statements — (Continued)The amount of the milestone payment is commensurate with the related effort and risk; and
A reasonable amount of time passed between the initial license payment and the first and subsequent milestone payments.
If these conditions have not been met, the milestone payment is deferred and recognized over the economic lifeterm of the technology.
agreement.Product sales. Product sales to third parties are recognized at the time of shipment, provided that an order has been received, the price is fixed or determinable, collectability of the resulting receivable is reasonably assured and returns can be reasonably estimated. The Company’s sales terms provide no right of return outside of the standard warranty policy. Payment terms are generally set at30-45 days.
Research and development. The Company performs third party research and development activities, which are typically provided on a time and materials basis. Generally, revenue for research and development is recorded as performance progresses under the applicable agreement.
contract.Arrangements with multiple deliverables. Prior to October 1, 2009, arrangements such as license and development agreements were analyzed to determine whether the deliverables, which often include a license and performance obligations such as research and development, could be separated, or whether they must be accounted for as a single unit of accounting in accordance with accounting guidance. If the fair value of the undelivered performance obligations could be determined, such obligations would then be accounted for separately. If the license was considered to either (i) not have stand-alone value or (ii) have stand-alone value but the fair value of any of the undelivered performance obligations could not be determined, the arrangement would then be accounted for as a single unit of accounting, and the license payments and payments for performance obligations would be recognized as revenue over the estimated period of when the performance obligations are performed, or the economic life of the technology licensed to the customer. When the Company determined that an arrangement should be accounted for as a single unit of accounting, it recognized the related revenue on a time-based accounting model.
The Company had one significant multiple element arrangement prior to October 1, 2009 that was accounted for as a single unit of accounting resulting in deferral and recognition of all related payments received for license and research and development activities using a time-based model. This arrangement was terminated during the first quarter of fiscal 2009 as described in Note 1 above.
2 below.SurModics, Inc. and Subsidiaries
Notes to Consolidated Financial Statements — (Continued)
In October 2009, the Financial Accounting Standards Board (“FASB”) amended the accounting standards for multiple deliverable revenue arrangements were amended to:
(i) provide updated guidance on whether multiple deliverables exist, how the deliverables in an arrangement should be separated, and how the consideration should be allocated;
(ii) require an entity to allocate revenue in an arrangement using estimated selling prices (ESP)(“ESP”) of deliverables if a vendor does not have vendor-specific objective evidence of selling price (VSOE)(“VSOE”) or third-party evidence of selling price (TPE)(“TPE”); and
(iii) eliminate the use of the residual method and require an entity to allocate revenue using the relative selling price method.
The Company elected to early adopt this accounting guidance at the beginning of its first quarter of fiscal 2010, on a prospective basis, for applicable transactions originating or materially modified on or after October 1, 2009. In connection with the adoption of the amended accounting standard the Company also changed its policy prospectively for multiple element arrangements, whereby the Company accounts for revenue using a multiple attribution model in which consideration allocated to research and development activities is recognized as performed, and milestone payments are recognized when the milestone events are achieved, when such activities and milestones are deemed substantive. Accordingly, in situations where a unit of accounting includes both a license and research and development activities, and when a license does not have stand-alone value, the Company applies a multiple attribution model in which consideration allocated to the license is recognized ratably, consideration allocated to research and development activities is recognized as performed and milestone payments are recognized when the milestone events are achieved, when such activities and milestones are deemed substantive.
F-14
SurModics, Inc. and Subsidiaries
Notes to Consolidated Financial Statements — (Continued)
The Company enters into license and development arrangements that may consist of multiple deliverables which could include a license(s) to SurModicsSurModics’ technology, research and development activities, manufacturing services, and product sales based on the needs of its customers. For example, a customer may enter into an arrangement to obtain a license to SurModics’ intellectual property which may also include research and development activities, and supply of products manufactured by SurModics. For these services provided, SurModics could receive upfront license fees upon signing of an agreement and granting the license, fees for research and development activities as such activities are performed, milestone payments contingent upon advancement of the product through development and clinical stages to successful commercialization, fees for manufacturing services and supply of product, and royalty payments based on customer sales of product incorporating SurModics’ technology. The Company’s license and development arrangements generally do not have refund provisions if the customer cancels or terminates the agreement. Typically all payments made are non-refundable.
TheUnder the accounting guidance, the Company evaluatesis still required to evaluate each deliverable in a multiple element arrangement for separability. The Company is then required to allocate revenue to each separate deliverable using a hierarchy of VSOE, TPE, or ESP. In certainmany instances, the Company is not able to establish VSOE for all deliverables in an arrangement with multiple elements whichelements. This may be a result of the Company infrequently selling each element separately.separately or having a limited history with multiple element arrangements. When VSOE cannot be established, the Company establishesattempts to establish a selling price of each element based on TPE. TPE is determined based on competitor prices for similar deliverables when sold separately.
When the Company is unable to establish a selling price using VSOE or TPE, the Company uses ESP in its allocation of arrangement consideration. The objective of ESP is to determine the price at which the Company would transact a sale if the product or service were sold on a stand-alone basis. ESP is generally used for highly customized offerings.
SurModics, Inc. and Subsidiaries
Notes to Consolidated Financial Statements — (Continued)
The Company determines ESP for undelivered elements by considering multiple factors including, but not limited to, market conditions, competitive landscape and past pricing arrangements with similar characteristics.
Net sales as reported and pro forma net sales that would have been reportedfeatures. The determination of ESP is made through consultation with the Company’s management, taking into consideration the marketing strategies for
the year ended September 30, 2010, if the transactions entered into or materially modified after September 30, 2009 were subject to theeach business unit.The Company’s accounting policies under the previous accounting guidance, are shown in the following table (in thousands):
| | | | | | | | | |
| | | | | | Pro Forma Basis as if the
| |
| | | | | | Previous Accounting
| |
| | | As Reported | | | Guidance Were in Effect | |
| |
| Total multiple element arrangement revenue | | $ | 4,232 | | | $ | 378 | |
| | | | | | | | | |
The impact to revenueapplicable for the fiscal year ended September 30, 2010 associated with adoption of the new accounting guidance was primarily related to research and development activities. The Company’s accounting policies under the previous accounting guidance2009, would have resulted in partial recognition of the research and development revenue in the current periods with the remainder deferred and recognized over the economic life of the technology. Under the new accounting guidance, effective for fiscal 2011 and 2010, the Company is recognizing research and development revenue as the activities are performed. The Company notes that this new accounting guidance will result in current revenue recognition of research and development activities in the period the activities are performed with the revenue generated changing from period to period based on the stage of project development. The amount of revenue that is recognized could be material in any reporting period.
In April 2010, the FASB issued updated authoritative accounting guidance which provides a consistent framework for applying the milestone method of revenue recognition in arrangements that include research or development deliverables. The amendments are effective on a prospective basis for milestones achieved in fiscal years, and interim periods within those years, beginning on or after June 15, 2010 with early adoption permitted. The Company is evaluating the guidance and does not expect the adoption to have a material impact on the Company’s consolidated financial statements.
F-15
SurModics, Inc. and Subsidiaries
Notes to Consolidated Financial Statements — (Continued)
Merck Agreement. OnIn June 27, 2007, the Company announcedentered into a licenseLicense and research collaboration agreementResearch Collaboration Agreement and separate Supply Agreement with Merck & Co., Inc. (Merck)(“Merck”). The agreement called for SurModics and Merck to pursue the joint development and commercialization of SurModics’ I-vation sustained drug delivery system with TA (triamcinolone acetonide)(“triamcinolone acetonide”), and other products combining certain of Merck’s proprietary drug compounds and the I-vation system for the treatment of serious retinal diseases. Under the terms of the agreement, Merck led and funded development and commercialization activities. SurModics received an up-front license fee of $20 million in fiscal 2007 and additional license fees totaling $11 million in fiscal 2008. In addition, the Company was paid for its activities in researching and developing the combination products. Research and development fees totaling $5.8 million were billed in fiscal 2008. The Company recognizedout-of-pocket reimbursements, totaling $1.6 million in fiscal 2008, as revenue in the period since the related costs were incurred when commensurate value was transferred to Merck in exchange for the reimbursement received.
In September 2008, following a strategic review of Merck’s business and product development portfolio, Merck gave notice to SurModics of its intent to terminatethat it was terminating the collaborative researchlicense and licenseresearch agreement, as well as the supply agreement entered into in June 2007. The termination was effective in December 2008. The Company recognized all remaining deferred revenue related to the Merck agreement, totaling $34.8 million, as revenue in fiscal 2009. The Company also recognized a $9$9.0 million milestone payment from Merck associated with the termination of the triamcinolone acetonide development program in fiscal 2009.
The Company recognized revenue from the up-front license fee, additional license fees and research and development fees over the economic life of the technology licensed to Merck, which was 16 years, prior to termination of the contract.
Amounts received prior to satisfying the above revenue recognition criteria are recorded as deferred revenue in the accompanying consolidated balance sheets, with deferred revenue to be recognized beyond one year being classified as non-current deferred revenue. As of September 30, 20102011 and 2009,2010, the Company had deferred revenue of $4.2 million and $1.5 million, respectively.
for both periods.Costs related to products and services delivered are recognized in the period revenue is recognized except for services related to the Merck agreement, which were recognized as incurred. Customer advances are accounted for as a liability until all criteria for revenue recognition have been met.
Customer Concentrations
The Company’s licensed technologies provide royalty revenue, which represents the largest revenue stream to the Company. The Company has licenses with a diverse base of customers and certain customers have multiple products using the Company’s technology. Medtronic, Inc. (“Medtronic”) is the Company’s largest customer at 15% of total revenue for fiscal 2011. Medtronic has several separately licensed products that generate royalty revenue for the Company. In addition, there has been a decline in royalty revenue from one of the Company’s largest customers, Cordis Corporation, a subsidiary of Johnson & Johnson (“Cordis”), and with Cordis’ June 2011 announcement of the cessation of the manufacture of the CYPHER® and CYPHER SELECT® Plus stents by the end of 2011, the Company’s royalty stream from this customer reached the contractual $1.0 million minimum quarterly level per the agreement in the third and fourth quarters of fiscal 2011. No other individual customer product using licensed technology constitutes more than 5% of the Company’s total revenue. Further,
SurModics, Inc. and Subsidiaries
Notes to Consolidated Financial Statements — (Continued)
the Company’s licensing agreements with many of its customers, including most of its significant customers, cover many licensed products that each separately generate royalty revenue. This situation reduces the potential risk to the Company’s operations that may result from reduced sales (or the termination of a license) of a single product for any specific customer.
Research and Development
Research and development costs are expensed as incurred. Some research and development costs are related to third party contracts, and the related revenue is recognized as described in “Revenue Recognition” above. The research and development costs are presented in the consolidated statements of operations in two categories; those associated with customer-related projects and those associated with other research and development costs.
Costs associated with customer-related research and development include specific project direct labor costs and material expenses as well as an allocation of overhead costs based on direct labor dollars.
The preparation of financial statements in conformity with GAAP requires management to make estimates and assumptions that affect the reported amounts of assets and liabilities, the disclosure of contingent assets and liabilities at the date of the financial statements and the reported amounts of revenue and expenses during the reporting period. Ultimate results could differ from those estimates.
F-16
New Accounting PronouncementsIn September 2011, the FASB issued changes to existing goodwill impairment testing guidance and permitted early adoption. The new accounting guidance involves assessment of qualitative factors to determine whether the existence of events or circumstances leads to a determination that it is more likely than not that the fair value of a reporting unit is less than its carrying amount. If, after assessing the totality of events or circumstances, an entity determines it is not more likely than not that the fair value of a reporting unit is less than its carrying amount, then moving to the next phase, the two-step impairment test is unnecessary. The Company elected to early adopt the new guidance for its annual impairment testing in the fourth quarter of fiscal 2011.
In June 2011, the FASB issued changes to the presentation of comprehensive income. These changes give an entity the option to present the total of comprehensive income, the components of net income, and the components of other comprehensive income either in a single continuous statement of comprehensive income or in two separate but consecutive statements; the option to present components of other comprehensive income as part of the statement of changes in stockholders’ equity was eliminated. The items that must be reported in other comprehensive income or when an item of other comprehensive income must be reclassified to net income were not changed. Additionally, no changes were made to the calculation and presentation of earnings per share. These changes become effective for the Company on October 1, 2012 (fiscal 2013). Management is currently evaluating these changes to determine which option will be chosen for the presentation of comprehensive income. Other than the change in presentation, management has determined these changes will not have an impact on the consolidated financial statements.In May 2011, the FASB issued changes to conform existing guidance regarding fair value measurement and disclosure between GAAP and International Financial Reporting Standards. These changes both clarify the FASB’s intent about the application of existing fair value measurement and disclosure requirements and amend certain principles or requirements for measuring fair value or for disclosing information about fair value measurements. The clarifying changes relate to the application of the highest and best use and valuation premise concepts, measuring the fair value of an instrument classified in a reporting entity’s shareholders’ equity, and
SurModics, Inc. and Subsidiaries
Notes to Consolidated Financial Statements — (Continued)
New Accounting Pronouncements
disclosure of quantitative information about unobservable inputs used for Level 3 fair value measurements. The amendments relate to measuring the fair value of financial instruments that are managed within a portfolio; application of premiums and discounts in a fair value measurement; and additional disclosures concerning the valuation processes used and sensitivity of the fair value measurement to changes in unobservable inputs for those items categorized as Level 3, a reporting entity’s use of a nonfinancial asset in a way that differs from the asset’s highest and best use, and the categorization by level in the fair value hierarchy for items required to be measured at fair value for disclosure purposes only. These changes become effective for the Company on January 1, 2012 (fiscal 2012). Management is currently evaluating the potential impact of these changes on the consolidated financial statements.
No other new accounting pronouncement issued or effective has had, or is expected to have, a material impact on the Company’s consolidated financial statements.
| 3. | |
3. | Fair Value Measurements |
The accounting guidance on fair value measurements defines fair value, establishes a framework for measuring fair value under GAAP, and expands disclosures about fair value measurements. The guidance is applicable for all financial assets and financial liabilities and for all nonfinancial assets and nonfinancial liabilities recognized or disclosed at fair value in the financial statements on a recurring basis (at least annually). Fair value is defined as the exchange price that would be received from selling an asset or paid to transfer a liability (an exit price) in an orderly transaction between market participants at the measurement date. When determining the fair value measurements for assets and liabilities required or permitted to be recorded at fair value, the Company considers the principal or most advantageous market in which it would transact and also considers assumptions that market participants would use when pricing the asset or liability, such as inherent risk, transfer restrictions and risk of nonperformance.
Accounting guidance on fair value measurements requires that assets and liabilities carried at fair value be classified and disclosed in one of the following three categories:
Level 1 — Quoted (unadjusted) prices in active markets for identical assets or liabilities.
The Company’s Level 1 asset consists of its investment in OctoPlus (see Note 2 for further information). The fair market value of this investment is based on the quoted price of OctoPlus shares as traded on the Amsterdam Stock Exchange.
Level 2 — Observable inputs other than quoted prices included in Level 1, such as quoted prices for similar assets or liabilities in active markets; quoted prices for identical or similar assets or liabilities in markets that are not active; or other inputs that are observable or can be corroborated by observable market data for substantially the full term of the asset or liability.
The Company’s Level 2 assets consist of money market funds, U.S. Treasury securities, corporate bonds, municipal bonds, U.S. government agency securities, government agency and municipal securities and certain asset-backed securities and mortgage-backed securities. Fair market values for these assets are based on quoted vendor prices and broker pricing where all significant inputs are observable.
Level 3 — Unobservable inputs to the valuation methodology that are supported by little or no market activity and that are significant to the measurement of the fair value of the assets or liabilities. Level 3 assets and liabilities include those whose fair value measurements are determined using pricing models, discounted cash flow methodologies or similar valuation techniques, as well as significant management judgment or estimation.
SurModics, Inc. and Subsidiaries
Notes to Consolidated Financial Statements — (Continued)
The Company’s Level 3 assets include a U.S. government agency security and certain asset-backed and mortgage-backed securities. The fair market values of these investments were determined by broker pricing where not all significant inputs were observable.
In valuing assets and liabilities, the Company is required to maximize the use of quoted market prices and minimize the use of unobservable inputs.
We The Company did not significantly change ourits valuation techniques from prior periods.
F-17
SurModics, Inc. and Subsidiaries
Notes to Consolidated Financial Statements — (Continued)
Assets and Liabilities Measured at Fair Value on a Recurring Basis
In instances where the inputs used to measure fair value fall into different levels of the fair value hierarchy, the fair value measurement has been determined based on the lowest level input that is significant to the fair value measurement in its entirety. The Company’s assessment of the significance of a particular item to the fair value measurement in its entirety requires judgment, including the consideration of inputs specific to the asset or liability. The following table presents information about the Company’s financialassets and liabilities measured at fair value on a recurring basis as of September 30, 2011(in thousands):
| | | | | | | | | | | | | | | | |
| | | Quoted Prices
in Active
Markets for
Identical
Instruments
(Level 1) | | | Significant
Other
Observable
Inputs
(Level 2) | | | Significant
Unobservable
Inputs
(Level 3) | | | Total Fair
Value as of
September 30,
2011 | |
Assets: | | | | | | | | | | | | | | | | |
Cash equivalents | | $ | — | | | $ | 8,419 | | | $ | — | | | $ | 8,419 | |
Available-for-sale debt securities: | | | | | | | | | | | | | | | | |
U.S. government and government agency obligations | | | — | | | | 30,604 | | | | — | | | | 30,604 | |
Mortgage-backed securities | | | — | | | | 3,933 | | | | 15 | | | | 3,948 | |
Municipal bonds | | | — | | | | 3,614 | | | | — | | | | 3,614 | |
Asset-backed securities | | | — | | | | 1,278 | | | | 9 | | | | 1,287 | |
Corporate bonds | | | — | | | | 2,497 | | | | — | | | | 2,497 | |
Other assets | | | 1,190 | | | | — | | | | — | | | | 1,190 | |
| | | | | | | | | | | | | | | | |
Total assets measured at fair value | | $ | 1,190 | | | $ | 50,345 | | | $ | 24 | | | $ | 51,559 | |
| | | | | | | | | | | | | | | | |
The consolidated balance sheets include held-to-maturity investments totaling $3.0 million as of September 30, 2011. Held-to-maturity investments are carried at amortized cost.
SurModics, Inc. and Subsidiaries
Notes to Consolidated Financial Statements — (Continued)
The following table presents information about the Company’s assets and liabilities measured at fair value on a recurring basis as of September 30, 2010(in thousands):
| | | | | | | | | | | | | | | | | |
| | | Quoted Prices
| | | | | | | | | | |
| | | in Active
| | | Significant
| | | | | | | |
| | | Markets for
| | | Other
| | | Significant
| | | Total Fair
| |
| | | Identical
| | | Observable
| | | Unobservable
| | | Value as of
| |
| | | Instruments
| | | Inputs
| | | Inputs
| | | September 30,
| |
| | | (Level 1) | | | (Level 2) | | | (Level 3) | | | 2010 | |
| |
| Assets: | | | | | | | | | | | | | | | | |
| Cash equivalents | | $ | — | | | $ | 10,128 | | | $ | — | | | $ | 10,128 | |
| Available for sale debt securities | | | | | | | | | | | | | | | | |
| US government obligations | | | — | | | | 25,626 | | | | 704 | | | | 26,330 | |
| Mortgage backed securities | | | — | | | | 4,757 | | | | 69 | | | | 4,826 | |
| Municipal bonds | | | — | | | | 3,150 | | | | — | | | | 3,150 | |
| Asset backed securities | | | — | | | | 1,113 | | | | — | | | | 1,113 | |
| Corporate bonds | | | — | | | | 5,852 | | | | — | | | | 5,852 | |
| Other assets | | | 2,624 | | | | — | | | | — | | | | 2,624 | |
| | | | | | | | | | | | | | | | | |
| Total assets measured at fair value | | $ | 2,624 | | | $ | 50,626 | | | $ | 773 | | | $ | 54,023 | |
| | | | | | | | | | | | | | | | | |
Short-term and long-term investments disclosed in the consolidated balance sheets includeheld-to-maturity investments totaling $4.1 million as of September 30, 2010.Held-to-maturity investments are carried at amortized cost.
The following table presents information about the Company’s financial assets and liabilities measured at fair value on a recurring basis as of September 30, 2009(in thousands):
| | | | | | | | | | | | | | | | | |
| | | Quoted Prices
| | | | | | | | | | |
| | | in Active
| | | Significant
| | | | | | | |
| | | Markets for
| | | Other
| | | Significant
| | | Total Fair
| |
| | | Identical
| | | Observable
| | | Unobservable
| | | Value as of
| |
| | | Instruments
| | | Inputs
| | | Inputs
| | | September 30,
| |
| | | (Level 1) | | | (Level 2) | | | (Level 3) | | | 2009 | |
| |
| Assets: | | | | | | | | | | | | | | | | |
| Cash equivalents | | $ | — | | | $ | 9,108 | | | $ | — | | | $ | 9,108 | |
| Available for sale debt securities | | | | | | | | | | | | | | | | |
| US government obligations | | | — | | | | 9,960 | | | | 1,130 | | | | 11,090 | |
| Mortgage backed securities | | | — | | | | 7,935 | | | | 73 | | | | 8,008 | |
| Municipal bonds | | | — | | | | 7,443 | | | | — | | | | 7,443 | |
| Asset backed securities | | | — | | | | 2,256 | | | | — | | | | 2,256 | |
| Corporate bonds | | | — | | | | 1,184 | | | | — | | | | 1,184 | |
| Other assets | | | 3,700 | | | | — | | | | — | | | | 3,700 | |
| | | | | | | | | | | | | | | | | |
| Total assets measured at fair value | | $ | 3,700 | | | $ | 37,886 | | | $ | 1,203 | | | $ | 42,789 | |
| | | | | | | | | | | | | | | | | |
F-18
| | | | | | | | | | | | | | | | |
| | | Quoted Prices
in Active
Markets for
Identical
Instruments
(Level 1) | | | Significant
Other
Observable
Inputs
(Level 2) | | | Significant
Unobservable
Inputs
(Level 3) | | | Total Fair
Value as of
September 30,
2010 | |
Assets: | | | | | | | | | | | | | | | | |
Cash equivalents | | $ | — | | | $ | 10,128 | | | $ | — | | | $ | 10,128 | |
Available-for-sale debt securities: | | | | | | | | | | | | | | | | |
U.S. government and government agency obligations | | | — | | | | 25,626 | | | | 704 | | | | 26,330 | |
Mortgage-backed securities | | | — | | | | 4,757 | | | | 69 | | | | 4,826 | |
Municipal bonds | | | — | | | | 3,150 | | | | — | | | | 3,150 | |
Asset-backed securities | | | — | | | | 1,113 | | | | — | | | | 1,113 | |
Corporate bonds | | | — | | | | 5,852 | | | | — | | | | 5,852 | |
Other assets | | | 2,624 | | | | — | | | | — | | | | 2,624 | |
| | | | | | | | | | | | | | | | |
Total assets measured at fair value | | $ | 2,624 | | | $ | 50,626 | | | $ | 773 | | | $ | 54,023 | |
| | | | | | | | | | | | | | | | |
SurModics, Inc. and Subsidiaries
Notes to Consolidated Financial Statements — (Continued)
Changes in Level 3 Instruments Measured at Fair Value on a Recurring Basis
The following tables (in thousands) provide a reconciliation of fiscal 20102011 and 20092010 financial assets measured at fair value on a recurring basis using significant unobservable inputs (Level 3) (in thousands). Transfers of instruments into and out of Level 3 are based on beginning of year values.
| | | | | | | | | | | | | |
| | | Fair Value Measurements Using Significant Unobservable Inputs (Level 3)
| |
| | | For the Year Ended September 30, 2010
| |
| | | Available-for-Sale Debt Securities | |
| | | U.S. Government
| | | Mortgage
| | | | |
| | | Obligations | | | Backed | | | Total | |
| |
| Balance, September 30, 2009 | | $ | 1,130 | | | $ | 73 | | | $ | 1,203 | |
| Transfers into Level 3 | | | — | | | | 148 | | | | 148 | |
| Transfers out of Level 3 | | | (36 | ) | | | (145 | ) | | | (181 | ) |
| Total realized and unrealized gains (losses): | | | | | | | | | | | | |
| Included in other comprehensive (loss) income | | | (33 | ) | | | 3 | | | | (30 | ) |
| Purchases, issuances, sales and settlements, net | | | (357 | ) | | | (10 | ) | | | (367 | ) |
| | | | | | | | | | | | | |
| Balance, September 30, 2010 | | $ | 704 | | | $ | 69 | | | $ | 773 | |
| | | | | | | | | | | | | |
| | | | | | | | | | | | | | | | | |
| | | Fair Value Measurements Using Significant
| |
| | | Unobservable Inputs (Level 3)
| |
| | | For the Year Ended September 30, 2009
| |
| | | Available-for-Sale Debt Securities | |
| | | U.S. Government
| | | | | | Mortgage
| | | | |
| | | Obligations | | | Corporate | | | Backed | | | Total | |
| |
| Balance, September 30, 2008 | | $ | 74 | | | $ | 190 | | | $ | — | | | $ | 264 | |
| Transfers into Level 3 | | | 1,273 | | | | — | | | | 79 | | | | 1,352 | |
| Transfers out of Level 3 | | | (581 | ) | | | (199 | ) | | | — | | | | (780 | ) |
| Total realized and unrealized gains (losses): | | | | | | | | | | | | | | | | |
| Included in other comprehensive income (loss) | | | 15 | | | | 9 | | | | 1 | | | | 25 | |
| Purchases, issuances, sales and settlements, net | | | 349 | | | | — | | | | (7 | ) | | | 342 | |
| | | | | | | | | | | | | | | | | |
| Balance, September 30, 2009 | | $ | 1,130 | | | $ | — | | | $ | 73 | | | $ | 1,203 | |
| | | | | | | | | | | | | | | | | |
| | | | | | | | | | | | | | | | |
| | | Fair Value Measurements Using Significant
Unobservable Inputs (Level 3)
For the Year Ended September 30, 2011
Available-for-Sale Debt Securities | |
| | | U.S. Government
Obligations | | | Mortgage-
Backed Securities | | | Asset-
Backed Securities | | | Total | |
Balance at September 30, 2010 | | $ | 704 | | | $ | 69 | | | $ | — | | | $ | 773 | |
Transfers into Level 3 | | | — | | | | 17 | | | | 14 | | | | 31 | |
Transfers out of Level 3 | | | (695 | ) | | | (68 | ) | | | — | | | | (763 | ) |
Total realized and unrealized gains (losses): | | | | | | | | | | | | | | | | |
Included in other comprehensive (loss) income | | | 19 | | | | (3 | ) | | | (3 | ) | | | 13 | |
Purchases, issuances, sales and settlements, net | | | (28 | ) | | | — | | | | (2 | ) | | | (30 | ) |
| | | | | | | | | | | | | | | | |
Balance at September 30, 2011 | | $ | — | | | $ | 15 | | | $ | 9 | | | $ | 24 | |
| | | | | | | | | | | | | | | | |
SurModics, Inc. and Subsidiaries
Notes to Consolidated Financial Statements — (Continued)
| | | | | | | | | | | | | | |
| | | Fair Value Measurements Using Significant
Unobservable Inputs (Level 3)
For the Year Ended September 30, 2010
Available-for-Sale Debt Securities | |
| | | U.S. Government
Obligations | | | Mortgage-
Backed Securities | | | Total | |
Balance at September 30, 2009 | | $ | 1,130 | | | $ | 73 | | | $ | 1,203 | |
Transfers into Level 3 | | | — | | | | 148 | | | | 148 | |
Transfers out of Level 3 | | | (36 | ) | | | (145 | ) | | | (181 | ) |
Total realized and unrealized gains (losses): | | | | | | | | | | | | |
Included in other comprehensive (loss) income | | | (33 | ) | | | 3 | | | | (30 | ) |
Purchases, issuances, sales and settlements, net | | | (357 | ) | | | (10 | ) | | | (367 | ) |
| | | | | | | | | | | | |
Balance at September 30, 2010 | | $ | 704 | | | $ | 69 | | | $ | 773 | |
| | | | | | | | | | | | |
As of September 30, 2010,2011, marketable securities measured at fair value using Level 3 inputs were comprised of $0.7 million of an Other U.S. governmentless than $50,000 and included one asset-backed security and $0.1 million of aone mortgage-backed security within the Company’savailable-for-sale investment portfolio. These securities were measured using observable market data and Level 3 inputs as a result of the lack of market activity and liquidity. The fair value of these securities was based on the Company’s assessment of the underlying collateral and the creditworthiness of the issuer of the securities.
Assets and Liabilities Measured at Fair Value on a Non-Recurring Basis
The Company’s investments in non-marketable securities of private companies are accounted for using the cost method as the Company does not exert significant influence over the investees’ operating or financial activities. These investments, as well asheld-to-maturity securities, are measured at fair value on a non-recurring basis when they are deemed to beother-than-temporarily impaired. In determining whether a decline in value of non-marketable equity investments in private companies has occurred and isother-than-temporary, other than temporary, an assessment is made by considering available evidence, including the general market conditions in the investee’s industry, the investee’s product development status and subsequent rounds of financing and the related valuationand/or the Company’s participation in such financings. The Company also assesses the investee’s ability to meet business milestones and the financial condition and near-term prospects of the individual investee, including the rate at
F-19
SurModics, Inc. and Subsidiaries
Notes to Consolidated Financial Statements — (Continued)
which the investee is using its cash and the investee’s need for possible additional funding at a potentially lower valuation. The valuation methodology for determining the decline in value of non-marketable equity securities is based on inputs that require management judgment and are Level 3 inputs.
In the fourth quarter of fiscal 2011, the Company recognized asset impairment charges totaling $17.9 million. The Company wrote down long-lived assets (fixed assets of $14.8 million and intangibles of $3.1 million), associated with its Pharmaceuticals segment, based on the current valuation of the assets relative to their carrying value. The Company had been exploring strategic alternatives for the Pharmaceuticals segment, including a potential sale. The assets of the Pharmaceuticals segment did not qualify as held-for-sale as of September 30, 2011, because the Company had not committed to a plan to sell at that time. However, the Company’s assessment of options available as of September 30, 2011 resulted in a probability-weighted value of expected future cash flows below the carrying value, which required the Company to determine the fair value of the long-lived assets of the Pharmaceuticals segment using the probability-weighted value of the expected future cash flows. Subsequently, on November 1, 2011, the Company announced that it entered into a definitive agreement to sell substantially all of its Pharmaceuticals assets for $30.0 million and the sale closed on November 17, 2011. See Note 1 for further information regarding the sale of SurModics Pharmaceuticals.
SurModics, Inc. and Subsidiaries
Notes to Consolidated Financial Statements — (Continued)
The Company wrote down three investments totaling $7.9 million in the year ended September 30, 2010, as the investments were deemed to beother-than-temporarily impaired. A pending round of financing at a substantially lower valuation at one of the private companies resulted in impairment loss of $2.4 million. Another company sold off assets in light of current market conditions and this action resulted in impairment loss of $0.2 million. In addition, an impairment loss of $5.3 million was recognized related to a third company, which continues to face operational and financing difficulties and potential rounds of financing at lower valuations. Management utilized Level 3 inputs which included information about pending financings as well as market input to determine the fair value of these investments.
The Company also incurredrecognized long-lived asset impairment charges totaling $4.9 million in fiscal 2010. Fair value measurements used in the impairment reviews of property and equipment and intangible assets are Level 3 measurements that require management judgment. The Company recorded a $1.9 million asset impairment charge associated with writing down one of its facilities in Alabama to fair value based on a decision to sell the facility, which decision was reversed later in fiscal 2010. The $2.1 million carrying value of this facility iswas based on a real estate market appraisal obtained during the Company’s negotiations.
The Company also recorded a $1.3 million asset impairment charge in fiscal 2010 associated with certain long-lived assets where very limitedno ongoing business is expected in the near termforeseeable future based on current market conditions. Furthermore, a $1.3 million asset impairment charge associated with certain fixed asset costs located in Minnesota and a $0.4 million asset impairment charge associated with prototypes and other equipment related to a development project for which very limitedno ongoing business iswas expected in the near termforeseeable future in light of current market conditions were also recognized. The assets associated with these charges had limited remaining value and as such were written down to zero value.
See Note 2 for additional information related to these impairments
| 4. | |
4. Acquisition | Acquisitions |
PR Pharmaceuticals, Inc. On November 4, 2008, the Company’s SurModics Pharmaceuticals Inc. (formerly known as Brookwood Pharmaceuticals, Inc.) subsidiary entered into an asset purchase agreement with PR Pharmaceuticals, Inc. (PR Pharma)(“PR Pharma”), whereby it acquired certain contracts and assets of PR Pharma for $5.6 million consisting of $2.9 million in cash on the closing date, additional consideration of $2.4 million upon(paid in fiscal 2009) based on successful achievement of specified milestones and $0.3 million in transaction costs. The sellers of PR Pharma isare still eligible to receive up to an additional $3.6$3.0 million in cash upon thebased on successful achievement of specified milestones for contract signing and invoicing, successful patent issuances and product development. Management believes this acquisition strengthensPotential milestones of $0.6 million were not earned and lapsed in fiscal 2011. The Company agreed to indemnify Evonik for certain contingent consideration obligations when it sold substantially all of the Company’s portfolio of drug delivery technologies for the pharmaceutical and biotechnology industries.SurModics Pharmaceuticals assets to Evonik on November 17, 2011. The purchase price was allocated as follows as of November 4, 2008(in thousands):
| | | | |
Core technology | | $ | 1,400 | |
Customer relationships | | | 900 | |
In-process research and development | | | 3,200 | |
Trade names | | | 20 | |
Non-compete agreements | | | 50 | |
| | | | |
Total purchase price | | $ | 5,570 | |
| | | | |
| | | | |
Core technology | | $ | 1,400 | |
Customer relationships | | | 900 | |
In-process research and development | | | 3,200 | |
Trade names | | | 20 | |
Non-compete agreements | | | 50 | |
| | | | |
Total purchase price | | $ | 5,570 | |
| | | | |
The acquired developed technology is being amortized on a straight-line basis over 18 years, customer relationships are being amortized over 9nine years, and non-compete agreements are beingwere amortized over 2two years.
SurModics, Inc. and Subsidiaries
Notes to Consolidated Financial Statements — (Continued)
The trade names had a life of less than one year and were fully amortized in fiscal 2009. As part of the acquisition, the
F-20
SurModics, Inc. and Subsidiaries
Notes to Consolidated Financial Statements — (Continued)
Company recognized fair value associated with in-process research and development (IPR&D)(“IPR&D”) of $3.2 million. The IPR&D was expensed on the date of acquisition and relates to polymer-based drug delivery systems. The value assigned to IPR&D is related to projects for which the related products have not achieved commercial feasibility and have no future alternative use. The amount of purchase price allocated to IPR&D was based on estimating the future cash flows of each project and discounting the net cash flows back to their present values. The discount rate used was determined at the time of acquisition in accordance with accepted valuation methods. These methodologies include consideration of the risk of the project not achieving commercial feasibility. The research efforts ranged from 5% to 50% complete at the date of acquisition. The Company used the Relief from Royalty valuation method to assess the fair value of the projects with a risk-adjusted discount rate of 25%. The Company determined the method was appropriate based on the nature of the projects and future cash flow streams. The research and development work performed is billed to customers, in most cases, using standard commercial billing rates which include a reasonable markup. Accordingly, the Company has no fixed cost obligations to carry projects forward. There have been no significant changes to the development plans for the acquired incomplete projects. Significant net cash inflows would commence with the commercial launch of customer products that are covered by the intellectual property rights and related agreements acquired from PR Pharma.
| 5. | |
5. | Revolving Credit Facility |
In February 2009,2011, the Company entered into a two-year $25.0 millionextended its unsecured revolving credit facility.facility through March 2012 and reduced the credit facility to $15.0 million. Borrowings under the credit facility, if any, will bear interest at a benchmark rate plus an applicable margin based upon the Company’s funded debt to EBITDA ratio. In connection with the credit facility, the Company is required to maintain certain financial and nonfinancial covenants. As of September 30, 2010,2011, the Company had no debt outstanding under the credit facility and was not in compliance with certainall covenants. The Company is working with the bank to obtain waivers and expects to complete these activities by the end of the second quarter of fiscal 2011. The Company believes that noncompliance will not cause liquidity issues given the Company’s investment holdings and cash flow generated by operations.
| 6. | |
6. | Stockholders’ Equity |
The Company has stock-based compensation plans under which it grants stock options, restricted stock awards and performance share awards. Accounting guidance requires all share-based payments to be recognized as an operating expense, based on their fair values, over the requisite service period. The Company’s stock-based compensation expenses for the years ended September 30 were allocated to the following expense categories(in thousands):
| | | | | | | | | | | | | |
| | | 2010 | | | 2009 | | | 2008 | |
| |
| Product | | $ | 139 | | | $ | 87 | | | $ | 161 | |
| Customer research and development | | | 772 | | | | 815 | | | | 1,794 | |
| Other research and development | | | 2,399 | | | | 2,806 | | | | 1,999 | |
| Selling, general and administrative | | | 2,565 | | | | 3,145 | | | | 5,698 | |
| | | | | | | | | | | | | |
| Total | | $ | 5,875 | | | $ | 6,853 | | | $ | 9,652 | |
| | | | | | | | | | | | | |
| | | | | | | | | | | | |
| | | 2011 | | | 2010 | | | 2009 | |
Product | | $ | 213 | | | $ | 139 | | | $ | 87 | |
Customer research and development | | | 372 | | | | 772 | | | | 815 | |
Other research and development | | | 983 | | | | 2,399 | | | | 2,806 | |
Selling, general and administrative | | | 2,684 | | | | 2,565 | | | | 3,145 | |
| | | | | | | | | | | | |
Total | | $ | 4,252 | | | $ | 5,875 | | | $ | 6,853 | |
| | | | | | | | | | | | |
As of September 30, 2010,2011, approximately $4.8$4.3 million of total unrecognized compensation costs related to non-vested awards is expected to be recognized over a weighted average period of approximately 2.42.5 years. The unrecognized compensation costs above exclude $1.2$1.0 million associated with performance share awards that are currently not anticipated to be fully expensed because the performance conditions are not expected to be met.
F-21
SurModics, Inc. and Subsidiaries
Notes to Consolidated Financial Statements — (Continued)
Stock Option Plans
The Company uses the Black-Scholes option pricing model to determine the weighted average grant date fair value of stock options granted. The weighted average per share fair value of stock options granted during fiscal 2011, 2010 and 2009 was $3.96, $6.78, and 2008 was $6.78, $8.95, and $14.85, respectively. The assumptions used as inputs in the model for the years ended September 30 were as follows:
| | | | | | | | | | | | | |
| | | 2010 | | 2009 | | 2008 |
| |
| Risk-free interest rates | | | 1.95 | % | | | 2.30 | % | | | 2.80 | % |
| Expected life | | | 4.8 years | | | | 4.8 years | | | | 4.6 years | |
| Expected volatility | | | 41 | % | | | 40 | % | | | 37 | % |
| Dividend yield | | | 0 | % | | | 0 | % | | | 0 | % |
| | | | | | | | | | | | |
| | | 2011 | | | 2010 | | | 2009 | |
Risk-free interest rates | | | 1.45 | % | | | 1.95 | % | | | 2.30 | % |
Expected life | | | 4.8 years | | | | 4.8 years | | | | 4.8 years | |
Expected volatility | | | 45 | % | | | 41 | % | | | 40 | % |
Dividend yield | | | 0 | % | | | 0 | % | | | 0 | % |
SurModics, Inc. and Subsidiaries
Notes to Consolidated Financial Statements — (Continued)
The risk-free interest rate assumption was based on the U.S. Treasury’s rates for U.S. Treasury zero-coupon bonds with maturities similar to those of the expected term of the award. The expected life of options granted is determined based on the Company’s experience. Expected volatility is based on the Company’s stock price movement over a period approximating the expected term. Based on management’s judgment, dividend rates are expected to be zero for the expected life of the options. The Company also estimates forfeitures of options granted, which are based on historical experience.
The Company’s Incentive Stock Options (ISO)(“ISO”) are granted at a price of at least 100% of the fair market value of the common stock of the Company on the date of the grant or 110% with respect to optionees who own more than 10% of the total combined voting power of all classes of stock. ISOs generally expire in seven years or upon termination of employment and generally are exercisable at a rate of 20% per year commencing one year after the date of grant. Non-qualified stock options are granted at fair market value on the date of grant. Non-qualified stock options expire in 7seven to 10ten years or upon termination of employment or service as a Board member. Non-qualified stock options granted prior to May 2008 generally become exercisable with respect to 20% of the shares on each of the first five anniversaries following the grant date, and nonqualified stock options granted subsequent to MayApril 2008 generally become exercisable with respect to 25% of the shares on each of the first four anniversaries following the grant date. Shareholders approved the 2009 Equity Incentive Plan (2009 Plan)(“2009 Plan”) at the February 8, 2010 Annual Meeting of Shareholders. The 2009 Plan has 1,500,000 shares authorized, plus the number of shares that have not yet been awarded under the 2003 Equity Incentive Plan, or were awarded and subsequently returned to the pool of available shares under the 2003 Equity Incentive Plan pursuant to its terms. At September 30, 2010,2011, there were 1,819,0001,433,000 shares available for future awards. As of September 30, 2010,2011, the aggregate intrinsic value of the option shares outstanding and option shares exercisable was not meaningful, as the Company’s stock price of $11.92$9.10 per share on September 30, 20102011 was below the value of option shares outstanding and exercisable. At September 30, 2010,2011, the average remaining contractual life of options outstanding and options exercisable was 4.34.1 and 3.32.8 years, respectively. There were no stock options exercised in fiscal 2011. There was no intrinsic value associated with options exercised during fiscal 2010 as the Company’s stock price of $11.92 per share on September 30, 2010 was below the value of options exercised. The intrinsic value of options exercised during fiscal 2009 and 2008 was $0.2 million and $2.9 million, respectively.
F-22
| | | | | | | | |
| | | Number of
Shares | | | Weighted
Average
Exercise Price | |
Outstanding at September 30, 2008 | | | 1,522,790 | | | $ | 34.26 | |
Granted | | | 268,700 | | | | 24.06 | |
Exercised | | | (17,600 | ) | | | 8.82 | |
Forfeited | | | (104,320 | ) | | | 35.33 | |
| | | | | | | | |
Outstanding at September 30, 2009 | | | 1,669,570 | | | $ | 32.82 | |
Granted | | | 388,635 | | | | 22.88 | |
Exercised | | | (20,350 | ) | | | 20.74 | |
Forfeited | | | (545,534 | ) | | | 30.58 | |
| | | | | | | | |
Outstanding at September 30, 2010 | | | 1,492,321 | | | $ | 31.22 | |
Granted | | | 551,773 | | | | 9.96 | |
Exercised | | | — | | | | — | |
Forfeited | | | (528,906 | ) | | | 25.15 | |
| | | | | | | | |
Outstanding at September 30, 2011 | | | 1,515,188 | | | $ | 25.59 | |
Exercisable at September 30, 2011 | | | 838,160 | | | $ | 32.91 | |
SurModics, Inc. and Subsidiaries
Notes to Consolidated Financial Statements — (Continued)
| | | | | | | | | |
| | | | | | Weighted
| |
| | | Number of
| | | Average
| |
| | | Shares | | | Exercise Price | |
| |
| Outstanding at September 30, 2007 | | | 1,401,420 | | | $ | 31.29 | |
| Granted | | | 392,917 | | | | 41.86 | |
| Exercised | | | (163,297 | ) | | | 27.45 | |
| Forfeited | | | (108,250 | ) | | | 33.59 | |
| | | | | | | | | |
| Outstanding at September 30, 2008 | | | 1,522,790 | | | $ | 34.26 | |
| Granted | | | 268,700 | | | | 24.06 | |
| Exercised | | | (17,600 | ) | | | 8.82 | |
| Forfeited | | | (104,320 | ) | | | 35.33 | |
| | | | | | | | | |
| Outstanding at September 30, 2009 | | | 1,669,570 | | | $ | 32.82 | |
| Granted | | | 388,635 | | | | 22.88 | |
| Exercised | | | (20,350 | ) | | | 20.74 | |
| Forfeited | | | (545,534 | ) | | | 30.58 | |
| | | | | | | | | |
| Outstanding at September 30, 2010 | | | 1,492,321 | | | $ | 31.22 | |
| Exercisable at September 30, 2010 | | | 843,112 | | | $ | 33.10 | |
The Company has entered into restricted stock agreements with certain key employees, covering the issuance of common stock (Restricted Stock). Under accounting guidance these shares are considered to be non-vested shares. The Restricted Stock will be released to the key employees if they are employed by the Company at the end of the vesting period. Compensation has been recognized for the estimated fair value of the 41,07272,627 common shares and is being charged to income over the vesting term. The stock-based compensation table includes the Restricted Stock expenses recognized related to these awards, which totaled $0.9 million, $1.0 million $1.8 million and $2.2$1.8 million during fiscal 2011, 2010 and 2009, and 2008, respectively.
| | | | | | | | | |
| | | | | | Weighted
| |
| | | Number of
| | | Average
| |
| | | Shares | | | Grant Price | |
| |
| Balance at September 30, 2007 | | | 206,191 | | | $ | 35.89 | |
| Granted | | | 12,383 | | | | 42.18 | |
| Vested | | | (40,336 | ) | | | 38.76 | |
| Forfeited | | | (21,109 | ) | | | 32.83 | |
| | | | | | | | | |
| Balance at September 30, 2008 | | | 157,129 | | | $ | 36.06 | |
| Granted | | | 7,700 | | | | 23.93 | |
| Vested | | | (59,047 | ) | | | 34.44 | |
| Forfeited | | | (4,887 | ) | | | 41.91 | |
| | | | | | | | | |
| Balance at September 30, 2009 | | | 100,895 | | | $ | 35.80 | |
| Granted | | | 30,440 | | | | 18.49 | |
| Vested | | | (83,195 | ) | | | 36.32 | |
| Forfeited | | | (7,068 | ) | | | 33.39 | |
| | | | | | | | | |
| Balance at September 30, 2010 | | | 41,072 | | | $ | 22.33 | |
F-23
| | | | | | | | |
| | | Number of
Shares | | | Weighted
Average
Grant Price | |
Balance at September 30, 2008 | | | 157,129 | | | $ | 36.06 | |
Granted | | | 7,700 | | | | 23.93 | |
Vested | | | (59,047 | ) | | | 34.44 | |
Forfeited | | | (4,887 | ) | | | 41.91 | |
| | | | | | | | |
Balance at September 30, 2009 | | | 100,895 | | | $ | 35.80 | |
Granted | | | 30,440 | | | | 18.49 | |
Vested | | | (83,195 | ) | | | 36.32 | |
Forfeited | | | (7,068 | ) | | | 33.39 | |
| | | | | | | | |
Balance at September 30, 2010 | | | 41,072 | | | $ | 22.33 | |
Granted | | | 66,533 | | | | 10.01 | |
Vested | | | (23,978 | ) | | | 19.38 | |
Forfeited | | | (11,000 | ) | | | 20.79 | |
| | | | | | | | |
Balance at September 30, 2011 | | | 72,627 | | | $ | 12.25 | |
SurModics, Inc. and Subsidiaries
Notes to Consolidated Financial Statements — (Continued)
Performance Share Awards
The Company has entered into Performance Share agreements with certain key employees, covering the issuance of common stock (Performance Shares)(“Performance Shares”). The Performance Shares vest upon the achievement of all or a portion of certain performance objectives, which must be achieved during the performance period. Compensation is recognized in each period based on management’s best estimate of the achievement level of the grants’ specified performance objectives and the resulting vesting amounts. In fiscal 2011, the Company recognized expense of $0.2 million related to 80,695 three-year Performance Shares awarded in November and December 2010 and 591 Performance Shares that vested for a certain individual that met specific performance objectives. In fiscal 2010, the Company recognized expense of $32,000less than $0.1 million related to specific performance objectives achieved by certain individuals. In fiscal 2009, the Company reversed expenses previously recognized of $207,000$0.2 million relating to three-year Performance Shares awarded in May 2008 and one-year Performance Shares awarded in September 2008, which was partially offset by an expense of $164,000$0.2 million related to the estimated value of Performance Shares awarded to individuals based on likely achievement of specific performance objectives. The Company recorded compensation expense of $1.9 million in fiscal 2008 related to 30,552 one-year Performance Shares and 30,552 three-year Performance Shares awarded in May 2008 and 7,600 Performance Shares that vested for certain individuals that met various specific performance objectives. The stock-based compensation table includes the Performance Shares expenses.
1999 Employee Stock Purchase Plan
Under the 1999 Employee Stock Purchase Plan (Stock(“Stock Purchase Plan)Plan”), the Company is authorized to issue up to 400,000 shares of common stock. The number of authorized shares was increased by 200,000 effective with
SurModics, Inc. and Subsidiaries
Notes to Consolidated Financial Statements — (Continued)
shareholder approval at the February 8, 2010 Annual Meeting. All full-time and part-time employees can choose to have up to 10% of their annual compensation withheld, with a limit of $25,000, to purchase the Company’s common stock at purchase prices defined within the provision of the Stock Purchase Plan. As of September 30, 20102011 and 2009,2010, there were $321,000less than $0.1 million and $376,000$0.3 million of employee contributions, respectively, included in accrued liabilities in the accompanying consolidated balance sheets. Stock compensation expense recognized related to the Stock Purchase Plan totaled $250,000, $265,000,$0.2 million, $0.3 million and $199,000$0.3 million, during fiscal 2011, 2010 2009, and 2008,2009, respectively. The stock-based compensation table includes the Stock Purchase Plan expenses.
| 7. | |
7. | Restructuring Charges |
In August 2011, the Company announced a realignment of its business to optimize the Company’s resources according to its strategic plan. As a result of the organizational change, the Company eliminated approximately 9% of its workforce. These employee terminations occurred across various functions, and the reorganization plan was completed by the end of the fourth quarter of fiscal 2011. The Company recorded total pre-tax restructuring charges of $1.0 million in the fourth quarter of fiscal 2011, which consisted of $1.0 million of severance pay and benefits expenses.
In October 2010, the Company announced initiatives to reduce its cost structure and renew its focus on business units to more closely match operations and cost structure with the current customer environment. As a result of the organizational change, the Company eliminated 30 positions, or approximately 13% of its workforce. These employee terminations occurred across various functions, and the reorganization plan was completed by the end of the first quarter of fiscal 2011. The reorganization also resulted in SurModics vacating a leased production facility in Birmingham, Alabama and relocating the production activities to one of its owned facilities in Birmingham. The Company recorded total pre-tax restructuring charges of $1.2 million in the first quarter of fiscal 2011, which consisted of $1.2 million of severance pay and benefits expenses and less than $0.1 million of facility-related costs.
In March 2010, the Company announced an organizational change designed to support future growth by better meeting customer needs, leveraging its multiple competencies across the organization, and building on its pharmaceutical industry experience. As a result of the reorganization, the Company eliminated 11 positions, or approximately 4% of the Company’s workforce. These employee terminations occurred across various functions and the reorganization plan was completed by the end of the third quarter of fiscal 2010. The Company also announced that it was vacatingvacated and subleased its leased sales office in Irvine, California and vacated a leased warehouse in Birmingham, Alabama, as part of the reorganization plan. Both leased spaces were vacated by March 31, 2010.
The Company recorded total pre-tax restructuring charges of approximately $1.3 million in connection with the fiscal 2010 reorganization. These pre-tax chargesreorganization, which consisted of $0.8 million of severance pay and benefits expenses and $0.5 million of facility-related costs.
In November 2008, the Company announced a functional reorganization to allow the Company to better serve its customers and improve its operating performance. As a result of the reorganization, the Company eliminated 15 positions, or approximately five percent5% of the Company’s workforce. These employee terminations occurred across various functions and the reorganization plan was completed by the end of the first quarter of fiscal 2009. The Company also vacated a leased facility in Eden Prairie, Minnesota, consolidating into its owned office and research facility also in Eden Prairie, as part of the reorganization plan.
The Company recorded total pre-tax restructuring charges of approximately $1.8 million in connection with the reorganization. These pre-tax chargesfiscal 2009 reorganization, which consisted of $0.5 million of severance pay and benefits expenses and
F-24
Cash payments related to all restructuring events totaled $2.4 million in fiscal 2011, resulting in a restructuring accrual balance of $1.0 million at September 30, 2011.SurModics, Inc. and Subsidiaries
Notes to Consolidated Financial Statements — (Continued)
$1.3 million of facility-related costs which were recorded in fiscal 2009. The restructuring was expected to result in approximately $2.0 million in annualized cost savings.
Cash payments related to both restructuring events totaled $1.1 million in fiscal 2010, resulting in a balance of $1.2 million at September 30, 2010.
The following table summarizes the restructuring accrual activity for fiscal 2010(in thousands):
| | | | | | | | | | | | | |
| | | Employee
| | | Facility-
| | | | |
| | | Severance
| | | Related
| | | | |
| | | and Benefits | | | Costs | | | Total | |
| |
| Balance at September 30, 2008 | | $ | — | | | $ | — | | | $ | — | |
| Accruals during the year | | | 513 | | | | 1,250 | | | | 1,763 | |
| Cash payments | | | (513 | ) | | | (295 | ) | | | (808 | ) |
| | | | | | | | | | | | | |
| Balance at September 30, 2009 | | $ | — | | | $ | 955 | | | $ | 955 | |
| Accruals during the year | | | 818 | | | | 488 | | | | 1,306 | |
| Cash payments | | | (814 | ) | | | (264 | ) | | | (1,078 | ) |
| | | | | | | | | | | | | |
| Balance at September 30, 2010 | | $ | 4 | | | $ | 1,179 | | | $ | 1,183 | |
| | | | | | | | | | | | | |
| | | | | | | | | | | | |
| | | Employee
Severance
and Benefits | | | Facility-
Related
Costs | | | Total | |
Balance at September 30, 2008 | | $ | — | | | $ | — | | | $ | — | |
Accruals during the year | | | 513 | | | | 1,250 | | | | 1,763 | |
Cash payments | | | (513 | ) | | | (295 | ) | | | (808 | ) |
| | | | | | | | | | | | |
Balance at September 30, 2009 | | $ | — | | | $ | 955 | | | $ | 955 | |
Accruals during the year | | | 818 | | | | 488 | | | | 1,306 | |
Cash payments | | | (814 | ) | | | (264 | ) | | | (1,078 | ) |
| | | | | | | | | | | | |
Balance at September 30, 2010 | | $ | 4 | | | $ | 1,179 | | | $ | 1,183 | |
Accruals during the year | | | 2,181 | | | | 62 | | | | 2,243 | |
Cash payments | | | (1,455 | ) | | | (991 | ) | | | (2,446 | ) |
| | | | | | | | | | | | |
Balance at September 30, 2011 | | $ | 730 | | | $ | 250 | | | $ | 980 | |
| | | | | | | | | | | | |
The charges above have been shown separately as restructuring charges on the consolidated statements of operations. The remaining accrual for bothrelates to the fiscal 2011 and 2010 restructurings and 2009 restructurings is expected to be paid within the next 3927 months. As such, the current portion totaling $1.0$0.9 million is recorded as a current liability within other accruedcurrent liabilities and the long-term portion totaling $0.2$0.1 million is recorded as a long-term liability within other long-term liabilities on the consolidated balance sheets.
F-25
SurModics, Inc. and Subsidiaries
Notes to Consolidated Financial Statements — (Continued)
The Company accounts for income taxes under the asset and liability method prescribed in accounting guidance. Deferred tax assets and liabilities are recognized for the future tax consequences attributable to differences between the financial statement carrying amounts of existing assets and liabilities and their respective tax bases. A valuation allowance is provided when it is more likely than not that some portion or all of a deferred tax asset will not be realized. The ultimate realization of deferred tax assets depends on the generation of future taxable income during the period in which related temporary differences become deductible. Management considers the scheduled reversal of deferred tax liabilities, projected future taxable income and tax planning strategies in this assessment. Deferred tax assets and liabilities are measured using the enacted tax rates expected to apply to taxable income in the years in which those temporary differences are expected to be recovered or settled. The effect on deferred tax assets and liabilities of a change in tax rates is recognized in income in the period that includes the enactment date of such change.
SurModics, Inc. and Subsidiaries
Notes to Consolidated Financial Statements — (Continued)
Income taxes in the accompanying consolidated statements of operations for the fiscal years ended September 30 are as follows(in thousands):
| | | | | | | | | | | | | |
| | | 2010 | | | 2009 | | | 2008 | |
| |
| Current provision: | | | | | | | | | | | | |
| Federal | | $ | (331 | ) | | $ | 12,257 | | | $ | 13,534 | |
| State and foreign | | | 277 | | | | 1,362 | | | | 1,516 | |
| | | | | | | | | | | | | |
| Total current provision | | | (54 | ) | | | 13,619 | | | | 15,050 | |
| Deferred provision (benefit): | | | | | | | | | | | | |
| Federal | | | 1,019 | | | | 7,483 | | | | (2,832 | ) |
| State | | | (535 | ) | | | 872 | | | | (65 | ) |
| | | | | | | | | | | | | |
| Total deferred provision (benefit) | | | 484 | | | | 8,355 | | | | (2,897 | ) |
| | | | | | | | | | | | | |
| Total provision | | $ | 430 | | | $ | 21,974 | | | $ | 12,153 | |
| | | | | | | | | | | | | |
| | | | | | | | | | | | |
| | | 2011 | | | 2010 | | | 2009 | |
Current provision (benefit): | | | | | | | | | | | | |
Federal | | $ | 2,273 | | | $ | (331 | ) | | $ | 12,257 | |
State and foreign | | | 348 | | | | 277 | | | | 1,362 | |
| | | | | | | | | | | | |
Total current provision (benefit) | | | 2,621 | | | | (54 | ) | | | 13,619 | |
Deferred (benefit) provision : | | | | | | | | | | | | |
Federal | | | (6,187 | ) | | | 1,019 | | | | 7,483 | |
State | | | (148 | ) | | | (535 | ) | | | 872 | |
| | | | | | | | | | | | |
Total deferred (benefit) provision | | | (6,335 | ) | | | 484 | | | | 8,355 | |
| | | | | | | | | | | | |
Total (benefit) provision | | $ | (3,714 | ) | | $ | 430 | | | $ | 21,974 | |
| | | | | | | | | | | | |
The reconciliation of the difference between amounts calculated at the statutory federal tax rate for the fiscal years ended September 30 and the Company’s effective tax rate is as follows(in thousands):
| | | | | | | | | | | | | |
| | | 2010 | | | 2009 | | | 2008 | |
| |
| Amount at statutory federal income tax rate | | $ | (7,231 | ) | | $ | 20,833 | | | $ | 9,387 | |
| Change because of the following items: | | | | | | | | | | | | |
| State taxes | | | (209 | ) | | | 1,206 | | | | 715 | |
| Other | | | (20 | ) | | | (481 | ) | | | 223 | |
| Stock-based compensation | | | 276 | | | | 416 | | | | 239 | |
| Valuation allowance | | | 2,780 | | | | — | | | | 1,589 | |
| Goodwill impairment | | | 4,834 | | | | — | | | | — | |
| | | | | | | | | | | | | |
| Income tax provision | | $ | 430 | | | $ | 21,974 | | | $ | 12,153 | |
| | | | | | | | | | | | | |
F-26
| | | | | | | | | | | | |
| | | 2011 | | | 2010 | | | 2009 | |
Amount at statutory federal income tax rate | | $ | (5,772 | ) | | $ | (7,231 | ) | | $ | 20,833 | |
Change because of the following items: | | | | | | | | | | | | |
State taxes | | | (1,038 | ) | | | (209 | ) | | | 1,206 | |
Stock-based compensation | | | — | | | | 276 | | | | 416 | |
Valuation allowance | | | 1,145 | | | | 2,780 | | | | — | |
Goodwill impairment | | | 1,977 | | | | 4,834 | | | | — | |
Other | | | (26 | ) | | | (20 | ) | | | (481 | ) |
| | | | | | | | | | | | |
Income tax (benefit) provision | | $ | (3,714 | ) | | $ | 430 | | | $ | 21,974 | |
| | | | | | | | | | | | |
SurModics, Inc. and Subsidiaries
Notes to Consolidated Financial Statements — (Continued)
The components of deferred income taxes consisted of the following as of September 30 and result from differences in the recognition of transactions for income tax and financial reporting purposes(in thousands):
| | | | | | | | | |
| | | 2010 | | | 2009 | |
| |
| Depreciable assets | | $ | (5,795 | ) | | $ | (2,951 | ) |
| Deferred revenue | | | 1,666 | | | | 261 | |
| Accruals and reserves | | | 780 | | | | 526 | |
| Stock options | | | 5,947 | | | | 5,258 | |
| Impaired investments | | | 6,130 | | | | 3,264 | |
| Unrealized losses on investments | | | (563 | ) | | | (962 | ) |
| Other | | | 1,211 | | | | 844 | |
| Valuation allowance | | | (6,523 | ) | | | (3,339 | ) |
| | | | | | | | | |
| Total deferred tax asset | | | 2,853 | | | | 2,901 | |
| Less current deferred tax asset | | | (247 | ) | | | (353 | ) |
| | | | | | | | | |
| Noncurrent deferred tax asset | | $ | 2,606 | | | $ | 2,548 | |
| | | | | | | | | |
| | | | | | | | |
| | | 2011 | | | 2010 | |
Depreciable assets | | $ | (348 | ) | | $ | (5,795 | ) |
Deferred revenue | | | 1,589 | | | | 1,666 | |
Accruals and reserves | | | 591 | | | | 780 | |
Stock options | | | 7,375 | | | | 5,947 | |
Impaired investments | | | 6,072 | | | | 6,130 | |
Unrealized losses (gains) on investments | | | 96 | | | | (563 | ) |
Other | | | 1,698 | | | | 1,211 | |
Valuation allowance | | | (7,668 | ) | | | (6,523 | ) |
| | | | | | | | |
Total deferred tax assets | | | 9,405 | | | | 2,853 | |
Less current deferred tax assets | | | (376 | ) | | | (247 | ) |
| | | | | | | | |
Noncurrent deferred tax assets | | $ | 9,029 | | | $ | 2,606 | |
| | | | | | | | |
SurModics, Inc. and Subsidiaries
Notes to Consolidated Financial Statements — (Continued)
In fiscal 2011 and 2010, the Company recorded avaluation allowances of $1.1 million and $3.1 million, respectively, related to deferred tax assets. The fiscal 2011 valuation allowance whichrelates to deferred tax assets associated with state net operating losses based on the uncertainty regarding the realization of the net operating losses in the carryforward periods. The fiscal 2010 valuation allowance primarily relates to deferred tax assets associated with potential capital losses created by the impairment of the Company’s investments in Nexeon and two additional medical technology companies (see Note 32 for further information). The fiscal 2010 valuation allowance wasallowances were recorded because the Company does not currently foresee future capital gains within the allowable carryforward and carryback periods to offset these capital losses when they were recognized. As such, no tax benefit has been recorded in the consolidated statements of operations.
On October 1, 2007, the Company adopted new accounting guidance on the accounting for uncertainty in income taxes. Unrecognized tax benefits are the differences between a tax position taken, or expected to be taken in a tax return, and the benefit recognized for accounting purposes pursuant to accounting guidance. A reconciliation of the beginning and ending amount of unrecognized tax benefits is as follows(in thousands):
| | | | | | | | | | | | | |
| | | 2010 | | | 2009 | | | 2008 | |
| |
| Beginning of fiscal year | | $ | 2,042 | | | $ | 1,540 | | | $ | 1,120 | |
| Increase in tax positions for prior years | | | — | | | | 280 | | | | 194 | |
| Decrease in tax positions for prior years | | | (104 | ) | | | (7 | ) | | | — | |
| Increases in tax positions for current year | | | 92 | | | | 260 | | | | 237 | |
| Settlements with taxing authorities | | | — | | | | — | | | | — | |
| Lapse of the statute of limitations | | | (82 | ) | | | (31 | ) | | | (11 | ) |
| | | | | | | | | | | | | |
| End of fiscal year | | $ | 1,948 | | | $ | 2,042 | | | $ | 1,540 | |
| | | | | | | | | | | | | |
| | | | | | | | | | | | |
| | | 2011 | | | 2010 | | | 2009 | |
Beginning of fiscal year | | $ | 1,948 | | | $ | 2,042 | | | $ | 1,540 | |
Increases in tax positions for prior years | | | 3 | | | | — | | | | 280 | |
Decreases in tax positions for prior years | | | (85 | ) | | | (104 | ) | | | (7 | ) |
Increases in tax positions for current year | | | 55 | | | | 92 | | | | 260 | |
Settlements with taxing authorities | | | (53 | ) | | | — | | | | — | |
Lapse of the statute of limitations | | | (193 | ) | | | (82 | ) | | | (31 | ) |
| | | | | | | | | | | | |
End of fiscal year | | $ | 1,675 | | | $ | 1,948 | | | $ | 2,042 | |
| | | | | | | | | | | | |
The total amount of unrecognized tax benefits including interest and penalties that, if recognized, would affect the effective tax rate as of September 30, 2011, 2010 2009 and 2008,2009, respectively, are $1.7 million, $1.9 million $2.0 million and $1.5$2.0 million. Currently, the Company does not expect the liability for unrecognized tax benefits to change significantly in the next twelve12 months with the above balances classified on the consolidated balance sheets as a part ofin other long-term liabilities. Interest and penalties related to unrecognized tax benefits are recorded in income tax expense. As of September 30, 2011, 2010 2009 and 2008,2009, a gross balance of $0.8 million, $0.7 million $0.6 million and $0.4$0.6 million, respectively, has been accrued related to the unrecognized tax benefits balance for interest and penalties.
The Company files income tax returns, including returns for its subsidiaries, in the United States (U.S.(“U.S.”) federal jurisdiction and in various state jurisdictions. Uncertain tax positions are related to tax years that remain subject to examination. The Internal Revenue Service has(“IRS”) commenced an examination of the Company’s U.S. income tax return for fiscal 20092010 in the first quarter of fiscal 2011. Fiscal years2012. The IRS completed an examination of the Company’s U.S. income tax return for fiscal 2009 and a payment was made in the third quarter of fiscal 2011 associated with timing adjustments. U.S. income tax returns for fiscal 2007 and 2008 remain subject to examination by
F-27
SurModics, Inc. and Subsidiaries
Notes to Consolidated Financial Statements — (Continued)
federal tax authorities. Tax returns for state and local jurisdictions for fiscal years ended September 30, 2003 through 20092010 remain subject to examination by state and local tax authorities.
| 9. | |
9. | Commitments and Contingencies |
Litigation. From time to time, the Company has been, and may become, involved in various legal actions involving its operations, products and technologies, including intellectual property and employment disputes. The outcomes of these legal actions are not within the Company’s complete control and may not be known for prolonged periods of time. In some actions, the claimants seek damages, as well as other relief, including injunctions barring the sale of products that are the subject of the lawsuit, which, if granted, could require significant expenditures or result in lost revenues.revenue. The Company records a liability in the consolidated financial
SurModics, Inc. and Subsidiaries
Notes to Consolidated Financial Statements — (Continued)
statements for these actions when a loss is known or considered probable and the amount can be reasonably estimated. If the reasonable estimate of a known or probable loss is a range, and no amount within the range is a better estimate, the minimum amount of the range is accrued. If a loss is possible but not known or probable, and can be reasonably estimated, the estimated loss or range of loss is disclosed. In most cases, significant judgment is required to estimate the amount and timing of a loss to be recorded.
SRI Litigation. On July 31, 2009, the Company’s SurModics Pharmaceuticals subsidiary was named as a defendant in litigation pending in the circuit court of Jefferson County, Alabama, between SRI and two of SRI’s former employees (the Plaintiffs)“Plaintiffs”). In the litigation, the Plaintiffs allege that they contributed to or invented certain intellectual property while they were employed at SRI, and pursuant to SRI’s policies then in effect, they are entitled to, among other things, a portion of the purchase price consideration paid by the Company to SRI as part of the Company’s acquisition of BrookwoodSurModics Pharmaceuticals Inc., pursuant to a stock purchase agreement made effective on July 31, 2007 (the Stock“Stock Purchase Agreement)Agreement”). The Plaintiffs have also alleged that they are entitled to a portion of the intellectual property income derived from license agreements with certain customers of SurModics Pharmaceuticals that make use of patents to which the Plaintiffs invented or contributed. A trial has not yet been scheduled. Pursuant to the Stock Purchase Agreement, the Company has certain rights of indemnification against losses (including without limitation, damages, expenses and costs) incurred as a result of the litigation. The Company’s consolidated financial statements do not include any expenses or liabilities related to the above litigation as the probability of the outcome is currently not determinable and any potential loss is not estimable. The Company believes that it has meritorious defenses to the Plaintiff’s claims and will vigorously defend and prosecute this matter.
InnoRx, Inc. In January 2005, the Company entered into a merger agreement whereby SurModics acquired all of the assets of InnoRx, Inc. (InnoRx)(“InnoRx”), an early stage company developing drug delivery devices and therapies for the ophthalmology market. SurModics will be required to issue up to approximately 480,059 additional shares of its common stock to the stockholders of InnoRx upon the successful completion of the remaining development and commercial milestones involving InnoRx technology acquired in the transaction.
BioFX Laboratories, Inc.SurModics IVD. In August 2007, the Company acquired 100% of the capital stock of BioFX Laboratories, Inc. (BioFX),SurModics IVD, a provider of substrates to thein vitrodiagnostics industry. The sellers of BioFXSurModics IVD are still eligible to receive up to $3.5$3.0 million in additional consideration based on specific revenue targets through calendar 2011.
Potential milestones of $0.5 million were not earned and lapsed in fiscal 2011.SurModics Pharmaceuticals, Inc.Pharmaceuticals. In July 2007, the Company acquired 100% of the capital stock of Brookwood Pharmaceuticals Inc. (now known as SurModics Pharmaceuticals, Inc.) (SurModics Pharmaceuticals), a drug delivery company that provides proprietary polymer-based technologies to companies developing pharmaceutical products. The sellers of SurModics Pharmaceuticals are still eligible to receive up to $16.3$2.9 million in additional consideration based on successful achievement of specific milestones through calendar 2011. A project milestone eventPotential milestones of $7.7 million were not earned and lapsed in fiscal 2011. The additional contingent consideration obligation was achieved inretained by the first quarterCompany when it sold substantially all of fiscal 2011 and as such an obligation of $0.8 million was recognized.
the SurModics Pharmaceuticals assets to Evonik on November 17, 2011.Alabama Jobs Commitment. In April 2008, the Company purchased a 286,000 square foot office and warehouse facility to support cGMP manufacturing needs of customers.customers and the anticipated growth of the SurModics Pharmaceuticals business. At the same time, SurModics Pharmaceuticals entered into an agreement with various governmental authorities to obtain financial incentives associated with creation of jobs in Alabama. Some of the governmental agencies have recapture rights in connection with the financial incentives if thea specific number of full-time employees are not hired by June 2012, with an extension to June 2013
F-28
SurModics, Inc. and Subsidiaries
Notes to Consolidated Financial Statements — (Continued)
if circumstances or events occur that are beyond the control of SurModics Pharmaceuticals or could not have been reasonably anticipated by SurModics Pharmaceuticals. As of September 30, 2010,2011, SurModics Pharmaceuticals has received $1.7 million in connection with the agreement, and the Company has recorded the paymentpayments in other long-term liabilities.
current liabilities becauseSurModics, Inc. and Subsidiaries
Notes to Consolidated Financial Statements — (Continued)
the Company has not met the criteria to recognize the amounts received as income as of September 30, 2011. This liability was retained by the Company and did not transfer to Evonik when the Company sold substantially all of the SurModics Pharmaceuticals assets on November 17, 2011.
Operating Leases. The Company leases certain facilities under noncancelable operating lease agreements. Rent expense for the years ended September 30, 2011, 2010 and 2009 and 2008 was $0.2 million, $0.3 million, $1.0 million, and $0.8$1.0 million, respectively. Annual commitments pursuant to operating lease agreements are as follows:
| | | | | |
Year Ended September 30, | | | |
| |
| 2011 | | $ | 258,000 | |
| 2012 | | | 57,000 | |
| 2013 | | | 60,000 | |
| 2014 | | | 62,000 | |
| 2015 | | | 62,000 | |
| Thereafter | | | 16,000 | |
| | | | | |
| Total minimum lease payments | | $ | 515,000 | |
| | | | | |
| | | | |
Year Ended September 30, | | | |
2012 | | $ | 58 | |
2013 | | | 61 | |
2014 | | | 62 | |
2015 | | | 64 | |
2016 | | | 16 | |
| | | | |
Total minimum lease payments | | $ | 261 | |
| | | | |
| 10. | |
10. | Defined Contribution Plans |
The Company has a 401(k) retirement and savings plan for the benefit of qualifying employees. The Company matches 50% of employee contributions on the first 6% of eligible compensation. Effective April 1, 2009, the Company changed its matching contribution to a discretionary approach and the Company ceased matching contributions. Effective April 1, 2010, the Company re-instated its matching contribution at the previous level. Company contributions totaling $0.2$0.4 million, $0.2 million, and $0.5$0.2 million have been expensed for the years ended September 30, 2011, 2010 and 2009, and 2008, respectively.
| 11. | |
11. | Operating Segments |
Operating segments are defined as components of an enterprise about which separate financial information is available that is evaluated regularly by the chief operating decision maker, or decision making group, in deciding how to allocate resources and in assessing performance. In October 2010,the first quarter of fiscal 2011, the Company announced it was changing its operational structure to renew focus on business units and the Company willis now be organized into three business units:segments, as follows: (1) the Medical Device unit, which is comprised of surface modification coating technologies to improve access, deliverability, and predictable deployment of medical devices, as well as drug delivery coating technologies to provide site-specific drug delivery from the surface of a medical device. End markets include coronary, peripheral, and neuro-vascular, and urology, among others; (2) the Pharmaceuticals unit, which incorporates a broad range of drug delivery technologies for injectable therapeutics, including microparticles, nanoparticles, and implants addressing a range of clinical applications including ophthalmology, oncology, dermatology and neurology, among others. Based in Birmingham, Alabama, the Pharmaceuticals business includes the Company’s cGMP manufacturing facility; and (3) the In Vitro Diagnostics (IVD). Beginning in the first quarterunit, which consists of fiscal 2011, the Company will describe its business under the new reporting structure.
In March 2010, prior to the fiscal 2011 change noted above, the Company announced it changed its organizational structure to better align functional expertise, which also resulted in the elimination of the company’s business units. The Company evaluates revenue resultscomponent products and opportunities on the basis of the clinical market areas in which the Company’s customers participate as noted in the table below. The “Therapeutic” market includes revenue from: (1) Cardiovascular, which provides drug deliverytechnologies for diagnostic test kits and surface modification technologies to customers in the cardiovascular market; (2) Ophthalmology, which is focused on the advancement of treatments for eye diseases, such as age-related macular degeneration (AMD) and diabetic macular edema (DME), two of the leading causes of blindness; and (3) Other Markets, which is focused on a variety of clinical markets principally in the pharmaceutical and biotechnology industries. The “Diagnostic” market includes revenue from the Company’sbiomedical research applications. Products include microarray slide technologies, protein stabilization products, antigensreagents, substrates, and substrates for immunoassay diagnostics tests, and itsin vitrodiagnostic format technology.
For fiscal years ended September 30, 2010, 2009, and 2008, the Company’s results are aggregated into one reportable segment, as the Company manages its expenses on a company-wide basis, as well as its sales and marketing efforts.
F-29
SurModics, Inc. and Subsidiaries
Notes to Consolidated Financial Statements — (Continued)
The table below presents revenue, operating (loss) income and depreciation and amortization from the markets identified above, with Therapeutic broken out further by focus area,segments, for the years ended September 30, as follows (in thousands):
| | | | | | | | | | | | | |
| | | 2010 | | | 2009 | | | 2008 | |
| |
| Therapeutic | | | | | | | | | | | | |
| Cardiovascular | | $ | 40,155 | | | $ | 39,841 | | | $ | 47,675 | |
| Ophthalmology | | | 7,617 | | | | 52,102 | | | | 10,252 | |
| Other Markets | | | 10,932 | | | | 13,114 | | | | 17,875 | |
| | | | | | | | | | | | | |
| Total Therapeutic | | | 58,704 | | | | 105,057 | | | | 75,802 | |
| Diagnostic | | | 11,194 | | | | 16,477 | | | | 21,249 | |
| | | | | | | | | | | | | |
| Total revenue | | $ | 69,898 | | | $ | 121,534 | | | $ | 97,051 | |
| | | | | | | | | | | | | |
| | | | | | | | | | | | |
| | | 2011 | | | 2010 | | | 2009 | |
Revenue: | | | | | | | | | | | | |
Medical Device | | $ | 39,576 | | | $ | 43,211 | | | $ | 86,546 | |
Pharmaceuticals | | | 15,055 | | | | 15,493 | | | | 18,511 | |
In Vitro Diagnostics | | | 13,150 | | | | 11,194 | | | | 16,477 | |
| | | | | | | | | | | | |
Total revenue | | $ | 67,781 | | | $ | 69,898 | | | $ | 121,534 | |
| | | | | | | | | | | | |
| | | |
| | | 2011 | | | 2010 | | | 2009 | |
Operating (loss) income: | | | | | | | | | | | | |
Medical Device | | $ | 19,847 | | | $ | 19,524 | | | $ | 62,472 | |
Pharmaceuticals | | | (32,522 | ) | | | (26,479 | ) | | | (5,248 | ) |
In Vitro Diagnostics | | | 4,275 | | | | 3,304 | | | | 8,081 | |
Corporate | | | (9,118 | ) | | | (10,402 | ) | | | (7,804 | ) |
| | | | | | | | | | | | |
Total operating (loss) income | | $ | (17,518 | ) | | $ | (14,053 | ) | | $ | 57,501 | |
| | | | | | | | | | | | |
| | | |
| | | 2011 | | | 2010 | | | 2009 | |
Depreciation and amortization: | | | | | | | | | | | | |
Medical Device | | $ | 1,604 | | | $ | 2,136 | | | $ | 2,077 | |
Pharmaceuticals | | | 4,035 | | | | 4,241 | | | | 2,030 | |
In Vitro Diagnostics | | | 799 | | | | 828 | | | | 1,248 | |
Corporate | | | 707 | | | | 613 | | | | 557 | |
| | | | | | | | | | | | |
Total depreciation and amortization | | $ | 7,145 | | | $ | 7,818 | | | $ | 5,912 | |
| | | | | | | | | | | | |
Segment results above for fiscal 2011 include asset impairment charges of $17.9 million and a goodwill impairment charge of $5.7 million in the Pharmaceuticals segment and restructuring charges of $2.2 million in Corporate.
Segment results above for fiscal 2010 include asset impairment charges of $1.9 million and a goodwill impairment charge of $13.8 million in the Pharmaceuticals segment and restructuring charges of $1.3 million and asset impairment charges of $3.0 million in Corporate.
Segment results above for fiscal 2009 include revenue of $45.0 million in the Medical Device segment associated with the terminated Merck collaborative research and license agreement, revenue of $4.9 million in the In Vitro Diagnostics segment associated with the expired Abbott Laboratories (“Abbott”) diagnostic format patent license agreement, purchased in-process research and development charges of $3.2 million in the Pharmaceuticals segment and restructuring charges of $1.8 million in Corporate.
Corporate includes expenses for administrative corporate functions, such as executive, corporate accounting, legal, human resources and Board related, that have not been fully allocated to segments. Corporate also includes special charges, such as restructuring costs, which are not specific to a segment.
Asset information by segment is not presented in the table above because the Company does not provide its chief operating decision maker assets by segment, as the data is not readily available.
SurModics, Inc. and Subsidiaries
Notes to Consolidated Financial Statements — (Continued)
Major Customers
Revenue from customers that equaled or exceeded 10% of total revenue was as follows for the years ended September 30:
| | | | | | | | | | | | | |
| | | 2010 | | | 2009 | | | 2008 | |
| |
| Johnson & Johnson | | | 17 | % | | | 11 | % | | | 20 | % |
| Medtronic, Inc. | | | 14 | % | | | ** | | | | ** | |
| Merck & Company | | | ** | | | | 37 | % | | | ** | |
| Abbott Laboratories | | | ** | | | | ** | | | | 10 | % |
| | | | | | | | | | | | |
| | | 2011 | | | 2010 | | | 2009 | |
Medtronic | | | 15 | % | | | 14 | % | | | | ** |
Johnson & Johnson | | | 13 | % | | | 17 | % | | | 11 | % |
Merck & Company | | | | ** | | | | ** | | | 37 | % |
| | |
| ** | | - less-less than ten percent10% |
The revenue from the customers listed is derived from all three primary sources: licensing, product sales, and research and development.
Geographic revenue was as follows for the years ended September 30:
| | | | | | | | | | | | | |
| | | 2010 | | 2009 | | 2008 |
| |
| Domestic | | | 78 | % | | | 84 | % | | | 79 | % |
| Foreign | | | 22 | % | | | 16 | % | | | 21 | % |
F-30
| | | | | | | | | | | | |
| | | 2011 | | | 2010 | | | 2009 | |
Domestic | | | 72 | % | | | 78 | % | | | 84 | % |
Foreign | | | 28 | % | | | 22 | % | | | 16 | % |
SurModics, Inc. and Subsidiaries
Notes to Consolidated Financial Statements — (Continued)
| 12. | |
12. | Quarterly Financial Data (Unaudited) |
The following is a summary of the unaudited quarterly results for the years ended September 30, 2010, 2009,2011 and 20082010(in thousands, except net (loss) income per share data)share).
| | | | | | | | | | | | | | | | | |
| | | First
| | | Second
| | | Third
| | | Fourth
| |
| | | Quarter | | | Quarter | | | Quarter | | | Quarter | |
| |
Fiscal 2010 | | | | | | | | | | | | | | | | |
| Revenue | | $ | 17,381 | | | $ | 18,360 | | | $ | 18,608 | | | $ | 15,549 | |
| Income (loss) from operations | | | 2,768 | | | | (952 | ) | | | 2,220 | | | | (18,089 | ) |
| Net income (loss) | | | 1,917 | | | | (427 | ) | | | (916 | ) | | | (21,663 | ) |
| Net income (loss) per share(1): | | | | | | | | | | | | | | | | |
| Basic | | | 0.11 | | | | (0.02 | ) | | | (0.05 | ) | | | (1.25 | ) |
| Diluted | | | 0.11 | | | | (0.02 | ) | | | (0.05 | ) | | | (1.25 | ) |
Fiscal 2009 | | | | | | | | | | | | | | | | |
| Revenue | | $ | 63,216 | | | $ | 20,925 | | | $ | 18,186 | | | $ | 19,207 | |
| Income from operations | | | 42,667 | | | | 6,200 | | | | 4,661 | | | | 3,973 | |
| Net income | | | 27,085 | | | | 4,216 | | | | 3,539 | | | | 2,710 | |
| Net income per share(1): | | | | | | | | | | | | | | | | |
| Basic | | | 1.53 | | | | 0.24 | | | | 0.20 | | | | 0.16 | |
| Diluted | | | 1.53 | | | | 0.24 | | | | 0.20 | | | | 0.16 | |
Fiscal 2008 | | | | | | | | | | | | | | | | |
| Revenue | | $ | 23,829 | | | $ | 25,707 | | | $ | 24,276 | | | $ | 23,239 | |
| Income from operations | | | 7,571 | | | | 7,181 | | | | 7,184 | | | | 5,325 | |
| Net income (loss) | | | 5,646 | | | | 5,107 | | | | 4,800 | | | | (814 | ) |
| Net income (loss) per share(1): | | | | | | | | | | | | | | | | |
| Basic | | | 0.31 | | | | 0.28 | | | | 0.27 | | | | (0.05 | ) |
| Diluted | | | 0.31 | | | | 0.28 | | | | 0.26 | | | | (0.05 | ) |
| | | | | | | | | | | | | | | | |
| | | First
Quarter | | | Second
Quarter | | | Third
Quarter | | | Fourth
Quarter | |
Fiscal 2011 | | | | | | | | | | | | | | | | |
Revenue | | $ | 15,168 | | | $ | 17,494 | | | $ | 17,967 | | | $ | 17,152 | |
(Loss) income from operations | | | (5,620 | ) | | | 2,042 | | | | 3,446 | | | | (17,386 | ) |
Net (loss) income | | | (6,171 | ) | | | 2,488 | | | | 3,842 | | | | (12,937 | ) |
Net (loss) income per share(1): | | | | | | | | | | | | | | | | |
Basic | | | (0.36 | ) | | | 0.14 | | | | 0.22 | | | | (0.74 | ) |
Diluted | | | (0.36 | ) | | | 0.14 | | | | 0.22 | | | | (0.74 | ) |
Fiscal 2010 | | | | | | | | | | | | | | | | |
Revenue | | $ | 17,381 | | | $ | 18,360 | | | $ | 18,608 | | | $ | 15,549 | |
Income (loss) from operations | | | 2,768 | | | | (952 | ) | | | 2,220 | | | | (18,089 | ) |
Net income (loss) | | | 1,917 | | | | (427 | ) | | | (916 | ) | | | (21,663 | ) |
Net income (loss) per share(1): | | | | | | | | | | | | | | | | |
Basic | | | 0.11 | | | | (0.02 | ) | | | (0.05 | ) | | | (1.25 | ) |
Diluted | | | 0.11 | | | | (0.02 | ) | | | (0.05 | ) | | | (1.25 | ) |
| | |
| (1) | | The sum of the quarterly earningsnet income (loss) per share may not equal the annual earningsnet income (loss) per share because of changes in the weighted average number of shares outstanding. |
SurModics, Inc. and Subsidiaries
Notes to Consolidated Financial Statements — (Continued)
In the first quarter of fiscal 2011, the Company recorded a $5.7 million goodwill impairment charge associated with the Company’s SurModics Pharmaceuticals reporting unit and a restructuring charge of $1.2 million in connection with the reorganization announced in October 2010.
In the fourth quarter of fiscal 2011, the Company recorded $17.9 million of asset impairment charges associated with the write-down of the long-lived assets of the SurModics Pharmaceuticals segment and a $1.0 million restructuring charge in connection with the reorganization announced in August 2011.
In the second quarter of fiscal 2010, the Company recorded a restructuring charge of $1.3 million, associated with a functional reorganization and an asset impairment charge of $2.1 million, associated with consolidation of the Company’s multiple facilities in Birmingham, Alabama.
In the third quarter of fiscal 2010, the Company recorded a $2.6 million non-cash impairment loss on its investment in two private medical technology companies and adjusted the asset impairment charge associated with the Birmingham, Alabama facilities by $0.2 million. The Company also recognized a $0.4 million
asset impairment charge associated with prototypes and other equipment related to a development project for which no ongoing business was expected in the foreseeable future in light of market conditions.In the fourth quarter of fiscal 2010, the Company recorded a $0.4 million non-cash inventory impairment charge, a $1.3 million in non-cash asset impairment charge associated with long-lived assets, a $1.3 million non-cash asset impairment loss associated with certain fixed assetsasset costs in Minnesota, a $13.8 million non-cash goodwill impairment charge associated with the Company’s SurModics Pharmaceuticals reporting unit, and a $5.3 million non-cash impairment loss on its investment in Nexeon MedSystems.
F-31
F-35
SurModics, Inc. and Subsidiaries
Notes to Consolidated Financial Statements — (Continued)
In the first quarter of fiscal 2009, the Company recorded income that had previously been deferred of $34.8 million associated with the Merck contract termination, a $9 million milestone payment from Merck associated with the termination of the triamcinolone acetonide development program, a $3.2 million charge for in-process research and development acquired in connection with the purchase of certain contracts and assets of PR Pharma, as well as a $1.8 million restructuring charge associated with a functional reorganization.
In the fourth quarter of fiscal 2009, the Company recorded $1.3 million in royalty income in connection with the settlement of previously disclosed litigation involving Abbott Laboratories and Church & Dwight Co, Inc.
In the fourth quarter of fiscal 2008, the Company recorded a $4.3 million non-cash impairment loss on its investment in OctoPlus.
F-32