Breadth of service, or ability to manage staffing suppliers, has become more critical as customers seek “one-stop shopping” for all their staffing needs. Geographic presence is important, as temporary employees are generally unwilling to travel great distances for assignment and customers prefer working with companies in their local market.
Environmental Concerns
Because we are involved in a service business, federal, state or local laws that regulate the discharge of materials into the environment do not materially impact us.
Employees
We employ approximately 1,100 people at our corporate headquarters in Troy, Michigan, and approximately 6,9007,000 staff members in our international network of branch offices. In 2010,2013, we assigned approximately 530,000540,000 temporary employees withto a variety of customers around the globe.
While services may be provided inside the facilities of customers, we remain the employer of record for our temporary employees. We retain responsibility for employee assignments, the employer’s share of all applicable payroll taxes and the administration of the employee’s share of these taxes.
Foreign Operations
For information regarding sales, earnings from operations and long-lived assets by domestic and foreign operations, please refer to the information presented in the Segment Disclosures note to our consolidated financial statements, presented in Part II, Item 8 of this report.
Access to Company Information
We electronically file our annual report on Form 10-K, quarterly reports on Form 10-Q, current reports on Form 8-K and all amendments to those reports with the Securities and Exchange Commission (“SEC”). The public may read and copy any of the reports that are filed with the SEC at the SEC’s Public Reference Room at 100 F.F Street, NE, Washington, DC 20549. The public may obtain information on the operation of the Public Reference Room by calling the SEC at 1-800-SEC-0330. The SEC also maintains an Internet website atwww.sec.gov that contains reports, proxy and information statements and other information regarding issuers that file electronically.
We make available, free of charge, through our Internet website, and by responding to requests addressed to our vice president of investor relations, our annual report on Form 10-K, quarterly reports on Form 10-Q, current reports on Form 8-K and all amendments to those reports. These reports are available as soon as reasonably practicable after such material is electronically filed with or furnished to the SEC. Our website address is: www.kellyservices.com. The information contained on our website, or on other websites linked to our website, is not part of this report.
ITEM 1A. RISK FACTORS.
We operate in a highly competitive industry with low barriers to entry and may be unable to compete successfully against existing or new competitors.
The worldwide staffing services market is highly competitive with limited barriers to entry. We compete in global, national, regional and local markets with full-service and specialized temporary staffing and consulting companies. While the majority of our competitors are significantly smaller than us, several competitors, including Allegis Group, Adecco S.A, Manpower Inc., Robert Half International, Inc.S.A., Randstad Holding N.V., ManpowerGroup Inc. and SFN Group,Robert Half International Inc., have substantial marketing and financial resources. In particular, Adecco S.A, Manpower Inc. andS.A., Randstad Holding N.V. and ManpowerGroup Inc. are considerably larger than we are and, thus, have significantly more marketing and financial resources than we do.resources. Additionally, the emergence of on-line staffing platforms or other forms of disintermediation may pose a competitive threat to our services, which operate under a more traditional staffing business model. Price competition in the staffing industry is intense, particularly for the provision of office clerical and light industrial personnel. We expect that the level of competition will remain high, which could limit our ability to maintain or increase our market share or profitability.
5
Our business is significantly affected by fluctuations in general economic conditions.
Demand for staffing services is significantly affected by the general level of economic activity and employment in the United States and the other countries in which we operate. When economic activity increases, temporary employees are often added before full-time employees are hired. As economic activity slows, however, many companies reduce their use of temporary employees before laying off full-time employees. Significant swings in economic activity historically have had a disproportionate impact on staffing industry volumes. We may also experience more competitive pricing pressure during periods of economic downturn. A substantial portion of our revenues and earnings are generated by our business operations in the United States. Any significant economic downturn in the United States or certain other countries in which we operate hascould have a material adverse effect on our business, financial condition and results of operations.
We may not achieve the intended effects of our business strategy.
As discussed in the Management’s Discussion and Analysis of Financial Condition and Results of Operations, our business strategy focuses on improving profitability through scale and specialization, particularly with our professional and technical and OCG businesses. We have implemented steps to increase our presencedriving growth in the commercial staffing markets, grow our higher margin specialty staffingspecialties -- in Americas PT and growalso within our outsourcing and consulting business.growing OCG segment. We plan to add resources and implement cost-efficient service delivery models to enable local teams to focus on profit-generating activities and relationships. We expect that revenue growth will lag these investments and, consequently, affect our profitability in the short-term. If we are not successful in achievingexecuting our strategy, we may not achieve either our stated goal of double-digit revenue growth in those segments or the intended productivity improvements, therefore negatively impacting future profitability.
We are highly dependent on our senior management and the continued performance and productivity of our field personnel.
We are highly dependent on the continued efforts of the members of our senior management. We are also highly dependent on the performance and productivity of our field personnel. The loss of any of the members of our senior management may cause a significant disruption in our business. In addition, the loss of any of our field personnel may jeopardize existing customer relationships with businesses that use our services based on relationships with these objectives,individuals.
We may be unable to adequately protect our intellectual property rights, including our brand, which is important to our success.
Our success depends, in part, upon our ability to protect our proprietary methodologies and other intellectual property including the value of our brands. Existing laws of the various countries in which we provide services or solutions may offer only limited protection. We rely upon a combination of internal controls, confidentiality and other contractual agreements, and patent, copyright and trademark laws to protect our intellectual property rights. Our intellectual property rights may not prevent competitors from independently developing products and services similar to ours. Further, the steps we take might not be adequate to prevent or deter infringement or other misappropriation of our intellectual property by competitors, former employees or other third parties, which could materially adversely affect our business and financial results.
If we fail to successfully develop new service offerings, we may be unable to retain current customers and gain new customers and our revenues costswould decline.
The process of developing new service offerings requires accurate anticipation of customers’ changing needs and overall profitabilityemerging technological trends. This may require that we make long-term investments and commit significant resources before knowing whether these investments will eventually result in service offerings that achieve customer acceptance and generate the revenues required to provide desired returns. If we fail to accurately anticipate and meet our customers’ needs through the development of new service offerings, our competitive position could be negatively affected. Ifweakened and that could materially adversely affect our results of operations and financial condition.
As we increasingly offer services outside the realm of traditional staffing, including business process outsourcing, we are unableexposed to execute our business strategy effectively, our productivity and cost competitiveness could be negatively affected.
Our business strategy focuses on growing our outsourcing and consulting business, including business process outsourcing, where we provide operational management of our customers’ non-core functions or departments. This could expose us to certain risks unique to that business, including product liability or product recalls. Although we have internal vetting processes to control such risks, there is no assurance that these processes will be effective. Additionally, while we maintain insurance in types and amounts we believe are appropriate in light of the aforementioned exposures, there can also be no assurance that such insurance policies will remain available on reasonable terms or be sufficient in amount or scope of coverage.
Past and future acquisitions may not be successful.
From time to time, we acquire and invest in companies throughout the world. Acquisitions involve a number of risks, including the diversion of management’s attention from its existing operations, the failure to retain key personnel or customers of an acquired business, the failure to realize anticipated benefits such as cost savings and revenue enhancements, the potentially substantial transaction costs associated with acquisitions, the assumption of unknown liabilities of the acquired business and the inability to successfully integrate the business into our operations. Potential impairment losses could result if we overpay for an acquisition. There can be no assurance that any past or future acquired businesses will generate anticipated revenues or earnings.
Investments in equity affiliates expose us to additional risks and uncertainties.
We participate, or may participate in the future, in certain investments in equity affiliates, such as joint ventures or other equity investments with strategic partners. These arrangements expose us to a number of risks, including the risk that the management of the combined venture may not be able to fulfill their performance obligations under the management agreements or may be incapable of providing the required financial support. Additionally, improper, illegal or unethical actions by the venture management could have a negative impact on the reputation of the venture and our company.
A loss of major customers could have a material adverse effect on our business.
Our business strategy is focused on serving large corporate customers through high volume global service agreements. While our strategy is intended to enable us to increase our revenues and earnings from our major corporate customers, the strategy also exposes us to increased risks arising from the possible loss of major customer accounts. In addition, some of our customers are in industries, such as the automotive and manufacturing industries, that have experienced adverse business and financial conditions in recent years. The deterioration of the financial condition or business prospects of these customers could reduce their need for temporary employment services and result in a significant decrease in the revenues and earnings we derive from these customers. Since receipts from customers generally lag payroll to temporary employees, the bankruptcy of a major customer could have a material adverse impact on our ability to meet our working capital requirements. Additionally, most of our customer contracts can be terminated by the customer on short notice without penalty. Further, as a result of alleged contractual noncompliance, we could be excluded from participating in government contracts. This creates uncertainty with respect to the revenues and earnings we may recognize with respect to our customer contracts.
We conduct a significant portion of our operations outside of the United States and we are subject to risks relating to our international business activities, including fluctuations in currency exchange rates and numerous legal and regulatory requirements.
We conduct our business in most major staffing markets throughout the world. Our operations outside the United States are subject to risks inherent in international business activities, including:
● | fluctuations in currency exchange rates; |
● | varying economic and political conditions; |
● | differences in cultures and business practices; |
● | differences in employment and tax laws and regulations; |
● | differences in accounting and reporting requirements; |
● | differences in labor and market conditions; |
● | changing and, in some cases, complex or ambiguous laws and regulations; |
● | violations of U.S. Foreign Corrupt Practices Act and similar anti-corruption laws; and |
● | litigation and claims. |
Our operations outside the United States are reported in the applicable local currencies and then translated into U.S. dollars at the applicable currency exchange rates for inclusion in our consolidated financial statements. Exchange rates for currencies of these countries may fluctuate in relation to the U.S. dollar and these fluctuations may have an adverse or favorable effect on our operating results when translating foreign currencies into U.S. dollars.
We depend on our ability to attract and retain qualified temporary personnel (employed directly by us or through third-party suppliers).
We depend on our ability to attract qualified temporary personnel who possess the skills and experience necessary to meet the staffing requirements of our customers. We must continually evaluate our base of available qualified personnel to keep pace with changing customer needs. Competition for individuals with proven professional skills is intense, and demand for these individuals is expected to remain strong for the foreseeable future. There can be no assurance that qualified personnel will continue to be available in sufficient numbers and on terms of employment acceptable to us and our customers. Our success is substantially dependent on our ability to recruit and retain qualified temporary personnel.
We may be exposed to employment-related claims and losses, including class action lawsuits and collective actions, which could have a material adverse effect on our business.
We employ and assign personnel in the workplaces of other businesses. The risks of these activities include possible claims relating to:
● | discrimination and harassment; |
● | wrongful termination or retaliation; |
● | violations of employment rights related to employment screening or privacy issues; |
● | apportionment between us and our customer of legal obligations as an employer of temporary employees; |
● | classification of workers as employees or independent contractors; |
● | employment of unauthorized workers; |
● | violations of wage and hour requirements; |
● | retroactive entitlement to employee benefits; |
● | failure to comply with leave policy requirements; and |
● | errors and omissions by our temporary employees, particularly for the actions of professionals such as attorneys, accountants and scientists. |
We are also subject to potential risks relating to misuse of customer proprietary information, misappropriation of funds, death or injury to our employees, damage to customer facilities due to negligence of temporary employees, criminal activity and other similar occurrences. We may incur fines and other losses or negative publicity with respect to these risks. In addition, these occurrences may give rise to litigation, which could be time-consuming and expensive. In the U.S. and certain other countries in which we operate, new employment and labor laws and regulations have been proposed or adopted that may increase the potential exposure of employers to employment-related claims and litigation. Such laws and regulations are also arising with increasing frequency at the state and local level in the U.S. There can be no assurance that the corporate policies and practices we have in place to help reduce our exposure to these risks will be effective or that we will not experience losses as a result of these risks. Although we maintain insurance in types and amounts we believe are appropriate in light of the aforementioned exposures, there can also be no assurance that such insurance policies will remain available on reasonable terms or be sufficient in amount or scope of coverage. Additionally, should we have a material inability to produce records as a consequence of litigation or a government investigation, the cost or consequences of such matters could become much greater.
Improper disclosure of sensitive or private information could result in liability and damage our reputation.
Our business involves the use, storage and transmission of information about full-time and temporaryemployees. Additionally, our employees may have access or exposure to customer data and systems, the misuse of which could result in legal liability. Cyber-attacks, including attacks motivated by grievances against our industry and against us in particular, may disable or damage our systems. We are dependent on, and are ultimately responsible for, the security provisions of vendors who have custodial control of our data. We have established policies and procedures to help protect the security and privacy of this information. It is possible that our security controls over personal and other data and other practices we follow may not prevent the improper access to or disclosure of personally identifiable or otherwise confidential information. Such disclosure or damage to our systems could harm our reputation and subject us to liability under our contracts and laws that protect personal data and confidential information, resulting in increased costs or loss of revenue. Further, data privacy is subject to frequently evolving rules and regulations, which sometimes conflict among the various jurisdictions and countries in which we provide services. Our failure to adhere to or successfully implement processes in response to changing regulatory requirements in this area could result in legal liability, additional compliance costs, missed business opportunities or damage to our reputation in the marketplace.
Damage to our key data centers could affect our ability to sustain critical business applications.
Many business processes critical to our continued operation are housed in our data center situated within the corporate headquarters complex as well as regional data centers in Asia-Pacific and Europe. Those processes include, but are not limited to, payroll, customer reporting and order management. While we have taken steps to protect these operations and have developed remote recovery capabilities, the loss of a data center would create a substantial risk of business interruption.
Our information technology projects may not yield their intended results.
At the present time, we have a number of information technology projects in process or in the planning stages, including improvements to applicant onboarding and tracking systems, order management, billing and customer data analytics. Although the technology is intended to increase productivity and operating efficiencies, these projects may not yield their intended results. Any delays in completing, or an inability to successfully complete, these technology initiatives or an inability to achieve the anticipated efficiencies could adversely affect our operations, liquidity and financial condition.
Failure to maintain adequate financial and management processes and controls could lead to errors in our financial reporting.
Failure to maintain adequate financial and management processes and controls could lead to errors in our financial reporting. If our management is unable to certify the effectiveness of our internal controls or if our independent registered public accounting firm cannot render an opinion on the effectiveness of our internal controls over financial reporting, or if material weaknesses in our internal controls are identified, we could be subject to regulatory scrutiny and a loss of public confidence. In addition, if we do not maintain adequate financial and management personnel, processes and controls, we may not be able to accurately report our financial performance on a timely basis, which could have a negative effect on our stock price.
Impairment charges relating to our goodwill and long-lived assets could adversely affect our results of operations.
We regularly monitor our goodwill and long-lived assets for impairment indicators. In conducting our goodwill impairment testing, we compare the fair value of each of our reporting units to the related net book value. In conducting our impairment analysis of long-lived assets, we compare the undiscounted cash flows expected to be generated from the long-lived assets to the related net book values. Changes in economic or operating conditions impacting our estimates and assumptions could result in the impairment of our goodwill or long-lived assets. In the event that we determine that our goodwill or long-lived assets are impaired, we may be required to record a significant non-cash charge to earnings that could adversely affect our results of operations.
6
We self-insure, or otherwise bear financial responsibility for, a significant portion of expected losses under our workers’ compensation program, disability and medical benefits claims. Unexpected changes in claim trends, including the severity and frequency of claims, actuarial estimates and medical cost inflation, could result in costs that are significantly different than initially reported. If future claims-related liabilities increase due to unforeseen circumstances, or if we must make unfavorable adjustments to accruals for prior accident years, our costs could increase significantly. There can be no assurance that we will be able to increase the fees charged to our customers in a timely manner and in a sufficient amount to cover increased costs as a result ofany changes in claims-related liabilities.
The net financial impact of recent U.S. healthcare legislation on our results of operations could be significant.
In March 2010, the Patient Protection and Affordable Care Act and the Health Care and Education Reconciliation Act of 2010 (collectively, the “Acts”) were signed into U.S. law. The Acts represent comprehensive U.S. healthcare reform legislation that, in addition to other provisions, will subject us to potential penalties unless we offer to our employees minimum essential healthcare coverage that is affordable and provides minimum value. In order to comply with the Acts, we intend to begin offering health care coverage in 2015 to all temporary employees eligible for coverage under the Acts. In 2014, we will continue to incur costs related to implementing the Acts in advance of future pricing designed to pass related costs on to our customers. Further, there can be no assurance that we will be able to increase pricing to our customers in a sufficient amount to cover all the increased costs, or that they will be recovered in the period in which costs are incurred, and the net financial impact on our results of operations could be significant.
Our business is subject to extensive government regulation, which may restrict the types of employment services we are permitted to offer or result in additional or increased taxes, including payroll taxes or other costs that reduce our revenues and earnings.
The temporary employment industry is heavily regulated in many of the countries in which we operate. Changes in laws or government regulations may result in prohibition or restriction of certain types of employment services we are permitted to offer or the imposition of new or additional benefit, licensing or tax requirements that could reduce our revenues and earnings. In particular, we are subject to state unemployment taxes in the U.S., which typically increase during periods of increased levels of unemployment. We also receive benefits, such as the work opportunity income tax credit in the U.S., that regularly expire and may not be reinstated. There can be no assurance that we will be able to increase the fees charged to our customers in a timely manner and in a sufficient amount to fully cover increased costs as a result of any changes in claims-related liabilities.
7
We are subject to federal taxes and a multitude of state and local taxes in the United States and taxes in foreign jurisdictions. We are also subject to unclaimed or abandoned property (escheat) laws which require us to remit to certain U.S. government authorities the property of others held by us that has been unclaimed for a specified period of time, such as payroll checks issued to temporary employees.The demographics of our work force and the visibility of our industry may make it more likely we become a target of government investigations, andwe are regularly subject to audit by tax authorities. Although we believe our tax and unclaimed property estimates are reasonable, the final determination of audits and any related litigation could be materially different from our historical tax provisions and accruals. The results of an audit or litigation could materially harm our business.
Failure to maintain specified financial covenants in our bank credit facilities, or credit market events beyond our control, could adversely restrict our financial and operating flexibility and subject us to other risks, including inadequaterisk of loss of access to liquidity.
Our Bank Credit Facilitiesbank credit facilities contain covenants that require us to maintain specified financial ratios and satisfy other financial conditions. During 2010,2013, we met all of the covenant requirements. Our ability to continue to meet these financial covenants, particularly with respect to interest coverage (see Debt note in the footnotes to the consolidated financial statements), may not be assured. If we default under this or any other of these requirements, the lenders could declare all outstanding borrowings, accrued interest and fees to be due and payable or significantly increase the cost of the facility. In these circumstances, there can be no assurance that we would have sufficient liquidity to repay or refinance this indebtedness at favorable rates or at all. Events beyond our control could result in the failure of one or more of our banks, reducing our access to liquidity and potentially resulting in reduced financial and operating flexibility. If broader credit markets were to experience dislocation, our potential access to other funding sources would be limited.
The lenders that participate in our data center situated within the corporate headquarters complex as well as regional data centers in Asia-Pacificrevolving credit facility and Europe. Those processes include, butour securitization facility may be unwilling or unable to honor their obligations to provide credit under these committed credit facilities.
Aside from cash on hand, our revolving credit facility and our securitization facility are not limited to, payroll, customer reporting and order management. While we have taken steps to protect these operations, the lossour main sources of liquidity. The revolving credit facility is financed by a data center would create a substantial risksyndicate of business interruption.
8
Our controlling stockholder exercises voting control over our company and has the ability to elect or remove from office all of our directors.
Terence E. Adderley, the Executive Chairman of our board of directors, and certain trusts with respect to which he acts as trustee or co-trustee, control approximately 93% of the outstanding shares of Kelly Class B common stock, which is the only class of our common stock entitled to voting rights. Mr. Adderley is therefore able to exercise voting control with respect to all matters requiring stockholder approval, including the election or removal from office of all members of our directors.
9
Our Class A and Class B common stock are quoted on the NASDAQ Global Market. Under the listing standards of the NASDAQ Global Market, we are deemed to be a “controlled company” by virtue of the fact that Terence E. Adderley, the Executive Chairman of our board of directors, and certain trusts of which he acts as trustee or co-trustee have voting power with respect to more than fifty percent of our outstanding voting stock. A controlled company is not required to have a majority of its board of directors comprised of independent directors. Director nominees are not required to be selected or recommended for the board’s selection by a majority of independent directors or a nominations committee comprised solely of independent directors, nor do the NASDAQ Global Market listing standards require a controlled company to certify the adoption of a formal written charter or board resolution, as applicable, addressing the nominations process. A controlled company is also exempt from NASDAQ Global Market’s requirements regarding the determination of officer compensation by a majority of independent directors or a compensation committee comprised solely of independent directors. A controlled company is required to have an audit committee composed of at least three directors, who are independent as defined under the rules of both the Securities and Exchange Commission and the NASDAQ Global Market. The NASDAQ Global Market further requires that all members of the audit committee have the ability to read and understand fundamental financial statements and that at least one member of the audit committee possess financial sophistication. The independent directors must also meet at least twice a year in meetings at which only they are present.
We currently comply with certain of the listing standards of the NASDAQ Global Market that do not apply to controlled companies. Our compliance is voluntary, however, and there can be no assurance that we will continue to comply with these standards in the future.
Provisions in our certificate of incorporation and bylaws and Delaware law may delay or prevent an acquisition of our company.
Our restated certificate of incorporation and bylaws contain provisions that could make it harder for a third party to acquire us without the consent of our board of directors. For example, if a potential acquirer were to make a hostile bid for us, the acquirer would not be able to call a special meeting of stockholders to remove our board of directors or act by written consent without a meeting. The acquirer would also be required to provide advance notice of its proposal to replace directors at any annual meeting, and would not be able to cumulate votes at a meeting, which would require the acquirer to hold more shares to gain representation on the board of directors than if cumulative voting were permitted.
Our board of directors also has the ability to issue additional shares of common stock that could significantly dilute the ownership of a hostile acquirer. In addition, Section 203 of the Delaware General Corporation Law limits mergers and other business combination transactions involving 15 percent or greater stockholders of Delaware corporations unless certain board or stockholder approval requirements are satisfied. These provisions and other similar provisions make it more difficult for a third party to acquire us without negotiation.
Our board of directors could choose not to negotiate with an acquirer that it did not believe was in our strategic interests. If an acquirer is discouraged from offering to acquire us or prevented from successfully completing a hostile acquisition by these or other measures, our shareholders could lose the opportunity to sell their shares at a favorable price.
The holders of shares of our Class A common stock are not entitled to voting rights.
Under our certificate of incorporation, the holders of shares of our Class A common stock are not entitled to voting rights, except as otherwise required by Delaware law. As a result, Class A common stock holders do not have the right to vote for the election of directors or in connection with most other matters submitted for the vote of our stockholders.
10
The market price of our common stock may be subject to significant volatility. We believe that many factors, including several which are beyond our control, have a significant effect on the market price of our common stock. These include:
● | actual or anticipated variations in our quarterly operating results; |
● | announcements of new services by us or our competitors; |
● | announcements relating to strategic relationships or acquisitions; |
● | changes in financial estimates by securities analysts; |
● | changes in general economic conditions; |
● | actual or anticipated changes in laws and government regulations; |
● | commencement of, or involvement in, litigation; |
● | any major change in our board or management; |
● | changes in industry trends or conditions; and |
● | sales of significant amounts of our common stock or other securities in the market. |
In addition, the stock market in general, and the NASDAQ Global Market in particular, have experienced significant price and volume fluctuations that have often been unrelated or disproportionate to the operating performance of listed companies. These broad market and industry factors may seriously harm the market price of our common stock, regardless of our operating performance. In the past, securities class action litigation has often been instituted following periods of volatility in the market price of a company’s securities. A securities class action suit against us could result in substantial costs, potential liabilities and the diversion of our management’s attention and resources. Further, our operating results may be below the expectations of securities analysts or investors. In such event, the price of our common stock may decline.
ITEM 1B. UNRESOLVED STAFF COMMENTS.
None.
ITEM 2. PROPERTIES.
We own our headquarters in Troy, Michigan, where corporate, subsidiary and divisional offices are currently located. The original headquarters building was purchased in 1977. Headquarters operations were expanded into additional buildings purchased in 1991, 1997 and 2001.
The combined usable floor space in the headquarters complex is approximately 350,000 square feet. Our buildings are in good condition and are currently adequate for their intended purpose and use. We also own undeveloped land in Troy and northern Oakland County, Michigan.
Branch office business is conducted in leased premises with the majority of leases being fixed for terms of generally three to five years in the United States and Canada and 5five to 10ten years outside the United States and Canada. We own virtually all of the office furniture and the equipment used in our corporate headquarters and branch offices.
11
ITEM 3. LEGAL PROCEEDINGS.
During the fourth quarter of 2013, a Louisiana jury rendered an award of $4.4 million, pursuant to litigation brought by Robert and Margaret Ward against the Jefferson Parish School Board and Kelly Services. Under the verdict, Kelly’s share of the liability consists of $2.7 million plus a portion of pre-and-post-judgment interest. Kelly is appropriately insured for this verdict. Kelly believes that the verdict is not supported by the facts of the case and is currently evaluating appeals strategies with its insurers.
The Company is also involvedcontinuously engaged in a number of other lawsuitslitigation arising in the ordinary course of its business, typically matters alleging employment discrimination, andalleging wage and hour matters.violations or enforcing the restrictive covenants in the Company’s employment agreements. While management does not expectthere is no expectation that any of these other matters towill have a material adverse effect on the Company’s results of operations, financial position or cash flows, litigation is always subject to inherent uncertaintiesuncertainty and the Company is not at this time able to reasonably predict the outcome of these matters. Itif any matter will be resolved in a manner that is reasonably possible that some matters could be decided unfavorablymaterially adverse to the Company and, if so, could have a material adverse impact on our consolidated financial statements. During 2010 and 2009, the Company reassessed its potential exposure from pending litigation and established additional reserves of $3.5 million and $4.4 million, respectively.Company.
ITEM 4. MINE SAFETY DISCLOSURES.
Not applicable.
12
ITEM 5. MARKET FOR THE REGISTRANT'S COMMON EQUITY, RELATED STOCKHOLDER MATTERS AND ISSUER PURCHASES OF EQUITY SECURITIES
Market Information and Dividends
Our Class A and Class B common stock is traded on the NASDAQ Global Market under the symbols “KELYA” and “KELYB,” respectively. The high and low selling prices for our Class A common stock and Class B common stock as quoted by the NASDAQ Global Market and the dividends paid on the common stock for each quarterly period in the last two fiscal years are reported in the table below. Payments ofbelow.Our ability to pay dividends are restricted by theis subject to compliance with certain financial covenants contained in our short- and long-term debt facilities, as described in the Debt footnote to the consolidated financial statements.
| Per share amounts (in dollars) | ||||||||||||||||||||
| First | Second | Third | Fourth | |||||||||||||||||
| Quarter | Quarter | Quarter | Quarter | Year | ||||||||||||||||
2010 | ||||||||||||||||||||
| Class A common | ||||||||||||||||||||
| High | $ | 18.02 | $ | 18.93 | $ | 16.28 | $ | 20.29 | $ | 20.29 | ||||||||||
| Low | 11.80 | 12.80 | 10.07 | 11.70 | 10.07 | |||||||||||||||
| Class B common | ||||||||||||||||||||
| High | 17.56 | 18.54 | 14.40 | 20.90 | 20.90 | |||||||||||||||
| Low | 10.66 | 13.16 | 10.45 | 10.51 | 10.45 | |||||||||||||||
| Dividends | — | — | — | — | — | |||||||||||||||
2009 | ||||||||||||||||||||
| Class A common | ||||||||||||||||||||
| High | $ | 14.13 | $ | 12.99 | $ | 14.10 | $ | 13.69 | $ | 14.13 | ||||||||||
| Low | 6.11 | 7.68 | 10.39 | 10.01 | 6.11 | |||||||||||||||
| Class B common | ||||||||||||||||||||
| High | 14.50 | 11.65 | 14.12 | 14.99 | 14.99 | |||||||||||||||
| Low | 9.21 | 10.00 | 10.74 | 11.18 | 9.21 | |||||||||||||||
| Dividends | — | — | — | — | — | |||||||||||||||
Per share amounts (in dollars) First Quarter Second Quarter Third Quarter Fourth Quarter Year 2013 Class A common High Low Class B common High Low Dividends 2012 Class A common High Low Class B common High Low Dividends $ 18.92 $ 18.99 $ 20.46 $ 25.82 $ 25.82 15.04 16.32 17.28 18.37 15.04 19.86 21.24 20.98 24.17 24.17 15.50 16.54 17.56 19.01 15.50 0.05 0.05 0.05 0.05 0.20 $ 18.09 $ 16.25 $ 14.30 $ 15.90 $ 18.09 13.75 11.30 11.26 12.40 11.26 17.40 18.02 14.47 15.50 18.02 13.80 12.13 11.65 12.93 11.65 0.05 0.05 0.05 0.05 0.20
Holders
The number of holders of record of our Class A and Class B common stock were 5,400wereapproximately 7,400 and 410,300, respectively, as of February 7, 2011.
Recent Sales of Unregistered Securities
None.
13
| Maximum Number | ||||||||||||||||
| Total Number | (or Approximate | |||||||||||||||
| of Shares (or | Dollar Value) of | |||||||||||||||
| Total Number | Average | Units) Purchased | Shares (or Units) | |||||||||||||
| of Shares | Price Paid | as Part of Publicly | That May Yet Be | |||||||||||||
| (or Units) | per Share | Announced Plans | Purchased Under the | |||||||||||||
| Period | Purchased | (or Unit) | or Programs | Plans or Programs | ||||||||||||
| (in millions of dollars) | ||||||||||||||||
| October 4, 2010 through November 7, 2010 | 276 | $ | 14.24 | — | $ | — | ||||||||||
| November 8, 2010 through December 5, 2010 | — | — | — | — | ||||||||||||
| December 6, 2010 through January 2, 2011 | 6,961 | 18.80 | — | — | ||||||||||||
| Total | 7,237 | $ | 18.63 | — | ||||||||||||
During the fourth quarter of 2013, we reacquired shares of our Class A common stock as follows:
Period Total Number of Shares (or Units) Purchased Average Price Paid per Share (or Unit) Total Number of Shares (or Units) Purchased as Part of Publicly Announced Plans or Programs Maximum Number (or Approximate Dollar Value) of Shares (or Units) That May Yet Be Purchased Under the Plans or Programs (in millions of dollars) September 30, 2013 throughNovember 3, 2013 November 4, 2013 throughDecember 1, 2013 December 2, 2013 throughDecember 29, 2013 Total 302 $ 20.07 - $ - 29,229 23.24 - - - - - - 29,531 $ 23.21 -
We may reacquire shares sold to cover taxes due upon the vesting of restricted stock held by employees. Accordingly, 7,23729,531 shares were reacquired during the Company’s fourth quarter.
14
The following graph compares the cumulative total return of our Class A common stock with that of the S&P 600 SmallCap Index and the S&P 1500 Human Resources and Employment Services Index for the five years ended December 31, 2010.2013. The graph assumes an investment of $100 on December 31, 20052008 and that all dividends were reinvested.
COMPARISON OF 5 YEAR CUMULATIVE TOTAL RETURN
Assumes Initial Investment of $100
December 31, 2005 —2008 – December 31, 20102013
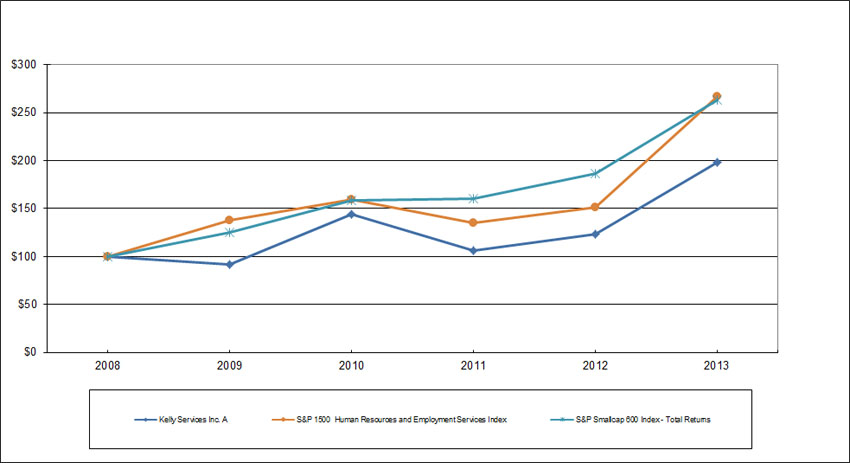
2008 2009 2010 2011 2012 2013 Kelly Services, Inc. $100.00 $91.70 $144.50 $105.83 $123.58 $197.94 S&P SmallCap 600 Index $100.00 $125.57 $158.60 $160.22 $186.37 $263.37 S&P 1500 Human Resources and Employment Services Index $100.00 $138.19 $159.84 $135.07 $151.22 $266.86
| 2005 | 2006 | 2007 | 2008 | 2009 | 2010 | |||||||||||||||||||
| Kelly Services, Inc. | $ | 100.00 | $ | 112.20 | $ | 73.91 | $ | 53.20 | $ | 48.78 | $ | 76.87 | ||||||||||||
| S&P SmallCap 600 Index | $ | 100.00 | $ | 115.11 | $ | 114.77 | $ | 79.10 | $ | 99.32 | $ | 125.45 | ||||||||||||
| S&P 1500 Human Resources and Employment Services Index | $ | 100.00 | $ | 119.59 | $ | 91.28 | $ | 58.72 | $ | 81.15 | $ | 93.87 | ||||||||||||
15
| (In millions except per share amounts) | 2010 (2) | 2009 (1,2) | 2008 (2) | 2007 | 2006 | |||||||||||||||
| Revenue from services | $ | 4,950.3 | $ | 4,314.8 | $ | 5,517.3 | $ | 5,667.6 | $ | 5,546.8 | ||||||||||
| Earnings (loss) from continuing operations | 26.1 | (105.1 | ) | (81.7 | ) | 53.7 | 56.8 | |||||||||||||
| Earnings (loss) from discontinued operations, net of tax (3) | — | 0.6 | (0.5 | ) | 7.3 | 6.7 | ||||||||||||||
| Net earnings (loss) | 26.1 | (104.5 | ) | (82.2 | ) | 61.0 | 63.5 | |||||||||||||
| Basic earnings (loss) per share: | ||||||||||||||||||||
| Earnings (loss) from continuing operations | 0.71 | (3.01 | ) | (2.35 | ) | 1.46 | 1.56 | |||||||||||||
| Earnings (loss) from discontinued operations | — | 0.02 | (0.02 | ) | 0.20 | 0.18 | ||||||||||||||
| Net earnings (loss) | 0.71 | (3.00 | ) | (2.37 | ) | 1.65 | 1.74 | |||||||||||||
| Diluted earnings (loss) per share: | ||||||||||||||||||||
| Earnings (loss) from continuing operations | 0.71 | (3.01 | ) | (2.35 | ) | 1.45 | 1.55 | |||||||||||||
| Earnings (loss) from discontinued operations | — | 0.02 | (0.02 | ) | 0.20 | 0.18 | ||||||||||||||
| Net earnings (loss) | 0.71 | (3.00 | ) | (2.37 | ) | 1.65 | 1.73 | |||||||||||||
| Dividends per share | ||||||||||||||||||||
| Classes A and B common | — | — | 0.54 | 0.52 | 0.45 | |||||||||||||||
| Working capital | 367.6 | 357.6 | 427.4 | 478.6 | 463.3 | |||||||||||||||
| Total assets | 1,368.4 | 1,312.5 | 1,457.3 | 1,574.0 | 1,469.4 | |||||||||||||||
| Total noncurrent liabilities | 153.6 | 205.3 | 203.8 | 200.5 | 142.6 | |||||||||||||||
(In millions except per share amounts) 2013 2012 2011 2010 Revenue from services Earnings (loss) from continuing operations (2) Earnings (loss) from discontinued operations, net of tax (3) Net earnings (loss) Basic earnings (loss) per share: Earnings (loss) from continuing operations Earnings (loss) from discontinued operations Net earnings (loss) Diluted earnings (loss) per share: Earnings (loss) from continuing operations Earnings (loss) from discontinued operations Net earnings (loss) Dividends per share Classes A and B common Working capital Total assets Total noncurrent liabilities 2009(1) $ 5,413.1 $ 5,450.5 $ 5,551.0 $ 4,950.3 $ 4,314.8 58.9 49.7 64.9 26.1 (105.1 ) - 0.4 (1.2 ) - 0.6 58.9 50.1 63.7 26.1 (104.5 ) 1.54 1.31 1.72 0.71 (3.01 ) - 0.01 (0.03 ) - 0.02 1.54 1.32 1.69 0.71 (3.00 ) 1.54 1.31 1.72 0.71 (3.01 ) - 0.01 (0.03 ) - 0.02 1.54 1.32 1.69 0.71 (3.00 ) 0.20 0.20 0.10 - - 474.5 470.3 417.0 367.6 357.6 1,798.6 1,635.7 1,541.7 1,368.4 1,312.5 214.0 172.4 168.3 153.6 205.3
(1) | ||
Fiscal year included 53 weeks. |
(2) | Included in results of continuing operations are asset impairments of $1.7 million in 2013, $3.1 millionin 2012, $2.0 million in 2010 and $53.1 million in |
(3) | Discontinued Operations represent adjustments to assets and |
ITEM 7. MANAGEMENT'S DISCUSSION AND ANALYSIS OF FINANCIAL CONDITION AND RESULTS OF OPERATIONS.
Executive Overview
The Staffing Industry
The worldwide staffing industry is competitive and highly fragmented. In the United States, approximately 100 competitors operate nationally, and approximately 10,000 smaller companies compete in varying degrees at local levels. Additionally, several staffing companies compete globally. Demand for temporary services is highly dependent on the overall strength of the global economy and labor markets. In periods of economic growth, demand for temporary services generally increases, and the need to recruit, screen, train, retain and manage a pool of employees who match the skills required by particular customers becomes critical. Conversely, during an economic downturn, demand drops, leading to competitive pricing pressures. Accordingly, the on-going economic crisis in the Eurozone and slow recovery from recession in the U.S. have impacted staffing firms of all sizes over the last several years.
Our Business
Kelly Services is a global staffing company, providing innovative workforce solutions for customers in a variety of industries. Our staffing operations are divided into three regions, Americas, EMEA and APAC, with commercial and professional and technical staffing businesses in each region. As the human capital arena has become more complex, we have also developed a suite of innovative solutions within our global OCG business. We are forging strategic relationships with our customers to help them manage their flexible workforces through outsourcing, consulting, recruitment, career transition and vendor management services.
We earn revenues from the hourly sales of services by our temporary employees to customers, as a result of recruiting permanent employees for our customers, and through our outsourcing and consulting activities. Our working capital requirements are primarily generated from temporary employee payroll and customer accounts receivable. The nature of our business is such that trade accounts receivable are our most significant financial asset. Average days sales outstanding varies within and outside the U.S., but is 52 days on a global basis. Since receipts from customers generally lag temporary employee payroll, working capital requirements increase substantially in periods of growth.
Our Strategy and Outlook
Our long-term strategic objective is to create shareholder value by delivering a competitive profit from the best workforce solutions and talent in the industry. To achieve this, we are focused on the following key areas:
● | Maintain our core strengths in commercial staffing in key markets; |
● | Grow our professional and technical solutions; |
● | Transform our OCG segment into a market-leading provider of |
● | Capture permanent placement growth in selected specialties; and |
● | Lower our costs through deployment of |
16
However, even with these underlying influences, we delivered solid operational performance in two key areas. During 2013:
● | In our OCG segment, we increased revenue by 20% and earnings from operations by 36% year over year, confirming that our direction aligns with increased market demand for outsourced solutions. Growth was particularly strong in the core elements of our talent supply chain management model, which continues to be a key driver of our strategic and financial progress. |
● | While making additional investments, including significant investments in OCG, we continued to practice effective expense control. Total company expenses increased by 2% in comparison to the prior year, underscoring our commitment to balancing fiscal discipline with targeted long-term growth. |
At 1.0% for 2013, our return on sales (“ROS”) is still well below our long-term goal of 4.0%. To make significant progress against our ROS goal and global economies exhibited signs of slowly strengthening throughout 2010. Economicbetter leverage our business, we will need to see continued economic growth coupled with stronger demand for full-time and temporary labor in the emergence of positive labor market trends, was favorable to the staffing industry.sectors that Kelly supports. In the U.S.,meantime, we remain focused on what we can control: executing a well-formed strategy with increased speed and precision, and making the temporary employment penetration rate increased fornecessary investments to advance that strategy.
During 2013, we did not make the 15th consecutive monthlevel of investment in DecemberAmericas PT that was necessary to 1.7%, the highest levelestablish and maintain sufficient recruiting capability to achieve growth in over 21/2 years. More than 300,000 temporary jobs were addedthis segment, which was reflected in the year-over-year revenue decline of 3%. In 2014, we plan to make targeted investments to adjust our operating models and increase our resources responsible for driving growth in higher margin specialties – in Americas PT and also within our growing OCG segment. Specifically, our investments will expand a centralized approach to PT recruiting for our local markets, as well as develop additional capabilities within OCG to meet the increasing demand for our solutions, such as in talent supply chain analytics. These investments are intended to drive double-digit sales growth in 2015 in both OCG and our Americas PT segment, assuming continued growth in portions of the economy that rely on these services. We will also continue to invest in driving efficiencies throughout the Company as we build out our centralized service delivery model for large accounts and create operational efficiencies that remove administrative burdens from client-facing teams. We expect that revenue growth will lag these investments and, consequently, that our overall earnings will be down on a year-over-year basis.
Meeting the provisions of the Patient Protection and Affordable Care Act and the Health Care and Education Reconciliation Act of 2010 (collectively, the “Acts”) remains a challenge for us. The Acts represent comprehensive U.S. during 2010,healthcare reform legislation that, in addition to other provisions, will subject us to potential penalties unless we offer to our employees minimum essential healthcare coverage that is affordable and provides minimum value. In order to comply with the Acts, Kelly intends to begin offering health care coverage in 2015 to all temporary employees eligible for coverage under the Acts. In 2014, we will continue to incur costs related to implementing the Acts in advance of future pricing designed to pass related costs on to our customers. Further, there can be no assurance that we will be able to increase pricing to our customers in a growthsufficient amount to cover all the increased costs, or that they will be recovered in the period in which costs are incurred, and the net financial impact on our results of nearly 30% sinceoperations could be significant.
Longer-term, we believe the low pointtrends in September, 2009. While still short of pre-recession levels, the current environment is encouraging for the staffing industry as employers seekare positive: companies are becoming more comfortable with the use of flexible staffing models; there is increasing acceptance of free agents and contractual employment by companies and candidates alike; and companies are searching for more comprehensive workforce management solutions. This shift in demand for contingent labor models. However, it will likely take several years forplays to our strengths and experience -- particularly serving large companies.
Financial Measures – Operating Margin and Constant Currency
Operating margin or ROS (earnings from operations divided by revenue from services) is a ratio used to measure the overall labor market to fully recover.
17
| Revenue from Services | ||||||||||||
| 2010 | 2009 | |||||||||||
| (52 Weeks) | (53 Weeks) | % Change | ||||||||||
| (In millions of dollars) | ||||||||||||
| Revenue from Services — Constant Currency: | ||||||||||||
| Americas Commercial | $ | 2,404.0 | $ | 1,980.3 | 21.4 | % | ||||||
| Americas PT | 887.3 | 792.6 | 12.0 | |||||||||
| Total Americas Commercial and PT — Constant Currency | 3,291.3 | 2,772.9 | 18.7 | |||||||||
| EMEA Commercial | 886.9 | 895.2 | (0.9 | ) | ||||||||
| EMEA PT | 151.4 | 141.9 | 6.7 | |||||||||
| Total EMEA Commercial and PT — Constant Currency | 1,038.3 | 1,037.1 | 0.1 | |||||||||
| APAC Commercial | 321.7 | 284.9 | 12.9 | |||||||||
| APAC PT | 29.6 | 25.4 | 16.8 | |||||||||
| Total APAC Commercial and PT — Constant Currency | 351.3 | 310.3 | 13.2 | |||||||||
| OCG — Constant Currency | 254.2 | 219.9 | 15.6 | |||||||||
| Less: Intersegment revenue | (29.0 | ) | (25.4 | ) | 14.2 | |||||||
| Total Revenue from Services — Constant Currency | 4,906.1 | 4,314.8 | 13.7 | |||||||||
| Foreign Currency Impact | 44.2 | |||||||||||
| Revenue from Services | $ | 4,950.3 | $ | 4,314.8 | 14.7 | % | ||||||
18Staffing Fee-Based Income
| Constant | ||||||||||||||||
| 2010 | 2009 | Currency | ||||||||||||||
| (52 Weeks) | (53 Weeks) | Change | Change | |||||||||||||
| (In millions of dollars) | ||||||||||||||||
| Revenue from Services | $ | 2,428.2 | $ | 1,980.3 | 22.6 | % | 21.4 | % | ||||||||
| Fee-based income | 8.8 | 6.6 | 31.8 | 29.0 | ||||||||||||
| Gross profit | 354.9 | 290.7 | 22.0 | 21.0 | ||||||||||||
| SG&A expenses excluding restructuring charges | 275.3 | 273.2 | 0.7 | |||||||||||||
| Restructuring charges | 0.3 | 7.2 | (95.0 | ) | ||||||||||||
| Total SG&A expenses | 275.6 | 280.4 | (1.7 | ) | (2.6 | ) | ||||||||||
| Earnings from Operations | 79.3 | 10.3 | NM | |||||||||||||
| Gross profit rate | 14.6 | % | 14.7 | % | (0.1 | )pts. | ||||||||||
| Expense rates (excluding restructuring charges): | ||||||||||||||||
| % of revenue | 11.3 | 13.8 | (2.5 | ) | ||||||||||||
| % of gross profit | 77.5 | 93.9 | (16.4 | ) | ||||||||||||
| Operating margin | 3.3 | 0.5 | 2.8 | |||||||||||||
19
| Constant | ||||||||||||||||
| 2010 | 2009 | Currency | ||||||||||||||
| (52 Weeks) | (53 Weeks) | Change | Change | |||||||||||||
| (In millions of dollars) | ||||||||||||||||
| Revenue from Services | $ | 889.0 | $ | 792.6 | 12.2 | % | 12.0 | % | ||||||||
| Fee-based income | 9.0 | 9.4 | (4.5 | ) | (4.9 | ) | ||||||||||
| Gross profit | 140.0 | 125.1 | 12.0 | 11.8 | ||||||||||||
| SG&A expenses excluding restructuring charges | 93.7 | 100.9 | (7.0 | ) | ||||||||||||
| Restructuring charges | — | 1.0 | (100.0 | ) | ||||||||||||
| Total SG&A expenses | 93.7 | 101.9 | (8.0 | ) | (8.2 | ) | ||||||||||
| Earnings from Operations | 46.3 | 23.2 | 100.1 | |||||||||||||
| Gross profit rate | 15.8 | % | 15.8 | % | — | pts. | ||||||||||
| Expense rates (excluding restructuring charges): | ||||||||||||||||
| % of revenue | 10.5 | 12.7 | (2.2 | ) | ||||||||||||
| % of gross profit | 67.0 | 80.7 | (13.7 | ) | ||||||||||||
| Operating margin | 5.2 | 2.9 | 2.3 | |||||||||||||
| Constant | ||||||||||||||||
| 2010 | 2009 | Currency | ||||||||||||||
| (52 Weeks) | (53 Weeks) | Change | Change | |||||||||||||
| (In millions of dollars) | ||||||||||||||||
| Revenue from Services | $ | 872.0 | $ | 895.2 | (2.6 | )% | (0.9 | )% | ||||||||
| Fee-based income | 19.1 | 16.6 | 15.9 | 16.0 | ||||||||||||
| Gross profit | 141.0 | 140.2 | 0.6 | 2.3 | ||||||||||||
| SG&A expenses excluding restructuring charges | 130.5 | 150.3 | (13.2 | ) | ||||||||||||
| Restructuring charges | 2.7 | 15.6 | (82.8 | ) | ||||||||||||
| Total SG&A expenses | 133.2 | 165.9 | (19.7 | ) | (18.9 | ) | ||||||||||
| Asset impairments | 1.5 | — | NM | |||||||||||||
| Earnings from Operations | 6.3 | (25.7 | ) | NM | ||||||||||||
| Gross profit rate | 16.2 | % | 15.7 | % | 0.5 | pts. | ||||||||||
| Expense rates (excluding restructuring charges): | ||||||||||||||||
| % of revenue | 15.0 | 16.8 | (1.8 | ) | ||||||||||||
| % of gross profit | 92.6 | 107.2 | (14.6 | ) | ||||||||||||
| Operating margin | 0.7 | (2.9 | ) | 3.6 | ||||||||||||
20
Results of Operations
2013 versus 2012
Total Company
(Dollars in millions)
2013 | 2012 | Change | CC Change | |||||||||||||
Revenue from services | $ | 5,413.1 | $ | 5,450.5 | (0.7 | )% | (0.6 | )% | ||||||||
Staffing fee-based income | 87.7 | 96.8 | (9.5 | ) | (8.5 | ) | ||||||||||
Gross profit | 889.5 | 896.6 | (0.8 | ) | (0.6 | ) | ||||||||||
SG&A expenses excludingrestructuring charges | 832.9 | 822.1 | 1.3 | |||||||||||||
Restructuring charges | 1.6 | (0.9 | ) | 278.7 | ||||||||||||
Total SG&A expenses | 834.5 | 821.2 | 1.6 | 1.8 | ||||||||||||
Asset impairments | 1.7 | 3.1 | (47.1 | ) | ||||||||||||
Earnings from operations | 53.3 | 72.3 | (26.3 | ) | ||||||||||||
Gross profit rate | 16.4 | % | 16.5 | % | (0.1 | ) pts. | ||||||||||
Expense rates (excludingrestructuring charges): | ||||||||||||||||
| % of revenue | 15.4 | 15.1 | 0.3 | |||||||||||||
| % of gross profit | 93.6 | 91.7 | 1.9 | |||||||||||||
Operating margin | 1.0 | 1.3 | (0.3 | ) | ||||||||||||
Total Company revenue for 2013 was down 1% in comparison to the prior year. This reflected a 4% decrease in hours worked, partially offset by higher incentive-based compensation, resulted in the decrease in SG&A expenses.
| Constant | ||||||||||||||||
| 2010 | 2009 | Currency | ||||||||||||||
| (52 Weeks) | (53 Weeks) | Change | Change | |||||||||||||
| (In millions of dollars) | ||||||||||||||||
| Revenue from Services | $ | 147.6 | $ | 141.9 | 4.0 | % | 6.7 | % | ||||||||
| Fee-based income | 15.0 | 15.7 | (4.3 | ) | (4.1 | ) | ||||||||||
| Gross profit | 38.7 | 37.8 | 2.9 | 4.8 | ||||||||||||
| SG&A expenses | 36.9 | 40.6 | (9.3 | ) | (8.2 | ) | ||||||||||
| Earnings from Operations | 1.8 | (2.8 | ) | NM | ||||||||||||
| Gross profit rate | 26.3 | % | 26.6 | % | (0.3 | )pts. | ||||||||||
| Expense rates: | ||||||||||||||||
| % of revenue | 25.0 | 28.6 | (3.6 | ) | ||||||||||||
| % of gross profit | 94.8 | 107.6 | (12.8 | ) | ||||||||||||
| Operating margin | 1.4 | (2.0 | ) | 3.4 | ||||||||||||
Compared to 2012, the gross profit rate was primarily due to decreasesdown 10 basis points. Decreases in fee-based income.the gross profit rate in EMEA, APAC and OCG were partially offset by a slight increase in the Americas gross profit rate.
Selling, general and administrative (“SG&A”) expenses increased 2% year over year. Included in SG&A expenses declined duefor 2013 is $3.0 million for a settlement with the state of Delaware related to reductionsunclaimed property examinations. Restructuring costs in personnel.
| Constant | ||||||||||||||||
| 2010 | 2009 | Currency | ||||||||||||||
| (52 Weeks) | (53 Weeks) | Change | Change | |||||||||||||
| (In millions of dollars) | ||||||||||||||||
| Revenue from Services | $ | 355.3 | $ | 284.9 | 24.7 | % | 12.9 | % | ||||||||
| Fee-based income | 11.4 | 9.7 | 16.6 | 5.6 | ||||||||||||
| Gross profit | 48.4 | 41.6 | 16.2 | 4.6 | ||||||||||||
| SG&A expenses excluding restructuring charges | 45.1 | 44.6 | 1.3 | |||||||||||||
| Restructuring charges | 0.5 | 1.6 | (66.5 | ) | ||||||||||||
| Total SG&A expenses | 45.6 | 46.2 | (1.0 | ) | (10.7 | ) | ||||||||||
| Earnings from Operations | 2.8 | (4.6 | ) | NM | ||||||||||||
| Gross profit rate | 13.6 | % | 14.6 | % | (1.0 | )pts. | ||||||||||
| Expense rates (excluding restructuring charges): | ||||||||||||||||
| % of revenue | 12.7 | 15.6 | (2.9 | ) | ||||||||||||
| % of gross profit | 93.3 | 107.0 | (13.7 | ) | ||||||||||||
| Operating margin | 0.8 | (1.6 | ) | 2.4 | ||||||||||||
Asset impairments in 2013 represent the write-off of 4.5% on a constant currency basis. The decrease in the constant currency average hourly bill rates for APAC Commercial was primarily duecarrying value of long-lived assets related to the decision to exit the staffing marketexecutive search business operating in Japan. Excluding Japan,Germany. Asset impairments in 2012 represent the write-off of previously capitalized costs related to the decision to abandon the PeopleSoft billing system implementation.
Income tax benefit for 2013 was $10.1 million (-20.8% effective tax rate), compared to expense of $19.1 million (27.8%) for 2012. The U.S. work opportunity credit program was generally not available for employees hired in 2012, but was retroactively reinstated for 2012 and 2013 in January, 2013. Accordingly, we did not record work opportunity credits for most employees hired in 2012 until 2013. As a result, we recorded $9.3 million of 2012 work opportunity credits in the first quarter of 2013 and work opportunity credits recorded in 2013 were $18.3 million higher than in 2012.
The work opportunity credit program expired again at the end of 2013, and it is uncertain if or when it will be reinstated. The work opportunity credit program generates a significant tax benefit. Over the last three years, we generated approximately $15 million in credits per year. In the event the program is not renewed, we will receive credits for employees who work in 2014 but were hired in prior years. The credits related to employees hired in prior years have averaged about $3 million per year.
Other items that favorably impacted 2013 income taxes as compared to 2012 include strong 2013 tax-free returns on investments in company-owned variable universal life insurance policies that are used to fund non-qualified retirement plans, the favorable impact of a fourth quarter 2013 Mexico income tax law change on deferred tax balances, and lower 2013 pretax income. In 2012, the Company closed income tax examinations relating to prior years, resulting in a $5.1 million benefit.
Diluted earnings from continuing operations per share for 2013 were $1.54, as compared to $1.31 for 2012.
Earnings from discontinued operations for 2012 represent adjustments to the estimated costs of litigation, net of tax, retained from the 2007 sale of the Kelly Home Care business unit.
Total Americas
(Dollars in millions)
2013 | 2012 | Change | CC Change | |||||||||||||
Revenue from services | $ | 3,547.0 | $ | 3,672.1 | (3.4 | )% | (3.2 | )% | ||||||||
Staffing fee-based income | 32.4 | 30.2 | 7.2 | 7.9 | ||||||||||||
Gross profit | 533.7 | 547.9 | (2.6 | ) | (2.4 | ) | ||||||||||
Total SG&A expenses | 424.9 | 405.8 | 4.7 | 5.0 | ||||||||||||
Earnings from operations | 108.8 | 142.1 | (23.5 | ) | ||||||||||||
Gross profit rate | 15.0 | % | 14.9 | % | 0.1 | pts. | ||||||||||
Expense rates: | ||||||||||||||||
| % of revenue | 12.0 | 11.1 | 0.9 | |||||||||||||
| % of gross profit | 79.6 | 74.1 | 5.5 | |||||||||||||
Operating margin | 3.1 | 3.9 | (0.8 | ) | ||||||||||||
The change in Americas revenue represents a 4% decrease in hours worked, partially offset by a 1% increase in average bill rate increased by 0.6% on a constant currency basis. APAC Commercial revenuerates. Americas represented 7.2%66% of total Company revenue in 20102013 and 6.6%67% in 2009.
21
| Constant | ||||||||||||||||
| 2010 | 2009 | Currency | ||||||||||||||
| (52 Weeks) | (53 Weeks) | Change | Change | |||||||||||||
| (In millions of dollars) | ||||||||||||||||
| Revenue from Services | $ | 32.5 | $ | 25.4 | 28.2 | % | 16.8 | % | ||||||||
| Fee-based income | 10.5 | 3.8 | 172.1 | 156.3 | ||||||||||||
| Gross profit | 13.9 | 7.7 | 81.3 | 68.3 | ||||||||||||
| SG&A expenses | 17.0 | 9.2 | 85.1 | 72.0 | ||||||||||||
| Earnings from Operations | (3.1 | ) | (1.5 | ) | (104.5 | ) | ||||||||||
| Gross profit rate | 42.7 | % | 30.2 | % | 12.5 | pts. | ||||||||||
| Expense rates: | ||||||||||||||||
| % of revenue | 52.2 | 36.2 | 16.0 | |||||||||||||
| % of gross profit | 122.3 | 119.8 | 2.5 | |||||||||||||
| Operating margin | (9.5 | ) | (6.0 | ) | (3.5 | ) | ||||||||||
The small increase in 2009.
The increase in SG&A expenses increased,was due to our investment in centralized operations staff to support our largest customers, investments in our technology infrastructure and the start of our investment in PT recruiters, coupled with a $3.0 million, one-time charge in the first quarter of 2013 relating to an unclaimed property settlement.
Total EMEA
(Dollars in millions)
2013 | 2012 | Change | CC Change | |||||||||||||
Revenue from services | $ | 1,057.2 | $ | 1,022.9 | 3.4 | % | 1.9 | % | ||||||||
Staffing fee-based income | 35.8 | 39.2 | (8.6 | ) | (8.6 | ) | ||||||||||
Gross profit | 176.2 | 176.8 | (0.2 | ) | (1.6 | ) | ||||||||||
SG&A expenses excludingrestructuring charges | 164.3 | 169.0 | (2.8 | ) | ||||||||||||
Restructuring charges | 0.4 | (0.9 | ) | 156.6 | ||||||||||||
Total SG&A expenses | 164.7 | 168.1 | (1.9 | ) | (3.3 | ) | ||||||||||
Earnings from operations | 11.5 | 8.7 | 32.9 | |||||||||||||
Gross profit rate | 16.7 | % | 17.3 | % | (0.6 | ) pts. | ||||||||||
Expense rates (excludingrestructuring charges): | ||||||||||||||||
| % of revenue | 15.5 | 16.5 | (1.0 | ) | ||||||||||||
| % of gross profit | 93.2 | 95.6 | (2.4 | ) | ||||||||||||
Operating margin | 1.1 | 0.8 | 0.3 | |||||||||||||
The change in EMEA revenue from services reflected a 3% increase in average bill rates on a CC basis, partially offset by a 1% decrease in hours worked. The increase in average bill rates was due to favorable country and customer mix. EMEA revenue represented 20% of total Company revenue in 2013 and 19% in 2012.
The EMEA gross profit rate decreased due to unfavorable customer mix, with revenue from large customers increasing by 7% on a CC basis and revenue from retail customers with higher margins decreasing 2% in comparison to the prior year. Additionally, the gross profit rate was impacted by the decline in staffing fee-based income. The effect of these decreases, which accounted for 110 basis points, was partially offset by the effect of the CICE tax credit in France. The CICE tax credit is related to a law which was introduced in 2013 to enhance the competitiveness of businesses in France. This credit of $5.5 million, which was recorded in cost of services, improved the reported gross profit rate by approximately 50 basis points.
The decrease in SG&A expenses excluding restructuring charges was primarily due to hiringa reduction of permanent placement recruiters.full-time employees. Restructuring costs recorded in 2013 reflect the adjustments to prior restructuring costs primarily in France and Italy. The total net restructuring benefit in 2012 included $2.9 million of favorable adjustments to prior restructuring costs in the U.K., partially offset by costs associated with restructuring actions taken in Italy, France and Ireland.
Total APAC
(Dollars in millions)
2013 2012 Change CC Change Revenue from services )% % Staffing fee-based income 19.4 Gross profit SG&A expenses excludingrestructuring charges Restructuring charges NM Total SG&A expenses Earnings from operations NM Gross profit rate % % Expense rates (excludingrestructuring charges): Operating margin $ 382.7 $ 394.8 (3.1 0.1 27.5 (29.6 ) (26.6 ) 63.3 71.1 (11.0 ) (7.7 ) 60.2 73.4 (18.1 ) 0.3 - 60.5 73.4 (17.7 ) (14.6 ) 2.8 (2.3 ) 16.5 18.0 (1.5 ) pts. % of revenue 15.7 18.6 (2.9 ) % of gross profit 95.1 103.3 (8.2 ) 0.7 (0.6 ) 1.3
The change in total APAC revenue reflected a 12% increase in average bill rates on a CC basis, partially offset by a 9% decrease in hours worked. Excluding the 2012 results from the North Asia operations which were deconsolidated in the fourth quarter of 2012, APAC revenue declined 3% on a CC basis. The change in hours worked was due to declines in India where we exited lower margin business, and Malaysia, where the decrease reflected changing customer demand. The improvement in average bill rates was primarily due to the mix of countries, particularly the business we exited in India with very low average bill rates. APAC revenue represented 7% of total Company revenue in both 2013 and 2012.
Excluding the North Asia operations from 2012 results, the APAC gross profit rate decreased 30 basis points. Temporary margins reduced the gross profit rate by 40 basis points, primarily due to pricing pressures for large accounts in Australia and New Zealand. Staffing fee-based income decreased 5% on a CC basis excluding the North Asia operations, and also negatively impacted the gross profit rate by 40 basis points. Fees declined in most countries in the APAC region, in comparison to the prior year. These decreases were partially offset by favorable adjustments to workers’ compensation reserves in Australia, along with the effect of a wage credit related to a new law enacted in Singapore to promote the training and development of its citizens and incentivize companies to increase employee wages. The favorable adjustments to workers’ compensation reserves, which were recorded in cost of services, totaled $1.3 million and added 30 basis points to the APAC region gross profit rate in 2013. The wage credit, which was also recorded in cost of services, totaled $0.7 million and added 20 basis points to the APAC region gross profit rate in 2013.
SG&A expenses declined 5% on a CC basis, excluding the North Asia operations from 2012 results. This change was the result of consolidating Australia and New Zealand management and lower country headquarters costs across the region.
| Constant | ||||||||||||||||
| 2010 | 2009 | Currency | ||||||||||||||
| (52 Weeks) | (53 Weeks) | Change | Change | |||||||||||||
| (In millions of dollars) | ||||||||||||||||
| Revenue from Services | $ | 254.8 | $ | 219.9 | 15.8 | % | 15.6 | % | ||||||||
| Fee-based income | 25.6 | 24.4 | 4.9 | 3.9 | ||||||||||||
| Gross profit | 60.0 | 59.7 | 0.2 | (0.1 | ) | |||||||||||
| SG&A expenses excluding restructuring charges | 77.5 | 69.6 | 11.3 | |||||||||||||
| Restructuring charges | 0.1 | 1.9 | (96.0 | ) | ||||||||||||
| Total SG&A expenses | 77.6 | 71.5 | 8.5 | 8.1 | ||||||||||||
| Earnings from Operations | (17.6 | ) | (11.8 | ) | (50.8 | ) | ||||||||||
| Gross profit rate | 23.5 | % | 27.2 | % | (3.7 | )pts. | ||||||||||
| Expense rates (excluding restructuring charges): | ||||||||||||||||
| % of revenue | 30.4 | 31.7 | (1.3 | ) | ||||||||||||
| % of gross profit | 129.5 | 116.6 | 12.9 | |||||||||||||
| Operating margin | (7.0 | ) | (5.3 | ) | (1.7 | ) | ||||||||||
OCG
(Dollars in millions)
2013 2012 Change CC Change Revenue from services % % Gross profit SG&A expenses excludingrestructuring charges Restructuring charges NM Total SG&A expenses Asset impairments Earnings from operations Gross profit rate % % Expense rates (excludingrestructuring charges): Operating margin $ 475.9 $ 396.1 20.2 20.4 119.8 104.0 15.1 15.4 105.5 95.4 10.6 0.9 - 106.4 95.4 11.5 11.7 1.7 - NM 11.7 8.6 35.6 25.2 26.3 (1.1 ) pts. % of revenue 22.2 24.1 (1.9 ) % of gross profit 88.1 91.6 (3.5 ) 2.5 2.2 0.3
Revenue from services in the OCG segment for 2010 increased in the Americas, EMEA and APAC regions,during 2013 due primarily to growth in ourthe BPO and CWO practice areas. Revenue in BPO grew by 30% year over year and revenue in CWO, which includes PPO, grew by 23%. These increases were partially offset by a decrease in RPO revenue of 4%. The revenue growth in BPO and RPO practices.CWO was due to both expansion of programs with existing customers and new customers. OCG revenue represented 5.1%9% of total Company revenue in 20102013 and 2009.
22
Results of Operations2009
2012 versus 2008
Total Company
(Dollars in millions)
2012 2011 Change CC Change Revenue from services )% )% Staffing fee-based income Gross profit SG&A expenses excludingrestructuring charges Restructuring charges Total SG&A expenses Asset impairments NM Earnings from operations Gross profit rate % % Expense rates (excludingrestructuring charges): Operating margin $ 5,450.5 $ 5,551.0 (1.8 (0.2 96.8 98.5 (1.8 ) 1.3 896.6 883.3 1.5 3.3 822.1 822.8 (0.1 ) (0.9 ) 2.8 (132.3 ) 821.2 825.6 (0.6 ) 1.2 3.1 - 72.3 57.7 25.3 16.5 15.9 0.6 pts. % of revenue 15.1 14.8 0.3 % of gross profit 91.7 93.2 (1.5 ) 1.3 1.0 0.3
Total Company revenue for 2009 totaled $4.31 billion,2012 was down 2% in comparison to 2011, and declined 3%, excluding the Company’s 2011 acquisition of Tradição described below. On a decreaseCC basis, total Company revenue was flat and down 1%, excluding the Company’s acquisition of 21.8% from 2008.Tradição. This was the result of areflected an 11% decrease in hours worked, of 18.7% combined withpartially offset by a 9% increase in average bill rates on a CC basis. Hours decreased in our staffing business in all three regions. The decrease in the Americas and EMEA was due, in large part, to the economic uncertainty existing in both regions, while the decline in APAC was due to decisions we made to exit low-margin business in India. The improvement in average hourly bill rates was primarily due to the mix of 5.0% (1.2% on a constant currency basis). Fee-based income, which is includedcountries, particularly the business we exited in revenue from services, totaled $86.1 million, or 2.0% of total revenue, for 2009, a decrease of 43.1% as compared to $151.3 million for 2008. Revenue for 2009 decreased in all seven business segments, reflecting the global economic slowdown.
Compared to 2008, the U.S. dollar was stronger against many foreign currencies, including the euro, British pound, Australian dollar and Canadian dollar. As a result, our consolidated U.S. dollar translated revenue was lower than would have otherwise been reported. On a constant currency basis, revenue for 2009 decreased 19.2% as compared with 2008. The table below summarizes the impact of foreign exchange adjustments on revenue for 2009 on a 53-week reported basis:
| Revenue from Services | ||||||||||||
| 2009 | 2008 | |||||||||||
| (53 Weeks) | (52 Weeks) | % Change | ||||||||||
| (In millions of dollars) | ||||||||||||
| Revenue from Services — Constant Currency: | ||||||||||||
| Americas Commercial | $ | 2,006.1 | $ | 2,516.7 | (20.3 | )% | ||||||
| Americas PT | 793.4 | 938.2 | (15.4 | ) | ||||||||
| Total Americas Commercial and PT — Constant Currency | 2,799.5 | 3,454.9 | (19.0 | ) | ||||||||
| EMEA Commercial | 984.3 | 1,310.5 | (24.9 | ) | ||||||||
| EMEA PT | 154.0 | 172.5 | (10.7 | ) | ||||||||
| Total EMEA Commercial and PT — Constant Currency | 1,138.3 | 1,483.0 | (23.2 | ) | ||||||||
| APAC Commercial | 299.2 | 336.0 | (11.0 | ) | ||||||||
| APAC PT | 26.0 | 34.3 | (24.3 | ) | ||||||||
| Total APAC Commercial and PT — Constant Currency | 325.2 | 370.3 | (12.2 | ) | ||||||||
| OCG — Constant Currency | 222.3 | 233.3 | (4.7 | ) | ||||||||
| Less: Intersegment revenue | (25.3 | ) | (24.2 | ) | 5.0 | |||||||
| Total Revenue from Services — Constant Currency | 4,460.0 | 5,517.3 | (19.2 | ) | ||||||||
| Foreign Currency Impact | (145.2 | ) | ||||||||||
| Revenue from Services | $ | 4,314.8 | $ | 5,517.3 | (21.8 | )% | ||||||
23
SG&A expenses totaled $794.7 million, a year-over-year decreaseexcluding restructuring decreased slightly year over year. In the fourth quarter of $172.7 million, or 17.9% (14.8%2012, we embarked on a constant currency basis). Includedrestructuring program for certain of our EMEA operations in SG&A expenses for 2009 are litigation costs of $5.3 millionItaly, France and Ireland. The total net restructuring charges of $29.9benefit in 2012 included $2.9 million of which $14.4 millionfavorable adjustments to prior restructuring costs in the U.K., partially offset by costs associated with restructuring actions in taken in Italy, France and Ireland. Restructuring costs in 2011 related primarily to severance, $7.9 million related torevisions of the estimated lease termination costs and $7.6 million relatedfor previously closed EMEA Commercial branches.
In the fourth quarter of 2012, we made the decision to asset write-offs and other costs. Included in SG&A expenses for 2008 are litigation costs of $22.5 million and restructuring costs of $6.5 million.
24
Diluted lossearnings from continuing operations per share for 2009 was $3.01,2012 were $1.31, as compared to diluted loss$1.72 for 2011.
Earnings (loss) from continuingdiscontinued operations per share of $2.35 for 2008.
Total Americas Commercial
| Constant | ||||||||||||||||
| 2009 | 2008 | Currency | ||||||||||||||
| (53 Weeks) | (52 Weeks) | Change | Change | |||||||||||||
| (In millions of dollars) | ||||||||||||||||
| Revenue from Services | $ | 1,980.3 | $ | 2,516.7 | (21.3 | )% | (20.3 | )% | ||||||||
| Fee-based income | 6.6 | 15.7 | (58.4 | ) | (56.8 | ) | ||||||||||
| Gross profit | 290.7 | 399.0 | (27.1 | ) | (26.3 | ) | ||||||||||
| SG&A expenses excluding restructuring charges | 273.2 | 328.2 | (16.7 | ) | ||||||||||||
| Restructuring charges | 7.2 | 0.9 | NM | |||||||||||||
| Total SG&A expenses | 280.4 | 329.1 | (14.8 | ) | (13.8 | ) | ||||||||||
| Earnings from Operations | 10.3 | 69.9 | (85.1 | ) | ||||||||||||
| Gross profit rate | 14.7 | % | 15.9 | % | (1.2 | )pts. | ||||||||||
| Expense rates (excluding restructuring charges): | ||||||||||||||||
| % of revenue | 13.8 | 13.0 | 0.8 | |||||||||||||
| % of gross profit | 93.9 | 82.2 | 11.7 | |||||||||||||
| Operating margin | 0.5 | 2.8 | (2.3 | ) | ||||||||||||
(Dollars in Americas Commercialmillions)
2012 2011 Change CC Change Revenue from services % % Staffing fee-based income Gross profit Total SG&A expenses Earnings from operations Gross profit rate % % Expense rates: % of revenue % of gross profit Operating margin $ 3,672.1 $ 3,643.7 0.8 1.3 30.2 25.3 19.0 20.3 547.9 523.1 4.7 5.2 405.8 396.4 2.4 3.0 142.1 126.7 12.0 14.9 14.4 0.5 pts. 11.1 10.9 0.2 74.1 75.8 (1.7 ) 3.9 3.5 0.4
On an organic basis, excluding the Tradição acquisition in Brazil in late 2011, CC revenue from services reflecteddecreased slightly. This was attributable to a 4% decrease in hours worked, of 20.3%partially offset by a 3% increase in average bill rates on a CC basis. During 2012, the PT segment revenue grew by 5%, combined with awhile the Commercial segment revenue, excluding Tradição, declined 3%. The PT segment growth was fueled primarily by increases in hours and revenues in our engineering, IT and finance services. The decrease in average hourly bill rates of 0.9% (an increase of 0.3% on a constant currency basis).Commercial segment revenue was driven primarily by decreases in light industrial and electronic assembly service lines, reflecting slowing demand as the year progressed, due to economic uncertainties. Americas Commercial represented 45.9%67% of total Company revenue for 2009in 2012 and 45.6% for 2008.
The decreaseincrease in theour gross profit rate was due to lowerthe combined effects of increased staffing fee-based income, anpricing increases and the decreases in workers’ compensation costs noted above. The year-over-year increase in total SG&A expenses was due to the proportioncosts associated with our Tradição operation. Total SG&A expenses without Tradição decreased slightly from last year.
Total EMEA
(Dollars in millions)
2012 2011 Change CC Change Revenue from services )% )% Staffing fee-based income Gross profit SG&A expenses excludingrestructuring charges Restructuring charges Total SG&A expenses Earnings from operations Gross profit rate % % ) pts. Expense rates (excludingrestructuring charges): Operating margin $ 1,022.9 $ 1,169.0 (12.5 (6.7 39.2 44.1 (11.2 ) (5.5 ) 176.8 207.7 (14.9 ) (9.2 ) 169.0 186.9 (9.7 ) (0.9 ) 2.8 (132.3 ) 168.1 189.7 (11.5 ) (6.0 ) 8.7 18.0 (51.6 ) 17.3 17.8 (0.5 % of revenue 16.5 16.0 0.5 % of gross profit 95.6 90.1 5.5 0.8 1.5 (0.7 )
The change in EMEA revenue from services reflected an 11% decrease in hours worked. The decrease primarily reflected the difficult economic environment in the European Union. However, we also saw a decrease in our hours in Russia, where we were focused on gaining higher-margin customers. The decrease in volume was partially offset by a 5% increase in average bill rates on a CC basis. This was the result of lower-margin light industrial businessaverage bill rate increases in Switzerland due to higher-margin clerical business,favorable customer mix and Russia where, as well as the impact of lower favorable workers’ compensation adjustments from prior years. Of the total $2.8 million adjustment in 2009 noted above, $2.4 million was reflectedwe were focused on higher-margin customers. EMEA represented 19% of total Company revenue in 2012 and 21% in 2011.
The EMEA gross profit rate decreased due to both a mix change, where higher-margin retail business decreased by more than lower-margin corporate accounts, and a decrease in staffing fee-based income in the results of Americas Commercial. This comparesEurozone due to an adjustment of $10.5 million in 2008.
The decrease in SG&A expenses reflected reduced salariesexcluding restructuring charges was primarily due to a reduction of full-time employees in specific countries. The total net restructuring benefit recorded in 2012 included $2.9 million of favorable adjustments to prior restructuring costs in the U.K., partially offset by costs associated with the restructuring actions taken in Italy, France and incentive compensation related to expense control initiatives. Restructuring chargesIreland in 2009 and 2008 included severance, lease termination and other costs to close or consolidate approximately 115 branches.the fourth quarter of 2012.
Total APAC
(Dollars in millions)
2012 2011 Change CC Change Revenue from services )% )% Staffing fee-based income Gross profit Total SG&A expenses Earnings from operations Gross profit rate % % pts. Expense rates: Operating margin $ 394.8 $ 449.0 (12.1 (11.5 27.5 29.2 (5.8 ) (4.8 ) 71.1 76.3 (6.8 ) (6.3 ) 73.4 77.0 (4.7 ) (4.1 ) (2.3 ) (0.7 ) (207.4 ) 18.0 17.0 1.0 % of revenue 18.6 17.2 1.4 % of gross profit 103.3 101.0 2.3 (0.6 ) (0.2 ) (0.4 )
25
| Constant | ||||||||||||||||
| 2009 | 2008 | Currency | ||||||||||||||
| (53 Weeks) | (52 Weeks) | Change | Change | |||||||||||||
| (In millions of dollars) | ||||||||||||||||
| Revenue from Services | $ | 792.6 | $ | 938.2 | (15.5 | )% | (15.4 | )% | ||||||||
| Fee-based income | 9.4 | 19.4 | (51.5 | ) | (51.4 | ) | ||||||||||
| Gross profit | 125.1 | 161.7 | (22.6 | ) | (22.5 | ) | ||||||||||
| SG&A expenses excluding restructuring charges | 100.9 | 113.3 | (10.9 | ) | ||||||||||||
| Restructuring charges | 1.0 | — | NM | |||||||||||||
| Total SG&A expenses | 101.9 | 113.3 | (10.0 | ) | (9.8 | ) | ||||||||||
| Earnings from Operations | 23.2 | 48.4 | (52.2 | ) | ||||||||||||
| Gross profit rate | 15.8 | % | 17.2 | % | (1.4 | )pts. | ||||||||||
| Expense rates (excluding restructuring charges): | ||||||||||||||||
| % of revenue | 12.7 | 12.1 | 0.6 | |||||||||||||
| % of gross profit | 80.7 | 70.1 | 10.6 | |||||||||||||
| Operating margin | 2.9 | 5.2 | (2.3 | ) | ||||||||||||
The Americas PTimprovement in the APAC gross profit rate decreased,was also due primarily to the decision to exit a number of lower-margin customers in India. The temporary gross profit rate in India was significantly lower than the temporary gross profit rate of the region. Staffing fee-based income changes in customer mix and higher growth in certain lower-margin customer accounts.
| Constant | ||||||||||||||||
| 2009 | 2008 | Currency | ||||||||||||||
| (53 Weeks) | (52 Weeks) | Change | Change | |||||||||||||
| (In millions of dollars) | ||||||||||||||||
| Revenue from Services | $ | 895.2 | $ | 1,310.5 | (31.7 | )% | (24.9 | )% | ||||||||
| Fee-based income | 16.6 | 39.5 | (58.0 | ) | (52.6 | ) | ||||||||||
| Gross profit | 140.2 | 227.3 | (38.4 | ) | (32.5 | ) | ||||||||||
| SG&A expenses excluding restructuring charges | 150.3 | 226.5 | (33.7 | ) | ||||||||||||
| Restructuring charges | 15.6 | 3.9 | 301.4 | |||||||||||||
| Total SG&A expenses | 165.9 | 230.4 | (28.0 | ) | (20.2 | ) | ||||||||||
| Earnings from Operations | (25.7 | ) | (3.1 | ) | NM | |||||||||||
| Gross profit rate | 15.7 | % | 17.4 | % | (1.7 | )pts. | ||||||||||
| Expense rates (excluding restructuring charges): | ||||||||||||||||
| % of revenue | 16.8 | 17.3 | (0.5 | ) | ||||||||||||
| % of gross profit | 107.2 | 99.6 | 7.6 | |||||||||||||
| Operating margin | (2.9 | ) | (0.2 | ) | (2.7 | ) | ||||||||||
26
| Constant | ||||||||||||||||
| 2009 | 2008 | Currency | ||||||||||||||
| (53 Weeks) | (52 Weeks) | Change | Change | |||||||||||||
| (In millions of dollars) | ||||||||||||||||
| Revenue from Services | $ | 141.9 | $ | 172.5 | (17.8 | )% | (10.7 | )% | ||||||||
| Fee-based income | 15.7 | 26.8 | (41.2 | ) | (33.2 | ) | ||||||||||
| Gross profit | 37.8 | 51.2 | (26.2 | ) | (18.8 | ) | ||||||||||
| SG&A expenses | 40.6 | 48.9 | (16.9 | ) | (8.5 | ) | ||||||||||
| Earnings from Operations | (2.8 | ) | 2.3 | NM | ||||||||||||
| Gross profit rate | 26.6 | % | 29.7 | % | (3.1 | )pts. | ||||||||||
| Expense rates: | ||||||||||||||||
| % of revenue | 28.6 | 28.3 | 0.3 | |||||||||||||
| % of gross profit | 107.6 | 95.5 | 12.1 | |||||||||||||
| Operating margin | (2.0 | ) | 1.3 | (3.3 | ) | |||||||||||
The change in revenue from services in EMEA PT resulted from the decrease in fee-based income,SG&A expenses reflected a decrease in hours worked of 10.7%, combined withfull-time salaries due, in part, to a 3.7% decreasedecision to keep open positions vacant in average hourly bill rates (an increase of 3.9% on a constant currency basis). EMEA PT revenue represented 3.3% of total Company revenue for 2009 and 3.1% for 2008.
27
(Dollars in millions)
| Constant | ||||||||||||||||
| 2009 | 2008 | Currency | ||||||||||||||
| (53 Weeks) | (52 Weeks) | Change | Change | |||||||||||||
| (In millions of dollars) | ||||||||||||||||
| Revenue from Services | $ | 284.9 | $ | 336.0 | (15.2 | )% | (11.0 | )% | ||||||||
| Fee-based income | 9.7 | 17.0 | (43.0 | ) | (40.6 | ) | ||||||||||
| Gross profit | 41.6 | 56.3 | (26.1 | ) | (22.6 | ) | ||||||||||
| SG&A expenses excluding restructuring charges | 44.6 | 56.6 | (21.3 | ) | ||||||||||||
| Restructuring charges | 1.6 | — | NM | |||||||||||||
| Total SG&A expenses | 46.2 | 56.6 | (18.5 | ) | (14.8 | ) | ||||||||||
| Earnings from Operations | (4.6 | ) | (0.3 | ) | NM | |||||||||||
| Gross profit rate | 14.6 | % | 16.8 | % | (2.2 | )pts. | ||||||||||
| Expense rates (excluding restructuring charges): | ||||||||||||||||
| % of revenue | 15.6 | 16.8 | (1.2 | ) | ||||||||||||
| % of gross profit | 107.0 | 100.5 | 6.5 | |||||||||||||
| Operating margin | (1.6 | ) | (0.1 | ) | (1.5 | ) | ||||||||||
| Constant | ||||||||||||||||
| 2009 | 2008 | Currency | ||||||||||||||
| (53 Weeks) | (52 Weeks) | Change | Change | |||||||||||||
| (In millions of dollars) | ||||||||||||||||
| Revenue from Services | $ | 25.4 | $ | 34.3 | (26.0 | )% | (24.3 | )% | ||||||||
| Fee-based income | 3.8 | 5.1 | (25.0 | ) | (21.0 | ) | ||||||||||
| Gross profit | 7.7 | 10.2 | (25.1 | ) | (22.6 | ) | ||||||||||
| SG&A expenses | 9.2 | 10.7 | (14.2 | ) | (9.9 | ) | ||||||||||
| Earnings from Operations | (1.5 | ) | (0.5 | ) | (224.9 | ) | ||||||||||
| Gross profit rate | 30.2 | % | 29.8 | % | 0.4 | pts. | ||||||||||
| Expense rates: | ||||||||||||||||
| % of revenue | 36.2 | 31.2 | 5.0 | |||||||||||||
| % of gross profit | 119.8 | 104.6 | 15.2 | |||||||||||||
| Operating margin | (6.0 | ) | (1.4 | ) | (4.6 | ) | ||||||||||
2012 | 2011 | Change | CC Change | |||||||||||||
Revenue from services | $ | 396.1 | $ | 317.3 | 24.8 | % | 25.5 | % | ||||||||
Gross profit | 104.0 | 78.8 | 32.0 | 33.5 | ||||||||||||
Total SG&A expenses | 95.4 | 81.4 | 17.0 | 18.6 | ||||||||||||
Earnings from operations | 8.6 | (2.6 | ) | NM | ||||||||||||
Gross profit rate | 26.3 | % | 24.8 | % | 1.5 | pts. | ||||||||||
Expense rates: | ||||||||||||||||
| % of revenue | 24.1 | 25.7 | (1.6 | ) | ||||||||||||
| % of gross profit | 91.6 | 103.4 | (11.8 | ) | ||||||||||||
Operating margin | 2.2 | (0.8 | ) | 3.0 | ||||||||||||
28
| Constant | ||||||||||||||||
| 2009 | 2008 | Currency | ||||||||||||||
| (53 Weeks) | (52 Weeks) | Change | Change | |||||||||||||
| (In millions of dollars) | ||||||||||||||||
| Revenue from Services | $ | 219.9 | $ | 233.3 | (5.7 | )% | (4.7 | )% | ||||||||
| Fee-based income | 24.4 | 27.8 | (12.3 | ) | (9.4 | ) | ||||||||||
| Gross profit | 59.7 | 72.9 | (18.0 | ) | (16.1 | ) | ||||||||||
| SG&A expenses excluding restructuring charges | 69.6 | 69.5 | 0.0 | |||||||||||||
| Restructuring charges | 1.9 | 0.5 | 328.4 | |||||||||||||
| Total SG&A expenses | 71.5 | 70.0 | 2.0 | 4.3 | ||||||||||||
| Earnings from Operations | (11.8 | ) | 2.9 | NM | ||||||||||||
| Gross profit rate | 27.2 | % | 31.2 | % | (4.0 | )pts. | ||||||||||
| Expense rates (excluding restructuring charges): | ||||||||||||||||
| % of revenue | 31.7 | 29.8 | 1.9 | |||||||||||||
| % of gross profit | 116.6 | 95.6 | 21.0 | |||||||||||||
| Operating margin | (5.3 | ) | 1.2 | (6.5 | ) | |||||||||||
The OCG gross profit rate decreasedincreased primarily due to a shift in revenue mix among the OCG business units. Revenueas volume increased in the higher-marginhigher margin BPO, RPO and CWO units declined, while revenuepractice areas. The increase in our lower-margin BPO unit grew modestly during 2009. This change in business mix, coupled with a decrease in the gross profit rates in our RPO practice as compared to 2008, resulted in the overall gross profit decline.
Results of Operations
Financial Condition
Historically, we have financed our operations through cash generated by operating activities and access to credit markets. Our working capital requirements are primarily generated from temporary employee payroll and customer accounts receivable. Since receipts from customers generally lag payroll to temporary employees, working capital requirements increase substantially in periods of growth. Conversely, when economic activity slows, working capital requirements may substantially decrease. As highlighted in the consolidated statements of cash flows, our liquidity and available capital resources are impacted by four key components: cash and equivalents, operating activities, investing activities and financing activities.
Cash and Equivalents
Cash and equivalents totaled $80.5 million at the end of 2010, a decrease of $8.4 million from the $88.9$125.7 million at year-end 2009.2013, compared to $76.3 million at year-end 2012. As further described below, during 2010,2013, we generated $41.8$115.3 million of cash from operating activities, used $11.3$20.8 million of cash infor investing activities and used $35.3$43.7 million in cash for financing activities.
29
In 2010,2013, we generated $41.8$115.3 million inof net cash from our operating activities, as compared to using $27.4generating $61.1 million in 20092012 and generating $111.4$19.1 million in 2008.2011. Included in net cash from operating activities for 2013 is $20.0 million related to the timing of payments to suppliers noted above, along with an increase of $4.8 million related to the correction of an error from prior periods. The increase in net cash from operating activities from 2012 to 2013 was also due to lower working capital requirements and improved operating results. The increase from 20092011 to 20102012 was primarily due to improved earningslower additional working capital requirements. In fiscal 2014, net cash from operating activities will be negatively impacted by the timing of the $20.0 million in 2010. The decrease from 2008payments to 2009 was primarily due to the decline in operating earnings, after adjustment for non-cash asset impairments and non-cash changes in deferred tax assets.
Trade accounts receivable totaled $810.9 million$1.0 billion at the end of 2010.year-end 2013. Global days sales outstanding (“DSO”) for the fourth quarter were 4952 days for 2010,2013, compared to 5153 days for 2009.
Our working capital position was $367.6$474.5 million at the end of 2010,year-end 2013, an increase of $10.0$4.2 million from year-end 2009.2012. The current ratio (total current assets divided by total current liabilities) was 1.6 at year-end 20102013 and 1.7 at year-end 2009. The year-over-year decrease in book overdrafts of $10.2 million in 2009 and increase of $9.8 million in 2008 was reclassified from financing to operating activities in the consolidated statement of cash flows.
Investing Activities
In 2010,2013, we used $11.3$20.8 million inof net cash for investing activities, compared to $23.4$28.1 million in 20092012 and $64.0$20.7 million in 2008.2011. Capital expenditures, which totaled $11.0$20.0 million in 2010, $13.12013, $21.5 million in 20092012 and $31.1$15.4 million in 2008,2011, primarily related to the Company’s information technology programs. programs in 2013 and 2011.
In 2008,2012, capital expenditures included costs for the implementation of the PeopleSoft payroll, billing and accounts receivable project.
During 2012, we entered into an agreement with Temp Holdings Co., Ltd. (“Temp Holdings”) to form a venture, TS Kelly Workforce Solutions (“TS Kelly”), in order to expand both companies’ presence in North Asia. As part of this agreement, we contributed our operations in China, South Korea and Hong Kong for a 49% ownership interest in TS Kelly. The total cost$6.6 million investment represented a $1.8 million payment to TS Kelly, as well as the cash on hand at the operations we contributed. Our share of the project to dateoperating results of TS Kelly is $79 million, of which $56 million was capital expenditures and $23 million was selling, general and administrative expenses. We anticipate spending approximately $25 to $30 million to complete the PeopleSoft project by the end of 2014. Includedrecorded on an equity basis beginning in the consolidated balance sheet at year-end 2010 was $5.5first quarter of 2013.
In November, 2011, we acquired the stock of Tradição Planejamento e Tecnologia de Serviços S.A. and Tradição Tecnologia e Serviços Ltda. (collectively, “Tradição”), a national service provider in Brazil, for $6.6 million of capitalized costs related to unimplemented PeopleSoft modules.
Financing Activities
To take advantage of improved conditions in the credit markets and obtain more favorable pricing and flexible terms and conditions, effective December 11, 2013, we refinanced our existing secured revolving credit facility and securitization facility. Our amended revolver increased capacity to $200.0 million and carries a term of five years. The amended securitization facility carries a term of three years and has a total capacity of $150.0 million.
In 2010,2013, we used $35.3$43.7 million in net cash fromfor financing activities, as compared to generating $19.6using $39.4 million in 20092012 and using $18.6generating $6.1 million in 2008.2011. Changes in net cash from financing activities are primarily related to short-term borrowing activities. Debt totaled $78.8$28.3 million at year-end 20102013 compared to $137.1$64.1 million at year-end 2009.2012. Debt-to-total capital is a common ratio to measure the relative capital structure and leverage of the Company. Our ratio of debt-to-total capital (total debt reported on the balance sheet divided by total debt plus stockholders’ equity) was 11.2%3.3% at year-end 2013 and 8.0% at year-end 2012.
In 2013, the endnet change in short-term borrowings was primarily due to $35.0 million of 2010 and 19.5% atrepayments on the end of 2009.
30
Dividends paid per common share were $0.54$0.20 in 2008. No dividends were paid2013 and 2012 and $0.10 in 2009 or 2010.2011. Payments of dividends are restricted by the financial covenants contained in our debt facilities. Details of this restriction are contained in the Debt footnote in the notes to our consolidated financial statements.
Contractual Obligations and Commercial Commitments
Summarized below are our obligations and commitments to make future payments as of year-end 2010:
| Payment due by period | ||||||||||||||||||||
| Less than | More than | |||||||||||||||||||
| Total | 1 year | 1-3 Years | 3-5 Years | 5 years | ||||||||||||||||
| (In millions of dollars) | ||||||||||||||||||||
| Operating leases | $ | 115.8 | $ | 44.0 | $ | 51.4 | $ | 13.2 | $ | 7.2 | ||||||||||
| Short-term borrowings and current portion of long-term debt | 78.8 | 78.8 | — | — | — | |||||||||||||||
| Accrued insurance | 84.9 | 31.3 | 26.4 | 12.8 | 14.4 | |||||||||||||||
| Accrued retirement benefits | 92.4 | 7.2 | 14.1 | 14.1 | 57.0 | |||||||||||||||
| Other long-term liabilities | 4.2 | 0.8 | 1.6 | 1.6 | 0.2 | |||||||||||||||
| Uncertain income tax positions, interest and penalties | 6.1 | 0.2 | 5.8 | 0.1 | — | |||||||||||||||
| Purchase obligations | 25.4 | 12.8 | 12.5 | 0.1 | — | |||||||||||||||
| Total | $ | 407.6 | $ | 175.1 | $ | 111.8 | $ | 41.9 | $ | 78.8 | ||||||||||
Total Less than 1 year 1-3 Years 3-5 Years More than 5 years (In millions of dollars) Operating leases Short-term borrowings Accrued insurance Accrued retirement benefits Other long-term liabilities Uncertain income tax positions Purchase obligations Total Payment due by period $ 106.4 $ 39.0 $ 47.7 $ 17.3 $ 2.4 28.3 28.3 - - - 73.6 27.6 21.4 9.6 15.0 140.1 5.8 11.5 11.5 111.3 12.0 2.9 3.6 2.3 3.2 3.1 - 1.6 0.7 0.8 30.8 20.3 9.1 1.4 - $ 394.3 $ 123.9 $ 94.9 $ 42.8 $ 132.7
Purchase obligations above represent unconditional commitments relating primarily to voice and data communications services and online tools which we expect to utilize generally within the next threetwo fiscal years, in the ordinary course of business. We have no material, unrecorded commitments, losses, contingencies or guarantees associated with any related parties or unconsolidated entities.
31
We expect to meet our ongoing short-short and long-term cash requirements principally through cash generated from operations, available cash and equivalents, securitization of customer receivables and committed unused credit facilities. Additional funding sources could include public or private bonds, asset-based lending, additional bank facilities, issuance of equity or other sources. We expect these same sources of liquidity to fund the $61.7 million of our debt which matures on October 3, 2011.
We utilize intercompany loans, dividends, capital contributions and redemptions and a notional cash pool to effectively manage our cash on a global basis. We periodically review our foreign subsidiaries’ cash balances and projected cash needs. As part of those reviews, we may identify cash that we feel should be repatriated to optimize the Company’s overall capital structure. At the present time, we dothese reviews have not haveresulted in any specific plans to repatriate thea majority of our international excess cash balances. AsWe expect much of our business recovers, we expect this international cash will be needed to fund working capital growth in our local operations. The majority of our international cash was investedis concentrated in oura cash poolpooling arrangement (the “Cash Pool”) and wasis available to fund general corporate needs bothinternationally. The Cash Pool is a set of cash accounts maintained with a single bank that must, as a whole, maintain at our headquartersleast a zero balance; individual accounts may be positive or negative. This allows countries with excess cash to invest and at other international affiliates. There are no significant restrictions on our abilitycountries with cash needs to utilize the cash pool, and we did so throughout the year. As our global cash position improved in December, funds from the cash pool were used to help finance reductions of debt.
We manage our cash and debt very closely to minimize outstanding debt balances.optimize our capital structure. As our cash balances build, we tend to pay down debt as appropriate. Conversely, when working capital needs grow, we tend to use corporate cash and cash available in the cash poolCash Pool first, and then we access our borrowing facilities.
At year-end 2013, we had $90.0$200.0 million of available capacity on our $90$200.0 million revolving credit facility and $37.3$67.0 million of available capacity on our $100$150.0 million securitization facility. The securitization facility carried $17.0$28.0 million of short-term borrowings and $45.7$55.0 million of standby letters of credit related to workers’ compensation. Together, the revolving credit and securitization facilities provide the Company with committed funding capacity that may be used for general corporate purposes. While we believe these facilities will cover our working capital needs over the short term, if economic conditions or operating results change significantly, we may need to seek additional sources of funds. DuringThroughout 2013 and as of the first quarter of 2011,2013 year end, we expectmet the debt covenants related to refinance theour revolving credit facility and the securitization facility to increase capacity and improve pricing, terms, and conditions. Once this process is complete, it is our intention to prepay our term loans and move the debt onto the revolving credit facility and the securitization facility.
At year-end 2013, we also had additional unsecured, uncommitted short-term credit facilities totaling $15.3 million, under which we had borrowed $0.3 million. Details of our debt facilities as of the 2013 year end are contained in the Debt footnote in the notes to our consolidated financial statements.
We monitor the credit ratings of our major banking partners on a regular basis. We also have regular discussions with them. Based on our reviews and communications, we believe the risk of one or more of our banks not being able to honor their commitments is insignificant. We also review the ratings and holdings of our money market funds and other investment vehicles regularly to ensure high credit quality and access to our invested cash.
Our total exposure to European receivables from our customers at year-end 2013 was $293.5 million, which represents 29% of total trade accounts receivable, net. The percentage of trade accounts receivable over 90 days past due for Europe was consistent with our global experience.
Critical Accounting Estimates
We prepare our consolidated financial statements in conformity with accounting principles generally accepted in the United States. In this process, it is necessary for us to make certain assumptions and related estimates affecting the amounts reported in the consolidated financial statements and the attached notes. Actual results can differ from assumed and estimated amounts.
Critical accounting estimates are those that we believe require the most difficult, subjective or complex judgments, often as a result of the need to make estimates about the effect of matters that are inherently uncertain. We base our estimates on historical experience and on various other assumptions that we believe to be reasonable under the circumstances, the results of which form the basis for making judgments about the carrying value of assets and liabilities that are not readily apparent from other sources. Judgments and uncertainties affecting the application of those estimates may result in materially different amounts being reported under different conditions or using different assumptions. We consider the following estimates to be most critical in understanding the judgments involved in preparing our consolidated financial statements.
Workers’ Compensation
In the U.S., we have a combination of insurance and self-insurance contracts under which we effectively bear the first $1.0 million of risk per single accident. There is no aggregate limitation on our per-risk exposure under these insurance and self-insurance programs. We establish accruals for workers’ compensation utilizing actuarial methods to estimate the undiscounted future cash payments that will be made to satisfy the claims, including an allowance for incurred-but-not-reported claims. This process includes establishing loss development factors, based on our historical claims experience as well as industry experience, and applying those factors to current claims information to derive an estimate of our ultimate claims liability. In preparing the estimates, we also consider the nature, frequency and severity of the claims, reserving practices of our third party claims administrators, performance of our medical cost management programs, changes in our territory and business line mix and current legal, economic and regulatory factors such as industry estimates of medical cost trends. Where appropriate, multiple generally-accepted actuarial techniques are applied and tested in the course of preparing our estimates. When claims exceed the applicable loss limit or self-insured retention and realization of recovery of the claim from existing insurance policies is deemed probable, we record a receivable from the insurance company for the excess amount.
We evaluate the accrual, and the underlying assumptions, regularly throughout the year and make adjustments as needed. The ultimate cost of these claims may be greater than or less than the established accrual. While we believe that the recorded amounts are reasonable, there can be no assurance that changes to our estimates will not occur due to limitations inherent in the estimation process. In the event we determine that a smaller or larger accrual is appropriate, we would record a credit or a charge to cost of services in the period in which we made such a determination. The accrual for workers’ compensation, net of related receivables which are included in prepaid expenses and other current assets and other assets in the consolidated balance sheet at year-end 2013, and other assets at year-end 2012, was $58.4 million and $61.3 million at year-end 2013 and 2012, respectively.
Income Taxes
Income tax expense is based on expected income and statutory tax rates in the various jurisdictions in which we operate. Judgment is required in determining our income tax expense. We establish accruals for uncertain tax positions under generally accepted accounting principles, which require that a position taken or expected to be taken in a tax return be recognized in the consolidated financial statements when it is more likely than not (i.e., a likelihood of more than fifty percent) that the position would be sustained upon examination by tax authorities that have full knowledge of all relevant information. A recognized tax position is then measured at the largest amount of benefit that is greater than fifty percent likely of being realized upon ultimate settlement.
32
Tax laws require items to be included in the tax return at different times than the items are reflected in the consolidated financial statements. As a result, the income tax expense reflected in our consolidated financial statements is different than the liability reported in our tax return. Some of these differences are permanent, which are not deductible or taxable on our tax return, and some are temporary differences, which give rise to deferred tax assets and liabilities. Deferred tax assets generally represent items that can be used as a tax deduction or credit in our tax return in future years for which we have already recorded the tax benefit in our consolidated income statement. We establish valuation allowances for our deferred tax assets when the amount of expected future taxable income is not likely to support the use of the deduction or credit. Deferred tax liabilities generally represent items for which we have already taken a deduction on our tax return, but have not yet recognized as expense in our consolidated financial statements. Our net deferred tax asset is recorded using currently enacted tax laws, and may need to be adjusted in the event tax laws change.
The U.S. work opportunity credit is allowed for wages earned by employees in certain targeted groups. The actual amount of creditable wages in a particular period is estimated, since the credit is only available once an employee reaches a minimum employment period and the employee’s inclusion in a targeted group is certified by the applicable state. As these events often occur after the period the wages are earned, judgment is required in determining the amount of work opportunity credits accrued for in each period. We evaluate the accrual regularly throughout the year and make adjustments as needed.
Goodwill
We test goodwill for impairment annually and whenever events or circumstances make it more likely than not that an impairment may have occurred. Generally accepted accounting principles require that goodwill be tested for impairment at a reporting unit level. We have determined that our reporting units are the same as our operating and reportable segments. If we have determined that it is more likely than not that the fair value for one or more reporting units is greater than their carrying value, we may use a qualitative assessment for the annual impairment test.
In conducting the qualitative assessment, we assess the totality of relevant events and circumstances that affect the fair value or carrying value of the reporting unit. Such events and circumstances may include macroeconomic conditions, industry and competitive environment conditions, overall financial performance, reporting unit specific events and market considerations. We may also consider recent valuations of the reporting unit, including the magnitude of the difference between the most recent fair value estimate and the carrying value, as well as both positive and adverse events and circumstances, and the extent to which each of the events and circumstances identified may affect the comparison of a reporting unit’s fair value with its carrying value.
For reporting units where the qualitative assessment is not used, goodwill is tested for impairment using a two-step process. In the first step, the estimated fair value of a reporting unit is compared to its carrying value. If the estimated fair value of a reporting unit exceeds the carrying value of the net assets assigned to a reporting unit, goodwill is not considered impaired and no further testing is required. To derive the estimated fair value of reporting units, we primarily relied on an income approach. Under the income approach, estimated fair value is determined based on estimated future cash flows discounted by an estimated weighted-average cost of capital, which reflects the overall level of inherent risk of the reporting unit being measured. Estimated future cash flows are based on our internal projection model. Assumptions and estimates about future cash flows and discount rates are complex and often subjective. They can be affected by a variety of factors, including external factors such as industry and economic trends, and internal factors such as changes in our business strategy and our internal forecasts.
If the carrying value of the net assets assigned to a reporting unit exceeds the estimated fair value of a reporting unit, a second step of the impairment test is performed in order to determine the implied fair value of a reporting unit’s goodwill. Determining the implied fair value of goodwill requires valuation of a reporting unit’s tangible and intangible assets and liabilities in a manner similar to the allocation of purchase price in a business combination. If the carrying value of a reporting unit’s goodwill exceeds its implied fair value, goodwill is deemed impaired and is written down to the extent of the difference.
We completed our annual impairment test for all reporting units in the fourth quarter for the fiscal year ended 2013 and 2012 and determined that goodwill was not impaired. In 2013, we performed a qualitative assessment for the OCG and APAC PT reporting units, and a step one quantitative assessment for the Americas Commercial and Americas PT reporting units. In 2012, we performed a qualitative assessment for the Americas Commercial and Americas PT reporting units, and a step one quantitative assessment for the OCG and APAC PT reporting segments.
Our step one analysis used significant assumptions by segment, including: expected future revenue and expense growth rates, profit margins, cost of capital, discount rate and forecasted capital expenditures. For the step one analyses we performed in 2013, our revenue projections assumed modest growth. For the step one analyses we performed in 2012, our revenue projections assumed near-term growth consistent with current year results, followed by long-term modest growth. Although we believe the assumptions and estimates we have made are reasonable and appropriate, different assumptions and estimates could materially impact our reported financial results. Different assumptions of the anticipated future results and growth from these businesses could result in an impairment charge, which would decrease operating income and result in lower asset values on our consolidated balance sheet. A 10% reduction in our revenue growth rate assumptions would not result in the estimated fair value falling below book value for those reporting units where we performed a step one quantitative test.
At year-end 2013 and 2012, total goodwill amounted to $90.3 million and $89.5 million, respectively. (See the Goodwill footnote in the notes to our consolidated financial statements).
Litigation
Kelly is subject to legal proceedings and claims arising out of the normal course of business. Kelly routinely assesses the likelihood of any adverse judgments or outcomes to these matters, as well as ranges of probable losses. A determination of the amount of the accruals required, if any, for these contingencies is made after analysis of each known issue. Development of the analysis includes consideration of many factors including: potential exposure, the status of proceedings, negotiations, discussions with our outside counsel, results of similar litigation and, in the case of class action lawsuits, participation rates. The required accruals may change in the future due to new developments in each matter. For further discussion, see the Contingencies footnote in the notes to consolidated financial statements of this Annual Report on Form 10-K. At year-end 2013 and 2012, the gross accrual for litigation costs amounted to $6.9 million and $3.1 million, respectively, and related insurance recoveries totaled $3.1 million and $0.2 million, respectively.
Allowance for Uncollectible Accounts Receivable
We make ongoing estimates relating to the collectibility of our accounts receivable and maintain an allowance for estimated losses resulting from the inability of our customers to make required payments. In determining the amount of the allowance, we consider our historical level of credit losses and apply percentages to certain aged receivable categories. We also make judgments about the creditworthiness of significant customers based on ongoing credit evaluations,creditevaluations, and we monitor historical trends that might impact the level of credit losses in the future. Historically, losses from uncollectible accounts have not exceeded our allowance. Since we cannot predict with certainty future changes in the financial stability of our customers, actual future losses from uncollectible accounts may differ from our estimates. If the financial condition of our customers were to deteriorate, resulting in their inability to make payments, a larger allowance may be required.
In the event we determined that a smaller or larger allowance was appropriate, we would record a credit or a charge to SG&A expense in the period in which we made such a determination. In addition, for billing adjustments related to errors, service issues and compromises on billing disputes, we also include a provision for sales allowances, based on our historical experience, in our allowance for uncollectible accounts receivable. If sales allowances vary from our historical experience, an adjustment to the allowance may be required. As of year-end 2010required, and 2009, the allowance for uncollectible accounts receivable was $12.3 million and $15.0 million, respectively.
33
34
Certain statements contained in this report are “forward-looking”"forward-looking" statements within the meaning of the Private Securities Litigation Reform Act of 1995. Forward-looking statements include statements which are predictive in nature, which depend upon or refer to future events or conditions, or which include words such as “expects,"expects,” “anticipates,"anticipates,” “intends,"intends,” “plans,” “believes,"believes,” “estimates,” or variations or negatives thereof or by similar or comparable words or phrases. In addition, any statements concerning future financial performance (including future revenues, earnings or growth rates), ongoing business strategies or prospects, and possible future actions by us that may be provided by management, including oral statements or other written materials released to the public, are also forward-looking statements. Forward-looking statements are based on current expectations and projections about future events and are subject to risks, uncertainties and assumptions about our company and economic and market factors in the countries in which we do business, among other things. These statements are not guarantees of future performance, and we have no specific intention to update these statements.
Actual events and results may differ materially from those expressed or forecasted in forward-looking statements due to a number of factors. The principal important risk factors that could cause our actual performance and future events and actions to differ materially from such forward-looking statements include, but are not limited to, competitive market pressures including pricing and technology introductions, changing market and economic conditions, our ability to achieve our business strategy, our ability to retain the services of our senior management, local management and field personnel, our ability to adequately protect our intellectual property rights, including our brand, our ability to successfully expand intodevelop new marketsservice offerings, our exposure to risks associated with services outside traditional staffing, including business process outsourcing, the risks associated with past and service lines,future acquisitions, exposure to risks associated with investments in equity affiliates, material changes in demand from or loss of large corporate customers, further impairment charges initiated by adverse industry or market developments, unexpected termination of customer contracts,risks associated with conducting business in foreign countries, including foreign currency fluctuations, availability of temporary workers with appropriate skills required by customers, liabilities for employment-related claims and losses, including class action lawsuits unexpected changes in claim trends on workers’ compensation and benefit plans, our ability to maintain specified financial covenants in our bank facilities, our ability to access credit markets and continued availabilitycollective actions, liability for improper disclosure of financing for funding working capital,sensitive or private employee information, our ability to sustain critical business applications through our key data centers, our ability to effectively implement and manage our information technology programs, our ability to retainmaintain adequate financial and management processes and controls, impairment charges triggered by adverse industry or market developments, unexpected changes in claim trends on workers’ compensation, disability and medical benefit plans, the servicesnet financial impact of the Patient Protection and Affordable Care Act on our senior management, local management and field personnel,business, the impact of changes in laws and regulations (including federal, state and international tax laws), the netrisk of additional tax or unclaimed property liabilities in excess of our estimates, our ability to maintain specified financial impactcovenants in our bank facilities, our ability to access credit markets and continued availability of recent U.S. healthcare legislation on our business, and risks associated with conducting business in foreign countries, including foreign currency fluctuations. Certainfinancing for funding working capital.Certain risk factors are discussed more fully under “Risk Factors” in Part I, Item 1A of this report.
ITEM 7A. QUANTITATIVE AND QUALITATIVE DISCLOSURES ABOUT MARKET RISK.
35
In addition, we are exposed to interest rate risks through our use of the multi-currency line of credit and other borrowings. A hypothetical fluctuation of 10% of market interest rates would not have had a material impact on 20102013 earnings.
Marketable equity investments, representing our investment in Temp Holdings, are stated at fair value and marked to market through stockholders’ equity, net of tax. Impairments in value below historical cost, if any, deemed to be other than temporary, would be expensed in the consolidated statement of earnings. See the Fair Value Measurements footnote in the notesNotes to consolidated financial statementsConsolidated Financial Statements of this Annual Report on Form 10-K for further discussion.
We are exposed to market risk as a result of our obligation to pay benefits under our nonqualified deferred compensation plan and our related investments in company-owned variable universal life insurance policies. The obligation to employees increases and decreases based on movements in the equity and debt markets. The investments in mutual funds, as part of the company-owned variable universal life insurance policies, are designed to mitigate, but not eliminate, this risk with offsetting gains and losses.
Overall, our holdings and positions in market risk-sensitive instruments do not subject us to material risk.
36
ITEM 8. FINANCIAL STATEMENTS AND SUPPLEMENTARY DATA.
ITEM 9. CHANGES IN AND DISAGREEMENTS WITH ACCOUNTANTS ON ACCOUNTING AND FINANCIAL DISCLOSURE.
None.
ITEM 9A. CONTROLS AND PROCEDURES.
Conclusion Regarding the Effectiveness of Disclosure Controls and Procedures
Based on their evaluation as of the end of the period covered by this report, our Chief Executive Officer and Chief Financial Officer have concluded that our disclosure controls and procedures (as defined in Rules 13a-15(e) and 15d-15(e) under the Securities Exchange Act of 1934) are effective.
Management’s Report on Internal Control Over Financial Reporting
Management’s report on internal control over financial reporting is presented preceding the consolidated financial statements on page 44 of this report.
Attestation Report of Independent Registered Public Accounting Firm
PricewaterhouseCoopers LLP, independent registered public accounting firm, has audited the effectiveness of our internal control over financial reporting as of January 2, 2011December 29, 2013, as stated in their report which appears herein.
Changes in Internal Control Over Financial Reporting
There were no changes in our internal control over financial reporting that occurred during our fourth fiscal quarter that have materially affected, or are reasonably likely to materially affect, our internal control over financial reporting.
37
ITEM 9B. OTHER INFORMATION
None.
PART III
Information required by Part III with respect to Directors, Executive Officers and Corporate Governance (Item 10), Executive Compensation (Item 11), Security Ownership of Certain Beneficial Owners and Management and Related Stockholder Matters (Item 12), Certain Relationships and Related Transactions, and Director Independence (Item 13) and Principal Accounting Fees and Services (Item 14), except as set forth under the titles “Executive"Executive Officers of the Registrant”Registrant", which is included on page 38, and “Code of Business Conduct and Ethics,” which is included on page 39, (Item 10), and except as set forth under the title “Equity Compensation Plan Information,” which is included on page 39, (Item 12), is to be included in a definitive proxy statement filed not later than 120 days after the close of our fiscal year and the proxy statement, when filed, is incorporated in this report by reference.
ITEM 10. EXECUTIVE OFFICERS OF THE REGISTRANT.
Name/Office | Age | Served as an Officer Since | Business Experience During Last 5 Years | |||
Carl T. Camden President and Chief Executive Officer | 59 | 1995 | Served as officer of the Company. | |||
George S. Corona Executive Vice President and Chief Operating Officer | 55 | 2000 | Served as officer of the Company. | |||
Patricia Little Executive Vice President and Chief Financial Officer | 53 | 2008 | Served as officer of the Company. | |||
Michael S. Webster Executive Vice President and General Manager, Americas | 58 | 1996 | Served as officer of the Company. | |||
Teresa S. Carroll Senior Vice President and General Manager, Outsourcing and Consulting Group | 48 | 2000 | Served as officer of the Company. | |||
Michael E. Debs Senior Vice President, Controller and Chief Accounting Officer | 56 | 2000 | Served as officer of the Company. | |||
Peter W. Quigley Senior Vice President and General Counsel | 52 | 2004 | Served as officer of the Company. | |||
Antonina M. Ramsey Senior Vice President | 59 | 1992 | Served as officer of the Company. | |||
Natalia A. Shuman (1) Senior Vice President and General Manager, EMEA / APAC | 40 | 2007 | Served as officer of the Company. | |||
Leif Agnéus (2) Senior Vice President and General Manager, EMEA / APAC | 50 | 2002 | Served as officer of the Company. |
(1) | ||
Ms. Shuman assumed the position of Senior Vice President and General Manager, EMEA / APAC effective September 1, 2013. |
(2) | Mr. Agnéus terminated employment with the Company effective September 30, 2013. |
| Served as an | Business Experience | |||||
| Name/Office | Age | Officer Since | During Last 5 Years | |||
| Carl T. Camden President and Chief Executive Officer | 56 | 1995 | Served as officer of the Company. | |||
| George S. Corona Executive Vice President and Chief Operating Officer | 52 | 2000 | Served as officer of the Company. | |||
| Patricia Little Executive Vice President and Chief Financial Officer | 50 | 2008 | Served as officer of the Company since July 2008. Served in various key finance positions at Ford Motor Company from 1984 to 2008, most recently as general auditor (2006 — 2008) and director of global accounting (2002 — 2006). | |||
| Michael S. Webster Executive Vice President | 55 | 1996 | Served as officer of the Company. | |||
| Leif Agneus Senior Vice President and General Manager, EMEA | 47 | 2002 | Served as officer of the Company. | |||
| Michael E. Debs Senior Vice President, Controller and Chief Accounting Officer | 53 | 2000 | Served as officer of the Company. | |||
| Rolf E. Kleiner Senior Vice President | 56 | 1995 | Served as officer of the Company. | |||
| Daniel T. Lis Senior Vice President, General Counsel and Corporate Secretary | 64 | 2003 | Served as officer of the Company. | |||
| Antonina M. Ramsey Senior Vice President | 56 | 1992 | Served as officer of the Company. | |||
| Dhirendra Shantilal Senior Vice President and General Manager, APAC | 54 | 2000 | Served as officer of the Company. |
38
We have adopted a Code of Business Conduct and Ethics that applies to our directors, officers and employees, including our principal executive officer, principal financial officer and principal accounting officer or controller or persons performing similar functions. The Code of Business Conduct and Ethics is included as Exhibit 14 in the Index to Exhibits on page 75.77. We have posted our Code of Business Conduct and Ethics on our website at www.kellyservices.com.www.kellyservices.com. We intend to post any changes in or waivers from our Code of Business Conduct and Ethics applicable to any of these officers on our website.
ITEM 12. SECURITIES AUTHORIZED FOR ISSUANCE UNDER EQUITY COMPENSATION PLANS.
Equity Compensation Plan Information
The following table shows the number of shares of our Class A common stock that may be issued upon the exercise of outstanding options, warrants and rights, the weighted-average exercise price of outstanding options, warrants and rights, and the number of securities remaining available for future issuance under our equity compensation plans as of the fiscal year end for 2010.
| Number of securities | ||||||||||||
| remaining available | ||||||||||||
| for future issuance | ||||||||||||
| Number of securities | under equity | |||||||||||
| to be issued upon | Weighted-average | compensation plans | ||||||||||
| exercise of outstanding | exercise price of | (excluding securities | ||||||||||
| options, warrants | outstanding options, | reflected in the first | ||||||||||
| and rights | warrants and rights | column) (2) | ||||||||||
| Equity compensation plans approved by security holders (1) | 645,036 | $ | 25.32 | 2,143,304 | ||||||||
| Equity compensation plans not approved by security holders (3) | — | — | — | |||||||||
| Total | 645,036 | $ | 25.32 | 2,143,304 | ||||||||
Number of securities to be issued upon exercise of outstanding options, warrants and rights Weighted-average exercise price of outstanding options,warrants and rights Number of securities remaining available for future issuance under equity compensation plans (excluding securities reflected in the first column) (2) Equity compensation plansapproved by securityholders (1) Equity compensation plansnot approved by securityholders (3) Total 162,613 27.84 1,829,814 - - - 162,613 $ 27.84 1,829,814
(1) | ||
The equity compensation plans approved by our stockholders include our Equity Incentive Plan, Non-Employee | ||
The number of shares to be issued upon exercise of outstanding options, warrants and rights excludes |
(2) | The Equity Incentive Plan provides that the maximum number of shares available for grants, including stock options and restricted stock, | |
The Non-Employee | ||
The Non-Employee |
(3) | We have no equity compensation plans that have not been approved by our stockholders. |
PART IV
39
ITEM 15. EXHIBITS, FINANCIAL STATEMENT SCHEDULES.
(1) | Financial statements: | |
| Management’s Report on Internal Control Over Financial |
| Report of Independent Registered Public Accounting Firm | |||
| Consolidated Statements of Earnings for the three fiscal years ended December 29, 2013 | |||
| Consolidated Statements of Comprehensive Income for the three fiscal years ended December 29, 2013 | |||
| Consolidated Balance Sheets at December 29, 2013 and December 30, 2012 | |||
| Consolidated Statements of Stockholders' Equity for the three fiscal years ended December 29, 2013 | |||
| Consolidated Statements of Cash Flows for the three fiscal years ended December 29, 2013 | |||
| Notes to Consolidated Financial Statements | |||
| (2) | Financial Statement Schedule - |
| For the three fiscal years ended December 29, 2013: | |||
| Schedule II - Valuation Reserves | |||
| All other schedules are omitted because they are not applicable or the required information is shown in the financial statements or notes thereto. | |||
| (3) | The Exhibits are listed in the Index to Exhibits included beginning at page |
(b) | The Index to Exhibits and required Exhibits are included following the Financial Statement Schedule beginning at page |
(c) | None. |
40
Date: February | KELLY SERVICES, INC. | |||||
Registrant | ||||||
By | ||||||
/s/ P. Little | ||||||
P. Little | ||||||
Executive Vice President and | ||||||
| Chief Financial Officer |
Pursuant to the requirements of the Securities Exchange Act of 1934, this report has been signed below by the following persons on behalf of the registrant and in the capacities and on the dates indicated.
Date: February | * | T. E. Adderley | ||
T. E. Adderley | ||||
Executive Chairman of the Board and Director | ||||
Date: February | * | C. T. Camden | ||
C. T. Camden | ||||
President, Chief Executive Officer and Director | ||||
(Principal Executive Officer) | ||||
Date: February 13, 2014 | * | C. M. Adderley | ||
C. M. Adderley | ||||
Director | ||||
Date: February 13, 2014 | * | J. E. Dutton | ||
J. E. Dutton | ||||
Director | ||||
Date: February 13, 2014 | * | M. A. Fay, O.P. | ||
M. A. Fay, O.P. | ||||
Director | ||||
Date: February 13, 2014 | * | T. B. Larkin | ||
T. B. Larkin | ||||
Director | ||||
Date: February 13, 2014 | * | C. L. Mallett, Jr. | ||
C. L. Mallett, Jr. | ||||
Director | ||||
Date: February 13, 2014 | * | L. A. Murphy | ||
L. A. Murphy | ||||
Director | ||||
Date: February 13, 2014 | * | D. R. Parfet | ||
| Director | ||||
| Date: February | 13, 2014 | * | ||
| Director | ||||
| Date: February | 13, 2014 | * | ||
| B. J. White | ||||
| B. J. White | ||||
| Director |
41
Date: February | /s/ P. Little | |||||
P. Little | ||||||
Executive Vice President and Chief Financial Officer | ||||||
(Principal Financial Officer) | ||||||
Date: February 13, 2014 | /s/ M. E. Debs | |||||
M. E. Debs | ||||||
Senior Vice President, Controller and Chief Accounting Officer | ||||||
(Principal Accounting Officer) | ||||||
Date: February 13, 2014 | *By | /s/ P. Little | ||||
P. Little | ||||||
Attorney-in-Fact |
KELLY SERVICES, INC. AND SUBSIDIARIES
INDEX TO FINANCIAL STATEMENTS AND
SUPPLEMENTAL SCHEDULE
Page Reference in Report on Form 10-K | ||||||
42
44 | ||||
45 | ||||
| December 29, 2013 | 46 | |||
47 | ||||
Consolidated Balance Sheets at | 48 | |||
| December 29, 2013 | 49 | |||
| December 29, 2013 | 50 | |||
51 - | 74 | |||
| 75 | ||||
43
The management of Kelly Services, Inc. (the “Company”), is responsible for establishing and maintaining adequate internal control over financial reporting. Internal control over financial reporting is defined in Rules 13a-15(f) and 15d-15(f) promulgated under the Securities Exchange Act of 1934 as a process designed by, or under the supervision of, the Company’s principal executive and principal financial officers and effected by the Company’s board of directors, management and other personnel, to provide reasonable assurance regarding the reliability of financial reporting and the preparation of financial statements for external purposes in accordance with generally accepted accounting principles and includes those policies and procedures that:
● | Pertain to the maintenance of records that in reasonable detail accurately and fairly reflect the transactions and dispositions of the assets of the Company; |
● | Provide reasonable assurance that transactions are recorded as necessary to permit preparation of financial statements in accordance with generally accepted accounting principles, and that receipts and expenditures of the Company are being made only in accordance with authorizations of management and directors of the Company; |
● | Provide reasonable assurance regarding prevention or timely detection of unauthorized acquisition, use or disposition of the Company’s assets that could have a material effect on the financial statements. |
Because of its inherent limitations, internal control over financial reporting may not prevent or detect misstatements. Also, projections of any evaluation of effectiveness to future periods are subject to the risk that controls may become inadequate because of changes in conditions, or that the degree of compliance with the policies or procedures may change.
The Company’s management assessed the effectiveness of the Company’s internal control over financial reporting as of January 2, 2011.December 29, 2013. In making this assessment, the Company’s management used the criteria set forth by the Committee of Sponsoring Organizations of the Treadway Commission (COSO) in Internal Control-Integrated Framework.
Based on our assessment, management determined that, as of January 2, 2011,December 29, 2013, the Company’s internal control over financial reporting was effective based on those criteria.
The effectiveness of the Company’s internal control over financial reporting as of January 2, 2011December 29, 2013 has been audited by PricewaterhouseCoopers LLP, an independent registered public accounting firm, as stated in their report which appears on page 45.
44
To the Stockholders and Board of Directors of Kelly Services, Inc.:
In our opinion, the consolidated financial statements listed in the accompanying index appearing under Item 15(a)(1) present fairly, in all material respects, the financial position of Kelly Services, Inc. and its subsidiaries at January 2, 2011December 29, 2013 and January 3, 2010,December 30, 2012, and the results of their operations and their cash flows for each of the three fiscal years in the period ended January 2, 2011December 29, 2013 in conformity with accounting principles generally accepted in the United States of America. In addition, in our opinion, the financial statement schedule listed in the accompanying index appearing under Item 15(a)(2)presents fairly, in all material respects, the information set forth therein when read in conjunction with the related consolidated financial statements. Also in our opinion, the Company maintained, in all material respects, effective internal control over financial reporting as of January 2, 2011,December 29, 2013, based on criteria established inInternal Control —- Integrated Framework (1992)issued by the Committee of Sponsoring Organizations of the Treadway Commission (COSO). The Company’sCompany's management is responsible for these financial statements and financial statement schedule, for maintaining effective internal control over financial reporting and for its assessment of the effectiveness of internal control over financial reporting, included in Management’sManagement's Report on Internal Control over Financial Reporting. Our responsibility is to express opinions on these financial statements, on the financial statement schedule, and on the Company’sCompany's internal control over financial reporting based on our integrated audits. We conducted our audits in accordance with the standards of the Public Company Accounting Oversight Board (United States). Those standards require that we plan and perform the audits to obtain reasonable assurance about whether the financial statements are free of material misstatement and whether effective internal control over financial reporting was maintained in all material respects. Our audits of the financial statements included examining, on a test basis, evidence supporting the amounts and disclosures in the financial statements, assessing the accounting principles used and significant estimates made by management, and evaluating the overall financial statement presentation. Our audit of internal control over financial reporting included obtaining an understanding of internal control over financial reporting, assessing the risk that a material weakness exists, and testing and evaluating the design and operating effectiveness of internal control based on the assessed risk. Our audits also included performing such other procedures as we considered necessary in the circumstances. We believe that our audits provide a reasonable basis for our opinions.
A company’s internal control over financial reporting is a process designed to provide reasonable assurance regarding the reliability of financial reporting and the preparation of financial statements for external purposes in accordance with generally accepted accounting principles. A company’s internal control over financial reporting includes those policies and procedures that (i) pertain to the maintenance of records that, in reasonable detail, accurately and fairly reflect the transactions and dispositions of the assets of the company; (ii) provide reasonable assurance that transactions are recorded as necessary to permit preparation of financial statements in accordance with generally accepted accounting principles, and that receipts and expenditures of the company are being made only in accordance with authorizations of management and directors of the company; and (iii) provide reasonable assurance regarding prevention or timely detection of unauthorized acquisition, use, or disposition of the company’s assets that could have a material effect on the financial statements.
Because of its inherent limitations, internal control over financial reporting may not prevent or detect misstatements. Also, projections of any evaluation of effectiveness to future periods are subject to the risk that controls may become inadequate because of changes in conditions, or that the degree of compliance with the policies or procedures may deteriorate.
/s/PricewaterhouseCoopers LLP
PricewaterhouseCoopers LLP
Detroit, MI
Michigan
February 17, 201113, 2014
45
| 2010 | 2009 (1) | 2008 | ||||||||||
| (In millions of dollars except per share items) | ||||||||||||
Revenue from services | $ | 4,950.3 | $ | 4,314.8 | $ | 5,517.3 | ||||||
| Cost of services | 4,155.8 | 3,613.1 | 4,539.7 | |||||||||
Gross profit | 794.5 | 701.7 | 977.6 | |||||||||
| Selling, general and administrative expenses | 754.4 | 794.7 | 967.4 | |||||||||
| Asset impairments | 2.0 | 53.1 | 80.5 | |||||||||
Earnings (loss) from operations | 38.1 | (146.1 | ) | (70.3 | ) | |||||||
| Other expense, net | (5.4 | ) | (2.2 | ) | (3.4 | ) | ||||||
Earnings (loss) from continuing operations before taxes | 32.7 | (148.3 | ) | (73.7 | ) | |||||||
| Income taxes | 6.6 | (43.2 | ) | 8.0 | ||||||||
Earnings (loss) from continuing operations | 26.1 | (105.1 | ) | (81.7 | ) | |||||||
| Earnings (loss) from discontinued operations, net of tax | — | 0.6 | (0.5 | ) | ||||||||
Net earnings (loss) | $ | 26.1 | $ | (104.5 | ) | $ | (82.2 | ) | ||||
Basic earnings (loss) per share | ||||||||||||
| Earnings (loss) from continuing operations | $ | 0.71 | $ | (3.01 | ) | $ | (2.35 | ) | ||||
| Earnings (loss) from discontinued operations | — | 0.02 | (0.02 | ) | ||||||||
| Net earnings (loss) | $ | 0.71 | $ | (3.00 | ) | $ | (2.37 | ) | ||||
Diluted (loss) earnings per share | ||||||||||||
| Earnings (loss) from continuing operations | $ | 0.71 | $ | (3.01 | ) | $ | (2.35 | ) | ||||
| Earnings (loss) from discontinued operations | — | 0.02 | (0.02 | ) | ||||||||
| Net earnings (loss) | $ | 0.71 | $ | (3.00 | ) | $ | (2.37 | ) | ||||
| Dividends per share | $ | — | $ | — | $ | 0.54 | ||||||
| Average shares outstanding (millions): | ||||||||||||
| Basic | 36.1 | 34.9 | 34.8 | |||||||||
| Diluted | 36.1 | 34.9 | 34.8 | |||||||||
2013 | 2012 | 2011 | ||||||||||
(In millions of dollars except per share items) | ||||||||||||
Revenue from services | $ | 5,413.1 | $ | 5,450.5 | $ | 5,551.0 | ||||||
Cost of services | 4,523.6 | 4,553.9 | 4,667.7 | |||||||||
Gross profit | 889.5 | 896.6 | 883.3 | |||||||||
Selling, general andadministrative expenses | 834.5 | 821.2 | 825.6 | |||||||||
Asset impairments | 1.7 | 3.1 | - | |||||||||
Earnings from operations | 53.3 | 72.3 | 57.7 | |||||||||
Other expense, net | 4.5 | 3.5 | 0.1 | |||||||||
Earnings from continuing operationsbefore taxes | 48.8 | 68.8 | 57.6 | |||||||||
Income tax (benefit) expense | (10.1 | ) | 19.1 | (7.3 | ) | |||||||
Earnings from continuing operations | 58.9 | 49.7 | 64.9 | |||||||||
Earnings (loss) from discontinued operations, net of tax | - | 0.4 | (1.2 | ) | ||||||||
Net earnings | $ | 58.9 | $ | 50.1 | $ | 63.7 | ||||||
Basic earnings (loss) per share | ||||||||||||
Earnings from continuing operations | $ | 1.54 | $ | 1.31 | $ | 1.72 | ||||||
Earnings (loss) from discontinued operations | - | 0.01 | (0.03 | ) | ||||||||
Net earnings | $ | 1.54 | $ | 1.32 | $ | 1.69 | ||||||
Diluted earnings (loss) per share | ||||||||||||
Earnings from continuing operations | $ | 1.54 | $ | 1.31 | $ | 1.72 | ||||||
Earnings (loss) from discontinued operations | - | 0.01 | (0.03 | ) | ||||||||
Net earnings | $ | 1.54 | $ | 1.32 | $ | 1.69 | ||||||
Dividends per share | $ | 0.20 | $ | 0.20 | $ | 0.10 | ||||||
Average shares outstanding(millions): | ||||||||||||
Basic | 37.3 | 37.0 | 36.8 | |||||||||
Diluted | 37.3 | 37.0 | 36.8 | |||||||||
See accompanying Notes to Consolidated Financial Statements.
46
KELLY SERVICES, INC. AND SUBSIDIARIES
CONSOLIDATED BALANCE SHEETS
| 2010 | 2009 | |||||||
| (In millions of dollars) | ||||||||
ASSETS | ||||||||
Current Assets | ||||||||
| Cash and equivalents | $ | 80.5 | $ | 88.9 | ||||
| Trade accounts receivable, less allowances of $12.3 million and $15.0 million, respectively | 810.9 | 717.9 | ||||||
| Prepaid expenses and other current assets | 44.8 | 70.6 | ||||||
| Deferred taxes | 22.4 | 21.0 | ||||||
| Total current assets | 958.6 | 898.4 | ||||||
Property and Equipment | ||||||||
| Land and buildings | 59.0 | 58.8 | ||||||
| Computer hardware, software and other | 260.3 | 264.0 | ||||||
| Accumulated depreciation | (215.3 | ) | (195.7 | ) | ||||
| Net property and equipment | 104.0 | 127.1 | ||||||
Noncurrent Deferred Taxes | 84.0 | 77.5 | ||||||
Goodwill, net | 67.3 | 67.3 | ||||||
Other Assets | 154.5 | 142.2 | ||||||
Total Assets | $ | 1,368.4 | $ | 1,312.5 | ||||
LIABILITIES AND STOCKHOLDERS’ EQUITY | ||||||||
Current Liabilities | ||||||||
| Short-term borrowings and current portion of long-term debt | $ | 78.8 | $ | 79.6 | ||||
| Accounts payable and accrued liabilities | 181.6 | 182.6 | ||||||
| Accrued payroll and related taxes | 243.3 | 208.3 | ||||||
| Accrued insurance | 31.3 | 22.9 | ||||||
| Income and other taxes | 56.0 | 47.4 | ||||||
| Total current liabilities | 591.0 | 540.8 | ||||||
Noncurrent Liabilities | ||||||||
| Long-term debt | — | 57.5 | ||||||
| Accrued insurance | 53.6 | 54.9 | ||||||
| Accrued retirement benefits | 85.4 | 76.9 | ||||||
| Other long-term liabilities | 14.6 | 16.0 | ||||||
| Total noncurrent liabilities | 153.6 | 205.3 | ||||||
Stockholders’ Equity | ||||||||
| Capital stock, $1.00 par value | ||||||||
| Class A common stock, shares issued 36.6 million at 2010 and 2009 | 36.6 | 36.6 | ||||||
| Class B common stock, shares issued 3.5 million at 2010 and 2009 | 3.5 | 3.5 | ||||||
| Treasury stock, at cost | ||||||||
| Class A common stock, 3.4 million shares at 2010 and 5.1 million at 2009 | (70.3 | ) | (106.6 | ) | ||||
| Class B common stock | (0.6 | ) | (0.6 | ) | ||||
| Paid-in capital | 28.0 | 36.9 | ||||||
| Earnings invested in the business | 597.6 | 571.5 | ||||||
| Accumulated other comprehensive income | 29.0 | 25.1 | ||||||
| Total stockholders’ equity | 623.8 | 566.4 | ||||||
Total Liabilities and Stockholders’ Equity | $ | 1,368.4 | $ | 1,312.5 | ||||
2013 | 2012 | 2011 | ||||||||||
(In millions of dollars) | ||||||||||||
Net earnings | $ | 58.9 | $ | 50.1 | $ | 63.7 | ||||||
Other comprehensive income, net of tax: | ||||||||||||
Foreign currency translation adjustments, net of taxbenefit of $0.0, $0.4 and $0.6 million, respectively | (6.7 | ) | 4.9 | (8.0 | ) | |||||||
Less: Reclassification adjustments included innet earnings | (0.1 | ) | 0.7 | (1.6 | ) | |||||||
Foreign currency translation adjustments | (6.8 | ) | 5.6 | (9.6 | ) | |||||||
Unrealized gains (losses) on investment, net oftax expense of $16.2, $0.0 and $0.0 million, respectively | 31.2 | 13.1 | (2.1 | ) | ||||||||
Pension liability adjustments, net of tax expense of$0.2, $0.0 and $0.1 million, respectively | 1.4 | 0.3 | (1.2 | ) | ||||||||
Less: Reclassification adjustments included innet earnings | 0.2 | 0.2 | 0.1 | |||||||||
Pension liability adjustments | 1.6 | 0.5 | (1.1 | ) | ||||||||
Other comprehensive income (loss) | 26.0 | 19.2 | (12.8 | ) | ||||||||
Comprehensive Income | $ | 84.9 | $ | 69.3 | $ | 50.9 | ||||||
See accompanying Notes to Consolidated Financial Statements.
47
KELLY SERVICES, INC. AND SUBSIDIARIES
CONSOLIDATED BALANCE SHEETS
| 2010 | 2009 (1) | 2008 | ||||||||||
| (In millions of dollars) | ||||||||||||
Capital Stock | ||||||||||||
| Class A common stock | ||||||||||||
| Balance at beginning of year | $ | 36.6 | $ | 36.6 | $ | 36.6 | ||||||
| Conversions from Class B | — | — | — | |||||||||
| Balance at end of year | 36.6 | 36.6 | 36.6 | |||||||||
| Class B common stock | ||||||||||||
| Balance at beginning of year | 3.5 | 3.5 | 3.5 | |||||||||
| Conversions to Class A | — | — | — | |||||||||
| Balance at end of year | 3.5 | 3.5 | 3.5 | |||||||||
Treasury Stock | ||||||||||||
| Class A common stock | ||||||||||||
| Balance at beginning of year | (106.6 | ) | (110.6 | ) | (105.7 | ) | ||||||
| Sale of stock, exercise of stock options, restricted stock awards and other | 36.3 | 4.0 | 3.1 | |||||||||
| Purchase of treasury stock | — | — | (8.0 | ) | ||||||||
| Balance at end of year | (70.3 | ) | (106.6 | ) | (110.6 | ) | ||||||
| Class B common stock | ||||||||||||
| Balance at beginning of year | (0.6 | ) | (0.6 | ) | (0.6 | ) | ||||||
| Exercise of stock options, restricted stock awards and other | — | — | — | |||||||||
| Balance at end of year | (0.6 | ) | (0.6 | ) | (0.6 | ) | ||||||
Paid-in Capital | ||||||||||||
| Balance at beginning of year | 36.9 | 35.8 | 34.5 | |||||||||
| Sale of stock, exercise of stock options, restricted stock awards and other | (8.9 | ) | 1.1 | 1.3 | ||||||||
| Balance at end of year | 28.0 | 36.9 | 35.8 | |||||||||
Earnings Invested in the Business | ||||||||||||
| Balance at beginning of year | 571.5 | 676.0 | 777.3 | |||||||||
| Net earnings (loss) | 26.1 | (104.5 | ) | (82.2 | ) | |||||||
| Dividends | — | — | (19.1 | ) | ||||||||
| Balance at end of year | 597.6 | 571.5 | 676.0 | |||||||||
Accumulated Other Comprehensive Income | ||||||||||||
| Balance at beginning of year | 25.1 | 12.2 | 42.6 | |||||||||
| Foreign currency translation adjustments, net of tax | 3.6 | 12.3 | (29.7 | ) | ||||||||
| Unrealized gains on investments, net of tax | 1.0 | 1.6 | — | |||||||||
| Reclassification of unrealized losses on investments, net of tax to net earnings (loss) | — | — | 0.1 | |||||||||
| Pension liability adjustments, net of tax | (0.7 | ) | (1.0 | ) | (0.8 | ) | ||||||
| Balance at end of year | 29.0 | 25.1 | 12.2 | |||||||||
Stockholders’ Equity at end of year | $ | 623.8 | $ | 566.4 | $ | 652.9 | ||||||
Comprehensive Income | ||||||||||||
| Net earnings (loss) | $ | 26.1 | $ | (104.5 | ) | $ | (82.2 | ) | ||||
| Foreign currency translation adjustments, net of tax | 3.9 | 12.3 | (29.7 | ) | ||||||||
| Unrealized gains (losses) on investments, net of tax | 1.0 | 1.6 | (10.8 | ) | ||||||||
| Pension liability adjustments, net of tax | (0.8 | ) | (1.0 | ) | (0.8 | ) | ||||||
| Reclassification adjustments included in net earnings (loss) | (0.2 | ) | — | 10.9 | ||||||||
| Comprehensive Income | $ | 30.0 | $ | (91.6 | ) | $ | (112.6 | ) | ||||
2013 | 2012 | |||||||
(In millions of dollars) | ||||||||
ASSETS | ||||||||
Current Assets: | ||||||||
Cash and equivalents | $ | 125.7 | $ | 76.3 | ||||
Trade accounts receivable, less allowances of$9.9 million and $10.4 million, respectively | 1,023.1 | 1,013.9 | ||||||
Prepaid expenses and other current assets | 52.2 | 57.5 | ||||||
Deferred taxes | 35.5 | 44.9 | ||||||
Total current assets | 1,236.5 | 1,192.6 | ||||||
Property and Equipment: | ||||||||
Property and equipment | 350.5 | 337.6 | ||||||
Accumulated depreciation | (258.5 | ) | (247.7 | ) | ||||
Net property and equipment | 92.0 | 89.9 | ||||||
Noncurrent Deferred Taxes | 121.7 | 82.8 | ||||||
Goodwill, Net | 90.3 | 89.5 | ||||||
Other Assets | 258.1 | 180.9 | ||||||
Total Assets | $ | 1,798.6 | $ | 1,635.7 | ||||
LIABILITIES AND STOCKHOLDERS' EQUITY | ||||||||
Current Liabilities: | ||||||||
Short-term borrowings | $ | 28.3 | $ | 64.1 | ||||
Accounts payable and accrued liabilities | 342.4 | 295.6 | ||||||
Accrued payroll and related taxes | 294.9 | 264.5 | ||||||
Accrued insurance | 27.6 | 32.8 | ||||||
Income and other taxes | 68.8 | 65.3 | ||||||
Total current liabilities | 762.0 | 722.3 | ||||||
Noncurrent Liabilities: | ||||||||
Accrued insurance | 46.0 | 43.5 | ||||||
Accrued retirement benefits | 134.7 | 111.0 | ||||||
Other long-term liabilities | 33.3 | 17.9 | ||||||
Total noncurrent liabilities | 214.0 | 172.4 | ||||||
Commitments and contingencies (See Commitments andContingencies footnotes) | ||||||||
Stockholders' Equity: | ||||||||
Capital stock, $1.00 par value | ||||||||
Class A common stock, shares issued 36.6 millionat 2013 and 2012 | 36.6 | 36.6 | ||||||
Class B common stock, shares issued 3.5 millionat 2013 and 2012 | 3.5 | 3.5 | ||||||
Treasury stock, at cost | ||||||||
Class A common stock, 2.7 million shares at 2013and 2.9 million at 2012 | (55.6 | ) | (61.0 | ) | ||||
Class B common stock | (0.6 | ) | (0.6 | ) | ||||
Paid-in capital | 26.0 | 27.1 | ||||||
Earnings invested in the business | 751.3 | 700.0 | ||||||
Accumulated other comprehensive income | 61.4 | 35.4 | ||||||
Total stockholders' equity | 822.6 | 741.0 | ||||||
Total Liabilities and Stockholders' Equity | $ | 1,798.6 | $ | 1,635.7 | ||||
See accompanying Notes to Consolidated Financial Statements.
48
KELLY SERVICES, INC. AND SUBSIDIARIES
| 2010 | 2009 (1) | 2008 | ||||||||||
| (In millions of dollars) | ||||||||||||
Cash flows from operating activities | ||||||||||||
| Net earnings (loss) | $ | 26.1 | $ | (104.5 | ) | $ | (82.2 | ) | ||||
| Noncash adjustments: | ||||||||||||
| Impairment of assets | 2.0 | 53.1 | 80.5 | |||||||||
| Depreciation and amortization | 34.9 | 40.9 | 46.0 | |||||||||
| Provision for bad debts | 2.1 | 2.2 | 6.7 | |||||||||
| Stock-based compensation | 3.2 | 5.1 | 4.4 | |||||||||
| Deferred income taxes | (9.3 | ) | (31.0 | ) | 7.5 | |||||||
| Other, net | 0.5 | (2.2 | ) | 3.7 | ||||||||
| Changes in operating assets and liabilities | (17.7 | ) | 9.0 | 44.8 | ||||||||
Net cash from operating activities | 41.8 | (27.4 | ) | 111.4 | ||||||||
Cash flows from investing activities | ||||||||||||
| Capital expenditures | (11.0 | ) | (13.1 | ) | (31.1 | ) | ||||||
| Acquisition of companies, net of cash received | — | (7.5 | ) | (32.7 | ) | |||||||
| Other investing activities | (0.3 | ) | (2.8 | ) | (0.2 | ) | ||||||
Net cash from investing activities | (11.3 | ) | (23.4 | ) | (64.0 | ) | ||||||
Cash flows from financing activities | ||||||||||||
| Net change in short-term borrowings | (44.8 | ) | 52.7 | (34.2 | ) | |||||||
| Proceeds from debt | — | — | 42.5 | |||||||||
| Repayment of debt | (14.9 | ) | (30.5 | ) | — | |||||||
| Dividend payments | — | — | (19.1 | ) | ||||||||
| Purchase of treasury stock | — | — | (8.0 | ) | ||||||||
| Sale of stock and other financing activities | 24.4 | (2.6 | ) | 0.2 | ||||||||
Net cash from financing activities | (35.3 | ) | 19.6 | (18.6 | ) | |||||||
Effect of exchange rates on cash and equivalents | (3.6 | ) | 1.8 | (3.3 | ) | |||||||
Net change in cash and equivalents | (8.4 | ) | (29.4 | ) | 25.5 | |||||||
Cash and equivalents at beginning of year | 88.9 | 118.3 | 92.8 | |||||||||
Cash and equivalents at end of year | $ | 80.5 | $ | 88.9 | $ | 118.3 | ||||||
2013 | 2012 | 2011 | ||||||||||
(In millions of dollars) | ||||||||||||
Capital Stock | ||||||||||||
Class A common stock | ||||||||||||
Balance at beginning of year | $ | 36.6 | $ | 36.6 | $ | 36.6 | ||||||
Conversions from Class B | - | - | - | |||||||||
Balance at end of year | 36.6 | 36.6 | 36.6 | |||||||||
Class B common stock | ||||||||||||
Balance at beginning of year | 3.5 | 3.5 | 3.5 | |||||||||
Conversions to Class A | - | - | - | |||||||||
Balance at end of year | 3.5 | 3.5 | 3.5 | |||||||||
Treasury Stock | ||||||||||||
Class A common stock | ||||||||||||
Balance at beginning of year | (61.0 | ) | (66.3 | ) | (70.3 | ) | ||||||
Exercise of stock options, restricted stock and other | 5.4 | 5.3 | 4.0 | |||||||||
Balance at end of year | (55.6 | ) | (61.0 | ) | (66.3 | ) | ||||||
Class B common stock | ||||||||||||
Balance at beginning of year | (0.6 | ) | (0.6 | ) | (0.6 | ) | ||||||
Exercise of stock options, restricted stock and other | - | - | - | |||||||||
Balance at end of year | (0.6 | ) | (0.6 | ) | (0.6 | ) | ||||||
Paid-in Capital | ||||||||||||
Balance at beginning of year | 27.1 | 28.8 | 28.0 | |||||||||
Exercise of stock options, restricted stock and other | (1.1 | ) | (1.7 | ) | 0.8 | |||||||
Balance at end of year | 26.0 | 27.1 | 28.8 | |||||||||
Earnings Invested in the Business | ||||||||||||
Balance at beginning of year | 700.0 | 657.5 | 597.6 | |||||||||
Net earnings | 58.9 | 50.1 | 63.7 | |||||||||
Dividends | (7.6 | ) | (7.6 | ) | (3.8 | ) | ||||||
Balance at end of year | 751.3 | 700.0 | 657.5 | |||||||||
Accumulated Other Comprehensive Income | ||||||||||||
Balance at beginning of year | 35.4 | 16.2 | 29.0 | |||||||||
Other comprehensive income (loss), net of tax | 26.0 | 19.2 | (12.8 | ) | ||||||||
Balance at end of year | 61.4 | 35.4 | 16.2 | |||||||||
Stockholders' Equity at end of year | $ | 822.6 | $ | 741.0 | $ | 675.7 | ||||||
See accompanying Notes to Consolidated Financial Statements.
49
CONSOLIDATED STATEMENTS OF CASH FLOWS
2013 | 2012 | 2011 | ||||||||||
(In millions of dollars) | ||||||||||||
Cash flows from operating activities: | ||||||||||||
Net earnings | $ | 58.9 | $ | 50.1 | $ | 63.7 | ||||||
Noncash adjustments: | ||||||||||||
Impairment of assets | 1.7 | 3.1 | - | |||||||||
Depreciation and amortization | 20.4 | 22.3 | 31.4 | |||||||||
Provision for bad debts | 2.0 | 1.1 | 4.3 | |||||||||
Stock-based compensation | 3.8 | 4.8 | 4.6 | |||||||||
Deferred income taxes | (31.3 | ) | 4.7 | (27.3 | ) | |||||||
Other, net | 0.6 | 1.3 | (2.6 | ) | ||||||||
Changes in operating assets and liabilities | 59.2 | (26.3 | ) | (55.0 | ) | |||||||
Net cash from operating activities | 115.3 | 61.1 | 19.1 | |||||||||
Cash flows from investing activities: | ||||||||||||
Capital expenditures | (20.0 | ) | (21.5 | ) | (15.4 | ) | ||||||
Investment in equity affiliate | - | (6.6 | ) | - | ||||||||
Acquisition of companies, net of cash received | - | - | (6.5 | ) | ||||||||
Other investing activities | (0.8 | ) | - | 1.2 | ||||||||
Net cash used in investing activities | (20.8 | ) | (28.1 | ) | (20.7 | ) | ||||||
Cash flows from financing activities: | ||||||||||||
Net change in short-term borrowings | (35.8 | ) | (31.9 | ) | 79.2 | |||||||
Repayment of debt | - | - | (68.3 | ) | ||||||||
Dividend payments | (7.6 | ) | (7.6 | ) | (3.8 | ) | ||||||
Other financing activities | (0.3 | ) | 0.1 | (1.0 | ) | |||||||
Net cash (used in) provided by financing activities | (43.7 | ) | (39.4 | ) | 6.1 | |||||||
Effect of exchange rates on cash and equivalents | (1.4 | ) | 1.7 | (4.0 | ) | |||||||
Net change in cash and equivalents | 49.4 | (4.7 | ) | 0.5 | ||||||||
Cash and equivalents at beginning of year | 76.3 | 81.0 | 80.5 | |||||||||
Cash and equivalents at end of year | $ | 125.7 | $ | 76.3 | $ | 81.0 | ||||||
See accompanying Notes to Consolidated Financial Statements.
KELLY SERVICES, INC. AND SUBSIDIARIES
NOTES TO CONSOLIDATED FINANCIAL STATEMENTS
1. Summary of Significant Accounting Policies
Nature of OperationsKelly Services, Inc. is a global workforce solutions provider operating throughout the world.
Fiscal YearThe Company’sCompany's fiscal year ends on the Sunday nearest to December 31. The three most recent years ended on December 29, 2013 (2013), December 30, 2012 (2012) and January 2, 2011 (2010,1, 2012 (2011), respectively, all of which contained 52 weeks), January 3, 2010 (2009, which contained 53 weeks) and December 28, 2008 (2008, which contained 52 weeks)weeks. The Company’s operations in Brazil are accounted for on a one-month lag. The Company’s equity investment in TS Kelly Workforce Solutions is accounted for on a one-quarter lag (see Investment in Equity Affiliate footnote). Any material transactions in the intervening period are disclosed or accounted for in the current reporting period. Period costs included in selling, general and administrative (“SG&A”) expenses are recorded on a calendar-year basis.
Principles of ConsolidationThe consolidated financial statements include the accounts and operations of the Company and its wholly owned subsidiaries. All significant intercompany accounts and transactions have been eliminated.
Available-For-Sale InvestmentAvailable-for-sale investments areThe Company’s available-for-sale investment, as further described in the Fair Value Measurements footnote, is carried at fair value with the unrealized gains or losses, net of tax, included as a component of accumulated other comprehensive income (loss) in stockholders’ equity. Realized gains and losses and declines in value below cost judged to be other-than-temporary on such securities are included as a component of asset impairments expense in the consolidated statement of earnings. The fair valuesvalue of the available-for-sale investments areinvestment is based on quoted market prices.
Foreign Currency TranslationAll of the Company’s international subsidiaries use their local currency as their functional currency. Revenue and expense accounts of foreign subsidiaries are translated to U.S. dollars at average exchange rates, while assets and liabilities are translated to U.S. dollars at year-end exchange rates. Resulting translation adjustments, net of deferred taxes,tax, where applicable, are reported as accumulated foreign currency translation adjustments in stockholders’ equity and are recorded as a component of accumulated other comprehensive income.
Revenue RecognitionRevenue from services is recognized as services are provided by the temporary or contract employees. Revenue from permanent placement services is recognized at the time the permanent placement candidate begins full-time employment. Revenue from other staffing fee-based consulting services is recognized when the services are provided. Provisions for sales allowances (billing adjustments related to errors, service issues and compromises on billing disputes), based on historical experience, are recognized at the time the related sale is recognized as a reduction in revenue from services.
Allowance for Uncollectible Accounts ReceivableThe Company records an allowance for uncollectible accounts receivable based on historical loss experience, customer payment patterns and current economic trends. The reserve for sales allowances, as discussed above, is also included in the allowance for uncollectible accounts receivable. The Company reviews the adequacy of the allowance for uncollectible accounts receivable on a quarterly basis and, if necessary, increases or decreases the balance by recording a charge or credit to SG&A expenses.
Cost of ServicesCost of services are those costs directly associated with the earning of revenue. The primary examples of these types of costs are temporary employee wages, along with associated payroll taxes, temporary employee benefits, such as service bonus and holiday pay, and workers’ compensation costs. These costs differ fundamentally from SG&A expenses in that they arise specifically from the action of providing our services to customers whereas SG&A costs are incurred regardless of whether or not we place temporary employees with our customers.
Advertising ExpensesAdvertising expenses from continuing operations, which are expensed as incurred and are included in SG&A expenses, were $7.0$8.9 million in 2010, $7.12013, $8.5 million in 20092012 and $11.1$7.5 million in 2008.2011.
KELLY SERVICES, INC. AND SUBSIDIARIES
NOTES TO CONSOLIDATED FINANCIAL STATEMENTS (continued)
1. Summary of Significant Accounting Policies (continued)
Use of EstimatesThe preparation of financial statements in conformity with generally accepted accounting principles requires management to make estimates and assumptions that affect the reported amounts in the consolidated financial statements and accompanying notes. Estimates are used for, but not limited to, the accounting for the allowance for uncollectible accounts receivable, workers’ compensation, goodwill and long-lived asset impairment, litigation costs and income taxes. Actual results could differ materially from those estimates.
50
Property and EquipmentProperty and equipment are stated at cost and are depreciated on a straight-line basis over their estimated useful lives, principally by the straight-line method.lives. Cost and estimated useful lives of property and equipment by function are as follows:
| Category | 2010 | 2009 | Life | |||||||
| (In millions of dollars) | ||||||||||
| Land | $ | 3.8 | $ | 3.8 | — | |||||
| Work in process | 7.0 | 8.2 | — | |||||||
| Buildings and improvements | 55.2 | 55.0 | 15 to 45 years | |||||||
| Computer hardware and software | 183.4 | 181.0 | 3 to 12 years | |||||||
| Equipment, furniture and fixtures | 33.9 | 36.9 | 5 years | |||||||
| Leasehold improvements | 36.0 | 37.9 | The lesser of the life of the lease or 5 years. | |||||||
| Total property and equipment | $ | 319.3 | $ | 322.8 | ||||||
Category 2013 2012 Life (In millions of dollars) Land Work in process Buildings and improvements Computer hardware and software Equipment, furniture and fixtures Leasehold improvements The lesser of the life of thelease or 5 years. Total property and equipment $ 3.8 $ 3.8 - 4.4 7.2 - 58.9 56.5 15 to 45 years 215.7 202.3 3 to 12 years 33.6 33.0 5 years 34.1 34.8 $ 350.5 $ 337.6
The Company capitalizes external costs and internal payroll costs directly incurred in the development of software for internal use as required by the Internal-Use Software Subtopic of the Financial Accounting Standards Board (“FASB”) Accounting Standards Codification (“ASC”). Work in process represents capitalized costs for internal use software not yet in service and is included with computer hardware, software and other on the consolidated balance sheet.service. Depreciation expense from continuing operations was $31.3$18.4 million for 2010, $36.02013, $19.0 million for 20092012 and $41.4$28.9 million for 2008.
Operating LeasesThe Company recognizes rent expense on a straight-line basis over the lease term. This includes the impact of both scheduled rent increases and free or reduced rents (commonly referred to as “rent holidays”). The Company records allowances provided by landlords for leasehold improvements as deferred rent in the consolidated balance sheet and as operating cash flows in the consolidated statement of cash flows.
Goodwill and Other Intangible AssetsGoodwill represents the excess of the purchase price over the fair value of net assets acquired. Purchased intangible assets with definite lives are recorded at estimated fair value at the date of acquisition and are amortized over their respective useful lives (from 3 to 15 years) on a straight-line basis or, if appropriate, on an accelerated basis commensurate with the related cash flows.
Impairment of Long-Lived Assets and Intangible AssetsThe Company evaluates long-lived assets and intangible assets with definite lives for impairment whenever events or changes in circumstances indicate that the carrying amount of an asset may not be recoverable. When estimated undiscounted future cash flows will not be sufficient to recover an asset’sthe asset group’s carrying amount, in which the long-lived asset being tested for impairment resides, the asset is written down to its estimated fair value. Assets to be disposed of by sale, if any, are reported at the lower of the carrying amount or estimated fair value less cost to sell.
We test goodwill for impairment at the reporting unit level annually and whenever events or circumstances make it more likely than not that an impairment may have occurred. We have determined that our reporting units are the same as our operating and reportable segments based on our organizational structure and the financial information that is provided to and reviewed by management. GoodwillWe may use a qualitative assessment for one or more reporting units for the annual goodwill impairment test if we have determined that it is more likely than not that the fair value of the reporting unit(s) is more than their carrying value.
KELLY SERVICES, INC. AND SUBSIDIARIES
NOTES TO CONSOLIDATED FINANCIAL STATEMENTS (continued)
1. Summary of Significant Accounting Policies (continued)
For reporting units where the qualitative assessment is not used, goodwill is tested for impairment using a two-step process. In the first step, the estimated fair value of a reporting unit is compared to its carrying value. If the estimated fair value of a reporting unit exceeds the carrying value of the net assets assigned to a reporting unit, goodwill is not considered impaired and no further testing is required.
If the carrying value of the net assets assigned to a reporting unit exceeds the estimated fair value of a reporting unit, a second step of the impairment test is performed in order to determine the implied fair value of a reporting unit’s goodwill. If the carrying value of a reporting unit’s goodwill exceeds its implied fair value, goodwill is deemed impaired and is written down to the extent of the difference.
51
Accrued Payroll and Related TaxesIncluded in accrued payroll and related taxes are outstanding checks in excess of funds on deposit. Such amounts totaled $6.4$4.0 million and $6.3$5.3 million at year-end 20102013 and 2009,2012, respectively. Payroll taxes for temporary employees are recognized proportionately to direct wages for interim periods based on expected full-year amounts.
Income TaxesThe Company accounts for income taxes using the liability method. Under this method, deferred tax assets and liabilities are recognized for the expected tax consequences of temporary differences between the tax bases of assets and liabilities and their reported amounts. Valuation allowances are provided against deferred tax assets when it is more likely than not that some portion or all of the deferred tax asset will not be realized.
Uncertain tax positions that are taken or expected to be taken in a tax return are recognized in the financial statements when it is more likely than not (i.e., a likelihood of more than fifty percent) that the position would be sustained upon examination by tax authorities that have full knowledge of all relevant information. A recognized tax position is then measured at the largest amount of benefit that is greater than fifty percent likely of being realized upon ultimate settlement.
Interest and penalties related to income taxes are accounted for as income tax expense.
Stock-Based CompensationThe Companymay grant restricted stock awards and units (collectively, “restricted stock”), stock options (both incentive and nonqualified), stock appreciation rights and performance awards to key employees utilizingassociated with the Company’s Class A stock. Thestock.The Company utilizes the market price on the date of grant as the fair market value for restricted stock awards and estimates the fair value of stock option awards on the date of grant using an option-pricing model. The value of awards that are ultimately expected to vest is recognized as expense over the requisite service periods in SG&A expense in the Company’s consolidated statements of earnings.
Earnings Per ShareRestricted stock awards that entitle their holders to receive nonforfeitable dividends before vesting are considered participating securities and, therefore, are included in the calculation of earnings per share using the two-class method. The two-class method is an earnings allocation formula that determines earnings per share for each class of common stock and participating security according to dividends declared and participation rights in undistributed earnings. Under this method, earnings from continuing operations (or net earnings) is reduced by the amount of dividends declared, and the remaining undistributed earnings is allocated to common stock and participating securities based on the proportion of each class’s weighted average shares outstanding to the total weighted average shares outstanding. The calculation of diluted earnings per share includes the effect of potential common shares outstanding in the average weighted shares outstanding.
KELLY SERVICES, INC. AND SUBSIDIARIES
NOTES TO CONSOLIDATED FINANCIAL STATEMENTS (continued)
1. Summary of Significant Accounting Policies (continued)
Workers’ CompensationThe Company establishes accruals for workers’ compensation claims utilizing actuarial methods to estimate the undiscounted future cash payments that will be made to satisfy the claims. The estimates are based both on historical experience as well as current legal, economic and regulatory factors. When claims exceed the applicable loss limit or self-insured retention and realization of recovery of the claim from existing insurance policies is deemed probable, the Company records a receivable from the insurance company for the excess amount. The receivable is included in prepaid expenses and other current assets and other assets in the consolidated balance sheet at the 2013 year end and in other assets at the 2012 year end. The Company regularly updates its estimates, and the ultimate cost of these claims may be greater than or less than the established accrual. During 2010, the Company revised its estimate of the cost of outstanding workers’ compensation claims and, accordingly, reduced expense by $5.2 million. This compares to adjustments reducing prior year workers’ compensation claims by $2.8 million in 2009 and $12.7 million in 2008.
52
Trade accounts receivable, accounts payable, accrued liabilities, accrued payroll and related taxes and short-term borrowings approximate their fair values due to the short-term maturities of these assets and liabilities. As of January 2, 2011 and January 3, 2010, the carrying value of long-term debt (see Debt footnote), approximates the fair value. All long-term debt is classified as current as of January 2, 2011.
Assets Measured at Fair Value on a Recurring Basis
The following tables present the assets carried at fair value as of January 2, 2011year-end 2013 and January 3, 20102012 on the consolidated balance sheet by fair value hierarchy level, as described below. The Company carried no liabilities at fair value as of January 2, 2011 and January 3, 2010.
| Fair Value Measurements on a Recurring Basis | ||||||||||||||||
| As of January 2, 2011 | ||||||||||||||||
| Description | Total | Level 1 | Level 2 | Level 3 | ||||||||||||
| (In millions of dollars) | ||||||||||||||||
| Money market funds | $ | 4.1 | $ | 4.1 | $ | — | $ | — | ||||||||
| Available-for-sale investment | 27.8 | 27.8 | — | — | ||||||||||||
| Forward exchange contracts, net | 0.7 | — | 0.7 | — | ||||||||||||
| Total assets at fair value | $ | 32.6 | $ | 31.9 | $ | 0.7 | $ | — | ||||||||
| Fair Value Measurements on a Recurring Basis | ||||||||||||||||
| As of January 3, 2010 | ||||||||||||||||
| Description | Total | Level 1 | Level 2 | Level 3 | ||||||||||||
| (In millions of dollars) | ||||||||||||||||
| Money market funds | $ | 1.0 | $ | 1.0 | $ | — | $ | — | ||||||||
| Available-for-sale investment | 23.6 | 23.6 | — | — | ||||||||||||
| Total assets at fair value | $ | 24.6 | $ | 24.6 | $ | — | $ | — | ||||||||
Level 1 measurements consist of unadjusted quoted prices in active markets for identical assets or liabilities. Level 2 measurements include quoted prices in markets that are not active or model inputs that are observable either directly or indirectly for substantially the full term of the asset or liability. Level 3 measurements include significant unobservable inputs.
Fair Value Measurements on a Recurring Basis As of Year-End 2013 Description Total Level 1 Level 2 Level 3 (In millions of dollars) Money market funds Available-for-sale investment Total assets at fair value $ 2.9 $ 2.9 $ - $ - 80.7 80.7 - - $ 83.6 $ 83.6 $ - $ -
Fair Value Measurements on a Recurring Basis As of Year-End 2012 Description Total Level 1 Level 2 Level 3 (In millions of dollars) Money market funds Available-for-sale investment Total assets at fair value $ 2.3 $ 2.3 $ - $ - 37.7 37.7 - - $ 40.0 $ 40.0 $ - $ -
Money market funds as of January 2, 2011 represent investments in money market accounts, of which $2.9 million is included in cashyear-end 2013 and equivalents and $1.2 million of restricted cash is included in prepaid expenses and other current assets on the consolidated balance sheet. Money market funds as of January 3, 20102012 represent investments in money market accounts, all of which are restricted cashas to use and are included in other assets on the consolidated balance sheet as of year-end 2013 and prepaid expenses and other current assets on the consolidated balance sheet.as of year-end 2012. The valuations were based on quoted market prices of those accounts as of the respective period end.
KELLY SERVICES, INC. AND SUBSIDIARIES
NOTES TO CONSOLIDATED FINANCIAL STATEMENTS (continued)
2. Fair Value Measurements (continued)
Available-for-sale investment represents the Company’s investment in Temp Holdings Co., Ltd. (“Temp Holdings”) and is included in other assets on the consolidated balance sheet. Thesheet.The valuation is based on the quoted market price of Temp Holdings stock on the Tokyo Stock Exchange as of the period end. The unrealized gain of $1.0$30.1 million pretax and net of tax for the year ended January 2, 20112013 and $1.6$13.1 million pretax and net of tax for the year ended January 3, 2010 was2012 were recorded in other comprehensive income, as well as in accumulated other comprehensive income, a component of stockholders’ equity.
53
We completed our annual impairment test for all reporting units in the fourth quarter for the yearfiscal years ended January 2, 20112013 and 2012 and determined that goodwill was not impaired. The
In 2013, we completed a qualitative assessment for the annual goodwill impairment test for the OCG and APAC PT reporting units. In 2012, we completed a qualitative assessment for the annual goodwill impairment test for the Americas Commercial and Americas PT reporting units. As a result of these qualitative assessments, we determined it was more likely than not that the fair value of each of the reporting units was more than its carrying value. In conducting the qualitative assessment, we assessed the totality of relevant events and circumstances that affect the fair value or carrying value of a reporting unit. Such events and circumstances included macroeconomic conditions, industry and competitive environment considerations, overall financial performance, reporting unit specific events and market considerations. We considered recent valuations of our reporting units, including the magnitude of the difference between the most recent fair value estimate and the carrying value. We considered both positive and adverse events and circumstances and assessed the extent to which each of the events and circumstances identified affected the comparison of a reporting unit's fair value with its carrying value.
In 2013, we completed a step one quantitative test for the Americas Commercial and Americas PT reporting units. In 2012, we completed a step one quantitative test for the OCG and APAC PT reporting units. For both years, the estimated fair value of each reporting unit significantlytested exceeded its related carrying value.
During the second quarter of 2009, due to significantly worse than anticipated economic conditions and the impacts to our business, we revised our internal forecasts for all of our segments, which we deemed to be2013, a triggering event for purposesthe evaluation of assessing goodwill for impairment. Accordingly, goodwill at all of our reporting units was testedcertain long-lived assets for impairment occurred as the Company made the decision to exit the executive search business operating in an asset group within Germany that was associated with the OCG business segment. Based on the Company’s estimates as of the 2013 second quarter end, a $1.7 million reduction in the second quartercarrying value of 2009. As a result, we recorded a goodwill impairment loss of $50.5 million, of which $16.4 million related to the Americas Commercial reporting unit, $22.0 million related to the EMEA PT reporting unit and $12.1 million related to the APAC Commercial reporting unit.OCG intangible assets was recorded. The resulting expense was recorded in the asset impairments line on the consolidated statement of earnings.
In 2012, management made the carrying value of an asset may not be recoverable, based on estimated undiscounted future cash flows. The Company’s estimates as of June 28, 2009 resulted in a $2.1 million reductiondecision to abandon the PeopleSoft billing system implementation project in the carrying valueU.S., Canada and Puerto Rico and accordingly, recorded impairment charges of long-lived assets and intangible assets in Japan. Additionally, the Company’s estimates as of September 27, 2009 resulted in a $0.5$3.1 million reduction in the carrying value of long-lived assets and intangible assets in Europe.representing previously capitalized costs associated with this project.
54
3. Acquisition
In the fourth quarter of 2008. This expense was recorded2011, we acquired the stock of Tradição Planejamento e Tecnologia de Serviços S.A. and Tradição Tecnologia e Serviços Ltda. (collectively, “Tradição”), a national service provider in Brazil. Tradição is included the Americas Commercial operating segment.
Included in the asset impairments lineassets purchased was approximately $5.0 million of intangible assets associated with customer lists. These assets are being amortized over approximately 7 years based on the expected cash flows and will have no residual value. Acquisition adjustments totaling $0.8 million were identified during the measurement period and recorded to our consolidated statement of earnings. Additionally, the Company tested its long-lived assetsbalance sheet in 2013. These adjustments, which related to changes in Tradição’s estimated tax liabilities assumed, are included in the U.K. for impairment as of December 28, 2008, resulting in an impairment charge of $11.4 million, which was recorded in the asset impairments line of the Company’s consolidated statement of earnings. The impairment primarily included computer software and leasehold improvements.
| Balance as of December 28, 2008 | $ | 4.1 | ||
| Additions charged to operations | 29.9 | |||
| Noncash charges | (1.6 | ) | ||
| Reductions for cash payments | (19.7 | ) | ||
| Balance as of January 3, 2010 | $ | 12.7 | ||
| Additions charged to operations | 7.2 | |||
| Noncash charges | (0.1 | ) | ||
| Reductions for cash payments | (15.1 | ) | ||
| Balance as of January 2, 2011 | $ | 4.7 | ||
55
4. Investment in Equity Affiliate
In 2012, we purchased the remaining 30% noncontrolling interest in our China subsidiaries, and recorded a charge to paid-in capital of $1.2 million for the fiscal year 2010. difference between the carrying value of the noncontrolling interest and the fair value of the consideration provided.
On July 24, 2012, we entered into an agreement with Temp Holdings Co., Ltd. (“Temp Holdings”) to form a venture, TS Kelly Workforce Solutions (“TS Kelly”), in order to expand both companies’ presence in North Asia. On November 1, 2012, we contributed our China, Hong Kong and South Korea subsidiaries in exchange for a 49% ownership interest in TS Kelly. Consequently, we deconsolidated the operations of those entities and recorded a $5.1 million investment in other assets on the consolidated balance sheet, which represented the estimated fair value of our ownership interest in TS Kelly at year-end 2012. The operating results of our interest in TS Kelly are accounted for on a one-quarter lag under the equity method; accordingly, our consolidated financial statements include operating results for TS Kelly beginning in 2013. Our 49% share of TS Kelly’s operating results is recorded in other expense, net in the consolidated statement of earnings (see Other Expense, Net footnote).
In 2012, we recorded a loss of $0.7 million in other expense, net, which represented the difference between the carrying value of net assets contributed to the venture and the fair value of our retained investment in TS Kelly. As part of this transaction, we allocated a pro-rata share of goodwill related to the contributed entities in our APAC PT and OCG segments amounting to $0.6 million.
The amount due to or due from TS Kelly was immaterial as of year-end 2013 and 2012.
KELLY SERVICES, INC. AND SUBSIDIARIES
NOTES TO CONSOLIDATED FINANCIAL STATEMENTS (continued)
5. Goodwill
The changes in the net carrying amount of goodwill for the fiscal year 2009 were as follows:years 2013 and 2012 are included in the tables below. See Acquisition footnote for a description of adjustments to Americas Commercial goodwill and Investment in Equity Affiliate footnote for a description of adjustments to APAC PT and OCG goodwill.
As of Year-End 2012 As of Year-End 2013 Goodwill, Gross Accumulated Impairment Losses Adjustments to Goodwill Goodwill, Gross Accumulated Impairment Losses Goodwill, Net (In millions of dollars) Americas Americas Commercial Americas PT Total Americas EMEA EMEA Commercial EMEA PT Total EMEA APAC APAC Commercial APAC PT Total APAC OCG Consolidated Total $ 39.2 $ (16.4 ) $ 0.8 $ 40.0 $ (16.4 ) $ 23.6 39.2 - - 39.2 - 39.2 78.4 (16.4 ) 0.8 79.2 (16.4 ) 62.8 50.4 (50.4 ) - 50.4 (50.4 ) - 22.0 (22.0 ) - 22.0 (22.0 ) - 72.4 (72.4 ) - 72.4 (72.4 ) - 12.1 (12.1 ) - 12.1 (12.1 ) - 1.4 - - 1.4 - 1.4 13.5 (12.1 ) - 13.5 (12.1 ) 1.4 26.1 - - 26.1 - 26.1 $ 190.4 $ (100.9 ) $ 0.8 $ 191.2 $ (100.9 ) $ 90.3
As of Year-End 2011 As of Year-End 2012 Goodwill, Gross Accumulated Impairment Losses Adjustments to Goodwill Goodwill, Gross Accumulated Impairment Losses Goodwill, Net (In millions of dollars) Americas Americas Commercial Americas PT Total Americas EMEA EMEA Commercial EMEA PT Total EMEA APAC APAC Commercial APAC PT Total APAC OCG Consolidated Total $ 39.3 $ (16.4 ) $ (0.1 ) $ 39.2 $ (16.4 ) $ 22.8 39.2 - - 39.2 - 39.2 78.5 (16.4 ) (0.1 ) 78.4 (16.4 ) 62.0 50.4 (50.4 ) - 50.4 (50.4 ) - 22.0 (22.0 ) - 22.0 (22.0 ) - 72.4 (72.4 ) - 72.4 (72.4 ) - 12.1 (12.1 ) - 12.1 (12.1 ) - 1.8 - (0.4 ) 1.4 - 1.4 13.9 (12.1 ) (0.4 ) 13.5 (12.1 ) 1.4 26.3 - (0.2 ) 26.1 - 26.1 $ 191.1 $ (100.9 ) $ (0.7 ) $ 190.4 $ (100.9 ) $ 89.5
| Goodwill, Net | Accumulated Impairment Losses | |||||||||||||||||||||||
| Balance | Balance | Balance | Balance | |||||||||||||||||||||
| as of | Impairment | as of | as of | Impairment | as of | |||||||||||||||||||
| Dec. 28, 2008 | Losses | Jan. 3, 2010 | Dec. 28, 2008 | Losses | Jan. 3, 2010 | |||||||||||||||||||
| (In millions of dollars) | (In millions of dollars) | |||||||||||||||||||||||
Americas | ||||||||||||||||||||||||
| Americas Commercial | $ | 16.4 | $ | (16.4 | ) | $ | — | $ | — | $ | (16.4 | ) | $ | (16.4 | ) | |||||||||
| Americas PT | 39.2 | — | 39.2 | — | — | — | ||||||||||||||||||
| Total Americas | 55.6 | (16.4 | ) | 39.2 | — | (16.4 | ) | (16.4 | ) | |||||||||||||||
EMEA | ||||||||||||||||||||||||
| EMEA Commercial | — | — | — | (50.4 | ) | — | (50.4 | ) | ||||||||||||||||
| EMEA PT | 22.0 | (22.0 | ) | — | — | (22.0 | ) | (22.0 | ) | |||||||||||||||
| Total EMEA | 22.0 | (22.0 | ) | — | (50.4 | ) | (22.0 | ) | (72.4 | ) | ||||||||||||||
APAC | ||||||||||||||||||||||||
| APAC Commercial | 12.1 | (12.1 | ) | — | — | (12.1 | ) | (12.1 | ) | |||||||||||||||
| APAC PT | 1.8 | — | 1.8 | — | — | — | ||||||||||||||||||
| Total APAC | 13.9 | (12.1 | ) | 1.8 | — | (12.1 | ) | (12.1 | ) | |||||||||||||||
| OCG | 26.3 | — | 26.3 | — | — | — | ||||||||||||||||||
| Consolidated Total | $ | 117.8 | $ | (50.5 | ) | $ | 67.3 | $ | (50.4 | ) | $ | (50.5 | ) | $ | (100.9 | ) | ||||||||
KELLY SERVICES, INC. AND SUBSIDIARIES
NOTES TO CONSOLIDATED FINANCIAL STATEMENTS (continued)
6. Other Assets
Included in other assets are the following:
| 2010 | 2009 | |||||||
| (In millions of dollars) | ||||||||
| Deferred compensation plan (See Retirement Benefits footnote) | $ | 87.8 | $ | 78.3 | ||||
| Available-for-sale investment (See Fair Value Measurements footnote) | 27.8 | 23.6 | ||||||
| Workers’ compensation receivable | 14.3 | 10.8 | ||||||
| Intangibles, net of accumulated amortization of $18.1 million and $15.3 million, respectively | 9.1 | 13.0 | ||||||
| Other | 15.5 | 16.5 | ||||||
| Other assets | $ | 154.5 | $ | 142.2 | ||||
2013 2012 (In millions of dollars) Deferred compensation plan (see Retirement Benefits footnote) Available-for-sale investment (see Fair Value Measurements footnote) Workers' compensation receivable Wage credit receivable Intangibles, net of accumulated amortization of $17.7 million in 2013 and $21.8 million in 2012 Investment in equity affiliate (see Investment in Equity Affiliate footnote) Other Other assets $ 134.0 $ 106.3 80.7 37.7 13.4 15.0 6.1 - 4.3 8.1 3.8 5.1 15.8 8.7 $ 258.1 $ 180.9
Intangible amortization expense which is included in SG&A expenses, was $3.6$2.0 million, $4.9$3.3 million and $4.6$2.5 million in 2010, 20092013, 2012 and 2008,2011, respectively. Included in accumulated amortization as of year-end 2009Wage credit receivable is $2.2 million related to a tax law introduced in 2013 to enhance the impairmentcompetitiveness of intangible assetsbusinesses in Japan and Europe.
56
Short-Term Debt
On December 11, 2013, we entered into an agreement with our lenders to amend and restate our existing revolving credit facility (“facility”dated March 30, 2011 (the “Facility”) that is secured by. The amendment made, among others, the assets of the Company and has a three-year term, maturing on September 28, 2012. following changes:
● | Increased the lenders’ commitments from $150.0 million to $200.0 million; |
● | Revised the termination date of the facility from March 31, 2016 to December 11, 2018; and |
● | Reduced the applicable margins based on the Company’s leverage ratio, as defined in the agreement and calculated at the end of each fiscal quarter. |
The facilityFacility allows for borrowings in various currencies and is used to fund working capital, acquisitions, and for general corporate purposes. The interest rate applicable toneeds. At year-end 2013 and 2012, there were no borrowings under the facility atFacility and the remaining borrowing capacity was $200.0 million and $150.0 million, respectively. At year-end 2010 and 2009 was 3102013, the Facility had a commitment fee of 25 basis points overpoints. This varies based on the London InterBank Offering Rate (“LIBOR”)Company’s leverage ratio as defined in addition to a 40 bps facility fee. LIBOR rates vary by currency. Borrowings under the facility were zero at year-end 2010, and $9.0 million at year-end 2009, which carried an interest rate of 5.35%.agreement. The facility containedFacility’s financial covenants and certain restrictions are described below, all of which were met at January 2, 2011.year-end 2013:
● | We must maintain a certain minimum ratio of earnings before interest, taxes, depreciation, amortization and certain cash and non-cash charges that are non-recurring in nature (“EBITDA”) to interest expense (“Interest Coverage Ratio”) as of the end of any fiscal quarter. |
● | We must maintain a certain maximum ratio of total indebtedness to the sum of net worth and total indebtedness at all times. |
● | Dividends, stock buybacks and similar transactions are limited to certain maximum amounts. |
● | We must adhere to other operating restrictions relating to the conduct of business, such as certain limitations on asset sales and the type and scope of investments. |
KELLY SERVICES, INC. AND SUBSIDIARIES
NOTES TO CONSOLIDATED FINANCIAL STATEMENTS (continued)
7. Debt (continued)
On December 4, 2009,11, 2013, the Company and Kelly Receivables Funding, LLC, a wholly owned bankruptcy remote special purpose subsidiary of the Company (the “Receivables Entity”) entered into aamended the Receivables Purchase Agreement dated December 4, 2009 related to establish a 364-day, $100the existing $150 million securitization facility (“Securitization Facility”). The Receivables Purchase Agreement will terminate in five years, afteramendment made, among others, the date of the agreement, unless terminated earlier pursuant to its terms. following changes:
● | Revised the termination date of the facility from March 31, 2014 to December 9, 2016; |
● | Introduced a delayed funding option that allows the bank to delay honoring a funding request for up to 35 days in the event there is market dislocation; and |
● | Reduced the facility fees, letter of credit fees, and program fees. |
Under the Securitization Facility, the Company will sell certain trade receivables and related rights (“Receivables”), on a revolving basis, to the Receivables Entity. The Receivables Entity may from time to time sell an undivided variable percentage ownership interest in the Receivables. The Securitization Facility also allows for the issuance of standby letters of credit (“SBLC”). The Securitization Facility contains a cross-default clause that could result in a termination of the facility if defaults occur under our other loan agreements. The Securitization Facility also contains certain restrictions based on the performance of the Receivables.
As of January 2, 2011,year-end 2013, the Securitization Facility carried $17.0$28.0 million of short-term borrowings at a rate of 1.57%.0.97%, $55.0 million of SBLCs related to workers’ compensation and a remaining capacity of $67.0 million. The interest rate detailed above includes a facility fee of 40 basis points. As of January 3, 2010,year-end 2012, the Securitization Facility carried $55.0$63.0 million of short-term borrowings at a rate of 1.87%. The cost1.40%, SBLCs of borrowings on this facility varies on a daily basis. At year-end 2010 and 2009, the Securitization Facility also contained $45.7$55.0 million and $44.3 million, respectively, of SBLCs related to workers’ compensation. Thecompensation and remaining capacity on the facility was $37.3 million at year-end 2010 and $0.7 million at year-end 2009.
57
The Company has additionalhad total unsecured, uncommitted one-yearshort-term local credit facilities that total $11.2of $15.3 million as of January 2, 2011.year-end 2013. Borrowings under these lines totaled $0.1$0.3 million and $1.0$1.1 million at year-end 20102013 and 2009,2012, respectively. The interest rate for these borrowings was 5.0%10.75% at January 2, 2011year-end 2013 and 2.2%9.56% at January 3, 2010.year-end 2012.
58
8. Retirement Benefits
The Company provides a qualified defined contribution plan covering substantially all U.S.-based full-time employees, except officers and certain other management employees. Upon approval by the Board of Directors, a discretionary contribution based on eligible wages may be funded annually. Discretionary contributions, which were suspended in 2008 and 2009, were reinstated in 2010. The plan also offers a savings feature with Company matching contributions. Company matching contributions were suspended as of October, 2009, and have been reinstated effective January, 2011. Assets of this plan are held by an independent trustee for the sole benefit of participating employees.
A nonqualified deferred compensation plan is provided for officers and certain other management employees. Upon approval by the Board of Directors, a discretionary contribution based on eligible wages may be made annually. Discretionary contributions, which were suspended in 2008 and 2009, were reinstated in 2010. This plan also includes provisions for salary deferrals and Company matching contributions.
In addition to the plans above, the Company matching contributions were suspended as of February, 2009also provides a qualified plan and have been reinstated effective January, 2011.
The liability for the nonqualified planplans was $88.0$135.6 million and $80.5$110.6 million as of year-end 20102013 and 2009,2012, respectively, and is included in current accrued payroll and related taxes and noncurrent accrued retirement benefits. The cost of participants’ earnings on this liability, which were charged toincluded in SG&A expenses, were $9.0earnings of $15.7 million and $10.2 million in 20102013 and $13.6 million in 2009,2012, respectively, and losses of $25.3$0.9 million in 2008.2011. In connection with the administration of this plan,these plans, the Company has purchased company-owned variable universal life insurance policies insuring the lives of certain officers and key employees. The cash surrender value of these policies, which is based primarily on investments in mutual funds and can only be used for payment of the Company’s obligations related to the non-qualified deferred compensation plan noted above, was $87.8$134.0 million and $78.3$106.3 million at year-end 20102013 and 2009,2012, respectively. These investments areThe cash surrender value of these insurance policies is included in other assets and are restricted for the use of funding this plan. Earningsassets. Tax-free earnings on these assets, which were included in SG&A expenses, were $10.1$17.4 million in 2010 and $13.82013, $10.3 million in 2009,2012 and losses of $24.3$1.8 million in 2008.
The net expense from continuing operations for retirement benefits for both the qualified and nonqualified deferred compensation plans, including Company matching and discretionary contributions for full-time employees, totaled $0.6$6.2 million in 2010, $0.62013, $9.7 million in 20092012 and $3.7$9.9 million in 2008.
In addition, the Company also has several defined benefit pension plans in locations outside of the United States. The total projected benefit obligation, assets and unfunded liability for these plans as of January 2, 2011,year-end 2013 were $11.9$13.7 million, $7.6$9.2 million and $4.3$4.5 million, respectively. The total projected benefit obligation, assets and unfunded liability for these plans as of January 3, 2010,year-end 2012 were $10.5$14.2 million, $6.9$8.2 million and $3.6$6.0 million, respectively. Total pension expense for these plans was $0.8$0.7 million, $1.0$1.1 million and $0.5$0.9 million in 2010, 20092013, 2012 and 2008,2011, respectively. Pension contributions and the amount of accumulated other comprehensive income expected to be recognized in 20112014 are not significant.
59
9. Stockholders’ Equity
Common Stock
The authorized capital stock of the Company is 100,000,000 shares of Class A common stock and 10,000,000 shares of Class B common stock. Class A shares have no voting rights and are not convertible. Class B shares have voting rights and are convertible by the holder into Class A shares on a share-for-share basis at any time. Both classes of stock have identical rights in the event of liquidation.
Class A shares and Class B shares are both entitled to receive dividends, subject to the limitation that no cash dividend on the Class B shares may be declared unless the Board of Directors declares an equal or larger cash dividend on the Class A shares. As a result, a cash dividend may be declared on the Class A shares without declaring a cash dividend on the Class B shares.
During 2013, 2012 and 2011, the Company sold 1,576,169 shares of Kelly’s Class A common stock to Temp Holdings. The shares were sold in a private transaction at $15.42 per share, which was the average of the closing prices of the Class A common stock for the five days from May 3, 2010 through May 7, 2010,made dividend payments totaling $7.6 million, $7.6 million and represented 4.8 percent of the outstanding Class A shares after the completion of the sale. As part of this transaction, Kelly added a representative of Temp Holdings to Kelly’s Board of Directors.
Accumulated Other Comprehensive Income
The components ofchanges in accumulated other comprehensive income at year-end 2010 and 2009 were as follows:by component, net of tax, during 2013 are included in the table below. Amounts in parentheses indicate debits.
Foreign Currency Translation Adjustments Unrealized Gains and Losses on Investment Pension Liability Adjustments Total (In millions of dollars) Balance at year-end 2012 Other comprehensive income (loss)before reclassifications Amounts reclassified from accumulatedother comprehensive income Net current-period other comprehensiveincome Balance at year-end 2013 $ 24.9 $ 13.6 $ (3.1 ) $ 35.4 (6.7 ) 31.2 (1) 1.4 25.9 (0.1 ) (2) - 0.2 (3) 0.1 (6.8 ) 31.2 1.6 26.0 $ 18.1 $ 44.8 $ (1.5 ) $ 61.4
(1) | Includes utilization of a $1.1 million income tax valuation allowance relating to the Temp Holdings investment. |
(2) | Amount was recorded in the other expense, net line item in the consolidated statement of earnings. |
(3) | Amount was recorded in the SG&A expenses line item in the consolidated statement of earnings. |
| 2010 | 2009 | |||||||
| (in millions of dollars) | ||||||||
| Cumulative translation adjustments, net of tax benefit of $2.1 million in 2010 and $1.6 million in 2009 | $ | 28.9 | $ | 25.3 | ||||
| Unrealized gain on marketable securities | 2.6 | 1.6 | ||||||
| Pension liability, net of tax benefit of $0.2 million in 2010 and $0.5 million in 2009 | (2.5 | ) | (1.8 | ) | ||||
| $ | 29.0 | $ | 25.1 | |||||
60
10. Earnings Per Share
The reconciliation of basic earnings per share on common stock for the year ended January 2,year-end 2013, 2012 and 2011 follows (in millions of dollars except per share data). Reconciliations for 2009 and 2008 are not applicable, since an allocation of the net loss in those years to participating securities would have an anti-dilutive effect on basic and diluted per share amounts.
| 2010 | ||||
| Net earnings | $ | 26.1 | ||
| Less: Earnings allocated to participating securities | (0.3 | ) | ||
| Net earnings available to common shareholders | $ | 25.8 | ||
| Earnings per share on common stock: | ||||
| Basic | $ | 0.71 | ||
| Diluted | 0.71 | |||
| Average common shares outstanding (millions) | ||||
| Basic | 36.1 | |||
| Diluted | 36.1 | |||
2013 2012 2011 Earnings from continuing operations Less: Earnings allocated to participating securities Earnings from continuing operations available tocommon shareholders Earnings (loss) from discontinued operations Less: Earnings (loss) allocated to participating securities Earnings (loss) from discontinued operations available tocommon shareholders Net earnings Less: Earnings allocated to participating securities Net earnings available to common shareholders Basic earnings (loss) per share on common stock: Earnings from continuing operations Earning (loss) from discontinued operations Net earnings Diluted earnings (loss) per share on common stock: Earnings from continuing operations Earnings (loss) from discontinued operations Net earnings Average common shares outstanding (millions) Basic Diluted $ 58.9 $ 49.7 $ 64.9 (1.5 ) (1.3 ) (1.5 ) $ 57.4 $ 48.4 $ 63.4 $ - $ 0.4 $ (1.2 ) - - - $ - $ 0.4 $ (1.2 ) $ 58.9 $ 50.1 $ 63.7 (1.5 ) (1.3 ) (1.5 ) $ 57.4 $ 48.8 $ 62.2 $ 1.54 $ 1.31 $ 1.72 $ - $ 0.01 $ (0.03 ) $ 1.54 $ 1.32 $ 1.69 $ 1.54 $ 1.31 $ 1.72 $ - $ 0.01 $ (0.03 ) $ 1.54 $ 1.32 $ 1.69 37.3 37.0 36.8 37.3 37.0 36.8
Due to the fact that there were no potentially dilutive common shares outstanding during the period, the computations of basic and diluted earnings per share on common stock are the same for 2010, 20092013, 2012 and 2008.2011. Stock options representing 0.70.3 million, 0.90.4 million and 1.10.6 million shares for 2010, 20092013, 2012 and 2008,2011, respectively, were excluded from the computation of diluted earnings (loss) per share due to their anti-dilutive effect.
We have presented earnings per share for our two classes of common stock on a combined basis. This presentation is consistent with the earnings per share computations that result for each class of common stock utilizing the two-class method as described in ASC Topic 260, “Earnings Per Share”. The two-class method is an earnings allocation formula which determines earnings per share for each class of common stock according to the dividends declared (or accumulated) and participation rights in the undistributed earnings.
KELLY SERVICES, INC. AND SUBSIDIARIES
NOTES TO CONSOLIDATED FINANCIAL STATEMENTS (continued)
10. Earnings Per Share (continued)
In applying the two class method, we have determined that the undistributed earnings should be allocated to each class on a pro rata basis after consideration of all of the participation rights of the Class B shares (including voting and conversion rights) and our history of paying dividends equally to each class of common stock on a per share basis.
The Company’s Restated Certificate of Incorporation allows the Board of Directors to declare a cash dividend to Class A shares without declaring equal dividends to the Class B shares. Class B shares’ voting and conversion rights, however, effectively allow the Class B shares to participate in dividends equally with Class A shares on a per share basis.
The Class B shares are the only shares with voting rights. The Class B shareholders are therefore able to exercise voting control with respect to all matters requiring stockholder approval, including the election of or removal of directors. The Board of Directors has historically declared and the Company historically has paid equal per share dividends on both the Class A and Class B shares. Each class has participated equally in all dividends declared since 1987.
In addition, Class B shares are convertible, at the option of the holder, into Class A shares on a one for one basis. As a result, Class B shares can participate equally in any dividends declared on the Class A shares by exercising their conversion rights.
61
Under the Equity Incentive Plan (the “Plan”), the Company may grant stock options (both incentive and nonqualified), stock appreciation rights, restricted stock awards and performance awards to key employees utilizingassociated with the Company’s Class A stock. The Plan provides that the maximum number of shares available for grants is 10 percent of the outstanding Class A stock, adjusted for Plan activity over the preceding five years. Shares available for future grants at January 2, 2011year-end 2013 under the Equity Incentive Plan were 1,888,532.1,552,354. The Company issues shares out of treasury stock to satisfy stock-based awards. The Company presently has no intent to repurchase additional shares for the purpose of satisfying stock-based awards.
The Company recognized stock-based compensation cost of $4.2 million, $6.0 million in 2013 and $5.62012 and $5.7 million respectively,in 2011, as well as related tax benefits of $1.6$2.3 million $2.3 millionin 2013 and 2012 and $2.2 million respectively.
Restricted Stock Awards
Restricted stock, awards, which typically vestvests over a period of 3 to 54 years, areis issued to certain key employees and areis subject to forfeiture until the end of an established restriction period. The Company utilizes the market price of its Class A stock on the date of grant as the fair market value of restricted stock awards and expenses the fair value on a straight-line basis over the vesting period.
A summary of the status of nonvested restricted stock awards under the Plan as of the year ended January 2, 2011year-end 2013 and changes during this period is presented as follows:
Restricted Stock Weighted Average Grant Date Fair Value Nonvested at year-end 2012 Granted Vested Forfeited Nonvested at year-end 2013 1,062,525 $ 15.19 497,700 19.74 (345,925 ) 15.58 (85,700 ) 15.35 1,128,600 $ 17.06
| Weighted | ||||||||
| Average | ||||||||
| Restricted | Grant Date | |||||||
| Stock | Fair Value | |||||||
| Nonvested at January 3, 2010 | 519,070 | $ | 21.92 | |||||
| Granted | 449,900 | 18.08 | ||||||
| Vested | (226,640 | ) | 23.78 | |||||
| Forfeited | (33,925 | ) | 22.54 | |||||
| Nonvested at January 2, 2011 | 708,405 | $ | 18.85 | |||||
KELLY SERVICES, INC. AND SUBSIDIARIES
NOTES TO CONSOLIDATED FINANCIAL STATEMENTS (continued)
11. Stock-Based Compensation (continued)
As of January 2, 2011,year-end 2013, unrecognized compensation cost related to unvested restricted sharesstock totaled $11.0$16.2 million. The weighted average period over which this cost is expected to be recognized is approximately two years. The weighted average grant date fair value per share of restricted stock awards granted during 2010, 20092013, 2012 and 20082011 was $18.08, $12.82$19.74, $12.98 and $20.61,$16.84, respectively. The total fair market value of restricted sharesstock, which vested during 2010, 20092013, 2012 and 20082011, was $3.4$6.5 million, $2.8$4.1 million and $3.7 million, respectively.
62
Under the terms of the Plan, stock options may not be granted at prices less than the fair market value of the Company’s Class A stock on the date of grant, nor for a term exceeding 10 years, and typically vest over 3 years. The Company expenses the fair value of stock option grants on a straight-line basis over the vesting period. No stock options were granted in 2010, 20092013, 2012 and 2008.
A summary of the status of stock option grants under the Plan as of the year ended January 2, 2011year-end 2013 and changes during this period is presented as follows:
| Weighted | ||||||||||||||||
| Weighted | Average | |||||||||||||||
| Average | Remaining | Aggregate | ||||||||||||||
| Exercise | Contractual | Intrinsic | ||||||||||||||
| Options | Price | Term (Years) | Value | |||||||||||||
| Outstanding at January 3, 2010 | 851,306 | $ | 25.09 | |||||||||||||
| Granted | — | — | ||||||||||||||
| Exercised | — | — | ||||||||||||||
| Forfeited | — | — | ||||||||||||||
| Expired | (206,270 | ) | 24.36 | |||||||||||||
| Outstanding at January 2, 2011 | 645,036 | $ | 25.32 | 2.29 | $ | — | ||||||||||
| Options exercisable at January 2, 2011 | 645,036 | $ | 25.32 | 2.29 | $ | — | ||||||||||
Options Weighted Average Exercise Price Weighted Average Remaining Contractual Term (Years) Aggregate Intrinsic Value Outstanding at year-end 2012 Granted Exercised Forfeited Expired Outstanding at year-end 2013 Options exercisable at year-end 2013 392,599 $ 26.16 - - - - - - (229,986 ) 24.97 162,613 $ 27.84 0.68 $ - 162,613 $ 27.84 0.68 $ -
The table above includes 55,50033,000 of non-employee director shares outstanding at January 2, 2011.
As of January 2, 2011,year-end 2013, there was no unrecognized compensation cost related to unvested stock options. No stock options were exercised in 2010, 20092013, 2012 and 2008.
Windfall tax benefits, arising from stock-based compensation were insignificant. In 2008, windfall tax benefits totaled $0.1 million andwhich were included in the “Sale of stock and other“Other financing activities” component of net cash from financing activities in the consolidated statement of cash flows.flows, totaled $0.5 million in 2013 and were insignificant for 2012 and 2011.
KELLY SERVICES, INC. AND SUBSIDIARIES
NOTES TO CONSOLIDATED FINANCIAL STATEMENTS (continued)
12. Other Expense, Net
Included in other expense, net are the following:
| 2010 | 2009 | 2008 | ||||||||||
| (In millions of dollars) | ||||||||||||
| Interest income | $ | 0.8 | $ | 1.3 | $ | 3.8 | ||||||
| Interest expense | (5.7 | ) | (4.1 | ) | (4.1 | ) | ||||||
| Dividend income | 0.4 | 0.6 | 0.7 | |||||||||
| Foreign exchange losses | (1.2 | ) | (0.5 | ) | (3.7 | ) | ||||||
| Other | 0.3 | 0.5 | (0.1 | ) | ||||||||
| Other expense, net | $ | (5.4 | ) | $ | (2.2 | ) | $ | (3.4 | ) | |||
2013 2012 2011 (In millions of dollars) Interest income Interest expense Dividend income Foreign exchange (losses) gains Net loss on equity investment (see Investmentin Equity Affiliate footnote) Other Other expense, net $ 0.4 $ 1.0 $ 1.0 (2.8 ) (3.4 ) (3.4 ) 0.6 0.6 0.5 (1.5 ) (1.0 ) 1.5 (1.3 ) (0.7 ) - 0.1 - 0.3 $ (4.5 ) $ (3.5 ) $ (0.1 )
Dividend income includes dividends earned on the Company’s investment in Temp Holdings (see Fair Value Measurements footnote). Foreign exchange losses in 2008 related to yen-denominated net debt for the Temp Holdings investment and ruble-denominated intercompany balances in Russia.
63
Earnings (loss) from continuing operations before taxes for the years 2010, 20092013, 2012 and 20082011 were taxed under the following jurisdictions:
| 2010 | 2009 | 2008 | ||||||||||
| (in million of dollars) | ||||||||||||
| Domestic | $ | 27.3 | $ | (56.8 | ) | $ | 8.7 | |||||
| Foreign | 5.4 | (91.5 | ) | (82.4 | ) | |||||||
| Total | $ | 32.7 | $ | (148.3 | ) | $ | (73.7 | ) | ||||
2013 2012 2011 (In million of dollars) Domestic Foreign Total $ 35.1 $ 56.3 $ 36.7 13.7 12.5 20.9 $ 48.8 $ 68.8 $ 57.6
The provision for income taxes from continuing operations was as follows:
2013 2012 2011 (In millions of dollars) Current tax expense: U.S. federal U.S. state and local Foreign Total current Deferred tax expense: U.S. federal U.S. state and local Foreign Total deferred Total provision $ 7.3 $ 1.4 $ 5.2 3.5 3.0 1.8 10.4 10.0 13.0 21.2 14.4 20.0 (26.9 ) 4.7 (33.3 ) (1.6 ) 0.9 1.1 (2.8 ) (0.9 ) 4.9 (31.3 ) 4.7 (27.3 ) $ (10.1 ) $ 19.1 $ (7.3 )
| 2010 | 2009 | 2008 | ||||||||||
| (in millions of dollars) | ||||||||||||
| Current tax expense: | ||||||||||||
| U.S. federal | $ | 6.2 | $ | (14.0 | ) | $ | (6.9 | ) | ||||
| U.S. state and local | 0.6 | 0.9 | 0.1 | |||||||||
| Foreign | 9.1 | 0.9 | 8.2 | |||||||||
| Total current | 15.9 | (12.2 | ) | 1.4 | ||||||||
| Deferred tax expense: | ||||||||||||
| U.S. federal | (11.3 | ) | (21.6 | ) | 5.5 | |||||||
| U.S. state and local | (0.3 | ) | (3.3 | ) | 1.3 | |||||||
| Foreign | 2.3 | (6.1 | ) | (0.2 | ) | |||||||
| Total deferred | (9.3 | ) | (31.0 | ) | 6.6 | |||||||
| Total provision | $ | 6.6 | $ | (43.2 | ) | $ | 8.0 | |||||
KELLY SERVICES, INC. AND SUBSIDIARIES
NOTES TO CONSOLIDATED FINANCIAL STATEMENTS (continued)
13. Income Taxes (continued)
Deferred taxes are comprised of the following:
| 2010 | 2009 | |||||||
| (in millions of dollars) | ||||||||
| Depreciation and amortization | $ | (5.0 | ) | $ | (7.7 | ) | ||
| Employee compensation and benefit plans | 49.4 | 41.1 | ||||||
| Workers’ compensation | 26.9 | 25.7 | ||||||
| Unrealized loss on securities | 7.7 | 7.0 | ||||||
| Loss carryforwards | 41.0 | 45.8 | ||||||
| Credit Carryforwards | 39.5 | 36.2 | ||||||
| Other, net | (4.8 | ) | (1.2 | ) | ||||
| Valuation allowance | (52.5 | ) | (52.7 | ) | ||||
| Net deferred tax assets | $ | 102.2 | $ | 94.2 | ||||
2013 2012 (In millions of dollars) Depreciation and amortization Employee compensation and benefit plans Workers' compensation Unrealized (gain) loss on securities Loss carryforwards Credit carryforwards Other, net Valuation allowance Net deferred tax assets $ (10.4 ) $ (8.9 ) 68.1 57.5 22.8 23.7 (17.2 ) 2.3 49.4 50.2 82.0 60.5 0.2 (3.6 ) (56.3 ) (58.4 ) $ 138.6 $ 123.3
64
| 2010 | 2009 | |||||||
| (in millions of dollars) | ||||||||
| Current assets, deferred tax | $ | 22.4 | $ | 21.0 | ||||
| Noncurrent deferred tax asset | 84.0 | 77.5 | ||||||
| Current liabilities, income and other taxes | (1.5 | ) | (0.9 | ) | ||||
| Noncurrent liabilities, other long-term liabilities | (2.7 | ) | (3.4 | ) | ||||
| $ | 102.2 | $ | 94.2 | |||||
2013 2012 (In millions of dollars) Current assets, deferred tax Noncurrent deferred tax asset Current liabilities, income and other taxes Noncurrent liabilities, other long-term liabilities $ 35.5 $ 44.9 121.7 82.8 (0.4 ) (3.3 ) (18.2 ) (1.1 ) $ 138.6 $ 123.3
The differences between income taxes from continuing operations for financial reporting purposes and the U.S. statutory rate of 35% are as follows:
2013 2012 2011 (In millions of dollars) Income tax based on statutory rate State income taxes, net of federal benefit General business credits Life insurance cash surrender value Foreign items Foreign business taxes Mexico tax law change Worthless stock Non-deductible compensation Change in deferred tax realizability Uncertain tax positions Other, net Total $ 17.1 $ 24.1 $ 20.2 1.2 2.6 1.9 (26.2 ) (7.9 ) (28.5 ) (5.8 ) (3.4 ) 0.9 0.3 1.6 (0.5 ) 3.9 4.5 4.7 (4.6 ) - - - - (7.7 ) 1.2 1.2 1.5 2.8 (0.7 ) (0.6 ) - (4.8 ) (0.7 ) - 1.9 1.5 $ (10.1 ) $ 19.1 $ (7.3 )
| 2010 | 2009 | 2008 | ||||||||||
| (in millions of dollars) | ||||||||||||
| Income tax based on statutory rate | $ | 11.4 | $ | (51.9 | ) | $ | (25.8 | ) | ||||
| State income taxes, net of federal benefit | 0.2 | (1.6 | ) | 0.9 | ||||||||
| General business credits | (11.7 | ) | (11.8 | ) | (11.3 | ) | ||||||
| Life insurance cash surrender value | (3.3 | ) | (4.6 | ) | 8.7 | |||||||
| Impairment | 0.2 | 15.6 | 25.1 | |||||||||
| Restructuring | 0.8 | 4.9 | 1.2 | |||||||||
| Foreign items | 0.8 | 5.7 | 7.9 | |||||||||
| Foreign business taxes | 4.5 | 0.4 | 1.3 | |||||||||
| Worthless stock benefit | (0.9 | ) | (3.6 | ) | — | |||||||
| Stock-based compensation | 0.7 | 1.1 | — | |||||||||
| Change in deferred tax realizability | 3.0 | — | (0.7 | ) | ||||||||
| Other, net | 0.9 | 2.6 | 0.7 | |||||||||
| Total | $ | 6.6 | $ | (43.2 | ) | $ | 8.0 | |||||
KELLY SERVICES, INC. AND SUBSIDIARIES
NOTES TO CONSOLIDATED FINANCIAL STATEMENTS (continued)
13. Income Taxes (continued)
General business credits primarily represent U.S. work opportunity credits and, in 2011 only, HIRE Act retention credits of $11.3 million. In 2012, the work opportunity credit was available only for veterans and pre-2012 hires. The full credit was retroactively reinstated on January 2, 2013, resulting in the United States.inclusion of $9.3 million of tax benefits during 2013 that would have been recognized in 2012 if the law had been in effect. Foreign business taxes areinclude the French business tax and other taxes based on revenue less certain expenses and are classified as income taxes under ASC 740.Topic 740 (“ASC 740”), Income Taxes. The increase in 2010 is primarily due to the French business tax, which had been classified as a component of SG&A prior to 2010. The French government changed the business tax from an asset-based tax to an income-based tax, thereby requiring the classification of this tax as anCompany closed income tax for 2010.
The Company has U.S. general business credit carryforwards of $37.8$82.0 million which will expire from 20282030 to 2030 and foreign tax credit carryforwards of $1.7 million which expire in 2019 and 2020.2033. The net tax effect of state and foreign loss carryforwards at January 2, 2011year-end 2013 totaled $41.0$49.4 million, which expire as follows (in millions of dollars):
| Year | Amount | |||
| 2011-2013 | $ | 0.9 | ||
| 2014-2016 | 3.1 | |||
| 2017-2020 | 2.8 | |||
| No expiration | 34.2 | |||
| Total | $ | 41.0 | ||
65
Year | Amount | ||||
2014-2015 | $ | 0.6 | |||
2016-2018 | 3.3 | ||||
2019-2022 | 2.5 | ||||
2023-2033 | 0.6 | ||||
No expiration | 42.4 | ||||
Total | $ | 49.4 | |||
Provision has not been made for U.S. or additional foreign income taxes on an estimated $26.2 million of$76.8 millionof undistributed earnings of foreign subsidiaries, which are permanently reinvested. If suchthese earnings were to be remitted, management believes thatrepatriated, the Company would be subject to additional U.S. foreign tax credits would largely eliminate any such U.S. and foreign income taxes.
| 2010 | 2009 | 2008 | ||||||||||
| (in millions of dollars) | ||||||||||||
| Cumulative translation adjustments | $ | (0.3 | ) | $ | (3.5 | ) | $ | 5.9 | ||||
| Pension liability | (0.3 | ) | 0.1 | 0.3 | ||||||||
| Total | $ | (0.6 | ) | $ | (3.4 | ) | $ | 6.2 | ||||
KELLY SERVICES, INC. AND SUBSIDIARIES
NOTES TO CONSOLIDATED FINANCIAL STATEMENTS (continued)
13. Income Taxes (continued)
A reconciliation of the beginning and ending amount of unrecognized tax benefits is as follows:
| 2010 | 2009 | 2008 | ||||||||||
| (in millions of dollars) | ||||||||||||
| Balance at beginning of the year | $ | 6.8 | $ | 2.5 | $ | 3.7 | ||||||
| Additions based on tax positions related to the current year | — | 4.8 | 0.4 | |||||||||
| Additions for prior years’ tax positions | 0.1 | 0.4 | 0.5 | |||||||||
| Reductions for prior years’ tax positions | (0.3 | ) | (0.4 | ) | (0.9 | ) | ||||||
| Reductions for settlements | — | (0.2 | ) | (0.9 | ) | |||||||
| Reductions for expiration of statutes | (0.2 | ) | (0.3 | ) | (0.3 | ) | ||||||
| Balance at end of the year | $ | 6.4 | $ | 6.8 | $ | 2.5 | ||||||
2013 2012 2011 (In millions of dollars) Balance at beginning of the year Additions for prior years' tax positions Reductions for prior years' tax positions Additions for settlements Reductions for settlements Reductions for expiration of statutes Balance at end of the year $ 2.9 $ 7.8 $ 8.5 - 0.4 0.2 (0.1 ) (5.3 ) (0.8 ) - - 0.2 - - (0.2 ) - - (0.1 ) $ 2.8 $ 2.9 $ 7.8
If the $6.4$2.8 million in 2010, $6.82013, $2.9 million in 20092012 and $2.5$7.8 million in 20082011 of unrecognized tax benefits were recognized, they would have a favorable effect of $6.0$1.8 million in 2010, $6.22013, $1.9 million in 20092012 and $2.0$6.7 million in 20082011 on the effectiveincome tax rate.
66
The Company files income tax returns in the U.S. and in various states and foreign countries. InThe tax periods open to examination by the major taxing jurisdictions whereto which the Company operates, it is generally no longer subject to income tax examinations by tax authoritiesinclude the U.S. for fiscal years before 2003.
The Company and its subsidiaries have various other income tax returns in the process of examination or administrative appeals or litigation.appeals. The unrecognized tax benefit and related interest and penalty balances include approximately $1.6$0.5 million for 2010 and $1.3 million for 20092013 related to tax positions which are reasonably possible to change within the next twelve months due to income tax audits, settlements and statute expirations.
KELLY SERVICES, INC. AND SUBSIDIARIES
NOTES TO CONSOLIDATED FINANCIAL STATEMENTS (continued)
14. Supplemental Cash Flow Information
Changes in operating assets and liabilities, net of acquisitions and the effect of deconsolidated entities, as disclosed in the statements of cash flows, for the fiscal years 2010, 20092013, 2012 and 2008,2011, respectively, were as follows:
| 2010 | 2009 | 2008 | ||||||||||
| (in millions of dollars) | ||||||||||||
| (Increase) decrease in trade accounts receivable | $ | (95.5 | ) | $ | 116.6 | $ | 28.9 | |||||
| Decrease (increase) in prepaid expenses and other current assets | 25.0 | (9.2 | ) | (19.7 | ) | |||||||
| Increase (decrease) in accounts payable and accrued liabilities | 0.4 | (59.0 | ) | 72.3 | ||||||||
| Increase (decrease) in accrued payroll and related taxes | 36.0 | (41.9 | ) | (12.7 | ) | |||||||
| Increase (decrease) in accrued insurance | 7.0 | 4.5 | (10.9 | ) | ||||||||
| Increase (decrease) in income and other taxes | 9.4 | (2.0 | ) | (13.1 | ) | |||||||
| Total changes in operating assets and liabilities | $ | (17.7 | ) | $ | 9.0 | $ | 44.8 | |||||
2013 2012 2011 (In millions of dollars) Increase in trade accounts receivable Increase in prepaid expensesand other assets Increase in accounts payableand accrued liabilities Increase in accrued payrolland related taxes (Decrease) increase in accrued insurance Increase (decrease) in income and other taxes Total changes in operating assets and liabilities $ (14.6 ) $ (57.9 ) $ (148.5 ) (11.8 ) (12.5 ) (4.7 ) 43.8 54.1 58.9 39.2 2.4 34.3 (2.9 ) (8.7 ) 0.2 5.5 (3.7 ) 4.8 $ 59.2 $ (26.3 ) $ (55.0 )
The Company paid interest of $6.1$2.0 million, $4.2$2.6 million and $3.7$2.9 million in 2010, 20092013, 2012 and 2008,2011, respectively. The Company received a refund of income taxes of $7.8 million in 2010 and $9.4 million in 2009, and paid income taxes of $26.9$16.9 million in 2008.
67
The Company conducts its field operations primarily from leased facilities. The following is a schedule by fiscal year of future minimum commitments under operating leases as of January 2, 2011year-end 2013 (in millions of dollars):
Fiscal year: 2014 2015 2016 19.0 2017 2018 Later years Total $ 39.0 28.7 11.0 6.3 2.4 $ 106.4
| Fiscal year: | ||||
| 2011 | $ | 44.0 | ||
| 2012 | 31.6 | |||
| 2013 | 19.8 | |||
| 2014 | 8.6 | |||
| 2015 | 4.6 | |||
| Later years | 7.2 | |||
| Total | $ | 115.8 | ||
KELLY SERVICES, INC. AND SUBSIDIARIES
NOTES TO CONSOLIDATED FINANCIAL STATEMENTS (continued)
15. Commitments (continued)
Lease expense from continuing operations for fiscal 2010, 20092013, 2012 and 20082011 amounted to $50.1$45.6 million, $56.8$48.3 million and $61.8$50.5 million, respectively.
In addition to operating lease agreements, the Company has entered into unconditionalnoncancelable purchase obligations totaling $25.4$30.8 million. These obligations relate primarily to voice and data communications services and online tools which the Company expects to utilize generally within the next threetwo fiscal years, in the ordinary course of business. The Company has no material unrecorded commitments, losses, contingencies or guarantees associated with any related parties or unconsolidated entities.
16. Contingencies
During the first quarter of 2013, the Company agreed to a settlement related to its unclaimed property examination by Delaware, its state of incorporation, for $4.5 million. Types of property under exam included payroll and accounts payable checks and accounts receivable credits, covering all reporting years through and including 2012. Accordingly, the Company recorded an additional reserve of $3.0 million in the first quarter of 2013. The Company paid this settlement during the second quarter of 2013.
During the fourth quarter of 2013, a Louisiana jury rendered an award of $4.4 million, pursuant to litigation brought by Robert and Margaret Ward against the Jefferson Parish School Board and Kelly Services. Under the verdict, Kelly’s share of the liability consists of $2.7 million plus a portion of pre-and-post-judgment interest. Kelly believes it is appropriately insured for this verdict. Kelly believes that the subjectverdict is not supported by the facts of two pendingthe case and is currently evaluating appeals strategies with its insurers.
In 2012, the Company received final court approval of the settlement of a single class action, lawsuits. The two lawsuits, Fuller v. Kelly Services, Inc. and Kelly Home Care Services, Inc., pending in the Superior Court of California, Los Angeles, and Sullivan v. Kelly Services, Inc., pending in the U.S. District Court Southern District of California, both involve claimswhich involved a claim for monetary damages by current and former temporary employees working in the State of California.
The Company is also involvedcontinuously engaged in a number of other lawsuitslitigation arising in the ordinary course of its business, typically matters alleging employment discrimination, andalleging wage and hour matters.violations or enforcing the restrictive covenants in the Company’s employment agreements. While management does not expectthere is no expectation that any of these other matters towill have a material adverse effect on the Company’s results of operations, financial position or cash flows, litigation is always subject to inherent uncertaintiesuncertainty and the Company is not at this time able to reasonably predict the outcome of these matters. Itif any matter will be resolved in a manner that is reasonably possible that some matters could be decided unfavorablymaterially adverse to the CompanyCompany. At year-end 2013 and if so, could have a material adverse impact on our consolidated financial statements. During 2010 and 2009,2012, the Company reassessed its potential exposure from pending litigation and established additional reserves of $3.5 million and $4.4 million, respectively. Thegross accrual for litigation costs at year-end 2010 and 2009 amounted to $3.6$6.9 million and $2.3$3.1 million, respectively, and is included in accounts payablerelated insurance recoveries totaled $3.1 million and accrued liabilities on the consolidated balance sheet.$0.2 million, respectively.
68
17. Segment Disclosures
The Company’s segments are based on the organizational structure for which financial results are regularly evaluated by the Company’s chief operating decision maker to determine resource allocation and assess performance. The Company’s seven reporting segments are: (1) Americas Commercial, (2) Americas Professional and Technical (“Americas PT”), (3) Europe, Middle East and Africa Commercial (“EMEA Commercial”), (4) Europe, Middle East and Africa Professional and Technical (“EMEA PT”), (5) Asia Pacific Commercial (“APAC Commercial”), (6) Asia Pacific Professional and Technical (“APAC PT”) and (7) Outsourcing and Consulting Group (“OCG”).
The Commercial business segments within the Americas, EMEA and APAC regions represent traditional office services, contact-center staffing, marketing, electronic assembly, light industrial and, in the Americas, substitute teachers. The PT segments encompass a wide range of highly skilled temporary employees, including scientists, financial professionals, attorneys, engineers, IT specialists and healthcare workers. OCG includes recruitment process outsourcing (“RPO”), contingent workforce outsourcing (“CWO”), business process outsourcing (“BPO”), payroll process outsourcing (“PPO”), executive placement and career transition/outplacement services. Corporate expenses that directly support the operating units have been allocated to the seven segmentsAmericas, EMEA and APAC regions and OCG based on a work effort, volume, or in the absence of ana readily available measurement process, proportionately based on revenue from services. Included in Corporate is $0.5 million in 2010, $53.1 million in 2009 and $80.5 million in 2008 related to asset impairment charges (see Fair Value Measurements and Goodwill footnotes) and $5.3 million in 2009 and $22.5 million in 2008 related to litigation costs.
69
2013 2012 2011 (In millions of dollars) Revenue from Services: Americas Commercial Americas PT Total Americas Commercial and PT EMEA Commercial EMEA PT Total EMEA Commercial and PT APAC Commercial APAC PT Total APAC Commercial and PT OCG Less: Intersegment revenue Consolidated Total $ 2,545.6 $ 2,642.4 $ 2,660.9 1,001.4 1,029.7 982.8 3,547.0 3,672.1 3,643.7 877.5 854.6 990.1 179.7 168.3 178.9 1,057.2 1,022.9 1,169.0 344.1 343.2 397.6 38.6 51.6 51.4 382.7 394.8 449.0 475.9 396.1 317.3 (49.7 ) (35.4 ) (28.0 ) $ 5,413.1 $ 5,450.5 $ 5,551.0
| 2010 | 2009 | 2008 | ||||||||||
| (In millions of dollars) | ||||||||||||
| Revenue from Services: | ||||||||||||
| Americas Commercial | $ | 2,428.2 | $ | 1,980.3 | $ | 2,516.7 | ||||||
| Americas PT | 889.0 | 792.6 | 938.2 | |||||||||
| Total Americas Commercial and PT | 3,317.2 | 2,772.9 | 3,454.9 | |||||||||
| EMEA Commercial | 872.0 | 895.2 | 1,310.5 | |||||||||
| EMEA PT | 147.6 | 141.9 | 172.5 | |||||||||
| Total EMEA Commercial and PT | 1,019.6 | 1,037.1 | 1,483.0 | |||||||||
| APAC Commercial | 355.3 | 284.9 | 336.0 | |||||||||
| APAC PT | 32.5 | 25.4 | 34.3 | |||||||||
| Total APAC Commercial and PT | 387.8 | 310.3 | 370.3 | |||||||||
| OCG | 254.8 | 219.9 | 233.3 | |||||||||
| Less: Intersegment revenue | (29.1 | ) | (25.4 | ) | (24.2 | ) | ||||||
| Consolidated Total | $ | 4,950.3 | $ | 4,314.8 | $ | 5,517.3 | ||||||
| Earnings (Loss) from Operations: | ||||||||||||
| Americas Commercial | $ | 79.3 | $ | 10.3 | $ | 69.9 | ||||||
| Americas PT | 46.3 | 23.2 | 48.4 | |||||||||
| Total Americas Commercial and PT | 125.6 | 33.5 | 118.3 | |||||||||
| EMEA Commercial | 6.3 | (25.7 | ) | (3.1 | ) | |||||||
| EMEA PT | 1.8 | (2.8 | ) | 2.3 | ||||||||
| Total EMEA Commercial and PT | 8.1 | (28.5 | ) | (0.8 | ) | |||||||
| APAC Commercial | 2.8 | (4.6 | ) | (0.3 | ) | |||||||
| APAC PT | (3.1 | ) | (1.5 | ) | (0.5 | ) | ||||||
| Total APAC Commercial and PT | (0.3 | ) | (6.1 | ) | (0.8 | ) | ||||||
| OCG | (17.6 | ) | (11.8 | ) | 2.9 | |||||||
| Corporate | (77.7 | ) | (133.2 | ) | (189.9 | ) | ||||||
| Consolidated Total | $ | 38.1 | $ | (146.1 | ) | $ | (70.3 | ) | ||||
70
KELLY SERVICES, INC. AND SUBSIDIARIES
17. Segment Disclosures (continued)
2013 2012 2011 (In millions of dollars) Earnings from Operations: Americas Commercial gross profit Americas PT gross profit Americas Region gross profit Americas Region SG&A expenses Americas Region Earnings from Operations EMEA Commercial gross profit EMEA PT gross profit EMEA Region gross profit EMEA Region SG&A expenses EMEA Region Earnings from Operations APAC Commercial gross profit APAC PT gross profit APAC Region gross profit APAC Region SG&A expenses APAC Region Earnings (Loss) from Operations OCG gross profit OCG SG&A expenses OCG asset impairments OCG Earnings (Loss) from Operations Less: Intersegment gross profit Less: Intersegment SG&A expenses Net Intersegment Activity Corporate Consolidated Total Other Expense, Net Earnings From Continuing OperationsBefore Taxes $ 370.2 $ 388.2 $ 375.3 163.5 159.7 147.8 533.7 547.9 523.1 (424.9 ) (405.8 ) (396.4 ) 108.8 142.1 126.7 133.6 133.8 160.3 42.6 43.0 47.4 176.2 176.8 207.7 (164.7 ) (168.1 ) (189.7 ) 11.5 8.7 18.0 49.3 50.1 55.7 14.0 21.0 20.6 63.3 71.1 76.3 (60.5 ) (73.4 ) (77.0 ) 2.8 (2.3 ) (0.7 ) 119.8 104.0 78.8 (106.4 ) (95.4 ) (81.4 ) (1.7 ) - - 11.7 8.6 (2.6 ) (3.5 ) (3.2 ) (2.6 ) 3.5 3.2 2.6 0.0 0.0 0.0 (81.5 ) (84.8 ) (83.7 ) 53.3 72.3 57.7 4.5 3.5 0.1 $ 48.8 $ 68.8 $ 57.6
KELLY SERVICES, INC. AND SUBSIDIARIES
NOTES TO CONSOLIDATED FINANCIAL STATEMENTS (continued)
17. Segment Disclosures (continued)
A summary of revenue from services by geographic area for 2010, 20092013, 2012 and 20082011 follows:
| 2010 | 2009 | 2008 | ||||||||||
| (In millions of dollars) | ||||||||||||
| Revenue From Services: | ||||||||||||
| Domestic | $ | 3,121.9 | $ | 2,634.3 | $ | 3,237.1 | ||||||
| International | 1,828.4 | 1,680.5 | 2,280.2 | |||||||||
| Total | $ | 4,950.3 | $ | 4,314.8 | $ | 5,517.3 | ||||||
2013 2012 2011 (In millions of dollars) Revenue From Services: Domestic International Total $ 3,419.9 $ 3,464.2 $ 3,445.4 1,993.2 1,986.3 2,105.6 $ 5,413.1 $ 5,450.5 $ 5,551.0
Foreign revenue is based on the country in which the legal subsidiary is domiciled. No single foreign country’s revenue was material torepresented more than 10% of the consolidated revenues of the Company.
A summary of long-lived assets information by geographic area as of the years ended 2010year-end 2013 and 20092012 follows:
| 2010 | 2009 | |||||||
| (In millions of dollars) | ||||||||
| Long-Lived Assets: | ||||||||
| Domestic | $ | 90.6 | $ | 110.5 | ||||
| International | 22.4 | 29.6 | ||||||
| Total | $ | 113.0 | $ | 140.1 | ||||
2013 2012 (In millions of dollars) Long-Lived Assets: Domestic International Total $ 74.3 $ 72.1 17.7 17.8 $ 92.0 $ 89.9
Long-lived assets include primarily property and equipment and intangible assets.equipment. No single foreign country’s long-lived assets were material torepresented more than 10% of the consolidated long-lived assets of the Company.
18. New Accounting Pronouncements
In March 2013, the FASB issued amendments to address the accounting for the cumulative translation adjustment when a parent either sells a part or all of its investment in a foreign entity or no longer holds a controlling financial interest in a subsidiary or group of assets that is a nonprofit activity or a business within a foreign entity. The amendments are effective prospectively for fiscal years (and interim reporting periods within those years) beginning after December 15, 2013 (early adoption is permitted). The adoption of this guidance is not expected to have a material effect on our results of operations, financial position or liquidity.
In July 2013, the FASB amended its guidance on the financial statement presentation of an unrecognized tax benefit when a net operating loss carryforward, similar tax loss or a tax credit carryforward exists. This guidance is effective for fiscal periods beginning after December 15, 2013, and is to be applied prospectively to all unrecognized tax benefits that exist at the effective date (retrospective and early adoption are also permitted). The amendments only affect gross versus net presentation and the adoption of this guidance is not expected to have a material effect on our results of operations, financial position or liquidity.
71
19. Selected Quarterly Financial Data (unaudited)
Fiscal Year 2013 First Quarter Second Quarter Third Quarter Fourth Quarter Year (In millions of dollars except per share data) Revenue from services Gross profit SG&A expenses Restructuring charges (credits) included in SG&A Asset impairments Earnings from continuing operations Earnings from discontinued operations, net of tax Net earnings Basic earnings per share (1) Earnings from continuing operations Earnings from discontinued operations Net earnings Diluted earnings per share (1) Earnings from continuing operations Earnings from discontinued operations Net earnings Dividends per share $ 1,314.8 $ 1,366.9 $ 1,345.6 $ 1,385.8 $ 5,413.1 216.9 220.7 220.4 231.5 889.5 209.8 202.6 200.2 221.9 834.5 - 0.8 0.5 0.3 1.6 - 1.7 - - 1.7 12.9 10.0 18.8 17.2 58.9 - - - - - 12.9 10.0 18.8 17.2 58.9 0.34 0.26 0.49 0.45 1.54 - - - - - 0.34 0.26 0.49 0.45 1.54 0.34 0.26 0.49 0.45 1.54 - - - - - 0.34 0.26 0.49 0.45 1.54 0.05 0.05 0.05 0.05 0.20
Fiscal Year 2012 | ||||||||||
First Quarter | Second Quarter | Third Quarter | Fourth Quarter | Year | ||||||
(In millions of dollars except per share data) | ||||||||||
Revenue from services | $ | 1,354.8 | $ | 1,366.1 | $ | 1,354.2 | $ | 1,375.4 | $ | 5,450.5 |
Gross profit | 223.7 | 223.2 | 227.5 | 222.2 | 896.6 | |||||
SG&A expenses | 209.0 | 199.4 | 203.5 | 209.3 | 821.2 | |||||
Restructuring charges (credits) included in SG&A | - | (2.2) | - | 1.3 | (0.9) | |||||
Asset impairments | - | - | - | 3.1 | 3.1 | |||||
Earnings from continuing operations | 9.2 | 15.0 | 16.6 | 8.9 | 49.7 | |||||
Earnings from discontinued operations, net of tax | 0.4 | - | - | - | 0.4 | |||||
Net earnings | 9.6 | 15.0 | 16.6 | 8.9 | 50.1 | |||||
Basic earnings per share (1) | ||||||||||
Earnings from continuing operations | 0.24 | 0.40 | 0.43 | 0.23 | 1.31 | |||||
Earnings from discontinued operations | 0.01 | - | - | - | 0.01 | |||||
Net earnings | 0.26 | 0.40 | 0.43 | 0.23 | 1.32 | |||||
Diluted earnings per share (1) | ||||||||||
Earnings from continuing operations | 0.24 | 0.40 | 0.43 | 0.23 | 1.31 | |||||
Earnings from discontinued operations | 0.01 | - | - | - | 0.01 | |||||
Net earnings | 0.26 | 0.40 | 0.43 | 0.23 | 1.32 | |||||
Dividends per share | 0.05 | 0.05 | 0.05 | 0.05 | 0.20 | |||||
(1) Earnings per share amounts for each quarter are required to be computed independently and Subsidiariesmay not equal the amounts computed for the total year.
| Fiscal Year 2010 | ||||||||||||||||||||
| First | Second | Third | Fourth | |||||||||||||||||
| Quarter | Quarter | Quarter | Quarter | Year | ||||||||||||||||
| (In millions of dollars except per share data) | ||||||||||||||||||||
| Revenue from services | $ | 1,130.4 | $ | 1,209.4 | $ | 1,284.7 | $ | 1,325.8 | $ | 4,950.3 | ||||||||||
| Gross profit | 180.0 | 190.9 | 207.2 | 216.4 | 794.5 | |||||||||||||||
| SG&A expenses | 181.6 | 180.9 | 192.9 | 199.0 | 754.4 | |||||||||||||||
| Restructuring charges (included in SG&A) | 4.4 | — | 2.8 | — | 7.2 | |||||||||||||||
| Asset impairments | — | 1.5 | — | 0.5 | 2.0 | |||||||||||||||
| (Loss) earnings from continuing operations | (2.0 | ) | 3.9 | 9.6 | 14.6 | 26.1 | ||||||||||||||
| Earnings from discontinued operations, net of tax | — | — | — | — | — | |||||||||||||||
| Net (loss) earnings | (2.0 | ) | 3.9 | 9.6 | 14.6 | 26.1 | ||||||||||||||
| Basic (loss) earnings per share (1) | ||||||||||||||||||||
| (Loss) earnings from continuing operations | (0.06 | ) | 0.11 | 0.26 | 0.39 | 0.71 | ||||||||||||||
| Earnings from discontinued operations | — | — | — | — | — | |||||||||||||||
| Net (loss) earnings | (0.06 | ) | 0.11 | 0.26 | 0.39 | 0.71 | ||||||||||||||
| Diluted (loss) earnings per share (1) | ||||||||||||||||||||
| (Loss) earnings from continuing operations | (0.06 | ) | 0.11 | 0.26 | 0.39 | 0.71 | ||||||||||||||
| Earnings from discontinued operations | — | — | — | — | — | |||||||||||||||
| Net (loss) earnings | (0.06 | ) | 0.11 | 0.26 | 0.39 | 0.71 | ||||||||||||||
| Dividends per share | — | — | — | — | — | |||||||||||||||
| Fiscal Year 2009 | ||||||||||||||||||||
| First | Second | Third | Fourth | |||||||||||||||||
| Quarter | Quarter | Quarter | Quarter | Year | ||||||||||||||||
| (In millions of dollars except per share data) | ||||||||||||||||||||
| Revenue from services | $ | 1,042.6 | $ | 1,028.9 | $ | 1,049.2 | $ | 1,194.1 | $ | 4,314.8 | ||||||||||
| Gross profit | 175.5 | 171.7 | 166.2 | 188.3 | 701.7 | |||||||||||||||
| SG&A expenses | 206.1 | 193.6 | 193.7 | 201.3 | 794.7 | |||||||||||||||
| Restructuring charges (included in SG&A) | 7.2 | 4.7 | 4.6 | 13.4 | 29.9 | |||||||||||||||
| Asset impairments | — | 52.6 | 0.5 | — | 53.1 | |||||||||||||||
| Loss from continuing operations | (16.1 | ) | (66.0 | ) | (14.8 | ) | (8.2 | ) | (105.1 | ) | ||||||||||
| Earnings from discontinued operations, net of tax | 0.6 | — | — | — | 0.6 | |||||||||||||||
| Net loss | (15.5 | ) | (66.0 | ) | (14.8 | ) | (8.2 | ) | (104.5 | ) | ||||||||||
| Basic (loss) earnings per share (1) | ||||||||||||||||||||
| Loss from continuing operations | (0.46 | ) | (1.89 | ) | (0.43 | ) | (0.23 | ) | (3.01 | ) | ||||||||||
| Earnings from discontinued operations | 0.02 | — | — | — | 0.02 | |||||||||||||||
| Net loss | (0.45 | ) | (1.89 | ) | (0.43 | ) | (0.23 | ) | (3.00 | ) | ||||||||||
| Diluted (loss) earnings per share (1) | ||||||||||||||||||||
| Loss from continuing operations | (0.46 | ) | (1.89 | ) | (0.43 | ) | (0.23 | ) | (3.01 | ) | ||||||||||
| Earnings from discontinued operations | 0.02 | — | — | — | 0.02 | |||||||||||||||
| Net loss | (0.45 | ) | (1.89 | ) | (0.43 | ) | (0.23 | ) | (3.00 | ) | ||||||||||
| Dividends per share | — | — | — | — | — | |||||||||||||||
KELLY SERVICES, INC. AND SUBSIDIARIES
SCHEDULE II - VALUATION RESERVES
(In millions of dollars)
Additions Balance at beginning of year Charged to costs and expenses Charged to other accounts Currency exchange effects Deductions from reserves Balance at end of year Description Fiscal year ended December 29, 2013: Reserve deducted in the balance sheetfrom the assets to which it applies - Allowance for doubtful accounts Deferred tax assets valuation allowance Fiscal year ended December 30, 2012: Reserve deducted in the balance sheetfrom the assets to which it applies - Allowance for doubtful accounts Deferred tax assets valuation allowance Fiscal year ended January 1, 2012: Reserve deducted in the balance sheetfrom the assets to which it applies - Allowance for doubtful accounts Deferred tax assets valuation allowance $ 10.4 2.5 (0.5 ) (1) - (2.5 ) $ 9.9 $ 58.4 8.7 - (1.1 ) (9.7 ) $ 56.3 $ 13.4 1.1 - 0.1 (4.2 ) $ 10.4 $ 65.4 7.1 (0.1 ) (2) 0.2 (14.2 ) $ 58.4 $ 12.3 4.3 - (0.2 ) (3.0 ) $ 13.4 $ 52.5 14.1 1.5 (2) (1.0 ) (1.7 ) $ 65.4
(1) | Adjustment to provision for sales allowances charged to revenue from services. |
(2) | Allowance of companies acquired. |
INDEX TO EXHIBITS REQUIRED BY ITEM 601, REGULATION S-K | ||
Exhibit No. | Description | |
72
| Additions | ||||||||||||||||||||||||
| Balance at | Charged to | Charged to | Currency | Deductions | Balance | |||||||||||||||||||
| beginning | costs and | other | exchange | from | at end | |||||||||||||||||||
| of year | expenses | accounts * | effects | reserves | of year | |||||||||||||||||||
| Description | ||||||||||||||||||||||||
| Fiscal year ended January 2, 2011: | ||||||||||||||||||||||||
| Reserve deducted in the balance sheet from the assets to which it applies — | ||||||||||||||||||||||||
| Allowance for doubtful accounts | $ | 15.0 | 2.1 | — | (0.2 | ) | (4.6 | ) | $ | 12.3 | ||||||||||||||
| Deferred tax assets valuation allowance | $ | 52.7 | 6.1 | — | (1.0 | ) | (5.3 | ) | $ | 52.5 | ||||||||||||||
| Fiscal year ended January 3, 2010: | ||||||||||||||||||||||||
| Reserve deducted in the balance sheet from the assets to which it applies — | ||||||||||||||||||||||||
| Allowance for doubtful accounts | $ | 17.0 | 2.2 | — | 0.6 | (4.8 | ) | $ | 15.0 | |||||||||||||||
| Deferred tax assets valuation allowance | $ | 44.2 | 7.5 | — | 2.3 | (1.3 | ) | $ | 52.7 | |||||||||||||||
| Fiscal year ended December 28, 2008: | ||||||||||||||||||||||||
| Reserve deducted in the balance sheet from the assets to which it applies — | ||||||||||||||||||||||||
| Allowance for doubtful accounts | $ | 18.2 | 6.7 | 0.9 | (1.4 | ) | (7.4 | ) | $ | 17.0 | ||||||||||||||
| Deferred tax assets valuation allowance | $ | 28.7 | 24.9 | — | (6.2 | ) | (3.2 | ) | $ | 44.2 | ||||||||||||||
3.1 |
73
| Restated Certificate of Incorporation, effective May 6, 2009 (Reference is | ||||||||
3.2 | By-laws, effective May 6, 2009 (Reference is made to Exhibit 3.2 to the | |||||||
10.1* | Kelly Services, Inc. Short-Term Incentive Plan, as amended and restated | |||||||
10.2* | Kelly Services, Inc. Equity Incentive Plan, as amended and restated on December 31, 2011 (Reference is made to Exhibit 10.2 to the Form | |||||||
10.3* | Kelly Services, Inc. Executive Severance Plan dated April 4, 2006, as amended November 8, 2007 (Reference is made to Exhibit 10.3 to the Form | |||||||
10.4* | Kelly Services, Inc. | |||||||
10.5* | Kelly Services, Inc. 2008 Non-Employee | |||||||
10.6 | Amended and restated five-year, secured, revolving credit agreement, dated | |||||||
10.7* | Kelly Services, Inc. Performance Incentive Plan, as amended and restated on March 29, 1996 and April 14, 2000 (Reference is made to Exhibit 10 to the Form 10-Q for the quarterly period ended April 1, 2001, filed with the Commission on May 14, 2001, which is incorporated herein by reference). | |||||||
10.8* | Form of Amendment to Performance Incentive Plan (Reference is made to Exhibit 10.1 to the Form 8-K filed with the Commission on November 9, 2006, which is incorporated herein by reference). | |||||||
| 10.9* | Retirement Agreement (Reference is made to Exhibit 10.9 to the Form 10-K filedwith the Commission on February 14, 2013, which is incorporated herein by reference). | |||||||
10.10* | Severance Agreement. | |||||||
74
INDEX TO EXHIBITS REQUIRED BY ITEM 601, REGULATION S-K (continued) | |
Exhibit No. | Description |
10.12* | Kelly Services, Inc. 2008 Management Retirement Plan – Post 2004 (Reference is made to Exhibit 10.12 to the Form 10-Q filed with the Commission on November 7, 2012, which is incorporated herein by reference). |
10.13* | First Amendment to the Kelly Services, Inc. 2008 Management Retirement Plan (Reference is made to Exhibit 10.13 to the Form 10-Q filed with the Commission on November 7, 2012, which is incorporated herein by reference). |
10.14 | Pledge and Security Agreement, dated September 28, 2009 (Reference is made to Exhibit 10.14 to the Form 8-K filed with the Commission on September 29, 2009, which is incorporated herein by reference). |
10.15 | Receivables Purchase Agreement, dated December 4, 2009 (Reference is made to Exhibit 10.17 to the Form 8-K filed with the Commission on December 9, 2009, which is incorporated herein by reference). |
10.16 | Receivables Purchase Agreement Amendment No. 2 (Reference is made to Exhibit 10.16 to the Form 8-K filed with the Commission on April 6, 2011, which is incorporated herein by reference). |
10.17 | Receivables Purchase Agreement Amendment No. 3 (Reference is made toExhibit 10.17 to the Form 10-Q filed with the Commission on November 6, 2013,which is incorporated herein by reference). |
10.18 | First Amendment to Amended and Restated Credit Agreement, dated December 11, 2013 (Reference is made to Exhibit 10.18 to the Form 8-K filed with the Commission on December 13, 2013, which is incorporated herein by reference). |
10.19 | Annex A to First Amendment to Amended and Restated Credit Agreement, dated December 11, 2013 (Reference is made to Exhibit 10.19 to the Form 8-K filed with the Commission on December 13, 2013, which is incorporated herein by reference). |
10.20 | Receivables Purchase Agreement Amendment No. 4, dated December 11, 2013 (Reference is made to Exhibit 10.20 to the Form 8-K filed with the Commission on December 13, 2013, which is incorporate herein by reference). |
| 14 | Code of Business Conduct and Ethics, adopted February 9, 2004, as amended on November 9, 2010 (Reference is made to Exhibit 14 to the Form 10-K filed with the Commission on February 17, 2011, which is incorporated herein by reference). |
21 | Subsidiaries of Registrant. |
23 | Consent of Independent Registered Public Accounting Firm. |
24 | Power of Attorney. |
| Exhibit No. | Description | Document | ||||||
| 10.10 | Form of Amendment to 1999 Non-Employee Directors Stock Option Plan (Reference is made to Exhibit 10.4 to the Form 8-K filed with the Commission on November 9, 2006, which is incorporated herein by reference). | |||||||
| 10.12 | 2008 Management Retirement Plan (Reference is made to Exhibit 10.12 to the Form 8-K filed with the Commission on November 14, 2007, which is incorporated herein by reference). | |||||||
| 10.14 | Pledge and Security Agreement, dated September 28, 2009 (Reference is made to Exhibit 10.14 to the Form 8-K filed with the Commission on September 29, 2009, which is incorporated herein by reference). | |||||||
| 10.15 | Receivables Purchase Agreement, dated December 4, 2009 (Reference is made to Exhibit 10.17 to the Form 8-K filed with the Commission on December 9, 2009, which is incorporated herein by reference). | |||||||
| 14 | Code of Business Conduct and Ethics, adopted February 9, 2004, as amended on November 9, 2010. | 2 | ||||||
| 21 | Subsidiaries of Registrant. | 3 | ||||||
| 23 | Consent of Independent Registered Public Accounting Firm. | 4 | ||||||
| 24 | Power of Attorney. | 5 | ||||||
| 31.1 | Certification Pursuant to Rule 13a-14(a)/15d-14(a). | 6 | ||||||
| 31.2 | Certification Pursuant to Rule 13a-14(a)/15d-14(a). | 7 | ||||||
| 32.1 | Certification Pursuant to 18 U.S.C. Section 1350, as Adopted Pursuant to Section 906 of the Sarbanes-Oxley Act of 2002. | 8 | ||||||
| 32.2 | Certification Pursuant to 18 U.S.C. Section 1350, as Adopted Pursuant to Section 906 of the Sarbanes-Oxley Act of 2002. | 9 | ||||||
INDEX TO EXHIBITS REQUIRED BY ITEM 601, REGULATION S-K (continued) | |
Exhibit No. | Description |
31.1 | Certification Pursuant to Rule 13a-14(a)/15d-14(a) of the Securities Exchange Act, as amended. |
31.2 | Certification Pursuant to Rule 13a-14(a)/15d-14(a) of the Securities Exchange Act, as amended. |
32.1 | Certification Pursuant to 18 U.S.C. Section 1350, as Adopted Pursuant to Section 906 of the Sarbanes-Oxley Act of 2002. |
32.2 | Certification Pursuant to 18 U.S.C. Section 1350, as Adopted Pursuant to Section 906 of the Sarbanes-Oxley Act of 2002. |
101.INS | XBRL Instance Document |
101.SCH | XBRL Taxonomy Extension Schema Document |
101.CAL | XBRL Taxonomy Extension Calculation Linkbase Document |
101.LAB | XBRL Taxonomy Extension Label Linkbase Document |
101.PRE | XBRL Taxonomy Extension Presentation Linkbase Document |
101.DEF | XBRL Taxonomy Extension Definition Linkbase Document |
75
*Indicates a management contract or compensatory plan or arrangement.
78