they are settled or as they are marked to market for each reporting period. See “— Quantitative and Qualitative Disclosures about Market Risk”.
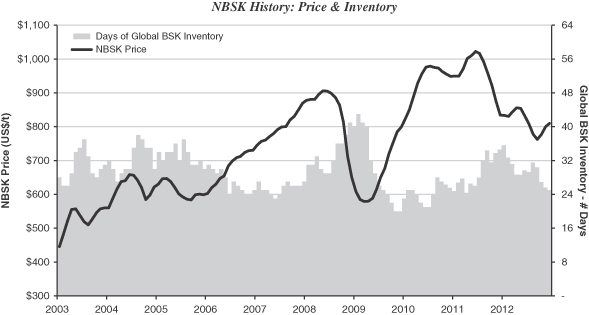
approximately 2529 days’ supply, while at the end of 20092011 inventories for softwood kraft reached historically low levels ofwere approximately 19 days, primarily due to exceptionally high demand combined with producer shutdowns.
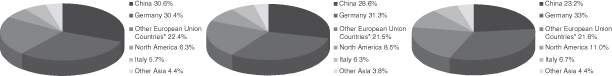
36 days’ supply.Pulp sales volume decreased slightlyincreased by approximately 3% to 1,428,638a record 1,473,519 ADMTs in 20102012 from 1,445,4611,427,924 ADMTs in 2009.
2011, primarily as a result of increased sales to China in 2012.Pulp production increased to a record level of 1,426,2861,468,275 ADMTs in 20102012 from 1,397,4411,453,677 ADMTs in 2009,2011, primarily as a result of overall strong operating performancedue to increased pulp production at all of our Stendal and Celgar mills. In 20102012 and 2009,2011, we took a total of 3140 and 4335 days scheduled maintenance downtime, respectively, at our mills and expect to take approximately 3935 days in 2011.
2013.Costs and expenses increasedmarginally decreased to €732.8€785.1 million in the year ended December 31, 20102012 from €632.6€788.4 million in 2009,2011, primarily due to lower fiber costs, partially offset by higher fiber costs.
pulp sales volumes in 2012. Our costs and expenses in 2012 included approximately €13.9 million for regularly scheduled maintenance costs, compared to €17.4 million in 2011. Several competing producers and members of the peer group that we benchmark our performance against now report their financial results in accordance with International Financial Reporting Standards which permit a significant portion of such maintenance costs to be capitalized instead of expensed. Such costs are not charged to EBITDA by the peer group companies but instead are expensed as depreciation.On average, in 2010,2012, our per unit fiber costs increaseddecreased by approximately 24%7% compared to 2009. In Germany,2011, primarily due to lower fiber costs were higher, primarily as a result of lower levels of harvesting, combined with increasedin Germany caused by decreased demand for wood from the energy sector for heatingEuropean particle board industry and other bio-energy purposes. Extreme winter weather in the fourth quarter of 2010 further reduced the availability ofregional residual fiber for our German mills.users. Fiber costs at our Celgar mill increased marginally fromwere higher, primarily due to the prior year. Inimpact of foreign exchange changes more than offsetting improved wood chip availability for the near term, weregion. We currently expect fiber costs to increase slightly at our German mills while remaining generally flat at our Celgar mill.
to increase slightly in the short—to mid-term, primarily due to higher demand from pellet and board producers which has been compounded by winter weather conditions limiting wood supply, though we expect these costs to be partially offset by price decreases in Canada as a result of strong sawmill activity in British Columbia.Operating depreciation and amortization increased to €57.8 million in 2012 from €55.8 million in 2011. Selling, general and administrative expenses increasedmarginally decreased to €33.4€38.3 million in 20102012 from €27.4€38.8 million in 2009, primarily as a result of increased commission costs.
In 2010, contribution to income from the sale of emission allowances decreased to €0.1 million, compared to €0.5 million in 2009. Operating depreciation and amortization increased marginally to €55.9 million in 2010 from €53.9 million in 2009, primarily due to capital asset additions related to the Celgar Energy Project.
2011.For the year ended December 31, 2010,2012, operating income significantly increaseddecreased to €167.7€49.0 million from a loss of €12.8€111.1 million in 2009,2011, primarily due to higher pricelower average pulp sales realizations, resulting from higher pulp prices.
partially offset by a stronger U.S. dollar relative to the Euro and lower fiber costs.Interest expense in 2010 increased2012 decreased to €67.6€55.8 million from €64.8€59.0 million in 2009,2011, primarily due to accretion expense related to the exchange of our 2010 Convertible Notes, partially offset by reduced debt levels of debt associated with our Stendal mill.
mill and the conversion of our remaining convertible notes in 2011.Transportation costs increased to €66.4€71.8 million in 20102012 from €57.3€67.8 million in 2009,2011, primarily due toas a result of higher container rates.
sales volumes and the impact of foreign exchange on our shipments from Celgar.In 2010,2012, we recorded an unrealized gain of €1.9€1.7 million on the Stendal Interest Rate Swap Contracts,Contract, compared to an unrealized loss of €5.8€1.4 million in 2009,2011, which was primarily the result of a smallan increase in short-term European interest rates.
We entered into various fixed pulp swap contracts with a bank in 2012. Under the first contract, 5,000 metric tonnes, referred to as “MT”, of pulp per month was fixed at a price of $915 per MT for each month between May and December of 2012. Under contracts entered into in November 2012, 3,000 MT of pulp per month is fixed at prices ranging from $880 to $890 per MT per month and expire in December 2013. We recorded a gain of approximately €2.0 million related to these swap contracts during the year ended December 31, 2012.A portion of our long-term debt is denominated and repayable in foreign currencies, principally U.S. dollars. In 2010,2012, we recorded neither a foreign exchange loss or gain on our debt, of €6.1 million as a result of the strengthening of the U.S. dollar against the Euro, compared to a gain of €2.7€1.2 million in 2009.
During 2010, we2011.We recorded losses on the extinguishment of debt of €7.5€0.1 million in each of 2012 and 2011, primarily in connection with the purchase and extinguishment of some of our 2013outstanding Senior Notes.
In 2009, we recorded a gain of €4.4 million on the extinguishment of our 2010 Convertible Notes.
In 2010,2012, the noncontrolling shareholder’s proportionate interest in the Stendal mill’s gainincome was €8.5€1.7 million, compared to a loss of €9.9€3.9 million in 2009.
During 2010, income taxes increased to €3.9 million from2011.In 2012, deferred tax recoveries were €0.1 million, compared to deferred tax recoveries of €2.4 million in 2009,2011, primarily due to improved operating results at our German millsthe timing of recognizing deferred tax assets based on forecasted income.
In 2012, we reported net loss of €12.2 million, or €0.22 per basic and certain tax deduction limitations with regards to the ability to deductdiluted share. This included an unrealized non-cash gain of €1.7 million on Stendal interest expenserate derivatives and loss carry forwards. Deferred tax recoveries increased in 2010 to €9.8a realized gain of €1.2 million from €6.0and an unrealized gain of €0.8 million in 2009, primarily due to improved results and forecasted taxable income.
on pulp price derivatives. In 2010,2011, we reported net income attributable to common shareholders of €86.3€50.1 million, or €2.24€1.00 per basic and €1.56€0.89 per diluted share. This included unrealized aggregate net non-cash unrealized losses of € 0.5 million, comprised of a non-cash gainloss of €1.9€1.4 million on our Stendal Interest Rate Swap Contracts, a non-cash foreign
46
In 2010, capital expenditures related to the Celgar Energy Project totaled approximately €26.2 million, substantially all of which was financed through a C$48.0 million grant from the Canadian federal government under the GTP. See “Item 1 — Business — Generation and Sales of ‘Green’ Energy at our Mills”.
Debt
As at December 31, 2010, the amount outstanding under Stendal Loan Facility was €500.7 million. We also had approximately C$20.0 million outstanding under the Celgar Working Capital Facility and €3.8 million under our Rosenthal investment loan. As at December 31, 2010, we had no amount drawn on the Rosenthal Loan Facility.
Additionally, we have $300 million (€224.0 million) in principal amount of our 2017 Senior Notes outstanding which mature in December 2017 and for which we pay interest at the rate of 9.5% on June 1 and December 1 of each year. The indenture governing the 2017 Senior Notes does not contain any financial maintenance covenants and there are no scheduled principal payments until maturity. We also had approximately $20.5 million in aggregate principal amount of our 2013 Senior Notes remaining as at December 31, 2010 which were all redeemed on February 15, 2011.
Further, we had approximately $42.5 million (€31.7 million) in aggregate principal amount of 2012 Convertible Notes outstanding as of December 31, 2010. The indenture governing the 2012 Convertible Notes does not have any financial maintenance covenants.
For a description of the Senior Notes, the 2010 Convertible Notes and the 2012 Convertible Notes, see “Item 1 — Business — Description of Certain Indebtedness”.
Debt Covenants
Our long-term obligations contain various financial tests and covenants customary to these types of arrangements.
The Stendal Loan Facility contains an annual debt service cover ratio which, pursuant to the terms of the Amendment, must not fall below 1.1x for the period from December 31, 2011 to December 31, 2013 and 1.2x for the period after January 1, 2014 until maturity on September 30, 2017. The Amendment also implements a permitted leverage ratio of total debt to EBITDA which is effective from December 31, 2009. This ratio, which the lenders waived for 2009, is set to decline over time from 13.0x on its effective date to 4.5x on June 30, 2017. Failure to comply with either ratio constitutes an event of default, but may be cured by the shareholders of Stendal with aonce-per-fiscal-year ratio deficiency cure through a capital contribution or subordinated loan in the amount necessary to cure such deficiency.
Under the Rosenthal Loan Facility, our Rosenthal mill must not exceed a ratio of net debt to EBITDA of 3:1 in any12-month period and there must be a ratio of EBITDA to interest expense equal to or in excess of 1.2:1.1 for each 12 month period. Additionally, current assets to current liabilities must equal or exceed 1.1:1.0.
The Celgar Working Capital Facility includes a covenant that, for so long as the excess amount under the facility is less than C$2.0 million, then until it becomes equal to or greater than such amount, the Celgar mill must maintain a fixed charge coverage ratio of not less than 1.1:1.0 for each12-month period.
As at December 31, 2010, we were in full compliance with all of the covenants of our indebtedness.
Cash Flow Analysis
Cash Flows from Operating Activities.Activities.We operate in a cyclical industry and our operating cash flows vary accordingly. Our principal operating cash expenditures are for labor, fiber, chemicals and debt service.
Working capital levels fluctuate throughout the year and are affected by maintenance downtime, changing sales patterns, seasonality and the timing of receivables and the payment of payables and expenses. Generally, finished goods inventories are increased prior to scheduled maintenance downtime to maintain sales volume while production is stopped. Our fiber inventories exhibit seasonal swings as we increase pulp log and wood chip inventories to ensure adequate supply of fiber to our mills during the winter months. Changes in sales volume can
51
affect the level of receivables and influence overall working capital levels. We believe our management practices with respect to working capital conform to common business practices.
OperatingCash provided by operating activities in 2012 declined to €46.0 million from €111.1 million in 2011 and €91.3 million in 2010 due to decreased operating income as a result of lower average pulp sales realizations. A decrease in receivables, excluding non-cash items, provided cash of €91.3€8.4 million in 2012, compared to providingincreases in receivables using cash of €37.3€1.6 million in 2009, primarily due to a significant increase in net income, partially offset by an increase in working capital. An increase in receivables used cash of2011 and €40.0 million in 2010,2010. A decrease in inventories provided cash of €1.3 million in 2012, compared to a decreaseincreases in receivables providinginventories using cash of €31.9€17.7 million in 2009. An increase in inventories used cash of2011 and €24.5 million in 2010, compared to a decrease in inventories providing cash of €32.2 million in 2009.2010. A decrease in accounts payable and accrued expenses used cash of €14.0 million in 2012, compared to an increase in accounts payable and accrued expenses providing cash of €14.3 million in 2011 and a decrease in accounts payable and accrued expenses using cash of €3.1 million in 2010 and €3.0 million in 2009.
2010.Cash Flows from Investing Activities.Investing activities in 2012 used cash of €23.8 million, primarily related to capital expenditures of €36.7 million. The maturity of government bonds in 2012 provided cash of €12.2 million. Investing activities in 2011 used cash of €46.3 million, primarily due to capital spending of €37.8 million and the purchase of marketable securities of €12.2 million. Investing activities in 2010 used cash of €36.0 million, primarily due to capital spending of €38.3 million. Investing activities in 2009
In 2012, capital expenditures, primarily related to Project Blue Mill and the recovery boiler upgrade at our Rosenthal mill, used cash of €15.2 million,€36.7 million. In 2011, capital expenditures, primarily duerelated to €28.8 millionvarious projects at our mills, used cash of capital spending being only partially offset by a drawdown of €13.0 million from the Stendal Loan Facility’s DSRA.
€37.8 million. In 2010, capital expenditures, primarily related to the Celgar Energy Project, used cash of €25.6€38.3 million. In the same period last year, capital expenditures related to the Celgar Energy Project used cash of €13.4 million.
Excluding costs for projects being financed through government grants under the GTP, we expect our consolidated capital expenditures in 2011 to total approximately €24.1 million, comprised of an array of small projects at our mills.
Cash Flows from Financing Activities.In 2012, financing activities used net cash of €22.9 million, primarily due to €24.6 million used to repay principal under the Stendal Loan Facility and €1.6 million to purchase and extinguish some of our Senior Notes. In 2012, we received €3.9 million in government grants. In 2011, financing activities used net cash of €60.1 million, primarily due to using cash of €15.2 million to redeem all of our remaining 2013 Senior Notes, €23.2 million to repay principal under the Stendal Loan Facility, €14.7 million to repay the balance of our Celgar Working Capital Facility, €7.5 million to purchase shares of our common stock and €9.7 million to purchase and extinguish some of our Senior Notes. In 2011, we received
€14.2 million in government grants. In 2010, financing activities used net cash of €6.1 million, primarily due to cash used to repurchase our 2013 Senior Notes and €13.9 million in cash used to pay down the Stendal Loan Facility, partially offset by the receipt of €16.7 million in government grants for the Celgar Energy Project and the proceeds received from the sale of the 2017 Senior Notes, being more than offset byNotes.
Balance Sheet Data
The following table is a summary of selected financial information for the dates indicated:
| | | | | | | | |
| | | December 31, | |
| | | 2012 | | | 2011 | |
| | | (in thousands) | |
Financial Position | | | | | | | | |
Cash and cash equivalents | | € | 104,239 | | | € | 105,072 | |
Marketable securities | | | 184 | | | | 12,372 | (1) |
Working capital | | | 208,573 | | | | 247,159 | |
Total assets | | | 1,183,603 | | | | 1,217,250 | |
Long-term liabilities | | | 768,253 | | | | 807,641 | |
Total equity | | | 278,925 | | | | 283,542 | |
| (1) | Principally comprised of German federal government bonds with a maturity of less than one year. |
Sources and Uses of Funds
Our principal sources of funds are cash used to repurchaseflows from operations, cash and cash equivalents on hand and the revolving working capital loan facilities for our 2013 Senior NotesCelgar and €13.9 million in cash used to pay down the Stendal Loan Facility. Financing activities used cashRosenthal mills. Our principal uses of €13.3 million in 2009 primarily due tofunds consist of operating expenditures, payments of principal repayments underand interest on the Stendal Loan Facility, capital expenditures and interest payments on our outstanding Senior Notes.
As at December 31, 2012, our cash and cash equivalents were €104.2 million, compared to cash and cash equivalents and short-term German federal government bonds aggregating €117.3 million at the end of €13.92011.
As at December 31, 2012, we had approximately €26.2 million and C$24.0 million available under our Rosenthal and Celgar facilities, respectively.
In 2013, excluding amounts being financed through government grants, we currently expect capital expenditures to be approximately €29.0 million, primarily related to Project Blue Mill and various smaller projects at all of our mills. In 2012, we committed to implementing Project Blue Mill at a cost of €40.0 million, which will primarily be funded through €12.0 million of which €13.0 million was funded from the DSRA under the facility,non-refundable German government grants and the repayment€17.0 million Blue Mill Facility. The balance of Project Blue Mill will be funded through operating cash flow of the Stendal mill and up to an aggregate €6.5 million in pro rata shareholder loans from us and Stendal’s noncontrolling shareholder.
As at December 31, 2012, other then planned capital lease obligations of €3.2 million which were partially offset by government investment grants of €9.1 million primarily for the Celgar Energy Project.
Capital Resources
We haveexpenditures, we had no material commitments to acquire assets or operating businesses.
Future Liquidity
Our ability to make scheduled payments of principal, or to pay interest on or to refinance our indebtedness, or to fund planned expenditures will depend on our future performance, which is subject to general economic, financial and other factors that are beyond our control.
Based upon the current level of operations and our current expectations for future periods in light of the current economic environment, and in particular, current and expected pulp pricing and foreign exchange rates, we believe that cash flow from operations and available cash, together with available borrowings under our Celgar Working Capital Facility and Rosenthal Loan Facility, will be adequate to meet the future liquidity needs during the next 12 months.
In the future we may make acquisitions of businesses or assets or commitments to additional capital projects. To achieve the long-term goals of expanding our assets and earnings, including through acquisitions, capital resources will be required. Depending on the size of a transaction, the capital resources that will be required can be substantial. The necessary resources will be generated from cash flow from operations, cash on hand, borrowing against our assets or the issuance of securities.
Debt and Debt CovenantsWe had the following amounts outstanding under our debt facilities as at the dates indicated:
| | | | | | | | |
| | | December 31, | |
| | | 2012 | | | 2011 | |
| | | (in thousands) | |
Rosenthal Loan Facility | | € | — | | | € | — | |
Rosenthal Investment Loan | | | 1,632 | | | | 2,719 | |
Rosenthal revolving €3.5 million facility | | | — | | | | — | |
Celgar Working Capital Facility | | | 4,574 | | | | — | |
Senior Notes | | | 215,670 | | | | 220,753 | |
Stendal Loan Facility | | | 452,907 | | | | 477,490 | |
Blue Mill Facility | | | — | | | | n/a | |
For a description of such indebtedness, see “Item 1—Business—Description of Certain Indebtedness”.
Certain of our long-term obligations contain various financial tests and covenants customary to these types of arrangements.
The Stendal Loan Facility contains an annual debt service cover ratio which, pursuant to the terms of the Amendment, must not fall below 1.1x for the period from December 31, 2011 to December 31, 2013 and 1.2x for the period after January 1, 2014 until maturity on September 30, 2017. The Amendment also implements a permitted leverage ratio of total debt to EBITDA which is effective from December 31, 2009. This ratio is set to decline over time from 13.0x on its effective date to 4.5x on June 30, 2017. Failure to comply with either ratio constitutes an event of default, but may be cured by the shareholders of Stendal with a once-per-fiscal-year ratio deficiency cure through a capital contribution or subordinated loan in the amount necessary to cure such deficiency. The Stendal Blue Mill Facility requires the Stendal mill to maintain similar debt service and leverage ratios as the Stendal Loan Facility and contains similar cure provisions.
Under the Rosenthal Loan Facility, our Rosenthal mill must not exceed a ratio of net debt to EBITDA of 3:1 in any 12-month period and there must be a ratio of EBITDA to interest expense equal to or in excess of 1.2:1.0 for each 12 month period. Additionally, current assets to current liabilities must equal or exceed 1.1:1.0.
The Celgar Working Capital Facility includes a covenant that, for so long as the excess amount under the facility is less than C$2.0 million, then until it becomes equal to or greater than such amount, the Celgar mill must maintain a fixed charge coverage ratio of not less than 1.1:1.0 for each 12-month period.
The Stendal Loan Facility is provided by a syndicate of eleven financial institutions, the Stendal Blue Mill Facility by two financial institutions and each of our Celgar Working Capital Facility and our Rosenthal Loan Facility are provided by one financial institution. To date we have not experienced any reductions in credit availability with respect to these credit facilities. However, if any of these financial institutions were to default on their commitment to fund, we could be adversely affected.
The indenture governing the Senior Notes does not contain any financial maintenance covenants and there are no scheduled principal payments until maturity. We pay interest on our Senior Notes at the rate of 9.5% on June 1 and December 1 of each year and they mature in December 2017.
As at December 31, 2012, we were in full compliance with all of the covenants of our indebtedness.
Off-Balance-Sheet Activities
At December 31, 20102012 and 2009,2011, we had no off-balance-sheet arrangements.
52
Interest expense for the Restricted Group increaseddecreased to €31.5€23.4 million in 20102012 from €27.4€24.9 million in 2009,2011, primarily due to the accretion expense related to the exchangeconversion of our 2010 Convertible Notes.
convertible notes in 2011.Most of the long-term debt of the Restricted Group is denominated and repayable in foreign currencies, principally in U.S. dollars. In 2012, the Restricted Group recorded neither a loss nor gain on foreign currency denominated debt, compared to a gain of €1.2 million in 2011.
The Restricted Group recorded a loss of approximately €0.1 million on the purchase and subsequent extinguishment of some of our Senior Notes in each of 2012 and 2011.
During 2012, the Restricted Group recorded €5.5 million of net income tax expense, compared to €4.6 million in 2011.
For the reasons discussed above, the Restricted Group reported net loss for 2012 of €14.2 million, compared to net income of €39.8 million in 2011 and Operating EBITDA of €39.1 million, compared to Operating EBITDA of €93.0 million in the comparative period of 2011. See the discussion of our results for the year ended December 31, 2012 compared to the year ended December 31, 2011 for the definition of Operating EBITDA, significant limitations in Operating EBITDA as an analytical tool and additional information relating to such limitations and Operating EBITDA.
The following table provides a reconciliation of net income (loss) to operating income and Operating EBITDA for the Restricted Group for the periods indicated:
| | | | | | | | |
| | | Year Ended December 31, | |
| | | 2012 | | | 2011 | |
| | | (in thousands) | |
Restricted Group(1) | | | | | | | | |
Net income (loss) | | € | (14,221 | ) | | € | 39,809 | |
Income tax provision | | | 5,482 | | | | 4,614 | |
Interest expense | | | 23,425 | | | | 24,886 | |
Gain on derivative instruments | | | (2,028 | ) | | | — | |
Foreign exchange (gain) loss on debt | | | — | | | | (1,175 | ) |
Loss on extinguishment of debt | | | 81 | | | | 71 | |
Other income | | | (5,108 | ) | | | (5,262 | ) |
| | | | | | | | |
Operating income | | | 7,631 | | | | 62,943 | |
Add: Depreciation and amortization | | | 31,471 | | | | 30,086 | |
| | | | | | | | |
Operating EBITDA | | € | 39,102 | | | € | 93,029 | |
| | | | | | | | |
| (1) | See Note 20 of the financial statements included in this annual report on Form 10-K for a reconciliation to our consolidated results. |
Year Ended December 31, 2011 Compared to Year Ended December 31, 2010
Pulp revenues for the Restricted Group for the year ended December 31, 2011 slightly decreased by approximately 3% to €474.0 million from €490.0 million in the comparative period of 2010, primarily due to a weaker U.S. dollar. In 2011, revenues from the sale of excess energy increased by 68% to a record €25.5 million from €15.1 million in 2010, primarily due to record annual energy sales at both our Rosenthal and Celgar mills.
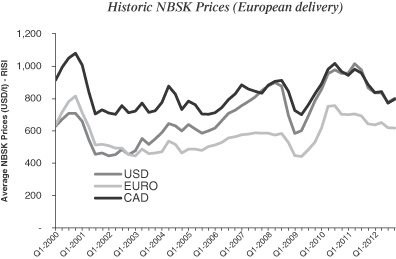
Pulp prices were higher in 2011 than in 2010. Average list prices for NBSK pulp in Europe were $956 (€687) per ADMT in 2011, compared to $938 (€707) per ADMT in 2010. In China, average list prices were $834 (€599) per ADMT in 2011 and $821 (€618) per ADMT in 2010. In 2011, average pulp sales realizations for the Restricted Group decreased by approximately 3% to €575 per ADMT from €592 per ADMT in the previous year.
Pulp sales volume of the Restricted Group marginally decreased to 823,183 ADMTs in 2011 from 826,340 ADMTs in 2010.
Pulp production for the Restricted Group increased to 832,396 ADMTs in 2011 from 826,301 ADMTs in 2010, primarily as a result of record annual production at our Rosenthal mill. In 2011, our Celgar and Rosenthal mills had an aggregate of 20 days (approximately 24,500 ADMTs) of scheduled maintenance downtime, compared to 21 days (approximately 25,300 ADMTs) of scheduled maintenance downtime in 2010.
Costs and expenses for the Restricted Group in 2011 increased to €436.5 million from €411.5 million in 2010, primarily due to higher fiber costs.
Overall, per unit fiber costs of the Restricted Group increased by approximately 9% in 2011 compared to 2010, primarily due to higher fiber costs at our Celgar mill caused by increased competition for fiber.
In 2011, operating depreciation and amortization for the Restricted Group decreased marginally to €29.8 million from €30.0 million in the same period last year.
Selling, general and administrative expenses increased to €24.1 million from €20.2 million in 2010, primarily as a result of a higher non-cash stock compensation expense resulting from a higher share price and increased foreign exchange losses.
In 2011, the Restricted Group reported operating income of €62.9 million, compared to operating income of €93.7 million in 2010, primarily due to higher fiber costs in 2011 and a weaker U.S. dollar.
Transportation costs for the Restricted Group marginally increased to €50.8 million in 2011 from €50.5 million in 2010.
Interest expense for the Restricted Group decreased to €24.9 million in 2011 from €31.5 million in 2010, primarily due to the conversion of our convertible notes in 2011.
Most of the long-term debt of the Restricted Group is denominated and repayable in foreign currencies, principally in U.S. dollars. In 2011, the Restricted Group recorded a non-cash lossgain on foreign currency denominated debt of €6.1€1.2 million, as a result of the strengthening of the U.S. dollar compared to the Euro during the first half of 2010, compared to a gainloss of €2.7€6.1 million in 2009.
2010.During 2011, the Restricted Group recorded a loss of approximately €0.1 million on the purchase and subsequent extinguishment of some of our Senior Notes. In 2010, the Restricted Group recorded a loss of approximately €7.5 million on the extinguishment of the 2013 Senior Notes. In 2009,
During 2011, the Restricted Group recorded a gain of approximately €4.4 million on the extinguishment of the 2010 Convertible Notes.
During 2010, the Restricted Group recorded €8.7€4.6 million of net income tax recoveries,expense, compared to net income tax recoveries of €0.2€8.7 million in 2009.2010, primarily due to the timing of recognizing deferred tax assets based on forecasted income. The tax recoveries reflectin 2010 reflected our expectation that certain of our tax assets will be utilized to reduce taxable income in the future.
For the reasons discussed above, the Restricted Group reported net income for 20102011 of €39.8 million, compared to net income of €62.3 million compared to a net loss of €35.9 million in 20092010 and Operating EBITDA of €124.0€93.0 million, compared to Operating EBITDA of €6.8€124.0 million in the comparative period of 2009. Operating EBITDA is defined as operating income (loss) plus depreciation and amortization and non-recurring capital asset impairment charges. Operating EBITDA has significant limitations as an analytical tool, and should not be considered in isolation, or as a substitute for analysis of our results as reported under GAAP.2010. See the discussion of our consolidated results for the year ended December 31, 20102012 compared to the year ended December 31, 20092011 for the definition of Operating EBITDA, significant limitations in Operating EBITDA as an analytical tool and additional information relating to such limitations and Operating EBITDA.
The following table provides a reconciliation of net income (loss) attributable to common shareholders to operating income (loss) and Operating EBITDA for the Restricted Group for the periods indicated:
| | | | | | | | | |
| | | Years Ended December 31, | |
| | | 2010 | | | 2009 | |
| | | (in thousands) | |
| |
Restricted Group(1) | | | | | | | | |
| Net income (loss) | | € | 62,327 | | | € | (35,927 | ) |
| Income taxes (benefits) | | | (8,651 | ) | | | (183 | ) |
| Interest expense | | | 31,498 | | | | 27,351 | |
| Investment (income) loss | | | (5,103 | ) | | | (5,002 | ) |
| Foreign exchange (gain) loss on debt | | | 6,126 | | | | (2,692 | ) |
| Loss (gain) on extinguishment of debt | | | 7,494 | | | | (4,447 | ) |
| | | | | | | | | |
| Operating income (loss) | | | 93,691 | | | | (20,900 | ) |
| Add: Depreciation and amortization | | | 30,270 | | | | 27,704 | |
| | | | | | | | | |
| Operating EBITDA | | € | 123,961 | | | € | 6,804 | |
| | | | | | | | | |
| | | | | | | | |
| | | Year Ended December 31, | |
| | | 2011 | | | 2010 | |
| | | (in thousands) | |
Restricted Group(1) | | | | | | | | |
Net income | | € | 39,809 | | | € | 62,327 | |
Income tax (benefits) | | | 4,614 | | | | (8,651 | ) |
Interest expense | | | 24,886 | | | | 31,498 | |
Foreign exchange (gain) loss on debt | | | (1,175 | ) | | | 6,126 | |
Loss on extinguishment of debt | | | 71 | | | | 7,494 | |
Other income | | | (5,262 | ) | | | (5,103 | ) |
| | | | | | | | |
Operating income | | | 62,943 | | | | 93,691 | |
Add: Depreciation and amortization | | | 30,086 | | | | 30,270 | |
| | | | | | | | |
Operating EBITDA | | € | 93,029 | | | € | 123,961 | |
| | | | | | | | |
| (1) | | |
(1) | | See Note 1920 of the financial statements included in this annual report on Form10-K for a reconciliation to our consolidated results. |
Liquidity and Capital ResourcesRestricted Group Results — Year Ended December 31, 2009 Compared to Year Ended December 31, 2008
Pulp revenues for the Restricted Group in 2009 decreased to €318.4 million from €401.0 million in 2008, primarily due to lower sales realizations. Revenues from the saleSummary of excess energy were €15.2 million in 2009 compared to €12.1 million in 2008.
Pulp prices decreased in the first half of 2009 due to deteriorating global economic conditions but increased in the second half of 2009, primarily as a result of stronger demand and the weakening of the U.S. dollar. List prices for NBSK pulp in Europe were approximately $667 (€478) per ADMT in 2009, compared to approximately $839 (€571) in 2008.
55
At December 31, 2010,Sources and Uses of Funds of the Restricted Group hadThe Restricted Group’s principal sources of funds are cash flows from operations, cash and cash equivalents on hand and the revolving working capital loan facilities for our Celgar and Rosenthal mills. The Restricted Group’s principal uses of €50.7funds consist of operating expenditures, capital expenditures and interest payments on our outstanding Senior Notes.
As at December 31, 2012, the Restricted Group’s cash and cash equivalents were €36.7 million, compared to €20.6cash and cash equivalents and short-term German federal government bonds aggregating €57.0 million at the end of 2009. At December 31, 2010, the Restricted Group had working capital of €150.7 million.
2011.As at December 31, 2010,2012, we had not drawn any amount€26.2 million available under the credit facilities related to the Rosenthal mill and C$24.0 million under the Celgar Working Capital Facility.
In 2013, excluding amounts being financed by governmental grants, we currently expect capital expenditures to be approximately €11.5 million, primarily for various small projects at the Rosenthal and Celgar mills.
We expect the Restricted Group to meet its interest and debt service obligations and meet the working and maintenance capital requirements for its current operations from cash flow from operations, cash and cash equivalents on hand, the Rosenthal Loan Facility and had drawn C$20.0 million under the C$40.0 million Celgar Working Capital Facility.
In the future we may make acquisitions of businesses or assets or commitments to additional projects. To achieve the long-term goals of expanding our assets and earnings, including through acquisitions, capital resources will be required. Depending on the size of a transaction, the capital resources that will be required can be substantial. The necessary resources will be generated from cash flow from operations, cash on hand, borrowing against our assets or the issuance of securities.
Credit Ratings of Senior Notes
Standard & Poor’s Rating Services, (“Sreferred to as “S&P”), and Moody’s Investors Service, Inc. (“Moody’s”), referred to as “Moody’s”, base their assessment of ourthe credit risk on our Senior Notes on the business and financial profile of the Restricted Group only. Factors that may affect our credit rating include changes in our operating performance and liquidity. Credit rating downgrades can adversely impact, among other things, future borrowing costs and access to capital markets.
During the second quarter of 2010,2011, we were subject to improved rating actions by Moody’s and S&P. In May 2010,July 2011, S&P raised its target creditratings on the Senior Notes to B+ from B and improved its recovery rating from “4” to B from B- with a stable“3”. The improved ratings outlook to reflect temporaryour balance sheet deleveraging in the first half of 2011 and S&P’s belief that demand for NBSK pulp supply shortagesshould remain robust and the strengthening of pulp markets. S&P believes that weour liquidity position should be able to maintain sufficient liquidity to support this new credit rating. The B rating also reflected the expectation that we would continue to benefit from favorable foreign exchange rates resulting from the strength of the U.S. dollar relative to the Euro.
improve.In June 2010,November 2011, Moody’s upgraded our Corporate Family Ratingits outlook from “stable” to B3 from Caa1. Subsequently, on November 5, 2010, Moody’s further upgraded“positive” while keeping the rating to B2 from B3 with a stable rating outlook.for our Senior Notes at B3. In December 2012, Moody’s cited the upgrade reflects earnings improvement, modest debt reduction and lingering strength in market pulp prices are expected to benefit our liquidity profile and capital structure. Furthermore, material improvements made to Celgar’s cost structure and the completion of the Celgar Energy Project are expected to strengthen future earnings potential and soften the impact of market downturns.
Additionally, Moody’s assigned amaintained its B3 rating tofor our 2017 Senior Notes, while S&P assigned a B rating with a recovery rating of 4.
We expect the Restricted Groupchanging its outlook to meet its interest and debt service obligations and meet the working and maintenance capital requirements for its current operations from cash flow from operations, cash on hand, the Rosenthal Loan Facility and the Celgar Working Capital Facility.
“stable”.Critical Accounting Policies
The preparation of financial statements and related disclosures in conformity with GAAP requires management to make estimates and assumptions that affect both the amount and the timing of recording of assets, liabilities, revenues and expenses in the consolidated financial statements and accompanying note disclosures. Our management routinely makes judgments and estimates about the effects of matters that are inherently uncertain. As the number of variables and assumptions affecting the probable future resolution of the uncertainties increase, these judgments become even more subjective and complex.
Our significant accounting policies are disclosed in Note 1 to our audited annual consolidated financial statements included in Part IV of this annual report. While all of the significant accounting policies are important to the consolidated financial statements, some of these policies may be viewed as having a high degree of judgment. On an ongoing basis using currently available information, management reviews its estimates, including those related to accounting for, pensions and post-retirement benefits, provisions for bad debt andamong other things, doubtful accounts derivative instruments,and reserves, depreciation and amortization, future cash flows associated with impairment oftesting for long-lived assets, deferred taxes, inventory provisions andderivative financial instruments, environmental conservation and legal liabilities.liabilities, asset retirement obligations, pensions and post-retirement benefit obligations, income taxes, contingencies, and inventory obsolescence and provisions. Actual estimatesresults could differ materially from these estimates.
estimates, and changes in these estimates are recorded when known.The following accounting policies require management’s most difficult, subjective and complex judgments, and are subject to a fair degree of measurement uncertainty.
Derivative Instruments.We occasionally enter into derivative financial instruments, including foreign currency forward contracts, electricity forward contracts, interest rate swaps and pulp price swaps to limit exposures to changes in foreign currency exchange rates, energy prices, interest rates, and pulp prices. These derivative instruments are not designated as hedging instruments. Derivative instruments are measured at fair value and reported in theour balance sheet as assets or liabilities. Accounting for gains or losses depends onThe change in fair value of electricity derivative contracts is included in operating costs in our Consolidated Statement of Operations and any changes in the intended usefair value of theforeign currency, interest rate and pulp price derivative instruments. Gains or lossescontracts are recognized in gain (loss) on derivative instruments in our Consolidated Statement of Operations. Periodically, we enter into derivative contracts to supply materials for our own use, which are not designated hedges for accounting purposes are recognized in earnings in the period of the change in fair value. Gains or losses on derivative instruments formally designated as hedges are recognized in either earnings or other comprehensive income.
58
Energy Price Risk
We are subject to some electricityenergy price risk, primarily for natural gas purchases. Our electricity price risks are mitigated by the electricity thatability of all of our operations purchase.
| |
| ITEM 8. | FINANCIAL STATEMENTS AND SUPPLEMENTARY DATA |
The consolidated financial statements and supplementary data required with respect to this Item 8, and as listed in Item 15 of this annual report onForm 10-K, are included in this annual report onForm 10-K commencing on page 72.
| |
| ITEM 9. | CHANGES IN AND DISAGREEMENTS WITH ACCOUNTANTS ON ACCOUNTING AND FINANCIAL DISCLOSURE |
| |
| ITEM 9A. | CONTROLS AND PROCEDURES |
Evaluation of Disclosure Controls and Procedures
Our management, with the participation of our principal executive officer and principal financial officer, has evaluated the effectiveness of our disclosure controls and procedures (as such term is defined inRules 13a-15(e)
and15d-15(e) under the Exchange Act), as of the end of the period covered by this annual report onForm 10-K. Disclosure controls and procedures include, without limitation, controls and procedures designed to ensure that information required to be disclosed in the reports we file or submit under the Exchange Act is accumulated and communicated to management, including our principal executive officer and principal financial officer, as appropriate, to allow timely decisions regarding required disclosure. Based on such evaluation, our principal executive officer and principal financial officer have concluded that, as of the end of the period covered by this report, our disclosure controls and procedures are effective in recording, processing, summarizing and reporting, on a timely basis, information required to be disclosed by us in the reports that we file or submit under the Exchange Act.
It should be noted that any system of controls is based in part upon certain assumptions designed to obtain reasonable (and not absolute) assurance as to its effectiveness, and there can be no assurance that any design will succeed in achieving its stated goals.
Management’s Report on Internal Control Over Financial Reporting
Our management is responsible for establishing and maintaining adequate internal control over financial reporting. Mercer Inc.’s internal control over financial reporting is designed to provide reasonable assurance regarding the reliability of financial reporting and the preparation of financial statements for external purposes in accordance with generally accepted accounting principles.
Our internal control over financial reporting includes those policies and procedures that:
Pertain to the maintenance of records that, in reasonable detail, accurately and fairly reflect the transactions and dispositions of the assets of Mercer;
Provide reasonable assurance that transactions are recorded as necessary to permit preparation of financial statements in accordance with generally accepted accounting principles, and that receipts and expenditures are being made only in accordance with authorizations of management and directors; and
| | |
| • | Pertain to the maintenance of records that, in reasonable detail, accurately and fairly reflect the transactions and dispositions of the assets of Mercer; |
|
| • | Provide reasonable assurance that transactions are recorded as necessary to permit preparation of financial statements in accordance with generally accepted accounting principles, and that receipts and expenditures are being made only in accordance with authorizations of management and directors; and |
|
| • | Provide reasonable assurance regarding prevention or timely detection of unauthorized acquisition, use or disposition of assets that could have a material effect on the financial statements. |
Provide reasonable assurance regarding prevention or timely detection of unauthorized acquisition, use or disposition of assets that could have a material effect on the financial statements.
Because of its inherent limitations, internal control over financial reporting may not prevent or detect misstatements. Also, projections of any evaluation of effectiveness to future periods are subject to the risk that controls may become inadequate because of changes in conditions, or that the degree or compliance with the policies or procedures may deteriorate.
64
Management assessed the effectiveness of Mercer Inc.’s internal control over financial reporting as of December 31, 2010.2012. In making this assessment, management used the criteria set forth inInternal Control-Integrated Framework, as issued by the Committee of Sponsoring Organizations of the Treadway Commission. Based on our assessment and those criteria, management believes that Mercer Inc. maintained effective internal control over financial reporting as of December 31, 2010.
Mercer Inc.’s independent registered chartered accountants have issued an audit report on Mercer Inc.’s2012.The effectiveness of Mercer’s internal control over financial reporting as of December 31, 2012 has been audited by PricewaterhouseCoopers LLP, an independent registered public accounting firm, as stated in their report which appears below.
Changes in Internal Controls
There have been no changes in our internal control over financial reporting (as defined inRules 13a-15(f) and15d-15(f) under the Exchange Act) during the year ended December 31, 20102012 that have materially affected, or are reasonably likely to materially affect, our internal control over financial reporting.
| |
| ITEM 9B. | OTHER INFORMATION |
65
PART III
| |
| ITEM 10. | DIRECTORS, EXECUTIVE OFFICERS AND CORPORATE GOVERNANCE |
We are governed by a board of directors, referred to as the “Board”, each member of which is elected annually. The following sets forth information relating to our directors and executive officers.
Jimmy S.H. Lee, age 53,55, has been a director since May 1985 and President and Chief Executive Officer since 1992. Previously, during the period that MFC Bancorp Ltd. was our affiliate, he served as a director from 1986 and President from 1988 to December 1996 when it was spun out. During Mr. Lee’s tenure with Mercer, we acquired the Rosenthal mill and converted it to the production of kraft pulp, constructed and commenced operations at the Stendal mill and acquired the Celgar mill.
Kenneth A. Shields, age 62, has been a director since August 2003. Mr. Shields is the Chairman and Chief Executive Officer of Conifex Timber Inc., a public Canadian company operating in the forestry and sawmilling sector. Mr. Shields was formerly a member of the board of directors of Raymond James Financial, Inc., and retired as Chief Executive Officer of its Canadian subsidiary, Raymond James Ltd., in February 2006. Mr. Shields has served as past Chairman of the Investment Dealers Association of Canada and Pacifica Papers Inc., and is a former director of each of Slocan Forest Products Ltd., TimberWest Forest Corp. and the Investment Dealers Association of Canada.
William D. McCartney, age 55, has been a director since January 2003. Mr. McCartney has been President and Chief Executive Officer of Pemcorp Management Inc., a management services company, since 1990. Mr. McCartney is also a member of the Institute of Chartered Accountants in Canada.
Guy W. Adams, age 59, has been a director since August 2003. Mr. Adams is the managing member of GWA Advisors, LLC, GWA Investments, LLC and GWA Capital Partners, LLC, where he has served since 2002. GWA Investments is an investment fund investing in publicly traded securities managed by GWA Capital Partners, LLC, a registered investment advisor. Prior to 2002, Mr. Adams was the President of GWA Capital, which he founded in 1996 to invest his own capital in public and private equity transactions, and a business consultant to entities seeking refinancing or recapitalization.
Eric Lauritzen, age 72,74, has been a director since June 2004. Mr. Lauritzen was President and Chief Executive Officer of Harmac Pacific, Inc., a North American producer of softwood kraft pulp previously listed on the Toronto Stock Exchange and acquired by Pope & Talbot Inc. in 1998, from May 1994 to July 1998, when he retired. Mr. Lauritzen was Vice President, Pulp and Paper Marketing of MacMillan Bloedel Limited, a North American pulp and paper company previously listed on the Toronto Stock Exchange and acquired by Weyerhaeuser Company Limited in 1999, from July 1981 to April 1994.
William D. McCartney, age 57, has been a director since January 2003. Mr. McCartney has been President and Chief Executive Officer of Pemcorp Management Inc., a management services company, since 1990. Mr. McCartney is also a member of the Institute of Chartered Accountants in Canada.
Graeme A. Witts, age 72,74, has been a director since January 2003. Mr. Witts organized Sanne Trust Company Limited, a trust company located in the Channel Islands, in 1988 and was managing director from 1988 to 2000, when he retired. He is now managing director of Azure Property Group, SA, a European hotel group. Mr. Witts is also a fellow of the Institute of Chartered Accountants of England and Wales and has previous executive experience with the Procter & Gamble Company and Clarks Shoes, as well as government auditing.
George MalpassGuy W. Adams, age 71,61, has been a director since November 2006.August 2003. Mr. MalpassAdams is the managing member of GWA Advisors, LLC, GWA Investments, LLC and GWA Capital Partners, LLC, where he has served since 2002. GWA Investments is an investment fund investing in publicly traded securities managed by GWA Capital Partners, LLC, a registered investment advisor. Prior to 2002, Mr. Adams was the President of GWA Capital, which he founded in 1996 to invest his own capital in public and private equity transactions, and a business consultant to entities seeking refinancing or recapitalization.
Bernard Picchi, age 63, has been a director since June 2011. Mr. Picchi has been the Managing Director of Private Wealth Management for Palisade Capital Management, LLC since July 2009. Prior to 2009, Mr. Picchi has been an analyst and consultant for several mid-sized broker/dealers and investment advisory firms. In particular, from 1980 to 1999, Mr. Picchi was an All Star rated energy analyst at Solomon Brothers, Kidder Peabody and Lehman Brothers, where he also served as Director of U.S. Stock Research. Mr. Picchi has also been the sole manager of the 5-Star rated $1.5 billion Capital Appreciation Fund of Federated Investors, where he served as U.S. Director of Research from January 2000 to June 2002. Mr. Picchi is also a Chartered Financial Analyst.
James Shepherd, age 60, has been a director since June 2011. Mr. Shepherd was President and Chief Executive Officer of Canfor Corporation from 2004 to 2007 and Slocan Forest Products Ltd. from 1999 to 2004. Mr. Shepherd is also the former President of Crestbrook Forest Industries Ltd. and Finlay Forest Industries Limited and is the former Chairman of the Forest Products Association of Canada. Mr. Shepherd has been a director with Canfor Corporation, which is listed on the Toronto Stock Exchange, from 2004 to 2007 and has been a director of Canfor Pulp Income Fund from 2006 to 2007. Mr. Shepherd is also currently a director of Conifex Timber Inc. He, which is listed on the TSX Venture Exchange, and Buckman Laboratories International Inc.
Keith Purchase, age 68, has been a director since April 2012. Mr. Purchase was formerly theExecutive Vice-President and Chief Operating Officer of MacMillan Bloedel Ltd. from 1998 to 1999, President and Chief Executive Officer of TimberWest Forest Ltd. from 1994 to 1998 and Managing Director of Tasman Pulp and Paper from 1990 to 1994. Mr. Purchase is currently a director of Primex Forest Products Ltd. andHardwoods Distribution Inc., which is currently listed on the Toronto Stock Exchange. Mr. Purchase was also a formertrustee of Tree Island Wire Income Fund from 2003 to 2007 (and Chair of the board of directors from 2006 to 2007) which is listed on the Toronto Stock Exchange and was a director of both International Forest Products Ltd. and Riverside Forest Products Ltd.
Catalyst Paper Corporation from 2001 to 2007 (and Chair of the board of directors from 2005 to 2007).David M. Gandossi, age 53,55, has been Secretary, Executive Vice-President and Chief Financial Officer since August 15, 2003. Mr. Gandossi was formerly the Chief Financial Officer and Executive Vice-President of Formation Forest Products (a closely held corporation) from June 2002 to August 2003. Mr. Gandossi previously served as Chief Financial Officer, Vice-President, Finance and Secretary of Pacifica Papers Inc., a North American specialty pulp and paper manufacturing company previously listed on the Toronto Stock Exchange, from December 1999 to August 2001 and Controller and Treasurer from June 1998 to December 1999. From June 1998 to August 31, 1998, he also served as Secretary to Pacifica Papers Inc. From March 1998 to June 1998, Mr. Gandossi served as Controller, Treasurer and Secretary of MB Paper Ltd. From April 1994 to March 1998, Mr. Gandossi held
66
the position of Controller and Treasurer with Harmac Pacific Inc., a Canadian pulp manufacturing company previously listed on the Toronto Stock Exchange. Mr. Gandossi participated in the Pulp and Paper Advisory Committee of the British Columbia Competition Council and was a member of the British Columbia Working Roundtable on Forestry. From February 2007 to present, he has chaired the B.C. Pulp and Paper Task Force, a government industry and labor effort that is mandated to identify measures to improve the competitiveness of the British Columbia pulp and paper industry. Mr. Gandossi is a member of the Institute of Chartered Accountants in Canada.
Claes-Inge Isacson, age 65,67, has been our Chief Operating Officer since November 2006 and is based in our Berlin office. Mr. Isacson brings over 24 years of senior level pulp and paper management to our senior management team, with a focus on kraft pulp. Mr. Isacson held the positions of President Norske Skog Europe, and then Senior Vice President Production for Norske Skogindustrier ASA between 1989 and 2004. His most recent position was President, AF Process, a consulting and engineering company working worldwide. He holds a Masters of Science, Mechanical Engineering.
Richard Short, age 43, has been our Controller since December 2010, prior to which he was our Director, Corporate Finance, since joining Mercer in 2007. Prior to joining Mercer, Mr. Short was Controller, Financial Reporting from 2006 to 2007 and Director, Corporate Finance from 2004 to 2006 with Catalyst Paper Corp. Mr. Short is a member of the Institute of Chartered Accountants in Canada.
Leonhard Nossol, age 53,55, has been our Group Controller for Europe since August 2005. He has also been a managing director of Rosenthal since 1997 and the sole managing director of Rosenthal since September 2005. Mr. Nossol had a significant involvement in the conversion of the Rosenthal mill to the production of kraft pulp in 1999 and increases in the mill’s annual production capacity to 330,000355,000 ADMTs, as well as the reduction in production costs at the mill.
Richard Short, age 45, has been our Controller since December 2010, prior to which he was our Director, Corporate Finance, since joining Mercer in 2007. Prior to joining Mercer, Mr. Short was Controller, Financial Reporting from 2006 to 2007 and Director, Corporate Finance from 2004 to 2006 with Catalyst Paper Corp. Mr. Short is a member of the Institute of Chartered Accountants in Canada.
David M. Cooper, age 57,59, has been Vice President of Sales and Marketing for Europe since June 2005. Mr. Cooper previously held a variety of senior positions around the world in Sappi Ltd., a large global forest products group, from 1982 to 2005, including the sales and marketing of various pulp and paper grades and the management of a manufacturing facility. He has more than 2530 years of diversified experience in the international pulp and paper industry.
Eric X. Heine, age 47,49, has been Vice President of Sales and Marketing for North America and Asia since June 2005. Mr. Heine was previously Vice President Pulp and International Paper Sales and Marketing for
Domtar Inc., a global pulp and paper corporation, from 1999 to 2005. He has over 18 years of experience in the pulp and paper industry, including developing strategic sales channels and market partners to build corporate brands.
Wolfram Ridder, age 49,51, was appointed Vice President of Business Development in August 2005, prior to which he was a managing director of Stendal. Mr. Ridder was the principal assistant to our Chief Executive Officer from November 1995 until September 2002.
Genevieve Stannus, age 40,42, has been our Treasurer since July 2005, prior to which she was a Senior Financial Analyst with Mercer from August 2003. Prior to joining Mercer, Ms. Stannus held Senior Treasury Analyst positions with Catalyst Paper Corporation and Pacifica Papers Inc. She has over ten yearsyears’ experience in the forest products industry. Ms. Stannus is a member of the Certified General Accountants’ Association of Canada.
Niklaus Gruenenfelder, age 53, became the Managing Director of Stendal in January 2009. Previously, from 1989 until 2006, Mr. Gruenenfelder held a variety of positions in Switzerland, China, Germany and Pakistan with Swiss chemicals manufacturer Ciba Specialty Chemicals Holding Inc. (formerly Ciba-Geigy AG). In 2006, Huntsman Corporation, a global chemical and chemical products company, acquired the textile effects business from Ciba and Mr. Gruenenfelder was the Managing Director and Head of Technical Operations at Huntsman’s Langweid am Leich plant in Germany from 2006 until he joined Mercer. Mr. Gruenenfelder holds a Ph.D. in Technical Science and an MBA.
Brian Merwin, age 37,39, has been our Vice President of Strategic Initiatives since February 2009, prior to which he was our Director of Strategic and Business Initiatives since August 2007 and Business Analyst since May 2005. BrianMr. Merwin has an MBA from the Richard Ivey School of Business at the University of Western Ontario.
67
We also have experienced mill managers at all of our mills who have operated through multiple business cycles in the pulp industry.
The Board met fiveten times during 20102012 and each current member of the Board attended 75% or more100% of the total number of such meetings and meetings of the committees of the Board on which they serve during their term. In addition, our independent directors regularly meet in separate executive sessions without any member of our management present. The Lead Director presides over these meetings. Although we do not have a formal policy with respect to attendance of directors at our annual meetings, all directors are encouraged and expected to attend such meetings if possible. All of our directors attended our 20102012 annual meeting.
The Board has developed corporate governance guidelines in respect of: (i) the duties and responsibilities of the Board, its committees and officers; and (ii) practices with respect to the holding of regular quarterly and strategic meetings of the Board including separate meetings of non-management directors. The Board has established four standing committees, the Audit Committee, the Compensation and Human Resource Committee, the Governance and Nominating Committee and the Environmental, Health and Safety Committee.
Audit Committee
The Audit Committee was established in accordance with Section 3(a)(58)(A) of the Exchange Act and functions pursuant to a charter adopted by the directors. A copy of the current charter is incorporated by reference in the exhibits to thisForm 10-K and is available on our website atwww.mercerint.com under the “Governance” link. The function of the Audit Committee generally is to meet with and review the results of the audit of our financial statements performed by the independent public accountants and to recommend the selection of independent public accountants. The members of the Audit Committee are Mr. McCartney, Mr. WittsAdams and Mr. Lauritzen,Shepherd, each of whom is independent under applicable laws and regulations and the listing requirements of the NASDAQ Global Market. Both Mr. McCartney and Mr. Witts are Chartered Accountants and Mr. McCartney is a Chartered Accountant and a “financial expert” within the meaning of such term under theSarbanes-Oxley Act of 2002. The Audit Committee met four times during 2010.
2012.The Audit Committee has established procedures for: (i) the receipt, retention and treatment of complaints received by us regarding accounting, internal accounting controls or auditing matters; and (ii) the confidential and anonymous submission by our employees and others of concerns regarding questionable accounting or
auditing matters. A person wishing to notify us of such a complaint or concern should send a written notice thereof, marked “Private & Confidential”, to the Chairman of the Audit Committee, Mercer International Inc.,c/o Suite 2840, P.O. Box 11576, 6501120, 700 West GeorgiaPender Street, Vancouver, British Columbia, Canada V6B 4N8.
V6C 1G8.
Compensation and Human Resource Committee
The Board has established a Compensation and Human Resource Committee. The Compensation and Human Resource Committee is responsible for reviewing and approving the strategy and design of our compensation, equity-based and benefits programs. The Compensation and Human Resource Committee functions pursuant to a charter adopted by the directors, a copy of which is available on our website atwww.mercerint.com in the Corporate Governance Guidelines under the “Governance” link. The Compensation and Human Resource Committee is also responsible for approving all compensation actions relating to executive officers. The members of the Compensation and Human Resource Committee are Mr. Malpass,Picchi, Mr. LauritzenWitts and Mr. Adams,Purchase, each of whom is independent under applicable laws and regulations and the listing requirements of the NASDAQ Global Market. The Compensation and Human Resource Committee met sixfour times during 2010.
Governance and Nominating Committee
The Board has established a Governance and Nominating Committee comprised of Mr. Shields,Lauritzen, Mr. McCartney and Mr. Witts, each of whom is independent under applicable laws and regulations and the listing requirements of the NASDAQ Global Market. The Governance and Nominating Committee functions pursuant to a charter adopted by the directors, a copy of which is incorporated by reference in the exhibits to thisForm 10-K and is available on our website atwww.mercerint.com in the Corporate Governance Guidelines under the “Governance” link. The purpose of the committee is to: (i) manage the corporate governance system of the Board; (ii) assist the Board in fulfilling its duties to meet applicable legal and regulatory and self-regulatory business principles and
68
codes of best practice; (iii) assist in the creation of a corporate culture and environment of integrity and accountability; (iv) in conjunction with the Lead Director, monitor the quality of the relationship between the Board and management; (v) review management succession plans; (vi) recommend to the Board nominees for appointment to the Board; (vii) lead the Board’s annual review of the Chief Executive Officer’s performance; and (viii) set the Board’s forward meeting agenda. The Governance and Nominating Committee met four times in 2010.
2012.Environmental, Health and Safety Committee
The Board established an Environmental, Health and Safety Committee in 2006, currently comprised of Mr. Lauritzen,Shepherd, Mr. MalpassPurchase and Mr. Lee, to review on behalf of the Board the policies and processes implemented by management, and the resulting impact and assessments of all our environmental, health and safety related activities. The Environmental, Health and Safety Committee functions pursuant to a charter adopted by the directors, a copy of which is available on our website atwww.mercerint.com in the Corporate Governance Guidelines under the “Governance” link. More specifically, the Environmental, Health and Safety Committee is to: (i) review and approve, and if necessary revise, our environmental, health and safety policies and environmental compliance programs; (ii) monitor our environmental, health and safety management systems including internal and external audit results and reporting; and (iii) provide direction to management on the frequency and focus of external independent environmental, health and safety audits. The Environmental, Health and Safety Committee met four times in 2010.
Lead Director/Deputy Chairman
The Board appointed Mr. ShieldsLauritzen as its Lead Director in September 2003 and in 2006 as Deputy Chairman of the Board.2012. The role of the Lead Director is to provide leadership to the non-management directors on the Board and to ensure that the Board can operate independently of management and that directors have an independent leadership contact. The duties of the Lead Director include, among other things: (i) ensuring that the Board has adequate resources to support its decision-making
process and ensuring that the Board is appropriately approving strategy and supervising management’s progress against that strategy; (ii) ensuring that the independent directors have adequate opportunity to meet to discuss issues without management being present; (iii) chairing meetings of directors in the absence of the Chairman and Chief Executive Officer; (iv) ensuring that delegated committee functions are carried out and reported to the Board; and (v) communicating to management, as appropriate, the results of private discussions among outside directors and acting as a liaison between the Board and the Chief Executive Officer.
Code of Business Conduct and Ethics
The Board has adopted a Code of Business Conduct and Ethics that applies to our directors, employees and executive officers. The code is incorporated by reference in the exhibits to thisForm 10-K and is available on our website atwww.mercerint.com under the “Governance” link. A copy of the code may also be obtained without charge upon request to Investor Relations, Mercer International Inc., Suite 2840, P.O. Box 11576, 6501120, 700 West GeorgiaPender Street, Vancouver, British Columbia, Canada V6B 4N8V6C 1G8 (Telephone:(604) 684-1099) or Investor Relations, Mercer International Inc., 14900 Interurban Avenue South, Suite 282, Seattle WA, U.S.A. 98168 (Telephone:(206) 674-4639).
Section 16(a) Beneficial Ownership Reporting Compliance
The information required under “Section 16(a) Beneficial Ownership Reporting Compliance” is incorporated by reference from the proxy statement relating to our annual meeting to be held in 2011,2013, which will be filed with the SEC within 120 days of our most recently completed fiscal year.
| |
| ITEM 11. | EXECUTIVE COMPENSATION |
The information required by this Item 11 is incorporated by reference from the proxy statement relating to our annual meeting to be held in 2011,2013, which will be filed with the SEC within 120 days of our most recently completed fiscal year.
69
| |
| ITEM 12. | SECURITY OWNERSHIP OF CERTAIN BENEFICIAL OWNERS AND MANAGEMENT AND RELATED STOCKHOLDER MATTERS |
The information required by this Item 12 is incorporated by reference from the proxy statement relating to our annual meeting to be held in 2011,2013, which will be filed with the SEC within 120 days of our most recently completed fiscal year.
| |
| ITEM 13. | CERTAIN RELATIONSHIPS AND RELATED TRANSACTIONS, AND DIRECTOR INDEPENDENCE |
Review, Approval or Ratification of Transactions with Related Persons
Pursuant to the terms of the Audit Committee Charter, the Audit Committee is responsible for reviewing and approving the terms and conditions of all proposed transactions between us, any of our officers, directors or shareholders who beneficially own more than 5% of our outstanding shares of common stock, or relatives or affiliates of any such officers, directors or shareholders, to ensure that such related party transactions are fair and are in our overall best interest and that of our shareholders. In the case of transactions with employees, a portion of the review authority is delegated to supervising employees pursuant to the terms of our written Code of Business Conduct and Ethics.
The Audit Committee has not adopted any specific procedures for conduct of reviews and considers each transaction in light of the facts and circumstances. In the course of its review and approval of a transaction, the Audit Committee considers, among other factors it deems appropriate:
Whether the transaction is fair and reasonable to us;
The business reasons for the transaction;
| | |
| • | Whether the transaction is fair and reasonable to us; |
|
| • | The business reasons for the transaction; |
|
| • | Whether the transaction would impair the independence of one of our non-employee directors; and |
|
| • | Whether the transaction is material, taking into account the significance of the transaction. |
Whether the transaction would impair the independence of one of our non-employee directors; and
Whether the transaction is material, taking into account the significance of the transaction.
Any member of the Audit Committee who is a related person with respect to a transaction under review may not participate in the deliberations or vote respecting approval or ratification of the transaction, provided, however, that such director may be counted in determining the presence of a quorum at a meeting of the committee that considers the transaction.
The information called for by Items 404(a) and 407(a) ofRegulation S-K required to be included under this Item 13 is incorporated by reference from the proxy statement relating to our annual meeting to be held in 2011,2013, which will be filed with the SEC within 120 days of our most recently completed fiscal year.
| |
| ITEM 14. | PRINCIPAL ACCOUNTANT FEES AND SERVICES |
The information required by this Item 14 is incorporated by reference from the proxy statement relating to our annual meeting to be held in 2011,2013, which will be filed with the SEC within 120 days of our most recently completed fiscal year.
70
PART IV| ITEM 15. | EXHIBITS, FINANCIAL STATEMENTS |
(a) (1)Financial Statements
| |
ITEM 15. | EXHIBITS, FINANCIAL STATEMENT SCHEDULES |
| | | | |
| | | Page |
| |
| | | 7385 | |
| | | 7487 | |
| | | 7588 | |
| | | 7689 | |
| | | 7790 | |
| | | 7891 | |
| | | 7993 | |
| | | | | |
| | 2 | .1 | | Agreement and Plan of Merger among Mercer International Inc., Mercer International Regco Inc. and Mercer Delaware Inc. dated December 14, 2005. Incorporated by reference to the Proxy Statement/Prospectus filed on December 15, 2005. |
| | 3 | .1 | | Articles of Incorporation of the Company, as amended. Incorporated by reference fromForm 8-A dated March 1, 2006. |
| | 3 | .2 | | Bylaws of the Company. Incorporated by reference fromForm 8-A dated March 1, 2006. |
| | 4 | .1 | | Indenture dated as of December 10, 2004 between Mercer International Inc. and Wells Fargo Bank, National Association. Incorporated by reference fromForm S-3 filed December 10, 2004. |
| | 4 | .2 | | First Supplemental Indenture dated February 14, 2005 to Indenture dated December 10, 2004 between Mercer International Inc. and Wells Fargo Bank, National Association. Incorporated by reference fromForm 8-K dated February 17, 2005. |
| | 4 | .3 | | Indenture dated as of December 10, 2009 between Mercer International Inc. and Wells Fargo Bank, National Association. Incorporated by reference fromForm 8-K dated December 11, 2009. |
| | 4 | .4 | | Second Supplemental Indenture dated as of November 16, 2010 to the Indenture dated December 10, 2004 between Mercer International Inc. and Wells Fargo Bank, National Association. Incorporated by reference fromForm 8-K dated November 19, 2010. |
| | 4 | .5 | | Indenture dated as of November 17, 2010 between Mercer International Inc. and Wells Fargo Bank, National Association. Incorporated by reference fromForm 8-K dated November 19, 2010. |
| | 4 | .6 | | Registration Rights Agreement among Mercer International Inc. and RBC Capital Markets, LLC and Credit Suisse Securities (USA) LLC dated November 17, 2010. Incorporated by reference fromForm 8-K dated November 19, 2010. |
| | 10 | .1* | | Project Financing Facility Agreement dated August 26, 2002 between Zellstoff Stendal GmbH and Bayerische Hypo-und Vereinsbank AG, as amended by Amendment, Restatement and Undertaking Agreement dated January 31, 2009. |
| | 10 | .2 | | Shareholders’ Undertaking Agreement dated August 26, 2002 among Mercer International Inc., Stendal Pulp Holdings GmbH, RWE Industrie-Lösungen GmbH, AIG Altmark Industrie AG and FAHR Beteiligungen AG and Zellstoff Stendal GmbH and Bayerische Hypo-und Vereinsbank AG. Incorporated by reference fromForm 8-K dated September 10, 2002. |
| | 10 | .3* | | Shareholders’ Agreement dated August 26, 2002 among Zellstoff Stendal GmbH, Stendal Pulp Holdings GmbH, RWE Industrie-Lösungen GmbH and FAHR Beteiligungen AG. |
| | 10 | .4* | | Contract for the Engineering, Design, Procurement, Construction, Erection andStart-Up of a Kraft Pulp Mill between Zellstoff Stendal GmbH and RWE Industrie-Lösungen GmbH dated August 26, 2002. Certain non-public information has been omitted from the appendices to Exhibit 10.4 pursuant to a request for confidential treatment filed with the SEC. Such non-public information was filed with the SEC on a confidential basis. The SEC approved the request for confidential treatment in January 2004. |
| | 10 | .5* | | Form of Trustee’s Indemnity Agreement between Mercer International Inc. and its Trustees. |
71
| | | | | |
| | 10 | .6 | | Employment Agreement dated for reference August 7, 2003 between Mercer International Inc. and David Gandossi. Incorporated by reference fromForm 8-K dated August 11, 2003. |
| | 10 | .7 | | Employment Agreement effective as of April 28, 2004 between Mercer International Inc. and Jimmy S.H. Lee. Incorporated by reference fromForm 8-K dated April 28, 2004. |
| | 10 | .8 | | 2004 Stock Incentive Plan. Incorporated by reference fromForm S-8 dated June 15, 2004. |
| | 10 | .9 | | 2010 Stock Incentive Plan. Incorporated by reference fromForm S-8 dated June 11, 2010. |
| | 10 | .10 | | Employment Agreement dated October 2, 2006 between Stendal Pulp Holding GmbH and Wolfram Ridder. Incorporated by reference fromForm 8-K dated October 2, 2006. |
| | 10 | .11* | | Employment Agreement effective September 25, 2006 between Mercer International Inc. and Claes-Inge Isacson dated December 5, 2008. |
| | 10 | .12 | | Employment Agreement effective September 1, 2005 between Mercer International Inc. and Leonhard Nossol dated August 18, 2005. Incorporated by reference fromForm 10-Q dated May 6, 2008. |
| | 10 | .13* | | Electricity Purchase Agreement effective January 27, 2009 between Zellstoff Celgar Limited Partnership and British Columbia Hydro and Power Authority. Certain non-public information has been omitted from the appendices to Exhibit 10.13 pursuant to a request for confidential treatment filed with the SEC. Such non-public information was filed with the SEC on a confidential basis. The SEC approved the request for confidential treatment in March 2009. |
| | 10 | .14* | | Revolving Credit Facility Agreement dated August 19, 2009 among D&Z Holding GmbH, Zellstoff-und Papierfabrik Rosenthal GmbH, D&Z Beteiligungs GmbH and ZPR Logistik GmbH and BayerischeHypo-und Vereinsbank AG. Incorporated by reference fromForm 8-K dated August 24, 2009. |
| | 10 | .15 | | Loan Agreement dated August 19, 2009 among Zellstoff-und Papierfabrik Rosenthal GmbH, as borrower, and Bayerische Hypo-und Vereinsbank Aktiengesellschaft, as lender. Incorporated by reference fromForm 8-K dated August 24, 2009. |
| | 10 | .16 | | Amended and Restated Credit Agreement dated as of November 27, 2009 among Zellstoff Celgar Limited Partnership, as borrower, and the lenders from time to time parties thereto, as lenders, and CIT Business Credit Canada Inc., as agent. Incorporated by reference fromForm 8-K dated November 30, 2009. |
| | 14 | | | Code of Business Conduct and Ethics. Incorporated by reference from the definitive proxy statement on Schedule 14A dated August 11, 2003. |
| | 99 | .1 | | Audit Committee Charter. Incorporated by reference from the definitive proxy statement on Schedule 14A dated April 28, 2005. |
| | 99 | .2 | | Governance and Nominating Committee Charter. Incorporated by reference from the definitive proxy statement on Schedule 14A dated April 28, 2004. |
| | 99 | .3 | | Exchange Agreement dated November 25, 2009 between Mercer International Inc. and IAT Reinsurance Co. Ltd. Incorporated by reference fromForm 8-K filed November 27, 2009. |
| | 99 | .4 | | Exchange Agreement dated November 25, 2009 between Mercer International Inc. and Alden Global Distressed Opportunities Fund L.P. Incorporated by reference fromForm 8-K filed November 27, 2009. |
| | 99 | .5 | | Exchange Agreement dated November 25, 2009 between Mercer International Inc. and Greenlight Capital Qualified LP, Greenlight Capital LP and Greenlight Capital Offshore Partners. Incorporated by reference fromForm 8-K filed November 27, 2009. |
| | 21 | | | List of Subsidiaries of Registrant. |
| | 23 | .1 | | Consent of Independent Registered Chartered Accountants — PricewaterhouseCoopers LLP. |
| | 31 | .1 | | Section 302 Certificate of Chief Executive Officer. |
| | 31 | .2 | | Section 302 Certificate of Chief Financial Officer. |
| | 32 | .1** | | Section 906 Certificate of Chief Executive Officer. |
| | 32 | .2** | | Section 906 Certificate of Chief Financial Officer. |
| | |
* 2.1 | | Agreement and Plan of Merger among Mercer International Inc., Mercer International Regco Inc. and Mercer Delaware Inc. dated December 14, 2005. Incorporated by reference to the Proxy Statement/Prospectus filed on December 15, 2005. |
| |
| 3.1 | | Articles of Incorporation of the Company, as amended. Incorporated by reference from Form 8-A dated March 1, 2006. |
| |
| 3.2 | | Bylaws of the Company. Incorporated by reference from Form 8-A dated March 1, 2006. |
| |
| 4.1 | | Indenture dated as of November 17, 2010 between Mercer International Inc. and Wells Fargo Bank, National Association. Incorporated by reference from Form 8-K dated November 19, 2010. |
| |
| 10.1* | | Project Financing Facility Agreement dated August 26, 2002 between Zellstoff Stendal GmbH and Bayerische Hypo-und Vereinsbank AG, as amended by Amendment, Restatement and Undertaking Agreement dated January 31, 2009 and the Amendment Agreement dated January 20, 2012. |
| |
| 10.2* | | Project Blue Mill Financing Facility Agreement dated January 20, 2012 between Zellstoff Stendal GmbH and Unicredit Bank AG and IKB Deutsche Industriebank AG. |
| |
| 10.3* | | Shareholders’ Undertaking Agreement dated August 26, 2002 among Mercer International Inc., Stendal Pulp Holdings GmbH, RWE Industrie-Lösungen GmbH, AIG Altmark Industrie AG and FAHR Beteiligungen AG and Zellstoff Stendal GmbH and Bayerische Hypo-und Vereinsbank AG as amended by the Amendment Restatement and Undertaking Agreement dated January 20, 2012. |
| |
| 10.4* | | Shareholders’ Agreement dated August 26, 2002 among Zellstoff Stendal GmbH, Stendal Pulp Holdings GmbH, RWE Industrie-Lösungen GmbH and FAHR Beteiligungen AG as amended by the Amendment Agreement dated January 20, 2012. |
| |
| 10.5* | | Contract for the Engineering, Design, Procurement, Construction, Erection and Start-Up of a Kraft Pulp Mill between Zellstoff Stendal GmbH and RWE Industrie-Lösungen GmbH dated August 26, 2002. Certain non-public information has been omitted from the appendices to Exhibit 10.4 pursuant to a request for confidential treatment filed with the SEC. Such non-public information was filed with the SEC on a confidential basis. The SEC approved the request for confidential treatment in January 2004. |
| |
| 10.6* | | Form of Trustee’s Indemnity Agreement between Mercer International Inc. and its Trustees. |
| |
| 10.7 | | Employment Agreement dated for reference August 7, 2003 between Mercer International Inc. and David Gandossi. Incorporated by reference from Form 8-K dated August 11, 2003. |
| | |
| 10.8 | | Employment Agreement effective as of April 28, 2004 between Mercer International Inc. and Jimmy S.H. Lee. Incorporated by reference from Form 8-K dated April 28, 2004. |
| |
| 10.9 | | 2004 Stock Incentive Plan. Incorporated by reference from Form S-8 dated June 15, 2004. |
| |
| 10.10 | | 2010 Stock Incentive Plan. Incorporated by reference from Form S-8 dated June 11, 2010. |
| |
| 10.11 | | Employment Agreement dated October 2, 2006 between Stendal Pulp Holding GmbH and Wolfram Ridder. Incorporated by reference from Form 8-K dated October 2, 2006. |
| |
| 10.12* | | Employment Agreement effective September 25, 2006 between Mercer International Inc. and Claes-Inge Isacson dated December 5, 2008. |
| |
| 10.13 | | Employment Agreement effective September 1, 2005 between Mercer International Inc. and Leonhard Nossol dated August 18, 2005. Incorporated by reference from Form 10-Q dated May 6, 2008. |
| |
| 10.14* | | Electricity Purchase Agreement effective January 27, 2009 between Zellstoff Celgar Limited Partnership and British Columbia Hydro and Power Authority. Certain non-public information has been omitted from the appendices to Exhibit 10.13 pursuant to a request for confidential treatment filed with the SEC. Such non-public information was filed with the SEC on a confidential basis. The SEC approved the request for confidential treatment in March 2009. |
| |
| 10.15 | | Revolving Credit Facility Agreement dated August 19, 2009 among D&Z Holding GmbH, Zellstoff-und Papierfabrik Rosenthal GmbH, D&Z Beteiligungs GmbH and ZPR Logistik GmbH and Bayerische Hypo-und Vereinsbank AG. Incorporated by reference from Form 8-K dated August 24, 2009. |
| |
| 10.16 | | Loan Agreement dated August 19, 2009 among Zellstoff-und Papierfabrik Rosenthal GmbH, as borrower, and Bayerische Hypo-und Vereinsbank Aktiengesellschaft, as lender. Incorporated by reference from Form 8-K dated August 24, 2009. |
| |
| 10.17 | | Extension, Amendment and Confirmation Letter dated October 4, 2012 among Zellstoff—und Papierfabrik Rosenthal GmbH, D&Z Holding GmbH, D&Z Beteiligungs GmbH, ZPR Logistik GmbH and Mercer International Inc. Incorporated by reference from Form 10-Q dated November 2, 2012. |
| |
| 10.18 | | Amended and Restated Credit Agreement dated as of November 27, 2009 among Zellstoff Celgar Limited Partnership, as borrower, and the lenders from time to time parties thereto, as lenders, and CIT Business Credit Canada Inc., as agent. Incorporated by reference from Form 8-K dated November 30, 2009. |
| |
| 14 | | Code of Business Conduct and Ethics. Incorporated by reference from the definitive proxy statement on Schedule 14A dated August 11, 2003. |
| |
| 99.1 | | Audit Committee Charter. Incorporated by reference from the definitive proxy statement on Schedule 14A dated April 28, 2005. |
| |
| 99.2 | | Governance and Nominating Committee Charter. Incorporated by reference from the definitive proxy statement on Schedule 14A dated April 28, 2004. |
| |
| 99.3 | | Exchange Agreement dated November 25, 2009 between Mercer International Inc. and IAT Reinsurance Co. Ltd. Incorporated by reference from Form 8-K filed November 27, 2009. |
| |
| 99.4 | | Exchange Agreement dated November 25, 2009 between Mercer International Inc. and Alden Global Distressed Opportunities Fund L.P. Incorporated by reference from Form 8-K filed November 27, 2009. |
| |
| 99.5 | | Exchange Agreement dated November 25, 2009 between Mercer International Inc. and Greenlight Capital Qualified LP, Greenlight Capital LP and Greenlight Capital Offshore Partners. Incorporated by reference from Form 8-K filed November 27, 2009. |
| | |
| 21 | | List of Subsidiaries of Registrant. |
| |
| 23.1 | | Consent of Independent Registered Public Accounting Firm |
| |
| 31.1 | | Section 302 Certificate of Chief Executive Officer. |
| |
| 31.2 | | Section 302 Certificate of Chief Financial Officer. |
| |
| 32.1** | | Section 906 Certificate of Chief Executive Officer. |
| |
| 32.2** | | Section 906 Certificate of Chief Financial Officer. |
| * | Filed inForm 10-K for prior years. |
| ** | | In accordance with Release33-8212 of the Commission, these Certifications: (i) are “furnished” to the Commission and are not “filed” for the purposes of liability under the Exchange Act; and (ii) are not to be subject to automatic incorporation by reference into any of our Company’s registration statements filed under the Securities Act for the purposes of liability thereunder or any offering memorandum, unless our Company specifically incorporates them by reference therein. |
72

February 15, 2013Report of Independent Registered Public Accounting FirmREPORT OF INDEPENDENT REGISTERED PUBLIC ACCOUNTING FIRM
To the Shareholders and Board of Directors of
Mercer International Inc.
We have audited the accompanying consolidated balance sheets of Mercer International Inc. and its subsidiaries as of December 31, 20102012 and December 31, 20092011 and the related consolidated statements of operations, comprehensive income (loss), changes in shareholders’ equity, and cash flows for each of the years in the three-year period ended December 31, 2010.2012. We also have audited Mercer International Inc.’s and its subsidiaries’ internal control over financial reporting as of December 31, 2010,2012, based on criteria established in Internal Control —- Integrated Framework issued by the Committee of Sponsoring Organizations of the Treadway Commission (COSO). Management is responsible for these consolidated financial statements, for maintaining effective internal control over financial reporting and for its assessment of the effectiveness of internal control over financial reporting, included in the accompanying Management’s Report on Internal Control.Control Over Financial Reporting appearing under Item 9A. Our responsibility is to express an opinion on these consolidated financial statements and an opinion on the company’s internal control over financial reporting based on our integrated audits.
We conducted our audits in accordance with the standards of the Public Company Accounting Oversight Board (United States). Those standards require that we plan and perform the audits to obtain reasonable assurance about whether the consolidated financial statements are free of material misstatement and whether effective internal control over financial reporting was maintained in all material respects. Our audits of the consolidated financial statements included examining, on a test basis, evidence supporting the amounts and disclosures in the consolidated financial statements, assessing the accounting principles used and significant estimates made by management, and evaluating the overall consolidated financial statement presentation. Our audit of internal control over financial reporting included obtaining an understanding of internal control over financial reporting, assessing the risk that a material weakness exists, and testing and evaluating the design and operating effectiveness of internal control based on the assessed risk. Our audits also included performing such other procedures as we considered necessary in the circumstances. We believe that our audits provide a reasonable basis for our opinions.
A company’s internal control over financial reporting is a process designed to provide reasonable assurance regarding the reliability of financial reporting and the preparation of financial statements for external purposes in accordance with generally accepted accounting principles. A company’s internal control over financial reporting includes those policies and procedures thatthat: (i) pertain to the maintenance of records that, in reasonable detail, accurately and fairly reflect the transactions and dispositions of the assets of the company; (ii) provide reasonable assurance that transactions are recorded as necessary to permit preparation of consolidated financial statements in accordance with generally accepted accounting principles, and that receipts and expenditures of the company are being made only in accordance with authorizations of management and directors of the company; and (iii) provide reasonable assurance regarding prevention or timely detection of unauthorized acquisition, use, or disposition of the company’s assets that could have a material effect on the financial statements. Because of its inherent limitations, internal control over financial reporting may not prevent or detect misstatements. Also, projections of any evaluation of effectiveness to future periods are subject to the risk that controls may become inadequate because of changes in conditions, or that the degree of compliance with the policies or procedures may deteriorate.
In our opinion, the consolidated financial statements referred to above present fairly, in all material respects, the financial position of Mercer International Inc. and its subsidiaries as of December 31, 20102012 and December 31, 2009,2011 and the results of itstheir operations and itstheir cash flows for each of the years in the three-year period ended December 31, 20102012 in conformity with accounting principles generally accepted in the United States of America. Also, in our opinion, Mercer International Inc. and its subsidiaries maintained, in all material respects, effective internal control over financial reporting as of December 31, 2010,2012, based on criteria established in Internal Control — Control—Integrated Framework issued by the Committee of Sponsoring Organizations of the Treadway Commission (COSO).
COSO./s/ PricewaterhouseCoopers LLP
Vancouver, Canada
February 15, 2011
73
MERCER INTERNATIONAL INC.
CONSOLIDATED BALANCE SHEETS
(In thousands of Euros, except per share data)
| | | | | | | | | |
| | | December 31, | |
| | | 2010 | | | 2009 | |
| |
ASSETS | | | | | | | | |
| Current assets | | | | | | | | |
| Cash and cash equivalents (Note 2) | | € | 99,022 | | | € | 51,291 | |
| Receivables (Note 3) | | | 121,709 | | | | 71,143 | |
| Inventories (Note 4) | | | 102,219 | | | | 72,629 | |
| Prepaid expenses and other | | | 11,360 | | | | 5,871 | |
| Deferred income tax (Note 9) | | | 22,570 | | | | — | |
| | | | | | | | | |
| Total current assets | | | 356,880 | | | | 200,934 | �� |
| | | | | | | | | |
| Long-term assets | | | | | | | | |
| Property, plant and equipment (Note 5) | | | 846,767 | | | | 868,558 | |
| Deferred note issuance and other | | | 11,082 | | | | 8,186 | |
| Deferred income tax (Note 9) | | | — | | | | 3,426 | |
| Note receivable | | | 1,346 | | | | 2,727 | |
| | | | | | | | | |
| | | | 859,195 | | | | 882,897 | |
| | | | | | | | | |
| Total assets | | € | 1,216,075 | | | € | 1,083,831 | |
| | | | | | | | | |
| | | | | | | | | |
LIABILITIES | | | | | | | | |
| Current liabilities | | | | | | | | |
| Accounts payable and accrued expenses (Note 6) | | € | 84,873 | | | € | 85,185 | |
| Pension and other post-retirement benefit obligations (Note 8) | | | 728 | | | | 567 | |
| Debt (Note 7) | | | 39,596 | | | | 16,032 | |
| | | | | | | | | |
| Total current liabilities | | | 125,197 | | | | 101,784 | |
| | | | | | | | | |
| Long-term liabilities | | | | | | | | |
| Debt (Note 7) | | | 782,328 | | | | 813,142 | |
| Unrealized interest rate derivative losses (Note 14) | | | 50,973 | | | | 52,873 | |
| Pension and other post-retirement benefit obligations (Note 8) | | | 24,236 | | | | 17,902 | |
| Capital leases and other (Note 15) | | | 12,010 | | | | 12,157 | |
| Deferred income tax (Note 9) | | | 7,768 | | | | — | |
| | | | | | | | | |
| | | | 877,315 | | | | 896,074 | |
| | | | | | | | | |
| Total liabilities | | € | 1,002,512 | | | € | 997,858 | |
| | | | | | | | | |
| | | | | | | | | |
EQUITY | | | | | | | | |
| Shareholders’ equity | | | | | | | | |
| Share capital (Note 10) | | | 219,211 | | | | 202,844 | |
| Paid-in capital | | | (3,899 | ) | | | (6,082 | ) |
| Retained earnings (deficit) | | | (10,956 | ) | | | (97,235 | ) |
| Accumulated other comprehensive income (loss) | | | 31,712 | | | | 23,695 | |
| | | | | | | | | |
| Total shareholders’ equity | | | 236,068 | | | | 123,222 | |
| | | | | | | | | |
| Noncontrolling interest (deficit) (Note 17) | | | (22,505 | ) | | | (37,249 | ) |
| | | | | | | | | |
| Total equity | | | 213,563 | | | | 85,973 | |
| | | | | | | | | |
| Total liabilities and equity | | € | 1,216,075 | | | € | 1,083,831 | |
| | | | | | | | | |
| Commitments and contingencies (Note 16) | | | | | | | | |
| Subsequent events (Note 18) | | | | | | | | |
The accompanying notes are an integral part of these financial statements.
74
| | | | | | | | | | | | | |
| | | For the Years Ended December 31, | |
| | | 2010 | | | 2009 | | | 2008 | |
| |
| Revenues | | | | | | | | | | | | |
| Pulp | | € | 856,311 | | | € | 577,298 | | | € | 689,320 | |
| Energy | | | 44,225 | | | | 42,501 | | | | 30,971 | |
| | | | | | | | | | | | | |
| | | | 900,536 | | | | 619,799 | | | | 720,291 | |
| Costs and expenses | | | | | | | | | | | | |
| Operating costs | | | 643,529 | | | | 551,781 | | | | 626,933 | |
| Operating depreciation and amortization | | | 55,932 | | | | 53,919 | | | | 55,484 | |
| | | | | | | | | | | | | |
| | | | 201,075 | | | | 14,099 | | | | 37,874 | |
| Selling, general and administrative expenses | | | 33,442 | | | | 27,414 | | | | 30,158 | |
| Purchase (sale) of emission allowances | | | (110 | ) | | | (516 | ) | | | (5,613 | ) |
| | | | | | | | | | | | | |
| Operating income (loss) | | | 167,743 | | | | (12,799 | ) | | | 13,329 | |
| | | | | | | | | | | | | |
| Other income (expense) | | | | | | | | | | | | |
| Interest expense | | | (67,621 | ) | | | (64,770 | ) | | | (65,756 | ) |
| Investment income (loss) | | | 468 | | | | (1,804 | ) | | | (1,174 | ) |
| Foreign exchange gain (loss) on debt | | | (6,126 | ) | | | 2,692 | | | | (4,234 | ) |
| Gain (loss) on extinguishment of debt (Note 7) | | | (7,494 | ) | | | 4,447 | | | | — | |
| Gain (loss) on derivative instruments (Note 14) | | | 1,899 | | | | (5,760 | ) | | | (25,228 | ) |
| | | | | | | | | | | | | |
| Total other income (expense) | | | (78,874 | ) | | | (65,195 | ) | | | (96,392 | ) |
| | | | | | | | | | | | | |
| Income (loss) before income taxes | | | 88,869 | | | | (77,994 | ) | | | (83,063 | ) |
| Income tax benefit (provision) | | | | | | | | | | | | |
| — current | | | (3,881 | ) | | | (134 | ) | | | (501 | ) |
| — deferred (Note 9) | | | 9,760 | | | | 6,003 | | | | (1,976 | ) |
| | | | | | | | | | | | | |
| Net income (loss) | | | 94,748 | | | | (72,125 | ) | | | (85,540 | ) |
| Less: net loss (income) attributable to noncontrolling interest | | | (8,469 | ) | | | 9,936 | | | | 13,075 | |
| | | | | | | | | | | | | |
| Net income (loss) attributable to common shareholders | | € | 86,279 | | | € | (62,189 | ) | | € | (72,465 | ) |
| | | | | | | | | | | | | |
| Net income (loss) per share attributable to common shareholders (Note 12) | | | | | | | | | | | | |
| Basic | | € | 2.24 | | | € | (1.71 | ) | | € | (2.00 | ) |
| | | | | | | | | | | | | |
| Diluted | | € | 1.56 | | | € | (1.71 | ) | | € | (2.00 | ) |
| | | | | | | | | | | | | |
The accompanying notes are an integral part of these financial statements.
75
| | | | | | | | | | | | | |
| | | For the Years Ended December 31, | |
| | | 2010 | | | 2009 | | | 2008 | |
| |
| Net income (loss) | | € | 94,748 | | | € | (72,125 | ) | | € | (85,540 | ) |
| Other comprehensive income (loss), net of taxes | | | | | | | | | | | | |
| Foreign currency translation adjustment | | | 11,333 | | | | 28,316 | | | | (41,876 | ) |
| Pension income (expense) (Note 8) | | | (3,314 | ) | | | (3,128 | ) | | | 4,079 | |
| Unrealized gains (losses) on securities arising during the year | | | (2 | ) | | | 379 | | | | (340 | ) |
| | | | | | | | | | | | | |
| Other comprehensive income (loss), net of taxes | | | 8,017 | | | | 25,567 | | | | (38,137 | ) |
| | | | | | | | | | | | | |
| Total comprehensive income (loss) | | | 102,765 | | | | (46,558 | ) | | | (123,677 | ) |
| Comprehensive (income) loss attributable to noncontrolling interest | | | (8,469 | ) | | | 9,936 | | | | 13,075 | |
| | | | | | | | | | | | | |
| Comprehensive income (loss) attributable to common shareholders | | € | 94,296 | | | € | (36,622 | ) | | € | (110,602 | ) |
| | | | | | | | | | | | | |
| | | | | | | | |
| | | December 31, | |
| | | 2012 | | | 2011 | |
ASSETS | | | | | | | | |
Current assets | | | | | | | | |
Cash and cash equivalents (Note 2) | | € | 104,239 | | | € | 105,072 | |
Marketable securities (Note 3) | | | — | | | | 12,216 | |
Receivables (Note 4) | | | 110,087 | | | | 120,487 | |
Inventories (Note 5) | | | 118,300 | | | | 120,539 | |
Prepaid expenses and other | | | 7,907 | | | | 8,162 | |
Deferred income tax (Note 10) | | | 4,465 | | | | 6,750 | |
| | | | | | | | |
Total current assets | | | 344,998 | | | | 373,226 | |
| | | | | | | | |
Long-term assets | | | | | | | | |
Property, plant and equipment (Note 6) | | | 808,878 | | | | 820,974 | |
Deferred note issuance and other | | | 12,162 | | | | 10,763 | |
Deferred income tax (Note 10) | | | 17,565 | | | | 12,287 | |
| | | | | | | | |
| | | 838,605 | | | | 844,024 | |
| | | | | | | | |
Total assets | | € | 1,183,603 | | | € | 1,217,250 | |
| | | | | | | | |
LIABILITIES | | | | | | | | |
Current liabilities | | | | | | | | |
Accounts payable and other (Note 7) | | € | 89,950 | | | € | 99,640 | |
Pension and other post-retirement benefit obligations (Note 9) | | | 813 | | | | 756 | |
Debt (Note 8) | | | 45,662 | | | | 25,671 | |
| | | | | | | | |
Total current liabilities | | | 136,425 | | | | 126,067 | |
| | | | | | | | |
Long-term liabilities | | | | | | | | |
Debt (Note 8) | | | 665,741 | | | | 708,415 | |
Unrealized interest rate derivative losses (Note 16) | | | 50,678 | | | | 52,391 | |
Pension and other post-retirement benefit obligations (Note 9) | | | 32,141 | | | | 31,197 | |
Capital leases and other (Note 18) | | | 13,936 | | | | 13,053 | |
Deferred income tax (Note 10) | | | 5,757 | | | | 2,585 | |
| | | | | | | | |
| | | 768,253 | | | | 807,641 | |
| | | | | | | | |
Total liabilities | | | 904,678 | | | | 933,708 | |
| | | | | | | | |
EQUITY | | | | | | | | |
Shareholders’ equity | | | | | | | | |
Share capital (Note 11) | | | 248,371 | | | | 247,642 | |
Paid-in capital | | | (3,547 | ) | | | (4,857 | ) |
Retained earnings | | | 25,800 | | | | 37,985 | |
Accumulated other comprehensive income (Note 13) | | | 25,181 | | | | 21,346 | |
| | | | | | | | |
Total shareholders’ equity | | | 295,805 | | | | 302,116 | |
| | | | | | | | |
Noncontrolling deficit | | | (16,880 | ) | | | (18,574 | ) |
| | | | | | | | |
Total equity | | | 278,925 | | | | 283,542 | |
| | | | | | | | |
Total liabilities and equity | | € | 1,183,603 | | | € | 1,217,250 | |
| | | | | | | | |
Commitments and contingencies (Note 19) | | | | | | | | |
The accompanying notes are an integral part of these consolidated financial statements.
76
MERCER INTERNATIONAL INC.
CONSOLIDATED STATEMENTS OF CHANGES IN SHAREHOLDERS’ EQUITY
OPERATIONS
(In thousands of Euros)Euros, except per share data)
| | | | | | | | | | | | | | | | | | | | | | | | | | | | | | | | | | | | | | | | | |
| | | | | | | | | | | | | | | | | | Accumulated Other
| | | | |
| | | Common Shares | | | | | | | | | Comprehensive Income (Loss) | | | | |
| | | | | | | | | Amount
| | | | | | | | | Foreign
| | | Defined
| | | Unrealized
| | | | | | | |
| | | | | | | | | Paid in
| | | | | | Retained
| | | Currency
| | | Benefit
| | | Gains
| | | | | | | |
| | | Number
| | | Par
| | | Excess of
| | | Paid-in
| | | Earnings
| | | Translation
| | | Pension
| | | (Losses) on
| | | | | | Shareholders’
| |
| | | of Shares | | | Value | | | Par Value | | | Capital | | | (Deficit) | | | Adjustments | | | Plans | | | Securities | | | Total | | | Equity | |
| |
| Balance at December 31, 2007 | | | 36,285,027 | | | € | 27,576 | | | € | 175,268 | | | € | 134 | | | € | 37,419 | | | € | 41,099 | | | € | (4,929 | ) | | € | 95 | | | € | 36,265 | | | € | 276,662 | |
| Shares issued on grants of restricted stock | | | 21,000 | | | | — | | | | — | | | | 61 | | | | — | | | | — | | | | — | | | | — | | | | — | | | | 61 | |
| Shares issued on grants of performance stock | | | 116,460 | | | | — | | | | — | | | | 29 | | | | — | | | | — | | | | — | | | | — | | | | — | | | | 29 | |
| Stock compensation expense | | | — | | | | — | | | | — | | | | 75 | | | | — | | | | — | | | | — | | | | — | | | | — | | | | 75 | |
| Net loss | | | — | | | | — | | | | — | | | | — | | | | (72,465 | ) | | | — | | | | — | | | | — | | | | — | | | | (72,465 | ) |
| Other comprehensive income (loss) | | | — | | | | — | | | | — | | | | — | | | | — | | | | (41,876 | ) | | | 4,079 | | | | (340 | ) | | | (38,137 | ) | | | (38,137 | ) |
| | | | | | | | | | | | | | | | | | | | | | | | | | | | | | | | | | | | | | | | | |
| Balance at December 31, 2008 | | | 36,422,487 | | | € | 27,576 | | | € | 175,268 | | | € | 299 | | | € | (35,046 | ) | | € | (777 | ) | | € | (850 | ) | | € | (245 | ) | | € | (1,872 | ) | | € | 166,225 | |
| Capital contribution to acquire additional 4.32% of Stendal Mill | | | — | | | | — | | | | — | | | | (6,809 | ) | | | — | | | | — | | | | — | | | | — | | | | — | | | | (6,809 | ) |
| Shares issued on grants of restricted stock | | | 21,000 | | | | — | | | | — | | | | 52 | | | | — | | | | — | | | | — | | | | — | | | | — | | | | 52 | |
| Stock compensation expense | | | — | | | | — | | | | — | | | | 376 | | | | — | | | | — | | | | — | | | | — | | | | — | | | | 376 | |
| Net loss | | | — | | | | — | | | | — | | | | — | | | | (62,189 | ) | | | — | | | | — | | | | — | | | | — | | | | (62,189 | ) |
| Other comprehensive income (loss) | | | — | | | | — | | | | — | | | | — | | | | — | | | | 28,316 | | | | (3,128 | ) | | | 379 | | | | 25,567 | | | | 25,567 | |
| | | | | | | | | | | | | | | | | | | | | | | | | | | | | | | | | | | | | | | | | |
| Balance at December 31, 2009 | | | 36,443,487 | | | € | 27,576 | | | € | 175,268 | | | € | (6,082 | ) | | € | (97,235 | ) | | € | 27,539 | | | € | (3,978 | ) | | € | 134 | | | € | 23,695 | | | € | 123,222 | |
| Shares issued on exercise of stock options | | | — | | | | — | | | | — | | | | — | | | | — | | | | — | | | | — | | | | — | | | | — | | | | — | |
| Shares issued on grants of restricted stock | | | 56,000 | | | | — | | | | — | | | | 153 | | | | — | | | | — | | | | — | | | | — | | | | — | | | | 153 | |
| Shares issued on conversion of convertible note | | | 6,500,171 | | | | 4,961 | | | | 11,406 | | | | — | | | | — | | | | — | | | | — | | | | — | | | | — | | | | 16,367 | |
| Stock compensation expense | | | — | | | | — | | | | — | | | | 2,030 | | | | — | | | | — | | | | — | | | | — | | | | — | | | | 2,030 | |
| Net income | | | — | | | | — | | | | — | | | | — | | | | 86,279 | | | | — | | | | — | | | | — | | | | — | | | | 86,279 | |
| Other comprehensive income (loss) | | | — | | | | — | | | | — | | | | — | | | | — | | | | 11,333 | | | | (3,314 | ) | | | (2 | ) | | | 8,017 | | | | 8,017 | |
| | | | | | | | | | | | | | | | | | | | | | | | | | | | | | | | | | | | | | | | | |
| Balance at December 31, 2010 | | | 42,999,658 | | | € | 32,537 | | | € | 186,674 | | | € | (3,899 | ) | | € | (10,956 | ) | | € | 38,872 | | | € | (7,292 | ) | | € | 132 | | | € | 31,712 | | | € | 236,068 | |
| | | | | | | | | | | | | | | | | | | | | | | | | | | | | | | | | | | | | | | | | |
| | | | | | | | | | | | |
| | | For the Year Ended December 31, | |
| | | 2012 | | | 2011 | | | 2010 | |
Revenues | | | | | | | | | | | | |
Pulp | | € | 761,854 | | | € | 831,396 | | | € | 856,311 | |
Energy and chemicals | | | 72,289 | | | | 68,079 | | | | 49,288 | |
| | | | | | | | | | | | |
| | | 834,143 | | | | 899,475 | | | | 905,599 | |
Costs and expenses | | | | | | | | | | | | |
Operating costs | | | 689,052 | | | | 693,825 | | | | 648,592 | |
Operating depreciation and amortization | | | 57,776 | | | | 55,760 | | | | 55,932 | |
| | | | | | | | | | | | |
| | | 87,315 | | | | 149,890 | | | | 201,075 | |
Selling, general and administrative expenses | | | 38,310 | | | | 38,771 | | | | 33,332 | |
| | | | | | | | | | | | |
Operating income | | | 49,005 | | | | 111,119 | | | | 167,743 | |
| | | | | | | | | | | | |
| | | |
Other income (expense) | | | | | | | | | | | | |
Interest expense | | | (55,805 | ) | | | (58,995 | ) | | | (67,621 | ) |
Gain (loss) on derivative instruments (Note 16) | | | 3,741 | | | | (1,418 | ) | | | 1,899 | |
Foreign exchange gain (loss) on debt | | | — | | | | 1,175 | | | | (6,126 | ) |
Loss on extinguishment of debt (Note 8(b)) | | | (81 | ) | | | (71 | ) | | | (7,494 | ) |
Other income (expense) | | | (58 | ) | | | 1,501 | | | | 468 | |
| | | | | | | | | | | | |
Total other income (expense) | | | (52,203 | ) | | | (57,808 | ) | | | (78,874 | ) |
| | | | | | | | | | | | |
Income (loss) before income taxes | | | (3,198 | ) | | | 53,311 | | | | 88,869 | |
Income tax benefit (provision) (Note 10) | | | | | | | | | | | | |
Current | | | (7,411 | ) | | | (1,682 | ) | | | (3,881 | ) |
Deferred | | | 118 | | | | 2,377 | | | | 9,760 | |
| | | | | | | | | | | | |
Net income (loss) | | | (10,491 | ) | | | 54,006 | | | | 94,748 | |
Less: net income attributable to noncontrolling interest | | | (1,694 | ) | | | (3,931 | ) | | | (8,469 | ) |
| | | | | | | | | | | | |
Net income (loss) attributable to common shareholders | | € | (12,185 | ) | | € | 50,075 | | | € | 86,279 | |
| | | | | | | | | | | | |
| | | |
Net income (loss) per share attributable to common shareholders (Note 14) | | | | | | | | | | | | |
Basic | | € | (0.22 | ) | | € | 1.00 | | | € | 2.24 | |
Diluted | | € | (0.22 | ) | | € | 0.89 | | | € | 1.56 | |
The accompanying notes are an integral part of these consolidated financial statements.
77
MERCER INTERNATIONAL INC.
CONSOLIDATED STATEMENTS OF CASH FLOWS
COMPREHENSIVE INCOME (LOSS)
(In thousands of Euros)
| | | | | | | | | | | | | |
| | | For the Years Ended December 31, | |
| | | 2010 | | | 2009 | | | 2008 | |
| |
| Cash flows from (used in) operating activities | | | | | | | | | | | | |
| Net income (loss) attributable to common shareholders | | € | 86,279 | | | € | (62,189 | ) | | € | (72,465 | ) |
| Adjustments to reconcile net income (loss) attributable to common shareholders to cash flows from operating activities | | | | | | | | | | | | |
| Loss (gain) on derivative instruments | | | (1,899 | ) | | | 5,760 | | | | 25,228 | |
| Foreign exchange (gain) loss on debt | | | 6,126 | | | | (2,692 | ) | | | 4,234 | |
| Loss (gain) on extinguishment of debt | | | 7,494 | | | | (4,447 | ) | | | — | |
| Depreciation and amortization | | | 56,231 | | | | 54,170 | | | | 55,762 | |
| Accretion expense (income) | | | 2,492 | | | | 181 | | | | — | |
| Noncontrolling interest | | | 8,469 | | | | (9,936 | ) | | | (13,075 | ) |
| Deferred income taxes | | | (9,760 | ) | | | (6,003 | ) | | | 1,976 | |
| Stock compensation expense | | | 2,394 | | | | 455 | | | | 264 | |
| Pension and other post-retirement expense, net of funding | | | 418 | | | | 282 | | | | (758 | ) |
| Inventory provisions | | | — | | | | — | | | | 11,272 | |
| Other | | | 5,190 | | | | 2,482 | | | | 3,025 | |
| Changes in current assets and liabilities | | | | | | | | | | | | |
| Receivables | | | (40,038 | ) | | | 31,907 | | | | (14,811 | ) |
| Inventories | | | (24,462 | ) | | | 32,158 | | | | (13,331 | ) |
| Accounts payable and accrued expenses | | | (3,089 | ) | | | (2,950 | ) | | | (1,091 | ) |
| Other | | | (4,566 | ) | | | (1,859 | ) | | | 1,904 | |
| | | | | | | | | | | | | |
| Net cash from (used in) operating activities | | | 91,279 | | | | 37,319 | | | | (11,866 | ) |
| Cash flows from (used in) investing activities | | | | | | | | | | | | |
| Purchase of property, plant and equipment | | | (38,300 | ) | | | (28,828 | ) | | | (25,704 | ) |
| Proceeds on sale of property, plant and equipment | | | 1,138 | | | | 436 | | | | 2,000 | |
| Cash, restricted | | | — | | | | 13,000 | | | | 20,000 | |
| Note receivable | | | 1,113 | | | | 152 | | | | 5,708 | |
| | | | | | | | | | | | | |
| Net cash from (used in) investing activities | | | (36,049 | ) | | | (15,240 | ) | | | 2,004 | |
| Cash flows from (used in) financing activities | | | | | | | | | | | | |
| Repayment of notes payable and debt | | | (234,598 | ) | | | (26,499 | ) | | | (34,023 | ) |
| Repayment of capital lease obligations | | | (2,920 | ) | | | (3,178 | ) | | | (3,312 | ) |
| Proceeds from borrowings of notes payable and debt | | | 222,193 | | | | 13,511 | | | | — | |
| Proceeds from (repayment of) credit facilities, net | | | (2,660 | ) | | | (4,272 | ) | | | 5,837 | |
| Proceeds from government grants | | | 17,952 | | | | 9,058 | | | | 266 | |
| Payment of deferred note issuance costs | | | (6,095 | ) | | | (1,969 | ) | | | — | |
| | | | | | | | | | | | | |
| Net cash from (used in) financing activities | | | (6,128 | ) | | | (13,349 | ) | | | (31,232 | ) |
| Effect of exchange rate changes on cash and cash equivalents | | | (1,371 | ) | | | 109 | | | | (1,302 | ) |
| | | | | | | | | | | | | |
| Net increase (decrease) in cash and cash equivalents | | | 47,731 | | | | 8,839 | | | | (42,396 | ) |
| Cash and cash equivalents, beginning of period | | | 51,291 | | | | 42,452 | | | | 84,848 | |
| | | | | | | | | | | | | |
| Cash and cash equivalents, end of period | | € | 99,022 | | | € | 51,291 | | | € | 42,452 | |
| | | | | | | | | | | | | |
| Supplemental disclosure of cash flow information | | | | | | | | | | | | |
| Cash paid (received) during the period for | | | | | | | | | | | | |
| Interest | | € | 65,167 | | | € | 62,022 | | | € | 60,652 | |
| Income taxes | | | 461 | | | | 377 | | | | 1,100 | |
| Supplemental schedule of non-cash investing and financing activities | | | | | | | | | | | | |
| Acquisition of production and other equipment under capital lease obligations | | € | 2,087 | | | € | 625 | | | € | 5,318 | |
| Decrease (increase) in accounts payable relating to investing activities | | | (8,562 | ) | | | (1,471 | ) | | | 2,627 | |
| | | | | | | | | | | | |
| | | For the Year Ended December 31, | |
| | | 2012 | | | 2011 | | | 2010 | |
Net income (loss) | | € | (10,491 | ) | | € | 54,006 | | | € | 94,748 | |
| | | |
Other comprehensive income (loss), net of taxes | | | | | | | | | | | | |
Foreign currency translation adjustments, net of tax benefit of €353 (2011 – expense of €683; 2010 – €nil) | | | 4,464 | | | | (2,305 | ) | | | 11,333 | |
Change in unrecognized losses and prior service costs related to defined benefit plans, net of tax benefit of €nil (2011 – €nil; 2010 – €nil) (Note 9) | | | (628 | ) | | | (8,049 | ) | | | (3,314 | ) |
Change in unrealized losses on marketable securities, net of tax benefit of €nil (2011 – €nil; 2010 – €nil) | | | (1 | ) | | | (12 | ) | | | (2 | ) |
| | | | | | | | | | | | |
Other comprehensive income (loss), net of taxes | | | 3,835 | | | | (10,366 | ) | | | 8,017 | |
| | | | | | | | | | | | |
Total comprehensive income (loss) | | | (6,656 | ) | | | 43,640 | | | | 102,765 | |
Comprehensive income attributable to noncontrolling interest | | | (1,694 | ) | | | (3,931 | ) | | | (8,469 | ) |
| | | | | | | | | | | | |
Comprehensive income (loss) attributable to common shareholders | | € | (8,350 | ) | | € | 39,709 | | | € | 94,296 | |
| | | | | | | | | | | | |
The accompanying notes are an integral part of these consolidated financial statements.
78
MERCER INTERNATIONAL INC.
CONSOLIDATED STATEMENTS OF CHANGES IN SHAREHOLDERS
’ EQUITY(In thousands of Euros)
| | | | | | | | | | | | | | | | | | | | | | | | | | | | | | | | | | | | |
| | | Common shares | | | | | | | | | | | | | | | | | | | |
| | | Number of
Shares
(thousands
of shares) | | | Par Value | | | Amount
Paid in
Excess
of Par
Value | | | Paid-in
Capital | | | Retained
Earnings
(Deficit) | | | Accumulated
Other
Comprehensive
Income (Loss) | | | Shareholders’
Equity | | | Noncontrolling
Interest
(Deficit) | | | Total
Equity | |
Balance at December 31, 2009 | | | 36,443 | | | € | 27,576 | | | € | 175,268 | | | € | (6,082 | ) | | € | (97,235 | ) | | € | 23,695 | | | € | 123,222 | | | € | (37,249 | ) | | € | 85,973 | |
Shares issued on grants of restricted shares | | | 56 | | | | — | | | | — | | | | 153 | | | | — | | | | — | | | | 153 | | | | — | | | | 153 | |
Shares issued on conversion of convertible notes | | | 6,500 | | | | 4,961 | | | | 11,406 | | | | — | | | | — | | | | — | | | | 16,367 | | | | — | | | | 16,367 | |
Stock compensation expense | | | — | | | | — | | | | — | | | | 2,030 | | | | — | | | | — | | | | 2,030 | | | | — | | | | 2,030 | |
Net income | | | — | | | | — | | | | — | | | | — | | | | 86,279 | | | | — | | | | 86,279 | | | | 8,469 | | | | 94,748 | |
Foreign currency translation adjustments | | | — | | | | — | | | | — | | | | — | | | | — | | | | 11,333 | | | | 11,333 | | | | — | | | | 11,333 | |
Change in unrecognized losses and prior service costs related to defined benefit plans | | | — | | | | — | | | | — | | | | — | | | | — | | | | (3,314 | ) | | | (3,314 | ) | | | — | | | | (3,314 | ) |
Conversion of shareholder loans to a capital contribution | | | — | | | | — | | | | — | | | | — | | | | — | | | | — | | | | — | | | | 6,275 | | | | 6,275 | |
Change in unrealized losses on marketable securities | | | — | | | | — | | | | — | | | | — | | | | — | | | | (2 | ) | | | (2 | ) | | | — | | | | (2 | ) |
| | | | | | | | | | | | | | | | | | | | | | | | | | | | | | | | | | | | |
Balance at December 31, 2010 | | | 42,999 | | | | 32,537 | | | | 186,674 | | | | (3,899 | ) | | | (10,956 | ) | | | 31,712 | | | | 236,068 | | | | (22,505 | ) | | | 213,563 | |
Shares issued on grants of restricted shares | | | 238 | | | | 74 | | | | 296 | | | | (370 | ) | | | — | | | | — | | | | — | | | | — | | | | — | |
Shares issued on grants of performance shares | | | 358 | | | | 243 | | | | 3,585 | | | | (3,828 | ) | | | — | | | | — | | | | — | | | | — | | | | — | |
Shares issued on conversion of convertible notes | | | 13,447 | | | | 9,499 | | | | 21,076 | | | | — | | | | — | | | | — | | | | 30,575 | | | | — | | | | 30,575 | |
Treasury shares retired | | | (1,263 | ) | | | (971 | ) | | | (5,371 | ) | | | — | | | | (1,134 | ) | | | — | | | | (7,476 | ) | | | — | | | | (7,476 | ) |
Stock compensation expense | | | — | | | | — | | | | — | | | | 3,240 | | | | — | | | | — | | | | 3,240 | | | | — | | | | 3,240 | |
Net income | | | — | | | | — | | | | — | | | | — | | | | 50,075 | | | | — | | | | 50,075 | | | | 3,931 | | | | 54,006 | |
Foreign currency translation adjustments | | | — | | | | — | | | | — | | | | — | | | | — | | | | (2,305 | ) | | | (2,305 | ) | | | — | | | | (2,305 | ) |
Change in unrecognized losses and prior service costs related to defined benefit plans | | | — | | | | — | | | | — | | | | — | | | | — | | | | (8,049 | ) | | | (8,049 | ) | | | — | | | | (8,049 | ) |
Change in unrealized losses on marketable securities | | | — | | | | — | | | | — | | | | — | | | | — | | | | (12 | ) | | | (12 | ) | | | — | | | | (12 | ) |
| | | | | | | | | | | | | | | | | | | | | | | | | | | | | | | | | | | | |
Balance at December 31, 2011 | | | 55,779 | | | | 41,382 | | | | 206,260 | | | | (4,857 | ) | | | 37,985 | | | | 21,346 | | | | 302,116 | | | | (18,574 | ) | | | 283,542 | |
Shares issued on grants of restricted shares | | | 37 | | | | 57 | | | | 672 | | | | (729 | ) | | | — | | | | — | | | | — | | | | — | | | | — | |
Stock compensation expense | | | — | | | | — | | | | — | | | | 2,039 | | | | — | | | | — | | | | 2,039 | | | | — | | | | 2,039 | |
Net income (loss) | | | — | | | | — | | | | — | | | | — | | | | (12,185 | ) | | | — | | | | (12,185 | ) | | | 1,694 | | | | (10,491 | ) |
Foreign currency translation adjustments | | | — | | | | — | | | | — | | | | — | | | | — | | | | 4,464 | | | | 4,464 | | | | — | | | | 4,464 | |
Change in unrecognized losses and prior service costs related to defined benefit plans | | | — | | | | — | | | | — | | | | — | | | | — | | | | (628 | ) | | | (628 | ) | | | — | | | | (628 | ) |
Change in unrealized losses on marketable securities | | | — | | | | — | | | | — | | | | — | | | | — | | | | (1 | ) | | | (1 | ) | | | — | | | | (1 | ) |
| | | | | | | | | | | | | | | | | | | | | | | | | | | | | | | | | | | | |
Balance at December 31, 2012 | | | 55,816 | | | € | 41,439 | | | € | 206,932 | | | € | (3,547 | ) | | € | 25,800 | | | € | 25,181 | | | € | 295,805 | | | € | (16,880 | ) | | € | 278,925 | |
| | | | | | | | | | | | | | | | | | | | | | | | | | | | | | | | | | | | |
The accompanying notes are an integral part of these consolidated financial statements.
MERCER INTERNATIONAL INC.
CONSOLIDATED STATEMENTS OF CASH FLOWS
(In thousands of Euros)
| | | | | | | | | | | | |
| | | For the Year Ended December 31, | |
| | | 2012 | | | 2011 | | | 2010 | |
Cash flows from (used in) operating activities | | | | | | | | | | | | |
Net income (loss) | | € | (10,491 | ) | | € | 54,006 | | | € | 94,748 | |
Adjustments to reconcile net income (loss) to cash flows from operating activities | | | | | | | | | | | | |
Unrealized loss (gain) on derivative instruments | | | (2,477 | ) | | | 1,418 | | | | (1,899 | ) |
Foreign exchange loss (gain) on debt | | | — | | | | (1,175 | ) | | | 6,126 | |
Loss on extinguishment of debt | | | 81 | | | | 71 | | | | 7,494 | |
Depreciation and amortization | | | 58,052 | | | | 56,005 | | | | 56,231 | |
Deferred income taxes | | | (118 | ) | | | (2,377 | ) | | | (9,760 | ) |
Stock compensation expense | | | 2,039 | | | | 3,310 | | | | 2,394 | |
Pension and other post-retirement expense, net of funding | | | 284 | | | | (269 | ) | | | 418 | |
Other | | | 3,801 | | | | 1,905 | | | | 7,682 | |
Changes in working capital | | | | | | | | | | | | |
Receivables | | | 8,394 | | | | (1,604 | ) | | | (40,038 | ) |
Inventories | | | 1,342 | | | | (17,713 | ) | | | (24,462 | ) |
Accounts payable and accrued expenses | | | (13,990 | ) | | | 14,252 | | | | (3,089 | ) |
Other | | | (944 | ) | | | 3,226 | | | | (4,566 | ) |
| | | | | | | | | | | | |
Net cash from (used in) operating activities | | | 45,973 | | | | 111,055 | | | | 91,279 | |
| | | | | | | | | | | | |
| | | |
Cash flows from (used in) investing activities | | | | | | | | | | | | |
Purchase of property, plant and equipment | | | (36,704 | ) | | | (37,809 | ) | | | (38,300 | ) |
Proceeds on sale of property, plant and equipment | | | 653 | | | | 813 | | | | 1,138 | |
Purchase of marketable securities | | | — | | | | (12,187 | ) | | | — | |
Proceeds on maturity of marketable securities | | | 12,213 | | | | — | | | | — | |
Note receivable | | | — | | | | 2,865 | | | | 1,113 | |
| | | | | | | | | | | | |
Net cash from (used in) investing activities | | | (23,838 | ) | | | (46,318 | ) | | | (36,049 | ) |
| | | | | | | | | | | | |
Cash flows from (used in) financing activities | | | | | | | | | | | | |
Repayment of notes payable and debt | | | (27,254 | ) | | | (49,193 | ) | | | (234,582 | ) |
Proceeds from borrowings of note payable and debt | | | — | | | | — | | | | 222,177 | |
Repayment of capital lease obligations | | | (2,125 | ) | | | (2,942 | ) | | | (2,920 | ) |
Proceeds from (repayment of) credit facilities, net | | | 4,559 | | | | (14,652 | ) | | | (2,660 | ) |
Payment of note issuance costs | | | (1,933 | ) | | | — | | | | (6,095 | ) |
Proceeds from government grants | | | 3,888 | | | | 14,199 | | | | 17,952 | |
Purchase of treasury shares | | | — | | | | (7,476 | ) | | | — | |
| | | | | | | | | | | | |
Net cash from (used in) financing activities | | | (22,865 | ) | | | (60,064 | ) | | | (6,128 | ) |
| | | | | | | | | | | | |
Effect of exchange rate changes on cash and cash equivalents | | | (103 | ) | | | 1,377 | | | | (1,371 | ) |
| | | | | | | | | | | | |
Net increase (decrease) in cash and cash equivalents | | | (833 | ) | | | 6,050 | | | | 47,731 | |
Cash and cash equivalents, beginning of year | | | 105,072 | | | | 99,022 | | | | 51,291 | |
| | | | | | | | | | | | |
Cash and cash equivalents, end of year | | € | 104,239 | | | € | 105,072 | | | € | 99,022 | |
| | | | | | | | | | | | |
The accompanying notes are an integral part of these consolidated financial statements.
MERCER INTERNATIONAL INC.
CONSOLIDATED STATEMENTS OF CASH FLOWS (continued)
(In thousands of Euros)
| | | | | | | | | | | | |
| | | For the Year Ended December 31, | |
| | | 2012 | | | 2011 | | | 2010 | |
Supplemental disclosure of cash flow information | | | | | | | | | | | | |
Cash paid during the year for | | | | | | | | | | | | |
Interest | | € | 51,845 | | | € | 57,725 | | | € | 65,167 | |
Income taxes | | | 3,890 | | | | 3,197 | | | | 461 | |
Supplemental schedule of non-cash investing and financing activities | | | | | | | | | | | | |
Acquisition of production and other equipment under capital lease obligations | | € | 2,059 | | | € | 2,782 | | | € | 2,087 | |
Increase (decrease) in accounts payable for property, plant and equipment | | | 6,210 | | | | 324 | | | | (1,070 | ) |
Increase (decrease) in receivables of government grants for long-term assets | | | (2,559 | ) | | | (6,835 | ) | | | 7,492 | |
The accompanying notes are an integral part of these consolidated financial statements.
MERCER INTERNATIONAL INC.
NOTES TO THE CONSOLIDATED FINANCIAL STATEMENTS
(In thousands of Euros, except per share data)
| |
Note 1. The Company and Summary of Significant Accounting Policies Note 1.
| The Company and Summary of Significant Accounting Policies |
Background
Mercer International Inc. (“Mercer Inc.” or the “Company”) is a Washington corporation and the Company’s shares of common stock are quoted and listed for trading on the NASDAQ Global Market and the Toronto Stock Exchange, respectively. The Company converted its corporate form from a Washington business trust to a corporation effective March 1, 2006 without effecting any changes to its business, management, accounting practices, assets or liabilities.
Exchange.Mercer Inc. operates three pulp manufacturing facilities, one in Canada and two in Germany, and is one of the largest producers of market northern bleached softwood kraft or “NBSK”,(“NBSK”) pulp in the world.
In these consolidated financial statements,Consolidated Financial Statements, unless otherwise indicated, all amounts are expressed in Euros (“€”). The term “U.S. dollars” and the symbol “$” refer to United States dollars. The symbol “C$” refers to Canadian dollars.
These consolidated financial statementsConsolidated Financial Statements contained herein include the accounts of the Company and its wholly-owned and majority-owned subsidiaries (collectively, the “Company”). All significant inter-company balances and transactionsThe Company’s consolidated financial statements have been eliminated upon consolidation.
Use of Estimates
Preparation of financial statements and related disclosuresprepared in
conformityaccordance with accounting principles generally accepted in the United States of America (“GAAP”)
. All significant inter-company balances and transactions have been eliminated upon consolidation.Use of Estimates
Preparation of financial statements and related disclosures in conformity with GAAP requires management to make estimates and assumptions that affect the amounts reported in the financial statements and accompanying notes. Significant management judgementjudgment is required in determining the accounting for, among other things, the accounting for doubtful accounts and reserves, depreciation and amortization, future cash flows associated with impairment testing for long-lived assets, derivative financial instruments, environmental conservation and legal liabilities, asset retirement obligations, pensions and post-retirement benefit obligations, income taxes, contingencies, and inventory obsolescence and provisions. Actual results could differ materially from these estimates, and changes in these estimates are recorded when known.
Cash and Cash Equivalents
Cash and cash equivalents include cash held in bank accounts and highly liquid money market investments with original maturities of three months or less.
TradingInvestments in debt securities consisting of marketable securities, are classified as current investments and are reported at fair values with realized gains or losses and unrealized holding gains or losses included in the results of operations.
Equityequity investments in publicly traded companies in which the Company has less than 20% of the voting interest and in which it does not exercise significant influence are classified asavailable-for-sale securities. These securities are reported in long-term assets at fair values; based upon quoted market prices, with the unrealized gains or losses included in accumulated other comprehensive income as a separate component of shareholders’ equity, until realized. If a loss in value inavailable-for-sale securities is considered to be other than temporary, the loss is recognized in the determination of net income. The cost of all securities sold is based on the specific identification method to determine realized gains or losses.
79
MERCER INTERNATIONAL INC.
NOTES TO THE CONSOLIDATED FINANCIAL STATEMENTS
(In thousands of Euros, except per share data)
| |
Note 1. The Company and Summary of Significant Accounting Policies (continued) Note 1.
| The Company and Summary of Significant Accounting Policies — (Continued) |
Inventories
Inventories of pulp, logsraw materials, finished goods and wood chipswork in progress are valued at the lower of cost, using the weighted-average cost method, or net realizable value. Other materials and suppliesspare parts are valued at the lower of cost and replacement cost. Cost includes labor, materials and production overhead and is determined by using the weighted average cost method. InventoriesRaw materials inventories include both roundwood (logs) and wood chips. These inventories are located both at the pulp mills and at various offsite locations. In accordance with industry practice, physical inventory counts utilize standardized techniques to estimate quantities of roundwood and wood chip inventory volumes. These techniques historically have provided reasonable estimates of such inventories.
Property, Plant and Equipment
Property, plant and equipment is stated at cost less accumulated depreciation. Depreciation of buildings and production equipment is based on the estimated useful lives of the assets and is computed using the straight-line method. Buildings are depreciated over 10 to 50 years and production equipment and other equipment primarily over 25 years.
The Company reviews its long-lived assets for impairment whenever events or changes in circumstances indicate that the carrying value of such assets may not be recoverable. To determine recoverability, the Company compares the carrying value of the assets to the estimated future undiscounted cash flows. Measurement of an impairment loss for long-lived assets held for use is based on the fair value of the asset.
The costs of major rebuilds, replacements and those expenditures that substantially increase the useful lives of existing property, plant, and equipment are capitalized, as well as interest costs associated with major capital projects until ready for their intended use. The cost of repairs and maintenance as well as planned shutdown maintenance performed on manufacturing facilities, composed of labor, materials and other incremental costs, is charged to operations as incurred.
Leases which transfer to the Company substantially all the risks and benefits incidental to ownership of the leased item are capitalized at the present value of the minimum lease payments. Capital leases are depreciated over the lease term. Operating lease payments are recognized as an expense in the Consolidated Statement of Operations on a straight-line basis over the lease term.
The Company provides for asset retirement obligations when there areis a legislated or contractual basesbasis for those obligations. Obligations are recorded as a liability at fair value, with a corresponding increase to property, plant, and equipment, and are amortized over the remaining useful life of the related assets. The liability is accreted using a risk freerisk-free interest rate.
The Company’s obligations for the proper removal and disposal of asbestos products from the Company’s mills meets the definition of a conditional asset retirement obligation as found in the Financial Accounting Standards Board (“FASB”) issued guidance as outlined in Accounting Standards Codification Topic 410, (“ASC 410”),Asset Retirement and Environment. Generally asbestos is found on steam and condensate piping systems as well as certain cladding on buildings and in building insulation throughout its older facilities. As a result of the longevity of the Company’s mills, due in part to the maintenance procedures and the fact that the Company does not have plans for major changes that require the removal of asbestos, the timing of the asbestos removal is indeterminate. As a result, the Company is currently unable to estimate the fair value of its asbestos removal and disposal obligation.
Government Investment Grants
The Company records investment grants from federal and state governments when theythe conditions of their receipt are complied with and there is reasonable assurance that the grants will be received. Grants related to assets are government grants whose primary condition is that the company qualifying for them should purchase, construct or otherwise acquire long-term assets. Secondary conditions may also be attached, including
80
MERCER INTERNATIONAL INC.
NOTES TO THE CONSOLIDATED FINANCIAL STATEMENTS
(In thousands of Euros, except per share data)
| |
Note 1. | The Company and Summary of Significant Accounting Policies — (Continued) |
restricting the type or location of the assets
and/or other conditions that must be met. Grants related to assets
when received, are deducted from the asset
costs. costs in the Consolidated Balance Sheet.MERCER INTERNATIONAL INC.
NOTES TO THE CONSOLIDATED FINANCIAL STATEMENTS
(In thousands of Euros, except per share data)
Note 1. The Company and Summary of Significant Accounting Policies (continued)
Grants related to income are government grants which are either unconditional, related to reduced environmental emissions or related to the Company’s normal business operations, and are reported as a reduction of related expenses in the Consolidated Statement of Operations when received.
The Company is required to pay certain fees based on water consumption levels at its German mills. Accrued fees can be reduced by wastewater grants upon the mills’ demonstration of reduced environmental emissions. The fees are expensed as incurred and the grants are recognized once the German regulators have evaluated and accepted the measurement of the wastewater emission reduction. There may be a significant period of time between recognition of the wastewater expense and recognition of the wastewater grant.
To the extent that government grants have been received and not applied, these grants are recorded in cash with a corresponding adjustment to the “Accountsaccounts payable and accrued expenses”other in the Consolidated Balance Sheet due to the short-term nature of the related payments.
Deferred Note Issuance Costs
Note issuance costs are deferred and amortized as a component of interest expense in the Consolidated Statement of Operations over the term of the related debt instrument.
The Company maintains a defined benefit pension plan for its salaried employees at its Celgar mill which is funded and non-contributory. The cost of the benefits earned by the salaried employees is determined using the projected benefit method pro ratedprorated on services. The pension expense reflects the current service cost, the interest on the unfunded liability and the amortization over the estimated average remaining service life of the employees of (i) the unfunded liabilityprior service costs, and (ii) experience gainsthe net actuarial gain or losses.
In accordance withloss that exceeds 10% of the guidancegreater of the accrued benefit obligation and the fair value of plan assets as outlined inof theCompensation-Retirement BenefitsTopic ASC 715 (“ASC715-30” and “ASC715-60”), beginning of the period. The Company recognizes the net funded status of the plan.
Effective December 31, 2008, the defined benefit pension plan was closed to new members and the defined benefit service accrual ceased. Members began to accrue benefits under a new defined contribution plan effective January 1, 2009. The contributions to the new plan will be charged against earnings, in the Consolidated Statement of Operations.
In addition, hourly-paid employees at the Celgar mill are covered by a multi-employer defined contributionmultiemployer pension plan for which contributions are charged against earnings in the Consolidated Statement of Operations.
Foreign Operations and Currency Translation
The Company translates foreign assets and liabilities of its subsidiaries, other than those denominated in Euros, at the rate of exchange at the balance sheet date. Revenues and expenses are translated at the average rate of exchange throughout the year. Transaction gains and losses related to net assets primarily located in Canada are recognized as unrealized foreign currency translation adjustments within accumulated other comprehensive income (loss) in shareholders’ equity, until all of the investment in the subsidiaries is sold or liquidated. The translation adjustments do not recognize the effect of income tax when the Company expects earnings of the foreign subsidiary to reinvestbe indefinitely reinvested. The income tax effect on currency translation adjustments related to foreign subsidiaries that are not considered indefinitely reinvested is recorded as a component of deferred taxes in the amounts indefinitely in operations.Consolidated Balance Sheet with an offset to other comprehensive income. Gains and losses resulting from foreign currency transactions (transactions denominated in a currency other than the entity’s functional currency) are included in “Costscosts and expenses”expenses in the Consolidated Statement of Operations.
Where inter-company loans are of a long-term investment nature, the after-tax effect of exchange rate changes are included as an unrealized foreign currency translation adjustment within accumulated other comprehensive income in shareholders’ equity.MERCER INTERNATIONAL INC.
NOTES TO THE CONSOLIDATED FINANCIAL STATEMENTS
(In thousands of Euros, except per share data)
Note 1. The Company and Summary of Significant Accounting Policies (continued)
Revenue and Related Cost Recognition
The Company recognizes revenue from product, sales, transportation, chemical and other sales when persuasive evidence of an arrangement exists, the sales price is fixed or determinable, title of ownership and risk of loss have passed to the customer and collectability is reasonably assured. Sales are reported net of discounts and allowances.
81
MERCER INTERNATIONAL INC.
NOTES TO THE CONSOLIDATED FINANCIAL STATEMENTS
(In thousands of Euros, except per share data)
| |
Note 1. | The Company and Summary of Significant Accounting Policies — (Continued) |
Amounts charged to customers for shipping and handling are recognized as revenue.revenue in the Consolidated Statement of Operations. Shipping and handling costs incurred by the Company are included in “Operating costs”.
During 2008,operating costs in the
Consolidated Statement of Operations.The Company increased its focus on the production and sale of surplus electricity. Accordingly, management no longer considered this activity to be a by-product and, commencing in 2008, the Company began reportingreports revenue from sales of surplus electricity and the sale of chemicals as “Energy revenue”energy and chemical revenues in the Consolidated Statement of Operations. Energy revenues are recognized as the electricity is consumed by the customers are invoiced at agreed upon rates and when collection is reasonably assured. These revenues include an estimate of the value of electricity consumed bytransferred to customers in the year but billed subsequent to year-end. Customer bills are based on agreed upon rates and meter readings that indicate electricity consumption. This activity does not meet the tests to be considered an operating segment, as defined in the
Segment Reporting Topic ASC 280 (“ASC280-10”).
Environmental Conservation
Liabilities for environmental conservation are recorded when it is probable that obligations have been incurred and their fair value can be reasonably estimated. Any potential recoveries of such liabilities are recorded when there is an agreement with the reimbursing entity and recovery is assessed as likely to occur.
Under theCompensation-Stock CompensationTopic ASC 718 (“ASC 718”), theThe Company recognizes stock-based compensation expense over an award’s vesting period based on the award’s fair value. Stock based compensation expense has been recordedvalue in “Selling,selling, general, and administrative expenses” inexpenses within the Consolidated Statement of Operations.
The fair value of performance stock awardsshare units is re-measured at each balance sheet date.date by multiplying the market price of a share of Mercer Inc. common shares by the expected number of common shares to be awarded. The cumulative effect of the change in fair value is recognized in the period of the change as an adjustment to compensation cost. The Company estimates forfeitures of performance stock awardsshare units based on management’s expectations and recognizes compensation cost only for those awards expected to vest. Estimated forfeitures are adjusted to actual experience as needed.
at each balance sheet date.The fair value of restricted stockshare awards areis determined by multiplying the market price of a share of Mercer Inc. common shares on the grant date by the number of units.
units granted.Income Taxes
Income taxes are reported under the guidance of theIncome TaxesTopic ASC 740 (“ASC740-10”) and accordingly, deferredDeferred income taxes are recognized using the asset and liability method, whereby deferred tax assets and liabilities are recognized for the future tax consequences attributable to differences between the financial statement carrying amounts of existing assets and liabilities and their respective tax bases, and operating loss and tax credit carryforwards. Valuation allowances are provided if, after considering both positive and negative available evidence, it is more likely than not that some or all of the net deferred tax assets will not be realized.
MERCER INTERNATIONAL INC.
NOTES TO THE CONSOLIDATED FINANCIAL STATEMENTS
(In thousands of Euros, except per share data)
Note 1. The Company and Summary of Significant Accounting Policies (continued)
Deferred income taxes are determined separately for each tax-paying component of the Company. For each tax-paying component, all current deferred tax liabilities and assets shall beare offset and presented as a single net amount and all noncurrent deferred tax liabilities and assets shall beare offset and presented as a single net amount.
Derivative Financial Instruments
The Company occasionally enters into derivative financial instruments, including foreign currency forward contracts, electricity forward contracts, and interest rate swaps, and pulp price swaps to limit exposures to changes in foreign currency
82
MERCER INTERNATIONAL INC.
NOTES TO THE CONSOLIDATED FINANCIAL STATEMENTS
(In thousands of Euros, except per share data)
| |
Note 1. | The Company and Summary of Significant Accounting Policies — (Continued) |
exchange rates, energy prices, interest rates, and interest rates.pulp prices. These derivative instruments are not designated as hedging instruments under the guidance of theDerivatives and HedgingTopic ASC 815 (“ASC815-25”), and accordingly, anyinstruments. The change in themarked-to-marketfair value of electricity derivative contracts is included in operating costs in the Consolidated Statement of Operations and any changes in the fair value of foreign currency, interest rate, and pulp price derivative contracts are recognized as ain gain or loss(loss) on derivative financial instruments in the Consolidated Statement of Operations. Periodically, the Company enters into derivative contracts to supply materials for its own use and as such are exempt from mark to marketmark-to-market accounting.
Net Income (Loss) Per Share Attributable to Common Shareholders
Basic net income (loss) per share attributable to common shareholders (“EPS”) is computed by dividing net income (loss) available to common shareholders by the weighted average number of common shares outstanding in the period. Diluted income (loss) per share attributable to common shareholders is calculated to give effect to all potentially dilutive common shares outstanding (computed under basic EPS) by applying the “Treasury Stock” and “If Converted”“If-Converted” methods. Outstanding stock options, restricted stock, awards such as restricted stock awards withshares, performance conditions (known as “performance stock”),shares, performance share units, and convertible notes represent the only potentially dilutive effects on the Company’s weighted average shares. See
Note 12-NetReclassifications Income (Loss) Per Share.
Reclassifications
Certain prior year amounts in the consolidated financial statements have been reclassified to conform to the current year presentation.
New Accounting Standards
In April 2010, During the FASB issued guidanceyear ended December 31, 2012, the Company has presented revenue from the sale of chemicals within Accounting Standards Update (“ASU”)2010-13,Compensation — Stock Compensation (ASC 718): Effect of Denominating the Exercise Price of a Share-Based Payment Awardenergy and chemical revenues in the CurrencyConsolidated Statement of the Market in Which the Underlying Equity Security Trades.The amendments in this update are effective for fiscal years, and interim periodsOperations. This revenue had previously been presented within those fiscal years, beginning on or after December 15, 2010. The amendments in this update should be applied by recording a cumulative-effect adjustment to the opening balance of retained earnings. The cumulative-effect adjustment should be calculated for all awards outstanding as of the beginning of the fiscal year in which the amendments are initially applied, as if the amendments had been applied consistently since the inception of the award. The cumulative-effect adjustment should be presented separately. The adoption of this guidance is not expected to have a material impact on the Company’s financial statements.
Recently Implemented Accounting Standards
This section highlights recently implemented accounting standards that had a significant impact on the Company’s financial statements.
In January 2010, the Company adopted ASU2010-06, which amends Accounting Standards Codification 820 (“ASC 820”),Fair Value Measurements and Disclosures.This new accounting guidance requires expanded fair value measurement disclosures in quarterly and annual financial statements. The new guidance clarifies existing disclosure requirementsoperating costs. Chemical revenue for the Level 2 and 3 fair value measurement. Additionally, the new guidance also requires details of significant transfers of assets between Level 1 and Level 2 fair value measurement categories, including the reasons for such transfers, as well as gross presentation of activity within the Level 3 fair value measurement category. This guidance is effective for the Company on January 1,year ended December 31, 2012 was €11,643 (2011 – €10,107; 2010 except for the gross presentation of Level 3 activity, which is effective January 1, 2011. The adoption of this new accounting guidance did not impact the results of operations or the financial position of the Company.
83– €5,063).
MERCER INTERNATIONAL INC.
NOTES TO THE CONSOLIDATED FINANCIAL STATEMENTS
(In thousands of Euros, except per share data)
| |
Note 2. | Cash and Cash Equivalents |
The Company maintains cash balances in foreign financial institutions in excess of insured limits.
| | | | | | | | | |
| | | December 31, |
| | | 2010 | | 2009 |
| |
| Cash and cash equivalents | | € | 99,022 | | | € | 51,291 | |
| | | | | | | | | |
Included in cash and cash equivalents is approximately €nil (2009 — €1,300) that was provided as part of the Canadian Federal Government’s Pulp and Paper Green Transformation Program (“GTP”). Monies provided under the GTP are expected to be spent on various projects at the Celgar mill shortly after receipt.
Cash Equivalents | | | | | | | | |
| | | December 31, | |
| | | 2012 | | | 2011 | |
Cash and cash equivalents | | € | 104,239 | | | € | 105,072 | |
| | | | | | | | |
Cash and cash equivalents includes cash allocated for debt service reserves and for a capital project as required under certain debt agreements (Note 7(a))(see Note 8(a)(d)—Debt).
| | | | | | | | | |
| | | December 31, | |
| | | 2010 | | | 2009 | |
| |
| Sale of pulp (net of allowance of €1,005 and €952, respectively) | | € | 105,950 | | | € | 64,864 | |
| Value added tax | | | 3,669 | | | | 3,001 | |
| Other | | | 12,090 | | | | 3,278 | |
| | | | | | | | | |
| | | € | 121,709 | | | € | 71,143 | |
| | | | | | | | | |
MERCER INTERNATIONAL INC.
NOTES TO THE CONSOLIDATED FINANCIAL STATEMENTS
(In thousands of Euros, except per share data)
Note 3. Marketable Securities
The Company’s marketable securities at December 31, 2012 and 2011 are summarized as follows:
| | | | | | | | | | | | | | | | |
| December 31, 2012 | | Amortized
Cost | | | Gross
Unrealized
Gains | | | Gross
Unrealized
Losses | | | Fair
Value | |
Long-term | | | | | | | | | | | | | | | | |
Equity securities | | € | 65 | | | € | 154 | | | € | (35 | ) | | € | 184 | |
| | | | | | | | | | | | | | | | |
| | | | |
| December 31, 2011 | | Amortized
Cost | | | Gross
Unrealized
Gains | | | Gross
Unrealized
Losses | | | Fair
Value | |
Current | | | | | | | | | | | | | | | | |
0.50% German federal government bonds due June 2012 | | € | 2,008 | | | € | 3 | | | € | — | | | € | 2,011 | |
0.75% German federal government bonds due September 2012 | | | 7,036 | | | | 19 | | | | — | | | | 7,055 | |
5.00% German federal government bonds due July 2012 | | | 3,143 | | | | 7 | | | | — | | | | 3,150 | |
| | | | | | | | | | | | | | | | |
| | € | 12,187 | | | € | 29 | | | € | — | | | € | 12,216 | |
| | | | | | | | | | | | | | | | |
Long-term | | | | | | | | | | | | | | | | |
Equity securities | | € | 65 | | | € | 132 | | | € | (41 | ) | | € | 156 | |
| | | | | | | | | | | | | | | | |
In order to maintain the Company’s liquidity requirements and manage risk, the Company periodically invests in low risk and highly liquid marketable debt securities that are classified as available-for-sale investments and accordingly are carried at fair value. As at December31,2012, all debt securities had matured and the Company realized a gain of €26 in other income (expense) in the Consolidated Statement of Operations.
The Company has also invested nominal amounts in equity securities. The equity securities are classified as available-for-sale investments and accordingly are carried at fair value. The Company recognizes any gross unrealized gains or losses through accumulated other comprehensive income, and records investments in long-term marketable securities in the Consolidated Balance Sheet within deferred note issuance and other.
The Company reviews for other-than-temporary losses on a regular basis and has concluded that the gross unrealized losses indicated above are temporary in nature.
Note 4. Receivables
| | | | | | | | |
| | | December 31, | |
| | | 2012 | | | 2011 | |
Sale of pulp, energy and chemicals, net of allowance of €112 (2011 – €105) | | € | 101,451 | | | € | 108,094 | |
Value added tax | | | 4,290 | | | | 7,411 | |
Other non-trade receivables | | | 4,346 | | | | 4,982 | |
| | | | | | | | |
| | € | 110,087 | | | € | 120,487 | |
| | | | | | | | |
MERCER INTERNATIONAL INC.
NOTES TO THE CONSOLIDATED FINANCIAL STATEMENTS
(In thousands of Euros, except per share data)
Note 4. Receivables (continued)
The Company reviews the collectability of receivables on a periodic basis.at each reporting date. The Company maintains an allowance for doubtful accounts at an amount estimated to cover the potential losses on certain uninsured receivables. Any amounts that are determined to be uncollectible and uninsured are offset against the allowance. The allowance is based on the Company’s evaluation of numerous factors, including the payment history and financial position of the debtors. The Company does not generally require collateral for any of its receivables.
As at December 31, 2010, pursuant to an amended contribution agreement for approximately C$48.0 million finalized in November 2010 under the GTP,For certain customers the Company recorded approximately €7,700 (C$10.2 million) (2009 — €nil) within other receivables in relationreceives a letter of credit prior to the Green Energy Project.
Other than the above mentioned item, other receivables relates to non-trade receivables that are individually not material.
| | | | | | | | | |
| | | December 31, | |
| | | 2010 | | | 2009 | |
| |
| Raw materials | | € | 47,179 | | | € | 24,888 | |
| Finished goods | | | 27,127 | | | | 24,198 | |
| Work in process and other | | | 27,913 | | | | 23,543 | |
| | | | | | | | | |
| | | € | 102,219 | | | € | 72,629 | |
| | | | | | | | | |
As at December 31, 2010, the Company had not recorded any provisions against finished goods inventories (2009 — €nil), or against raw material inventories (2009 — €nil).
84
Note 5. InventoriesMERCER INTERNATIONAL INC.
NOTES TO THE CONSOLIDATED FINANCIAL STATEMENTS
(In thousands of Euros, except per share data)
| | | | | | | | |
| | | December 31, | |
| | | 2012 | | | 2011 | |
Raw materials | | € | 46,028 | | | € | 48,063 | |
Finished goods | | | 38,169 | | | | 41,392 | |
Spare parts and other | | | 34,103 | | | | 31,084 | |
| | | | | | | | |
| | € | 118,300 | | | € | 120,539 | |
| | | | | | | | |
| |
Note 5. | Property, Plant and Equipment |
| | | | | | | | | |
| | | December 31, | |
| | | 2010 | | | 2009 | |
| |
| Land | | € | 25,137 | | | € | 24,921 | |
| Buildings | | | 131,546 | | | | 126,570 | |
| Production equipment and other | | | 1,130,294 | | | | 1,098,380 | |
| | | | | | | | | |
| | | | 1,286,977 | | | | 1,249,871 | |
| Less: Accumulated depreciation | | | (440,210 | ) | | | (381,313 | ) |
| | | | | | | | | |
| | | € | 846,767 | | | € | 868,558 | |
| | | | | | | | | |
Note 6. Property, Plant and Equipment
| | | | | | | | |
| | | December 31, | |
| | | 2012 | | | 2011 | |
Land | | € | 25,188 | | | € | 25,156 | |
Buildings | | | 134,394 | | | | 133,316 | |
Production equipment and other | | | 1,165,274 | | | | 1,125,953 | |
| | | | | | | | |
| | | 1,324,856 | | | | 1,284,425 | |
Less: accumulated depreciation | | | (515,978 | ) | | | (463,451 | ) |
| | | | | | | | |
| | € | 808,878 | | | € | 820,974 | |
| | | | | | | | |
As at December 31, 20102012, property, plant and equipment was net of €297,992€276,715 of unamortized government investment grants (2009 — €283,730)(2011 – €291,655).
As at December31, 2010,2012, included in production equipment and other is equipment under capital leases which had gross amounts of €17,468 (2009 — €17,465)€16,466 (2011 – €17,036), and accumulated depreciation of €9,585 (2009 — €9,280)€8,375 (2011 – €9,096). During the year, production equipment and other totalling €2,087€2,059 was acquired under capital lease obligations (2009 — €625; 2008 — €5,318)(2011 – €2,782; 2010 – €2,087).
The Company maintains industrial landfills on its premises for the disposal of waste, primarily from the mill’s pulp processing activities. The mills have obligations under their landfill permits to decommission these disposal facilities pursuant to certain regulations. As at December31, 2010,2012, the Company had recorded €4,180 (2009 — €3,912)€4,251 (2011 – €4,170) of asset retirement obligations.
Certain ofobligations in capital leases and other in the assets at the Celgar mill are subject to a lien registered for the benefit of the province of British Columbia. The lien was registered pursuant to a property transfer tax dispute that is currently before the courts. Effective January 24, 2011, the lien was removed from these assets. See Note 16 — Commitments and Contingencies.
| |
Note 6. Consolidated Balance Sheet. | Accounts Payable and Accrued Expenses |
| | | | | | | | | |
| | | December 31, | |
| | | 2010 | | | 2009 | |
| |
| Trade payables | | € | 36,680 | | | € | 31,771 | |
| Accounts payable and other | | | 3,861 | | | | 1,225 | |
| Accrued expenses | | | 27,452 | | | | 31,441 | |
| Accrued interest | | | 13,640 | | | | 18,039 | |
| Capital leases, current portion | | | 3,240 | | | | 2,709 | |
| | | | | | | | | |
| | | € | 84,873 | | | € | 85,185 | |
| | | | | | | | | |
85
MERCER INTERNATIONAL INC.
NOTES TO THE CONSOLIDATED FINANCIAL STATEMENTS
(In thousands of Euros, except per share data)
Note 7. Accounts Payable and Other
| | | | | | | | |
| | | December 31, | |
| | | 2012 | | | 2011 | |
Trade payables | | € | 30,259 | | | € | 45,751 | |
Accrued expenses | | | 35,852 | | | | 28,422 | |
Accrued interest | | | 8,739 | | | | 10,054 | |
Capital leases, current portion (Note 18) | | | 1,958 | | | | 2,505 | |
Current taxes payable (Note 10) | | | 7,217 | | | | 2,541 | |
Other (a) | | | 5,925 | | | | 10,367 | |
| | | | | | | | |
| | € | 89,950 | | | € | 99,640 | |
| | | | | | | | |
| (a) | |
On January 28, 2011, the Company received approximately €10,000, which was intended to compensate the Company for remediation work that is required at the Stendal mill. The payment was recognized as an increase in cash and cash equivalents, and a corresponding increase in other accounts payable. As at December 31, 2012, the Company had €1,768 (2011 – €9,150) remaining in other accounts payable (see Note 7. | Debt19(b)—Commitments and Contingencies). |
Note 8. Debt
Debt consists of the following:
| | | | | | | | | |
| | | December 31, | |
| | | 2010 | | | 2009 | |
| |
| Note payable to bank, included in a total loan credit facility of €827,950 to finance the construction related to the Stendal mill (a) | | € | 500,657 | | | € | 514,574 | |
| Senior notes due February 2013, interest at 9.25% accrued and payable semi-annually, unsecured (b)(1) | | | 15,341 | | | | 216,299 | |
| Senior notes due December 2017, interest at 9.50% accrued and payable semi-annually, unsecured (c) | | | 224,031 | | | | — | |
| Subordinated convertible notes due October 2010, interest at 8.5% accrued and payable semi-annually (d)(2) | | | — | | | | 16,749 | |
| Subordinated convertible notes due January 2012, interest at 8.5% accrued and payable semi-annually (e) | | | 31,707 | | | | 26,160 | |
| Credit agreement with a lender with respect to a revolving credit facility of C$40 million (f) | | | 15,016 | | | | 16,000 | |
| Loan payable to the noncontrolling shareholder of the Stendal mill (g) | | | 31,365 | | | | 35,881 | |
| Credit agreement with a bank with respect to a revolving credit facility of €25,000 (h) | | | — | | | | — | |
| Investment loan agreement with a lender with respect to the wash press project at the Rosenthal mill of €4,351 (i) | | | 3,807 | | | | 3,511 | |
| Credit agreement with a bank with respect to a revolving credit facility of €3,500 (j) | | | — | | | | — | |
| | | | | | | | | |
| | | | 821,924 | | | | 829,174 | |
| Less: current portion | | | (39,596 | ) | | | (16,032 | ) |
| | | | | | | | | |
| Debt, less current portion | | € | 782,328 | | | € | 813,142 | |
| | | | | | | | | |
The Company made scheduled principal repayments under these facilities of €16,086 in 2010, and expects the principal repayments to be €39,596 in 2011. As of December 31, 2010, the principal maturities of debt are as follows:
| | | | | |
Matures | | Amount | |
| |
| 2011(1) | | € | 39,596 | |
| 2012 | | | 57,378 | |
| 2013(1)(3) | | | 56,104 | |
| 2014 | | | 40,543 | |
| 2015 | | | 44,000 | |
| Thereafter | | | 584,303 | |
| | | | | |
| | | € | 821,924 | |
| | | | | |
| | |
(1) | | On December 20, 2010, the Company announced its intention to redeem all of its Senior Notes due 2013. The unconditional redemption notice stipulates that all outstanding Senior Notes due 2013 are irrevocably due and payable on the redemption date of February 15, 2011 and as such the Company has treated this amount as current as at December 31, 2010. See Note 18 — Subsequent Events. |
(2) | | On January 21, 2010, €15,162 of the subordinated convertible notes due October 2010 were tendered for exchange for subordinated convertible notes due January 2012 and as such the Company treated this amount as non-current at December 31, 2009. |
(3) | | Includes revolving credit facility principal amounts totalling €15,016. |
86
| | | | | | | | |
| | | December 31, | |
| | | 2012 | | | 2011 | |
Note payable to bank, included in a total loan credit facility of €827,950 to finance the construction related to the Stendal mill (a) | | € | 452,907 | | | € | 477,490 | |
Senior notes, interest at 9.50% accrued and payable semi-annually, unsecured (b) | | | 215,670 | | | | 220,753 | |
Credit agreement with a lender with respect to a revolving credit facility of C$40 million (c) | | | 4,574 | | | | — | |
Term bank facility for a project at the Stendal mill of €17,000 (d) | | | — | | | | — | |
Loans payable to the noncontrolling shareholder of the Stendal mill (e) | | | 36,620 | | | | 33,124 | |
Investment loan agreement with a lender with respect to a project at the Rosenthal mill of €4,351 (f) | | | 1,632 | | | | 2,719 | |
Credit agreement with a bank with respect to a revolving credit facility of €25,000 (g) | | | — | | | | — | |
Credit agreement with a bank with respect to a revolving credit facility of €3,500 (h) | | | — | | | | — | |
| | | | | | | | |
| | | 711,403 | | | | 734,086 | |
Less: current portion | | | (45,662 | ) | | | (25,671 | ) |
| | | | | | | | |
Debt, less current portion | | € | 665,741 | | | € | 708,415 | |
| | | | | | | | |
MERCER INTERNATIONAL INC.
NOTES TO THE CONSOLIDATED FINANCIAL STATEMENTS
(In thousands of Euros, except per share data)
| |
Note 7. | Debt — (Continued) |
Note 8. Debt (continued)
The Company made repayments under these facilities of €27,254 in 2012, and expects the repayments to be €45,662 in 2013. As of December 31, 2012, the maturities of debt are as follows:
| | | | |
Matures | | Amount | |
2013 | | € | 45,662 | |
2014 | | | 40,544 | |
2015 | | | 44,000 | |
2016 | | | 44,000 | |
2017 | | | 537,197 | |
Thereafter | | | — | |
| | | | |
| | € | 711,403 | |
| | | | |
Certain of the Company’s debt agreementsinstruments were issued under an indenture which, among other things, restricts its ability and the ability of its restricted subsidiaries to make certain payments. These limitations are subject to other important qualifications andspecific exceptions. As at December 31, 2010,2012, the Company was in compliance with the terms of the indenture.
| |
| (a) | Note payable to bank, included in a total loan facility of €827,950 to finance the construction related to the Stendal mill (“Stendal Loan Facility”), interest at rates varying from Euribor plus 0.90% to Euribor plus 1.58%1.80% (rates on amounts of borrowing at December 31, 20102012 range from 2.04%1.50% to 2.72%2.25%), principal due in required installments beginning September 30, 2006 until September 30, 2017, collateralized by the gross assets of the Stendal mill, with 48% and 32% guaranteed by the Federal Republic of Germany and the State of Saxony-Anhalt, respectively, of up to €455,657€392,907 of outstanding principal, subject to a debt service reserve account required to pay(“DSRA”) for purposes of paying amounts due in the following twelve12 months under the terms of the Stendal Loan Facility; payment of dividends is only permitted if certain cash flow requirements are met. |
| | |
| | On March 13, 2009, See Note 16—Derivative Transactions for a discussion of the Company finalized an agreement with its lendersCompany’s variable-to-fixed interest rate swap that was put in place to amend itseffectively fix the interest rate on the Stendal Loan Facility. The amendment deferred approximately €164,000 of scheduled principal payments until the maturity date, September 30, 2017, including approximately €20,000, €26,000, €21,000 of scheduled principal payments that were originally due in 2009, 2010, and 2011, respectively. The amendment also provided for a 100% cash sweep, referred to as the “Cash Sweep”, of any cash, in excess of a €15,000 working capital reserve, held by Stendal which will be used first to fund the debt service reserve account to a level sufficient to service the amounts due and payable under the Stendal Loan Facility during the then following 12 months, or “Fully Funded”, and second to prepay the deferred principal amounts. As at December 31, 2010, the debt service reserve balance was approximately €6,968. |
| |
(b) | In February 2005, the Company issued $310 million of senior notes due February 2013 (“2013 Notes), which bear interest at 9.25% accrued, and payable semi-annually, and are unsecured. On or after February 15, 2009, the Company may redeem all or a part of the notes at redemption prices (expressed as a percentage of principal amount) equal to 104.63% for the twelve month period beginning on February 15, 2009, 102.31% for the twelve month period beginning on February 15, 2010, and 100.00% beginning on February 15, 2011 and at any time thereafter, plus accrued and unpaid interest. |
| | |
| | On November 17, 2010, the Company used the proceeds from a private offering of $300 million Senior Notes due 2017, described in Note 5(c) below and cash on hand to complete a tender offer to repurchase approximately $289 million aggregate principal amount of its 2013 Notes. Pursuant to the FASB’s Accounting Standards Codification No. 405,Liabilities — Extinguishment of Liabilities(“ASC405-20”), the Company concluded that the tendering of the 2013 Notes met the definition of debt extinguishment. In connection with this tender offer and pursuant to FASB’s Accounting Standards CodificationNo. 470-50,Debt-Modifications and Extinguishments(“ASC470-50”), the Company recorded approximately €7,500 to the loss on extinguishment of debt line in the Consolidated Statement of Operations which included the tender premium paid and the write-off of 2013 Notes unamortized debt issue costs. On December 2, 2010, a further $0.6 million of 2013 Notes were tendered. |
|
| | On December 20, 2010, the Company issued a redemption notice (the “Redemption Notice”) and announced its intention to redeem all 2013 Notes, of which approximately $20.5 million remain outstanding. The Redemption Notice is unconditional, and pursuant to the terms of the indenture all outstanding 2013 Notes are irrevocably due and payable on February 15, 2011 (the “Redemption Date”). The redemption price is 100.00% of the principal amount of the 2013 Notes redeemed, plus accrued and unpaid interest to, but not including, the Redemption Date. See Note 18 — Subsequent Events. |
87
MERCER INTERNATIONAL INC.
NOTES TO THE CONSOLIDATED FINANCIAL STATEMENTS
(In thousands of Euros, except per share data)
| |
Note 7. | Debt — (Continued) |
| |
(c) (b) | On November 17, 2010, the Company completed a private offering of $300$300.0 million in aggregate principal amount of Senior Notessenior notes due 2017 (“2017Senior Notes”). The proceeds from this offering were used to finance the tender offer and consent solicitation for approximately $289 million of the Company’s 2013 Notes. See Note 7(b). The 2017Senior Notes were issued at a price of 100% of their principal amount. The 2017Senior Notes will mature on December 1, 2017 and bear interest at 9.5%9.50% which is accrued and payable semi-annually. |
| | |
| | The 2017 Notes are general unsecured senior obligations of the Company. The 2017 Notes rank equal in right of payment with all existing and future indebtedness of the Company and senior in right of payment to any current or future subordinated indebtedness of the Company. The 2017 Notes are effectively junior in right of payment to all borrowings of the Company’s restricted subsidiaries, including borrowings under the Company’s credit agreements which are secured by certain assets of its restricted subsidiaries. |
|
| | The Company may redeem all or a part of the 2017 Notes, upon not less than 30 or more than 60 days’ notice, at the redemption prices (expressed as percentages of principal amount) equal to 104.75% for the twelve month period beginning on December 1, 2014, 102.38% for the twelve month period beginning on December 1, 2015, and 100.00% beginning on December 1, 2016 and at any time thereafter, plus accrued and unpaid interest. |
| |
(d) | On October 15, 2010 the Company repaid the outstanding principal balance of approximately $2.3 million for the Subordinated Convertible Notes due October 2010 (“2010 Notes”) and any unpaid interest up to the redemption date. This balance represented the amount of 2010 Notes which were not exchanged for Subordinated Convertible Notes due January 2012. See Note 7(e). |
|
(e) | On December 10 and 11, 2009, the Company exchanged approximately $43.3 million of Subordinated Convertible Notes due October 2010 through private exchange agreements with the holders thereof for approximately $43.8 million of Subordinated Convertible Notes due January 2012 (the “2012 Notes”). On January 22, 2010, through an exchange offer with the remaining holders of the 2010 Notes, the Company exchanged a further $21.7 million of 2010 Notes for approximately $22.0 million of the Company’s 2012 Notes. The Company recognized both exchange transactions of the Subordinated Convertible Notes as extinguishments of debt in accordance with ASC Topic 470,Debt,because the fair value of the embedded conversion option changed by more than 10% in both transactions. As a result, for the year ended December 31, 2009, the Company accounted for the December 10, 2009 exchange as a debt extinguishment and recognized a gain of €4,447 in the Consolidated Statement of Operations. During 2010, the Company recognized a loss of €929 as a result of the January 22, 2010 exchange. Both the gain and the loss were determined using fair market values prevailing at the time of the transactions, and both will be accreted to income through to January 2012 through interest expense yielding an effective interest rate of approximately 13% on the December 10, 2009 exchange and 3% on the January 22, 2010 exchange. |
The 2012 Notes bear interest at 8.50%, accrued and payable semi-annually, are convertible at anytime byIn August 2011, the holder into common sharesCompany’s Board of Directors authorized the Company at $3.30 per share and are unsecured. The Company may redeem for cash all or a portionpurchase of the notes on or after July 15, 2011 at 100% of theup to $25.0 million in aggregate principal amount of the notes plus accrued interestCompany’s Senior Notes from time to time, over a period ending August 2012. In June 2012, the Company’s Board of Directors authorized the purchase of up to €50,000 in aggregate principal amount of the redemption date.Company’s Senior Notes from time to time, over a period ending
MERCER INTERNATIONAL INC.
NOTES TO THE CONSOLIDATED FINANCIAL STATEMENTS
(In thousands of Euros, except per share data)
Note 8. Debt (continued)
June 2013. During the year, approximately $21.4 million of Subordinated Convertible Notes due January 2012 were converted into 6,500,171 shares. The Company recorded a debt conversion expense of approximately $0.9 million for the year ended December 31, 2010, as a result2012, the Company purchased $2.0 million of its outstanding Senior Notes. During the year ended December 31, 2011, the Company purchased $13.6 million of its outstanding Senior Notes.
The Senior Notes are general unsecured senior obligations of the conversions,Company. The Senior Notes rank equal in right of payment with all existing and future senior unsecured indebtedness of the Company and senior in right of payment to any current or future subordinated indebtedness of the Company. The Senior Notes are effectively junior in right of payment to all borrowings of the Company’s restricted subsidiaries, including borrowings under the Company’s credit agreements which is included within interest expense inare secured by certain assets of its restricted subsidiaries.
The Company may redeem all or a part of the Consolidated StatementsSenior Notes, upon not less than 30 days’ or more than 60 days’ notice, at the redemption prices (expressed as percentages of Operations. See Note 18 — Subsequent Events.
| |
(f) (c) | Credit agreement with respect to a revolving credit facility of up to C$40.0 million for the Celgar mill. The credit agreement matures May 2013. Borrowings under the credit agreement are collateralized by the mill’s inventory and receivables and are restricted by a borrowing base calculated on the mill’s inventory and receivables. Canadian dollar denominated amounts bear interest at bankers acceptance plus 3.75% or |
88
MERCER INTERNATIONAL INC.
NOTES TO THE CONSOLIDATED FINANCIAL STATEMENTS
(In thousands of Euros, except per share data)
| |
Note 7. | Debt — (Continued) |
| |
| Canadian prime plus 2.00%. U.S. dollar denominated amounts bear interest at LIBOR plus 3.75% or U.S. base plus 2.00%. As at December 31, 2010,2012, this facility was accruing interest at a rate of approximately 4.96%5.00%, C$6.0 million of this facility was drawn, C$1.7 million was supporting letters of credit and the undrawn amount was approximately C$17.9 million.24.0 million was available. |
| (d) | |
(g) | Loans payableA €17,000 amortizing term facility to partially finance a project, referred to as “Project Blue Mill”, to increase the Stendal mill’s annual pulp production capacity by 30,000 air-dried metric tonnes and includes the installation of an additional 40 megawatt steam turbine. The facility, 80% of which is guaranteed by the State of Saxony-Anhalt, bears interest at a rate of Euribor plus 3.5% per annum and is available for disbursement up to August 31, 2013. The interest period for the facility, at the choice of the Company, will be of one, three or six months duration and interest is paid on the last day of the interest period selected. The facility, together with accrued interest, is scheduled to mature in September 2017. The facility will be repaid semi-annually, commencing September 30, 2013, is collateralized by the gross assets of the Stendal mill, and will be non-recourse to the Company. As at December 31, 2012, the Company had not drawn on this facility. As part of the term facility, the Company was required to open an investment account with the lender for the purpose of managing project costs and is required to deposit all funding associated with Project Blue Mill in this account. As at December 31, 2012 the balance in the investment account was €670; this cash was from shareholder loans entered into in January 2012 and operating cash flows. |
| (e) | A loan of €25,128 payable by the Stendal mill to its noncontrolling shareholder of Stendal mill bearbears interest at 7.00%, and areis accrued semi-annually. The loan payable is unsecured, subordinated to all liabilities of the Stendal mill, non-recourse to the Company and its restricted subsidiaries, and is due in 2017. |
In January 2012, the Stendal mill entered into two additional loans payable by the Stendal mill to its noncontrolling shareholder as part of the financing for Project Blue Mill. The first loan has a principal amount of €1,192 and the second loan has a principal amount of €440. Both loans bear interest at 7.00% per annum and are due in 2017, provided that the Project Blue Mill facility (Note 8(d)) and the Stendal Loan
MERCER INTERNATIONAL INC.
NOTES TO THE CONSOLIDATED FINANCIAL STATEMENTS
(In thousands of Euros, except per share data)
Note 8. Debt (continued)
Facility (Note 8(a)) have been fully repaid on such date. The second loan may be repaid prior to October 1, 2017 if the DSRA has been Fully Funded for the first time. The first loan is subordinated to all liabilities of the Stendal mill and the second loan is subordinated to all liabilities of the Stendal mill only until such time as the DSRA is Fully Funded for the first time.
As at December 31, 2012, accrued interest on these loans was €9,860 (2011 – €7,996).
| (f) | A four-year amortizing investment loan agreement with a lender relating to the wash press project at the Rosenthal mill with a total facility of €4,351 bearing interest at the rate of Euribor plus 2.75% that matures February 2014. Borrowings under this agreement are secured by the wash press equipment. As at December 31, 2012, the balance includes principaloutstanding was €1,632 and accrued interest. During the first quarterwas accruing interest at a rate of 2010, the noncontrolling shareholder agreed to convert approximately €6,275 of accrued interest into a capital contribution. SeeNote 17- Noncontrolling Interest.3.42%. |
|
(h) (g) | A €25,000 working capital facility at the Rosenthal mill that matures in December 2012.October 2016. Borrowings under the facility are collateralized by the mill’s inventory and receivables and bear interest at approximately Euribor plus 3.50%. As at December 31, 2010,2012, approximately €2,100€1,300 of this facility was supporting bank guarantees leaving approximately €22,900 undrawn.€23,700 available. |
|
(i) (h) | On August 19, 2009 the Company finalized an investment loan agreement with a lender relating to the new wash pressA €3,500 facility at the Rosenthal mill. The four-year amortizing investment loan was completed with a total facility of €4,351 bearing interest at the rate of Euribor plus 2.75%.mill that matures in December 2015. Borrowings under this agreement are secured by the new wash press equipment. As at December 31, 2010 this facility was drawn by €3,807 and was accruing interest at a rate of 3.90%. |
|
(j) | On February 8, 2010, the Rosenthal mill finalized a credit agreement with a lender for a €3,500 facility maturing in December 2012. Borrowings under the facility will bear interest at the rate of the3-month three-month Euribor plus 3.50% and are secured by certain land at ourthe Rosenthal mill. As at December 31, 2010,2012 approximately €1,000 of this facility was undrawn.supporting bank guarantees leaving approximately €2,500 available. |
| |
Note 8. | Pension and Other Post-Retirement Benefit Obligations |
Note 9. Pension and Other Post-Retirement Benefit Obligations
Included in pension and other post-retirement benefit obligations are amounts related to the Company’s Celgar and GermanRosenthal mills. The largest component of this obligation is with respect to the Celgar mill which maintains a defined benefit pension plan and post-retirement benefit plans for certain employees (“Celgar Plans”).
Pension benefits are based on employee’semployees’ earnings and years of service. The Celgar Plans are funded by contributions from the Company based on actuarial estimates and statutory requirements. Pension contributions forduring the twelve month periodyear ended December 31, 2010 totalled€1,053 (2009 — €963)2012 totaled €2,288 (2011 – €2,039).
Effective December 31, 2008, the defined benefit plan was closed to new members. In addition, the defined benefit service accrual ceased on December 31, 2008, and members began to receive pension benefits, at a fixed contractual rate, under a new defined contribution plan effective January 1, 2009. During the year ended December 31, 2012, the Company made contributions of approximately €2,264€618 (2011 – €524) to its defined contribution plans (2009 — €1,844).
89
MERCER INTERNATIONAL INC.
NOTES TO THE CONSOLIDATED FINANCIAL STATEMENTS
(In thousands of Euros, except per share data)
| |
Note 9. Pension and Other Post-Retirement Benefit Obligations (continued) Note 8.
| Pension and Other Post-Retirement Benefit Obligations — (Continued) |
Information about the Celgar Plans, in aggregate for the year ended December 31, 20102012 is as follows:
| | | | | | | | | | | | | |
| | | 2010 | |
| | | | | | Other
| | | | |
| | | | | | Post-Retirement
| | | | |
| | | | | | Benefit
| | | | |
| | | Pension | | | Obligations | | | Total | |
| |
| Change in benefit obligation | | | | | | | | | | | | |
| Benefit obligation, December 31, 2009 | | € | 27,219 | | | € | 12,073 | | | € | 39,292 | |
| Service cost | | | 81 | | | | 391 | | | | 472 | |
| Interest cost | | | 1,672 | | | | 771 | | | | 2,443 | |
| Benefit payments | | | (2,494 | ) | | | (483 | ) | | | (2,977 | ) |
| Past service cost (credit) | | | — | | | | — | | | | — | |
| Actuarial (gains) losses | | | 2,118 | | | | 2,289 | | | | 4,407 | |
| Foreign currency exchange rate changes | | | 3,472 | | | | 1,602 | | | | 5,074 | |
| | | | | | | | | | | | | |
| Benefit obligation, December 31, 2010 | | | 32,068 | | | | 16,643 | | | | 48,711 | |
| | | | | | | | | | | | | |
| Reconciliation of fair value of plan assets | | | | | | | | | | | | |
| Fair value of plan assets, December 31, 2009 | | | 20,947 | | | | — | | | | 20,947 | |
| Actual returns | | | 2,189 | | | | — | | | | 2,189 | |
| Contributions | | | 570 | | | | 483 | | | | 1,053 | |
| Benefit payments | | | (2,494 | ) | | | (483 | ) | | | (2,977 | ) |
| Foreign currency exchange rate changes | | | 2,651 | | | | — | | | | 2,651 | |
| | | | | | | | | | | | | |
| Fair value of plan assets, December 31, 2010 | | | 23,863 | | | | — | | | | 23,863 | |
| | | | | | | | | | | | | |
| Funded status, December 31, 2010(1) | | € | (8,205 | ) | | € | (16,643 | ) | | € | (24,848 | ) |
| | | | | | | | | | | | | |
| Components of the net benefit cost recognized | | | | | | | | | | | | |
| Service cost | | € | 81 | | | € | 391 | | | € | 472 | |
| Interest cost | | | 1,672 | | | | 771 | | | | 2,443 | |
| Expected return on plan assets | | | (1,563 | ) | | | — | | | | (1,563 | ) |
| Amortization of recognized items | | | 438 | | | | (310 | ) | | | 128 | |
| | | | | | | | | | | | | |
| Net benefit costs | | € | 628 | | | € | 852 | | | € | 1,480 | |
| | | | | | | | | | | | | |
| | | | | | | | | | | | |
| | | 2012 | |
| | | Pension | | | Other Post-
Retirement
Benefit
Obligations | | | Total | |
Change in benefit obligation | | | | | | | | | | | | |
Benefit obligation, December 31, 2011 | | € | 35,778 | | | € | 19,797 | | | € | 55,575 | |
Service cost | | | 112 | | | | 564 | | | | 676 | |
Interest cost | | | 1,525 | | | | 875 | | | | 2,400 | |
Benefit payments | | | (1,905 | ) | | | (605 | ) | | | (2,510 | ) |
Actuarial losses | | | 1,193 | | | | 762 | | | | 1,955 | |
Foreign currency exchange rate changes | | | 186 | | | | 81 | | | | 267 | |
| | | | | | | | | | | | |
Benefit obligation, December 31, 2012 | | | 36,889 | | | | 21,474 | | | | 58,363 | |
| | | | | | | | | | | | |
Reconciliation of fair value of plan assets | | | | | | | | | | | | |
Fair value of plan assets, December 31, 2011 | | | 23,734 | | | | — | | | | 23,734 | |
Actual returns | | | 1,905 | | | | — | | | | 1,905 | |
Contributions | | | 1,683 | | | | 605 | | | | 2,288 | |
Benefit payments | | | (1,905 | ) | | | (605 | ) | | | (2,510 | ) |
Foreign currency exchange rate changes | | | 101 | | | | — | | | | 101 | |
| | | | | | | | | | | | |
Fair value of plan assets, December 31, 2012 | | | 25,518 | | | | — | | | | 25,518 | |
| | | | | | | | | | | | |
Funded status, December 31, 2012(1) | | € | (11,371 | ) | | € | (21,474 | ) | | € | (32,845 | ) |
| | | | | | | | | | | | |
Components of the net benefit cost recognized | | | | | | | | | | | | |
Service cost | | € | 112 | | | € | 564 | | | € | 676 | |
Interest cost | | | 1,525 | | | | 875 | | | | 2,400 | |
Expected return on plan assets | | | (1,637 | ) | | | — | | | | (1,637 | ) |
Amortization of unrecognized items | | | 1,130 | | | | 5 | | | | 1,135 | |
| | | | | | | | | | | | |
Net benefit costs | | € | 1,130 | | | € | 1,444 | | | € | 2,574 | |
| | | | | | | | | | | | |
| | |
| (1) | | The total of €24,964€32,954 on the consolidated balance sheetsConsolidated Balance Sheet also includes the pension liabilities of €116€109 relating to employees at the Company’s German operations.Rosenthal operation. |
90
MERCER INTERNATIONAL INC.
NOTES TO THE CONSOLIDATED FINANCIAL STATEMENTS
(In thousands of Euros, except per share data)
| |
Note 9. Pension and Other Post-Retirement Benefit Obligations (continued) Note 8.
| Pension and Other Post-Retirement Benefit Obligations — (Continued) |
Information about the Celgar Plans, in aggregate for the year ended December 31, 20092011 is as follows:
| | | | | | | | | | | | | |
| | | 2009 | |
| | | | | | Other
| | | | |
| | | | | | Post-Retirement
| | | | |
| | | | | | Benefit
| | | | |
| | | Pension | | | Obligations | | | Total | |
| |
| Change in benefit obligation | | | | | | | | | | | | |
| Benefit obligation, December 31, 2008 | | € | 20,028 | | | € | 10,297 | | | € | 30,325 | |
| Service cost | | | 56 | | | | 305 | | | | 361 | |
| Interest cost | | | 1,513 | | | | 785 | | | | 2,298 | |
| Benefit payments | | | (1,715 | ) | | | (373 | ) | | | (2,088 | ) |
| Past service cost (credit) | | | — | | | | (70 | ) | | | (70 | ) |
| Actuarial (gains) losses | | | 4,366 | | | | (295 | ) | | | 4,071 | |
| Foreign currency exchange rate changes | | | 2,971 | | | | 1,424 | | | | 4,395 | |
| | | | | | | | | | | | | |
| Benefit obligation, December 31, 2009 | | | 27,219 | | | | 12,073 | | | | 39,292 | |
| | | | | | | | | | | | | |
| Reconciliation of fair value of plan assets | | | | | | | | | | | | |
| Fair value of plan assets, December 31, 2008 | | | 17,098 | | | | — | | | | 17,098 | |
| Actual returns | | | 2,561 | | | | — | | | | 2,561 | |
| Contributions | | | 589 | | | | 373 | | | | 962 | |
| Benefit payments | | | (1,715 | ) | | | (373 | ) | | | (2,088 | ) |
| Foreign currency exchange rate changes | | | 2,414 | | | | — | | | | 2,414 | |
| | | | | | | | | | | | | |
| Fair value of plan assets, December 31, 2009 | | | 20,947 | | | | — | | | | 20,947 | |
| | | | | | | | | | | | | |
| Funded status, December 31, 2009(1) | | € | (6,272 | ) | | € | (12,073 | ) | | € | (18,345 | ) |
| | | | | | | | | | | | | |
| Components of the net benefit cost recognized | | | | | | | | | | | | |
| Service cost | | € | 56 | | | € | 305 | | | € | 361 | |
| Interest cost | | | 1,513 | | | | 785 | | | | 2,298 | |
| Expected return on plan assets | | | (1,272 | ) | | | — | | | | (1,272 | ) |
| Amortization of recognized items | | | 141 | | | | (279 | ) | | | (138 | ) |
| | | | | | | | | | | | | |
| Net benefit costs | | € | 438 | | | € | 811 | | | € | 1,249 | |
| | | | | | | | | | | | | |
| | | | | | | | | | | | |
| | | 2011 | |
| | | Pension | | | Other Post-
Retirement
Benefit
Obligations | | | Total | |
Change in benefit obligation | | | | | | | | | | | | |
Benefit obligation, December 31, 2010 | | € | 32,068 | | | € | 16,643 | | | �� | 48,711 | |
Service cost | | | 87 | | | | 469 | | | | 556 | |
Interest cost | | | 1,511 | | | | 815 | | | | 2,326 | |
Benefit payments | | | (1,716 | ) | | | (461 | ) | | | (2,177 | ) |
Actuarial losses | | | 3,382 | | | | 2,049 | | | | 5,431 | |
Foreign currency exchange rate changes | | | 446 | | | | 282 | | | | 728 | |
| | | | | | | | | | | | |
Benefit obligation, December 31, 2011 | | | 35,778 | | | | 19,797 | | | | 55,575 | |
| | | | | | | | | | | | |
Reconciliation of fair value of plan assets | | | | | | | | | | | | |
Fair value of plan assets, December 31, 2010 | | | 23,863 | | | | — | | | | 23,863 | |
Actual returns | | | (204 | ) | | | — | | | | (204 | ) |
Contributions | | | 1,578 | | | | 461 | | | | 2,039 | |
Benefit payments | | | (1,716 | ) | | | (461 | ) | | | (2,177 | ) |
Foreign currency exchange rate changes | | | 213 | | | | — | | | | 213 | |
| | | | | | | | | | | | |
Fair value of plan assets, December 31, 2011 | | | 23,734 | | | | — | | | | 23,734 | |
| | | | | | | | | | | | |
Funded status, December 31, 2011(1) | | € | (12,044 | ) | | € | (19,797 | ) | | € | (31,841 | ) |
| | | | | | | | | | | | |
Components of the net benefit cost recognized | | | | | | | | | | | | |
Service cost | | € | 87 | | | € | 469 | | | € | 556 | |
Interest cost | | | 1,511 | | | | 815 | | | | 2,326 | |
Expected return on plan assets | | | (1,549 | ) | | | — | | | | (1,549 | ) |
Amortization of unrecognized items | | | 511 | | | | (69 | ) | | | 442 | |
| | | | | | | | | | | | |
Net benefit costs | | € | 560 | | | € | 1,215 | | | € | 1,775 | |
| | | | | | | | | | | | |
| | |
| (1) | | The total of €18,469€31,953 on the consolidated balance sheetsConsolidated Balance Sheet also includes the pension liabilities of €124€112 relating to employees at the Company’s German operations.Rosenthal operation. |
The Company anticipates that it will make contributions to the pension planCelgar Plans of approximately €1,419€1,509 in 2011.2013. Estimated future benefit payments under the Celgar Plans are as follows:
| | | | | |
| | | Amount |
| |
| 2011 | | € | 2,448 | |
| 2012 | | | 2,509 | |
| 2013 | | | 2,611 | |
| 2014 | | | 2,734 | |
| 2015 | | | 2,862 | |
| 2016 — 2020 | | | 16,445 | |
91
| | | | |
| | | Amount | |
2013 | | € | 2,622 | |
2014 | | | 2,765 | |
2015 | | | 2,890 | |
2016 | | | 3,030 | |
2017 | | | 3,175 | |
2018 – 2022 | | | 17,482 | |
MERCER INTERNATIONAL INC.
NOTES TO THE CONSOLIDATED FINANCIAL STATEMENTS
(In thousands of Euros, except per share data)
| |
Note 8. | Pension and Other Post-Retirement Benefit Obligations — (Continued) |
Note 9. Pension and Other Post-Retirement Benefit Obligations (continued)
During the year ended December 31, 2010,2012, the Company recognized a loss, net of €3,314tax of €628 in other comprehensive income (2009 —(2011 – loss of €3,128; 2008 — income€8,049; 2010 – loss of €4,079)€3,314). As at December 31, 2010,2012, the pension related accumulated other comprehensive income balance of €7,292 (2009 — €3,978)€15,969 (2011 – €15,341) is primarily a result of net actuarial losses. These amounts have been stated net of tax. The Celgar Plans do not have any net transition asset or obligation recognized as a reclassification adjustment of other comprehensive income. The amount included in other comprehensive income which is expected to be recognized in 20112013 is approximately €571€1,221 of net actuarial losses. There are no plan assets that are expected to be returned to the Company in 2011.
2013.Summary of key assumptions:
| | | | | | | | | |
| | | December 31, | |
| | | 2010 | | | 2009 | |
| |
| Benefit obligations | | | | | | | | |
| Discount rate | | | 5.00 | % | | | 5.75 | % |
| Rate of compensation increase | | | 2.75 | % | | | 2.75 | % |
| Net benefit cost for year ended | | | | | | | | |
| Discount rate | | | 5.75 | % | | | 7.25 | % |
| Rate of compensation increase | | | 2.75 | % | | | 2.75 | % |
| Expected rate of return on plan assets | | | 7.00 | % | | | 7.00 | % |
| Assumed health care cost trend rate at | | | | | | | | |
| Initial health care cost trend rate | | | 10.00 | % | | | 11.00 | % |
| Annual rate of decline in trend rate | | | 1.00 | % | | | 1.00 | % |
| Ultimate health care cost trend rate | | | 4.50 | % | | | 4.50 | % |
| Medical services plan premiums trend rate | | | 6.00 | % | | | 6.00 | % |
| | | | | | | | |
| | | December 31, | |
| | | 2012 | | | 2011 | |
Benefit obligations | | | | | | | | |
Discount rate | | | 4.00 | % | | | 4.25 | % |
Rate of compensation increase | | | 2.75 | % | | | 2.75 | % |
Net benefit cost for year ended | | | | | | | | |
Discount rate | | | 4.25 | % | | | 5.00 | % |
Rate of compensation increase | | | 2.75 | % | | | 2.75 | % |
Expected rate of return on plan assets | | | 6.75 | % | | | 6.75 | % |
Assumed health care cost trend rate at | | | | | | | | |
Initial health care cost trend rate | | | 8.50 | % | | | 9.00 | % |
Annual rate of decline in trend rate | | | 0.50 | % | | | 0.50 | % |
Ultimate health care cost trend rate | | | 4.50 | % | | | 4.50 | % |
Medical services plan premiums trend rate | | | 6.00 | % | | | 6.00 | % |
The expected rate of return on plan assets is a management estimate based on, among other factors, historical long-term returns, expected asset mix and active management premium.
The discount rate assumption is adjusted annually to reflect the rates available on high-quality debt instruments, with a duration that is expected to match the timing of expected pension and other post-retirement benefit obligations. High-quality debt instruments are corporate bonds with a rating of “AA” or better.
A one-percentage point change in assumed health care cost trend rate would have the following effect on the post-retirement benefit obligations:
| | | | | | | | | | | | | | | | | |
| | | December 31, 2010 | | December 31, 2009 |
| | | 1% increase | | 1% decrease | | 1% increase | | 1% decrease |
| |
| Effect on total service and interest rate components | | € | 38 | | | € | (39 | ) | | € | 37 | | | € | (38 | ) |
| Effect on post-retirement benefit obligation | | € | 572 | | | € | (551 | ) | | € | 436 | | | € | (419 | ) |
| | | | | | | | | | | | | | | | |
| | | December 31, 2012 | | | December 31, 2011 | |
| | | 1%
Increase | | | 1%
Decrease | | | 1%
Increase | | | 1%
Decrease | |
Effect on total service and interest rate components | | € | 39 | | | € | (41 | ) | | € | 39 | | | € | (40 | ) |
Effect on post-retirement benefit obligation | | € | 744 | | | € | (716 | ) | | € | 621 | | | € | (600 | ) |
MERCER INTERNATIONAL INC.
NOTES TO THE CONSOLIDATED FINANCIAL STATEMENTS
(In thousands of Euros, except per share data)
Note 9. Pension and Other Post-Retirement Benefit Obligations (continued)
Asset allocation of funded plans:
| | | | | | | | | | | | | |
| | | Target | | | 2010 | | | 2009 | |
| |
| Equity securities | | | 60 | % | | | 63 | % | | | 63 | % |
| Debt securities | | | 35 | % | | | 34 | % | | | 35 | % |
| Cash and cash equivalents | | | 5 | % | | | 3 | % | | | 2 | % |
| | | | | | | | | | | | | |
| | | | | | | | 100 | % | | | 100 | % |
| | | | | | | | | | | | | |
| | | | | | | | | | | | |
| | | Target | | | 2012 | | | 2011 | |
Equity securities | | | 60 | % | | | 58 | % | | | 56 | % |
Debt securities | | | 40 | % | | | 42 | % | | | 44 | % |
Cash and cash equivalents | | | 0 | % | | | 0 | % | | | 0 | % |
| | | | | | | | | | | | |
| | | | | | | 100 | % | | | 100 | % |
| | | | | | | | | | | | |
Investment Objective:Objective
The investment objective for the Celgar Plans is to sufficiently diversify invested plan assets to maintain a reasonable level of risk without imprudently sacrificing the return on the invested funds, and ultimately to achieve a long-term total rate of return, net of fees and expenses, at least equal to the long-term interest rate assumptions used
92
MERCER INTERNATIONAL INC.
NOTES TO THE CONSOLIDATED FINANCIAL STATEMENTS
(In thousands of Euros, except per share data)
| |
Note 8. | Pension and Other Post-Retirement Benefit Obligations — (Continued) |
for funding actuarial valuations. To achieve this objective, the Company’s overall investment strategy is to maintain an investment allocation mix of long-term growth investments (equities) and fixed income investments (debt securities). Investment allocation targets have been established by asset class as summarized above. The asset allocation targets are set after considering the nature of the liabilities, long-term return expectations, the risks associated with key asset classes, inflation and interest rates and related management fees and expenses. In addition, the Celgar Plans’ investment strategy seeks to minimize risk beyond legislated requirements by constraining the investment managers’ investment options. There are a number of specific constraints based on investment type, but they all have the general purpose of ensuring that the investments are fully diversified and that risk is appropriately managed. For example, no more than 10% of the book value of the assets can be invested in any one entity or group, investments in any one entity cannot exceed 30% of the voting shares and all equity holdings must be listed on a public exchange. Reviews of the investment objectives, key assumptions and the independent investment managers are performed periodically.
Celgar Plans’ asset fair value measurements at December 31, 2010:
| | | | | | | | | | | | | | | | | |
| | | Quoted
| | | | | | | | | | |
| | | prices in
| | | | | | | | | | |
| | | active
| | | Significant
| | | | | | | |
| | | markets for
| | | other
| | | Significant
| | | | |
| | | identical
| | | observable
| | | unobservable
| | | | |
| | | assets | | | inputs | | | Inputs | | | Total | |
| |
Asset Category | | | | | | | | | | | | | | | | |
| Leith Wheeler Diversified Balanced Fund | | € | 11,971 | | | € | — | | | € | — | | | € | 11,971 | |
| Phillips, Hagar and North Balanced Pension Trust | | | 11,892 | | | | — | | | | — | | | | 11,892 | |
| | | | | | | | | | | | | | | | | |
| Total assets | | € | 23,863 | | | € | — | | | € | — | | | € | 23,863 | |
| | | | | | | | | | | | | | | | | |
2012: | | | | | | | | | | | | | | | | |
Asset category | | Quoted Prices in
Active Markets
for Identical
Assets | | | Significant
Other
Observable
Inputs | | | Significant
Unobservable
Inputs | | | Total | |
Leith Wheeler Diversified Funds | | € | 14,626 | | | € | — | | | € | — | | | € | 14,626 | |
Phillips, Hagar and North Bond Fund | | | 10,766 | | | | — | | | | — | | | | 10,766 | |
Cash | | | 126 | | | | — | | | | — | | | | 126 | |
| | | | | | | | | | | | | | | | |
Total assets | | € | 25,518 | | | € | — | | | € | — | | | € | 25,518 | |
| | | | | | | | | | | | | | | | |
Concentrations of Risk in the Celgar Plans’ Assets:Plans’ Assets
The Company has reviewed the Celgar Plans’ investments and determined that they are allocated based on the specific investment manager’s stated investment strategy with only slight over- or under-weightings within any specific category, and that those investments are within the constraints that have been set by the Company. Those constraints include a limitation on the value that can be invested in any one entity or group and the investment category targets noted above. In addition, we have two independent investment managers. The Company has concluded that there are no significant concentrations of risk.
MERCER INTERNATIONAL INC.
NOTES TO THE CONSOLIDATED FINANCIAL STATEMENTS
(In thousands of Euros, except per share data)
Note 9. Pension and Other Post-Retirement Benefit Obligations (continued)
Multiemployer Plan
The Company accountsparticipates in a multiemployer plan for income taxesthe hourly-paid employees at the Celgar mill. The contributions to the plan are determined based on an amount per hour worked pursuant to a collective bargaining agreement. The Company has no current or future contribution obligations in accordance with ASC 740,excess of the contractual contributions. Plan details are included in the following table:
| | | | | | | | | | | | | | | | |
| | | Provincially
Registered
Plan
Number | | Expiration
Date of
Collective
Bargaining
Agreement | | | | | | | | | | |
| | | | | | | | | | | Are the Company’s
Contributions Greater Than
5% of Total Contributions |
| | | | | | | | | | |
| | | | | Company
Contributions | | |
Legal name | | | | 2012 | | | 2011 | | | 2012 | | 2011 |
The Pulp and Paper Industry Pension Plan | | P085324 | | April 30,
2017 | | € | 2,056 | | | € | 1,760 | | | Yes | | Yes |
Note 10. Income Taxes(“ASC 740”).
The Company’s effective income tax (benefit) rate can be affected by many factors, including but not limited to, changes in the mix of earnings in tax jurisdictions with differing statutory rates, changes in corporate structure, changes in the valuation of deferred tax assets and liabilities, the result of audit examinations of previously filed tax returns and changes in tax laws. The asset and liability approach is used to recognize deferred tax assets and liabilities for the expected future tax consequences of temporary differences between the carrying amounts and the tax bases of assets and liabilities.
The Companyand/or one or more of its subsidiaries filesfile income tax returns in the United States, Germany and Canada. Currently, the Company does not anticipate that the expiration of the statue of limitations or the completion of audits in the next fiscal year will result in liabilities for uncertain income tax positions that are materially different than the amounts accrued or disclosed as of December 31, 2010.2012. However, this belief could change as tax years are examined by taxing authorities, the timing of those examinations, if any, are uncertain at this time. During 2010,2012, the German tax
93
MERCER INTERNATIONAL INC.
NOTES TO THE CONSOLIDATED FINANCIAL STATEMENTS
(In thousands of Euros, except per share data)
| |
Note 9. | Income Taxes — (Continued) |
authorities completed examinations of the 2005, 2006,2008, 2009, and 2007 tax years. As of December 31, 2010 the 2005, 2006, and 2007 tax years are being examined by Canadianfor all but one German entity. The examination for this German entity will be completed in 2013. We believe that we have adequately provided for any reasonable foreseeable outcomes related to our tax authorities.audits and that any settlement will not have a material adverse effect on our consolidated results. However, there can be no assurances as to the possible outcomes. The Company is generally not subject to U.S., German, or Canadian income tax examinations for tax years before 2007,2009, 2011 and 2008, and 2006, respectively.
As at December 31, 2010,2012, the Company had approximately €500€62,900 of total gross unrecognized tax benefits, substantially all of which would affect the Company’s effective tax rate if recognized. A reconciliation of the beginning and ending amount of total gross unrecognized tax benefits is as follows:
| | | | | | | | | |
| | | 2010 | | | 2009 | |
| |
| Balance at January 1 | | € | 700 | | | € | 800 | |
| Reductions — prior year tax positions | | | (500 | ) | | | — | |
| Lapse of statute of limitations | | | — | | | | (100 | ) |
| | | | | | | | | |
| Balance at December 31 | | € | 200 | | | € | 700 | |
| | | | | | | | | |
| | | | | | | | |
| | | 2012 | | | 2011 | |
Balance at January 1 | | € | 1,100 | | | € | 500 | |
Reduction prior year tax positions | | | (1,100 | ) | | | (500 | ) |
Addition of current year tax positions | | | 62,900 | | | | 1,100 | |
| | | | | | | | |
Balance at December 31 | | € | 62,900 | | | € | 1,100 | |
| | | | | | | | |
MERCER INTERNATIONAL INC.
NOTES TO THE CONSOLIDATED FINANCIAL STATEMENTS
(In thousands of Euros, except per share data)
Note 10. Income Taxes (continued)
The liability in the Consolidated Balance Sheet related to unrecognized tax benefits was €6,526 as at December 31, 2012 (2011 – €200). The Company recognizes interest and penalties related to unrecognized tax benefits in income tax expense.benefit (provision) in the Consolidated Statement of Operations. During the year ended December 31, 2010,2012, the Company recognized approximately €nil€104 in penalties and interest (2009-€nil). The Company had approximately €nil for the payment of interest and penalties (2011 – €nil), which was accrued at December 31, 2010.
Except for2012 (2011 – €nil).Subsequent to year end, the changes in uncertainCompany resolved an outstanding issue with the German tax positions as mentioned above,authorities. As a result, the Company will reduce its unrecognized tax benefit from €6,526 to €nil and will record a current tax expense of approximately €3,200. Additionally, the Company will increase its valuation allowance by approximately €3,100, thereby reducing the deferred tax asset and increasing the deferred tax expense by this amount.
The provision for current income taxes consists entirelyprimarily ofnon-U.S. taxes for the years ended December 31, 2012, 2011 and 2010, 2009 and 2008, respectively.
Differences between the U.S. Federal Statutory and the Company’s effective rates are as follows:
| | | | | | | | | | | | | |
| | | Year Ended December 31, | |
| | | 2010 | | | 2009 | | | 2008 | |
| |
| U.S. Federal statutory rate | | | 34 | % | | | 34 | % | | | 34 | % |
| U.S. Federal statutory rate on (income) loss from continuing operations before income tax and noncontrolling interest | | € | (30,206 | ) | | € | 26,526 | | | € | 28,241 | |
| Tax differential on foreign income (loss) | | | 8,754 | | | | (3,412 | ) | | | (2,966 | ) |
| Effect of foreign earnings | | | (6,721 | ) | | | — | | | | (17,800 | ) |
| Valuation allowance | | | 13,326 | | | | (20,806 | ) | | | (5,530 | ) |
| Change in undistributed earnings | | | 15,186 | | | | — | | | | — | |
| Other | | | 5,540 | | | | 3,561 | | | | (4,422 | ) |
| | | | | | | | | | | | | |
| | | € | 5,879 | | | € | 5,869 | | | € | (2,477 | ) |
| | | | | | | | | | | | | |
| Comprised of: | | | | | | | | | | | | |
| Current | | € | (3,881 | ) | | € | (134 | ) | | € | (501 | ) |
| Deferred | | | 9,760 | | | | 6,003 | | | | (1,976 | ) |
| | | | | | | | | | | | | |
| | | € | 5,879 | | | € | 5,869 | | | € | (2,477 | ) |
| | | | | | | | | | | | | |
94
| | | | | | | | | | | | |
| | | Year Ended December 31, | |
| | | 2012 | | | 2011 | | | 2010 | |
U.S. Federal statutory rate | | | 35 | % | | | 35 | % | | | 34 | % |
U.S. Federal statutory rate on (income) loss before income taxes and noncontrolling interest | | € | 1,119 | | | € | (18,659 | ) | | € | (30,206 | ) |
Tax differential on foreign income | | | 680 | | | | 5,670 | | | | 8,754 | |
Effect of foreign earnings | | | (6,518 | ) | | | (9,906 | ) | | | (6,721 | ) |
Valuation allowance | | | (11,972 | ) | | | 7,069 | | | | 13,326 | |
Tax benefit of partnership structure | | | 5,276 | | | | 5,234 | | | | 5,076 | |
Pension adjustment | | | 135 | | | | 1,864 | | | | 937 | |
Non-taxable foreign subsidiaries | | | 1,475 | | | | 4,024 | | | | — | |
Research and development expense | | | 2,672 | | | | — | | | | — | |
Change in undistributed earnings | | | — | | | | — | | | | 15,186 | |
Other | | | (160 | ) | | | 5,399 | | | | (473 | ) |
| | | | | | | | | | | | |
| | € | (7,293 | ) | | € | 695 | | | € | 5,879 | |
| | | | | | | | | | | | |
Comprised of: | | | | | | | | | | | | |
Current | | € | (7,411 | ) | | € | (1,682 | ) | | € | (3,881 | ) |
Deferred | | | 118 | | | | 2,377 | | | | 9,760 | |
| | | | | | | | | | | | |
| | € | (7,293 | ) | | € | 695 | | | € | 5,879 | |
| | | | | | | | | | | | |
MERCER INTERNATIONAL INC.
NOTES TO THE CONSOLIDATED FINANCIAL STATEMENTS
(In thousands of Euros, except per share data)
| |
Note 9. | Income Taxes — (Continued) |
Note 10. Income Taxes (continued)
Deferred income tax assets and liabilities are composed of the following:
| | | | | | | | | |
| | | December 31, | |
| | | 2010 | | | 2009 | |
| |
| German tax loss carryforwards | | € | 86,087 | | | € | 83,362 | |
| U.S. tax loss carryforwards | | | 28,310 | | | | 9,409 | |
| Canadian tax loss carryforwards | | | 34,516 | | | | 10,653 | |
| Basis difference between income tax and financial reporting with respect to operating pulp mills | | | (65,237 | ) | | | (15,960 | ) |
| Derivative financial instruments | | | 14,311 | | | | 14,844 | |
| Long-term debt | | | (477 | ) | | | (2,407 | ) |
| Payables and accrued expenses | | | (1,412 | ) | | | (1,454 | ) |
| Reserve for deferred pension liability | | | 5,102 | | | | 3,358 | |
| Capital leases | | | 1,734 | | | | 530 | |
| Other | | | 805 | | | | 620 | |
| | | | | | | | | |
| | | | 103,739 | | | | 102,955 | |
| Valuation allowance | | | (88,937 | ) | | | (99,529 | ) |
| | | | | | | | | |
| Net deferred tax (liability) asset | | € | 14,802 | | | € | 3,426 | |
| | | | | | | | | |
| Comprised of: | | | | | | | | |
| Deferred income tax asset | | € | 22,570 | | | € | 3,426 | |
| Deferred income tax liability | | | 7,768 | | | | — | |
| | | | | | | | | |
| | | € | 14,802 | | | € | 3,426 | |
| | | | | | | | | |
| | | | | | | | |
| | | December 31, | |
| | | 2012 | | | 2011 | |
German tax loss carryforwards | | € | 76,034 | | | € | 87,023 | |
U.S. tax loss carryforwards | | | 27,372 | | | | 27,914 | |
Canadian tax loss carryforwards | | | 31,090 | | | | 33,891 | |
Basis difference between income tax and financial reporting with respect to operating pulp mills | | | (53,994 | ) | | | (77,440 | ) |
Derivative financial instruments | | | 14,228 | | | | 14,709 | |
Long-term debt | | | 1,567 | | | | 1,367 | |
Payable and accrued expenses | | | (195 | ) | | | (89 | ) |
Deferred pension liability | | | 8,199 | | | | 7,381 | |
Capital leases | | | 2,136 | | | | 1,941 | |
Research and development expense pool | | | 2,672 | | | | — | |
Other | | | 1,004 | | | | 1,623 | |
| | | | | | | | |
| | | 110,113 | | | | 98,320 | |
Valuation allowance | | | (93,840 | ) | | | (81,868 | ) |
| | | | | | | | |
Net deferred tax asset | | € | 16,273 | | | € | 16,452 | |
| | | | | | | | |
Comprised of: | | | | | | | | |
Deferred income tax asset—current | | € | 4,465 | | | € | 6,750 | |
Deferred income tax asset—non-current | | | 17,565 | | | | 12,287 | |
Deferred income tax liability—non-current | | | (5,757 | ) | | | (2,585 | ) |
| | | | | | | | |
Net deferred tax asset | | € | 16,273 | | | € | 16,452 | |
| | | | | | | | |
The Company is subject to income tax audits on a continuing basis which may result in changes to the amounts in the above table.deferred tax assets and liabilities. Due to this and other uncertainties regarding future amounts of taxable income in Germany, Canada and the United States, the Company has provided a valuation allowance against a portion of its deferred tax assets, which primarily consist of tax losses carried forward for income tax purposes.forward. However, during the year, based on forecasted taxable income for the entities in each tax jurisdiction, income tax strategies, and its best estimates of the timing of temporary differences, the Company believes that it is more likely than not that certain tax assets will not be realized and accordingly the Company has reversedincreased certain valuation allowances totalling €10.6 million.by approximately €12,000. The Company’s tax asset recognition methodology consists of forecasting taxable income into the future along with related temporary differences. The Company then estimates which tax assets, based on a variety of factors, are more likely than not to be realized, and recognizes the tax assets accordingly. However, ASC 740 does not allow for tax assets to be recognized where the entity does not have a strong history of profitability. However, ASC 740 does not provide specific guidance with respect to what a strong history of profitability is. As a result, of this rule, the Company was not able to recognize certain tax assets as at December 31, 2010. Management expects that certain entities will meet theprofessional judgement is required when considering whether a company has a strong history of profitability testsor not. For example, the relative impact of negative and positive evidence of profitability where a company has cumulative losses in 2011,recent years. The weight given to negative and if so, additional tax assetspositive evidence is commensurate with the extent to which it can be objectively verified. Operating results during the most recent three-year period are expected to be recognized.
generally given more weight than expectations of future profitability, which are inherently uncertain.MERCER INTERNATIONAL INC.
NOTES TO THE CONSOLIDATED FINANCIAL STATEMENTS
(In thousands of Euros, except per share data)
Note 10. Income Taxes (continued)
The Company’s German tax loss carryforward amount includes corporate and trade tax losses totalling approximately €442,500€313,800 at December 31, 20102012 which have no expiration date. In addition, the Company has approximately €104,400 of German interest carryforwards which have no expiration date and can be used to reduce taxable income, with certain limitations. The Company’s U.S. loss carryforwards amount is approximately €83,200€78,200 at December 31, 2010,2012, of which approximately €2,600, €5,800€4,800 and €74,000,€73,400, if not used, will expire in the tax years ending 2011, 20122018 to 20192023 and 20202024 to 2030, respectively. The Company’s Canadian tax loss carryforward amount is approximately €138,100€124,400 at December 31, 20102012 of which approximately €10,000 will expire in 2016 and approximately €114,400 will begin to expire in the tax year ending 2026, if not used. The Company has Canadian investment tax credits for scientific research and experimental development of approximately €10,700 which begin to expire in the taxation year 2031. Management has concluded that it is more likely than not that thesea portion of the above noted losses will not be utilized, under current circumstances, and accordingly has reserved any resulting potential tax benefit that is not expected to be realized in the near future.
95
The Company’s policy is to indefinitely reinvest undistributed earnings of Mercer’s foreign subsidiaries. Accordingly, no provision for U.S. income taxes has been made for such undistributed earnings.Note 11. Share Capital
Common sharesThe Company has authorized 200,000,000 common shares (2011 – 200,000,000) with a par value of $1 per share.
As at December 31, 2012, the Company had 55,815,704 common shares (2011 – 55,779,204) issued and outstanding. During the year ended December 31, 2012, the Company issued 36,500 restricted shares to directors of the Company.
Share Repurchase Program
In August 2011, the Company’s Board of Directors authorized a share repurchase program (the “Program”) to repurchase up to $25.0 million worth of the Company’s outstanding common shares from time to time over a period ending August 2012. In July 2012, the Company’s Board of Directors re-authorized the Program to allow for the repurchase of up to approximately $14.4 million of the Company’s outstanding common shares over a period ending August 2013. During the year ended December 31, 2012, the Company did not repurchase any of its common shares. During the year ended December 31, 2011, the Company repurchased 1,263,401 of its common shares at an aggregate cost of $10.6 million. The Company recorded these as treasury shares.
The Company retired all outstanding treasury shares prior to December 31, 2011. The retired treasury shares had a carrying value of approximately €6,342. Upon the formal retirement of treasury shares, the Company reduced its share capital based on the estimated average cost of the common shares and reduced the treasury share account based on the repurchase price. The difference between the repurchase price and the original issue value was recorded as a reduction to retained earnings.
The Company may make additional repurchases of common shares under its Program, depending on prevailing market conditions, alternate uses of capital and other factors. Whether and when to initiate a purchase of common shares and the amount of common shares purchased is at the Company’s discretion. As at December 31, 2012, the Company had an authorized amount of $14.4 million remaining to repurchase its common shares.
MERCER INTERNATIONAL INC.
NOTES TO THE CONSOLIDATED FINANCIAL STATEMENTS
(In thousands of Euros, except per share data)
| |
Note 9.
| Income Taxes — (Continued) |
No provision for U.S. income taxes has been made for undistributed earnings of certain of the Company’s foreign subsidiaries which have been indefinitely reinvested. The Company is unable to estimate the amount of U.S. income taxes that would be payable if such undistributed foreign earnings were repatriated.
| |
Note 10. | Shareholders’ Equity |
Common shares
The Company has authorized 200,000,000 common shares (2009 — 200,000,000) with a par value of $1 per share. During the twelve months ended December 31, 2010, 6,500,171 shares were issued as a result of certain holders of the Company’s Subordinated Convertible Notes due January 2012 exercising their conversion option. See Note 7(e) — Debt. As at December 31, 2010, the Company had 42,999,658 (2009 — 36,443,487) common shares issued and outstanding.
11. Share Capital (continued)Preferred shares
The Company has authorized 50,000,000 preferred shares (2009 —(2011 – 50,000,000) with U.S. $1 par value issuable in series, of which 2,000,000 shares have been designated as Series A. The preferred shares may be issued in one or more series and with such designations and preferences for each series as shall be stated in the resolutions providing for the designation and issue of each such series adopted by the Board of Directors of the Company. The Board of Directors is authorized by the Company’s articles of incorporation to determine the voting, dividend, redemption and liquidation preferences pertaining to each such series. As at December 31, 2010,2012, no preferred shares had been issued by the Company.
| |
Note 11. | Stock-Based Compensation |
Note 12. Stock-Based Compensation
In June 2010, the Company adopted a new stock incentive plan (the “2010 Plan”) which provides for options, restricted stock rights, restricted stock,shares, performance shares, performance share units (“PSUs”) and stock appreciation rights to be awarded to employees, consultants and non-employee directors. The 2010 Plan replaced the Company’s 2004 stock incentive plan (the “2004 Plan”). However, the terms of the 2004 Plan will govern prior awards untilAs at December 31, 2012, after factoring in all awards granted under the 2004 Plan have been exercised, forfeited, cancelled, expired, or otherwise terminated in accordance with the terms thereof. The Company may grant up to a maximum of 2,000,000allocated shares, there remain approximately 1.1 million common shares under the 2010 plan, plus the number of common shares remaining available for grant pursuant to the 20042010 Plan.
Performance StockShares and PSUs
Grants ofPerformance shares are common shares granted to an employee which have restrictive conditions, such as the ability to sell the shares, until the Company and the grantee achieve certain performance stockobjectives. PSUs comprise rights to receive stockcommon shares at a future date that are contingent on the Company and the grantee achieving certain performance objectives. During the year ended December 31, 2010, potential stock based performance awards totaled 534,783 shares (2009 — 565,165; 2008 — 570,614). Expense recognized for the year was €2,255(2009 — €397; 2008 — €96).
The fair value of the performance stockshares and PSUs is recorded as compensation expense over the vesting period. The fair value is determined based upon the targeted number of shares awarded and the quoted price of the Company’s stockshares at the reporting date. Performance stock generally cliff vest three years fromThe target number of shares is determined using management’s best estimate. The final determination of the award date.
On February 11, 2010,number of shares to be granted or unrestricted will be made by the Company awarded a totalCompany’s Board of 13,000 performance stock to two employees. DuringDirectors. For the twelve month periodyear ended December 31, 2010, 43,382 performance stock were forfeited due2012, the Company recognized an expense of €1,207 related to the departure of two employees.
PSUs (2011 – €916; 2010 – €2,255).As ofat December 31, 2010, all of2012, there are no performance shares outstanding.
The following table summarizes PSU activity during the performance stock had vested (2009 — nil; 2008 — nil), however the decision determining the total number of performance awards to be granted to employees will be finalized by the
96
| | | | | | | | | | | | |
| | | Number of PSUs | |
| | | 2012 | | | 2011 | | | 2010 | |
Outstanding at January 1 | | | 795,312 | | | | 534,783 | | | | 565,165 | |
Granted | | | 55,478 | | | | 812,575 | | | | 13,000 | |
Vested and issued | | | — | | | | (474,728 | ) | | | — | |
Cancelled | | | — | | | | (60,055 | ) | | | — | |
Forfeited | | | (64,661 | ) | | | (17,263 | ) | | | (43,382 | ) |
| | | | | | | | | | | | |
Outstanding at December 31 | | | 786,129 | | | | 795,312 | | | | 534,783 | |
| | | | | | | | | | | | |
MERCER INTERNATIONAL INC.
NOTES TO THE CONSOLIDATED FINANCIAL STATEMENTS
(In thousands of Euros, except per share data)
| |
Note 12. Stock-Based Compensation (continued) Note 11.
| Stock-Based Compensation — (Continued) |
Company during the first quarter of 2011. As at such date, the Company will record any outstanding unrecognized compensation cost associated with the final determination of performance stock within stock compensation expense during the three month period ended March 31, 2011.
Restricted StockShares
The fair value of restricted stockshares is determined based upon the number of shares granted and the quoted price of the Company’s stockshares on the date of grant. Restricted stockshares generally vestsvest over one year. Expenseyear; however, 200,000 restricted shares granted during the year ended December 31, 2011 vest in equal amounts over a five-year period commencing in 2012. The fair value of the restricted shares is recognizedrecorded as compensation expense on a straight-line basis over the vesting period.
Expense recognized for the year ended December 31, 2012 was €832 (2011 – €998; 2010 was €139 (2009 — €58; 2008 — €168)– €139).
As at December 31, 2010,2012, the total remaining unrecognized compensation cost related to restricted stock amounted to approximately €93 (2009 — €7)€711 (2011 – €1,381), which will be amortized over theirthe remaining vesting period.
During the year ended December 31, 2010, 56,000periods.The following table summarizes restricted stock awards were granted to Directors of the Company (2009 — 21,000; 2008 — 21,000) and no restricted stock was cancelledshare activity during the year (2009 — nil; 2008 — nil).
As at December 31, 2010, the total number of restricted stock outstanding was 56,000 (2009 — 21,000; 2008 — 21,000), which had not vested.
year: | | | | | | | | | | | | |
| | | Number of Restricted Shares | |
| | | 2012 | | | 2011 | | | 2010 | |
Outstanding at January 1 | | | 238,000 | | | | 56,000 | | | | 21,000 | |
Granted | | | 36,500 | | | | 238,000 | | | | 56,000 | |
Vested | | | (78,000 | ) | | | (56,000 | ) | | | (21,000 | ) |
| | | | | | | | | | | | |
Outstanding at December 31 | | | 196,500 | | | | 238,000 | | | | 56,000 | |
| | | | | | | | | | | | |
Stock Options
Following is a summary ofThe following table summarizes the status of options outstanding at December 31, 2010:
| | | | | | | | | | | | | | | | | | | | | |
| Outstanding Options | | | | |
| | | | | Weighted
| | | | Exercisable Options |
Exercise
| | | | Average
| | Weighted
| | | | Weighted
|
Price
| | | | Remaining
| | Average
| | | | Average
|
| Range | | Number | | Contractual Life | | Exercise Price | | Number | | Exercise Price |
| (In U.S. Dollars) | | | | (Years) | | | | | | (In U.S. Dollars) |
| |
| $5.65 | | | 100,000 | | | | 2.70 | | | | $5.65 | | | | 100,000 | | | | $5.65 | |
| $7.25 | | | 30,000 | | | | 4.57 | | | | 7.25 | | | | 30,000 | | | | 7.25 | |
| $7.92 | | | 60,000 | | | | 3.58 | | | | 7.92 | | | | 60,000 | | | | 7.92 | |
2012: | | | | | | | | | | | | | | | | | | | | | | |
| Outstanding Options | | | Exercisable Options | |
Exercise Price | | | Number | | | Weighted
Average
Remaining
Contractual
Life (Years) | | | Weighted
Average
Exercise Price | | | Number | | | Weighted
Average
Exercise Price | |
| $ | 5.65 | | | | 100,000 | | | | 0.69 | | | $ | 5.65 | | | | 100,000 | | | $ | 5.65 | |
| $ | 7.30 | | | | 30,000 | | | | 2.57 | | | $ | 7.30 | | | | 30,000 | | | $ | 7.30 | |
| $ | 7.92 | | | | 45,000 | | | | 2.69 | | | $ | 7.92 | | | | 45,000 | | | $ | 7.92 | |
During the yearsyear ended December 31, 20102012 and 2009,2011, no options were granted, exercised or cancelled and 738,334 (2009 — nil; 2008 — nil)cancelled. During the year ended December 31, 2012, no options expired.expired (2011 – 15,000). The aggregate intrinsic value of options outstanding and currently exercisableis calculated as the difference between the quoted market price for the Company’s common stock as at December 31, 20102012, and the exercise price of the stock options for those options where the exercise price is $1.73 per option.
below the quoted market price. As at December 31, 2012, the Company had 100,000 options (2011 – 100,000) with an exercise price below the quoted market price resulting in an aggregate intrinsic value of €115 (2011 – €32). The Company issues new shares upon the exercise of stock options.Stock compensation expense recognized for the year ended December 31, 20102012 was €nil (2009 -(2011 – €nil; 2010 – €nil). As at December 31, 2010, all stock options had fully vested.
97
MERCER INTERNATIONAL INC.
NOTES TO THE CONSOLIDATED FINANCIAL STATEMENTS
(In thousands of Euros, except per share data)
Note 13. Accumulated Other Comprehensive Income
The components of accumulated other comprehensive income are as follows:
| | | | | | | | |
| | | Year Ended December 31, | |
| | | 2012 | | | 2011 | |
Foreign currency translation adjustments | | € | 41,031 | | | € | 36,567 | |
Unrecognized losses and prior service costs related to defined benefit plans | | | (15,969 | ) | | | (15,341 | ) |
Unrealized gains on marketable securities | | | 119 | | | | 120 | |
| | | | | | | | |
Accumulated other comprehensive income | | € | 25,181 | | | € | 21,346 | |
| | | | | | | | |
Note 14. Net Income (Loss) Per Share Attributable to Common Shareholders
| | | | | | | | | | | | |
| | | Year Ended December 31, | |
| | | 2012 | | | 2011 | | | 2010 | |
Net income (loss) attributable to common shareholders—basic | | € | (12,185 | ) | | € | 50,075 | | | € | 86,279 | |
Interest on convertible notes, net of tax | | | — | | | | 797 | | | | 2,439 | |
| | | | | | | | | | | | |
Net income (loss) attributable to common shareholders—diluted | | € | (12,185 | ) | | € | 50,872 | | | € | 88,718 | |
| | | | | | | | | | | | |
Net income (loss) per share attributable to common shareholders | | | | | | | | | | | | |
Basic | | € | (0.22 | ) | | € | 1.00 | | | € | 2.24 | |
| | | | | | | | | | | | |
Diluted | | € | (0.22 | ) | | € | 0.89 | | | € | 1.56 | |
| | | | | | | | | | | | |
Weighted average number of common shares outstanding: | | | | | | | | | | | | |
Basic(1) | | | 55,596,761 | | | | 50,116,982 | | | | 38,590,797 | |
Effect of dilutive shares: | | | | | | | | | | | | |
Performance shares and PSUs | | | — | | | | 544,853 | | | | 442,844 | |
Restricted shares | | | — | | | | 87,923 | | | | 26,683 | |
Stock options and awards | | | — | | | | 57,483 | | | | — | |
Convertible notes | | | — | | | | 6,178,778 | | | | 17,902,638 | |
| | | | | | | | | | | | |
Diluted | | | 55,596,761 | | | | 56,986,019 | | | | 56,962,962 | |
| | | | | | | | | | | | |
| |
Note 12. | Net Income (Loss) Per Share |
| | | | | | | | | | | | | |
| | | Year Ended December 31, | |
| | | 2010 | | | 2009 | | | 2008 | |
| |
| Net income (loss) attributable to common shareholders — basic | | € | 86,279 | | | € | (62,189 | ) | | € | (72,465 | ) |
| Interest on convertible notes, net of tax | | | 2,439 | | | | — | | | | — | |
| | | | | | | | | | | | | |
| Net income (loss) attributable to common shareholders — diluted | | € | 88,718 | | | € | (62,189 | ) | | € | (72,465 | ) |
| | | | | | | | | | | | | |
| Net income (loss) per share attributable to common shareholders | | | | | | | | | | | | |
| Basic | | € | 2.24 | | | € | (1.71 | ) | | € | (2.00 | ) |
| | | | | | | | | | | | | |
| Diluted | | € | 1.56 | | | € | (1.71 | ) | | € | (2.00 | ) |
| | | | | | | | | | | | | |
| Weighted average number of common shares outstanding: | | | | | | | | | | | | |
| Basic(1) | | | 38,590,797 | | | | 36,296,649 | | | | 36,285,027 | |
| Effect of dilutive shares: | | | | | | | | | | | | |
| Stock options and awards | | | 469,527 | | | | — | | | | — | |
| Convertible notes | | | 17,902,638 | | | | — | | | | — | |
| | | | | | | | | | | | | |
| Diluted | | | 56,962,962 | | | | 36,296,649 | | | | 36,285,027 | |
| | | | | | | | | | | | | |
| | |
| (1) | | The basic weighted average number of shares excludes performance and196,500 restricted stockshares which have been issued, but have not vested as at December 31, 2010.2012 (2011 – 238,000 restricted shares; 2010 – 56,000 restricted shares). |
MERCER INTERNATIONAL INC.
NOTES TO THE CONSOLIDATED FINANCIAL STATEMENTS
(In thousands of Euros, except per share data)
Note 14. Net Income (Loss) Per Share Attributable to Common Shareholders (continued)
The calculation of diluted net income (loss) per share attributable to common shareholders does not assume the exercise of stock options and awards or the conversion of convertible notesany instruments that would have an anti-dilutive effect on earnings per share.
Stock options and awards The following table summarizes the instruments excluded from the calculation of diluted income (loss) per share attributable to common shareholders because they are anti-dilutive represented 190,000 for the year ended December 31, 2010 (2009 — 928,334; 2008 — 928,334).
Restricted stock excluded from the calculation of diluted income (loss) per share attributable to common shareholders because they are anti-dilutive represented nil for the year ended December 31, 2010 (2009 — 21,000; 2008 — 21,000).
Shares associated with the convertible notes excluded from the calculation of diluted income (loss) per share attributable to common shareholders because they are anti-dilutive represented nil for the year ended December 31, 2010 (2009 — 9,141,910; 2008 — 8,678,065).
Performance stock excluded from the calculation of diluted net income (loss) per share attributable to common shareholders because they are anti-dilutive represented nil for the year ended December 31, 2010 (2009 — 369,924; 2008 — 372,642).
were anti-dilutive. | | | | | | | | | | | | |
| | | Year Ended December 31, | |
| | | 2012 | | | 2011 | | | 2010 | |
Stock options and awards | | | 175,000 | | | | — | | | | 190,000 | |
PSUs | | | 786,129 | | | | — | | | | — | |
Restricted shares | | | 196,500 | | | | — | | | | — | |
| |
Note 13. | Business Segment Information |
Note 15. Business Segment Information
The Company has three operating segments, the individual pulp mills that are aggregated into one reportable business segment, market pulp. Accordingly, the results presented are those of the one reportable business segment.
The pulp business is cyclical in nature and its market is affected by fluctuations in supply and demand in each cycle. These fluctuations have significant effect on the cost of materials and the eventual sales prices of products.
98
MERCER INTERNATIONAL INC.
NOTES TO THE CONSOLIDATED FINANCIAL STATEMENTS
(In thousands of Euros, except per share data)
| |
Note 13. | Business Segment Information — (Continued) |
The following table presents net sales from continuing operations to external customers by geographic area based on location of the customer.
| | | | | | | | | | | | | |
| | | 2010 | | | 2009 | | | 2008 | |
| |
| Germany | | € | 278,348 | | | € | 154,323 | | | € | 198,340 | |
| China | | | 196,022 | | | | 146,613 | | | | 131,412 | |
| Italy | | | 56,301 | | | | 44,616 | | | | 56,487 | |
| Other European Union countries(1) | | | 182,246 | | | | 107,276 | | | | 133,621 | |
| Other Asia | | | 37,561 | | | | 38,946 | | | | 65,192 | |
| North America | | | 92,628 | | | | 68,213 | | | | 78,718 | |
| Other countries | | | 1,503 | | | | 8,312 | | | | 17,146 | |
| | | | | | | | | | | | | |
| | | | 844,609 | | | | 568,299 | | | | 680,916 | |
| Energy revenues | | | 44,225 | | | | 42,501 | | | | 30,971 | |
| Third party transportation revenues | | | 11,702 | | | | 8,999 | | | | 8,404 | |
| | | | | | | | | | | | | |
| | | € | 900,536 | | | € | 619,799 | | | € | 720,291 | |
| | | | | | | | | | | | | |
| | | | | | | | | | | | |
| | | Year Ended December 31, | |
| | | 2012 | | | 2011 | | | 2010 | |
China | | € | 230,007 | | | € | 234,654 | | | € | 196,022 | |
Germany | | | 228,402 | | | | 256,563 | | | | 278,348 | |
Other European Union countries(1) | | | 168,616 | | | | 175,937 | | | | 182,246 | |
North America | | | 47,513 | | | | 69,345 | | | | 92,628 | |
Italy | | | 43,112 | | | | 51,509 | | | | 56,301 | |
Other Asia | | | 33,197 | | | | 30,872 | | | | 37,561 | |
Other countries | | | 1,632 | | | | 823 | | | | 1,503 | |
| | | | | | | | | | | | |
| | | 752,479 | | | | 819,703 | | | | 844,609 | |
Energy and chemical revenues | | | 72,289 | | | | 68,079 | | | | 49,288 | |
Third party transportation revenues | | | 9,375 | | | | 11,693 | | | | 11,702 | |
| | | | | | | | | | | | |
| | € | 834,143 | | | € | 899,475 | | | € | 905,599 | |
| | | | | | | | | | | | |
| | |
| (1) | | Not including Germany or Italy; includes new entrant countries to the European Union from their time of admission. |
The following table presents total long-lived assets from continuing operations by geographic area based on location of the asset.
| | | | | | | | | |
| | | 2010 | | | 2009 | |
| |
| Germany | | € | 656,090 | | | € | 689,545 | |
| Canada | | | 190,648 | | | | 178,941 | |
| Other | | | 1,507 | | | | 2,934 | |
| | | | | | | | | |
| | | € | 848,245 | | | € | 871,420 | |
| | | | | | | | | |
| | | | | | | | |
| | | December 31, | |
| | | 2012 | | | 2011 | |
Germany | | € | 636,735 | | | € | 638,500 | |
Canada | | | 172,143 | | | | 182,474 | |
| | | | | | | | |
| | € | 808,878 | | | € | 820,974 | |
| | | | | | | | |
MERCER INTERNATIONAL INC.
NOTES TO THE CONSOLIDATED FINANCIAL STATEMENTS
(In 2010,thousands of Euros, except per share data)
Note 15. Business Segment Information (continued)
In 2012, one customer accounted for 11% of the Company’s total pulp sales (2011—no single customer accounted for 10% or more; 2010—one customer—11%).
Note 16. Derivative Transactions
The Company is exposed to certain market risks relating to its ongoing business. The Company seeks to manage these risks through internal risk management policies as well as, from time to time, the use of derivatives. The Company currently manages its interest rate risk and a small portion of its pulp sales price risk with the use of derivative instruments. The derivatives are measured at fair value with changes in fair value immediately recognized in gain (loss) on derivative instruments in the Consolidated Statement of Operations.
Derivative assets are presented in prepaid expenses and other, and derivative liabilities are presented in unrealized interest rate derivative losses in the Consolidated Balance Sheet.
Interest Rate Derivatives
During 2004, the Company entered into certain variable-to-fixed interest rate swaps in connection with the Stendal mill with respect to an aggregate maximum amount of approximately €612,600 of the principal amount of the indebtedness under the Stendal Loan Facility. Under the remaining interest rate swap, the Company pays a fixed rate and receives a floating rate with the interest payments being calculated on a notional amount. Currently, the contract has an aggregate notional amount of €357,576 at a fixed interest rate of 5.28% and it matures in October 2017 (which for the most part matches the maturity of the Stendal Loan Facility).
The interest rate derivative contract is with a bank that is part of a banking syndicate that holds the Stendal Loan Facility and the Company does not anticipate non-performance by the bank.
Pulp Price Derivative
During May 2012, the Company entered into a fixed price pulp swap contract with a bank. Under the terms of the contract, 5,000 metric tonnes (“MT”) of pulp per month was fixed at a price of $915 per MT. The contract expired in December 2012. In November 2012, the Company entered into two additional contracts. Under the terms of the contracts, 3,000 MT of pulp per month is fixed at prices which range from $880 to $890 per MT. The contracts expire in December 2013.
Energy Derivatives
The Company is also subject to price risk for electricity used in its manufacturing operations. The Company enters into electricity forward sales contracts when it sees an opportunity to sell forward electricity at opportunistic rates. No electricity forward sales contracts were entered into in 2012, 2011 or 2010. Although the Company does not currently have plans to enter into such transactions, the Company may enter into similar electricity derivative contracts in the future.
Foreign Exchange Derivatives
The Company did not enter into foreign exchange derivatives in 2012, 2011 and 2010.
MERCER INTERNATIONAL INC.
NOTES TO THE CONSOLIDATED FINANCIAL STATEMENTS
(In thousands of Euros, except per share data)
Note 16. Derivative Transactions (continued)
Credit Risk
The Company’s credit risk is primarily attributable to cash held in bank accounts and receivables. The Company maintains cash balances in foreign financial institutions in excess of insured limits. The Company limits its credit exposure on cash held in bank accounts by periodically investing cash in excess of short-term operating requirements and debt obligations in low risk government bonds, or similar debt instruments. The Company’s credit risk associated with the sale of pulp products is managed through establishing long-term contractual relationships with its customers, setting credit limits, the purchase of credit insurance and for certain customers a letter of credit is received prior to shipping its product. Concentrations of credit risk on the sale of pulp products are with customers and agents based in Germany, China, Italy and the United States.
The carrying amount of cash and cash equivalents of €104,239 and receivables of €110,087 recorded in the Consolidated Balance Sheet, net of any allowances for losses, represents the Company’s largest customer amountedmaximum exposure to approximately 15% (2009 — 10%; 2008 — 9%)credit risk.
The following table shows our gains and losses by type of total pulp sales.
| | | | | | | | | | | | |
| | | Year Ended December 31, | |
| | | 2012 | | | 2011 | | | 2010 | |
Interest rate derivative contract | | € | 1,713 | | | € | (1,418 | ) | | € | 1,899 | |
Pulp price derivative contracts | | | 2,028 | | | | — | | | | — | |
| | | | | | | | | | | | |
| | € | 3,741 | | | € | (1,418 | ) | | € | 1,899 | |
| | | | | | | | | | | | |
| |
Note 14. | Financial Instruments |
Note 17. Financial Instruments
The fair value of financial instruments as at December 31 is summarized as follows:
| | | | | | | | | | | | | | | | | |
| | | 2010 | | 2009 |
| | | Carrying
| | | | Carrying
| | |
| | | Amount | | Fair Value | | Amount | | Fair Value |
| |
| Cash and cash equivalents | | € | 99,022 | | | € | 99,022 | | | € | 51,291 | | | € | 51,291 | |
| Investments | | | 275 | | | | 275 | | | | 230 | | | | 230 | |
| Receivables | | | 121,709 | | | | 121,709 | | | | 71,143 | | | | 71,143 | |
| Notes receivable | | | 2,978 | | | | 2,978 | | | | 3,819 | | | | 3,819 | |
| Accounts payable and accrued expenses | | | 84,873 | | | | 84,873 | | | | 85,185 | | | | 85,185 | |
| Debt | | | 821,924 | | | | 847,875 | | | | 829,174 | | | | 769,207 | |
| Interest rate derivative contracts — liability | | | 50,973 | | | | 50,973 | | | | 52,873 | | | | 52,873 | |
99
| | | | | | | | | | | | | | | | |
| | | 2012 | | | 2011 | |
| | | Carrying
Amount | | | Fair Value | | | Carrying
Amount | | | Fair Value | |
Cash and cash equivalents | | € | 104,239 | | | € | 104,239 | | | € | 105,072 | | | € | 105,072 | |
Marketable securities(1) | | | 184 | | | | 184 | | | | 12,372 | | | | 12,372 | |
Receivables | | | 110,087 | | | | 110,087 | | | | 120,487 | | | | 120,487 | |
Pulp price derivative contracts—asset | | | 745 | | | | 745 | | | | — | | | | — | |
Accounts payable and other | | | 89,950 | | | | 89,950 | | | | 99,640 | | | | 99,640 | |
Debt | | | 711,403 | | | | 700,001 | | | | 734,086 | | | | 717,522 | |
Interest rate derivative contract—liability | | | 50,678 | | | | 50,678 | | | | 52,391 | | | | 52,391 | |
MERCER INTERNATIONAL INC.
NOTES TO THE CONSOLIDATED FINANCIAL STATEMENTS
(In thousands of Euros, except per share data)
| (1) | |
Note 14. | Financial Instruments — (Continued)Includes equity securities of €184 (2011 – €156) recorded in the Consolidated Balance Sheet within deferred note issuance and other. |
Cash and Debt Instruments
Many of the Company’s transactions are denominated in foreign currencies, primarily the U.S. dollar. As a result of these transactions the Company and its subsidiaries has financial risk that the value of the Company’s financial instruments will vary due to fluctuations in foreign exchange rates.
The carrying value of cash and cash equivalents and accounts payable and accrued expensesother approximates the fair value due to the immediate or short-term maturity of these financial instruments. The carrying value of receivables approximates the fair value due to their short-term nature and historical collectability. The fair value of notes receivable was estimated using discounted cash flows at prevailing market rates. The fair value of debt reflects recent market transactions and discounted cash flow estimate.estimates. Marketable securities are recorded at fair value based on quoted prices in active markets. See the Fair Value Measurement and DisclosuresDisclosure section below for details on how the fair value of the pulp price derivative contracts and interest rate derivative contractscontract was determined.
The Company uses interest rate derivatives to fix the rate of interest on indebtedness under the Stendal Loan Facilities and sometimes uses foreign exchange derivatives to convert some costs (including currency swaps relating to long-term indebtedness) from Euros to U.S. dollars. As at December 31, 2010, there were only interest rate derivative instruments in place and there were no foreign exchange derivatives outstanding. The interest rate derivative contracts are with a large European bank that is the largest holder of the Stendal Loan Facility and the Company does not anticipate non-performance.
| | | | | | | | | | | | | |
| | | 2010 | | 2009 | | 2008 |
| |
| Unrealized net gain (loss) on derivative financial instruments | | € | 1,899 | | | € | (5,760 | ) | | € | (25,228 | ) |
| | | | | | | | | | | | | |
Energy Derivatives
The Company is also subject to price risk for electricity used in its manufacturing operations. During 2008, the Company entered into fixed electricity forward sales contracts in connection with the Stendal and Rosenthal mills electricity generation. The Company realized no gains for the years ended 2010, 2009, and 2008. The Company entered into the electricity forward sales contracts because it saw an opportunity to sell forward at opportunistic rates. No electricity forward sales were entered into in 2010. Although the Company does not currently have plans to enter into similar transactions, should similar situations present themselves, the Company may enter into similar electricity derivative contracts. As at December 31, 2010, the Company had no outstanding electricity derivative contracts. Gains from energy derivatives are included within “Operating costs” in the Consolidated Statement of Operations.
Interest Rate Derivatives
During 2004, the Company entered into certainvariable-to-fixed interest rate swaps in connection with the Stendal mill with respect to an aggregate maximum amount of approximately €612,619 of the principal amount of the indebtedness under the Stendal Loan Facility. Currently, the aggregate notional amount of these contracts is €447,763 at a fixed interest rate of 5.28% and they mature October 2017 (which for the most part matches the maturity of the Stendal Loan Facility). The Company recognized an unrealized gain of €1,899, with respect to these interest rate swaps for the year ended December 31, 2010 (2009 — an unrealized loss of €5,760; 2008 — an unrealized loss of €25,228).
Foreign Exchange Derivatives
The Company did not enter into foreign exchange derivatives in 2010, 2009 and 2008.
100
MERCER INTERNATIONAL INC.
NOTES TO THE CONSOLIDATED FINANCIAL STATEMENTS
(In thousands of Euros, except per share data)
| |
Note 14. | Financial Instruments — (Continued) |
Credit RiskNote 17. Financial Instruments (continued)
ConcentrationsMany of creditthe Company’s transactions are denominated in foreign currencies, primarily the U.S. dollar. As a result of these transactions the Company and its subsidiaries have financial risk onthat the salevalue of pulp products are with customers and agents basedthe Company’s financial instruments will vary due to fluctuations in Germany, China, Italy and the United States.
foreign exchange rates.Fair Value Measurement and DisclosuresDisclosure
The Company adopted the guidance outlined in ASC 820, originally released as FAS 157,Fair Value Measurement, effective January 1, 2008. The adoption of this guidance resulted in no impact on the Company’s Consolidated Balance Sheet or the Consolidated Statement of Operations.
The fair value methodologies and, as a result, the fair value of the Company’s investments and derivative instruments are determined based on the fair value hierarchy provided in ASC 820. The fair value hierarchy per ASC 820 isthe Fair Value Measurements and Disclosures topic of the FASB Accounting Standards Codification, and are as follows:
Level 1 — 1—Valuations based on quoted prices in active markets foridenticalassets and liabilities.
Level 2 — 2—Valuations based on observable inputs in active markets forsimilarassets and liabilities, other than Level 1 prices, such as quoted commodity prices or interest or currency exchange rates.
Level 3 — 3—Valuations based on significant unobservable inputs that are supported by little or no market activity, such as discounted cash flow methodologies based on internal cash flow forecasts.
The Company classified its investmentsmarketable securities within Level 1 of the valuation hierarchy wherebecause quoted prices are available in an active market. Level 1market for both exchange-traded equities and the German federal government bonds. The Company classified the German federal government bonds as available-for-sale as it was not certain these investments include exchange-traded equities.
would be held to maturity, nor did the Company intend to actively trade these investments.The Company’s interest rate and pulp price derivatives are classified within Level 2 of the valuation hierarchy, as they are traded on theover-the-counter market and are valued using internal models that use as their basis readily observable market inputs, such as forward interest rates.
rates, yield curves observable at specified intervals and commodity price curves. The valuation techniques used by the Company are based upon observable inputs. Observable inputs reflect market data obtained from independent sources. In addition, the Company considered the risk of non-performance of the obligor, which in some cases reflects the Company’s own credit risk, in determining the fair value of the derivative instruments.risk. The counterparty to our interest rate swap derivative is aand pulp price derivatives are multi-national financial institution.
institutions.The following table presents a summary of the Company’s outstanding financial instruments and their estimated fair values under the hierarchy defined in ASC 820:
| | | | | | | | | | | | | | | | | |
| | | Fair value measurements at December 31, 2010 using: | |
| | | Quoted prices
| | | Significant
| | | | | | | |
| | | in active
| | | other
| | | Significant
| | | | |
| | | markets for
| | | observable
| | | unobservable
| | | | |
| | | identical assets
| | | inputs
| | | inputs
| | | | |
Description | | (Level 1) | | | (Level 2) | | | (Level 3) | | | Total | |
| |
Assets | | | | | | | | | | | | | | | | |
| Investments(a) | | € | 275 | | | € | — | | | € | — | | | € | 275 | |
| | | | | | | | | | | | | | | | | |
Liabilities | | | | | | | | | | | | | | | | |
| Derivatives(b) | | | | | | | | | | | | | | | | |
| — Interest rate swaps | | € | — | | | € | 50,973 | | | € | — | | | € | 50,973 | |
| | | | | | | | | | | | | | | | | |
| | |
(a) | | Based on observable market data. |
(b) | | Based on observable inputs for the liability (interest rates and yield curves observable at specific intervals). |
101
| | | | | | | | | | | | | | | | |
| | | Fair value measurements at December 31, 2012 using: | |
| Description | | Level 1 | | | Level 2 | | | Level 3 | | | Total | |
Assets | | | | | | | | | | | | | | | | |
Marketable securities | | | | | | | | | | | | | | | | |
Exchange traded equities | | € | 184 | | | € | — | | | € | — | | | € | 184 | |
Pulp price derivative contracts | | | — | | | | 745 | | | | — | | | | 745 | |
| | | | | | | | | | | | | | | | |
| | € | 184 | | | € | 745 | | | € | — | | | € | 929 | |
| | | | | | | | | | | | | | | | |
Liabilities | | | | | | | | | | | | | | | | |
Interest rate derivative contract | | € | — | | | € | 50,678 | | | € | — | | | € | 50,678 | |
| | | | | | | | | | | | | | | | |
MERCER INTERNATIONAL INC.
NOTES TO THE CONSOLIDATED FINANCIAL STATEMENTS
(In thousands of Euros, except per share data)
Note 17. Financial Instruments (continued)
| | | | | | | | | | | | | | | | |
| | | Fair value measurements at December 31, 2011 using: | |
| Description | | Level 1 | | | Level 2 �� | | | Level 3 | | | Total | |
Assets | | | | | | | | | | | | | | | | |
Marketable securities | | | | | | | | | | | | | | | | |
German federal government bonds | | € | 12,216 | | | € | — | | | € | — | | | € | 12,216 | |
Exchange traded equities | | | 156 | | | | — | | | | — | | | | 156 | |
| | | | | | | | | | | | | | | | |
| | € | 12,372 | | | € | — | | | € | — | | | € | 12,372 | |
| | | | | | | | | | | | | | | | |
Liabilities | | | | | | | | | | | | | | | | |
Interest rate derivative contract | | € | — | | | € | 52,391 | | | € | — | | | € | 52,391 | |
| | | | | | | | | | | | | | | | |
| |
Note 15. | Lease Commitments |
Note 18. Lease Commitments
Minimum lease payments, primarily for various vehicles, and plant and equipment under capital and non-cancellable operating leases and the present value of net minimum payments at December 31, 2010 were2012 is as follows:
| | | | | | | | | |
| | | Capital
| | | Operating
| |
| | | Leases | | | Leases | |
| |
| 2011 | | € | 3,400 | | | € | 3,287 | |
| | | | | | | | | |
| 2012 | | | 2,114 | | | | 2,740 | |
| 2013 | | | 799 | | | | 1,551 | |
| 2014 | | | 612 | | | | 1,404 | |
| 2015 | | | 667 | | | | 1,387 | |
| Thereafter | | | 1,556 | | | | 3,287 | |
| | | | | | | | | |
| Total | | € | 9,148 | | | € | 13,656 | |
| | | | | | | | | |
| Less imputed interest | | | 1,166 | | | | | |
| | | | | | | | | |
| Total present value of minimum capitalized payments | | | 7,982 | | | | | |
| Less current portion of capital lease obligations | | | 3,240 | | | | | |
| | | | | | | | | |
| Long-term capital lease obligations | | € | 4,742 | | | | | |
| | | | | | | | | |
| | | | | | | | |
| | | Capital
Leases | | | Operating
Leases | |
2013 | | € | 1,998 | | | € | 2,973 | |
2014 | | | 1,367 | | | | 1,612 | |
2015 | | | 1,440 | | | | 1,468 | |
2016 | | | 1,202 | | | | 915 | |
2017 | | | 846 | | | | 888 | |
Thereafter | | | 2,900 | | | | 1,553 | |
| | | | | | | | |
Total | | | 9,753 | | | € | 9,409 | |
| | | | | | | | |
Less: imputed interest | | | 1,510 | | | | | |
| | | | | | | | |
Total present value of minimum capitalized payments | | | 8,243 | | | | | |
Less: current portion of capital lease obligations | | | 1,958 | | | | | |
| | | | | | | | |
Long-term capital lease obligations | | € | 6,285 | | | | | |
| | | | | | | | |
Rent expense under operating leases was €2,246€3,006 for 2010 (2009 — €1,218; 2008 — €1,011)the year ended December 31, 2012 (2011—€3,313; 2010—€2,246). The current portion of the capital lease obligations is included in accounts payable and accrued expensesother and the long-term portion is included in capital leases and other in the Consolidated Balance Sheets.
Note 19. Commitments and Contingencies
| (a) | |
Note 16. | CommitmentsAt December 31, 2012, the Company has liabilities for environmental conservation expenditures which include asset retirement obligations of €4,251 (2011—€4,170) and Contingencieswastewater fees of €6,648 (2011—€4,438). Management believes the accrued amounts recorded are sufficient. |
At December 31, 2010, the Company recorded a liability for environmental conservation expenditures of approximately €2,085. Management believes the liability amount recorded is sufficient.
The Company is required to pay certain fees based on water consumption levels at its German mills. Unpaid fees can be reduced by the mills’ demonstration of reduced environmental emissions. To the extent that the Company has not agreed with regulatory authorities for fee reductions, a liability for these water charges has been recognized.
The Company maintains industrial landfills on its premises for the disposal of waste, primarily from the mill’s pulp processing activities. The mills have obligations under their landfill permits to decommission these disposal facilities pursuant to the requirements of its local regulations.
The Company had also entered into certain other capital commitments at the Rosenthal mill, none of which is individually material.
The Company is involved in a property transfer tax dispute with respect to the Celgar mill and certain other legal actions and claims arising in the ordinary course of business. While the outcome of these legal actions and claims cannot be predicted with certainty, it is the opinion of management that the outcome of any such claim which is pending or threatened, either individually or on a combined basis, will not have a material adverse effect on the consolidated financial condition, results of operations or liquidity of the Company.
The Company entered into certain minimum or fixed purchase commitments primarily related to the purchase of raw materials, none of which are individually material, that extend beyond 2011. Commitments under these contracts are approximately €1,000 in 2011.
102
| (b) | Pursuant to an arbitration proceeding with the general construction contractor (the noncontrolling shareholder) of the Stendal mill regarding certain warranty claims, the Company acted upon a bank guarantee for defect liability on civil works that was about to expire as provided in the engineering, procurement, and construction contract. On January 28, 2011, the Company received approximately €10,000 |
MERCER INTERNATIONAL INC.
NOTES TO THE CONSOLIDATED FINANCIAL STATEMENTS
(In thousands of Euros, except per share data)
Note 19. Commitments and Contingencies (continued)
| |
Note 17. | Noncontrolling Interest(the “Guarantee Amount”), which is intended to compensate the Company for remediation work that is required at the Stendal mill, but it is less than the amount claimed by the Company under the arbitration. Consequently, the arbitration proceeding is ongoing, and there is no certainty that the Company will be successful with its claims. |
On March 13, 2009, the Company made aThe €10,000 capital contribution to the Stendal mill, of which €2,582 related towas initially recognized as an increase in the Stendal mill’s stated capital, diluting the interest held bycash and a corresponding increase in accounts payable and other. As civil works remediation steps are agreed to with the noncontrolling shareholder and resulting in a 4.32% increase in the Company’s equity ownership in the Stendal mill from 70.58%an agreed to 74.90%. Pursuant toASC 810-10-65, the increase in equity ownership was accounted for as an equity transaction. The carrying amountportion of the Company’s shareholders’ equity was adjustedpayable is reversed with the offset recorded in operating costs to reflectoffset the 4.32% increase of ownership interest in the Stendal mill. As a result,remediation expenditures. In January 2012, the noncontrolling deficit andshareholder contributed its required €1,632 from the Company’s Additional Paid-in Capital were reduced by €6,809.
DuringGuarantee Amount as part of the first quarterfinancing agreement for Project Blue Mill. This contribution was reclassified to long-term debt as part of 2010, the noncontrolling interest holder agreed to convert certain interest claims totaling €6,275 borne from shareholder loans into a capital contribution. As a result of this conversion, the Company reduced the amount owingloan payable to the noncontrolling shareholder and decreased the noncontrolling shareholder’s share of losses.
| |
Note 18. | Subsequent Events |
In January and February 2011, approximately $1.9 million and $3.2 million of Subordinated Convertible Notes due Januaryshareholder. See Note 8(e)—Debt. As at December 31, 2012, were converted into 565,757 and 959,391 shares, respectively.
The Company has previously commenced an arbitration proceeding with the general construction contractor of the Stendal mill for civil claims. On January 28, 2011, the Company acted upon a performance guaranteehad Guarantee Amount proceeds of €1,768 remaining in accounts payable and received a pre-payment of approximately €10.0 million, which the Company treated as a contingent gain and accordingly was not accounted for as a reduction to property, plant and equipment prior to receipt. The ultimate settlement will be determined in an arbitration proceeding that remains ongoing.
On February 15, 2011, the Company redeemed for cash all of its outstanding 9.25% Senior Notes due 2013. As of February 15, 2011, the principal outstanding amount of the 2013 Notes was $20.5 million. The Notes were redeemed for a price equal to 100% of the principal amount thereof, plus accrued and unpaid interest to, but not including, February 15, 2011. In total, the Company paid approximately €15.9 million in connection with the redemption of the Notes.
103
| (c) | The Company is involved in a property transfer tax dispute with respect to the Celgar mill and certain other legal actions and claims arising in the ordinary course of business. Celgar had previously paid the property transfer tax assessment, and the court date is scheduled during the first quarter of 2013 to appeal the assessment. While the outcome of these legal actions and claims cannot be predicted with certainty, it is the opinion of management that the outcome of any such claim which is pending or threatened, either individually or on a combined basis, will not have a material adverse effect on the consolidated financial condition, results of operations or liquidity of the Company. |
| (d) | The Company is subject to regulations that require the handling and disposal of asbestos in a prescribed manner if a property undergoes a major renovation or demolition. Otherwise, the Company is not required to remove asbestos from its facilities. Generally asbestos is found on steam and condensate piping systems as well as certain cladding on buildings and in building insulation throughout older facilities. The Company’s obligation for the proper removal and disposal of asbestos products from the Company’s mills is a conditional asset retirement obligation. As a result of the longevity of the Company’s mills, due in part to the maintenance procedures and the fact that the Company does not have plans for major changes that require the removal of asbestos, the timing of the asbestos removal is indeterminate. As a result, the Company is currently unable to reasonably estimate the fair value of its asbestos removal and disposal obligation. The Company will recognize a liability in the period in which sufficient information is available to reasonably estimate its fair value. |
| (e) | As at December 31, 2012, the Company had entered into capital commitments of approximately €14,000 at the Stendal mill as part of Project Blue Mill. |
| (f) | The Company entered into certain minimum or fixed purchase commitments primarily related to the purchase of raw materials, none of which are individually material, that extend beyond 2013. Commitments under these contracts are approximately €808 in 2014, approximately €676 in 2015, approximately €568 in 2016, and approximately €615 in 2017 and beyond. |
MERCER INTERNATIONAL INC.
NOTES TO THE CONSOLIDATED FINANCIAL STATEMENTS
(In thousands of Euros, except per share data)
| |
Note 19. | Restricted Group Supplemental Disclosure |
Note 20. Restricted Group Supplemental Disclosure
The terms of the indenturesindenture governing our 9.25% senior unsecured notes and our 9.5% senior secured notesSenior Notes require that we provide the results of operations and financial condition of Mercer International Inc. and our restricted subsidiaries under the indenture, collectively referred to as the “Restricted Group”. As at and during the years ended December 31, 20102012 and 2009,2011, the Restricted Group was comprised of Mercer International Inc., certain holding subsidiaries and our Rosenthal and Celgar mills. The Restricted Group excludes the Stendal mill.
Combined Condensed Balance Sheets
| | | | | | | | | | | | | | | | | |
| | | December 31, 2010 | |
| | | Restricted
| | | Unrestricted
| | | | | | Consolidated
| |
| | | Group | | | Subsidiaries | | | Eliminations | | | Group | |
| |
ASSETS |
| Current | | | | | | | | | | | | | | | | |
| Cash and cash equivalents | | € | 50,654 | | | € | 48,368 | | | € | — | | | € | 99,022 | |
| Receivables | | | 70,865 | | | | 50,844 | | | | — | | | | 121,709 | |
| Inventories | | | 60,910 | | | | 41,309 | | | | — | | | | 102,219 | |
| Prepaid expenses and other | | | 6,840 | | | | 4,520 | | | | — | | | | 11,360 | |
| Deferred income tax | | | 22,570 | | | | — | | | | — | | | | 22,570 | |
| | | | | | | | | | | | | | | | | |
| Total current assets | | | 211,839 | | | | 145,041 | | | | — | | | | 356,880 | |
| Long-term assets | | | | | | | | | | | | | | | | |
| Property, plant and equipment | | | 362,274 | | | | 484,493 | | | | — | | | | 846,767 | |
| Deferred note issuance and other | | | 6,903 | | | | 4,179 | | | | — | | | | 11,082 | |
| Deferred income tax | | | — | | | | — | | | | — | | | | — | |
| Due from unrestricted group | | | 80,582 | | | | — | | | | (80,582 | ) | | | — | |
| Note receivable | | | 1,346 | | | | — | | | | — | | | | 1,346 | |
| | | | | | | | | | | | | | | | | |
| Total assets | | € | 662,944 | | | € | 633,713 | | | € | (80,582 | ) | | € | 1,216,075 | |
| | | | | | | | | | | | | | | | | |
| |
| LIABILITIES |
| Current liabilities | | | | | | | | | | | | | | | | |
| Accounts payable and accrued expenses | | € | 44,015 | | | € | 40,858 | | | € | — | | | € | 84,873 | |
| Pension and other post-retirement benefit obligations | | | 728 | | | | — | | | | — | | | | 728 | |
| Debt | | | 16,429 | | | | 23,167 | | | | — | | | | 39,596 | |
| | | | | | | | | | | | | | | | | |
| Total current liabilities | | | 61,172 | | | | 64,025 | | | | — | | | | 125,197 | |
| Long-term liabilities | | | | | | | | | | | | | | | | |
| Debt | | | 273,473 | | | | 508,855 | | | | — | | | | 782,328 | |
| Due to restricted group | | | — | | | | 80,582 | | | | (80,582 | ) | | | — | |
| Unrealized interest rate derivative losses | | | — | | | | 50,973 | | | | — | | | | 50,973 | |
| Pension and other post-retirement benefit obligations | | | 24,236 | | | | — | | | | — | | | | 24,236 | |
| Capital leases and other | | | 7,154 | | | | 4,856 | | | | — | | | | 12,010 | |
| Deferred income tax | | | 7,768 | | | | — | | | | — | | | | 7,768 | |
| | | | | | | | | | | | | | | | | |
| Total liabilities | | | 373,803 | | | | 709,291 | | | | (80,582 | ) | | | 1,002,512 | |
| | | | | | | | | | | | | | | | | |
EQUITY | | | | | | | | | | | | | | | | |
| Total shareholders’ equity (deficit) | | | 289,141 | | | | (53,073 | ) | | | — | | | | 236,068 | |
| Noncontrolling interest (deficit) | | | — | | | | (22,505 | ) | | | — | | | | (22,505 | ) |
| | | | | | | | | | | | | | | | | |
| Total liabilities and equity | | € | 662,944 | | | € | 633,713 | | | € | (80,582 | ) | | € | 1,216,075 | |
| | | | | | | | | | | | | | | | | |
104
| | | | | | | | | | | | | | | | |
| | | December 31, 2012 | |
| | | Restricted
Group | | | Unrestricted
Subsidiaries | | | Eliminations | | | Consolidated
Group | |
ASSETS | | | | | | | | | | | | | | | | |
Current assets | | | | | | | | | | | | | | | | |
Cash and cash equivalents | | € | 36,714 | | | € | 67,525 | | | € | — | | | € | 104,239 | |
Receivables | | | 61,212 | | | | 48,875 | | | | — | | | | 110,087 | |
Inventories | | | 74,786 | | | | 43,514 | | | | — | | | | 118,300 | |
Prepaid expenses and other | | | 5,811 | | | | 2,096 | | | | — | | | | 7,907 | |
Deferred income tax | | | 2,188 | | | | 2,277 | | | | — | | | | 4,465 | |
| | | | | | | | | | | | | | | | |
Total current assets | | | 180,711 | | | | 164,287 | | | | — | | | | 344,998 | |
Long-term assets | | | | | | | | | | | | | | | | |
Property, plant and equipment | | | 345,311 | | | | 463,567 | | | | — | | | | 808,878 | |
Deferred note issuance and other | | | 6,607 | | | | 5,555 | | | | — | | | | 12,162 | |
Deferred income tax | | | 9,179 | | | | 8,386 | | | | — | | | | 17,565 | |
Due from unrestricted group | | | 102,311 | | | | — | | | | (102,311 | ) | | | — | |
| | | | | | | | | | | | | | | | |
Total assets | | € | 644,119 | | | € | 641,795 | | | € | (102,311 | ) | | € | 1,183,603 | |
| | | | | | | | | | | | | | | | |
LIABILITIES | | | | | | | | | | | | | | | | |
Current liabilities | | | | | | | | | | | | | | | | |
Accounts payable and other | | € | 42,106 | | | € | 47,844 | | | € | — | | | € | 89,950 | |
Pension and other post-retirement benefit obligations | | | 813 | | | | — | | | | — | | | | 813 | |
Debt | | | 5,662 | | | | 40,000 | | | | — | | | | 45,662 | |
| | | | | | | | | | | | | | | | |
Total current liabilities | | | 48,581 | | | | 87,844 | | | | — | | | | 136,425 | |
Long-term liabilities | | | | | | | | | | | | | | | | |
Debt | | | 216,214 | | | | 449,527 | | | | — | | | | 665,741 | |
Due to restricted group | | | — | | | | 102,311 | | | | (102,311 | ) | | | — | |
Unrealized interest rate derivative losses | | | — | | | | 50,678 | | | | — | | | | 50,678 | |
Pension and other post-retirement benefit obligations | | | 32,141 | | | | — | | | | — | | | | 32,141 | |
Capital leases and other | | | 6,073 | | | | 7,863 | | | | — | | | | 13,936 | |
Deferred income tax | | | 5,757 | | | | — | | | | — | | | | 5,757 | |
| | | | | | | | | | | | | | | | |
Total liabilities | | | 308,766 | | | | 698,223 | | | | (102,311 | ) | | | 904,678 | |
| | | | | | | | | | | | | | | | |
EQUITY | | | | | | | | | | | | | | | | |
Total shareholders’ equity (deficit) | | | 335,353 | | | | (39,548 | ) | | | — | | | | 295,805 | |
Noncontrolling deficit | | | — | | | | (16,880 | ) | | | — | | | | (16,880 | ) |
| | | | | | | | | | | | | | | | |
Total liabilities and equity | | € | 644,119 | | | € | 641,795 | | | € | (102,311 | ) | | € | 1,183,603 | |
| | | | | | | | | | | | | | | | |
MERCER INTERNATIONAL INC.
NOTES TO THE CONSOLIDATED FINANCIAL STATEMENTS
(In thousands of Euros, except per share data)
| |
Note 19. | Restricted Group Supplemental Disclosure — (Continued) |
Note 20. Restricted Group Supplemental Disclosure (continued)
Combined Condensed Balance Sheets
| | | | | | | | | | | | | | | | | |
| | | December 31, 2009 | |
| | | Restricted
| | | Unrestricted
| | | | | | Consolidated
| |
| | | Group | | | Subsidiaries | | | Eliminations | | | Group | |
| |
ASSETS |
| Current | | | | | | | | | | | | | | | | |
| Cash and cash equivalents | | € | 20,635 | | | € | 30,656 | | | € | — | | | € | 51,291 | |
| Receivables | | | 34,588 | | | | 36,555 | | | | — | | | | 71,143 | |
| Inventories | | | 52,897 | | | | 19,732 | | | | — | | | | 72,629 | |
| Prepaid expenses and other | | | 3,452 | | | | 2,419 | | | | — | | | | 5,871 | |
| | | | | | | | | | | | | | | | | |
| Total current assets | | | 111,572 | | | | 89,362 | | | | — | | | | 200,934 | |
| Long-term assets | | | | | | | | | | | | | | | | |
| Property, plant and equipment | | | 362,311 | | | | 506,247 | | | | — | | | | 868,558 | |
| Deferred note issuance and other | | | 3,388 | | | | 4,798 | | | | — | | | | 8,186 | |
| Deferred income tax | | | 3,426 | | | | — | | | | — | | | | 3,426 | |
| Due from unrestricted group | | | 72,553 | | | | — | | | | (72,553 | ) | | | — | |
| Note receivable | | | 2,727 | | | | — | | | | — | | | | 2,727 | |
| | | | | | | | | | | | | | | | | |
| Total assets | | € | 555,977 | | | € | 600,407 | | | € | (72,553 | ) | | € | 1,083,831 | |
| | | | | | | | | | | | | | | | | |
| |
| LIABILITIES |
| Current liabilities | | | | | | | | | | | | | | | | |
| Accounts payable and accrued expenses | | € | 51,875 | | | € | 33,310 | | | € | — | | | € | 85,185 | |
| Pension and other post-retirement benefit obligations | | | 567 | | | | — | | | | — | | | | 567 | |
| Debt | | | 2,115 | | | | 13,917 | | | | — | | | | 16,032 | |
| | | | | | | | | | | | | | | | | |
| Total current liabilities | | | 54,557 | | | | 47,227 | | | | — | | | | 101,784 | |
| Long-term liabilities | | | | | | | | | | | | | | | | |
| Debt | | | 276,604 | | | | 536,538 | | | | — | | | | 813,142 | |
| Due to restricted group | | | — | | | | 72,553 | | | | (72,553 | ) | | | — | |
| Unrealized interest rate derivative losses | | | — | | | | 52,873 | | | | — | | | | 52,873 | |
| Pension and other post-retirement benefit obligations | | | 17,902 | | | | — | | | | — | | | | 17,902 | |
| Capital leases and other | | | 6,667 | | | | 5,490 | | | | — | | | | 12,157 | |
| | | | | | | | | | | | | | | | | |
| Total liabilities | | | 355,730 | | | | 714,681 | | | | (72,553 | ) | | | 997,858 | |
| | | | | | | | | | | | | | | | | |
EQUITY | | | | | | | | | | | | | | | | |
| Total shareholders’ equity (deficit) | | | 200,247 | | | | (77,025 | ) | | | — | | | | 123,222 | |
| Noncontrolling interest (deficit) | | | — | | | | (37,249 | ) | | | — | | | | (37,249 | ) |
| | | | | | | | | | | | | | | | | |
| Total liabilities and equity | | € | 555,977 | | | € | 600,407 | | | € | (72,553 | ) | | € | 1,083,831 | |
| | | | | | | | | | | | | | | | | |
105
| | | | | | | | | | | | | | | | |
| | | December 31, 2011 | |
| | | Restricted
Group | | | Unrestricted
Subsidiaries | | | Eliminations | | | Consolidated
Group | |
ASSETS | | | | | | | | | | | | | | | | |
Current assets | | | | | | | | | | | | | | | | |
Cash and cash equivalents | | € | 44,829 | | | € | 60,243 | | | € | — | | | € | 105,072 | |
Marketable securities | | | 12,216 | | | | — | | | | — | | | | 12,216 | |
Receivables | | | 62,697 | | | | 57,790 | | | | — | | | | 120,487 | |
Inventories | | | 71,692 | | | | 48,847 | | | | — | | | | 120,539 | |
Prepaid expenses and other | | | 5,019 | | | | 3,143 | | | | — | | | | 8,162 | |
Deferred income tax | | | 5,179 | | | | 1,571 | | | | — | | | | 6,750 | |
| | | | | | | | | | | | | | | | |
Total current assets | | | 201,632 | | | | 171,594 | | | | — | | | | 373,226 | |
Long-term assets | | | | | | | | | | | | | | | | |
Property, plant and equipment | | | 353,925 | | | | 467,049 | | | | — | | | | 820,974 | |
Deferred note issuance and other | | | 5,971 | | | | 4,792 | | | | — | | | | 10,763 | |
Deferred income tax | | | 8,492 | | | | 3,795 | | | | — | | | | 12,287 | |
Due from unrestricted group | | | 88,824 | | | | — | | | | (88,824 | ) | | | — | |
| | | | | | | | | | | | | | | | |
Total assets | | € | 658,844 | | | € | 647,230 | | | € | (88,824 | ) | | € | 1,217,250 | |
| | | | | | | | | | | | | | | | |
LIABILITIES | | | | | | | | | | | | | | | | |
Current liabilities | | | | | | | | | | | | | | | | |
Accounts payable and other | | € | 49,815 | | | € | 49,825 | | | € | — | | | € | 99,640 | |
Pension and other post-retirement benefit obligations | | | 756 | | | | — | | | | — | | | | 756 | |
Debt | | | 1,088 | | | | 24,583 | | | | — | | | | 25,671 | |
| | | | | | | | | | | | | | | | |
Total current liabilities | | | 51,659 | | | | 74,408 | | | | — | | | | 126,067 | |
| | | | |
Long-term liabilities | | | | | | | | | | | | | | | | |
Debt | | | 222,384 | | | | 486,031 | | | | — | | | | 708,415 | |
Due to restricted group | | | — | | | | 88,824 | | | | (88,824 | ) | | | — | |
Unrealized interest rate derivative losses | | | — | | | | 52,391 | | | | — | | | | 52,391 | |
Pension and other post-retirement benefit obligations | | | 31,197 | | | | — | | | | — | | | | 31,197 | |
Capital leases and other | | | 6,604 | | | | 6,449 | | | | — | | | | 13,053 | |
Deferred income tax | | | 2,585 | | | | — | | | | — | | | | 2,585 | |
| | | | | | | | | | | | | | | | |
Total liabilities | | | 314,429 | | | | 708,103 | | | | (88,824 | ) | | | 933,708 | |
| | | | | | | | | | | | | | | | |
EQUITY | | | | | | | | | | | | | | | | |
Total shareholders’ equity (deficit) | | | 344,415 | | | | (42,299 | ) | | | — | | | | 302,116 | |
Noncontrolling deficit | | | — | | | | (18,574 | ) | | | — | | | | (18,574 | ) |
| | | | | | | | | | | | | | | | |
Total liabilities and equity | | € | 658,844 | | | € | 647,230 | | | € | (88,824 | ) | | € | 1,217,250 | |
| | | | | | | | | | | | | | | | |
MERCER INTERNATIONAL INC.
NOTES TO THE CONSOLIDATED FINANCIAL STATEMENTS
(In thousands of Euros, except per share data)
| |
Note 19. | Restricted Group Supplemental Disclosure — (Continued) |
Note 20. Restricted Group Supplemental Disclosure (continued)
Combined Condensed Statements of Operations
| | | | | | | | | | | | | | | | | |
| | | Year Ended December 31, 2010 | |
| | | Restricted
| | | Unrestricted
| | | | | | Consolidated
| |
| | | Group | | | Subsidiaries | | | Eliminations | | | Group | |
| |
| Revenues | | | | | | | | | | | | | | | | |
| Pulp | | € | 490,020 | | | € | 366,291 | | | € | — | | | € | 856,311 | |
| Energy | | | 15,145 | | | | 29,080 | | | | — | | | | 44,225 | |
| | | | | | | | | | | | | | | | | |
| | | | 505,165 | | | | 395,371 | | | | — | | | | 900,536 | |
| | | | | | | | | | | | | | | | | |
| Operating costs | | | 361,272 | | | | 282,257 | | | | — | | | | 643,529 | |
| Operating depreciation and amortization | | | 29,971 | | | | 25,961 | | | | — | | | | 55,932 | |
| Selling, general and administrative expenses and other | | | 20,231 | | | | 13,101 | | | | — | | | | 33,332 | |
| | | | | | | | | | | | | | | | | |
| | | | 411,474 | | | | 321,319 | | | | — | | | | 732,793 | |
| | | | | | | | | | | | | | | | | |
| Operating income (loss) | | | 93,691 | | | | 74,052 | | | | — | | | | 167,743 | |
| | | | | | | | | | | | | | | | | |
| Other income (expense) | | | | | | | | | | | | | | | | |
| Interest expense | | | (31,498 | ) | | | (40,852 | ) | | | 4,729 | | | | (67,621 | ) |
| Investment income (loss) | | | 5,103 | | | | 94 | | | | (4,729 | ) | | | 468 | |
| Foreign exchange gain (loss) on debt | | | (6,126 | ) | | | — | | | | — | | | | (6,126 | ) |
| Gain (loss) on extinguishment of debt | | | (7,494 | ) | | | — | | | | — | | | | (7,494 | ) |
| Gain (loss) on derivative instruments | | | — | | | | 1,899 | | | | — | | | | 1,899 | |
| | | | | | | | | | | | | | | | | |
| Total other income (expense) | | | (40,015 | ) | | | (38,859 | ) | | | — | | | | (78,874 | ) |
| | | | | | | | | | | | | | | | | |
| Income (loss) before income taxes | | | 53,676 | | | | 35,193 | | | | — | | | | 88,869 | |
| Income tax benefit (provision) | | | 8,651 | | | | (2,772 | ) | | | — | | | | 5,879 | |
| | | | | | | | | | | | | | | | | |
| Net income (loss) | | | 62,327 | | | | 32,421 | | | | — | | | | 94,748 | |
| Less: net (income) loss attributable to noncontrolling interest | | | — | | | | (8,469 | ) | | | — | | | | (8,469 | ) |
| | | | | | | | | | | | | | | | | |
| Net income (loss) attributable to common shareholders | | € | 62,327 | | | € | 23,952 | | | € | — | | | € | 86,279 | |
| | | | | | | | | | | | | | | | | |
106
| | | | | | | | | | | | | | | | |
| | | Year Ended December 31, 2012 | |
| | | Restricted
Group | | | Unrestricted
Subsidiaries | | | Eliminations | | | Consolidated
Group | |
Revenues | | | | | | | | | | | | | | | | |
Pulp | | € | 423,943 | | | € | 337,911 | | | € | — | | | € | 761,854 | |
Energy and chemicals | | | 28,489 | | | | 43,800 | | | | — | | | | 72,289 | |
| | | | | | | | | | | | | | | | |
| | | 452,432 | | | | 381,711 | | | | — | | | | 834,143 | |
Operating costs | | | 388,966 | | | | 300,086 | | | | — | | | | 689,052 | |
Operating depreciation and amortization | | | 31,195 | | | | 26,581 | | | | — | | | | 57,776 | |
Selling, general and administrative expenses | | | 24,640 | | | | 13,670 | | | | — | | | | 38,310 | |
| | | | | | | | | | | | | | | | |
| | | 444,801 | | | | 340,337 | | | | — | | | | 785,138 | |
| | | | | | | | | | | | | | | | |
Operating income | | | 7,631 | | | | 41,374 | | | | — | | | | 49,005 | |
| | | | | | | | | | | | | | | | |
Other income (expense) | | | | | | | | | | | | | | | | |
Interest expense | | | (23,425 | ) | | | (38,050 | ) | | | 5,670 | | | | (55,805 | ) |
Gain (loss) on derivative instruments | | | 2,028 | | | | 1,713 | | | | — | | | | 3,741 | |
Loss on extinguishment of debt | | | (81 | ) | | | — | | | | — | | | | (81 | ) |
Other income (expense) | | | 5,108 | | | | 504 | | | | (5,670 | ) | | | (58 | ) |
| | | | | | | | | | | | | | | | |
Total other income (expense) | | | (16,370 | ) | | | (35,833 | ) | | | — | | | | (52,203 | ) |
| | | | | | | | | | | | | | | | |
Income (loss) before income taxes | | | (8,739 | ) | | | 5,541 | | | | — | | | | (3,198 | ) |
Income tax benefit (provision) | | | (5,482 | ) | | | (1,811 | ) | | | — | | | | (7,293 | ) |
| | | | | | | | | | | | | | | | |
Net income (loss) | | | (14,221 | ) | | | 3,730 | | | | — | | | | (10,491 | ) |
Less: net income attributable to noncontrolling interest | | | — | | | | (1,694 | ) | | | — | | | | (1,694 | ) |
| | | | | | | | | | | | | | | | |
Net income (loss) attributable to common shareholders | | € | (14,221 | ) | | € | 2,036 | | | € | — | | | € | (12,185 | ) |
| | | | | | | | | | | | | | | | |
MERCER INTERNATIONAL INC.
NOTES TO THE CONSOLIDATED FINANCIAL STATEMENTS
(In thousands of Euros, except per share data)
| |
Note 19. | Restricted Group Supplemental Disclosure — (Continued) |
Note 20. Restricted Group Supplemental Disclosure (continued)
Combined Condensed Statements of Operations
| | | | | | | | | | | | | | | | | |
| | | Year Ended December 31, 2009 | |
| | | Restricted
| | | Unrestricted
| | | | | | Consolidated
| |
| | | Group | | | Subsidiaries | | | Eliminations | | | Group | |
| |
| Revenues | | | | | | | | | | | | | | | | |
| Pulp | | € | 318,448 | | | € | 258,850 | | | € | — | | | € | 577,298 | |
| Energy | | | 15,183 | | | | 27,318 | | | | — | | | | 42,501 | |
| | | | | | | | | | | | | | | | | |
| | | | 333,631 | | | | 286,168 | | | | — | | | | 619,799 | |
| | | | | | | | | | | | | | | | | |
| Operating costs | | | 312,029 | | | | 239,752 | | | | — | | | | 551,781 | |
| Operating depreciation and amortization | | | 27,453 | | | | 26,466 | | | | — | | | | 53,919 | |
| Selling, general and administrative expenses and other | | | 15,049 | | | | 11,849 | | | | — | | | | 26,898 | |
| | | | | | | | | | | | | | | | | |
| | | | 354,531 | | | | 278,067 | | | | — | | | | 632,598 | |
| | | | | | | | | | | | | | | | | |
| Operating income (loss) | | | (20,900 | ) | | | 8,101 | | | | — | | | | (12,799 | ) |
| | | | | | | | | | | | | | | | | |
| Other income (expense) | | | | | | | | | | | | | | | | |
| Interest expense | | | (27,351 | ) | | | (41,932 | ) | | | 4,513 | | | | (64,770 | ) |
| Investment income (loss) | | | 5,002 | | | | (2,293 | ) | | | (4,513 | ) | | | (1,804 | ) |
| Foreign exchange gain (loss) on debt | | | 2,692 | | | | — | | | | — | | | | 2,692 | |
| Gain (loss) on extinguishment of debt | | | 4,447 | | | | — | | | | — | | | | 4,447 | |
| Gain (loss) on derivative instruments | | | — | | | | (5,760 | ) | | | — | | | | (5,760 | ) |
| | | | | | | | | | | | | | | | | |
| Total other income (expense) | | | (15,210 | ) | | | (49,985 | ) | | | — | | | | (65,195 | ) |
| | | | | | | | | | | | | | | | | |
| Income (loss) before income taxes | | | (36,110 | ) | | | (41,884 | ) | | | — | | | | (77,994 | ) |
| Income tax benefit (provision) | | | 183 | | | | 5,686 | | | | — | | | | 5,869 | |
| | | | | | | | | | | | | | | | | |
| Net income (loss) | | | (35,927 | ) | | | (36,198 | ) | | | — | | | | (72,125 | ) |
| Less: net (income) loss attributable to noncontrolling interest | | | — | | | | 9,936 | | | | — | | | | 9,936 | |
| | | | | | | | | | | | | | | | | |
| Net income (loss) attributable to common shareholders | | € | (35,927 | ) | | € | (26,262 | ) | | € | — | | | € | (62,189 | ) |
| | | | | | | | | | | | | | | | | |
107
| | | | | | | | | | | | | | | | |
| | | Year Ended December 31, 2011 | |
| | | Restricted
Group | | | Unrestricted
Subsidiaries | | | Eliminations | | | Consolidated
Group | |
Revenues | | | | | | | | | | | | | | | | |
Pulp | | € | 473,992 | | | € | 357,404 | | | € | — | | | € | 831,396 | |
Energy and chemicals | | | 25,473 | | | | 42,606 | | | | — | | | | 68,079 | |
| | | | | | | | | | | | | | | | |
| | | 499,465 | | | | 400,010 | | | | — | | | | 899,475 | |
Operating costs | | | 382,555 | | | | 311,270 | | | | — | | | | 693,825 | |
Operating depreciation and amortization | | | 29,841 | | | | 25,919 | | | | — | | | | 55,760 | |
Selling, general and administrative expenses | | | 24,126 | | | | 14,645 | | | | — | | | | 38,771 | |
| | | | | | | | | | | | | | | | |
| | | 436,522 | | | | 351,834 | | | | — | | | | 788,356 | |
| | | | | | | | | | | | | | | | |
Operating income | | | 62,943 | | | | 48,176 | | | | — | | | | 111,119 | |
| | | | | | | | | | | | | | | | |
Other income (expense) | | | | | | | | | | | | | | | | |
Interest expense | | | (24,886 | ) | | | (39,074 | ) | | | 4,965 | | | | (58,995 | ) |
Gain (loss) on derivative instruments | | | — | | | | (1,418 | ) | | | — | | | | (1,418 | ) |
Foreign exchange gain (loss) on debt | | | 1,175 | | | | — | | | | — | | | | 1,175 | |
Loss on extinguishment of debt | | | (71 | ) | | | — | | | | — | | | | (71 | ) |
Other income (expense) | | | 5,262 | | | | 1,204 | | | | (4,965 | ) | | | 1,501 | |
| | | | | | | | | | | | | | | | |
Total other income (expense) | | | (18,520 | ) | | | (39,288 | ) | | | — | | | | (57,808 | ) |
| | | | | | | | | | | | | | | | |
Income (loss) before income taxes | | | 44,423 | | | | 8,888 | | | | — | | | | 53,311 | |
Income tax benefit (provision) | | | (4,614 | ) | | | 5,309 | | | | — | | | | 695 | |
| | | | | | | | | | | | | | | | |
Net income (loss) | | | 39,809 | | | | 14,197 | | | | — | | | | 54,006 | |
Less: net income attributable to noncontrolling interest | | | — | | | | (3,931 | ) | | | — | | | | (3,931 | ) |
| | | | | | | | | | | | | | | | |
Net income (loss) attributable to common shareholders | | € | 39,809 | | | € | 10,266 | | | € | — | | | € | 50,075 | |
| | | | | | | | | | | | | | | | |
MERCER INTERNATIONAL INC.
NOTES TO THE CONSOLIDATED FINANCIAL STATEMENTS
(In thousands of Euros, except per share data)
| |
Note 19. | Restricted Group Supplemental Disclosure — (Continued) |
Note 20. Restricted Group Supplemental Disclosure (continued)
Combined Condensed Statements of Operations
| | | | | | | | | | | | | | | | | |
| | | Year Ended December 31, 2008 | |
| | | Restricted
| | | Unrestricted
| | | | | | Consolidated
| |
| | | Group | | | Subsidiaries | | | Eliminations | | | Group | |
| |
| Revenues | | | | | | | | | | | | | | | | |
| Pulp | | € | 400,969 | | | € | 288,351 | | | € | — | | | € | 689,320 | |
| Energy | | | 12,119 | | | | 18,852 | | | | — | | | | 30,971 | |
| | | | | | | | | | | | | | | | | |
| | | | 413,088 | | | | 307,203 | | | | — | | | | 720,291 | |
| | | | | | | | | | | | | | | | | |
| Operating costs | | | 369,923 | | | | 257,010 | | | | — | | | | 626,933 | |
| Operating depreciation and amortization | | | 28,589 | | | | 26,895 | | | | — | | | | 55,484 | |
| Selling, general and administrative expenses and other | | | 16,973 | | | | 7,572 | | | | — | | | | 24,545 | |
| | | | | | | | | | | | | | | | | |
| | | | 415,485 | | | | 291,477 | | | | — | | | | 706,962 | |
| | | | | | | | | | | | | | | | | |
| Operating income (loss) | | | (2,397 | ) | | | 15,726 | | | | — | | | | 13,329 | |
| | | | | | | | | | | | | | | | | |
| Other income (expense) | | | | | | | | | | | | | | | | |
| Interest expense | | | (27,027 | ) | | | (43,117 | ) | | | 4,388 | | | | (65,756 | ) |
| Investment income (loss) | | | 6,834 | | | | (3,620 | ) | | | (4,388 | ) | | | (1,174 | ) |
| Foreign exchange gain (loss) on debt | | | (4,114 | ) | | | (120 | ) | | | — | | | | (4,234 | ) |
| Gain (loss) on derivative instruments | | | — | | | | (25,228 | ) | | | — | | | | (25,228 | ) |
| | | | | | | | | | | | | | | | | |
| Total other income (expense) | | | (24,307 | ) | | | (72,085 | ) | | | — | | | | (96,392 | ) |
| | | | | | | | | | | | | | | | | |
| Income (loss) before income taxes | | | (26,704 | ) | | | (56,359 | ) | | | — | | | | (83,063 | ) |
| Income tax benefit (provision) | | | (3,728 | ) | | | 1,251 | | | | — | | | | (2,477 | ) |
| | | | | | | | | | | | | | | | | |
| Net income (loss) | | | (30,432 | ) | | | (55,108 | ) | | | — | | | | (85,540 | ) |
| Less: net (income) loss attributable to noncontrolling interest | | | — | | | | 13,075 | | | | — | | | | 13,075 | |
| | | | | | | | | | | | | | | | | |
| Net income (loss) attributable to common shareholders | | € | (30,432 | ) | | € | (42,033 | ) | | € | — | | | € | (72,465 | ) |
| | | | | | | | | | | | | | | | | |
108
| | | | | | | | | | | | | | | | |
| | | Year Ended December 31, 2010 | |
| | | Restricted
Group | | | Unrestricted
Subsidiaries | | | Eliminations | | | Consolidated
Group | |
Revenues | | | | | | | | | | | | | | | | |
Pulp | | € | 490,020 | | | € | 366,291 | | | € | — | | | € | 856,311 | |
Energy and chemicals | | | 15,145 | | | | 34,143 | | | | — | | | | 49,288 | |
| | | | | | | | | | | | | | | | |
| | | 505,165 | | | | 400,434 | | | | — | | | | 905,599 | |
Operating costs | | | 361,272 | | | | 287,320 | | | | — | | | | 648,592 | |
Operating depreciation and amortization | | | 29,971 | | | | 25,961 | | | | — | | | | 55,932 | |
Selling, general and administrative expenses | | | 20,231 | | | | 13,101 | | | | — | | | | 33,332 | |
| | | | | | | | | | | | | | | | |
| | | 411,474 | | | | 326,382 | | | | — | | | | 737,856 | |
| | | | | | | | | | | | | | | | |
Operating income | | | 93,691 | | | | 74,052 | | | | — | | | | 167,743 | |
| | | | | | | | | | | | | | | | |
Other income (expense) | | | | | | | | | | | | | | | | |
Interest expense | | | (31,498 | ) | | | (40,852 | ) | | | 4,729 | | | | (67,621 | ) |
Gain (loss) on derivative instruments | | | — | | | | 1,899 | | | | — | | | | 1,899 | |
Foreign exchange gain (loss) on debt | | | (6,126 | ) | | | — | | | | — | | | | (6,126 | ) |
Loss on extinguishment of debt | | | (7,494 | ) | | | — | | | | — | | | | (7,494 | ) |
Other income (expense) | | | 5,103 | | | | 94 | | | | (4,729 | ) | | | 468 | |
| | | | | | | | | | | | | | | | |
Total other income (expense) | | | (40,015 | ) | | | (38,859 | ) | | | — | | | | (78,874 | ) |
| | | | | | | | | | | | | | | | |
Income (loss) before income taxes | | | 53,676 | | | | 35,193 | | | | — | | | | 88,869 | |
Income tax benefit (provision) | | | 8,651 | | | | (2,772 | ) | | | — | | | | 5,879 | |
| | | | | | | | | | | | | | | | |
Net income (loss) | | | 62,327 | | | | 32,421 | | | | — | | | | 94,748 | |
Less: net income attributable to noncontrolling interest | | | — | | | | (8,469 | ) | | | — | | | | (8,469 | ) |
| | | | | | | | | | | | | | | | |
Net income (loss) attributable to common shareholders | | € | 62,327 | | | € | 23,952 | | | € | — | | | € | 86,279 | |
| | | | | | | | | | | | | | | | |
MERCER INTERNATIONAL INC.
NOTES TO THE CONSOLIDATED FINANCIAL STATEMENTS
(In thousands of Euros, except per share data)
| |
Note 19. | Restricted Group Supplemental Disclosure — (Continued) |
Note 20. Restricted Group Supplemental Disclosure (continued)
Combined Condensed Statements of Cash Flows
| | | | | | | | | | | | | |
| | | Year Ended December 31, 2010 | |
| | | Restricted
| | | Unrestricted
| | | Consolidated
| |
| | | Group | | | Group | | | Group | |
| |
| Cash flows from (used in) operating activities | | | | | | | | | | | | |
| Net income (loss) attributable to common shareholders | | € | 62,327 | | | € | 23,952 | | | € | 86,279 | |
| Adjustments to reconcile net income (loss) attributable to common shareholders to cash flows from operating activities | | | | | | | | | | | | |
| Loss (gain) on derivative instruments | | | — | | | | (1,899 | ) | | | (1,899 | ) |
| Foreign exchange (gain) loss on debt | | | 6,126 | | | | — | | | | 6,126 | |
| Loss (gain) on extinguishment of debt | | | 7,494 | | | | — | | | | 7,494 | |
| Depreciation and amortization | | | 30,270 | | | | 25,961 | | | | 56,231 | |
| Accretion expense (income) | | | 2,492 | | | | — | | | | 2,492 | |
| Noncontrolling interest | | | — | | | | 8,469 | | | | 8,469 | |
| Deferred income taxes | | | (9,760 | ) | | | — | | | | (9,760 | ) |
| Stock compensation expense | | | 2,394 | | | | — | | | | 2,394 | |
| Pension and other post-retirement expense, net of funding | | | 418 | | | | — | | | | 418 | |
| Other | | | 2,519 | | | | 2,671 | | | | 5,190 | |
| Changes in current assets and liabilities | | | | | | | | | | | | |
| Receivables | | | (25,913 | ) | | | (14,125 | ) | | | (40,038 | ) |
| Inventories | | | (2,885 | ) | | | (21,577 | ) | | | (24,462 | ) |
| Accounts payable and accrued expenses | | | (10,304 | ) | | | 7,215 | | | | (3,089 | ) |
| Other(1) | | | (10,597 | ) | | | 6,031 | | | | (4,566 | ) |
| | | | | | | | | | | | | |
| Net cash from (used in) operating activities | | | 54,581 | | | | 36,698 | | | | 91,279 | |
| Cash flows from (used in) investing activities | | | | | | | | | | | | |
| Purchase of property, plant and equipment | | | (34,675 | ) | | | (3,625 | ) | | | (38,300 | ) |
| Proceeds on sale of property, plant and equipment | | | 251 | | | | 887 | | | | 1,138 | |
| Cash, restricted | | | — | | | | — | | | | — | |
| Note receivable | | | 1,113 | | | | — | | | | 1,113 | |
| | | | | | | | | | | | | |
| Net cash from (used in) investing activities | | | (33,311 | ) | | | (2,738 | ) | | | (36,049 | ) |
| Cash flows from (used in) financing activities | | | | | | | | | | | | |
| Repayment of notes payable and debt | | | (220,681 | ) | | | (13,917 | ) | | | (234,598 | ) |
| Repayment of capital lease obligations | | | (589 | ) | | | (2,331 | ) | | | (2,920 | ) |
| Proceeds from borrowings of notes payable and debt | | | 222,193 | | | | — | | | | 222,193 | |
| Proceeds from (repayment of) credit facilities, net | | | (2,660 | ) | | | — | | | | (2,660 | ) |
| Proceeds from government grants | | | 17,952 | | | | — | | | | 17,952 | |
| Payment of deferred note issuance costs | | | (6,095 | ) | | | — | | | | (6,095 | ) |
| | | | | | | | | | | | | |
| Net cash from (used in) financing activities | | | 10,120 | | | | (16,248 | ) | | | (6,128 | ) |
| Effect of exchange rate changes on cash and cash equivalents | | | (1,371 | ) | | | — | | | | (1,371 | ) |
| | | | | | | | | | | | | |
| Net increase (decrease) in cash and cash equivalents | | | 30,019 | | | | 17,712 | | | | 47,731 | |
| Cash and cash equivalents, beginning of period | | | 20,635 | | | | 30,656 | | | | 51,291 | |
| | | | | | | | | | | | | |
| Cash and cash equivalents, end of period | | € | 50,654 | | | € | 48,368 | | | € | 99,022 | |
| | | | | | | | | | | | | |
| | | | | | | | | | | | |
| | | Year Ended December 31, 2012 | |
| | | Restricted
Group | | | Unrestricted
Subsidiaries | | | Consolidated
Group | |
Cash flows from (used in) operating activities | | | | | | | | | | | | |
Net income (loss) | | € | (14,221 | ) | | € | 3,730 | | | € | (10,491 | ) |
Adjustments to reconcile net income (loss) to cash flows from operating activities | | | | | | | | | | | | |
Unrealized loss (gain) on derivative instruments | | | (764 | ) | | | (1,713 | ) | | | (2,477 | ) |
Loss on extinguishment of debt | | | 81 | | | | — | | | | 81 | |
Depreciation and amortization | | | 31,471 | | | | 26,581 | | | | 58,052 | |
Deferred income taxes | | | 5,179 | | | | (5,297 | ) | | | (118 | ) |
Stock compensation expense | | | 2,039 | | | | — | | | | 2,039 | |
Pension and other post-retirement expense, net of funding | | | 284 | | | | — | | | | 284 | |
Other | | | 1,144 | | | | 2,657 | | | | 3,801 | |
Changes in working capital | | | | | | | | | | | | |
Receivables | | | (587 | ) | | | 8,981 | | | | 8,394 | |
Inventories | | | (3,991 | ) | | | 5,333 | | | | 1,342 | |
Accounts payable and accrued expenses | | | (7,446 | ) | | | (6,544 | ) | | | (13,990 | ) |
Other(1) | | | (15,779 | ) | | | 14,835 | | | | (944 | ) |
| | | | | | | | | | | | |
Net cash from (used in) operating activities | | | (2,590 | ) | | | 48,563 | | | | 45,973 | |
| | | | | | | | | | | | |
Cash flows from (used in) investing activities | | | | | | | | | | | | |
Purchase of property, plant and equipment | | | (21,937 | ) | | | (14,767 | ) | | | (36,704 | ) |
Proceeds on sale of property, plant and equipment | | | 365 | | | | 288 | | | | 653 | |
Proceeds on maturity of marketable securities | | | 12,213 | | | | — | | | | 12,213 | |
| | | | | | | | | | | | |
Net cash from (used in) investing activities | | | (9,359 | ) | | | (14,479 | ) | | | (23,838 | ) |
| | | | | | | | | | | | |
Cash flows from (used in) financing activities | | | | | | | | | | | | |
Repayment of notes payable and debt | | | (2,671 | ) | | | (24,583 | ) | | | (27,254 | ) |
Repayment of capital lease obligations | | | (735 | ) | | | (1,390 | ) | | | (2,125 | ) |
Proceeds from (repayment of) credit facilities, net | | | 4,559 | | | | — | | | | 4,559 | |
Payment of note issuance costs | | | (312 | ) | | | (1,621 | ) | | | (1,933 | ) |
Proceeds from government grants | | | 3,096 | | | | 792 | | | | 3,888 | |
| | | | | | | | | | | | |
Net cash from (used in) financing activities | | | 3,937 | | | | (26,802 | ) | | | (22,865 | ) |
| | | | | | | | | | | | |
Effect of exchange rate changes on cash and cash equivalents | | | (103 | ) | | | — | | | | (103 | ) |
| | | | | | | | | | | | |
Net increase (decrease) in cash and cash equivalents | | | (8,115 | ) | | | 7,282 | | | | (833 | ) |
Cash and cash equivalents, beginning of year | | | 44,829 | | | | 60,243 | | | | 105,072 | |
| | | | | | | | | | | | |
Cash and cash equivalents, end of year | | € | 36,714 | | | € | 67,525 | | | € | 104,239 | |
| | | | | | | | | | | | |
| | |
| (1) | | Includes intercompany working capital related transactions. |
109
MERCER INTERNATIONAL INC.
NOTES TO THE CONSOLIDATED FINANCIAL STATEMENTS
(In thousands of Euros, except per share data)
| |
Note 19. | Restricted Group Supplemental Disclosure — (Continued) |
Note 20. Restricted Group Supplemental Disclosure (continued)
Combined Condensed Statements of Cash Flows
| | | | | | | | | | | | | |
| | | Year Ended December 31, 2009 | |
| | | Restricted
| | | Unrestricted
| | | Consolidated
| |
| | | Group | | | Group | | | Group | |
| |
| Cash flows from (used in) operating activities | | | | | | | | | | | | |
| Net income (loss) attributable to common shareholders | | € | (35,927 | ) | | € | (26,262 | ) | | € | (62,189 | ) |
| Adjustments to reconcile net income (loss) attributable to common shareholders to cash flows from operating activities | | | | | | | | | | | | |
| Loss (gain) on derivative instruments | | | — | | | | 5,760 | | | | 5,760 | |
| Foreign exchange (gain) loss on debt | | | (2,692 | ) | | | — | | | | (2,692 | ) |
| Loss (gain) on extinguishment of debt | | | (4,447 | ) | | | — | | | | (4,447 | ) |
| Depreciation and amortization | | | 27,704 | | | | 26,466 | | | | 54,170 | |
| Accretion expense (income) | | | 181 | | | | — | | | | 181 | |
| Noncontrolling interest | | | — | | | | (9,936 | ) | | | (9,936 | ) |
| Deferred income taxes | | | (176 | ) | | | (5,827 | ) | | | (6,003 | ) |
| Stock compensation expense | | | 455 | | | | — | | | | 455 | |
| Pension and other post-retirement expense, net of funding | | | 282 | | | | — | | | | 282 | |
| Other | | | 934 | | | | 1,548 | | | | 2,482 | |
| Changes in current assets and liabilities | | | | | | | | | | | | |
| Receivables | | | 26,140 | | | | 5,767 | | | | 31,907 | |
| Inventories | | | 13,234 | | | | 18,924 | | | | 32,158 | |
| Accounts payable and accrued expenses | | | 5,839 | | | | (8,789 | ) | | | (2,950 | ) |
| Other(1) | | | (18,265 | ) | | | 16,406 | | | | (1,859 | ) |
| | | | | | | | | | | | | |
| Net cash from (used in) operating activities | | | 13,262 | | | | 24,057 | | | | 37,319 | |
| Cash flows from (used in) investing activities | | | | | | | | | | | | |
| Purchase of property, plant and equipment | | | (26,839 | ) | | | (1,989 | ) | | | (28,828 | ) |
| Proceeds on sale of property, plant and equipment | | | 158 | | | | 278 | | | | 436 | |
| Cash, restricted | | | — | | | | 13,000 | | | | 13,000 | |
| Note receivable | | | 152 | | | | — | | | | 152 | |
| | | | | | | | | | | | | |
| Net cash from (used in) investing activities | | | (26,529 | ) | | | 11,289 | | | | (15,240 | ) |
| Cash flows from (used in) financing activities | | | | | | | | | | | | |
| Repayment of notes payable and debt | | | (10,000 | ) | | | (16,499 | ) | | | (26,499 | ) |
| Repayment of capital lease obligations | | | (680 | ) | | | (2,498 | ) | | | (3,178 | ) |
| Proceeds from borrowings of notes payable and debt | | | 13,511 | | | | — | | | | 13,511 | |
| Proceeds from (repayment of) credit facilities, net | | | (4,272 | ) | | | — | | | | (4,272 | ) |
| Proceeds from government investment grants | | | 9,058 | | | | — | | | | 9,058 | |
| Payment of deferred note issuance costs | | | — | | | | (1,969 | ) | | | (1,969 | ) |
| | | | | | | | | | | | | |
| Net cash from (used in) financing activities | | | 7,617 | | | | (20,966 | ) | | | (13,349 | ) |
| Effect of exchange rate changes on cash and cash equivalents | | | 109 | | | | — | | | | 109 | |
| | | | | | | | | | | | | |
| Net increase (decrease) in cash and cash equivalents | | | (5,541 | ) | | | 14,380 | | | | 8,839 | |
| Cash and cash equivalents, beginning of period | | | 26,176 | | | | 16,276 | | | | 42,452 | |
| | | | | | | | | | | | | |
| Cash and cash equivalents, end of period | | € | 20,635 | | | € | 30,656 | | | € | 51,291 | |
| | | | | | | | | | | | | |
| | | | | | | | | | | | |
| | | Year Ended December 31, 2011 | |
| | | Restricted
Group | | | Unrestricted
Subsidiaries | | | Consolidated
Group | |
Cash flows from (used in) operating activities | | | | | | | | | | | | |
Net income (loss) | | € | 39,809 | | | € | 14,197 | | | € | 54,006 | |
Adjustments to reconcile net income (loss) to cash flows from operating activities | | | | | | | | | | | | |
Unrealized loss (gain) on derivative instruments | | | — | | | | 1,418 | | | | 1,418 | |
Foreign exchange loss (gain) on debt | | | (1,175 | ) | | | — | | | | (1,175 | ) |
Loss on extinguishment of debt | | | 71 | | | | — | | | | 71 | |
Depreciation and amortization | | | 30,086 | | | | 25,919 | | | | 56,005 | |
Deferred income taxes | | | 2,989 | | | | (5,366 | ) | | | (2,377 | ) |
Stock compensation expense | | | 3,310 | | | | — | | | | 3,310 | |
Pension and other post-retirement expense, net of funding | | | (269 | ) | | | — | | | | (269 | ) |
Other | | | 1,413 | | | | 492 | | | | 1,905 | |
Changes in working capital | | | | | | | | | | | | |
Receivables | | | 3,255 | | | | (4,859 | ) | | | (1,604 | ) |
Inventories | | | (10,175 | ) | | | (7,538 | ) | | | (17,713 | ) |
Accounts payable and accrued expenses | | | 5,868 | | | | 8,384 | | | | 14,252 | |
Other(1) | | | (8,503 | ) | | | 11,729 | | | | 3,226 | |
| | | | | | | | | | | | |
Net cash from (used in) operating activities | | | 66,679 | | | | 44,376 | | | | 111,055 | |
| | | | | | | | | | | | |
Cash flows from (used in) investing activities | | | | | | | | | | | | |
Purchase of property, plant and equipment | | | (29,513 | ) | | | (8,296 | ) | | | (37,809 | ) |
Proceeds on sale of property, plant and equipment | | | 327 | | | | 486 | | | | 813 | |
Purchase of marketable securities | | | (12,187 | ) | | | — | | | | (12,187 | ) |
Note receivable | | | 2,865 | | | | — | | | | 2,865 | |
| | | | | | | | | | | | |
Net cash from (used in) investing activities | | | (38,508 | ) | | | (7,810 | ) | | | (46,318 | ) |
| | | | | | | | | | | | |
Cash flows from (used in) financing activities | | | | | | | | | | | | |
Repayment of notes payable and debt | | | (26,026 | ) | | | (23,167 | ) | | | (49,193 | ) |
Repayment of capital lease obligations | | | (1,310 | ) | | | (1,632 | ) | | | (2,942 | ) |
Proceeds from (repayment of) credit facilities, net | | | (14,652 | ) | | | — | | | | (14,652 | ) |
Proceeds from government grants | | | 14,091 | | | | 108 | | | | 14,199 | |
Purchase of treasury shares | | | (7,476 | ) | | | — | | | | (7,476 | ) |
| | | | | | | | | | | | |
Net cash from (used in) financing activities | | | (35,373 | ) | | | (24,691 | ) | | | (60,064 | ) |
| | | | | | | | | | | | |
Effect of exchange rate changes on cash and cash equivalents | | | 1,377 | | | | — | | | | 1,377 | |
| | | | | | | | | | | | |
Net increase (decrease) in cash and cash equivalents | | | (5,825 | ) | | | 11,875 | | | | 6,050 | |
Cash and cash equivalents, beginning of year | | | 50,654 | | | | 48,368 | | | | 99,022 | |
| | | | | | | | | | | | |
Cash and cash equivalents, end of year | | € | 44,829 | | | € | 60,243 | | | € | 105,072 | |
| | | | | | | | | | | | |
| | |
| (1) | | Includes intercompany working capital related transactions. |
110
MERCER INTERNATIONAL INC.
NOTES TO THE CONSOLIDATED FINANCIAL STATEMENTS
(In thousands of Euros, except per share data)
| |
Note 19. | Restricted Group Supplemental Disclosure — (Continued) |
Note 20. Restricted Group Supplemental Disclosure (continued)
Combined Condensed StatementStatements of Cash Flows
| | | | | | | | | | | | | |
| | | Year Ended December 31, 2008 | |
| | | Restricted
| | | Unrestricted
| | | Consolidated
| |
| | | Group | | | Group | | | Group | |
| |
| Cash flows from (used in) operating activities | | | | | | | | | | | | |
| Net income (loss) attributable to common shareholders | | € | (30,432 | ) | | € | (42,033 | ) | | € | (72,465 | ) |
| Adjustments to reconcile net income (loss) attributable to common shareholders to cash flows from operating activities | | | | | | | | | | | | |
| Loss (gain) on derivative instruments | | | — | | | | 25,228 | | | | 25,228 | |
| Foreign exchange (gain) loss on debt | | | 4,114 | | | | 120 | | | | 4,234 | |
| Depreciation and amortization | | | 28,868 | | | | 26,894 | | | | 55,762 | |
| Noncontrolling interest | | | — | | | | (13,075 | ) | | | (13,075 | ) |
| Deferred income taxes | | | 3,464 | | | | (1,488 | ) | | | 1,976 | |
| Stock compensation expense | | | 264 | | | | — | | | | 264 | |
| Pension and other post-retirement expense, net of funding | | | (758 | ) | | | — | | | | (758 | ) |
| Inventory provisions | | | 8,637 | | | | 2,635 | | | | 11,272 | |
| Other | | | 2,046 | | | | 979 | | | | 3,025 | |
| Changes in current assets and liabilities | | | | | | | | | | | | |
| Receivables | | | (24,427 | ) | | | 9,616 | | | | (14,811 | ) |
| Inventories | | | (12,207 | ) | | | (1,124 | ) | | | (13,331 | ) |
| Accounts payable and accrued expenses | | | 861 | | | | (1,952 | ) | | | (1,091 | ) |
| Other(1) | | | (2,321 | ) | | | 4,225 | | | | 1,904 | |
| | | | | | | | | | | | | |
| Net cash from (used in) operating activities | | | (21,891 | ) | | | 10,025 | | | | (11,866 | ) |
| Cash flows from (used in) investing activities | | | | | | | | | | | | |
| Purchase of property, plant and equipment | | | (20,776 | ) | | | (4,928 | ) | | | (25,704 | ) |
| Proceeds on sale of property, plant and equipment | | | 189 | | | | 1,811 | | | | 2,000 | |
| Cash, restricted | | | — | | | | 20,000 | | | | 20,000 | |
| Note receivable | | | 5,708 | | | | — | | | | 5,708 | |
| | | | | | | | | | | | | |
| Net cash from (used in) investing activities | | | (14,879 | ) | | | 16,883 | | | | 2,004 | |
| Cash flows from (used in) financing activities | | | | | | | | | | | | |
| Repayment of notes payable and debt | | | — | | | | (34,023 | ) | | | (34,023 | ) |
| Repayment of capital lease obligations | | | (1,226 | ) | | | (2,086 | ) | | | (3,312 | ) |
| Proceeds from (repayment of) credit facilities, net | | | 5,837 | | | | — | | | | 5,837 | |
| Proceeds from government investment grants | | | 266 | | | | — | | | | 266 | |
| | | | | | | | | | | | | |
| Net cash from (used in) financing activities | | | 4,877 | | | | (36,109 | ) | | | (31,232 | ) |
| Effect of exchange rate changes on cash and cash equivalents | | | (1,302 | ) | | | — | | | | (1,302 | ) |
| | | | | | | | | | | | | |
| Net increase (decrease) in cash and cash equivalents | | | (33,195 | ) | | | (9,201 | ) | | | (42,396 | ) |
| Cash and cash equivalents, beginning of period | | | 59,371 | | | | 25,477 | | | | 84,848 | |
| | | | | | | | | | | | | |
| Cash and cash equivalents, end of period | | € | 26,176 | | | € | 16,276 | | | € | 42,452 | |
| | | | | | | | | | | | | |
| | | | | | | | | | | | |
| | | Year Ended December 31, 2010 | |
| | | Restricted
Group | | | Unrestricted
Subsidiaries | | | Consolidated
Group | |
Cash flows from (used in) operating activities | | | | | | | | | | | | |
Net income (loss) | | € | 62,327 | | | € | 32,421 | | | € | 94,748 | |
Adjustments to reconcile net income (loss) to cash flows from operating activities | | | | | | | | | | | | |
Unrealized loss (gain) on derivative instruments | | | — | | | | (1,899 | ) | | | (1,899 | ) |
Foreign exchange loss (gain) on debt | | | 6,126 | | | | — | | | | 6,126 | |
Loss on extinguishment of debt | | | 7,494 | | | | — | | | | 7,494 | |
Depreciation and amortization | | | 30,270 | | | | 25,961 | | | | 56,231 | |
Deferred income taxes | | | (9,760 | ) | | | — | | | | (9,760 | ) |
Stock compensation expense | | | 2,394 | | | | — | | | | 2,394 | |
Pension and other post-retirement expense, net of funding | | | 418 | | | | — | | | | 418 | |
Other | | | 5,011 | | | | 2,671 | | | | 7,682 | |
Changes in working capital | | | | | | | | | | | | |
Receivables | | | (25,913 | ) | | | (14,125 | ) | | | (40,038 | ) |
Inventories | | | (2,885 | ) | | | (21,577 | ) | | | (24,462 | ) |
Accounts payable and accrued expenses | | | (10,304 | ) | | | 7,215 | | | | (3,089 | ) |
Other(1) | | | (10,597 | ) | | | 6,031 | | | | (4,566 | ) |
| | | | | | | | | | | | |
Net cash from (used in) operating activities | | | 54,581 | | | | 36,698 | | | | 91,279 | |
| | | | | | | | | | | | |
Cash flows from (used in) investing activities | | | | | | | | | | | | |
Purchase of property, plant and equipment | | | (34,675 | ) | | | (3,625 | ) | | | (38,300 | ) |
Proceeds on sale of property, plant and equipment | | | 251 | | | | 887 | | | | 1,138 | |
Note receivable | | | 1,113 | | | | — | | | | 1,113 | |
| | | | | | | | | | | | |
Net cash from (used in) investing activities | | | (33,311 | ) | | | (2,738 | ) | | | (36,049 | ) |
| | | | | | | | | | | | |
Cash flows from (used in) financing activities | | | | | | | | | | | | |
Repayment of notes payable and debt | | | (220,665 | ) | | | (13,917 | ) | | | (234,582 | ) |
Proceeds from borrowings of notes payable and debt | | | 222,177 | | | | — | | | | 222,177 | |
Repayment of capital lease obligations | | | (589 | ) | | | (2,331 | ) | | | (2,920 | ) |
Proceeds from (repayment of) credit facilities, net | | | (2,660 | ) | | | — | | | | (2,660 | ) |
Payment of note issuance costs | | | (6,095 | ) | | | — | | | | (6,095 | ) |
Proceeds from government grants | | | 17,952 | | | | — | | | | 17,952 | |
| | | | | | | | | | | | |
Net cash from (used in) financing activities | | | 10,120 | | | | (16,248 | ) | | | (6,128 | ) |
| | | | | | | | | | | | |
Effect of exchange rate changes on cash and cash equivalents | | | (1,371 | ) | | | — | | | | (1,371 | ) |
| | | | | | | | | | | | |
Net increase (decrease) in cash and cash equivalents | | | 30,019 | | | | 17,712 | | | | 47,731 | |
Cash and cash equivalents, beginning of year | | | 20,635 | | | | 30,656 | | | | 51,291 | |
| | | | | | | | | | | | |
Cash and cash equivalents, end of year | | € | 50,654 | | | € | 48,368 | | | € | 99,022 | |
| | | | | | | | | | | | |
| | |
| (1) | | Includes intercompany working capital related transactions. |
111
SUPPLEMENTARY FINANCIAL INFORMATION (UNAUDITED)
Quarterly Financial Data
(Thousands of Euros, except per share amounts)
| | | | | | | | | | | | | | | | | |
| | | Quarter Ended | |
| | | March 31 | | | June 30 | | | September 30 | | | December 31 | |
| |
2010 | | | | | | | | | | | | | | | | |
| Revenues | | € | 180,252 | | | € | 240,224 | | | € | 234,418 | | | € | 245,642 | |
| Gross profit | | | 18,024 | | | | 47,888 | | | | 51,411 | | | | 50,420 | |
| Net income (loss) attributable to common shareholders | | | (7,546 | ) | | | 12,401 | | | | 46,135 | | | | 35,289 | |
| Net income (loss) per share attributable to common shareholders* | | | (0.21 | ) | | | 0.23 | | | | 0.82 | | | | 0.63 | |
2009 | | | | | | | | | | | | | | | | |
| Revenues | | € | 139,572 | | | € | 158,884 | | | € | 156,231 | | | € | 165,112 | |
| Gross profit | | | (12,413 | ) | | | (9,736 | ) | | | (493 | ) | | | 9,843 | |
| Net income (loss) attributable to common shareholders | | | (39,350 | ) | | | (11,476 | ) | | | (14,112 | ) | | | 2,749 | |
| Net income (loss) per share attributable to common shareholders* | | | (1.08 | ) | | | (0.32 | ) | | | (0.39 | ) | | | 0.07 | |
112
| | | | | | | | | | | | | | | | |
| | | Quarters Ended | |
| | | March 31 | | | June 30 | | | September 30 | | | December 31 | |
2012 | | | | | | | | | | | | | | | | |
Revenues | | € | 218,358 | | | € | 204,062 | | | € | 223,275 | | | € | 188,448 | |
Gross profit | | | 16,243 | | | | 18,296 | | | | 7,214 | | | | 7,252 | |
Net income (loss) attributable to common shareholders | | | 1,173 | | | | 1,515 | | | | (9,712 | ) | | | (5,161 | ) |
Net income (loss) per share attributable to common shareholders* | | | 0.02 | | | | 0.03 | | | | (0.17 | ) | | | (0.09 | ) |
2011 | | | | | | | | | | | | | | | | |
Revenues | | € | 226,330 | | | € | 234,495 | | | € | 207,065 | | | € | 231,585 | |
Gross profit | | | 36,644 | | | | 36,211 | | | | 35,307 | | | | 2,957 | |
Net income (loss) attributable to common shareholders | | | 29,053 | | | | 14,383 | | | | 8,440 | | | | (1,801 | ) |
Net income (loss) per share attributable to common shareholders* | | | 0.52 | | | | 0.26 | | | | 0.15 | | | | (0.03 | ) |
* On a diluted basis
Pursuant to the requirements of Section 13 or 15(d) of theSecurities Exchange Act of 1934, the Registrant has duly caused this report to be signed on its behalf by the undersigned, thereunto duly authorized.
| | | | | | |
| | |
| | Mercer International Inc.MERCER INTERNATIONAL INC. |
| | | |
Dated: February 17, 201115, 2013 | | | | By: | | /s/ JIMMY S.H. LEE |
| | | | | | Jimmy S.H. Lee Jimmy S.H. Lee
|
| | | | | | Chairman |
Pursuant to the requirements of theSecurities Exchange Act of 1934, this report has been signed below by the following persons on behalf of the Registrant and in the capacities and on the dates indicated.
| | | | | | |
/s/ JIMMY S.H. LEE | | |
| | |
/s/ Jimmy S.H. Lee
Jimmy S.H. Lee
Chairman, Chief Executive Officer
and Director
| | Date: February 17, 2011 |
| 15, 2013 | | |
| | | | | | |
Chairman, Chief Executive Officer and Director | | | | | | |
| | | |
/s/ DavidDAVID M. Gandossi
David M. Gandossi
Secretary, Executive Vice President,
Chief Financial Officer
and Principal Accounting Officer
GANDOSSI | | | | Date: February 17, 2011 |
| 15, 2013 | | |
| | | | | | |
Secretary, Executive Vice President, | | | | | | |
Chief Financial Officer and Principal | | | | | | |
Accounting Officer | | | | | | |
| | | |
/s/ Kenneth A. Shields
Kenneth A. Shields
Director
ERIC LAURITZEN | | | | Date: February 17, 2011 |
| 15, 2013 | | |
| | | | | | |
Director | | | | | | |
| | | |
/s/ Eric Lauritzen
Eric Lauritzen
Director
WILLIAM D. MCCARTNEY | | | | Date: February 17, 2011 |
| 15, 2013 | | |
| | | | | | |
Director | | | | | | |
| | | |
/s/ GRAEME A. WITTS | | | | Date: February 17, 2011 |
| 15, 2013 | | |
| | | | | | |
Director | | | | | | |
| | | |
/s/ GUY W. ADAMS | | | | Date: February 17, 2011 |
| 15, 2013 | | |
| | | | | | |
Director | | | | | | |
| | | |
/s/ BERNARD PICCHI | | | | Date: February 17, 2011 |
| 15, 2013 | | |
| | | | | | |
Director | | | | | | |
| | | |
/s/ George Malpass
George Malpass
Director
JAMES SHEPHERD | | | | Date: February 17, 201115, 2013 | | |
James Shepherd | | | | | | |
Director | | | | | | |
| | | |
/s/ KEITH PURCHASE | | | | Date: February 15, 2013 | | |
Keith Purchase | | | | | | |
Director | | | | | | |
113
EXHIBIT INDEX
| | | | | |
Exhibit
| | |
No. | | Description of Exhibit |
| |
| | 2 | .1 | | Agreement and Plan of Merger among Mercer International Inc., Mercer International Regco Inc. and Mercer Delaware Inc. dated December 14, 2005. Incorporated by reference to the Proxy Statement/Prospectus filed on December 15, 2005. |
| | 3 | .1 | | Articles of Incorporation of the Company, as amended. Incorporated by reference fromForm 8-A dated March 1, 2006. |
| | 3 | .2 | | Bylaws of the Company. Incorporated by reference fromForm 8-A dated March 1, 2006. |
| | 4 | .1 | | Indenture dated as of December 10, 2004 between Mercer International Inc. and Wells Fargo Bank, National Association. Incorporated by reference fromForm S-3 filed December 10, 2004. |
| | 4 | .2 | | First Supplemental Indenture dated February 14, 2005 to Indenture dated December 10, 2004 between Mercer International Inc. and Wells Fargo Bank, National Association. Incorporated by reference fromForm 8-K dated February 17, 2005. |
| | 4 | .3 | | Indenture dated as of December 10, 2009 between Mercer International Inc. and Wells Fargo Bank, National Association. Incorporated by reference fromForm 8-K dated December 11, 2009. |
| | 4 | .4 | | Second Supplemental Indenture dated as of November 16, 2010 to the Indenture dated December 10, 2004 between Mercer International Inc. and Wells Fargo Bank, National Association. Incorporated by reference fromForm 8-K dated November 19, 2010. |
| | 4 | .5 | | Indenture dated as of November 17, 2010 between Mercer International Inc. and Wells Fargo Bank, National Association. Incorporated by reference fromForm 8-K dated November 19, 2010. |
| | 4 | .6 | | Registration Rights Agreement among Mercer International Inc. and RBC Capital Markets, LLC and Credit Suisse Securities (USA) LLC dated November 17, 2010. Incorporated by reference fromForm 8-K dated November 19, 2010. |
| | 10 | .1* | | Project Financing Facility Agreement dated August 26, 2002 between Zellstoff Stendal GmbH and Bayerische Hypo-und Vereinsbank AG, as amended by Amendment, Restatement and Undertaking Agreement dated January 31, 2009. |
| | 10 | .2 | | Shareholders’ Undertaking Agreement dated August 26, 2002 among Mercer International Inc., Stendal Pulp Holdings GmbH, RWE Industrie-Lösungen GmbH, AIG Altmark Industrie AG and FAHR Beteiligungen AG and Zellstoff Stendal GmbH and Bayerische Hypo-und Vereinsbank AG. Incorporated by reference fromForm 8-K dated September 10, 2002. |
| | 10 | .3* | | Shareholders’ Agreement dated August 26, 2002 among Zellstoff Stendal GmbH, Stendal Pulp Holdings GmbH, RWE Industrie-Lösungen GmbH and FAHR Beteiligungen AG. |
| | 10 | .4* | | Contract for the Engineering, Design, Procurement, Construction, Erection andStart-Up of a Kraft Pulp Mill between Zellstoff Stendal GmbH and RWE Industrie-Lösungen GmbH dated August 26, 2002. Certain non-public information has been omitted from the appendices to Exhibit 10.4 pursuant to a request for confidential treatment filed with the SEC. Such non-public information was filed with the SEC on a confidential basis. The SEC approved the request for confidential treatment in January 2004. |
| | 10 | .5* | | Form of Trustee’s Indemnity Agreement between Mercer International Inc. and its Trustees. |
| | 10 | .6 | | Employment Agreement dated for reference August 7, 2003 between Mercer International Inc. and David Gandossi. Incorporated by reference fromForm 8-K dated August 11, 2003. |
| | 10 | .7 | | Employment Agreement effective as of April 28, 2004 between Mercer International Inc. and Jimmy S.H. Lee. Incorporated by reference fromForm 8-K dated April 28, 2004. |
| | 10 | .8 | | 2004 Stock Incentive Plan. Incorporated by reference fromForm S-8 dated June 15, 2004. |
| | 10 | .9 | | 2010 Stock Incentive Plan. Incorporated by reference fromForm S-8 dated June 11, 2010. |
| | 10 | .10 | | Employment Agreement dated October 2, 2006 between Stendal Pulp Holding GmbH and Wolfram Ridder. Incorporated by reference fromForm 8-K dated October 2, 2006. |
| | 10 | .11* | | Employment Agreement effective September 25, 2006 between Mercer International Inc. and Claes-Inge Isacson dated December 5, 2008. |
114
| | | | | |
Exhibit
| | |
No. | | Description of Exhibit |
| |
| | 10 | .12 | | Employment Agreement effective September 1, 2005 between Mercer International Inc. and Leonhard Nossol dated August 18, 2005. Incorporated by reference fromForm 10-Q dated May 6, 2008. |
| | 10 | .13* | | Electricity Purchase Agreement effective January 27, 2009 between Zellstoff Celgar Limited Partnership and British Columbia Hydro and Power Authority. Certain non-public information has been omitted from the appendices to Exhibit 10.13 pursuant to a request for confidential treatment filed with the SEC. Such non-public information was filed with the SEC on a confidential basis. The SEC approved the request for confidential treatment in March 2009. |
| | 10 | .14 | | Revolving Credit Facility Agreement dated August 19, 2009 among D&Z Holding GmbH, Zellstoff-und Papierfabrik Rosenthal GmbH, D&Z Beteiligungs GmbH and ZPR Logistik GmbH and BayerischeHypo-und Vereinsbank AG. Incorporated by reference fromForm 8-K dated August 24, 2009. |
| | 10 | .15 | | Loan Agreement dated August 19, 2009 among Zellstoff-und Papierfabrik Rosenthal GmbH, as borrower, and Bayerische Hypo-und Vereinsbank Aktiengesellschaft, as lender. Incorporated by reference fromForm 8-K dated August 24, 2009. |
| | 10 | .16 | | Amended and Restated Credit Agreement dated as of November 27, 2009 among Zellstoff Celgar Limited Partnership, as borrower, and the lenders from time to time parties thereto, as lenders, and CIT Business Credit Canada Inc., as agent. Incorporated by reference fromForm 8-K dated November 30, 2009. |
| | 14 | | | Code of Business Conduct and Ethics. Incorporated by reference from the definitive proxy statement on Schedule 14A dated August 11, 2003. |
| | 99 | .1 | | Audit Committee Charter. Incorporated by reference from the definitive proxy statement on Schedule 14A dated April 28, 2005. |
| | 99 | .2 | | Governance and Nominating Committee Charter. Incorporated by reference from the definitive proxy statement on Schedule 14A dated April 28, 2004. |
| | 99 | .3 | | Exchange Agreement dated November 25, 2009 between Mercer International Inc. and IAT Reinsurance Co. Ltd. Incorporated by reference fromForm 8-K filed November 27, 2009. |
| | 99 | .4 | | Exchange Agreement dated November 25, 2009 between Mercer International Inc. and Alden Global Distressed Opportunities Fund L.P. Incorporated by reference fromForm 8-K filed November 27, 2009. |
| | 99 | .5 | | Exchange Agreement dated November 25, 2009 between Mercer International Inc. and Greenlight Capital Qualified LP, Greenlight Capital LP and Greenlight Capital Offshore Partners. Incorporated by reference fromForm 8-K filed November 27, 2009. |
| | 21 | | | List of Subsidiaries of Registrant. |
| | 23 | .1 | | Consent of Independent Registered Chartered Accountants — PricewaterhouseCoopers LLP. |
| | 31 | .1 | | Section 302 Certificate of Chief Executive Officer. |
| | 31 | .2 | | Section 302 Certificate of Chief Financial Officer. |
| | 32 | .1** | | Section 906 Certificate of Chief Executive Officer. |
| | 32 | .2** | | Section 906 Certificate of Chief Financial Officer. |
| | |
*Exhibit No. | | Description of Exhibit |
| 2.1 | | Agreement and Plan of Merger among Mercer International Inc., Mercer International Regco Inc. and Mercer Delaware Inc. dated December 14, 2005. Incorporated by reference to the Proxy Statement/Prospectus filed on December 15, 2005. |
| |
| 3.1 | | Articles of Incorporation of the Company, as amended. Incorporated by reference from Form 8-A dated March 1, 2006. |
| |
| 3.2 | | Bylaws of the Company. Incorporated by reference from Form 8-A dated March 1, 2006. |
| |
| 4.1 | | Indenture dated as of November 17, 2010 between Mercer International Inc. and Wells Fargo Bank, National Association. Incorporated by reference from Form 8-K dated November 19, 2010. |
| |
| 10.1* | | Project Financing Facility Agreement dated August 26, 2002 between Zellstoff Stendal GmbH and Bayerische Hypo-und Vereinsbank AG, as amended by Amendment, Restatement and Undertaking Agreement dated January 31, 2009 and the Amendment Agreement dated January 20, 2011. |
| |
| 10.2* | | Project Blue Mill Financing Facility Agreement dated January 20, 2012 between Zellstoff Stendal GmbH and Unicredit Bank AG and IKB Deutsche Industriebank AG. |
| |
| 10.3* | | Shareholders’ Undertaking Agreement dated August 26, 2002 among Mercer International Inc., Stendal Pulp Holdings GmbH, RWE Industrie-Lösungen GmbH, AIG Altmark Industrie AG and FAHR Beteiligungen AG and Zellstoff Stendal GmbH and Bayerische Hypo-und Vereinsbank AG as amended by the Amendment Restatement and Undertaking Agreement dated January 20, 2012. |
| |
| 10.4* | | Shareholders’ Agreement dated August 26, 2002 among Zellstoff Stendal GmbH, Stendal Pulp Holdings GmbH, RWE Industrie-Lösungen GmbH and FAHR Beteiligungen AG as amended by the Amendment Restatement and Undertaking Agreement dated January 20, 2012. |
| |
| 10.5* | | Contract for the Engineering, Design, Procurement, Construction, Erection and Start-Up of a Kraft Pulp Mill between Zellstoff Stendal GmbH and RWE Industrie-Lösungen GmbH dated August 26, 2002. Certain non-public information has been omitted from the appendices to Exhibit 10.4 pursuant to a request for confidential treatment filed with the SEC. Such non-public information was filed with the SEC on a confidential basis. The SEC approved the request for confidential treatment in January 2004. |
| |
| 10.6* | | Form of Trustee’s Indemnity Agreement between Mercer International Inc. and its Trustees. |
| |
| 10.7 | | Employment Agreement dated for reference August 7, 2003 between Mercer International Inc. and David Gandossi. Incorporated by reference from Form 8-K dated August 11, 2003. |
| |
| 10.8 | | Employment Agreement effective as of April 28, 2004 between Mercer International Inc. and Jimmy S.H. Lee. Incorporated by reference from Form 8-K dated April 28, 2004. |
| |
| 10.9 | | 2004 Stock Incentive Plan. Incorporated by reference from Form S-8 dated June 15, 2004. |
| |
| 10.10 | | 2010 Stock Incentive Plan. Incorporated by reference from Form S-8 dated June 11, 2010. |
| |
| 10.11 | | Employment Agreement dated October 2, 2006 between Stendal Pulp Holding GmbH and Wolfram Ridder. Incorporated by reference from Form 8-K dated October 2, 2006. |
| |
| 10.12* | | Employment Agreement effective September 25, 2006 between Mercer International Inc. and Claes-Inge Isacson dated December 5, 2008. |
| |
| 10.13 | | Employment Agreement effective September 1, 2005 between Mercer International Inc. and Leonhard Nossol dated August 18, 2005. Incorporated by reference from Form 10-Q dated May 6, 2008. |
| |
| 10.14* | | Electricity Purchase Agreement effective January 27, 2009 between Zellstoff Celgar Limited Partnership and British Columbia Hydro and Power Authority. Certain non-public information has been omitted from the appendices to Exhibit 10.13 pursuant to a request for confidential treatment filed with the SEC. Such non-public information was filed with the SEC on a confidential basis. The SEC approved the request for confidential treatment in March 2009. |
| | |
| 10.15 | | Revolving Credit Facility Agreement dated August 19, 2009 among D&Z Holding GmbH, Zellstoff-und Papierfabrik Rosenthal GmbH, D&Z Beteiligungs GmbH and ZPR Logistik GmbH and Bayerische Hypo-und Vereinsbank AG. Incorporated by reference from Form 8-K dated August 24, 2009. |
| |
| 10.16 | | Loan Agreement dated August 19, 2009 among Zellstoff-und Papierfabrik Rosenthal GmbH, as borrower, and Bayerische Hypo-und Vereinsbank Aktiengesellschaft, as lender. Incorporated by reference from Form 8-K dated August 24, 2009. |
| |
| 10.17 | | Extension, Amendment and Confirmation Letter dated October 4, 2012 among Zellstoff- und Papierfabrik Rosenthal GmbH, D&Z Holding GmbH, D&Z Beteiligungs GmbH, ZPR Logistik GmbH and Mercer International Inc. Incorporated by reference from Form 10-Q dated November 2, 2012. |
| |
| 10.18 | | Amended and Restated Credit Agreement dated as of November 27, 2009 among Zellstoff Celgar Limited Partnership, as borrower, and the lenders from time to time parties thereto, as lenders, and CIT Business Credit Canada Inc., as agent. Incorporated by reference from Form 8-K dated November 30, 2009. |
| |
| 14 | | Code of Business Conduct and Ethics. Incorporated by reference from the definitive proxy statement on Schedule 14A dated August 11, 2003. |
| |
| 99.1 | | Audit Committee Charter. Incorporated by reference from the definitive proxy statement on Schedule 14A dated April 28, 2005. |
| |
| 99.2 | | Governance and Nominating Committee Charter. Incorporated by reference from the definitive proxy statement on Schedule 14A dated April 28, 2004. |
| |
| 99.3 | | Exchange Agreement dated November 25, 2009 between Mercer International Inc. and IAT Reinsurance Co. Ltd. Incorporated by reference from Form 8-K filed November 27, 2009. |
| |
| 99.4 | | Exchange Agreement dated November 25, 2009 between Mercer International Inc. and Alden Global Distressed Opportunities Fund L.P. Incorporated by reference from Form 8-K filed November 27, 2009. |
| |
| 99.5 | | Exchange Agreement dated November 25, 2009 between Mercer International Inc. and Greenlight Capital Qualified LP, Greenlight Capital LP and Greenlight Capital Offshore Partners. Incorporated by reference from Form 8-K filed November 27, 2009. |
| |
| 21 | | List of Subsidiaries of Registrant. |
| |
| 23.1 | | Consent of Independent Registered Public Accounting Firm. |
| |
| 31.1 | | Section 302 Certificate of Chief Executive Officer. |
| |
| 31.2 | | Section 302 Certificate of Chief Financial Officer. |
| |
| 32.1** | | Section 906 Certificate of Chief Executive Officer. |
| |
| 32.2** | | Section 906 Certificate of Chief Financial Officer. |
| * | Filed inForm 10-K for prior years. |
|
| ** | | In accordance with Release33-8212 of the SEC, these Certifications: (i) are “furnished” to the SEC and are not “filed” for the purposes of liability under the Exchange Act; and (ii) are not to be subject to automatic incorporation by reference into any of the Company’s registration statements filed under the Securities Act for the purposes of liability thereunder or any offering memorandum, unless the Company specifically incorporates them by reference therein. |
115