PART I
In this document, please note the following:
references to “we”, “our”, “us”, the “Company” or “Mercer” mean Mercer International Inc. and its subsidiaries, unless the context clearly suggests otherwise, and references to “Mercer Inc.” mean Mercer International Inc. excluding its subsidiaries;
references to “ADMTs” mean air-dried metric tonnes;
| | |
| • | references to “we”, “our”, “us”, the “Company” or “Mercer” mean Mercer International Inc. and its subsidiaries, unless the context clearly suggests otherwise, and references to “Mercer Inc.” mean Mercer International Inc. excluding its subsidiaries; |
|
| • | references to “ADMTs” mean air-dried metric tonnes; |
|
| • | references to “MW” mean megawatts and “MWh” mean megawatt hours; |
|
| • | information is provided as of December 31, 2010, unless otherwise stated or the context clearly suggests otherwise; |
|
| • | all references to monetary amounts are to “Euros”, the lawful currency adopted by most members of the European Union, unless otherwise stated; and |
|
| • | “€” refers to Euros; “$” refers to U.S. dollars; and “C$” refers to Canadian dollars. |
references to “MW” mean megawatts and “MWh” mean megawatt hours; and
all references to “$” shall mean U.S. dollars, which is our reporting currency, unless otherwise stated; “€” refers to Euros; and “C$” refers to Canadian dollars.
Due to rounding, numbers presented throughout this report may not add up precisely to totals we provide and percentages may not precisely reflect the absolute figures.
The Company
Mercer Inc. is a Washington corporation and our shares of common stock are quoted and listed for trading on the NASDAQ Global Market (MERC) and the Toronto Stock Exchange (MRI.U).
We operate in the pulp business and are among the largest publicly traded producerproducers of market northern bleached softwood kraft, or “NBSK”, pulp in the world. Mercer Inc. reorganized as a corporation under the laws of the State of Washington in 2006 from a Washington business trust. Its common stock is quoted and listed for trading on the NASDAQ Global Select Market (MERC) and the Toronto Stock Exchange (MRI.U).
We are the sole kraft pulpNBSK producer, and the only significant producer of pulp for resale, known as “market pulp”, in Germany, which is the largest pulp import market in Europe. We also generate and sell a significant amount of surplus “green” energy to regional utilities. Our operations are located in Eastern Germany and Western Canada. We currently employ approximately 1,052 people at our German operations, 422 people at our Celgar mill in Western Canada and 17 people at our office in Vancouver, British Columbia, Canada.1,460 people. We operate three NBSK pulp mills with a consolidated annual production capacity of approximately 1.5 million ADMTs:
| | |
| | • | | Rosenthal mill.mill. Our wholly-owned subsidiary, Rosenthal, owns and operates the Rosenthal mill, a modern, efficient ISO 9001, 14001 and 1400150001 certified NBSK pulp mill that has a currentan annual pulp production capacity of approximately 330,000 ADMTs. Additionally, the360,000 ADMTs and 57 MW of electrical generation. The Rosenthal mill is a significant producer of “green” energygenerated and exported 123,309178,295 MWh of electricity in 2010.2013, resulting in approximately $21.5 million in annual revenues. The Rosenthal mill is located nearin the town of Blankenstein, Germany, approximately 300 kilometers south of Berlin. |
|
| | • | | Celgar mill.mill. Our wholly-owned subsidiary, Celgar, owns and operates the Celgar mill, a modern, efficient ISO 9001 and 14001 certified NBSK pulp mill with an annual pulp production capacity of approximately 520,000 ADMTs.ADMTs and 100 MW of electrical generation. The Celgar mill also produces “green” energygenerated and exported 70,923127,729 MWh of electricity in 2010. At the end of September of 2010, Celgar completed a new “green” energy project, referred to as the “Celgar Energy Project”, that is expected to increase surplus energy sales by over 238,000 MWh annually and generate2013, resulting in approximately C$20 to C$25$12.3 million of additional high-margin revenue per annum.in annual revenues. The Celgar mill is located near the city of Castlegar, British Columbia, Canada, approximately 600 kilometers east of Vancouver, British Columbia, Canada. |
|
| | • | | Stendal mill.mill. Our 74.9%83.0% owned subsidiary, Stendal, owns and operates the Stendal mill, astate-of-the-art, single-line, ISO 9001 and 14001 certified NBSK pulp mill that has an annual pulp production capacity of approximately 645,000 ADMTs. Additionally, the660,000 ADMTs and 148 MW of electrical generation. The Stendal mill is a significant producer of “green” energygenerated and exported 325,773393,027 MWh of electricity in 2010.2013, resulting in approximately $45.6 million in annual revenues. The Stendal mill is located near the town of Stendal, Germany, approximately 130 kilometers west of Berlin. |
5
Organizational Chart
The following chart sets out our directly and indirectly owned principal operating subsidiaries, their jurisdictions of organization, their principal activities and their principal activities:
annual pulp production and electrical generation capacity: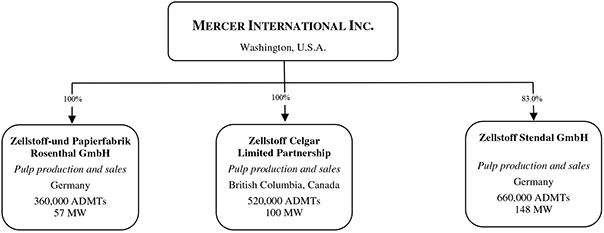
History and Development of Business
We acquired our initialIn 1994, we commenced pulp and paper operations in 1993. Subsequently, we disposedwith the acquisition of our paper operations to focus our business on our core pulp operations.
Rosenthal mill. In late 1999, we completed a major capital project which, among other things, converted the Rosenthalthat mill to the production of kraft pulp from sulphite pulp, increased its annual production capacity reduced costs and improved efficiencies. The aggregate cost of this project was approximately €361.0$385.7 million, of which approximately €102.0$100.8 million was financed through government grants. Subsequent minor capital investments and efficiency improvements have reduced emissions and energy costs and increased the Rosenthal mill’s annual production capacity to approximately 330,000360,000 ADMTs.
In September 2004, we completed construction of the Stendal mill at an aggregate cost of approximately €1.0$1.1 billion. The Stendal mill is one of the largest NBSK pulp mills in Europe. The Stendal mill was financed through a combination of government grants totaling approximately €275.0$332.0 million, low-cost, long-term project debt which is largely severally guaranteed by the federal government and a state government in Germany, and equity contributions.
We initially had a 63.6% ownership interest in Stendal and, over time, increased our interest to 74.9%83.0%.
We Stendal and itsStendal’s noncontrolling shareholder are parties to a shareholders’ agreement dated August 26, 2002, as amended, to govern our respective interests in Stendal. The agreement contains terms and conditions customary for these types of agreements, including restrictions on transfers of share capital and shareholder loans other than to affiliates, rights of first refusal on share and shareholder loan transfers, pre-emptive rights and piggyback rights on dispositions of our interest. The shareholders are not obligated to fund any further equity capital contributions to the project. The shareholders’ agreement provides that Stendal’s managing directors are appointed by holders of a simple majority of its share capital. Further, shareholder decisions, other than those mandated by law or for the provision of financial assistance to a shareholder, are determined by a simple majority of Stendal’s share capital.
In December 2013, our Stendal mill completed a $49.3 million project, referred to as “Project Blue Mill”, which was designed to increase production and efficiency through debottlenecking initiatives including the installation of an additional 46 MW steam turbine at our Stendal mill. The debottlenecking which, among other things, required a new turbine in order to enhance and efficiently utilize steam production is designed to increase the mill’s annual pulp production capacity by 30,000 ADMTs. The new turbine is also expected to initially produce an additional 109,000 MWh of surplus renewable energy for sale at premium pricing.
A significant portion of the capital investments at our German mills, including the construction of the Stendal mill, were financed through government grants. Since 1999,1998, our German mills have benefited from an aggregate €384.7approximately $464.1 million in government grants. These grants reduce the cost basis of the assets purchased when the grants are received and are not reported in our income.
In February 2005, we acquired the Celgar mill for $210.0 million of which $170.0 million was paid in cash and $40.0 million was paid in our shares, plus $16.0 million for the defined working capital of the mill. The Celgar mill was completely rebuilt in the early 1990s through a C$850.0 million modernization and expansion project, which transformed it into a modern and competitive producer.
6
In 2007,Since its acquisition, we completed a C$28.0 millionhave effected several capital project which improved efficienciesprojects and reliability and, with other measures, increasedinitiatives at the Celgar mill’smill to increase its annual pulp production capacity to 500,000 ADMTs. In 2008, we commenced520,000 ADMTs and its production of “green” energy. This includes a capital project, referred to as the Celgar“Celgar Energy Project to increaseProject”, which was completed in September 2010 and increased the Celgar mill’s production of “green” energy and optimizeoptimized its power generation capacity. We completed the project at the end of September 2010capacity, at an aggregate cost of approximately C$64.9$60.6 million, of which approximately C$48.0$44.6 million was financed by grants from the Canadian federal government. See “— Capital Expenditures”. We have also increased the Celgar mill’s overall annual pulp production capacity to approximately 520,000 ADMTs through increased efficiencies.
Our Competitive Strengths
Our competitive strengths include the following:
| | |
| | • | | Modern and Competitive Mills.We operate three large, modern, competitive NBSK pulp mills that produce high qualityhigh-quality NBSK pulp, which is a premium grade of kraft pulp. We believe the relative age, production capacity and operating featureselectrical generation capacity of our mills provide us with certain manufacturing cost and other advantages over many of our competitors including lower maintenance capital expenditures.competitors. |
|
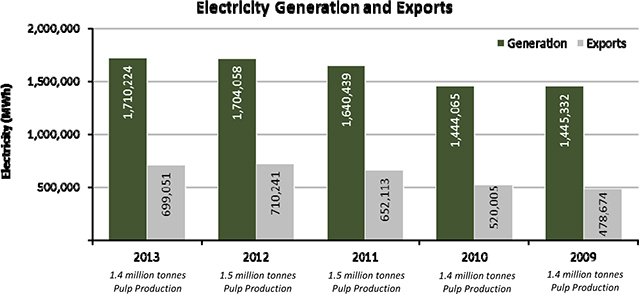
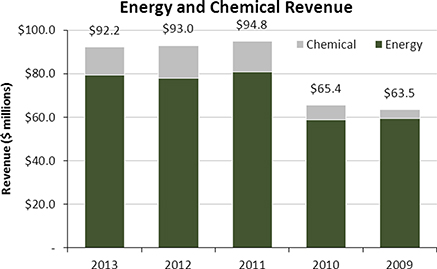
| | • | | Stable and Growing Income from Surplus Renewable Energy and Chemical Sales.Our modern mills generate electricity and steam in their boilers which is surplus to their operating requirements. Such energy is primarily produced from wood residuals which are a renewable carbon neutral source. All of our mills also generate and sell surplus energy to regional utilities. Our German mills benefit from special tariffs under Germany’sRenewable Energy Sources Act, referred to as the “Renewable Energy Act”, which provides for premium pricing. Our Celgar mill is party to a fixed electricity purchase agreement, referred to as the “Electricity Purchase Agreement”, with the regional public utility provider, for the sale of surplus power that runs until 2020. Our Stendal mill also produces tall oil as a chemical by-product which is sold to third parties. In 2013, our mills produced approximately 699,051 MWh of surplus renewable energy and generated approximately $92.2 million in revenues from energy and chemical sales. These sales provide us with a stable income unrelated to cyclical changes in pulp prices. In 2014, we expect our revenues from this source to increase as we completed the Blue Mill Project at our Stendal mill in December 2013, which is designed to produce an annual incremental 109,000 MWh of surplus energy. Additionally, in 2014, our Rosenthal mill is implementing a capital project to also produce and sell tall oil. We believe our generation and sale of surplus renewable “green” energy and chemicals provides us with a competitive energy advantage over less efficient mills. |
| • | | Leading Market Position. Mercer isWe are among the largest publicly traded NBSK market pulp producerproducers in the world, which provides us increased presence and better industry information in the markets in which we operate and provides for closestrong customer relationships with many large pulp consumers. |
|
| | • | Renewable Surplus Energy. Our modern mills generate electricity and steam in their boilers and are generally energy self-sufficient. Such energy is primarily produced from wood residuals which are a renewable carbon neutral source. All of our mills also generate surplus energy which we sell to third parties. Our Rosenthal and Stendal mills benefit from special tariffs under Germany’sRenewable Energy Resources Act, referred to as the “Renewable Energy Act” which provides for premium pricing and has materially increased their revenues from sales of surplus power. Additionally, our Celgar mill completed the Celgar Energy Project at the end of September 2010 and is party to an electricity purchase agreement, referred to as the “Electricity Purchase Agreement” with the British Columbia Hydro and Power Authority, or “B.C. Hydro”, British Columbia’s primary public utility provider, for the sale of surplus power for ten years. The Celgar Energy Project is expected to increase our consolidated total sales of surplus power by 238,000 MWh per annum to over 700,000 MWh per annum. We believe our generation and sale of surplus renewable “green” energy provides us with a competitive energy advantage over less efficient mills. |
|
| • | Strategic Locations and Customer Service.We are the only significant producer of market pulp in Germany, which is the largest pulp import market in Europe. Due to the proximity of our German mills to most of our European customers, we benefit from lower transportation costs relative to our major competitors. Our Celgar mill, located in Western Canada, is well situated to serve Asian and North American customers. We primarily work directly with customers to capitalize on our geographic diversity, coordinate sales and enhance customer relationships. We believe our ability to deliver high qualityhigh-quality pulp on a timely basis and our customer service makesmake us a preferred supplier for many customers. |
|
| | • | | Advantageous Capital Investments and Financing.Our German mills are eligible to receive government grants in respect of qualifying capital investments. Over the last eleven16 years, our German mills have benefited from approximately €384.7$464.1 million of such government grants. In addition, in October 2009, our Celgar mill qualified to receive C$57.7received approximately $55.6 million of creditsgrants under the Canadian government’s Pulp and Paper Green Transformation Program referred to asfund the “GTP”. TheseCelgar Energy Project and other smaller projects. All such grants reduce the cost basis of the assets purchased when the grants are received and are not reported in our income. Additionally, during the last eleventen years, capital investments at our German mills have reduced the amount of overall wastewater fees that would otherwise be payable by over €55.8$71.3 million. Further, our Stendal mill benefits from German governmental guarantees of its project financing, which permitted it to obtain better credit terms and lower interest costs than would otherwise have been available. TheStendal’s project debt, of Stendal which matures in 2017, currently bears interest at a substantially fixed rate of 5.28% per annum plus an applicable margin and is non-recourse to our other operations and Mercer Inc. |
7
| | |
| | • | | Proximity of Abundant Fiber Supply.Although fiber is cyclical in both price and supply, there is a significant amount of high-quality fiber within a close radius of each of our mills. This fiber supply, combined with our purchasing power and our current ability to meaningfully switch between whole logs chipped at our mills and sawmill residual chips, enables us to enter into contracts and arrangements which have generally provided us with a competitivesufficient fiber supply. |
|
| | • | | Experienced Management Team. Our directors and senior managers have extensive experience in the pulp and forestry industries. In particular, our Chief Executive Officer has over 16 years experience in the pulp industry and has guided the Company’s operations and development over that time. Our Chief Operating Officer and Chief Financial Officer each has over 30 years of industry experience. We also have experienced managers at all of our mills. Our management has a proven track record of implementing new initiatives and programscapital projects in order to reduce costs throughout our operations as well as identifying and harnessing new revenue opportunities. |
Corporate Strategy
Our corporate strategy is to create shareholder value by focusing on the expansion of our asset and earnings base.base through organic growth and acquisitions, primarily in Europe and North America. We pursue organic growth through active management and targeted capital expenditures to generate a high return by increasing pulp, energy and chemical production, reducing costs and improving efficiency. We are also conducting research to develop innovative new products based on other derivatives of the kraft pulping process. We seek to acquire interests in companies and assets in the pulp industry and related businesses where we can leverage our experience and expertise in adding value through a focused management approach. Key features of our strategy include:
| | |
| | • | | Focus on NBSK Market Pulp.Targeted Capital Expenditures.We focus on NBSK pulp because it is a premium grade kraft pulp and generally obtains the highest price relative to other kraft pulps. Although demand is cyclical, between 1998 and 2008, worldwide demand for softwood kraft market pulp grew at an average of approximately 2.3% per annum. We focus on servicing customers that produce high quality printing and writing paper grades and tissue producers. This allows us to benefit from our stable relationships with paper and tissue manufacturers in Europe and Asia as well as participate in strong growth markets such as China where we also have strong customer relationships. |
|
| • | Maximizing Renewable Energy Realizations. In 2010 and 2009, our mills generated 520,005 MWh and 478,674 MWh, respectively, of surplus energy, primarily from a renewable carbon-neutral source. We are developing other initiatives to increase our overall energy generation and the amount of and price for our surplus power sales. We completed the Celgar Energy Project at the end of September 2010. Based upon the current production levels of our mills and after giving effect to the planned generation from the Celgar Energy Project, we expect to generate and sell between 700,000 MWh and 750,000 MWh of surplus renewable energy per annum. We expect energy generation and sales to continue to be a key focus for our mills for the foreseeable future. |
|
| • | Enhancing Long-Term Sustainability/Growth. In connection with the global slowdown that commenced in 2008, we shifted our short-term focus to enhancing the long-term sustainability of our business. To this end, we have extended the maturity of senior debt and reduced our overall debt levels in order to maximize our long-term liquidity position. Although pulp prices improved significantly in 2010, we intend to continue our focus on cost reduction initiatives while strategically evaluating and pursuing internal, high return capital projects and growth opportunities in order to enhance cash flows and maximize shareholder value. |
|
| • | Operating and Maximizing Returns from our Modern, World-Class Mills. In order to keep our operating costs as low as possible, with a goal of generating positive cash flow in all market conditions, we operate three large modern pulp mills. Wemills as we believe these production facilities provide us with the best platform to be an efficient and competitive producer of high-quality NBSK pulp without the need for significant sustaining capital. Our modern mills are also generally net exporters of renewable energy. We are constantly reviewing opportunitiesseek to enhancemake targeted capital expenditures that increase the production and maximize the usageoperational efficiency of the strengthsmills, reduce costs and improve product quality. Over the last five years, we have invested approximately $200.0 million (including $73.0 million in associated government grants) in growth capital expenditures for capacity expansions and operational efficiencies. |
| • | | Increasing Stable Revenues from Renewable Energy and Chemical Sales.We focus on the generation and sales of surplus renewable energy and chemicals and, because there are minimal associated incremental costs, such sales are highly profitable and they provide us with a stable income source unrelated to cyclical changes in pulp prices. In 2013, our mills sold 699,051 MWh of surplus electricity resulting in revenues of approximately $79.4 million, compared to 710,241 MWh and approximately $78.0 million in revenues in 2012. In December 2013, our Stendal mill completed Project Blue Mill to increase production and efficiency through debottlenecking initiatives and the installation of a 46 MW steam turbine at the mill. The new turbine is expected to initially produce an additional 109,000 MWh of surplus electricity annually. Our Rosenthal mill is implementing a capital project in 2014 to produce and sell tall oil. Based upon the current production levels of our mills, including through increasedwe expect to sell in excess of 840,000 MWh of surplus renewable energy in 2014. We continually explore and pursue initiatives to enhance our energy and chemical generation production ofand sales in order to reduce volatility and increase our revenues from a stable source. |
| • | | Focus on NBSK Market Pulp.We produce NBSK pulp because it is a premium grades ofgrade kraft pulp and other improvements, to capturegenerally obtains the highest returns available.price relative to other kraft pulps. Although demand is cyclical, between 2004 and 2013 overall worldwide demand for bleached softwood kraft market pulp grew at an average of approximately 2% per annum. We focus on customers that produce tissue, specialty papers and high-quality printing and writing paper grades. We believe the growth in demand from tissue and specialty paper customers, which utilize a significant proportion of NBSK pulp, has more than offset the secular decline in demand from printing and writing paper customers. This allows us to benefit from our long-term relationships with tissue and paper manufacturers in Europe and participate in strong growth markets in emerging countries such as China where there has been strong growth in tissue demand. |
8
| • | | Achieving Operational Excellence.Operating our mills reliably and at a competitive cost is important for our financial performance. In addition to our capital expenditure program, we continuously strive to develop maintenance systems and procedures that will improve the throughput of our products by increasing the reliability of our manufacturing processes. We also seek to reduce operating costs by better managing certain operating activities such as fiber procurement, sales, marketing and logistics activities. We believe that our continued focus on operational excellence should allow us to achieve improved profitability and cash flows. |
| • | | Strategic Opportunities.We believe there will be continuing change and consolidation in the pulp and paper industry as industry participants continually seek to lower costs, refocus their product lines and react to ever changing global market conditions. We take an opportunistic approach to opportunities that can expand our earnings or grow our business. |
The Pulp Industry
Pulp is used in the production of paper, tissues and paper-related products. Pulp is generally classified according to fiber type, the process used in its production and the degree to which it is bleached. Kraft pulp, a type of chemical pulp, is produced through a sulphate chemical process in which lignin, the component of wood which binds individual fibers, is dissolved in a chemical reaction. Chemically prepared pulp allows the wood’s fiber to retain its length and flexibility, resulting in stronger paper products. Kraft pulp can be bleached to increase its brightness. Kraft pulp is noted for its strength, brightness and absorption properties and is used to produce a variety of products, including lightweight publication grades of paper, tissues and other paper-related products.
The selling price of kraft pulp depends in part on the fiber used in the production process. There are two primary speciesmain types of wood used as fiber:bleached kraft pulp, being softwood kraft made from coniferous trees and hardwood.hardwood kraft made from deciduous trees. Softwood species generally have long, flexible fibers which add strength to paper while fibers from species of hardwood contain shorter fibers which lend bulk and opacity. Generally, list prices for softwood pulp are higher than list prices for hardwood pulp. Most uses of market kraft pulp, including fine printing papers, coated
We produce and uncoated magazine papers and various tissue products, utilize a mix of softwood and hardwood grades to optimize production and product qualities. In recent years, production of hardwood pulp, based on fast growing plantation fiber primarily from Asia and South America, has increased much more rapidly than that of softwood grades that have longer growth cycles. As a result of the growth in supply and lower costs, kraft pulp customers have substituted some of the pulp content in their products to hardwood pulp. Counteracting customers’ increased proportionate usage of hardwood pulp has been the requirement for strength characteristics in finished goods. Paper and tissue makers focus on higher machine speeds and lower basis weights for publishing papers which also require the strength characteristics of softwood pulp. We believe that the ability of kraft pulp users to continue to further substitute hardwood for softwood pulp is limited by such requirements.
sell NBSK pulp, which is a bleached kraft pulp manufactured using species of northern softwood and is considered a premium grade because of its strength. It generally obtains the highest price relative to other kraft pulps. Southern bleached softwood kraft pulp is kraft pulp manufactured using southern softwood species and does not possess the strength found in NBSK pulp. NBSK pulp is the sole pulp product of our mills.
Most paper users of market kraft pulp use a mix of softwood and hardwood grades to optimize production and product qualities. In 2013, market kraft pulp consumption was approximately 52% hardwood bleached kraft, 44% softwood bleached kraft and the remainder comprised of unbleached pulp. Over the last several years, production of hardwood pulp, based on fast growing plantation fiber primarily from Asia and South America, has increased much more rapidly than that of softwood grades that have longer growth cycles. Hardwood kraft generally has a cost advantage over softwood kraft as a result of lower fiber costs, higher wood yields and, for newer hardwood mills, economies of scale. As a result of this growth in supply and lower costs, kraft pulp customers have substituted some of the pulp content in their products to hardwood pulp.
Counteracting customers’ ability to substitute lower priced hardwood pulp for NBSK pulp is the requirement for strength and formation characteristics in finished goods. Paper and tissue makers focus on larger paper machines with higher speeds and lower basis weights for certain papers which require the strength characteristics of softwood pulp. Additionally, where paper products are lightweight or specialized, like direct mail, magazine paper or premium tissue, or where strength or absorbency are important, softwood kraft forms a significant proportion of the fiber used. As a result, we believe that the ability of kraft pulp users to further substitute hardwood for softwood pulp is limited by such requirements.
Kraft pulp can be made in different grades, with varying technical specifications, for different end uses. High-quality kraft pulp is valued for its reinforcing role in mechanical printing papers, while other grades of kraft pulp are used to produce lower priced grades of paper, including tissues and paper-related products.
We believe that over 125130 million ADMTs of kraftchemical pulp are converted annually into tissues, printing and writing papers, tissues, carton boards and other whitespecialty grades of paper and paperboard around the world. We also believe that approximatelyover one third of this pulp is sold on the open market as market pulp, while the remainder is produced for internal purposes by integrated paper and paperboard manufacturers.
Demand for kraft pulp is cyclical in nature and is generally related to global and regional levels of economic activity. In 2008, overall global demand for all kraft pulp types, including softwood, was negatively impacted by the weak global economic conditions and global financial and credit turmoil the world began to experience in the second half of that year and which continued into the first half of 2009. Significant producer shutdowns and curtailments, along with strong demand from China, resulted in an improved supply-demand balance and improved prices in the second half of 2009 through 2010.
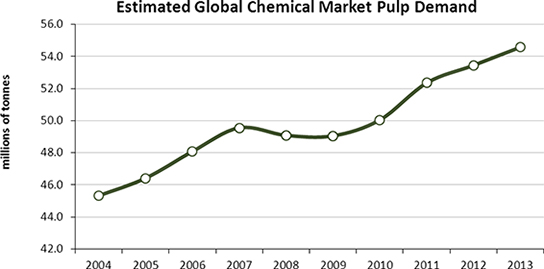
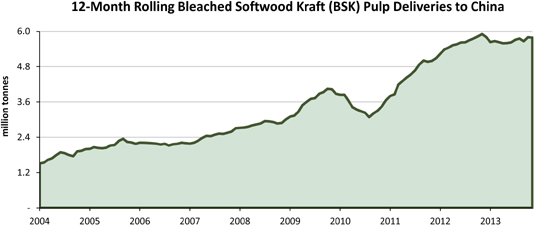
Although global pulp markets continued to strengthen in the first half of 2011, mainly driven by demand from Asia, economic uncertainty in Europe and credit tightening in China resulted in a decrease in demand and weaker pulp prices in the fourth quarter of 2011. In 2012, there was continued economic uncertainty in Europe and credit tightening in China in the first half of the year. Further, in the latter part of 2012, weak demand for paper in Europe resulted in some integrated producers curtailing their paper production and selling their pulp on the market, primarily in China. These factors negatively impacted demand and supply of pulp and resulted in generally weak pulp prices. In 2013, demand from China was stable throughout the year and supply was slightly under-balanced, which resulted in higher prices in 2013.Between 19982004 and 20082013, worldwide demand for softwoodchemical market pulp grew at an average rate of approximately 2.3%2% annually. DemandThe following chart illustrates the global demand for softwoodchemical market pulp was negatively impacted by weak global economic conditionsfor the periods indicated:
Two key macro-economic trends in 2009. However,worldwide NBSK pulp demand over the supply/last several years have been:
a significant increase in demand balance for softwood market pulp improvedfrom emerging markets, and in 2010, primarily due to strongparticular China, which has more than offset a decline in demand in China, the residual effectsmature markets of Europe, North America and Japan; and
partly related to the Chilean earthquake that affected millsforegoing, there has been a significant shift in that regiondemand by end use, as demand from tissue and specialty producers has increased markedly and offset the net closure of approximately 3.4 million tonnes of production capacity globally. secular decline in demand for printing and writing paper resulting from the rapid growth in digital media.
Since 2007, demand for chemical softwood market pulp has grown in the emerging markets of Asia, Eastern Europe and Latin America. China in particular has experienced substantial growth and its demand forimports of softwood market pulp grew by approximately 13.6%13% per annum between 2004 and 2009.2013. We believe the emerging markets now account for approximately 50% of total world demand. China now accounts for approximately 22%28% of global bleached softwood kraft market
9
pulp demand, compared to only 12% in 2004. Western Europe currently accounts for approximately 28%27% of global bleached softwood kraft market pulp demand.
demand, compared to approximately 38% in 2004. We believe the demand in the mature markets of Europe, North America and Japan in 2013 will have declined by approximately 2.5 million ADMTs from its peak in 2005.The following chart sets forth industry-wide bleached softwood kraft delivery levels to China for the periods indicated:
Growth in NBSK pulp demand in China and other emerging markets has, to a large extent, been driven by increased demand from tissue producers, as a result of economic growth and rising income levels and living standards in such markets. These factors generally contribute to a greater demand for personal hygiene products in such regions. In China alone, tissue producers have publicly announced plans to add a total of 132 tissue paper machines at various sites by the end of 2015 to increase their annual tissue capacity by approximately 4.9 million ADMTs. At this time there can be no assurance as to when and how much of such capacity expansion will be implemented.
This has also led to an overall shift in demand for NBSK pulp, as demand from tissue producers has increased, while demand from printing and writing end uses has decreased. Between 2004 and 2012 (the last year for which information is currently available), NBSK pulp demand for tissue production increased by approximately 106%.
The following chart compares NBSK pulp demand by end use in each of 2003 and 2012 (the latest year for which figures are currently available).
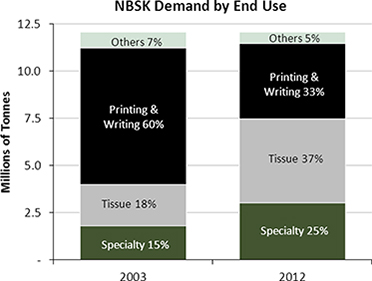
We believe 2013 NBSK demand by end use was generally consistent with the trend in the chart above.
A measure of demand for kraft pulp is the ratio obtained by dividing the worldwide demand of kraft pulp by the worldwide capacity for the production of kraft pulp, or the “demand/capacity ratio”. An increase in this ratio generally occurs when there is an increase in global and regional levels of economic activity. An increase in this ratio also generally indicates greater demand as consumption increases, which often results in rising kraft pulp prices and a reduction of inventories by producers and buyers. As prices continue to rise, producers continue to run at higher operating rates. However, an adverse change in global and regional levels of economic activity generally negatively affects demand for kraft pulp, often leading buyers to reduce their purchases and relyingrely on existing pulp inventories. As a result, producers run at lower operating rates by taking downtime to limit thebuild-up of their own inventories. The demand/capacity ratio for softwood kraft pulp was approximately 93%94%, 94% and 92% in 2010, approximately 91% in 20092013, 2012 and approximately 89% in 2008.
2011, respectively.A significant factor affecting our market is the amount of closures of old, high-cost capacity. InOver the four-year period from 2006 to 2009, we estimate approximately 5.3 million tonnes of predominantly NBSK capacity waslast several years, mills in North America, Finland and Sweden were permanently or indefinitely closed. In connection with the recent recovery of pulp prices, approximately 1.9 million tonnesAlthough some capacity was restarted in late 2009 and 2010. The2010 in response to very high NBSK pulp prices, we believe the overall net effect reduced NBSK pulp supply and positively impacted markets. Between 2011 and 2013, we believe approximately 1.5 million ADMTs of thesepulp capacity was idled or shut down through mill closures or curtailments. Further, in efforts to improve environmental and restartssafety standards, China has publicly stated that it will be reducing existing pulp and paper capacity in the near term by closing “old” mills, targeting a removal of 7.4 million ADMTs by the end of 2013. At this time, there can be no certainty as to the actual amount and timing of any such closures.
During the course of 2014, the supply of hardwood bleached kraft pulp production is an estimated 3.4projected to increase by approximately 2.1 million tonnesADMTs, primarily from South America. This increase in hardwood chemical production is, in large part, targeted at the growing demand for pulp by tissue makers, particularly in China. As a result of capacity removed from the market. generally lower prices for hardwood bleached pulp, this increase in supply could put downward pressure on NBSK pulp prices.
We are aware of only one plannednew NBSK mill in Russia which started up in 2013. The new mill provided a net incremental increase in annual pulp production capacity of approximately 490,000 ADMTs. Other than the foregoing, we are unaware of any new material NBSK pulp capacity that has been announced. However, certain integrated pulp and paper producers have the ability to discontinue paper production by idling their paper machines and selling their NBSK pulp production on the market, if market conditions, prices and trends warrant such actions. We believe that the absence of other plant expansion worldwide in the next few years, which we believeexpansions is due in part to fiber supply constraints and high capital costs.
CompetitionNBSK Pulp Pricing
Pulp prices are highly cyclical. In general, kraft pulp is a globally traded commodity. Pricing and demand are influenced by the balance between supply and demand, as affected by global macroeconomic conditions, changes in consumption and capacity, the level of customer and producer inventories and fluctuations in exchange rates. As Northern Europe has historically been the world’s largest market and NBSK is the premium grade, the European NBSK market price is generally used as a benchmark price by the industry.
The average European list prices for NBSK pulp since 2000 have fluctuated between a low of approximately $447 per ADMT in 2002 to a high of $1,030 per ADMT in 2011.
The following chart sets out the changes in list prices for NBSK pulp in Europe, as stated in U.S. dollars, Canadian dollars and Euros for the periods indicated:
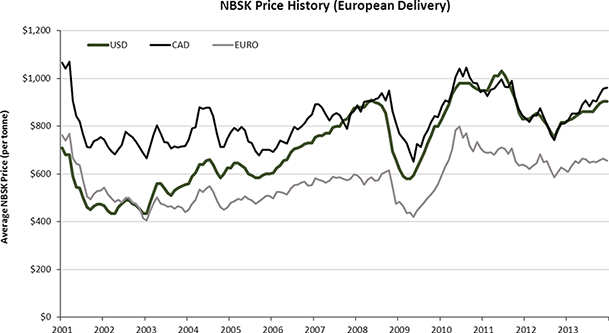
In 2006, pulp prices increased steadily from approximately $600 per ADMT in Europe to $870 per ADMT at the end of 2007. These price increases resulted from increased demand and the closure of several pulp mills, particularly in North America, which reduced NBSK capacity. In the second half of 2008, list prices for NBSK pulp decreased markedly due to weak global economic conditions. As a result, list prices for NBSK pulp in Europe decreased from $900 per ADMT in mid-2008 to $635 per ADMT at the end of the year. Such pulp price weakness continued into early 2009, though commencing in mid-2009, pulp markets began to strengthen which led to improved prices. Strong demand from China, capacity closures and historically low global inventories for bleached softwood kraft pulp helped support upward price momentum. During the second half of 2009, several price increases raised European list prices by a total of $170 per ADMT to $800 per ADMT by year end. Such price increases were partially offset by the continued weakening of the U.S. dollar versus the Euro and Canadian dollar during the period. In 2010, several increases lifted prices to record levels in the middle of the year and at the end of 2010 list prices were near historic highs of $950, $960 and $840 per ADMT in Europe, North America and China, respectively.
In 2011, pulp prices remained strong in the first half of the year, reaching record levels of $1,030 per ADMT in Europe and $1,035 and $920 per ADMT in North America and China, respectively. However, uncertainty concerning the economic situation in Europe, along with credit tightening in China in the last part of the year, caused pulp prices to drop sharply to $825 per ADMT in Europe and $890 and $670 per ADMT in North America and China, respectively, by the end of the year. Economic uncertainty in Europe and China continued to dampen demand and NBSK pulp prices, which remained generally weak in 2012. In 2012, year-end list prices were approximately $810, $870 and $655 per ADMT in Europe, North America and China, respectively. In 2013, demand from China was stable throughout the year and supply was slightly under-balanced, which resulted in higher year-end list prices of $905 per ADMT in Europe and $990 and $750 per ADMT in North America and China, respectively.
A producer’s net sales realizations are list prices, net of customer discounts, commissions and other selling concessions. While there are differences between NBSK list prices in Europe, North America and Asia, European prices are generally regarded as the global benchmark and pricing in other regions tends to follow European trends. The nature of the pricing structure in Asia is different in that, while quoted list prices tend to be lower than Europe, customer discounts and rebates are much lower resulting in net sales realizations that are generally similar to other markets.
The majority of market NBSK pulp is produced and sold by Canadian and Northern European producers, while the price of NBSK pulp is generally quoted in U.S. dollars. As a result, NBSK pricing is often affected by fluctuations in the currency exchange rates for the U.S. dollar versus the Canadian dollar, the Euro and local currencies. NBSK pulp price increases during 2006, 2007 and the first half of 2008 were in large part offset by the weakening of the U.S. dollar. Similarly, the strengthening of the U.S. dollar against the Canadian dollar and the Euro towards the end of 2008 helped partially offset pulp price decreases caused by the deterioration in global economic conditions. The overall strengthening of the U.S. dollar against the Euro in 2010, and in particular in the first half of 2010, improved the operating margins of our German mills. Although the U.S. dollar weakened against the Euro for most of 2011, it strengthened at the end of 2011. Overall, the U.S. dollar was 8% stronger against the Euro in 2012 compared to 2011, partially offsetting pulp price decreases in 2012. In 2013, the U.S. dollar was 3% weaker against the Euro, compared to 2012, which reduced the operating margins of our German mills.
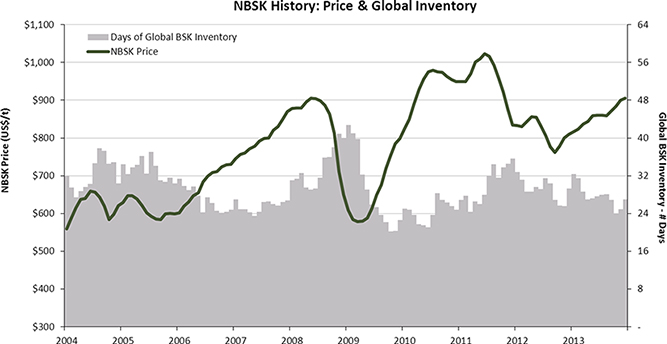
The global supply and demand balance for NBSK pulp is a key determinant in pulp pricing. Generally, we and other producers consider global NBSK pulp supply and demand to be evenly balanced when world inventory levels are at about 30 days’ supply.
The following chart sets forth changes in FOEX PIX Pulp index prices for NBSK pulp and global bleached softwood kraft inventory levels between 2004 and 2013:
Seasonality
We are exposed to fluctuations in quarterly sales volumes and expenses due to seasonal factors. These factors are common in the NBSK pulp industry. We generally have weaker pulp demand in Europe during the summer holiday months and in China in the period relating to its lunar new year. We typically have a seasonal build-up in raw material inventories in the early winter months as the mills build up their fiber supply for the winter when there is reduced availability.
Competition
Pulp markets are large and highly competitive. Producers ranging from small independent manufacturers to large integrated companies produce pulp worldwide. Our pulp and customer services compete with similar products manufactured and distributed by others. While many factors influence our competitive position, particularly in weak economic times, a key factor is price. Other factors include service, quality and convenience of location. Some of our competitors are larger than we are in certain markets and have substantially greater financial resources. These resources may afford those competitors more purchasing power, increased financial flexibility, more capital resources for expansion and improvement and enable them to compete more effectively. Our key NBSK pulp competitors are principally located in Northern Europe and Canada.
Pulp prices are highly cyclical. Global economic conditions, changes in production capacity, inventory levels, and currency exchange rates are the primary factors affecting NBSK pulp list prices. The average annual European list prices for NBSK pulp since 2000 have ranged from a low of approximately $447 per ADMT to a high of $980 per ADMT.
Starting in 2006, pulp prices increased steadily from approximately $600 per ADMT in Europe to $870 per ADMT at the end of 2007. These price increases resulted from the closure of several pulp mills, particularly in North America, which reduced NBSK capacity by approximately 1.3 million ADMTs, better demand and the general weakness of the U.S. dollar against the Euro and the Canadian dollar.
In the second half of 2008, list prices for NBSK pulp decreased markedly due to weak global economic conditions. As a result, list prices for NBSK pulp in Europe decreased from $900 per ADMT in mid-2008 to $635 per ADMT at the end of the year. Such price weakness continued into early 2009 as list prices in Europe fell to approximately $575 per ADMT. Commencing in mid-2009, pulp markets began to strengthen which led to improved prices. Strong demand from China, capacity closures and historically low global inventories for bleached softwood kraft pulp helped support upward price momentum. During the second half of 2009, several price increases raised European list prices by a total of $170 per ADMT to $800 per ADMT by year end. Such price increases were partially offset by the continued weakening of the U.S. dollar versus the Euro and Canadian dollar during the period. In December 2009, list prices for pulp were approximately $800 per ADMT in Europe, $830 per ADMT in North America and $700 per ADMT in China. In 2010, several increases lifted prices to record levels in the middle of the year and at the end of 2010 list prices were near historic highs of $950, $960 and $840 per ADMT
10
in Europe, North America and China, respectively. As pulp prices are highly cyclical, there can be no assurance that prices will not decline in the future.
A producer’s net sales realizations are list prices, net of customer discounts, commissions and other selling concessions. While there are differences between NBSK list prices in Europe, North America and Asia, European prices are generally regarded as the global benchmark and pricing in other regions tends to follow European trends. The nature of the pricing structure in Asia is different in that, while quoted list prices tend to be lower than Europe, customer discounts and commissions tend to be lower resulting in net sales realizations that are generally similar to other markets.
The majority of market NBSK pulp is produced and sold by Canadian and Scandinavian producers, while the price of NBSK pulp is generally quoted in U.S. dollars. As a result, NBSK pricing is affected by fluctuations in the currency exchange rates for the U.S. dollar versus the Canadian dollar, the Euro and local currencies. NBSK pulp price increases during 2006, 2007 and the first half of 2008 were in large part offset by the weakening of the U.S. dollar. Similarly, the strengthening of the U.S. dollar against the Canadian dollar and the Euro towards the end of 2008 helped slightly offset pulp price decreases caused by the deterioration in global economic conditions. The overall strengthening of the U.S. dollar against the Euro in 2010, and in particular in the first half of 2010, improved the operating margins of our German mills.
The following chart sets out the changes in list prices for NBSK pulp in Europe, as stated in U.S. dollars, Canadian dollars and Euros for the periods indicated.
Price Delivered to N. Europe (C$ and €equivalent indexed to 2000)
11
The Manufacturing Process
The following diagram provides a simplified description of the kraft pulp manufacturing process at our pulp mills:
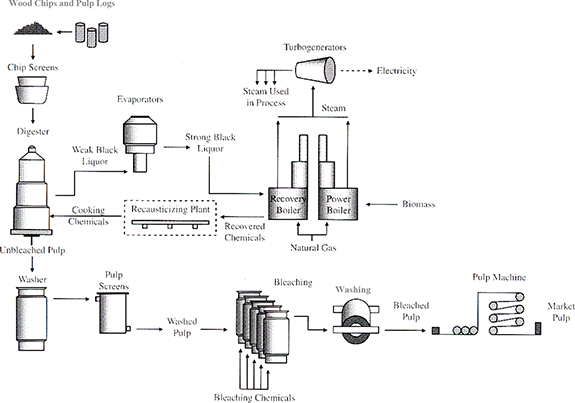
In order to transform wood chips into kraft pulp, wood chips undergo a multi-step process involving the following principal stages: chip screening, digesting, pulp washing, screening, bleaching and drying.
In the initial processing stage, wood chips are screened to remove oversized chips and sawdust and are conveyed to a pressurized digester where they are heated and cooked with chemicals. This occurs in a continuous process at the Celgar and Rosenthal mills and in a batch process at the Stendal mill. This process softens and eventually dissolves the phenolic material called lignin that binds the fibers to each other in the wood.
Cooked pulp flows out of the digester and is washed and screened to remove most of the residual spent chemicals called black liquor, and partially cooked wood chips. The pulp then undergoes a series of bleaching stages where the brightness of the pulp is gradually increased. Finally, the bleached pulp is sent to the pulp machine where it is dried to achieve a dryness level of more thanapproximately 90%. The pulp is then ready to be baled for shipment to customers.
A significant feature of kraft pulping technology is the recovery system, whereby chemicals used in the cooking process are captured and extracted for re-use, which reduces chemical costs and improves environmental performance. During the cooking stage, dissolved organic wood materials and used chemicals, collectively known as black liquor, are extracted from the digester. After undergoing an evaporation process, black liquor is burned in a recovery boiler. The chemical compounds of the black liquor are collected from the recovery boiler and are reconstituted into cooking chemicals used in the digesting stage through additional processing in the recausticizing plant.
The heat produced by the recovery boiler is used to generate high-pressure steam. Additional steam is generated by a power boiler through the combustion of biomass consisting of bark and other wood residuesresiduals from sawmills and our woodrooms and residue generated by the effluent treatment system. Additionally, during times of
12
upset, we may use natural gas to generate steam. The steam produced by the recovery and power boilers is used to power a turbine generator to generate electricity, as well as to provide heat for the digesting and pulp drying processes.
Research and Development
We, along with other pulp producers both individually and through industry associations, are conducting research and development focused on developing innovative new products that are based on derivatives of the kraft pulping process. Currently these derivatives are focused in two broad categories:
the further refinement of materials contained in black liquor, the extractive chemical and lignin containing compounds that are a result of the kraft pulping process; and
the further refinement of cellulose materials that are currently the basis of NBSK kraft pulp.
We are engaged with several research partners to participate in and develop new innovative products. To date, one of the most well-developed of these projects is a cellulose derivative generally referred to in the industry as “cellulose filaments”. Cellulose filaments are the result of a new process that unbinds the individual filaments that make up a cellulose fiber. In northern softwoods, there are approximately 1,000 filaments making up a single fiber. The filaments resulting from this patented process are long, ribbon-like structures that have unique strength characteristics similar to other chemical derivatives, such as aramids. We believe that this material may have commercial potential in many applications, including strength enhancers, solution stabilizers and specialty solutions for numerous other industries.
We are part of an industry association that has made considerable progress in developing a particular manufacturing process. We, along with other member companies, including certain other NBSK producers, have license rights to further develop and market existing intellectual property registered under patent to our industry association. Further, such association, in conjunction with one of its member companies, is constructing a pilot production facility and we have access to its product for development purposes. While there remains much research and development to be done, we are encouraged enough to continue to expend resources to develop this technology, both individually and in joint development arrangements with third parties. We estimate expenditures totaling approximately $3.0 million over the next three years.
Such research and development is still at an early stage and there has been no commercialization of the research to date. We currently estimate it may take between three and five years before we can determine if product applications can be commercialized. However, there can be no assurance that such research and development will ever result in commercialization or the production or sales of any products by us at a profit or at all.
Our Mills and Product
We manufacture and sell NBSK pulp produced from wood chipswoodchips and pulp logs.logs at our three mills.
The following table sets out our pulp production capacity and actual production by mill for the periods indicated:
| | | | | | | | | | | | | | | | |
| | | Annual
Production
Capacity(1) | | | Year Ended December 31, | |
| | | | 2013 | | | 2012 | | | 2011 | |
Pulp Production by Mill: | | | | | (ADMTs) | |
Rosenthal | | | 360,000 | | | | 361,724 | | | | 337,959 | | | | 344,389 | |
Celgar | | | 520,000 | | | | 447,935 | | | | 490,018 | | | | 488,007 | |
Stendal | | | 660,000 | | | | 634,816 | | | | 640,298 | | | | 621,281 | |
| | | | | | | | | | | | | | | | |
Total pulp production | | | 1,540,000 | | | | 1,444,475 | | | | 1,468,275 | | | | 1,453,677 | |
| | | | | | | | | | | | | | | | |
| (1) | Capacity is the rated capacity of the plants for the year ended December 31, 2013. |
Rosenthal Mill.The Rosenthal mill is situated on a 220 acre site in the town of Blankenstein in the state of Thüringia, approximately 300 kilometers south of Berlin. The Saale river flows through the site of the mill. In late 1999, we completed a major capital project which converted the Rosenthal mill to the production of kraft pulp. It is a single line mill with a current annual production capacity of approximately 360,000 ADMTs of kraft pulp. The mill is self-sufficient in steam and electrical power. Some excess electrical power which is constantly generated is sold to the regional power grid. The facilities at the mill include:
an approximately 315,000 square feet fiber storage area;
debarking and chipping facilities for pulp logs;
an approximately 300,000 square feet roundwood yard;
a fiber line, which includes a Kamyr continuous digester and bleaching facilities;
a pulp machine, which includes a dryer, a cutter and a baling line;
an approximately 63,000 square feet finished goods storage area;
a chemical recovery line, which includes a recovery boiler, evaporation plant, recausticizing plant and lime kiln;
a fresh water plant;
a wastewater treatment plant; and
a power station with a turbine capable of producing 57 MW of electric power from steam produced by the recovery boiler and a power boiler.
The kraft pulp produced at the Rosenthal mill is a long-fibered softwood pulp produced by a sulphate cooking process and manufactured primarily from wood chips and pulp logs. A number of factors beyond economic supply and demand have an impact on the market for chemical pulp, including requirements for pulp bleached without any chlorine compounds or without the use of chlorine gas. The Rosenthal mill has the capability of producing both “totally chlorine free” and “elemental chlorine free” pulp. Totally chlorine free pulp is bleached to a high brightness using oxygen, ozone and hydrogen peroxide as bleaching agents, whereas elemental chlorine free pulp is produced by substituting chlorine dioxide for chlorine gas in the bleaching process. This substitution virtually eliminates complex chloro-organic compounds from mill effluent.
Kraft pulp is valued for its reinforcing role in mechanical printing papers and is sought after by producers of paper for the publishing industry, primarily for magazines and advertising materials. Kraft pulp is also an important ingredient for tissue manufacturing, and tissue demand tends to increase with living standards in developing countries. Kraft pulp produced for reinforcement fibers is considered the highest grade of kraft pulp and generally obtains the highest price. The Rosenthal mill produces pulp for reinforcement fibers to the specifications of certain of our customers. We believe that a number of our customers consider us their supplier of choice.
Stendal Mill.The Stendal mill is situated on a 200 acre site owned by Stendal that is part of a larger 1,250 acre industrial park near the town of Stendal in the state ofSaxony-Anhalt, approximately 300 kilometers north of the Rosenthal mill and 130 kilometers west of Berlin. The mill is adjacent to the Elbe river and has access to harbor facilities for water transportation. The mill is a single line mill with a current annual design production capacity of approximately 660,000 ADMTs of kraft pulp. The Stendal mill is self-sufficient in steam and electrical power. Some excess electrical power which is constantly being generated is sold to the regional power grid. The facilities at the mill include:
an approximately 920,000 square feet fiber storage area;
debarking and chipping facilities for pulp logs;
a fiber line, which includes ten SuperBatch™ digesters and bleaching facilities;
a pulp machine, which includes a dryer, a cutter and a baling line;
an approximately 108,000 square feet finished goods storage area;
a chemical recovery line, which includes a recovery boiler, evaporation plant, recausticizing plant and lime kiln;
a fresh water plant;
a wastewater treatment plant; and
a power station with two turbines capable of producing 148 MW of electrical power since the completion of Project Blue Mill in December 2013.
The kraft pulp produced at the Stendal mill is of a slightly different grade than the pulp produced at the Rosenthal mill as the mix of softwood fiber used is slightly different. This results in a complementary product more suitable for different end uses. The Stendal mill is capable of producing both totally chlorine free and elemental chlorine free pulp.
Celgar Mill.The Celgar mill is situated on a 400 acre site near the city of Castlegar, British Columbia. The mill is located on the south bank of the Columbia River, approximately 600 kilometers east of the port city of Vancouver, British Columbia, and approximately 32 kilometers north of theCanada-U.S. border. The city of Seattle, Washington is approximately 650 kilometers southwest of Castlegar. The Celgar mill is a single line mill with a current annual production capacity of approximately 520,000 ADMTs of kraft pulp. Internal power generating capacity resulting from the completion of the Celgar Energy Project in 2010 enables the Celgar mill to be self-sufficient in electrical power and to sell surplus electricity. The facilities at the Celgar mill include:
chip storage facilities with a capacity of 250,000 cubic meters of chips;
a woodroom containing debarking and chipping equipment for pulp logs;
a fiber line, which includes a dual vessel hydraulic digester, two stage oxygen delignification and a four stage bleach plant;
two pulp machines, which each include a dryer, a cutter and a baling line;
a chemical recovery line, which includes a recovery boiler, evaporation plant, recausticizing area and wastewater treatment system; and
two turbines and generators capable of producing approximately 48 MW and 52 MW, respectively, of electric power from steam produced by the recovery boiler and a power boiler.
The Celgar mill produces high-quality kraft pulp that is made from a unique blend of slow growing/long-fiber Western Canadian tree species. It is used in the manufacture of high-quality paper and tissue products. We believe the Celgar mill’s pulp is known for its excellent product characteristics, including tensile strength, wet strength and brightness. The Celgar mill is a long-established supplier to paper and tissue producers in Asia.
Generation and Sales of “Green” Energy and Chemicals at our Mills
Climate change concerns have caused a proliferation of renewable or “green” energy legislation, incentives and commercialization in both Europe and, increasingly, in North America. This has generated an increase in demand and legislated requirements for “carbon neutral” sources of energy supply. Our pulp mills are large scale bio-refineries that, produce bothin addition to pulp, andalso produce surplus “carbon neutral” or “green” energy. As part of the pulp production process our mills generate “green” energy using carbon-neutral biofuels such as black liquor and wood waste. Through the incineration of biofuels in the recovery and power boilers, our mills produce sufficient steam to cover all of our steam requirements and generallyallow us to produce surplus energyelectricity which we sell to third party utilities.
As a result, we have benefitted from “green” energy legislation, incentives and commercialization that has developed over the last few years in Europe and Canada. In
2010addition, in recent years we have applied considerable resources to increasing our capacity to produce and
2009, we sold 520,005 MWh and 478,674 MWh ofsell bio-chemicals, primarily tall oil for use in numerous applications including bio-fuels.Our surplus energy respectively, and recorded revenues of €44.2 million and €42.5 million, respectively, from such energy sales.chemical sales provide our mills with a new stable revenue source unrelated to pulp prices. Since our energy and chemical production is a by-productare by-products of our pulp production process, there are minimal incremental costs and our surplus energy and chemical sales are
13
The following table sets out for the periods indicated the effect of these government grants on the recorded value of such assets in our
consolidatedConsolidated Balance Sheets: | | | | | | | | | | | | |
| | | As at December 31, | |
| | | 2013 | | | 2012 | | | 2011 | |
| | | (in thousands) | |
Property, plant and equipment, gross amount less amortization | | $ | 1,403,990 | | | $ | 1,431,355 | | | $ | 1,443,315 | |
Less: government grants less amortization | | | 365,359 | | | | 364,849 | | | | 378,348 | |
| | | | | | | | | | | | |
Property, plant and equipment, net (as shown on the Consolidated Balance Sheet) | | $ | 1,038,631 | | | $ | 1,066,506 | | | $ | 1,064,967 | |
| | | | | | | | | | | | |
The following table sets forth the gross amount of all government grants we have received and capitalized in our balance sheets:
| | | | | | | | | | | | | |
| | | As at December 31, | |
| | | 2010 | | | 2009 | | | 2008 | |
| | | (in thousands) | |
| |
| Properties, gross amount including government grants less amortization | | € | 1,144,759 | | | € | 1,152,288 | | | € | 1,171,891 | |
| Less: government grants less amortization | | | 297,992 | | | | 283,730 | | | | 290,187 | |
| | | | | | | | | | | | | |
| Properties, net (as shown on consolidated balance sheets) | | € | 846,767 | | | € | 868,558 | | | € | 881,704 | |
| | | | | | | | | | | | | |
sheet, the associated amortization and the resulting net balance we include in our property, plant and equipment for the periods indicated: | | | | | | | | | | | | |
| | | As at December 31, | |
| | | 2013 | | | 2012 | | | 2011 | |
| | | (in thousands) | |
Government grants—gross | | $ | 600,158 | | | $ | 569,039 | | | $ | 557,726 | |
Less: Accumulated amortization | | | 234,799 | | | | 204,190 | | | | 179,378 | |
| | | | | | | | | | | | |
Government grants less accumulated amortization | | $ | 365,359 | | | $ | 364,849 | | | $ | 378,348 | |
| | | | | | | | | | | | |
Qualifying capital investments at industrial facilities in Germany that reduce effluent discharges offset wastewater fees that would otherwise be required to be paid. For more information about our environmental capital expenditures, see “—“– Environmental”.
TotalIn 2013, capital expenditures at the Celgar mill included maintenance projects, while in 2010, 2009 and 2008 were €30.6 million, €17.8 million and €12.1 million, respectively.2012 such expenditures included a project to recover/recycle chemicals from the mill’s effluent, referred to as the “GAP Project”. In 2010,2011, capital expenditures related primarily to the Celgar Energy Project. We implemented the Celgar Energy Project as part of our continued focus on energy production and sales and to increase the mill’s production of “green” energy and optimize its power generation capacity. The project was designed as a high return capital project at a cost of approximately C$64.9 million (€48.7 million). It included the installation of a second turbine generator with a design capacity of 48 MW.
In October 2009, as part of the GTP, the Canadian government through NRCan agreed to provide approximately C$57.7 million in credits towards the capital costs associated with the Celgar mill includingrelated to a project to improve the Celgar Energy Project. Such credits reduced the cost basis of the assets purchased and were not recorded in our income. The majority of the remaining credits not used for the Celgar Energy Project will be available for use by the Celgar mill on other qualifying projects until March 31, 2012. To be eligible for GTP credits, projects must meet certain energy efficiency or environmental improvement requirements. Specifically, we have applied to NRCan to utilize approximately C$9.7 million of our allocated GTP funding towards improving ourmill’s fiber line and oxygen delignification process at our Celgar mill. Once completed, we believe that this project, referred to as the “Oxygen Delignification Project”, should generate a high return for the mill while reducing Celgar’s chemical and energy costs through decreased consumption.
The Celgar Energy Project increased the mill’s installed generating capacity to 100 MW, and upgraded the mill’s bark boiler and steam facilities. process.In January 2009,2014, we commenced the Celgar mill finalizedimplementation of a new Enterprise Resource Planning, or “ERP”, solution to replace our existing business software applications at an estimated cost of $12.0 million. The project is designed to be completed in stages over the Electricity Purchase Agreement undernext three years. After considerable due diligence, we selected SAP, a global leader in the development of ERP solutions for medium to large sized international businesses.
The ERP installation will replace a suite of existing legacy systems which, itwhile functional, will sell electrical energy generated bybegin becoming obsolete in the Celgar Energy Projectnear future. The ERP solution introduces state of the art end to B.C. Hydro.
end business solutions that will provide automation for most aspects of our business including finance, payroll, inventory management, sales, fiber management, supply chain, business analytics and forecasting.To assist us through the implementation, we have engaged third party advisors with extensive experience in ERP implementations using contemporary systems implementation methodologies that will address not only the technical complexities of such an implementation but also assist with maintaining internal controls over financial reporting.
Excluding costs for projects financed through government grants, under the GTP, capital expenditures for all of our mills in 20112014 are expected to be approximately €24.1$40.0 million, comprised of principally of:
a tall oil plant, chip receiving project, wastewater reduction project and maintenance projects at the Rosenthal mill, aggregating approximately $16.0 million;
wastewater reduction projects at the Stendal mill and maintenance projects, aggregating approximately $8.6 million;
a chip screening project and maintenance projects at the Celgar mill, aggregating approximately $9.5 million; and
an array of small projects.ERP software implementation across the entire company, aggregating approximately $5.9 million.
Environmental
Our operations are subject to a wide range of environmental laws and regulations, dealing primarily with water, air and land pollution control. We devote significant management and financial resources to comply with all applicable environmental laws and regulations. Our total capital expenditures on environmental projects at our mills were approximately €2.5$1.9 million in 2010 (€9.52013, as compared to approximately $12.0 million in 2009). The Oxygen Delignification Project is intended2012 related primarily to generatethe Rosenthal mill’s recovery boiler upgrade. In 2014, capital expenditures for environmental improvements by reducing organic loading on the effluent treatment system.
projects are expected to be approximately $8.0 million.We believe we have obtained all required environmental permits, authorizations and approvals for our operations. We believe our operations are currently in substantialmaterial compliance with the requirements of all applicable environmental laws and regulations and our respective operating permits.
Under German state environmental rules relating to effluent discharges, industrial users are required to pay wastewater fees based upon the amount of their effluent discharge. These rules also provide that an industrial user which undertakes environmental capital expenditures and lowers certain effluent discharges to prescribed levels may offset the amount of these expenditures against the wastewater fees that they would otherwise be required to pay. We estimate that the aggregate amount of wastewater fees we saved in 20102013 as a result of environmental capital
20
expenditures and initiatives to reduce allowable emissions and discharges at our Stendal andmill was approximately $1.8 million. The estimated amount of accrued wastewater fees we expect to recover at our Rosenthal mills weremill is approximately €6.4$3.0 million. We expect that capitalCapital investment programs and other environmental initiatives at our German mills will mostly offset the wastewater fees that may bewere payable for 2010, 2011 and 20122013 and we believe they will ensure that our operations continue in substantial compliance with prescribed standards.
Environmental compliance is a priority for our operations. To ensure compliance with environmental laws and regulations, we regularly monitor emissions at our mills and periodically perform environmental audits of operational sites and procedures both with our internal personnel and outside consultants. These audits identify opportunities for improvement and allow us to take proactive measures at the mills as considered appropriate.
The Rosenthal mill has a relatively modern biological wastewater treatment and oxygen bleaching facility. We have significantly reduced our levels of absorbable organic halogen discharge at the Rosenthal mill and we believe the Rosenthal mill’s absorbable organic halogen and chemical oxygen demand discharges are in compliance with the standards currently mandated by the German government.
The Stendal mill, which commenced operations in September 2004, has been in substantial compliance with applicable environmental laws, regulations and permits. Management believes that, as the Stendal mill is astate-of-the-art facility, it will be able to continue to operate in compliance with the applicable environmental requirements.
The Celgar mill has been in substantial compliance with applicable environmental laws, regulations and permits.
In November 2008, the Celgar mill suffered a spill of diluted weak black liquor into the nearby Columbia River. The spill was promptly reported by the mill to authorities and remediated. An environmental impact report prepared by independent consultants engaged by the mill concluded that the environmental impact of the spill was minimal. The spill was also investigated by federal and provincial environmental authorities and, in January 2009, the Celgar mill received a government directive requiring it to take a number of measures relating to the retention capacity of spill ponds. These measures have now been completed to the satisfaction of the overseeing environmental authorities. However, in September 2009, the Celgar mill received a summons in connection with this spill for charges under the CanadianFisheries Actand the British ColumbiaEnvironmental Management Act, primarily relating to alleged effluent exceedances under the Celgar mill’s discharge permit. See “Legal Proceedings”.
The Celgar mill operates two landfills, a newly commissioned site andone of which is an older site.site that the mill is in the process of decommissioning. The Celgar mill intends to decommission the old landfill and is developingcontinuing work on finalizing a closure plan for such site and then reviewing such plan with the CanadianBritish Columbia Ministry of Environment, or “MOE”. However, the MOE, in conjunction with the provincial pulp and paper industry, is in the process of developing a standard for landfill closures. In addition, the portion of the landfill owned by an adjacent sawmill continuesWe expect to be active. Accordingly, the mill has not been able to move forward with the closure. We currently believe we may receive regulatory approval for suchfinalize our closure plan for the older landfill in 2011 and commence2014. The actual closure activities based onshall be effected pursuant to a timetable agreed to by both Celgarthe mill and the MOE. We currently estimate theThe cost of closing the landfill atis expected to be approximately €2.1 million but, since the closure program for the old landfill has not been finalized or approved, there can be no assurance that the decommissioning of the old landfill will not exceed such cost estimate.
$3.0 million.Future regulations or permits may place lower limits on allowable types of emissions, including air, water, waste and hazardous materials, and may increase the financial consequences of maintaining compliance with environmental laws and regulations or conducting remediation. Our ongoing monitoring and policies have enabled us to develop and implement effective measures to maintain emissions in substantial compliance with environmental laws and regulations to date in a cost-effective manner. However, there can be no assurances that this will be the case in the future.
Climate Change
Currently,As there are numerous differing scientific studies and opinions relating to the severity, extent and speed at which climate change is or may be occurring, around the world. As a result, we are currently unable tocannot identify and predict all of the specific consequences of climate change on our business and operations.
21
To date, the potentialand/oreffects and perceived effects of climate change and social and governmental responses to it have created both business opportunities and the potential for negative consequences for our business.
The focus on climate change has generated a substantial increase in demand and in legislative requirements for “carbon neutral” or “green” energy in both Europe and, increasingly, in North America. Pulp mills consume wood residue,residuals, being wood chips and pulp logs, as the base raw material for itstheir production process. Wood chips are residueresiduals left over from lumber production and pulp logs are generally lower quality logs left over from logging that are unsuitable for the production of lumber.
As part of their production process, our mills take wood residueresiduals and process itthem through a digester where cellulose is separated from the wood to be used in pulp production and the remaining residue,residuals, called “black liquor”, is used for green energy production. As a result of their use of wood residueresiduals and because our mills generate combined heat and power in a process known as cogeneration, they are efficient producers of energy. This energy is carbon neutral and produced from a renewable source. Our relatively modern mills generate a substantial amount of energy that is surplus to their operational requirements.
These factors, along with governmental initiatives in respect of renewable or green energy legislation, have provided business opportunities for us to enhance our generation and sales of green energy and to participate in the saleregional utilities. In December 2013, we completed Project Blue Mill, a project at our Stendal mill to install a new 46 MW steam turbine which we expect will initially produce an additional 109,000 MWh of emission allowances under the EU ETS.
Currently, wesurplus electricity annually.We are constantly exploring other initiatives to enhance our generation and sales of surplus green energy.energy and chemical by-products. Other potential opportunities that may result from climate change include:
the expansion of softwood forests and increased growth rates for such forests;
more intensive forestry practices and timber salvaging versus harvesting standing timber;
| | |
| • | increased growth rates for northern softwood forests due to greater atmospheric CO2 levels; |
|
| • | the expansion of softwood forests into less developed tundra areas; |
|
| • | more intensive forestry practices and timber salvaging versus harvesting standing timber; |
|
| • | greater demand for sustainable energy and cellulosic biomass fuels; and |
|
| • | governmental incentivesand/or legislative requirements to enhance biomass energy production and prices. |
greater demand for sustainable energy and cellulosic biomass fuels; and
additional governmental incentives and/or legislative requirements to enhance biomass energy production.
At this time, we cannot predict which, if any, of these potential opportunities will be available to or realized by us or their economic effect on our business.
While all of the specific consequences to our business from climate controlchange are not yet predictable, the most visible potential negativeadverse consequence to date is that the focus on renewable energy will createhas created greater demand and competition for the wood residuals or fiber that is consumed by our mills as part of their production process.
from renewable energy producers like the pellet industry in Germany.In Germany, since 2006, the price and supply of wood residuals have been affected by an increasing demand from alternative or renewable energy producers and governmental initiatives for carbon neutral energy. Over the long term, this non-traditional demand for fiber is expected to increase in Europe. Additionally, the growing interest and focus in British Columbia for renewable green energy is also expected to create additional competition for such fiber in that region over time. Such additional demand for wood residuals may increase the competition and prices for wood residuals over time. See “— Operating“– Production Costs —– Fiber”.
Governmental action or legislation may also have an important effect on the demand and prices for wood residuals. As governments pursue green energy initiatives, they risk creating incentives and demand for wood residuals from renewable energy producers that “cannibalizes” or adversely affects existing traditional users, such as lumber and pulp and paper producers. We are activelycontinually engaged in continuing dialogue with government to educate and try to ensure potential initiatives recognize the traditional and continuing role of our mills in the overall usage of forestry resources and the economies of local communities.
Other potential negative consequences from climate change that over time that may affect our business include:
| | |
| • | a greater susceptibility of northern softwood forest to disease, fire and insect infestation; |
|
| • | the disruption of transportation systems and power supply lines due to more severe storms; |
22
a greater susceptibility of northern softwood forest to disease, fire and insect infestation;
the disruption of transportation systems and power supply lines due to more severe storms;
the loss of fresh water transportation for logs due to lower water levels;
decreases in quantity and quality of processed water for our mill operations;
| | |
| • | the loss of water transportation for logs and our finished goods inventories due to lower water levels; |
|
| • | decreases in quantity and quality of processed water for our mill operations; |
|
| • | the loss of northern softwood boreal forests in areas in sufficient proximity to our mills to competitively acquire fiber; and |
|
| • | lower harvest levels decreasing the supply of harvestable timber and, as a consequence, wood residuals. |
the loss of northern softwood boreal forests in areas in sufficient proximity to our mills to competitively acquire fiber; and
lower harvest levels decreasing the supply of harvestable timber and, as a consequence, wood residuals.
Human Resources
We currently employ approximately 1,4911,460 people. We have approximately 1,0521,041 employees working in our German operations, including our wood procurement, transportation and sales subsidiaries. In addition, there are approximately 17 people workingemployed at the office we maintain in Vancouver, British Columbia, Canada. Celgar currently employs approximately 422405 people in its operations, the vast majority of which are unionized.
Rosenthal, which employs approximately 445443 people, is bound by collective agreements negotiated with Industriegewerkschaft Bergbau, Chemie, Energie, or “IGBCE”, a national union that represents pulp and paper workers. In December 2010, we successfully negotiatedJuly 2013, our Rosenthal mill renewed its collective agreement for a new agreement with IGBCE substantially upon the same terms as the previous labor contract.two-year period until June 2015. The new collective agreement provides for, among other things, an approximately 3.5%initial 1.8% wage increase for employees thereunder, with a subsequent 3% wage increase in 2011 and expires at the end of November 2011.
May 2014.Stendal and its subsidiaries employ approximately 601592 people. In 2011, Stendal has not yet entered into anya seven-year collective agreementsagreement with IGBCE although it may do soeffective July 2011. Since, prior to entering into this collective agreement, Stendal’s employees had relatively lower wages compared to their peers at other German pulp mills, this agreement provided for an approximately 5.5% wage increase in 2012. The collective agreement provides for a further 2.5% minimum annual wage increase from 2013 to 2015. The collective agreement is scheduled to expire in 2018.
Our Celgar mill settled, effective May 1, 2012, a new five-year collective agreement with its hourly workers to replace its expiring prior agreement. The agreement provided for lump sum payments of C$3,750 for all active employees in 2012 and 2013 and wage increases of 2.0%, 2.5% or 3.0% in each of 2014, 2015 and 2016. The collective agreement is scheduled to expire in April 2017. In July 2013, we commenced reducing the future.
Celgar mill’s workforce by approximately 85 employees over a 12-month period to reduce fixed costs. See Part II, “Item 7. Management’s Discussion and Analysis of Financial Condition and Results of Operations”.We consider the relationships with our employees to be good. Although no assurances can be provided, we have not had any significant work stoppages at any of our German operations and we would therefore expect to enter into new labor agreements with our pulp workers in Germanywhen the current labor agreements expire without any significant work stoppages at our German mills.
We negotiated a four-year collective agreement, effective May 1, 2008, with our hourly workers at the Celgar mill to replace the collective agreement which expired on April 30, 2008. The agreement provided for a retroactive wage increase of 2.0% for 2008, a wage increase of 2.5% in each of 2009 and 2010 and a wage increase of 3.0% in 2011.
stoppages.
Description of Certain Indebtedness
The following summaries of certain material provisions of: (i) our 2017 Senior Notes; (ii) our 2013 Senior Notes; (iii) our 2012 Convertible Notes; (iv) the Stendal Loan Facility; (v)(iii) a €17.0 million amortizing term facility at our Stendal mill in respect of Project Blue Mill, referred to as the “Blue Mill Facility”; (iv) the working capital facilities and investment loan associated with our Rosenthal mill; and (vi)(v) the Celgar Working Capital Facility, as such terms are referred to below, are not complete and these provisions, including definitions of certain terms, are qualified by reference to the applicable documents and the applicable amendments to such documents on file with the U.S. Securities and Exchange Commission, referred to as the “SEC”.
In November 2010, we issued $300.0 million in aggregate principal amount of 9.5% Senior Notes due 2017, referred to as the “2017 Senior“Senior Notes”, to principally refinance our 20139.25% Senior Notes (as defined below)due 2013. In July 2013, we issued an additional $50.0 million in principal amount of Senior Notes at a price of 104.5%. The 2017 Senior Notes bear interest at a rate of 9.5% per annum, payable semi-annually in arrears on December 1 and June 1, commencing June 1, 2011.1. The 2017 Senior Notes mature on December 1, 2017. The 2017 Senior Notes are our senior unsecured obligations and, accordingly, rank junior in right of payment to all existing and future secured indebtedness and all indebtedness and liabilities of our subsidiaries, equal in right of payment with all of our existing and future unsecured senior indebtedness including the 2013 Senior Notes, and senior in right of payment to the 2012 Convertible Notes (as defined below) as well as any current or future subordinated indebtedness. The 2017 Senior Notes were issued under an indenture which, among other things, restricts our ability and the ability of our restricted subsidiaries under the indenture to: (i) incur additional indebtedness or issue preferred stock; (ii) pay dividends or make other distributions to our stockholders; (iii) purchase or redeem capital stock or subordinated indebtedness; (iv) make investments; (v) create liens and enter into sale and lease back transactions; (vi) incur restrictions on the
23
From time to time, we also provide forward-looking statements in other materials we release as well as oral forward-looking statements. Such statements give our current expectations or forecasts of future events; they do not relate strictly to historical or current facts.
Other potential risks to our business from climate change include:
a greater susceptibility of northern softwood forest to disease, fire and insect infestation, which could diminish fiber availability;
the disruption of transportation systems and power supply lines due to more severe storms;
| | |
| • | a greater susceptibility of northern softwood forest to disease, fire and insect infestation, which could diminish fiber availability; |
|
| • | the disruption of transportation systems and power supply lines due to more severe storms; |
|
| • | the loss of water transportation for logs and our finished goods inventories due to lower water levels; |
|
| • | decreases in quantity and quality of processed water for our mill operations; |
|
| • | the loss of northern softwood boreal forests in areas in sufficient proximity to our mills to competitively acquire fiber; and |
|
| • | lower harvest levels decreasing the supply of harvestable timber and, as a consequence, wood residuals. |
the loss of water transportation for logs due to lower water levels;
decreases in quantity and quality of processed water for our mill operations;
the loss of northern softwood boreal forests in areas in sufficient proximity to our mills to competitively acquire fiber; and
lower harvest levels decreasing the supply of harvestable timber and, as a consequence, wood residuals.
The occurrence of some or all of these events could have a material adverse effect on our operationsand/or financial results.
Our new ERP system may cost more than expected, be delayed, fail to perform as planned and interrupt operational transactions during and following the implementation, which could adversely affect our operations and results of operations.
In January 2014, we commenced the implementation of a new ERP solution to replace our existing business software applications at a total estimated cost of $12.0 million. The project is designed to be completed in stages over the next three years. Such projects are inherently complex, resource intensive, and lengthy. As a result, we could experience unplanned or unforeseen issues that could adversely affect the project, our business and/or our results of operations, including:
costs of implementation that materially exceed our expectation;
delays in the go-live of one or more of the stages of the project, resulting in additional costs or time for completion;
errors in implementation resulting in errors in the commencement or reporting of business transactions;
failure in the deliverables of our key partners, suppliers and implementation advisors, resulting in an inferior product, reduced business efficacy and the project not providing expected benefits;
deficiencies in the training of employees in the use of the new solution, resulting in errors in the recording of data or transactions, leading to delays in input deliveries and production impairment;
a control failure during or post implementation, which may result in a material weakness in our internal controls over financial reporting; and
other implementation issues leading to delays and impacts on our business.
Our operations require substantial capital and we may be unable to maintain adequate capital resources to provide for all of our capital requirements.
Our business is capital intensive and requires that we regularly incur capital expenditures to maintain our equipment, improve efficiencies and, as a result of changes to environmental regulations that require capital expenditures, bring our operations into compliance with such regulations. In addition, our senior management and board of directors may approve projects in the future that will require significant capital expenditures. Increased capital expenditures could have a material adverse effect on our cash flow and our ability to satisfy our debt obligations. If our available cash resources and cash generated from operations are not sufficient to fund our operating needs and capital expenditures, we would have to obtain additional funds from borrowings or other available sources or reduce or delay our capital expenditures. The global financial crisis in 2008 adversely affected global credit conditions, caused a downturn in the global economy and resulted in a significant tightening in the credit markets and the overall availability of credit. Our indebtedness could adversely affect our financial health, limit our operations and impair our ability to raise additional capital. If this occurs, we may not be able to obtain additional funds on favorable terms or at all. If we cannot maintain or upgrade our equipment as may be required from time to time, we may become unable to manufacture products that compete effectively. An inability to make required capital expenditures in a timely fashion could have a material adverse effect on our growth, business, financial condition or results of operations.
Future acquisitions may result in additional risks and uncertainties in our business.
In order to grow our business, we may seek to acquire additional assets or companies. Our ability to pursue selective and accretive acquisitions will be dependent on management’s ability to identify, acquire, and develop suitable acquisition targets in both new and existing markets, but, in certain circumstances, acceptable acquisition targets might not be available. In pursuing acquisition and investment opportunities, we face competition from other companies having similar growth strategies, many of which may have substantially greater resources than us. Competition for these acquisitions or investment targets could result in increased acquisition or investment prices, higher risks and a diminished pool of businesses or assets available for acquisition.
Acquisitions also frequently result in recording of goodwill and other intangible assets, which are subject to potential impairments in the future that could have a material adverse effect on our operating results. Furthermore, the costs of integrating acquired businesses (including restructuring charges associated with the acquisitions, as well as other acquisition costs, such as accounting fees, legal fees and investment banking fees) could significantly impact our operating results.
Although we perform diligence on the businesses we purchase, in light of the circumstances of each transaction, an unavoidable level of risk remains regarding the actual condition of these businesses. We may not be able to ascertain the value or understand the potential liabilities of the acquired businesses and their operations until we assume operating control of the assets and operations of these businesses.
Furthermore, any future acquisitions of businesses or facilities could entail a number of risks, including:
problems with the effective integration of operations;
inability to maintain key pre-acquisition business relationships;
increased operating costs;
exposure to substantial unanticipated liabilities; and
difficulties in realizing projected efficiencies, synergies and cost savings.
In addition, geographic and other expansions, acquisitions or joint ventures may require significant managerial attention, which may be diverted from our other operations. If we are unsuccessful in overcoming these risks, our business, financial condition or results of operations could be materially and adversely affected.
Changes in credit ratings issued by nationally recognized statistical rating organizations could adversely affect our cost of financing and have an adverse effect on the market price of our securities.
Credit rating agencies rate our debt securities on factors that include our operating results, actions that we take, their view of the general outlook for our industry and their view of the general outlook for the economy. Actions taken by the rating agencies can include maintaining, upgrading or downgrading the current rating or placing the company on a watch list for possible future downgrading. Downgrading the credit rating of our debt securities or placing us on a watch list for possible future downgrading could limit our access to the credit markets, increase our cost of financing and have an adverse effect on the market price of our securities.
The actual benefits of the Celgar mill workforce reduction may differ from those currently expected.
In July 2013, we commenced implementing a workforce reduction at the Celgar mill to, among other things, reduce the mill’s fixed costs and improve its competitiveness. We currently estimate that the Celgar mill will realize approximately $8.0 million to $10.0 million in annual pre-tax cost savings once such restructuring has been completed, and currently expect to realize approximately 80% of such savings in 2014. The Celgar workforce reduction initiative is subject to various risks, which could result in the actual benefits of the initiative differing from those currently anticipated. These risks and uncertainties include, among others, that unanticipated disruptions to the Celgar mill’s operations may result in additional costs being incurred, anticipated benefits not being realized and may adversely impact the mill’s operations.
We are subject to risks related to our employees.
The majority of our employees are unionized and we have collective agreements in place with our employees at all of our Rosenthal and Celgar mills. In September 2008, we negotiated a four-year collective agreement, effective May 1, 2008, with the hourly workers at our Celgar mill and, in December 2010, we entered into our current collective agreement with our Rosenthal employees. In the future we may enter into a collective agreement with our pulp workers at the Stendal mill. Although we have not experienced any work stoppages in the past, there can be no assurance that we will be able to negotiate acceptable collective agreements or other satisfactory arrangements with our employees upon the expiration of our collective agreements or in conjunction with the establishment of a new agreement or arrangement with our pulp workers at the Stendal mill.agreements. This could result in a strike or work stoppage by the affected workers. The registration or renewal of the collective agreements or the outcome of our wage negotiations could result in higher wages or benefits paid to union members. Accordingly, we could experience a significant disruption of our operations or higher on-going labor costs, which could have a material adverse effect on our business, financial condition, results of operations and cash flow.
In addition, whenever we seek to reduce workforce at any of our mills, the affected mill’s labor force could seek to hinder or delay such actions, we could incur material severance or other costs, and our operations could be disrupted.We rely on government grants and guarantees and participate in German and European statutory energy programs.
We currently benefit from a subsidized capital expenditure program and lower cost of financing as a result of German federal and state government grants and guarantees at our Stendal mill. Should either the German federal or state governments be prohibited from honoring legislative grants and guarantees at Stendal, or should we be required to repay any such legislative grants, this may have a material adverse effect on our business, financial condition, results of operations and cash flow.
Since 2005, our German mills have benefitted from sales of emission allowances under the EU Emissions Trading Scheme. As a result ofETS. Since our Rosenthal and Stendal mills’ eligibility forGerman mills receive stipulated special tariffs under the Renewable Energy Act, the amount of emissions allowances granted to our German mills under the EU ETS has been reduced. Additionally, all such German legislation isemission allowances are subject to statutory amendment or change in the future.
In parallel with the European Commission’s recently initiated formal investigation of Germany’s renewable energy charge system under the Renewable Energy Act, the German government has proposed plans to withdraw or amend the exemption from a surcharge for companies that produce energy used in their own manufacturing processes. Additionally, the European Commission has expressed concerns that the Renewable Energy Act and certain exemptions thereunder are not in compliance with current European Union laws and are unpermitted state aid. The European Commission did not address whether the companies that received such substantial reductions could have to refund any benefits. We cannot currently predict the outcome of such developments. However, they could potentially result in an increase in our energy costs at our German mills, which, depending upon legislated changes, may be material.
Our German mills sell surplus “green energy” at stipulated tariffs under the Renewable Energy Act. The German government has publicly announced its intention to review various provisions and features of such Act and its overall energy policies. If the German government enacts legislation as a result, it could, adverselyamong other things, affect the eligibilityour cost of our Rosenthalenergy and Stendal mills to participate in this statutory programand/or the tariffs paid thereunder.we receive for sales of surplus energy. Currently, we cannot predict with any certainty which actions the German government may implement or their effect on our operations. As a result, we cannot predict with any certainty the amount of future sales of surplus energy we may be able to generate.
We are dependent on key personnel.
Our future success depends, to a large extent, on the efforts and abilities of our executive and senior mill operating officers. Such officers are industry professionals many of whom have operated through multiple business cycles. Our officers play an integral role in, among other things:
| | |
| • | sales and marketing; |
|
| • | reducing operating costs; |
|
| • | identifying capital projects which provide a high rate of return; and |
34
Further, if our transportation providers fail to deliver our pulp in a timely manner, it could negatively impact our customer relationships and we may be unable to sell it at full value. If our transportation providers fail to deliver our raw materials in a timely fashion, we may be unable to manufacture pulp in response to customer orders. Also, if any of our transportation providers were to cease operations, we may be unable to replace them at a reasonable cost. The occurrence of any of the foregoing events could materially adversely affect our results of operations.
The price of our common stock may be volatile.
The market price of our common stock may be influenced by many factors, some of which are beyond our control, including those described above and the following:
actual or anticipated fluctuations in our operating results or our competitors’ operating results;
announcements by us or our competitors of new products, capacity changes, significant contracts, acquisitions or strategic investments;
our growth rate and our competitors’ growth rates;
the financial market and general economic conditions;
changes in stock market analyst recommendations regarding us, our competitors or the forest products industry generally or lack of analyst coverage of our common stock;
sales of common stock by our executive officers, directors and significant stockholders; and
changes in accounting principles.
In addition, there has been significant volatility in the market price and trading volume of securities of companies operating in the forest products industry that often has been unrelated to the operating performance of particular companies. Some companies that have had volatile market prices for their securities have had securities litigation brought against them. If litigation of this type is brought against us, it could result in substantial costs and would divert management’s attention and resources.
A small number of our stockholders could significantly influence our business.
As of December 31, 2013, we believe that our top three stockholders control approximately 57% of our common stock. These few significant stockholders, either individually or acting together, may be able to exercise significant influence over matters requiring stockholder approval, including the election of directors and approval of significant corporate transactions, such as a merger or other sale of the company or our assets. This concentration of ownership may make it more difficult for other stockholders to effect substantial changes in the company, may have the effect of delaying, preventing or expediting, as the case may be, a change in control of the company, and may adversely affect the market price of our common stock. Further, the interests of these few stockholders may not be in the best interests of all stockholders.
| |
| ITEM 1B. | UNRESOLVED STAFF COMMENTS. |
We lease offices in Vancouver, British Columbia, Seattle, Washington, and Berlin, Germany. We own the Rosenthal and Celgar mills and the underlying property. The Stendal mill is situated on property owned by Stendal, our 74.9%83.0% owned subsidiary.
The Rosenthal mill is situated on For a
220 acre site near the towndescription of
Blankensteinour mills, please see “Part I. – Item 1. Business – Our Mills and Product”.We lease offices in the state of Thüringia, approximately 300 kilometers south of Berlin. The Saale river flows through the site of the mill. In late 1999, we completed a major capital project which converted the Rosenthal mill to the production of kraft pulp. It is a single line mill with a current annual production capacity of approximately 330,000 ADMTs of kraft pulp. The mill is self-sufficient in steam and electrical power. Some excess electrical power which is constantly generated is sold to the regional power grid. The facilities at the mill include:
| | |
| • | an approximately 315,000 square feet fiber storage area; |
|
| • | barking and chipping facilities for pulp logs; |
|
| • | an approximately 300,000 square feet roundwood yard; |
|
| • | a fiber line, which includes a Kamyr continuous digester and bleaching facilities; |
|
| • | a pulp machine, which includes a dryer, a cutter and a baling line; |
|
| • | an approximately 63,000 square feet finished goods storage area; |
|
| • | a chemical recovery system, which includes a recovery boiler, evaporation plant and recausticizing plant; |
|
| • | a fresh water plant; |
|
| • | a wastewater treatment plant; and |
|
| • | a power station with a turbine capable of producing 57 MW of electric power from steam produced by the recovery boiler and the power boiler. |
The Stendal mill is situated on a 200 acre site owned by Stendal that is part of a larger 1,250 acre industrial park near the town of Stendal in the state of Saxony-Anhalt, approximately 300 kilometers north of the Rosenthal mill and 130 kilometers west of Berlin. The mill is adjacent to the Elbe river and has access to harbor facilities for water transportation. The mill is a single line mill with a current annual design production capacity of approximately 645,000 ADMTs of kraft pulp. The Stendal mill is self-sufficient in steam and electrical power. Some excess electrical power which is constantly being generated is sold to the regional power grid. The facilities at the mill include:
| | |
| • | an approximately 920,000 square feet fiber storage area; |
|
| • | debarking and chipping facilities for pulp logs; |
|
| • | a fiber line, which includes ten Superbatch digesters and bleaching facilities; |
|
| • | a pulp machine, which includes a dryer, a cutter and a baling line; |
|
| • | an approximately 108,000 square feet finished goods storage area; |
|
| • | a recovery line, which includes a recovery boiler, evaporation plant, recausticizing plant and lime kiln; |
|
| • | a fresh water plant; |
|
| • | a wastewater treatment plant; and |
36
| | |
| • | a power station with a turbine capable of producing approximately 100 MW of electric power from steam produced by the recovery boiler and a power boiler. |
The Celgar mill is situated on a 400 acre site near the city of Castlegar, British Columbia. The mill is located on the south bank of the Columbia River, approximately 600 kilometers east of the port city of Vancouver, British Columbia, Berlin, Arneburg and approximately 32 kilometers north of the Canada-U.S. border. The city ofHamburg, Germany, and Seattle, Washington is approximately 650 kilometers southwest of Castlegar. It is a single line mill with a current annual production capacity of approximately 520,000 ADMTs of kraft pulp. Internal power generating capacity will, with certain capital improvements that are currently being constructed, enable the Celgar mill to be self-sufficient in electrical power and to sell surplus electricity. The facilities at the Celgar mill include:
| | |
| • | chip storage facilities consisting of four vertical silos and an asphalt surfaced yard with a capacity of 200,000 cubic meters of chips; |
|
| • | a woodroom containing debarking and chipping equipment for pulp logs; |
|
| • | a fiber line, which includes a dual vessel hydraulic digester, pressure knotting and screening, single stage oxygen delignification and a four stage bleach plant; |
|
| • | two pulp machines, which each include a dryer, a cutter and a baling line; |
|
| • | a chemical recovery system, which includes a recovery boiler, evaporation plant, recausticizing area and effluent treatment system; and |
|
| • | two turbines and generators capable of producing approximately 48 MW and 52 MW, respectively, of electric power from steam produced by a recovery boiler and power boiler. |
Washington.At the end of 2010,2013, substantially all of the assets relating to the Stendal mill were pledged to secure the Stendal Loan Facility.Facilities. The €5.0 million Rosenthal working capital facility is secured by certain land at the Rosenthal mill. The other working capital loan facilities established for the Rosenthal and Celgar mills are secured by first charges against the inventories and receivables atof the respective mills.
The following table sets out our pulp production capacity and actual production sales volumes and revenues by mill for the periods indicated:
| | | | | | | | | | | | | | | | | |
| | | Annual
| | | | | | | | | | |
| | | Production
| | | Years Ended December 31, | |
| | | Capacity(1) | | | 2010 | | | 2009 | | | 2008 | |
| | | | | | (ADMTs) | |
| |
Pulp Production by Mill: | | | | | | | | | | | | | | | | |
| Rosenthal | | | 330,000 | | | | 324,194 | | | | 310,244 | | | | 328,693 | |
| Celgar | | | 520,000 | | | | 502,107 | | | | 466,855 | | | | 485,893 | |
| Stendal | | | 645,000 | | | | 599,985 | | | | 620,342 | | | | 610,401 | |
| | | | | | | | | | | | | | | | | |
| Total pulp production | | | 1,495,000 | | | | 1,426,286 | | | | 1,397,441 | | | | 1,424,987 | |
| | | | | | | | | | | | | | | | | |
| | |
(1) | | Capacity is the rated capacity of the plants for the year ended December 31, 2010, which is based upon production for 365 days a year. Targeted production is generally based upon 355 days per year. |
In October 2005, our wholly-owned subsidiary, ZellstoffOur Celgar Limited, receivedmill is currently appealing a re-assessment for real2013 property tax assessment decision from the British Columbia Supreme Court that resulted in it not recovering approximately C$4.5 million ($4.2 million) of previously paid property transfer tax payable in British Columbia, Canada, in the amount of approximately €3.0 million (C$4.5 million) in connection with the acquisition of the Celgar mill. We are currently contestingexpect such appeal to be heard by the re-assessment and we currently expect the SupremeBritish Columbia Court of British Columbia to hold a hearing on this matter sometimeAppeal in 2011. The amount, if any, that may be payable in connection with this matter remains uncertain.
2014.In September 2009, the Celgar mill received a summons for charges under the CanadianFisheries Act and the British ColumbiaEnvironmental Management Act in connection with a November 2008 spill of diluted weak black liquor and diluted weak black liquor foam into the nearby Columbia River. The charges relate primarily to exceedances of allowable limits under the Celgar mill’s effluent discharge permit and spill pond maintenance requirements. We currently anticipate the Provincial Court to hold a hearing on this matter some time in 2011. Although we cannot assess with any certainty the potential liability for damages, if any, that may result from these
37
charges, we do not currently expect them to have a material adverse effect on our business or operations. Nevertheless, there can be no assurance that we will not be required to pay the maximum amount of fines that may be levied pursuant to the application of statutory provisions.
In September of 2010, the Celgar mill received a letter from the Upper Columbia River Natural Resources Trustee Council, an organization consisting of aboriginal groups and US government representatives, (thereferred to as the “Council”), alleging that, based on their preliminary assessment, (theor the “Preliminary Assessment”), between 1961 to 1993, the Celgar mill had discharged chlorinated organic compounds into the Columbia River. The Preliminary Assessment was conducted to evaluate the need to conduct a formal natural resource damage assessment under the U.S.Comprehensive Environmental Response, Compensation and Liability Act(“CERCLA”), referred to as “CERCLA”. Although we did not acquire the Celgar mill until 2005, and the Celgar mill’s alleged discharges occurred prior to our acquisition of the mill, the Council determined to proceed with a formal natural resource damage assessment under the CERCLA. Although at this time it is unclear as to whether any harm was caused by these alleged discharges and, in any event, we do not believe we are liable, due to the preliminary nature of the assessment, we cannot at this time quantify the costs, if any, associated with this matter.
In January 2012, we served a Notice of Intent to Submit a Claim to Arbitration on the Government of Canada, referred to as the “NAFTA Notice”, for breaches by it of its obligations under the North American Free Trade Agreement, referred to as “NAFTA”. The Company’s NAFTA claim, referred to as the “NAFTA Claim”, relates to its investments in the Celgar mill and arises from the treatment of the Celgar mill’s energy generation assets and operations by the Province of British Columbia, primarily through the actions of B.C. Hydro, a provincially owned and controlled enterprise, and the British Columbia Utilities Commission, a provincial government regulatory agency. Our NAFTA Claim is against the Government of Canada, rather than the Province of British Columbia as, under NAFTA, the Canadian federal government is responsible for the actions of its provinces. Our NAFTA Claim alleges that our Celgar mill has received unfair and discriminatory treatment regarding the mill’s ability to purchase and sell energy compared to other pulp mills and entities that generate and sell electricity within the Province of British Columbia. Subsequent to the filing of the NAFTA Notice, our representatives met with representatives of the Government of Canada and the Province of British Columbia to attempt to settle our NAFTA Claim through consultation and negotiation, as required under NAFTA Article 1118. However, no resolution was achieved. As a result, we served a Request for Arbitration on the Government of Canada under NAFTA in order to meet the applicable filing deadline and to preserve and progress our NAFTA Claim. Under our NAFTA Claim, we are seeking approximately C$250 million in damages consisting of past losses of approximately C$19.0 million per year accruing since 2008 and the net present value of projected losses that would result from the ongoing application of discriminatory Provincial policies should the status quo remain unchanged. Our NAFTA Claim is being instituted under Chapter 11 of NAFTA and will be heard by a tribunal appointed in accordance with Article 1123 of NAFTA. At this time, there can be no assurance whether we will be successful in such claim and we cannot quantify the amount we may recover, if any, under such proceedings if we were successful.
In 2012, as a result of a regular tax field audit for the Stendal mill, German public authorities commenced a preliminary investigation into a past and then current managers of the mill relating to whether certain settlement amounts received by the Stendal mill in 2007, 2010 and 2011 from the main contractor under the Engineering, Procurement and Construction Contract for the construction of the Stendal mill should have reduced the assessment base for the original investment subsidies granted to the mill by German authorities. The payments were made by the contractor to the Stendal mill to settle certain warranty, performance and remediation claims that the Stendal mill made against the contractor after completion of mill construction in 2004. The amounts currently under review aggregate approximately €8.3 million ($11.4 million). Investment subsidies received by the Stendal mill were generally based upon a percentage of the assessment base for subsidies of the mill. If the settlement payments received by the Stendal mill result in a reduction of the assessment base for subsidies under applicable German rules there could be a proportionate reduction in the investment subsidies and the difference could be repayable by the Stendal mill. The Stendal mill believes that it has properly recorded the settlement amounts received from the contractor and that the same do not reduce the assessment base for subsidies of the mill. However, at this time, there can be no certainty as to the outcome of the current investigation.
We are also subject to routine litigation incidental to our business. We do not believe that the outcome of such litigation will have a material adverse effect on our business or financial condition.
| ITEM 4. | MINE SAFETY DISCLOSURES |
Not applicable.
PART II
ITEM 4. 5. | SUBMISSION OF MATTERS TO A VOTE OF SECURITY HOLDERS |
Not applicable.
38
PART II
| |
ITEM 5. | MARKET FOR REGISTRANT’S COMMON EQUITY, AND RELATED STOCKHOLDER MATTERS AND ISSUER PURCHASES OF EQUITY SECURITIES |
(a)Market Information.Our shares are quoted for trading on the NASDAQ Global Select Market under the symbol “MERC” and listed in U.S. dollars on the Toronto Stock Exchange under the symbol “MRI.U”. The following table sets forth the high and low sale prices of our shares on the NASDAQ Global Select Market for each quarter in the two yeartwo-year period ended December 31, 2010:
| | | | | | | | | |
Fiscal Quarter Ended | | High | | | Low | |
| |
2010 | | | | | | | | |
| March 31 | | $ | 5.87 | | | $ | 2.68 | |
| June 30 | | | 6.08 | | | | 3.98 | |
| September 30 | | | 5.58 | | | | 3.97 | |
| December 31 | | | 7.95 | | | | 4.93 | |
2009 | | | | | | | | |
| March 31 | | $ | 2.24 | | | $ | 0.25 | |
| June 30 | | | 1.24 | | | | 0.51 | |
| September 30 | | | 4.37 | | | | 0.50 | |
| December 31 | | | 3.68 | | | | 1.73 | |
2013: | | | | | | | | |
Fiscal Quarter Ended | | High | | | Low | |
2013 | | | | | | | | |
March 31 | | $ | 7.51 | | | $ | 6.50 | |
June 30 | | $ | 7.07 | | | $ | 5.87 | |
September 30 | | $ | 7.84 | | | $ | 6.22 | |
December 31 | | $ | 10.55 | | | $ | 7.04 | |
2012 | | | | | | | | |
March 31 | | $ | 8.80 | | | $ | 6.15 | |
June 30 | | $ | 8.10 | | | $ | 5.55 | |
September 30 | | $ | 7.51 | | | $ | 5.05 | |
December 31 | | $ | 7.80 | | | $ | 6.18 | |
(b)Shareholder Information.As at February 15, 2011,19, 2014, there were approximately 368295 holders of record of our shares and a total of 44,524,80655,853,704 shares were outstanding.
(c)Dividend Information.The declaration and payment of dividends is at the discretion of our board of directors. Our board of directors has not declared or paid any dividends on our shares in the past two years and does not anticipate declaring or paying dividends in the foreseeable future.
In addition, the indenture governing our Senior Notes and our bank credit facilities limit our ability to pay dividends or make other distributions on capital stock. See Part I, “Item 1. Business – Description of Certain Indebtedness”.(d)Equity Compensation Plans.The following table sets forth information as at December 31, 20102013 regarding our equity compensation plans approved by our shareholders. 2,543,854As at December 31, 2013, 1,081,654 of our shares may be issuedwere available for future issuance pursuant to grants of options, stock appreciation rights, restricted stock, restricted stock rights, performance shares and performance units under our 2010 Stock Incentive Plan, referred to as the “2010 Plan”, which was adopted in June 2010 and which replaced our 2004 Stock Incentive Plan.Plan, referred to as the “2004 Plan”. Our Amended and Restated 1992 Non-Qualified Stock Option Plan expired in 2008.
| | | | | | | | | | | | | |
| | | Number of Shares to be
| | | Weighted-average
| | | Number of Shares
| |
| | | Issued Upon Exercise
| | | Exercise Price of
| | | Available for Future
| |
| | | of Outstanding Options | | | Outstanding Options | | | Issuance Under Plan | |
| |
| 2010 Stock Incentive Plan | | | — | | | $ | — | | | | 2,000,000 | |
| 2004 Stock Incentive Plan | | | 30,000 | (1) | | $ | 7.25 | | | | 543,854 | (2) |
| Amended and Restated 1992 Non-Qualified Stock Option Plan | | | 160,000 | | | $ | 6.50 | | | | — | (3) |
| | | | | | | | | | | | |
| | | Number of Shares to be
Issued Upon Exercise
of Outstanding Options | | | Weighted-average
Exercise Price of
Outstanding Options | | | Number of Shares
Available for Future
Issuance Under Plan
(Excluding Shares Reflected
in Column (a)) | |
| | | (a) | | | (b) | | | (c) | |
2010 Stock Incentive Plan | | | — | | | $ | — | | | | 1,081,654 | (1)(2) |
2004 Stock Incentive Plan | | | 30,000 | (3) | | $ | 7.30 | | | | — | |
Amended and Restated 1992 Non-Qualified Stock Option Plan | | | 45,000 | (4) | | $ | 7.92 | | | | — | (5) |
| | |
| (1) | As at December 31, 2013, we had 791,432 performance share units outstanding under the 2010 Plan. In February 2011, we awarded 783,395 performance share units under the 2010 Plan which may vest and become issuable into a maximum of 783,395 shares of our common stock only upon the attainment of designated performance objectives over a three year performance period that commenced on January 1, 2011 and ended on December 31, 2013. In February 2011, we awarded 29,180 performance share units under the 2010 Plan. These were subsequently forfeited in 2012, and a cash payment was made as compensation. During 2012, we awarded 55,478 performance share units under the 2010 Plan which may vest and become issuable into a maximum of 55,478 shares of our common stock only upon the attainment of designated performance objectives over a performance period that commenced on January 1, 2011 and ended on December 31, 2013. During 2013, we awarded 40,499 performance share units under the 2010 Plan which may vest and become issuable into a maximum of 40,499 shares of our common stock only upon the attainment of designated performance objectives, for 28,340 of the performance share units the performance period commenced on January 1, 2011 and ended on December 31, 2013 and for 12,159 of the performance share units the performance period will end in March 2014. The scheduled vesting dates for the performance shares units are: 30,399 shares on March 31, 2014; 355,386 shares on January 1, 2014; 203,181 shares on January 1, 2015 and 202,466 shares on January 1, 2016. 35,196 performance share units were forfeited in 2013, 64,661 performance share units were forfeited in 2012 and 17,263 shares in 2011. |
| (2) | As at December 31, 2013, we had 158,000 restricted stock outstanding under the 2010 Plan. In 2011, we issued 238,000 shares of restricted stock under the 2010 Plan, of which 78,000 vested in 2012, 40,000 vested in 2013 and the remaining 120,000 vest in equal amounts over a three-year period between 2014 and 2016. During 2012, we issued 36,500 shares of restricted stock under the 2010 Plan, which vested in June 2013. During 2013, we issued 38,000 shares of restricted stock under the 2010 Plan, which vest in June 2014. |
| (3) | The terms of the 2004 Stock Incentive Plan will govern all prior awards granted under such plan until such awards have been cancelled or forfeited or exercised in accordance with the terms thereof. |
(2)(4) | | Pursuant to the terms of the 2004Our 1992 Amended and Restated Stock IncentiveOption Plan we initiated a long-term performance incentive supplement or “Performance Supplement”expired in February 2008. An2008 but an aggregate of 309,685 restricted shares have been issued45,000 unexercised options that were previously granted under the plan. Grants for up to 534,783 shares have been made pursuant to the Performance Supplement.this plan remained outstanding as of December 31, 2013. |
(3) | (5) | The plan has expired. |
In JuneOur 2010 we adopted our 2010 Stock Incentive Plan referred to as the “2010 Plan”, which provides for options, restricted stock rights, restricted stock, performance shares, performance share units and stock appreciation rights to be awarded to employees, consultants and non-employee directors. The 2010 Plan replaced the Company’s 2004 Stock Incentive Plan, referred to as the “2004 Plan”.Plan. However, the terms of the 2004 Plan will govern prior awards until all awards granted under the 2004 Plan have been exercised, forfeited, cancelled, expired, or otherwise terminated in accordance with the terms of such plan. The Company may grant up to a maximum of 2,000,000
39
common shares under the 2010 Plan, plus the number of common shares remaining available for grant pursuant to the 2004 Plan.
We do not have any equity compensation plans that have not been approved by shareholders.
(e)Exchange Offer. In late December 2009, we commenced a tender offer, referred to as the “Exchange Offer”, to exchange up to $23.6 million aggregate principal amount of our then outstanding 2010 Convertible Notes in exchange for an amount of our 2012 Convertible Notes equal to the principal amount of the 2010 Convertible Notes tendered, plus accrued and unpaid interest equaling approximately $12.75 per $1,000 principal amount of 2010 Convertible Notes tendered in the Exchange Offer. As a result of the Exchange Offer, which expired in January 2010, $21.7 million in aggregate principal amount of our 2010 Convertible Notes was tendered in exchange for $22.0 million in aggregate principal amount of our 2012 Convertible Notes. The 2012 Convertible Notes issued in accordance with the terms of the Exchange Agreements are convertible into shares of the Company’s common stock at a conversion price of $3.30 per share, (equal to a conversion rate of approximately 303 shares per $1,000 principal amount of 2012 Convertible Notes), subject to certain adjustments. Since participation in the Exchange Offer was limited to existing holders of the 2010 Convertible Notes and no commission or other remuneration was paid or given directly or indirectly for soliciting the 2010 Convertible Notes tendered in the Exchange Offer, the 2012 Convertible Notes issued as part of the Exchange Offer were exempt from registration pursuant to Section 3(a)(9) of the Securities Act.
(f) Performance Graph.The following graph shows a five-year comparison of cumulative total shareholder return, calculated on an assumed dividend reinvested basis, for our common stock, the NASDAQ Stock Market Index (the “NASDAQ Index”) and Standard Industrial Classification, or “SIC”, Code Index (SIC Code 2611 —- pulp mills) (the “Industry Index”). The graph assumes $100 was invested in each of our common stock, the NASDAQ Index and the Industry Index on December 31, 2005.2008. Data points on the graph are annual.
COMPARISON OF CUMULATIVE TOTAL RETURN
ASSUMES $100 INVESTED ON JAN. 01, 2006
ASSUMES DIVIDEND REINVESTED
FISCAL YEAR ENDING DEC. 31, 2010
| | | | | | | | | | | | | | | | | | | | | | | | | |
| | | 2005 | | 2006 | | 2007 | | 2008 | | 2009 | | 2010 |
| |
| Mercer International Inc. | | | 100.00 | | | | 151.02 | | | | 99.62 | | | | 24.43 | | | | 39.44 | | | | 98.60 | |
| SIC Code Index | | | 100.00 | | | | 155.34 | | | | 190.41 | | | | 31.47 | | | | 30.53 | | | | 59.83 | |
| NASDAQ Stock Market Index | | | 100.00 | | | | 110.25 | | | | 121.88 | | | | 73.10 | | | | 106.22 | | | | 125.36 | |
40
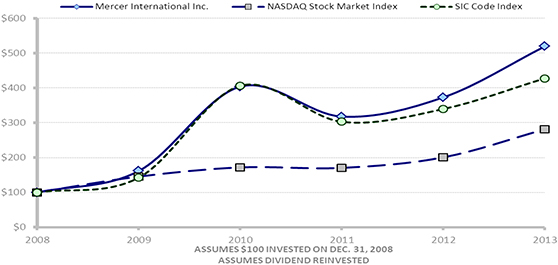
| | | | | | | | | | | | | | | | | | | | | | | | |
| | | 2008 | | | 2009 | | | 2010 | | | 2011 | | | 2012 | | | 2013 | |
Mercer International Inc. | | | 100.00 | | | | 161.46 | | | | 403.65 | | | | 317.71 | | | | 372.92 | | | | 519.27 | |
SIC Code Index | | | 100.00 | | | | 142.23 | | | | 406.11 | | | | 302.73 | | | | 339.46 | | | | 427.49 | |
NASDAQ Stock Market Index | | | 100.00 | | | | 145.36 | | | | 171.74 | | | | 170.39 | | | | 200.62 | | | | 281.22 | |
| |
| ITEM 6. | SELECTED FINANCIAL DATA |
The following table sets forth selected historical financial and operating data as at and for the periods indicated. Our consolidated financial statements as at and for each of the years in the four-year period ended December 31, 2012 were reported using the Euro. Effective October 1, 2013, we changed our reporting currency to the U.S. dollar. With the change in reporting currency, all comparative financial information has been recast from Euros to U.S. dollars to reflect our consolidated financial statements as if they had been historically reported in U.S. dollars, consistent with Accounting Standards Codification Topic 830. The consolidated Euro balance sheet information was translated into the U.S. dollar reporting currency by translating assets and liabilities at the rate of exchange on the balance sheet date and translating equity accounts using historical exchange rates. The consolidated statement of operations information was translated into U.S. dollars using the weighted average exchange rate for the period. Unrealized gains or losses from these translations are recorded in our Consolidated Statement of Comprehensive Income (Loss) and do not affect our net earnings.
The following selected financial data is qualified in its entirety by, and should be read in conjunction with, our consolidated financial statements and related notes contained in this annual report and “Item 7. Management’s Discussion and Analysis of Financial Condition and Results of Operations”. The following selected financial data excludes the results of operations of our paper operations which were sold in 2006 and are accounted for as discontinued operations. Previously reported data and the financial statements and related notes included herein have been reclassified to conform to the current presentation.
| | | | | | | | | | | | | | | | | | | | | |
| | | Years Ended December 31, | |
| | | 2010 | | | 2009 | | | 2008 | | | 2007(1) | | | 2006(1) | |
| | | (Euro in thousands, other than per share and per ADMT amounts) | |
| |
Statement of Operations Data | | | | | | | | | | | | | | | | | | | | |
| Revenues | | | | | | | | | | | | | | | | | | | | |
| Pulp | | € | 856,311 | | | € | 577,298 | | | € | 689,320 | | | € | 704,391 | | | € | 623,977 | |
| Energy | | € | 44,225 | | | € | 42,501 | | | € | 30,971 | | | € | 22,904 | | | € | 20,922 | |
| | | | | | | | | | | | | | | | | | | | | |
| | | € | 900,536 | | | € | 619,799 | | | € | 720,291 | | | € | 727,295 | | | € | 644,899 | |
| Costs and expenses | | € | 732,793 | | | € | 632,598 | | | € | 706,962 | | | € | 657,709 | | | € | 552,395 | |
| Operating income (loss) | | € | 167,743 | | | € | (12,799 | ) | | € | 13,329 | | | € | 69,586 | | | € | 92,504 | |
| Gain (loss) on derivative instruments | | € | 1,899 | | | € | (5,760 | ) | | € | (25,228 | ) | | € | 20,357 | | | € | 105,848 | |
| Interest expense | | € | 67,621 | | | € | 64,770 | | | € | 65,756 | | | € | 71,400 | | | € | 91,931 | |
| Investment income (loss) | | € | 468 | | | € | (1,804 | ) | | € | (1,174 | ) | | € | 4,453 | | | € | 6,090 | |
| Income (loss) from continuing operations after income taxes(2) | | € | 94,748 | | | € | (72,125 | ) | | € | (85,540 | ) | | € | 23,640 | | | € | 70,313 | |
| Net income (loss) per share attributable to common shareholders from continuing operations | | | | | | | | | | | | | | | | | | | | |
| Basic | | € | 2.24 | | | € | (1.71 | ) | | € | (2.00 | ) | | € | 0.62 | | | € | 2.08 | |
| Diluted | | € | 1.56 | | | € | (1.71 | ) | | € | (2.00 | ) | | € | 0.58 | | | € | 1.72 | |
| Weighted average shares outstanding (in thousands) | | | | | | | | | | | | | | | | | | | | |
| Basic | | | 38,591 | | | | 36,297 | | | | 36,285 | | | | 36,081 | | | | 33,336 | |
| Diluted | | | 56,731 | | | | 36,297 | | | | 36,285 | | | | 45,303 | | | | 43,084 | |
Balance Sheet Data | | | | | | | | | | | | | | | | | | | | |
| Current assets | | € | 356,880 | | | € | 200,934 | | | € | 258,901 | | | € | 290,259 | | | € | 221,800 | |
| Current liabilities | | € | 125,197 | | | € | 101,784 | | | € | 104,527 | | | € | 121,516 | | | € | 120,002 | |
| Working capital | | € | 231,683 | | | € | 99,150 | | | € | 154,374 | | | € | 168,743 | | | € | 101,798 | |
| Total assets | | € | 1,216,075 | | | € | 1,083,831 | | | € | 1,151,600 | | | € | 1,272,393 | | | € | 1,284,089 | |
| Long-term liabilities | | € | 877,315 | | | € | 896,074 | | | € | 914,970 | | | € | 895,262 | | | € | 967,583 | |
| Total equity | | € | 213,563 | | | € | 85,973 | | | € | 132,103 | | | € | 255,615 | | | € | 196,504 | |
Other Data | | | | | | | | | | | | | | | | | | | | |
| Pulp sales volume (ADMTs) | | | 1,428,638 | | | | 1,445,461 | | | | 1,423,300 | | | | 1,352,590 | | | | 1,326,355 | |
| Pulp production (ADMTs) | | | 1,426,286 | | | | 1,397,441 | | | | 1,424,987 | | | | 1,404,673 | | | | 1,302,260 | |
| Average pulp price realized (per ADMT)(3) | | € | 591 | | | € | 393 | | | € | 478 | | | € | 516 | | | € | 465 | |
| | | | | | | | | | | | | | | | | | | | |
| | | Year Ended December 31, | |
| | | 2013 | | | 2012 | | | 2011 | | | 2010 | | | 2009 | |
| | | (in thousands, other than per share and per ADMT amounts) | |
Statement of Operations Data | | | | | | | | | | | | | | | | | | | | |
Revenues | | | | | | | | | | | | | | | | | | | | |
Pulp | | $ | 996,187 | | | $ | 979,770 | | | $ | 1,157,206 | | | $ | 1,136,595 | | | $ | 804,426 | |
Energy and chemicals | | | 92,198 | | | | 92,966 | | | | 94,758 | | | | 65,421 | | | | 63,457 | |
| | | | | | | | | | | | | | | | | | | | |
| | $ | 1,088,385 | | | $ | 1,072,736 | | | $ | 1,251,964 | | | $ | 1,202,016 | | | $ | 867,883 | |
Costs and expenses | | $ | 1,056,725 | | | $ | 1,009,714 | | | $ | 1,097,299 | | | $ | 979,368 | | | $ | 885,719 | |
Operating income (loss) | | $ | 31,660 | | | $ | 63,022 | | | $ | 154,665 | | | $ | 222,648 | | | $ | (17,836 | ) |
Interest expense | | $ | 69,156 | | | $ | 71,767 | | | $ | 82,114 | | | $ | 89,754 | | | $ | 90,253 | |
Gain (loss) on derivative instruments | | $ | 19,709 | | | $ | 4,812 | | | $ | (1,974 | ) | | $ | 2,521 | | | $ | (8,026 | ) |
Other income (expense) | | $ | 1,215 | | | $ | (179 | ) | | $ | 3,625 | | | $ | (17,457 | ) | | $ | 7,434 | |
Net income (loss)(1)(2) | | $ | (26,375 | ) | | $ | (15,670 | ) | | $ | 69,699 | | | $ | 114,521 | | | $ | (86,658 | ) |
Net income (loss) per share(2) | | | | | | | | | | | | | | | | | | | | |
Basic | | $ | (0.47 | ) | | $ | (0.28 | ) | | $ | 1.39 | | | $ | 2.97 | | | $ | (2.39 | ) |
Diluted | | $ | (0.47 | ) | | $ | (0.28 | ) | | $ | 1.24 | | | $ | 2.07 | | | $ | (2.39 | ) |
Weighted average shares outstanding (in thousands) | | | | | | | | | | | | | | | | | | | | |
Basic | | | 55,674 | | | | 55,597 | | | | 50,117 | | | | 38,591 | | | | 36,297 | |
Diluted | | | 55,674 | | | | 55,597 | | | | 56,986 | | | | 56,963 | | | | 36,297 | |
Balance Sheet Data | | | | | | | | | | | | | | | | | | | | |
Current assets | | $ | 471,773 | | | $ | 454,880 | | | $ | 484,149 | | | $ | 477,897 | | | $ | 287,978 | |
Current liabilities | | $ | 165,499 | | | $ | 179,876 | | | $ | 163,534 | | | $ | 167,651 | | | $ | 145,877 | |
Working capital | | $ | 306,274 | | | $ | 275,004 | | | $ | 320,615 | | | $ | 310,246 | | | $ | 142,101 | |
Total assets | | $ | 1,548,559 | | | $ | 1,560,581 | | | $ | 1,579,017 | | | $ | 1,628,445 | | | $ | 1,553,345 | |
Long-term liabilities | | $ | 1,034,743 | | | $ | 1,012,943 | | | $ | 1,047,672 | | | $ | 1,174,812 | | | $ | 1,284,253 | |
Total equity | | $ | 348,317 | | | $ | 367,762 | | | $ | 367,811 | | | $ | 285,982 | | | $ | 123,215 | |
Other Data | | | | | | | | | | | | | | | | | | | | |
Pulp sales volume (ADMTs) | | | 1,440,147 | | | | 1,473,519 | | | | 1,427,924 | | | | 1,428,638 | | | | 1,445,461 | |
Pulp production (ADMTs) | | | 1,444,475 | | | | 1,468,275 | | | | 1,453,677 | | | | 1,426,286 | | | | 1,397,441 | |
Average pulp price realized (per ADMT)(3) | | $ | 683 | | | $ | 657 | | | $ | 799 | | | $ | 785 | | | $ | 548 | |
| | |
| (1) | | The presentation for 2006 and 2007 has been modified to conform to the presentation requirements as prescribed in theConsolidationsTopic ASC 810. |
(2) | | We do not report the effect of government grants relating to our assets in our income. These grants reduce the cost basis of the assets purchased when the grants are received.purchased. See “Item 1 —– Business —– Capital Expenditures”. |
| (2) | Attributable to common shareholders. |
| (3) | | Our averageAverage realized pulp price for the years indicated reflects customer discounts and pulp price movements between the order and shipment date. |
41
ITEM 7. MANAGEMENT’S DISCUSSION AND ANALYSIS OF FINANCIAL CONDITION AND RESULTS OF OPERATIONS
| ITEM 7. | MANAGEMENT’S DISCUSSION AND ANALYSIS OF FINANCIAL CONDITION AND RESULTS OF OPERATIONS |
The following discussion and analysis of our financial condition and results of our operations for the three years ended December 31, 20102013, 2012 and 2011 is based upon and should be read in conjunction with the consolidated financial statements and related notes included elsewhere in this annual report. This annual report contains forward-looking statements that involve risks and uncertainties. Our actual results may differ materially from those indicated in forward-looking statements. See “Cautionary Note Regarding Forward-Looking Statements”.
Effective October 1, 2013, we changed our reporting currency from Euros to the U.S. dollar. As a result of our change in reporting currency, all comparative financial information has been recast from Euros to U.S. dollars to reflect our financial statements as if they had been historically reported in U.S. dollars, consistent with the method described in significant accounting policies. See “—Critical Accounting Policies—Change in Reporting Currency” for more information about our change in reporting currency, including the reasons for the change and the manner in which the change has been applied to recast prior period financial statements. See also Note 1 of the consolidated financial statements included in this annual report on Form 10-K.
Results of Operations
We operate in the pulp business and our operations are located in Germany and Western Canada. Our mills have a current combined annual production capacity of approximately 1,500,0001.5 million ADMTs of NBSK pulp.
We operate in markets thatpulp and 305 MW of electrical generation.Markets for NBSK pulp are global, cyclical and commodity based. Our financial performance depends on a number of variables that impact sales and production costs. Sales and production results for kraft pulp are influenced largely by the market price for our products, raw materialsNBSK pulp, fiber costs and foreign currency exchange rates. Kraft pulp markets are highly cyclical, with prices determined by supply and demand. Demand forIn general, kraft pulp is a globally traded commodity. Pricing and demand are influenced to a significant degreeby the balance between supply and demand, as affected by global levels of economic activity and supply is driven by industry capacity and utilization rates. Our product mix is important because premium grades of NBSK pulp generally achieve higher prices and profit margins.
Global economicmacroeconomic conditions, changes in
productionconsumption and industry capacity,
the level of customer and
inventory levels are the primary factors affecting kraft pulp prices. Historically, kraft pulp prices have been cyclicalproducer inventories and fluctuations in
nature.exchange rates. The average European list prices for NBSK pulp between 2000 and
2008 ranged from2013 have fluctuated between a low of $447 per ADMT in 2002 to
$900a high of $1,030 per ADMT in
mid-2008.2011.During the first half of 2011, pulp prices were around record highs, primarily as a result of strong demand from China and the closure of several older mills in the prior years. However, economic uncertainty in Europe and credit tightening in China resulted in a sharp decline in pulp prices commencing in the fourth quarter of 2011. In 2012, there was continuing economic uncertainty in Europe and credit tightening in China in the first half of the year. Further, in the latter part of 2008, we experienced extremely difficult2012, weak demand for paper in Europe resulted in some integrated producers curtailing their paper production and selling their pulp on the market, conditions characterized by poorprimarily in China. These factors negatively impacted demand and rapidly declininglist prices all offor NBSK pulp. In 2013, demand from China was stable throughout the year and supply was slightly under-balanced, which impacted our results for 2008. In slowing economic times, a key factor influencing our competitive position is the price of our product. At the end of 2008,resulted in higher prices. On average, NBSK list prices in Europe had declined to $635 per ADMT. As world economies began to stabilize, NBSKdecreased by approximately 15% in 2012 from the prior year and increased by approximately 6% in 2013 from 2012. At the end of 2013, list prices rebounded in the latter part of 2009 to finish at $800were approximately $905 per ADMT in Europe at year end. Such price improvement was partially offset by the weakening of the U.S. dollar versus the Euro and the Canadian dollar during the period. In 2010, several increases lifted prices to record levels in the middle of the year. Although pulp list prices decreased slightly in the fourth quarter, they remained at historically high levels. As at December 31, 2010, list prices were $950, $960$990 and $840$750 per ADMT in Europe, North America and China, respectively. As pulp prices are highly cyclical, there can be no assurance that prices will not decline in the future.
Our sales realizations are list prices, reduced bynet of customer discounts, rebates and other items.selling concessions. Over the last three years, these discounts, rebates and concessions have increased as producers compete for customers and sales. Our reported average sale price realizations are affected by NBSK price movements between the order and shipment dates.
DuringSurplus energy and chemicals are by-products of our pulp production and the last three years,volumes generated and sold are primarily related to the rate of pulp production. Prices for our energy productionand chemical sales are generally stable and unrelated to cyclical changes in pulp prices.
Production and sales of surplus energy have become aand chemicals are key source of revenuesrevenue sources for us. In 20102013, 2012 and 2009,2011, our mills generated 520,005699,051 MWh, 710,241 MWh and 478,674652,113 MWh, respectively, of surplus energy, primarily from a renewable carbon-neutral source. At the end of September 2010, we completed the Celgar Energy Project and, based on our Celgar mill operating at or around current levels and our contracted sale pricesInitiatives to B.C. Hydro, we currently estimate that surplus power sales from the Celgar mill will generate approximately C$20.0 million to C$25.0 million in annual revenues. Increasingincrease our generation and sales of surplus renewable energy and chemicals will continue to be a key focus for usus. In the last quarter of 2013, our Stendal mill completed Project Blue Mill, which is expected to both increase pulp production and increase surplus electricity production by approximately 109,000 MWh annually. Additionally, in the near term. We are currently exploring various2014, our Rosenthal mill is implementing a capital project at an estimated cost of approximately $3.1 million to process and sell tall oil, a chemical by-product. Further initiatives to enhance suchincrease energy generation and chemical sales revenues. Such initiatives, if implemented, willmay require additional capital spending.
Our production costs are influenced by the availability and cost of raw materials, energy and labor, and our plant efficiencies and productivity. Our main raw material is fiber in the form of wood chips and pulp logs. Wood chip and pulp log costs are primarily affected by the supply of, and demand for, lumber and pulp, which are both highly cyclical. Overall weak lumber markets since 2008 have resulted in reduced sawmilling activityOver the last three years, the demand and log harvesting in both Germany and British Columbia. This has reduced the supply of both wood residuals such as chips and pulp logs. This cyclical supply reduction has put upward pressure oncompetition for fiber prices. Additionally, higher energy prices and a focus on “green” or renewable energy, while benefiting our surplus power sales, has also led to an
42
overall increase in demand for wood residuals from otherbeen impacted by renewable energy producers
such asin Germany, particularly by wood pellet producers.
We currently expect demand from renewable energy producers will likely continue to increase over the long term, thereby putting upward pressure on prices for wood residuals such as wood chips in Germany and its neighboring countries. Similarly, renewable energy initiatives in British Columbia are increasing and could also lead to higher demand for wood residuals there over time. Higher fiber costs could affect producer profit margins if they are unable to pass along price increases to pulp customers or purchasers of surplus energy.
Our Celgar mill historically relied primarily uponGenerally weak lumber markets in 2011 and most of 2012 resulted in reduced sawmill activity and log harvesting in the regional fiber baskets for our mills. In 2013, the lumber markets improved globally which had the effect of increasing supply of chips and increased demand for the substantial majority of itssaw logs and higher quality pulp logs, which put upward pressure on log pricing. Additionally, higher energy prices and a focus on “green” or renewable energy, while benefiting our surplus power sales, led to an overall increase in demand for wood residuals in Germany from other renewable energy producers such as pellet producers. This increased demand and competition for fiber supply. With the severe economic declinehas put upward pressure on fiber prices. A recovery in 2008 and the corresponding adverse effect it had on the U.S. housing starts which commenced in the latter part of 2012 and lumber industries, many sawmills shut down or dramatically curtailed their production. Thiscontinued in 2013 resulted in a significantly reducedincreased sawmill activity. This increased the supply of sawmill chips and materially higher fiber priceswoodchips for the Celgar mill. Asmill and reduced its need for pulp logs, which are generally a result, we implemented a substantial enhancement tohigher cost for the whole log chipping facility at our Celgar mill. The capital cost of the project was approximately C$11.0 million and it was completed in early 2009. During 2009, we started up this new facility and, over the course of the year, substantially enhanced its capability so that it is now capable of supplying up to a potential 50% of the Celgar mill’s total fiber needs. The ability to conduct such whole log chipping has permitted the Celgar mill to materially reduce its dependence on third party field chippers and residual sawmill chips and to better manage its fiber costs. For a more detailed discussion of our fiber needs and resources, see “Business — Operating Costs — Fiber”.
than woodchips.Production costs also depend on the total volume of production. High operating rates and production efficiencies permit us to lower our average cost by spreading fixed costs over more units. Higher operating rates also permit us to increase our generation and sales of surplus renewable energy.energy and chemicals. Our production levels are also dependent on, among other things, the number of days of scheduled and unscheduled downtime at our mills. In 2014, we have no scheduled downtime in the first quarter. For the balance of 2014, we have scheduled maintenance downtime of ten days, or approximately 14,000 ADMTs, for our Celgar mill in the second quarter and 12 days, or approximately 12,000 ADMTs, for our Rosenthal mill in the third quarter. Our Stendal mill is not scheduled to have major maintenance downtime in 2014. Instead, in the second and fourth quarters of 2014, our Stendal mill will have two two-day shutdowns, or approximately 3,600 ADMTs for each shutdown. Unexpected production downtime, which has not materially affected us during any of the periods described in this discussion, can be particularly disruptive in our industry. Our currently scheduled production downtime for our mills in 2011, compared to prior years,product mix is as follows:
| | | | | | | | | | | | | | | | | |
| | | 2011(1) | | 2010 | | 2009 | | 2008 |
| |
Rosenthal | | | | | | | | | | | | | | | | |
| Scheduled production downtime (Days) | | | 12 | | | | 9 | (2) | | | 24 | | | | 10 | |
Celgar | | | | | | | | | | | | | | | | |
| Scheduled production downtime (Days) | | | 10 | | | | 12 | | | | 10 | | | | 12 | |
Stendal | | | | | | | | | | | | | | | | |
| Scheduled production downtime (Days) | | | 17 | | | | 10 | | | | 9 | | | | 11 | |
| | |
(1) | | Projected for 2011. |
(2) | | In addition to thenine-day scheduled production downtime taken by the Rosenthal mill, we also idled our electricity generation for an additional 51 days for turbine maintenance. |
also important because premium grades of NBSK pulp generally achieve higher prices and profit margins.Our financial performance for any reporting period is also impacted by changes in the U.S. dollar to Euro and Canadian dollar exchange rates and in interest rates. Changes in currency rates affect our operating results because the price for our principal product, NBSK pulp, is generally based on a global industry benchmark that is quoted in U.S. dollars, even though a significant portion of the sales from our German mills is invoiced in Euros and we report our results in Euros. Therefore, a weakening of the U.S. dollar against the Euro and the Canadian dollar will generally reduce the amount of our pulp operations’ revenues. Mostmost of our operating costs at our German mills, including our debt obligations under the Stendal Loan Facility and our revolving working capital facility related to the Rosenthal mill,Facilities, are incurred in Euros. Most of our operating costs at the Celgar mill, including the mill’s working capital facility, are in Canadian dollars. These costs do not fluctuate with the U.S. dollar to Euro or Canadian dollar exchange rates. Thus, a weakening of the U.S. dollar against the Euro and the Canadian dollar tends to reduceincrease our sales revenue, gross profitoperating and interest costs and decrease our operating margin and income from operations. Conversely, an increase in the U.S. dollar versus the Euro and the Canadian dollar positively impactsdecreases our revenuesoperating and interest costs and increases our operating margins and cash flow.
Changesincome from operations.On average, in interest rates can impact2012, the U.S. dollar increased by approximately 8% and by approximately 1%, respectively, versus the Euro and the Canadian dollar compared to 2011. On average, in 2013, the U.S. dollar declined by approximately 3% and increased by approximately 3%, respectively, versus the Euro and the Canadian dollar compared to 2012. If sustained in 2014, the appreciation of the U.S. dollar versus the Canadian dollar during the latter part of 2013 should positively benefit our Celgar mill’s operating results because the credit facilities established for our mills use floating rates of interest, to the extent that we have not hedged these rates.
From time to time, wemargins.We also periodically enter into interest rate, foreign currency, pulp price and energy price derivative contracts to partially protect against the effect of such changes. Gains or losses on such derivatives are included in our earnings, either as
43
they are settled or as they are marked to market for each reporting period. See “— Quantitative and Qualitative Disclosures about Market Risk”.
Stendal, as required under the Stendal Loan Facility, entered intovariable-to-fixed rate interest swaps, referred to as the “Stendal Interest Rate Swap Contracts”Contract”, in August 2002 to fix the interest rate on approximately €612.6 million ofsuch indebtedness for the full term of the Stendal Loan Facility. In 2010 and 2009, we recorded a netChanges in long-term interest rates result in our recording unrealized non-cash gain of €1.9 million and non-cash loss of €5.8 million, respectively, before noncontrolling interests on the mark to market valuation of the Stendal Interest Rate Swap Contracts. Such unrealized gain resulted primarily from a small increase in long-term European interest rates. In 2008, we recorded a net unrealized non-cash loss of €25.2 million before noncontrolling interestsgains or losses on the Stendal Interest Rate Swap Contracts. Changes in long-term interest rates could result in our recording of further unrealized non-cash losses or gains on the Stendal Interest Rate Swap Contracts in future periodsContract when they areit is marked to market.
market on a quarterly basis. Such non-realized gains or losses can materially impact our operating results for any reporting period. See “Quantitative and Qualitative Disclosures about Market Risk”.We do not believe that inflation has had a material impact on revenues or income during 2013.
Significant Actions
In 2010,2013, we took the following significant actions:
In July 2013, we commenced reducing the Celgar mill’s workforce by approximately 85 employees over the following 12-months to reduce its fixed costs. We incurred pre-tax charges of approximately $5.0 million in 2013 and expect to incur an additional $0.6 million of such expenses in 2014. We currently estimate that our Celgar mill will realize approximately $8.0 million to $10.0 million in annual pre-tax costs savings once such restructuring has been completed and currently expect to realize approximately 80% of such savings in 2014;
In July 2013, we completed our registered public offering of $50.0 million aggregate principal amount of additional Senior Notes at an issue price of 104.5%;
| | |
| • | Effectively extended the maturity of our senior unsecured indebtedness by issuing $300 million in aggregate principal amount of 2017 Senior Notes, the proceeds of which, along with cash on hand, were used to acquire approximately $288.9 million, or 93.2% of our outstanding 2013 Senior Notes; |
|
| • | Negotiated the conversion of $21.2 million of our 2012 Convertible Notes into equity and repaid the balance of our 2010 Convertible Notes; |
|
| • | Completed the Celgar Energy Project, financed primarily through government grants provided by the Canadian government; |
|
| • | Continued to focus on cost reductions and working capital management; and |
|
| • | Continued to improve operations, which allowed us to achieve record annual pulp production and energy generation. |
In September 2013, our Stendal mill amended the Stendal Facilities to provide it greater financial flexibility by, among other things, waiving compliance with certain financial ratios in 2013, amending such ratios to make them less restrictive and reducing the amount required to cure failures to satisfy such ratios;
In December 2013, we completed Project Blue Mill at our Stendal mill to increase the mill’s production of pulp and green energy and further enhance our stable stream of income from energy and chemical sales; and
We continued to improve mill operations and efficiencies, which allowed us to achieve record annual pulp production and energy generation at our German mills.
Current Market Environment
Currently, pulp demand continues to be strongDemand from China was stable throughout the year and pulpsupply was slightly under-balanced, which resulted in higher prices remain at historically high levels. Recent decreases in NBSK pulp inventory levels, along with an increase in NBSK pulp shipments, particularly to China, indicate continued strength in2013.
At year end, the NBSK pulp market throughwas slightly under-balanced with world producer inventories at about 27 days’ supply. In addition, we expect to see continued growth in NBSK demand in emerging markets, particularly in China, driven by increasing strong demand from tissue producers. As a result of the foregoing and the closure of a Norwegian mill, we currently expect that NBSK pulp prices will continue their moderate upward trend over the first half of 2011.
The completion2014. During the course of 2014, the Celgar Energy Project andglobal supply of hardwood kraft pulp is projected to increase by approximately 2.1 million ADMTs, primarily from South America. This increase in hardwood production is largely targeted at the commencementgrowing demand for pulp by tissue makers, particularly in China. If such additional hardwood pulp supply is not absorbed by such demand growth, as a result of sales of electricity pursuant to the Electricity Purchase Agreement with BC Hydro should provide us with a new stable revenue source unrelated togenerally lower prices for hardwood pulp, pricing. As we move into 2011, we expect that demand/this supply conditions, including prospects for improving Chinese demand and relatively lowincrease could put downward pressure on NBSK pulp inventory levels, should resultprices. However, we believe customers’ ability to further substitute NBSK pulp for lower priced hardwood pulp is limited by the strength characteristic provided by NBSK pulp that large modern paper machines need to run lower basis weight paper products efficiently. As pulp prices are highly cyclical, there can be no assurance that prices will not decline in a reasonably favorable outlook for our business.
44the future.
Summary Financial Highlights
| | | | | | | | | | | | |
| | | Year Ended December 31, | |
| | | 2013 | | | 2012 | | | 2011 | |
| | | (in thousands, other than per share amounts) | |
Pulp revenues | | $ | 996,187 | | | $ | 979,770 | | | $ | 1,157,206 | |
Energy and chemical revenues | | $ | 92,198 | | | $ | 92,966 | | | $ | 94,758 | |
Operating income | | $ | 31,660 | | | $ | 63,022 | | | $ | 154,665 | |
Restructuring expenses | | $ | 6,415 | | | $ | — | | | $ | — | |
Gain (loss) on derivative instruments | | $ | 19,709 | | | $ | 4,812 | | | $ | (1,974 | ) |
Income tax benefit (provision) | | $ | (9,196 | ) | | $ | (9,379 | ) | | $ | 968 | |
Net income (loss)(1) | | $ | (26,375 | ) | | $ | (15,670 | ) | | $ | 69,699 | |
Net income (loss) per share(1) | | | | | | | | | | | | |
Basic | | $ | (0.47 | ) | | $ | (0.28 | ) | | $ | 1.39 | |
Diluted | | $ | (0.47 | ) | | $ | (0.28 | ) | | $ | 1.24 | |
| (1) | Attributable to common shareholders. |
Selected Production, Sales and Other Data
Selected Financial Snapshot
Selected production, sales and exchange rate data for the periods indicated:
| | | | | | | | | | | | | |
| | | Years Ended December 31, | |
| | | 2010 | | | 2009 | | | 2008 | |
| |
Consolidated | | | | | | | | | | | | |
| Pulp Production (’000 ADMTs) | | | 1,426.3 | | | | 1,397.4 | | | | 1,425.0 | |
| Scheduled Production Downtime (’000 ADMTs) | | | 43.5 | | | | 52.1 | | | | 47.0 | |
| Pulp Sales (’000 ADMTs) | | | 1,428.6 | | | | 1,445.5 | | | | 1,423.3 | |
| Pulp Revenues (in millions) | | € | 856.3 | | | € | 577.3 | | | € | 689.3 | |
| NBSK pulp list prices ($/ADMT) | | $ | 938 | | | $ | 667 | | | $ | 839 | |
| NBSK pulp list prices (€/ADMT) | | € | 707 | | | € | 478 | | | € | 571 | |
| Average pulp sales realizations (€/ADMT)(1) | | € | 591 | | | € | 393 | | | € | 478 | |
| Energy Production (’000 MWh) | | | 1,444.1 | | | | 1,445.3 | | | | 1,456.6 | |
| Energy Sales (’000 MWh) | | | 520.0 | | | | 478.7 | | | | 456.1 | |
| Energy Revenue (in millions) | | € | 44.2 | | | € | 42.5 | | | € | 31.0 | |
| Average energy sales realizations (€/MWh) | | € | 85 | | | € | 89 | | | € | 68 | |
| | | | | | | | | | | | | |
Restricted Group | | | | | | | | | | | | |
| Pulp Production (’000 ADMTs) | | | 826.3 | | | | 777.1 | | | | 814.6 | |
| Scheduled Production Downtime (’000 ADMTs) | | | 25.3 | | | | 36.9 | | | | 25.7 | |
| Pulp Sales (’000 ADMTs) | | | 826.3 | | | | 795.1 | | | | 833.2 | |
| Pulp Revenues (in millions) | | € | 490.0 | | | € | 318.4 | | | € | 401.0 | |
| NBSK pulp list prices ($/ADMT) | | $ | 938 | | | $ | 667 | | | $ | 839 | |
| NBSK pulp list prices (€/ADMT) | | € | 707 | | | € | 478 | | | € | 571 | |
| Average pulp sales realizations (€/ADMT)(1) | | € | 592 | | | € | 400 | | | € | 480 | |
| Energy Production (’000 MWh) | | | 718.6 | | | | 732.9 | | | | 764.4 | |
| Energy Sales (’000 MWh) | | | 194.2 | | | | 178.4 | | | | 177.2 | |
| Energy Revenue (in millions) | | € | 15.1 | | | € | 15.2 | | | € | 12.1 | |
| Average energy sales realizations (€/MWh) | | € | 78 | | | € | 85 | | | € | 68 | |
| | | | | | | | | | | | | |
Average Spot Currency Exchange Rates | | | | | | | | | | | | |
| € / $(2) | | | 0.7541 | | | | 0.7176 | | | | 0.6826 | |
| C$ / $(2) | | | 1.0298 | | | | 1.1412 | | | | 1.0660 | |
| C$ / €(3) | | | 1.3671 | | | | 1.5851 | | | | 1.5603 | |
| | | | | | | | | | | | |
| | | Year Ended December 31, | |
| | | 2013 | | | 2012 | | | 2011 | |
Consolidated | | | | | | | | | | | | |
Pulp production (‘000 ADMTs) | | | 1,444.5 | | | | 1,468.3 | | | | 1,453.7 | |
Scheduled production downtime (‘000 ADMTs) | | | 47.8 | | | | 50.9 | | | | 52.4 | |
Scheduled production downtime (days) | | | 33 | | | | 40 | | | | 35 | |
Pulp sales (‘000 ADMTs) | | | 1,440.1 | | | | 1,473.5 | | | | 1,427.9 | |
Average NBSK pulp list prices in Europe ($/ADMT)(1) | | | 864 | | | | 813 | | | | 956 | |
Average pulp sales realizations ($/ADMT)(2) | | | 683 | | | | 657 | | | | 799 | |
Energy production (‘000 MWh) | | | 1,710.2 | | | | 1,704.1 | | | | 1,640.4 | |
Energy sales (‘000 MWh) | | | 699.1 | | | | 710.2 | | | | 652.1 | |
Average energy sales realizations ($/MWh) | | | 114 | | | | 110 | | | | 124 | |
Average Spot Currency Exchange Rates | | | | | | | | | | | | |
$ / €(3) | | | 1.3281 | | | | 1.2859 | | | | 1.3931 | |
$ / C$(3) | | | 0.9712 | | | | 1.0007 | | | | 1.0121 | |
| | |
| (1) | Source: RISI pricing report. |
| (2) | Our averageAverage realized pulp price for the periodperiods indicated reflect customer discounts and pulp price movements between the order and shipment date. |
(2) | (3) | Average Federal Reserve Bank of New York noon spot rate over the reporting period. |
(3) | | Average Bank of Canada noon spot rate over the reporting period. |
Year Ended December 31, 20102013 Compared to Year Ended December 31, 20092012
In the year ended December 31, 2010,2013, pulp revenues increased by approximately 48%2% to €856.3$996.2 million from €577.3$979.8 million in 2009,2012, primarily due to significantly higher average pulp prices and a stronger U.S. dollar relative to the Euro. In 2010, revenues from the sale of excess energy increased by approximately 4% to €44.2 million from €42.5 million in 2009 due to increased energy sales at our Celgar mill,realizations, partially offset by reducedlower sales volume. In 2013, demand from China was stable throughout the year and supply was slightly under-balanced, which resulted in higher prices in 2013.
In 2013, surplus energy and chemicals sales at our Rosenthal mill caused by 60 days of scheduled turbine maintenance.
Pulp prices increasedmarginally decreased to $92.2 million from $93.0 million in
2010,2012, primarily as a result of
stronger pulp markets. lower sales volumes.List prices for NBSK pulp in Europe averaged approximately $938 (€707)$864 per ADMT in 2010,2013, compared to approximately $667 (€478)$813 per ADMT in 2009.2012. At the end of 2010,2013, list prices increased to approximately $950 (€709)were $905 per ADMT in Europe and $960 (€717)$990 and $840 (€627)$750 per ADMT in North America and China, respectively. Average pulp sales realizations increased by approximately 50%4% to €591$683 per ADMT in 20102013 from €393$657 per ADMT in 2009,2012, primarily due to significantly higher pulp prices. At the end of 2010,2013, reported global inventories for softwood kraft were
45
approximately 2527 days’ supply, while at the end of 20092012 inventories for softwood kraft reached historically low levels ofwere approximately 19 days, primarily due to exceptionally high demand combined with producer shutdowns.
29 days’ supply.Pulp sales volume decreased slightlyby approximately 2% to 1,428,6381,440,147 ADMTs in 20102013 from 1,445,4611,473,519 ADMTs in 2009.
Pulp production increased to a record level of 1,426,286 ADMTs in 2010 from 1,397,441 ADMTs in 2009,2012, primarily as a result of
overall strong operating performancelower production levels at
all of our
mills.Celgar mill.Pulp production decreased to 1,444,475 ADMTs in 2013 from 1,468,275 ADMTs in 2012, primarily due to lower production at our Celgar mill. In 20102013 and 2009,2012, we took a total of 3133 and 43 days40 days’ scheduled maintenance downtime, respectively, at our mills and expect to take approximately 3926 days in 2011.
2014. During the second quarter of 2013, our Celgar mill took its annual scheduled major maintenance shutdown. As a result of a combination of a lightning strike at the mill and equipment and execution issues, the shutdown which was planned for 11 days took 15 days instead. Further, the start-up of the mill was slower than budgeted. The shutdown and slower start-up resulted in a loss of approximately 30,300 ADMTs of NBSK pulp production (of which approximately 14,300 ADMTs was unplanned) and a consequential loss of energy production.Costs and expenses increased to €732.8$1,056.7 million in the year ended December 31, 20102013 from €632.6$1,009.7 million in 2009,2012, primarily due to higher fiber costs.
costs at our German mills and the impact of a weaker U.S. dollar relative to the Euro on our German mill expenses and restructuring costs, partially offset by lower sales volume. Our costs and expenses in 2013 included approximately $24.7 million for regularly scheduled maintenance costs, compared to $17.9 million in 2012. Several competing producers and members of the peer group that we benchmark our performance against report their financial results in accordance with International Financial Reporting Standards which permit a significant portion of such maintenance costs to be capitalized instead of expensed. Such costs are not charged to EBITDA by the peer group companies but instead are expensed as depreciation.On average, in 2010,2013, our overall per unit fiber costs increased by approximately 24%8% compared to 2009. In Germany,2012, primarily due to a 13% increase in per unit fiber costs in Germany, only partially offset by a 12% decrease in per unit fiber costs in Canada. Fiber costs in Germany were higher primarily as a resultbecause of lower levels of harvesting, combined with increasedstrong demand for wood from the energy sectorEuropean pellet and board producers and sawmills, which increased prices for heating and other bio-energy purposes. Extreme winter weather inpulp logs, the fourth quarter of 2010 further reduced the availabilitymajor source of fiber for the Stendal mill. Further, in 2013, fiber supply in Germany was negatively impacted by several different factors. These included harsh winter conditions at the start of 2013, which later resulted in record flooding and mild, very wet conditions at the end of 2013. All these conditions hampered harvesting and fiber logistics during 2013. We currently expect fiber costs at our German mills.mills to stabilize in the short- to mid-term, primarily due to the mild winter in Germany which should reduce competition from the pellet industry and improve supply. Fiber costs at our Celgar mill were lower, primarily due to strong sawmill activity in the region, which reduces Celgar’s need for pulp logs, which are generally a higher cost for the mill than woodchips. We expect flat pricing in Canada as a result of continued strong sawmill activity in British Columbia.
Operating depreciation and amortization increased marginallyto $78.3 million in 2013 from the prior year. In the near term, we expect fiber costs to increase slightly at our German mills, while remaining generally flat at our Celgar mill.
$74.3 million in 2012. Selling, general and administrative expenses increased to
€33.4$51.2 million in
20102013 from
€27.4$49.3 million in
2009,2012.In 2013, we had restructuring expenses of $6.4 million, primarily related to the workforce reduction at our Celgar mill.
In 2013, operating income decreased to $31.7 million from $63.0 million in 2012, primarily due to higher fiber costs in Germany, the impact of a weaker U.S. dollar relative to the Euro on our German mill expenses and the Celgar restructuring, partially offset by a higher realized sales price.
Interest expense in 2013 decreased to $69.2 million from $71.8 million in 2012, primarily due to reduced debt levels associated with our Stendal mill.
Transportation costs decreased to $90.0 million in 2013 from $92.3 million in 2012, primarily as a result of increased commission costs.
lower sales volume.In 2010, contribution to income from the sale of emission allowances decreased to €0.1 million, compared to €0.5 million in 2009. Operating depreciation and amortization increased marginally to €55.9 million in 2010 from €53.9 million in 2009, primarily due to capital asset additions related to the Celgar Energy Project.
For the year ended December 31, 2010, operating income significantly increased to €167.7 million from a loss of €12.8 million in 2009, primarily due to higher price realizations resulting from higher pulp prices.
Interest expense in 2010 increased to €67.6 million from €64.8 million in 2009, primarily due to accretion expense related to the exchange of our 2010 Convertible Notes, partially offset by reduced levels of debt associated with our Stendal mill.
Transportation costs increased to €66.4 million in 2010 from €57.3 million in 2009, primarily due to higher container rates.
In 2010,2013, we recorded an unrealized gain of €1.9$22.5 million on the Stendal Interest Rate Swap Contracts,Contract, compared to an unrealized lossgain of €5.8$2.2 million in 2009,2012, which was primarily the result of a smallan increase in short-term European interest rates.
A portion of our long-term debt is denominated and repayable in foreign currencies, principally U.S. dollars. In 2010, we We recorded a foreign exchange loss on our debt of €6.1approximately $2.8 million as a result ofrelated to fixed pulp price swap contracts during the strengthening of the U.S. dollar against the Euro,year ended December 31, 2013, compared to a gain of €2.7$2.6 million in 2009.
During 2010, we recorded losses onduring the
extinguishment of debt of €7.5 million, primarily in connection with the purchase of ouryear ended December 31, 2012.In 2013, Senior Notes. In 2009, we recorded a gain of €4.4 million on the extinguishment of our 2010 Convertible Notes.
In 2010, the noncontrolling shareholder’s proportionate interest in the Stendal
mill’s gainmill was
€8.5income of $0.6 million, compared to
$2.2 million in 2012.In 2013, we recognized a deferred tax expense of $11.5 million, primarily as a result of an increase in the valuation allowance against the carrying value of deferred tax assets on our balance sheet, compared to a recovery of $0.2 million in 2012. This is a non-cash charge and does not reduce our underlying tax attributes or hinder our ability to use them. See “— Critical Accounting Policies — Deferred Tax Assets”.
In 2013, we reported a net loss of €9.9 million in 2009.
During 2010, income taxes increased to €3.9 million from €0.1 million in 2009, primarily due to improved operating results at our German mills and certain tax deduction limitations with regards to the ability to deduct interest expense and loss carry forwards. Deferred tax recoveries increased in 2010 to €9.8 million from €6.0 million in 2009, primarily due to improved results and forecasted taxable income.
In 2010, we reported net income attributable to common shareholders of €86.3$26.4 million, or €2.24 per basic and €1.56 per diluted share. This included unrealized aggregate net non-cash unrealized losses of € 0.5 million, comprised of a non-cash gain of €1.9 million on our Stendal Interest Rate Swap Contracts, a non-cash foreign
46
exchange loss of €6.1 million on our long-term debt, a non-cash loss of €2.6 million on the extinguishment of our 2013 Senior Notes and a non-cash income tax benefit of €6.3 million. In 2009, we reported net loss attributable to common shareholders of €62.2 million, or €1.71$0.47 per basic and diluted share. This included unrealized aggregate non-casha net gainsgain of €7.5$19.7 million comprisedon Stendal interest rate derivatives and pulp price derivatives, restructuring expenses of $6.4 million and $11.5 million of a non-cashdeferred tax expense. In 2012, we reported a net loss of €5.8$15.7 million, or $0.28 per basic and diluted share. This included a net gain of $4.8 million on our Stendal Interest Rate Swap Contracts, a non-cash foreign exchange gain of €2.7 million on our long-term debt, a non-cash gain of €4.4 million on the extinguishment of our convertible notesinterest rate derivatives and a non-cash income tax benefit of €6.2 million.
fixed price pulp derivatives.In 2010,2013, “Operating EBITDA” increased fivefolddecreased to €224.0$110.3 million from €41.4$137.7 million in 2009.2012 for the same reasons that operating income declined. Operating EBITDA is defined as operating income (loss) plus depreciation and amortization and non-recurring capital asset impairment charges. Management uses Operating EBITDA as a benchmark measurement of its own operating results, and as a benchmark relative to its competitors. Management considers it to be a meaningful supplement to operating income as a performance measure primarily because depreciation expense and non-recurring capital asset impairment charges are not an actual cash cost, and depreciation expense varies widely from company to company in a manner that management considers largely independent of the underlying cost efficiency of their operating facilities. In addition, we believe Operating EBITDA is commonly used by securities analysts, investors and other interested parties to evaluate our financial performance.
Operating EBITDA does not reflect the impact of a number of items that affect our net income (loss) attributable to common shareholders, including financing costs and the effect of derivative instruments. Operating EBITDA is not a measure of financial performance under the accounting principles generally accepted in the United States of America, (“GAAP”)referred to as “GAAP”, and should not be considered as an alternative to net income (loss) or income (loss) from operations as a measure of performance, nor as an alternative to net cash from operating activities as a measure of liquidity.
Operating EBITDA has significant limitations as an analytical tool, and should not be considered in isolation, or as a substitute for analysis of our results as reported under GAAP. Some of these limitations are that Operating EBITDA does not reflect: (i) our cash expenditures, or future requirements, for capital expenditures or contractual commitments; (ii) changes in, or cash requirements for, working capital needs; (iii) the significant interest expense, or the cash requirements necessary to service interest or principal payments, on our outstanding debt; (iv) noncontrolling interestsinterest on our Stendal NBSK pulp mill operations; (v) the impact of realized or marked to market changes in our derivative positions, which can be substantial; and (vi) Operating EBITDA does not reflect the impact of impairment charges against our investments or assets. Because of these limitations, Operating EBITDA should only be considered as a supplemental performance measure and should not be considered as a measure of liquidity or cash available to us to invest in the growth of our business. See the Statement of Cash Flows set out in our consolidated financial statements included herein. Because all companies do not calculate Operating EBITDA in the same manner, Operating EBITDA as calculated by us may differ from Operating EBITDA or EBITDA as calculated by other companies. We compensate for these limitations by using Operating EBITDA as a supplemental measure of our performance and by relying primarily on our GAAP financial statements.
47
The following table provides a reconciliation of net income (loss) attributable to common shareholders to operating income (loss) and Operating EBITDA for the periods indicated:
| | | | | | | | | |
| | | Years Ended December 31, | |
| | | 2010 | | | 2009 | |
| | | (in thousands) | |
| |
| Net income (loss) attributable to common shareholders | | € | 86,279 | | | € | (62,189 | ) |
| Net income (loss) attributable to noncontrolling interest | | | 8,469 | | | | (9,936 | ) |
| Income taxes (benefits) | | | (5,879 | ) | | | (5,869 | ) |
| Interest expense | | | 67,621 | | | | 64,770 | |
| Investment (income) loss | | | (468 | ) | | | 1,804 | |
| Foreign exchange (gain) loss on debt | | | 6,126 | | | | (2,692 | ) |
| Loss (gain) on extinguishment of debt | | | 7,494 | | | | (4,447 | ) |
| Loss (gain) on derivative instruments | | | (1,899 | ) | | | 5,760 | |
| | | | | | | | | |
| Operating income (loss) | | | 167,743 | | | | (12,799 | ) |
| Add: Depreciation and amortization | | | 56,231 | | | | 54,170 | |
| | | | | | | | | |
| Operating EBITDA | | € | 223,974 | | | € | 41,371 | |
| | | | | | | | | |
| | | | | | | | |
| | | Year Ended December 31, | |
| | | 2013 | | | 2012 | |
| | | (in thousands) | |
Net income (loss) attributable to common shareholders | | $ | (26,375 | ) | | $ | (15,670 | ) |
Net income (loss) attributable to noncontrolling interest | | | 607 | | | | 2,179 | |
Income tax provision | | | 9,196 | | | | 9,379 | |
Interest expense | | | 69,156 | | | | 71,767 | |
Loss (gain) on derivative instruments | | | (19,709 | ) | | | (4,812 | ) |
Other expense (income) | | | (1,215 | ) | | | 179 | |
| | | | | | | | |
Operating income | | | 31,660 | | | | 63,022 | |
Add: Depreciation and amortization | | | 78,645 | | | | 74,657 | |
| | | | | | | | |
Operating EBITDA | | $ | 110,305 | | | $ | 137,679 | |
| | | | | | | | |
Year Ended December 31, 20092012 Compared to Year Ended December 31, 20082011
In the year ended December 31, 2009,2012, pulp revenues decreased by approximately 16%15% to €577.3$979.8 million from €689.3$1,157.2 million in 2008,2011, primarily due to lower average pulp sales prices.realizations, partially offset by higher pulp sales volumes. In 2009, revenues from2012, there was continuing economic uncertainty in Europe and credit tightening in China in the salefirst half of excessthe year. Further, in the latter part of 2012, weak demand for paper in Europe resulted in some integrated producers curtailing their paper production and selling their pulp on the market, primarily in China. These factors negatively impacted demand and supply and list prices for NBSK pulp. NBSK pulp prices remained relatively stable during the first quarter of 2012 before decreasing in the middle part of the year and were generally stagnant in the latter part of 2012.
In 2012, surplus energy increasedand chemicals sales decreased by approximately 2% to €42.5$93.0 million from €31.0$94.8 million in 2008.
Pulp prices decreased in 2009,2011, primarily
asdue to the impact of a
resultstronger U.S. dollar relative to the Euro on sales from our German mills, partially offset by the impact of
significantly weaker demand. record pulp production.List prices for NBSK pulp in Europe averaged approximately $667 (€478)$813 per ADMT in 2009,2012, compared to approximately $839 (€571)$956 per ADMT in 2008.2011. At the end of 2009,2012, list prices increased to approximately $800 (€558)were $810 per ADMT in Europe and $700 (€488)$870 and $655 per ADMT in Asia, depending upon the country of delivery.North America and China, respectively. Average pulp sales realizations decreased by approximately 18% to €393$657 per ADMT in 20092012 from €478$799 per ADMT in 2008 because of2011, primarily due to lower pulp prices. The weakened market conditions, however, were partially offset by an overall slightly higher U.S. dollar duringAt the year. At December 31, 2009,end of 2012, reported global inventories for softwood kraft decreased towere approximately 1929 days’ supply, compared to 40 dayswhile at the end of 2008.
2011 inventories for softwood kraft were approximately 36 days’ supply.Pulp sales volume increased by approximately 3% to 1,445,461a record 1,473,519 ADMTs in 20092012 from 1,423,3001,427,924 ADMTs in 2008.
Pulp production decreased to 1,397,441 ADMTs in 2009 from 1,424,987 ADMTs in 2008,2011, primarily as a result of
increased sales to China in 2012.Pulp production increased to a heavier scheduled maintenance program.record level of 1,468,275 ADMTs in 2012 from 1,453,677 ADMTs in 2011, primarily due to increased pulp production at our Stendal and Celgar mills. In 20092012 and 2008,2011, we took a total of 4340 and 3335 days scheduled maintenance downtime, respectively, at our mills.
Costs and expenses decreased to €632.6$1,009.7 million in the year ended December 31, 20092012 from €707.0$1,097.3 million in 2008,2011, primarily due to the impact of a stronger U.S. dollar relative to the Euro on our German mill expenses and lower fiber costs.
costs, partially offset by higher pulp sales volumes in 2012. Our costs and expenses in 2012 included approximately $17.9 million for regularly scheduled maintenance costs, compared to $24.2 million in 2011. Several competing producers and members of the peer group that we benchmark our performance against report their financial results in accordance with International Financial Reporting Standards which permit a significant portion of such maintenance costs to be capitalized instead of expensed. Such costs are not charged to EBITDA by the peer group companies but instead are expensed as depreciation.On average, in 2009,2012, our per unit fiber costs decreased by approximately 16%14% compared to 2008. In Germany,2011, primarily due to lower fiber costs were significantly lower asin Germany caused by the impact of a stronger U.S. dollar relative to the Euro and decreased demand from the European particle board industry decreased.and other regional residual fiber users. Fiber costs at our Celgar mill decreased fromwere lower due to the prior year primarily as a resultimpact of improved woodroom performancewood chip availability for the region.
Operating depreciation and amortization decreased reliance on fiber sourcedto $74.3 million in 2012 from third party field chippers.
$77.6 million in 2011. Selling, general and administrative expenses decreased to €27.4$49.3 million in 20092012 from €30.2$54.0 million in 2008.
2011.In 2009, contribution to2012, operating income from the sale of emission allowances decreased to €0.5$63.0 million compared to €5.6from $154.7 million in 2008. Operating depreciation and amortization decreased marginally to €53.9 million in 2009 from €55.5 million in 2008.
For the year ended December 31, 2009, operating income (loss) decreased to a loss of €12.8 million from an income of €13.3 million in 2008,2011, primarily due to lower price realizations.
average pulp sales realizations, partially offset by lower fiber costs.Interest expense in 20092012 decreased to €64.8$71.8 million from €65.8$82.1 million in 20082011, primarily due to lowerthe impact of a stronger U.S. dollar relative to the Euro on our Stendal mill interest expense, reduced debt levels associated with our Stendal mill and the conversion of borrowing.
48
Transportation costs decreased to €57.3$92.3 million in 20092012 from €66.8$94.4 million in 2008,2011, primarily due toas a result of lower shipments.
container costs, partially offset by higher sales volumes.In 2009,2012, we recorded an unrealized lossgain of €5.8$2.2 million on the Stendal Interest Rate Swap Contracts,Contract, compared to an unrealized loss of €25.2$2.0 million in 2008,2011, which was primarily the result of lower long-terman increase in short-term European interest rates in 2009.
A portion of our long-term debt is denominated and repayable in foreign currencies, principally U.S. dollars. In 2009, we recorded a foreign exchange gain on our debt of €2.7 million as a result of the weakening of the U.S. dollar in the latter part of the year, compared to a loss of €4.2 million in 2008.
In the fourth quarter of 2009, we completed an exchange of approximately €30.2 million ($43.3 million) in aggregate principal amount of our 2010 Convertible Notes for new 2012 Convertible Notes.rates. We also recorded a gain of approximately €4.4$2.6 million onrelated to these fixed pulp price swap contracts during the extinguishment of the 2010 Convertible Notes.
year ended December 31, 2012.In 2009,2012, the noncontrolling shareholder’s proportionate interest in the Stendal mill’s lossincome was €9.9$2.2 million, compared to a loss of €13.1$5.5 million in 2008.
During 2009, income taxes decreased slightly2011.In 2012, deferred tax recoveries were $0.2 million, compared to €0.1 million from €0.5deferred tax recoveries of $3.3 million in 2008. Deferred tax recoveries increased in 2009 to €6.0 million from a €2.0 million deferred tax provision recognized in 2008,2011, primarily due to management’s belief that it is more likely than not that certainthe timing of recognizing deferred tax assets will be recognized based on forecasted taxable income.
In 2009,2012, we reported a net loss attributable to common shareholders of €62.2$15.7 million, or €1.71$0.28 per basic and diluted share whichshare. This included an unrealizeda net gain of $4.8 million on the Stendal interest rate derivatives and fixed price pulp derivatives. In 2011, we reported net income of $69.7 million, or $1.39 per basic and $1.24 per diluted share. This included a non-cash loss of €3.1$2.0 million on our Stendal Interest Rate Swap Contracts and a foreign exchange gain on our long-term debt. Contract.
In 2008, we reported net loss attributable2012, Operating EBITDA decreased to common shareholders of €72.5$137.7 million or €2.00 per basic and diluted share, which included an unrealized loss of €29.5 million on our Stendal Interest Rate Swap Contracts and a foreign exchange loss on our long-term debt and non-cash inventory provisions totaling €11.3 million.
In 2009, “Operating EBITDA” was €41.4 million, compared to €69.1from $232.6 million in 2008. Operating EBITDA is defined as operating income (loss) plus depreciation and amortization and non-recurring capital asset impairment charges. Operating EBITDA has significant limitations as an analytical tool, and should not be considered in isolation, or as a substitute for analysis of our results as reported under GAAP.2011. See the discussion of our results for the year ended December 31, 20102013 compared to the year ended December 31, 20092012 for the definition of Operating EBITDA, significant limitations in Operating EBITDA as an analytical tool and additional information relating to such limitations andof Operating EBITDA.
The following table provides a reconciliation of net income (loss) attributable to common shareholders to operating income (loss) and Operating EBITDA for the periods indicated:
| | | | | | | | | |
| | | Years Ended December 31, | |
| | | 2009 | | | 2008 | |
| | | (in thousands) | |
| |
| Net income (loss) attributable to common shareholders | | € | (62,189 | ) | | € | (72,465 | ) |
| Net income (loss) attributable to noncontrolling interest | | | (9,936 | ) | | | (13,075 | ) |
| Income taxes (benefits) | | | (5,869 | ) | | | 2,477 | |
| Interest expense | | | 64,770 | | | | 65,756 | |
| Investment (income) loss | | | 1,804 | | | | 1,174 | |
| Foreign exchange (gain) loss on debt | | | (2,692 | ) | | | 4,234 | |
| Loss (gain) on extinguishment of debt | | | (4,447 | ) | | | — | |
| Loss (gain) on derivative instruments | | | 5,760 | | | | 25,228 | |
| | | | | | | | | |
| Operating income (loss) | | | (12,799 | ) | | | 13,329 | |
| Add: Depreciation and amortization | | | 54,170 | | | | 55,762 | |
| | | | | | | | | |
| Operating EBITDA | | € | 41,371 | | | € | 69,091 | |
| | | | | | | | | |
49
| | | | | | | | |
| | | Year Ended December 31, | |
| | | 2012 | | | 2011 | |
| | | (in thousands) | |
Net income (loss) attributable to common shareholders | | $ | (15,670 | ) | | $ | 69,699 | |
Net income attributable to noncontrolling interest | | | 2,179 | | | | 5,471 | |
Income tax provision (benefit) | | | 9,379 | | | | (968 | ) |
Interest expense | | | 71,767 | | | | 82,114 | |
Loss (gain) on derivative instruments | | | (4,812 | ) | | | 1,974 | |
Other expense (income) | | | 179 | | | | (3,625 | ) |
| | | | | | | | |
Operating income | | | 63,022 | | | | 154,665 | |
Add: Depreciation and amortization | | | 74,657 | | | | 77,952 | |
| | | | | | | | |
Operating EBITDA | | $ | 137,679 | | | $ | 232,617 | |
| | | | | | | | |
Sensitivities
Sensitivities
Our earnings are sensitive to, among other things, fluctuations in:
NBSK Pulp Price. NBSK pulp is a global commodity that is priced in U.S. dollars, whose markets are highly competitive and cyclical in nature. As a result, our earnings are sensitive to NBSK pulp price changes. Based upon our 20102013 sales volume (and assuming all other factors remained constant), each $10.00 per tonne change in NBSK list pulp prices yields a change in Operating EBITDA of approximately €10.8$12.0 million.
Foreign Exchange.Our operating costs are in Euros for our German mills and Canadian dollars for our Celgar mill. As NBSK pulp is principally quoted in U.S. dollars, the amount of revenues we generate fluctuatesa result, our operating costs will fluctuate with changes in the value of the U.S.U.S dollar relative to the Euro.Euro and Canadian dollar. Based uponon our 2010 revenues,2013 operating costs, each €0.01$0.01 change in the value of the U.S. dollar relative to the Euro and the Canadian dollar yields a total change in annual gross sales revenueoperating costs of approximately €11.4$8.0 million.
Seasonal Influences.We are exposed to fluctuations in quarterly sales volumes and expenses due to seasonal factors. These factors are common in the NBSK pulp industry. We generally have weaker pulp demand in Europe during the summer holiday months and in China in the period relating to its lunar new year. We typically have a seasonal build-up in raw material inventories in the early winter months as the mills build up their fiber supply for the winter when there is reduced availability.
Liquidity and Capital Resources
The following table is a summarySummary of selected financial information for the periods indicated:
| | | | | | | | | |
| | | Years Ended December 31, |
| | | 2010 | | 2009 |
| | | (in thousands) |
| |
Financial Position | | | | | | | | |
| Cash and cash equivalents | | € | 99,022 | | | € | 51,291 | |
| Working capital | | | 231,683 | | | | 99,150 | |
| Property, plant and equipment | | | 846,767 | | | | 868,558 | |
| Total assets | | | 1,216,075 | | | | 1,083,831 | |
| Long-term liabilities | | | 877,315 | | | | 896,074 | |
| Total equity | | | 213,563 | | | | 85,973 | |
Sources and Uses of FundsCash Flows
Our principal sources of funds are cash flows from operations, cash on hand and the revolving working capital loan facilities for our Celgar and Rosenthal mills. Our principal uses of funds consist of operating expenditures, payments of principal and interest on the Stendal Loan Facility, capital expenditures and interest payments on our outstanding 2017 Senior Notes and 2012 Convertible Notes.
As at December 31, 2010, our cash and cash equivalents were €99.0 million, compared to €51.3 million at the end of 2009.
In February 2009, to increase its liquidity and financial flexibility, Stendal entered into the Amendment for its Stendal Loan Facility. The Amendment revised the repayment schedule of principal payments due by deferring approximately €164.0 million of principal payments until maturity on September 30, 2017. The Deferred Amount includes approximately €20.0 million, €26.0 million and €21.0 million of scheduled principal payments in 2009, 2010 and 2011, respectively. In accordance with the revised repayment schedule, we made principal payments totaling €13.9 million during 2010 and are required to make principal payments totaling €23.2 million during 2011. The Amendment also provided for a cash sweep of any excess cash of Stendal which will be used first to prepay the Deferred Amount and second to fund the DSRA. Not included in the cash sweep is €15.0 million which Stendal is permitted to retain for working capital purposes. For a description of the Stendal Loan Facility see “Item 1 — Business — Description of Certain Indebtedness”.
The Stendal Loan Facility is provided by a syndicate of eleven financial institutions and both our Celgar Working Capital Facility and our Rosenthal Loan Facility are each provided by one financial institution. To date we have not experienced any reductions in credit availability with respect to these credit facilities. However, if any of these financial institutions were to default on their commitment to fund, we could be adversely affected. For a description of the Celgar Working Capital Facility and the Rosenthal Loan Facility, see “Item 1 — Business — Description of Certain Indebtedness”.
50
| | | | | | | | | | | | |
| | | Year Ended December 31, | |
| | | 2013 | | | 2012 | | | 2011 | |
| | | (in thousands) | |
Net cash provided by operating activities | | $ | 36,325 | | | $ | 59,115 | | | $ | 154,576 | |
Net cash provided by (used in) investing activities | | | (44,968 | ) | | | (30,610 | ) | | | (63,849 | ) |
Net cash provided by (used in) financing activities | | | 15,233 | | | | (29,667 | ) | | | (82,862 | ) |
Effect of exchange rate on changes in cash and cash equivalents | | | 3,699 | | | | 2,302 | | | | (4,166 | ) |
| | | | | | | | | | | | |
Net increase in cash and cash equivalents | | $ | 10,289 | | | $ | 1,140 | | | $ | 3,699 | |
| | | | | | | | | | | | |
In 2010, capital expenditures related to the Celgar Energy Project totaled approximately €26.2 million, substantially all of which was financed through a C$48.0 million grant from the Canadian federal government under the GTP. See “Item 1 — Business — Generation and Sales of ‘Green’ Energy at our Mills”.
Debt
As at December 31, 2010, the amount outstanding under Stendal Loan Facility was €500.7 million. We also had approximately C$20.0 million outstanding under the Celgar Working Capital Facility and €3.8 million under our Rosenthal investment loan. As at December 31, 2010, we had no amount drawn on the Rosenthal Loan Facility.
Additionally, we have $300 million (€224.0 million) in principal amount of our 2017 Senior Notes outstanding which mature in December 2017 and for which we pay interest at the rate of 9.5% on June 1 and December 1 of each year. The indenture governing the 2017 Senior Notes does not contain any financial maintenance covenants and there are no scheduled principal payments until maturity. We also had approximately $20.5 million in aggregate principal amount of our 2013 Senior Notes remaining as at December 31, 2010 which were all redeemed on February 15, 2011.
Further, we had approximately $42.5 million (€31.7 million) in aggregate principal amount of 2012 Convertible Notes outstanding as of December 31, 2010. The indenture governing the 2012 Convertible Notes does not have any financial maintenance covenants.
For a description of the Senior Notes, the 2010 Convertible Notes and the 2012 Convertible Notes, see “Item 1 — Business — Description of Certain Indebtedness”.
Debt Covenants
Our long-term obligations contain various financial tests and covenants customary to these types of arrangements.
The Stendal Loan Facility contains an annual debt service cover ratio which, pursuant to the terms of the Amendment, must not fall below 1.1x for the period from December 31, 2011 to December 31, 2013 and 1.2x for the period after January 1, 2014 until maturity on September 30, 2017. The Amendment also implements a permitted leverage ratio of total debt to EBITDA which is effective from December 31, 2009. This ratio, which the lenders waived for 2009, is set to decline over time from 13.0x on its effective date to 4.5x on June 30, 2017. Failure to comply with either ratio constitutes an event of default, but may be cured by the shareholders of Stendal with aonce-per-fiscal-year ratio deficiency cure through a capital contribution or subordinated loan in the amount necessary to cure such deficiency.
Under the Rosenthal Loan Facility, our Rosenthal mill must not exceed a ratio of net debt to EBITDA of 3:1 in any12-month period and there must be a ratio of EBITDA to interest expense equal to or in excess of 1.2:1.1 for each 12 month period. Additionally, current assets to current liabilities must equal or exceed 1.1:1.0.
The Celgar Working Capital Facility includes a covenant that, for so long as the excess amount under the facility is less than C$2.0 million, then until it becomes equal to or greater than such amount, the Celgar mill must maintain a fixed charge coverage ratio of not less than 1.1:1.0 for each12-month period.
As at December 31, 2010, we were in full compliance with all of the covenants of our indebtedness.
Cash Flow Analysis
Cash Flows from Operating Activities.Activities.We operate in a cyclical industry and our operating cash flows vary accordingly. Our principal operating cash expenditures are for labor, fiber, chemicals and debt service.
Working capital levels fluctuate throughout the year and are affected by maintenance downtime, changing sales patterns, seasonality and the timing of receivables and the payment of payables and expenses. Generally, finished goods inventories are increased prior to scheduled maintenance downtime to maintain sales volume while production is stopped. Our fiber inventories exhibit seasonal swings as we increase pulp log and wood chip inventories to ensure adequate supply of fiber to our mills during the winter months. Changes in sales volume can
51
affect the level of receivables and influence overall working capital levels. We believe our management practices with respect to working capital conform to common business practices.
OperatingCash provided by operating activities in 20102013 decreased to $36.3 million from $59.1 million in 2012 and $154.6 million in 2011 due to lower operating income. A decrease in receivables, excluding non-cash items, provided cash of €91.3$14.0 million in 2013, compared to providing cash of €37.3$10.8 million in 2009, primarily due to a significant increase in net income, partially offset by2012 and an increase in working capital. An increase in receivables usedusing cash of €40.0$2.2 million in 2010, compared to a decrease in receivables providing cash of €31.9 million in 2009.2011. An increase in inventories used cash of €24.5$14.6 million in 2010,2013, compared to a decrease in inventories providing cash of €32.2$1.7 million in 2009.2012 and an increase in inventories using cash of $24.7 million in 2011. A decrease in accounts payable and accrued expenses used cash of €3.1$11.6 million in 2010 and €3.02013, compared to $18.0 million in 2009.
2012 and an increase in accounts payable and accrued expenses providing cash of $19.8 million in 2011.Cash Flows from Investing Activities. Investing activities in 20102013 used cash of €36.0$45.0 million, primarily related to capital expenditures of $45.7 million. Investing activities in 2012 used cash of $30.6 million, primarily due to capital spending of €38.3$47.2 million. The maturity of government bonds in 2012 provided cash of $15.8 million. Investing activities in 20092011 used cash of €15.2$63.8 million, primarily due to €28.8 million of capital spending being only partially offset by a drawdown of €13.0$52.6 million fromand the Stendal Loan Facility’s DSRA.
purchase of marketable securities of $16.3 million.In 2010,2013, capital expenditures, primarily related to the Celgar Energy Project Blue Mill, used cash of €25.6$45.7 million. In the same period last year,2012, capital expenditures, primarily related to Project Blue Mill and the Celgar Energy Projectrecovery boiler upgrade at our Rosenthal mill, used cash of €13.4$47.2 million.
Excluding costs for projects being financed through government grants under the GTP, we expect our consolidated In 2011, capital expenditures, in 2011primarily related to total approximately €24.1 million, comprised of an array of smallvarious projects at our mills.
mills, used cash of $52.6 million.Cash Flows from Financing Activities. In 2010,2013, financing activities usedprovided net cash of €6.1$15.2 million, primarily due to borrowings by the receiptStendal mill under the Blue Mill Facility, which provided cash of €16.7$22.2 million, in government grants for the Celgar Energy Project and the proceeds received from the saleissuance of the 2017an additional $50.0 million of Senior Notes, being more thanwhich provided cash of $52.3 million, partially offset by cash used to repurchase our 2013 Senior Notes and €13.9 million in cash used to pay down the Stendal Loan Facility. Financing activities used cash of €13.3 million in 2009 primarily due to principal repayments under the Stendal Facilities which used cash of $55.0 million. In 2013, we received $9.3 million in government grants. In 2012, financing activities used net cash of $29.7 million, primarily due to $32.1 million used to repay principal under the Stendal Loan Facility and $2.0 million to purchase and extinguish some of €13.9our Senior Notes. In 2012, we received $5.0 million in government grants. In 2011, financing activities used net cash of $82.9 million, primarily due to using cash of $20.5 million to redeem all of our remaining 2013 Senior Notes, $32.2 million to repay principal under the Stendal Loan Facility, $20.5 million to repay the balance of our Celgar Working Capital Facility, $10.6 million to purchase shares of our common stock and $13.5 million to purchase and extinguish some of our Senior Notes. In 2011, we received $20.0 million in government grants.
Balance Sheet Data
The following table is a summary of selected financial information for the dates indicated:
| | | | | | | | |
| | | December 31, | |
| | | 2013 | | | 2012 | |
| | | (in thousands) | |
Financial Position | | | | | | | | |
Cash and cash equivalents | | $ | 147,728 | | | $ | 137,439 | |
Working capital | | $ | 306,274 | | | $ | 275,004 | |
Total assets | | $ | 1,548,559 | | | $ | 1,560,581 | |
Long-term liabilities | | $ | 1,034,743 | | | $ | 1,012,943 | |
Total equity | | $ | 348,317 | | | $ | 367,762 | |
Sources and Uses of Funds
Our principal sources of funds are cash flows from operations, cash and cash equivalents on hand and the revolving working capital loan facilities for our Celgar and Rosenthal mills. Our principal uses of funds consist of operating expenditures, payments of principal and interest on the Stendal Facilities, capital expenditures and interest payments on our outstanding Senior Notes.
As at December 31, 2013, our cash and cash equivalents were $147.7 million, compared to cash and cash equivalents of $137.4 million at the end of 2012. At the end of 2013, $64.8 million of our cash and cash equivalents were held by Stendal and under the Stendal Facilities are limited to its use.
As at December 31, 2013, we had approximately €28.3 million and C$33.3 million available under our Rosenthal and Celgar facilities, respectively.
In 2014, excluding amounts being financed through government grants, we currently expect capital expenditures to be approximately $40.0 million, primarily related to a tall oil plant, chip receiving project and wastewater reduction project at the Rosenthal mill, wastewater reduction projects at the Stendal mill, a chip screening project and maintenance projects at the Celgar mill and an ERP software implementation across the entire company.
In 2013, we implemented Project Blue Mill at a cost of $49.3 million, which €13.0was primarily funded through approximately €11.3 million ($15.0 million) of non-refundable German government grants and the €17.0 million ($22.2 million) Blue Mill Facility. The balance of such project was funded through operating cash flow of the Stendal mill and an aggregate €6.5 million ($8.6 million) in pro rata shareholder loans from us and Stendal’s noncontrolling shareholder. As at December 31, 2013, €7.0 million ($9.3 million) of the DSRA under the facility, and the repaymentapproximately €11.3 million ($15.0 million) of capital lease obligations of €3.2 million which were partially offset bynon-refundable German government investment grants of €9.1 million primarily for the Celgar Energy Project.
Capital Resources
We havehad been received.As at December 31, 2013, we had no material commitments to acquire assets or operating businesses.
Future Liquidity
Our ability to make scheduled payments of principal, or to pay interest on or to refinance our indebtedness, or to fund planned expenditures will depend on our future performance, which is subject to general economic, financial and other factors that are beyond our control.
Based upon the current level of operations and our current expectations for future periods in light of the current economic environment, and in particular, current and expected pulp pricing and foreign exchange rates, we believe that cash flow from operations and available cash, together with available borrowings under our Celgar Working Capital Facility and Rosenthal Loan Facility,facilities, will be adequate to meet the future liquidity needs during the next 12 months.
In the future we may make acquisitions of businesses or assets or commitments to additional capital projects. To achieve the long-term goals of expanding our assets and earnings, including through acquisitions, capital resources will be required. Depending on the size of a transaction, the capital resources that will be required can be substantial. The necessary resources will be generated from cash flow from operations, cash on hand, borrowing against our assets or the issuance of securities.
Credit Facility and Debt CovenantsWe had the following amounts outstanding under our credit facilities and Senior Notes as at the dates indicated:
| | | | | | | | |
| | | December 31, | |
| | | 2013 | | | 2012 | |
| | | (in thousands) | |
Rosenthal Loan Facility | | $ | — | | | $ | — | |
Rosenthal Investment Loan | | $ | 749 | | | $ | 2,152 | |
Rosenthal revolving €5.0 million facility | | $ | — | | | $ | — | |
Celgar Working Capital Facility | | $ | — | | | $ | 6,031 | |
Senior Notes | | $ | 336,382 | | | $ | 284,361 | |
Stendal Loan Facility | | $ | 568,945 | | | $ | 597,158 | |
Blue Mill Facility | | $ | 21,179 | | | $ | — | |
For a description of such indebtedness, see Part I, “Item 1. Business – Description of Certain Indebtedness”.
Certain of our long-term obligations contain various financial tests and covenants customary to these types of arrangements.
The Stendal Facilities require the Stendal mill to maintain an Annual Debt Ratio, which, pursuant to the terms of the 2013 Amendment, must not fall below 1.1x until maturity on September 30, 2017; provided that a failure to satisfy such covenant would only be an event of default when amounts in the debt service reserve account plus certain cash reserves are below a specified threshold. They also require the Stendal mill to satisfy a Senior Debt/EBITDA Cover Ratio, which, at the next measurement date of June 30, 2014, must not exceed 5.5x. Failure to comply with the Ratios constitutes an event of default (subject to the proviso set forth in the first sentence of this paragraph) which may be cured and the same shall not constitute a default by the shareholders of Stendal with a once-per-fiscal-year equity cure through a capital contribution or subordinated loan to Stendal in the amount necessary to cure such deficiency. As the Senior Debt/EBITDA Cover Ratio is based on Stendal’s trailing 12-month EBITDA and its weak 2013 operating results, there can be no assurance that Stendal will be in compliance with such ratio at its next measurement date of June 30, 2014. If Stendal is not in compliance with such ratio and it is not waived, we intend to exercise our equity cure right to avoid a default.
The 2013 Amendment modified the Stendal Facilities to provide the Stendal mill greater financial flexibility by, among other things: (i) waiving compliance with the Ratios in 2013; (ii) amending the Ratios so that the financial covenants now deduct from senior debt cash in the debt service reserve account and cash above a stipulated threshold; and (iii) reducing the amount required to cure financial covenant defaults under the Stendal Facilities.
Under the Rosenthal Loan Facility, our Rosenthal mill must not exceed a ratio of net debt to EBITDA of 3:1 in any 12-month period and there must be a ratio of EBITDA to interest expense equal to or in excess of 1.2:1.0 for each 12 month period. Additionally, current assets to current liabilities must equal or exceed 1.1:1.0.
The Celgar Working Capital Facility includes a covenant that, for so long as the excess amount under the facility is less than C$5.0 million, then until it becomes equal to or greater than such amount, the Celgar mill must maintain a fixed charge coverage ratio of not less than 1.1:1.0 for each 12-month period.
The Stendal Loan Facility is provided by a syndicate of eight financial institutions, the Stendal Blue Mill Facility by two financial institutions and our Celgar Working Capital Facility and our Rosenthal facilities are each provided by one financial institution. To date we have not experienced any reductions in credit availability with respect to these credit facilities. However, if any of these financial institutions were to default on their commitment to fund, we could be adversely affected.
The indenture governing the Senior Notes does not contain any financial maintenance covenants and there are no scheduled principal payments until maturity. We pay interest on our Senior Notes at the rate of 9.5% on June 1 and December 1 of each year and they mature in December 2017.
As at December 31, 2013, we were in full compliance with all of the covenants of our indebtedness.
Off-Balance-Sheet Activities
At December 31, 20102013 and 2009,2012, we had no off-balance-sheetoff-balance sheet arrangements.
52
Contractual Obligations and Commitments
The following table sets out our contractual obligations and commitments as at December 31, 2010 in connection with our long-term liabilities.
| | | | | | | | | | | | | | | | | | | | | |
| | | Payments Due By Period | |
Contractual Obligations(8) | | 2011 | | | 2012-2013 | | | 2014-2015 | | | Beyond 2015 | | | Total | |
| | | | | | (in thousands) | | | | |
| |
| Long-term debt(1) | | € | 16,429 | | | € | 48,899 | | | € | 543 | | | € | 255,396 | | | € | 321,267 | |
| Debt, Stendal(2) | | | 23,167 | | | | 64,583 | | | | 84,000 | | | | 328,907 | | | | 500,657 | |
| Interest on debt(3) | | | 58,750 | | | | 105,653 | | | | 93,148 | | | | 99,503 | | | | 357,054 | |
| Capital lease obligations(4) | | | 3,400 | | | | 2,913 | | | | 1,279 | | | | 1,556 | | | | 9,148 | |
| Operating lease obligations(5) | | | 3,287 | | | | 4,291 | | | | 2,791 | | | | 3,287 | | | | 13,656 | |
| Purchase obligations(6) | | | 1,055 | | | | 751 | | | | — | | | | — | | | | 1,806 | |
| Other long-term liabilities(7) | | | 1,973 | | | | 1,285 | | | | 1,538 | | | | 5,115 | | | | 9,911 | |
| | | | | | | | | | | | | | | | | | | | | |
| Total | | € | 108,061 | | | € | 228,375 | | | € | 183,299 | | | € | 693,764 | | | € | 1,213,499 | |
| | | | | | | | | | | | | | | | | | | | | |
| | | | | | | | | | | | | | | | | | | | |
| | | Payments Due By Period | |
Contractual Obligations(8) | | 2014 | | | 2015-2016 | | | 2017-2018 | | | Beyond 2018 | | | Total | |
| | | (in thousands) | |
Long-term debt(1) | | $ | 749 | | | $ | — | | | $ | 373,254 | | | $ | — | | | $ | 374,003 | |
Debt, Stendal(2) | | | 59,606 | | | | 131,132 | | | | 399,386 | | | | — | | | | 590,124 | |
Interest on debt(3) | | | 64,274 | | | | 112,943 | | | | 60,491 | | | | — | | | | 237,708 | |
Capital lease obligations(4) | | | 2,406 | | | | 4,677 | | | | 2,391 | | | | 3,111 | | | | 12,585 | |
Operating lease obligations(5) | | | 2,280 | | | | 3,371 | | | | 2,476 | | | | 929 | | | | 9,056 | |
Purchase obligations(6) | | | 6,036 | | | | 677 | | | | — | | | | — | | | | 6,713 | |
Other long-term liabilities(7) | | | 5,262 | | | | 7,767 | | | | 8,225 | | | | 22,311 | | | | 43,565 | |
| | | | | | | | | | | | | | | | | | | | |
Total | | $ | 140,613 | | | $ | 260,567 | | | $ | 846,223 | | | $ | 26,351 | | | $ | 1,273,754 | |
| | | | | | | | | | | | | | | | | | | | |
| | |
| (1) | | This reflects the future principal payments due under our long-term debt obligations, but excludes the Stendal Loan Facility.Facilities. See “Item 1 — Business — - Business—Description of Certain Indebtedness”, footnote 2 below and Note 7 to our annual financial statements included herein for a description of such indebtedness. |
| (2) | | This reflects principal only in connection with the Stendal Loan Facility.Facilities. See “Item 1 — Business — - Business—Description of Certain Indebtedness” and Note 7 to our annual financial statements included herein for a description of such indebtedness. This does not include amounts associated with derivatives entered into in connection with the Stendal Loan Facility. See “Item 7A —- Quantitative and Qualitative Disclosure about Market Risk” for information about our derivatives. |
| (3) | | Amounts presented for interest payments include guarantee fees, and assume that all debt outstanding as of December 31, 20102013 will remain outstanding until maturity, and interest rates on variable rate debt in effect as of December 31, 20102013 will remain in effect until maturity. |
| (4) | | Capital lease obligations relate to transportation vehicles and production equipment. These amounts reflect principal and interest. |
| (5) | | Operating lease obligations relate to transportation vehicles and other production and office equipment. |
| (6) | | Purchase obligations relate primarily totake-or-pay contracts, including for purchases of raw materials, made in the ordinary course of business. |
| (7) | | Other long-term liabilities relate primarily to future payments that will be made for post-employment benefits other than pensions.benefits. Those amounts are estimated using actuarial assumptions, including expected future service, to project the future obligations. Additionally, the balance also includes pension funding which is calculated on an annual basis. Consequently, the 20112014 amount includes €1.4$1.6 million related to pension funding. |
| (8) | | We have identified approximately €0.2 million of potential tax liabilities that are more likely than not to be paid and approximately €4.2$5.5 million of asset retirement obligations. However, due to the uncertain timing related to these potential liabilities, we are unable to allocate the payments in the contractual obligations table. |
Foreign Currency
OurEffective October 1, 2013, our reporting currency is the Euro as the majority of our business transactions are denominated in Euros.U.S. dollar. However, we hold certain assets and liabilities in U.S.Euros and Canadian dollars and the majority of our expenditures are denominated in Euros or Canadian dollars. Accordingly, our consolidated financial results are subject to foreign currency exchange rate fluctuations.
We translate foreign denominated assets and liabilities into EurosU.S. dollars at the rate of exchange on the balance sheet date. Equity accounts are translated using historical exchange rates. Unrealized gains or losses from these translations are recorded in our consolidated statementConsolidated Statement of comprehensive incomeComprehensive Income (Loss) and impact on shareholders’ equity on the balance sheet but do not affect our net earnings.
In the year ended December 31, 2010,2013, we reported a net €11.3$1.7 million foreign currency translation gainloss and, as a result, the cumulative foreign exchange translation gain reported within accumulated other comprehensive income (loss) increaseddecreased to €38.9$47.8 million at December 31, 2010.2013. In the year ended December 31, 2009,2012, we reported a cumulativenet $11.6 million foreign currency translation gain of €27.5 million.
gain.Based upon the exchange rate at December 31, 2010,2013, the U.S. dollar has increaseddecreased by approximately 7.0%5% in value against the Euro and increased by approximately 6% in value against the Canadian dollar since December 31, 2009.2012. See “Item 7A —7A. Quantitative and Qualitative Disclosures about Market Risk”.
53
Results of Operations of the Restricted Group Under Ourunder our Senior Note Indenture
General
The indenture governing our 2017 Senior Notes requires that we also provide a discussion in annual and quarterly reports we file with the SEC under Management’s Discussion and Analysis of Financial Condition and Results of Operations of the results of operations and financial condition of Mercer Inc. and our restricted subsidiaries under the indenture, referred to as the “Restricted Group”. The Restricted Group is comprised of Mercer Inc., our Rosenthal and Celgar mills and certain holding subsidiaries. The Restricted Group excludes our Stendal mill.
Summary Financial Highlights for the Restricted Group
| | | | | | | | | | | | |
| | | Year Ended December 31, | |
| | | 2013 | | | 2012 | | | 2011 | |
| | | (in thousands) | |
Pulp revenues | | $ | 561,350 | | | $ | 545,205 | | | $ | 659,741 | |
Energy and chemical revenues | | $ | 33,783 | | | $ | 36,638 | | | $ | 35,455 | |
Operating income | | $ | 15,711 | | | $ | 9,814 | | | $ | 87,609 | |
Restructuring expenses | | $ | 5,029 | | | $ | — | | | $ | — | |
Gain (loss) on derivative instruments | | $ | (2,767 | ) | | $ | 2,609 | | | $ | — | |
Income tax benefit (provision) | | $ | (9,365 | ) | | $ | (7,050 | ) | | $ | (6,422 | ) |
Net income (loss) | | $ | (19,525 | ) | | $ | (18,287 | ) | | $ | 55,408 | |
Selected Production, Sales and Other Data for the Restricted Group
Selected production, sales and exchange rate data for the Restricted Group for the periods indicated:
| | | | | | | | | | | | |
| | | Year Ended December 31, | |
| | | 2013 | | | 2012 | | | 2011 | |
Restricted Group | | | | | | | | | | | | |
Pulp Production (‘000 ADMTs) | | | 809.7 | | | | 828.0 | | | | 832.4 | |
Scheduled Production Downtime (‘000 ADMTs) | | | 25.4 | | | | 32.8 | | | | 24.5 | |
Scheduled Production Downtime (days) | | | 21 | | | | 30 | | | | 20 | |
Pulp Sales (‘000 ADMTs) | | | 818.6 | | | | 826.9 | | | | 823.2 | |
Average NBSK pulp list prices in Europe ($/ADMT)(1) | | | 864 | | | | 813 | | | | 956 | |
Average pulp sales realizations ($/ADMT)(2) | | | 686 | | | | 659 | | | | 800 | |
Energy Production (‘000 MWh) | | | 901.2 | | | | 930.1 | | | | 893.7 | |
Energy Sales (‘000 MWh) | | | 306.0 | | | | 341.6 | | | | 301.4 | |
Average energy sales realizations ($/MWh) | | | 110 | | | | 107 | | | | 118 | |
Average Spot Currency Exchange Rates | | | | | | | | | | | | |
$ / €(3) | | | 1.3281 | | | | 1.2859 | | | | 1.3931 | |
$ / C$(3) | | | 0.9712 | | | | 1.0007 | | | | 1.0121 | |
| (1) | Source: RISI pricing report. |
| (2) | Average realized pulp price for the years indicated reflect customer discounts and pulp price movements between the order and shipment date. |
| (3) | Average Federal Reserve Bank of New York noon spot rate over the reporting period. |
Restricted Group Results
The following is a discussion of the results of operations and financial condition of the Restricted Group. For further information regarding the Restricted Group including, without limitation, a reconciliation to our consolidated results of operations, see Note 1921 of the consolidated financial statements included in this annual report onForm 10-K.
Restricted Group Results — Year Ended December 31, 20102013 Compared to Year Ended December 31, 20092012
Pulp revenues for the Restricted Group for the year ended December 31, 2010in 2013 increased by approximately 54%3% to €490.0$561.4 million from €318.4$545.2 million in the comparative period of 2009,2012, primarily due to significantly higher average pulp prices and a stronger U.S. dollar relative to the Euro. Revenuessales realizations, partially offset by lower sales volume.
In 2013, revenues from the sale of excess energy remained relatively consistentdecreased by approximately 8% to $33.8 million from $36.6 million in both 2009 and 2010,2012, primarily due to the commencement of powerlower sales under the Celgar Energy Project, mostly offset by scheduled turbine maintenance at our Rosenthal mill in 2010. During 2010, the Rosenthal mill had nine days of downtime for scheduled maintenance and its turbine was down for an additional 51 days for maintenance. During such51-day period, the Rosenthal mill produced pulp at capacity but purchased energy instead of selling surplus energy.
volume.Pulp prices were significantly higher in 20102013 than in 2009 due to continued strengthening in global pulp markets.2012. Average list prices for NBSK pulp in Europe were approximately $938 (€707)$864 per ADMT in 20102013, compared to approximately $667 (€478)$813 per ADMT in 2009.2012. In China, average list prices were $821 (€618)$700 per ADMT in 20102013 and $576 (€414)$667 per ADMT in 2009.2012. In 2010,2013, average pulp sales realizations for the Restricted Group increased by approximately 48%4% to €592$686 per ADMT from €400$659 per ADMT in the previous year.
Pulp sales volume of the Restricted Group increaseddecreased to 826,340818,570 ADMTs in 20102013 from 795,092826,921 ADMTs in 2009.
2012.Pulp production for the Restricted Group increaseddecreased to 826,301809,659 ADMTs in 20102013 from 777,099827,977 ADMTs in 2009, primarily as a result of improved mill reliability.2012. In 2010,2013 and 2012, our Celgar and Rosenthal mills had an aggregate of 21 days (approximately 25,00025,400 ADMTs) and 30 days (approximately 32,800 ADMTs) of scheduled maintenance downtime, comparedrespectively, and expect to 34take approximately 22 days (approximately 37,000 ADMTs)in 2014. We had 15 days of maintenance downtime at our Celgar mill in 2009.
the first half of 2013, which, together with a slower startup, resulted in a loss of approximately 30,300 ADMTs of NBSK pulp production. See “—Results of Operations –Selected Production, Sales and Other Data – Year Ended December 31, 2013 Compared to Year Ended December 31, 2012” for further information regarding the Celgar mill shutdown.Costs and expenses for the Restricted Group in 20102013 increased to €411.5$579.4 million from €354.5$572.0 million in 2009,2012, primarily due to higher fiber costs at our Rosenthal mill and the impact of a weaker U.S. dollar relative to the Euro on our German mill expenses, partially offset by lower sales volume. The Restricted Group’s costs and expenses in Germany2013 included approximately $14.3 million for regularly scheduled maintenance costs, compared to $9.6 million in 2012. Several competing producers and higher energymembers of the peer group that we benchmark the Restricted Group’s performance against report their financial results in accordance with International Financial Reporting Standards which permit a significant portion of such maintenance costs resulting fromto be capitalized instead of expensed. Such costs are not charged to EBITDA by the turbine maintenance at the Rosenthal mill.
peer group companies but instead are expensed as depreciation.Overall, average per unit fiber costs of the Restricted Group increased by approximately 15%3% in 20102013 compared to 2009,2012, primarily due to 16% higher Germanper unit fiber prices resulting from lower levels of harvestingcosts in central Germany combined with increasedcaused by strong demand for wood from the energy sectorEuropean pellet and board producers and sawmills, only partially offset by a 12% decrease in per unit fiber costs for heating and other bio-energy purposes.
the Celgar mill.In 2010,2013, operating depreciation and amortization for the Restricted Group increased to €30.0$43.5 million from €27.5$40.1 million in the same period last year.
Selling, general and administrative expenses
marginally increased to
€20.2$31.9 million from
€15.0$31.7 million in
2009, primarily as a result2012.In 2013, the Restricted Group had restructuring expenses of increased selling costs and a stronger Canadian dollar relative$5.0 million related to the Euro.
workforce reduction at the Celgar mill.In 2010,2013, the Restricted Group reported operating income of €93.7$15.7 million, compared to an operating lossincome of €20.9$9.8 million in 2009,2012, primarily due to significantlya higher pulp realizations.
realized sales price, partially offset by higher fiber costs in Germany, lower sales volume and the impact of a weaker U.S. dollar relative to the Euro on our German mill expenses.Transportation costs for the Restricted Group increasedmarginally decreased to €50.5$64.1 million in 20102013 from €39.9$66.1 million in 2009, primarily due to higher container rates.
54
Interest expense for the Restricted Group increased to
€31.5$32.3 million in
20102013 from
€27.4$30.1 million in
2009,2012, primarily due to the
accretionissuance of $50.0 million of additional Senior Notes in July 2013.In 2013, we recognized a deferred tax expense related to the exchange of our 2010 Convertible Notes.
Most of the long-term debt of the Restricted Group is denominated and repayable in foreign currencies, principally U.S. dollars. In 2010, the Restricted Group recorded a non-cash loss on foreign currency denominated debt of €6.1$7.3 million, primarily as a result of the strengthening ofincrease in the U.S. dollarvaluation reserve for our deferred tax assets on our balance sheet, compared to the Euro during the first half of 2010, compared to a gain of €2.7$6.7 million in 2009.
During 2010, the Restricted Group recorded2012. This is a loss of approximately €7.5 million on the extinguishment of the 2013 Senior Notes. In 2009, the Restricted Group recorded a gain of approximately €4.4 million on the extinguishment of the 2010 Convertible Notes.
During 2010, the Restricted Group recorded €8.7 million of net incomenon-cash tax recoveries, compared to incomecharge and does not reduce our underlying tax recoveries of €0.2 million in 2009. The tax recoveries reflect our expectation that certain of our tax assets will be utilized to reduce taxable income in the future.
attributes.For the reasons discussed above, the Restricted Group reported a net incomeloss for 20102013 of €62.3$19.5 million, compared to a net loss of €35.9$18.3 million in 20092012, and Operating EBITDA of €124.0$59.5 million for 2013, compared to Operating EBITDA of €6.8$50.3 million in the comparative period of 2009. Operating EBITDA is defined as operating income (loss) plus depreciation and amortization and non-recurring capital asset impairment charges. Operating EBITDA has significant limitations as an analytical tool, and should not be considered in isolation, or as a substitute for analysis of our results as reported under GAAP.2012. See the discussion of our results for the year ended December 31, 20102013 compared to the year ended December 31, 20092012 for the definition of Operating EBITDA, significant limitations in Operating EBITDA as an analytical tool and additional information relating to such limitations and Operating EBITDA.
The following table provides a reconciliation of net income (loss) attributable to common shareholders to operating income (loss) and Operating EBITDA for the Restricted Group for the periods indicated:
| | | | | | | | | |
| | | Years Ended December 31, | |
| | | 2010 | | | 2009 | |
| | | (in thousands) | |
| |
Restricted Group(1) | | | | | | | | |
| Net income (loss) | | € | 62,327 | | | € | (35,927 | ) |
| Income taxes (benefits) | | | (8,651 | ) | | | (183 | ) |
| Interest expense | | | 31,498 | | | | 27,351 | |
| Investment (income) loss | | | (5,103 | ) | | | (5,002 | ) |
| Foreign exchange (gain) loss on debt | | | 6,126 | | | | (2,692 | ) |
| Loss (gain) on extinguishment of debt | | | 7,494 | | | | (4,447 | ) |
| | | | | | | | | |
| Operating income (loss) | | | 93,691 | | | | (20,900 | ) |
| Add: Depreciation and amortization | | | 30,270 | | | | 27,704 | |
| | | | | | | | | |
| Operating EBITDA | | € | 123,961 | | | € | 6,804 | |
| | | | | | | | | |
| | |
(1) | | See Note 19 of the financial statements included in this annual report on Form10-K for a reconciliation to our consolidated results. |
Restricted Group Results — Year Ended December 31, 2009 Compared to Year Ended December 31, 2008
Pulp revenues for the Restricted Group in 2009 decreased to €318.4 million from €401.0 million in 2008, primarily due to lower sales realizations. Revenues from the sale of excess energy were €15.2 million in 2009 compared to €12.1 million in 2008.
Pulp prices decreased in the first half of 2009 due to deteriorating global economic conditions but increased in the second half of 2009, primarily as a result of stronger demand and the weakening of the U.S. dollar. List prices for NBSK pulp in Europe were approximately $667 (€478) per ADMT in 2009, compared to approximately $839 (€571) in 2008.
55
Pulp sales volume of the Restricted Group decreased to 795,092 ADMTs in 2009 from 833,177 ADMTs in 2008. Average pulp sales realizations for the Restricted Group decreased by approximately 17% to €400 per ADMT in the year ended December 31, 2009 from €480 per ADMT in 2008.
Pulp production for the Restricted Group decreased to 777,099 ADMTs in 2009 from 814,586 ADMTs in 2008, primarily due to a heavier maintenance program. We took an aggregate of 34 days of scheduled annual maintenance downtime at our Rosenthal and Celgar mills in 2009 and 22 days of scheduled annual maintenance downtime in 2008.
By the end of 2009, pulp inventories for the Restricted Group decreased to €52.9 million from €59.8 million, the same time last year.
Cost and expenses for the Restricted Group in 2009 decreased to €354.5 million from €415.5 million in the comparative period of 2008, primarily due to lower sales volume and lower fiber costs.
Overall, fiber costs of the Restricted Group decreased by approximately 21% in 2009 versus the same period of 2008.
Operating depreciation and amortization for the Restricted Group decreased slightly to €27.5 million in 2009 from €28.6 million in 2008.
Selling, general and administrative expenses and other decreased to €15.0 million from €17.0 million in 2008.
In 2009, operating loss for the Restricted Group increased to €20.9 million from €2.4 million last year.
Interest expense for the Restricted Group in 2009 was virtually unchanged at €27.4 million compared to €27.0 million a year ago.
In 2009, the Restricted Group recorded a gain on foreign currency denominated debt of €2.7 million, compared to an unrealized loss of €4.1 million in 2008.
In 2009, the Restricted Group recorded a gain of approximately €4.4 million on the extinguishment of approximately €30.2 million ($43.3 million) in aggregate principal amount of our 2010 Convertible Notes.
The Restricted Group recorded a net loss of €35.9 million for the year ended December 31, 2009, compared to a net loss of €30.4 million for the year ended December 31, 2008.
The Restricted Group generated “Operating EBITDA” of €6.8 million and €26.5 million in the years ended December 31, 2009 and 2008, respectively. Operating EBITDA is defined as operating income (loss) plus depreciation and amortization and non-recurring capital asset impairment charges. Operating EBITDA has significant limitations as an analytical tool, and should not be considered in isolation, or as a substitute for analysis of our results as reported under GAAP. See the discussion of our results for the year ended December 31, 2010 compared to the year ended December 31, 2009 for additional information relating to such limitations and Operating EBITDA.
56
The following table provides a reconciliation of net income (loss) to operating income (loss) and Operating EBITDA for the Restricted Group for the periods indicated:
| | | | | | | | | |
| | | Years Ended
| |
| | | December 31, | |
| | | 2009 | | | 2008 | |
| | | (in thousands) | |
| |
Restricted Group(1) | | | | | | | | |
| Net income (loss) | | € | (35,927 | ) | | € | (30,432 | ) |
| Income taxes (benefits) | | | (183 | ) | | | 3,728 | |
| Interest expense | | | 27,351 | | | | 27,027 | |
| Investment (income) loss | | | (5,002 | ) | | | (6,834 | ) |
| Foreign exchange (gain) loss on debt | | | (2,692 | ) | | | 4,114 | |
| Loss (gain) on extinguishment of debt | | | (4,447 | ) | | | — | |
| | | | | | | | | |
| Operating income (loss) | | | (20,900 | ) | | | (2,397 | ) |
| Add: Depreciation and amortization | | | 27,704 | | | | 28,867 | |
| | | | | | | | | |
| Operating EBITDA | | € | 6,804 | | | € | 26,470 | |
| | | | | | | | | |
| | | | | | | | |
| | | Year Ended December 31, | |
| | | 2013 | | | 2012 | |
| | | (in thousands) | |
Restricted Group(1) | | | | | | | | |
Net income (loss) | | $ | (19,525 | ) | | $ | (18,287 | ) |
Income tax provision | | | 9,365 | | | | 7,050 | |
Interest expense | | | 32,321 | | | | 30,125 | |
Loss (gain) on derivative instruments | | | 2,767 | | | | (2,609 | ) |
Other (income) expense | | | (9,217 | ) | | | (6,465 | ) |
| | | | | | | | |
Operating income | | | 15,711 | | | | 9,814 | |
Add: Depreciation and amortization | | | 43,833 | | | | 40,474 | |
| | | | | | | | |
Operating EBITDA | | $ | 59,544 | | | $ | 50,288 | |
| | | | | | | | |
| | |
| (1) | | See Note 1921 of the financial statements included in this annual report on Form10-K for a reconciliation to our consolidated results. |
Cash Flow AnalysisYear Ended December 31, 2012 Compared to Year Ended December 31, 2011
Pulp revenues for the Restricted Group in 2012 decreased by approximately 17% to $545.2 million from $659.7 million in the comparative period of 2011, primarily due to lower average pulp sales realizations, partially offset by higher sales volumes.
In 2012, revenues from the sale of excess energy increased by approximately 3% to a record $36.6 million from $35.5 million in 2011, primarily due to record annual energy sales volumes at both our Rosenthal and Celgar mills.
Pulp prices were lower in 2012 than in 2011. Average list prices for NBSK pulp in Europe were $813 per ADMT in 2012, compared to $956 per ADMT in 2011. In China, average list prices were $667 per ADMT in 2012 and $834 per ADMT in 2011. In 2012, average pulp sales realizations for the Restricted Group decreased by approximately 18% to $659 per ADMT from $800 per ADMT in the previous year.
Pulp sales volume of the Restricted Group marginally increased to 826,921 ADMTs in 2012 from 823,183 ADMTs in 2011.
Pulp production for the Restricted Group decreased to 827,977 ADMTs in 2012 from 832,396 ADMTs in 2011. In 2012 and 2011, our Celgar and Rosenthal mills had an aggregate of 30 days (approximately 32,800 ADMTs) and 20 days (approximately 24,500 ADMTs) of scheduled maintenance downtime, respectively.
Costs and expenses for the Restricted Group in 2012 decreased to $572.0 million from $607.6 million in 2011, primarily due to the impact of a stronger U.S. dollar relative to the Euro on our German mill expenses and lower fiber costs during the year, partially offset by higher sales volumes. The Restricted Group’s costs and expenses in 2012 included approximately $9.6 million for regularly scheduled maintenance costs, compared to $13.6 million in 2011. Several competing producers and members of the peer group that we benchmark the Restricted Group’s performance against report their financial results in accordance with International Financial Reporting Standards which permit a significant portion of such maintenance costs to be capitalized instead of expensed. Such costs are not charged to EBITDA by the peer group companies but instead are expensed as depreciation.
Overall, per unit fiber costs of the Restricted Group decreased by approximately 10% in 2012 compared to 2011, primarily due to decreased fiber costs in Germany and at our Celgar mill.
In 2012, operating depreciation and amortization for the Restricted Group decreased to $40.1 million from $41.5 million in the same period last year. Selling, general and administrative expenses marginally decreased to $31.7 million from $33.6 million in 2011.
In 2012, the Restricted Group reported operating income of $9.8 million, compared to operating income of $87.6 million in 2011, primarily due to lower average pulp sales realizations, partially offset by a stronger U.S. dollar relative to the Euro and lower fiber costs in 2012.
Transportation costs for the Restricted Group decreased to $66.1 million in 2012 from $70.7 million in 2011.
Interest expense for the Restricted Group decreased to $30.1 million in 2012 from $34.6 million in 2011, primarily due to the conversion of our convertible notes in 2011.
During 2012, the Restricted Group recorded $7.1 million of net income tax expense, compared to $6.4 million in 2011.
For the reasons discussed above, the Restricted Group reported net loss for 2012 of $18.3 million, compared to net income of $55.4 million in 2011 and Operating EBITDA of $50.3 million, compared to Operating EBITDA of $129.5 million in the comparative period of 2011. See the discussion of our results for the year ended December 31, 2013 compared to the year ended December 31, 2012 for the definition of Operating EBITDA, significant limitations in Operating EBITDA as an analytical tool and additional information relating to such limitations and Operating EBITDA.
The following table provides a reconciliation of net income (loss) to operating income and Operating EBITDA for the Restricted Group for the periods indicated:
| | | | | | | | |
| | | Year Ended
December 31, | |
| | | 2012 | | | 2011 | |
| | | (in thousands) | |
Restricted Group(1) | | | | | | | | |
Net income (loss) | | $ | (18,287 | ) | | $ | 55,408 | |
Income tax provision | | | 7,050 | | | | 6,422 | |
Interest expense | | | 30,125 | | | | 34,639 | |
Gain on derivative instruments | | | (2,609 | ) | | | — | |
Other income | | | (6,465 | ) | | | (8,860 | ) |
| | | | | | | | |
Operating income | | | 9,814 | | | | 87,609 | |
Add: Depreciation and amortization | | | 40,474 | | | | 41,875 | |
| | | | | | | | |
Operating EBITDA | | $ | 50,288 | | | $ | 129,484 | |
| | | | | | | | |
| (1) | See Note 21 of the financial statements included in this annual report on Form 10-K for a reconciliation to our consolidated results. |
Liquidity and Capital Resources
Summary of Cash Flows
| | | | | | | | | | | | |
| | | Year Ended December 31, | |
| | | 2013 | | | 2012 | | | 2011 | |
| | | (in thousands) | |
Net cash provided by (used in) operating activities | | $ | 23,513 | | | $ | (3,336 | ) | | $ | 92,806 | |
Net cash provided by (used in) investing activities | | | (32,602 | ) | | | (11,990 | ) | | | (52,978 | ) |
Net cash provided by (used in) financing activities | | | 42,597 | | | | 5,360 | | | | (48,516 | ) |
Effect of exchange rate on changes in cash and cash equivalents | | | 995 | | | | 221 | | | | (990 | ) |
| | | | | | | | | | | | |
Net increase (decrease) in cash and cash equivalents | | $ | 34,503 | | | $ | (9,745 | ) | | $ | (9,678 | ) |
| | | | | | | | | | | | |
Cash Flows from Operating Activities.Activities Cash provided by operating. Operating activities for the Restricted Group increased to €54.6provided cash of $23.5 million in 2010 from €13.32013 compared to using cash of $3.3 million in 2009, primarily due2012 and providing cash of $92.8 million in 2011. A decrease in receivables provided cash of $4.8 million in 2013, compared to improved operating results, partially offset by working capital movements. Anan increase in receivables usedusing cash of €25.9$0.8 million in 2010, compared to2012 and a decrease in receivables providing cash of €26.1$4.5 million in 2009. An2011. A decrease in inventories provided cash of $2.0 million in 2013, compared to an increase in inventories usedusing cash of €2.9$5.1 million in 2010, compared to a decrease in inventories providing cash of €13.22012 and $14.2 million in 2009.2011. A decrease in accounts payable and accrued expenses used cash of €10.3$6.0 million in 2010, compared to2013 and $9.6 million in 2012 and an increase in accounts payable and accrued expenses providingprovided cash of €5.8$8.2 million in 2009.
2011.Cash Flows from Investing Activities. Investing activities used cash of €33.3$32.6 million, $12.0 million and €26.5$53.0 million in 20102013, 2012 and 2009,2011, respectively. In 2010,2013, a capital investment in Stendal, an unrestricted subsidiary, used cash of $20.0 million. In 2013, capital expenditures used cash of €34.7$13.2 million primarily for therelated to various projects at our Rosenthal and Celgar Energy Project.mills. Capital expenditures in 20092012 and 2011 used cash of €26.8 million.
$28.2 million and $41.1 million, respectively.Cash Flows from Financing Activities. Financing activities provided net cash of €10.1$42.6 million in 2010,2013, primarily as a resultdue to cash of the receipt of approximately €16.7$52.3 million in government grants for the Celgar Energy Project andprovided from proceeds from the saleissuance of the 2017additional Senior Notes, being partially offset by cash used to purchasethe repayment of our 2013 Senior Notes.credit facilities of $5.6 million. Financing activities provided net cash of €7.6$5.4 million in 2009. Repayment of indebtedness2012 and leases used net cash of €221.3 million and €10.7$48.5 million in 20102011, primarily due to using cash of $20.5 million to redeem all of our remaining 2013 Senior Notes, $20.5 million to repay the balance of our Celgar Working Capital Facility and 2009, respectively.
$10.6 million to purchase shares of our common stock and $13.5 million to purchase and extinguish some of our Senior Notes. In 2011, we received $19.9 million in governmental grants.
Liquidity and Capital ResourcesBalance Sheet Data of the Restricted Group
The following table is a summary of selected financial information for the Restricted Group for the periodsdates indicated:
| | | | | | | | | |
| | | Years Ended December 31, | |
| | | 2010 | | | 2009 | |
| | | (in thousands) | |
| |
Restricted Group Financial Position(1) | | | | | | | | |
| Cash and cash equivalents | | € | 50,654 | | | € | 20,635 | |
| Working capital | | | 150,667 | | | | 57,015 | |
| Property, plant and equipment | | | 362,274 | | | | 362,311 | |
| Total assets | | | 662,944 | | | | 555,977 | |
| Long-term liabilities | | | 312,631 | | | | 301,173 | |
| Total equity | | | 289,141 | | | | 200,247 | |
| | | | | | | | |
| | | December 31, | |
| | | 2013 | | | 2012 | |
| | | (in thousands) | |
Restricted Group Financial Position(1) | | | | | | | | |
Cash and cash equivalents | | $ | 82,910 | | | $ | 48,407 | |
Working capital | | $ | 211,749 | | | $ | 174,213 | |
Total assets | | $ | 858,824 | | | $ | 849,271 | |
Long-term liabilities | | $ | 394,821 | | | $ | 343,056 | |
Total equity | | $ | 412,033 | | | $ | 442,161 | |
| | |
| (1) | | See Note 1921 of the financial statements included in this annual report onForm 10-K for a reconciliation to our consolidated results. |
57
At December 31, 2010,Sources and Uses of Funds of the Restricted Group hadThe Restricted Group’s principal sources of funds are cash flows from operations, cash and cash equivalents on hand and the revolving working capital loan facilities for our Celgar and Rosenthal mills. The Restricted Group’s principal uses of funds consist of operating expenditures, capital expenditures and interest payments on our outstanding Senior Notes.
As at December 31, 2013, the Restricted Group’s cash and cash equivalents were $82.9 million, compared to cash and cash equivalents of €50.7 million, compared to €20.6$48.4 million at the end of 2009. At December 31, 2010, the Restricted Group had working capital of €150.7 million.
2012.As at December 31, 2010,2013, we had not drawn any amount€28.3 million available under the credit facilities related to the Rosenthal Loan Facilitymill and had drawn C$20.033.3 million under the C$40.0 million Celgar Working Capital Facility.
In 2014, excluding amounts being financed by governmental grants, we currently expect capital expenditures to be approximately $28.0 million, primarily for a tall oil plant, chip receiving project and wastewater reduction project at the Rosenthal mill, a chip screening project and maintenance projects at the Celgar mill and an enterprise resource planning software implementation across the entire company.
We expect the Restricted Group to meet its interest and debt service obligations and meet the working and maintenance capital requirements for its current operations from cash flow from operations, cash and cash equivalents on hand, the Rosenthal facilities and the Celgar Working Capital Facility.
In the future we may make acquisitions of businesses or assets or commitments to additional projects. To achieve the long-term goals of expanding our assets and earnings, including through acquisitions, capital resources will be required. Depending on the size of a transaction, the capital resources that will be required can be substantial. The necessary resources will be generated from cash flow from operations, cash on hand, borrowing against our assets or the issuance of securities.
Credit Ratings of Senior Notes
Standard & Poor’s Rating Services, (“Sreferred to as “S&P”), and Moody’s Investors Service, Inc. (“Moody’s”), referred to as “Moody’s”, base their assessment of ourthe credit risk on our Senior Notes on the business and financial profile of the Restricted Group only. Factors that may affect our credit rating include changes in our operating performance and liquidity. Credit rating downgrades can adversely impact, among other things, future borrowing costs and access to capital markets.
DuringIn July 2013, S&P lowered its rating on the second quarter of 2010, we were subject to improved rating actions by Moody’s and S&P. In May 2010, S&P raised its target credit ratingSenior Notes to B from B- with a stableB+ but maintained its recovery rating at “3” and Moody’s maintained its B3 rating and “stable” outlook for our Senior Notes.
Credit ratings outlookare not recommendations to reflect temporary pulp supply shortagesbuy, sell or hold securities and may be subject to revision or withdrawal by the strengthening of pulp markets. S&P believes that weassigning rating organization. Each rating should be able to maintain sufficient liquidity to support this new creditevaluated independently of any other rating. The B rating also reflected the expectation that we would continue to benefit from favorable foreign exchange rates resulting from the strength of the U.S. dollar relative to the Euro.
In June 2010, Moody’s upgraded our Corporate Family Rating to B3 from Caa1. Subsequently, on November 5, 2010, Moody’s further upgraded the rating to B2 from B3 with a stable rating outlook. Moody’s cited the upgrade reflects earnings improvement, modest debt reduction and lingering strength in market pulp prices are expected to benefit our liquidity profile and capital structure. Furthermore, material improvements made to Celgar’s cost structure and the completion of the Celgar Energy Project are expected to strengthen future earnings potential and soften the impact of market downturns.
Additionally, Moody’s assigned a B3 rating to our 2017 Senior Notes, while S&P assigned a B rating with a recovery rating of 4.
We expect the Restricted Group to meet its interest and debt service obligations and meet the working and maintenance capital requirements for its current operations from cash flow from operations, cash on hand, the Rosenthal Loan Facility and the Celgar Working Capital Facility.
Critical Accounting Policies
The preparation of financial statements and related disclosures in conformity with GAAP requires management to make estimates and assumptions that affect both the amount and the timing of recording of assets, liabilities, revenues and expenses in the consolidated financial statements and accompanying note disclosures. Our management routinely makes judgments and estimates about the effects of matters that are inherently uncertain. As the number of variables and assumptions affecting the probable future resolution of the uncertainties increase, these judgments become even more subjective and complex.
Our significant accounting policies are disclosed in Note 1 to our audited annual consolidated financial statements included in Part IV of this annual report. While all of the significant accounting policies are important to the consolidated financial statements, some of these policies may be viewed as having a high degree of judgment. On an ongoing basis using currently available information, management reviews its estimates, including those related to accounting for, among other things, doubtful accounts and reserves, depreciation and amortization, future cash flows associated with impairment testing for long-lived assets, derivative financial instruments, legal liabilities, asset retirement obligations, pensions and post-retirement benefits, provisions for bad debtbenefit obligations, income taxes, contingencies and doubtful accounts, derivative instruments, impairment of long-lived assets, deferred taxes, inventory provisionsobsolescence and environmental conservation and legal liabilities.provisions. Actual estimatesresults could differ materially from these estimates.
estimates, and changes in these estimates are recorded when known.The following accounting policies require management’s most difficult, subjective and complex judgments, and are subject to a fair degree of measurement uncertainty.
Change in Reporting Currency. Our consolidated financial statements for each of the years in the four-year period ended December 31, 2012 were reported using the Euro. Effective October 1, 2013, we changed our reporting currency to the U.S. dollar to enhance communication and understanding with shareholders, analysts and other stakeholders and improve comparability of our financial information with other competitors and peer group companies. With the change in reporting currency, all comparative financial information has been recast from Euros to U.S. dollars to reflect our consolidated financial statements as if they had been historically reported in U.S. dollars, consistent with our currency translation policy described below and in Note 1 of our consolidated financial statements.
In order for our shareholders to better understand the transition to U.S. dollars, the following table provides selected financial information in Euros and U.S. dollars as at and for the year ended December 31, 2013.
| | | | | | | | |
| | | Euros | | | US$ | |
| | | (in thousands, other than per share data
and per ADMT amounts) | |
Statement of Operations Data | | | | | | | | |
Revenues | | | | | | | | |
Pulp | | € | 749,858 | | | $ | 996,187 | |
Energy and chemicals | | | 69,400 | | | | 92,198 | |
| | | | | | | | |
| | € | 819,258 | | | $ | 1,088,385 | |
Costs and expenses | | € | 795,427 | | | $ | 1,056,725 | |
Operating income (loss) | | € | 23,831 | | | $ | 31,660 | |
Interest expense | | € | (52,056 | ) | | $ | (69,156 | ) |
Gain (loss) on derivative instruments | | € | 14,836 | | | $ | 19,709 | |
Other income (expense) | | € | 915 | | | $ | 1,215 | |
Net income (loss)(1) | | € | (19,853 | ) | | $ | (26,375 | ) |
Net income (loss) per share(1) | | | | | | | | |
Basic and diluted | | € | (0.36 | ) | | $ | (0.47 | ) |
Weighted average shares outstanding (in thousands) | | | | | | | | |
Basic and diluted | | | 55,674 | | | | 55,674 | |
Balance Sheet Data | | | | | | | | |
Current assets | | € | 342,386 | | | $ | 471,773 | |
Current liabilities | | € | 120,110 | | | $ | 165,499 | |
Working capital | | € | 222,276 | | | $ | 306,274 | |
Total assets | | € | 1,123,855 | | | $ | 1,548,559 | |
Long-term liabilities | | € | 750,957 | | | $ | 1,034,743 | |
Total equity | | € | 252,788 | | | $ | 348,317 | |
Other Data | | | | | | | | |
Average pulp price realized (per ADMT)(2) | | € | 514 | | | $ | 683 | |
| (1) | Attributable to common shareholders. |
| (2) | Average realized pulp price for 2013 reflects customer discounts and pulp price movements between order and shipment date. |
Foreign Operations and Currency Translation.We translate foreign assets and liabilities of our subsidiaries, other than those denominated in U.S. dollars, at the rate of exchange at our balance sheet date. Revenues and expenses are translated at the average rate of exchange throughout the year. Transaction gains and losses related to net assets are recognized as unrealized foreign currency translation adjustments within accumulated other comprehensive income in shareholders’ equity, until all of the investment in the subsidiaries is sold or liquidated. The translation adjustments do not recognize the effect of income tax when we expect earnings of the foreign subsidiary to be indefinitely reinvested. The income tax effect on currency translation adjustments related to foreign subsidiaries that are not considered indefinitely reinvested is recorded as a component of deferred taxes in our Consolidated Balance Sheet with an offset to other comprehensive income. Gains and losses resulting from foreign currency transactions (transactions denominated in a currency other than the entity’s functional currency) are included in costs and expenses in our Consolidated Statement of Operations. Where inter-company loans are of a long-term investment nature, the after-tax effect of exchange rate changes are included as an unrealized foreign currency translation adjustment within accumulated other comprehensive income in shareholders’ equity.
Derivative Instruments.We occasionally enter into derivative financial instruments, including foreign currency forward contracts, electricity forward contracts, interest rate swaps and pulp price swaps to limit exposures to changes in foreign currency exchange rates, energy prices, interest rates, and pulp prices. These derivative instruments are not designated as hedging instruments. Derivative instruments are measured at fair value and reported in theour balance sheet as assets or liabilities. Accounting for gains or losses depends onThe change in fair value of electricity derivative contracts is included in operating costs in our Consolidated Statement of Operations and any changes in the intended usefair value of theforeign currency, interest rate and pulp price derivative instruments. Gains or lossescontracts are recognized in gain (loss) on derivative instruments in our Consolidated Statement of Operations. Periodically, we enter into derivative contracts to supply materials for our own use, which are not designated hedges for accounting purposes are recognized in earnings in the period of the change in fair value. Gains or losses on derivative instruments formally designated as hedges are recognized in either earnings or other comprehensive income.
58
In 2010,2013, we reported a netan unrealized non-cash holding gain of €1.9$22.5 million before noncontrolling interestsinterest in respect of the Stendal Interest Rate Swap Contracts.
Contract and a realized loss of $2.8 million for our pulp price swap contracts.Impairment of Long-Lived Assets. We state property, plant and equipment at cost less accumulated depreciation. Depreciation of buildings and production equipment is based on the estimated useful lives of the assets and is computed using the straight-line method. Buildings are depreciated over 10 to 50 years and production equipment and other primarily over 25 years.
We evaluate long-lived assets for impairment whenever events or changes in circumstances indicate that the carrying amountvalue of an asset may not be recoverable. In performing the review of recoverability, we estimate future cash flows expected to result from the use of the asset and its eventual disposition. The estimates of future cash flows, based on reasonable and supportable assumptions and projections, require management to make subjective judgments. In addition, the time periods for estimating future cash flows is often lengthy, which increases the sensitivity of the assumptions made. Depending on the assumptions and estimates used, the estimated future cash flows projected in the evaluation of long-lived assets can vary within a wide range of outcomes. Our management considers the likelihood of possible outcomes in determining the best estimate of future cash flows. If actual results are not consistent with the assumptions and judgments used in estimating future cash flows and asset fair values, actual impairment losses could vary materially, either positively or negatively, from estimated impairment losses.
The costs of major rebuilds, replacements and those expenditures that substantially increase the useful lives of existing property, plant, and equipment are capitalized, as well as interest costs associated with major capital projects until ready for their intended use. The cost of repairs and maintenance as well as planned shutdown maintenance performed on manufacturing facilities, composed of labor, materials and other incremental costs, is charged to operations as incurred.
Leases which transfer to us substantially all the risks and benefits incidental to ownership of the leased item are capitalized at the present value of the minimum lease payments. Capital leases are depreciated over the lease term. Operating lease payments are recognized as an expense in our Consolidated Statement of Operations on a straight-line basis over the lease term.
We provide for asset retirement obligations when there is a legislated or contractual basis for those obligations. Obligations are recorded as a liability at fair value, with a corresponding increase to property, plant, and equipment, and are amortized over the remaining useful life of the related assets. The liability is accreted using a risk-free interest rate.
As a result of improvingcurrent market conditions, we concluded that there were no impairment indicators. Accordingly, we did not undertake a long-lived asset impairment review in 2010.
2013.Deferred Taxes.We currently have deferred tax assets which are comprised primarily of tax loss carryforwards and deductible temporary differences, both of which will reduce taxable income in the future. The amounts recorded for deferred tax are based upon various judgments, assumptions and estimates. We assess the realization of these deferred tax assets on a periodic basis to determine whether a valuation allowance is required. We determine whether it is more likely than not that all or a portion of the deferred tax assets will be realized, based on currently available information, including, but not limited to, the following:
the history of the tax loss carryforwards and their expiry dates;
future reversals of temporary differences;
| | |
| • | the history of the tax loss carryforwards and their expiry dates; |
|
| • | future reversals of temporary differences; |
|
| • | our projected earnings; and |
|
| • | tax planning opportunities. |
our historical and projected earnings; and
tax planning opportunities.
If we believe that it is more likely than not that some of these deferred tax assets will not be realized, based on currently available information, an income tax valuation allowance is recorded against these deferred tax assets. Additionally, based on guidance noted in FASB Accounting Standards Codification Topic 740,Income Taxes, a cumulative loss position is considered significant negative evidence in assessing the realizability of deferred income tax assets are not permittedthat is difficult to be recognized where the entity does not have a strong history of profitability.overcome. As at December 31, 2010,2013, we had €22.6$23.5 million in deferred tax assets and €7.8$14.5 million in deferred tax liabilities, resulting in a net deferred tax asset of €14.8$9.0 million. Our tax assets are net of a €88.9$140.8 million valuation allowance. For the year ended December 31, 2010,2013, our review concluded that it was appropriate to decreaseincrease the valuation allowance against loss carryforwards by approximately €10.6$17.0 million, after considering expected future earningshistorical and reversalsforecast taxable income, income tax strategies and the best estimates of the timing of movements in temporary differences.
If market conditions improve or tax planning opportunities arise in the future, we will reduce our valuation allowances, resulting in future tax benefits. If market conditions deteriorate in the future, we will increase our valuation allowances, resulting in future tax expenses. Any change in tax laws particularly in Germany, will change the valuation allowances in future periods.
Government Grants.We record investment grants from federal and state governments when the conditions of their receipt are complied with and there is reasonable assurance that the grants will be received. Grants related to assets are government grants whose primary condition is that the company qualifying for them should purchase, construct or otherwise acquire long-term assets. Secondary conditions may also be attached, including restricting the type or location of the assets and/or other conditions that must be met. Grants related to assets are deducted from the asset costs in our balance sheet.
Grants related to income are government grants which are either unconditional, related to reduced environmental emissions or related to our normal business operations, and are reported as a reduction of related expenses in our Consolidated Statement of Operations when received.
We are required to pay certain fees based on water consumption levels at our German mills. Unpaid fees can be reduced upon the mills’ demonstration of reduced wastewater emissions. The fees are expensed as incurred and the fee reduction is recognized once we have reasonable assurance that the German regulators will accept the reduced level of wastewater emissions. There may be a significant period of time between recognition of the wastewater expense and recognition of the wastewater fee reduction.
To the extent that government grants have been received and not applied, these grants are recorded in cash with a corresponding adjustment to accounts payable and other in our Consolidated Balance Sheet due to the short-term nature of the related payments.
Inventory Provisions.Inventories of NBSK pulp and logs and wood chips are valued at the lower of cost, using the weighted-average cost method, or net realizable value. We estimate the net realizable value based on future cash flows expected to result from the sale of our product (NBSK pulp). The cash flows are estimated based on the expected time it will take to exhaust the respective inventory, including estimates of additional costs that will need to be incurred to bring that inventory to a salable state. The future cash flows, based on reasonable and supportable assumptions and projections, require management to make subjective judgments. Depending on the assumptions and estimates used, the estimated future cash flows can vary within a wide range of outcomes. We consider the likelihood of possible outcomes in determining the best estimate of future cash flows. If actual results are not consistent with the assumptions and judgments used in estimating future cash flows, actual inventory provisions could vary materially, either positively or negatively, from estimated inventory provisions.
59
As at December 31, 2010,2013, we did not record an inventory provision against any of our finished goods and raw materials inventories.
New Accounting StandardsStandards.
See Note 1 to our consolidated financial statements included in Item 15 of this annual report onForm 10-K.
Cautionary Statement RegardingForward-Looking Information
The statements in this annual report onForm 10-K that are not reported financial results or other historical information are “forward-looking“forward-looking statements” within the meaning of thePrivate Securities Litigation Reform Act of 1995, as amended. These statements appear in a number of different places in this report and can be identified by words such as “estimates”, “projects”, “expects”, “intends”, “believes”, “plans”, or their negatives or other comparable words. Also look for discussions of strategy that involve risks and uncertainties.Forward-looking statements include statements regarding the outlook for our future operations, forecasts of future costs and expenditures, the evaluation of market conditions, the outcome of legal proceedings, the adequacy of reserves, or other business plans. You are cautioned that any suchforward-looking statements are not guarantees and may involve risks and uncertainties. Our actual results may differ materially from those in theforward-looking statements due to risks facing us or due to actual facts differing from the assumptions underlying our estimates. Some of these risks and assumptions include those set forth in reports and other documents we have filed with or furnished to the SEC, including in our annual report onForm 10-K for the fiscal year ended December 31, 2010.2013. We advise you that these cautionary remarks expressly qualify in their entirety allforward-looking statements attributable to us or persons acting on our behalf. Unless required by law, we do not assume any obligation to updateforward-looking statements based on unanticipated events or changed expectations. However, you should carefully review the reports and other documents we file from time to time with the SEC. Factors that could cause actual results to differ materially include, but are not limited to those set forth under “Item 1A —– Risk Factors” in this annual report onForm 10-K.
Inflation
We do not believe that inflation has had a material impact on revenues or income during 2010.
| |
| ITEM 7A. | QUANTITATIVE AND QUALITATIVE DISCLOSURES ABOUT MARKET RISK |
We are exposed to market risks from changes in interest rates and foreign currency exchange rates, particularly the exchange rates between the Euro and the U.S. dollar and the Canadian dollar versus the U.S. dollar and the Euro.dollar. Changes in these rates may affect our results of operations and financial condition and, consequently, our fair value. We seek to manage these risks through internal risk management policies as well as the use of derivatives. We use derivatives to reduce or limit our exposure to interest rate and currency risks. We may in the futurealso use derivatives to reduce or limit our exposure to fluctuations in pulp prices. We also use derivatives to reduce our potential losses or to augment our potential gains, depending on our management’s perception of future economic events and developments. These types of derivatives are generally highly speculative in nature. They are also very volatile as they are highly leveraged given that margin requirements are relatively low in proportion to notional amounts.
Many of our strategies, including the use of derivatives, and the types of derivatives selected by us, are based on historical trading patterns and correlations and our management’s expectations of future events. However, these strategies may not be effective in all market environments or against all types of risks. Unexpected market developments may affect our risk management strategies during this time, and unanticipated developments could impact our risk management strategies in the future. If any of the variety of instruments and strategies we utilize is not effective, we may incur significant losses.
Derivatives
Derivatives are contracts between two parties where payments between the parties are dependent upon movements in the price of an underlying asset, index or financial rate. Examples of derivatives include swaps, options and forward rate agreements. The notional amount of the derivatives is the contract amount used as a
60
reference point to calculate the payments to be exchanged between the two parties and the notional amount itself is not generally exchanged by the parties.
The principal derivatives we use are interest rate derivatives, pulp price derivatives, energy derivatives and foreign exchange derivatives.
Interest rate derivatives andinclude interest rate derivatives.
forwards (forward rate agreements) which are contractual obligations to buy or sell an interest-rate-sensitive financial instrument on a future date at a specified price. They also include interest rate swaps which are over-the-counter contracts in which two counterparties exchange interest payments based upon rates applied to a notional amount.Pulp price derivatives include fixed price pulp swaps which are contracts in which two counterparties exchange payments based upon the difference between the market price of pulp and the notional amount in the contract.
Energy derivatives include fixed electricity forward sales and purchase contracts which are contractual obligations to buy or sell electricity at a future specified date. Our mills produce surplus electricity that we sell to third parties. As a result, we monitor the electricity market closely. Where possible and to the extent we think it is advantageous, we may sell into the forward market through forward contracts.
Foreign exchange derivatives include currency swaps which involve the exchange of fixed payments in one currency for the receipt of fixed payments in another currency. Such cross currency swaps involve the exchange of both interest and principal amounts in two different currencies. They also include foreign exchange forwards which are contractual obligations in which two counterparties agree to exchange one currency for another at a specified price for settlement at a pre-determined future date. Forward contracts are effectively tailor-made agreements that are transacted between counterparties in theover-the-counter market.
Interest rate derivatives include interest rate forwards (forward rate agreements) which are contractual obligations to buy or sell an interest-rate-sensitive financial instrument on a future date at a specified price. They also include interest rate swaps which areover-the-counter contracts in which two counterparties exchange interest payments based upon rates applied to a notional amount.
Energy derivatives include fixed electricity forward sales and purchase contracts which are contractual obligations to buy or sell electricity at a future specified date. Our mills produce surplus electricity that we sell to third parties. As a result, we monitor the electricity market closely. Where possible and to the extent we think it is advantageous, we may sell into the forward market through forward contracts.
We occasionally use foreign exchange derivatives to convert some of our costs (including currency swaps relating to our long-term indebtedness) from Euros to U.S. dollars as our principal product is priced in U.S. dollars. We have also converted some of our costs to U.S. dollars by issuing long-term U.S. dollar denominated debt in the form of our 2012 Convertible Notes and our 2017 Senior Notes. We use interest rate derivatives to fix the rate of interest on indebtedness, including under the Stendal Loan Facility.
The interest rate derivatives we entered into were pursuant to the Stendal Loan Facility which provides facilities for foreign exchange derivatives, interest rate derivatives and commodities derivatives, subject to prescribed controls, including maximum notional and at-risk amounts. The Stendal Loan Facility is secured by substantially all of the assets of the Stendal mill and has the benefit of certain German governmental guarantees. This credit facility does not have a separate margin requirement when derivatives are entered into and is subsequently marked to market each period.
The Rosenthal Loan Facility also allows us to enter into derivative instruments to manage risks relating to its operations but, as at December 31, 2010,2013, we had not entered into any such derivative instruments.
We record unrealized gains and losses on our outstanding derivatives when they are marked to market at the end of each reporting period and realized gains or losses on them when they are settled. We determine market valuations based primarily upon valuations provided by our counterparties.
In August 2002, Stendal entered into the Stendal Interest Rate Swap ContractsContract in connection with its long-term indebtedness relating to the Stendal mill to fix the interest rate under the Stendal Loan Facility at the then low level, relative to its historical trend and projected variable interest rate. These contracts were entered into under a specific credit line under the Stendal Loan Facility and are subject to prescribed controls, including certain maximum amounts for notional and at-risk amounts. Under the Stendal Interest Rate Swap Contracts,Contract, Stendal pays a fixed rate and receives a floating rate with the interest payments being calculated on a notional amount. The interest rates payable under the Stendal Loan Facility were swapped into fixed rates based on the Eur-Euribor rate for the repayment periods of the tranches under the Stendal Loan Facility. Stendal effectively converted the Stendal Loan Facility from a variable interest rate loan into a fixed interest rate loan, thereby reducing interest rate uncertainty.
In May 2012, we entered into a fixed price pulp swap contract with a bank. Under the contract, 5,000 MTs of pulp per month is fixed at a price of $915 per MT for each month between May and December of 2012. The contract expired in December 2012. In November 2012, we entered into two additional contracts. Under the terms of these contracts, 3,000 MTs of pulp per month is fixed at prices which range from $880 to $890 per MT. These contracts expired in December 2013.
We are exposed to very modest credit related risks in the event of non-performance by counterparties to derivative contracts. However, we do not expect that the counterparties, which are major financial institutions and large utilities, will fail to meet their obligations.
61
The following table and the notes thereto sets forth the maturity date, the notional amount, the recognized gain or loss and the strike and swap rates for derivatives that were in effect during 20092013 and 2010:
| | | | | | | | | | | | | | | | | | | | | |
| | | | | | | | | Recognized
| | | | | | Recognized
| |
| | | | | | | | | Gain (Loss)
| | | | | | Gain (Loss)
| |
| | | | | | | | | Year Ended
| | | | | | Year Ended
| |
| | | | | | Notional
| | | December 31,
| | | Notional
| | | December 31,
| |
Derivative Instrument | | Maturity Date | | | Amount | | | 2010 | | | Amount | | | 2009 | |
| | | | | | (in millions of
| | | (in thousands) | | | (in millions of
| | | (in thousands) | |
| | | | | | Euros) | | | | | | Euros) | | | | |
| |
Interest Rate Derivatives | | | | | | | | | | | | | | | | | | | | |
| Stendal interest rate swaps(1) | | | October 2017 | | | € | 447.8 | | | € | 1,899 | | | € | 487.0 | | | € | (5,760 | ) |
| | | | | | | | | | | | | | | | | | | | | |
| | | | | | | | | | | | | | | | | | |
| | | | | December 31, 2013 | | | December 31, 2012 | |
Derivative Instrument | | Maturity Date | | Notional
Amount | | | Recognized
Gain (Loss) | | | Notional
Amount | | | Recognized
Gain (Loss) | |
| | | | | (in millions) | | | (in thousands) | | | (in millions) | | | (in thousands) | |
Stendal interest rate swap(1) | | October 2017 | | $ | 422.7 | | | $ | 22,476 | | | $ | 471.5 | | | $ | 2,203 | |
Fixed price pulp swap(2) | | December 2013 | | $ | — | | | $ | (2,767 | ) | | $ | 36.4 | | | $ | 2,609 | |
| | |
| (1) | | In connection with the Stendal Loan Facility, in the third quarter of 2002 Stendal entered into the Stendal Interest Rate Swap Contracts,Contract, which arevariable-to-fixed interest rate swaps, for the term of the Stendal Loan Facility, with respect to an aggregate maximum amount of approximately €612.6 million of the principal amount of the long-term indebtedness under the Stendal Loan Facility. The swaps took effect on October 1, 2002 and are comprised of three contracts. The first contract commenced in October 2002 for a notional amount of €4.1 million, gradually increasing to €464.9 million, with an interest rate of 3.795%, and matured in May 2004. The second contract commenced in May 2004 for a notional amount of €464.9 million, gradually increasing to €612.6 million, with an interest rate of 5.28%, and matured in April 2005. The thirdremaining contract commenced in April 2005 for a notional amount of €612.6 million, with an interest rate of 5.28%, and the notional amount gradually decreases and the contract terminates upon the maturity of the Stendal Loan Facility in October 2017. |
| (2) | In May 2012, we entered into a fixed price pulp swap contract with a bank. Under the contract, 5,000 MTs of pulp per month is fixed at a price of $915 per MT for each month between May and December of 2012. In November 2012, we entered into two additional contracts under the terms of which 3,000 MTs of pulp per month are fixed at prices which range from $880 to $890 per MT. These contracts matured in December 2013. |
Interest Rate Risk
Fluctuations in interest rates may affect the fair value of fixed interest rate financial instruments which are sensitive to such fluctuations. A decrease in interest rates may increase the fair value of such fixed interest rate financial instrument assets and an increase in interest rates may decrease the fair value of such fixed interest rate financial instrument liabilities, thereby increasing our fair value. An increase in interest rates may decrease the fair value of such fixed interest rate financial instrument assets and a decrease in interest rates may increase the fair value of such fixed interest rate financial instrument liabilities, thereby decreasing our fair value. We seek to manage our interest rate risks through the use of interest rate derivatives. For a discussion of our interest rate derivatives including maturities, notional amounts, gains or losses and swap rates, see “Derivatives” in this Item 7A.
The following tables provide information about our exposure to interest rate fluctuations for the carrying amount of financial instruments sensitive to such fluctuations as at December 31, 20102013 and expected cash flows from these instruments:
| | | | | | | | | | | | | | | | | | | | | | | | | | | | | | | | | |
| | | As at December 31, 2010 | |
| | | Carrying
| | | Fair
| | | Expected maturity date | |
| | | Value | | | Value | | | 2011 | | | 2012 | | | 2013 | | | 2014 | | | 2015 | | | Thereafter | |
| | | (in thousands) | |
| |
Liabilities | | | | | | | | | | | | | | | | | | | | | | | | | | | | | | | | |
| Long-term debt: | | | | | | | | | | | | | | | | | | | | | | | | | | | | | | | | |
| Fixed rate ($)(1) | | € | 15,341 | | | € | 15,571 | | | € | 15,341 | | | € | — | | | € | — | | | € | — | | | € | — | | | € | — | |
| Average interest rate | | | 9.25 | % | | | 9.25 | % | | | 9.25 | % | | | | | | | | | | | | | | | | | | | | |
| Fixed rate ($)(2) | | € | 224,031 | | | € | 230,192 | | | € | — | | | € | — | | | € | — | | | € | — | | | € | — | | | € | 224,031 | |
| Average interest rate | | | 9.50 | % | | | 9.50 | % | | | | | | | | | | | | | | | | | | | | | | | 9.50 | % |
| Fixed rate ($)(3) | | € | 31,707 | | | € | 74,790 | | | € | — | | | € | 31,707 | | | € | — | | | € | — | | | € | — | | | € | — | |
| Average interest rate | | | 8.5 | % | | | 8.5 | % | | | | | | | 8.5 | % | | | | | | | | | | | | | | | | |
| Variable rate (€)(4) | | € | 500,657 | | | € | 500,657 | | | € | 23,167 | | | € | 24,583 | | | € | 40,000 | | | € | 40,000 | | | € | 44,000 | | | € | 328,907 | |
| Average interest rate | | | 6.3 | % | | | 6.3 | % | | | 6.3 | % | | | 6.3 | % | | | 6.3 | % | | | 6.3 | % | | | 6.3 | % | | | 6.3 | % |
| Variable rate (€)(5) | | € | 3,807 | | | € | 3,807 | | | € | 1,088 | | | € | 1,088 | | | € | 1,088 | | | € | 543 | | | € | — | | | € | — | |
| Average interest rate | | | 3.90 | % | | | 3.90 | % | | | 3.90 | % | | | 3.90 | % | | | 3.90 | % | | | 3.90 | % | | | | | | | | |
| Variable rate (C$)(6) | | € | 15,016 | | | € | 15,016 | | | € | — | | | € | — | | | € | 15,016 | | | € | — | | | € | — | | | € | — | |
| Average interest rate | | | 5.70 | % | | | 5.70 | % | | | | | | | | | | | 5.70 | % | | | | | | | | | | | | |
62
| | | | | | | | | | | | | | | | | | | | | | | | | | | | | | | | |
| | | As at December 31, 2013 | |
| | | Carrying | | | Fair | | | Expected maturity date | |
| | | Value | | | Value | | | 2014 | | | 2015 | | | 2016 | | | 2017 | | | 2018 | | | Thereafter | |
| | | (in thousands, other than percentages) | |
Liabilities | | | | |
Long-term debt: | | | | | | | | | | | | | | | | | | | | | | | | | | | | | | | | |
Fixed rate ($)(1) | | | 336,382 | | | | 366,656 | | | | — | | | | — | | | | — | | | | 336,382 | | | | — | | | | — | |
Average interest rate | | | 9.5 | % | | | 9.5 | % | | | | | | | | | | | | | | | | | | | | | | | | |
Variable rate ($)(2) | | | 590,124 | | | | 590,124 | | | | 59,606 | | | | 65,566 | | | | 65,566 | | | | 399,386 | | | | — | | | | — | |
Average interest rate | | | 1.75 | % | | | 1.75 | % | | | 1.75 | % | | | 1.75 | % | | | 1.75 | % | | | 1.75 | % | | | — | | | | | |
Variable rate ($)(3) | | | 749 | | | | 749 | | | | 749 | | | | — | | | | — | | | | — | | | | — | | | | — | |
Average interest rate | | | 3.09 | % | | | 3.09 | % | | | 3.09 | % | | | | | | | | | | | | | | | | | | | | |
| | | | | | | | | | | | | | | | | | | | | | | | | | | | | | | | |
| | | Nominal | | | Fair | | | Expected maturity date | |
| | | Amount | | | Value | | | 2014 | | | 2015 | | | 2016 | | | 2017 | | | 2018 | | | Thereafter | |
| | | (in thousands, other than percentages) | |
Interest Rate Derivatives | | | | |
Interest rate swap: | | | | | | | | | | | | | | | | | | | | | | | | | | | | | | | | |
Variable to fixed ($)(4) | | | 422,715 | | | | (46,517 | ) | | | 75,729 | | | | 81,830 | | | | 88,323 | | | | 176,833 | | | | — | | | | — | |
Average pay rate | | | 5.3 | % | | | 5.3 | % | | | 5.3 | % | | | 5.3 | % | | | 5.3 | % | | | 5.3 | % | | | — | | | | | |
Average receive rate | | | 0.3 | % | | | 0.3 | % | | | 0.3 | % | | | 0.3 | % | | | 0.3 | % | | | 0.3 | % | | | — | | | | | |
| | | | | | | | | | | | | | | | | | | | | | | | | | | | | | | | | |
| | | Nominal
| | | Fair
| | | Expected maturity date | |
| | | Amount | | | Value | | | 2011 | | | 2012 | | | 2013 | | | 2014 | | | 2015 | | | Thereafter | |
| | | (in thousands) | |
| |
Interest Rate Derivatives | | | | | | | | | | | | | | | | | | | | | | | | | | | | | | | | |
| Interest rate swaps: | | | | | | | | | | | | | | | | | | | | | | | | | | | | | | | | |
| Variable to fixed (€)(7) | | € | 447,763 | | | € | (50,973 | ) | | € | 43,315 | | | € | 46,873 | | | € | 50,794 | | | € | 54,959 | | | € | 59,388 | | | € | 192,434 | |
| Average pay rate | | | 5.3 | % | | | 5.3 | % | | | 5.3 | % | | | 5.3 | % | | | 5.3 | % | | | 5.3 | % | | | 5.3 | % | | | 5.3 | % |
| Average receive rate | | | 5.3 | % | | | 5.3 | % | | | 5.3 | % | | | 5.3 | % | | | 5.3 | % | | | 5.3 | % | | | 5.3 | % | | | 5.3 | % |
| | |
| (1) | | Senior Notes due February 2013, bearing interest at 9.25%, principal amount $20.5 million. |
(2) | | Senior Notes due 2017, bearing interest at 9.50%, principal amount $300.0$336.4 million. |
(3) | | 2012 Convertible Notes due January 2012 bearing interest at 8.5%, principal amount $44.4 million. |
(4) | (2) | Stendal Loan Facility bears interest at varying rates of between Euribor plus 0.90% to Euribor plus 1.85%1.80%. The Blue Mill Facility bears interest at Euribor plus 3.5%. |
(5) | (3) | Rosenthal investment loan bears interest at Euribor plus 2.75%. As at December 31, 2010, €3.8 million was drawn from this loan and was accruing interest at a rate of 3.90%. |
(6) | | Celgar Working Capital Facility bears interest at bankers acceptance plus 3.75% or Canadian prime plus 2.0% on Canadian dollar denominated amounts and bears interest at LIBOR plus 3.75% or U.S. base plus 2.0% on U.S. dollar denominated amounts. As at December 31, 2010, the principal amount owing was C$20.0 million. |
(7) | (4) | Interest rate swapsswap put in place on the Stendal Loan Facility, effectively converting it from a variable interest rate to a fixed interest rate loan. |
Foreign Currency Exchange Rate Risk
Our reporting currency is the Euro.U.S. dollar. However, we hold financial instruments denominated in U.S. dollarsEuros and Canadian dollars which are sensitive to foreign currency exchange rate fluctuations. A depreciation of these currencies against the EuroU.S. dollar will decrease the fair value of such financial instrument assets and an appreciation of these currencies against the EuroU.S. dollar will increase the fair value of such financial instrument liabilities, thereby decreasing our fair value. An appreciation of these currencies against the EuroU.S. dollar will increase the fair value of such financial instrument assets and a depreciation of these currencies against the EuroU.S. dollar will decrease the fair value of financial instrument liabilities, thereby increasing our fair value. We seek to manage our foreign currency risks by utilizing foreign exchange rate derivatives. For a discussion of such derivatives including maturities, notional amounts, gains or losses and strike rates, see “Derivatives”“–Derivatives” in this Item 7A.
The following table provides information about our exposure to foreign currency exchange rate fluctuations for the carrying amount of financial instruments sensitive to such fluctuations as at December 31, 20102013 and expected cash flows from these instruments:
| | | | | | | | | | | | | | | | | | | | | | | | | | | | | | | | | |
| | | As at December 31, 2010 | |
| | | Carrying
| | | Fair
| | | Expected maturity date | |
| | | Value | | | Value | | | 2011 | | | 2012 | | | 2013 | | | 2014 | | | 2015 | | | Thereafter | |
| | | (in thousands) | |
| |
On-Balance Sheet Financial Instruments | | | | | | | | | | | | | | | | | | | | | | | | | | | | | | | | |
| Euro functional currency | | | | | | | | | | | | | | | | | | | | | | | | | | | | | | | | |
| Liabilities: | | | | | | | | | | | | | | | | | | | | | | | | | | | | | | | | |
| Fixed rate ($)(1) | | € | 15,341 | | | € | 15,571 | | | € | 15,341 | | | € | — | | | € | — | | | € | — | | | € | — | | | € | — | |
| Average interest rate | | | 9.25 | % | | | 9.25 | % | | | 9.25 | % | | | | | | | | | | | | | | | | | | | | |
| Fixed rate ($)(2) | | € | 224,031 | | | € | 230,192 | | | € | — | | | € | — | | | € | — | | | € | — | | | € | — | | | € | 224,031 | |
| Average interest rate | | | 9.5 | % | | | 9.5 | % | | | | | | | | | | | | | | | | | | | | | | | 9.5 | % |
| Fixed rate ($)(3) | | € | 31,707 | | | € | 74,790 | | | € | — | | | € | 31,707 | | | € | — | | | € | — | | | € | — | | | € | — | |
| Average interest rate | | | 8.5 | % | | | 8.5 | % | | | | | | | 8.5 | % | | | | | | | | | | | | | | | | |
| Variable rate (C$)(4) | | € | 15,016 | | | € | 15,016 | | | € | — | | | € | — | | | € | 15,016 | | | € | — | | | € | — | | | € | — | |
| Average interest rate | | | 5.70 | % | | | 5.70 | % | | | | | | | | | | | 5.70 | % | | | | | | | | | | | | |
| | |
(1) | | Senior Notes due February 2013, bearing interest at 9.25%, principal amount $20.5 million. |
(2) | | Senior Notes due 2017, bearing interest at 9.50%, principal amount $300.0 million. |
(3) | | 2012 Convertible Notes due January 2012, principal amount $44.4 million. |
(4) | | Celgar Working Capital Facility bears interest at bankers acceptance plus 3.75% or Canadian prime plus 2.0% on Canadian dollar denominated amounts and bears interest at LIBOR plus 3.75% or U.S. base plus 2.0% on U.S. dollar denominated amounts. As at December 31, 2010, the principal amount owing was C$20.0 million. |
63
| | | | | | | | | | | | | | | | | | | | | | | | | | | | | | | | | | | | |
| | | As at December 31, 2013 | |
| | | Carrying
Value | | | Fair
Value | | | Nominal
Amount | | | Expected maturity date | |
| | | | | | 2014 | | | 2015 | | | 2016 | | | 2017 | | | 2018 | | | Thereafter | |
| | | (in thousands) | |
On-Balance Sheet Financial Instruments | | | | |
Euro functional currency | | | | | | | | | | | | | | | | | | | | | | | | | | | | | | | | | | | | |
Cash and cash equivalents (€) | | | 59,075 | | | | 59,075 | | | | — | | | | 59,075 | | | | — | | | | — | | | | — | | | | — | | | | — | |
Receivables (€) | | | 53,280 | | | | 53,280 | | | | — | | | | 53,280 | | | | — | | | | — | | | | — | | | | — | | | | — | |
Accounts payable and other (€) | | | 47,724 | | | | 47,724 | | | | — | | | | 47,724 | | | | — | | | | — | | | | — | | | | — | | | | — | |
Interest rate derivative liability (€) | | | 33,760 | | | | 33,760 | | | | 306,782 | | | | 54,960 | | | | 59,387 | | | | 64,100 | | | | 128,335 | | | | — | | | | — | |
Debt (€) | | | 466,645 | | | | 445,842 | | | | — | | | | 43,802 | | | | 47,584 | | | | 47,584 | | | | 327,675 | | | | — | | | | — | |
CAD functional currency | | | | | | | | | | | | | | | | | | | | | | | | | | | | | | | | | | | | |
Cash and cash equivalents (C$) | | | 9,175 | | | | 9,175 | | | | — | | | | 9,175 | | | | — | | | | — | | | | — | | | | — | | | | — | |
Receivables (C$) | | | 2,805 | | | | 2,805 | | | | — | | | | 2,805 | | | | — | | | | — | | | | — | | | | — | | | | — | |
Accounts payable and other (C$) | | | 25,629 | | | | 25,629 | | | | — | | | | 25,629 | | | | — | | | | — | | | | — | | | | — | | | | — | |
Pulp Price Risk
Fluctuations in the price of pulp will affect the fair value of our pulp price swaps. A decrease in pulp prices will increase the fair value of the pulp price swaps and an increase in pulp prices will decrease the fair value of the pulp price swaps.
Energy Price Risk
We are subject to some electricityenergy price risk, primarily for natural gas purchases. Our electricity price risks are mitigated by the electricity thatability of all of our operations purchase.
| |
| ITEM 8. | FINANCIAL STATEMENTS AND SUPPLEMENTARY DATA |
The consolidated financial statements and supplementary data required with respect to this Item 8, and as listed in Item 15 of this annual report onForm 10-K, are included in this annual report onForm 10-K commencing on page 72.
| |
| ITEM 9. | CHANGES IN AND DISAGREEMENTS WITH ACCOUNTANTS ON ACCOUNTING AND FINANCIAL DISCLOSURE |
| |
| ITEM 9A. | CONTROLS AND PROCEDURES |
Evaluation of Disclosure Controls and Procedures
Our management, with the participation of our principal executive officer and principal financial officer, has evaluated the effectiveness of our disclosure controls and procedures (as such term is defined inRules 13a-15(e) and15d-15(e) under the Exchange Act), as of the end of the period covered by this annual report onForm 10-K. Disclosure controls and procedures include, without limitation, controls and procedures designed to ensure that information required to be disclosed in the reports we file or submit under the Exchange Act is accumulated and communicated to management, including our principal executive officer and principal financial officer, as appropriate, to allow timely decisions regarding required disclosure. Based on such evaluation, our principal executive officer and principal financial officer have concluded that, as of the end of the period covered by this report, our disclosure controls and procedures are effective in recording, processing, summarizing and reporting, on a timely basis, information required to be disclosed by us in the reports that we file or submit under the Exchange Act.
It should be noted that any system of controls is based in part upon certain assumptions designed to obtain reasonable (and not absolute) assurance as to its effectiveness, and there can be no assurance that any design will succeed in achieving its stated goals.
Management’s Report on Internal Control Over Financial Reporting
Our management is responsible for establishing and maintaining adequate internal control over financial reporting. Mercer Inc.’sMercer’s internal control over financial reporting is designed to provide reasonable assurance regarding the reliability of financial reporting and the preparation of financial statements for external purposes in accordance with generally accepted accounting principles.
Our internal control over financial reporting includes those policies and procedures that:
Pertain to the maintenance of records that, in reasonable detail, accurately and fairly reflect the transactions and dispositions of the assets of Mercer;
Provide reasonable assurance that transactions are recorded as necessary to permit preparation of financial statements in accordance with generally accepted accounting principles, and that receipts and expenditures are being made only in accordance with authorizations of management and directors; and
| | |
| • | Pertain to the maintenance of records that, in reasonable detail, accurately and fairly reflect the transactions and dispositions of the assets of Mercer; |
|
| • | Provide reasonable assurance that transactions are recorded as necessary to permit preparation of financial statements in accordance with generally accepted accounting principles, and that receipts and expenditures are being made only in accordance with authorizations of management and directors; and |
|
| • | Provide reasonable assurance regarding prevention or timely detection of unauthorized acquisition, use or disposition of assets that could have a material effect on the financial statements. |
Provide reasonable assurance regarding prevention or timely detection of unauthorized acquisition, use or disposition of assets that could have a material effect on the financial statements.
Because of its inherent limitations, internal control over financial reporting may not prevent or detect misstatements. Also, projections of any evaluation of effectiveness to future periods are subject to the risk that controls may become inadequate because of changes in conditions, or that the degree or compliance with the policies or procedures may deteriorate.
64
Management assessed the effectiveness of Mercer Inc.’sMercer’s internal control over financial reporting as of December 31, 2010.2013. In making this assessment, management used the criteria set forth inInternal Control-Integrated Framework, as issued in 1992 by the Committee of Sponsoring Organizations of the Treadway Commission. Based on our assessment and those criteria, management believesconcluded that Mercer Inc. maintained effective internal control over financial reporting as of December 31, 2010.
Mercer Inc.’s independent registered chartered accountants have issued an audit report on Mercer Inc.’s2013.The effectiveness of Mercer’s internal control over financial reporting as of December 31, 2013 has been audited by PricewaterhouseCoopers LLP, an independent registered public accounting firm, as stated in their attestation report which appears below.
Changes in Internal Controls
There have been no changes in our internal control over financial reporting (as defined inRules 13a-15(f) and15d-15(f) under the Exchange Act) during the year ended December 31, 20102013 that have materially affected, or are reasonably likely to materially affect, our internal control over financial reporting.
| |
| ITEM 9B. | OTHER INFORMATION |
65
PART III
| |
| ITEM 10. | DIRECTORS, EXECUTIVE OFFICERS AND CORPORATE GOVERNANCE |
We are governed by a board of directors, referred to as the “Board”, each member of which is elected annually. The following sets forth information relating to our directors and executive officers.
Jimmy S.H. Lee, age 53,56, has been aserved as director since May 1985 and President and Chief Executive Officer since 1992. Previously, during the period that MFC Bancorp Ltd. was our affiliate, he served as a director from 1986 and President from 1988 to December 1996 when it was spun out. Mr. Lee was also a director of Quinsam Capital Corp. from March 2004 to November 2007 and Fortress Paper Ltd. from August 2006 to April 2008. During Mr. Lee’s tenure with Mercer, we acquired the Rosenthal mill and converted it to the production of kraft pulp, constructed and commenced operations at the Stendal mill and acquired the Celgar mill.
Kenneth A. Shields, age 62, has been Mr. Lee possesses particular knowledge and experience in finance and banking, credit markets, derivative risk management, and international pulp markets. He holds a director since August 2003. Mr. Shields isBachelor of Science Degree in Chemical Engineering from the Chairman and Chief Executive OfficerUniversity of Conifex Timber Inc., a public Canadian company operating in the forestry and sawmilling sector. Mr. Shields was formerly a member of the board of directors of Raymond James Financial, Inc., and retired as Chief Executive Officer of its Canadian subsidiary, Raymond James Ltd., in February 2006. Mr. Shields has served as past Chairman of the Investment Dealers Association of Canada and Pacifica Papers Inc., and is a former director of each of Slocan Forest Products Ltd., TimberWest Forest Corp. and the Investment Dealers Association ofBritish Columbia, Canada.
William D. McCartney, age 55, has been a director since January 2003. Mr. McCartney has been President and Chief Executive Officer of Pemcorp Management Inc., a management services company, since 1990. Mr. McCartney is also a member of the Institute of Chartered Accountants in Canada.
Guy W. Adams, age 59, has been a director since August 2003. Mr. Adams is the managing member of GWA Advisors, LLC, GWA Investments, LLC and GWA Capital Partners, LLC, where he has served since 2002. GWA Investments is an investment fund investing in publicly traded securities managed by GWA Capital Partners, LLC, a registered investment advisor. Prior to 2002, Mr. Adams was the President of GWA Capital, which he founded in 1996 to invest his own capital in public and private equity transactions, and a business consultant to entities seeking refinancing or recapitalization.
Eric Lauritzen, age 72,75, has beenserved as a director since June 2004. Mr. LauritzenFrom 1994 until his retirement in 1998, he was President and Chief Executive Officer of Harmac Pacific, Inc., a North AmericanTSX-listed pulp producer of softwood kraft pulp previously listed on the Toronto Stock Exchange andthat was acquired by Pope & Talbot Inc. in 1998, from MayFrom 1981 to 1994, to July 1998, when he retired. Mr. Lauritzen wasserved as Vice President, Pulp and Paper Marketing of MacMillan Bloedel Limited, a TSX-listed North American pulp and paper company previously listed on the Toronto Stock Exchange andthat was acquired by Weyerhaeuser Company LimitedLimited. Mr. Lauritzen has accumulated extensive executive, production and marketing experience in 1999,the pulp and paper industry, particularly in the softwood kraft pulp sector. He received his Bachelor of Commerce degree in 1961 from July 1981the University of British Columbia and his M.B.A. in 1963 from Harvard Business School.
William D. McCartney, age 58, has served as a director since January 2003. He has been the President and Chief Executive Officer of Pemcorp Management Inc., a corporate finance and management consulting firm, since its inception in 1990. From 1984 to April 1994.
1990, he was a founding partner of Davidson & Company, chartered accountants, where he specialized in business advisory services. He has been involved with numerous capital restructuring and financing events involving several public companies and brings substantial knowledge relating to the financial accounting and auditing processes. He is a member of the Local Advisory Committee of the TSX and TSX Ventures Exchanges. He is a chartered accountant and has been a member of the Canadian Institute of Chartered Accountants since 1980. He holds a Bachelor of Arts degree in Business Administration from Simon Fraser University.Graeme A. Witts, age 72,75, has beenserved as a director since January 2003. Mr. WittsHe is also a Director and the former Chairman of Azure Property Group, SA, a European hotel group. He organized Sanne Trust Company Limited, a trust company located in the Channel Islands, in 1988 and was managing directorManaging Director from 1988 to 2000, when he retired. Mr. Witts has previous executive experience with the Procter & Gamble Company, as well as with Clarks shoes. He is now managing director of Azure Property Group, SA,also has experience in government auditing and brings significant financial accounting knowledge from a European hotel group.global perspective. Mr. Witts is also a fellow of the Institute of Chartered Accountants of England and Wales and has previous executive experience with the Procter & Gamble Companyholds a masters degree in chemistry from Oxford University and Clarks Shoes, as well as government auditing.
a research degree in magnetic resonance.George MalpassBernard Picchi, age 71,64, has beenserved as a director since November 2006.June 2011. He is now Managing Director of Private Wealth Management for Palisade Capital Management, LLC, of Fort Lee, New Jersey, and has been in that role since July 2009. Before joining Palisade, Mr. MalpassPicchi served as Managing Partner of Willow Rock Associates from August 2008 through June 2009, which advised securities firms on energy investments. From March 2003 through July 2008, Mr. Picchi served as Senior Energy Analyst at two independent research firms based in New York City, Foresight Research Solutions (2003-2005) and Wall Street Access (2006-2008). From 1999 through 2002, he was Director of U.S. Equity Research at Pittsburgh-based Federated Investors, where he also managed the Capital Appreciation Fund, a 5-star rated (during his tenure) $1.5 billion equity mutual fund. Before Federated, Mr. Picchi enjoyed a 20-year career on Wall Street (Salomon Brothers, Kidder Peabody, and Lehman Brothers) both as an award-winning energy analyst and as an executive (Director of U.S. Equity Research at Lehman in the mid-1990s). He began his post-college career at Mellon Bank in Pittsburgh, Pennsylvania. Mr. Picchi holds a Bachelor of Science degree in Foreign Service from Georgetown University, and he has achieved the professional designation Chartered Financial Analyst. He has also served on various non-profit boards, most notably that of the Georgetown University Library which he has served for the past 30 years.
James Shepherd, age 61, has served as a director since June 2011. He is also currently a director of Conifex Timber Inc. He, which is listed on the TSX Venture Exchange, and Buckman Laboratories International Inc. Mr. Shepherd was formerly thePresident and Chief Executive Officer of Canfor Corporation from 2004 to 2007 and Slocan Forest Products Ltd. from 1999 to 2004. He is also the former President of Crestbrook Forest Industries Ltd. and Finlay Forest Industries Limited and the former Chairman of the Forest Products Association of Canada. Mr. Shepherd has previously served as a director of Primex ForestCanfor Corporation as well as Canfor Pulp Income Fund (now Canfor Pulp Products Ltd. andInc.). Mr. Shepherd holds a degree in Mechanical Engineering from Queen’s University.
R. Keith Purchase, age 69, has served as a director since June 2012. He is currently also a former director of both International Forest Products Ltd. and Riverside Forest Products Ltd.
David M. Gandossi, age 53, has been Secretary, Executive Vice-President and Chief Financial Officer since August 15, 2003. Mr. Gandossi was formerly the Chief Financial Officer and Executive Vice-President of Formation Forest Products (a closely held corporation) from June 2002 to August 2003. Mr. Gandossi previously served as Chief Financial Officer, Vice-President, Finance and Secretary of Pacifica PapersHardwoods Distribution Inc., a North American specialty pulp and paper manufacturing company previously listed on the Toronto Stock Exchange, from December 1999 to August 2001 and Controller and Treasurer from June 1998 to December 1999. From June 1998 to August 31, 1998, he also served as Secretary to Pacifica Papers Inc. From March 1998 to June 1998, Mr. Gandossi served as Controller, Treasurer and Secretary of MB Paper Ltd. From April 1994 to March 1998, Mr. Gandossi held
66
the position of Controller and Treasurer with Harmac Pacific Inc., a Canadian pulp manufacturing company previouslywhich is listed on the Toronto Stock Exchange. Mr.
Gandossi participated in thePurchase was Executive Vice-President and Chief Operating Officer for MacMillan Bloedel Ltd. from 1998 to 1999, President and Chief Executive Officer of TimberWest Forest Ltd. from 1994 to 1998 and Managing Director of Tasman Pulp and Paper
Advisory Committeefrom 1990 to 1994. Mr. Purchase was previously a director of Catalyst Paper Corporation and Chair of the
British Columbia Competition Councilboard of directors. As he has held several senior positions in the forestry industry, Mr. Purchase brings to the Board extensive senior executive experience relevant to the Company’s operations, as well as significant board of director leadership experience from a wide variety of companies.Nancy Orr, age 63, has served as a director since May 2013. Ms. Orr is currently also a director of Blue Goose Capital Inc., Cavendish Health and Social Services Centre, Ressources Quebec Inc. and Prometic Life Sciences Inc. Ms. Orr’s previous experience includes serving as President of Dynamis Group Inc. from 1991 to 2007 and Interim Chief Financial Officer of Redline Communications Inc., where she also served as a director, Chair of the Audit Committee and a member of its Compensation Committee. Ms. Orr was also a director of Dundee Wealth Management Inc., Fibrek Inc. and FRV Media Inc. She brings to the Board significant experience as a senior executive, director and audit committee member of a wide variety of companies. Ms. Orr is a member of the British Columbia Working Roundtable on Forestry. From FebruaryInstitute of Corporate Directors and has been a member of the Canadian Institute of Chartered Accountants since 1978. She holds a Master of Business and Administration from Queen’s University and a Bachelor of Arts degree in Business Administration from the University of Western Ontario.
David M. Gandossi, age 56, has served as Executive Vice-President, Chief Financial Officer and Secretary since August 2003. His previous roles included Chief Financial Officer and other senior executive positions with Formation Forest Products and Pacifica Papers Inc. Since 2007, to present, heMr. Gandossi has chaired the B.C. Pulp and Paper Task Force, a joint government industry and labor effort that is mandated to identify measures to improve the competitiveness of the British Columbia pulp and paper industry. Mr. Gandossi isHe also participated in the Pulp and Paper Advisory Committee to the BC Competition Council and was a member of BC’s Working Roundtable on Forestry. He is currently a Director of FPInnovations and Chair of the InstituteFPI National Research Advisory Committee. He also co-chairs the BC Bio-economy Transformation Council, a collaborative effort between Government and industry. Mr. Gandossi holds a Bachelor of Commerce Degree from the University of British Columbia and is a Chartered AccountantsAccountant in Canada.
Canada CPA, CA.Claes-Inge Isacson, age 65,68, has been ourserved as Chief Operating Officer since November 20062006. Prior to this role at Mercer, Mr. Isacson was President at AF Process, a worldwide consulting and is based in our Berlin office.engineering company. Mr. Isacson also served as Vice President Operations Indonesia for APRIL, Senior Vice President Production for Norske Skogindustrier ASA and President at Norske Skog Europe. Mr. Isacson brings over 24twenty-eight years of senior level pulp and paper management to ourthe senior management team, withteam. He holds a focus on kraft pulp. Mr. Isacson heldMaster of Science Degree in Mechanical Engineering.
David K. Ure, age 46, returned to Mercer in September 2013, assuming the positionsrole of President Norske Skog Europe, and then Senior Vice President, Production for Norske Skogindustrier ASA between 1989Finance. Prior to serving as Vice President, Finance of Sierra Wireless Inc., Mr. Ure was Vice President, Controller at Mercer from 2006 to 2010. He has also served as Controller at various companies including Catalyst Paper Corp., Pacifica Papers Inc., and 2004. His most recent position was President, AF Process, a consultingTrojanLitho, as well as CFO and engineering company working worldwide.Secretary of Finlay Forest Industries Inc. Mr. Ure has over fifteen years’ experience in the forest products industry. He holds a MastersBachelor of Commerce in Finance from the University of British Columbia, Canada and is a member of the Certified General Accountants’ Association of Canada.
Leonhard Nossol, age 56, has served as our Group Controller for Europe since August 2005. He has also been Managing Director of Rosenthal since 1997 and the sole Managing Director of Rosenthal since 2005. Before joining Mercer, Mr. Nossol was Director, Finance and Administration for a German household appliance producer from 1992 to 1997. Prior to this, he was Operations Controller at Grundig AG (consumer electronics) in Nürnberg. Mr. Nossol has been a member of the German Industry Federation’s (BDI) Tax Committee since 2003. He was elected President of the German Wood Users Association (AGR) in 2013. Mr. Nossol holds a Political Science Mechanical Engineering.
degree from Freie Universität Berlin and a degree in Business Management from the University of Applied Sciences in Berlin.Richard Short, age 43,46, has been ourserved as Controller since DecemberNovember 2010, prior to which he was ourserved as Director, Corporate Finance since joining Mercer in 2007. Prior to joining Mercer, Mr. Short wasPrevious roles include Controller, Financial Reporting from 2006 to 2007 and Director, Corporate Finance from 2004 to 2006 with Catalyst Paper Corp.Corporation. Mr. Short isholds a Bachelor of Arts in Psychology from the University of British Columbia and has been a member of the Canadian Institute of Chartered Accountants in Canada.
Leonhard Nossol, age 53, has been our Group Controller for Europe since August 2005. He has also been a managing director of Rosenthal since 1997 and the sole managing director of Rosenthal since September 2005. Mr. Nossol had a significant involvement in the conversion of the Rosenthal mill to the production of kraft pulp in 1999 and increases in the mill’s annual production capacity to 330,000 ADMTs, as well as the reduction in production costs at the mill.
1993.David M. Cooper, age 57,60, has beenserved as Vice President of Sales and Marketing for Europe since June 2005. Mr. Cooper previously held a variety of senior positions around the world inat Sappi Ltd., a large global forest products group, from 1982 to 2005, including2005. These roles included the sales and marketing of various pulp and paper grades and the management of a manufacturing facility. HeMr. Cooper has more than 25thirty years of diversified experience in the international pulp and paper industry.
Eric X. Heine, age 47,50, has beenserved as Vice President of Sales and Marketing for North America and Asia since June 2005. Mr. Heine was previously Vice President Pulp and International Paper Sales and Marketing for Domtar Inc., a global pulp and paper corporation, from 1999 to 2005. HeMr. Heine has over 18twenty-five years of experience in the pulp and paper industry, including developing strategic sales channels and market partners to build corporate brands.
He holds a Bachelor of Science in Forestry (Wood Science) from the University of Toronto, Canada.Wolfram Ridder, age 49, was appointed52, has served as Vice President of Business Development in Augustsince 2005, prior to which he was a managing director of Stendal.served as Managing Director at Mercer’s Stendal mill from 2001 to 2005. Mr. Ridder wasalso served as Vice President Pulp Operations, Assistant to CEO from 1999 to 2005 and Assistant Managing Director at the principal assistantRosenthal mill from 1995 to our Chief Executive Officer1998. Prior to joining Mercer, Mr. Ridder worked as a Scientist for pulping technology development at the German Federal Research Center for Wood Science and Technology in Hamburg from November 1995 until September 2002.
1988 to 1995. Mr. Ridder has a Master of Business and Administration and a Master of Wood Science and Forest Product Technology from Hamburg University.Genevieve Stannus, age 40,43, has been ourserved as Treasurer since July 2005, prior to which she was aserved as Senior Financial Analyst withsince joining Mercer fromin August 2003. Prior to joiningher role at Mercer, Ms. Stannus held Senior Treasury Analyst positions with Catalyst Paper Corporation and Pacifica Papers Inc. SheMs. Stannus has over tentwenty years of experience in the forest products industry. Ms. StannusShe is a member of the Certified General Accountants’Accountants Association of Canada.
Niklaus Gruenenfelder, age 53, became the Managing Director of Stendal in January 2009. Previously, from 1989 until 2006, Mr. Gruenenfelder held a variety of positions in Switzerland, China, Germany and Pakistan with Swiss chemicals manufacturer Ciba Specialty Chemicals Holding Inc. (formerly Ciba-Geigy AG). In 2006, Huntsman Corporation, a global chemical and chemical products company, acquired the textile effects business from Ciba and Mr. Gruenenfelder was the Managing Director and Head of Technical Operations at Huntsman’s Langweid am Leich plant in Germany from 2006 until he joined Mercer. Mr. Gruenenfelder holds a Ph.D. in Technical Science and an MBA.
Brian Merwin, age 37,40, has been ourserved as Vice President, of Strategic Initiatives since February 2009, prior to which he was our2009. Mr. Merwin previously held roles within Mercer such as Director, of Strategic and Business Initiatives, since August 2007 and Business Analyst since May 2005. BrianAnalyst. He was a key member of Celgar’s Green Energy Project, and was instrumental in the development of the BC Hydro energy purchase agreement and securing the ecoENERGY grant. Mr. Merwin has an MBAa Master of Business and Administration from the Richard Ivey School of Business atin Ontario, Canada and a Bachelor of Commerce Degree from the University of Western Ontario.
67
We also have experienced mill managers at all of our mills who have operated through multiple business cycles in the pulp industry.
The Board met fivesix times during 20102013 and each current member of the Board attended 75% or more100% of the total number of such meetings and meetings of the committees of the Board on which they serve during their term. In addition, our independent directors regularly meet in separate executive sessions without any member of our management present. The Lead Director presides over these meetings. Although we do not have a formal policy with respect to attendance of directors at our annual meetings, all directors are encouraged and expected to attend such meetings if possible. All of our directors attended our 20102013 annual meeting.
The Board has developed corporate governance guidelines in respect of: (i) the duties and responsibilities of the Board, its committees and officers; and (ii) practices with respect to the holding of regular quarterly and strategic meetings of the Board including separate meetings of non-management directors. The Board has established four standing committees, the Audit Committee, the Compensation and Human Resource Committee, the Governance and Nominating Committee and the Environmental, Health and Safety Committee.
Audit Committee
The Audit Committee was established in accordance with Section 3(a)(58)(A) of the Exchange Act and functions pursuant to a charter adopted by the directors. A copy of the current charter is incorporated by reference in the exhibits to thisForm 10-K and is available on our website atwww.mercerint.com under the “Governance” link. The function of the Audit Committee generally is to meet with and review the results of the audit of our financial statements performed by the independent public accountants and to recommend the selection of independent public accountants. The members of the Audit Committee are Mr. McCartney, Mr. WittsShepherd and Mr. Lauritzen,Ms. Orr, each of whom is independent under applicable laws and regulations and the listing requirements of the NASDAQ Global Select Market. Both Mr. McCartney and Mr. Witts areis a Chartered AccountantsAccountant and Mr. McCartney is a “financial expert” within the meaning of such term under theSarbanes-Oxley Act of 2002. The Audit Committee met four times during 2010.
2013.The Audit Committee has established procedures for: (i) the receipt, retention and treatment of complaints received by us regarding accounting, internal accounting controls or auditing matters; and (ii) the confidential and anonymous submission by our employees and others of concerns regarding questionable accounting or auditing matters. A person wishing to notify us of such a complaint or concern should send a written notice thereof, marked “Private & Confidential”, to the Chairman of the Audit Committee, Mercer International Inc.,c/o Suite 2840, P.O. Box 11576, 6501120, 700 West GeorgiaPender Street, Vancouver, British Columbia, Canada V6B 4N8.
V6C 1G8.
Compensation and Human Resource Committee
The Board has established a Compensation and Human Resource Committee. The Compensation and Human Resource Committee is responsible for reviewing and approving the strategy and design of our compensation,equity-based and benefits programs. The Compensation and Human Resource Committee functions pursuant to a charter adopted by the directors, a copy of which is available on our website atwww.mercerint.com in the Corporate Governance Guidelines under the “Governance” link. The Compensation and Human Resource Committee is also responsible for approving all compensation actions relating to executive officers. The members of the Compensation and Human Resource Committee are Mr. Malpass,Picchi, Mr. LauritzenWitts, Mr. Purchase and Mr. Adams,Ms. Orr, each of whom is independent under applicable laws and regulations and the listing requirements of the NASDAQ Global Select Market. The Compensation and Human Resource Committee met six times during 2010.
Governance and Nominating Committee
The Board has established a Governance and Nominating Committee comprised of Mr. Shields,Lauritzen, Mr. McCartney and Mr. Witts, each of whom is independent under applicable laws and regulations and the listing requirements of the NASDAQ Global Select Market. The Governance and Nominating Committee functions pursuant to a charter adopted by the directors, a copy of which is incorporated by reference in the exhibits to thisForm 10-K and is available on our website atwww.mercerint.com in the Corporate Governance Guidelines under the “Governance” link. The purpose of the committee is to: (i) manage the corporate governance system of the Board; (ii) assist the Board in fulfilling its duties to meet applicable legal and regulatory and self-regulatory business principles and
68
codes of best practice; (iii) assist in the creation of a corporate culture and environment of integrity and accountability; (iv) in conjunction with the Lead Director, monitor the quality of the relationship between the Board and management; (v) review management succession plans; (vi) recommend to the Board nominees for appointment to the Board; (vii) lead the Board’s annual review of the Chief Executive Officer’s performance; and (viii) set the Board’s forward meeting agenda. The Governance and Nominating Committee met foursix times in 2010.
2013.
Environmental, Health and Safety Committee
The Board established an Environmental, Health and Safety Committee in 2006, currently comprised of Mr. Lauritzen,Shepherd, Mr. MalpassPurchase and Mr. Lee, to review on behalf of the Board the policies and processes implemented by management, and the resulting impact and assessments of all our environmental, health and safety related activities. The Environmental, Health and Safety Committee functions pursuant to a charter adopted by the directors, a copy of which is available on our website atwww.mercerint.com in the Corporate Governance Guidelines under the “Governance” link. More specifically, the Environmental, Health and Safety Committee is to: (i) review and approve, and if necessary revise, our environmental, health and safety policies and environmental compliance programs; (ii) monitor our environmental, health and safety management systems including internal and external audit results and reporting; and (iii) provide direction to management on the frequency and focus of external independent environmental, health and safety audits. The Environmental, Health and Safety Committee met four times in 2010.
Lead Director/Deputy Chairman
The Board appointed Mr. ShieldsLauritzen as its Lead Director in September 2003 and in 2006 as Deputy Chairman of the Board.2012. The role of the Lead Director is to provide leadership to the non-management directors on the Board and to ensure that the Board can operate independently of management and that directors have an independent leadership contact. The duties of the Lead Director include, among other things: (i) ensuring that the Board has adequate resources to support itsdecision-making process and ensuring that the Board is appropriately approving strategy and supervising management’s progress against that strategy; (ii) ensuring that the independent directors have adequate opportunity to meet to discuss issues without management being present; (iii) chairing meetings of directors in the absence of the Chairman and Chief Executive Officer; (iv) ensuring that delegated committee functions are carried out and reported to the Board; and (v) communicating to management, as appropriate, the results of private discussions among outside directors and acting as a liaison between the Board and the Chief Executive Officer.
Code of Business Conduct and Ethics
The Board has adopted a Code of Business Conduct and Ethics that applies to our directors, employees and executive officers. The code is incorporated by reference in the exhibits to thisForm 10-K and is available on our website atwww.mercerint.com under the “Governance” link. A copy of the code may also be obtained without charge upon request to Investor Relations, Mercer International Inc., Suite 2840, P.O. Box 11576, 6501120, 700 West GeorgiaPender Street, Vancouver, British Columbia, Canada V6B 4N8V6C 1G8 (Telephone:(604) 684-1099) or Investor Relations, Mercer International Inc., 14900 Interurban Avenue South, Suite 282, Seattle WA, U.S.A. 98168 (Telephone:(206) 674-4639).
Section 16(a) Beneficial Ownership Reporting Compliance
The information required under “Section 16(a) Beneficial Ownership Reporting Compliance” is incorporated by reference from the proxy statement relating to our annual meeting to be held in 2011,2014, which will be filed with the SEC within 120 days of our most recently completed fiscal year.
| |
| ITEM 11. | EXECUTIVE COMPENSATION |
The information required by this Item 11 is incorporated by reference from the proxy statement relating to our annual meeting to be held in 2011,2014, which will be filed with the SEC within 120 days of our most recently completed fiscal year.
69
| |
| ITEM 12. | SECURITY OWNERSHIP OF CERTAIN BENEFICIAL OWNERS AND MANAGEMENT AND RELATED STOCKHOLDER MATTERS |
The information required by this Item 12 is incorporated by reference from the proxy statement relating to our annual meeting to be held in 2011,2014, which will be filed with the SEC within 120 days of our most recently completed fiscal year.
| |
| ITEM 13. | CERTAIN RELATIONSHIPS AND RELATED TRANSACTIONS, AND DIRECTOR INDEPENDENCE |
Review, Approval or Ratification of Transactions with Related Persons
Pursuant to the terms of the Audit Committee Charter, the Audit Committee is responsible for reviewing and approving the terms and conditions of all proposed transactions between us, any of our officers, directors or shareholders who beneficially own more than 5% of our outstanding shares of common stock, or relatives or affiliates of any such officers, directors or shareholders, to ensure that such related party transactions are fair and are in our overall best interest and that of our shareholders. In the case of transactions with employees, a portion of the review authority is delegated to supervising employees pursuant to the terms of our written Code of Business Conduct and Ethics.
The Audit Committee has not adopted any specific procedures for conduct of reviews and considers each transaction in light of the facts and circumstances. In the course of its review and approval of a transaction, the Audit Committee considers, among other factors it deems appropriate:
Whether the transaction is fair and reasonable to us;
The business reasons for the transaction;
| | |
| • | Whether the transaction is fair and reasonable to us; |
|
| • | The business reasons for the transaction; |
|
| • | Whether the transaction would impair the independence of one of our non-employee directors; and |
|
| • | Whether the transaction is material, taking into account the significance of the transaction. |
Whether the transaction would impair the independence of one of our non-employee directors; and
Whether the transaction is material, taking into account the significance of the transaction.
Any member of the Audit Committee who is a related person with respect to a transaction under review may not participate in the deliberations or vote respecting approval or ratification of the transaction, provided, however, that such director may be counted in determining the presence of a quorum at a meeting of the committee that considers the transaction.
The information called for by Items 404(a) and 407(a) ofRegulation S-K required to be included under this Item 13 is incorporated by reference from the proxy statement relating to our annual meeting to be held in 2011,2014, which will be filed with the SEC within 120 days of our most recently completed fiscal year.
| |
| ITEM 14. | PRINCIPAL ACCOUNTANT FEES AND SERVICES |
The information required by this Item 14 is incorporated by reference from the proxy statement relating to our annual meeting to be held in 2011,2014, which will be filed with the SEC within 120 days of our most recently completed fiscal year.
70
PART IV
| ITEM 15. | EXHIBITS, FINANCIAL STATEMENTS |
(a) (1)Financial Statements
| |
ITEM 15. | EXHIBITS, FINANCIAL STATEMENT SCHEDULES |
| | | | |
| | | Page |
| |
| | | 7386 | |
| | | 7488 | |
| | | 7589 | |
| | | 7690 | |
| | | 7791 | |
| | | 7892 | |
| | | 7994 | |
| | | | | |
| | 2 | .1 | | Agreement and Plan of Merger among Mercer International Inc., Mercer International Regco Inc. and Mercer Delaware Inc. dated December 14, 2005. Incorporated by reference to the Proxy Statement/Prospectus filed on December 15, 2005. |
| | 3 | .1 | | Articles of Incorporation of the Company, as amended. Incorporated by reference fromForm 8-A dated March 1, 2006. |
| | 3 | .2 | | Bylaws of the Company. Incorporated by reference fromForm 8-A dated March 1, 2006. |
| | 4 | .1 | | Indenture dated as of December 10, 2004 between Mercer International Inc. and Wells Fargo Bank, National Association. Incorporated by reference fromForm S-3 filed December 10, 2004. |
| | 4 | .2 | | First Supplemental Indenture dated February 14, 2005 to Indenture dated December 10, 2004 between Mercer International Inc. and Wells Fargo Bank, National Association. Incorporated by reference fromForm 8-K dated February 17, 2005. |
| | 4 | .3 | | Indenture dated as of December 10, 2009 between Mercer International Inc. and Wells Fargo Bank, National Association. Incorporated by reference fromForm 8-K dated December 11, 2009. |
| | 4 | .4 | | Second Supplemental Indenture dated as of November 16, 2010 to the Indenture dated December 10, 2004 between Mercer International Inc. and Wells Fargo Bank, National Association. Incorporated by reference fromForm 8-K dated November 19, 2010. |
| | 4 | .5 | | Indenture dated as of November 17, 2010 between Mercer International Inc. and Wells Fargo Bank, National Association. Incorporated by reference fromForm 8-K dated November 19, 2010. |
| | 4 | .6 | | Registration Rights Agreement among Mercer International Inc. and RBC Capital Markets, LLC and Credit Suisse Securities (USA) LLC dated November 17, 2010. Incorporated by reference fromForm 8-K dated November 19, 2010. |
| | 10 | .1* | | Project Financing Facility Agreement dated August 26, 2002 between Zellstoff Stendal GmbH and Bayerische Hypo-und Vereinsbank AG, as amended by Amendment, Restatement and Undertaking Agreement dated January 31, 2009. |
| | 10 | .2 | | Shareholders’ Undertaking Agreement dated August 26, 2002 among Mercer International Inc., Stendal Pulp Holdings GmbH, RWE Industrie-Lösungen GmbH, AIG Altmark Industrie AG and FAHR Beteiligungen AG and Zellstoff Stendal GmbH and Bayerische Hypo-und Vereinsbank AG. Incorporated by reference fromForm 8-K dated September 10, 2002. |
| | 10 | .3* | | Shareholders’ Agreement dated August 26, 2002 among Zellstoff Stendal GmbH, Stendal Pulp Holdings GmbH, RWE Industrie-Lösungen GmbH and FAHR Beteiligungen AG. |
| | 10 | .4* | | Contract for the Engineering, Design, Procurement, Construction, Erection andStart-Up of a Kraft Pulp Mill between Zellstoff Stendal GmbH and RWE Industrie-Lösungen GmbH dated August 26, 2002. Certain non-public information has been omitted from the appendices to Exhibit 10.4 pursuant to a request for confidential treatment filed with the SEC. Such non-public information was filed with the SEC on a confidential basis. The SEC approved the request for confidential treatment in January 2004. |
| | 10 | .5* | | Form of Trustee’s Indemnity Agreement between Mercer International Inc. and its Trustees. |
71
| | | | | |
| | 10 | .6 | | Employment Agreement dated for reference August 7, 2003 between Mercer International Inc. and David Gandossi. Incorporated by reference fromForm 8-K dated August 11, 2003. |
| | 10 | .7 | | Employment Agreement effective as of April 28, 2004 between Mercer International Inc. and Jimmy S.H. Lee. Incorporated by reference fromForm 8-K dated April 28, 2004. |
| | 10 | .8 | | 2004 Stock Incentive Plan. Incorporated by reference fromForm S-8 dated June 15, 2004. |
| | 10 | .9 | | 2010 Stock Incentive Plan. Incorporated by reference fromForm S-8 dated June 11, 2010. |
| | 10 | .10 | | Employment Agreement dated October 2, 2006 between Stendal Pulp Holding GmbH and Wolfram Ridder. Incorporated by reference fromForm 8-K dated October 2, 2006. |
| | 10 | .11* | | Employment Agreement effective September 25, 2006 between Mercer International Inc. and Claes-Inge Isacson dated December 5, 2008. |
| | 10 | .12 | | Employment Agreement effective September 1, 2005 between Mercer International Inc. and Leonhard Nossol dated August 18, 2005. Incorporated by reference fromForm 10-Q dated May 6, 2008. |
| | 10 | .13* | | Electricity Purchase Agreement effective January 27, 2009 between Zellstoff Celgar Limited Partnership and British Columbia Hydro and Power Authority. Certain non-public information has been omitted from the appendices to Exhibit 10.13 pursuant to a request for confidential treatment filed with the SEC. Such non-public information was filed with the SEC on a confidential basis. The SEC approved the request for confidential treatment in March 2009. |
| | 10 | .14* | | Revolving Credit Facility Agreement dated August 19, 2009 among D&Z Holding GmbH, Zellstoff-und Papierfabrik Rosenthal GmbH, D&Z Beteiligungs GmbH and ZPR Logistik GmbH and BayerischeHypo-und Vereinsbank AG. Incorporated by reference fromForm 8-K dated August 24, 2009. |
| | 10 | .15 | | Loan Agreement dated August 19, 2009 among Zellstoff-und Papierfabrik Rosenthal GmbH, as borrower, and Bayerische Hypo-und Vereinsbank Aktiengesellschaft, as lender. Incorporated by reference fromForm 8-K dated August 24, 2009. |
| | 10 | .16 | | Amended and Restated Credit Agreement dated as of November 27, 2009 among Zellstoff Celgar Limited Partnership, as borrower, and the lenders from time to time parties thereto, as lenders, and CIT Business Credit Canada Inc., as agent. Incorporated by reference fromForm 8-K dated November 30, 2009. |
| | 14 | | | Code of Business Conduct and Ethics. Incorporated by reference from the definitive proxy statement on Schedule 14A dated August 11, 2003. |
| | 99 | .1 | | Audit Committee Charter. Incorporated by reference from the definitive proxy statement on Schedule 14A dated April 28, 2005. |
| | 99 | .2 | | Governance and Nominating Committee Charter. Incorporated by reference from the definitive proxy statement on Schedule 14A dated April 28, 2004. |
| | 99 | .3 | | Exchange Agreement dated November 25, 2009 between Mercer International Inc. and IAT Reinsurance Co. Ltd. Incorporated by reference fromForm 8-K filed November 27, 2009. |
| | 99 | .4 | | Exchange Agreement dated November 25, 2009 between Mercer International Inc. and Alden Global Distressed Opportunities Fund L.P. Incorporated by reference fromForm 8-K filed November 27, 2009. |
| | 99 | .5 | | Exchange Agreement dated November 25, 2009 between Mercer International Inc. and Greenlight Capital Qualified LP, Greenlight Capital LP and Greenlight Capital Offshore Partners. Incorporated by reference fromForm 8-K filed November 27, 2009. |
| | 21 | | | List of Subsidiaries of Registrant. |
| | 23 | .1 | | Consent of Independent Registered Chartered Accountants — PricewaterhouseCoopers LLP. |
| | 31 | .1 | | Section 302 Certificate of Chief Executive Officer. |
| | 31 | .2 | | Section 302 Certificate of Chief Financial Officer. |
| | 32 | .1** | | Section 906 Certificate of Chief Executive Officer. |
| | 32 | .2** | | Section 906 Certificate of Chief Financial Officer. |
| | |
* 2.1 | | Agreement and Plan of Merger among Mercer International Inc., Mercer International Regco Inc. and Mercer Delaware Inc. dated December 14, 2005. Incorporated by reference to the Proxy Statement/Prospectus filed on December 15, 2005. |
| |
3.1 | | Articles of Incorporation of the Company, as amended. Incorporated by reference from Form 8-A dated March 1, 2006. |
| |
3.2 | | Bylaws of the Company. Incorporated by reference from Form 8-A dated March 1, 2006. |
| |
4.1 | | Indenture dated as of November 17, 2010 between Mercer International Inc. and Wells Fargo Bank, National Association. Incorporated by reference from Form 8-K filed on July 23, 2013. |
| |
10.1* | | Project Financing Facility Agreement dated August 26, 2002 between Zellstoff Stendal GmbH and Bayerische Hypo-und Vereinsbank AG, as amended by Amendment, Restatement and Undertaking Agreement dated January 31, 2009 and the Amendment Agreement dated January 20, 2012. |
| |
10.2* | | Project Blue Mill Financing Facility Agreement dated January 20, 2012 between Zellstoff Stendal GmbH and Unicredit Bank AG and IKB Deutsche Industriebank AG. |
| |
10.3* | | Shareholders’ Undertaking Agreement dated August 26, 2002 among Mercer International Inc., Stendal Pulp Holdings GmbH, RWE Industrie-Lösungen GmbH, AIG Altmark Industrie AG and FAHR Beteiligungen AG and Zellstoff Stendal GmbH and Bayerische Hypo-und Vereinsbank AG as amended by the Amendment Restatement and Undertaking Agreement dated January 20, 2012. |
| |
10.4* | | Shareholders’ Agreement dated August 26, 2002 among Zellstoff Stendal GmbH, Stendal Pulp Holdings GmbH, RWE Industrie-Lösungen GmbH and FAHR Beteiligungen AG as amended by the Amendment Agreement dated January 20, 2012. |
| |
10.5* | | Contract for the Engineering, Design, Procurement, Construction, Erection and Start-Up of a Kraft Pulp Mill between Zellstoff Stendal GmbH and RWE Industrie-Lösungen GmbH dated August 26, 2002. Certain non-public information has been omitted from the appendices to Exhibit 10.4 pursuant to a request for confidential treatment filed with the SEC. Such non-public information was filed with the SEC on a confidential basis. The SEC approved the request for confidential treatment in January 2004. |
| |
10.6* | | Form of Trustee’s Indemnity Agreement between Mercer International Inc. and its Trustees. |
| |
10.7 | | Employment Agreement dated for reference August 7, 2003 between Mercer International Inc. and David Gandossi. Incorporated by reference from Form 8-K dated August 11, 2003. |
| |
10.8 | | Employment Agreement effective as of April 28, 2004 between Mercer International Inc. and Jimmy S.H. Lee. Incorporated by reference from Form 8-K dated April 28, 2004. |
| |
10.9 | | 2004 Stock Incentive Plan. Incorporated by reference from Form S-8 dated June 15, 2004. |
| |
10.10 | | 2010 Stock Incentive Plan. Incorporated by reference from Form S-8 dated June 11, 2010. |
| | |
| |
10.11 | | Employment Agreement dated October 2, 2006 between Stendal Pulp Holding GmbH and Wolfram Ridder. Incorporated by reference from Form 8-K dated October 2, 2006. |
| |
10.12* | | Employment Agreement effective September 25, 2006 between Mercer International Inc. and Claes-Inge Isacson dated December 5, 2008. |
| |
10.13 | | Employment Agreement effective September 1, 2005 between Mercer International Inc. and Leonhard Nossol dated August 18, 2005. Incorporated by reference from Form 10-Q dated May 6, 2008. |
| |
10.14* | | Electricity Purchase Agreement effective January 27, 2009 between Zellstoff Celgar Limited Partnership and British Columbia Hydro and Power Authority. Certain non-public information has been omitted from the appendices to Exhibit 10.13 pursuant to a request for confidential treatment filed with the SEC. Such non-public information was filed with the SEC on a confidential basis. The SEC approved the request for confidential treatment in March 2009. |
| |
10.15 | | Revolving Credit Facility Agreement dated August 19, 2009 among D&Z Holding GmbH, Zellstoff-und Papierfabrik Rosenthal GmbH, D&Z Beteiligungs GmbH and ZPR Logistik GmbH and Bayerische Hypo-und Vereinsbank AG. Incorporated by reference from Form 8-K dated August 24, 2009. |
| |
10.16 | | Loan Agreement dated August 19, 2009 among Zellstoff-und Papierfabrik Rosenthal GmbH, as borrower, and Bayerische Hypo-und Vereinsbank Aktiengesellschaft, as lender. Incorporated by reference from Form 8-K dated August 24, 2009. |
| |
10.17 | | Extension, Amendment and Confirmation Letter dated October 4, 2012 among Zellstoff- und Papierfabrik Rosenthal GmbH, D&Z Holding GmbH, D&Z Beteiligungs GmbH, ZPR Logistik GmbH and Mercer International Inc. Incorporated by reference from Form 10-Q dated November 2, 2012. |
| |
10.18 | | Second Amended and Restated Credit Agreement dated as of May 2, 2013 among Zellstoff Celgar Limited Partnership, as borrower, and the lenders from time to time parties thereto, as lenders, and Canadian Imperial Bank of Commerce, as agent. Incorporated by reference from Form 8-K dated May 8, 2013. |
| |
10.19 | | Amendment Agreement, dated September 30, 2013, among Zellstoff Stendal GmbH, as Borrower, UniCredit Bank AG, as Arranger, Agent, Security Agent and Original Lender, the Lenders from time to time parties thereto, E & Z Industrie-Lösungen GmbH, Mercer International Inc. and Stendal Pulp Holding GmbH. Incorporated by reference from Form 10-Q filed on November 1, 2013. |
| |
14 | | Code of Business Conduct and Ethics. Incorporated by reference from the definitive proxy statement on Schedule 14A dated August 11, 2003. |
| |
99.1 | | Audit Committee Charter. Incorporated by reference from the definitive proxy statement on Schedule 14A dated April 28, 2005. |
| |
99.2 | | Governance and Nominating Committee Charter. Incorporated by reference from the definitive proxy statement on Schedule 14A dated April 28, 2004. |
| |
21 | | List of Subsidiaries of Registrant. |
| |
23.1 | | Consent of Independent Registered Public Accounting Firm. |
| |
31.1 | | Section 302 Certificate of Chief Executive Officer. |
| |
31.2 | | Section 302 Certificate of Chief Financial Officer. |
| |
32.1** | | Section 906 Certificate of Chief Executive Officer. |
| |
32.2** | | Section 906 Certificate of Chief Financial Officer. |
| * | Filed inForm 10-K for prior years. |
| ** | | In accordance with Release33-8212 of the Commission, these Certifications: (i) are “furnished” to the Commission and are not “filed” for the purposes of liability under the Exchange Act; and (ii) are not to be subject to automatic incorporation by reference into any of our Company’s registration statements filed under the Securities Act for the purposes of liability thereunder or any offering memorandum, unless our Company specifically incorporates them by reference therein. |
72

REPORT OF INDEPENDENT REGISTERED PUBLIC ACCOUNTING FIRMReport of Independent Registered Public Accounting Firm
To the Shareholders and Board of Directors of
Mercer International Inc.
We have audited the accompanying consolidated balance sheets of Mercer International Inc. and its subsidiaries as of December 31, 20102013 and December 31, 20092012 and the related consolidated statements of operations, comprehensive income (loss), changes in shareholders’shareholder’s equity, and cash flows for each of the years in the three-year period ended December 31, 2010.2013. We also have audited Mercer International Inc.’s and its subsidiaries’ internal control over financial reporting as of December 31, 2010,2013, based on criteria established in Internal Control — Control—Integrated Framework (1992) issued by the Committee of Sponsoring Organizations of the Treadway Commission (COSO). Management is responsible for these consolidated financial statements, for maintaining effective internal control over financial reporting, and for its assessment of the effectiveness of internal control over financial reporting, included in the accompanying Management’s Report on Internal Control.Control over Financial Reporting appearing under Item 9A of this Form 10-K. Our responsibility is to express an opinion on these consolidated financial statements and an opinion on the company’s internal control over financial reporting based on our integrated audits.
We conducted our audits in accordance with the standards of the Public Company Accounting Oversight Board (United States). Those standards require that we plan and perform the auditsaudit to obtain reasonable assurance about whether the consolidated financial statements are free of material misstatement and whether effective internal control over financial reporting was maintained in all material respects. Our audits of the consolidated financial statements included examining, on a test basis, evidence supporting the amounts and disclosures in the consolidated financial statements, assessing the accounting principles used and significant estimates made by management, and evaluating the overall consolidated financial statement presentation. Our audit of internal control over financial reporting included obtaining an understanding of internal control over financial reporting, assessing the risk that a material weakness exists, and testing and evaluating the design and operating effectiveness of internal control based on the assessed risk. Our audits also included performing such other procedures as we considered necessary in the circumstances. We believe that our audits provide a reasonable basis for our opinions.
A company’s internal control over financial reporting is a process designed to provide reasonable assurance regarding the reliability of financial reporting and the preparation of financial statements for external purposes in accordance with generally accepted accounting principles. A company’s internal control over financial reporting includes those policies and procedures thatthat: (i) pertain to the maintenance of records that, in reasonable detail, accurately and fairly reflect the transactions and dispositions of the assets of the company; (ii) provide reasonable assurance that transactions are recorded as necessary to permit preparation of consolidated financial statements in accordance with generally accepted accounting principles, and that receipts and expenditures of the company are being made only in accordance with authorizations of management and directors of the company; and (iii) provide reasonable assurance regarding prevention or timely detection of unauthorized acquisition, use, or disposition of the company’s assets that could have a material effect on the financial statements. Because of its inherent limitations, internal control over financial reporting may not prevent or detect misstatements. Also, projections of any evaluation of effectiveness to future periods are subject to the risk that controls may become inadequate because of changes in conditions, or that the degree of compliance with the policies or procedures may deteriorate.
In our opinion, the consolidated financial statements referred to above present fairly, in all material respects, the financial position of Mercer International Inc. and its subsidiaries as of December 31, 20102013 and December 31, 2009,2012 and the results of itstheir operations and itstheir cash flows for each of the years in the three-year period ended December 31, 20102013 in conformity with accounting principles generally accepted in the United States of America. Also, in our opinion, Mercer International Inc. and its subsidiaries maintained, in all material respects, effective internal control over financial reporting as of December 31, 2010,2013, based on criteria established in Internal Control — Control—Integrated Framework (1992) issued by the Committee of Sponsoring Organizations of the Treadway Commission (COSO).
COSO./s/ PricewaterhouseCoopers LLP
Chartered Professional Accountants
British ColumbiaFebruary 15, 2011
73
MERCER INTERNATIONAL INC.
CONSOLIDATED BALANCE SHEETS
(In thousands of Euros, except per share data)
| | | | | | | | | |
| | | December 31, | |
| | | 2010 | | | 2009 | |
| |
ASSETS | | | | | | | | |
| Current assets | | | | | | | | |
| Cash and cash equivalents (Note 2) | | € | 99,022 | | | € | 51,291 | |
| Receivables (Note 3) | | | 121,709 | | | | 71,143 | |
| Inventories (Note 4) | | | 102,219 | | | | 72,629 | |
| Prepaid expenses and other | | | 11,360 | | | | 5,871 | |
| Deferred income tax (Note 9) | | | 22,570 | | | | — | |
| | | | | | | | | |
| Total current assets | | | 356,880 | | | | 200,934 | �� |
| | | | | | | | | |
| Long-term assets | | | | | | | | |
| Property, plant and equipment (Note 5) | | | 846,767 | | | | 868,558 | |
| Deferred note issuance and other | | | 11,082 | | | | 8,186 | |
| Deferred income tax (Note 9) | | | — | | | | 3,426 | |
| Note receivable | | | 1,346 | | | | 2,727 | |
| | | | | | | | | |
| | | | 859,195 | | | | 882,897 | |
| | | | | | | | | |
| Total assets | | € | 1,216,075 | | | € | 1,083,831 | |
| | | | | | | | | |
| | | | | | | | | |
LIABILITIES | | | | | | | | |
| Current liabilities | | | | | | | | |
| Accounts payable and accrued expenses (Note 6) | | € | 84,873 | | | € | 85,185 | |
| Pension and other post-retirement benefit obligations (Note 8) | | | 728 | | | | 567 | |
| Debt (Note 7) | | | 39,596 | | | | 16,032 | |
| | | | | | | | | |
| Total current liabilities | | | 125,197 | | | | 101,784 | |
| | | | | | | | | |
| Long-term liabilities | | | | | | | | |
| Debt (Note 7) | | | 782,328 | | | | 813,142 | |
| Unrealized interest rate derivative losses (Note 14) | | | 50,973 | | | | 52,873 | |
| Pension and other post-retirement benefit obligations (Note 8) | | | 24,236 | | | | 17,902 | |
| Capital leases and other (Note 15) | | | 12,010 | | | | 12,157 | |
| Deferred income tax (Note 9) | | | 7,768 | | | | — | |
| | | | | | | | | |
| | | | 877,315 | | | | 896,074 | |
| | | | | | | | | |
| Total liabilities | | € | 1,002,512 | | | € | 997,858 | |
| | | | | | | | | |
| | | | | | | | | |
EQUITY | | | | | | | | |
| Shareholders’ equity | | | | | | | | |
| Share capital (Note 10) | | | 219,211 | | | | 202,844 | |
| Paid-in capital | | | (3,899 | ) | | | (6,082 | ) |
| Retained earnings (deficit) | | | (10,956 | ) | | | (97,235 | ) |
| Accumulated other comprehensive income (loss) | | | 31,712 | | | | 23,695 | |
| | | | | | | | | |
| Total shareholders’ equity | | | 236,068 | | | | 123,222 | |
| | | | | | | | | |
| Noncontrolling interest (deficit) (Note 17) | | | (22,505 | ) | | | (37,249 | ) |
| | | | | | | | | |
| Total equity | | | 213,563 | | | | 85,973 | |
| | | | | | | | | |
| Total liabilities and equity | | € | 1,216,075 | | | € | 1,083,831 | |
| | | | | | | | | |
| Commitments and contingencies (Note 16) | | | | | | | | |
| Subsequent events (Note 18) | | | | | | | | |
The accompanying notes are an integral part of these financial statements.
74
| | | | | | | | |
| | | December 31, | |
| | | 2013 | | | 2012 | |
ASSETS | | | | | | | | |
Current assets | | | | | | | | |
Cash and cash equivalents (Note 2) | | $ | 147,728 | | | $ | 137,439 | |
Receivables (Note 3) | | | 135,893 | | | | 145,150 | |
Inventories (Note 4) | | | 170,908 | | | | 155,979 | |
Prepaid expenses and other | | | 10,918 | | | | 10,425 | |
Deferred income tax (Note 9) | | | 6,326 | | | | 5,887 | |
| | | | | | | | |
Total current assets | | | 471,773 | | | | 454,880 | |
| | | | | | | | |
Long-term assets | | | | | | | | |
Property, plant and equipment (Note 5) | | | 1,038,631 | | | | 1,066,506 | |
Deferred note issuance costs and other | | | 20,998 | | | | 16,036 | |
Deferred income tax (Note 9) | | | 17,157 | | | | 23,159 | |
| | | | | | | | |
| | | 1,076,786 | | | | 1,105,701 | |
| | | | | | | | |
Total assets | | $ | 1,548,559 | | | $ | 1,560,581 | |
| | | | | | | | |
LIABILITIES | | | | | | | | |
Current liabilities | | | | | | | | |
Accounts payable and other (Note 6) | | $ | 103,814 | | | $ | 118,599 | |
Pension and other post-retirement benefit obligations (Note 8) | | | 1,330 | | | | 1,072 | |
Debt (Note 7) | | | 60,355 | | | | 60,205 | |
| | | | | | | | |
Total current liabilities | | | 165,499 | | | | 179,876 | |
| | | | | | | | |
Long-term liabilities | | | | | | | | |
Debt (Note 7) | | | 919,017 | | | | 877,780 | |
Interest rate derivative liability (Note 17) | | | 46,517 | | | | 66,819 | |
Pension and other post-retirement benefit obligations (Note 8) | | | 35,466 | | | | 42,378 | |
Capital leases and other (Note 19) | | | 19,293 | | | | 18,375 | |
Deferred income tax (Note 9) | | | 14,450 | | | | 7,591 | |
| | | | | | | | |
| | | 1,034,743 | | | | 1,012,943 | |
| | | | | | | | |
Total liabilities | | | 1,200,242 | | | | 1,192,819 | |
| | | | | | | | |
EQUITY | | | | | | | | |
Shareholders’ equity | | | | | | | | |
Share capital (Note 10) | | | 328,549 | | | | 327,818 | |
Paid-in capital | | | (11,756 | ) | | | (4,481 | ) |
Retained earnings | | | 10,815 | | | | 37,190 | |
Accumulated other comprehensive income (Note 14) | | | 31,470 | | | | 28,577 | |
| | | | | | | | |
Total shareholders’ equity | | | 359,078 | | | | 389,104 | |
| | | | | | | | |
Noncontrolling interest (deficit) (Note 15) | | | (10,761 | ) | | | (21,342 | ) |
| | | | | | | | |
Total equity | | | 348,317 | | | | 367,762 | |
| | | | | | | | |
Total liabilities and equity | | $ | 1,548,559 | | | $ | 1,560,581 | |
| | | | | | | | |
Commitments and contingencies (Note 20) | | | | | | | | |
| | | | | | | | | | | | | |
| | | For the Years Ended December 31, | |
| | | 2010 | | | 2009 | | | 2008 | |
| |
| Revenues | | | | | | | | | | | | |
| Pulp | | € | 856,311 | | | € | 577,298 | | | € | 689,320 | |
| Energy | | | 44,225 | | | | 42,501 | | | | 30,971 | |
| | | | | | | | | | | | | |
| | | | 900,536 | | | | 619,799 | | | | 720,291 | |
| Costs and expenses | | | | | | | | | | | | |
| Operating costs | | | 643,529 | | | | 551,781 | | | | 626,933 | |
| Operating depreciation and amortization | | | 55,932 | | | | 53,919 | | | | 55,484 | |
| | | | | | | | | | | | | |
| | | | 201,075 | | | | 14,099 | | | | 37,874 | |
| Selling, general and administrative expenses | | | 33,442 | | | | 27,414 | | | | 30,158 | |
| Purchase (sale) of emission allowances | | | (110 | ) | | | (516 | ) | | | (5,613 | ) |
| | | | | | | | | | | | | |
| Operating income (loss) | | | 167,743 | | | | (12,799 | ) | | | 13,329 | |
| | | | | | | | | | | | | |
| Other income (expense) | | | | | | | | | | | | |
| Interest expense | | | (67,621 | ) | | | (64,770 | ) | | | (65,756 | ) |
| Investment income (loss) | | | 468 | | | | (1,804 | ) | | | (1,174 | ) |
| Foreign exchange gain (loss) on debt | | | (6,126 | ) | | | 2,692 | | | | (4,234 | ) |
| Gain (loss) on extinguishment of debt (Note 7) | | | (7,494 | ) | | | 4,447 | | | | — | |
| Gain (loss) on derivative instruments (Note 14) | | | 1,899 | | | | (5,760 | ) | | | (25,228 | ) |
| | | | | | | | | | | | | |
| Total other income (expense) | | | (78,874 | ) | | | (65,195 | ) | | | (96,392 | ) |
| | | | | | | | | | | | | |
| Income (loss) before income taxes | | | 88,869 | | | | (77,994 | ) | | | (83,063 | ) |
| Income tax benefit (provision) | | | | | | | | | | | | |
| — current | | | (3,881 | ) | | | (134 | ) | | | (501 | ) |
| — deferred (Note 9) | | | 9,760 | | | | 6,003 | | | | (1,976 | ) |
| | | | | | | | | | | | | |
| Net income (loss) | | | 94,748 | | | | (72,125 | ) | | | (85,540 | ) |
| Less: net loss (income) attributable to noncontrolling interest | | | (8,469 | ) | | | 9,936 | | | | 13,075 | |
| | | | | | | | | | | | | |
| Net income (loss) attributable to common shareholders | | € | 86,279 | | | € | (62,189 | ) | | € | (72,465 | ) |
| | | | | | | | | | | | | |
| Net income (loss) per share attributable to common shareholders (Note 12) | | | | | | | | | | | | |
| Basic | | € | 2.24 | | | € | (1.71 | ) | | € | (2.00 | ) |
| | | | | | | | | | | | | |
| Diluted | | € | 1.56 | | | € | (1.71 | ) | | € | (2.00 | ) |
| | | | | | | | | | | | | |
The accompanying notes are an integral part of these financial statements.
75
| | | | | | | | | | | | | |
| | | For the Years Ended December 31, | |
| | | 2010 | | | 2009 | | | 2008 | |
| |
| Net income (loss) | | € | 94,748 | | | € | (72,125 | ) | | € | (85,540 | ) |
| Other comprehensive income (loss), net of taxes | | | | | | | | | | | | |
| Foreign currency translation adjustment | | | 11,333 | | | | 28,316 | | | | (41,876 | ) |
| Pension income (expense) (Note 8) | | | (3,314 | ) | | | (3,128 | ) | | | 4,079 | |
| Unrealized gains (losses) on securities arising during the year | | | (2 | ) | | | 379 | | | | (340 | ) |
| | | | | | | | | | | | | |
| Other comprehensive income (loss), net of taxes | | | 8,017 | | | | 25,567 | | | | (38,137 | ) |
| | | | | | | | | | | | | |
| Total comprehensive income (loss) | | | 102,765 | | | | (46,558 | ) | | | (123,677 | ) |
| Comprehensive (income) loss attributable to noncontrolling interest | | | (8,469 | ) | | | 9,936 | | | | 13,075 | |
| | | | | | | | | | | | | |
| Comprehensive income (loss) attributable to common shareholders | | € | 94,296 | | | € | (36,622 | ) | | € | (110,602 | ) |
| | | | | | | | | | | | | |
The accompanying notes are an integral part of these consolidated financial statements.
76
MERCER INTERNATIONAL INC.
CONSOLIDATED STATEMENTS OF CHANGES IN SHAREHOLDERS’ EQUITY
OPERATIONS
(In thousands of Euros)
| | | | | | | | | | | | | | | | | | | | | | | | | | | | | | | | | | | | | | | | | |
| | | | | | | | | | | | | | | | | | Accumulated Other
| | | | |
| | | Common Shares | | | | | | | | | Comprehensive Income (Loss) | | | | |
| | | | | | | | | Amount
| | | | | | | | | Foreign
| | | Defined
| | | Unrealized
| | | | | | | |
| | | | | | | | | Paid in
| | | | | | Retained
| | | Currency
| | | Benefit
| | | Gains
| | | | | | | |
| | | Number
| | | Par
| | | Excess of
| | | Paid-in
| | | Earnings
| | | Translation
| | | Pension
| | | (Losses) on
| | | | | | Shareholders’
| |
| | | of Shares | | | Value | | | Par Value | | | Capital | | | (Deficit) | | | Adjustments | | | Plans | | | Securities | | | Total | | | Equity | |
| |
| Balance at December 31, 2007 | | | 36,285,027 | | | € | 27,576 | | | € | 175,268 | | | € | 134 | | | € | 37,419 | | | € | 41,099 | | | € | (4,929 | ) | | € | 95 | | | € | 36,265 | | | € | 276,662 | |
| Shares issued on grants of restricted stock | | | 21,000 | | | | — | | | | — | | | | 61 | | | | — | | | | — | | | | — | | | | — | | | | — | | | | 61 | |
| Shares issued on grants of performance stock | | | 116,460 | | | | — | | | | — | | | | 29 | | | | — | | | | — | | | | — | | | | — | | | | — | | | | 29 | |
| Stock compensation expense | | | — | | | | — | | | | — | | | | 75 | | | | — | | | | — | | | | — | | | | — | | | | — | | | | 75 | |
| Net loss | | | — | | | | — | | | | — | | | | — | | | | (72,465 | ) | | | — | | | | — | | | | — | | | | — | | | | (72,465 | ) |
| Other comprehensive income (loss) | | | — | | | | — | | | | — | | | | — | | | | — | | | | (41,876 | ) | | | 4,079 | | | | (340 | ) | | | (38,137 | ) | | | (38,137 | ) |
| | | | | | | | | | | | | | | | | | | | | | | | | | | | | | | | | | | | | | | | | |
| Balance at December 31, 2008 | | | 36,422,487 | | | € | 27,576 | | | € | 175,268 | | | € | 299 | | | € | (35,046 | ) | | € | (777 | ) | | € | (850 | ) | | € | (245 | ) | | € | (1,872 | ) | | € | 166,225 | |
| Capital contribution to acquire additional 4.32% of Stendal Mill | | | — | | | | — | | | | — | | | | (6,809 | ) | | | — | | | | — | | | | — | | | | — | | | | — | | | | (6,809 | ) |
| Shares issued on grants of restricted stock | | | 21,000 | | | | — | | | | — | | | | 52 | | | | — | | | | — | | | | — | | | | — | | | | — | | | | 52 | |
| Stock compensation expense | | | — | | | | — | | | | — | | | | 376 | | | | — | | | | — | | | | — | | | | — | | | | — | | | | 376 | |
| Net loss | | | — | | | | — | | | | — | | | | — | | | | (62,189 | ) | | | — | | | | — | | | | — | | | | — | | | | (62,189 | ) |
| Other comprehensive income (loss) | | | — | | | | — | | | | — | | | | — | | | | — | | | | 28,316 | | | | (3,128 | ) | | | 379 | | | | 25,567 | | | | 25,567 | |
| | | | | | | | | | | | | | | | | | | | | | | | | | | | | | | | | | | | | | | | | |
| Balance at December 31, 2009 | | | 36,443,487 | | | € | 27,576 | | | € | 175,268 | | | € | (6,082 | ) | | € | (97,235 | ) | | € | 27,539 | | | € | (3,978 | ) | | € | 134 | | | € | 23,695 | | | € | 123,222 | |
| Shares issued on exercise of stock options | | | — | | | | — | | | | — | | | | — | | | | — | | | | — | | | | — | | | | — | | | | — | | | | — | |
| Shares issued on grants of restricted stock | | | 56,000 | | | | — | | | | — | | | | 153 | | | | — | | | | — | | | | — | | | | — | | | | — | | | | 153 | |
| Shares issued on conversion of convertible note | | | 6,500,171 | | | | 4,961 | | | | 11,406 | | | | — | | | | — | | | | — | | | | — | | | | — | | | | — | | | | 16,367 | |
| Stock compensation expense | | | — | | | | — | | | | — | | | | 2,030 | | | | — | | | | — | | | | — | | | | — | | | | — | | | | 2,030 | |
| Net income | | | — | | | | — | | | | — | | | | — | | | | 86,279 | | | | — | | | | — | | | | — | | | | — | | | | 86,279 | |
| Other comprehensive income (loss) | | | — | | | | — | | | | — | | | | — | | | | — | | | | 11,333 | | | | (3,314 | ) | | | (2 | ) | | | 8,017 | | | | 8,017 | |
| | | | | | | | | | | | | | | | | | | | | | | | | | | | | | | | | | | | | | | | | |
| Balance at December 31, 2010 | | | 42,999,658 | | | € | 32,537 | | | € | 186,674 | | | € | (3,899 | ) | | € | (10,956 | ) | | € | 38,872 | | | € | (7,292 | ) | | € | 132 | | | € | 31,712 | | | € | 236,068 | |
| | | | | | | | | | | | | | | | | | | | | | | | | | | | | | | | | | | | | | | | | |
U.S. dollars, except per share data) | | | | | | | | | | | | |
| | | For the Year Ended December 31, | |
| | | 2013 | | | 2012 | | | 2011 | |
Revenues | | | | | | | | | | | | |
Pulp | | $ | 996,187 | | | $ | 979,770 | | | $ | 1,157,206 | |
Energy and chemicals | | | 92,198 | | | | 92,966 | | | | 94,758 | |
| | | | | | | | | | | | |
| | | 1,088,385 | | | | 1,072,736 | | | | 1,251,964 | |
Costs and expenses | | | | | | | | | | | | |
Operating costs | | | 920,832 | | | | 886,144 | | | | 965,723 | |
Operating depreciation and amortization | | | 78,309 | | | | 74,302 | | | | 77,611 | |
| | | | | | | | | | | | |
| | | 89,244 | | | | 112,290 | | | | 208,630 | |
Selling, general and administrative expenses | | | 51,169 | | | | 49,268 | | | | 53,965 | |
Restructuring expenses (Note 13) | | | 6,415 | | | | — | | | | — | |
| | | | | | | | | | | | |
Operating income | | | 31,660 | | | | 63,022 | | | | 154,665 | |
| | | | | | | | | | | | |
Other income (expense) | | | | | | | | | | | | |
Interest expense | | | (69,156 | ) | | | (71,767 | ) | | | (82,114 | ) |
Gain (loss) on derivative instruments (Note 17) | | | 19,709 | | | | 4,812 | | | | (1,974 | ) |
Other income (expense) | | | 1,215 | | | | (179 | ) | | | 3,625 | |
| | | | | | | | | | | | |
Total other income (expense) | | | (48,232 | ) | | | (67,134 | ) | | | (80,463 | ) |
| | | | | | | | | | | | |
Income (loss) before income taxes | | | (16,572 | ) | | | (4,112 | ) | | | 74,202 | |
Income tax benefit (provision) (Note 9) | | | | | | | | | | | | |
Current | | | 2,286 | | | | (9,531 | ) | | | (2,341 | ) |
Deferred | | | (11,482 | ) | | | 152 | | | | 3,309 | |
| | | | | | | | | | | | |
Net income (loss) | | | (25,768 | ) | | | (13,491 | ) | | | 75,170 | |
Less: net income attributable to noncontrolling interest | | | (607 | ) | | | (2,179 | ) | | | (5,471 | ) |
| | | | | | | | | | | | |
Net income (loss) attributable to common shareholders | | $ | (26,375 | ) | | $ | (15,670 | ) | | $ | 69,699 | |
| | | | | | | | | | | | |
Net income (loss) per share attributable to common shareholders (Note 12) | | | | | | | | | | | | |
Basic | | $ | (0.47 | ) | | $ | (0.28 | ) | | $ | 1.39 | |
Diluted | | $ | (0.47 | ) | | $ | (0.28 | ) | | $ | 1.24 | |
The accompanying notes are an integral part of these consolidated financial statements.
77
MERCER INTERNATIONAL INC.
CONSOLIDATED STATEMENTS OF CASH FLOWS
COMPREHENSIVE INCOME (LOSS)
(In thousands of Euros)
| | | | | | | | | | | | | |
| | | For the Years Ended December 31, | |
| | | 2010 | | | 2009 | | | 2008 | |
| |
| Cash flows from (used in) operating activities | | | | | | | | | | | | |
| Net income (loss) attributable to common shareholders | | € | 86,279 | | | € | (62,189 | ) | | € | (72,465 | ) |
| Adjustments to reconcile net income (loss) attributable to common shareholders to cash flows from operating activities | | | | | | | | | | | | |
| Loss (gain) on derivative instruments | | | (1,899 | ) | | | 5,760 | | | | 25,228 | |
| Foreign exchange (gain) loss on debt | | | 6,126 | | | | (2,692 | ) | | | 4,234 | |
| Loss (gain) on extinguishment of debt | | | 7,494 | | | | (4,447 | ) | | | — | |
| Depreciation and amortization | | | 56,231 | | | | 54,170 | | | | 55,762 | |
| Accretion expense (income) | | | 2,492 | | | | 181 | | | | — | |
| Noncontrolling interest | | | 8,469 | | | | (9,936 | ) | | | (13,075 | ) |
| Deferred income taxes | | | (9,760 | ) | | | (6,003 | ) | | | 1,976 | |
| Stock compensation expense | | | 2,394 | | | | 455 | | | | 264 | |
| Pension and other post-retirement expense, net of funding | | | 418 | | | | 282 | | | | (758 | ) |
| Inventory provisions | | | — | | | | — | | | | 11,272 | |
| Other | | | 5,190 | | | | 2,482 | | | | 3,025 | |
| Changes in current assets and liabilities | | | | | | | | | | | | |
| Receivables | | | (40,038 | ) | | | 31,907 | | | | (14,811 | ) |
| Inventories | | | (24,462 | ) | | | 32,158 | | | | (13,331 | ) |
| Accounts payable and accrued expenses | | | (3,089 | ) | | | (2,950 | ) | | | (1,091 | ) |
| Other | | | (4,566 | ) | | | (1,859 | ) | | | 1,904 | |
| | | | | | | | | | | | | |
| Net cash from (used in) operating activities | | | 91,279 | | | | 37,319 | | | | (11,866 | ) |
| Cash flows from (used in) investing activities | | | | | | | | | | | | |
| Purchase of property, plant and equipment | | | (38,300 | ) | | | (28,828 | ) | | | (25,704 | ) |
| Proceeds on sale of property, plant and equipment | | | 1,138 | | | | 436 | | | | 2,000 | |
| Cash, restricted | | | — | | | | 13,000 | | | | 20,000 | |
| Note receivable | | | 1,113 | | | | 152 | | | | 5,708 | |
| | | | | | | | | | | | | |
| Net cash from (used in) investing activities | | | (36,049 | ) | | | (15,240 | ) | | | 2,004 | |
| Cash flows from (used in) financing activities | | | | | | | | | | | | |
| Repayment of notes payable and debt | | | (234,598 | ) | | | (26,499 | ) | | | (34,023 | ) |
| Repayment of capital lease obligations | | | (2,920 | ) | | | (3,178 | ) | | | (3,312 | ) |
| Proceeds from borrowings of notes payable and debt | | | 222,193 | | | | 13,511 | | | | — | |
| Proceeds from (repayment of) credit facilities, net | | | (2,660 | ) | | | (4,272 | ) | | | 5,837 | |
| Proceeds from government grants | | | 17,952 | | | | 9,058 | | | | 266 | |
| Payment of deferred note issuance costs | | | (6,095 | ) | | | (1,969 | ) | | | — | |
| | | | | | | | | | | | | |
| Net cash from (used in) financing activities | | | (6,128 | ) | | | (13,349 | ) | | | (31,232 | ) |
| Effect of exchange rate changes on cash and cash equivalents | | | (1,371 | ) | | | 109 | | | | (1,302 | ) |
| | | | | | | | | | | | | |
| Net increase (decrease) in cash and cash equivalents | | | 47,731 | | | | 8,839 | | | | (42,396 | ) |
| Cash and cash equivalents, beginning of period | | | 51,291 | | | | 42,452 | | | | 84,848 | |
| | | | | | | | | | | | | |
| Cash and cash equivalents, end of period | | € | 99,022 | | | € | 51,291 | | | € | 42,452 | |
| | | | | | | | | | | | | |
| Supplemental disclosure of cash flow information | | | | | | | | | | | | |
| Cash paid (received) during the period for | | | | | | | | | | | | |
| Interest | | € | 65,167 | | | € | 62,022 | | | € | 60,652 | |
| Income taxes | | | 461 | | | | 377 | | | | 1,100 | |
| Supplemental schedule of non-cash investing and financing activities | | | | | | | | | | | | |
| Acquisition of production and other equipment under capital lease obligations | | € | 2,087 | | | € | 625 | | | € | 5,318 | |
| Decrease (increase) in accounts payable relating to investing activities | | | (8,562 | ) | | | (1,471 | ) | | | 2,627 | |
U.S. dollars) | | | | | | | | | | | | |
| | | For the Year Ended December 31, | |
| | | 2013 | | | 2012 | | | 2011 | |
Net income (loss) | | $ | (25,768 | ) | | $ | (13,491 | ) | | $ | 75,170 | |
Other comprehensive income (loss), net of taxes | | | | | | | | | | | | |
Foreign currency translation adjustment (net of tax effect of ($1,002), ($454), $951) | | | (1,733 | ) | | | 11,635 | | | | (19,394 | ) |
Change in unrecognized losses and prior service costs related to defined benefit plans (net of tax effect of $nil in all years) | | | 4,636 | | | | (808 | ) | | | (11,203 | ) |
Change in unrealized gains (losses) on marketable securities (net of tax effect of $nil in all years) | | | (10 | ) | | | (1 | ) | | | (17 | ) |
| | | | | | | | | | | | |
Other comprehensive income (loss), net of taxes | | | 2,893 | | | | 10,826 | | | | (30,614 | ) |
| | | | | | | | | | | | |
Total comprehensive income (loss) | | | (22,875 | ) | | | (2,665 | ) | | | 44,556 | |
Comprehensive income attributable to noncontrolling interest | | | (607 | ) | | | (2,179 | ) | | | (5,471 | ) |
| | | | | | | | | | | | |
Comprehensive income (loss) attributable to common shareholders | | $ | (23,482 | ) | | $ | (4,844 | ) | | $ | 39,085 | |
| | | | | | | | | | | | |
The accompanying notes are an integral part of these consolidated financial statements.
78
MERCER INTERNATIONAL INC.
CONSOLIDATED STATEMENTS OF CHANGES IN SHAREHOLDERS
’ EQUITY(In thousands of U.S. dollars)
| | | | | | | | | | | | | | | | | | | | | | | | | | | | | | | | | | | | |
| | | Common shares | | | | | | | | | | | | | | | | | | | |
| | | Number of
Shares
(thousands
of shares) | | | Par Value | | | Amount
Paid in
Excess
of Par
Value | | | Paid-in
Capital | | | Retained
Earnings
(Deficit) | | | Accumulated
Other
Comprehensive
Income (Loss) | | | Shareholders’
Equity | | | Noncontrolling
Interest
(Deficit) | | | Total Equity | |
Balance at December 31, 2010 | | | 42,999 | | | $ | 42,785 | | | $ | 242,840 | | | $ | (4,550 | ) | | $ | (14,466 | ) | | $ | 48,365 | | | $ | 314,974 | | | $ | (28,992 | ) | | $ | 285,982 | |
Shares issued on grants of restricted shares | | | 238 | | | | 98 | | | | 386 | | | | (484 | ) | | | — | | | | — | | | | — | | | | — | | | | — | |
Shares issued on grants of performance shares | | | 358 | | | | 358 | | | | 5,315 | | | | (5,673 | ) | | | — | | | | — | | | | — | | | | — | | | | — | |
Shares issued on conversion of convertible notes | | | 13,447 | | | | 13,447 | | | | 29,842 | | | | — | | | | — | | | | — | | | | 43,289 | | | | — | | | | 43,289 | |
Treasury shares retired | | | (1,263 | ) | | | (1,263 | ) | | | (6,987 | ) | | | — | | | | (2,373 | ) | | | — | | | | (10,623 | ) | | | — | | | | (10,623 | ) |
Stock compensation expense | | | — | | | | — | | | | — | | | | 4,607 | | | | — | | | | — | | | | 4,607 | | | | — | | | | 4,607 | |
Net income (loss) | | | — | | | | — | | | | — | | | | — | | | | 69,699 | | | | — | | | | 69,699 | | | | 5,471 | | | | 75,170 | |
Foreign currency translation adjustments | | | — | | | | — | | | | — | | | | — | | | | — | | | | (19,394 | ) | | | (19,394 | ) | | | — | | | | (19,394 | ) |
Change in unrecognized losses and prior service costs related to defined benefit plans | | | — | | | | — | | | | — | | | | — | | | | — | | | | (11,203 | ) | | | (11,203 | ) | | | — | | | | (11,203 | ) |
Change in unrealized losses on marketable securities | | | — | | | | — | | | | — | | | | — | | | | — | | | | (17 | ) | | | (17 | ) | | | — | | | | (17 | ) |
| | | | | | | | | | | | | | | | | | | | | | | | | | | | | | | | | | | | |
Balance at December 31, 2011 | | | 55,779 | | | | 55,425 | | | | 271,396 | | | | (6,100 | ) | | | 52,860 | | | | 17,751 | | | | 391,332 | | | | (23,521 | ) | | | 367,811 | |
Shares issued on grants of restricted shares | | | 37 | | | | 78 | | | | 919 | | | | (997 | ) | | | — | | | | — | | | | — | | | | — | | | | — | |
Stock compensation expense | | | — | | | | — | | | | — | | | | 2,616 | | | | — | | | | — | | | | 2,616 | | | | — | | | | 2,616 | |
Net income (loss) | | | — | | | | — | | | | — | | | | — | | | | (15,670 | ) | | | — | | | | (15,670 | ) | | | 2,179 | | | | (13,491 | ) |
Foreign currency translation adjustments | | | — | | | | — | | | | — | | | | — | | | | — | | | | 11,635 | | | | 11,635 | | | | — | | | | 11,635 | |
Change in unrecognized losses and prior service costs related to defined benefit plans | | | — | | | | — | | | | — | | | | — | | | | — | | | | (808 | ) | | | (808 | ) | | | — | | | | (808 | ) |
Change in unrealized losses on marketable securities | | | — | | | | — | | | | — | | | | — | | | | — | | | | (1 | ) | | | (1 | ) | | | — | | | | (1 | ) |
| | | | | | | | | | | | | | | | | | | | | | | | | | | | | | | | | | | | |
Balance at December 31, 2012 | | | 55,816 | | | | 55,503 | | | | 272,315 | | | | (4,481 | ) | | | 37,190 | | | | 28,577 | | | | 389,104 | | | | (21,342 | ) | | | 367,762 | |
Shares issued on grants of restricted shares | | | 38 | | | | 77 | | | | 654 | | | | (731 | ) | | | — | | | | — | | | | — | | | | — | | | | — | |
Stock compensation expense | | | — | | | | — | | | | — | | | | 3,574 | | | | — | | | | — | | | | 3,574 | | | | — | | | | 3,574 | |
Net income (loss) | | | — | | | | — | | | | — | | | | — | | | | (26,375 | ) | | | — | | | | (26,375 | ) | | | 607 | | | | (25,768 | ) |
Foreign currency translation adjustments | | | — | | | | — | | | | — | | | | — | | | | — | | | | (1,733 | ) | | | (1,733 | ) | | | — | | | | (1,733 | ) |
Capital contribution to acquire additional 8.1% of Stendal mill | | | — | | | | — | | | | — | | | | (10,118 | ) | | | — | | | | — | | | | (10,118 | ) | | | 9,974 | | | | (144 | ) |
Change in unrecognized losses and prior service costs related to defined benefit plans | | | — | | | | — | | | | — | | | | — | | | | — | | | | 4,636 | | | | 4,636 | | | | — | | | | 4,636 | |
Change in unrealized losses on marketable securities | | | — | | | | — | | | | — | | | | — | | | | — | | | | (10 | ) | | | (10 | ) | | | — | | | | (10 | ) |
| | | | | | | | | | | | | | | | | | | | | | | | | | | | | | | | | | | | |
Balance at December 31, 2013 | | | 55,854 | | | $ | 55,580 | | | $ | 272,969 | | | $ | (11,756 | ) | | $ | 10,815 | | | $ | 31,470 | | | $ | 359,078 | | | $ | (10,761 | ) | | $ | 348,317 | |
| | | | | | | | | | | | | | | | | | | | | | | | | | | | | | | | | | | | |
The accompanying notes are an integral part of these consolidated financial statements.
MERCER INTERNATIONAL INC.
CONSOLIDATED STATEMENTS OF CASH FLOWS
(In thousands of U.S. dollars)
| | | | | | | | | | | | |
| | | For the Year Ended December 31, | |
| | | 2013 | | | 2012 | | | 2011 | |
Cash flows from (used in) operating activities | | | | | | | | | | | | |
Net income (loss) | | $ | (25,768 | ) | | $ | (13,491 | ) | | $ | 75,170 | |
Adjustments to reconcile net income (loss) to cash flows from operating activities | | | | | | | | | | | | |
Unrealized loss (gain) on derivative instruments | | | (21,494 | ) | | | (3,186 | ) | | | 1,974 | |
Depreciation and amortization | | | 78,645 | | | | 74,657 | | | | 77,952 | |
Deferred income taxes | | | 11,482 | | | | (152 | ) | | | (3,309 | ) |
Stock compensation expense | | | 3,574 | | | | 2,616 | | | | 4,607 | |
Pension and other post-retirement expense, net of funding | | | 648 | | | | 365 | | | | (374 | ) |
Other | | | 3,169 | | | | 4,991 | | | | 1,116 | |
Changes in working capital | | | | | | | | | | | | |
Receivables | | | 13,993 | | | | 10,795 | | | | (2,233 | ) |
Inventories | | | (14,563 | ) | | | 1,726 | | | | (24,654 | ) |
Accounts payable and accrued expenses | | | (11,569 | ) | | | (17,992 | ) | | | 19,837 | |
Other | | | (1,792 | ) | | | (1,214 | ) | | | 4,490 | |
| | | | | | | | | | | | |
Net cash from (used in) operating activities | | | 36,325 | | | | 59,115 | | | | 154,576 | |
| | | | | | | | | | | | |
Cash flows from (used in) investing activities | | | | | | | | | | | | |
Purchase of property, plant and equipment | | | (45,707 | ) | | | (47,203 | ) | | | (52,626 | ) |
Proceeds on sale of property, plant and equipment | | | 739 | | | | 840 | | | | 1,132 | |
Purchase of marketable securities | | | — | | | | — | | | | (16,343 | ) |
Proceeds on maturity of marketable securities | | | — | | | | 15,753 | | | | — | |
Note receivable | | | — | | | | — | | | | 3,988 | |
| | | | | | | | | | | | |
Net cash from (used in) investing activities | | | (44,968 | ) | | | (30,610 | ) | | | (63,849 | ) |
| | | | | | | | | | | | |
Cash flows from (used in) financing activities | | | | | | | | | | | | |
Repayment of debt and purchase of notes | | | (56,416 | ) | | | (35,440 | ) | | | (67,702 | ) |
Proceeds from issuance of notes and borrowings of debt | | | 74,472 | | | | — | | | | — | |
Repayment of capital lease obligations | | | (2,593 | ) | | | (2,733 | ) | | | (4,095 | ) |
Proceeds from (repayment of) credit facilities, net | | | (5,640 | ) | | | 6,031 | | | | (20,491 | ) |
Payment of note issuance costs | | | (3,855 | ) | | | (2,570 | ) | | | — | |
Proceeds from government grants | | | 9,265 | | | | 5,045 | | | | 20,049 | |
Purchase of treasury shares | | | — | | | | — | | | | (10,623 | ) |
| | | | | | | | | | | | |
Net cash from (used in) financing activities | | | 15,233 | | | | (29,667 | ) | | | (82,862 | ) |
| | | | | | | | | | | | |
Effect of exchange rate changes on cash and cash equivalents | | | 3,699 | | | | 2,302 | | | | (4,166 | ) |
| | | | | | | | | | | | |
Net increase (decrease) in cash and cash equivalents | | | 10,289 | | | | 1,140 | | | | 3,699 | |
Cash and cash equivalents, beginning of year | | | 137,439 | | | | 136,299 | | | | 132,600 | |
| | | | | | | | | | | | |
Cash and cash equivalents, end of year | | $ | 147,728 | | | $ | 137,439 | | | $ | 136,299 | |
| | | | | | | | | | | | |
The accompanying notes are an integral part of these consolidated financial statements.
MERCER INTERNATIONAL INC.
CONSOLIDATED STATEMENTS OF CASH FLOWS (continued)
(In thousands of U.S. dollars)
| | | | | | | | | | | | |
| | | For the Year Ended December 31, | |
| | | 2013 | | | 2012 | | | 2011 | |
Supplemental disclosure of cash flow information | | | | | | | | | | | | |
Cash paid during the year for | | | | | | | | | | | | |
Interest | | $ | 65,747 | | | $ | 66,673 | | | $ | 80,347 | |
Income taxes | | $ | 7,307 | | | $ | 5,003 | | | $ | 4,450 | |
Supplemental schedule of non-cash investing and financing activities | | | | | | | | | | | | |
Acquisition of production and other equipment under capital lease obligations | | $ | 2,112 | | | $ | 2,648 | | | $ | 3,872 | |
Increase (decrease) in accounts payable and accrued purchases for property, plant and equipment | | $ | (5,712 | ) | | $ | 7,986 | | | $ | 451 | |
Increase (decrease) in receivables of government grants for long-term assets | | $ | 2,871 | | | $ | (3,291 | ) | | $ | (9,514 | ) |
The accompanying notes are an integral part of these consolidated financial statements.
MERCER INTERNATIONAL INC.
NOTES TO THE CONSOLIDATED FINANCIAL STATEMENTS
(In thousands of Euros,U.S. dollars, except per share data)
| |
Note 1. | The Company and Summary of Significant Accounting Policies |
Note 1. The Company and Summary of Significant Accounting Policies
Background
Mercer International Inc. (“Mercer Inc.” or the “Company”) is a Washington corporation and the Company’s shares of common stock are quoted and listed for trading on the NASDAQ Global Market and the Toronto Stock Exchange, respectively. The Company converted its corporate form from a Washington business trust to a corporation effective March 1, 2006 without effecting any changes to its business, management, accounting practices, assets or liabilities.
Exchange.Mercer Inc. operates three pulp manufacturing facilities, one in Canada and two in Germany, and is one of the largest producers of market northern bleached softwood kraft or “NBSK”,(“NBSK”) pulp in the world.
In these consolidated financial statements,Consolidated Financial Statements, unless otherwise indicated, all amounts are expressed in EurosUnited States dollars (“€$” or “U.S. dollar”). The term “U.S. dollars”symbol “€” refers to the Euro and the symbol “$” refer to United States dollars. The symbol “C$” refers to Canadian dollars.
These consolidated financial statementsConsolidated Financial Statements contained herein include the accounts of the Company and its wholly-owned and majority-owned subsidiaries (collectively, the “Company”). All significant inter-company balances and transactionsThe Company’s consolidated financial statements have been eliminated upon consolidation.
Use of Estimates
Preparation of financial statements and related disclosuresprepared in
conformityaccordance with accounting principles generally accepted in the United States of America (“GAAP”)
. All significant inter-company balances and transactions have been eliminated upon consolidation.Effective October 1, 2013, the Company changed its reporting currency from the Euro to the U.S. dollar, to enhance communication and understanding with its shareholders, analysts and other stakeholders and improve comparability of the Company’s financial information with its competitors and peer group companies. With the change in reporting currency, all comparative financial information has been restated from Euros to U.S. dollars to reflect the Company’s consolidated financial statements as if it had been historically reported in U.S. dollars, consistent with the Company’s currency translation policy described below inForeign Operations and Currency Translation.
Use of Estimates
Preparation of financial statements and related disclosures in conformity with GAAP requires management to make estimates and assumptions that affect the amounts reported in the financial statements and accompanying notes. Significant management judgementjudgment is required in determining the accounting for, among other things, the accounting for doubtful accounts and reserves, depreciation and amortization, future cash flows associated with impairment testing for long-lived assets, derivative financial instruments, environmental conservation and legal liabilities, asset retirement obligations, pensions and post-retirement benefit obligations, income taxes, contingencies and inventory obsolescence and provisions. Actual results could differ materially from these estimates, and changes in these estimates are recorded when known.
Cash and Cash Equivalents
Cash and cash equivalents include cash held in bank accounts and highly liquid money market investments with original maturities of three months or less.
TradingInvestments in debt securities consisting of marketable securities, are classified as current investments and are reported at fair values with realized gains or losses and unrealized holding gains or losses included in the results of operations.
Equityequity investments in publicly traded companies in which the Company has less than 20% of the voting interest and in which it does not exercise significant influence are classified asavailable-for-sale securities. These securities are reported in long-term assets at fair values; based upon quoted market prices, with the unrealized gains or losses included in accumulated other comprehensive income as a separate component of shareholders’ equity, until realized. If a loss in value inavailable-for-sale securities is considered to be other than temporary, the loss is recognized in the determination of net income. The cost of all securities sold is based on the specific identification method to determine realized gains or losses.
79
MERCER INTERNATIONAL INC.
NOTES TO THE CONSOLIDATED FINANCIAL STATEMENTS
(In thousands of Euros,U.S. dollars, except per share data)
| |
Note 1. | The Company and Summary of Significant Accounting Policies — (Continued) |
Note 1. The Company and Summary of Significant Accounting Policies (continued)
Inventories
Inventories of pulp, logsraw materials, finished goods and wood chipswork in progress are valued at the lower of cost, using the weighted-average cost method, or net realizable value. Other materials and suppliesspare parts are valued at the lower of cost and replacement cost. Cost includes labor, materials and production overhead and is determined by using the weighted average cost method. InventoriesRaw materials inventories include both roundwood (logs) and wood chips. These inventories are located both at the pulp mills and at various offsite locations. In accordance with industry practice, physical inventory counts utilize standardized techniques to estimate quantities of roundwood and wood chip inventory volumes. These techniques historically have provided reasonable estimates of such inventories.
Property, Plant and Equipment
Property, plant and equipment is stated at cost less accumulated depreciation. Depreciation of buildings and production equipment is based on the estimated useful lives of the assets and is computed using the straight-line method. Buildings are depreciated over 10 to 50 years and production equipment and other equipment primarily over 25 years.
The Company reviews its long-lived assets for impairment whenever events or changes in circumstances indicate that the carrying value of such assets may not be recoverable. To determine recoverability, the Company compares the carrying value of the assets to the estimated future undiscounted cash flows. Measurement of an impairment loss for long-lived assets held for use is based on the fair value of the asset.
The costs of major rebuilds, replacements and those expenditures that substantially increase the useful lives of existing property, plant, and equipment are capitalized, as well as interest costs associated with major capital projects until ready for their intended use. The cost of repairs and maintenance as well as planned shutdown maintenance performed on manufacturing facilities, composed of labor, materials and other incremental costs, is charged to operations as incurred.
Leases which transfer to the Company substantially all the risks and benefits incidental to ownership of the leased item are capitalized at the present value of the minimum lease payments. Capital leases are depreciated over the lease term. Operating lease payments are recognized as an expense in the Consolidated Statement of Operations on a straight-line basis over the lease term.
The Company provides for asset retirement obligations when there areis a legislated or contractual basesbasis for those obligations. Obligations are recorded as a liability at fair value, with a corresponding increase to property, plant, and equipment, and are amortized over the remaining useful life of the related assets. The liability is accreted using a risk freerisk-free interest rate.
The Company’s obligations for the proper removal and disposal of asbestos products from the Company’s mills meets the definition of a conditional asset retirement obligation as found in the Financial Accounting Standards Board (“FASB”) issued guidance as outlined in Accounting Standards Codification Topic 410, (“ASC 410”),Asset Retirement and Environment. Generally asbestos is found on steam and condensate piping systems as well as certain cladding on buildings and in building insulation throughout its older facilities. As a result of the longevity of the Company’s mills, due in part to the maintenance procedures and the fact that the Company does not have plans for major changes that require the removal of asbestos, the timing of the asbestos removal is indeterminate. As a result, the Company is currently unable to estimate the fair value of its asbestos removal and disposal obligation.
Government Investment Grants
The Company records investment grants from federal and state governments when theythe conditions of their receipt are complied with and there is reasonable assurance that the grants will be received. Grants related to assets are government grants whose primary condition is that the company qualifying for them should purchase, construct or otherwise acquire long-term assets. Secondary conditions may also be attached, including
80
MERCER INTERNATIONAL INC.
NOTES TO THE CONSOLIDATED FINANCIAL STATEMENTS
(In thousands of Euros, except per share data)
| |
Note 1. | The Company and Summary of Significant Accounting Policies — (Continued) |
restricting the type or location of the assets
and/or other conditions that must be met. Grants related to assets
when received, are deducted from the asset
costs. costs in the Consolidated Balance Sheet.Grants related to income are government grants which are either unconditional, related to reduced environmental emissions or related to the Company’s normal business operations, and are reported as a reduction of related expenses in the Consolidated Statement of Operations when received.
MERCER INTERNATIONAL INC.
NOTES TO THE CONSOLIDATED FINANCIAL STATEMENTS
(In thousands of U.S. dollars, except per share data)
Note 1. The Company and Summary of Significant Accounting Policies (continued)
The Company is required to pay certain fees based on water consumption levels at its German mills. Accrued fees can be reduced upon the mills’ demonstration of reduced wastewater emissions. The fees are expensed as incurred and the fee reduction is recognized once the Company has reasonable assurance that the German regulators will accept the reduced level of wastewater emissions. There may be a significant period of time between recognition of the wastewater expense and recognition of the wastewater fee reduction.
To the extent that government grants have been received and not applied, these grants are recorded in cash with a corresponding adjustment to the “Accountsaccounts payable and accrued expenses”other in the Consolidated Balance Sheet due to the short-term nature of the related payments.
Deferred Note Issuance Costs
Note issuance costs are deferred and amortized as a component of interest expense in the Consolidated Statement of Operations over the term of the related debt instrument.
The Company maintains a defined benefit pension plan for its salaried employees at its Celgar mill which is funded and non-contributory. The cost of the benefits earned by the salaried employees is determined using the projected benefit method pro ratedprorated on services. The pension expense reflects the current service cost, the interest on the unfunded liability and the amortization over the estimated average remaining service life of the employees of (i) the unfunded liabilityprior service costs, and (ii) experience gainsthe net actuarial gain or losses.
In accordance withloss that exceeds 10% of the guidancegreater of the accrued benefit obligation and the fair value of plan assets as outlined inof theCompensation-Retirement BenefitsTopic ASC 715 (“ASC715-30” and “ASC715-60”), beginning of the period. The Company recognizes the net funded status of the plan.
Effective December 31, 2008, the defined benefit pension plan was closed to new members and the defined benefit service accrual ceased. Members began to accrue benefits under a new defined contribution plan effective January 1, 2009. The contributions to the new plan will be charged against earnings, in the Consolidated Statement of Operations.
In addition, hourly-paid employees at the Celgar mill are covered by a multi-employer defined contributionmultiemployer pension plan for which contributions are charged against earnings in the Consolidated Statement of Operations.
Foreign Operations and Currency Translation
The Company translates foreign assets and liabilities of its subsidiaries, other than those denominated in Euros,U.S. dollars, at the rate of exchange at the balance sheet date. Revenues and expenses are translated at the average rate of exchange throughout the year. Transaction gains and losses related to net assets primarily located in Canada and Germany are recognized as unrealized foreign currency translation adjustments within accumulated other comprehensive income (loss) in shareholders’ equity, until all of the investment in the subsidiaries is sold or liquidated. The translation adjustments do not recognize the effect of income tax when the Company expects earnings of the foreign subsidiary to reinvestbe indefinitely reinvested. The income tax effect on currency translation adjustments related to foreign subsidiaries that are not considered indefinitely reinvested is recorded as a component of deferred taxes in the amounts indefinitely in operations.Consolidated Balance Sheet with an offset to other comprehensive income. Gains and losses resulting from foreign currency transactions (transactions denominated in a currency other than the entity’s functional currency) are included in “Costscosts and expenses”expenses in the Consolidated Statement of Operations.
Where inter-company loans are of a long-term investment nature, the after-tax effect of exchange rate changes are included as an unrealized foreign currency translation adjustment within accumulated other comprehensive income in shareholders’ equity.MERCER INTERNATIONAL INC.
NOTES TO THE CONSOLIDATED FINANCIAL STATEMENTS
(In thousands of U.S. dollars, except per share data)
Note 1. The Company and Summary of Significant Accounting Policies (continued)
Revenue and Related Cost Recognition
The Company recognizes revenue from product, sales, transportation, chemical and other sales when persuasive evidence of an arrangement exists, the sales price is fixed or determinable, title of ownership and risk of loss have passed to the customer and collectability is reasonably assured. Sales are reported net of discounts and allowances.
81
MERCER INTERNATIONAL INC.
NOTES TO THE CONSOLIDATED FINANCIAL STATEMENTS
(In thousands of Euros, except per share data)
| |
Note 1. | The Company and Summary of Significant Accounting Policies — (Continued) |
Amounts charged to customers for shipping and handling are recognized as revenue.revenue in the Consolidated Statement of Operations. Shipping and handling costs incurred by the Company are included in “Operating costs”.
During 2008,operating costs in the
Consolidated Statement of Operations.The Company increased its focus on the production and sale of surplus electricity. Accordingly, management no longer considered this activity to be a by-product and, commencing in 2008, the Company began reportingreports revenue from sales of surplus electricity and the sale of chemicals as “Energy revenue”energy and chemical revenues in the Consolidated Statement of Operations. Energy revenues are recognized as the electricity is consumed by customers are invoiced at agreed upon rates and when collection is reasonably assured. These revenues include an estimate of the value of electricity consumed bytransferred to customers in the year but billed subsequent to year-end. Customer bills are based on agreed upon rates and meter readings that indicate electricity consumption. This activity does not meet the tests to be considered an operating segment, as defined in the
Segment Reporting Topic ASC 280 (“ASC280-10”).
Environmental Conservation
Liabilities for environmental conservation are recorded when it is probable that obligations have been incurred and their fair value can be reasonably estimated. Any potential recoveries of such liabilities are recorded when there is an agreement with the reimbursing entity and recovery is assessed as likely to occur.
Stock-Based Compensation
Under theCompensation-Stock CompensationTopic ASC 718 (“ASC 718”), theThe Company recognizes stock-based compensation expense over an award’s vesting period based on the award’s fair value. Stock based compensation expense has been recordedvalue in “Selling,selling, general, and administrative expenses” inexpenses within the Consolidated Statement of Operations.
The fair value of performance stock awardsshare units is re-measured at each balance sheet date.date by multiplying the market price of a share of Mercer Inc. common shares by the expected number of common shares to be awarded. The cumulative effect of the change in fair value is recognized in the period of the change as an adjustment to compensation cost. The Company estimates forfeitures of performance stock awardsshare units based on management’s expectations and recognizes compensation cost only for those awards expected to vest. Estimated forfeitures are adjusted to actual experience as needed.
at each balance sheet date.The fair value of restricted stockshare awards areis determined by multiplying the market price of a share of Mercer Inc. common shares on the grant date by the number of units.
Income Taxes
Income taxes are reported under the guidance of theunits granted.Income TaxesTopic ASC 740 (“ASC740-10”) and accordingly, deferred
Deferred income taxes are recognized using the asset and liability method, whereby deferred tax assets and liabilities are recognized for the future tax consequences attributable to differences between the financial statement carrying amounts of existing assets and liabilities and their respective tax bases, and operating loss and tax credit carryforwards. Valuation allowances are provided if, after considering both positive and negative available evidence, it is more likely than not that some or all of the net deferred tax assets will not be realized.
Deferred income taxes are determined separately for each tax-paying component of the Company. For each tax-paying component, all current deferred tax liabilities and assets shall beare offset and presented as a single net amount and all noncurrent deferred tax liabilities and assets shall beare offset and presented as a single net amount.
MERCER INTERNATIONAL INC.
NOTES TO THE CONSOLIDATED FINANCIAL STATEMENTS
(In thousands of U.S. dollars, except per share data)
Note 1. The Company and Summary of Significant Accounting Policies (continued)
Derivative Financial Instruments
The Company occasionally enters into derivative financial instruments, including foreign currency forward contracts, electricity forward contracts, and interest rate swaps, and pulp price swaps to limit exposures to changes in foreign currency
82
MERCER INTERNATIONAL INC.
NOTES TO THE CONSOLIDATED FINANCIAL STATEMENTS
(In thousands of Euros, except per share data)
| |
Note 1. | The Company and Summary of Significant Accounting Policies — (Continued) |
exchange rates, energy prices, interest rates, and interest rates.pulp prices. These derivative instruments are not designated as hedging instruments under the guidance of theDerivatives and HedgingTopic ASC 815 (“ASC815-25”), and accordingly, anyinstruments. The change in themarked-to-marketfair value of electricity derivative contracts is included in operating costs in the Consolidated Statement of Operations and any changes in the fair value of foreign currency, interest rate, and pulp price derivative contracts are recognized as ain gain or loss(loss) on derivative financial instruments in the Consolidated Statement of Operations. Periodically, the Company enters into derivative contracts to supply materials for its own use and as such are exempt from mark to marketmark-to-market accounting.
Net Income (Loss) Per Share Attributable to Common Shareholders
Basic net income (loss) per share attributable to common shareholders (“EPS”) is computed by dividing net income (loss) available to common shareholders by the weighted average number of common shares outstanding in the period. Diluted income (loss) per share attributable to common shareholders is calculated to give effect to all potentially dilutive common shares outstanding (computed under basic EPS) by applying the “Treasury Stock” and “If Converted”“If-Converted” methods. Outstanding stock options, restricted stock, awards such as restricted stock awards withshares, performance conditions (known as “performance stock”),shares, performance share units, and convertible notes represent the only potentially dilutive effects on the Company’s weighted average shares. SeeNote 12-Net Income (Loss) Per Share.
ReclassificationsNew Accounting Standards
Certain prior year amountsIn March 2013, the FASB issued ASU 2013-05, an update to Foreign Currency Matters, which indicates that a cumulative translation adjustment is attached to the parent’s investment in a foreign entity and should be released in a manner consistent with the derecognition guidance on investments in entities. Thus, the entire amount of the cumulative translation adjustment associated with the foreign entity would be released when there has been (i) a sale of a subsidiary or group of net assets within a foreign entity and the sale represents the substantially complete liquidation of the investment in the foreign entity; (ii) a loss of a controlling financial interest in an investment in a foreign entity; or (iii) a step acquisition for a foreign entity. The update does not change the requirement to release a pro-rata portion of the cumulative translation adjustment of the foreign entity into earnings for a partial sale of an equity method investment in a foreign entity. The amendments are effective for interim and annual periods beginning after December 15, 2013 and will not have an impact on the Company’s consolidated financial statements have been reclassified to conform tounless one or more of the current year presentation.
New Accounting Standards
derecognition events stated above occur after the effective date.In April 2010,July 2013, the FASB issued ASU 2013-11, which provides guidance within Accounting Standards Updateon the financial statement presentation of an unrecognized tax benefit when a net operating loss (“ASU”NOL”)2010-13,Compensation — Stock Compensation (ASC 718): Effect of Denominating the Exercise Price carryforward, a similar tax loss, or a tax credit carryforward exists. ASU 2013-11 requires entities to present an unrecognized tax benefit as a reduction of a Share-Based Payment Award indeferred tax asset for a NOL or tax credit carryforward whenever the CurrencyNOL or tax credit carryforward would be available to reduce the additional taxable income or tax due if the tax position is disallowed. This accounting standard update requires entities to assess whether to net the unrecognized tax benefit with a deferred tax asset as of the Market in Which the Underlying Equity Security Trades.reporting date. The amendments in this update are effective for fiscal years,interim and interimannual periods within those fiscal years, beginning on or after December 15, 2010.2013. The amendments in this update should be applied by recording a cumulative-effect adjustment to the opening balance of retained earnings. The cumulative-effect adjustment should be calculated for all awards outstanding as of the beginning of the fiscal year in which the amendments are initially applied, as if the amendments had been applied consistently since the inception of the award. The cumulative-effect adjustment should be presented separately. The adoption of this guidance isCompany has determined these changes will not expected to have a material impact on the Company’sconsolidated financial statements.
Recently Implemented Accounting Standards
This section highlights recently implemented accounting standards that had a significant impact on the Company’s financial statements.
In January 2010, the Company adopted ASU2010-06, which amends Accounting Standards Codification 820 (“ASC 820”),Fair Value Measurements and Disclosures.This new accounting guidance requires expanded fair value measurement disclosures in quarterly and annual financial statements. The new guidance clarifies existing disclosure requirements for the Level 2 and 3 fair value measurement. Additionally, the new guidance also requires details of significant transfers of assets between Level 1 and Level 2 fair value measurement categories, including the reasons for such transfers, as well as gross presentation of activity within the Level 3 fair value measurement category. This guidance is effective for the Company on January 1, 2010, except for the gross presentation of Level 3 activity, which is effective January 1, 2011. The adoption of this new accounting guidance did not impact the results of operations or the financial position of the Company.
83
MERCER INTERNATIONAL INC.
NOTES TO THE CONSOLIDATED FINANCIAL STATEMENTS
(In thousands of Euros,U.S. dollars, except per share data)
| |
Note 2. | Cash and Cash Equivalents |
The Company maintains cash balances in foreign financial institutions in excess of insured limits.
| | | | | | | | | |
| | | December 31, |
| | | 2010 | | 2009 |
| |
| Cash and cash equivalents | | € | 99,022 | | | € | 51,291 | |
| | | | | | | | | |
Included in cash and cash equivalents is approximately €nil (2009 — €1,300) that was provided as part of the Canadian Federal Government’s Pulp and Paper Green Transformation Program (“GTP”). Monies provided under the GTP are expected to be spent on various projects at the Celgar mill shortly after receipt.
Cash Equivalents | | | | | | | | |
| | | December 31, | |
| | | 2013 | | | 2012 | |
Cash and cash equivalents | | $ | 147,728 | | | $ | 137,439 | |
| | | | | | | | |
Cash and cash equivalents includes cash allocated for debt service reserves and for a capital project as required under certain debt agreements (Note(see Note 7(a))(d) – Debt).
| | | | | | | | | |
| | | December 31, | |
| | | 2010 | | | 2009 | |
| |
| Sale of pulp (net of allowance of €1,005 and €952, respectively) | | € | 105,950 | | | € | 64,864 | |
| Value added tax | | | 3,669 | | | | 3,001 | |
| Other | | | 12,090 | | | | 3,278 | |
| | | | | | | | | |
| | | € | 121,709 | | | € | 71,143 | |
| | | | | | | | | |
Note 3. Receivables
| | | | | | | | |
| | | December 31, | |
| | | 2013 | | | 2012 | |
Sale of pulp, energy and chemicals, net of allowance of $178 (2012 – $148) | | $ | 124,579 | | | $ | 133,764 | |
Value added tax | | | 4,545 | | | | 5,656 | |
Other non-trade receivables | | | 6,769 | | | | 5,730 | |
| | | | | | | | |
| | $ | 135,893 | | | $ | 145,150 | |
| | | | | | | | |
The Company reviews the collectability of receivables on a periodic basis.at each reporting date. The Company maintains an allowance for doubtful accounts at an amount estimated to cover the potential losses on certain uninsured receivables. Any amounts that are determined to be uncollectible and uninsured are offset against the allowance. The allowance is based on the Company’s evaluation of numerous factors, including the payment history and financial position of the debtors. The Company does not generally require collateral for any of its receivables.
As at December 31, 2010, pursuant to an amended contribution agreement for approximately C$48.0 million finalized in November 2010 under the GTP,For certain customers the Company recorded approximately €7,700 (C$10.2 million) (2009 — €nil) within other receivables in relationreceives a letter of credit prior to the Green Energy Project.
Other than the above mentioned item, other receivables relates to non-trade receivables that are individually not material.
| | | | | | | | | |
| | | December 31, | |
| | | 2010 | | | 2009 | |
| |
| Raw materials | | € | 47,179 | | | € | 24,888 | |
| Finished goods | | | 27,127 | | | | 24,198 | |
| Work in process and other | | | 27,913 | | | | 23,543 | |
| | | | | | | | | |
| | | € | 102,219 | | | € | 72,629 | |
| | | | | | | | | |
As at December 31, 2010, the Company had not recorded any provisions against finished goods inventories (2009 — €nil), or against raw material inventories (2009 — €nil).
84
Note 4. Inventories | | | | | | | | |
| | | December 31, | |
| | | 2013 | | | 2012 | |
Raw materials | | $ | 66,356 | | | $ | 60,688 | |
Finished goods | | | 54,982 | | | | 50,326 | |
Spare parts and other | | | 49,570 | | | | 44,965 | |
| | | | | | | | |
| | $ | 170,908 | | | $ | 155,979 | |
| | | | | | | | |
MERCER INTERNATIONAL INC.
NOTES TO THE CONSOLIDATED FINANCIAL STATEMENTS
(In thousands of Euros,U.S. dollars, except per share data)
| |
Note 5. | Property, Plant and Equipment |
| | | | | | | | | |
| | | December 31, | |
| | | 2010 | | | 2009 | |
| |
| Land | | € | 25,137 | | | € | 24,921 | |
| Buildings | | | 131,546 | | | | 126,570 | |
| Production equipment and other | | | 1,130,294 | | | | 1,098,380 | |
| | | | | | | | | |
| | | | 1,286,977 | | | | 1,249,871 | |
| Less: Accumulated depreciation | | | (440,210 | ) | | | (381,313 | ) |
| | | | | | | | | |
| | | € | 846,767 | | | € | 868,558 | |
| | | | | | | | | |
Note 5. Property, Plant and Equipment
| | | | | | | | |
| | | December 31, | |
| | | 2013 | | | 2012 | |
Land | | $ | 34,421 | | | $ | 33,210 | |
Buildings | | | 194,676 | | | | 177,198 | |
Production equipment and other | | | 1,570,196 | | | | 1,536,415 | |
| | | | | | | | |
| | | 1,799,293 | | | | 1,746,823 | |
Less: accumulated depreciation | | | (760,662 | ) | | | (680,317 | ) |
| | | | | | | | |
| | $ | 1,038,631 | | | $ | 1,066,506 | |
| | | | | | | | |
As at December 31, 20102013, property, plant and equipment was net of €297,992$365,359 of unamortized government investment grants (2009 — €283,730)(2012 – $364,849).
As at December 31, 2010,2013, included in production equipment and other is equipment under capital leases which had gross amounts of €17,468 (2009 — €17,465)$20,550 (2012 – $21,710), and accumulated depreciation of €9,585 (2009 — €9,280)$9,447 (2012 – $11,042). During the year, production equipment and other totalling €2,087$2,112 was acquired under capital lease obligations (2009 — €625; 2008 — €5,318)(2012 – $2,648; 2011 – $3,872).
The Company maintains industrial landfills on its premises for the disposal of waste, primarily from the mills’ pulp processing activities. The mills have obligations under their landfill permits to decommission these disposal facilities pursuant to certain regulations. As at December 31, 2010,2013, the Company had recorded €4,180 (2009 — €3,912)$5,549 (2012 – $5,605) of asset retirement obligations.
Certain ofobligations in capital leases and other in the
assets at the Celgar mill are subject to a lien registered for the benefit of the province of British Columbia. The lien was registered pursuant to a property transfer tax dispute that is currently before the courts. Effective January 24, 2011, the lien was removed from these assets. See Consolidated Balance Sheet.Note 16 — Commitments6. Accounts Payable and Contingencies.
| |
Note 6. | Accounts Payable and Accrued Expenses |
| | | | | | | | | |
| | | December 31, | |
| | | 2010 | | | 2009 | |
| |
| Trade payables | | € | 36,680 | | | € | 31,771 | |
| Accounts payable and other | | | 3,861 | | | | 1,225 | |
| Accrued expenses | | | 27,452 | | | | 31,441 | |
| Accrued interest | | | 13,640 | | | | 18,039 | |
| Capital leases, current portion | | | 3,240 | | | | 2,709 | |
| | | | | | | | | |
| | | € | 84,873 | | | € | 85,185 | |
| | | | | | | | | |
85
| | | | | | | | |
| | | December 31, | |
| | | 2013 | | | 2012 | |
Trade payables | | $ | 44,289 | | | $ | 39,896 | |
Accrued expenses | | | 39,060 | | | | 47,271 | |
Accrued interest | | | 10,697 | | | | 11,522 | |
Capital leases, current portion (Note 19) | | | 2,254 | | | | 2,582 | |
Current taxes payable (Note 9) | | | 1,132 | | | | 9,516 | |
Other | | | 6,382 | | | | 7,812 | |
| | | | | | | | |
| | $ | 103,814 | | | $ | 118,599 | |
| | | | | | | | |
MERCER INTERNATIONAL INC.
NOTES TO THE CONSOLIDATED FINANCIAL STATEMENTS
(In thousands of Euros,U.S. dollars, except per share data)
Note 7. Debt
Debt consists of the following:
| | | | | | | | | |
| | | December 31, | |
| | | 2010 | | | 2009 | |
| |
| Note payable to bank, included in a total loan credit facility of €827,950 to finance the construction related to the Stendal mill (a) | | € | 500,657 | | | € | 514,574 | |
| Senior notes due February 2013, interest at 9.25% accrued and payable semi-annually, unsecured (b)(1) | | | 15,341 | | | | 216,299 | |
| Senior notes due December 2017, interest at 9.50% accrued and payable semi-annually, unsecured (c) | | | 224,031 | | | | — | |
| Subordinated convertible notes due October 2010, interest at 8.5% accrued and payable semi-annually (d)(2) | | | — | | | | 16,749 | |
| Subordinated convertible notes due January 2012, interest at 8.5% accrued and payable semi-annually (e) | | | 31,707 | | | | 26,160 | |
| Credit agreement with a lender with respect to a revolving credit facility of C$40 million (f) | | | 15,016 | | | | 16,000 | |
| Loan payable to the noncontrolling shareholder of the Stendal mill (g) | | | 31,365 | | | | 35,881 | |
| Credit agreement with a bank with respect to a revolving credit facility of €25,000 (h) | | | — | | | | — | |
| Investment loan agreement with a lender with respect to the wash press project at the Rosenthal mill of €4,351 (i) | | | 3,807 | | | | 3,511 | |
| Credit agreement with a bank with respect to a revolving credit facility of €3,500 (j) | | | — | | | | — | |
| | | | | | | | | |
| | | | 821,924 | | | | 829,174 | |
| Less: current portion | | | (39,596 | ) | | | (16,032 | ) |
| | | | | | | | | |
| Debt, less current portion | | € | 782,328 | | | € | 813,142 | |
| | | | | | | | | |
The Company made scheduled principal repayments under these facilities of €16,086 in 2010, and expects the principal repayments to be €39,596 in 2011. | | | | | | | | |
| | | December 31, | |
| | | 2013 | | | 2012 | |
Note payable to bank, included in a total loan credit facility of €828.0 million to finance the construction related to the Stendal mill (a) | | $ | 568,945 | | | $ | 597,158 | |
Senior notes, interest at 9.50% accrued and payable semi-annually, unsecured (b) | | | 336,382 | | | | 284,361 | |
Credit agreement with a lender with respect to a revolving credit facility of C$40.0 million (c) | | | — | | | | 6,031 | |
Term bank facility for a project at the Stendal mill of €17.0 million (d) | | | 21,179 | | | | — | |
Loans payable to the noncontrolling shareholder of the Stendal mill (e) | | | 52,117 | | | | 48,283 | |
Investment loan agreement with a lender with respect to a project at the Rosenthal mill of €4.4 million (f) | | | 749 | | | | 2,152 | |
Credit agreement with a bank with respect to a revolving credit facility of €25.0 million (g) | | | — | | | | — | |
Credit agreement with a bank with respect to a revolving credit facility of €5.0 million (h) | | | — | | | | — | |
| | | | | | | | |
| | | 979,372 | | | | 937,985 | |
Less: current portion | | | (60,355 | ) | | | (60,205 | ) |
| | | | | | | | |
Debt, less current portion | | $ | 919,017 | | | $ | 877,780 | |
| | | | | | | | |
As of December 31, 2010,2013, the principal maturities of debt are as follows:
| | | | | |
Matures | | Amount | |
| |
| 2011(1) | | € | 39,596 | |
| 2012 | | | 57,378 | |
| 2013(1)(3) | | | 56,104 | |
| 2014 | | | 40,543 | |
| 2015 | | | 44,000 | |
| Thereafter | | | 584,303 | |
| | | | | |
| | | € | 821,924 | |
| | | | | |
| | |
(1) | | On December 20, 2010, the Company announced its intention to redeem all of its Senior Notes due 2013. The unconditional redemption notice stipulates that all outstanding Senior Notes due 2013 are irrevocably due and payable on the redemption date of February 15, 2011 and as such the Company has treated this amount as current as at December 31, 2010. See Note 18 — Subsequent Events. |
(2) | | On January 21, 2010, €15,162 of the subordinated convertible notes due October 2010 were tendered for exchange for subordinated convertible notes due January 2012 and as such the Company treated this amount as non-current at December 31, 2009. |
(3) | | Includes revolving credit facility principal amounts totalling €15,016. |
86
| | | | |
| Matures | | Amount | |
2014 | | $ | 60,355 | |
2015 | | | 65,566 | |
2016 | | | 65,566 | |
2017 | | | 787,885 | |
2018 | | | — | |
Thereafter | | | — | |
| | | | |
| | $ | 979,372 | |
| | | | |
MERCER INTERNATIONAL INC.
NOTES TO THE CONSOLIDATED FINANCIAL STATEMENTS
(In thousands of Euros, except per share data)
| |
Note 7. | Debt — (Continued) |
Certain of the Company’s debt agreementsinstruments were issued under an indenture which, among other things, restricts its ability and the ability of its restricted subsidiaries to make certain payments. These limitations are subject to other important qualifications andspecific exceptions. As at December 31, 2010,2013, the Company was in compliance with the terms of the indenture.
| |
| (a) | Note payable to bank, included in a total loan facility of €827,950€828.0 million to finance the construction related to the Stendal mill (“Stendal Loan Facility”), interest at rates varying from Euribor plus 0.90% to Euribor plus 1.58%1.80% (rates on amounts of borrowing at December 31, 20102013 range from 2.04%1.39% to 2.72%2.14%), principal due in required installments beginning September 30, 2006 until September 30, 2017, collateralized by the gross assets of the Stendal mill, with 48% and 32% guaranteed by the Federal Republic of Germany and the State of Saxony-Anhalt, respectively, of up to €455,657€352.9 million of the outstanding principal, subject to a debt service reserve account required to pay(“DSRA”) for purposes of paying amounts due in the following twelve12 months under the terms of the Stendal Loan Facility; payment of dividends is only permitted if certain cash flow requirements are met. |
| | |
| | On March 13, 2009, See Note 17 – Derivative Transactions for a discussion of the Company finalized an agreement with its lendersCompany’s variable-to-fixed interest rate swap that was put in place to amend itseffectively fix the interest rate on the Stendal Loan Facility. The amendment deferred approximately €164,000 of scheduled principal payments until the maturity date, September 30, 2017, including approximately €20,000, €26,000, €21,000 of scheduled principal payments that were originally due in 2009, 2010, and 2011, respectively. The amendment also provided for a 100% cash sweep, referred to as the “Cash Sweep”, of any cash, in excess of a €15,000 working capital reserve, held by Stendal which will be used first to fund the debt service reserve account to a level sufficient to service the amounts due and payable under the Stendal Loan Facility during the then following 12 months, or “Fully Funded”, and second to prepay the deferred principal amounts. As at December 31, 2010, the debt service reserve balance was approximately €6,968. |
| |
(b) | In February 2005, the Company issued $310 million of senior notes due February 2013 (“2013 Notes), which bear interest at 9.25% accrued, and payable semi-annually, and are unsecured. On or after February 15, 2009, the Company may redeem all or a part of the notes at redemption prices (expressed as a percentage of principal amount) equal to 104.63% for the twelve month period beginning on February 15, 2009, 102.31% for the twelve month period beginning on February 15, 2010, and 100.00% beginning on February 15, 2011 and at any time thereafter, plus accrued and unpaid interest. |
| | |
| | On November 17, 2010, the Company used the proceeds from a private offering of $300 million Senior Notes due 2017, described in Note 5(c) below and cash on hand to complete a tender offer to repurchase approximately $289 million aggregate principal amount of its 2013 Notes. Pursuant to the FASB’s Accounting Standards Codification No. 405,Liabilities — Extinguishment of Liabilities(“ASC405-20”), the Company concluded that the tendering of the 2013 Notes met the definition of debt extinguishment. In connection with this tender offer and pursuant to FASB’s Accounting Standards CodificationNo. 470-50,Debt-Modifications and Extinguishments(“ASC470-50”), the Company recorded approximately €7,500 to the loss on extinguishment of debt line in the Consolidated Statement of Operations which included the tender premium paid and the write-off of 2013 Notes unamortized debt issue costs. On December 2, 2010, a further $0.6 million of 2013 Notes were tendered. |
|
| | On December 20, 2010, the Company issued a redemption notice (the “Redemption Notice”) and announced its intention to redeem all 2013 Notes, of which approximately $20.5 million remain outstanding. The Redemption Notice is unconditional, and pursuant to the terms of the indenture all outstanding 2013 Notes are irrevocably due and payable on February 15, 2011 (the “Redemption Date”). The redemption price is 100.00% of the principal amount of the 2013 Notes redeemed, plus accrued and unpaid interest to, but not including, the Redemption Date. See Note 18 — Subsequent Events. |
87
MERCER INTERNATIONAL INC.
NOTES TO THE CONSOLIDATED FINANCIAL STATEMENTS
(In thousands of Euros,U.S. dollars, except per share data)
Note 7. Debt (continued)
On March 13, 2009, the Company finalized an agreement with its lenders to amend its Stendal Loan Facility. The amendment deferred approximately €164.0 million of scheduled principal payments until the maturity date, September 30, 2017. The amendment also provided for a 100% cash sweep, referred to as the “Cash Sweep”, of any cash, in excess of a €15.0 million working capital reserve and the Guarantee Amount, as discussed in Note 20(b) – Commitments and Contingencies, and other amounts as contemplated in the amendment, held by Stendal which will be used first to fund the DSRA to a level sufficient to service the amounts due and payable under the Stendal Loan Facility during the then following 12 months, which means the DSRA is “Fully Funded”, and second to prepay the deferred principal amounts. As at December 31, 2013, the DSRA balance was €33.0 million and was not Fully Funded.
On September 30, 2013, the Company amended the terms of the Stendal Loan Facility and Project Blue Mill facility (the “Facilities”) (Note 7(d)). The amendment included waiving compliance with the annual debt service cover ratio and the senior debt cover ratio under the Facilities until and including December 31, 2013; amending the senior debt cover ratio so that it now deducts the DSRA and other specified cash above a stipulated threshold in the calculation of senior debt; providing that a failure to satisfy the annual debt service cover ratio under the Facilities would only be an event of default when amounts in the DSRA plus certain cash reserves are below a specified threshold; and revising the calculation of amounts required to cure a senior debt cover ratio default. Pursuant to the amended agreement the Company made a capital investment of $20,000 in Stendal. See Note 15 – Noncontrolling Interest for details of the investment.
| |
Note 7. | Debt — (Continued) |
| |
(c) (b) | On November 17, 2010, the Company completed a private offering of $300 million$300,000 in aggregate principal amount of Senior Notessenior notes due 2017 (“2017Senior Notes”). The proceeds from this offering were used to finance the tender offer and consent solicitation for approximately $289 million of the Company’s 2013 Notes. See Note 7(b). The 2017Senior Notes were issued at a price of 100% of their principal amount. The 2017Senior Notes will mature on December 1, 2017 and bear interest at 9.5%9.50% which is accrued and payable semi-annually. |
| | |
| | The 2017 Notes are general unsecured senior obligations of the Company. The 2017In July 2013, the Company issued $50,000 in aggregate principal amount of its Senior Notes. The additional notes were priced at 104.50% plus accrued interest from June 1, 2013. The net proceeds from the offering were $50,500, after deducting the underwriter’s discounts, offering expenses and accrued interest. The Company used the net proceeds from the offering to repay the revolving credit facilities of the Rosenthal and Celgar mills and for general corporate purposes. The Senior Notes are general unsecured senior obligations of the Company. The Senior Notes rank equal in right of payment with all existing and future senior unsecured indebtedness of the Company and senior in right of payment to any current or future subordinated indebtedness of the Company. The 2017 Notes are effectively junior in right of payment to all borrowings of the Company’s restricted subsidiaries, including borrowings under the Company’s credit agreements which are secured by certain assets of its restricted subsidiaries. |
|
| | The Company may redeem all or a part of the 2017 Notes, upon not less than 30 or more than 60 days’ notice, at the redemption prices (expressed as percentages of principal amount) equal to 104.75% for the twelve month period beginning on December 1, 2014, 102.38% for the twelve month period beginning on December 1, 2015, and 100.00% beginning on December 1, 2016 and at any time thereafter, plus accrued and unpaid interest. |
| |
(d) | On October 15, 2010 the Company repaid the outstanding principal balance of approximately $2.3 million for the Subordinated Convertible Notes due October 2010 (“2010 Notes”) and any unpaid interest up to the redemption date. This balance represented the amount of 2010 Notes which were not exchanged for Subordinated Convertible Notes due January 2012. See Note 7(e). |
|
(e) | On December 10 and 11, 2009, the Company exchanged approximately $43.3 million of Subordinated Convertible Notes due October 2010 through private exchange agreements with the holders thereof for approximately $43.8 million of Subordinated Convertible Notes due January 2012 (the “2012 Notes”). On January 22, 2010, through an exchange offer with the remaining holders of the 2010 Notes, the Company exchanged a further $21.7 million of 2010 Notes for approximately $22.0 million of the Company’s 2012 Notes. The Company recognized both exchange transactions of the Subordinated Convertible Notes as extinguishments of debt in accordance with ASC Topic 470,Debt,because the fair value of the embedded conversion option changed by more than 10% in both transactions. As a result, for the year ended December 31, 2009, the Company accounted for the December 10, 2009 exchange as a debt extinguishment and recognized a gain of €4,447 in the Consolidated Statement of Operations. During 2010, the Company recognized a loss of €929 as a result of the January 22, 2010 exchange. Both the gain and the loss were determined using fair market values prevailing at the time of the transactions, and both will be accreted to income through to January 2012 through interest expense yielding an effective interest rate of approximately 13% on the December 10, 2009 exchange and 3% on the January 22, 2010 exchange. |
The 2012 Notes bear interest at 8.50%, accrued and payable semi-annually, are convertible at anytime by the holder into common shares of the Company
at $3.30 per share and
senior in right of payment to any current or future subordinated indebtedness of the Company. The Senior Notes are
unsecured. effectively junior in right of payment to all borrowings of the Company’s restricted subsidiaries, including borrowings under the Company’s credit agreements which are secured by certain assets of its restricted subsidiaries.The Company may redeem for cash all or a portionpart of the notesSenior Notes, upon not less than 30 days’ or more than 60 days’ notice, at the redemption prices (expressed as percentages of principal amount) equal to 104.75% for the twelve month period beginning on or after July 15, 2011December 1, 2014, 102.38% for the twelve month period beginning on December 1, 2015, and 100.00% beginning on December 1, 2016 and at 100% of the principal amount of the notesany time thereafter, plus accrued interest up to the redemption date. During the year, approximately $21.4 million of Subordinated Convertible Notes due January 2012 were converted into 6,500,171 shares. The Company recorded a debt conversion expense of approximately $0.9 million for the year ended December 31, 2010, as a result of the conversions, which is included within interest expense in the Consolidated Statements of Operations. See Note 18 — Subsequent Events.
| |
(f) (c) | Credit agreement with respect to a revolving credit facility of up to C$40.0 million for the Celgar mill. The credit agreementfacility matures May 2013.2016. Borrowings under the credit agreementfacility are collateralized by the mill’s inventory and receivables and are restricted by a borrowing base calculated on the mill’s inventory and receivables. Canadian dollar denominated amounts bear interest at bankers acceptance plus 3.75%1.75% or |
88
MERCER INTERNATIONAL INC.
NOTES TO THE CONSOLIDATED FINANCIAL STATEMENTS
(In thousands of Euros, except per share data)
| |
Note 7. | Debt — (Continued) |
| |
| Canadian prime plus 2.00%0.25%. U.S. dollar denominated amounts bear interest at LIBOR plus 3.75%1.75% or U.S. base plus 2.00%0.25%. As at December 31, 2010,2013, C$1.7 million of this facility was supporting letters of credit and approximately C$33.3 million was available. |
MERCER INTERNATIONAL INC.
NOTES TO THE CONSOLIDATED FINANCIAL STATEMENTS
(In thousands of U.S. dollars, except per share data)
Note 7. Debt (continued)
| (d) | A €17.0 million amortizing term facility to partially finance a project, referred to as “Project Blue Mill”. The facility, 80% of which is guaranteed by the State of Saxony-Anhalt, bears interest at a rate of Euribor plus 3.5% per annum. The interest period for the facility, at the choice of the Company, will be of one, three or six months duration and interest is paid on the last day of the interest period selected. The facility, together with accrued interest, is scheduled to mature in September 2017. The facility will be repaid semi-annually, commencing September 30, 2013, is collateralized by the gross assets of the Stendal mill, and will be non-recourse to Mercer Inc. As at December 31, 2013, the facility was accruing interest at a rate of approximately 4.96% and the undrawn amount was approximately C$17.9 million.3.84%. |
As part of this term facility, the Company was required to open an investment account with the lender for the purpose of managing project costs and is required to deposit all funding associated with Project Blue Mill in this account. As at December 31, 2013, the balance in the investment account was $2,618.
| |
(g) (e) | Loans of €26.8 million payable by the Stendal mill to theits noncontrolling shareholder of Stendal mill bear interest at 7.00%,a rate of 1.00% per annum and are accrued semi-annually.due in 2017, provided that the Project Blue Mill facility (Note 7(d)) and the Stendal Loan Facility (Note 7(a)) have been fully repaid on such date. The loan payable isloans are unsecured, subordinated to all liabilities of the Stendal mill, non-recourse to the Company and is due in 2017. The balance includesits restricted subsidiaries. One of the loans, which has a principal and accrued interest. Duringamount of €0.4 million, may be repaid prior to October 1, 2017 if the DSRA has been Fully Funded for the first quartertime and this loan is subordinated to all liabilities of 2010, the noncontrolling shareholder agreed to convert approximately €6,275 of accrued interest into a capital contribution. SeeNote 17- Noncontrolling Interest.Stendal mill only until such time as the DSRA is Fully Funded for the first time. |
As at December 31, 2013, accrued interest on these loans was €11.1 million (2012 – €9.9 million).
|
(h) (f) | A €25,000four-year amortizing investment loan agreement with a lender relating to the wash press project at the Rosenthal mill with a total facility of €4.4 million bearing interest at the rate of Euribor plus 2.75% that matures February 2014. Borrowings under this agreement are secured by the wash press equipment. As at December 31, 2013, the balance outstanding was accruing interest at a rate of 3.09%. |
| (g) | A €25.0 million working capital facility at the Rosenthal mill that matures in December 2012.October 2016. Borrowings under the facility are collateralized by the mill’s inventory and receivables and bear interest at approximately Euribor plus 3.50%. As at December 31, 2010,2013, approximately €2,100€0.6 million of this facility was supporting bank guarantees leaving approximately €22,900 undrawn.€24.4 million available. |
|
(i) (h) | On August 19, 2009 the Company finalized an investment loan agreement with a lender relating to the new wash pressA €5.0 million facility at the Rosenthal mill. The four-year amortizing investment loan was completed with a total facility of €4,351 bearing interest at the rate of Euribor plus 2.75%.mill that matures in December 2015. Borrowings under this agreement are secured by the new wash press equipment. As at December 31, 2010 this facility was drawn by €3,807 and was accruing interest at a rate of 3.90%. |
|
(j) | On February 8, 2010, the Rosenthal mill finalized a credit agreement with a lender for a €3,500 facility maturing in December 2012. Borrowings under the facility will bear interest at the rate of the3-month three-month Euribor plus 3.50% and are secured by certain land at ourthe Rosenthal mill. As at December 31, 2010,2013 approximately €1.1 million of this facility was undrawn.supporting bank guarantees leaving approximately €3.9 million available. |
MERCER INTERNATIONAL INC.
NOTES TO THE CONSOLIDATED FINANCIAL STATEMENTS
(In thousands of U.S. dollars, except per share data)
| |
Note 8. | Pension and Other Post-Retirement Benefit Obligations |
Note 8. Pension and Other Post-Retirement Benefit Obligations
Included in pension and other post-retirement benefit obligations are amounts related to the Company’s Celgar and GermanRosenthal mills. The largest component of this obligation is with respect to the Celgar mill which maintains a defined benefit pension plan and post-retirement benefit plans for certain employees (“Celgar Plans”).
Pension benefits are based on employee’semployees’ earnings and years of service. The Celgar Plans are funded by contributions from the Company based on actuarial estimates and statutory requirements. Pension contributions forduring the twelve month periodyear ended December 31, 2010 totalled€1,053 (2009 — €963)2013 totaled $2,878 (2012 – $2,941).
Effective December 31, 2008, the defined benefit plan was closed to new members. In addition, the defined benefit service accrual ceased on December 31, 2008, and members began to receive pension benefits, at a fixed contractual rate, under a new defined contribution plan effective January 1, 2009. During the year ended December 31, 2013, the Company made contributions of approximately €2,264$773 (2012 – $795) to its defined contribution plans (2009 — €1,844).
89
MERCER INTERNATIONAL INC.
NOTES TO THE CONSOLIDATED FINANCIAL STATEMENTS
(In thousands of Euros, except per share data)
| |
Note 8. | Pension and Other Post-Retirement Benefit Obligations — (Continued) |
Information about the Celgar Plans, in aggregate for the year ended December 31, 20102013 is as follows:
| | | | | | | | | | | | | |
| | | 2010 | |
| | | | | | Other
| | | | |
| | | | | | Post-Retirement
| | | | |
| | | | | | Benefit
| | | | |
| | | Pension | | | Obligations | | | Total | |
| |
| Change in benefit obligation | | | | | | | | | | | | |
| Benefit obligation, December 31, 2009 | | € | 27,219 | | | € | 12,073 | | | € | 39,292 | |
| Service cost | | | 81 | | | | 391 | | | | 472 | |
| Interest cost | | | 1,672 | | | | 771 | | | | 2,443 | |
| Benefit payments | | | (2,494 | ) | | | (483 | ) | | | (2,977 | ) |
| Past service cost (credit) | | | — | | | | — | | | | — | |
| Actuarial (gains) losses | | | 2,118 | | | | 2,289 | | | | 4,407 | |
| Foreign currency exchange rate changes | | | 3,472 | | | | 1,602 | | | | 5,074 | |
| | | | | | | | | | | | | |
| Benefit obligation, December 31, 2010 | | | 32,068 | | | | 16,643 | | | | 48,711 | |
| | | | | | | | | | | | | |
| Reconciliation of fair value of plan assets | | | | | | | | | | | | |
| Fair value of plan assets, December 31, 2009 | | | 20,947 | | | | — | | | | 20,947 | |
| Actual returns | | | 2,189 | | | | — | | | | 2,189 | |
| Contributions | | | 570 | | | | 483 | | | | 1,053 | |
| Benefit payments | | | (2,494 | ) | | | (483 | ) | | | (2,977 | ) |
| Foreign currency exchange rate changes | | | 2,651 | | | | — | | | | 2,651 | |
| | | | | | | | | | | | | |
| Fair value of plan assets, December 31, 2010 | | | 23,863 | | | | — | | | | 23,863 | |
| | | | | | | | | | | | | |
| Funded status, December 31, 2010(1) | | € | (8,205 | ) | | € | (16,643 | ) | | € | (24,848 | ) |
| | | | | | | | | | | | | |
| Components of the net benefit cost recognized | | | | | | | | | | | | |
| Service cost | | € | 81 | | | € | 391 | | | € | 472 | |
| Interest cost | | | 1,672 | | | | 771 | | | | 2,443 | |
| Expected return on plan assets | | | (1,563 | ) | | | — | | | | (1,563 | ) |
| Amortization of recognized items | | | 438 | | | | (310 | ) | | | 128 | |
| | | | | | | | | | | | | |
| Net benefit costs | | € | 628 | | | € | 852 | | | € | 1,480 | |
| | | | | | | | | | | | | |
| | | | | | | | | | | | |
| | | 2013 | |
| | | Pension | | | Other Post-
Retirement
Benefit
Obligations | | | Total | |
Change in benefit obligation | | | | | | | | | | | | |
Benefit obligation, December 31, 2012 | | $ | 48,639 | | | $ | 28,314 | | | $ | 76,953 | |
Service cost | | | 137 | | | | 753 | | | | 890 | |
Interest cost | | | 1,836 | | | | 1,108 | | | | 2,944 | |
Benefit payments | | | (2,772 | ) | | | (767 | ) | | | (3,539 | ) |
Special termination benefits | | | 277 | | | | — | | | | 277 | |
Actuarial losses (gains) | | | (1,472 | ) | | | 943 | | | | (529 | ) |
Foreign currency exchange rate changes | | | (3,079 | ) | | | (1,893 | ) | | | (4,972 | ) |
| | | | | | | | | | | | |
Benefit obligation, December 31, 2013 | | | 43,566 | | | | 28,458 | | | | 72,024 | |
| | | | | | | | | | | | |
Reconciliation of fair value of plan assets | | | | | | | | | | | | |
Fair value of plan assets, December 31, 2012 | | | 33,647 | | | | — | | | | 33,647 | |
Actual returns | | | 4,686 | | | | — | | | | 4,686 | |
Contributions | | | 2,111 | | | | 767 | | | | 2,878 | |
Benefit payments | | | (2,772 | ) | | | (767 | ) | | | (3,539 | ) |
Foreign currency exchange rate changes | | | (2,300 | ) | | | — | | | | (2,300 | ) |
| | | | | | | | | | | | |
Fair value of plan assets, December 31, 2013 | | | 35,372 | | | | — | | | | 35,372 | |
| | | | | | | | | | | | |
Funded status, December 31, 2013(1) | | $ | (8,194 | ) | | $ | (28,458 | ) | | $ | (36,652 | ) |
| | | | | | | | | | | | |
Components of the net benefit cost recognized | | | | | | | | | | | | |
Service cost | | $ | 137 | | | $ | 753 | | | $ | 890 | |
Interest cost | | | 1,836 | | | | 1,108 | | | | 2,944 | |
Expected return on plan assets | | | (2,133 | ) | | | — | | | | (2,133 | ) |
Special termination benefits | | | 277 | | | | — | | | | 277 | |
Amortization of unrecognized items | | | 1,439 | | | | 116 | | | | 1,555 | |
| | | | | | | | | | | | |
Net benefit costs | | $ | 1,556 | | | $ | 1,977 | | | $ | 3,533 | |
| | | | | | | | | | | | |
| | |
| (1) | | The total of €24,964$36,796 on the consolidated balance sheetsConsolidated Balance Sheet also includes the pension liabilities of €116$144 relating to employees at the Company’s German operations.Rosenthal operation. |
90
MERCER INTERNATIONAL INC.
NOTES TO THE CONSOLIDATED FINANCIAL STATEMENTS
(In thousands of Euros,U.S. dollars, except per share data)
| |
Note 8. | Pension and Other Post-Retirement Benefit Obligations — (Continued) |
Note 8. Pension and Other Post-Retirement Benefit Obligations (continued)
Information about the Celgar Plans, in aggregate for the year ended December 31, 20092012 is as follows:
| | | | | | | | | | | | | |
| | | 2009 | |
| | | | | | Other
| | | | |
| | | | | | Post-Retirement
| | | | |
| | | | | | Benefit
| | | | |
| | | Pension | | | Obligations | | | Total | |
| |
| Change in benefit obligation | | | | | | | | | | | | |
| Benefit obligation, December 31, 2008 | | € | 20,028 | | | € | 10,297 | | | € | 30,325 | |
| Service cost | | | 56 | | | | 305 | | | | 361 | |
| Interest cost | | | 1,513 | | | | 785 | | | | 2,298 | |
| Benefit payments | | | (1,715 | ) | | | (373 | ) | | | (2,088 | ) |
| Past service cost (credit) | | | — | | | | (70 | ) | | | (70 | ) |
| Actuarial (gains) losses | | | 4,366 | | | | (295 | ) | | | 4,071 | |
| Foreign currency exchange rate changes | | | 2,971 | | | | 1,424 | | | | 4,395 | |
| | | | | | | | | | | | | |
| Benefit obligation, December 31, 2009 | | | 27,219 | | | | 12,073 | | | | 39,292 | |
| | | | | | | | | | | | | |
| Reconciliation of fair value of plan assets | | | | | | | | | | | | |
| Fair value of plan assets, December 31, 2008 | | | 17,098 | | | | — | | | | 17,098 | |
| Actual returns | | | 2,561 | | | | — | | | | 2,561 | |
| Contributions | | | 589 | | | | 373 | | | | 962 | |
| Benefit payments | | | (1,715 | ) | | | (373 | ) | | | (2,088 | ) |
| Foreign currency exchange rate changes | | | 2,414 | | | | — | | | | 2,414 | |
| | | | | | | | | | | | | |
| Fair value of plan assets, December 31, 2009 | | | 20,947 | | | | — | | | | 20,947 | |
| | | | | | | | | | | | | |
| Funded status, December 31, 2009(1) | | € | (6,272 | ) | | € | (12,073 | ) | | € | (18,345 | ) |
| | | | | | | | | | | | | |
| Components of the net benefit cost recognized | | | | | | | | | | | | |
| Service cost | | € | 56 | | | € | 305 | | | € | 361 | |
| Interest cost | | | 1,513 | | | | 785 | | | | 2,298 | |
| Expected return on plan assets | | | (1,272 | ) | | | — | | | | (1,272 | ) |
| Amortization of recognized items | | | 141 | | | | (279 | ) | | | (138 | ) |
| | | | | | | | | | | | | |
| Net benefit costs | | € | 438 | | | € | 811 | | | € | 1,249 | |
| | | | | | | | | | | | | |
| | | | | | | | | | | | |
| | | 2012 | |
| | | Pension | | | Other Post-
Retirement
Benefit
Obligations | | | Total | |
Change in benefit obligation | | | | | | | | | | | | |
Benefit obligation, December 31, 2011 | | $ | 46,413 | | | $ | 25,681 | | | $ | 72,094 | |
Service cost | | | 144 | | | | 725 | | | | 869 | |
Interest cost | | | 1,961 | | | | 1,126 | | | | 3,087 | |
Benefit payments | | | (2,449 | ) | | | (777 | ) | | | (3,226 | ) |
Actuarial losses (gains) | | | 1,534 | | | | 980 | | | | 2,514 | |
Foreign currency exchange rate changes | | | 1,036 | | | | 579 | | | | 1,615 | |
| | | | | | | | | | | | |
Benefit obligation, December 31, 2012 | | | 48,639 | | | | 28,314 | | | | 76,953 | |
| | | | | | | | | | | | |
Reconciliation of fair value of plan assets | | | | | | | | | | | | |
Fair value of plan assets, December 31, 2011 | | | 30,789 | | | | — | | | | 30,789 | |
Actual returns | | | 2,449 | | | | — | | | | 2,449 | |
Contributions | | | 2,164 | | | | 777 | | | | 2,941 | |
Benefit payments | | | (2,449 | ) | | | (777 | ) | | | (3,226 | ) |
Foreign currency exchange rate changes | | | 694 | | | | — | | | | 694 | |
| | | | | | | | | | | | |
Fair value of plan assets, December 31, 2012 | | | 33,647 | | | | — | | | | 33,647 | |
| | | | | | | | | | | | |
Funded status, December 31, 2012(1) | | $ | (14,992 | ) | | $ | (28,314 | ) | | $ | (43,306 | ) |
| | | | | | | | | | | | |
Components of the net benefit cost recognized | | | | | | | | | | | | |
Service cost | | $ | 144 | | | $ | 725 | | | $ | 869 | |
Interest cost | | | 1,961 | | | | 1,126 | | | | 3,087 | |
Expected return on plan assets | | | (2,105 | ) | | | — | | | | (2,105 | ) |
Amortization of unrecognized items | | | 1,453 | | | | 7 | | | | 1,460 | |
| | | | | | | | | | | | |
Net benefit costs | | $ | 1,453 | | | $ | 1,858 | | | $ | 3,311 | |
| | | | | | | | | | | | |
| | |
| (1) | | The total of €18,469$43,450 on the consolidated balance sheetsConsolidated Balance Sheet also includes the pension liabilities of €124$144 relating to employees at the Company’s German operations.Rosenthal operation. |
The Company anticipates that it will make contributions to the pension planCelgar Plans of approximately €1,419$1,606 in 2011.2014. Estimated future benefit payments under the Celgar Plans are as follows:
| | | | | |
| | | Amount |
| |
| 2011 | | € | 2,448 | |
| 2012 | | | 2,509 | |
| 2013 | | | 2,611 | |
| 2014 | | | 2,734 | |
| 2015 | | | 2,862 | |
| 2016 — 2020 | | | 16,445 | |
91
| | | | |
| | | Amount | |
2014 | | $ | 3,656 | |
2015 | | | 3,824 | |
2016 | | | 3,943 | |
2017 | | | 4,052 | |
2018 | | | 4,173 | |
2019 – 2023 | | | 22,311 | |
MERCER INTERNATIONAL INC.
NOTES TO THE CONSOLIDATED FINANCIAL STATEMENTS
(In thousands of Euros,U.S. dollars, except per share data)
| |
Note 8. | Pension and Other Post-Retirement Benefit Obligations — (Continued) |
Note 8. Pension and Other Post-Retirement Benefit Obligations (continued)
During the year ended December 31, 2010,2013, the Company recognized a lossincome, net of €3,314tax of $4,636 in other comprehensive income (2009 —(2012 – loss of €3,128; 2008 — income$808; 2011 – loss of €4,079)$11,203). As at December 31, 2010,2013, the pension related accumulated other comprehensive income balance of €7,292 (2009 — €3,978)$16,414 (2012 – $21,050) is primarily a result of net actuarial losses. These amounts have been stated net of tax. The Celgar Plans do not have any net transition asset or obligation recognized as a reclassification adjustment of other comprehensive income. The amount included in accumulated other comprehensive income which is expected to be recognized in 20112014 is approximately €571$805 of net actuarial losses. There are no plan assets that are expected to be returned to the Company in 2011.
2014.Summary of key assumptions:
| | | | | | | | | |
| | | December 31, | |
| | | 2010 | | | 2009 | |
| |
| Benefit obligations | | | | | | | | |
| Discount rate | | | 5.00 | % | | | 5.75 | % |
| Rate of compensation increase | | | 2.75 | % | | | 2.75 | % |
| Net benefit cost for year ended | | | | | | | | |
| Discount rate | | | 5.75 | % | | | 7.25 | % |
| Rate of compensation increase | | | 2.75 | % | | | 2.75 | % |
| Expected rate of return on plan assets | | | 7.00 | % | | | 7.00 | % |
| Assumed health care cost trend rate at | | | | | | | | |
| Initial health care cost trend rate | | | 10.00 | % | | | 11.00 | % |
| Annual rate of decline in trend rate | | | 1.00 | % | | | 1.00 | % |
| Ultimate health care cost trend rate | | | 4.50 | % | | | 4.50 | % |
| Medical services plan premiums trend rate | | | 6.00 | % | | | 6.00 | % |
| | | | | | | | |
| | | December 31, | |
| | | 2013 | | | 2012 | |
Benefit obligations | | | | | | | | |
Discount rate | | | 4.50 | % | | | 4.00 | % |
Rate of compensation increase | | | 2.75 | % | | | 2.75 | % |
Net benefit cost for year ended | | | | | | | | |
Discount rate | | | 4.00 | % | | | 4.25 | % |
Rate of compensation increase | | | 2.75 | % | | | 2.75 | % |
Expected rate of return on plan assets | | | 6.60 | % | | | 6.75 | % |
Assumed health care cost trend rate at | | | | | | | | |
Initial health care cost trend rate | | | 8.00 | % | | | 8.50 | % |
Annual rate of decline in trend rate | | | 0.50 | % | | | 0.50 | % |
Ultimate health care cost trend rate | | | 4.50 | % | | | 4.50 | % |
Medical services plan premiums trend rate | | | 4.50 | % | | | 6.00 | % |
The expected rate of return on plan assets is a management estimate based on, among other factors, historical long-term returns, expected asset mix and active management premium.
The discount rate assumption is adjusted annually to reflect the rates available on high-quality debt instruments, with a duration that is expected to match the timing of expected pension and other post-retirement benefit obligations. High-quality debt instruments are corporate bonds with a rating of “AA” or better.
A one-percentage point change in assumed health care cost trend rate would have the following effect on the post-retirement benefit obligations:
| | | | | | | | | | | | | | | | | |
| | | December 31, 2010 | | December 31, 2009 |
| | | 1% increase | | 1% decrease | | 1% increase | | 1% decrease |
| |
| Effect on total service and interest rate components | | € | 38 | | | € | (39 | ) | | € | 37 | | | € | (38 | ) |
| Effect on post-retirement benefit obligation | | € | 572 | | | € | (551 | ) | | € | 436 | | | € | (419 | ) |
| | | | | | | | | | | | | | | | |
| | | December 31, 2013 | | | December 31, 2012 | |
| | | 1% | | | 1% | | | 1% | | | 1% | |
| | | Increase | | | Decrease | | | Increase | | | Decrease | |
Effect on total service and interest rate components | | $ | 51 | | | $ | (53 | ) | | $ | 50 | | | $ | (53 | ) |
Effect on post-retirement benefit obligation | | $ | 927 | | | $ | (896 | ) | | $ | 957 | | | $ | (921 | ) |
Asset allocation of funded plans:
| | | | | | | | | | | | | |
| | | Target | | | 2010 | | | 2009 | |
| |
| Equity securities | | | 60 | % | | | 63 | % | | | 63 | % |
| Debt securities | | | 35 | % | | | 34 | % | | | 35 | % |
| Cash and cash equivalents | | | 5 | % | | | 3 | % | | | 2 | % |
| | | | | | | | | | | | | |
| | | | | | | | 100 | % | | | 100 | % |
| | | | | | | | | | | | | |
| | | | | | | | | | | | |
| | | Target | | | 2013 | | | 2012 | |
Equity securities | | | 60 | % | | | 64 | % | | | 58 | % |
Debt securities | | | 40 | % | | | 36 | % | | | 42 | % |
Cash and cash equivalents | | | 0 | % | | | 0 | % | | | 0 | % |
| | | | | | | | | | | | |
| | | | | | | 100 | % | | | 100 | % |
| | | | | | | | | | | | |
MERCER INTERNATIONAL INC.
NOTES TO THE CONSOLIDATED FINANCIAL STATEMENTS
(In thousands of U.S. dollars, except per share data)
Note 8. Pension and Other Post-Retirement Benefit Obligations (continued)
Investment Objective:Objective
The investment objective for the Celgar Plans is to sufficiently diversify invested plan assets to maintain a reasonable level of risk without imprudently sacrificing the return on the invested funds, and ultimately to achieve a long-term total rate of return, net of fees and expenses, at least equal to the long-term interest rate assumptions used
92
MERCER INTERNATIONAL INC.
NOTES TO THE CONSOLIDATED FINANCIAL STATEMENTS
(In thousands of Euros, except per share data)
| |
Note 8. | Pension and Other Post-Retirement Benefit Obligations — (Continued) |
for funding actuarial valuations. To achieve this objective, the Company’s overall investment strategy is to maintain an investment allocation mix of long-term growth investments (equities) and fixed income investments (debt securities). Investment allocation targets have been established by asset class as summarized above. The asset allocation targets are set after considering the nature of the liabilities, long-term return expectations, the risks associated with key asset classes, inflation and interest rates and related management fees and expenses. In addition, the Celgar Plans’ investment strategy seeks to minimize risk beyond legislated requirements by constraining the investment managers’ investment options. There are a number of specific constraints based on investment type, but they all have the general purpose of ensuring that the investments are fully diversified and that risk is appropriately managed. For example, no more than 10% of the book value of the assets can be invested in any one entity or group, investments in any one entity cannot exceed 30% of the voting shares and all equity holdings must be listed on a public exchange. Reviews of the investment objectives, key assumptions and the independent investment managers are performed periodically.
Celgar Plans’ asset fair value measurements at December 31, 2010:
| | | | | | | | | | | | | | | | | |
| | | Quoted
| | | | | | | | | | |
| | | prices in
| | | | | | | | | | |
| | | active
| | | Significant
| | | | | | | |
| | | markets for
| | | other
| | | Significant
| | | | |
| | | identical
| | | observable
| | | unobservable
| | | | |
| | | assets | | | inputs | | | Inputs | | | Total | |
| |
Asset Category | | | | | | | | | | | | | | | | |
| Leith Wheeler Diversified Balanced Fund | | € | 11,971 | | | € | — | | | € | — | | | € | 11,971 | |
| Phillips, Hagar and North Balanced Pension Trust | | | 11,892 | | | | — | | | | — | | | | 11,892 | |
| | | | | | | | | | | | | | | | | |
| Total assets | | € | 23,863 | | | € | — | | | € | — | | | € | 23,863 | |
| | | | | | | | | | | | | | | | | |
2013: | | | | | | | | | | | | | | | | |
Asset category | | Quoted Prices in
Active Markets
for Identical
Assets | | | Significant
Other
Observable
Inputs | | | Significant
Unobservable
Inputs | | | Total | |
Leith Wheeler Diversified Funds | | $ | 22,458 | | | $ | — | | | $ | — | | | $ | 22,458 | |
Phillips, Hagar and North Bond Fund | | | 12,821 | | | | — | | | | — | | | | 12,821 | |
Cash | | | 93 | | | | — | | | | — | | | | 93 | |
| | | | | | | | | | | | | | | | |
Total assets | | $ | 35,372 | | | $ | — | | | $ | — | | | $ | 35,372 | |
| | | | | | | | | | | | | | | | |
Concentrations of Risk in the Celgar Plans’ Assets:Plans
’ AssetsThe Company has reviewed the Celgar Plans’ investments and determined that they are allocated based on the specific investment manager’s stated investment strategy with only slight over- or under-weightings within any specific category, and that those investments are within the constraints that have been set by the Company. Those constraints include a limitation on the value that can be invested in any one entity or group and the investment category targets noted above. In addition, we have two independent investment managers. The Company has concluded that there are no significant concentrations of risk.
Multiemployer Plan
The Company accountsparticipates in a multiemployer plan for income taxesthe hourly-paid employees at the Celgar mill. The contributions to the plan are determined based on an amount per hour worked pursuant to a collective bargaining agreement. The Company has no current or future contribution obligations in accordance with ASC 740,excess of the contractual contributions. The contributions during the year ended December 31, 2013 totaled $2,635 (2012 – $2,644; 2011 – $2,450). Plan details are included in the following table:
| | | | | | | | |
| | | | | Expiration | | | | |
| | | | | Date of | | Are the Company’s |
| | | Provincially | | Collective | | Contributions Greater Than |
| | | Registered | | Bargaining | | 5% of Total Contributions |
Legal name | | Plan Number | | Agreement | | 2013 | | 2012 |
The Pulp and Paper Industry Pension Plan | | P085324 | | April 30, 2017 | | Yes | | Yes |
MERCER INTERNATIONAL INC.
NOTES TO THE CONSOLIDATED FINANCIAL STATEMENTS
(In thousands of U.S. dollars, except per share data)
Note 9. Income Taxes(“ASC 740”).
The Company’s effective income tax (benefit) rate can be affected by many factors, including but not limited to, changes in the mix of earnings in tax jurisdictions with differing statutory rates, changes in corporate structure, changes in the valuation of deferred tax assets and liabilities, the result of audit examinations of previously filed tax returns and changes in tax laws. The asset and liability approach is used to recognize deferred tax assets and liabilities for the expected future tax consequences of temporary differences between the carrying amounts and the tax bases of assets and liabilities.
The Companyand/or one or more of its subsidiaries filesfile income tax returns in the United States, Germany and Canada. Currently, the Company does not anticipate that the expiration of the statuestatute of limitations or the completion of audits in the next fiscal year will result in liabilities for uncertain income tax positions that are materially different than the amounts accrued or disclosed as of December 31, 2010.2013. However, this belief could change as tax years are examined by taxing authorities, the timing of those examinations, if any, are uncertain at this time. During 2010,2013, the German tax
93
MERCER INTERNATIONAL INC.
NOTES TO THE CONSOLIDATED FINANCIAL STATEMENTS
(In thousands of Euros, except per share data)
| |
Note 9. | Income Taxes — (Continued) |
authorities completed examinations of 2011 for all but two entities. For one of the 2005, 2006,entities 2008, 2009, and 2007 tax years. As of December 31, 2010 the 2005, 2006, and 2007 tax years are still being examined by Canadianreviewed and the review is expected to be completed in 2014. For the other entity the 2010 examination is complete. The Company believes that it has adequately provided for any reasonable foreseeable outcomes related to its tax authorities.audits and that any settlement will not have a material adverse effect on its consolidated results. However, there can be no assurances as to the possible outcomes. The Company is generally not subject to U.S., German or Canadian income tax examinations for tax years before 2007,2010 and 2008, and 2006, respectively.
As at December 31, 2010, the Company had approximately €500 of total gross unrecognized tax benefits, substantially all of which would affect the Company’s effective tax rate if recognized. A reconciliation of the beginning and ending amount of total gross unrecognized tax benefits is as follows:
| | | | | | | | | |
| | | 2010 | | | 2009 | |
| |
| Balance at January 1 | | € | 700 | | | € | 800 | |
| Reductions — prior year tax positions | | | (500 | ) | | | — | |
| Lapse of statute of limitations | | | — | | | | (100 | ) |
| | | | | | | | | |
| Balance at December 31 | | € | 200 | | | € | 700 | |
| | | | | | | | | |
| | | | | | | | |
| | | 2013 | | | 2012 | |
Balance at January 1 | | $ | 82,934 | | | $ | 1,427 | |
Reduction prior year tax positions | | | (82,934 | ) | | | (1,427 | ) |
Addition of current year tax positions | | | — | | | | 82,934 | |
| | | | | | | | |
Balance at December 31 | | $ | — | | | $ | 82,934 | |
| | | | | | | | |
The liability in the Consolidated Balance Sheet related to unrecognized tax benefits was $nil as at December 31, 2013 (2012—$8,605). The Company recognizes interest and penalties related to unrecognized tax benefits in income tax expense.benefit (provision) in the Consolidated Statement of Operations. During the year ended December 31, 2010,2013, the Company recognized approximately €nil$nil in penalties and interest (2009-€nil). The Company had approximately €nil for the payment of interest and penalties accrued at(2012 – $134).
During the year ended December 31, 2010.
Except for2013, the
changes in uncertainCompany resolved an outstanding issue with the German tax
positions as mentioned above,authorities. As a result, the
Company reduced its unrecognized tax benefit from $8,605 to $nil and recorded a current tax expense of $4,270. Additionally, the Company increased its valuation allowance by $4,137, thereby reducing the deferred tax asset and increasing the deferred tax expense by this amount.The provision for current income taxes consists entirelyprimarily ofnon-U.S. taxes for the years ended December 31, 2010, 20092013, 2012 and 2008,2011, respectively.
MERCER INTERNATIONAL INC.
NOTES TO THE CONSOLIDATED FINANCIAL STATEMENTS
(In thousands of U.S. dollars, except per share data)
Note 9. Income Taxes (continued)
Differences between the U.S. Federal Statutory and the Company’s effective rates are as follows:
| | | | | | | | | | | | | |
| | | Year Ended December 31, | |
| | | 2010 | | | 2009 | | | 2008 | |
| |
| U.S. Federal statutory rate | | | 34 | % | | | 34 | % | | | 34 | % |
| U.S. Federal statutory rate on (income) loss from continuing operations before income tax and noncontrolling interest | | € | (30,206 | ) | | € | 26,526 | | | € | 28,241 | |
| Tax differential on foreign income (loss) | | | 8,754 | | | | (3,412 | ) | | | (2,966 | ) |
| Effect of foreign earnings | | | (6,721 | ) | | | — | | | | (17,800 | ) |
| Valuation allowance | | | 13,326 | | | | (20,806 | ) | | | (5,530 | ) |
| Change in undistributed earnings | | | 15,186 | | | | — | | | | — | |
| Other | | | 5,540 | | | | 3,561 | | | | (4,422 | ) |
| | | | | | | | | | | | | |
| | | € | 5,879 | | | € | 5,869 | | | € | (2,477 | ) |
| | | | | | | | | | | | | |
| Comprised of: | | | | | | | | | | | | |
| Current | | € | (3,881 | ) | | € | (134 | ) | | € | (501 | ) |
| Deferred | | | 9,760 | | | | 6,003 | | | | (1,976 | ) |
| | | | | | | | | | | | | |
| | | € | 5,879 | | | € | 5,869 | | | € | (2,477 | ) |
| | | | | | | | | | | | | |
94
| | | | | | | | | | | | |
| | | Year Ended December 31, | |
| | | 2013 | | | 2012 | | | 2011 | |
U.S. Federal statutory rate | | | 35 | % | | | 35 | % | | | 35 | % |
U.S. Federal statutory rate on (income) loss before income taxes and noncontrolling interest | | $ | 5,797 | | | $ | 1,439 | | | $ | (25,971 | ) |
Tax differential on foreign income | | | 736 | | | | 874 | | | | 7,892 | |
Effect of foreign earnings | | | (945 | ) | | | (8,382 | ) | | | (13,788 | ) |
Valuation allowance | | | (17,040 | ) | | | (17,529 | ) | | | 12,897 | |
Tax benefit of partnership structure | | | 5,942 | | | | 6,785 | | | | 7,285 | |
Pension adjustment | | | (1,206 | ) | | | 174 | | | | 2,595 | |
Non-taxable foreign subsidiaries | | | 1,696 | | | | 1,897 | | | | 5,601 | |
Research and development expense | | | 1,319 | | | | 3,436 | | | | — | |
Prior year adjustments | | | (5,749 | ) | | | — | | | | — | |
Other | | | 254 | | | | 1,927 | | | | 4,457 | |
| | | | | | | | | | | | |
| | $ | (9,196 | ) | | $ | (9,379 | ) | | $ | 968 | |
| | | | | | | | | | | | |
Comprised of: | | | | | | | | | | | | |
Current | | $ | 2,286 | | | $ | (9,531 | ) | | $ | (2,341 | ) |
Deferred | | | (11,482 | ) | | | 152 | | | | 3,309 | |
| | | | | | | | | | | | |
| | $ | (9,196 | ) | | $ | (9,379 | ) | | $ | 968 | |
| | | | | | | | | | | | |
MERCER INTERNATIONAL INC.
NOTES TO THE CONSOLIDATED FINANCIAL STATEMENTS
(In thousands of Euros, except per share data)
| |
Note 9. | Income Taxes — (Continued) |
Deferred income tax assets and liabilities are composed of the following:
| | | | | | | | | |
| | | December 31, | |
| | | 2010 | | | 2009 | |
| |
| German tax loss carryforwards | | € | 86,087 | | | € | 83,362 | |
| U.S. tax loss carryforwards | | | 28,310 | | | | 9,409 | |
| Canadian tax loss carryforwards | | | 34,516 | | | | 10,653 | |
| Basis difference between income tax and financial reporting with respect to operating pulp mills | | | (65,237 | ) | | | (15,960 | ) |
| Derivative financial instruments | | | 14,311 | | | | 14,844 | |
| Long-term debt | | | (477 | ) | | | (2,407 | ) |
| Payables and accrued expenses | | | (1,412 | ) | | | (1,454 | ) |
| Reserve for deferred pension liability | | | 5,102 | | | | 3,358 | |
| Capital leases | | | 1,734 | | | | 530 | |
| Other | | | 805 | | | | 620 | |
| | | | | | | | | |
| | | | 103,739 | | | | 102,955 | |
| Valuation allowance | | | (88,937 | ) | | | (99,529 | ) |
| | | | | | | | | |
| Net deferred tax (liability) asset | | € | 14,802 | | | € | 3,426 | |
| | | | | | | | | |
| Comprised of: | | | | | | | | |
| Deferred income tax asset | | € | 22,570 | | | € | 3,426 | |
| Deferred income tax liability | | | 7,768 | | | | — | |
| | | | | | | | | |
| | | € | 14,802 | | | € | 3,426 | |
| | | | | | | | | |
The Company is subject to income tax audits on a continuing basis which may result in changes to the amounts in the above table. Due to this and other uncertainties regarding future amounts | | | | | | | | |
| | | December 31, | |
| | | 2013 | | | 2012 | |
German tax loss carryforwards | | $ | 123,735 | | | $ | 100,251 | |
U.S. tax loss carryforwards | | | 44,718 | | | | 36,090 | |
Canadian tax loss carryforwards | | | 11,606 | | | | 40,992 | |
Basis difference between income tax and financial reporting with respect to operating pulp mills | | | (64,252 | ) | | | (71,191 | ) |
Derivative financial instruments | | | 13,060 | | | | 18,760 | |
Long-term debt | | | 2,204 | | | | 2,066 | |
Payable and accrued expenses | | | 578 | | | | (257 | ) |
Deferred pension liability | | | 9,605 | | | | 10,810 | |
Capital leases | | | 2,574 | | | | 2,816 | |
Research and development expense pool | | | 4,573 | | | | 3,523 | |
Other | | | 1,400 | | | | 1,323 | |
| | | | | | | | |
| | | 149,801 | | | | 145,183 | |
Valuation allowance | | | (140,768 | ) | | | (123,728 | ) |
| | | | | | | | |
Net deferred tax asset | | $ | 9,033 | | | $ | 21,455 | |
| | | | | | | | |
Comprised of: | | | | | | | | |
Deferred income tax asset – current | | $ | 6,326 | | | $ | 5,887 | |
Deferred income tax asset – non-current | | | 17,157 | | | | 23,159 | |
Deferred income tax liability – non-current | | | (14,450 | ) | | | (7,591 | ) |
| | | | | | | | |
Net deferred tax asset | | $ | 9,033 | | | $ | 21,455 | |
| | | | | | | | |
MERCER INTERNATIONAL INC.
NOTES TO THE CONSOLIDATED FINANCIAL STATEMENTS
(In thousands of taxable income in Germany, Canada and the United States, the Company has provided a valuation allowance against a portion of its deferred tax assets, which primarily consist of tax losses carried forward for income tax purposes. However, during the year, based on forecasted taxable income for the entities in each tax jurisdiction, income tax strategies, and its best estimates of the timing of temporary differences, the Company believes that it is more likely than not that certain tax assets will be realized and accordingly the Company has reversed certain valuation allowances totalling €10.6 million. The Company’s tax asset recognition methodology consists of forecasting taxable income into the future along with related temporary differences. The Company then estimates which tax assets, based on a variety of factors are more likely than not to be realized, and recognizes the tax assets accordingly. However, ASC 740 does not allow for tax assets to be recognized where the entity does not have a strong history of profitability. As a result of this rule, the Company was not able to recognize certain tax assets as at December 31, 2010. Management expects that certain entities will meet the history of profitability tests in 2011, and if so, additional tax assets are expected to be recognized.
U.S. dollars, except per share data)Note 9. Income Taxes (continued)
The Company’s German tax loss carryforward amount includes corporate and trade tax losses totalling approximately €442,500$528,700 at December 31, 20102013 which have no expiration date. In addition, the Company has approximately $162,700 of German interest carryforwards which have no expiration date and can be used to reduce taxable income, with certain limitations. The Company’s U.S. loss carryforwards and tax credits amount is approximately €83,200$125,700 at December 31, 2010,2013, of which approximately €2,600, €5,800$6,200 and €74,000,$119,500, if not used, will expire in the tax years ending 2011, 20122019 to 20192023 and 20202024 to 2030,2033, respectively. The Company has U.S. foreign tax credits of approximately $700 which begin to expire in 2030. The Company’s Canadian tax loss carryforward amount is approximately €138,100$43,800 at December 31, 20102013 of which approximately $12,300 will expire in 2015 and approximately $31,500 will begin to expire in the tax year ending 2026,2029, if not used. ManagementThe Company has concluded thatCanadian investment tax credits for scientific research and experimental development of approximately $4,600 which begin to expire in the taxation year 2030.
At each reporting period, the Company assesses whether it is more likely than not that the deferred tax assets will be realized, based on the review of all available positive and negative evidence, including future reversals of existing taxable temporary differences, estimates of future taxable income, past operating results and prudent and feasible tax planning strategies. The carrying value of our deferred tax assets reflects our expected ability to generate sufficient future taxable income in certain tax jurisdictions to utilize these deferred income tax benefits. Significant judgment is required when evaluating this positive and negative evidence, specifically the Company’s estimates of future taxable income. For example, the relative impact of negative and positive evidence of profitability where a company has cumulative losses in recent years. The weight given to negative and positive evidence is commensurate with the extent to which it can be objectively verified. Operating results during the most recent three-year period are generally given more weight than expectations of future profitability, which are inherently uncertain.
The following table summarizes the changes in valuation allowances related to net deferred tax assets:
| | | | | | | | |
| | | 2013 | | | 2012 | |
Balance at January 1 | | $ | 123,728 | | | $ | 106,199 | |
Additions (reversals) | | | | | | | | |
United States | | | 10,134 | | | | 477 | |
Canada | | | 12,324 | | | | 15,844 | |
Germany | | | (5,681 | ) | | | (71 | ) |
The impact of changes in foreign exchange rates | | | 263 | | | | 1,279 | |
| | | | | | | | |
Balance at December 31 | | $ | 140,768 | | | $ | 123,728 | |
| | | | | | | | |
For the year ended December 31, 2013, the Company increased its valuation allowance for certain Canadian and U.S. entities and decreased its valuation allowance for a German entity as after weighing all available evidence it concluded that it was more likely than not that the deferred tax assets for the Canadian and U.S. entities will not be utilized, underrealized and the deferred tax assets for the German entity will be realized. These assessments were based on historical and forecast taxable income, income tax strategies, and the best estimates of the timing of movements in temporary differences. The Company’s accounting for the German deferred tax assets represents its current circumstances,best estimate. It is reasonably possible that changes in the Company’s current estimates could have a material effect on the Company’s financial statements and accordingly has reserved any resulting potential tax benefit that is not expected to be realizedresults of operations in the near future.
95
MERCER INTERNATIONAL INC.
NOTES TO THE CONSOLIDATED FINANCIAL STATEMENTS
(In thousandsThe Company’s policy is to indefinitely reinvest undistributed earnings of Euros, except per share data)
| |
Note 9. | Income Taxes — (Continued) |
NoMercer Inc.’s foreign subsidiaries. Accordingly, no provision for U.S. income taxes has been made for
such undistributed
earnings of certain of the Company’s foreign subsidiaries which have been indefinitely reinvested. The Company is unable to estimate the amountearnings.MERCER INTERNATIONAL INC.
NOTES TO THE CONSOLIDATED FINANCIAL STATEMENTS
(In thousands of U.S. income taxes that would be payable if such undistributed foreign earnings were repatriated.
| |
Note 10. | Shareholders’ Equity |
dollars, except per share data)Note 10. Share Capital
Common shares
The Company has authorized 200,000,000 common shares (2009 —(2012 – 200,000,000) with a par value of $1 per share. During the twelve months ended December 31, 2010, 6,500,171 shares were issued as a result of certain holders of the Company’s Subordinated Convertible Notes due January 2012 exercising their conversion option. See Note 7(e) — Debt.
As at December 31, 2010,2013, the Company had 42,999,658 (2009 — 36,443,487)55,853,704 common shares (2012 – 55,815,704) issued and outstanding.
During the year ended December 31, 2013, the Company issued 38,000 restricted shares to directors of the Company.Preferred shares
The Company has authorized 50,000,000 preferred shares (2009 —(2012 – 50,000,000) with U.S. $1 par value issuable in series, of which 2,000,000 shares have been designated as Series A. The preferred shares may be issued in one or more series and with such designations and preferences for each series as shall be stated in the resolutions providing for the designation and issue of each such series adopted by the Board of Directors of the Company. The Board of Directors is authorized by the Company’s articles of incorporation to determine the voting, dividend, redemption and liquidation preferences pertaining to each such series. As at December 31, 2010,2013, no preferred shares had been issued by the Company.
| |
Note 11. | Stock-Based Compensation |
Note 11. Stock-Based Compensation
In June 2010, the Company adopted a new stock incentive plan (the “2010 Plan”) which provides for options, restricted stock rights, restricted stock,shares, performance shares, performance share units (“PSUs”) and stock appreciation rights to be awarded to employees, consultants and non-employee directors. The 2010 Plan replacedDuring the Company’s 2004years ended December 31, 2013 and December 31, 2012, there were no issued and outstanding restricted stock incentive plan (the “2004 Plan”). However, the terms of the 2004 Plan will govern prior awards untilrights or stock appreciation rights. As at December 31, 2013, after factoring in all awards granted under the 2004 Plan have been exercised, forfeited, cancelled, expired, or otherwise terminated in accordance with the terms thereof. The Company may grant up to a maximum of 2,000,000allocated shares, there remain approximately 1.1 million common shares under the 2010 plan, plus the number of common shares remaining available for grant pursuant to the 20042010 Plan.
Performance StockShares and PSUs
Grants ofPerformance shares are common shares granted to an employee which have restrictive conditions, such as the ability to sell the shares, until the Company and the grantee achieve certain performance stockobjectives. PSUs comprise rights to receive stockcommon shares at a future date that are contingent on the Company and the grantee achieving certain performance objectives. During the year ended December 31, 2010, potential stock basedThe performance awards totaled 534,783 shares (2009 — 565,165; 2008 — 570,614). Expense recognized for the year was €2,255(2009 — €397; 2008 — €96).
objective period is generally three years or less.The fair value of the performance stockshares and PSUs is recorded as compensation expense over the vesting period. The fair value is determined based upon the targeted number of shares awarded and the quoted price of the Company’s stockshares at the reporting date. Performance stock generally cliff vest three years fromThe target number of shares is determined using management’s best estimate. The final determination of the award date.
On February 11, 2010,number of shares to be granted or unrestricted will be made by the Company awarded a totalCompany’s Board of 13,000 performance stock to two employees. DuringDirectors. For the twelve month periodyear ended December 31, 2010, 43,382 performance stock were forfeited due2013, the Company recognized an expense of $2,882 related to the departure of two employees.
PSUs (2012 – $1,546; 2011 – $1,274). As
ofat December 31,
2010, all of2013, there are no performance shares outstanding.The following table summarizes PSU activity during the performance stock had vested (2009 — nil; 2008 — nil), however the decision determining the total number of performance awards to be granted to employees will be finalized by the
96
| | | | | | | | | | | | |
| | | Number of PSUs | |
| | | 2013 | | | 2012 | | | 2011 | |
Outstanding at January 1 | | | 786,129 | | | | 795,312 | | | | 534,783 | |
Granted | | | 40,499 | | | | 55,478 | | | | 812,575 | |
Vested and issued | | | — | | | | — | | | | (474,728 | ) |
Cancelled | | | — | | | | — | | | | (60,055 | ) |
Forfeited | | | (35,196 | ) | | | (64,661 | ) | | | (17,263 | ) |
| | | | | | | | | | | | |
Outstanding at December 31 | | | 791,432 | | | | 786,129 | | | | 795,312 | |
| | | | | | | | | | | | |
MERCER INTERNATIONAL INC.
NOTES TO THE CONSOLIDATED FINANCIAL STATEMENTS
(In thousands of Euros,U.S. dollars, except per share data)
| |
Note 11. | Stock-Based Compensation — (Continued) |
Company during the first quarter of 2011. As at such date, the Company will record any outstanding unrecognized compensation cost associated with the final determination of performance stock within stock compensation expense during the three month period ended March 31, 2011.
Note 11. Stock-Based Compensation (continued)
Restricted StockShares
The fair value of restricted stockshares is determined based upon the number of shares granted and the quoted price of the Company’s stockshares on the date of grant. Restricted stockshares generally vestsvest over one year. Expenseyear; however, 200,000 restricted shares granted during the year ended December 31, 2011 vest in equal amounts over a five-year period commencing in 2012. The fair value of the restricted shares is recognizedrecorded as compensation expense on a straight-line basis over the vesting period.
Expense recognized for the year ended December 31, 20102013 was €139 (2009 — €58; 2008 — €168)$692 (2012 – $1,070; 2011 – $1,389).
As at December 31, 2010,2013, the total remaining unrecognized compensation cost related to restricted stock amounted to approximately €93 (2009 — €7)$511 (2012 – $937), which will be amortized over theirthe remaining vesting period.
During the year ended December 31, 2010, 56,000periods.The following table summarizes restricted stock awards were granted to Directors of the Company (2009 — 21,000; 2008 — 21,000) and no restricted stock was cancelledshare activity during the year (2009 — nil; 2008 — nil).
As at December 31, 2010, the total number of restricted stock outstanding was 56,000 (2009 — 21,000; 2008 — 21,000), which had not vested.
year: | | | | | | | | | | | | |
| | | Number of Restricted Shares | |
| | | 2013 | | | 2012 | | | 2011 | |
Outstanding at January 1 | | | 196,500 | | | | 238,000 | | | | 56,000 | |
Granted | | | 38,000 | | | | 36,500 | | | | 238,000 | |
Vested | | | (76,500 | ) | | | (78,000 | ) | | | (56,000 | ) |
| | | | | | | | | | | | |
Outstanding at December 31 | | | 158,000 | | | | 196,500 | | | | 238,000 | |
| | | | | | | | | | | | |
Stock Options
Following is a summary ofThe following table summarizes the status of options outstanding at December 31, 2010:
| | | | | | | | | | | | | | | | | | | | | |
| Outstanding Options | | | | |
| | | | | Weighted
| | | | Exercisable Options |
Exercise
| | | | Average
| | Weighted
| | | | Weighted
|
Price
| | | | Remaining
| | Average
| | | | Average
|
| Range | | Number | | Contractual Life | | Exercise Price | | Number | | Exercise Price |
| (In U.S. Dollars) | | | | (Years) | | | | | | (In U.S. Dollars) |
| |
| $5.65 | | | 100,000 | | | | 2.70 | | | | $5.65 | | | | 100,000 | | | | $5.65 | |
| $7.25 | | | 30,000 | | | | 4.57 | | | | 7.25 | | | | 30,000 | | | | 7.25 | |
| $7.92 | | | 60,000 | | | | 3.58 | | | | 7.92 | | | | 60,000 | | | | 7.92 | |
2013: | | | | | | | | | | | | | | | | |
| Outstanding Options | | | Exercisable Options | |
Exercise Price (U.S. dollars) | | Number | | Weighted
Average
Remaining
Contractual
Life (Years) | | | Weighted
Average
Exercise Price
(U.S. dollars) | | | Number | | Weighted
Average
Exercise Price
(U.S. dollars) | |
$7.30 | | 30,000 | | | 1.57 | | | $ | 7.30 | | | 30,000 | | $ | 7.30 | |
$7.92 | | 45,000 | | | 1.69 | | | $ | 7.92 | | | 45,000 | | $ | 7.92 | |
During the years ended December 31, 20102013 and 2009,December 31, 2012, no options were granted, exercised or cancelled and 738,334 (2009 —cancelled. During the year ended December 31, 2013, 100,000 options expired (2012 – nil; 2008 — nil) options expired.2011 – 15,000). The aggregate intrinsic value of options outstanding and currently exercisableis calculated as the difference between the quoted market price for the Company’s common stock as at December 31, 20102013, and the exercise price of the stock options for those options where the exercise price is $1.73 per option.
below the quoted market price. As at December 31, 2013, the Company had 75,000 options (2012 – 100,000; 2011 – 100,000) with an exercise price below the quoted market price resulting in an aggregate intrinsic value of $172 (2012 – $151; 2011 – $45). The Company issues new shares upon the exercise of stock options.Stock compensation expense recognized for the year ended December 31, 20102013 was €nil (2009 - €nil)$nil (2012 – $nil; 2011 – $nil). As at December 31, 2010, all stock options had fully vested.
97
MERCER INTERNATIONAL INC.
NOTES TO THE CONSOLIDATED FINANCIAL STATEMENTS
(In thousands of Euros,U.S. dollars, except per share data)
Note 12. Net Income (Loss) Per Share Attributable to Common Shareholders
| | | | | | | | | | | | |
| | | Year Ended December 31, | |
| | | 2013 | | | 2012 | | | 2011 | |
Net income (loss) attributable to common shareholders – basic | | $ | (26,375 | ) | | $ | (15,670 | ) | | $ | 69,699 | |
Interest on convertible notes, net of tax | | | — | | | | — | | | | 1,110 | |
| | | | | | | | | | | | |
Net income (loss) attributable to common shareholders – diluted | | $ | (26,375 | ) | | $ | (15,670 | ) | | $ | 70,809 | |
| | | | | | | | | | | | |
Net income (loss) per share attributable to common shareholders | | | | | | | | | | | | |
Basic | | $ | (0.47 | ) | | $ | (0.28 | ) | | $ | 1.39 | |
| | | | | | | | | | | | |
Diluted | | $ | (0.47 | ) | | $ | (0.28 | ) | | $ | 1.24 | |
| | | | | | | | | | | | |
Weighted average number of common shares outstanding: | | | | | | | | | | | | |
Basic(1) | | | 55,673,838 | | | | 55,596,761 | | | | 50,116,982 | |
Effect of dilutive shares: | | | | | | | | | | | | |
Performance shares and PSUs | | | — | | | | — | | | | 544,853 | |
Restricted shares | | | — | | | | — | | | | 87,923 | |
Stock options and awards | | | — | | | | — | | | | 57,483 | |
Convertible notes | | | — | | | | — | | | | 6,178,778 | |
| | | | | | | | | | | | |
Diluted | | | 55,673,838 | | | | 55,596,761 | | | | 56,986,019 | |
| | | | | | | | | | | | |
| |
Note 12. | Net Income (Loss) Per Share |
| | | | | | | | | | | | | |
| | | Year Ended December 31, | |
| | | 2010 | | | 2009 | | | 2008 | |
| |
| Net income (loss) attributable to common shareholders — basic | | € | 86,279 | | | € | (62,189 | ) | | € | (72,465 | ) |
| Interest on convertible notes, net of tax | | | 2,439 | | | | — | | | | — | |
| | | | | | | | | | | | | |
| Net income (loss) attributable to common shareholders — diluted | | € | 88,718 | | | € | (62,189 | ) | | € | (72,465 | ) |
| | | | | | | | | | | | | |
| Net income (loss) per share attributable to common shareholders | | | | | | | | | | | | |
| Basic | | € | 2.24 | | | € | (1.71 | ) | | € | (2.00 | ) |
| | | | | | | | | | | | | |
| Diluted | | € | 1.56 | | | € | (1.71 | ) | | € | (2.00 | ) |
| | | | | | | | | | | | | |
| Weighted average number of common shares outstanding: | | | | | | | | | | | | |
| Basic(1) | | | 38,590,797 | | | | 36,296,649 | | | | 36,285,027 | |
| Effect of dilutive shares: | | | | | | | | | | | | |
| Stock options and awards | | | 469,527 | | | | — | | | | — | |
| Convertible notes | | | 17,902,638 | | | | — | | | | — | |
| | | | | | | | | | | | | |
| Diluted | | | 56,962,962 | | | | 36,296,649 | | | | 36,285,027 | |
| | | | | | | | | | | | | |
| | |
| (1) | | The basic weighted average number of shares excludes performance and158,000 restricted stockshares which have been issued, but have not vested as at December 31, 2010.2013 (2012 – 196,500 restricted shares; 2011 – 238,000 restricted shares). |
The calculation of diluted net income (loss) per share attributable to common shareholders does not assume the exercise of stock options and awards or the conversion of convertible notesany instruments that would have an anti-dilutive effect on earningsnet income (loss) per share.
Stock options and awards The following table summarizes the instruments excluded from the calculation of diluted income (loss) per share attributable to common shareholders because they are anti-dilutive represented 190,000 for the year ended December 31, 2010 (2009 — 928,334; 2008 — 928,334).
Restricted stock excluded from the calculation of diluted income (loss) per share attributable to common shareholders because they are anti-dilutive represented nil for the year ended December 31, 2010 (2009 — 21,000; 2008 — 21,000).
Shares associated with the convertible notes excluded from the calculation of diluted income (loss) per share attributable to common shareholders because they are anti-dilutive represented nil for the year ended December 31, 2010 (2009 — 9,141,910; 2008 — 8,678,065).
Performance stock excluded from the calculation of diluted net income (loss) per share attributable to common shareholders because they
are anti-dilutive represented nil forwere anti-dilutive. | | | | | | | | | | | | |
| | | Year Ended December 31, | |
| | | 2013 | | | 2012 | | | 2011 | |
Stock options and awards | | | 75,000 | | | | 175,000 | | | | — | |
PSUs | | | 791,432 | | | | 786,129 | | | | — | |
Restricted shares | | | 158,000 | | | | 196,500 | | | | — | |
Note 13. Restructuring Expenses
In July 2013, the Company announced a workforce reduction at the Celgar mill. The planned reduction will affect both hourly and salaried employees and will reduce the workforce by approximately 85 employees over the next five years, with the majority of employees affected in 2013 and over the next six months. In connection with implementing this workforce reduction, during the year ended December 31, 2010 (2009 — 369,924; 2008 — 372,642).
| |
Note 13. | Business Segment Information |
2013, the Company recorded restructuring expenses of $5,029 for severance and other personnel expenses, such as termination benefits. The Company
has three operating segments,expects to incur approximately $600 of additional expenses in 2014. As at December 31, 2013, the
individual pulp mills that are aggregated into one reportable business segment, market pulp. Accordingly,Company had a liability for these restructuring expenses of $2,898 in accounts payable and other.In 2013, the results presented are thoseCompany restructured the management team at the Stendal mill. In connection with this restructuring, the Company recorded expenses of $1,386 for severance and other personnel expenses, such as termination benefits. As at December 31, 2013, the one reportable business segment.
The pulp business is cyclicalCompany had a liability for these restructuring expenses of $1,096 in natureaccounts payable and its market is affected by fluctuations in supply and demand in each cycle. These fluctuations have significant effect on the cost of materials and the eventual sales prices of products.
98
MERCER INTERNATIONAL INC.
NOTES TO THE CONSOLIDATED FINANCIAL STATEMENTS
(In thousands of Euros,U.S. dollars, except per share data)
| |
Note 13. | Business Segment Information — (Continued) |
Note 14. Accumulated Other Comprehensive Income
The following table presents net sales from continuing operations to external customers by geographic area based on locationcomponents of accumulated other comprehensive income are as follows:
| | | | | | | | |
| | | Year Ended December 31, | |
| | | 2013 | | | 2012 | |
Foreign currency translation adjustments | | $ | 47,756 | | | $ | 49,489 | |
Unrecognized losses and prior service costs related to defined benefit plans | | | (16,414 | ) | | | (21,050 | ) |
Unrealized gains on marketable securities | | | 128 | | | | 138 | |
| | | | | | | | |
Accumulated other comprehensive income | | $ | 31,470 | | | $ | 28,577 | |
| | | | | | | | |
Note 15. Noncontrolling Interest
In September 2013, the customer.
| | | | | | | | | | | | | |
| | | 2010 | | | 2009 | | | 2008 | |
| |
| Germany | | € | 278,348 | | | € | 154,323 | | | € | 198,340 | |
| China | | | 196,022 | | | | 146,613 | | | | 131,412 | |
| Italy | | | 56,301 | | | | 44,616 | | | | 56,487 | |
| Other European Union countries(1) | | | 182,246 | | | | 107,276 | | | | 133,621 | |
| Other Asia | | | 37,561 | | | | 38,946 | | | | 65,192 | |
| North America | | | 92,628 | | | | 68,213 | | | | 78,718 | |
| Other countries | | | 1,503 | | | | 8,312 | | | | 17,146 | |
| | | | | | | | | | | | | |
| | | | 844,609 | | | | 568,299 | | | | 680,916 | |
| Energy revenues | | | 44,225 | | | | 42,501 | | | | 30,971 | |
| Third party transportation revenues | | | 11,702 | | | | 8,999 | | | | 8,404 | |
| | | | | | | | | | | | | |
| | | € | 900,536 | | | € | 619,799 | | | € | 720,291 | |
| | | | | | | | | | | | | |
| | |
(1) | | Not including Germany or Italy; includes new entrant countries to the European Union from their time of admission. |
The following table presents total long-lived assets from continuing operations by geographic area based on location ofCompany made a $20,000 capital investment in the asset.
| | | | | | | | | |
| | | 2010 | | | 2009 | |
| |
| Germany | | € | 656,090 | | | € | 689,545 | |
| Canada | | | 190,648 | | | | 178,941 | |
| Other | | | 1,507 | | | | 2,934 | |
| | | | | | | | | |
| | | € | 848,245 | | | € | 871,420 | |
| | | | | | | | | |
In 2010, pulp sales toStendal mill, resulting in an 8.1% increase in the Company’s largest customer amountedequity ownership in the mill as it went from 74.9% to approximately 15% (2009 — 10%; 2008 — 9%) of total pulp sales.
83.0%. The increase in equity ownership was accounted for as an equity transaction and as a result, the noncontrolling deficit was reduced by $9,974, and the paid-in capital, which includes legal fees associated with the transaction, was reduced by $10,118.Note 16. Business Segment Information
The Company has three operating segments, the individual pulp mills that are aggregated into one reportable business segment, market pulp. Accordingly, the results presented are those of the one reportable business segment.
The following table presents net sales to external customers by geographic area based on location of the customer:
| | | | | | | | | | | | |
| | | Year Ended December 31, | |
| | | 2013 | | | 2012 | | | 2011 | |
Germany | | $ | 309,399 | | | $ | 293,733 | | | $ | 357,106 | |
China | | | 300,827 | | | | 295,797 | | | | 326,610 | |
Other European Union countries(1) | | | 224,988 | | | | 216,846 | | | | 244,884 | |
Italy | | | 65,654 | | | | 55,443 | | | | 71,695 | |
Other Asia | | | 49,855 | | | | 42,692 | | | | 42,970 | |
North America | | | 30,404 | | | | 61,103 | | | | 96,520 | |
Other countries | | | 2,748 | | | | 2,099 | | | | 1,146 | |
| | | | | | | | | | | | |
| | | 983,875 | | | | 967,713 | | | | 1,140,931 | |
Energy and chemical revenues | | | 92,198 | | | | 92,966 | | | | 94,758 | |
Third party transportation revenues | | | 12,312 | | | | 12,057 | | | | 16,275 | |
| | | | | | | | | | | | |
| | $ | 1,088,385 | | | $ | 1,072,736 | | | $ | 1,251,964 | |
| | | | | | | | | | | | |
| (1) | |
Note 14. | Financial InstrumentsNot including Germany or Italy; includes new entrant countries to the European Union from their time of admission. |
The fair valuefollowing table presents total long-lived assets by geographic area based on location of financial instrumentsthe asset:
| | | | | | | | |
| | | December 31, | |
| | | 2013 | | | 2012 | |
Germany | | $ | 843,777 | | | $ | 839,535 | |
Canada | | | 194,854 | | | | 226,971 | |
| | | | | | | | |
| | $ | 1,038,631 | | | $ | 1,066,506 | |
| | | | | | | | |
In 2013, two customers at December 31 is summarized as follows:
| | | | | | | | | | | | | | | | | |
| | | 2010 | | 2009 |
| | | Carrying
| | | | Carrying
| | |
| | | Amount | | Fair Value | | Amount | | Fair Value |
| |
| Cash and cash equivalents | | € | 99,022 | | | € | 99,022 | | | € | 51,291 | | | € | 51,291 | |
| Investments | | | 275 | | | | 275 | | | | 230 | | | | 230 | |
| Receivables | | | 121,709 | | | | 121,709 | | | | 71,143 | | | | 71,143 | |
| Notes receivable | | | 2,978 | | | | 2,978 | | | | 3,819 | | | | 3,819 | |
| Accounts payable and accrued expenses | | | 84,873 | | | | 84,873 | | | | 85,185 | | | | 85,185 | |
| Debt | | | 821,924 | | | | 847,875 | | | | 829,174 | | | | 769,207 | |
| Interest rate derivative contracts — liability | | | 50,973 | | | | 50,973 | | | | 52,873 | | | | 52,873 | |
99
MERCER INTERNATIONAL INC.
NOTES TO THE CONSOLIDATED FINANCIAL STATEMENTS
(In thousands of Euros,U.S. dollars, except per share data)
| |
Note 14. | Financial Instruments — (Continued) |
CashNote 17. Derivative Transactions
The Company is exposed to certain market risks relating to its ongoing business. The Company seeks to manage these risks through internal risk management policies as well as, from time to time, the use of derivatives. The Company currently manages its interest rate risk with the use of a derivative instrument. The derivatives are measured at fair value with changes in fair value immediately recognized in gain (loss) on derivative instruments in the Consolidated Statement of Operations.
Derivative assets are presented in prepaid expenses and Debt Instruments
other, and derivative liabilities are presented in interest rate derivative liability in the Consolidated Balance Sheet.Interest Rate Derivative
During 2004, the Company entered into certain variable-to-fixed interest rate swaps in connection with the Stendal mill with respect to an aggregate maximum amount of approximately €612.6 million of the principal amount of the indebtedness under the Stendal Loan Facility. Under the remaining interest rate swap, the Company pays a fixed rate and receives a floating rate with the interest payments being calculated on a notional amount. Currently, the contract has an aggregate notional amount of €306.8 million at a fixed interest rate of 5.28% and it matures in October 2017 (which for the most part matches the maturity of the Stendal Loan Facility).
The interest rate derivative contract is with a bank that is part of a banking syndicate that holds the Stendal Loan Facility and the Company does not anticipate non-performance by the bank.
Pulp Price Derivatives
In May 2012, the Company entered into a fixed price pulp swap contract with a bank. Under the terms of the contract, 5,000 metric tonnes (“MT”) of pulp per month was fixed at a price of 915 U.S. dollars per MT. The contract matured in December 2012. In November 2012, the Company entered into two additional contracts. Under the terms of the contracts, 3,000 MT of pulp per month is fixed at prices which range from 880 U.S. dollars to 890 U.S. dollars per MT. The contracts matured in December 2013.
Energy Derivatives
The Company is also subject to price risk for electricity used in its manufacturing operations. The Company enters into electricity forward sales contracts when it sees an opportunity to sell forward electricity at opportunistic rates. No electricity forward sales contracts were entered into in 2013, 2012 or 2011. Although the Company does not currently have plans to enter into such transactions, the Company may enter into similar electricity derivative contracts in the future.
Foreign Exchange Derivatives
Many of the Company’s transactions are denominated in foreign currencies, primarily the U.S.Euro and Canadian dollar. As a result of these transactions the Company and its subsidiaries hashave financial risk that the value of the Company’s financial instruments will vary due to fluctuations in foreign exchange rates.
The Company did not enter into foreign exchange derivatives in 2013, 2012 and 2011.
MERCER INTERNATIONAL INC.
NOTES TO THE CONSOLIDATED FINANCIAL STATEMENTS
(In thousands of U.S. dollars, except per share data)
Note 17. Derivative Transactions (continued)
Credit Risk
The Company’s credit risk is primarily attributable to cash held in bank accounts and receivables. The Company maintains cash balances in foreign financial institutions in excess of insured limits. The Company limits its credit exposure on cash held in bank accounts by periodically investing cash in excess of short-term operating requirements and debt obligations in low risk government bonds, or similar debt instruments. The Company’s credit risk associated with the sale of pulp products is managed through establishing long-term contractual relationships with its customers, setting credit limits, the purchase of credit insurance and for certain customers a letter of credit is received prior to shipping its product. Concentrations of credit risk on the sale of pulp products are with customers and agents based in Germany, China, Italy and the United States.
The carrying amount of cash and cash equivalents of $147,728 and receivables of $135,893 recorded in the Consolidated Balance Sheet, net of any allowances for losses, represents the Company’s maximum exposure to credit risk.
The following table shows the derivative gains and losses by instrument type as they are recognized in gain (loss) on derivative instruments in the Consolidated Statement of Operations:
| | | | | | | | | | | | |
| | | Year Ended December 31, | |
| | | 2013 | | | 2012 | | | 2011 | |
Interest rate derivative contract | | $ | 22,476 | | | $ | 2,204 | | | $ | (1,974 | ) |
Pulp price derivative contracts | | | (2,767 | ) | | | 2,608 | | | | — | |
| | | | | | | | | | | | |
| | $ | 19,709 | | | $ | 4,812 | | | $ | (1,974 | ) |
| | | | | | | | | | | | |
Note 18. Financial Instruments
The fair value of financial instruments as at December 31 is summarized as follows:
| | | | | | | | | | | | | | | | |
| | | 2013 | | | 2012 | |
| | | Carrying
Amount | | | Fair Value | | | Carrying
Amount | | | Fair Value | |
Cash and cash equivalents | | $ | 147,728 | | | $ | 147,728 | | | $ | 137,439 | | | $ | 137,439 | |
Marketable securities | | $ | 217 | | | $ | 217 | | | $ | 243 | | | $ | 243 | |
Receivables | | $ | 135,893 | | | $ | 135,893 | | | $ | 145,150 | | | $ | 145,150 | |
Pulp price derivative contracts – asset | | $ | — | | | $ | — | | | $ | 982 | | | $ | 982 | |
Accounts payable and other | | $ | 103,814 | | | $ | 103,814 | | | $ | 118,599 | | | $ | 118,599 | |
Debt | | $ | 979,372 | | | $ | 980,982 | | | $ | 937,985 | | | $ | 922,951 | |
Interest rate derivative contract – liability | | $ | 46,517 | | | $ | 46,517 | | | $ | 66,819 | | | $ | 66,819 | |
The carrying value of cash and cash equivalents and accounts payable and accrued expensesother approximates the fair value due to the immediate or short-term maturity of these financial instruments. The carrying value of receivables approximates the fair value due to their short-term nature and historical collectability. TheMarketable securities are recorded at fair value of notes receivable was estimated using discounted cash flows at prevailing market rates. The fair value of debt reflectsbased on recent market transactions and discounted cash flow estimate.transactions. See the Fair Value Measurement and DisclosuresDisclosure section below for details on how the fair value of the pulp price derivative contracts, interest rate derivative contractscontract and debt was determined.
The Company uses interest rate derivatives to fix the rate of interest on indebtedness under the Stendal Loan Facilities and sometimes uses foreign exchange derivatives to convert some costs (including currency swaps relating to long-term indebtedness) from Euros to U.S. dollars. As at December 31, 2010, there were only interest rate derivative instruments in place and there were no foreign exchange derivatives outstanding. The interest rate derivative contracts are with a large European bank that is the largest holder of the Stendal Loan Facility and the Company does not anticipate non-performance.
| | | | | | | | | | | | | |
| | | 2010 | | 2009 | | 2008 |
| |
| Unrealized net gain (loss) on derivative financial instruments | | € | 1,899 | | | € | (5,760 | ) | | € | (25,228 | ) |
| | | | | | | | | | | | | |
Energy Derivatives
The Company is also subject to price risk for electricity used in its manufacturing operations. During 2008, the Company entered into fixed electricity forward sales contracts in connection with the Stendal and Rosenthal mills electricity generation. The Company realized no gains for the years ended 2010, 2009, and 2008. The Company entered into the electricity forward sales contracts because it saw an opportunity to sell forward at opportunistic rates. No electricity forward sales were entered into in 2010. Although the Company does not currently have plans to enter into similar transactions, should similar situations present themselves, the Company may enter into similar electricity derivative contracts. As at December 31, 2010, the Company had no outstanding electricity derivative contracts. Gains from energy derivatives are included within “Operating costs” in the Consolidated Statement of Operations.
Interest Rate Derivatives
During 2004, the Company entered into certainvariable-to-fixed interest rate swaps in connection with the Stendal mill with respect to an aggregate maximum amount of approximately €612,619 of the principal amount of the indebtedness under the Stendal Loan Facility. Currently, the aggregate notional amount of these contracts is €447,763 at a fixed interest rate of 5.28% and they mature October 2017 (which for the most part matches the maturity of the Stendal Loan Facility). The Company recognized an unrealized gain of €1,899, with respect to these interest rate swaps for the year ended December 31, 2010 (2009 — an unrealized loss of €5,760; 2008 — an unrealized loss of €25,228).
Foreign Exchange Derivatives
The Company did not enter into foreign exchange derivatives in 2010, 2009 and 2008.
100
MERCER INTERNATIONAL INC.
NOTES TO THE CONSOLIDATED FINANCIAL STATEMENTS
(In thousands of Euros, except per share data)
| |
Note 14. | Financial Instruments — (Continued) |
Credit Risk
Concentrations of credit risk on the sale of pulp products are with customers and agents based in Germany, China, Italy and the United States.
Fair Value Measurement and DisclosuresDisclosure
The Company adopted the guidance outlined in ASC 820, originally released as FAS 157,Fair Value Measurement, effective January 1, 2008. The adoption of this guidance resulted in no impact on the Company’s Consolidated Balance Sheet or the Consolidated Statement of Operations.
The fair value methodologies and, as a result, the fair value of the Company’s investmentsmarketable securities, debt and derivative instruments are determined based on the fair value hierarchy provided in ASC 820. The fair value hierarchythe Fair Value Measurements and Disclosures topic of the FASB Accounting Standards Codification, and are as follows:
MERCER INTERNATIONAL INC.
NOTES TO THE CONSOLIDATED FINANCIAL STATEMENTS
(In thousands of U.S. dollars, except per ASC 820 is as follows:
share data)Note 18. Financial Instruments (continued)
Level 1 —– Valuations based on quoted prices in active markets foridenticalassets and liabilities.
Level 2 —– Valuations based on observable inputs in active markets forsimilarassets and liabilities, other than Level 1 prices, such as quoted commodity prices or interest or currency exchange rates.
Level 3 —– Valuations based on significant unobservable inputs that are supported by little or no market activity, such as discounted cash flow methodologies based on internal cash flow forecasts.
The Company classified its investmentsmarketable securities within Level 1 of the valuation hierarchy wherebecause quoted prices are available in an active market. Level 1 investments includemarket for the exchange-traded equities.
The Company’s interest rate and pulp price derivatives are classified within Level 2 of the valuation hierarchy, as they are traded on theover-the-counter market and are valued using internal models that use as their basis readily observable market inputs, such as forward interest rates.
rates, yield curves observable at specified intervals and commodity price curves. The
valuation techniques used by the Company are based upon observable
inputs. Observable inputs reflect market data obtained from independent sources. In addition, the Company considered the risk of non-performance of the obligor, which in some cases reflects the Company’s own credit
risk, in determining therisk. The counterparty to its interest rate and pulp price derivatives are multi-national financial institutions.The Company’s debt is recognized at amortized cost. The fair value of the derivative instruments. The counterparty to ourdebt classified as Level 2 reflects recent market transactions and discounted cash flow estimates. Discounted cash flow models use observable market inputs taking into consideration variables such as interest rate swap derivativechanges, comparative securities, subordination discount and credit rating changes. The fair value of debt classified as Level 3 is a multi-national financial institution.
valued using discounted cash flow models or select comparable transactions, which require significant management estimates. These estimates are developed using available market, historical, and forecast data, including taking into account variables such as recent financing activities, the capital structure, and the lack of marketability of such debt.The following table presents a summary of the Company’s outstanding financial instruments and their estimated fair values under the hierarchy defined in ASC 820:
| | | | | | | | | | | | | | | | | |
| | | Fair value measurements at December 31, 2010 using: | |
| | | Quoted prices
| | | Significant
| | | | | | | |
| | | in active
| | | other
| | | Significant
| | | | |
| | | markets for
| | | observable
| | | unobservable
| | | | |
| | | identical assets
| | | inputs
| | | inputs
| | | | |
Description | | (Level 1) | | | (Level 2) | | | (Level 3) | | | Total | |
| |
Assets | | | | | | | | | | | | | | | | |
| Investments(a) | | € | 275 | | | € | — | | | € | — | | | € | 275 | |
| | | | | | | | | | | | | | | | | |
Liabilities | | | | | | | | | | | | | | | | |
| Derivatives(b) | | | | | | | | | | | | | | | | |
| — Interest rate swaps | | € | — | | | € | 50,973 | | | € | — | | | € | 50,973 | |
| | | | | | | | | | | | | | | | | |
| | |
(a) | | Based on observable market data. |
(b) | | Based on observable inputs for the liability (interest rates and yield curves observable at specific intervals). |
101
| | | | | | | | | | | | | | | | |
| | | Fair value measurements at December 31, 2013 using: | |
| Description | | Level 1 | | | Level 2 | | | Level 3 | | | Total | |
Assets | | | | | | | | | | | | | | | | |
Marketable securities | | $ | 217 | | | $ | — | | | $ | — | | | $ | 217 | |
| | | | | | | | | | | | | | | | |
Liabilities | | | | | | | | | | | | | | | | |
Interest rate derivative contract | | $ | — | | | $ | 46,517 | | | $ | — | | | $ | 46,517 | |
Debt | | | — | | | | 367,405 | | | | 613,577 | | | | 980,982 | |
| | | | | | | | | | | | | | | | |
| | $ | — | | | $ | 413,922 | | | $ | 613,577 | | | $ | 1,027,499 | |
| | | | | | | | | | | | | | | | |
| | | | | | | | | | | | | | | | |
| | | Fair value measurements at December 31, 2012 using: | |
| Description | | Level 1 | | | Level 2 | | | Level 3 | | | Total | |
Assets | | | | | | | | | | | | | | | | |
Marketable securities | | $ | 243 | | | $ | — | | | $ | — | | | $ | 243 | |
Pulp price derivative contracts | | | — | | | | 982 | | | | — | | | | 982 | |
| | | | | | | | | | | | | | | | |
| | $ | 243 | | | $ | 982 | | | $ | — | | | $ | 1,225 | |
| | | | | | | | | | | | | | | | |
Liabilities | | | | | | | | | | | | | | | | |
Interest rate derivative contract | | $ | — | | | $ | 66,819 | | | $ | — | | | $ | 66,819 | |
Debt | | | — | | | | 308,894 | | | | 614,057 | | | | 922,951 | |
| | | | | | | | | | | | | | | | |
| | $ | — | | | $ | 375,713 | | | $ | 614,057 | | | $ | 989,770 | |
| | | | | | | | | | | | | | | | |
MERCER INTERNATIONAL INC.
NOTES TO THE CONSOLIDATED FINANCIAL STATEMENTS
(In thousands of Euros,U.S. dollars, except per share data)
| |
Note 15. | Lease Commitments |
Minimum lease payments, primarily for various vehicles, and plant and equipment under capital and non-cancellable operating leases and the present value of net minimum payments at December 31, 2010 were as follows:
| | | | | | | | | |
| | | Capital
| | | Operating
| |
| | | Leases | | | Leases | |
| |
| 2011 | | € | 3,400 | | | € | 3,287 | |
| | | | | | | | | |
| 2012 | | | 2,114 | | | | 2,740 | |
| 2013 | | | 799 | | | | 1,551 | |
| 2014 | | | 612 | | | | 1,404 | |
| 2015 | | | 667 | | | | 1,387 | |
| Thereafter | | | 1,556 | | | | 3,287 | |
| | | | | | | | | |
| Total | | € | 9,148 | | | € | 13,656 | |
| | | | | | | | | |
| Less imputed interest | | | 1,166 | | | | | |
| | | | | | | | | |
| Total present value of minimum capitalized payments | | | 7,982 | | | | | |
| Less current portion of capital lease obligations | | | 3,240 | | | | | |
| | | | | | | | | |
| Long-term capital lease obligations | | € | 4,742 | | | | | |
| | | | | | | | | |
Rent expense under operating leases was €2,246 for 2010 (2009 — €1,218; 2008 — €1,011). The current portion of the capital lease obligations is included in accounts payable and accrued expenses and the long-term portion is included in capital leases and other in the Consolidated Balance Sheets.
| |
Note 16. | Commitments and Contingencies |
AtNote 19. Lease Commitments
Minimum lease payments, primarily for various vehicles, and plant and equipment under capital and non-cancellable operating leases and the present value of net minimum payments at December 31, 2010,2013 is as follows:
| | | | | | | | |
| | | Capital | | | Operating | |
| | | Leases | | | Leases | |
2014 | | $ | 2,406 | | | $ | 2,280 | |
2015 | | | 2,414 | | | | 2,076 | |
2016 | | | 2,263 | | | | 1,295 | |
2017 | | | 1,511 | | | | 1,239 | |
2018 | | | 880 | | | | 1,237 | |
Thereafter | | | 3,111 | | | | 929 | |
| | | | | | | | |
Total | | | 12,585 | | | $ | 9,056 | |
| | | | | | | | |
Less: imputed interest | | | 1,771 | | | | | |
| | | | | | | | |
Total present value of minimum capitalized payments | | | 10,814 | | | | | |
Less: current portion of capital lease obligations | | | 2,254 | | | | | |
| | | | | | | | |
Long-term capital lease obligations | | $ | 8,560 | | | | | |
| | | | | | | | |
Rent expense under operating leases was $3,497 for the year ended December 31, 2013 (2012 – $3,866; 2011 – $4,611). The current portion of the capital lease obligations is included in accounts payable and other and the long-term portion is included in capital leases and other in the Consolidated Balance Sheet.
Note 20. Commitments and Contingencies
| (a) | At December 31, 2013, the Company has liabilities for environmental conservation expenditures which include asset retirement obligations of $5,549 (2012 – $5,605) and wastewater fees of $6,929 (2012 – $8,765). Management believes the accrued amounts recorded are sufficient. |
| (b) | Pursuant to an arbitration proceeding with the general construction contractor (the noncontrolling shareholder) of the Stendal mill regarding certain warranty claims, the Company acted upon a bank guarantee for defect liability on civil works that was about to expire as provided in the engineering, procurement, and construction contract. On January 28, 2011, the Company received approximately €10.0 million ($13,606) (the “Guarantee Amount”), which is intended to compensate the Company for remediation work that is required at the Stendal mill, but it was less than the amount claimed by the Company under the arbitration. Most of the claims have been settled; however, the arbitration proceeding is ongoing, and there is no certainty that the Company will be successful with its remaining claim. |
The €10.0 million ($13,606) was initially recognized as an increase in cash and a corresponding increase in accounts payable and other. As civil works remediation steps are agreed to with the noncontrolling shareholder an agreed to portion of the payable is reversed with the offset recorded in operating costs to offset the remediation expenditures. As at December 31, 2013, the Company recorded a liability for environmental conservation expenditureshad Guarantee Amount proceeds of approximately €2,085. Management believes the liability amount recorded is sufficient.
The Company is required to pay certain fees based on water consumption levels at its German mills. Unpaid fees can be reduced by the mills’ demonstration of reduced environmental emissions. To the extent that the Company has not agreed with regulatory authorities for fee reductions, a liability for these water charges has been recognized.
The Company maintains industrial landfills on its premises for the disposal of waste, primarily from the mill’s pulp processing activities. The mills have obligations under their landfill permits to decommission these disposal facilities pursuant to the requirements of its local regulations.
The Company had also entered into certain other capital commitments at the Rosenthal mill, none of which is individually material.
The Company is involved$2,437 remaining in a property transfer tax dispute with respect to the Celgar millaccounts payable and certain other legal actions and claims arising in the ordinary course of business. While the outcome of these legal actions and claims cannot be predicted with certainty, it is the opinion of management that the outcome of any such claim which is pending or threatened, either individually or on a combined basis, will not have a material adverse effect on the consolidated financial condition, results of operations or liquidity of the Company.
The Company entered into certain minimum or fixed purchase commitments primarily related to the purchase of raw materials, none of which are individually material, that extend beyond 2011. Commitments under these contracts are approximately €1,000 in 2011.
102
MERCER INTERNATIONAL INC.
NOTES TO THE CONSOLIDATED FINANCIAL STATEMENTS
(In thousands of Euros,U.S. dollars, except per share data)
Note 20. Commitments and Contingencies (continued)
| (c) | |
Note 17. | Noncontrolling InterestThe Company is involved in a property transfer tax dispute with respect to the Celgar mill and certain other legal actions and claims arising in the ordinary course of business. Celgar had previously paid the property transfer tax assessment of approximately C$4.5 million ($4,200). During the second quarter of 2013, the Company lost its Supreme Court of British Columbia appeal of the property transfer tax assessment and as a result the Company filed an application to seek leave to appeal to the British Columbia Court of Appeal. In September 2013, the leave to appeal was granted to the Company and a hearing date with the Court of Appeal is expected in the first half of 2014. While the outcome of any legal actions and claims cannot be predicted with certainty, it is the opinion of management that the outcome of any such claim which is pending or threatened, either individually or on a combined basis, will not have a material adverse effect on the consolidated financial condition, results of operations or liquidity of the Company. |
On March 13, 2009, the Company made a €10,000 capital contribution to the Stendal mill, of which €2,582 related to an increase in the Stendal mill’s stated capital, diluting the interest held by the noncontrolling shareholder and resulting in a 4.32% increase in the Company’s equity ownership in the Stendal mill from 70.58% to 74.90%. Pursuant toASC 810-10-65, the increase in equity ownership was accounted for as an equity transaction. The carrying amount of the Company’s shareholders’ equity was adjusted to reflect the 4.32% increase of ownership interest in the Stendal mill. As a result, the noncontrolling deficit and the Company’s Additional Paid-in Capital were reduced by €6,809.
During the first quarter of 2010, the noncontrolling interest holder agreed to convert certain interest claims totaling €6,275 borne from shareholder loans into a capital contribution. As a result of this conversion, the Company reduced the amount owing to the noncontrolling shareholder and decreased the noncontrolling shareholder’s share of losses.
| (d) | |
Note 18. | Subsequent EventsIn 2012, as a result of a regular tax field audit for the Stendal mill, German public authorities commenced a preliminary investigation into a past and then current managers of the mill relating to whether certain settlement amounts received by the Stendal mill in 2007, 2010 and 2011 from the main contractor under the Engineering, Procurement and Construction Contract for the construction of the Stendal mill should have reduced the assessment base for the original investment subsidies granted to the mill by German authorities. The payments were made by the contractor to the Stendal mill to settle certain warranty, performance and remediation claims that the Stendal mill made against the contractor after completion of mill construction in 2004. The amounts currently under review aggregate approximately €8.3 million ($11,400). Investment subsidies received by the Stendal mill were generally based upon a percentage of the assessment base for subsidies of the mill. If the settlement payments received by the Stendal mill result in a reduction of the assessment base for subsidies under applicable German rules there could be a proportionate reduction in the investment subsidies and the difference could be repayable by the Stendal mill. The Stendal mill believes that it has properly recorded the settlement amounts received from the contractor and that the same do not reduce the assessment base for subsidies of the mill. While it is not reasonably possible to predict the outcome of the legal action and claim, it is the opinion of management that the outcome will not have a material adverse effect on the consolidated financial condition, results of operations or liquidity of the Company. |
In January and February 2011, approximately $1.9 million and $3.2 million of Subordinated Convertible Notes due January 2012 were converted into 565,757 and 959,391 shares, respectively.
The Company has previously commenced an arbitration proceeding with the general construction contractor of the Stendal mill for civil claims. On January 28, 2011, the Company acted upon a performance guarantee and received a pre-payment of approximately €10.0 million, which the Company treated as a contingent gain and accordingly was not accounted for as a reduction to property, plant and equipment prior to receipt. The ultimate settlement will be determined in an arbitration proceeding that remains ongoing.
On February 15, 2011, the Company redeemed for cash all of its outstanding 9.25% Senior Notes due 2013. As of February 15, 2011, the principal outstanding amount of the 2013 Notes was $20.5 million. The Notes were redeemed for a price equal to 100% of the principal amount thereof, plus accrued and unpaid interest to, but not including, February 15, 2011. In total, the Company paid approximately €15.9 million in connection with the redemption of the Notes.
103
| (e) | The Company is subject to regulations that require the handling and disposal of asbestos in a prescribed manner if a property undergoes a major renovation or demolition. Otherwise, the Company is not required to remove asbestos from its facilities. Generally asbestos is found on steam and condensate piping systems as well as certain cladding on buildings and in building insulation throughout older facilities. The Company’s obligation for the proper removal and disposal of asbestos products from the Company’s mills is a conditional asset retirement obligation. As a result of the longevity of the Company’s mills, due in part to the maintenance procedures and the fact that the Company does not have plans for major changes that require the removal of asbestos, the timing of the asbestos removal is indeterminate. As a result, the Company is currently unable to reasonably estimate the fair value of its asbestos removal and disposal obligation. The Company will recognize a liability in the period in which sufficient information is available to reasonably estimate its fair value. |
| (f) | The Company entered into certain minimum or fixed purchase commitments primarily related to the purchase of raw materials that extend beyond 2014, none of which are individually or together material. |
MERCER INTERNATIONAL INC.
NOTES TO THE CONSOLIDATED FINANCIAL STATEMENTS
(In thousands of Euros,U.S. dollars, except per share data)
| |
Note 19. | Restricted Group Supplemental Disclosure |
Note 21. Restricted Group Supplemental Disclosure
The terms of the indenturesindenture governing our 9.25% senior unsecured notes and our 9.5% senior secured notesthe Company’s Senior Notes require that we provideit provides the results of operations and financial condition of Mercer International Inc. and ourthe restricted subsidiaries under the indenture, collectively referred to as the “Restricted Group”. As at and during the years ended December 31, 20102013 and 2009,2012, the Restricted Group was comprised of Mercer International Inc., certain holding subsidiaries and ourits Rosenthal and Celgar mills. The Restricted Group excludes the Stendal mill.
Combined Condensed Balance Sheets
| | | | | | | | | | | | | | | | | |
| | | December 31, 2010 | |
| | | Restricted
| | | Unrestricted
| | | | | | Consolidated
| |
| | | Group | | | Subsidiaries | | | Eliminations | | | Group | |
| |
ASSETS |
| Current | | | | | | | | | | | | | | | | |
| Cash and cash equivalents | | € | 50,654 | | | € | 48,368 | | | € | — | | | € | 99,022 | |
| Receivables | | | 70,865 | | | | 50,844 | | | | — | | | | 121,709 | |
| Inventories | | | 60,910 | | | | 41,309 | | | | — | | | | 102,219 | |
| Prepaid expenses and other | | | 6,840 | | | | 4,520 | | | | — | | | | 11,360 | |
| Deferred income tax | | | 22,570 | | | | — | | | | — | | | | 22,570 | |
| | | | | | | | | | | | | | | | | |
| Total current assets | | | 211,839 | | | | 145,041 | | | | — | | | | 356,880 | |
| Long-term assets | | | | | | | | | | | | | | | | |
| Property, plant and equipment | | | 362,274 | | | | 484,493 | | | | — | | | | 846,767 | |
| Deferred note issuance and other | | | 6,903 | | | | 4,179 | | | | — | | | | 11,082 | |
| Deferred income tax | | | — | | | | — | | | | — | | | | — | |
| Due from unrestricted group | | | 80,582 | | | | — | | | | (80,582 | ) | | | — | |
| Note receivable | | | 1,346 | | | | — | | | | — | | | | 1,346 | |
| | | | | | | | | | | | | | | | | |
| Total assets | | € | 662,944 | | | € | 633,713 | | | € | (80,582 | ) | | € | 1,216,075 | |
| | | | | | | | | | | | | | | | | |
| |
| LIABILITIES |
| Current liabilities | | | | | | | | | | | | | | | | |
| Accounts payable and accrued expenses | | € | 44,015 | | | € | 40,858 | | | € | — | | | € | 84,873 | |
| Pension and other post-retirement benefit obligations | | | 728 | | | | — | | | | — | | | | 728 | |
| Debt | | | 16,429 | | | | 23,167 | | | | — | | | | 39,596 | |
| | | | | | | | | | | | | | | | | |
| Total current liabilities | | | 61,172 | | | | 64,025 | | | | — | | | | 125,197 | |
| Long-term liabilities | | | | | | | | | | | | | | | | |
| Debt | | | 273,473 | | | | 508,855 | | | | — | | | | 782,328 | |
| Due to restricted group | | | — | | | | 80,582 | | | | (80,582 | ) | | | — | |
| Unrealized interest rate derivative losses | | | — | | | | 50,973 | | | | — | | | | 50,973 | |
| Pension and other post-retirement benefit obligations | | | 24,236 | | | | — | | | | — | | | | 24,236 | |
| Capital leases and other | | | 7,154 | | | | 4,856 | | | | — | | | | 12,010 | |
| Deferred income tax | | | 7,768 | | | | — | | | | — | | | | 7,768 | |
| | | | | | | | | | | | | | | | | |
| Total liabilities | | | 373,803 | | | | 709,291 | | | | (80,582 | ) | | | 1,002,512 | |
| | | | | | | | | | | | | | | | | |
EQUITY | | | | | | | | | | | | | | | | |
| Total shareholders’ equity (deficit) | | | 289,141 | | | | (53,073 | ) | | | — | | | | 236,068 | |
| Noncontrolling interest (deficit) | | | — | | | | (22,505 | ) | | | — | | | | (22,505 | ) |
| | | | | | | | | | | | | | | | | |
| Total liabilities and equity | | € | 662,944 | | | € | 633,713 | | | € | (80,582 | ) | | € | 1,216,075 | |
| | | | | | | | | | | | | | | | | |
104
| | | | | | | | | | | | | | | | |
| | | December 31, 2013 | |
| | | Restricted
Group | | | Unrestricted
Subsidiaries | | | Eliminations | | | Consolidated
Group | |
ASSETS | | | | | | | | | | | | | | | | |
Current assets | | | | | | | | | | | | | | | | |
Cash and cash equivalents | | $ | 82,910 | | | $ | 64,818 | | | $ | — | | | $ | 147,728 | |
Receivables | | | 75,987 | | | | 59,906 | | | | — | | | | 135,893 | |
Inventories | | | 93,807 | | | | 77,101 | | | | — | | | | 170,908 | |
Prepaid expenses and other | | | 7,742 | | | | 3,176 | | | | — | | | | 10,918 | |
Deferred income tax | | | 3,273 | | | | 3,053 | | | | — | | | | 6,326 | |
| | | | | | | | | | | | | | | | |
Total current assets | | | 263,719 | | | | 208,054 | | | | — | | | | 471,773 | |
Long-term assets | | | | | | | | | | | | | | | | |
Property, plant and equipment | | | 420,373 | | | | 618,258 | | | | — | | | | 1,038,631 | |
Deferred note issuance costs and other | | | 10,987 | | | | 10,011 | | | | — | | | | 20,998 | |
Deferred income tax | | | 9,894 | | | | 7,263 | | | | — | | | | 17,157 | |
Due from unrestricted group | | | 153,851 | | | | — | | | | (153,851 | ) | | | — | |
| | | | | | | | | | | | | | | | |
Total assets | | $ | 858,824 | | | $ | 843,586 | | | $ | (153,851 | ) | | $ | 1,548,559 | |
| | | | | | | | | | | | | | | | |
LIABILITIES | | | | | | | | | | | | | | | | |
Current liabilities | | | | | | | | | | | | | | | | |
Accounts payable and other | | $ | 49,891 | | | $ | 53,923 | | | $ | — | | | $ | 103,814 | |
Pension and other post-retirement benefit obligations | | | 1,330 | | | | — | | | | — | | | | 1,330 | |
Debt | | | 749 | | | | 59,606 | | | | — | | | | 60,355 | |
| | | | | | | | | | | | | | | | |
Total current liabilities | | | 51,970 | | | | 113,529 | | | | — | | | | 165,499 | |
Long-term liabilities | | | | | | | | | | | | | | | | |
Debt | | | 336,382 | | | | 582,635 | | | | — | | | | 919,017 | |
Due to restricted group | | | — | | | | 153,851 | | | | (153,851 | ) | | | — | |
Interest rate derivative liability | | | — | | | | 46,517 | | | | — | | | | 46,517 | |
Pension and other post-retirement benefit obligations | | | 35,466 | | | | — | | | | — | | | | 35,466 | |
Capital leases and other | | | 8,523 | | | | 10,770 | | | | — | | | | 19,293 | |
Deferred income tax | | | 14,450 | | | | — | | | | — | | | | 14,450 | |
| | | | | | | | | | | | | | | | |
Total liabilities | | | 446,791 | | | | 907,302 | | | | (153,851 | ) | | | 1,200,242 | |
| | | | | | | | | | | | | | | | |
EQUITY | | | | | | | | | | | | | | | | |
Total shareholders’ equity (deficit) | | | 412,033 | | | | (52,955 | ) | | | — | | | | 359,078 | |
Noncontrolling interest (deficit) | | | — | | | | (10,761 | ) | | | — | | | | (10,761 | ) |
| | | | | | | | | | | | | | | | |
Total liabilities and equity | | $ | 858,824 | | | $ | 843,586 | | | $ | (153,851 | ) | | $ | 1,548,559 | |
| | | | | | | | | | | | | | | | |
MERCER INTERNATIONAL INC.
NOTES TO THE CONSOLIDATED FINANCIAL STATEMENTS
(In thousands of Euros,U.S. dollars, except per share data)
| |
Note 19. | Restricted Group Supplemental Disclosure — (Continued) |
Note 21. Restricted Group Supplemental Disclosure (continued)
Combined Condensed Balance Sheets
| | | | | | | | | | | | | | | | | |
| | | December 31, 2009 | |
| | | Restricted
| | | Unrestricted
| | | | | | Consolidated
| |
| | | Group | | | Subsidiaries | | | Eliminations | | | Group | |
| |
ASSETS |
| Current | | | | | | | | | | | | | | | | |
| Cash and cash equivalents | | € | 20,635 | | | € | 30,656 | | | € | — | | | € | 51,291 | |
| Receivables | | | 34,588 | | | | 36,555 | | | | — | | | | 71,143 | |
| Inventories | | | 52,897 | | | | 19,732 | | | | — | | | | 72,629 | |
| Prepaid expenses and other | | | 3,452 | | | | 2,419 | | | | — | | | | 5,871 | |
| | | | | | | | | | | | | | | | | |
| Total current assets | | | 111,572 | | | | 89,362 | | | | — | | | | 200,934 | |
| Long-term assets | | | | | | | | | | | | | | | | |
| Property, plant and equipment | | | 362,311 | | | | 506,247 | | | | — | | | | 868,558 | |
| Deferred note issuance and other | | | 3,388 | | | | 4,798 | | | | — | | | | 8,186 | |
| Deferred income tax | | | 3,426 | | | | — | | | | — | | | | 3,426 | |
| Due from unrestricted group | | | 72,553 | | | | — | | | | (72,553 | ) | | | — | |
| Note receivable | | | 2,727 | | | | — | | | | — | | | | 2,727 | |
| | | | | | | | | | | | | | | | | |
| Total assets | | € | 555,977 | | | € | 600,407 | | | € | (72,553 | ) | | € | 1,083,831 | |
| | | | | | | | | | | | | | | | | |
| |
| LIABILITIES |
| Current liabilities | | | | | | | | | | | | | | | | |
| Accounts payable and accrued expenses | | € | 51,875 | | | € | 33,310 | | | € | — | | | € | 85,185 | |
| Pension and other post-retirement benefit obligations | | | 567 | | | | — | | | | — | | | | 567 | |
| Debt | | | 2,115 | | | | 13,917 | | | | — | | | | 16,032 | |
| | | | | | | | | | | | | | | | | |
| Total current liabilities | | | 54,557 | | | | 47,227 | | | | — | | | | 101,784 | |
| Long-term liabilities | | | | | | | | | | | | | | | | |
| Debt | | | 276,604 | | | | 536,538 | | | | — | | | | 813,142 | |
| Due to restricted group | | | — | | | | 72,553 | | | | (72,553 | ) | | | — | |
| Unrealized interest rate derivative losses | | | — | | | | 52,873 | | | | — | | | | 52,873 | |
| Pension and other post-retirement benefit obligations | | | 17,902 | | | | — | | | | — | | | | 17,902 | |
| Capital leases and other | | | 6,667 | | | | 5,490 | | | | — | | | | 12,157 | |
| | | | | | | | | | | | | | | | | |
| Total liabilities | | | 355,730 | | | | 714,681 | | | | (72,553 | ) | | | 997,858 | |
| | | | | | | | | | | | | | | | | |
EQUITY | | | | | | | | | | | | | | | | |
| Total shareholders’ equity (deficit) | | | 200,247 | | | | (77,025 | ) | | | — | | | | 123,222 | |
| Noncontrolling interest (deficit) | | | — | | | | (37,249 | ) | | | — | | | | (37,249 | ) |
| | | | | | | | | | | | | | | | | |
| Total liabilities and equity | | € | 555,977 | | | € | 600,407 | | | € | (72,553 | ) | | € | 1,083,831 | |
| | | | | | | | | | | | | | | | | |
105
| | | | | | | | | | | | | | | | |
| | | December 31, 2012 | |
| | | Restricted
Group | | | Unrestricted
Subsidiaries | | | Eliminations | | | Consolidated
Group | |
ASSETS | | | | | | | | | | | | | | | | |
Current assets | | | | | | | | | | | | | | | | |
Cash and cash equivalents | | $ | 48,407 | | | $ | 89,032 | | | $ | — | | | $ | 137,439 | |
Receivables | | | 80,708 | | | | 64,442 | | | | — | | | | 145,150 | |
Inventories | | | 98,606 | | | | 57,373 | | | | — | | | | 155,979 | |
Prepaid expenses and other | | | 7,661 | | | | 2,764 | | | | — | | | | 10,425 | |
Deferred income tax | | | 2,885 | | | | 3,002 | | | | — | | | | 5,887 | |
| | | | | | | | | | | | | | | | |
Total current assets | | | 238,267 | | | | 216,613 | | | | — | | | | 454,880 | |
Long-term assets | | | | | | | | | | | | | | | | |
Property, plant and equipment | | | 455,293 | | | | 611,213 | | | | — | | | | 1,066,506 | |
Deferred note issuance costs and other | | | 8,712 | | | | 7,324 | | | | — | | | | 16,036 | |
Deferred income tax | | | 12,102 | | | | 11,057 | | | | — | | | | 23,159 | |
Due from unrestricted group | | | 134,897 | | | | — | | | | (134,897 | ) | | | — | |
| | | | | | | | | | | | | | | | |
Total assets | | $ | 849,271 | | | $ | 846,207 | | | $ | (134,897 | ) | | $ | 1,560,581 | |
| | | | | | | | | | | | | | | | |
LIABILITIES | | | | | | | | | | | | | | | | |
Current liabilities | | | | | | | | | | | | | | | | |
Accounts payable and other | | $ | 55,517 | | | $ | 63,082 | | | $ | — | | | $ | 118,599 | |
Pension and other post-retirement benefit obligations | | | 1,072 | | | | — | | | | — | | | | 1,072 | |
Debt | | | 7,465 | | | | 52,740 | | | | — | | | | 60,205 | |
| | | | | | | | | | | | | | | | |
Total current liabilities | | | 64,054 | | | | 115,822 | | | | — | | | | 179,876 | |
Long-term liabilities | | | | | | | | | | | | | | | | |
Debt | | | 285,079 | | | | 592,701 | | | | — | | | | 877,780 | |
Due to restricted group | | | — | | | | 134,897 | | | | (134,897 | ) | | | — | |
Interest rate derivative liability | | | — | | | | 66,819 | | | | — | | | | 66,819 | |
Pension and other post-retirement benefit obligations | | | 42,378 | | | | — | | | | — | | | | 42,378 | |
Capital leases and other | | | 8,008 | | | | 10,367 | | | | — | | | | 18,375 | |
Deferred income tax | | | 7,591 | | | | — | | | | — | | | | 7,591 | |
| | | | | | | | | | | | | | | | |
Total liabilities | | | 407,110 | | | | 920,606 | | | | (134,897 | ) | | | 1,192,819 | |
| | | | | | | | | | | | | | | | |
EQUITY | | | | | | | | | | | | | | | | |
Total shareholders’ equity (deficit) | | | 442,161 | | | | (53,057 | ) | | | — | | | | 389,104 | |
Noncontrolling interest (deficit) | | | — | | | | (21,342 | ) | | | — | | | | (21,342 | ) |
| | | | | | | | | | | | | | | | |
Total liabilities and equity | | $ | 849,271 | | | $ | 846,207 | | | $ | (134,897 | ) | | $ | 1,560,581 | |
| | | | | | | | | | | | | | | | |
MERCER INTERNATIONAL INC.
NOTES TO THE CONSOLIDATED FINANCIAL STATEMENTS
(In thousands of Euros,U.S. dollars, except per share data)
| |
Note 19. | Restricted Group Supplemental Disclosure — (Continued) |
Note 21. Restricted Group Supplemental Disclosure (continued)
Combined Condensed Statements of Operations
| | | | | | | | | | | | | | | | | |
| | | Year Ended December 31, 2010 | |
| | | Restricted
| | | Unrestricted
| | | | | | Consolidated
| |
| | | Group | | | Subsidiaries | | | Eliminations | | | Group | |
| |
| Revenues | | | | | | | | | | | | | | | | |
| Pulp | | € | 490,020 | | | € | 366,291 | | | € | — | | | € | 856,311 | |
| Energy | | | 15,145 | | | | 29,080 | | | | — | | | | 44,225 | |
| | | | | | | | | | | | | | | | | |
| | | | 505,165 | | | | 395,371 | | | | — | | | | 900,536 | |
| | | | | | | | | | | | | | | | | |
| Operating costs | | | 361,272 | | | | 282,257 | | | | — | | | | 643,529 | |
| Operating depreciation and amortization | | | 29,971 | | | | 25,961 | | | | — | | | | 55,932 | |
| Selling, general and administrative expenses and other | | | 20,231 | | | | 13,101 | | | | — | | | | 33,332 | |
| | | | | | | | | | | | | | | | | |
| | | | 411,474 | | | | 321,319 | | | | — | | | | 732,793 | |
| | | | | | | | | | | | | | | | | |
| Operating income (loss) | | | 93,691 | | | | 74,052 | | | | — | | | | 167,743 | |
| | | | | | | | | | | | | | | | | |
| Other income (expense) | | | | | | | | | | | | | | | | |
| Interest expense | | | (31,498 | ) | | | (40,852 | ) | | | 4,729 | | | | (67,621 | ) |
| Investment income (loss) | | | 5,103 | | | | 94 | | | | (4,729 | ) | | | 468 | |
| Foreign exchange gain (loss) on debt | | | (6,126 | ) | | | — | | | | — | | | | (6,126 | ) |
| Gain (loss) on extinguishment of debt | | | (7,494 | ) | | | — | | | | — | | | | (7,494 | ) |
| Gain (loss) on derivative instruments | | | — | | | | 1,899 | | | | — | | | | 1,899 | |
| | | | | | | | | | | | | | | | | |
| Total other income (expense) | | | (40,015 | ) | | | (38,859 | ) | | | — | | | | (78,874 | ) |
| | | | | | | | | | | | | | | | | |
| Income (loss) before income taxes | | | 53,676 | | | | 35,193 | | | | — | | | | 88,869 | |
| Income tax benefit (provision) | | | 8,651 | | | | (2,772 | ) | | | — | | | | 5,879 | |
| | | | | | | | | | | | | | | | | |
| Net income (loss) | | | 62,327 | | | | 32,421 | | | | — | | | | 94,748 | |
| Less: net (income) loss attributable to noncontrolling interest | | | — | | | | (8,469 | ) | | | — | | | | (8,469 | ) |
| | | | | | | | | | | | | | | | | |
| Net income (loss) attributable to common shareholders | | € | 62,327 | | | € | 23,952 | | | € | — | | | € | 86,279 | |
| | | | | | | | | | | | | | | | | |
106
| | | | | | | | | | | | | | | | |
| | | Year Ended December 31, 2013 | |
| | | Restricted
Group | | | Unrestricted
Subsidiaries | | | Eliminations | | | Consolidated
Group | |
Revenues | | | | | | | | | | | | | | | | |
Pulp | | $ | 561,350 | | | $ | 434,837 | | | $ | — | | | $ | 996,187 | |
Energy and chemicals | | | 33,783 | | | | 58,415 | | | | — | | | | 92,198 | |
| | | | | | | | | | | | | | | | |
| | | 595,133 | | | | 493,252 | | | | — | | | | 1,088,385 | |
Operating costs | | | 498,952 | | | | 421,880 | | | | — | | | | 920,832 | |
Operating depreciation and amortization | | | 43,498 | | | | 34,811 | | | | — | | | | 78,309 | |
Selling, general and administrative expenses | | | 31,943 | | | | 19,226 | | | | — | | | | 51,169 | |
Restructuring expenses | | | 5,029 | | | | 1,386 | | | | — | | | | 6,415 | |
| | | | | | | | | | | | | | | | |
| | | 579,422 | | | | 477,303 | | | | — | | | | 1,056,725 | |
| | | | | | | | | | | | | | | | |
Operating income | | | 15,711 | | | | 15,949 | | | | — | | | | 31,660 | |
| | | | | | | | | | | | | | | | |
Other income (expense) | | | | | | | | | | | | | | | | |
Interest expense | | | (32,321 | ) | | | (45,011 | ) | | | 8,176 | | | | (69,156 | ) |
Gain (loss) on derivative instruments | | | (2,767 | ) | | | 22,476 | | | | — | | | | 19,709 | |
Other income (expense) | | | 9,217 | | | | 174 | | | | (8,176 | ) | | | 1,215 | |
| | | | | | | | | | | | | | | | |
Total other income (expense) | | | (25,871 | ) | | | (22,361 | ) | | | — | | | | (48,232 | ) |
| | | | | | | | | | | | | | | | |
Income (loss) before income taxes | | | (10,160 | ) | | | (6,412 | ) | | | — | | | | (16,572 | ) |
Income tax benefit (provision) | | | (9,365 | ) | | | 169 | | | | — | | | | (9,196 | ) |
| | | | | | | | | | | | | | | | |
Net income (loss) | | | (19,525 | ) | | | (6,243 | ) | | | — | | | | (25,768 | ) |
Less: net income attributable to noncontrolling interest | | | — | | | | (607 | ) | | | — | | | | (607 | ) |
| | | | | | | | | | | | | | | | |
Net income (loss) attributable to common shareholders | | $ | (19,525 | ) | | $ | (6,850 | ) | | $ | — | | | $ | (26,375 | ) |
| | | | | | | | | | | | | | | | |
MERCER INTERNATIONAL INC.
NOTES TO THE CONSOLIDATED FINANCIAL STATEMENTS
(In thousands of Euros,U.S. dollars, except per share data)
| |
Note 19. | Restricted Group Supplemental Disclosure — (Continued) |
Note 21. Restricted Group Supplemental Disclosure (continued)
Combined Condensed Statements of Operations
| | | | | | | | | | | | | | | | | |
| | | Year Ended December 31, 2009 | |
| | | Restricted
| | | Unrestricted
| | | | | | Consolidated
| |
| | | Group | | | Subsidiaries | | | Eliminations | | | Group | |
| |
| Revenues | | | | | | | | | | | | | | | | |
| Pulp | | € | 318,448 | | | € | 258,850 | | | € | — | | | € | 577,298 | |
| Energy | | | 15,183 | | | | 27,318 | | | | — | | | | 42,501 | |
| | | | | | | | | | | | | | | | | |
| | | | 333,631 | | | | 286,168 | | | | — | | | | 619,799 | |
| | | | | | | | | | | | | | | | | |
| Operating costs | | | 312,029 | | | | 239,752 | | | | — | | | | 551,781 | |
| Operating depreciation and amortization | | | 27,453 | | | | 26,466 | | | | — | | | | 53,919 | |
| Selling, general and administrative expenses and other | | | 15,049 | | | | 11,849 | | | | — | | | | 26,898 | |
| | | | | | | | | | | | | | | | | |
| | | | 354,531 | | | | 278,067 | | | | — | | | | 632,598 | |
| | | | | | | | | | | | | | | | | |
| Operating income (loss) | | | (20,900 | ) | | | 8,101 | | | | — | | | | (12,799 | ) |
| | | | | | | | | | | | | | | | | |
| Other income (expense) | | | | | | | | | | | | | | | | |
| Interest expense | | | (27,351 | ) | | | (41,932 | ) | | | 4,513 | | | | (64,770 | ) |
| Investment income (loss) | | | 5,002 | | | | (2,293 | ) | | | (4,513 | ) | | | (1,804 | ) |
| Foreign exchange gain (loss) on debt | | | 2,692 | | | | — | | | | — | | | | 2,692 | |
| Gain (loss) on extinguishment of debt | | | 4,447 | | | | — | | | | — | | | | 4,447 | |
| Gain (loss) on derivative instruments | | | — | | | | (5,760 | ) | | | — | | | | (5,760 | ) |
| | | | | | | | | | | | | | | | | |
| Total other income (expense) | | | (15,210 | ) | | | (49,985 | ) | | | — | | | | (65,195 | ) |
| | | | | | | | | | | | | | | | | |
| Income (loss) before income taxes | | | (36,110 | ) | | | (41,884 | ) | | | — | | | | (77,994 | ) |
| Income tax benefit (provision) | | | 183 | | | | 5,686 | | | | — | | | | 5,869 | |
| | | | | | | | | | | | | | | | | |
| Net income (loss) | | | (35,927 | ) | | | (36,198 | ) | | | — | | | | (72,125 | ) |
| Less: net (income) loss attributable to noncontrolling interest | | | — | | | | 9,936 | | | | — | | | | 9,936 | |
| | | | | | | | | | | | | | | | | |
| Net income (loss) attributable to common shareholders | | € | (35,927 | ) | | € | (26,262 | ) | | € | — | | | € | (62,189 | ) |
| | | | | | | | | | | | | | | | | |
107
| | | | | | | | | | | | | | | | |
| | | Year Ended December 31, 2012 | |
| | | Restricted
Group | | | Unrestricted
Subsidiaries | | | Eliminations | | | Consolidated
Group | |
Revenues | | | | | | | | | | | | | | | | |
Pulp | | $ | 545,205 | | | $ | 434,565 | | | $ | — | | | $ | 979,770 | |
Energy and chemicals | | | 36,638 | | | | 56,328 | | | | — | | | | 92,966 | |
| | | | | | | | | | | | | | | | |
| | | 581,843 | | | | 490,893 | | | | — | | | | 1,072,736 | |
Operating costs | | | 500,223 | | | | 385,921 | | | | — | | | | 886,144 | |
Operating depreciation and amortization | | | 40,118 | | | | 34,184 | | | | — | | | | 74,302 | |
Selling, general and administrative expenses | | | 31,688 | | | | 17,580 | | | | — | | | | 49,268 | |
| | | | | | | | | | | | | | | | |
| | | 572,029 | | | | 437,685 | | | | — | | | | 1,009,714 | |
| | | | | | | | | | | | | | | | |
Operating income | | | 9,814 | | | | 53,208 | | | | — | | | | 63,022 | |
| | | | | | | | | | | | | | | | |
Other income (expense) | | | | | | | | | | | | | | | | |
Interest expense | | | (30,125 | ) | | | (48,934 | ) | | | 7,292 | | | | (71,767 | ) |
Gain (loss) on derivative instruments | | | 2,609 | | | | 2,203 | | | | — | | | | 4,812 | |
Other income (expense) | | | 6,465 | | | | 648 | | | | (7,292 | ) | | | (179 | ) |
| | | | | | | | | | | | | | | | |
Total other income (expense) | | | (21,051 | ) | | | (46,083 | ) | | | — | | | | (67,134 | ) |
| | | | | | | | | | | | | | | | |
Income (loss) before income taxes | | | (11,237 | ) | | | 7,125 | | | | — | | | | (4,112 | ) |
Income tax benefit (provision) | | | (7,050 | ) | | | (2,329 | ) | | | — | | | | (9,379 | ) |
| | | | | | | | | | | | | | | | |
Net income (loss) | | | (18,287 | ) | | | 4,796 | | | | — | | | | (13,491 | ) |
Less: net income attributable to noncontrolling interest | | | — | | | | (2,179 | ) | | | — | | | | (2,179 | ) |
| | | | | | | | | | | | | | | | |
Net income (loss) attributable to common shareholders | | $ | (18,287 | ) | | $ | 2,617 | | | $ | — | | | $ | (15,670 | ) |
| | | | | | | | | | | | | | | | |
MERCER INTERNATIONAL INC.
NOTES TO THE CONSOLIDATED FINANCIAL STATEMENTS
(In thousands of Euros,U.S. dollars, except per share data)
| |
Note 19. | Restricted Group Supplemental Disclosure — (Continued) |
Note 21. Restricted Group Supplemental Disclosure (continued)
Combined Condensed Statements of Operations
| | | | | | | | | | | | | | | | | |
| | | Year Ended December 31, 2008 | |
| | | Restricted
| | | Unrestricted
| | | | | | Consolidated
| |
| | | Group | | | Subsidiaries | | | Eliminations | | | Group | |
| |
| Revenues | | | | | | | | | | | | | | | | |
| Pulp | | € | 400,969 | | | € | 288,351 | | | € | — | | | € | 689,320 | |
| Energy | | | 12,119 | | | | 18,852 | | | | — | | | | 30,971 | |
| | | | | | | | | | | | | | | | | |
| | | | 413,088 | | | | 307,203 | | | | — | | | | 720,291 | |
| | | | | | | | | | | | | | | | | |
| Operating costs | | | 369,923 | | | | 257,010 | | | | — | | | | 626,933 | |
| Operating depreciation and amortization | | | 28,589 | | | | 26,895 | | | | — | | | | 55,484 | |
| Selling, general and administrative expenses and other | | | 16,973 | | | | 7,572 | | | | — | | | | 24,545 | |
| | | | | | | | | | | | | | | | | |
| | | | 415,485 | | | | 291,477 | | | | — | | | | 706,962 | |
| | | | | | | | | | | | | | | | | |
| Operating income (loss) | | | (2,397 | ) | | | 15,726 | | | | — | | | | 13,329 | |
| | | | | | | | | | | | | | | | | |
| Other income (expense) | | | | | | | | | | | | | | | | |
| Interest expense | | | (27,027 | ) | | | (43,117 | ) | | | 4,388 | | | | (65,756 | ) |
| Investment income (loss) | | | 6,834 | | | | (3,620 | ) | | | (4,388 | ) | | | (1,174 | ) |
| Foreign exchange gain (loss) on debt | | | (4,114 | ) | | | (120 | ) | | | — | | | | (4,234 | ) |
| Gain (loss) on derivative instruments | | | — | | | | (25,228 | ) | | | — | | | | (25,228 | ) |
| | | | | | | | | | | | | | | | | |
| Total other income (expense) | | | (24,307 | ) | | | (72,085 | ) | | | — | | | | (96,392 | ) |
| | | | | | | | | | | | | | | | | |
| Income (loss) before income taxes | | | (26,704 | ) | | | (56,359 | ) | | | — | | | | (83,063 | ) |
| Income tax benefit (provision) | | | (3,728 | ) | | | 1,251 | | | | — | | | | (2,477 | ) |
| | | | | | | | | | | | | | | | | |
| Net income (loss) | | | (30,432 | ) | | | (55,108 | ) | | | — | | | | (85,540 | ) |
| Less: net (income) loss attributable to noncontrolling interest | | | — | | | | 13,075 | | | | — | | | | 13,075 | |
| | | | | | | | | | | | | | | | | |
| Net income (loss) attributable to common shareholders | | € | (30,432 | ) | | € | (42,033 | ) | | € | — | | | € | (72,465 | ) |
| | | | | | | | | | | | | | | | | |
108
| | | | | | | | | | | | | | | | |
| | | Year Ended December 31, 2011 | |
| | | Restricted
Group | | | Unrestricted
Subsidiaries | | | Eliminations | | | Consolidated
Group | |
Revenues | | | | | | | | | | | | | | | | |
Pulp | | $ | 659,741 | | | $ | 497,465 | | | $ | — | | | $ | 1,157,206 | |
Energy and chemicals | | | 35,455 | | | | 59,303 | | | | — | | | | 94,758 | |
| | | | | | | | | | | | | | | | |
| | | 695,196 | | | | 556,768 | | | | — | | | | 1,251,964 | |
Operating costs | | | 532,471 | | | | 433,252 | | | | — | | | | 965,723 | |
Operating depreciation and amortization | | | 41,535 | | | | 36,076 | | | | — | | | | 77,611 | |
Selling, general and administrative expenses | | | 33,581 | | | | 20,384 | | | | — | | | | 53,965 | |
| | | | | | | | | | | | | | | | |
| | | 607,587 | | | | 489,712 | | | | — | | | | 1,097,299 | |
| | | | | | | | | | | | | | | | |
Operating income | | | 87,609 | | | | 67,056 | | | | — | | | | 154,665 | |
| | | | | | | | | | | | | | | | |
Other income (expense) | | | | | | | | | | | | | | | | |
Interest expense | | | (34,639 | ) | | | (54,386 | ) | | | 6,911 | | | | (82,114 | ) |
Gain (loss) on derivative instruments | | | — | | | | (1,974 | ) | | | — | | | | (1,974 | ) |
Other income (expense) | | | 8,860 | | | | 1,676 | | | | (6,911 | ) | | | 3,625 | |
| | | | | | | | | | | | | | | | |
Total other income (expense) | | | (25,779 | ) | | | (54,684 | ) | | | — | | | | (80,463 | ) |
| | | | | | | | | | | | | | | | |
Income (loss) before income taxes | | | 61,830 | | | | 12,372 | | | | — | | | | 74,202 | |
Income tax benefit (provision) | | | (6,422 | ) | | | 7,390 | | | | — | | | | 968 | |
| | | | | | | | | | | | | | | | |
Net income (loss) | | | 55,408 | | | | 19,762 | | | | — | | | | 75,170 | |
Less: net income attributable to noncontrolling interest | | | — | | | | (5,471 | ) | | | — | | | | (5,471 | ) |
| | | | | | | | | | | | | | | | |
Net income (loss) attributable to common shareholders | | $ | 55,408 | | | $ | 14,291 | | | $ | — | | | $ | 69,699 | |
| | | | | | | | | | | | | | | | |
MERCER INTERNATIONAL INC.
NOTES TO THE CONSOLIDATED FINANCIAL STATEMENTS
(In thousands of Euros,U.S. dollars, except per share data)
| |
Note 19. | Restricted Group Supplemental Disclosure — (Continued) |
Note 21. Restricted Group Supplemental Disclosure (continued)
Combined Condensed Statements of Cash Flows
| | | | | | | | | | | | | |
| | | Year Ended December 31, 2010 | |
| | | Restricted
| | | Unrestricted
| | | Consolidated
| |
| | | Group | | | Group | | | Group | |
| |
| Cash flows from (used in) operating activities | | | | | | | | | | | | |
| Net income (loss) attributable to common shareholders | | € | 62,327 | | | € | 23,952 | | | € | 86,279 | |
| Adjustments to reconcile net income (loss) attributable to common shareholders to cash flows from operating activities | | | | | | | | | | | | |
| Loss (gain) on derivative instruments | | | — | | | | (1,899 | ) | | | (1,899 | ) |
| Foreign exchange (gain) loss on debt | | | 6,126 | | | | — | | | | 6,126 | |
| Loss (gain) on extinguishment of debt | | | 7,494 | | | | — | | | | 7,494 | |
| Depreciation and amortization | | | 30,270 | | | | 25,961 | | | | 56,231 | |
| Accretion expense (income) | | | 2,492 | | | | — | | | | 2,492 | |
| Noncontrolling interest | | | — | | | | 8,469 | | | | 8,469 | |
| Deferred income taxes | | | (9,760 | ) | | | — | | | | (9,760 | ) |
| Stock compensation expense | | | 2,394 | | | | — | | | | 2,394 | |
| Pension and other post-retirement expense, net of funding | | | 418 | | | | — | | | | 418 | |
| Other | | | 2,519 | | | | 2,671 | | | | 5,190 | |
| Changes in current assets and liabilities | | | | | | | | | | | | |
| Receivables | | | (25,913 | ) | | | (14,125 | ) | | | (40,038 | ) |
| Inventories | | | (2,885 | ) | | | (21,577 | ) | | | (24,462 | ) |
| Accounts payable and accrued expenses | | | (10,304 | ) | | | 7,215 | | | | (3,089 | ) |
| Other(1) | | | (10,597 | ) | | | 6,031 | | | | (4,566 | ) |
| | | | | | | | | | | | | |
| Net cash from (used in) operating activities | | | 54,581 | | | | 36,698 | | | | 91,279 | |
| Cash flows from (used in) investing activities | | | | | | | | | | | | |
| Purchase of property, plant and equipment | | | (34,675 | ) | | | (3,625 | ) | | | (38,300 | ) |
| Proceeds on sale of property, plant and equipment | | | 251 | | | | 887 | | | | 1,138 | |
| Cash, restricted | | | — | | | | — | | | | — | |
| Note receivable | | | 1,113 | | | | — | | | | 1,113 | |
| | | | | | | | | | | | | |
| Net cash from (used in) investing activities | | | (33,311 | ) | | | (2,738 | ) | | | (36,049 | ) |
| Cash flows from (used in) financing activities | | | | | | | | | | | | |
| Repayment of notes payable and debt | | | (220,681 | ) | | | (13,917 | ) | | | (234,598 | ) |
| Repayment of capital lease obligations | | | (589 | ) | | | (2,331 | ) | | | (2,920 | ) |
| Proceeds from borrowings of notes payable and debt | | | 222,193 | | | | — | | | | 222,193 | |
| Proceeds from (repayment of) credit facilities, net | | | (2,660 | ) | | | — | | | | (2,660 | ) |
| Proceeds from government grants | | | 17,952 | | | | — | | | | 17,952 | |
| Payment of deferred note issuance costs | | | (6,095 | ) | | | — | | | | (6,095 | ) |
| | | | | | | | | | | | | |
| Net cash from (used in) financing activities | | | 10,120 | | | | (16,248 | ) | | | (6,128 | ) |
| Effect of exchange rate changes on cash and cash equivalents | | | (1,371 | ) | | | — | | | | (1,371 | ) |
| | | | | | | | | | | | | |
| Net increase (decrease) in cash and cash equivalents | | | 30,019 | | | | 17,712 | | | | 47,731 | |
| Cash and cash equivalents, beginning of period | | | 20,635 | | | | 30,656 | | | | 51,291 | |
| | | | | | | | | | | | | |
| Cash and cash equivalents, end of period | | € | 50,654 | | | € | 48,368 | | | € | 99,022 | |
| | | | | | | | | | | | | |
| | | | | | | | | | | | |
| | | Year Ended December 31, 2013 | |
| | | Restricted
Group | | | Unrestricted
Subsidiaries | | | Consolidated
Group | |
Cash flows from (used in) operating activities | | | | | | | | | | | | |
Net income (loss) | | $ | (19,525 | ) | | $ | (6,243 | ) | | $ | (25,768 | ) |
Adjustments to reconcile net income (loss) to cash flows from operating activities | | | | | | | | | | | | |
Unrealized loss (gain) on derivative instruments | | | 982 | | | | (22,476 | ) | | | (21,494 | ) |
Depreciation and amortization | | | 43,833 | | | | 34,812 | | | | 78,645 | |
Deferred income taxes | | | 7,263 | | | | 4,219 | | | | 11,482 | |
Stock compensation expense | | | 3,574 | | | | — | | | | 3,574 | |
Pension and other post-retirement expense, net of funding | | | 648 | | | | — | | | | 648 | |
Other | | | (360 | ) | | | 3,529 | | | | 3,169 | |
Changes in working capital | | | | | | | | | | | | |
Receivables | | | 4,780 | | | | 9,213 | | | | 13,993 | |
Inventories | | | 1,965 | | | | (16,528 | ) | | | (14,563 | ) |
Accounts payable and accrued expenses | | | (6,026 | ) | | | (5,543 | ) | | | (11,569 | ) |
Other(1) | | | (13,621 | ) | | | 11,829 | | | | (1,792 | ) |
| | | | | | | | | | | | |
Net cash from (used in) operating activities | | | 23,513 | | | | 12,812 | | | | 36,325 | |
| | | | | | | | | | | | |
Cash flows from (used in) investing activities | | | | | | | | | | | | |
Purchase of property, plant and equipment | | | (13,183 | ) | | | (32,524 | ) | | | (45,707 | ) |
Acquisition of noncontrolling interest (Note 15) | | | (20,000 | ) | | | 20,000 | | | | — | |
Proceeds on sale of property, plant and equipment | | | 581 | | | | 158 | | | | 739 | |
| | | | | | | | | | | | |
Net cash from (used in) investing activities | | | (32,602 | ) | | | (12,366 | ) | | | (44,968 | ) |
| | | | | | | | | | | | |
Cash flows from (used in) financing activities | | | | | | | | | | | | |
Repayment of debt and purchase of notes | | | (1,459 | ) | | | (54,957 | ) | | | (56,416 | ) |
Proceeds from issuance of notes and borrowings of debt | | | 52,250 | | | | 22,222 | | | | 74,472 | |
Repayment of capital lease obligations | | | (725 | ) | | | (1,868 | ) | | | (2,593 | ) |
Proceeds from (repayment of) credit facilities, net | | | (5,640 | ) | | | — | | | | (5,640 | ) |
Payment of note issuance costs | | | (1,829 | ) | | | (2,026 | ) | | | (3,855 | ) |
Proceeds from government grants | | | — | | | | 9,265 | | | | 9,265 | |
| | | | | | | | | | | | |
Net cash from (used in) financing activities | | | 42,597 | | | | (27,364 | ) | | | 15,233 | |
| | | | | | | | | | | | |
Effect of exchange rate changes on cash and cash equivalents | | | 995 | | | | 2,704 | | | | 3,699 | |
| | | | | | | | | | | | |
Net increase (decrease) in cash and cash equivalents | | | 34,503 | | | | (24,214 | ) | | | 10,289 | |
Cash and cash equivalents, beginning of year | | | 48,407 | | | | 89,032 | | | | 137,439 | |
| | | | | | | | | | | | |
Cash and cash equivalents, end of year | | $ | 82,910 | | | $ | 64,818 | | | $ | 147,728 | |
| | | | | | | | | | | | |
| | |
| (1) | | Includes intercompany working capital related transactions. |
109
MERCER INTERNATIONAL INC.
NOTES TO THE CONSOLIDATED FINANCIAL STATEMENTS
(In thousands of Euros,U.S. dollars, except per share data)
| |
Note 19. | Restricted Group Supplemental Disclosure — (Continued) |
Note 21. Restricted Group Supplemental Disclosure (continued)
Combined Condensed Statements of Cash Flows
| | | | | | | | | | | | | |
| | | Year Ended December 31, 2009 | |
| | | Restricted
| | | Unrestricted
| | | Consolidated
| |
| | | Group | | | Group | | | Group | |
| |
| Cash flows from (used in) operating activities | | | | | | | | | | | | |
| Net income (loss) attributable to common shareholders | | € | (35,927 | ) | | € | (26,262 | ) | | € | (62,189 | ) |
| Adjustments to reconcile net income (loss) attributable to common shareholders to cash flows from operating activities | | | | | | | | | | | | |
| Loss (gain) on derivative instruments | | | — | | | | 5,760 | | | | 5,760 | |
| Foreign exchange (gain) loss on debt | | | (2,692 | ) | | | — | | | | (2,692 | ) |
| Loss (gain) on extinguishment of debt | | | (4,447 | ) | | | — | | | | (4,447 | ) |
| Depreciation and amortization | | | 27,704 | | | | 26,466 | | | | 54,170 | |
| Accretion expense (income) | | | 181 | | | | — | | | | 181 | |
| Noncontrolling interest | | | — | | | | (9,936 | ) | | | (9,936 | ) |
| Deferred income taxes | | | (176 | ) | | | (5,827 | ) | | | (6,003 | ) |
| Stock compensation expense | | | 455 | | | | — | | | | 455 | |
| Pension and other post-retirement expense, net of funding | | | 282 | | | | — | | | | 282 | |
| Other | | | 934 | | | | 1,548 | | | | 2,482 | |
| Changes in current assets and liabilities | | | | | | | | | | | | |
| Receivables | | | 26,140 | | | | 5,767 | | | | 31,907 | |
| Inventories | | | 13,234 | | | | 18,924 | | | | 32,158 | |
| Accounts payable and accrued expenses | | | 5,839 | | | | (8,789 | ) | | | (2,950 | ) |
| Other(1) | | | (18,265 | ) | | | 16,406 | | | | (1,859 | ) |
| | | | | | | | | | | | | |
| Net cash from (used in) operating activities | | | 13,262 | | | | 24,057 | | | | 37,319 | |
| Cash flows from (used in) investing activities | | | | | | | | | | | | |
| Purchase of property, plant and equipment | | | (26,839 | ) | | | (1,989 | ) | | | (28,828 | ) |
| Proceeds on sale of property, plant and equipment | | | 158 | | | | 278 | | | | 436 | |
| Cash, restricted | | | — | | | | 13,000 | | | | 13,000 | |
| Note receivable | | | 152 | | | | — | | | | 152 | |
| | | | | | | | | | | | | |
| Net cash from (used in) investing activities | | | (26,529 | ) | | | 11,289 | | | | (15,240 | ) |
| Cash flows from (used in) financing activities | | | | | | | | | | | | |
| Repayment of notes payable and debt | | | (10,000 | ) | | | (16,499 | ) | | | (26,499 | ) |
| Repayment of capital lease obligations | | | (680 | ) | | | (2,498 | ) | | | (3,178 | ) |
| Proceeds from borrowings of notes payable and debt | | | 13,511 | | | | — | | | | 13,511 | |
| Proceeds from (repayment of) credit facilities, net | | | (4,272 | ) | | | — | | | | (4,272 | ) |
| Proceeds from government investment grants | | | 9,058 | | | | — | | | | 9,058 | |
| Payment of deferred note issuance costs | | | — | | | | (1,969 | ) | | | (1,969 | ) |
| | | | | | | | | | | | | |
| Net cash from (used in) financing activities | | | 7,617 | | | | (20,966 | ) | | | (13,349 | ) |
| Effect of exchange rate changes on cash and cash equivalents | | | 109 | | | | — | | | | 109 | |
| | | | | | | | | | | | | |
| Net increase (decrease) in cash and cash equivalents | | | (5,541 | ) | | | 14,380 | | | | 8,839 | |
| Cash and cash equivalents, beginning of period | | | 26,176 | | | | 16,276 | | | | 42,452 | |
| | | | | | | | | | | | | |
| Cash and cash equivalents, end of period | | € | 20,635 | | | € | 30,656 | | | € | 51,291 | |
| | | | | | | | | | | | | |
| | | | | | | | | | | | |
| | | Year Ended December 31, 2012 | |
| | | Restricted
Group | | | Unrestricted
Subsidiaries | | | Consolidated
Group | |
Cash flows from (used in) operating activities | | | | | | | | | | | | |
Net income (loss) | | $ | (18,287 | ) | | $ | 4,796 | | | $ | (13,491 | ) |
Adjustments to reconcile net income (loss) to cash flows from operating activities | | | | | | | | | | | | |
Unrealized loss (gain) on derivative instruments | | | (983 | ) | | | (2,203 | ) | | | (3,186 | ) |
Depreciation and amortization | | | 40,474 | | | | 34,183 | | | | 74,657 | |
Deferred income taxes | | | 6,660 | | | | (6,812 | ) | | | (152 | ) |
Stock compensation expense | | | 2,616 | | | | — | | | | 2,616 | |
Pension and other post-retirement expense, net of funding | | | 365 | | | | — | | | | 365 | |
Other | | | 1,574 | | | | 3,417 | | | | 4,991 | |
Changes in working capital | | | | | | | | | | | | |
Receivables | | | (755 | ) | | | 11,550 | | | | 10,795 | |
Inventories | | | (5,132 | ) | | | 6,858 | | | | 1,726 | |
Accounts payable and accrued expenses | | | (9,576 | ) | | | (8,416 | ) | | | (17,992 | ) |
Other(1) | �� | | (20,292 | ) | | | 19,078 | | | | (1,214 | ) |
| | | | | | | | | | | | |
Net cash from (used in) operating activities | | | (3,336 | ) | | | 62,451 | | | | 59,115 | |
| | | | | | | | | | | | |
Cash flows from (used in) investing activities | | | | | | | | | | | | |
Purchase of property, plant and equipment | | | (28,213 | ) | | | (18,990 | ) | | | (47,203 | ) |
Proceeds on sale of property, plant and equipment | | | 470 | | | | 370 | | | | 840 | |
Proceeds on maturity of marketable securities | | | 15,753 | | | | — | | | | 15,753 | |
| | | | | | | | | | | | |
Net cash from (used in) investing activities | | | (11,990 | ) | | | (18,620 | ) | | | (30,610 | ) |
| | | | | | | | | | | | |
Cash flows from (used in) financing activities | | | | | | | | | | | | |
Repayment of debt and purchase of notes | | | (3,378 | ) | | | (32,062 | ) | | | (35,440 | ) |
Repayment of capital lease obligations | | | (945 | ) | | | (1,788 | ) | | | (2,733 | ) |
Proceeds from (repayment of) credit facilities, net | | | 6,031 | | | | — | | | | 6,031 | |
Payment of note issuance costs | | | (409 | ) | | | (2,161 | ) | | | (2,570 | ) |
Proceeds from government grants | | | 4,061 | | | | 984 | | | | 5,045 | |
| | | | | | | | | | | | |
Net cash from (used in) financing activities | | | 5,360 | | | | (35,027 | ) | | | (29,667 | ) |
| | | | | | | | | | | | |
Effect of exchange rate changes on cash and cash equivalents | | | 221 | | | | 2,081 | | | | 2,302 | |
| | | | | | | | | | | | |
Net increase (decrease) in cash and cash equivalents | | | (9,745 | ) | | | 10,885 | | | | 1,140 | |
Cash and cash equivalents, beginning of year | | | 58,152 | | | | 78,147 | | | | 136,299 | |
| | | | | | | | | | | | |
Cash and cash equivalents, end of year | | $ | 48,407 | | | $ | 89,032 | | | $ | 137,439 | |
| | | | | | | | | | | | |
| | |
| (1) | | Includes intercompany working capital related transactions. |
110
MERCER INTERNATIONAL INC.
NOTES TO THE CONSOLIDATED FINANCIAL STATEMENTS
(In thousands of Euros,U.S. dollars, except per share data)
| |
Note 19. | Restricted Group Supplemental Disclosure — (Continued) |
Note 21. Restricted Group Supplemental Disclosure (continued)
Combined Condensed StatementStatements of Cash Flows
| | | | | | | | | | | | | |
| | | Year Ended December 31, 2008 | |
| | | Restricted
| | | Unrestricted
| | | Consolidated
| |
| | | Group | | | Group | | | Group | |
| |
| Cash flows from (used in) operating activities | | | | | | | | | | | | |
| Net income (loss) attributable to common shareholders | | € | (30,432 | ) | | € | (42,033 | ) | | € | (72,465 | ) |
| Adjustments to reconcile net income (loss) attributable to common shareholders to cash flows from operating activities | | | | | | | | | | | | |
| Loss (gain) on derivative instruments | | | — | | | | 25,228 | | | | 25,228 | |
| Foreign exchange (gain) loss on debt | | | 4,114 | | | | 120 | | | | 4,234 | |
| Depreciation and amortization | | | 28,868 | | | | 26,894 | | | | 55,762 | |
| Noncontrolling interest | | | — | | | | (13,075 | ) | | | (13,075 | ) |
| Deferred income taxes | | | 3,464 | | | | (1,488 | ) | | | 1,976 | |
| Stock compensation expense | | | 264 | | | | — | | | | 264 | |
| Pension and other post-retirement expense, net of funding | | | (758 | ) | | | — | | | | (758 | ) |
| Inventory provisions | | | 8,637 | | | | 2,635 | | | | 11,272 | |
| Other | | | 2,046 | | | | 979 | | | | 3,025 | |
| Changes in current assets and liabilities | | | | | | | | | | | | |
| Receivables | | | (24,427 | ) | | | 9,616 | | | | (14,811 | ) |
| Inventories | | | (12,207 | ) | | | (1,124 | ) | | | (13,331 | ) |
| Accounts payable and accrued expenses | | | 861 | | | | (1,952 | ) | | | (1,091 | ) |
| Other(1) | | | (2,321 | ) | | | 4,225 | | | | 1,904 | |
| | | | | | | | | | | | | |
| Net cash from (used in) operating activities | | | (21,891 | ) | | | 10,025 | | | | (11,866 | ) |
| Cash flows from (used in) investing activities | | | | | | | | | | | | |
| Purchase of property, plant and equipment | | | (20,776 | ) | | | (4,928 | ) | | | (25,704 | ) |
| Proceeds on sale of property, plant and equipment | | | 189 | | | | 1,811 | | | | 2,000 | |
| Cash, restricted | | | — | | | | 20,000 | | | | 20,000 | |
| Note receivable | | | 5,708 | | | | — | | | | 5,708 | |
| | | | | | | | | | | | | |
| Net cash from (used in) investing activities | | | (14,879 | ) | | | 16,883 | | | | 2,004 | |
| Cash flows from (used in) financing activities | | | | | | | | | | | | |
| Repayment of notes payable and debt | | | — | | | | (34,023 | ) | | | (34,023 | ) |
| Repayment of capital lease obligations | | | (1,226 | ) | | | (2,086 | ) | | | (3,312 | ) |
| Proceeds from (repayment of) credit facilities, net | | | 5,837 | | | | — | | | | 5,837 | |
| Proceeds from government investment grants | | | 266 | | | | — | | | | 266 | |
| | | | | | | | | | | | | |
| Net cash from (used in) financing activities | | | 4,877 | | | | (36,109 | ) | | | (31,232 | ) |
| Effect of exchange rate changes on cash and cash equivalents | | | (1,302 | ) | | | — | | | | (1,302 | ) |
| | | | | | | | | | | | | |
| Net increase (decrease) in cash and cash equivalents | | | (33,195 | ) | | | (9,201 | ) | | | (42,396 | ) |
| Cash and cash equivalents, beginning of period | | | 59,371 | | | | 25,477 | | | | 84,848 | |
| | | | | | | | | | | | | |
| Cash and cash equivalents, end of period | | € | 26,176 | | | € | 16,276 | | | € | 42,452 | |
| | | | | | | | | | | | | |
| | | | | | | | | | | | |
| | | Year Ended December 31, 2011 | |
| | | Restricted
Group | | | Unrestricted
Subsidiaries | | | Consolidated
Group | |
Cash flows from (used in) operating activities | | | | | | | | | | | | |
Net income (loss) | | $ | 55,408 | | | $ | 19,762 | | | $ | 75,170 | |
Adjustments to reconcile net income (loss) to cash flows from operating activities | | | | | | | | | | | | |
Unrealized loss (gain) on derivative instruments | | | — | | | | 1,974 | | | | 1,974 | |
Depreciation and amortization | | | 41,875 | | | | 36,077 | | | | 77,952 | |
Deferred income taxes | | | 4,160 | | | | (7,469 | ) | | | (3,309 | ) |
Stock compensation expense | | | 4,607 | | | | — | | | | 4,607 | |
Pension and other post-retirement expense, net of funding | | | (374 | ) | | | — | | | | (374 | ) |
Other | | | 431 | | | | 685 | | | | 1,116 | |
Changes in working capital | | | | | | | | | | | | |
Receivables | | | 4,530 | | | | (6,763 | ) | | | (2,233 | ) |
Inventories | | | (14,162 | ) | | | (10,492 | ) | | | (24,654 | ) |
Accounts payable and accrued expenses | | | 8,167 | | | | 11,670 | | | | 19,837 | |
Other(1) | | | (11,836 | ) | | | 16,326 | | | | 4,490 | |
| | | | | | | | | | | | |
Net cash from (used in) operating activities | | | 92,806 | | | | 61,770 | | | | 154,576 | |
| | | | | | | | | | | | |
Cash flows from (used in) investing activities | | | | | | | | | | | | |
Purchase of property, plant and equipment | | | (41,079 | ) | | | (11,547 | ) | | | (52,626 | ) |
Proceeds on sale of property, plant and equipment | | | 456 | | | | 676 | | | | 1,132 | |
Purchase of marketable securities | | | (16,343 | ) | | | — | | | | (16,343 | ) |
Note receivable | | | 3,988 | | | | — | | | | 3,988 | |
| | | | | | | | | | | | |
Net cash from (used in) investing activities | | | (52,978 | ) | | | (10,871 | ) | | | (63,849 | ) |
| | | | | | | | | | | | |
Cash flows from (used in) financing activities | | | | | | | | | | | | |
Repayment of debt and purchase of notes | | | (35,477 | ) | | | (32,225 | ) | | | (67,702 | ) |
Repayment of capital lease obligations | | | (1,823 | ) | | | (2,272 | ) | | | (4,095 | ) |
Proceeds from (repayment of) credit facilities, net | | | (20,491 | ) | | | — | | | | (20,491 | ) |
Proceeds from government grants | | | 19,898 | | | | 151 | | | | 20,049 | |
Purchase of treasury shares | | | (10,623 | ) | | | — | | | | (10,623 | ) |
| | | | | | | | | | | | |
Net cash from (used in) financing activities | | | (48,516 | ) | | | (34,346 | ) | | | (82,862 | ) |
| | | | | | | | | | | | |
Effect of exchange rate changes on cash and cash equivalents | | | (990 | ) | | | (3,176 | ) | | | (4,166 | ) |
| | | | | | | | | | | | |
Net increase (decrease) in cash and cash equivalents | | | (9,678 | ) | | | 13,377 | | | | 3,699 | |
Cash and cash equivalents, beginning of year | | | 67,830 | | | | 64,770 | | | | 132,600 | |
| | | | | | | | | | | | |
Cash and cash equivalents, end of year | | $ | 58,152 | | | $ | 78,147 | | | $ | 136,299 | |
| | | | | | | | | | | | |
| | |
| (1) | | Includes intercompany working capital related transactions. |
111
SUPPLEMENTARY FINANCIAL INFORMATION(UNAUDITED)
Quarterly Financial Data
(ThousandsIn thousands of Euros,U.S. Dollars, except per share amounts)
| | | | | | | | | | | | | | | | | |
| | | Quarter Ended | |
| | | March 31 | | | June 30 | | | September 30 | | | December 31 | |
| |
2010 | | | | | | | | | | | | | | | | |
| Revenues | | € | 180,252 | | | € | 240,224 | | | € | 234,418 | | | € | 245,642 | |
| Gross profit | | | 18,024 | | | | 47,888 | | | | 51,411 | | | | 50,420 | |
| Net income (loss) attributable to common shareholders | | | (7,546 | ) | | | 12,401 | | | | 46,135 | | | | 35,289 | |
| Net income (loss) per share attributable to common shareholders* | | | (0.21 | ) | | | 0.23 | | | | 0.82 | | | | 0.63 | |
2009 | | | | | | | | | | | | | | | | |
| Revenues | | € | 139,572 | | | € | 158,884 | | | € | 156,231 | | | € | 165,112 | |
| Gross profit | | | (12,413 | ) | | | (9,736 | ) | | | (493 | ) | | | 9,843 | |
| Net income (loss) attributable to common shareholders | | | (39,350 | ) | | | (11,476 | ) | | | (14,112 | ) | | | 2,749 | |
| Net income (loss) per share attributable to common shareholders* | | | (1.08 | ) | | | (0.32 | ) | | | (0.39 | ) | | | 0.07 | |
| | | | | | | | | | | | | | | | |
| | | Quarters Ended | |
| | | March 31 | | | June 30 | | | September 30 | | | December 31 | |
2013 | | | | | | | | | | | | | | | | |
Revenues | | $ | 261,785 | | | $ | 274,700 | | | $ | 269,218 | | | $ | 282,682 | |
Gross profit | | | 12,607 | | | | (1,169 | ) | | | 13,304 | | | | 6,918 | |
Net income (loss) attributable to common shareholders | | | (561 | ) | | | (13,015 | ) | | | (2,966 | ) | | | (9,833 | ) |
Net income (loss) per share attributable to common shareholders* | | | (0.01 | ) | | | (0.23 | ) | | | (0.05 | ) | | | (0.18 | ) |
2012 | | | | | | | | | | | | | | | | |
Revenues | | $ | 286,362 | | | $ | 261,650 | | | $ | 279,927 | | | $ | 244,797 | |
Gross profit | | | 21,302 | | | | 23,506 | | | | 8,730 | | | | 9,484 | |
Net income (loss) attributable to common shareholders | | | 1,539 | | | | 1,948 | | | | (12,494 | ) | | | (6,663 | ) |
Net income (loss) per share attributable to common shareholders* | | | 0.03 | | | | 0.03 | | | | (0.22 | ) | | | (0.12 | ) |
112
SIGNATURES
SIGNATURES
Pursuant to the requirements of Section 13 or 15(d) of theSecurities Exchange Act of 1934, the Registrant has duly caused this report to be signed on its behalf by the undersigned, thereunto duly authorized.
| | | | |
| | MERCER INTERNATIONAL INC. |
| | Mercer International Inc. |
| | |
Dated: February 17, 201121, 2014 | | | | /s/ JIMMY S.H. LEE |
| | | | Jimmy S.H. Lee Jimmy S.H. Lee
|
| | | | Chairman |
Pursuant to the requirements of theSecurities Exchange Act of 1934, this report has been signed below by the following persons on behalf of the Registrant and in the capacities and on the dates indicated.
| | |
| | |
/s/ Jimmy S.H. Lee
Jimmy S.H. Lee
Chairman, Chief Executive Officer
and Director
| | Date: February 17, 2011 |
| | |
/s/ David M. Gandossi
David M. Gandossi
Secretary, Executive Vice President,
Chief Financial Officer
and Principal Accounting Officer
| | Date: February 17, 2011 |
| | |
/s/ Kenneth A. Shields
Kenneth A. Shields
Director
| | Date: February 17, 2011 |
| | |
/s/ Eric Lauritzen
Eric Lauritzen
Director
| | Date: February 17, 2011 |
| | |
/s/ William D. McCartney
William D. McCartney
Director
| | Date: February 17, 2011 |
| | |
/s/ Graeme A. Witts
Graeme A. Witts
Director
| | Date: February 17, 2011 |
| | |
/s/ Guy W. Adams
Guy W. Adams
Director
| | Date: February 17, 2011 |
| | |
/s/ George Malpass
George Malpass
Director
| | Date: February 17, 2011 |
113
EXHIBIT INDEX
| | | | | |
Exhibit
| | |
No. | | Description of Exhibit |
| |
| | 2 | .1 | | Agreement and Plan of Merger among Mercer International Inc., Mercer International Regco Inc. and Mercer Delaware Inc. dated December 14, 2005. Incorporated by reference to the Proxy Statement/Prospectus filed on December 15, 2005. |
| | 3 | .1 | | Articles of Incorporation of the Company, as amended. Incorporated by reference fromForm 8-A dated March 1, 2006. |
| | 3 | .2 | | Bylaws of the Company. Incorporated by reference fromForm 8-A dated March 1, 2006. |
| | 4 | .1 | | Indenture dated as of December 10, 2004 between Mercer International Inc. and Wells Fargo Bank, National Association. Incorporated by reference fromForm S-3 filed December 10, 2004. |
| | 4 | .2 | | First Supplemental Indenture dated February 14, 2005 to Indenture dated December 10, 2004 between Mercer International Inc. and Wells Fargo Bank, National Association. Incorporated by reference fromForm 8-K dated February 17, 2005. |
| | 4 | .3 | | Indenture dated as of December 10, 2009 between Mercer International Inc. and Wells Fargo Bank, National Association. Incorporated by reference fromForm 8-K dated December 11, 2009. |
| | 4 | .4 | | Second Supplemental Indenture dated as of November 16, 2010 to the Indenture dated December 10, 2004 between Mercer International Inc. and Wells Fargo Bank, National Association. Incorporated by reference fromForm 8-K dated November 19, 2010. |
| | 4 | .5 | | Indenture dated as of November 17, 2010 between Mercer International Inc. and Wells Fargo Bank, National Association. Incorporated by reference fromForm 8-K dated November 19, 2010. |
| | 4 | .6 | | Registration Rights Agreement among Mercer International Inc. and RBC Capital Markets, LLC and Credit Suisse Securities (USA) LLC dated November 17, 2010. Incorporated by reference fromForm 8-K dated November 19, 2010. |
| | 10 | .1* | | Project Financing Facility Agreement dated August 26, 2002 between Zellstoff Stendal GmbH and Bayerische Hypo-und Vereinsbank AG, as amended by Amendment, Restatement and Undertaking Agreement dated January 31, 2009. |
| | 10 | .2 | | Shareholders’ Undertaking Agreement dated August 26, 2002 among Mercer International Inc., Stendal Pulp Holdings GmbH, RWE Industrie-Lösungen GmbH, AIG Altmark Industrie AG and FAHR Beteiligungen AG and Zellstoff Stendal GmbH and Bayerische Hypo-und Vereinsbank AG. Incorporated by reference fromForm 8-K dated September 10, 2002. |
| | 10 | .3* | | Shareholders’ Agreement dated August 26, 2002 among Zellstoff Stendal GmbH, Stendal Pulp Holdings GmbH, RWE Industrie-Lösungen GmbH and FAHR Beteiligungen AG. |
| | 10 | .4* | | Contract for the Engineering, Design, Procurement, Construction, Erection andStart-Up of a Kraft Pulp Mill between Zellstoff Stendal GmbH and RWE Industrie-Lösungen GmbH dated August 26, 2002. Certain non-public information has been omitted from the appendices to Exhibit 10.4 pursuant to a request for confidential treatment filed with the SEC. Such non-public information was filed with the SEC on a confidential basis. The SEC approved the request for confidential treatment in January 2004. |
| | 10 | .5* | | Form of Trustee’s Indemnity Agreement between Mercer International Inc. and its Trustees. |
| | 10 | .6 | | Employment Agreement dated for reference August 7, 2003 between Mercer International Inc. and David Gandossi. Incorporated by reference fromForm 8-K dated August 11, 2003. |
| | 10 | .7 | | Employment Agreement effective as of April 28, 2004 between Mercer International Inc. and Jimmy S.H. Lee. Incorporated by reference fromForm 8-K dated April 28, 2004. |
| | 10 | .8 | | 2004 Stock Incentive Plan. Incorporated by reference fromForm S-8 dated June 15, 2004. |
| | 10 | .9 | | 2010 Stock Incentive Plan. Incorporated by reference fromForm S-8 dated June 11, 2010. |
| | 10 | .10 | | Employment Agreement dated October 2, 2006 between Stendal Pulp Holding GmbH and Wolfram Ridder. Incorporated by reference fromForm 8-K dated October 2, 2006. |
| | 10 | .11* | | Employment Agreement effective September 25, 2006 between Mercer International Inc. and Claes-Inge Isacson dated December 5, 2008. |
114
| | | | | |
Exhibit
| | |
No. | | Description of Exhibit |
| |
| | 10 | .12 | | Employment Agreement effective September 1, 2005 between Mercer International Inc. and Leonhard Nossol dated August 18, 2005. Incorporated by reference fromForm 10-Q dated May 6, 2008. |
| | 10 | .13* | | Electricity Purchase Agreement effective January 27, 2009 between Zellstoff Celgar Limited Partnership and British Columbia Hydro and Power Authority. Certain non-public information has been omitted from the appendices to Exhibit 10.13 pursuant to a request for confidential treatment filed with the SEC. Such non-public information was filed with the SEC on a confidential basis. The SEC approved the request for confidential treatment in March 2009. |
| | 10 | .14 | | Revolving Credit Facility Agreement dated August 19, 2009 among D&Z Holding GmbH, Zellstoff-und Papierfabrik Rosenthal GmbH, D&Z Beteiligungs GmbH and ZPR Logistik GmbH and BayerischeHypo-und Vereinsbank AG. Incorporated by reference fromForm 8-K dated August 24, 2009. |
| | 10 | .15 | | Loan Agreement dated August 19, 2009 among Zellstoff-und Papierfabrik Rosenthal GmbH, as borrower, and Bayerische Hypo-und Vereinsbank Aktiengesellschaft, as lender. Incorporated by reference fromForm 8-K dated August 24, 2009. |
| | 10 | .16 | | Amended and Restated Credit Agreement dated as of November 27, 2009 among Zellstoff Celgar Limited Partnership, as borrower, and the lenders from time to time parties thereto, as lenders, and CIT Business Credit Canada Inc., as agent. Incorporated by reference fromForm 8-K dated November 30, 2009. |
| | 14 | | | Code of Business Conduct and Ethics. Incorporated by reference from the definitive proxy statement on Schedule 14A dated August 11, 2003. |
| | 99 | .1 | | Audit Committee Charter. Incorporated by reference from the definitive proxy statement on Schedule 14A dated April 28, 2005. |
| | 99 | .2 | | Governance and Nominating Committee Charter. Incorporated by reference from the definitive proxy statement on Schedule 14A dated April 28, 2004. |
| | 99 | .3 | | Exchange Agreement dated November 25, 2009 between Mercer International Inc. and IAT Reinsurance Co. Ltd. Incorporated by reference fromForm 8-K filed November 27, 2009. |
| | 99 | .4 | | Exchange Agreement dated November 25, 2009 between Mercer International Inc. and Alden Global Distressed Opportunities Fund L.P. Incorporated by reference fromForm 8-K filed November 27, 2009. |
| | 99 | .5 | | Exchange Agreement dated November 25, 2009 between Mercer International Inc. and Greenlight Capital Qualified LP, Greenlight Capital LP and Greenlight Capital Offshore Partners. Incorporated by reference fromForm 8-K filed November 27, 2009. |
| | 21 | | | List of Subsidiaries of Registrant. |
| | 23 | .1 | | Consent of Independent Registered Chartered Accountants — PricewaterhouseCoopers LLP. |
| | 31 | .1 | | Section 302 Certificate of Chief Executive Officer. |
| | 31 | .2 | | Section 302 Certificate of Chief Financial Officer. |
| | 32 | .1** | | Section 906 Certificate of Chief Executive Officer. |
| | 32 | .2** | | Section 906 Certificate of Chief Financial Officer. |
| | |
*/s/ JIMMY S.H. LEE | | Date: February 21, 2014 |
| Jimmy S.H. Lee | | |
| Chairman, Chief Executive Officer and Director | | |
| |
| /s/ DAVID M. GANDOSSI | | Date: February 21, 2014 |
| David M. Gandossi | | |
| Secretary, Executive Vice President, | | |
| Chief Financial Officer and Principal Accounting Officer | | |
| |
| /s/ ERIC LAURITZEN | | Date: February 21, 2014 |
| Eric Lauritzen | | |
| Director | | |
| |
| /s/ WILLIAM D. MCCARTNEY | | Date: February 21, 2014 |
| William D. McCartney | | |
| Director | | |
| |
| /s/ GRAEME A. WITTS | | Date: February 21, 2014 |
| Graeme A. Witts | | |
| Director | | |
| |
| /s/ BERNARD PICCHI | | Date: February 21, 2014 |
| Bernard Picchi | | |
| Director | | |
| |
| /s/ JAMES SHEPHERD | | Date: February 21, 2014 |
| James Shepherd | | |
| Director | | |
| |
| /s/ KEITH PURCHASE | | Date: February 21, 2014 |
| Keith Purchase | | |
| Director | | |
| |
| /s/ NANCY ORR | | Date: February 21, 2014 |
| Nancy Orr | | |
| Director | | |
EXHIBIT INDEX
| | |
Exhibit No. | | Description of Exhibit |
| |
| 2.1 | | Agreement and Plan of Merger among Mercer International Inc., Mercer International Regco Inc. and Mercer Delaware Inc. dated December 14, 2005. Incorporated by reference to the Proxy Statement/Prospectus filed on December 15, 2005. |
| |
| 3.1 | | Articles of Incorporation of the Company, as amended. Incorporated by reference from Form 8-A dated March 1, 2006. |
| |
| 3.2 | | Bylaws of the Company. Incorporated by reference from Form 8-A dated March 1, 2006. |
| |
| 4.1 | | Indenture dated as of November 17, 2010 between Mercer International Inc. and Wells Fargo Bank, National Association. Incorporated by reference from Form 8-K dated July 23, 2013. |
| |
| 10.1* | | Project Financing Facility Agreement dated August 26, 2002 between Zellstoff Stendal GmbH and Bayerische Hypo-und Vereinsbank AG, as amended by Amendment, Restatement and Undertaking Agreement dated January 31, 2009 and the Amendment Agreement dated January 20, 2011. |
| |
| 10.2* | | Project Blue Mill Financing Facility Agreement dated January 20, 2012 between Zellstoff Stendal GmbH and Unicredit Bank AG and IKB Deutsche Industriebank AG. |
| |
| 10.3* | | Shareholders’ Undertaking Agreement dated August 26, 2002 among Mercer International Inc., Stendal Pulp Holdings GmbH, RWE Industrie-Lösungen GmbH, AIG Altmark Industrie AG and FAHR Beteiligungen AG and Zellstoff Stendal GmbH and Bayerische Hypo-und Vereinsbank AG as amended by the Amendment Restatement and Undertaking Agreement dated January 20, 2012. |
| |
| 10.4* | | Shareholders’ Agreement dated August 26, 2002 among Zellstoff Stendal GmbH, Stendal Pulp Holdings GmbH, RWE Industrie-Lösungen GmbH and FAHR Beteiligungen AG as amended by the Amendment Restatement and Undertaking Agreement dated January 20, 2012. |
| |
| 10.5* | | Contract for the Engineering, Design, Procurement, Construction, Erection and Start-Up of a Kraft Pulp Mill between Zellstoff Stendal GmbH and RWE Industrie-Lösungen GmbH dated August 26, 2002. Certain non-public information has been omitted from the appendices to Exhibit 10.4 pursuant to a request for confidential treatment filed with the SEC. Such non-public information was filed with the SEC on a confidential basis. The SEC approved the request for confidential treatment in January 2004. |
| |
| 10.6* | | Form of Trustee’s Indemnity Agreement between Mercer International Inc. and its Trustees. |
| |
| 10.7 | | Employment Agreement dated for reference August 7, 2003 between Mercer International Inc. and David Gandossi. Incorporated by reference from Form 8-K dated August 11, 2003. |
| |
| 10.8 | | Employment Agreement effective as of April 28, 2004 between Mercer International Inc. and Jimmy S.H. Lee. Incorporated by reference from Form 8-K dated April 28, 2004. |
| |
| 10.9 | | 2004 Stock Incentive Plan. Incorporated by reference from Form S-8 dated June 15, 2004. |
| |
| 10.10 | | 2010 Stock Incentive Plan. Incorporated by reference from Form S-8 dated June 11, 2010. |
| |
| 10.11 | | Employment Agreement dated October 2, 2006 between Stendal Pulp Holding GmbH and Wolfram Ridder. Incorporated by reference from Form 8-K dated October 2, 2006. |
| |
| 10.12* | | Employment Agreement effective September 25, 2006 between Mercer International Inc. and Claes-Inge Isacson dated December 5, 2008. |
| | |
| |
| 10.13 | | Employment Agreement effective September 1, 2005 between Mercer International Inc. and Leonhard Nossol dated August 18, 2005. Incorporated by reference from Form 10-Q dated May 6, 2008. |
| |
| 10.14* | | Electricity Purchase Agreement effective January 27, 2009 between Zellstoff Celgar Limited Partnership and British Columbia Hydro and Power Authority. Certain non-public information has been omitted from the appendices to Exhibit 10.13 pursuant to a request for confidential treatment filed with the SEC. Such non-public information was filed with the SEC on a confidential basis. The SEC approved the request for confidential treatment in March 2009. |
| |
| 10.15 | | Revolving Credit Facility Agreement dated August 19, 2009 among D&Z Holding GmbH, Zellstoff-und Papierfabrik Rosenthal GmbH, D&Z Beteiligungs GmbH and ZPR Logistik GmbH and Bayerische Hypo-und Vereinsbank AG. Incorporated by reference from Form 8-K dated August 24, 2009. |
| |
| 10.16 | | Loan Agreement dated August 19, 2009 among Zellstoff-und Papierfabrik Rosenthal GmbH, as borrower, and Bayerische Hypo-und Vereinsbank Aktiengesellschaft, as lender. Incorporated by reference from Form 8-K dated August 24, 2009. |
| |
| 10.17 | | Extension, Amendment and Confirmation Letter dated October 4, 2012 among Zellstoff- und Papierfabrik Rosenthal GmbH, D&Z Holding GmbH, D&Z Beteiligungs GmbH, ZPR Logistik GmbH and Mercer International Inc. Incorporated by reference from Form 10-Q dated November 2, 2012. |
| |
| 10.18 | | Second Amended and Restated Credit Agreement dated as of May 2, 2013 among Zellstoff Celgar Limited Partnership, as borrower, and the lenders from time to time parties thereto, as lenders, and Canadian Imperial Bank of Commerce, as agent. Incorporated by reference from Form 8-K dated May 8, 2013. |
| |
| 10.19 | | Amendment Agreement, dated September 30, 2013, among Zellstoff Stendal GmbH, as Borrower, UniCredit Bank AG, as Arranger, Agent, Security Agent and Original Lender, the Lenders from time to time parties thereto, E & Z Industrie-Lösungen GmbH, Mercer International Inc. and Stendal Pulp Holding GmbH. Incorporated by reference from Form 10-Q filed on November 1, 2013. |
| |
| 14 | | Code of Business Conduct and Ethics. Incorporated by reference from the definitive proxy statement on Schedule 14A dated August 11, 2003. |
| |
| 99.1 | | Audit Committee Charter. Incorporated by reference from the definitive proxy statement on Schedule 14A dated April 28, 2005. |
| |
| 99.2 | | Governance and Nominating Committee Charter. Incorporated by reference from the definitive proxy statement on Schedule 14A dated April 28, 2004. |
| |
| 21 | | List of Subsidiaries of Registrant. |
| |
| 23.1 | | Consent of Independent Registered Public Accounting Firm. |
| |
| 31.1 | | Section 302 Certificate of Chief Executive Officer. |
| |
| 31.2 | | Section 302 Certificate of Chief Financial Officer. |
| |
| 32.1** | | Section 906 Certificate of Chief Executive Officer. |
| |
| 32.2** | | Section 906 Certificate of Chief Financial Officer. |
| * | Filed inForm 10-K for prior years. |
|
| ** | | In accordance with Release33-8212 of the SEC, these Certifications: (i) are “furnished” to the SEC and are not “filed” for the purposes of liability under the Exchange Act; and (ii) are not to be subject to automatic incorporation by reference into any of the Company’s registration statements filed under the Securities Act for the purposes of liability thereunder or any offering memorandum, unless the Company specifically incorporates them by reference therein. |
115